COLUMBIA VARIABLE PORTFOLIO – BALANCED ... - RiverSource
60
COLUMBIA VARIABLE PORTFOLIO – BALANCED FUND Please remember that you may not buy (nor will you own) shares of the Fund directly. The Fund is available through variable annuity contracts and variable life insurance policies offered by the separate accounts of participating insurance companies as well as qualified pension and retirement plans. Please contact your financial advisor or insurance representative for more information. ANNUAL REPORT December 31, 2021 Not Federally Insured • No Financial Institution Guarantee • May Lose Value
-
Upload
khangminh22 -
Category
Documents
-
view
0 -
download
0
Transcript of COLUMBIA VARIABLE PORTFOLIO – BALANCED ... - RiverSource

COLUMBIA VARIABLE PORTFOLIO – BALANCEDFUND
Please remember that you may not buy (nor will you own) shares of the Fund directly. The Fund is available through variable annuitycontracts and variable life insurance policies offered by the separate accounts of participating insurance companies as well asqualified pension and retirement plans. Please contact your financial advisor or insurance representative for more information.
ANNUAL REPORTDecember 31, 2021
Not Federally Insured • No Financial Institution Guarantee • May Lose Value

Fund at a Glance.......................................................................................................................................................... 3
Manager Discussion of Fund Performance ......................................................................................................................... 5
Understanding Your Fund’s Expenses .............................................................................................................................. 7
Portfolio of Investments................................................................................................................................................. 8
Statement of Assets and Liabilities ..................................................................................................................................35
Statement of Operations................................................................................................................................................36
Statement of Changes in Net Assets ................................................................................................................................37
Financial Highlights.......................................................................................................................................................38
Notes to Financial Statements .......................................................................................................................................40
Report of Independent Registered Public Accounting Firm......................................................................................................52
Trustees and Officers ....................................................................................................................................................53
Proxy voting policies and proceduresThe policy of the Board of Trustees is to vote the proxies of the companies in which Columbia Variable Portfolio – BalancedFund (the Fund) holds investments consistent with the procedures as stated in the Statement of Additional Information (SAI).You may obtain a copy of the SAI without charge by calling 800.345.6611; contacting your financial intermediary or searchingthe website of the Securities and Exchange Commission (SEC) at sec.gov. Information regarding how the Fund voted proxiesrelating to portfolio securities is filed with the SEC by August 31st for the most recent 12-month period ending June 30th ofthat year, and is available without charge by visiting columbiathreadneedleus.com/investor/, or searching the website of theSEC at sec.gov.
Quarterly schedule of investmentsThe Fund files a complete schedule of portfolio holdings with the SEC for the first and third quarters of each fiscal year onForm N-PORT. The Fund’s Form N-PORT is available on the SEC’s website at sec.gov. The Fund’s complete schedule ofportfolio holdings, as filed on Form N-PORT, can also be obtained without charge, upon request, by calling 800.345.6611.
Additional Fund informationFund investment managerColumbia Management Investment Advisers, LLC (the Investment Manager)290 Congress StreetBoston, MA 02210
Fund distributorColumbia Management Investment Distributors, Inc.290 Congress StreetBoston, MA 02210
Fund transfer agentColumbia Management Investment Services Corp.P.O. Box 219104Kansas City, MO 64121-9104
TABLE OF CONTENTS
Columbia Variable Portfolio – Balanced Fund | Annual Report 2021

Portfolio management
Guy Pope, CFALead Portfolio ManagerManaged Fund since 2011
Jason CallanPortfolio ManagerManaged Fund since 2018
Gregory LiechtyPortfolio ManagerManaged Fund since 2011
Ronald Stahl, CFAPortfolio ManagerManaged Fund since 2011
Average annual total returns (%) (for the period ended December 31, 2021)
Inception 1 Year 5 Years 10 Years
Class 1* 06/25/14 14.88 12.44 11.56
Class 2* 06/25/14 14.62 12.18 11.31
Class 3 04/30/86 14.74 12.29 11.43
Blended Benchmark 15.86 12.62 11.14
S&P 500 Index 28.71 18.47 16.55
Bloomberg U.S. Aggregate BondIndex -1.54 3.57 2.90
Performance data quoted represents past performance and current performance may be lower or higher. Pastperformance is no guarantee of future results. The investment return and principal value will fluctuate so thatshares, when redeemed, may be worth more or less than the original cost. For current month-end performanceinformation, please contact your financial advisor or insurance representative.
Performance results reflect the effect of any fee waivers or reimbursements of fund expenses by ColumbiaManagement Investment Advisers, LLC and/or any of its affiliates. Absent these fee waivers or expensereimbursement arrangements, performance results would have been lower.
Investment earnings, if any, are tax-deferred until distributed to shareholders, at which time taxes may becomedue. Total return performance includes changes in share price and assumes reinvestment of dividends and capitalgains, if any. Performance results reflect the effect of all fund expenses, but do not include any fees and expensesimposed under your variable annuity contract and/or variable life insurance policy or qualified pension orretirement plan. If performance results included the effect of these additional charges, they would be lower.
*The returns shown for periods prior to the share class inception date (including returns for the Life of the Fund, ifshown, which are since Fund inception) include the returns of the Fund’s oldest share class. These returns are adjustedto reflect any higher class-related operating expenses of the newer share classes, as applicable. Please visitcolumbiathreadneedleus.com/investor/investment-products/variable-products/appended-performance for moreinformation.
The Blended Benchmark consists of 60% S&P 500 Index and 40% Bloomberg U.S. Aggregate Bond Index.
The S&P 500 Index, an unmanaged index, measures the performance of 500 widely held, large-capitalization U.S.stocks and is frequently used as a general measure of market performance.
The Bloomberg U.S. Aggregate Bond Index is a broad-based benchmark that measures the investment-grade, U.S.dollar-denominated, fixed-rate taxable bond market, including Treasuries, government-related and corporate securities,mortgage-backed securities (agency fixed-rate and hybrid adjustable-rate mortgage passthroughs), asset-backedsecurities, and commercial mortgage-backed securities. Effective August 24, 2021, the Bloomberg BarclaysU.S. Aggregate Bond Index was re-branded as the Bloomberg U.S. Aggregate Bond Index.
Indices are not available for investment, are not professionally managed and do not reflect sales charges, fees,brokerage commissions, taxes or other expenses of investing. Securities in the Fund may not match those in an index.
Fund performance may be significantly negatively impacted by the economic impact of theCOVID-19 pandemic. The COVID-19 pandemic has adversely impacted economies andcapital markets around the world in ways that will likely continue and may change inunforeseen ways for an indeterminate period. The COVID-19 pandemic may exacerbatepre-existing political, social and economic risks in certain countries and globally.
Investment objective
The Fund seeks maximum total investment return through a combination of capital growth and current income.
FUND AT A GLANCE
Columbia Variable Portfolio – Balanced Fund | Annual Report 2021 3

Performance of a hypothetical $10,000 investment (December 31, 2011 — December 31, 2021)
0
10,000
20,000
30,000
40,000
$50,000
$29,527
$46,257
$28,759
$13,307
12/11 12/12 12/13 12/14 12/15 12/16 12/17 12/18 12/19 12/20 12/21
Columbia Variable Portfolio — Balanced Fund Class 3 ($29,527) Blended Benchmark ($28,759)S&P 500 Index ($46,257) Bloomberg U.S. Aggregate Bond Index ($13,307)
The chart above shows the change in value of a hypothetical $10,000 investment in Class 3 shares of Columbia Variable Portfolio – Balanced Fund during the stated time period, anddoes not reflect the deduction of taxes, if any, that a shareholder may pay on Fund distributions or on the redemption of Fund shares. The returns also do not reflect fees and expensesimposed under your variable annuity contract and/or variable life insurance policy or qualified pension or retirement plan, if any.
Portfolio breakdown (%) (at December 31, 2021)
Asset-Backed Securities — Non-Agency 6.4
Commercial Mortgage-Backed Securities - Non-Agency 5.1
Common Stocks 60.1
Convertible Bonds 0.0(a)
Corporate Bonds & Notes 6.1
Exchange-Traded Equity Funds 0.8
Foreign Government Obligations 0.0(a)
Money Market Funds 5.9
Residential Mortgage-Backed Securities - Agency 5.3
Residential Mortgage-Backed Securities - Non-Agency 10.0
Senior Loans 0.0(a)
U.S. Treasury Obligations 0.3
Total 100.0
(a) Rounds to zero.
Percentages indicated are based upon total investments excluding investments inderivatives, if any. The Fund’s portfolio composition is subject to change.
Equity sector breakdown (%) (at December 31, 2021)
Communication Services 12.0
Consumer Discretionary 9.4
Consumer Staples 4.5
Energy 3.0
Financials 10.1
Health Care 13.6
Industrials 8.4
Information Technology 32.8
Materials 3.1
Real Estate 1.3
Utilities 1.8
Total 100.0
Percentages indicated are based upon total equity investments. The Fund’s portfoliocomposition is subject to change.
FUND AT A GLANCE (continued)
4 Columbia Variable Portfolio – Balanced Fund | Annual Report 2021

For the 12-month period that ended December 31, 2021, Class 3 shares of the Fund returned 14.74%. The Fundunderperformed its Blended Benchmark, which returned 15.86% for the same time period. The Fund’s equity benchmark, theS&P 500 Index, returned 28.71% and the Fund’s fixed-income benchmark, the Bloomberg U.S. Aggregate Bond Index,returned -1.54% for the 12-month period.
Market overviewU.S. equities displayed remarkable resilience during the year, finishing with a solid gain despite a number of potentialheadwinds. Investors had to contend with the emergence of the Omicron variant of COVID-19, which was contagious enoughto raise concerns that a new wave of lockdowns could be necessary. The markets also faced a major shift in U.S. FederalReserve (Fed) policy. Whereas the Fed had previously viewed rising inflation as a transitory development, continued pricepressures caused the central bank to announce the tapering of its stimulative quantitative easing program. In addition, itbegan to prepare the financial markets for the likelihood of multiple interest rate increases in 2022. The failure of the BuildBack Better bill removed a source of anticipated fiscal stimulus. Nevertheless, most major U.S. indices closed the year at ornear their all-time highs on the strength of robust investment inflows and the lack of compelling total return potential inbonds.
Investors continued to search for yield in the low interest rate environment, which helped most spread sectors outperformTreasuries over the year. Broadly speaking, the best performing sectors within the fixed-income benchmark on an excessreturn basis included lower rated (A and BBB rated) commercial mortgage-backed securities (CMBS), BBB rated corporatesand longer maturity (10-25 years) corporates. Meanwhile, underperformers included fixed rate agency mortgage-backedsecurities (MBS), U.S. agencies and sovereigns.
The Fed’s monetary policy, including keeping short term rates at zero and its monthly asset purchases, continued to helpprovide liquidity and stability in financial markets. In 2021, interest rates increased across the curve with shorter maturityyields rising in anticipation of future interest rate hikes. Over the 12-month period, spreads for lower quality corporates (BBBrated) tightened by more than spreads for higher quality corporates. Lower quality corporates outperformed higher qualitycorporates in 2021.
The Fund’s notable detractors during the period
In the equity portion• The Fund’s relative underperformance was driven by a combination of stock selection and sector allocation during the
period.
• From an allocation perspective, overweights to the communication services and materials sectors hurt relativeperformance as both sectors underperformed the benchmark during the period.
• An underweight to the strong performing real estate sector also detracted.
• The industrials sector was the weakest sector for the Fund, driven primarily by stock selection, most notably Fundholdings in Uber Technologies, Southwest Airlines, Co. and Honeywell International Inc.
• Health care was also an area of detraction. Fund holdings that weighed on relative performance included biotechcompanies Biogen, Inc., BioMarin Pharmaceutical, Inc. and Vertex Pharmaceuticals, Inc., health care equipmentcompanies Dentsply Sirona, Inc. and Medtronic PLC, and pharmaceutical giant Johnson & Johnson.
• Activision Blizzard, Inc. and T-Mobile USA, Inc., both within the communication services sector, were among the Fund’slargest top detractors during the period.
• Within the consumer staples sector, Coca-Cola Company and Sysco Corporation disappointed during the period.
• Within consumer discretionary, the Fund’s large holding in Amazon.com weighed on results, as did holdings in retailersDollar Tree, Inc. and Gap, Inc.
MANAGER DISCUSSION OF FUND PERFORMANCE
Columbia Variable Portfolio – Balanced Fund | Annual Report 2021 5

In the fixed-income portion• The primary detractor from performance in the fixed-income portion of the Fund during the period was yield curve
positioning.
The Fund’s notable contributors during the period
In the equity portion• The Fund’s overweight allocations to the financials and energy sectors contributed to performance versus the
benchmark.
• Underweight allocations to the utilities and consumer staples sectors also added to relative results.
• The information technology sector was the Fund’s strongest area of contribution, with the Fund’s performance driven bystrong stock selection. Fund holdings that delivered strong results for the Fund included software companies Intuit,Inc., Microsoft Corp. and Palo Alto Networks. Semiconductor and semiconductor equipment companies NVIDIA Corp.,Lam Research Corp., and Marvell Technology were also strong contributors to Fund performance.
• Within energy, all three of the Fund’s holdings, Canadian Natural Resources Limited, Chevron and EOG Resources, Inc.,benefited Fund performance versus the benchmark.
• Within the financials sector notable contributors included Morgan Stanley, Bank of America Corp. and AmericanExpress.
• Google parent Alphabet Inc., in the communications sector, was one of the Fund’s top individual contributors during theperiod.
In the fixed-income portion• Allocations to spread sectors generally benefited performance in the fixed-income portion of the Fund for the 12-month
period ending December 2021.
� The Fund’s non-agency collateralized mortgage obligation (CMO) exposure had the greatest contribution to totalreturn.
� The Fund had overweight positions in asset-backed securities (ABS) and non-agency CMBS, both of whichprovided material contributions to total return in 2021.
• High-yield corporate bond exposure was also additive to performance.
• The fixed-income portion of the Fund was underweight in agency residential mortgage-backed securities (RMBS), whichbenefited performance as spreads widened and the sector posted negative excess returns.
• Security selection was additive to performance within the ABS, investment-grade corporate, non-agency CMBS andagency RMBS sectors.
• The Fund maintained a shorter duration versus the benchmark for the majority of the year, which benefited performanceas yields increased. In 2021, the 10-year Treasury yield increased approximately 60 basis points (bps; a basis point is1/100 of a percent) from 0.91% to 1.51%.
The views expressed in this report reflect the current views of the respective parties who have contributed to this report. These views are not guarantees of
future performance and involve certain risks, uncertainties and assumptions that are difficult to predict, so actual outcomes and results may differ
significantly from the views expressed. These views are subject to change at any time based upon economic, market or other conditions and the respective
parties disclaim any responsibility to update such views. These views may not be relied on as investment advice and, because investment decisions for a
Columbia fund are based on numerous factors, may not be relied on as an indication of trading intent on behalf of any particular Columbia fund. References
to specific securities should not be construed as a recommendation or investment advice.
MANAGER DISCUSSION OF FUND PERFORMANCE (continued)
6 Columbia Variable Portfolio – Balanced Fund | Annual Report 2021

As an investor, you incur ongoing costs, which generally include management fees, distribution and/or service fees, andother fund expenses. The following information is intended to help you understand your ongoing costs (in dollars) of investingin the Fund and to help you compare these costs with the ongoing costs of investing in other mutual funds.
The information below does not reflect fees and expenses imposed under your variable annuity contract and/or variable lifeinsurance policy (collectively, Contracts) or qualified pension and retirement plan (Qualified Plan), if any. The total fees andexpenses you bear may therefore be higher than those shown below.
Analyzing your Fund’s expensesTo illustrate these ongoing costs, we have provided examples and calculated the expenses paid by investors in each shareclass of the Fund during the period. The actual and hypothetical information in the table is based on an initial investment of$1,000 at the beginning of the period indicated and held for the entire period. Expense information is calculated two waysand each method provides you with different information. The amount listed in the “Actual” column is calculated using theFund’s actual operating expenses and total return for the period. You may use the Actual information, together with theamount invested, to estimate the expenses that you paid over the period. Simply divide your account value by $1,000 (forexample, an $8,600 account value divided by $1,000 = 8.6), then multiply the results by the expenses paid during the periodunder the “Actual” column. The amount listed in the “Hypothetical” column assumes a 5% annual rate of return beforeexpenses (which is not the Fund’s actual return) and then applies the Fund’s actual expense ratio for the period to thehypothetical return. You should not use the hypothetical account values and expenses to estimate either your actual accountbalance at the end of the period or the expenses you paid during the period. See “Compare with other funds” below fordetails on how to use the hypothetical data.
Compare with other fundsSince all mutual funds are required to include the same hypothetical calculations about expenses in shareholder reports, youcan use this information to compare the ongoing cost of investing in the Fund with other funds. To do so, compare thehypothetical example with the 5% hypothetical examples that appear in the shareholder reports of other funds. As youcompare hypothetical examples of other funds, it is important to note that hypothetical examples are meant to highlight theongoing costs of investing in a fund only and do not reflect any transaction costs, such as redemption or exchange fees, orexpenses that apply to the subaccount or the Contract. Therefore, the hypothetical calculations are useful in comparingongoing costs only, and will not help you determine the relative total costs of owning different funds. If the fees and expensesimposed under your Contract or Qualified Plan, if any, were included, your costs would be higher.
July 1, 2021 — December 31, 2021
Account value at thebeginning of the
period ($)
Account value at theend of theperiod ($)
Expenses paid duringthe period ($)
Fund’s annualizedexpense ratio (%)
Actual Hypothetical Actual Hypothetical Actual Hypothetical Actual
Class 1 1,000.00 1,000.00 1,044.80 1,021.42 3.87 3.82 0.75
Class 2 1,000.00 1,000.00 1,043.40 1,020.16 5.15 5.09 1.00
Class 3 1,000.00 1,000.00 1,044.00 1,020.82 4.48 4.43 0.87
Expenses paid during the period are equal to the annualized expense ratio for each class as indicated above, multiplied by the average account value over the period and thenmultiplied by the number of days in the Fund’s most recent fiscal half year and divided by 365.
Expenses do not include fees and expenses incurred indirectly by the Fund from its investment in underlying funds, including affiliated and non-affiliated pooled investment vehicles,such as mutual funds and exchange-traded funds.
UNDERSTANDING YOUR FUND’S EXPENSES(Unaudited)
Columbia Variable Portfolio – Balanced Fund | Annual Report 2021 7

Investments in securities
Asset-Backed Securities — Non-Agency 6.7%
IssuerCoupon
RatePrincipal
Amount ($) Value ($)
American Credit Acceptance Receivables Trust(a)
Series 2020-1 Class D03/13/2026 2.390% 2,875,000 2,911,450
Subordinated Series 2021-1 Class C03/15/2027 0.830% 1,300,000 1,293,922
Subordinated Series 2021-2 Class E07/13/2027 2.540% 600,000 590,746
Apidos CLO XI(a),(b)
Series 2012-11A Class BR33-month USD LIBOR + 1.650%Floor 1.650%04/17/2034 1.772% 1,925,000 1,916,844
Apidos CLO XXVIII(a),(b)
Series 2017-28A Class A1B3-month USD LIBOR + 1.150%Floor 1.150%01/20/2031 1.282% 900,000 897,141
Aqua Finance Trust(a)
Series 2021-A Class A07/17/2046 1.540% 839,876 830,833
ARES XLVII CLO Ltd.(a),(b)
Series 2018-47A Class B3-month USD LIBOR + 1.450%Floor 1.450%04/15/2030 1.574% 550,000 546,706
Avant Loans Funding Trust(a)
Series 2019-B Class B10/15/2026 3.150% 83,546 83,591
Series 2020-REV1 Class A05/15/2029 2.170% 3,300,000 3,305,446
Series 2020-REV1 Class B05/15/2029 2.680% 530,000 529,710
Subordinated Series 2021-REV1 Class C07/15/2030 2.300% 325,000 322,387
Bain Capital Credit CLO Ltd.(a),(b)
Series 2021-7A Class B3-month USD LIBOR + 1.650%Floor 1.650%01/22/2035 2.016% 2,425,000 2,423,150
Barings CLO Ltd.(a),(b)
Series 2018-4A Class B3-month USD LIBOR + 1.700%Floor 1.700%10/15/2030 1.824% 3,450,000 3,450,193
Asset-Backed Securities — Non-Agency (continued)
IssuerCoupon
RatePrincipal
Amount ($) Value ($)
Basswood Park CLO Ltd.(a),(b)
Series 2021-1A Class A3-month USD LIBOR + 1.000%Floor 1.000%04/20/2034 1.211% 1,025,000 1,017,186
Carbone CLO Ltd.(a),(b)
Series 2017-1A Class A13-month USD LIBOR + 1.140%01/20/2031 1.272% 1,850,000 1,850,006
Carlyle US CLO Ltd.(a),(b)
Series 2016-4A Class A2R3-month USD LIBOR + 1.450%Floor 1.450%10/20/2027 1.582% 3,425,000 3,416,677
Carmax Auto Owner TrustSubordinated Series 2021-1 Class C12/15/2026 0.940% 275,000 268,732
Carvana Auto Receivables Trust(a)
Subordinated Series 2019-3A Class C10/15/2024 2.710% 950,000 959,286
Cascade Funding Mortgage Trust(a)
CMO Series 2021-GRN1 Class A03/20/2041 1.100% 981,325 970,500
Consumer Loan Underlying Bond Club Certificate Issuer Trust(a)
Series 2019-HP1 Class A12/15/2026 2.590% 262,721 263,362
Consumer Loan Underlying Bond CLUB Credit Trust(a)
Subordinated Series 2019-P2 Class B10/15/2026 2.830% 296,098 296,607
Crossroads Asset Trust(a)
Subordinated Series 2021-A Class B06/20/2025 1.120% 175,000 173,902
Drive Auto Receivables TrustSubordinated Series 2020-2 Class D05/15/2028 3.050% 225,000 229,825
Subordinated Series 2021-2 Class D03/15/2029 1.390% 3,410,000 3,332,785
Dryden CLO Ltd.(a),(b)
Series 2018-55A Class A13-month USD LIBOR + 1.020%04/15/2031 1.144% 1,300,000 1,300,205
Dryden Senior Loan Fund(a),(b)
Series 2015-41A Class AR3-month USD LIBOR + 0.970%Floor 0.970%04/15/2031 1.094% 2,100,000 2,100,533
PORTFOLIO OF INVESTMENTSDecember 31, 2021(Percentages represent value of investments compared to net assets)
The accompanying Notes to Financial Statements are an integral part of this statement.
8 Columbia Variable Portfolio – Balanced Fund | Annual Report 2021

Asset-Backed Securities — Non-Agency (continued)
IssuerCoupon
RatePrincipal
Amount ($) Value ($)
Series 2016-42A Class BR3-month USD LIBOR + 1.550%07/15/2030 1.674% 950,000 950,198
DT Auto Owner Trust(a)
Series 2019-3A Class D04/15/2025 2.960% 1,600,000 1,638,034
Series 2020-2A Class D03/16/2026 4.730% 125,000 131,722
Subordinated Series 2020-1A Class D11/17/2025 2.550% 1,400,000 1,424,664
Subordinated Series 2020-3A Class D06/15/2026 1.840% 975,000 971,962
Exeter Automobile Receivables Trust(a)
Series 2019-4A Class D09/15/2025 2.580% 1,425,000 1,446,445
Subordinated Series 2020-1A Class D12/15/2025 2.730% 1,100,000 1,122,571
Subordinated Series 2020-2A Class D04/15/2026 4.730% 350,000 366,373
Exeter Automobile Receivables TrustSubordinated Series 2020-3A Class D07/15/2026 1.730% 600,000 604,381
Subordinated Series 2021-1A Class D11/16/2026 1.080% 1,125,000 1,112,693
Subordinated Series 2021-3A Class D06/15/2027 1.550% 3,960,000 3,892,470
Foundation Finance Trust(a)
Series 2019-1A Class A11/15/2034 3.860% 352,809 361,669
Foursight Capital Automobile Receivables Trust(a)
Subordinated Series 2021-1 Class D03/15/2027 1.320% 800,000 788,547
Freed ABS Trust(a)
Subordinated Series 2021-1CP Class C03/20/2028 2.830% 100,000 100,841
GLS Auto Receivables Issuer Trust(a)
Subordinated Series 2020-1A Class C11/17/2025 2.720% 1,500,000 1,520,410
GoldentTree Loan Management US CLO 1 Ltd.(a),(b)
Series 2021-10A Class A3-month USD LIBOR + 1.100%Floor 1.100%07/20/2034 1.232% 1,425,000 1,422,607
Hilton Grand Vacations Trust(a)
Series 2018-AA Class A02/25/2032 3.540% 264,873 272,436
Series 2019-AA Class A07/25/2033 2.340% 623,277 634,346
Asset-Backed Securities — Non-Agency (continued)
IssuerCoupon
RatePrincipal
Amount ($) Value ($)
Jay Park CLO Ltd.(a),(b)
Series 2016-1A Class A2R3-month USD LIBOR + 1.450%10/20/2027 1.582% 4,075,000 4,076,475
LendingPoint Asset Securitization Trust(a)
Subordinated Series 2020-REV1 Class B10/15/2028 4.494% 1,575,000 1,600,981
LL ABS Trust(a)
Series 2021-1A Class A05/15/2029 1.070% 758,580 754,868
Madison Park Funding XLVIII Ltd.(a),(b)
Series 2021-48A Class A3-month USD LIBOR + 1.150%Floor 1.150%04/19/2033 1.274% 475,000 474,999
Madison Park Funding XXXIII Ltd.(a),(b)
Series 2019-33A Class B13-month USD LIBOR + 1.800%Floor 1.800%10/15/2032 1.924% 3,600,000 3,600,184
Magnetite XII Ltd.(a),(b)
Series 2015-12A Class ARR3-month USD LIBOR + 1.100%10/15/2031 1.224% 2,150,000 2,150,103
Marlette Funding Trust(a)
Series 2019-3A Class B09/17/2029 3.070% 830,028 832,393
Subordinated Series 2019-2A Class B07/16/2029 3.530% 324,580 325,753
MVW Owner Trust(a)
Series 2016-1A Class A12/20/2033 2.250% 122,562 123,377
Series 2017-1A Class A12/20/2034 2.420% 560,115 565,858
NRZ Advance Receivables Trust(a)
Series 2020-T3 Class AT310/15/2052 1.317% 1,080,000 1,078,421
Octagon Investment Partners 39 Ltd.(a),(b)
Series 2018-3A Class B3-month USD LIBOR + 1.650%Floor 1.650%10/20/2030 1.982% 3,525,000 3,512,246
Octane Receivables Trust(a)
Series 2019-1A Class A09/20/2023 3.160% 82,503 82,833
Series 2020-1A Class A02/20/2025 1.710% 1,628,596 1,632,226
PORTFOLIO OF INVESTMENTS (continued)December 31, 2021
The accompanying Notes to Financial Statements are an integral part of this statement.
Columbia Variable Portfolio – Balanced Fund | Annual Report 2021 9

Asset-Backed Securities — Non-Agency (continued)
IssuerCoupon
RatePrincipal
Amount ($) Value ($)
OHA Credit Funding Ltd.(a),(b)
Series 2019-4A Class AR3-month USD LIBOR + 1.150%Floor 1.150%10/22/2036 1.278% 1,375,000 1,375,245
Series 2021-8A Class A3-month USD LIBOR + 1.190%Floor 1.190%01/18/2034 1.378% 650,000 650,341
Pagaya AI Debt Selection Trust(a),(c),(d)
Series 2021-5 Class A08/15/2029 1.530% 1,825,000 1,827,435
Race Point IX CLO Ltd.(a),(b)
Series 2015-9A Class A2R3-month USD LIBOR + 1.450%Floor 1.450%10/15/2030 0.574% 1,900,000 1,900,023
Research-Driven Pagaya Motor Asset Trust IV(a)
Series 2021-2A Class A03/25/2030 2.650% 1,075,000 1,072,009
Santander Consumer Auto Receivables Trust(a)
Subordinated Series 2021-AA Class C11/16/2026 1.030% 200,000 196,666
Subordinated Series 2021-AA Class D01/15/2027 1.570% 175,000 172,945
Santander Drive Auto Receivables TrustSeries 2020-2 Class D09/15/2026 2.220% 925,000 937,295
Subordinated Series 2020-3 Class D11/16/2026 1.640% 3,025,000 3,044,831
SCF Equipment Leasing LLC(a)
Series 2019-2A Class B08/20/2026 2.760% 1,275,000 1,298,848
Series 2020-1A Class C08/21/2028 2.600% 800,000 810,153
Sierra Timeshare Receivables Funding LLC(a)
Series 2018-2A Class A06/20/2035 3.500% 190,625 195,947
Series 2018-3A Class A09/20/2035 3.690% 132,510 136,599
SoFi Consumer Loan Program Trust(a)
Series 2018-3 Class B08/25/2027 4.020% 83,368 83,677
Theorem Funding Trust(a)
Subordinated Series 2021-1A Class B12/15/2027 1.840% 700,000 692,100
United Auto Credit Securitization Trust(a)
Series 2020-1 Class D02/10/2025 2.880% 1,075,000 1,087,143
Asset-Backed Securities — Non-Agency (continued)
IssuerCoupon
RatePrincipal
Amount ($) Value ($)
Upstart Pass-Through Trust(a),(d)
Series 2021-ST10 Class A01/20/2030 2.250% 3,350,000 3,350,000
Upstart Pass-Through Trust(a)
Series 2021-ST2 Class A04/20/2027 2.500% 255,624 256,401
Series 2021-ST7 Class A09/20/2029 1.850% 911,164 903,303
Series 2021-ST9 Class A11/20/2029 1.700% 433,743 430,285
Upstart Securitization Trust(a)
Series 2020-2 Class A11/20/2030 2.309% 661,145 665,846
Subordinated Series 2021-2 Class B06/20/2031 1.750% 425,000 422,420
Subordinated Series 2021-3 Class B07/20/2031 1.660% 425,000 419,465
VSE Voi Mortgage LLC(a)
Series 2018-A Class A02/20/2036 3.560% 304,196 313,060
Total Asset-Backed Securities — Non-Agency(Cost $96,990,037) 97,096,848
Commercial Mortgage-Backed Securities - Non-Agency 5.4%
1211 Avenue of the Americas Trust(a)
Series 2015-1211 Class A1A208/10/2035 3.901% 1,275,000 1,356,699
American Homes 4 Rent Trust(a)
Series 2014-SFR2 Class A10/17/2036 3.786% 1,136,434 1,178,254
Series 2014-SFR3 Class A12/17/2036 3.678% 1,257,222 1,313,829
Series 2015-SFR1 Class A04/17/2052 3.467% 1,161,724 1,217,186
Series 2015-SFR2 Class A10/17/2052 3.732% 691,299 725,944
AMSR Trust(a)
Series 2020-SFR2 Class C07/17/2037 2.533% 500,000 503,390
Ashford Hospitality Trust(a),(b)
Series 2018-KEYS Class B1-month USD LIBOR + 1.300%Floor 1.300%05/15/2035 1.560% 2,625,000 2,611,890
BBCMS Trust(a),(b)
Subordinated Series 2018-BXH Class B1-month USD LIBOR + 1.250%Floor 1.250%10/15/2037 1.360% 1,150,000 1,143,538
PORTFOLIO OF INVESTMENTS (continued)December 31, 2021
The accompanying Notes to Financial Statements are an integral part of this statement.
10 Columbia Variable Portfolio – Balanced Fund | Annual Report 2021

Commercial Mortgage-Backed Securities - Non-Agency (continued)
IssuerCoupon
RatePrincipal
Amount ($) Value ($)
Subordinated Series 2018-BXH Class C1-month USD LIBOR + 1.500%Floor 1.500%10/15/2037 1.610% 625,000 617,974
BB-UBS Trust(a)
Series 2012-SHOW Class A11/05/2036 3.430% 1,325,000 1,372,891
BHMS Mortgage Trust(a),(b)
Series 2018-ATLS Class A1-month USD LIBOR + 1.250%Floor 1.250%07/15/2035 1.360% 2,375,000 2,373,529
BX Commercial Mortgage Trust(a),(b)
Series 2019-XL Class C1-month USD LIBOR + 1.250%Floor 1.250%10/15/2036 1.360% 977,500 976,011
BX Mortgage Trust(a),(b)
Series 2021-PAC Class D1-month USD LIBOR + 1.298%Floor 1.298%10/15/2036 1.388% 2,175,000 2,171,016
BX Trust(a),(b)
Series 2019-ATL Class C1-month USD LIBOR + 1.587%Floor 1.587%, Cap 1.587%10/15/2036 1.697% 699,000 686,806
Series 2019-ATL Class D1-month USD LIBOR + 1.887%Floor 1.887%10/15/2036 1.997% 622,000 608,041
CIM Retail Portfolio Trust(a),(b)
Series 2021-RETL Class D1-month USD LIBOR + 3.050%Floor 3.050%08/15/2036 3.160% 3,825,000 3,786,771
CLNY Trust(a),(b)
Series 2019-IKPR Class D1-month USD LIBOR + 2.025%Floor 2.025%11/15/2038 2.135% 1,900,000 1,885,766
COMM Mortgage Trust(a),(b)
Series 2019-WCM Class C1-month USD LIBOR + 1.300%Floor 1.300%10/15/2036 1.410% 875,000 869,537
COMM Mortgage Trust(a),(e)
Series 2020-CBM Class D02/10/2037 3.633% 475,000 469,749
COMM Mortgage Trust(a)
Subordinated Series 2020-CX Class B11/10/2046 2.446% 525,000 517,970
Commercial Mortgage-Backed Securities - Non-Agency (continued)
IssuerCoupon
RatePrincipal
Amount ($) Value ($)
CSAIL Commercial Mortgage TrustSeries 2019-C16 Class A306/15/2052 3.329% 3,675,000 3,935,050
Extended Stay America Trust(a),(b)
Series 2021-ESH Class E1-month USD LIBOR + 2.850%Floor 2.850%07/15/2038 2.934% 298,447 298,447
Series 2021-ESH Class F1-month USD LIBOR + 3.700%Floor 3.700%07/15/2038 3.784% 298,447 298,448
FirstKey Homes Trust(a)
Subordinated Series 2020-SFR1 Class D09/17/2025 2.241% 675,000 672,737
Subordinated Series 2020-SFR2 Class D10/19/2037 1.968% 2,975,000 2,914,101
GS Mortgage Securities Corp. Trust(a)
Series 2017-485L Class A02/10/2037 3.721% 625,000 669,391
GS Mortgage Securities Corp. Trust(a),(b)
Subordinated CMO Series 2021-IP Class D1-month USD LIBOR + 2.100%Floor 2.100%10/15/2036 2.200% 825,000 823,626
Home Partners of America Trust(a)
Series 2019-2 Class D10/19/2039 3.121% 1,055,907 1,030,044
Subordinated Series 2021-2 Class B12/17/2026 2.302% 6,496,186 6,417,955
Invitation Homes Trust(a),(b)
Series 2018-SFR1 Class A1-month USD LIBOR + 0.700%03/17/2037 0.810% 1,871,701 1,871,701
Series 2018-SFR3 Class A1-month USD LIBOR + 1.000%Floor 1.000%07/17/2037 1.110% 608,572 607,519
Series 2018-SFR4 Class A1-month USD LIBOR + 1.100%Floor 1.000%01/17/2038 1.209% 3,072,395 3,071,502
JPMorgan Chase Commercial Mortgage Securities Trust(a),(e)
Subordinated Series 2021-2NU Class B01/05/2040 2.077% 600,000 585,315
Subordinated Series 2021-2NU Class C01/05/2040 2.077% 250,000 241,177
PORTFOLIO OF INVESTMENTS (continued)December 31, 2021
The accompanying Notes to Financial Statements are an integral part of this statement.
Columbia Variable Portfolio – Balanced Fund | Annual Report 2021 11

Commercial Mortgage-Backed Securities - Non-Agency (continued)
IssuerCoupon
RatePrincipal
Amount ($) Value ($)
KKR Industrial Portfolio Trust(a),(b)
Subordinated Series 2021-KDIP Class D1-month USD LIBOR + 1.250%Floor 1.250%12/15/2037 1.360% 375,000 370,534
Life Mortgage Trust(a),(b)
Subordinated Series 2021-BMR Class D1-month USD LIBOR + 1.400%Floor 1.400%03/15/2038 1.510% 700,000 692,972
Morgan Stanley Bank of America Merrill Lynch TrustSeries 2016-C29 Class A305/15/2049 3.058% 945,602 979,173
Series 2017-C34 Class A311/15/2052 3.276% 2,250,000 2,368,795
Morgan Stanley Capital I TrustSeries 2015-UBS8 Class A312/15/2048 3.540% 1,800,000 1,900,886
Morgan Stanley Capital I Trust(a),(e)
Series 2019-MEAD Class D11/10/2036 3.283% 1,175,000 1,152,099
One New York Plaza Trust(a),(b)
Subordinated Series 2020-1NYP Class C1-month USD LIBOR + 2.200%Floor 2.200%01/15/2026 2.310% 1,100,000 1,103,073
Subordinated Series 2020-1NYP Class D1-month USD LIBOR + 2.750%Floor 2.750%01/15/2026 2.860% 425,000 426,511
Progress Residential Trust(a)
Series 2019-SFR3 Class C09/17/2036 2.721% 750,000 749,598
Series 2019-SFR3 Class D09/17/2036 2.871% 1,125,000 1,124,403
Series 2019-SFR4 Class C10/17/2036 3.036% 2,850,000 2,849,144
Series 2020-SFR1 Class C04/17/2037 2.183% 325,000 324,886
Series 2020-SFR1 Class D04/17/2037 2.383% 675,000 674,625
Series 2020-SFR2 Class A06/17/2037 2.078% 425,000 425,418
Subordinated Series 2019-SFR2 Class C05/17/2036 3.545% 1,000,000 1,000,080
Subordinated Series 2020-SFR2 Class C06/18/2037 3.077% 100,000 101,351
Subordinated Series 2020-SFR2 Class D06/18/2037 3.874% 125,000 127,836
Commercial Mortgage-Backed Securities - Non-Agency (continued)
IssuerCoupon
RatePrincipal
Amount ($) Value ($)
Subordinated Series 2021-SFR8 Class D10/17/2038 2.082% 1,830,000 1,789,664
RBS Commercial Funding, Inc., Trust(a),(e)
Series 2013-GSP Class A01/15/2032 3.834% 1,100,000 1,139,084
SFO Commercial Mortgage Trust(a),(b)
Subordinated Series 2021-555 Class E1-month USD LIBOR + 2.900%Floor 2.900%05/15/2038 3.010% 475,000 475,005
Tricon American Homes(a)
Series 2020-SFR1 Class C07/17/2038 2.249% 650,000 645,805
Tricon American Homes Trust(a)
Subordinated Series 2020-SFR2 Class D11/17/2039 2.281% 1,075,000 1,039,978
UBS-Barclays Commercial Mortgage TrustSeries 2012-C4 Class A512/10/2045 2.850% 1,423,366 1,433,781
Wells Fargo Commercial Mortgage TrustSeries 2015-C28 Class A305/15/2048 3.290% 1,072,007 1,103,324
Series 2017-C39 Class A109/15/2050 1.975% 56,414 56,419
Wells Fargo Commercial Mortgage Trust(a),(b)
Series 2020-SDAL Class D1-month USD LIBOR + 2.090%Floor 2.090%02/15/2037 2.199% 500,000 487,137
Series 2021-FCMT Class A1-month USD LIBOR + 1.200%Floor 1.200%05/15/2031 1.310% 750,000 749,062
Series 2021-FCMT Class D1-month USD LIBOR + 3.500%Floor 3.500%05/15/2031 3.610% 625,000 622,657
WF-RBS Commercial Mortgage TrustSeries 2012-C9 Class A311/15/2045 2.870% 1,472,022 1,483,171
Series 2012-C9 Class ASB11/15/2045 2.445% 117,155 117,625
Series 2013-C15 Class A308/15/2046 3.881% 657,832 676,580
Total Commercial Mortgage-Backed Securities - Non-Agency(Cost $78,633,658) 78,014,480
PORTFOLIO OF INVESTMENTS (continued)December 31, 2021
The accompanying Notes to Financial Statements are an integral part of this statement.
12 Columbia Variable Portfolio – Balanced Fund | Annual Report 2021

Common Stocks 63.2%
Issuer Shares Value ($)
Communication Services 7.6%
Diversified Telecommunication Services 0.3%
AT&T, Inc. 185,642 4,566,793
Entertainment 0.8%
Activision Blizzard, Inc. 23,115 1,537,841
Endeavor Group Holdings, Inc., Class A(f) 107,239 3,741,569
Walt Disney Co. (The)(f) 36,989 5,729,226
Total 11,008,636
Interactive Media & Services 5.0%
Alphabet, Inc., Class A(f) 8,524 24,694,369
Alphabet, Inc., Class C(f) 9,095 26,317,201
Meta Platforms, Inc., Class A(f) 63,923 21,500,501
Total 72,512,071
Media 0.8%
Comcast Corp., Class A 236,321 11,894,036
Wireless Telecommunication Services 0.7%
T-Mobile USA, Inc.(f) 84,736 9,827,681
Total Communication Services 109,809,217
Consumer Discretionary 5.9%
Hotels, Restaurants & Leisure 0.9%
McDonald’s Corp. 49,475 13,262,763
Internet & Direct Marketing Retail 3.2%
Amazon.com, Inc.(f) 12,449 41,509,199
eBay, Inc. 74,332 4,943,078
Total 46,452,277
Specialty Retail 1.0%
Gap, Inc. (The) 178,841 3,156,544
Lowe’s Companies, Inc. 33,672 8,703,538
Ulta Beauty, Inc.(f) 7,890 3,253,363
Total 15,113,445
Textiles, Apparel & Luxury Goods 0.8%
Tapestry, Inc. 201,878 8,196,247
Under Armour, Inc., Class A(f) 132,096 2,799,114
Total 10,995,361
Total Consumer Discretionary 85,823,846
Common Stocks (continued)
Issuer Shares Value ($)
Consumer Staples 2.9%
Food & Staples Retailing 1.3%
Sysco Corp. 234,813 18,444,561
Food Products 0.9%
Mondelez International, Inc., Class A 203,840 13,516,630
Tobacco 0.7%
Philip Morris International, Inc. 102,258 9,714,510
Total Consumer Staples 41,675,701
Energy 1.9%
Oil, Gas & Consumable Fuels 1.9%
Canadian Natural Resources Ltd. 180,829 7,640,025
Chevron Corp. 109,627 12,864,729
EOG Resources, Inc. 78,571 6,979,462
Total 27,484,216
Total Energy 27,484,216
Financials 6.4%
Banks 2.1%
Bank of America Corp. 375,328 16,698,343
JPMorgan Chase & Co. 85,935 13,607,807
Total 30,306,150
Capital Markets 1.8%
BlackRock, Inc. 9,775 8,949,599
Morgan Stanley 44,964 4,413,666
State Street Corp. 132,491 12,321,663
Total 25,684,928
Consumer Finance 0.2%
American Express Co. 16,683 2,729,339
Diversified Financial Services 1.7%
Berkshire Hathaway, Inc., Class B(f) 83,019 24,822,681
Insurance 0.6%
Aon PLC, Class A 7,801 2,344,668
Willis Towers Watson PLC 28,775 6,833,775
Total 9,178,443
Total Financials 92,721,541
PORTFOLIO OF INVESTMENTS (continued)December 31, 2021
The accompanying Notes to Financial Statements are an integral part of this statement.
Columbia Variable Portfolio – Balanced Fund | Annual Report 2021 13

Common Stocks (continued)
Issuer Shares Value ($)
Health Care 8.6%
Biotechnology 1.4%
Biogen, Inc.(f) 15,556 3,732,196
BioMarin Pharmaceutical, Inc.(f) 73,398 6,484,713
Vertex Pharmaceuticals, Inc.(f) 46,057 10,114,117
Total 20,331,026
Health Care Equipment & Supplies 3.0%
Abbott Laboratories 115,951 16,318,944
Baxter International, Inc. 82,252 7,060,512
Dentsply Sirona, Inc. 148,902 8,307,242
Medtronic PLC 124,418 12,871,042
Total 44,557,740
Health Care Providers & Services 1.6%
Anthem, Inc. 22,064 10,227,547
CVS Health Corp. 122,130 12,598,931
Total 22,826,478
Pharmaceuticals 2.6%
Eli Lilly & Co. 51,503 14,226,159
Johnson & Johnson 135,662 23,207,698
Total 37,433,857
Total Health Care 125,149,101
Industrials 5.3%
Aerospace & Defense 1.7%
Raytheon Technologies Corp. 286,829 24,684,504
Airlines 0.6%
Southwest Airlines Co.(f) 221,770 9,500,627
Building Products 0.2%
Carrier Global Corp. 67,873 3,681,432
Industrial Conglomerates 0.7%
Honeywell International, Inc. 46,232 9,639,834
Machinery 0.6%
Stanley Black & Decker, Inc. 43,486 8,202,329
Road & Rail 1.5%
Uber Technologies, Inc.(f) 288,900 12,113,577
Union Pacific Corp. 37,914 9,551,674
Total 21,665,251
Total Industrials 77,373,977
Common Stocks (continued)
Issuer Shares Value ($)
Information Technology 20.7%
Communications Equipment 0.6%
Cisco Systems, Inc. 145,072 9,193,213
Electronic Equipment, Instruments & Components 1.4%
TE Connectivity Ltd. 127,995 20,650,713
IT Services 4.2%
Akamai Technologies, Inc.(f) 39,687 4,644,967
Fidelity National Information Services, Inc. 70,957 7,744,957
Global Payments, Inc. 50,147 6,778,871
International Business Machines Corp. 58,043 7,758,027
MasterCard, Inc., Class A 54,454 19,566,411
PayPal Holdings, Inc.(f) 33,827 6,379,096
Visa, Inc., Class A 37,994 8,233,680
Total 61,106,009
Semiconductors & Semiconductor Equipment 2.8%
GlobalFoundries, Inc.(f) 44,935 2,919,427
Lam Research Corp. 13,874 9,977,487
Marvell Technology, Inc. 63,118 5,522,194
Micron Technology, Inc. 72,194 6,724,871
NVIDIA Corp. 53,538 15,746,061
Total 40,890,040
Software 7.6%
Adobe, Inc.(f) 21,243 12,046,055
Autodesk, Inc.(f) 30,109 8,466,350
Intuit, Inc. 14,034 9,026,949
Microsoft Corp. 196,834 66,199,211
Palo Alto Networks, Inc.(f) 24,535 13,660,107
Total 109,398,672
Technology Hardware, Storage & Peripherals 4.1%
Apple, Inc. 335,089 59,501,754
Total Information Technology 300,740,401
Materials 2.0%
Chemicals 1.7%
Air Products & Chemicals, Inc. 8,347 2,539,658
Corteva, Inc. 178,295 8,429,787
International Flavors & Fragrances, Inc. 47,498 7,155,574
Nutrien Ltd. 77,204 5,805,741
Total 23,930,760
PORTFOLIO OF INVESTMENTS (continued)December 31, 2021
The accompanying Notes to Financial Statements are an integral part of this statement.
14 Columbia Variable Portfolio – Balanced Fund | Annual Report 2021

Common Stocks (continued)
Issuer Shares Value ($)
Metals & Mining 0.3%
Newmont Corp. 77,434 4,802,457
Total Materials 28,733,217
Real Estate 0.8%
Equity Real Estate Investment Trusts (REITS) 0.5%
American Tower Corp. 24,890 7,280,325
Real Estate Management & Development 0.3%
Zillow Group, Inc., Class C(f) 65,313 4,170,235
Total Real Estate 11,450,560
Utilities 1.1%
Electric Utilities 0.8%
American Electric Power Co., Inc. 123,891 11,022,582
Multi-Utilities 0.3%
Public Service Enterprise Group, Inc. 77,567 5,176,046
Total Utilities 16,198,628
Total Common Stocks(Cost $630,666,337) 917,160,405
Convertible Bonds 0.0%
IssuerCoupon
RatePrincipal
Amount ($) Value ($)
Cable and Satellite 0.0%
DISH Network Corp.Subordinated08/15/2026 3.375% 85,000 80,457
Total Convertible Bonds(Cost $80,255) 80,457
Corporate Bonds & Notes 6.4%
Aerospace & Defense 0.3%
BAE Systems PLC(a)
04/15/2030 3.400% 1,200,000 1,279,707
Boeing Co. (The)05/01/2040 5.705% 1,050,000 1,349,255
Bombardier, Inc.(a)
12/01/2024 7.500% 20,000 20,78004/15/2027 7.875% 64,000 66,367
Harris Corp.06/15/2028 4.400% 450,000 506,697
Lockheed Martin Corp.06/15/2050 2.800% 270,000 269,569
Northrop Grumman Corp.(a)
02/15/2031 7.750% 375,000 534,490
Corporate Bonds & Notes (continued)
IssuerCoupon
RatePrincipal
Amount ($) Value ($)
TransDigm, Inc.(a)
12/15/2025 8.000% 60,000 63,28903/15/2026 6.250% 170,000 176,653
TransDigm, Inc.11/15/2027 5.500% 57,000 58,74405/01/2029 4.875% 41,000 41,114
Total 4,366,665
Airlines 0.0%
Air Canada(a)
08/15/2026 3.875% 36,000 36,810
American Airlines, Inc./AAdvantage Loyalty IP Ltd.(a)
04/20/2026 5.500% 110,000 114,47904/20/2029 5.750% 16,629 17,783
Delta Air Lines, Inc.01/15/2026 7.375% 36,000 42,271
Hawaiian Brand Intellectual Property Ltd./Miles Loyalty Ltd.(a)
01/20/2026 5.750% 64,253 67,386
United Airlines, Inc.(a)
04/15/2026 4.375% 27,000 28,17204/15/2029 4.625% 31,000 32,152
Total 339,053
Automotive 0.1%
American Axle & Manufacturing, Inc.03/15/2026 6.250% 42,000 42,929
Ford Motor Co.02/12/2032 3.250% 38,000 38,903
Ford Motor Credit Co. LLC01/09/2022 3.219% 29,000 29,01306/16/2025 5.125% 32,000 34,89211/13/2025 3.375% 81,000 84,04501/09/2027 4.271% 55,000 59,28408/17/2027 4.125% 55,000 59,37302/16/2028 2.900% 31,000 31,14611/13/2030 4.000% 39,000 41,939
IAA Spinco, Inc.(a)
06/15/2027 5.500% 67,000 69,503
IHO Verwaltungs GmbH(a),(g)
09/15/2026 4.750% 38,000 38,804
KAR Auction Services, Inc.(a)
06/01/2025 5.125% 124,000 125,572
Panther BF Aggregator 2 LP/Finance Co., Inc.(a)
05/15/2026 6.250% 19,000 19,90705/15/2027 8.500% 41,000 43,467
Tenneco, Inc.(a)
01/15/2029 7.875% 59,000 64,00204/15/2029 5.125% 31,000 30,556
Total 813,335
PORTFOLIO OF INVESTMENTS (continued)December 31, 2021
The accompanying Notes to Financial Statements are an integral part of this statement.
Columbia Variable Portfolio – Balanced Fund | Annual Report 2021 15

Corporate Bonds & Notes (continued)
IssuerCoupon
RatePrincipal
Amount ($) Value ($)
Banking 1.2%
Bank of America Corp.(h)
04/23/2040 4.078% 2,632,000 3,018,905
Citigroup, Inc.Subordinated03/09/2026 4.600% 1,360,000 1,501,696
Discover Bank09/13/2028 4.650% 925,000 1,050,885
Goldman Sachs Group, Inc. (The)02/07/2030 2.600% 1,700,000 1,728,333
HSBC Holdings PLC(h)
05/24/2032 2.804% 1,350,000 1,356,606
JPMorgan Chase & Co.(h)
Subordinated05/13/2031 2.956% 3,000,000 3,104,665
Morgan Stanley(h)
01/22/2031 2.699% 1,675,000 1,715,780
PNC Financial Services Group, Inc. (The)01/22/2030 2.550% 350,000 360,925
State Street Corp.Subordinated03/03/2031 2.200% 1,461,000 1,456,254
Wells Fargo & Co.(h)
04/30/2041 3.068% 1,900,000 1,943,845
Total 17,237,894
Brokerage/Asset Managers/Exchanges 0.0%
Aretec Escrow Issuer, Inc.(a)
04/01/2029 7.500% 22,000 22,592
Hightower Holding LLC(a)
04/15/2029 6.750% 56,000 57,460
NFP Corp.(a)
08/15/2028 4.875% 57,000 57,78508/15/2028 6.875% 99,000 99,389
Total 237,226
Building Materials 0.0%
American Builders & Contractors Supply Co., Inc.(a)
01/15/2028 4.000% 46,000 47,062
Beacon Roofing Supply, Inc.(a)
11/15/2026 4.500% 63,000 65,25005/15/2029 4.125% 36,000 35,985
CP Atlas Buyer Inc.(a)
12/01/2028 7.000% 35,000 34,766
Interface, Inc.(a)
12/01/2028 5.500% 23,000 24,097
Corporate Bonds & Notes (continued)
IssuerCoupon
RatePrincipal
Amount ($) Value ($)
James Hardie International Finance DAC(a)
01/15/2028 5.000% 49,000 51,037
SRS Distribution, Inc.(a)
07/01/2028 4.625% 28,000 28,23007/01/2029 6.125% 53,000 53,98712/01/2029 6.000% 65,000 65,389
White Cap Buyer LLC(a)
10/15/2028 6.875% 75,000 78,511
Total 484,314
Cable and Satellite 0.3%
CCO Holdings LLC/Capital Corp.(a)
05/01/2027 5.125% 84,000 86,95303/01/2030 4.750% 127,000 132,39408/15/2030 4.500% 130,000 133,39502/01/2031 4.250% 41,000 41,437
Comcast Corp.08/15/2035 4.400% 450,000 535,178
CSC Holdings LLC(a)
02/01/2028 5.375% 49,000 50,65302/01/2029 6.500% 57,000 61,15301/15/2030 5.750% 67,000 66,99112/01/2030 4.125% 68,000 66,45002/15/2031 3.375% 45,000 42,131
DIRECTV Holdings LLC/Financing Co., Inc.(a)
08/15/2027 5.875% 64,000 65,560
DISH DBS Corp.07/01/2026 7.750% 17,000 17,95706/01/2029 5.125% 62,000 56,413
DISH DBS Corp.(a)
12/01/2028 5.750% 96,000 97,066
Radiate Holdco LLC/Finance, Inc.(a)
09/15/2026 4.500% 62,000 62,83509/15/2028 6.500% 93,000 93,448
Sirius XM Radio, Inc.(a)
09/01/2026 3.125% 39,000 38,98907/01/2029 5.500% 36,000 38,834
Time Warner Cable LLC05/01/2037 6.550% 1,300,000 1,702,943
Videotron Ltd.(a)
06/15/2029 3.625% 31,000 31,320
Virgin Media Finance PLC(a)
07/15/2030 5.000% 91,000 90,941
Virgin Media Secured Finance PLC(a)
05/15/2029 5.500% 40,000 42,09108/15/2030 4.500% 38,000 38,245
Ziggo Bond Co. BV(a)
02/28/2030 5.125% 72,000 72,546
PORTFOLIO OF INVESTMENTS (continued)December 31, 2021
The accompanying Notes to Financial Statements are an integral part of this statement.
16 Columbia Variable Portfolio – Balanced Fund | Annual Report 2021

Corporate Bonds & Notes (continued)
IssuerCoupon
RatePrincipal
Amount ($) Value ($)
Ziggo Bond Finance BV(a)
01/15/2027 6.000% 53,000 54,611
Ziggo BV(a)
01/15/2030 4.875% 50,000 51,251
Total 3,771,785
Chemicals 0.1%
Axalta Coating Systems LLC(a)
02/15/2029 3.375% 32,000 31,004
Axalta Coating Systems LLC/Dutch Holding B BV(a)
06/15/2027 4.750% 89,000 92,897
Element Solutions, Inc.(a)
09/01/2028 3.875% 81,000 82,004
HB Fuller Co.10/15/2028 4.250% 44,000 45,323
Herens Holdco Sarl(a)
05/15/2028 4.750% 45,000 44,081
Ingevity Corp.(a)
11/01/2028 3.875% 44,000 42,905
Innophos Holdings, Inc.(a)
02/15/2028 9.375% 54,000 58,613
Iris Holdings, Inc.(a),(g)
02/15/2026 8.750% 27,000 27,253
LYB International Finance BV03/15/2044 4.875% 350,000 434,823
Olympus Water US Holding Corp.(a)
10/01/2028 4.250% 55,000 54,22510/01/2029 6.250% 16,000 15,699
SPCM SA(a)
03/15/2027 3.125% 4,000 3,953
Unifrax Escrow Issuer Corp.(a)
09/30/2028 5.250% 33,000 33,41109/30/2029 7.500% 11,000 11,167
WR Grace Holdings LLC(a)
06/15/2027 4.875% 61,000 62,65608/15/2029 5.625% 95,000 97,594
Total 1,137,608
Construction Machinery 0.0%
Herc Holdings, Inc.(a)
07/15/2027 5.500% 30,000 31,231
Ritchie Bros Holdings, Inc.(a)
12/15/2031 4.750% 59,000 61,559
United Rentals North America, Inc.01/15/2030 5.250% 32,000 34,644
Total 127,434
Corporate Bonds & Notes (continued)
IssuerCoupon
RatePrincipal
Amount ($) Value ($)
Consumer Cyclical Services 0.0%
APX Group, Inc.(a)
02/15/2027 6.750% 13,000 13,73507/15/2029 5.750% 23,000 22,770
Arches Buyer, Inc.(a)
06/01/2028 4.250% 21,000 21,00512/01/2028 6.125% 32,000 32,213
Match Group, Inc.(a)
02/15/2029 5.625% 31,000 33,259
Staples, Inc.(a)
04/15/2026 7.500% 50,000 51,35204/15/2027 10.750% 6,000 5,652
Uber Technologies, Inc.(a)
05/15/2025 7.500% 69,000 72,69301/15/2028 6.250% 40,000 42,93508/15/2029 4.500% 108,000 110,241
Total 405,855
Consumer Products 0.0%
CD&R Smokey Buyer, Inc.(a)
07/15/2025 6.750% 74,000 77,659
Mattel, Inc.(a)
04/01/2026 3.375% 22,000 22,56604/01/2029 3.750% 67,000 69,569
Mattel, Inc.11/01/2041 5.450% 6,000 7,161
Prestige Brands, Inc.(a)
01/15/2028 5.125% 64,000 66,611
Scotts Miracle-Gro Co. (The)(a)
02/01/2032 4.375% 21,000 20,943
Tempur Sealy International, Inc.(a)
10/15/2031 3.875% 19,000 19,045
Total 283,554
Diversified Manufacturing 0.2%
BWX Technologies, Inc.(a)
06/30/2028 4.125% 32,000 32,462
Carrier Global Corp.04/05/2040 3.377% 1,050,000 1,095,230
CFX Escrow Corp.(a)
02/15/2026 6.375% 49,000 50,744
Gates Global LLC/Co.(a)
01/15/2026 6.250% 103,000 106,375
GE Capital International Funding Co. Unlimited Co.11/15/2035 4.418% 1,050,000 1,259,314
Honeywell International, Inc.06/01/2050 2.800% 300,000 312,793
PORTFOLIO OF INVESTMENTS (continued)December 31, 2021
The accompanying Notes to Financial Statements are an integral part of this statement.
Columbia Variable Portfolio – Balanced Fund | Annual Report 2021 17

Corporate Bonds & Notes (continued)
IssuerCoupon
RatePrincipal
Amount ($) Value ($)
Madison IAQ LLC(a)
06/30/2028 4.125% 32,000 32,16906/30/2029 5.875% 64,000 64,007
Resideo Funding, Inc.(a)
09/01/2029 4.000% 37,000 36,288
Stevens Holding Co., Inc.(a)
10/01/2026 6.125% 12,000 12,851
Vertical US Newco, Inc.(a)
07/15/2027 5.250% 32,000 33,611
Welbilt, Inc.02/15/2024 9.500% 17,000 17,176
WESCO Distribution, Inc.(a)
06/15/2025 7.125% 53,000 56,13206/15/2028 7.250% 52,000 57,175
Total 3,166,327
Electric 0.7%
Berkshire Hathaway Energy Co.10/15/2050 4.250% 348,000 424,914
Calpine Corp.(a)
02/15/2028 4.500% 55,000 57,05503/15/2028 5.125% 27,000 27,435
CenterPoint Energy, Inc.06/01/2031 2.650% 900,000 910,779
Clearway Energy Operating LLC(a)
03/15/2028 4.750% 101,000 106,49402/15/2031 3.750% 75,000 74,97201/15/2032 3.750% 20,000 19,915
CMS Energy Corp.03/01/2044 4.875% 262,000 329,839
Consolidated Edison Co. of New York, Inc.12/01/2045 4.500% 550,000 648,774
Dominion Energy, Inc.08/15/2031 2.250% 875,000 857,100
Emera US Finance LP06/15/2046 4.750% 1,000,000 1,187,813
Indiana Michigan Power Co.03/15/2037 6.050% 600,000 814,532
Leeward Renewable Energy Operations LLC(a)
07/01/2029 4.250% 16,000 16,171
NextEra Energy Operating Partners LP(a)
07/15/2024 4.250% 16,000 16,64209/15/2027 4.500% 59,000 63,619
NRG Energy, Inc.(a)
02/15/2029 3.375% 35,000 34,25906/15/2029 5.250% 30,000 32,11902/15/2031 3.625% 42,000 41,14102/15/2032 3.875% 48,000 47,214
Corporate Bonds & Notes (continued)
IssuerCoupon
RatePrincipal
Amount ($) Value ($)
Pennsylvania Electric Co.(a)
06/01/2029 3.600% 1,000,000 1,069,334
PG&E Corp.07/01/2028 5.000% 15,000 15,77007/01/2030 5.250% 41,000 42,985
Progress Energy, Inc.03/01/2031 7.750% 850,000 1,185,201
Southern Co. (The)07/01/2046 4.400% 625,000 738,202
TerraForm Power Operating LLC(a)
01/15/2030 4.750% 28,000 29,385
Vistra Operations Co. LLC(a)
02/15/2027 5.625% 32,000 33,08707/31/2027 5.000% 75,000 77,85705/01/2029 4.375% 38,000 38,144
WEC Energy Group, Inc.10/15/2027 1.375% 300,000 289,619
Xcel Energy, Inc.06/01/2030 3.400% 900,000 968,977
Total 10,199,348
Environmental 0.0%
GFL Environmental, Inc.(a)
12/15/2026 5.125% 63,000 65,67808/01/2028 4.000% 45,000 44,161
Waste Pro USA, Inc.(a)
02/15/2026 5.500% 103,000 102,989
Total 212,828
Finance Companies 0.0%
Global Aircraft Leasing Co., Ltd.(a),(g)
09/15/2024 6.500% 26,447 25,545
Navient Corp.01/25/2023 5.500% 60,000 62,51803/15/2028 4.875% 25,000 24,968
Provident Funding Associates LP/Finance Corp.(a)
06/15/2025 6.375% 84,000 86,760
Quicken Loans LLC/Co-Issuer, Inc.(a)
03/01/2031 3.875% 31,000 31,582
Rocket Mortgage LLC/Co-Issuer, Inc.(a)
10/15/2033 4.000% 113,000 114,513
Springleaf Finance Corp.06/01/2025 8.875% 13,000 13,949
Total 359,835
Food and Beverage 0.4%
Anheuser-Busch InBev Worldwide, Inc.01/15/2042 4.950% 1,650,000 2,070,764
PORTFOLIO OF INVESTMENTS (continued)December 31, 2021
The accompanying Notes to Financial Statements are an integral part of this statement.
18 Columbia Variable Portfolio – Balanced Fund | Annual Report 2021

Corporate Bonds & Notes (continued)
IssuerCoupon
RatePrincipal
Amount ($) Value ($)
Bacardi Ltd.(a)
05/15/2038 5.150% 1,300,000 1,601,965
Conagra Brands, Inc.11/01/2048 5.400% 270,000 365,048
FAGE International SA/USA Dairy Industry, Inc.(a)
08/15/2026 5.625% 100,000 102,874
JBS USA LUX SA/Food Co./Finance, Inc.(a)
12/01/2031 3.750% 30,000 30,688
Kraft Heinz Foods Co.06/01/2046 4.375% 911,000 1,069,144
Lamb Weston Holdings, Inc.(a)
01/31/2030 4.125% 44,000 45,20001/31/2032 4.375% 43,000 44,363
Mondelez International, Inc.09/04/2050 2.625% 465,000 435,013
Pilgrim’s Pride Corp.(a)
04/15/2031 4.250% 126,000 132,41603/01/2032 3.500% 98,000 99,375
Post Holdings, Inc.(a)
03/01/2027 5.750% 86,000 88,93504/15/2030 4.625% 52,000 52,77609/15/2031 4.500% 45,000 44,662
Primo Water Holdings, Inc.(a)
04/30/2029 4.375% 38,000 37,676
Simmons Foods, Inc./Prepared Foods, Inc./Pet Food, Inc./Feed(a)
03/01/2029 4.625% 28,000 27,595
US Foods, Inc.(a)
02/15/2029 4.750% 55,000 55,93406/01/2030 4.625% 33,000 33,404
Total 6,337,832
Gaming 0.1%
Boyd Gaming Corp.(a)
06/01/2025 8.625% 5,000 5,35406/15/2031 4.750% 51,000 52,276
Boyd Gaming Corp.12/01/2027 4.750% 48,000 49,337
Caesars Entertainment, Inc.(a)
10/15/2029 4.625% 94,000 94,534
Colt Merger Sub, Inc.(a)
07/01/2025 5.750% 45,000 47,03507/01/2025 6.250% 67,000 70,37407/01/2027 8.125% 29,000 32,099
MGM Growth Properties Operating Partnership LP/Finance Co-Issuer, Inc.05/01/2024 5.625% 25,000 26,73602/01/2027 5.750% 28,000 31,748
MGM Growth Properties Operating Partnership LP/Finance Co-Issuer, Inc.(a)
06/15/2025 4.625% 45,000 48,03402/15/2029 3.875% 9,000 9,492
Corporate Bonds & Notes (continued)
IssuerCoupon
RatePrincipal
Amount ($) Value ($)
Midwest Gaming Borrower LLC(a)
05/01/2029 4.875% 51,000 51,756
Scientific Games International, Inc.(a)
07/01/2025 8.625% 30,000 32,11110/15/2025 5.000% 82,000 84,38803/15/2026 8.250% 66,000 69,57811/15/2029 7.250% 20,000 22,439
VICI Properties LP/Note Co., Inc.(a)
12/01/2026 4.250% 19,000 19,78402/15/2027 3.750% 20,000 20,66508/15/2030 4.125% 20,000 21,173
Wynn Las Vegas LLC/Capital Corp.(a)
03/01/2025 5.500% 15,000 15,511
Wynn Resorts Finance LLC/Capital Corp.(a)
04/15/2025 7.750% 32,000 33,60010/01/2029 5.125% 12,000 12,205
Total 850,229
Health Care 0.3%
Acadia Healthcare Co., Inc.(a)
07/01/2028 5.500% 63,000 66,18004/15/2029 5.000% 17,000 17,595
AdaptHealth LLC(a)
03/01/2030 5.125% 107,000 109,435
Avantor Funding, Inc.(a)
07/15/2028 4.625% 56,000 58,84911/01/2029 3.875% 87,000 87,889
Becton Dickinson and Co.12/15/2044 4.685% 1,000,000 1,257,389
Catalent Pharma Solutions, Inc.(a)
02/15/2029 3.125% 15,000 14,79904/01/2030 3.500% 26,000 25,950
Change Healthcare Holdings LLC/Finance, Inc.(a)
03/01/2025 5.750% 46,000 46,442
Charles River Laboratories International, Inc.(a)
05/01/2028 4.250% 8,000 8,33503/15/2029 3.750% 19,000 19,293
CHS/Community Health Systems, Inc.(a)
02/15/2025 6.625% 58,000 60,03103/15/2026 8.000% 31,000 32,56603/15/2027 5.625% 15,000 15,86504/15/2029 6.875% 47,000 47,998
Cigna Corp.07/15/2046 4.800% 475,000 599,581
CVS Health Corp.03/25/2048 5.050% 900,000 1,177,605
HCA, Inc.09/01/2028 5.625% 77,000 89,93902/01/2029 5.875% 21,000 25,042
PORTFOLIO OF INVESTMENTS (continued)December 31, 2021
The accompanying Notes to Financial Statements are an integral part of this statement.
Columbia Variable Portfolio – Balanced Fund | Annual Report 2021 19

Corporate Bonds & Notes (continued)
IssuerCoupon
RatePrincipal
Amount ($) Value ($)
Hill-Rom Holdings, Inc.(a)
09/15/2027 4.375% 33,000 34,544
Mozart Debt Merger Sub, Inc.(a)
10/01/2029 5.250% 20,000 20,311
Ortho-Clinical Diagnostics, Inc./SA(a)
06/01/2025 7.375% 15,000 15,828
Select Medical Corp.(a)
08/15/2026 6.250% 104,000 110,176
Teleflex, Inc.(a)
06/01/2028 4.250% 27,000 27,773
Tenet Healthcare Corp.07/15/2024 4.625% 19,000 19,286
Tenet Healthcare Corp.(a)
04/01/2025 7.500% 47,000 49,36902/01/2027 6.250% 61,000 63,12311/01/2027 5.125% 35,000 36,49006/15/2028 4.625% 11,000 11,32010/01/2028 6.125% 60,000 63,397
Total 4,212,400
Healthcare Insurance 0.1%
Anthem, Inc.03/01/2028 4.101% 235,000 261,850
Centene Corp.12/15/2029 4.625% 92,000 99,28602/15/2030 3.375% 34,000 34,72810/15/2030 3.000% 41,000 41,71808/01/2031 2.625% 29,000 28,528
UnitedHealth Group, Inc.05/15/2060 3.125% 250,000 258,874
Total 724,984
Home Construction 0.0%
Meritage Homes Corp.06/01/2025 6.000% 46,000 51,436
Meritage Homes Corp.(a)
04/15/2029 3.875% 53,000 55,847
Shea Homes LP/Funding Corp.(a)
02/15/2028 4.750% 27,000 27,633
Taylor Morrison Communities, Inc.(a)
08/01/2030 5.125% 39,000 43,134
Taylor Morrison Communities, Inc./Holdings II(a)
04/15/2023 5.875% 36,000 37,623
TRI Pointe Group, Inc./Homes06/15/2024 5.875% 28,000 30,440
Total 246,113
Corporate Bonds & Notes (continued)
IssuerCoupon
RatePrincipal
Amount ($) Value ($)
Independent Energy 0.1%
Apache Corp.11/15/2027 4.875% 36,000 39,29309/01/2040 5.100% 35,000 39,55602/01/2042 5.250% 20,000 23,12104/15/2043 4.750% 47,000 51,70401/15/2044 4.250% 21,000 21,434
Callon Petroleum Co.07/01/2026 6.375% 104,000 100,591
Callon Petroleum Co.(a)
08/01/2028 8.000% 41,000 41,856
CNX Resources Corp.(a)
03/14/2027 7.250% 66,000 69,98601/15/2029 6.000% 38,000 39,520
Comstock Resources, Inc.(a)
03/01/2029 6.750% 27,000 29,27601/15/2030 5.875% 22,000 22,547
CrownRock LP/Finance, Inc.(a)
10/15/2025 5.625% 51,000 52,36305/01/2029 5.000% 19,000 19,726
Endeavor Energy Resources LP/Finance, Inc.(a)
07/15/2025 6.625% 21,000 22,21401/30/2028 5.750% 55,000 58,667
EQT Corp.01/15/2029 5.000% 36,000 40,072
EQT Corp.(h)
02/01/2030 7.500% 40,000 51,352
EQT Corp.(a)
05/15/2031 3.625% 20,000 20,869
Hilcorp Energy I LP/Finance Co.(a)
11/01/2028 6.250% 65,000 69,20202/01/2029 5.750% 11,000 11,332
Matador Resources Co.09/15/2026 5.875% 82,000 84,135
Occidental Petroleum Corp.08/15/2029 3.500% 1,000 1,02609/01/2030 6.625% 225,000 278,52101/01/2031 6.125% 25,000 30,34509/15/2036 6.450% 113,000 144,08007/15/2044 4.500% 3,000 3,08906/15/2045 4.625% 3,000 3,12003/15/2046 6.600% 14,000 18,17003/15/2048 4.200% 20,000 19,99708/15/2049 4.400% 94,000 95,537
SM Energy Co.09/15/2026 6.750% 75,000 76,959
Southwestern Energy Co.02/01/2032 4.750% 74,000 78,004
Total 1,657,664
PORTFOLIO OF INVESTMENTS (continued)December 31, 2021
The accompanying Notes to Financial Statements are an integral part of this statement.
20 Columbia Variable Portfolio – Balanced Fund | Annual Report 2021

Corporate Bonds & Notes (continued)
IssuerCoupon
RatePrincipal
Amount ($) Value ($)
Integrated Energy 0.0%
Cenovus Energy, Inc.02/15/2052 3.750% 710,000 715,324
Leisure 0.1%
Carnival Corp.(a)
03/01/2026 7.625% 47,000 49,21903/01/2027 5.750% 88,000 87,97808/01/2028 4.000% 66,000 65,52005/01/2029 6.000% 53,000 52,721
Cedar Fair LP/Canada’s Wonderland Co./Magnum Management Corp./MillenniumOperations LLC(a)
05/01/2025 5.500% 28,000 29,100
Cedar Fair LP/Canada’s Wonderland Co./Magnum Management Corp./MillenniumOperations LLC10/01/2028 6.500% 56,000 59,754
Cinemark USA, Inc.(a)
05/01/2025 8.750% 18,000 19,09503/15/2026 5.875% 40,000 40,40207/15/2028 5.250% 26,000 25,352
Live Nation Entertainment, Inc.(a)
03/15/2026 5.625% 14,000 14,46405/15/2027 6.500% 33,000 36,12010/15/2027 4.750% 32,000 32,893
NCL Corp., Ltd.(a)
02/01/2026 10.250% 14,000 16,27803/15/2026 5.875% 29,000 29,046
NCL Finance Ltd.(a)
03/15/2028 6.125% 15,000 14,842
Royal Caribbean Cruises Ltd.(a)
06/15/2023 9.125% 26,000 27,71707/01/2026 4.250% 36,000 34,95308/31/2026 5.500% 42,000 42,70404/01/2028 5.500% 48,000 48,691
Royal Caribbean Cruises Ltd.03/15/2028 3.700% 25,000 23,484
Six Flags Entertainment Corp.(a)
07/31/2024 4.875% 52,000 52,555
Six Flags Theme Parks, Inc.(a)
07/01/2025 7.000% 48,000 51,269
Total 854,157
Life Insurance 0.2%
Five Corners Funding Trust II(a)
05/15/2030 2.850% 1,100,000 1,140,284
Peachtree Corners Funding Trust(a)
02/15/2025 3.976% 350,000 373,299
Corporate Bonds & Notes (continued)
IssuerCoupon
RatePrincipal
Amount ($) Value ($)
Teachers Insurance & Annuity Association of America(a)
Subordinated09/15/2044 4.900% 460,000 591,669
Voya Financial, Inc.06/15/2046 4.800% 425,000 532,713
Total 2,637,965
Media and Entertainment 0.1%
Cengage Learning, Inc.(a)
06/15/2024 9.500% 60,000 60,758
Clear Channel Outdoor Holdings, Inc.(a)
04/15/2028 7.750% 60,000 64,44606/01/2029 7.500% 57,000 60,871
Clear Channel Worldwide Holdings, Inc.(a)
08/15/2027 5.125% 69,000 71,402
Diamond Sports Group LLC/Finance Co.(a)
08/15/2027 6.625% 13,000 3,635
Discovery Communications LLC09/15/2055 4.000% 376,000 395,931
iHeartCommunications, Inc.05/01/2026 6.375% 8,440 8,80005/01/2027 8.375% 99,366 104,861
iHeartCommunications, Inc.(a)
08/15/2027 5.250% 27,000 28,07701/15/2028 4.750% 26,000 26,383
Lamar Media Corp.02/15/2028 3.750% 18,000 18,09501/15/2029 4.875% 16,000 16,730
Netflix, Inc.04/15/2028 4.875% 30,000 34,27411/15/2028 5.875% 57,000 68,72605/15/2029 6.375% 99,000 123,394
Netflix, Inc.(a)
06/15/2030 4.875% 36,000 41,998
Outfront Media Capital LLC/Corp.(a)
08/15/2027 5.000% 55,000 56,27803/15/2030 4.625% 38,000 38,016
Roblox Corp.(a)
05/01/2030 3.875% 65,000 65,931
Scripps Escrow II, Inc.(a)
01/15/2029 3.875% 9,000 9,04601/15/2031 5.375% 18,000 18,341
Scripps Escrow, Inc.(a)
07/15/2027 5.875% 14,000 14,711
Univision Communications, Inc.(a)
05/01/2029 4.500% 31,000 31,392
Total 1,362,096
PORTFOLIO OF INVESTMENTS (continued)December 31, 2021
The accompanying Notes to Financial Statements are an integral part of this statement.
Columbia Variable Portfolio – Balanced Fund | Annual Report 2021 21

Corporate Bonds & Notes (continued)
IssuerCoupon
RatePrincipal
Amount ($) Value ($)
Metals and Mining 0.1%
Alcoa Nederland Holding BV(a)
03/31/2029 4.125% 25,000 25,876
Allegheny Technologies, Inc.10/01/2029 4.875% 21,000 20,98810/01/2031 5.125% 57,000 57,390
Constellium SE(a)
06/15/2028 5.625% 86,000 90,32404/15/2029 3.750% 111,000 109,270
Freeport-McMoRan, Inc.09/01/2029 5.250% 52,000 56,85008/01/2030 4.625% 38,000 40,74803/15/2043 5.450% 76,000 95,541
Hudbay Minerals, Inc.(a)
04/01/2026 4.500% 46,000 46,02104/01/2029 6.125% 40,000 42,420
Kaiser Aluminum Corp.(a)
06/01/2031 4.500% 92,000 90,574
Novelis Corp.(a)
11/15/2026 3.250% 27,000 27,30101/30/2030 4.750% 90,000 94,83608/15/2031 3.875% 32,000 31,844
Total 829,983
Midstream 0.5%
Cheniere Energy Partners LP10/01/2029 4.500% 43,000 45,81403/01/2031 4.000% 37,000 38,874
Cheniere Energy Partners LP(a)
01/31/2032 3.250% 88,000 88,967
Cheniere Energy, Inc.10/15/2028 4.625% 63,000 66,971
CNX Midstream Partners LP(a)
04/15/2030 4.750% 43,000 42,891
DCP Midstream Operating LP07/15/2027 5.625% 29,000 32,91705/15/2029 5.125% 51,000 57,57604/01/2044 5.600% 19,000 23,630
Delek Logistics Partners LP/Finance Corp.05/15/2025 6.750% 38,000 38,904
DT Midstream, Inc.(a)
06/15/2029 4.125% 39,000 40,09606/15/2031 4.375% 44,000 45,866
Energy Transfer Partners LP02/01/2042 6.500% 500,000 642,038
EQM Midstream Partners LP(a)
07/01/2025 6.000% 29,000 31,53107/01/2027 6.500% 41,000 45,99601/15/2031 4.750% 86,000 90,891
Corporate Bonds & Notes (continued)
IssuerCoupon
RatePrincipal
Amount ($) Value ($)
Hess Midstream Operations LP(a)
02/15/2030 4.250% 13,000 12,949
Holly Energy Partners LP/Finance Corp.(a)
02/01/2028 5.000% 51,000 51,167
ITT Holdings LLC(a)
08/01/2029 6.500% 12,000 11,858
Kinder Morgan Energy Partners LP03/01/2044 5.500% 900,000 1,105,529
MPLX LP02/15/2049 5.500% 785,000 1,003,894
NuStar Logistics LP06/01/2026 6.000% 43,000 46,90204/28/2027 5.625% 49,000 51,88710/01/2030 6.375% 30,000 33,456
Plains All American Pipeline LP/Finance Corp.01/15/2037 6.650% 1,100,000 1,424,678
Rockpoint Gas Storage Canada Ltd.(a)
03/31/2023 7.000% 36,000 36,046
Targa Resources Partners LP/Finance Corp.02/01/2027 5.375% 55,000 56,66103/01/2030 5.500% 109,000 119,23302/01/2031 4.875% 45,000 48,888
Targa Resources Partners LP/Finance Corp.(a)
01/15/2032 4.000% 34,000 35,597
TransMontaigne Partners LP/TLP Finance Corp.02/15/2026 6.125% 38,000 37,593
Venture Global Calcasieu Pass LLC(a)
08/15/2029 3.875% 60,000 62,45508/15/2031 4.125% 44,000 46,94811/01/2033 3.875% 51,000 53,579
Western Gas Partners LP08/15/2048 5.500% 48,000 57,381
Western Midstream Operating LP03/01/2028 4.500% 51,000 55,688
Williams Companies, Inc. (The)09/15/2045 5.100% 1,000,000 1,234,473
Total 6,919,824
Natural Gas 0.1%
NiSource, Inc.02/15/2044 4.800% 1,000,000 1,223,659
Oil Field Services 0.0%
Apergy Corp.05/01/2026 6.375% 26,000 27,078
Archrock Partners LP/Finance Corp.(a)
04/01/2028 6.250% 32,000 33,336
PORTFOLIO OF INVESTMENTS (continued)December 31, 2021
The accompanying Notes to Financial Statements are an integral part of this statement.
22 Columbia Variable Portfolio – Balanced Fund | Annual Report 2021

Corporate Bonds & Notes (continued)
IssuerCoupon
RatePrincipal
Amount ($) Value ($)
Nabors Industries Ltd.(a)
01/15/2026 7.250% 32,000 29,573
Transocean Guardian Ltd.(a)
01/15/2024 5.875% 295 283
Transocean Sentry Ltd.(a)
05/15/2023 5.375% 87,481 84,408
USA Compression Partners LP/Finance Corp.09/01/2027 6.875% 26,000 27,462
Total 202,140
Other REIT 0.0%
Blackstone Mortgage Trust, Inc.(a)
01/15/2027 3.750% 56,000 55,813
Ladder Capital Finance Holdings LLLP/Corp.(a)
10/01/2025 5.250% 81,000 82,08602/01/2027 4.250% 32,000 32,19406/15/2029 4.750% 75,000 76,895
Park Intermediate Holdings LLC/Domestic Property/Finance Co-Issuer(a)
10/01/2028 5.875% 55,000 57,592
Park Intermediate Holdings LLC/PK Domestic Property LLC/Finance Co-Issuer(a)
05/15/2029 4.875% 25,000 25,609
RHP Hotel Properties LP/Finance Corp.(a)
02/15/2029 4.500% 22,000 22,168
RLJ Lodging Trust LP(a)
07/01/2026 3.750% 27,000 27,03609/15/2029 4.000% 25,000 24,746
Service Properties Trust10/01/2024 4.350% 14,000 13,71912/15/2027 5.500% 19,000 19,508
Total 437,366
Packaging 0.0%
Ardagh Metal Packaging Finance USA LLC/PLC(a)
09/01/2029 4.000% 85,000 84,294
Ardagh Packaging Finance PLC/Holdings USA, Inc.(a)
08/15/2026 4.125% 63,000 64,40708/15/2027 5.250% 49,000 49,377
Berry Global, Inc.(a)
02/15/2026 4.500% 27,000 27,376
Canpack SA/US LLC(a)
11/15/2029 3.875% 80,000 78,068
Flex Acquisition Co., Inc.(a)
07/15/2026 7.875% 50,000 51,888
Trivium Packaging Finance BV(a)
08/15/2026 5.500% 62,000 64,74108/15/2027 8.500% 19,000 20,078
Total 440,229
Corporate Bonds & Notes (continued)
IssuerCoupon
RatePrincipal
Amount ($) Value ($)
Pharmaceuticals 0.3%
AbbVie, Inc.03/15/2035 4.550% 275,000 328,78211/06/2042 4.400% 1,275,000 1,529,638
Amgen, Inc.09/01/2053 2.770% 507,000 475,154
AstraZeneca Finance LLC05/28/2031 2.250% 800,000 808,561
Bausch Health Companies, Inc.(a)
04/01/2026 9.250% 62,000 65,84401/31/2027 8.500% 82,000 86,70708/15/2027 5.750% 34,000 35,32106/01/2028 4.875% 19,000 19,49302/15/2029 5.000% 22,000 19,52502/15/2029 6.250% 70,000 66,60701/30/2030 5.250% 8,000 7,07302/15/2031 5.250% 33,000 29,116
Bristol Myers Squibb Co.02/20/2048 4.550% 285,000 364,289
Endo Dac/Finance LLC/Finco, Inc.(a)
07/31/2027 9.500% 22,000 22,35406/30/2028 6.000% 17,000 12,689
Endo Luxembourg Finance Co I Sarl/US, Inc.(a)
04/01/2029 6.125% 18,000 17,624
Grifols Escrow Issuer SA(a)
10/15/2028 4.750% 34,000 34,317
Organon Finance 1 LLC(a)
04/30/2028 4.125% 63,000 64,59604/30/2031 5.125% 72,000 75,217
Par Pharmaceutical, Inc.(a)
04/01/2027 7.500% 32,000 32,691
Total 4,095,598
Property & Casualty 0.1%
Alliant Holdings Intermediate LLC/Co-Issuer(a)
10/15/2027 4.250% 89,000 89,25310/15/2027 6.750% 99,000 102,71211/01/2029 5.875% 31,000 31,563
American International Group, Inc.06/30/2050 4.375% 300,000 373,611
AssuredPartners, Inc.(a)
01/15/2029 5.625% 58,000 56,634
BroadStreet Partners, Inc.(a)
04/15/2029 5.875% 81,000 79,510
HUB International Ltd.(a)
12/01/2029 5.625% 58,000 59,726
Loews Corp.05/15/2030 3.200% 665,000 707,712
PORTFOLIO OF INVESTMENTS (continued)December 31, 2021
The accompanying Notes to Financial Statements are an integral part of this statement.
Columbia Variable Portfolio – Balanced Fund | Annual Report 2021 23

Corporate Bonds & Notes (continued)
IssuerCoupon
RatePrincipal
Amount ($) Value ($)
MGIC Investment Corp.08/15/2028 5.250% 34,000 35,869
Radian Group, Inc.03/15/2027 4.875% 20,000 21,463
USI, Inc.(a)
05/01/2025 6.875% 11,000 11,120
Total 1,569,173
Railroads 0.1%
CSX Corp.03/15/2044 4.100% 800,000 929,801
Union Pacific Corp.09/15/2037 3.600% 715,000 801,553
Total 1,731,354
Restaurants 0.0%
1011778 BC ULC/New Red Finance, Inc.(a)
01/15/2028 3.875% 70,000 70,874
IRB Holding Corp.(a)
06/15/2025 7.000% 71,000 75,10202/15/2026 6.750% 105,000 107,164
Total 253,140
Retailers 0.0%
Asbury Automotive Group Inc.(a)
02/15/2032 5.000% 13,000 13,431
Asbury Automotive Group, Inc.(a)
11/15/2029 4.625% 13,000 13,266
Group 1 Automotive, Inc.(a)
08/15/2028 4.000% 9,000 8,990
L Brands, Inc.(a)
07/01/2025 9.375% 6,000 7,31910/01/2030 6.625% 56,000 63,560
L Brands, Inc.06/15/2029 7.500% 23,000 26,19211/01/2035 6.875% 21,000 26,140
PetSmart, Inc./Finance Corp.(a)
02/15/2028 4.750% 51,000 52,42902/15/2029 7.750% 13,000 14,192
Total 225,519
Supermarkets 0.0%
Albertsons Companies LLC/Safeway, Inc./New Albertsons LP/Albertsons LLC(a)
03/15/2026 7.500% 18,000 19,22402/15/2028 5.875% 39,000 41,412
Albertsons Companies, Inc./Safeway, Inc./New Albertsons LP/Albertsons LLC(a)
02/15/2030 4.875% 49,000 52,964
Total 113,600
Corporate Bonds & Notes (continued)
IssuerCoupon
RatePrincipal
Amount ($) Value ($)
Technology 0.4%
Black Knight InfoServ LLC(a)
09/01/2028 3.625% 24,000 23,955
Boxer Parent Co., Inc.(a)
10/02/2025 7.125% 17,000 17,85103/01/2026 9.125% 6,000 6,266
Broadcom, Inc.(a)
02/15/2051 3.750% 1,114,000 1,163,840
Camelot Finance SA(a)
11/01/2026 4.500% 23,000 23,844
Clarivate Science Holdings Corp.(a)
07/01/2028 3.875% 31,000 31,24707/01/2029 4.875% 57,000 57,904
CommScope Technologies LLC(a)
06/15/2025 6.000% 33,000 33,036
Dun & Bradstreet Corp. (The)(a)
12/15/2029 5.000% 45,000 46,020
Gartner, Inc.(a)
07/01/2028 4.500% 51,000 53,26506/15/2029 3.625% 24,000 24,26810/01/2030 3.750% 52,000 52,860
HealthEquity, Inc.(a)
10/01/2029 4.500% 80,000 79,414
Helios Software Holdings, Inc.(a)
05/01/2028 4.625% 66,000 64,934
Intel Corp.03/25/2060 4.950% 260,000 365,056
International Business Machines Corp.05/15/2040 2.850% 600,000 590,605
ION Trading Technologies Sarl(a)
05/15/2028 5.750% 31,000 31,935
Iron Mountain, Inc.(a)
09/15/2027 4.875% 14,000 14,51207/15/2028 5.000% 54,000 55,73907/15/2030 5.250% 59,000 62,219
Logan Merger Sub, Inc.(a)
09/01/2027 5.500% 71,000 71,754
NCR Corp.(a)
09/01/2027 5.750% 25,000 26,13610/01/2028 5.000% 111,000 114,38204/15/2029 5.125% 53,000 54,804
Nielsen Finance LLC/Co.(a)
10/01/2028 5.625% 44,000 45,43007/15/2029 4.500% 31,000 30,49310/01/2030 5.875% 9,000 9,50307/15/2031 4.750% 21,000 20,810
NXP BV/Funding LLC/USA, Inc.(a)
05/01/2030 3.400% 1,000,000 1,066,321
PORTFOLIO OF INVESTMENTS (continued)December 31, 2021
The accompanying Notes to Financial Statements are an integral part of this statement.
24 Columbia Variable Portfolio – Balanced Fund | Annual Report 2021

Corporate Bonds & Notes (continued)
IssuerCoupon
RatePrincipal
Amount ($) Value ($)
Oracle Corp.04/15/2038 6.500% 485,000 653,360
Plantronics, Inc.(a)
03/01/2029 4.750% 125,000 119,168
QUALCOMM, Inc.05/20/2050 3.250% 340,000 373,487
RELX Capital, Inc.05/22/2030 3.000% 400,000 420,119
Shift4 Payments LLC/Finance Sub, Inc.(a)
11/01/2026 4.625% 51,000 52,734
Switch Ltd.(a)
06/15/2029 4.125% 31,000 31,813
Tempo Acquisition LLC/Finance Corp.(a)
06/01/2025 5.750% 48,000 49,779
Verscend Escrow Corp.(a)
08/15/2026 9.750% 79,000 83,479
ZoomInfo Technologies LLC/Finance Corp.(a)
02/01/2029 3.875% 86,000 84,997
Total 6,107,339
Transportation Services 0.1%
Avis Budget Car Rental LLC/Finance, Inc.(a)
07/15/2027 5.750% 5,000 5,213
ERAC USA Finance LLC(a)
10/15/2037 7.000% 515,000 759,783
Total 764,996
Wireless 0.1%
Altice France Holding SA(a)
02/15/2028 6.000% 105,000 100,430
Altice France SA(a)
01/15/2028 5.500% 115,000 114,00207/15/2029 5.125% 39,000 38,046
American Tower Corp.08/15/2029 3.800% 1,000,000 1,088,780
Sprint Capital Corp.03/15/2032 8.750% 47,000 70,508
Sprint Corp.03/01/2026 7.625% 86,000 103,122
T-Mobile USA, Inc.02/15/2029 2.625% 68,000 66,93402/15/2031 2.875% 37,000 36,52904/15/2031 3.500% 17,000 17,697
T-Mobile USA, Inc.(a)
04/15/2031 3.500% 64,000 66,336
Corporate Bonds & Notes (continued)
IssuerCoupon
RatePrincipal
Amount ($) Value ($)
Vmed O2 UK Financing I PLC(a)
01/31/2031 4.250% 33,000 32,34007/15/2031 4.750% 64,000 65,066
Total 1,799,790
Wirelines 0.3%
AT&T, Inc.09/15/2053 3.500% 1,710,000 1,728,386
Cablevision Lightpath LLC(a)
09/15/2027 3.875% 68,000 65,991
CenturyLink, Inc.04/01/2024 7.500% 12,000 13,138
Front Range BidCo, Inc.(a)
03/01/2027 4.000% 48,000 47,30903/01/2028 6.125% 52,000 51,313
Iliad Holding SAS(a)
10/15/2026 6.500% 55,000 57,82910/15/2028 7.000% 75,000 78,921
Northwest Fiber LLC/Finance Sub, Inc.(a)
02/15/2028 6.000% 23,000 22,604
Verizon Communications, Inc.08/10/2033 4.500% 1,600,000 1,885,069
Total 3,950,560
Total Corporate Bonds & Notes(Cost $88,403,440) 93,406,095
Exchange-Traded Equity Funds 0.9%
Shares Value ($)
International Mid Large Cap 0.9%
iShares Core MSCI EAFE ETF 168,620 12,585,797
Total Exchange-Traded Equity Funds(Cost $11,306,141) 12,585,797
Foreign Government Obligations(i) 0.0%
IssuerCoupon
RatePrincipal
Amount ($) Value ($)
Canada 0.0%
NOVA Chemicals Corp.(a)
06/01/2027 5.250% 34,000 36,26105/15/2029 4.250% 25,000 25,072
Total 61,333
Total Foreign Government Obligations(Cost $57,409) 61,333
PORTFOLIO OF INVESTMENTS (continued)December 31, 2021
The accompanying Notes to Financial Statements are an integral part of this statement.
Columbia Variable Portfolio – Balanced Fund | Annual Report 2021 25

Residential Mortgage-Backed Securities - Agency 5.5%
IssuerCoupon
RatePrincipal
Amount ($) Value ($)
Federal Home Loan Mortgage Corp.01/01/2030 3.500% 62,807 66,52504/01/2032 6.000% 35,913 39,62404/01/2032 7.000% 22,103 24,93507/01/2032 6.500% 11,744 12,96201/01/2033-07/01/2043 3.000% 847,572 892,15001/01/2034-05/01/2041 5.000% 379,155 429,03704/01/2041 4.500% 59,751 66,099
Federal Home Loan Mortgage Corp.(j)
05/01/2032 6.500% 202,648 223,66806/01/2037 6.000% 51,137 59,18802/01/2038 5.500% 204,661 234,61503/01/2038 5.000% 54,262 61,54605/01/2039-08/01/2041 4.500% 607,857 671,54908/01/2045 4.000% 55,590 60,589
Federal National Mortgage Association05/01/2024-12/01/2028 6.000% 19,236 21,21003/01/2026-12/01/2032 7.000% 298,582 313,29010/01/2026-12/01/2045 3.500% 531,070 561,75111/01/2026-01/01/2029 4.000% 269,646 283,65908/01/2028-09/01/2032 6.500% 79,476 89,06802/01/2033 2.500% 630,534 655,03902/01/2038-03/01/2038 5.500% 116,288 131,381
Federal National Mortgage Association(j)
02/01/2031 3.500% 165,280 174,28410/01/2040 4.500% 138,835 152,040
Uniform Mortgage-Backed Security TBA(k)
01/18/2037-01/13/2052 2.000% 29,550,000 29,591,06201/18/2037-01/13/2052 2.500% 26,475,000 27,072,34101/18/2037-01/13/2052 3.000% 15,700,000 16,289,30101/13/2052 3.500% 1,875,000 1,974,463
Total Residential Mortgage-Backed Securities - Agency(Cost $79,863,478) 80,151,376
Residential Mortgage-Backed Securities - Non-Agency 10.5%
510 Asset Backed Trust(a),(e)
CMO Series 2021-NPL2 Class A106/25/2061 2.116% 1,882,764 1,865,195
Ajax Mortgage Loan Trust(a),(e)
CMO Series 2021-A Class A109/25/2065 1.065% 3,136,255 3,114,629
Residential Mortgage-Backed Securities - Non-Agency (continued)
IssuerCoupon
RatePrincipal
Amount ($) Value ($)
CMO Series 2021-B Class A06/25/2066 2.239% 1,388,222 1,378,240
Angel Oak Mortgage Trust(a),(e)
CMO Series 2020-6 Class A305/25/2065 1.775% 198,573 197,779
CMO Series 2020-6 Class M105/25/2065 2.805% 400,000 399,396
CMO Series 2020-R1 Class A104/25/2053 0.990% 1,100,827 1,097,221
Angel Oak Mortgage Trust I LLC(a),(e)
CMO Series 2018-3 Class A309/25/2048 3.853% 165,297 165,164
CMO Series 2019-2 Class A303/25/2049 3.833% 158,131 158,630
Bayview Opportunity Master Fund IVa Trust(a)
CMO Series 2016-SPL1 Class A04/28/2055 4.000% 151,565 152,164
Bellemeade Re Ltd.(a),(b)
CMO Series 2020-3A Class M1B1-month USD LIBOR + 2.850%Floor 2.850%10/25/2030 2.952% 650,000 654,355
CMO Series 2020-4A Class M2A1-month USD LIBOR + 2.600%Floor 2.600%06/25/2030 2.702% 29,434 29,452
CMO Series 2021-1A Class M1C30-day Average SOFR + 2.950%Floor 2.950%03/25/2031 2.960% 800,000 822,702
CMO Series 2021-3A Class M1A30-day Average SOFR + 1.000%Floor 1.000%09/25/2031 1.050% 1,800,000 1,801,352
BRAVO Residential Funding Trust(a),(e)
CMO Series 2019-NQM1 Class A307/25/2059 2.996% 222,262 222,083
CMO Series 2019-NQM1 Class M107/25/2059 2.997% 350,000 344,359
CMO Series 2019-NQM2 Class A111/25/2059 2.748% 826,784 833,983
CMO Series 2019-NQM2 Class A311/25/2059 3.108% 275,595 277,652
CMO Series 2019-NQM2 Class M111/25/2059 3.451% 925,000 918,952
CMO Series 2020-NQM1 Class A105/25/2060 1.449% 437,706 437,721
CMO Series 2020-RPL1 Class A105/26/2059 2.500% 882,613 896,422
PORTFOLIO OF INVESTMENTS (continued)December 31, 2021
The accompanying Notes to Financial Statements are an integral part of this statement.
26 Columbia Variable Portfolio – Balanced Fund | Annual Report 2021

Residential Mortgage-Backed Securities - Non-Agency (continued)
IssuerCoupon
RatePrincipal
Amount ($) Value ($)
CMO Series 2021-A Class A103/25/2058 1.991% 1,450,746 1,439,630
CMO Series 2021-B Class A104/01/2069 2.115% 1,166,622 1,158,420
CMO Series 2021-NQM1 Class A102/25/2049 0.941% 1,839,864 1,824,989
CMO Series 2021-NQM1 Class A302/25/2049 1.332% 749,579 742,075
CMO Series 2021-NQM2 Class A303/25/2060 1.435% 665,540 661,535
Subordinated CMO Series 2021-NQM2 Class B103/25/2060 3.044% 425,000 418,237
BVRT Financing Trust(a),(b),(d)
CMO Series 2021-CRT2 Class M21-month USD LIBOR + 2.250%Floor 2.250%11/10/2032 2.351% 450,000 450,000
CIM Trust(a),(b)
CMO Series 2018-R6 Class A11-month USD LIBOR + 1.076%Floor 1.080%09/25/2058 1.178% 1,600,555 1,565,622
CIM Trust(a),(e)
CMO Series 2021-NR1 Class A107/25/2055 2.569% 1,331,759 1,329,739
CMO Series 2021-NR2 Class A107/25/2059 2.568% 904,534 902,266
Citigroup Mortgage Loan Trust, Inc.(a),(e)
CMO Series 2019-IMC1 Class A307/25/2049 3.030% 197,245 197,050
COLT Mortgage Loan Trust(a),(e)
CMO Series 2020-1R Class A109/25/2065 1.255% 391,276 391,293
CMO Series 2020-2 Class A103/25/2065 1.853% 193,268 193,599
CMO Series 2021-2R Class A107/27/2054 0.798% 735,874 735,233
Connecticut Avenue Securities Trust(a),(b)
CMO Series 2020-R01 Class 1M21-month USD LIBOR + 2.050%Floor 2.050%01/25/2040 2.152% 859,006 862,288
Credit Suisse Mortgage Trust(a),(e)
CMO Series 2021-AFC1 Class A103/25/2056 0.830% 882,197 874,205
CMO Series 2021-NQM1 Class A305/25/2065 1.199% 391,120 387,950
CMO Series 2021-NQM1 Class M105/25/2065 2.130% 175,000 173,562
Residential Mortgage-Backed Securities - Non-Agency (continued)
IssuerCoupon
RatePrincipal
Amount ($) Value ($)
CMO Series 2021-RPL1 Class A109/27/2060 1.668% 2,084,496 2,066,992
CMO Series 2021-RPL2 Class M101/25/2060 2.750% 751,019 788,220
CMO Series 2021-RPL2 Class M201/25/2060 3.250% 375,000 398,717
CSMC Trust(a),(e)
CMO Series 2018-RPL9 Class A09/25/2057 3.850% 1,886,251 1,959,474
CMO Series 2021-RPL4 Class A112/27/2060 1.796% 1,279,736 1,273,780
Subordinated CMO Series 2020-RPL3 Class A103/25/2060 2.691% 987,037 988,157
CSMC Trust(a)
CMO Series 2019-AFC1 Class A107/25/2049 2.573% 710,988 716,967
Subordinated CMO Series 2020-RPL4 Class A101/25/2060 2.000% 832,722 837,677
Eagle Re Ltd.(a),(b)
CMO Series 2021-1 Class M1C30-day Average SOFR + 2.700%Floor 2.700%10/25/2033 2.710% 425,000 431,693
CMO Series 2021-2 Class M1B30-day Average SOFR + 2.050%Floor 2.050%04/25/2034 2.099% 1,900,000 1,903,372
Subordinated CMO Series 2020-1 Class M1A1-month USD LIBOR + 0.900%01/25/2030 1.002% 2,325,000 2,316,283
Ellington Financial Mortgage Trust(a),(e)
CMO Series 2019-2 Class A311/25/2059 3.046% 190,604 191,755
CMO Series 2020-1 Class A105/25/2065 2.010% 88,610 88,951
Freddie Mac STACR REMIC Trust(a),(b)
CMO Series 2020-DNA1 Class M21-month USD LIBOR + 1.700%01/25/2050 1.802% 1,182,489 1,184,745
CMO Series 2020-DNA6 Class M130-day Average SOFR + 0.900%12/25/2050 0.950% 189,629 189,579
CMO Series 2021-DNA1 Class M230-day Average SOFR + 1.800%01/25/2051 1.850% 675,000 676,600
CMO Series 2021-DNA5 Class M230-day Average SOFR + 1.650%01/25/2034 1.700% 575,000 577,310
PORTFOLIO OF INVESTMENTS (continued)December 31, 2021
The accompanying Notes to Financial Statements are an integral part of this statement.
Columbia Variable Portfolio – Balanced Fund | Annual Report 2021 27

Residential Mortgage-Backed Securities - Non-Agency (continued)
IssuerCoupon
RatePrincipal
Amount ($) Value ($)
CMO Series 2021-HQA1 Class M130-day Average SOFR + 0.700%08/25/2033 0.750% 692,408 692,014
Freddie Mac STACR Trust(a),(b)
CMO Series 2018-DNA2 Class M21-month USD LIBOR + 2.150%12/25/2030 2.252% 675,000 683,206
CMO Series 2019-DNA4 Class M21-month USD LIBOR + 1.950%10/25/2049 2.052% 460,103 461,466
Freddie Mac Structured Agency Credit Risk Debt Notes(a),(b)
CMO Series 2020-DNA3 Class M21-month USD LIBOR + 3.000%06/25/2050 3.102% 263,778 264,148
Subordinated CMO Series 2021-DNA7 Class M130-day Average SOFR + 0.850%11/25/2041 0.898% 4,375,000 4,377,854
GCAT LLC(a),(e)
CMO Series 2020-3 Class A109/25/2025 2.981% 1,446,371 1,457,108
GCAT Trust(a),(e)
CMO Series 2019-RPL1 Class A110/25/2068 2.650% 1,183,657 1,200,683
CMO Series 2021-CM2 Class A108/25/2066 2.352% 4,953,246 4,942,871
GS Mortgage-Backed Securities Trust(a),(e)
CMO Series 2019-SL1 Class A101/25/2059 2.625% 781,954 788,144
CMO Series 2020-NQM1 Class A109/27/2060 1.382% 673,228 674,768
Home Re Ltd.(a),(b)
CMO Series 2021-1 Class M1B1-month USD LIBOR + 1.550%07/25/2033 1.652% 1,500,000 1,500,909
Homeward Opportunities Fund I Trust(a)
CMO Series 2018-2 Class A311/25/2058 4.239% 418,957 419,963
Homeward Opportunities Fund I Trust(a),(e)
CMO Series 2020-2 Class A305/25/2065 3.200% 550,000 558,457
Legacy Mortgage Asset Trust(a),(e)
CMO Series 2021-GS1 Class A110/25/2066 1.892% 1,351,068 1,351,533
CMO Series 2021-GS2 Class A104/25/2061 1.750% 2,707,660 2,684,058
Mello Warehouse Securitization Trust(a),(b)
CMO Series 2020-1 Class C1-month USD LIBOR + 1.350%Floor 1.350%10/25/2053 1.452% 775,000 774,427
Residential Mortgage-Backed Securities - Non-Agency (continued)
IssuerCoupon
RatePrincipal
Amount ($) Value ($)
MetLife Securitization Trust(a),(e)
CMO Series 2018-1A Class A03/25/2057 3.750% 472,454 487,071
MFA Trust(a),(e)
CMO Series 2020-NQM3 Class M101/26/2065 2.654% 475,000 475,236
CMO Series 2021-NQM1 Class A104/25/2065 1.153% 1,311,488 1,311,597
MFRA Trust(a),(e)
CMO Series 2021-INV1 Class A101/25/2056 0.852% 443,316 440,040
CMO Series 2021-INV1 Class A201/25/2056 1.057% 82,097 81,486
CMO Series 2021-INV1 Class A301/25/2056 1.262% 137,266 136,239
Mill City Mortgage Loan Trust(a),(e)
CMO Series 2018-3 Class A108/25/2058 3.472% 1,118,309 1,147,899
CMO Series 2021-NMR1 Class M111/25/2060 1.850% 1,150,000 1,142,805
MRA Issuance Trust(a),(b),(c),(d)
CMO Series 2021-11 Class A1X1-month USD LIBOR + 1.150%Floor 1.150%01/25/2022 1.234% 4,000,000 4,000,000
MRA Issuance Trust(a),(b)
CMO Series 2021-NA1 Class A1X1-month USD LIBOR + 1.500%Floor 1.500%03/08/2022 1.600% 1,950,000 1,950,404
New Residential Mortgage Loan Trust(a)
CMO Series 2016-3A Class A109/25/2056 3.750% 194,768 205,697
NRZ Excess Spread-Collateralized Notes(a)
Series 2020-PLS1 Class A12/25/2025 3.844% 620,548 623,218
Oaktown Re VI Ltd.(a),(b)
CMO Series 2021-1A Class M1B30-day Average SOFR + 2.050%Floor 2.050%10/25/2033 2.100% 825,000 826,017
OBX Trust(a),(b)
CMO Series 2020-EXP3 Class 2A1A1-month USD LIBOR + 0.950%01/25/2060 1.002% 929,241 930,381
Oceanview Mortgage Loan Trust(a)
CMO Series 2020-1 Class A1A05/28/2050 1.733% 468,287 469,075
PORTFOLIO OF INVESTMENTS (continued)December 31, 2021
The accompanying Notes to Financial Statements are an integral part of this statement.
28 Columbia Variable Portfolio – Balanced Fund | Annual Report 2021

Residential Mortgage-Backed Securities - Non-Agency (continued)
IssuerCoupon
RatePrincipal
Amount ($) Value ($)
OSAT Trust(a),(e)
CMO Series 2020-RPL1 Class A112/26/2059 3.072% 2,044,663 2,044,586
Preston Ridge Partners Mortgage(a),(e)
CMO Series 2021-4 Class A104/25/2026 1.867% 2,901,252 2,870,765
Preston Ridge Partners Mortgage LLC(a),(e)
CMO Series 2020-6 Class A111/25/2025 2.363% 798,939 793,720
CMO Series 2021-3 Class A104/25/2026 1.867% 1,768,060 1,756,486
Preston Ridge Partners Mortgage Trust(a),(e)
CMO Series 2021-1 Class A101/25/2026 2.115% 1,274,634 1,269,215
CMO Series 2021-10 Class A110/25/2026 2.487% 1,623,454 1,619,465
CMO Series 2021-9 Class A110/25/2026 2.363% 2,668,272 2,646,251
Pretium Mortgage Credit Partners LLC(a),(c),(d),(e)
CMO Series 2021-NPL6 Class A107/25/2051 2.487% 4,975,000 4,975,000
PRKCM Trust(a),(e)
CMO Series 2021-AFC2 Class A311/25/2056 2.893% 2,000,000 1,988,083
CMO Series 2021-AFC2 Class M111/25/2056 3.443% 1,475,000 1,464,961
Subordinated CMO Series 2021-AFC2 Class B111/25/2056 3.701% 1,300,000 1,237,547
PRPM LLC(a),(e)
CMO Series 2021-RPL1 Class A107/25/2051 1.319% 795,251 786,351
Radnor Re Ltd.(a),(b)
CMO Series 2020-1 Class M1A1-month USD LIBOR + 0.950%Floor 0.950%02/25/2030 1.052% 700,000 699,509
Subordinated CMO Series 2021-2 Class M1A30-day Average SOFR + 1.850%Floor 1.850%11/25/2031 1.898% 500,000 501,357
Subordinated CMO Series 2021-2 Class M1B30-day Average SOFR + 3.700%Floor 3.700%11/25/2031 3.748% 725,000 733,186
RCO VII Mortgage LLC(a),(e)
CMO Series 2021-1 Class A105/25/2026 1.868% 1,308,385 1,299,834
Residential Mortgage-Backed Securities - Non-Agency (continued)
IssuerCoupon
RatePrincipal
Amount ($) Value ($)
Residential Mortgage Loan Trust(a),(e)
CMO Series 2020-1 Class A302/25/2024 2.684% 347,538 349,152
STACR Trust(a),(b)
CMO Series 2018-DNA3 Class M21-month USD LIBOR + 2.100%09/25/2048 2.202% 1,500,000 1,516,563
Starwood Mortgage Residential Trust(a),(e)
CMO Series 2019-INV1 Class A109/27/2049 2.610% 263,584 265,644
CMO Series 2019-INV1 Class A309/27/2049 2.916% 557,774 561,255
CMO Series 2020-2 Class A304/25/2060 3.000% 975,000 978,590
CMO Series 2020-INV1 Class A311/25/2055 1.593% 269,562 269,491
CMO Series 2021-4 Class M108/25/2056 2.400% 525,000 520,470
Toorak Mortgage Corp., Ltd.(e)
CMO Series 2019-2 Class A109/25/2022 3.721% 1,015,457 1,016,780
Toorak Mortgage Corp., Ltd.(a),(e)
CMO Series 2020-1 Class A103/25/2023 2.734% 3,800,000 3,805,845
CMO Series 2021-1 Class A106/25/2024 2.240% 900,000 895,241
Towd Point HE Trust(a),(e)
CMO Series 2021-HE1 Class M202/25/2063 2.500% 450,000 452,335
Towd Point Mortgage Trust(a)
CMO Series 2015-6 Class A104/25/2055 3.500% 8,860 8,853
CMO Series 2016-3 Class A104/25/2056 2.250% 19,273 19,278
Towd Point Mortgage Trust(a),(e)
CMO Series 2016-2 Class A108/25/2055 3.000% 86,642 86,906
CMO Series 2018-1 Class A101/25/2058 3.000% 244,280 247,365
CMO Series 2018-6 Class A1A03/25/2058 3.750% 966,715 985,328
Towd Point Mortgage Trust(a),(b)
CMO Series 2019-HY1 Class A11-month USD LIBOR + 1.000%10/25/2048 1.102% 707,521 710,356
CMO Series 2019-HY2 Class A11-month USD LIBOR + 1.000%Floor 1.000%05/25/2058 1.102% 825,380 831,991
PORTFOLIO OF INVESTMENTS (continued)December 31, 2021
The accompanying Notes to Financial Statements are an integral part of this statement.
Columbia Variable Portfolio – Balanced Fund | Annual Report 2021 29

Residential Mortgage-Backed Securities - Non-Agency (continued)
IssuerCoupon
RatePrincipal
Amount ($) Value ($)
TVC Mortgage Trust(a)
CMO Series 2020-RTL1 Class A109/25/2024 3.474% 300,000 301,139
VCAT Asset Securitization LLC(a),(e)
CMO Series 2021-NPL6 Class A109/25/2051 1.917% 4,971,510 4,886,394
VCAT LLC(a),(e)
CMO Series 2021-NPL1 Class A112/26/2050 2.289% 287,515 286,543
Vericrest Opportunity Loan Transferee(a),(e)
CMO Series 2021-NP11 Class A108/25/2051 1.868% 2,418,748 2,392,671
Vericrest Opportunity Loan Transferee XCII LLC(a),(e)
CMO Series 2021-NPL1 Class A102/27/2051 1.893% 1,645,041 1,638,057
Vericrest Opportunity Loan Transferee XCIII LLC(a),(e)
CMO Series 2021-NPL2 Class A102/27/2051 1.893% 1,430,766 1,424,859
Vericrest Opportunity Loan Transferee XCIV LLC(a),(e)
CMO Series 2021-NPL3 Class A102/27/2051 2.240% 1,697,257 1,693,042
Vericrest Opportunity Loan Transferee XCIX LLC(a),(e)
CMO Series 2021-NPL8 Class A104/25/2051 2.116% 1,077,663 1,072,963
Vericrest Opportunity Loan Transferee XCVI LLC(a),(e)
CMO Series 2021-NPL5 Class A103/27/2051 2.116% 1,055,585 1,050,633
Vericrest Opportunity Loan Transferee XCVII LLC(a),(e)
CMO Series 2021-NPL6 Class A104/25/2051 2.240% 4,315,054 4,289,197
Vericrest Opportunity Loan Trust CI LLC(a),(e)
CMO Series 2021-NP10 Class A105/25/2051 1.992% 3,057,891 3,058,176
Verus Securitization Trust(a),(e)
CMO Series 2019-3 Class A307/25/2059 3.040% 987,215 989,610
CMO Series 2019-4 Class A311/25/2059 3.000% 1,215,700 1,223,962
CMO Series 2020-1 Class M101/25/2060 3.021% 1,000,000 1,007,421
CMO Series 2020-2 Class A105/25/2060 2.743% 298,918 300,381
CMO Series 2020-INV1 Class A103/25/2060 1.977% 117,944 118,619
CMO Series 2021-R1 Class A210/25/2063 1.057% 380,347 379,114
CMO Series 2021-R1 Class A310/25/2063 1.262% 481,773 480,000
Residential Mortgage-Backed Securities - Non-Agency (continued)
IssuerCoupon
RatePrincipal
Amount ($) Value ($)
Visio Trust(a),(e)
CMO Series 2019-2 Class A311/25/2054 3.076% 581,858 589,821
Visio Trust(a)
CMO Series 2020-1R Class A211/25/2055 1.567% 328,420 326,939
CMO Series 2020-1R Class A311/25/2055 1.873% 383,157 381,658
ZH Trust(a)
CMO Series 2021-1 Class A02/18/2027 2.253% 800,000 794,700
Total Residential Mortgage-Backed Securities - Non-Agency(Cost $152,884,187) 152,617,848
Senior Loans 0.0%
BorrowerCoupon
RatePrincipal
Amount ($) Value ($)
Chemicals 0.0%
WR Grace & Co.(b),(l)
Term Loan1-month USD LIBOR + 3.750%Floor 0.500%09/22/2028 4.250% 34,000 34,026
Consumer Cyclical Services 0.0%
8th Avenue Food & Provisions, Inc.(b),(d),(l)
2nd Lien Term Loan1-month USD LIBOR + 7.750%10/01/2026 7.852% 4,859 4,616
Consumer Products 0.0%
SWF Holdings I Corp.(b),(l)
1st Lien Term Loan1-month USD LIBOR + 4.000%Floor 0.750%10/06/2028 4.750% 65,000 64,350
Food and Beverage 0.0%
BellRing Brands LLC(b),(l)
Term Loan1-month USD LIBOR + 4.000%Floor 0.750%10/21/2024 4.750% 14,851 14,863
Media and Entertainment 0.0%
Cengage Learning, Inc.(b),(l)
Tranche B 1st Lien Term Loan1-month USD LIBOR + 4.750%Floor 1.000%07/14/2026 5.750% 55,864 55,963
PORTFOLIO OF INVESTMENTS (continued)December 31, 2021
The accompanying Notes to Financial Statements are an integral part of this statement.
30 Columbia Variable Portfolio – Balanced Fund | Annual Report 2021

Senior Loans (continued)
BorrowerCoupon
RatePrincipal
Amount ($) Value ($)
Restaurants 0.0%
IRB Holding Corp.(b),(l)
Tranche B Term Loan3-month USD LIBOR + 2.750%Floor 1.000%02/05/2025 3.750% 16,528 16,488
Technology 0.0%
Ascend Learning LLC(b),(l),(m)
1st Lien Term Loan1-month USD LIBOR + 3.500%Floor 0.500%12/11/2028 4.000% 39,000 38,911
Ascend Learning LLC(b),(l)
2nd Lien Term Loan1-month USD LIBOR + 5.750%Floor 0.500%12/10/2029 6.250% 23,000 23,038
DCert Buyer, Inc.(b),(l)
2nd Lien Term Loan1-month USD LIBOR + 7.000%02/19/2029 7.104% 36,000 36,000
Epicore Software Corp.(b),(l)
2nd Lien Term Loan1-month USD LIBOR + 7.750%Floor 1.000%07/31/2028 8.750% 17,000 17,368
Project Alpha Intermediate Holding, Inc.(b),(l)
Term Loan1-month USD LIBOR + 4.000%04/26/2024 5.000% 18,688 18,700
UKG, Inc.(b),(l)
1st Lien Term Loan1-month USD LIBOR + 3.250%Floor 0.500%05/04/2026 3.750% 23,185 23,047
Senior Loans (continued)
BorrowerCoupon
RatePrincipal
Amount ($) Value ($)
2nd Lien Term Loan1-month USD LIBOR + 5.250%Floor 0.500%05/03/2027 5.750% 45,000 45,085
Total 202,149
Total Senior Loans(Cost $391,908) 392,455
U.S. Treasury Obligations 0.3%
IssuerCoupon
RatePrincipal
Amount ($) Value ($)
U.S. Treasury(j)
02/15/2045 2.500% 3,925,000 4,319,953
Total U.S. Treasury Obligations(Cost $4,666,289) 4,319,953
Money Market Funds 6.2%
Shares Value ($)
Columbia Short-Term Cash Fund, 0.085%(n),(o) 89,988,018 89,970,020
Total Money Market Funds(Cost $89,976,027) 89,970,020
Total Investments in Securities(Cost: $1,233,919,166) 1,525,857,067
Other Assets & Liabilities, Net (74,191,677)
Net Assets 1,451,665,390
At December 31, 2021, securities and/or cash totaling $2,114,566 were pledged as collateral.
Investments in derivatives
Long futures contracts
DescriptionNumber ofcontracts
Expirationdate
Tradingcurrency
Notionalamount
Value/Unrealizedappreciation ($)
Value/Unrealizeddepreciation ($)
U.S. Treasury 10-Year Note 785 03/2022 USD 102,417,969 295,807 —U.S. Treasury 10-Year Note 75 03/2022 USD 9,785,156 — (30,202)U.S. Treasury 2-Year Note 50 03/2022 USD 10,908,594 — (21,189)U.S. Treasury 5-Year Note 340 03/2022 USD 41,132,031 — (24,319)U.S. Ultra Treasury Bond 20 03/2022 USD 3,942,500 40,429 —
Total 336,236 (75,710)
PORTFOLIO OF INVESTMENTS (continued)December 31, 2021
The accompanying Notes to Financial Statements are an integral part of this statement.
Columbia Variable Portfolio – Balanced Fund | Annual Report 2021 31

Notes to Portfolio of Investments
(a) Represents privately placed and other securities and instruments exempt from Securities and Exchange Commission registration (collectively, private placements), such asSection 4(a)(2) and Rule 144A eligible securities, which are often sold only to qualified institutional buyers. At December 31, 2021, the total value of these securities amounted to$325,766,876, which represents 22.44% of total net assets.
(b) Variable rate security. The interest rate shown was the current rate as of December 31, 2021.
(c) Represents fair value as determined in good faith under procedures approved by the Board of Trustees. At December 31, 2021, the total value of these securities amounted to$10,802,435, which represents 0.74% of total net assets.
(d) Valuation based on significant unobservable inputs.
(e) Variable or floating rate security, the interest rate of which adjusts periodically based on changes in current interest rates and prepayments on the underlying pool of assets. Theinterest rate shown was the current rate as of December 31, 2021.
(f) Non-income producing investment.
(g) Payment-in-kind security. Interest can be paid by issuing additional par of the security or in cash.
(h) Represents a variable rate security with a step coupon where the rate adjusts according to a schedule for a series of periods, typically lower for an initial period and then increasingto a higher coupon rate thereafter. The interest rate shown was the current rate as of December 31, 2021.
(i) Principal and interest may not be guaranteed by a governmental entity.
(j) This security or a portion of this security has been pledged as collateral in connection with derivative contracts.
(k) Represents a security purchased on a when-issued basis.
(l) The stated interest rate represents the weighted average interest rate at December 31, 2021 of contracts within the senior loan facility. Interest rates on contracts are primarilydetermined either weekly, monthly or quarterly by reference to the indicated base lending rate and spread and the reset period. These base lending rates are primarily the LIBORand other short-term rates. Base lending rates may be subject to a floor or minimum rate. The interest rate for senior loans purchased on a when-issued or delayed delivery basiswill be determined upon settlement, therefore no interest rate is disclosed. Senior loans often require prepayments from excess cash flows or permit the borrowers to repay at theirelection. The degree to which borrowers repay cannot be predicted with accuracy. As a result, remaining maturities of senior loans may be less than the stated maturities.Generally, the Fund is contractually obligated to receive approval from the agent bank and/or borrower prior to the disposition of a senior loan.
(m) Represents a security purchased on a forward commitment basis.
(n) The rate shown is the seven-day current annualized yield at December 31, 2021.
(o) As defined in the Investment Company Act of 1940, as amended, an affiliated company is one in which the Fund owns 5% or more of the company’s outstanding voting securities,or a company which is under common ownership or control with the Fund. The value of the holdings and transactions in these affiliated companies during the year endedDecember 31, 2021 are as follows:
Affiliated issuersBeginning
of period($) Purchases($) Sales($)
Net change inunrealized
appreciation(depreciation)($)
End ofperiod($)
Realized gain(loss)($) Dividends($)
End ofperiod shares
Columbia Short-Term Cash Fund, 0.085%76,557,600 452,626,572 (439,209,182) (4,970) 89,970,020 (3,982) 57,466 89,988,018
Abbreviation Legend
CMO Collateralized Mortgage Obligation
LIBOR London Interbank Offered Rate
SOFR Secured Overnight Financing Rate
TBA To Be Announced
Currency Legend
USD US Dollar
Fair value measurements
The Fund categorizes its fair value measurements according to a three-level hierarchy that maximizes the use of observable inputs and minimizes the use of unobservable inputs byprioritizing that the most observable input be used when available. Observable inputs are those that market participants would use in pricing an investment based on market dataobtained from sources independent of the reporting entity. Unobservable inputs are those that reflect the Fund’s assumptions about the information market participants would use inpricing an investment. An investment’s level within the fair value hierarchy is based on the lowest level of any input that is deemed significant to the asset’s or liability’s fair valuemeasurement. The input levels are not necessarily an indication of the risk or liquidity associated with investments at that level. For example, certain U.S. government securities aregenerally high quality and liquid, however, they are reflected as Level 2 because the inputs used to determine fair value may not always be quoted prices in an active market.
Fair value inputs are summarized in the three broad levels listed below:
� Level 1 — Valuations based on quoted prices for investments in active markets that the Fund has the ability to access at the measurement date. Valuation adjustments are notapplied to Level 1 investments.
PORTFOLIO OF INVESTMENTS (continued)December 31, 2021
The accompanying Notes to Financial Statements are an integral part of this statement.
32 Columbia Variable Portfolio – Balanced Fund | Annual Report 2021

Fair value measurements (continued)
� Level 2 — Valuations based on other significant observable inputs (including quoted prices for similar securities, interest rates, prepayment speeds, credit risks, etc.).
� Level 3 — Valuations based on significant unobservable inputs (including the Fund’s own assumptions and judgment in determining the fair value of investments).
Inputs that are used in determining fair value of an investment may include price information, credit data, volatility statistics, and other factors. These inputs can be either observable orunobservable. The availability of observable inputs can vary between investments, and is affected by various factors such as the type of investment, and the volume and level of activityfor that investment or similar investments in the marketplace. The inputs will be considered by the Investment Manager, along with any other relevant factors in the calculation of aninvestment’s fair value. The Fund uses prices and inputs that are current as of the measurement date, which may include periods of market dislocations. During these periods, theavailability of prices and inputs may be reduced for many investments. This condition could cause an investment to be reclassified between the various levels within the hierarchy.
Investments falling into the Level 3 category are primarily supported by quoted prices from brokers and dealers participating in the market for those investments. However, these maybe classified as Level 3 investments due to lack of market transparency and corroboration to support these quoted prices. Additionally, valuation models may be used as the pricingsource for any remaining investments classified as Level 3. These models may rely on one or more significant unobservable inputs and/or significant assumptions by the InvestmentManager. Inputs used in valuations may include, but are not limited to, financial statement analysis, capital account balances, discount rates and estimated cash flows, andcomparable company data.
Under the direction of the Fund’s Board of Trustees (the Board), the Investment Manager’s Valuation Committee (the Committee) is responsible for overseeing the valuation proceduresapproved by the Board. The Committee consists of voting and non-voting members from various groups within the Investment Manager’s organization, including operations andaccounting, trading and investments, compliance, risk management and legal.
The Committee meets at least monthly to review and approve valuation matters, which may include a description of specific valuation determinations, data regarding pricing informationreceived from approved pricing vendors and brokers and the results of Board-approved valuation control policies and procedures (the Policies). The Policies address, among otherthings, instances when market quotations are or are not readily available, including recommendations of third party pricing vendors and a determination of appropriate pricingmethodologies; events that require specific valuation determinations and assessment of fair value techniques; securities with a potential for stale pricing, including those that areilliquid, restricted, or in default; and the effectiveness of third party pricing vendors, including periodic reviews of vendors. The Committee meets more frequently, as needed, to discussadditional valuation matters, which may include the need to review back-testing results, review time-sensitive information or approve related valuation actions. The Committee reports tothe Board, with members of the Committee meeting with the Board at each of its regularly scheduled meetings to discuss valuation matters and actions during the period, similar tothose described earlier.
The following table is a summary of the inputs used to value the Fund’s investments at December 31, 2021:
Level 1 ($) Level 2 ($) Level 3 ($) Total ($)
Investments in Securities
Asset-Backed Securities — Non-Agency — 91,919,413 5,177,435 97,096,848Commercial Mortgage-Backed Securities - Non-Agency — 78,014,480 — 78,014,480Common Stocks
Communication Services 109,809,217 — — 109,809,217Consumer Discretionary 85,823,846 — — 85,823,846Consumer Staples 41,675,701 — — 41,675,701Energy 27,484,216 — — 27,484,216Financials 92,721,541 — — 92,721,541Health Care 125,149,101 — — 125,149,101Industrials 77,373,977 — — 77,373,977Information Technology 300,740,401 — — 300,740,401Materials 28,733,217 — — 28,733,217Real Estate 11,450,560 — — 11,450,560Utilities 16,198,628 — — 16,198,628
Total Common Stocks 917,160,405 — — 917,160,405
Convertible Bonds — 80,457 — 80,457Corporate Bonds & Notes — 93,406,095 — 93,406,095Exchange-Traded Equity Funds 12,585,797 — — 12,585,797Foreign Government Obligations — 61,333 — 61,333Residential Mortgage-Backed Securities - Agency — 80,151,376 — 80,151,376Residential Mortgage-Backed Securities - Non-Agency — 143,192,848 9,425,000 152,617,848Senior Loans — 387,839 4,616 392,455U.S. Treasury Obligations 4,319,953 — — 4,319,953Money Market Funds 89,970,020 — — 89,970,020
Total Investments in Securities 1,024,036,175 487,213,841 14,607,051 1,525,857,067
Investments in Derivatives
AssetFutures Contracts 336,236 — — 336,236
LiabilityFutures Contracts (75,710) — — (75,710)
Total 1,024,296,701 487,213,841 14,607,051 1,526,117,593
PORTFOLIO OF INVESTMENTS (continued)December 31, 2021
The accompanying Notes to Financial Statements are an integral part of this statement.
Columbia Variable Portfolio – Balanced Fund | Annual Report 2021 33

Fair value measurements (continued)
See the Portfolio of Investments for all investment classifications not indicated in the table.
The Fund’s assets assigned to the Level 2 input category are generally valued using the market approach, in which a security’s value is determined through reference to prices andinformation from market transactions for similar or identical assets.
Derivative instruments are valued at unrealized appreciation (depreciation).
The following table is a reconciliation of Level 3 assets for which significant observable and unobservable inputs were used to determine fair value:
Balanceas of
12/31/2020($)
Increase(decrease)in accrueddiscounts/premiums
($)
Realizedgain (loss)
($)
Changein unrealizedappreciation
(depreciation)(a)
($)Purchases
($)Sales($)
Transfersinto
Level 3($)
Transfersout ofLevel 3
($)
Balanceas of
12/31/2021($)
Asset-Backed Securities — Non-Agency 877,377 — — 2,435 5,175,000 — — (877,377) 5,177,435Residential Mortgage-Backed Securities —
Non-Agency 3,799,257 — 2,088 (4,889) 9,424,994 (3,796,450) — — 9,425,000Senior Loans — — — (158) — — 4,774 — 4,616
Total 4,676,634 — 2,088 (2,612) 14,599,994 (3,796,450) 4,774 (877,377) 14,607,051
(a) Change in unrealized appreciation (depreciation) relating to securities held at December 31, 2021 was $2,283, which is comprised of Asset-Backed Securities — Non-Agency of$2,435, Residential Mortgage-Backed Securities — Non-Agency of $6 and Senior Loans of $(158).
The Fund’s assets assigned to the Level 3 category are valued utilizing the valuation technique deemed the most appropriate in the circumstances. Certain residential mortgage backedsecurities, asset backed securities and senior loans classified as Level 3 securities are valued using the market approach and utilize single market quotations from broker dealers whichmay have included, but were not limited to, observable transactions for identical or similar assets in the market and the distressed nature of the security. The appropriateness of fairvalues for these securities is monitored on an ongoing basis which may include results of back testing, manual price reviews and other control procedures. Significant increases(decreases) to any of these inputs would have resulted in a significantly higher (lower) fair value measurement.
Financial assets were transferred from Level 2 to Level 3 due to utilizing a single market quotation from a broker dealer. As a result, management concluded that the market input(s)were generally unobservable.
Financial assets were transferred from Level 3 to Level 2 as observable market inputs were utilized and management determined that there was sufficient, reliable and observablemarket data to value these assets as of period end.
PORTFOLIO OF INVESTMENTS (continued)December 31, 2021
The accompanying Notes to Financial Statements are an integral part of this statement.
34 Columbia Variable Portfolio – Balanced Fund | Annual Report 2021

Assets
Investments in securities, at valueUnaffiliated issuers (cost $1,143,943,139) $1,435,887,047Affiliated issuers (cost $89,976,027) 89,970,020
Cash 3,901Receivable for:
Capital shares sold 348,883Dividends 628,305Interest 1,568,032Foreign tax reclaims 36,689Variation margin for futures contracts 111,250
Prepaid expenses 15,095
Total assets 1,528,569,222
Liabilities
Payable for:Investments purchased 56,331Investments purchased on a delayed delivery basis 74,970,615Capital shares purchased 1,592,018Management services fees 26,777Distribution and/or service fees 5,056Service fees 74,247Compensation of board members 130,972Compensation of chief compliance officer 262Other expenses 47,554
Total liabilities 76,903,832
Net assets applicable to outstanding capital stock $1,451,665,390
Represented by
Trust capital $1,451,665,390
Total - representing net assets applicable to outstanding capital stock $1,451,665,390
Class 1
Net assets $11,736,434Shares outstanding 278,313Net asset value per share $42.17
Class 2
Net assets $33,190,774Shares outstanding 801,850Net asset value per share $41.39
Class 3
Net assets $1,406,738,182Shares outstanding 33,642,077Net asset value per share $41.81
STATEMENT OF ASSETS AND LIABILITIESDecember 31, 2021
The accompanying Notes to Financial Statements are an integral part of this statement.
Columbia Variable Portfolio – Balanced Fund | Annual Report 2021 35

Net investment income
Income:Dividends — unaffiliated issuers $11,587,586Dividends — affiliated issuers 57,466Interest 10,100,740Foreign taxes withheld (69,802)
Total income 21,675,990
Expenses:Management services fees 9,342,836Distribution and/or service fees
Class 2 23,886Class 3 1,711,112
Service fees 834,973Compensation of board members 54,350Custodian fees 47,474Printing and postage fees 45,333Audit fees 39,500Legal fees 22,573Interest on collateral 565Compensation of chief compliance officer 256Other 42,252
Total expenses 12,165,110
Net investment income 9,510,880
Realized and unrealized gain (loss) — net
Net realized gain (loss) on:Investments — unaffiliated issuers 175,714,848Investments — affiliated issuers (3,982)Foreign currency translations 841Futures contracts (3,442,544)
Net realized gain 172,269,163Net change in unrealized appreciation (depreciation) on:
Investments — unaffiliated issuers 6,482,250Investments — affiliated issuers (4,970)Foreign currency translations (342)Futures contracts 198,160
Net change in unrealized appreciation (depreciation) 6,675,098
Net realized and unrealized gain 178,944,261
Net increase in net assets resulting from operations $188,455,141
STATEMENT OF OPERATIONSYear Ended December 31, 2021
The accompanying Notes to Financial Statements are an integral part of this statement.
36 Columbia Variable Portfolio – Balanced Fund | Annual Report 2021

Year EndedDecember 31, 2021
Year EndedDecember 31, 2020
Operations
Net investment income $9,510,880 $12,917,730Net realized gain 172,269,163 85,675,381Net change in unrealized appreciation (depreciation) 6,675,098 92,757,924
Net increase in net assets resulting from operations 188,455,141 191,351,035
Decrease in net assets from capital stock activity (27,044,181) (39,462,226)
Total increase in net assets 161,410,960 151,888,809
Net assets at beginning of year 1,290,254,430 1,138,365,621
Net assets at end of year $1,451,665,390 $1,290,254,430
Year Ended Year EndedDecember 31, 2021 December 31, 2020
Shares Dollars ($) Shares Dollars ($)
Capital stock activity
Class 1
Subscriptions 190,375 7,621,888 76,403 2,557,037Redemptions (9,891) (401,576) (2,359) (73,720)
Net increase 180,484 7,220,312 74,044 2,483,317
Class 2Subscriptions 822,232 33,120,788 — —Redemptions (20,503) (833,012) — —
Net increase 801,729 32,287,776 — —
Class 3Subscriptions 587,750 22,773,586 724,475 24,019,990Redemptions (2,251,153) (89,325,855) (2,127,137) (65,965,533)
Net decrease (1,663,403) (66,552,269) (1,402,662) (41,945,543)
Total net decrease (681,190) (27,044,181) (1,328,618) (39,462,226)
STATEMENT OF CHANGES IN NET ASSETS
The accompanying Notes to Financial Statements are an integral part of this statement.
Columbia Variable Portfolio – Balanced Fund | Annual Report 2021 37

The following table is intended to help you understand the Fund’s financial performance. Certain information reflects financialresults for a single share of a class held for the periods shown. Per share net investment income (loss) amounts arecalculated based on average shares outstanding during the period. Total return assumes reinvestment of all dividends anddistributions, if any. Total return does not reflect any fees and expenses imposed under your Contract and/or Qualified Plan,as applicable; such fees and expenses would reduce the total returns for all periods shown. Total return and portfolioturnover are not annualized for periods of less than one year. The portfolio turnover rate is calculated without regard topurchase and sales transactions of short-term instruments and certain derivatives, if any. If such transactions were included,the Fund’s portfolio turnover rate may be higher.
Net asset value,beginning of
period
Netinvestment
income
Netrealized
andunrealizedgain (loss)
Total frominvestmentoperations
Class 1
Year Ended 12/31/2021 $36.71 0.33 5.13 5.46
Year Ended 12/31/2020 $31.17 0.40 5.14 5.54
Year Ended 12/31/2019 $25.35 0.48 5.34 5.82
Year Ended 12/31/2018 $26.90 0.42 (1.97) (1.55)
Year Ended 12/31/2017 $23.46 0.34 3.10 3.44
Class 2
Year Ended 12/31/2021 $36.11 0.24 5.04 5.28
Year Ended 12/31/2020 $30.74 0.33 5.04 5.37
Year Ended 12/31/2019 $25.06 0.41 5.27 5.68
Year Ended 12/31/2018 $26.66 0.34 (1.94) (1.60)
Year Ended 12/31/2017 $23.30 0.28 3.08 3.36
Class 3
Year Ended 12/31/2021 $36.44 0.27 5.10 5.37
Year Ended 12/31/2020 $30.99 0.36 5.09 5.45
Year Ended 12/31/2019 $25.24 0.45 5.30 5.75
Year Ended 12/31/2018 $26.82 0.38 (1.96) (1.58)
Year Ended 12/31/2017 $23.42 0.30 3.10 3.40
Notes to Financial Highlights
(a) In addition to the fees and expenses that the Fund bears directly, the Fund indirectly bears a pro rata share of the fees and expenses of any other funds in which it invests. Suchindirect expenses are not included in the Fund’s reported expense ratios.
(b) Total net expenses include the impact of certain fee waivers/expense reimbursements made by the Investment Manager and certain of its affiliates, if applicable.
(c) Ratios include interest on collateral expense which is less than 0.01%.
FINANCIAL HIGHLIGHTS
The accompanying Notes to Financial Statements are an integral part of this statement.
38 Columbia Variable Portfolio – Balanced Fund | Annual Report 2021

Netassetvalue,end ofperiod
Totalreturn
Total grossexpenseratio toaverage
net assets(a)
Total netexpenseratio toaverage
net assets(a),(b)
Net investmentincomeratio toaverage
net assetsPortfolioturnover
Netassets,end ofperiod(000’s)
Class 1
Year Ended 12/31/2021 $42.17 14.88% 0.75%(c) 0.75%(c) 0.82% 118% $11,736
Year Ended 12/31/2020 $36.71 17.77% 0.78% 0.77% 1.21% 145% $3,591
Year Ended 12/31/2019 $31.17 22.96% 0.79% 0.76% 1.63% 126% $741
Year Ended 12/31/2018 $25.35 (5.76%) 0.78% 0.75% 1.53% 81% $3
Year Ended 12/31/2017 $26.90 14.66% 0.77% 0.74% 1.36% 63% $3
Class 2
Year Ended 12/31/2021 $41.39 14.62% 1.00%(c) 1.00%(c) 0.60% 118% $33,191
Year Ended 12/31/2020 $36.11 17.47% 1.00% 1.00% 1.04% 145% $4
Year Ended 12/31/2019 $30.74 22.66% 1.03% 1.01% 1.43% 126% $4
Year Ended 12/31/2018 $25.06 (6.00%) 1.03% 1.00% 1.27% 81% $3
Year Ended 12/31/2017 $26.66 14.42% 1.02% 0.99% 1.11% 63% $3
Class 3
Year Ended 12/31/2021 $41.81 14.74% 0.88%(c) 0.88%(c) 0.69% 118% $1,406,738
Year Ended 12/31/2020 $36.44 17.58% 0.90% 0.89% 1.13% 145% $1,286,659
Year Ended 12/31/2019 $30.99 22.78% 0.91% 0.88% 1.57% 126% $1,137,620
Year Ended 12/31/2018 $25.24 (5.89%) 0.91% 0.87% 1.40% 81% $1,004,017
Year Ended 12/31/2017 $26.82 14.52% 0.91% 0.89% 1.20% 63% $1,165,032
FINANCIAL HIGHLIGHTS (continued)
The accompanying Notes to Financial Statements are an integral part of this statement.
Columbia Variable Portfolio – Balanced Fund | Annual Report 2021 39

Note 1. OrganizationColumbia Variable Portfolio – Balanced Fund (the Fund), a series of Columbia Funds Variable Series Trust II (the Trust), is adiversified fund. The Trust is registered under the Investment Company Act of 1940, as amended (the 1940 Act), as anopen-end management investment company organized as a Massachusetts business trust.
Fund shares
The Trust may issue an unlimited number of shares (without par value). The Fund offers Class 1, Class 2 and Class 3 sharesto separate accounts funding variable annuity contracts and variable life insurance policies (collectively, Contracts) issued byaffiliated and unaffiliated life insurance companies (Participating Insurance Companies) as well as qualified pension andretirement plans (Qualified Plans) and other qualified institutional investors (Qualified Investors) authorized by ColumbiaManagement Investment Distributors, Inc. (the Distributor). You may not buy (nor will you own) shares of the Fund directly.You may invest by participating in a Qualified Plan or by buying a Contract and making allocations to the Fund. Although allshare classes generally have identical voting, dividend and liquidation rights, each share class votes separately whenrequired by the Trust’s organizational documents or by law. Different share classes pay different net investment incomedistribution amounts to the extent the expenses of such share classes differ, and distributions in liquidation will beproportional to the net asset value of each share class. Each share class has its own cost structure and other features.
Note 2. Summary of significant accounting policies
Basis of preparation
The Fund is an investment company that applies the accounting and reporting guidance in the Financial AccountingStandards Board (FASB) Accounting Standards Codification Topic 946, Financial Services - Investment Companies (ASC 946).The financial statements are prepared in accordance with U.S. generally accepted accounting principles (GAAP), whichrequires management to make certain estimates and assumptions that affect the reported amounts of assets and liabilities,the disclosure of contingent assets and liabilities at the date of the financial statements and the reported amounts of incomeand expenses during the reporting period. Actual results could differ from those estimates.
The following is a summary of significant accounting policies followed by the Fund in the preparation of its financialstatements.
Security valuation
Equity securities listed on an exchange are valued at the closing price or last trade price on their primary exchange at theclose of business of the New York Stock Exchange. Securities with a closing price not readily available or not listed on anyexchange are valued at the mean between the closing bid and ask prices. Listed preferred stocks convertible into commonstocks are valued using an evaluated price from a pricing service.
Debt securities generally are valued by pricing services approved by the Board of Trustees based upon market transactionsfor normal, institutional-size trading units of similar securities. The services may use various pricing techniques that take intoaccount, as applicable, factors such as yield, quality, coupon rate, maturity, type of issue, trading characteristics and otherdata, as well as approved independent broker-dealer quotes. Debt securities for which quotations are not readily available ornot believed to be reflective of market value may also be valued based upon a bid quote from an approved independentbroker-dealer. Debt securities maturing in 60 days or less are valued primarily at amortized market value, unless this methodresults in a valuation that management believes does not approximate fair value.
Asset- and mortgage-backed securities are generally valued by pricing services, which utilize pricing models that incorporatethe securities’ cash flow and loan performance data. These models also take into account available market data, includingtrades, market quotations, and benchmark yield curves for identical or similar securities. Factors used to identify similarsecurities may include, but are not limited to, issuer, collateral type, vintage, prepayment speeds, collateral performance,credit ratings, credit enhancement and expected life. Asset-backed securities for which quotations are readily available mayalso be valued based upon an over-the-counter or exchange bid quote from an approved independent broker-dealer. Debtsecurities maturing in 60 days or less are valued primarily at amortized market value, unless this method results in avaluation that management believes does not approximate fair value.
NOTES TO FINANCIAL STATEMENTSDecember 31, 2021
40 Columbia Variable Portfolio – Balanced Fund | Annual Report 2021

Senior loan securities for which reliable market quotations are readily available are generally valued by pricing services at theaverage of the bids received.
Foreign equity securities are valued based on the closing price or last trade price on their primary exchange at the close ofbusiness of the New York Stock Exchange. If any foreign equity security closing prices are not readily available, the securitiesare valued at the mean of the latest quoted bid and ask prices on such exchanges or markets. Foreign currency exchangerates are determined at the scheduled closing time of the New York Stock Exchange. Many securities markets andexchanges outside the U.S. close prior to the close of the New York Stock Exchange; therefore, the closing prices forsecurities in such markets or on such exchanges may not fully reflect events that occur after such close but before the closeof the New York Stock Exchange. In those situations, foreign securities will be fair valued pursuant to a policy adopted by theBoard of Trustees. Under the policy, the Fund may utilize a third-party pricing service to determine these fair values. Thethird-party pricing service takes into account multiple factors, including, but not limited to, movements in the U.S. securitiesmarkets, certain depositary receipts, futures contracts and foreign exchange rates that have occurred subsequent to theclose of the foreign exchange or market, to determine a good faith estimate that reasonably reflects the current marketconditions as of the close of the New York Stock Exchange. The fair value of a security is likely to be different from the quotedor published price, if available.
Investments in open-end investment companies (other than exchange-traded funds (ETFs)), are valued at the latest net assetvalue reported by those companies as of the valuation time.
Futures and options on futures contracts are valued based upon the settlement price at the close of regular trading on theirprincipal exchanges or, in the absence of a settlement price, at the mean of the latest quoted bid and ask prices.
Investments for which market quotations are not readily available, or that have quotations which management believes arenot reflective of market value or reliable, are valued at fair value as determined in good faith under procedures approved byand under the general supervision of the Board of Trustees. If a security or class of securities (such as foreign securities) isvalued at fair value, such value is likely to be different from the quoted or published price for the security, if available.
The determination of fair value often requires significant judgment. To determine fair value, management may useassumptions including but not limited to future cash flows and estimated risk premiums. Multiple inputs from varioussources may be used to determine fair value.
GAAP requires disclosure regarding the inputs and valuation techniques used to measure fair value and any changes invaluation inputs or techniques. In addition, investments shall be disclosed by major category. This information is disclosedfollowing the Fund’s Portfolio of Investments.
Foreign currency transactions and translations
The values of all assets and liabilities denominated in foreign currencies are generally translated into U.S. dollars atexchange rates determined at the close of regular trading on the New York Stock Exchange. Net realized and unrealized gains(losses) on foreign currency transactions and translations include gains (losses) arising from the fluctuation in exchangerates between trade and settlement dates on securities transactions, gains (losses) arising from the disposition of foreigncurrency and currency gains (losses) between the accrual and payment dates on dividends, interest income and foreignwithholding taxes.
For financial statement purposes, the Fund does not distinguish that portion of gains (losses) on investments which is due tochanges in foreign exchange rates from that which is due to changes in market prices of the investments. Such fluctuationsare included with the net realized and unrealized gains (losses) on investments in the Statement of Operations.
Derivative instruments
The Fund invests in certain derivative instruments, as detailed below, in seeking to meet its investment objectives.Derivatives are instruments whose values depend on, or are derived from, in whole or in part, the value of one or moresecurities, currencies, commodities, indices, or other assets or instruments. Derivatives may be used to increase investmentflexibility (including to maintain cash reserves while maintaining desired exposure to certain assets), for risk management(hedging) purposes, to facilitate trading, to reduce transaction costs and to pursue higher investment returns. The Fund may
NOTES TO FINANCIAL STATEMENTS (continued)December 31, 2021
Columbia Variable Portfolio – Balanced Fund | Annual Report 2021 41

also use derivative instruments to mitigate certain investment risks, such as foreign currency exchange rate risk, interest raterisk and credit risk. Derivatives may involve various risks, including the potential inability of the counterparty to fulfill itsobligations under the terms of the contract, the potential for an illiquid secondary market (making it difficult for the Fund tosell or terminate, including at favorable prices) and the potential for market movements which may expose the Fund to gainsor losses in excess of the amount shown in the Statement of Assets and Liabilities. The notional amounts of derivativeinstruments, if applicable, are not recorded in the financial statements.
A derivative instrument may suffer a marked-to-market loss if the value of the contract decreases due to an unfavorablechange in the market rates or values of the underlying instrument. Losses can also occur if the counterparty does notperform its obligations under the contract. The Fund’s risk of loss from counterparty credit risk on over-the-counter derivativesis generally limited to the aggregate unrealized gain netted against any collateral held by the Fund and the amount of anyvariation margin held by the counterparty, plus any replacement costs or related amounts. With exchange-traded or centrallycleared derivatives, there is reduced counterparty credit risk to the Fund since the clearinghouse or central counterparty(CCP) provides some protection in the case of clearing member default. The clearinghouse or CCP stands between the buyerand the seller of the contract; therefore, additional counterparty credit risk is failure of the clearinghouse or CCP. However,credit risk still exists in exchange-traded or centrally cleared derivatives with respect to initial and variation margin that is heldin a broker’s customer account. While clearing brokers are required to segregate customer margin from their own assets, inthe event that a clearing broker becomes insolvent or goes into bankruptcy and at that time there is a shortfall in theaggregate amount of margin held by the clearing broker for all its clients and such shortfall is remedied by the CCP orotherwise, U.S. bankruptcy laws will typically allocate that shortfall on a pro-rata basis across all the clearing broker’scustomers (including the Fund), potentially resulting in losses to the Fund.
In order to better define its contractual rights and to secure rights that will help the Fund mitigate its counterparty risk, theFund may enter into an International Swaps and Derivatives Association, Inc. Master Agreement (ISDA Master Agreement) orsimilar agreement with its derivatives counterparties. An ISDA Master Agreement is an agreement between the Fund and acounterparty that governs over-the-counter derivatives and foreign exchange forward contracts and contains, among otherthings, collateral posting terms and netting provisions in the event of a default and/or termination event. Under an ISDAMaster Agreement, the Fund may, under certain circumstances, offset with the counterparty certain derivative instruments’payables and/or receivables with collateral held and/or posted and create one single net payment. The provisions of theISDA Master Agreement typically permit a single net payment in the event of default (close-out netting), including thebankruptcy or insolvency of the counterparty. Note, however, that bankruptcy or insolvency laws of a particular jurisdictionmay impose restrictions on or prohibitions against the right of offset or netting in bankruptcy, insolvency or other events.
Collateral (margin) requirements differ by type of derivative. Margin requirements are established by the clearinghouse or CCPfor exchange-traded and centrally cleared derivatives. Brokers can ask for margin in excess of the minimum in certaincircumstances. Collateral terms for most over-the-counter derivatives are subject to regulatory requirements to exchangevariation margin with trading counterparties and may have contract specific margin terms as well. For over-the-counterderivatives traded under an ISDA Master Agreement, the collateral requirements are typically calculated by netting themarked-to-market amount for each transaction under such agreement and comparing that amount to the value of anyvariation margin currently pledged by the Fund and/or the counterparty. Generally, the amount of collateral due from or to aparty has to exceed a minimum transfer amount threshold (e.g., $250,000) before a transfer has to be made. To the extentamounts due to the Fund from its counterparties are not fully collateralized, contractually or otherwise, the Fund bears therisk of loss from counterparty nonperformance. The Fund may also pay interest expense on cash collateral received from thebroker. Any interest expense paid by the Fund is shown on the Statement of Operations. The Fund attempts to mitigatecounterparty risk by only entering into agreements with counterparties that it believes have the financial resources to honortheir obligations and by monitoring the financial stability of those counterparties.
Certain ISDA Master Agreements allow counterparties of over-the-counter derivatives transactions to terminate derivativescontracts prior to maturity in the event the Fund’s net asset value declines by a stated percentage over a specified timeperiod or if the Fund fails to meet certain terms of the ISDA Master Agreement, which would cause the Fund to acceleratepayment of any net liability owed to the counterparty. The Fund also has termination rights if the counterparty fails to meetcertain terms of the ISDA Master Agreement. In determining whether to exercise such termination rights, the Fund wouldconsider, in addition to counterparty credit risk, whether termination would result in a net liability owed from the counterparty.
NOTES TO FINANCIAL STATEMENTS (continued)December 31, 2021
42 Columbia Variable Portfolio – Balanced Fund | Annual Report 2021

For financial reporting purposes, the Fund does not offset derivative assets and derivative liabilities that are subject to nettingarrangements in the Statement of Assets and Liabilities.
Futures contracts
Futures contracts are exchange-traded and represent commitments for the future purchase or sale of an asset at a specifiedprice on a specified date. The Fund bought and sold futures contracts to manage the duration and yield curve exposure of theFund versus the benchmark and to manage exposure to movements in interest rates. These instruments may be used forother purposes in future periods. Upon entering into futures contracts, the Fund bears risks that it may not achieve theanticipated benefits of the futures contracts and may realize a loss. Additional risks include counterparty credit risk, thepossibility of an illiquid market, and that a change in the value of the contract or option may not correlate with changes in thevalue of the underlying asset.
Upon entering into a futures contract, the Fund deposits cash or securities with the broker, known as a futures commissionmerchant (FCM), in an amount sufficient to meet the initial margin requirement. The initial margin deposit must be maintainedat an established level over the life of the contract. Cash deposited as initial margin is recorded in the Statement of Assetsand Liabilities as margin deposits. Securities deposited as initial margin are designated in the Portfolio of Investments.Subsequent payments (variation margin) are made or received by the Fund each day. The variation margin payments areequal to the daily change in the contract value and are recorded as variation margin receivable or payable and are offset inunrealized gains or losses. The Fund generally expects to earn interest income on its margin deposits. The Fund recognizes arealized gain or loss when the contract is closed or expires. Futures contracts involve, to varying degrees, risk of loss inexcess of the variation margin disclosed in the Statement of Assets and Liabilities.
Effects of derivative transactions in the financial statements
The following tables are intended to provide additional information about the effect of derivatives on the financial statementsof the Fund, including: the fair value of derivatives by risk category and the location of those fair values in the Statement ofAssets and Liabilities; and the impact of derivative transactions over the period in the Statement of Operations, includingrealized and unrealized gains (losses). The derivative instrument schedules following the Portfolio of Investments presentadditional information regarding derivative instruments outstanding at the end of the period, if any.
The following table is a summary of the fair value of derivative instruments (not considered to be hedging instruments foraccounting disclosure purposes) at December 31, 2021:
Asset derivatives
Risk exposurecategory
Statementof assets and liabilitieslocation Fair value ($)
Interest rate risk Component of trust capital — unrealized appreciation on futures contracts 336,236*
Liability derivatives
Risk exposurecategory
Statementof assets and liabilitieslocation Fair value ($)
Interest rate risk Component of trust capital - unrealized depreciation on futures contracts 75,710*
* Includes cumulative appreciation (depreciation) as reported in the tables following the Portfolio of Investments. Only the current day’s variation margin is reported in receivables orpayables in the Statement of Assets and Liabilities.
NOTES TO FINANCIAL STATEMENTS (continued)December 31, 2021
Columbia Variable Portfolio – Balanced Fund | Annual Report 2021 43

The following table indicates the effect of derivative instruments (not considered to be hedging instruments for accountingdisclosure purposes) in the Statement of Operations for the year ended December 31, 2021:
Amount of realized gain (loss) on derivatives recognized in income
Risk exposure category
Futurescontracts
($)
Interest rate risk (3,442,544)
Change in unrealized appreciation (depreciation) on derivatives recognized in income
Risk exposure category
Futurescontracts
($)
Interest rate risk 198,160
The following table is a summary of the average outstanding volume by derivative instrument for the year endedDecember 31, 2021:
Derivative instrumentAverage notional
amounts ($)*
Futures contracts — long 136,428,618
* Based on the ending quarterly outstanding amounts for the year ended December 31, 2021.
Investments in senior loans
The Fund may invest in senior loan assignments. When the Fund purchases an assignment of a senior loan, the Fundtypically has direct rights against the borrower; provided, however, that the Fund’s rights may be more limited than the lenderfrom which it acquired the assignment and the Fund may be able to enforce its rights only through an administrative agent.Although certain senior loan assignments are secured by collateral, the Fund could experience delays or limitations inrealizing such collateral or have its interest subordinated to other indebtedness of the obligor. In the event that theadministrator or collateral agent of a loan becomes insolvent or enters into receivership or bankruptcy, the Fund may incurcosts and delays in realizing payment or may suffer a loss of principal and/or interest. The risk of loss is greater forunsecured or subordinated loans. In addition, senior loan assignments are vulnerable to market, economic or otherconditions or events that may reduce the demand for senior loan assignments and certain senior loan assignments whichwere liquid when purchased, may become illiquid.
The Fund may enter into senior loan assignments where all or a portion of the loan may be unfunded. The Fund is obligatedto fund these commitments at the borrower’s discretion. These commitments, if any, are generally traded and priced in thesame manner as other senior loan securities and are disclosed as unfunded senior loan commitments in the Fund’s Portfolioof Investments with a corresponding payable for investments purchased. The Fund designates cash or liquid securities tocover these commitments.
Asset- and mortgage-backed securities
The Fund may invest in asset-backed and mortgage-backed securities. The maturity dates shown represent the originalmaturity of the underlying obligation. Actual maturity may vary based upon prepayment activity on these obligations. All, or aportion, of the obligation may be prepaid at any time because the underlying asset may be prepaid. As a result, decreasingmarket interest rates could result in an increased level of prepayment. An increased prepayment rate will have the effect ofshortening the maturity of the security. Unless otherwise noted, the coupon rates presented are fixed rates.
Delayed delivery securities
The Fund may trade securities on other than normal settlement terms, including securities purchased or sold on a“when-issued” or "forward commitment" basis. This may increase risk to the Fund since the other party to the transactionmay fail to deliver, which could cause the Fund to subsequently invest at less advantageous prices. The Fund designatescash or liquid securities in an amount equal to the delayed delivery commitment.
NOTES TO FINANCIAL STATEMENTS (continued)December 31, 2021
44 Columbia Variable Portfolio – Balanced Fund | Annual Report 2021

To be announced securities
The Fund may trade securities on a To Be Announced (TBA) basis. As with other delayed-delivery transactions, a seller agreesto issue a TBA security at a future date. However, the seller does not specify the particular securities to be delivered. Instead,the Fund agrees to accept any security that meets specified terms.
In some cases, Master Securities Forward Transaction Agreements (MSFTAs) may be used to govern transactions of certainforward-settling agency mortgage-backed securities, such as delayed-delivery and TBAs, between the Fund and counterparty.The MSFTA maintains provisions for, among other things, initiation and confirmation, payment and transfer, events of default,termination, and maintenance of collateral relating to such transactions.
Mortgage dollar roll transactions
The Fund may enter into mortgage “dollar rolls” in which the Fund sells securities for delivery in the current month andsimultaneously contracts with the same counterparty to repurchase similar but not identical securities (same type, couponand maturity) on a specified future date. During the roll period, the Fund loses the right to receive principal and interest paidon the securities sold. However, the Fund may benefit because it receives negotiated amounts in the form of reductions ofthe purchase price for the future purchase plus the interest earned on the cash proceeds of the securities sold until thesettlement date of the forward purchase. The Fund records the incremental difference between the forward purchase andsale of each forward roll as a realized gain or loss. Unless any realized gains exceed the income, capital appreciation, andgain or loss due to mortgage prepayments that would have been realized on the securities sold as part of the mortgage dollarroll, the use of this technique may diminish the investment performance of the Fund compared to what the performancewould have been without the use of mortgage dollar rolls. All cash proceeds will be invested in instruments that arepermissible investments for the Fund. The Fund identifies cash or liquid securities in an amount equal to the forwardpurchase price.
For financial reporting and tax purposes, the Fund treats “to be announced” mortgage dollar rolls as two separatetransactions, one involving the purchase of a security and a separate transaction involving a sale. These transactions mayincrease the Fund’s portfolio turnover rate. The Fund does not currently enter into mortgage dollar rolls that are accounted foras financing transactions.
Mortgage dollar rolls involve the risk that the market value of the securities the Fund is obligated to repurchase may declinebelow the repurchase price, or that the counterparty may default on its obligations.
Security transactions
Security transactions are accounted for on the trade date. Cost is determined and gains (losses) are based upon the specificidentification method for both financial statement and federal income tax purposes.
The trade date for senior loans purchased in the primary market is the date on which the loan is allocated. The trade date forsenior loans purchased in the secondary market is the date on which the transaction is entered into.
Income recognition
Interest income is recorded on an accrual basis. Market premiums and discounts, including original issue discounts, areamortized and accreted, respectively, over the expected life of the security on all debt securities, unless otherwise noted. TheFund classifies gains and losses realized on prepayments received on mortgage-backed securities as adjustments to interestincome. For convertible securities, premiums attributable to the conversion feature are not amortized.
The Fund may place a debt security on non-accrual status and reduce related interest income when it becomes probable thatthe interest will not be collected and the amount of uncollectible interest can be reasonably estimated. A defaulted debtsecurity is removed from non-accrual status when the issuer resumes interest payments or when collectability of interest isreasonably assured.
Corporate actions and dividend income are generally recorded net of any non-reclaimable tax withholdings, on the ex-dividenddate or upon receipt of an ex-dividend notification in the case of certain foreign securities.
NOTES TO FINANCIAL STATEMENTS (continued)December 31, 2021
Columbia Variable Portfolio – Balanced Fund | Annual Report 2021 45

The Fund may receive distributions from holdings in equity securities, business development companies (BDCs),exchange-traded funds (ETFs), limited partnerships (LPs), other regulated investment companies (RICs), and real estateinvestment trusts (REITs), which report information as to the tax character of their distributions annually. These distributionsare allocated to dividend income, capital gain and return of capital based on actual information reported. Return of capital isrecorded as a reduction of the cost basis of securities held. If the Fund no longer owns the applicable securities, return ofcapital is recorded as a realized gain. With respect to REITs, to the extent actual information has not yet been reported,estimates for return of capital are made by Columbia Management Investment Advisers, LLC (the Investment Manager), awholly-owned subsidiary of Ameriprise Financial, Inc. (Ameriprise Financial). The Investment Manager’s estimates aresubsequently adjusted when the actual character of the distributions is disclosed by the REITs, which could result in aproportionate change in return of capital to shareholders.
Awards from class action litigation are recorded as a reduction of cost basis if the Fund still owns the applicable securities onthe payment date. If the Fund no longer owns the applicable securities on the payment date, the proceeds are recorded asrealized gains.
The value of additional securities received as an income payment through a payment in kind, if any, is recorded as interestincome and increases the cost basis of such securities.
The Fund may receive other income from senior loans, including amendment fees, consent fees and commitment fees.These fees are recorded as income when received by the Fund. These amounts are included in Interest Income in theStatement of Operations.
Expenses
General expenses of the Trust are allocated to the Fund and other funds of the Trust based upon relative net assets or otherexpense allocation methodologies determined by the nature of the expense. Expenses directly attributable to the Fund arecharged to the Fund. Expenses directly attributable to a specific class of shares are charged to that share class.
Determination of class net asset value
All income, expenses (other than class-specific expenses, which are charged to that share class, as shown in the Statementof Operations) and realized and unrealized gains (losses) are allocated to each class of the Fund on a daily basis, based onthe relative net assets of each class, for purposes of determining the net asset value of each class.
Federal income tax status
The Fund is treated as a partnership for federal income tax purposes, and the Fund does not expect to make regulardistributions. The Fund will not be subject to federal income tax, and therefore, there is no provision for federal income taxes.The partners of the Fund are subject to tax on their distributive share of the Fund’s income and loss. The components of theFund’s net assets are reported at the partner-level for federal income tax purposes, and therefore, are not presented in theStatement of Assets and Liabilities.
Management of the Fund has concluded that there are no significant uncertain tax positions in the Fund that would requirerecognition in the financial statements. However, management’s conclusion may be subject to review and adjustment at alater date based on factors including, but not limited to, new tax laws, regulations, and administrative interpretations(including relevant court decisions). Generally, the Fund’s federal tax returns for the prior three fiscal years remain subject toexamination by the Internal Revenue Service.
Foreign taxes
The Fund may be subject to foreign taxes on income, gains on investments or currency repatriation, a portion of which maybe recoverable. The Fund will accrue such taxes and recoveries, as applicable, based upon its current interpretation of taxrules and regulations that exist in the markets in which it invests.
Realized gains in certain countries may be subject to foreign taxes at the Fund level, based on statutory rates. The Fundaccrues for such foreign taxes on realized and unrealized gains at the appropriate rate for each jurisdiction, as applicable.The amount, if any, is disclosed as a liability on the Statement of Assets and Liabilities.
NOTES TO FINANCIAL STATEMENTS (continued)December 31, 2021
46 Columbia Variable Portfolio – Balanced Fund | Annual Report 2021

Guarantees and indemnifications
Under the Trust’s organizational documents and, in some cases, by contract, its officers and trustees are indemnified againstcertain liabilities arising out of the performance of their duties to the Trust or its funds. In addition, certain of the Fund’scontracts with its service providers contain general indemnification clauses. The Fund’s maximum exposure under thesearrangements is unknown since the amount of any future claims that may be made against the Fund cannot be determined,and the Fund has no historical basis for predicting the likelihood of any such claims.
Note 3. Fees and other transactions with affiliates
Management services fees
The Fund has entered into a Management Agreement with Columbia Management Investment Advisers, LLC (the InvestmentManager), a wholly-owned subsidiary of Ameriprise Financial, Inc. (Ameriprise Financial). Under the Management Agreement,the Investment Manager provides the Fund with investment research and advice, as well as administrative and accountingservices. The management services fee is an annual fee that is equal to a percentage of the Fund’s daily net assets thatdeclines from 0.72% to 0.52% as the Fund’s net assets increase. The effective management services fee rate for the yearended December 31, 2021 was 0.67% of the Fund’s average daily net assets.
Compensation of board members
Members of the Board of Trustees who are not officers or employees of the Investment Manager or Ameriprise Financial arecompensated for their services to the Fund as disclosed in the Statement of Operations. Under a Deferred CompensationPlan (the Deferred Plan), these members of the Board of Trustees may elect to defer payment of up to 100% of theircompensation. Deferred amounts are treated as though equivalent dollar amounts had been invested in shares of certainfunds managed by the Investment Manager. The Fund’s liability for these amounts is adjusted for market value changes andremains in the Fund until distributed in accordance with the Deferred Plan. All amounts payable under the Deferred Planconstitute a general unsecured obligation of the Fund. The expense for the Deferred Plan, which includes Trustees’ feesdeferred during the current period as well as any gains or losses on the Trustees’ deferred compensation balances as aresult of market fluctuations, is included in "Compensation of board members" on the Statement of Operations.
Compensation of Chief Compliance Officer
The Board of Trustees has appointed a Chief Compliance Officer for the Fund in accordance with federal securitiesregulations. As disclosed in the Statement of Operations, a portion of the Chief Compliance Officer’s total compensation isallocated to the Fund, along with other allocations to affiliated registered investment companies managed by the InvestmentManager and its affiliates, based on relative net assets.
Service fees
The Fund has entered into a Shareholder Services Agreement with Columbia Management Investment Services Corp. (theTransfer Agent), an affiliate of the Investment Manager and a wholly-owned subsidiary of Ameriprise Financial. Under thisagreement, the Fund pays a service fee equal to the payments made by the Transfer Agent to Participating InsuranceCompanies and other financial intermediaries (together, Participating Organizations) for services each such ParticipatingOrganization provides to its clients, customers and participants that are invested directly or indirectly in the Fund, up to a capapproved by the Board of Trustees from time to time. The effective service fee rate for the year ended December 31, 2021,was 0.06% of the Fund’s average daily net assets.
The Transfer Agent may retain as compensation for its services revenues from fees for wire, telephone and redemptionorders, account transcripts due the Transfer Agent from Fund shareholders and interest (net of bank charges) earned withrespect to balances in accounts the Transfer Agent maintains in connection with its services to the Fund.
NOTES TO FINANCIAL STATEMENTS (continued)December 31, 2021
Columbia Variable Portfolio – Balanced Fund | Annual Report 2021 47

Distribution and/or service fees
The Fund has an agreement with the Distributor, an affiliate of the Investment Manager and a wholly-owned subsidiary ofAmeriprise Financial, for distribution services. Under a Plan and Agreement of Distribution, the Fund pays a fee at an annualrate of up to 0.25% of the Fund’s average daily net assets attributable to Class 2 shares and an annual rate of up to 0.125%of the Fund’s average daily net assets attributable to Class 3 shares. The Fund pays no distribution and service fees forClass 1 shares.
Expenses waived/reimbursed by the Investment Manager and its affiliates
The Investment Manager and certain of its affiliates have contractually agreed to waive fees and/or reimburse expenses(excluding certain fees and expenses described below) for the period(s) disclosed below, unless sooner terminated at thesole discretion of the Board of Trustees, so that the Fund’s net operating expenses, after giving effect to fees waived/expenses reimbursed and any balance credits and/or overdraft charges from the Fund’s custodian, do not exceed thefollowing annual rate(s) as a percentage of the classes’ average daily net assets:
May 1, 2021through
April 30, 2022Prior to
May 1, 2021
Class 1 0.76% 0.77%
Class 2 1.01 1.02
Class 3 0.885 0.895
Under the agreement governing these fee waivers and/or expense reimbursement arrangements, the following fees andexpenses are excluded from the waiver/reimbursement commitment, and therefore will be paid by the Fund, ifapplicable: taxes (including foreign transaction taxes), expenses associated with investments in affiliated and non-affiliatedpooled investment vehicles (including mutual funds and exchange-traded funds), transaction costs and brokeragecommissions, costs related to any securities lending program, dividend expenses associated with securities sold short,inverse floater program fees and expenses, transaction charges and interest on borrowed money, interest, costs associatedwith certain shareholder meetings, infrequent and/or unusual expenses and any other expenses the exclusion of which isspecifically approved by the Board of Trustees. This agreement may be modified or amended only with approval from theInvestment Manager, certain of its affiliates and the Fund. Any fees waived and/or expenses reimbursed under the expensereimbursement arrangements described above are not recoverable by the Investment Manager or its affiliates in futureperiods.
Note 4. Portfolio informationThe cost of purchases and proceeds from sales of securities, excluding short-term investments and derivatives, if any,aggregated to $1,619,483,511 and $1,666,388,722, respectively, for the year ended December 31, 2021, of which$955,839,331 and $980,351,550, respectively, were U.S. government securities. The amount of purchase and sale activityimpacts the portfolio turnover rate reported in the Financial Highlights.
Note 5. Affiliated money market fundThe Fund invests in Columbia Short-Term Cash Fund, an affiliated money market fund established for the exclusive use by theFund and other affiliated funds (the Affiliated MMF). The income earned by the Fund from such investments is included asDividends - affiliated issuers in the Statement of Operations. As an investing fund, the Fund indirectly bears its proportionateshare of the expenses of the Affiliated MMF. The Affiliated MMF prices its shares with a floating net asset value. In addition,the Board of Trustees of the Affiliated MMF may impose a fee on redemptions (sometimes referred to as a liquidity fee) ortemporarily suspend redemptions (sometimes referred to as imposing a redemption gate) in the event its liquidity falls belowregulatory limits.
NOTES TO FINANCIAL STATEMENTS (continued)December 31, 2021
48 Columbia Variable Portfolio – Balanced Fund | Annual Report 2021

Note 6. Interfund lendingPursuant to an exemptive order granted by the Securities and Exchange Commission, the Fund participates in a program (theInterfund Program) allowing each participating Columbia Fund (each, a Participating Fund) to lend money directly to and,except for closed-end funds and money market funds, borrow money directly from other Participating Funds for temporarypurposes. The amounts eligible for borrowing and lending under the Interfund Program are subject to certain restrictions.
Interfund loans are subject to the risk that the borrowing fund could be unable to repay the loan when due, and a delay inrepayment to the lending fund could result in lost opportunities and/or additional lending costs. The exemptive order issubject to conditions intended to mitigate conflicts of interest arising from the Investment Manager’s relationship with eachParticipating Fund.
The Fund did not borrow or lend money under the Interfund Program during the year ended December 31, 2021.
Note 7. Line of creditThe Fund has access to a revolving credit facility with a syndicate of banks led by JPMorgan Chase Bank, N.A., Citibank, N.A.and Wells Fargo Bank, N.A. whereby the Fund may borrow for the temporary funding of shareholder redemptions or for othertemporary or emergency purposes. Pursuant to an October 28, 2021 amendment and restatement, the credit facility, which isa collective agreement between the Fund and certain other funds managed by the Investment Manager or an affiliatedinvestment manager, severally and not jointly, permits collective borrowings up to $950 million. Interest is currently chargedto each participating fund based on its borrowings at a rate equal to the higher of (i) the federal funds effective rate, (ii) thesecured overnight financing rate plus 0.11448% and (iii) the overnight bank funding rate, plus in each case, 1.00%. Eachborrowing under the credit facility matures no later than 60 days after the date of borrowing. The Fund also pays acommitment fee equal to its pro rata share of the unused amount of the credit facility at a rate of 0.15% per annum. Thecommitment fee is included in other expenses in the Statement of Operations. This agreement expires annually in Octoberunless extended or renewed. Prior to the October 28, 2021 amendment and restatement, the Fund had access to a revolvingcredit facility with a syndicate of banks led by JPMorgan Chase Bank, N.A., Citibank, N.A. and Wells Fargo Bank, N.A. whichpermitted collective borrowings up to $950 million. Interest was charged to each participating fund based on its borrowings ata rate equal to the higher of (i) the federal funds effective rate, (ii) the one-month London Interbank Offered Rate (LIBOR) rateand (iii) the overnight bank funding rate, plus in each case, 1.25%.
The Fund had no borrowings during the year ended December 31, 2021.
Note 8. Significant risks
Credit risk
Credit risk is the risk that the value of debt instruments in the Fund’s portfolio may decline because the issuer defaults orotherwise becomes unable or unwilling, or is perceived to be unable or unwilling, to honor its financial obligations, such asmaking payments to the Fund when due. Credit rating agencies assign credit ratings to certain debt instruments to indicatetheir credit risk. Lower-rated or unrated debt instruments held by the Fund may present increased credit risk as compared tohigher-rated debt instruments.
Information technology sector risk
The Fund is more susceptible to the particular risks that may affect companies in the information technology sector than if itwere invested in a wider variety of companies in unrelated sectors. Companies in the information technology sector aresubject to certain risks, including the risk that new services, equipment or technologies will not be accepted by consumersand businesses or will become rapidly obsolete. Performance of such companies may be affected by factors includingobtaining and protecting patents (or the failure to do so) and significant competitive pressures, including aggressive pricing oftheir products or services, new market entrants, competition for market share and short product cycles due to an acceleratedrate of technological developments. Such competitive pressures may lead to limited earnings and/or falling profit margins. Asa result, the value of their securities may fall or fail to rise. In addition, many information technology sector companies havelimited operating histories and prices of these companies’ securities historically have been more volatile than other
NOTES TO FINANCIAL STATEMENTS (continued)December 31, 2021
Columbia Variable Portfolio – Balanced Fund | Annual Report 2021 49

securities, especially over the short term. Some companies in the information technology sector are facing increasedgovernment and regulatory scrutiny and may be subject to adverse government or regulatory action, which could negativelyimpact the value of their securities.
Interest rate risk
Interest rate risk is the risk of losses attributable to changes in interest rates. In general, if prevailing interest rates rise, thevalues of debt instruments tend to fall, and if interest rates fall, the values of debt instruments tend to rise. Actions bygovernments and central banking authorities can result in increases or decreases in interest rates. Higher periods of inflationcould lead such authorities to raise interest rates. Increasing interest rates may negatively affect the value of debt securitiesheld by the Fund, resulting in a negative impact on the Fund’s performance and net asset value per share. In general, thelonger the maturity or duration of a debt security, the greater its sensitivity to changes in interest rates. The Fund is subjectto the risk that the income generated by its investments may not keep pace with inflation.
Liquidity risk
Liquidity risk is the risk associated with a lack of marketability of investments which may make it difficult to sell theinvestment at a desirable time or price. Changing regulatory, market or other conditions or environments (for example, theinterest rate or credit environments) may adversely affect the liquidity of the Fund’s investments. The Fund may have toaccept a lower selling price for the holding, sell other investments, or forego another, more appealing investment opportunity.Generally, the less liquid the market at the time the Fund sells a portfolio investment, the greater the risk of loss or decline ofvalue to the Fund. A less liquid market can lead to an increase in Fund redemptions, which may negatively impact Fundperformance and net asset value per share, including, for example, if the Fund is forced to sell securities in a down market.
Market risk
The Fund may incur losses due to declines in the value of one or more securities in which it invests. These declines may bedue to factors affecting a particular issuer, or the result of, among other things, political, regulatory, market, economic orsocial developments affecting the relevant market(s) more generally. In addition, turbulence in financial markets and reducedliquidity in equity, credit and/or fixed income markets may negatively affect many issuers, which could adversely affect theFund, including causing difficulty in assigning prices to hard-to-value assets in thinly traded and closed markets, significantredemptions and operational challenges. Global economies and financial markets are increasingly interconnected, andconditions and events in one country, region or financial market may adversely impact issuers in a different country, region orfinancial market. These risks may be magnified if certain events or developments adversely interrupt the global supply chain;in these and other circumstances, such risks might affect companies worldwide. As a result, local, regional or global eventssuch as terrorism, war, natural disasters, disease/virus outbreaks and epidemics or other public health issues, recessions,depressions or other events – or the potential for such events – could have a significant negative impact on global economicand market conditions.
The coronavirus disease 2019 and its variants (COVID-19) pandemic has resulted in, and may continue to result in,significant global economic and societal disruption and market volatility due to disruptions in market access, resourceavailability, facilities operations, imposition of tariffs, export controls and supply chain disruption, among others. Suchdisruptions may be caused, or exacerbated by, quarantines and travel restrictions, workforce displacement and loss inhuman and other resources. The uncertainty surrounding the magnitude, duration, reach, costs and effects of the globalpandemic, as well as actions that have been or could be taken by governmental authorities or other third parties, presentunknowns that are yet to unfold. The impacts, as well as the uncertainty over impacts to come, of COVID-19 – and any otherinfectious illness outbreaks, epidemics and pandemics that may arise in the future – could negatively affect globaleconomies and markets in ways that cannot necessarily be foreseen. In addition, the impact of infectious illness outbreaksand epidemics in emerging market countries may be greater due to generally less established healthcare systems,governments and financial markets. Public health crises caused by the COVID-19 outbreak may exacerbate other pre-existingpolitical, social and economic risks in certain countries or globally. The disruptions caused by COVID-19 could prevent theFund from executing advantageous investment decisions in a timely manner and negatively impact the Fund’s ability toachieve its investment objectives. Any such event(s) could have a significant adverse impact on the value and risk profile ofthe Fund.
NOTES TO FINANCIAL STATEMENTS (continued)December 31, 2021
50 Columbia Variable Portfolio – Balanced Fund | Annual Report 2021

Mortgage- and other asset-backed securities risk
The value of any mortgage-backed and other asset-backed securities including collateralized debt obligations, if any, held bythe Fund may be affected by, among other things, changes or perceived changes in: interest rates; factors concerning theinterests in and structure of the issuer or the originator of the mortgages or other assets; the creditworthiness of the entitiesthat provide any supporting letters of credit, surety bonds or other credit enhancements; or the market’s assessment of thequality of underlying assets. Payment of principal and interest on some mortgage-backed securities (but not the market valueof the securities themselves) may be guaranteed by the full faith and credit of a particular U.S. Government agency, authority,enterprise or instrumentality, and some, but not all, are also insured or guaranteed by the U.S. Government. Mortgage-backed securities issued by non-governmental issuers (such as commercial banks, savings and loan institutions, privatemortgage insurance companies, mortgage bankers and other secondary market issuers) may entail greater risk thanobligations guaranteed by the U.S. Government. Mortgage- and other asset-backed securities are subject to liquidity risk andprepayment risk. A decline or flattening of housing values may cause delinquencies in mortgages (especially sub-prime ornon-prime mortgages) underlying mortgage-backed securities and thereby adversely affect the ability of the mortgage-backedsecurities issuer to make principal and/or interest payments to mortgage-backed securities holders, including the Fund.Rising or high interest rates tend to extend the duration of mortgage- and other asset-backed securities, making their pricesmore volatile and more sensitive to changes in interest rates.
Shareholder concentration risk
At December 31, 2021, affiliated shareholders of record owned 99.6% of the outstanding shares of the Fund in one or moreaccounts. Subscription and redemption activity by concentrated accounts may have a significant effect on the operations ofthe Fund. In the case of a large redemption, the Fund may be forced to sell investments at inopportune times, including itsliquid positions, which may result in Fund losses and the Fund holding a higher percentage of less liquid positions. Largeredemptions could result in decreased economies of scale and increased operating expenses for non-redeeming Fundshareholders.
Note 9. Subsequent eventsManagement has evaluated the events and transactions that have occurred through the date the financial statements wereissued and noted no items requiring adjustment of the financial statements or additional disclosure.
Note 10. Information regarding pending and settled legal proceedingsAmeriprise Financial and certain of its affiliates have historically been involved in a number of legal, arbitration and regulatoryproceedings, including routine litigation, class actions, and governmental actions, concerning matters arising in connectionwith the conduct of their business activities. Ameriprise Financial believes that the Fund is not currently the subject of, andthat neither Ameriprise Financial nor any of its affiliates are the subject of, any pending legal, arbitration or regulatoryproceedings that are likely to have a material adverse effect on the Fund or the ability of Ameriprise Financial or its affiliatesto perform under their contracts with the Fund. Ameriprise Financial is required to make quarterly (10-Q), annual (10-K) and,as necessary, 8-K filings with the Securities and Exchange Commission (SEC) on legal and regulatory matters that relate toAmeriprise Financial and its affiliates. Copies of these filings may be obtained by accessing the SEC website at www.sec.gov.
There can be no assurance that these matters, or the adverse publicity associated with them, will not result in increasedFund redemptions, reduced sale of Fund shares or other adverse consequences to the Fund. Further, although we believeproceedings are not likely to have a material adverse effect on the Fund or the ability of Ameriprise Financial or its affiliates toperform under their contracts with the Fund, these proceedings are subject to uncertainties and, as such, we are unable toestimate the possible loss or range of loss that may result. An adverse outcome in one or more of these proceedings couldresult in adverse judgments, settlements, fines, penalties or other relief that could have a material adverse effect on theconsolidated financial condition or results of operations of Ameriprise Financial or one or more of its affiliates that providesservices to the Fund.
NOTES TO FINANCIAL STATEMENTS (continued)December 31, 2021
Columbia Variable Portfolio – Balanced Fund | Annual Report 2021 51

To the Board of Trustees of Columbia Funds Variable Series Trust II and Shareholders of Columbia Variable Portfolio –Balanced Fund
Opinion on the Financial Statements
We have audited the accompanying statement of assets and liabilities, including the portfolio of investments, of ColumbiaVariable Portfolio – Balanced Fund (one of the funds constituting Columbia Funds Variable Series Trust II, referred to hereafteras the "Fund") as of December 31, 2021, the related statement of operations for the year ended December 31, 2021, thestatement of changes in net assets for each of the two years in the period ended December 31, 2021, including the relatednotes, and the financial highlights for each of the five years in the period ended December 31, 2021 (collectively referred toas the "financial statements"). In our opinion, the financial statements present fairly, in all material respects, the financialposition of the Fund as of December 31, 2021, the results of its operations for the year then ended, the changes in its netassets for each of the two years in the period ended December 31, 2021 and the financial highlights for each of the fiveyears in the period ended December 31, 2021 in conformity with accounting principles generally accepted in theUnited States of America.
Basis for Opinion
These financial statements are the responsibility of the Fund’s management. Our responsibility is to express an opinion onthe Fund’s financial statements based on our audits. We are a public accounting firm registered with the Public CompanyAccounting Oversight Board (United States) (PCAOB) and are required to be independent with respect to the Fund inaccordance with the U.S. federal securities laws and the applicable rules and regulations of the Securities and ExchangeCommission and the PCAOB.
We conducted our audits of these financial statements in accordance with the standards of the PCAOB. Those standardsrequire that we plan and perform the audit to obtain reasonable assurance about whether the financial statements are free ofmaterial misstatement, whether due to error or fraud.
Our audits included performing procedures to assess the risks of material misstatement of the financial statements, whetherdue to error or fraud, and performing procedures that respond to those risks. Such procedures included examining, on a testbasis, evidence regarding the amounts and disclosures in the financial statements. Our audits also included evaluating theaccounting principles used and significant estimates made by management, as well as evaluating the overall presentation ofthe financial statements. Our procedures included confirmation of securities owned as of December 31, 2021 bycorrespondence with the custodian, transfer agent, brokers and agent banks; when replies were not received from brokers,we performed other auditing procedures. We believe that our audits provide a reasonable basis for our opinion.
/s/PricewaterhouseCoopers LLPMinneapolis, MinnesotaFebruary 22, 2022
We have served as the auditor of one or more investment companies within the Columbia Funds Complex since 1977.
REPORT OF INDEPENDENT REGISTERED PUBLICACCOUNTING FIRM
52 Columbia Variable Portfolio – Balanced Fund | Annual Report 2021

TRUSTEES AND OFFICERS
The Board oversees the Fund’s operations and appoints officers who are responsible for day-to-day business decisionsbased on policies set by the Board. The following table provides basic biographical information about the Fund’s Trustees asof the printing of this report, including their principal occupations during the past five years, although specific titles forindividuals may have varied over the period. The year set forth beneath Length of Service in the table below is the year inwhich the Trustee was first appointed or elected as Trustee to any Fund currently in the Columbia Funds Complex or apredecessor thereof. Under current Board policy, each Trustee generally serves until December 31 of the year such Trusteeturns seventy-five (75).
Independent trustees
Name,address,year of birth
Position heldwith the ColumbiaFunds andlength of service
Principal occupation(s)during past five yearsand other relevantprofessional experience
Number ofFunds in theColumbia FundsComplex*overseen
Other directorshipsheld by Trusteeduring the pastfive years
George S. Batejanc/o Columbia ManagementInvestment Advisers, LLC290 Congress StreetBoston, MA 022101953
Trustee since 2017 Executive Vice President, Global Head of Technologyand Operations, Janus Capital Group, Inc.,2010-2016
176 Former Chairman of the Board,NICSA (National InvestmentCompany Services Association)(Executive Committee,Nominating Committee andGovernance Committee),2014-2016; former Director,Intech InvestmentManagement, 2011-2016;former Board Member, MetroDenver Chamber of Commerce,2015-2016; former AdvisoryBoard Member, University ofColorado Business School,2015-2018
Kathleen Blatzc/o Columbia ManagementInvestment Advisers, LLC290 Congress StreetBoston, MA 022101954
Trustee since 2006 Attorney, specializing in arbitration and mediation;Chief Justice, Minnesota Supreme Court, 1998-2006;Associate Justice, Minnesota Supreme Court,1996-1998; Fourth Judicial District Court Judge,Hennepin County, 1994-1996; Attorney in privatepractice and public service, 1984-1993; StateRepresentative, Minnesota House of Representatives,1979-1993, which included service on the Tax andFinancial Institutions and Insurance Committees;Member and Interim Chair, Minnesota Sports FacilitiesAuthority, January 2017-July 2017; Interim Presidentand Chief Executive Officer, Blue Cross Blue Shield ofMinnesota (health care insurance), February-July2018, April-October 2021
176 Former Trustee, Blue CrossBlue Shield of Minnesota,2009-2021 (Chair of theBusiness DevelopmentCommittee, 2014-2017; Chairof the Governance Committee,2017-2019); former Memberand Chair of the Board,Minnesota Sports FacilitiesAuthority, January 2017-July2017; former Director, RobinaFoundation, 2009-2020(Chair, 2014-2020); Director,Schulze Family Foundation,since 2021
Pamela G. Carltonc/o Columbia ManagementInvestment Advisers, LLC290 Congress StreetBoston, MA 022101954
Trustee since 2007 President, Springboard — Partners in Cross CulturalLeadership (consulting company) since 2003;Managing Director of US Equity Research, JP MorganChase, 1999-2003; Director of US Equity Research,Chase Asset Management, 1996-1999; Co-DirectorLatin America Research, 1993-1996, COO GlobalResearch, 1992-1996, Co-Director of US Research,1991-1992, Investment Banker, Morgan Stanley,1982-1991, Morgan Stanley; Attorney, Cleary GottliebSteen & Hamilton LLP, 1980-1982
176 Trustee, New York PresbyterianHospital Board (ExecutiveCommittee and Chair of PeopleCommittee) since 1996;Director, DR Bank (AuditCommittee) since 2017;Director, Evercore Inc. (AuditCommittee); Director, ApolloCommercial Real EstateFinance, Inc. since 2021; theGoverning Council of theIndependent Directors Council(IDC), since 2021
Columbia Variable Portfolio – Balanced Fund | Annual Report 2021 53

TRUSTEES AND OFFICERS (continued)
Independent trustees (continued)
Name,address,year of birth
Position heldwith the ColumbiaFunds andlength of service
Principal occupation(s)during past five yearsand other relevantprofessional experience
Number ofFunds in theColumbia FundsComplex*overseen
Other directorshipsheld by Trusteeduring the pastfive years
Janet Langford Carrigc/o Columbia ManagementInvestment Advisers, LLC290 Congress StreetBoston, MA 022101957
Trustee since 1996 Senior Vice President, General Counsel and CorporateSecretary, ConocoPhillips (independent energycompany), September 2007-October 2018
174 Director, EQT Corporation(natural gas producer) since2019; Director, WhitingPetroleum Corporation(independent oil and gascompany) since 2020
J. Kevin Connaughtonc/o Columbia ManagementInvestment Advisers, LLC290 Congress StreetBoston, MA 022101964
Trustee since 2020 Member, FINRA National Adjudicatory Council sinceJanuary 2020; Adjunct Professor of Finance, BentleyUniversity since January 2018; Consultant toIndependent Trustees of CFVIT and CFST I from March2016 to June 2020 with respect to CFVIT andDecember 2020 with respect to CFST I; ManagingDirector and General Manager of Mutual FundProducts, Columbia Management Investment Advisers,LLC, May 2010-February 2015; President, ColumbiaFunds, 2008-2015; and senior officer of ColumbiaFunds and affiliated funds, 2003-2015
174 Former Director, The AutismProject, March2015-December 2021; formerMember of the InvestmentCommittee, St. Michael’sCollege, November2015-February 2020; formerTrustee, St. Michael’s College,June 2017-September 2019;former Trustee, New CenturyPortfolios, January2015-December 2017
Olive M. Darraghc/o Columbia ManagementInvestment Advisers, LLC290 Congress StreetBoston, MA 022101962
Trustee since 2020 Managing Director of Darragh Inc. (strategy and talentmanagement consulting firm) since 2010; Founderand CEO, Zolio, Inc. (investment management talentidentification platform) since 2004; Consultant toIndependent Trustees of CFVIT and CFST I from June2019 to June 2020 with respect to CFVIT andDecember 2020 with respect to CFST I; Partner, TudorInvestments, 2004-2010; Senior Partner, McKinsey &Company (consulting), 2001-2004
174 Former Director, University ofEdinburgh Business School(Member of US Board); formerDirector, Boston Public LibraryFoundation
Patricia M. Flynnc/o Columbia ManagementInvestment Advisers, LLC290 Congress StreetBoston, MA 022101950
Trustee since 2004 Trustee Professor of Economics and Management,Bentley University since 1976 (also teaches andconducts research on corporate governance); Dean,McCallum Graduate School of Business, BentleyUniversity, 1992-2002
176 Trustee, MA TaxpayersFoundation since 1997; Boardof Governors, InnovationInstitute, MA TechnologyCollaborative, 2010-2020;former Board of Directors, TheMA Business Roundtable,2003-2019
Brian J. Gallagherc/o Columbia ManagementInvestment Advisers, LLC290 Congress StreetBoston, MA 022101954
Trustee since 2017 Retired; Partner with Deloitte & Touche LLP and itspredecessors, 1977-2016
176 Trustee, Catholic SchoolsFoundation since 2004
54 Columbia Variable Portfolio – Balanced Fund | Annual Report 2021

TRUSTEES AND OFFICERS (continued)
Independent trustees (continued)
Name,address,year of birth
Position heldwith the ColumbiaFunds andlength of service
Principal occupation(s)during past five yearsand other relevantprofessional experience
Number ofFunds in theColumbia FundsComplex*overseen
Other directorshipsheld by Trusteeduring the pastfive years
Douglas A. Hackerc/o Columbia ManagementInvestment Advisers, LLC290 Congress StreetBoston, MA 022101955
Co-Chair since 2021;Chair of CFST I andCFVIT since 2014;Trustee of CFST I andCFVIT since 1996 andCFST, CFST II, CFVST II,CET I and CET II since2021
Independent business executive since May 2006;Executive Vice President – Strategy of United Airlines,December 2002 - May 2006; President of UAL LoyaltyServices (airline marketing company), September2001-December 2002; Executive Vice President andChief Financial Officer of United Airlines, July1999-September 2001
176 Director, Spartan NashCompany (food distributor);Director, Aircastle Limited(Chair of Audit Committee)(aircraft leasing); formerDirector, Nash Finch Company(food distributor), 2005-2013;former Director, SeaCubeContainer Leasing Ltd.(container leasing),2010-2013; and formerDirector, Travelport WorldwideLimited (travel informationtechnology), 2014-2019
Nancy T. Lukitshc/o Columbia ManagementInvestment Advisers, LLC290 Congress StreetBoston, MA 022101956
Trustee since 2011 Senior Vice President, Partner and Director ofMarketing, Wellington Management Company, LLP(investment adviser), 1997-2010; Chair, WellingtonManagement Portfolios (commingled non-U.S.investment pools), 2007 -2010; Director, WellingtonTrust Company, NA and other Wellington affiliates,1997-2010
174 None
David M. Moffettc/o Columbia ManagementInvestment Advisers, LLC290 Congress StreetBoston, MA 022101952
Trustee since 2011 Retired; Consultant to Bridgewater and Associates 174 Director, CSX Corporation(transportation suppliers);Director, Genworth Financial,Inc. (financial and insuranceproducts and services);Director, PayPal Holdings Inc.(payment and data processingservices); Trustee, University ofOklahoma Foundation; formerDirector, eBay Inc. (onlinetrading community),2007-2015; and formerDirector, CIT Bank, CITGroup Inc. (commercial andconsumer finance),2010-2016
Catherine James Pagliac/o Columbia ManagementInvestment Advisers, LLC290 Congress StreetBoston, MA 022101952
Co-Chair since 2021;Chair of CFST, CFST II,CFVST II, CET I and CETII since 2020; Trusteeof CFST, CFST II andCFVST II since 2004and CFST I and CFVITsince 2021
Director, Enterprise Asset Management, Inc. (privatereal estate and asset management company) sinceSeptember 1998; Managing Director and Partner,Interlaken Capital, Inc., 1989-1997; Vice President,1982-1985, Principal, 1985-1987, ManagingDirector, 1987-1989, Morgan Stanley; Vice President,Investment Banking, 1980-1982, Associate,Investment Banking, 1976-1980, Dean WitterReynolds, Inc.
176 Director, Valmont Industries,Inc. (irrigation systemsmanufacturer) since 2012;Trustee, Carleton College (onthe Investment Committee);Trustee, Carnegie Endowmentfor International Peace (on theInvestment Committee)
Columbia Variable Portfolio – Balanced Fund | Annual Report 2021 55
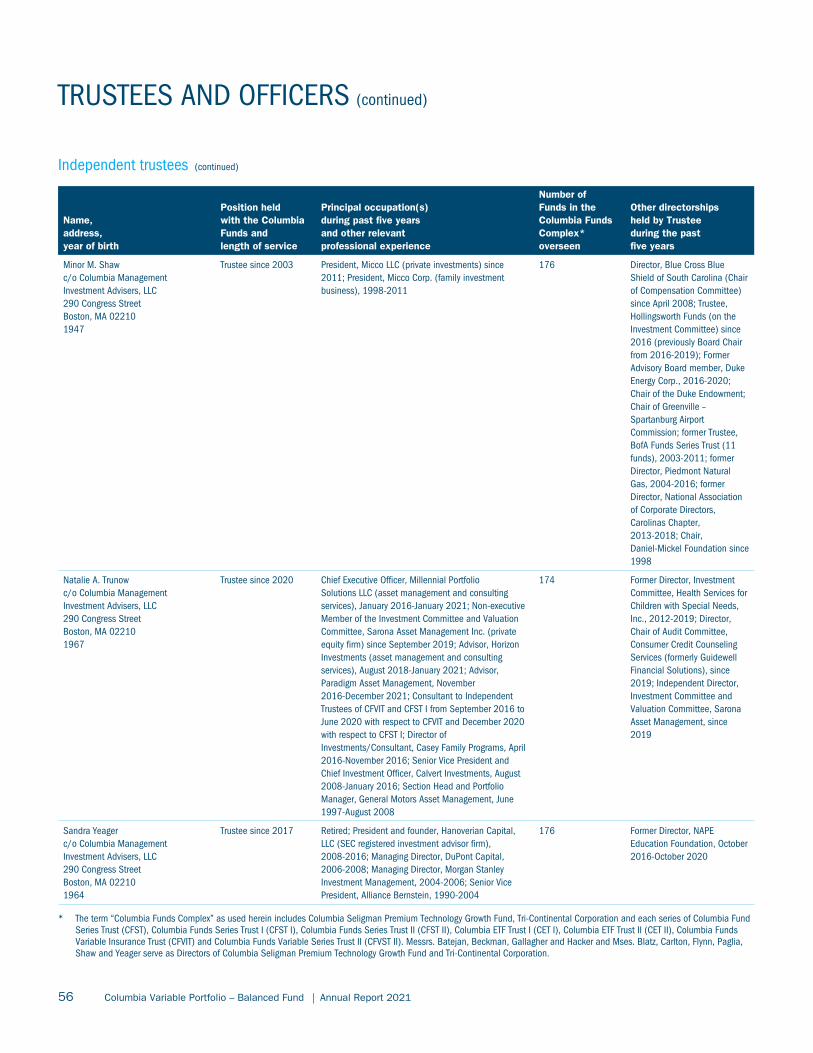
TRUSTEES AND OFFICERS (continued)
Independent trustees (continued)
Name,address,year of birth
Position heldwith the ColumbiaFunds andlength of service
Principal occupation(s)during past five yearsand other relevantprofessional experience
Number ofFunds in theColumbia FundsComplex*overseen
Other directorshipsheld by Trusteeduring the pastfive years
Minor M. Shawc/o Columbia ManagementInvestment Advisers, LLC290 Congress StreetBoston, MA 022101947
Trustee since 2003 President, Micco LLC (private investments) since2011; President, Micco Corp. (family investmentbusiness), 1998-2011
176 Director, Blue Cross BlueShield of South Carolina (Chairof Compensation Committee)since April 2008; Trustee,Hollingsworth Funds (on theInvestment Committee) since2016 (previously Board Chairfrom 2016-2019); FormerAdvisory Board member, DukeEnergy Corp., 2016-2020;Chair of the Duke Endowment;Chair of Greenville –Spartanburg AirportCommission; former Trustee,BofA Funds Series Trust (11funds), 2003-2011; formerDirector, Piedmont NaturalGas, 2004-2016; formerDirector, National Associationof Corporate Directors,Carolinas Chapter,2013-2018; Chair,Daniel-Mickel Foundation since1998
Natalie A. Trunowc/o Columbia ManagementInvestment Advisers, LLC290 Congress StreetBoston, MA 022101967
Trustee since 2020 Chief Executive Officer, Millennial PortfolioSolutions LLC (asset management and consultingservices), January 2016-January 2021; Non-executiveMember of the Investment Committee and ValuationCommittee, Sarona Asset Management Inc. (privateequity firm) since September 2019; Advisor, HorizonInvestments (asset management and consultingservices), August 2018-January 2021; Advisor,Paradigm Asset Management, November2016-December 2021; Consultant to IndependentTrustees of CFVIT and CFST I from September 2016 toJune 2020 with respect to CFVIT and December 2020with respect to CFST I; Director ofInvestments/Consultant, Casey Family Programs, April2016-November 2016; Senior Vice President andChief Investment Officer, Calvert Investments, August2008-January 2016; Section Head and PortfolioManager, General Motors Asset Management, June1997-August 2008
174 Former Director, InvestmentCommittee, Health Services forChildren with Special Needs,Inc., 2012-2019; Director,Chair of Audit Committee,Consumer Credit CounselingServices (formerly GuidewellFinancial Solutions), since2019; Independent Director,Investment Committee andValuation Committee, SaronaAsset Management, since2019
Sandra Yeagerc/o Columbia ManagementInvestment Advisers, LLC290 Congress StreetBoston, MA 022101964
Trustee since 2017 Retired; President and founder, Hanoverian Capital,LLC (SEC registered investment advisor firm),2008-2016; Managing Director, DuPont Capital,2006-2008; Managing Director, Morgan StanleyInvestment Management, 2004-2006; Senior VicePresident, Alliance Bernstein, 1990-2004
176 Former Director, NAPEEducation Foundation, October2016-October 2020
* The term “Columbia Funds Complex” as used herein includes Columbia Seligman Premium Technology Growth Fund, Tri-Continental Corporation and each series of Columbia FundSeries Trust (CFST), Columbia Funds Series Trust I (CFST I), Columbia Funds Series Trust II (CFST II), Columbia ETF Trust I (CET I), Columbia ETF Trust II (CET II), Columbia FundsVariable Insurance Trust (CFVIT) and Columbia Funds Variable Series Trust II (CFVST II). Messrs. Batejan, Beckman, Gallagher and Hacker and Mses. Blatz, Carlton, Flynn, Paglia,Shaw and Yeager serve as Directors of Columbia Seligman Premium Technology Growth Fund and Tri-Continental Corporation.
56 Columbia Variable Portfolio – Balanced Fund | Annual Report 2021

TRUSTEES AND OFFICERS (continued)
Interested trustee affiliated with Investment Manager*
Name,address,year of birth
Position held withthe ColumbiaFunds and lengthof service
Principal occupation(s) during thepast five years and other relevantprofessional experience
Number ofFunds in theColumbia FundsComplexoverseen
Other directorshipsheld by Trusteeduring the pastfive years
Daniel J. Beckmanc/o Columbia ManagementInvestment Advisers, LLC290 Congress StreetBoston, MA 022101962
Trustee sinceNovember 2021(a)
Vice President – Head of North America Product,Columbia Management Investment Advisers, LLC(since April 2015); officer of Columbia Funds andaffiliated funds since 2020.
176 Director, AmeripriseTrust Company, since October2016; Director, ColumbiaManagement InvestmentDistributors, Inc. sinceNovember 2018; Board ofGovernors, Columbia WangerAsset Management, LLC sinceJanuary 2022
* Interested person (as defined under the 1940 Act) by reason of being an officer, director, security holder and/or employee of the Investment Manager or Ameriprise Financial.
(a) Mr. Beckman serves as the President and Principal Executive Officer of the Columbia Funds (since 2021).
The Statement of Additional Information has additional information about the Fund’s Board members and is available, withoutcharge, upon request by calling 800.345.6611 or contacting your financial intermediary.
The Board has appointed officers who are responsible for day-to-day business decisions based on policies it has established.The officers serve at the pleasure of the Board. The following table provides basic information about the Officers of the Fund,including principal occupations during the past five years, although their specific titles may have varied over the period. Inaddition to Mr. Beckman, who is President and Principal Executive Officer, the Fund’s other officers are:
Fund officers
Name,address andyear of birth
Position and yearfirst appointed toposition for any Fundin the ColumbiaFunds Complex or apredecessor thereof Principal occupation(s) during past five years
Michael G. Clarke290 Congress StreetBoston, MA 022101969
Chief Financial Officer andPrincipal Financial Officer(2009) and Senior VicePresident (2019)
Vice President and Head of Global Operations & Investor Services, Columbia Management InvestmentAdvisers, LLC, since March 2022 (previously Vice President, Head of North American Operations, andCo-Head of Global Operations, June 2019 to February 2022 and Vice President – Accounting and Tax,May 2010 - May 2019); senior officer of Columbia Funds and affiliated funds since 2002.
Joseph Beranek5890 AmeripriseFinancial CenterMinneapolis, MN 554741965
Treasurer and ChiefAccounting Officer (PrincipalAccounting Officer) (2019)and Principal Financial Officer(2020), CFST, CFST I, CFST II,CFVIT and CFVST II; AssistantTreasurer, CET I and CET II
Vice President – Mutual Fund Accounting and Financial Reporting, Columbia Management InvestmentAdvisers, LLC, since December 2018 and March 2017, respectively (previously Vice President – Pricingand Corporate Actions, May 2010 - March 2017).
Marybeth Pilat290 Congress StreetBoston, MA 022101968
Treasurer and ChiefAccounting Officer (PrincipalAccounting Officer) andPrincipal Financial Officer(2020) for CET I and CET II;Assistant Treasurer, CFST,CFST I, CFST II, CFVIT andCFVST II
Vice President – Product Pricing and Administration, Columbia Management Investment Advisers, LLC,since May 2017; Director - Fund Administration, Calvert Investments, August 2015 – March 2017; VicePresident - Fund Administration, Legg Mason, May 2015 - July 2015; Vice President - FundAdministration, Columbia Management Investment Advisers, LLC, May 2010 - April 2015.
Columbia Variable Portfolio – Balanced Fund | Annual Report 2021 57

TRUSTEES AND OFFICERS (continued)
Fund officers (continued)
Name,address andyear of birth
Position and yearfirst appointed toposition for any Fundin the ColumbiaFunds Complex or apredecessor thereof Principal occupation(s) during past five years
William F. Truscott290 Congress StreetBoston, MA 022101960
Senior Vice President (2001) Formerly, Trustee/Director of Columbia Funds Complex or legacy funds, November 2001-January 1, 2021;Chief Executive Officer, Global Asset Management, Ameriprise Financial, Inc. since September 2012;Chairman of the Board and President, Columbia Management Investment Advisers, LLC since July 2004and February 2012, respectively; Chairman of the Board and Chief Executive Officer, ColumbiaManagement Investment Distributors, Inc. since November 2008 and February 2012, respectively;Chairman of the Board and Director, Threadneedle Asset Management Holdings, Sàrl since March 2013and December 2008, respectively; senior executive of various entities affiliated with ColumbiaThreadneedle.
Christopher O. Petersen5228 Ameriprise Financial CenterMinneapolis, MN 554741970
Senior Vice President andAssistant Secretary
Formerly, Trustee/Director of funds within the Columbia Funds Complex, July 1, 2020 - November 22,2021; Senior Vice President and Assistant General Counsel, Ameriprise Financial, Inc. since September2021 (previously Vice President and Lead Chief Counsel, January 2015 - September 2021); Presidentand Principal Executive Officer of the Columbia Funds 2015 - 2021; officer of Columbia Funds andaffiliated funds since 2007.
Thomas P. McGuire290 Congress StreetBoston, MA 022101972
Senior Vice President andChief Compliance Officer(2012)
Vice President – Asset Management Compliance, Ameriprise Financial, Inc., since May 2010; ChiefCompliance Officer, Columbia Acorn/Wanger Funds since December 2015; Chief Compliance Officer,Ameriprise Certificate Company, September 2010 – September 2020.
Ryan C. Larrenaga290 Congress StreetBoston, MA 022101970
Senior Vice President (2017),Chief Legal Officer (2017),and Secretary (2015)
Vice President and Chief Counsel, Ameriprise Financial, Inc. since August 2018 (previously Vice Presidentand Group Counsel, August 2011 - August 2018); Chief Legal Officer, Columbia Acorn/Wanger Funds,since September 2020; officer of Columbia Funds and affiliated funds since 2005.
Michael E. DeFao290 Congress StreetBoston, MA 022101968
Vice President (2011) andAssistant Secretary (2010)
Vice President and Chief Counsel, Ameriprise Financial, Inc. since May 2010; Vice President, Chief LegalOfficer and Assistant Secretary, Columbia Management Investment Advisers, LLC since October 2021(previously Vice President and Assistant Secretary, May 2010 – September 2021).
Lyn Kephart-Strong5228 AmeripriseFinancial CenterMinneapolis, MN 554741960
Vice President (2015) President, Columbia Management Investment Services Corp. since October 2014; Vice President &Resolution Officer, Ameriprise Trust Company since August 2009.
58 Columbia Variable Portfolio – Balanced Fund | Annual Report 2021

[THIS PAGE INTENTIONALLY LEFT BLANK]

Columbia Variable Portfolio – Balanced FundP.O. Box 219104Kansas City, MO 64121-9104
Please read and consider the investment objectives, risks, charges and expenses for any fund carefully before investing. For Fund andother investment product prospectuses, which contain this and other important information, contact your financial advisor or insurancerepresentative. Please read the prospectus carefully before you invest. The Fund is distributed by Columbia Management InvestmentDistributors, Inc., member FINRA, and managed by Columbia Management Investment Advisers, LLC.
Columbia Threadneedle Investments (Columbia Threadneedle) is the global brand name of the Columbia and Threadneedle group ofcompanies. All rights reserved. Columbia Management Investment Distributors, Inc., 290 Congress Street, Boston, MA 02210© 2022 Columbia Management Investment Advisers, LLC.
S-6677 AW (2/22)