Statement of Additional Information (SAI) - Invesco Mutual Fund
Upload
khangminh22Category
view
6download
0
Invesco India Midcap FundMid Cap Fund - An open ended equity scheme predominantly investing in mid cap stocks
1
Suitable for investors who are seeking*: Capital appreciation over long term Investments predominantly in equity and equity-related
instruments of Midcap companies
* Investors should consult their financial advisers if in doubt about whether the product is suitable for them
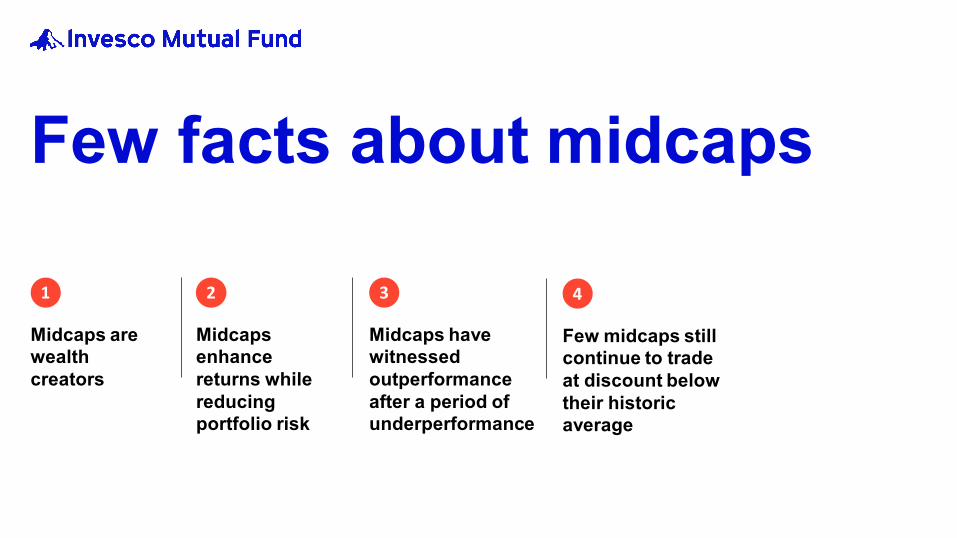
Few facts about midcaps
Midcaps are wealth creators
1
Midcaps enhance returns while reducing portfolio risk
2
Midcaps have witnessed outperformance after a period of underperformance
3
Optional footer
Few midcaps still continue to trade at discount below their historic average
4
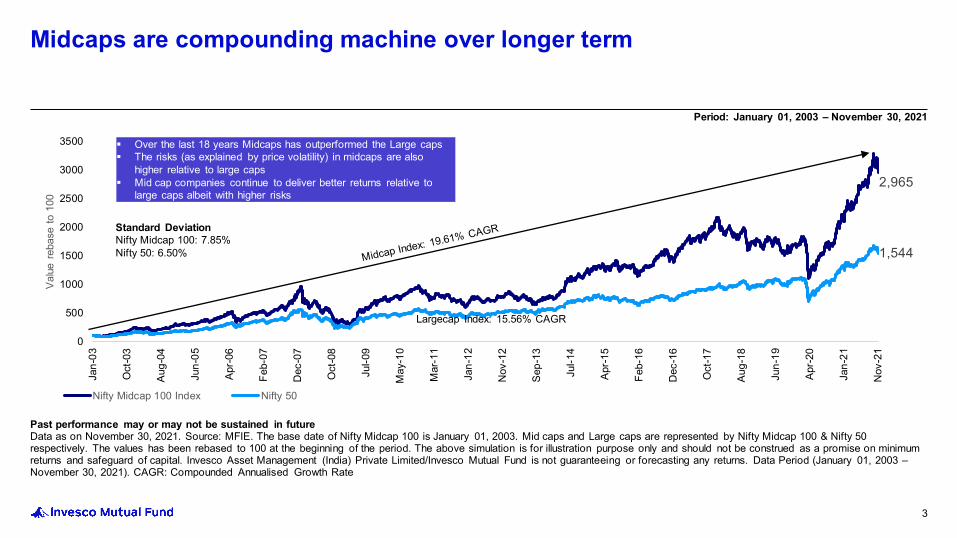
Past performance may or may not be sustained in futureData as on November 30, 2021. Source: MFIE. The base date of Nifty Midcap 100 is January 01, 2003. Mid caps and Large caps are represented by Nifty Midcap 100 & Nifty 50respectively. The values has been rebased to 100 at the beginning of the period. The above simulation is for illustration purpose only and should not be construed as a promise on minimum returns and safeguard of capital. Invesco Asset Management (India) Private Limited/Invesco Mutual Fund is not guaranteeing or forecasting any returns. Data Period (January 01, 2003 –November 30, 2021). CAGR: Compounded Annualised Growth Rate
2,965
1,544
0
500
1000
1500
2000
2500
3000
3500
Jan-
03
Oct
-03
Aug-
04
Jun-
05
Apr-0
6
Feb-
07
Dec
-07
Oct
-08
Jul-0
9
May
-10
Mar
-11
Jan-
12
Nov
-12
Sep-
13
Jul-1
4
Apr-1
5
Feb-
16
Dec
-16
Oct
-17
Aug-
18
Jun-
19
Apr-2
0
Jan-
21
Nov
-21
Value
reb
ase
to 1
00
Nifty Midcap 100 Index Nifty 50
Period: January 01, 2003 – November 30, 2021
3
Midcaps are compounding machine over longer term
Standard DeviationNifty Midcap 100: 7.85%Nifty 50: 6.50%
Largecap Index: 15.56% CAGR
Over the last 18 years Midcaps has outperformed the Large caps The risks (as explained by price volatility) in midcaps are also
higher relative to large caps Mid cap companies continue to deliver better returns relative to
large caps albeit with higher risks
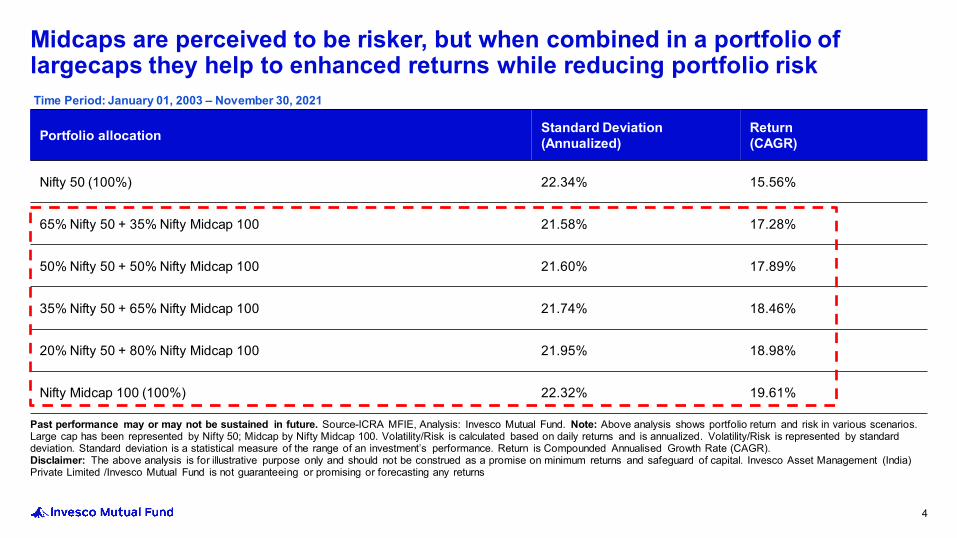
Past performance may or may not be sustained in future. Source-ICRA MFIE, Analysis: Invesco Mutual Fund. Note: Above analysis shows portfolio return and risk in various scenarios. Large cap has been represented by Nifty 50; Midcap by Nifty Midcap 100. Volatility/Risk is calculated based on daily returns and is annualized. Volatility/Risk is represented by standard deviation. Standard deviation is a statistical measure of the range of an investment’s performance. Return is Compounded Annualised Growth Rate (CAGR). Disclaimer: The above analysis is for illustrative purpose only and should not be construed as a promise on minimum returns and safeguard of capital. Invesco Asset Management (India) Private Limited /Invesco Mutual Fund is not guaranteeing or promising or forecasting any returns
Midcaps are perceived to be risker, but when combined in a portfolio of largecaps they help to enhanced returns while reducing portfolio risk
4
Portfolio allocation Standard Deviation(Annualized)
Return(CAGR)
Nifty 50 (100%) 22.34% 15.56%
65% Nifty 50 + 35% Nifty Midcap 100 21.58% 17.28%
50% Nifty 50 + 50% Nifty Midcap 100 21.60% 17.89%
35% Nifty 50 + 65% Nifty Midcap 100 21.74% 18.46%
20% Nifty 50 + 80% Nifty Midcap 100 21.95% 18.98%
Nifty Midcap 100 (100%) 22.32% 19.61%
Time Period: January 01, 2003 – November 30, 2021
12.48%
-30%
-20%
-10%
0%
10%
20%
30%
40%
Mar
-05
Feb-
06D
ec-0
6N
ov-0
7Se
p-08
Aug-
09Ju
n-10
May
-11
Mar
-12
Feb-
13D
ec-1
3N
ov-1
4Se
p-15
Aug-
16Ju
n-17
May
-18
Mar
-19
Feb-
20D
ec-2
0N
ov-2
1
Mid
cap
over
larg
ecap
O/U
(%)
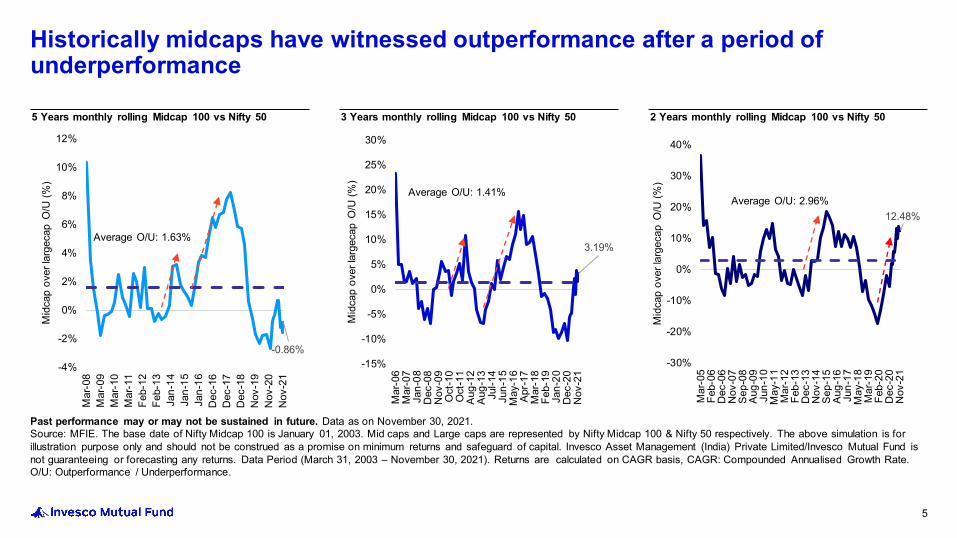
Average O/U: 2.96%
-0.86%-4%
-2%
0%
2%
4%
6%
8%
10%
12%
Mar
-08
Mar
-09
Mar
-10
Mar
-11
Feb-
12Fe
b-13
Jan-
14Ja
n-15
Jan-
16D
ec-1
6D
ec-1
7D
ec-1
8N
ov-1
9N
ov-2
0N
ov-2
1
Mid
cap
over
larg
ecap
O/U
(%)
Average O/U: 1.63%3.19%
-15%
-10%
-5%
0%
5%
10%
15%
20%
25%
30%
Mar
-06
Mar
-07
Jan-
08D
ec-0
8N
ov-0
9O
ct-1
0O
ct-1
1Au
g-12
Aug-
13Ju
l-14
Jun-
15M
ay-1
6Ap
r-17
Mar
-18
Feb-
19Ja
n-20
Dec
-20
Nov
-21
Mid
cap
over
larg
ecap
O/U
(%)
Average O/U: 1.41%
Past performance may or may not be sustained in future. Data as on November 30, 2021. Source: MFIE. The base date of Nifty Midcap 100 is January 01, 2003. Mid caps and Large caps are represented by Nifty Midcap 100 & Nifty 50 respectively. The above simulation is for illustration purpose only and should not be construed as a promise on minimum returns and safeguard of capital. Invesco Asset Management (India) Private Limited/Invesco Mutual Fund is not guaranteeing or forecasting any returns. Data Period (March 31, 2003 – November 30, 2021). Returns are calculated on CAGR basis, CAGR: Compounded Annualised Growth Rate. O/U: Outperformance / Underperformance.
5 Years monthly rolling Midcap 100 vs Nifty 50 3 Years monthly rolling Midcap 100 vs Nifty 50 2 Years monthly rolling Midcap 100 vs Nifty 50
5
Historically midcaps have witnessed outperformance after a period of underperformance
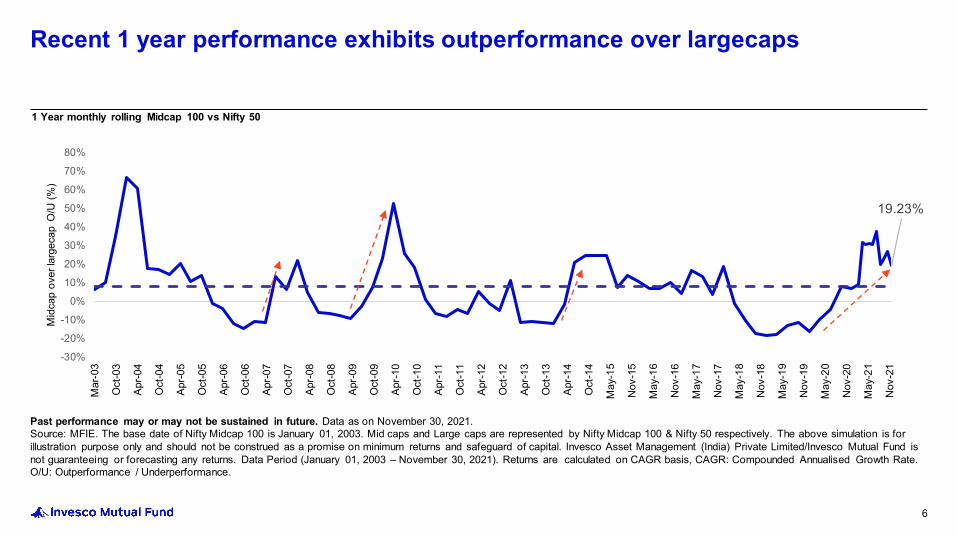
19.23%
-30%
-20%
-10%
0%
10%
20%
30%
40%
50%
60%
70%
80%
Mar
-03
Oct
-03
Apr-0
4
Oct
-04
Apr-0
5
Oct
-05
Apr-0
6
Oct
-06
Apr-0
7
Oct
-07
Apr-0
8
Oct
-08
Apr-0
9
Oct
-09
Apr-1
0
Oct
-10
Apr-1
1
Oct
-11
Apr-1
2
Oct
-12
Apr-1
3
Oct
-13
Apr-1
4
Oct
-14
May
-15
Nov
-15
May
-16
Nov
-16
May
-17
Nov
-17
May
-18
Nov
-18
May
-19
Nov
-19
May
-20
Nov
-20
May
-21
Nov
-21
Mid
cap
over
larg
ecap
O/U
(%)
Past performance may or may not be sustained in future. Data as on November 30, 2021. Source: MFIE. The base date of Nifty Midcap 100 is January 01, 2003. Mid caps and Large caps are represented by Nifty Midcap 100 & Nifty 50 respectively. The above simulation is for illustration purpose only and should not be construed as a promise on minimum returns and safeguard of capital. Invesco Asset Management (India) Private Limited/Invesco Mutual Fund is not guaranteeing or forecasting any returns. Data Period (January 01, 2003 – November 30, 2021). Returns are calculated on CAGR basis, CAGR: Compounded Annualised Growth Rate. O/U: Outperformance / Underperformance.
1 Year monthly rolling Midcap 100 vs Nifty 50
6
Recent 1 year performance exhibits outperformance over largecaps
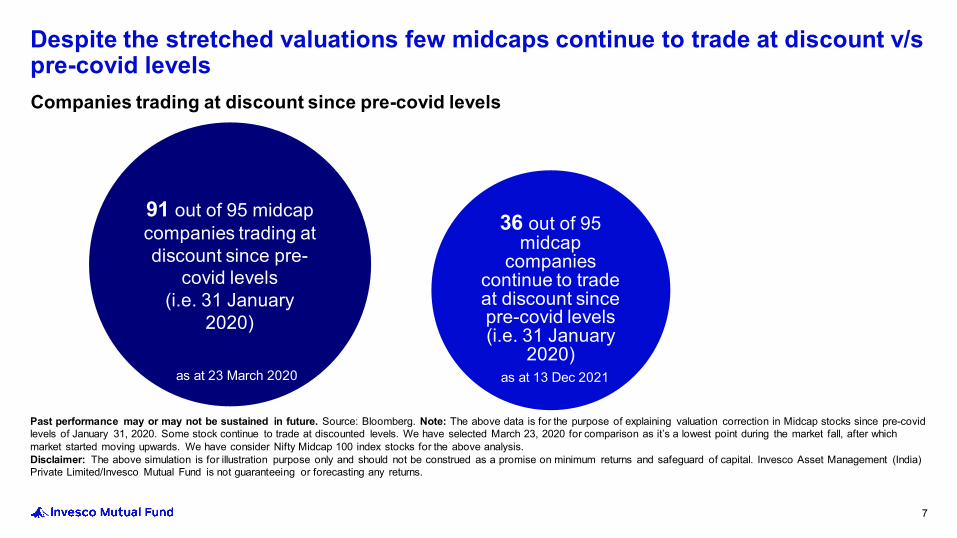
Past performance may or may not be sustained in future. Source: Bloomberg. Note: The above data is for the purpose of explaining valuation correction in Midcap stocks since pre-covidlevels of January 31, 2020. Some stock continue to trade at discounted levels. We have selected March 23, 2020 for comparison as it’s a lowest point during the market fall, after which market started moving upwards. We have consider Nifty Midcap 100 index stocks for the above analysis.Disclaimer: The above simulation is for illustration purpose only and should not be construed as a promise on minimum returns and safeguard of capital. Invesco Asset Management (India) Private Limited/Invesco Mutual Fund is not guaranteeing or forecasting any returns.
7
Despite the stretched valuations few midcaps continue to trade at discount v/s pre-covid levels
91 out of 95 midcap companies trading at discount since pre-
covid levels(i.e. 31 January
2020)
36 out of 95 midcap
companies continue to trade at discount since pre-covid levels(i.e. 31 January
2020) as at 23 March 2020 as at 13 Dec 2021
Companies trading at discount since pre-covid levels
0 10 20 30 40 50 60 70
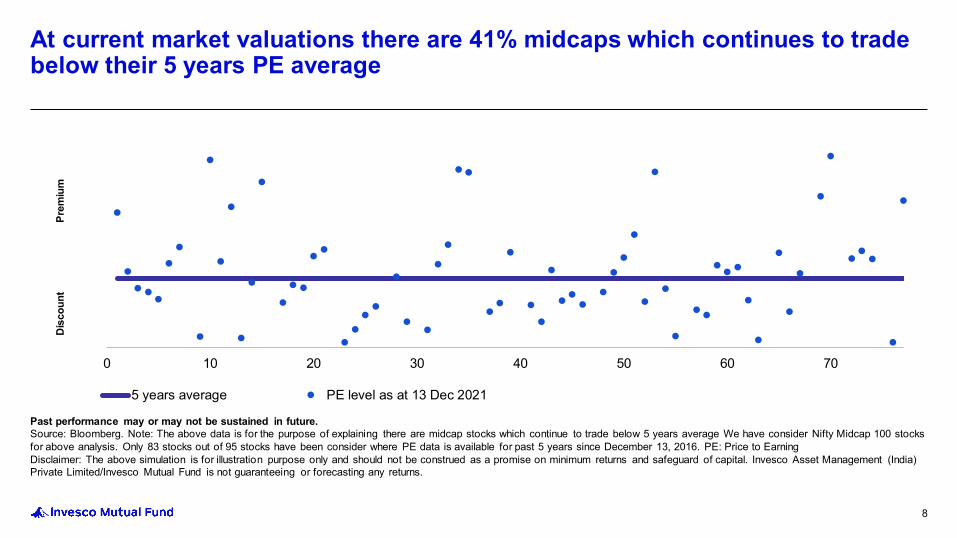
5 years average PE level as at 13 Dec 2021
Past performance may or may not be sustained in future.Source: Bloomberg. Note: The above data is for the purpose of explaining there are midcap stocks which continue to trade below 5 years average We have consider Nifty Midcap 100 stocks for above analysis. Only 83 stocks out of 95 stocks have been consider where PE data is available for past 5 years since December 13, 2016. PE: Price to EarningDisclaimer: The above simulation is for illustration purpose only and should not be construed as a promise on minimum returns and safeguard of capital. Invesco Asset Management (India) Private Limited/Invesco Mutual Fund is not guaranteeing or forecasting any returns.
8
At current market valuations there are 41% midcaps which continues to trade below their 5 years PE average
Dis
coun
tPr
emiu
m
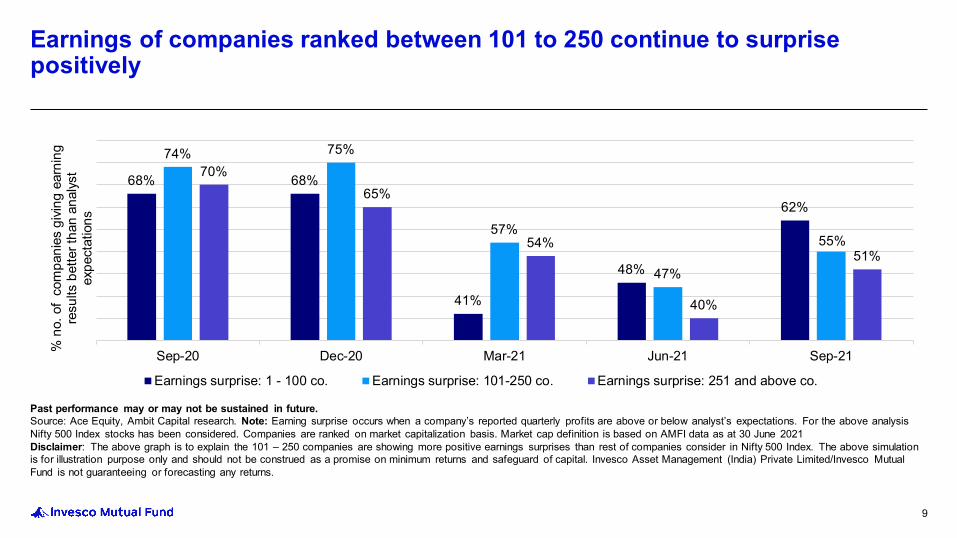
Past performance may or may not be sustained in future.Source: Ace Equity, Ambit Capital research. Note: Earning surprise occurs when a company’s reported quarterly profits are above or below analyst’s expectations. For the above analysis Nifty 500 Index stocks has been considered. Companies are ranked on market capitalization basis. Market cap definition is based on AMFI data as at 30 June 2021Disclaimer: The above graph is to explain the 101 – 250 companies are showing more positive earnings surprises than rest of companies consider in Nifty 500 Index. The above simulation is for illustration purpose only and should not be construed as a promise on minimum returns and safeguard of capital. Invesco Asset Management (India) Private Limited/Invesco Mutual Fund is not guaranteeing or forecasting any returns.
68% 68%
41%
48%
62%
74% 75%
57%
47%
55%
70%65%
54%
40%
51%
Sep-20 Dec-20 Mar-21 Jun-21 Sep-21% n
o. o
f co
mpa
nies
givi
ng e
arni
ng
resu
lts b
ette
r tha
n an
alys
t ex
pect
atio
ns
Earnings surprise: 1 - 100 co. Earnings surprise: 101-250 co. Earnings surprise: 251 and above co.
9
Earnings of companies ranked between 101 to 250 continue to surprise positively
Source: Bloomberg. 1The above data is for the purpose of explaining there are midcap stocks which continue to trade below 5 years average We have consider Nifty Midcap 100 stocks for above analysis. Only 83 stocks out of 95 stocks have been consider where PE data is available for past 5 years since 13 December 2021.
Mid Caps are better compounding machines than Large Caps over the long term as well as are wealth creators
Currently valuations across the market cap are higher than long term averages
41% of midcaps continue to trade at discount v/s pre-covid levels and below their 5 year average multiples1
Stock picking is a key attribute for long term wealth creation
Our bottom-up stock picking strategy is well suited to capitalize on this opportunity
To conclude
10
11
PresentingInvesco India Midcap Fund(Mid Cap Fund - An open ended equity scheme predominantly investing in mid cap stocks)
12
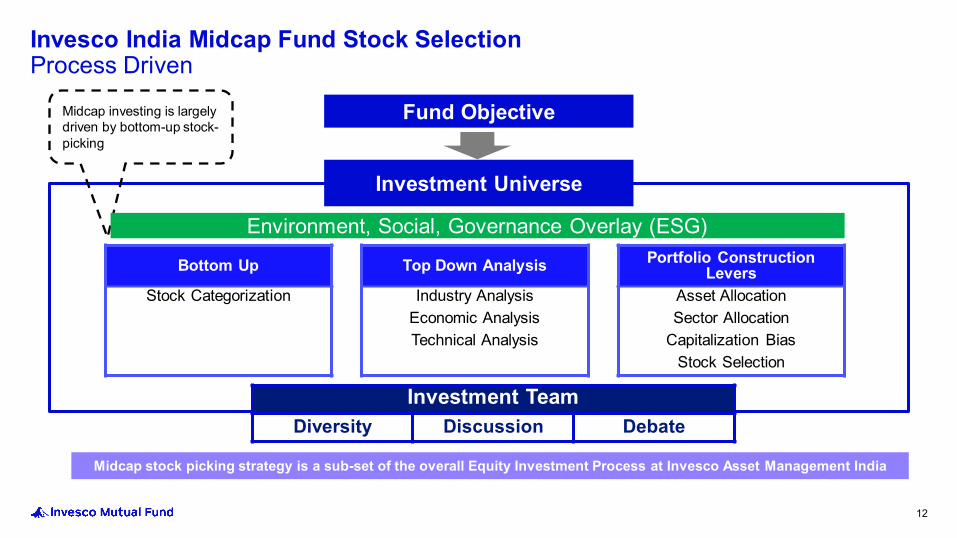
Invesco India Midcap Fund Stock SelectionProcess Driven
Fund Objective
Investment Universe
Bottom Up Top Down Analysis Portfolio Construction Levers
Stock Categorization Industry Analysis Asset AllocationEconomic Analysis Sector AllocationTechnical Analysis Capitalization Bias
Stock Selection
Investment TeamDiversity Discussion Debate
Midcap investing is largely driven by bottom-up stock-picking
Midcap stock picking strategy is a sub-set of the overall Equity Investment Process at Invesco Asset Management India
Environment, Social, Governance Overlay (ESG)
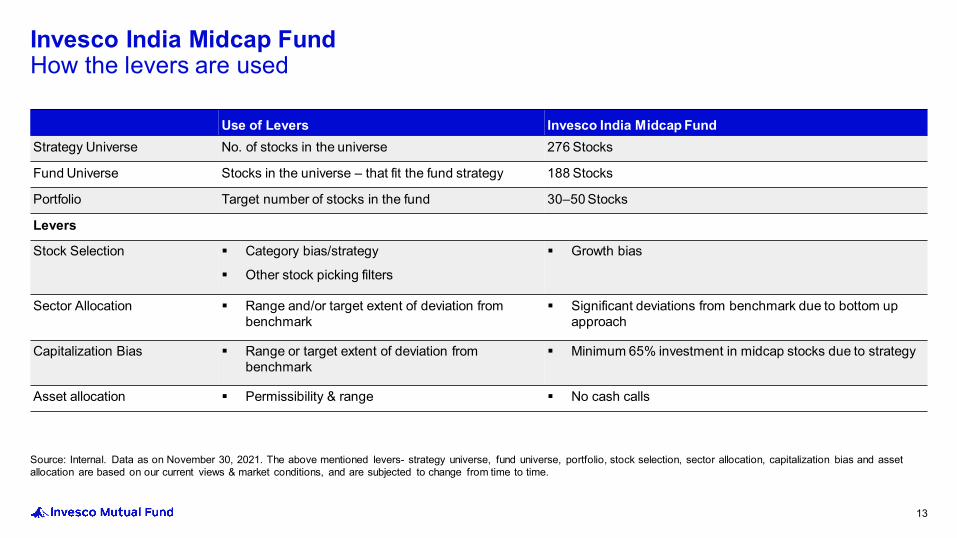
Source: Internal. Data as on November 30, 2021. The above mentioned levers- strategy universe, fund universe, portfolio, stock selection, sector allocation, capitalization bias and asset allocation are based on our current views & market conditions, and are subjected to change from time to time.
Use of Levers Invesco India Midcap FundStrategy Universe No. of stocks in the universe 276 Stocks
Fund Universe Stocks in the universe – that fit the fund strategy 188 Stocks
Portfolio Target number of stocks in the fund 30–50 Stocks
Levers
Stock Selection Category bias/strategy
Other stock picking filters
Growth bias
Sector Allocation Range and/or target extent of deviation from benchmark
Significant deviations from benchmark due to bottom up approach
Capitalization Bias Range or target extent of deviation from benchmark
Minimum 65% investment in midcap stocks due to strategy
Asset allocation Permissibility & range No cash calls
Invesco India Midcap FundHow the levers are used
13
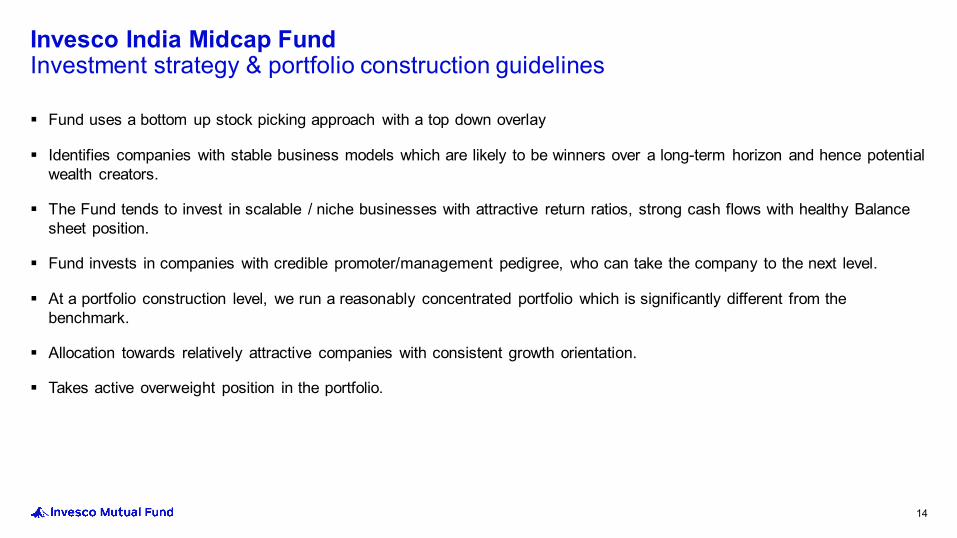
Fund uses a bottom up stock picking approach with a top down overlay
Identifies companies with stable business models which are likely to be winners over a long-term horizon and hence potential wealth creators.
The Fund tends to invest in scalable / niche businesses with attractive return ratios, strong cash flows with healthy Balancesheet position.
Fund invests in companies with credible promoter/management pedigree, who can take the company to the next level.
At a portfolio construction level, we run a reasonably concentrated portfolio which is significantly different from the benchmark.
Allocation towards relatively attractive companies with consistent growth orientation.
Takes active overweight position in the portfolio.
Invesco India Midcap FundInvestment strategy & portfolio construction guidelines
14
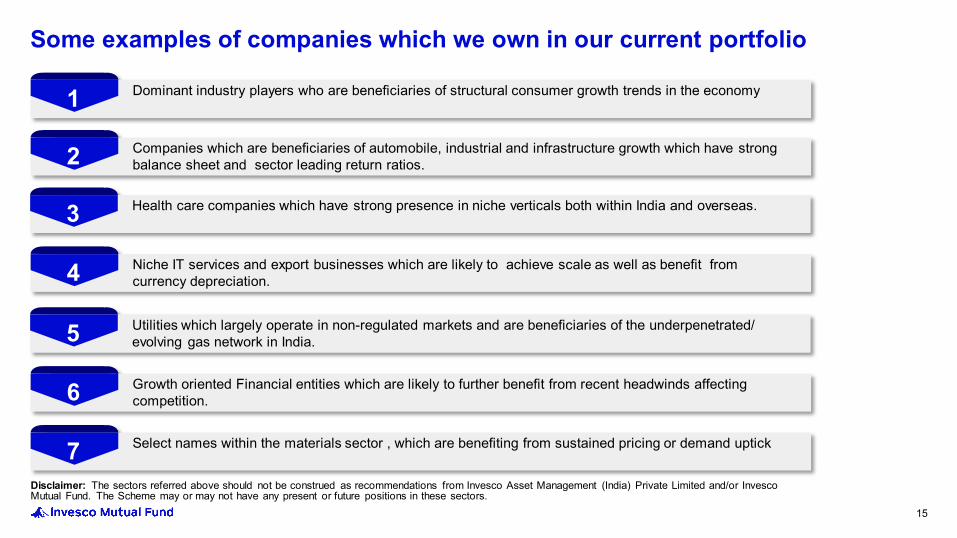
Disclaimer: The sectors referred above should not be construed as recommendations from Invesco Asset Management (India) Private Limited and/or Invesco Mutual Fund. The Scheme may or may not have any present or future positions in these sectors.
Some examples of companies which we own in our current portfolio
Dominant industry players who are beneficiaries of structural consumer growth trends in the economy1
15
Companies which are beneficiaries of automobile, industrial and infrastructure growth which have strong balance sheet and sector leading return ratios.2
Health care companies which have strong presence in niche verticals both within India and overseas. 3
Niche IT services and export businesses which are likely to achieve scale as well as benefit from currency depreciation.4
Utilities which largely operate in non-regulated markets and are beneficiaries of the underpenetrated/ evolving gas network in India.5
Growth oriented Financial entities which are likely to further benefit from recent headwinds affecting competition.6
Select names within the materials sector , which are benefiting from sustained pricing or demand uptick7
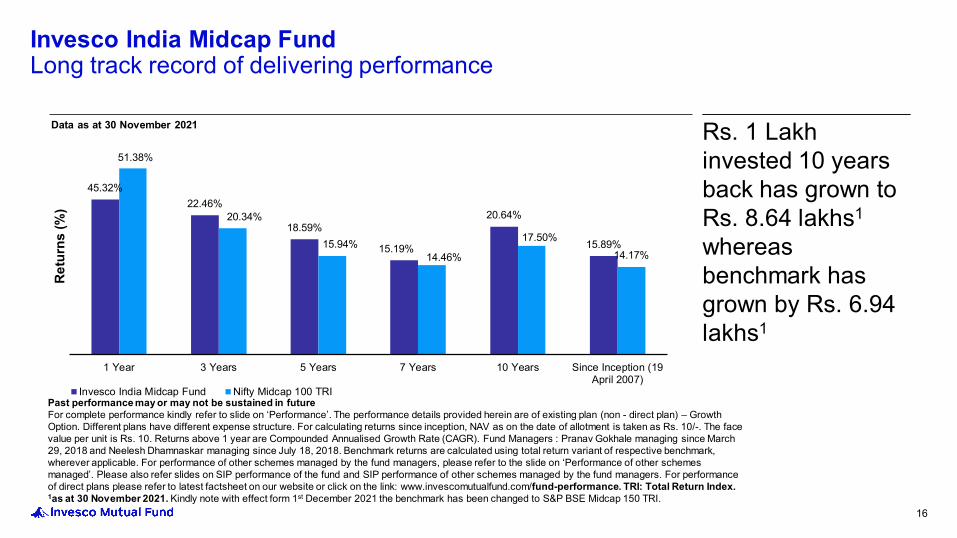
Invesco India Midcap FundLong track record of delivering performance
45.32%22.46%
18.59%
15.19%
20.64%
15.89%
51.38%
20.34%
15.94%14.46%
17.50%14.17%
1 Year 3 Years 5 Years 7 Years 10 Years Since Inception (19April 2007)
Retu
rns
(%)
Invesco India Midcap Fund Nifty Midcap 100 TRI
Data as at 30 November 2021
16
Past performance may or may not be sustained in futureFor complete performance kindly refer to slide on ‘Performance’. The performance details provided herein are of existing plan (non - direct plan) – Growth Option. Different plans have different expense structure. For calculating returns since inception, NAV as on the date of allotment is taken as Rs. 10/-. The face value per unit is Rs. 10. Returns above 1 year are Compounded Annualised Growth Rate (CAGR). Fund Managers : Pranav Gokhale managing since March 29, 2018 and Neelesh Dhamnaskar managing since July 18, 2018. Benchmark returns are calculated using total return variant of respective benchmark, wherever applicable. For performance of other schemes managed by the fund managers, please refer to the slide on ‘Performance of other schemes managed’. Please also refer slides on SIP performance of the fund and SIP performance of other schemes managed by the fund managers. For performance of direct plans please refer to latest factsheet on our website or click on the link: www.invescomutualfund.com/fund-performance. TRI: Total Return Index. 1as at 30 November 2021. Kindly note with effect form 1st December 2021 the benchmark has been changed to S&P BSE Midcap 150 TRI.
Rs. 1 Lakh invested 10 years back has grown to Rs. 8.64 lakhs1
whereas benchmark has grown by Rs. 6.94 lakhs1
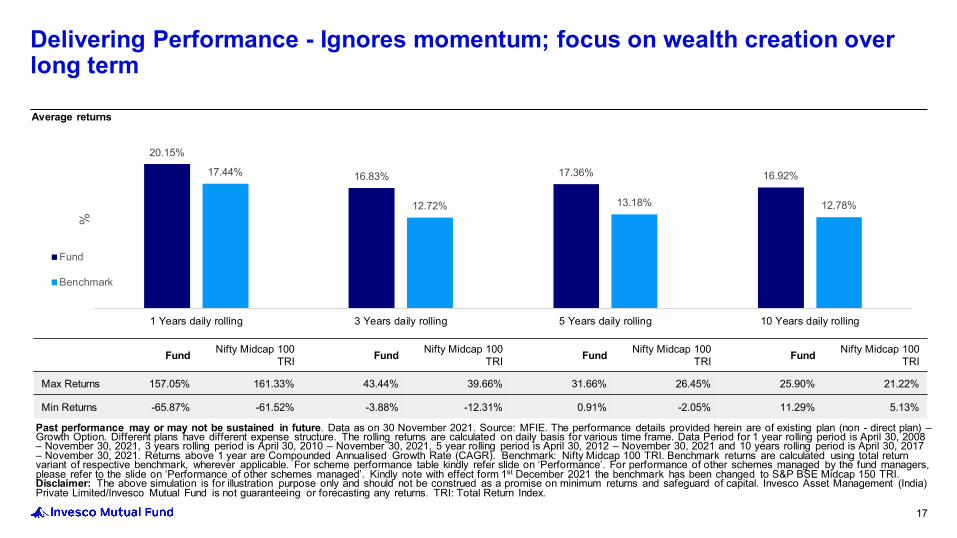
20.15%
16.83% 17.36% 16.92%17.44%
12.72% 13.18% 12.78%
1 Years daily rolling 3 Years daily rolling 5 Years daily rolling 10 Years daily rolling
%
Fund
Benchmark
Past performance may or may not be sustained in future. Data as on 30 November 2021. Source: MFIE. The performance details provided herein are of existing plan (non - direct plan) –Growth Option. Different plans have different expense structure. The rolling returns are calculated on daily basis for various time frame. Data Period for 1 year rolling period is April 30, 2008 – November 30, 2021, 3 years rolling period is April 30, 2010 – November 30, 2021, 5 year rolling period is April 30, 2012 – November 30, 2021 and 10 years rolling period is April 30, 2017 – November 30, 2021. Returns above 1 year are Compounded Annualised Growth Rate (CAGR). Benchmark: Nifty Midcap 100 TRI. Benchmark returns are calculated using total return variant of respective benchmark, wherever applicable. For scheme performance table kindly refer slide on ‘Performance’. For performance of other schemes managed by the fund managers, please refer to the slide on ‘Performance of other schemes managed’. Kindly note with effect form 1st December 2021 the benchmark has been changed to S&P BSE Midcap 150 TRI.Disclaimer: The above simulation is for illustration purpose only and should not be construed as a promise on minimum returns and safeguard of capital. Invesco Asset Management (India) Private Limited/Invesco Mutual Fund is not guaranteeing or forecasting any returns. TRI: Total Return Index.
Average returns
17
Delivering Performance - Ignores momentum; focus on wealth creation over long term
Fund Nifty Midcap 100 TRI Fund Nifty Midcap 100
TRI Fund Nifty Midcap 100 TRI Fund Nifty Midcap 100
TRI
Max Returns 157.05% 161.33% 43.44% 39.66% 31.66% 26.45% 25.90% 21.22%
Min Returns -65.87% -61.52% -3.88% -12.31% 0.91% -2.05% 11.29% 5.13%
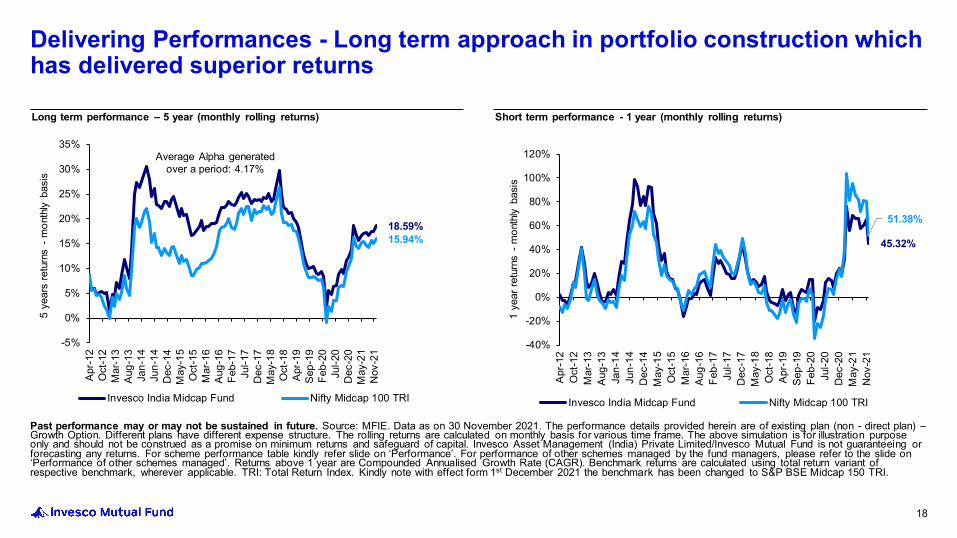
45.32%
51.38%
-40%
-20%
0%
20%
40%
60%
80%
100%
120%
Apr-1
2O
ct-1
2M
ar-1
3Au
g-13
Jan-
14Ju
n-14
Dec
-14
May
-15
Oct
-15
Mar
-16
Aug-
16Fe
b-17
Jul-1
7D
ec-1
7M
ay-1
8O
ct-1
8Ap
r-19
Sep-
19Fe
b-20
Jul-2
0D
ec-2
0M
ay-2
1N
ov-2
1
1 ye
ar re
turn
s -m
onth
ly ba
sis
Invesco India Midcap Fund Nifty Midcap 100 TRI
18.59%15.94%
-5%
0%
5%
10%
15%
20%
25%
30%
35%
Apr-1
2O
ct-1
2M
ar-1
3Au
g-13
Jan-
14Ju
n-14
Dec
-14
May
-15
Oct
-15
Mar
-16
Aug-
16Fe
b-17
Jul-1
7D
ec-1
7M
ay-1
8O
ct-1
8Ap
r-19
Sep-
19Fe
b-20
Jul-2
0D
ec-2
0M
ay-2
1N
ov-2
1
5 ye
ars
retu
rns
-mon
thly
basi
s
Invesco India Midcap Fund Nifty Midcap 100 TRI
Average Alpha generated over a period: 4.17%
Past performance may or may not be sustained in future. Source: MFIE. Data as on 30 November 2021. The performance details provided herein are of existing plan (non - direct plan) –Growth Option. Different plans have different expense structure. The rolling returns are calculated on monthly basis for various time frame. The above simulation is for illustration purpose only and should not be construed as a promise on minimum returns and safeguard of capital. Invesco Asset Management (India) Private Limited/Invesco Mutual Fund is not guaranteeing or forecasting any returns. For scheme performance table kindly refer slide on ‘Performance’. For performance of other schemes managed by the fund managers, please refer to the slide on ‘Performance of other schemes managed’. Returns above 1 year are Compounded Annualised Growth Rate (CAGR). Benchmark returns are calculated using total return variant of respective benchmark, wherever applicable. TRI: Total Return Index. Kindly note with effect form 1st December 2021 the benchmark has been changed to S&P BSE Midcap 150 TRI.
Long term performance – 5 year (monthly rolling returns) Short term performance - 1 year (monthly rolling returns)
18
Delivering Performances - Long term approach in portfolio construction which has delivered superior returns
-60%
-40%
-20%
0%
20%
40%
60%
80%
100%
120%
140%
28-D
ec-1
728
-Jan
-18
28-F
eb-1
831
-Mar
-18
30-A
pr-1
831
-May
-18
30-J
un-1
831
-Jul
-18
31-A
ug-1
830
-Sep
-18
31-O
ct-1
830
-Nov
-18
31-D
ec-1
831
-Jan
-19
28-F
eb-1
931
-Mar
-19
30-A
pr-1
931
-May
-19
30-J
un-1
931
-Jul
-19
31-A
ug-1
930
-Sep
-19
31-O
ct-1
930
-Nov
-19
31-D
ec-1
931
-Jan
-20
29-F
eb-2
031
-Mar
-20
30-A
pr-2
031
-May
-20
30-J
un-2
031
-Jul
-20
31-A
ug-2
030
-Sep
-20
31-O
ct-2
030
-Nov
-20
31-D
ec-2
031
-Jan
-21
28-F
eb-2
131
-Mar
-21
30-A
pr-2
131
-May
-21
30-J
un-2
131
-Jul
-21
31-A
ug-2
130
-Sep
-21
31-O
ct-2
130
-Nov
-21
1 ye
ar re
turn
-da
ily ro
lling
basi
s
Invesco India Mid Cap Fund - Growth Nifty Midcap 100 TRI
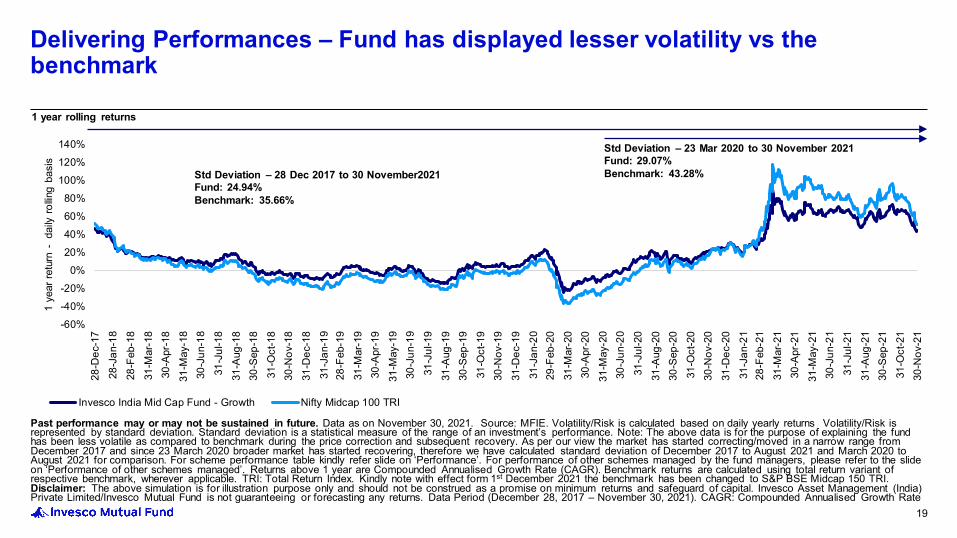
Std Deviation – 28 Dec 2017 to 30 November2021Fund: 24.94%Benchmark: 35.66%
Std Deviation – 23 Mar 2020 to 30 November 2021Fund: 29.07%Benchmark: 43.28%
Past performance may or may not be sustained in future. Data as on November 30, 2021. Source: MFIE. Volatility/Risk is calculated based on daily yearly returns Volatility/Risk is represented by standard deviation. Standard deviation is a statistical measure of the range of an investment’s performance. Note: The above data is for the purpose of explaining the fund has been less volatile as compared to benchmark during the price correction and subsequent recovery. As per our view the market has started correcting/moved in a narrow range from December 2017 and since 23 March 2020 broader market has started recovering, therefore we have calculated standard deviation of December 2017 to August 2021 and March 2020 to August 2021 for comparison. For scheme performance table kindly refer slide on ‘Performance’. For performance of other schemes managed by the fund managers, please refer to the slide on ‘Performance of other schemes managed’. Returns above 1 year are Compounded Annualised Growth Rate (CAGR). Benchmark returns are calculated using total return variant of respective benchmark, wherever applicable. TRI: Total Return Index. Kindly note with effect form 1st December 2021 the benchmark has been changed to S&P BSE Midcap 150 TRI.Disclaimer: The above simulation is for illustration purpose only and should not be construed as a promise on minimum returns and safeguard of capital. Invesco Asset Management (India) Private Limited/Invesco Mutual Fund is not guaranteeing or forecasting any returns. Data Period (December 28, 2017 – November 30, 2021). CAGR: Compounded Annualised Growth Rate
1 year rolling returns
19
Delivering Performances – Fund has displayed lesser volatility vs the benchmark
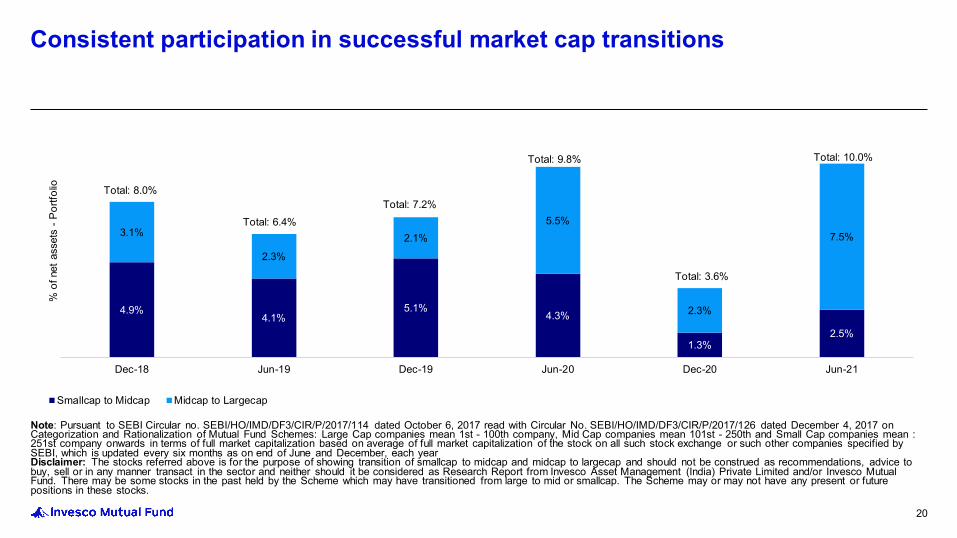
Note: Pursuant to SEBI Circular no. SEBI/HO/IMD/DF3/CIR/P/2017/114 dated October 6, 2017 read with Circular No. SEBI/HO/IMD/DF3/CIR/P/2017/126 dated December 4, 2017 on Categorization and Rationalization of Mutual Fund Schemes: Large Cap companies mean 1st - 100th company, Mid Cap companies mean 101st - 250th and Small Cap companies mean : 251st company onwards in terms of full market capitalization based on average of full market capitalization of the stock on all such stock exchange or such other companies specified by SEBI, which is updated every six months as on end of June and December, each yearDisclaimer: The stocks referred above is for the purpose of showing transition of smallcap to midcap and midcap to largecap and should not be construed as recommendations, advice to buy, sell or in any manner transact in the sector and neither should it be considered as Research Report from Invesco Asset Management (India) Private Limited and/or Invesco Mutual Fund. There may be some stocks in the past held by the Scheme which may have transitioned from large to mid or smallcap. The Scheme may or may not have any present or future positions in these stocks.
4.9%4.1%
5.1%4.3%
1.3%2.5%
3.1%
2.3%
2.1%5.5%
2.3%
7.5%
Dec-18 Jun-19 Dec-19 Jun-20 Dec-20 Jun-21
% o
f net
ass
ets
-Por
tfolio
Smallcap to Midcap Midcap to Largecap
Total: 8.0%
Total: 6.4%Total: 7.2%
Total: 9.8%
Total: 3.6%
20
Consistent participation in successful market cap transitions
Total: 10.0%
Past performance may or may not be sustained in future. Source: Factset. Data as on November 30, 20211Weighted Harmonic Mean. 2EPS growth is derived from P/E ratios. 3Weighted Arithmetic Mean. “Weighted Harmonic Mean” is an average resulting from the multiplication of the reciprocal of the observation for each component by the weightage of that stock in the portfolio/index. It reduces the impact of outliers. ROE: Return on Equity. EPS: Earnings Per Share. E denotes estimates. Risk Ratio: *Figures based on 3 year monthly data history. Risk ratios based on 3 years, monthly data history. (Risk – free rate of 3.41% based on overnight MIBOR). Data as on November 30, 2021. Benchmark – Nifty Midcap 100 TRI. Benchmark Returns are calculated using Total Return variant of respective Benchmark IndexThe stocks referred above should not be construed as recommendations from Invesco Asset Management (India) Private Limited and/or Invesco Mutual Fund. The Scheme may or may not have any present or future positions in these stocks. Kindly note with effect form 1st December 2021 the benchmark has been changed to S&P BSE Midcap 150 TRI.Disclaimer: Return on Equity, expected earnings growth & forward earnings mentioned herein are based on prevailing market conditions / various other factors / data points and is subject to change from time to time. It should not be construed as future returns of the Scheme. Invesco Asset Management (India) Pvt. Ltd./Invesco Mutual Fund is not guaranteeing or promising or forecasting any returns.
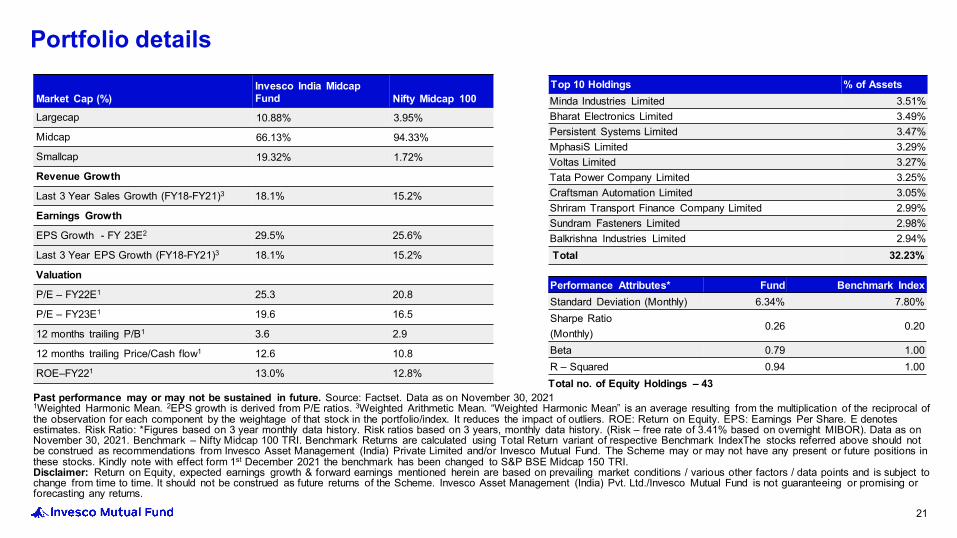
Top 10 Holdings % of AssetsMinda Industries Limited 3.51%Bharat Electronics Limited 3.49%Persistent Systems Limited 3.47%MphasiS Limited 3.29%Voltas Limited 3.27%Tata Power Company Limited 3.25%Craftsman Automation Limited 3.05%Shriram Transport Finance Company Limited 2.99%Sundram Fasteners Limited 2.98%Balkrishna Industries Limited 2.94%Total 32.23%
Portfolio details
Market Cap (%)Invesco India Midcap Fund Nifty Midcap 100
Largecap 10.88% 3.95%
Midcap 66.13% 94.33%
Smallcap 19.32% 1.72%
Revenue Growth
Last 3 Year Sales Growth (FY18-FY21)3 18.1% 15.2%
Earnings Growth
EPS Growth - FY 23E2 29.5% 25.6%
Last 3 Year EPS Growth (FY18-FY21)3 18.1% 15.2%
Valuation
P/E – FY22E1 25.3 20.8
P/E – FY23E1 19.6 16.5
12 months trailing P/B1 3.6 2.9
12 months trailing Price/Cash flow1 12.6 10.8
ROE–FY221 13.0% 12.8%
Performance Attributes* Fund Benchmark IndexStandard Deviation (Monthly) 6.34% 7.80%Sharpe Ratio(Monthly)
0.26 0.20
Beta 0.79 1.00R – Squared 0.94 1.00Total no. of Equity Holdings – 43
21
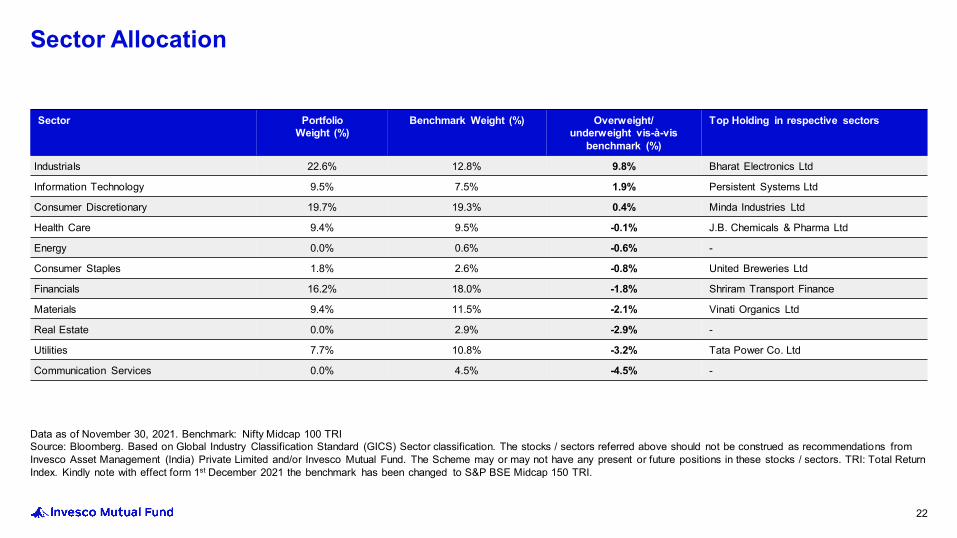
Data as of November 30, 2021. Benchmark: Nifty Midcap 100 TRI Source: Bloomberg. Based on Global Industry Classification Standard (GICS) Sector classification. The stocks / sectors referred above should not be construed as recommendations from Invesco Asset Management (India) Private Limited and/or Invesco Mutual Fund. The Scheme may or may not have any present or future positions in these stocks / sectors. TRI: Total Return Index. Kindly note with effect form 1st December 2021 the benchmark has been changed to S&P BSE Midcap 150 TRI.
Sector Portfolio Weight (%)
Benchmark Weight (%) Overweight/underweight vis-à-vis
benchmark (%)
Top Holding in respective sectors
Industrials 22.6% 12.8% 9.8% Bharat Electronics Ltd
Information Technology 9.5% 7.5% 1.9% Persistent Systems Ltd
Consumer Discretionary 19.7% 19.3% 0.4% Minda Industries Ltd
Health Care 9.4% 9.5% -0.1% J.B. Chemicals & Pharma Ltd
Energy 0.0% 0.6% -0.6% -
Consumer Staples 1.8% 2.6% -0.8% United Breweries Ltd
Financials 16.2% 18.0% -1.8% Shriram Transport Finance
Materials 9.4% 11.5% -2.1% Vinati Organics Ltd
Real Estate 0.0% 2.9% -2.9% -
Utilities 7.7% 10.8% -3.2% Tata Power Co. Ltd
Communication Services 0.0% 4.5% -4.5% -
Sector Allocation
22
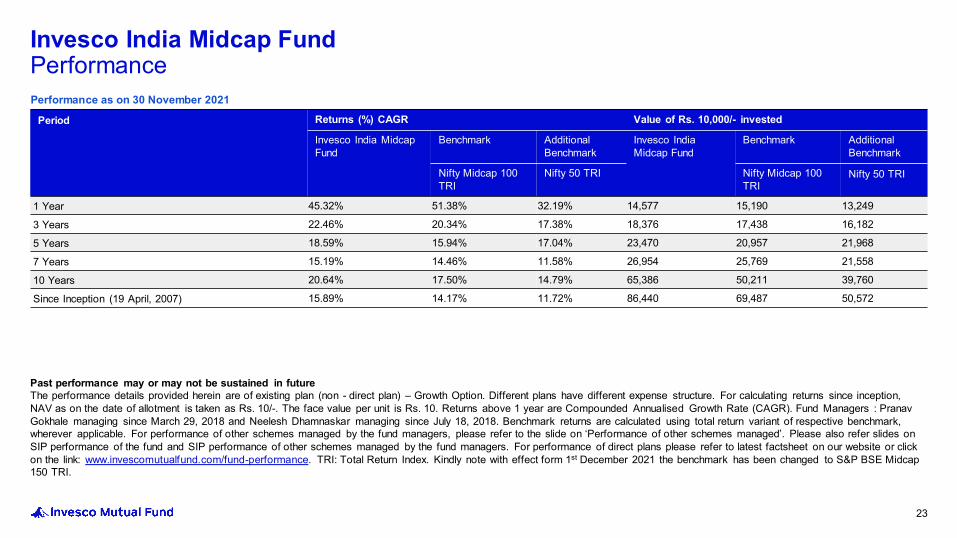
Past performance may or may not be sustained in futureThe performance details provided herein are of existing plan (non - direct plan) – Growth Option. Different plans have different expense structure. For calculating returns since inception, NAV as on the date of allotment is taken as Rs. 10/-. The face value per unit is Rs. 10. Returns above 1 year are Compounded Annualised Growth Rate (CAGR). Fund Managers : Pranav Gokhale managing since March 29, 2018 and Neelesh Dhamnaskar managing since July 18, 2018. Benchmark returns are calculated using total return variant of respective benchmark, wherever applicable. For performance of other schemes managed by the fund managers, please refer to the slide on ‘Performance of other schemes managed’. Please also refer slides on SIP performance of the fund and SIP performance of other schemes managed by the fund managers. For performance of direct plans please refer to latest factsheet on our website or click on the link: www.invescomutualfund.com/fund-performance. TRI: Total Return Index. Kindly note with effect form 1st December 2021 the benchmark has been changed to S&P BSE Midcap 150 TRI.
Period Returns (%) CAGR Value of Rs. 10,000/- invested
Invesco India MidcapFund
Benchmark AdditionalBenchmark
Invesco India Midcap Fund
Benchmark Additional Benchmark
Nifty Midcap 100 TRI
Nifty 50 TRI Nifty Midcap 100 TRI
Nifty 50 TRI
1 Year 45.32% 51.38% 32.19% 14,577 15,190 13,249
3 Years 22.46% 20.34% 17.38% 18,376 17,438 16,182
5 Years 18.59% 15.94% 17.04% 23,470 20,957 21,968
7 Years 15.19% 14.46% 11.58% 26,954 25,769 21,558
10 Years 20.64% 17.50% 14.79% 65,386 50,211 39,760
Since Inception (19 April, 2007) 15.89% 14.17% 11.72% 86,440 69,487 50,572
Invesco India Midcap FundPerformancePerformance as on 30 November 2021
23
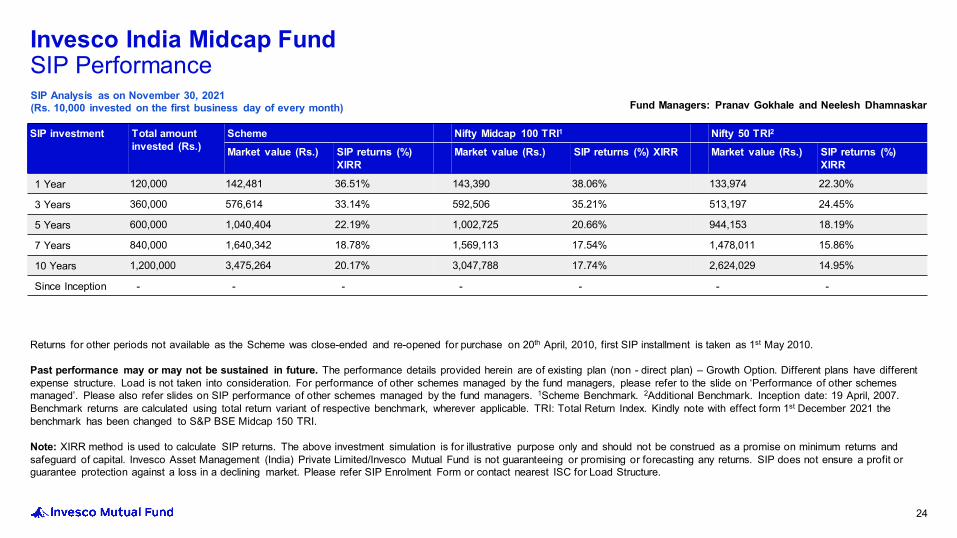
Returns for other periods not available as the Scheme was close-ended and re-opened for purchase on 20th April, 2010, first SIP installment is taken as 1st May 2010.
Past performance may or may not be sustained in future. The performance details provided herein are of existing plan (non - direct plan) – Growth Option. Different plans have differentexpense structure. Load is not taken into consideration. For performance of other schemes managed by the fund managers, please refer to the slide on ‘Performance of other schemes managed’. Please also refer slides on SIP performance of other schemes managed by the fund managers. 1Scheme Benchmark. 2Additional Benchmark. Inception date: 19 April, 2007. Benchmark returns are calculated using total return variant of respective benchmark, wherever applicable. TRI: Total Return Index. Kindly note with effect form 1st December 2021 the benchmark has been changed to S&P BSE Midcap 150 TRI.
Note: XIRR method is used to calculate SIP returns. The above investment simulation is for illustrative purpose only and should not be construed as a promise on minimum returns and safeguard of capital. Invesco Asset Management (India) Private Limited/Invesco Mutual Fund is not guaranteeing or promising or forecasting any returns. SIP does not ensure a profit or guarantee protection against a loss in a declining market. Please refer SIP Enrolment Form or contact nearest ISC for Load Structure.
SIP investment Total amount invested (Rs.)
Scheme Nifty Midcap 100 TRI1 Nifty 50 TRI2
Market value (Rs.) SIP returns (%) XIRR
Market value (Rs.) SIP returns (%) XIRR Market value (Rs.) SIP returns (%) XIRR
1 Year 120,000 142,481 36.51% 143,390 38.06% 133,974 22.30%
3 Years 360,000 576,614 33.14% 592,506 35.21% 513,197 24.45%
5 Years 600,000 1,040,404 22.19% 1,002,725 20.66% 944,153 18.19%
7 Years 840,000 1,640,342 18.78% 1,569,113 17.54% 1,478,011 15.86%
10 Years 1,200,000 3,475,264 20.17% 3,047,788 17.74% 2,624,029 14.95%
Since Inception - - - - - - -
Invesco India Midcap FundSIP PerformanceSIP Analysis as on November 30, 2021(Rs. 10,000 invested on the first business day of every month) Fund Managers: Pranav Gokhale and Neelesh Dhamnaskar
24
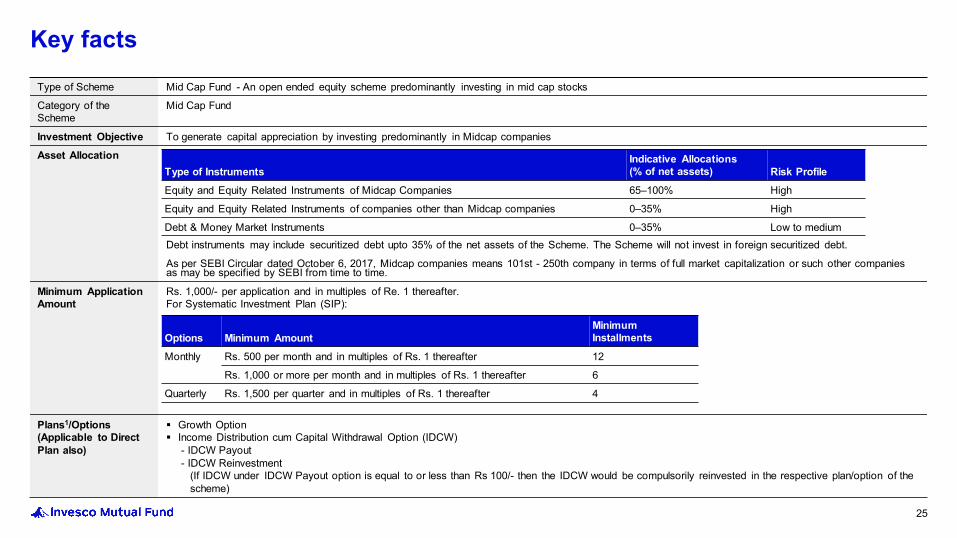
Type of Scheme Mid Cap Fund - An open ended equity scheme predominantly investing in mid cap stocks
Category of the Scheme
Mid Cap Fund
Investment Objective To generate capital appreciation by investing predominantly in Midcap companies
Asset Allocation
Debt instruments may include securitized debt upto 35% of the net assets of the Scheme. The Scheme will not invest in foreign securitized debt.
As per SEBI Circular dated October 6, 2017, Midcap companies means 101st - 250th company in terms of full market capitalization or such other companies as may be specified by SEBI from time to time.
Minimum Application Amount
Rs. 1,000/- per application and in multiples of Re. 1 thereafter. For Systematic Investment Plan (SIP):
Plans1/Options (Applicable to Direct Plan also)
Growth Option Income Distribution cum Capital Withdrawal Option (IDCW)
- IDCW Payout- IDCW Reinvestment
(If IDCW under IDCW Payout option is equal to or less than Rs 100/- then the IDCW would be compulsorily reinvested in the respective plan/option of the scheme)
Key facts
Type of InstrumentsIndicative Allocations (% of net assets) Risk Profile
Equity and Equity Related Instruments of Midcap Companies 65–100% High
Equity and Equity Related Instruments of companies other than Midcap companies 0–35% High
Debt & Money Market Instruments 0–35% Low to medium
Options Minimum AmountMinimum Installments
Monthly Rs. 500 per month and in multiples of Rs. 1 thereafter 12
Rs. 1,000 or more per month and in multiples of Rs. 1 thereafter 6
Quarterly Rs. 1,500 per quarter and in multiples of Rs. 1 thereafter 4
25
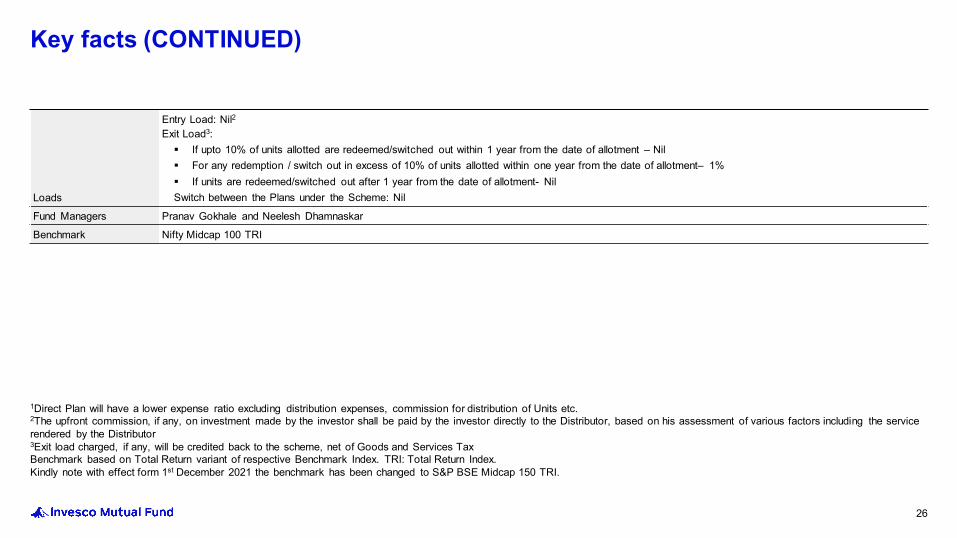
1Direct Plan will have a lower expense ratio excluding distribution expenses, commission for distribution of Units etc.2The upfront commission, if any, on investment made by the investor shall be paid by the investor directly to the Distributor, based on his assessment of various factors including the service rendered by the Distributor3Exit load charged, if any, will be credited back to the scheme, net of Goods and Services TaxBenchmark based on Total Return variant of respective Benchmark Index. TRI: Total Return Index.Kindly note with effect form 1st December 2021 the benchmark has been changed to S&P BSE Midcap 150 TRI.
Loads
Entry Load: Nil2Exit Load3: If upto 10% of units allotted are redeemed/switched out within 1 year from the date of allotment – Nil For any redemption / switch out in excess of 10% of units allotted within one year from the date of allotment– 1% If units are redeemed/switched out after 1 year from the date of allotment- NilSwitch between the Plans under the Scheme: Nil
Fund Managers Pranav Gokhale and Neelesh Dhamnaskar
Benchmark Nifty Midcap 100 TRI
Key facts (CONTINUED)
26
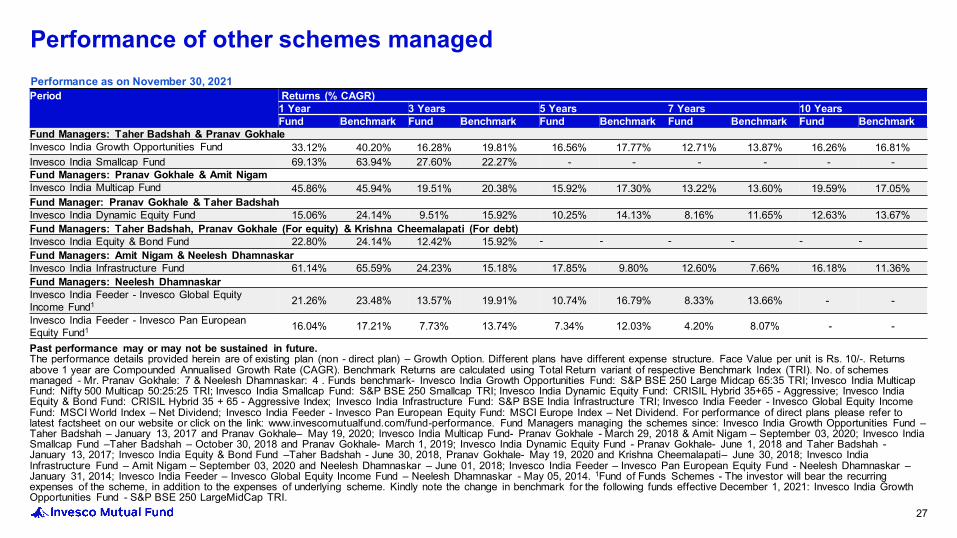
Past performance may or may not be sustained in future.The performance details provided herein are of existing plan (non - direct plan) – Growth Option. Different plans have different expense structure. Face Value per unit is Rs. 10/-. Returns above 1 year are Compounded Annualised Growth Rate (CAGR). Benchmark Returns are calculated using Total Return variant of respective Benchmark Index (TRI). No. of schemes managed - Mr. Pranav Gokhale: 7 & Neelesh Dhamnaskar: 4 . Funds benchmark- Invesco India Growth Opportunities Fund: S&P BSE 250 Large Midcap 65:35 TRI; Invesco India Multicap Fund: Nifty 500 Multicap 50:25:25 TRI; Invesco India Smallcap Fund: S&P BSE 250 Smallcap TRI; Invesco India Dynamic Equity Fund: CRISIL Hybrid 35+65 - Aggressive; Invesco India Equity & Bond Fund: CRISIL Hybrid 35 + 65 - Aggressive Index; Invesco India Infrastructure Fund: S&P BSE India Infrastructure TRI; Invesco India Feeder - Invesco Global Equity Income Fund: MSCI World Index – Net Dividend; Invesco India Feeder - Invesco Pan European Equity Fund: MSCI Europe Index – Net Dividend. For performance of direct plans please refer to latest factsheet on our website or click on the link: www.invescomutualfund.com/fund-performance. Fund Managers managing the schemes since: Invesco India Growth Opportunities Fund –Taher Badshah – January 13, 2017 and Pranav Gokhale– May 19, 2020; Invesco India Multicap Fund- Pranav Gokhale - March 29, 2018 & Amit Nigam – September 03, 2020; Invesco India Smallcap Fund –Taher Badshah – October 30, 2018 and Pranav Gokhale- March 1, 2019; Invesco India Dynamic Equity Fund - Pranav Gokhale- June 1, 2018 and Taher Badshah -January 13, 2017; Invesco India Equity & Bond Fund –Taher Badshah - June 30, 2018, Pranav Gokhale- May 19, 2020 and Krishna Cheemalapati– June 30, 2018; Invesco India Infrastructure Fund – Amit Nigam – September 03, 2020 and Neelesh Dhamnaskar – June 01, 2018; Invesco India Feeder – Invesco Pan European Equity Fund - Neelesh Dhamnaskar –January 31, 2014; Invesco India Feeder – Invesco Global Equity Income Fund – Neelesh Dhamnaskar - May 05, 2014. 1Fund of Funds Schemes - The investor will bear the recurring expenses of the scheme, in addition to the expenses of underlying scheme. Kindly note the change in benchmark for the following funds effective December 1, 2021: Invesco India Growth Opportunities Fund - S&P BSE 250 LargeMidCap TRI.
Period Returns (% CAGR)1 Year 3 Years 5 Years 7 Years 10 YearsFund Benchmark Fund Benchmark Fund Benchmark Fund Benchmark Fund Benchmark
Fund Managers: Taher Badshah & Pranav Gokhale Invesco India Growth Opportunities Fund 33.12% 40.20% 16.28% 19.81% 16.56% 17.77% 12.71% 13.87% 16.26% 16.81%Invesco India Smallcap Fund 69.13% 63.94% 27.60% 22.27% - - - - - -Fund Managers: Pranav Gokhale & Amit NigamInvesco India Multicap Fund 45.86% 45.94% 19.51% 20.38% 15.92% 17.30% 13.22% 13.60% 19.59% 17.05%Fund Manager: Pranav Gokhale & Taher BadshahInvesco India Dynamic Equity Fund 15.06% 24.14% 9.51% 15.92% 10.25% 14.13% 8.16% 11.65% 12.63% 13.67%Fund Managers: Taher Badshah, Pranav Gokhale (For equity) & Krishna Cheemalapati (For debt)Invesco India Equity & Bond Fund 22.80% 24.14% 12.42% 15.92% - - - - - -Fund Managers: Amit Nigam & Neelesh DhamnaskarInvesco India Infrastructure Fund 61.14% 65.59% 24.23% 15.18% 17.85% 9.80% 12.60% 7.66% 16.18% 11.36%Fund Managers: Neelesh DhamnaskarInvesco India Feeder - Invesco Global Equity Income Fund1 21.26% 23.48% 13.57% 19.91% 10.74% 16.79% 8.33% 13.66% - -
Invesco India Feeder - Invesco Pan European Equity Fund1 16.04% 17.21% 7.73% 13.74% 7.34% 12.03% 4.20% 8.07% - -
Performance of other schemes managedPerformance as on November 30, 2021
27
Performance of other schemes managed (Continued)
28
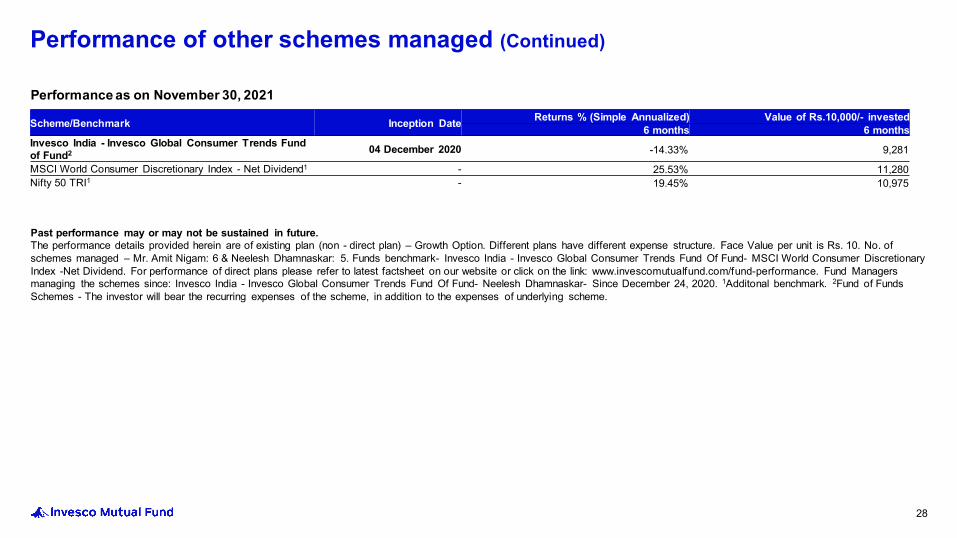
Scheme/Benchmark Inception Date Returns % (Simple Annualized) Value of Rs.10,000/- invested6 months 6 months
Invesco India - Invesco Global Consumer Trends Fund of Fund2 04 December 2020 -14.33% 9,281
MSCI World Consumer Discretionary Index - Net Dividend1 - 25.53% 11,280Nifty 50 TRI1 - 19.45% 10,975
Performance as on November 30, 2021
Past performance may or may not be sustained in future.The performance details provided herein are of existing plan (non - direct plan) – Growth Option. Different plans have different expense structure. Face Value per unit is Rs. 10. No. of schemes managed – Mr. Amit Nigam: 6 & Neelesh Dhamnaskar: 5. Funds benchmark- Invesco India - Invesco Global Consumer Trends Fund Of Fund- MSCI World Consumer Discretionary Index -Net Dividend. For performance of direct plans please refer to latest factsheet on our website or click on the link: www.invescomutualfund.com/fund-performance. Fund Managers managing the schemes since: Invesco India - Invesco Global Consumer Trends Fund Of Fund- Neelesh Dhamnaskar- Since December 24, 2020. 1Additonal benchmark. 2Fund of Funds Schemes - The investor will bear the recurring expenses of the scheme, in addition to the expenses of underlying scheme.
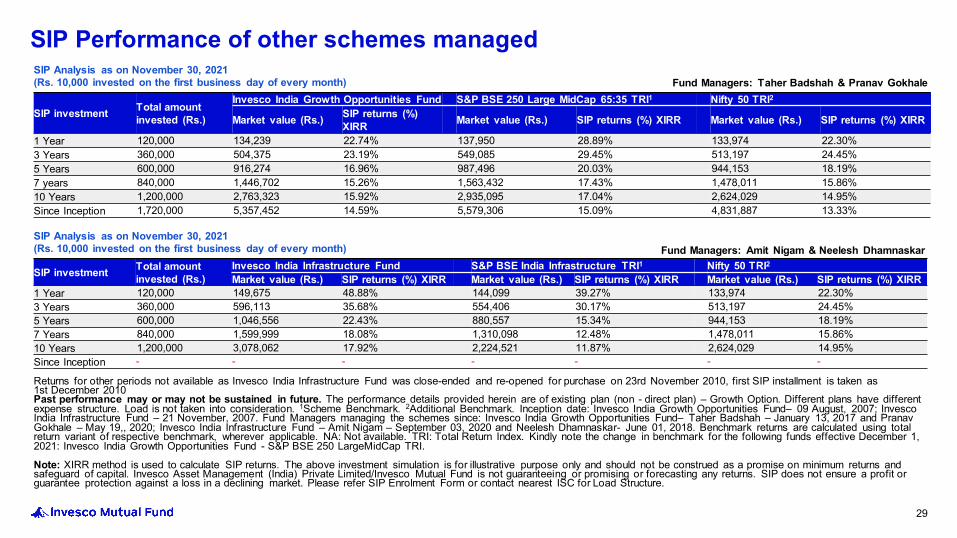
Returns for other periods not available as Invesco India Infrastructure Fund was close-ended and re-opened for purchase on 23rd November 2010, first SIP installment is taken as 1st December 2010Past performance may or may not be sustained in future. The performance details provided herein are of existing plan (non - direct plan) – Growth Option. Different plans have differentexpense structure. Load is not taken into consideration. 1Scheme Benchmark. 2Additional Benchmark. Inception date: Invesco India Growth Opportunities Fund– 09 August, 2007; Invesco India Infrastructure Fund – 21 November, 2007. Fund Managers managing the schemes since: Invesco India Growth Opportunities Fund– Taher Badshah – January 13, 2017 and Pranav Gokhale – May 19,, 2020; Invesco India Infrastructure Fund – Amit Nigam – September 03, 2020 and Neelesh Dhamnaskar- June 01, 2018. Benchmark returns are calculated using total return variant of respective benchmark, wherever applicable. NA: Not available. TRI: Total Return Index. Kindly note the change in benchmark for the following funds effective December 1, 2021: Invesco India Growth Opportunities Fund - S&P BSE 250 LargeMidCap TRI.
Note: XIRR method is used to calculate SIP returns. The above investment simulation is for illustrative purpose only and should not be construed as a promise on minimum returns and safeguard of capital. Invesco Asset Management (India) Private Limited/Invesco Mutual Fund is not guaranteeing or promising or forecasting any returns. SIP does not ensure a profit or guarantee protection against a loss in a declining market. Please refer SIP Enrolment Form or contact nearest ISC for Load Structure.
SIP investment Total amount invested (Rs.)
Invesco India Growth Opportunities Fund S&P BSE 250 Large MidCap 65:35 TRI1 Nifty 50 TRI2
Market value (Rs.) SIP returns (%) XIRR Market value (Rs.) SIP returns (%) XIRR Market value (Rs.) SIP returns (%) XIRR
1 Year 120,000 134,239 22.74% 137,950 28.89% 133,974 22.30%3 Years 360,000 504,375 23.19% 549,085 29.45% 513,197 24.45%5 Years 600,000 916,274 16.96% 987,496 20.03% 944,153 18.19%7 years 840,000 1,446,702 15.26% 1,563,432 17.43% 1,478,011 15.86%10 Years 1,200,000 2,763,323 15.92% 2,935,095 17.04% 2,624,029 14.95%Since Inception 1,720,000 5,357,452 14.59% 5,579,306 15.09% 4,831,887 13.33%
SIP Performance of other schemes managedSIP Analysis as on November 30, 2021(Rs. 10,000 invested on the first business day of every month) Fund Managers: Taher Badshah & Pranav Gokhale
SIP Analysis as on November 30, 2021(Rs. 10,000 invested on the first business day of every month)
SIP investment Total amount invested (Rs.)
Invesco India Infrastructure Fund S&P BSE India Infrastructure TRI1 Nifty 50 TRI2Market value (Rs.) SIP returns (%) XIRR Market value (Rs.) SIP returns (%) XIRR Market value (Rs.) SIP returns (%) XIRR
1 Year 120,000 149,675 48.88% 144,099 39.27% 133,974 22.30%3 Years 360,000 596,113 35.68% 554,406 30.17% 513,197 24.45%5 Years 600,000 1,046,556 22.43% 880,557 15.34% 944,153 18.19%7 Years 840,000 1,599,999 18.08% 1,310,098 12.48% 1,478,011 15.86%10 Years 1,200,000 3,078,062 17.92% 2,224,521 11.87% 2,624,029 14.95%Since Inception - - - - - - -
Fund Managers: Amit Nigam & Neelesh Dhamnaskar
29
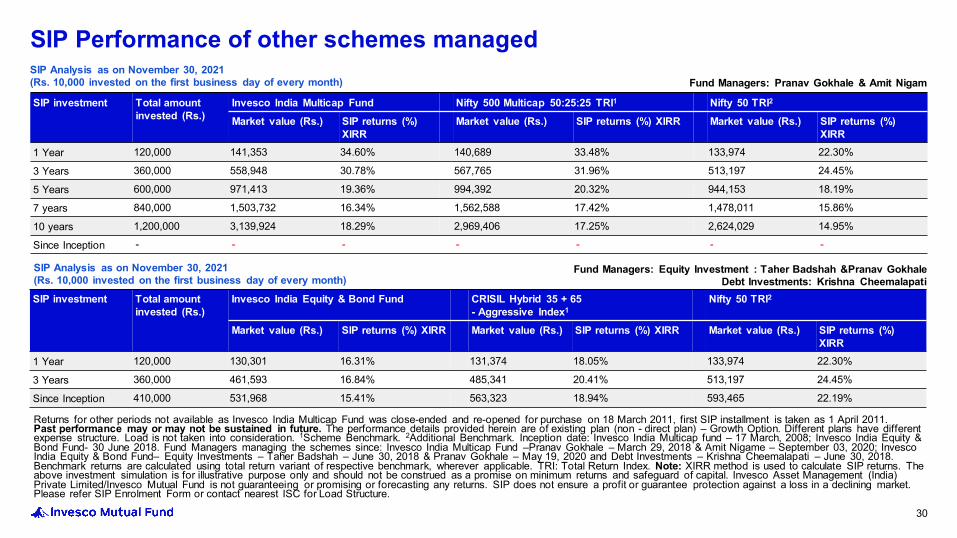
Returns for other periods not available as Invesco India Multicap Fund was close-ended and re-opened for purchase on 18 March 2011, first SIP installment is taken as 1 April 2011.Past performance may or may not be sustained in future. The performance details provided herein are of existing plan (non - direct plan) – Growth Option. Different plans have differentexpense structure. Load is not taken into consideration. 1Scheme Benchmark. 2Additional Benchmark. Inception date: Invesco India Multicap fund – 17 March, 2008; Invesco India Equity & Bond Fund- 30 June 2018. Fund Managers managing the schemes since: Invesco India Multicap Fund –Pranav Gokhale – March 29, 2018 & Amit Nigame – September 03, 2020; Invesco India Equity & Bond Fund– Equity Investments – Taher Badshah – June 30, 2018 & Pranav Gokhale – May 19, 2020 and Debt Investments – Krishna Cheemalapati – June 30, 2018. Benchmark returns are calculated using total return variant of respective benchmark, wherever applicable. TRI: Total Return Index. Note: XIRR method is used to calculate SIP returns. The above investment simulation is for illustrative purpose only and should not be construed as a promise on minimum returns and safeguard of capital. Invesco Asset Management (India) Private Limited/Invesco Mutual Fund is not guaranteeing or promising or forecasting any returns. SIP does not ensure a profit or guarantee protection against a loss in a declining market. Please refer SIP Enrolment Form or contact nearest ISC for Load Structure.
SIP investment Total amount invested (Rs.)
Invesco India Multicap Fund Nifty 500 Multicap 50:25:25 TRI1 Nifty 50 TRI2
Market value (Rs.) SIP returns (%) XIRR
Market value (Rs.) SIP returns (%) XIRR Market value (Rs.) SIP returns (%) XIRR
1 Year 120,000 141,353 34.60% 140,689 33.48% 133,974 22.30%
3 Years 360,000 558,948 30.78% 567,765 31.96% 513,197 24.45%
5 Years 600,000 971,413 19.36% 994,392 20.32% 944,153 18.19%
7 years 840,000 1,503,732 16.34% 1,562,588 17.42% 1,478,011 15.86%
10 years 1,200,000 3,139,924 18.29% 2,969,406 17.25% 2,624,029 14.95%
Since Inception - - - - - - -
SIP Performance of other schemes managedSIP Analysis as on November 30, 2021(Rs. 10,000 invested on the first business day of every month) Fund Managers: Pranav Gokhale & Amit Nigam
SIP Analysis as on November 30, 2021(Rs. 10,000 invested on the first business day of every month)SIP investment Total amount
invested (Rs.)Invesco India Equity & Bond Fund CRISIL Hybrid 35 + 65
- Aggressive Index1Nifty 50 TRI2
Market value (Rs.) SIP returns (%) XIRR Market value (Rs.) SIP returns (%) XIRR Market value (Rs.) SIP returns (%) XIRR
1 Year 120,000 130,301 16.31% 131,374 18.05% 133,974 22.30%
3 Years 360,000 461,593 16.84% 485,341 20.41% 513,197 24.45%
Since Inception 410,000 531,968 15.41% 563,323 18.94% 593,465 22.19%
Fund Managers: Equity Investment : Taher Badshah &Pranav GokhaleDebt Investments: Krishna Cheemalapati
30
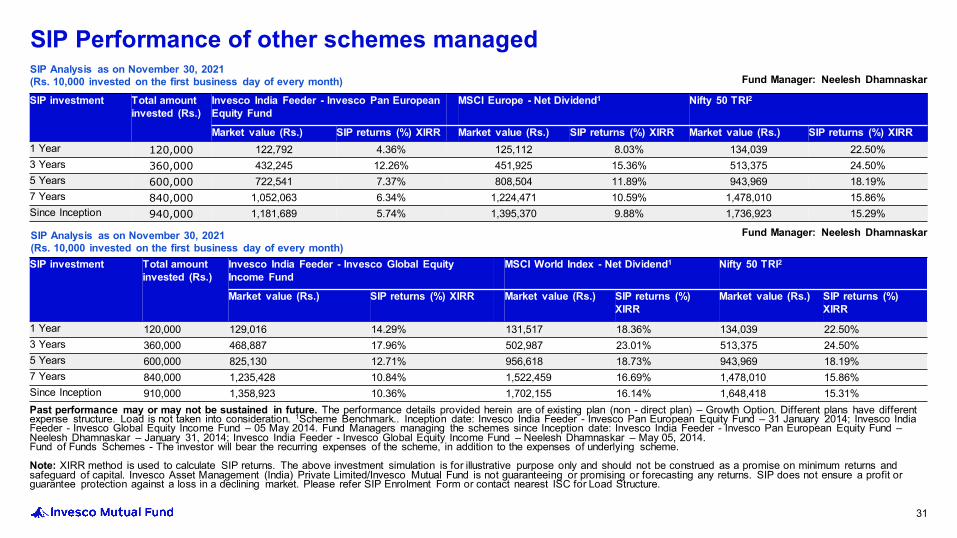
Past performance may or may not be sustained in future. The performance details provided herein are of existing plan (non - direct plan) – Growth Option. Different plans have differentexpense structure. Load is not taken into consideration. 1Scheme Benchmark.. Inception date: Invesco India Feeder - Invesco Pan European Equity Fund – 31 January 2014; Invesco India Feeder - Invesco Global Equity Income Fund – 05 May 2014. Fund Managers managing the schemes since Inception date: Invesco India Feeder - Invesco Pan European Equity Fund –Neelesh Dhamnaskar – January 31, 2014; Invesco India Feeder - Invesco Global Equity Income Fund – Neelesh Dhamnaskar – May 05, 2014. Fund of Funds Schemes - The investor will bear the recurring expenses of the scheme, in addition to the expenses of underlying scheme.
Note: XIRR method is used to calculate SIP returns. The above investment simulation is for illustrative purpose only and should not be construed as a promise on minimum returns and safeguard of capital. Invesco Asset Management (India) Private Limited/Invesco Mutual Fund is not guaranteeing or promising or forecasting any returns. SIP does not ensure a profit or guarantee protection against a loss in a declining market. Please refer SIP Enrolment Form or contact nearest ISC for Load Structure.
SIP investment Total amount invested (Rs.)
Invesco India Feeder - Invesco Pan European Equity Fund
MSCI Europe - Net Dividend1 Nifty 50 TRI2
Market value (Rs.) SIP returns (%) XIRR Market value (Rs.) SIP returns (%) XIRR Market value (Rs.) SIP returns (%) XIRR1 Year 120,000 122,792 4.36% 125,112 8.03% 134,039 22.50%3 Years 360,000 432,245 12.26% 451,925 15.36% 513,375 24.50%5 Years 600,000 722,541 7.37% 808,504 11.89% 943,969 18.19%7 Years 840,000 1,052,063 6.34% 1,224,471 10.59% 1,478,010 15.86%Since Inception 940,000 1,181,689 5.74% 1,395,370 9.88% 1,736,923 15.29%
SIP Performance of other schemes managedSIP Analysis as on November 30, 2021(Rs. 10,000 invested on the first business day of every month) Fund Manager: Neelesh Dhamnaskar
SIP Analysis as on November 30, 2021(Rs. 10,000 invested on the first business day of every month)SIP investment Total amount
invested (Rs.)Invesco India Feeder - Invesco Global Equity Income Fund
MSCI World Index - Net Dividend1 Nifty 50 TRI2
Market value (Rs.) SIP returns (%) XIRR Market value (Rs.) SIP returns (%) XIRR
Market value (Rs.) SIP returns (%) XIRR
1 Year 120,000 129,016 14.29% 131,517 18.36% 134,039 22.50%3 Years 360,000 468,887 17.96% 502,987 23.01% 513,375 24.50%5 Years 600,000 825,130 12.71% 956,618 18.73% 943,969 18.19%7 Years 840,000 1,235,428 10.84% 1,522,459 16.69% 1,478,010 15.86%Since Inception 910,000 1,358,923 10.36% 1,702,155 16.14% 1,648,418 15.31%
Fund Manager: Neelesh Dhamnaskar
31
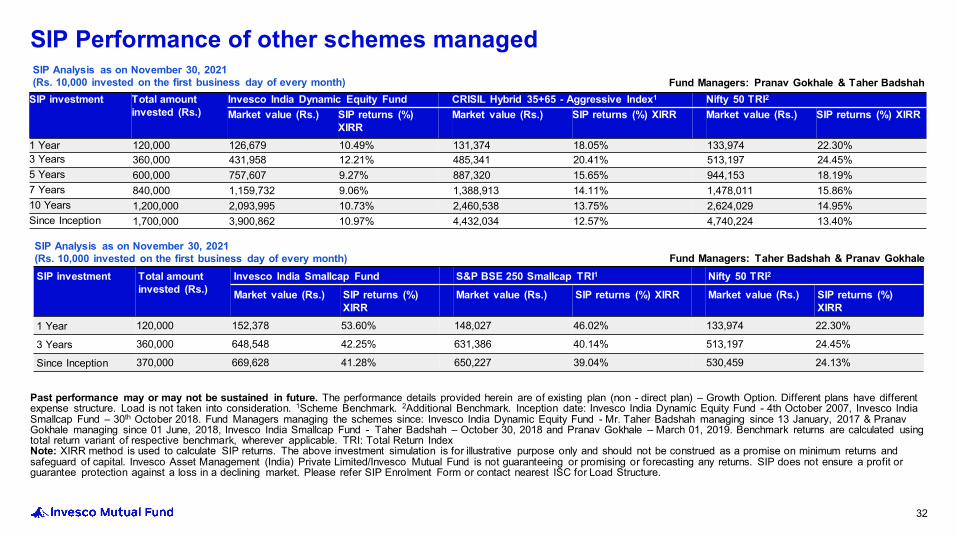
Past performance may or may not be sustained in future. The performance details provided herein are of existing plan (non - direct plan) – Growth Option. Different plans have differentexpense structure. Load is not taken into consideration. 1Scheme Benchmark. 2Additional Benchmark. Inception date: Invesco India Dynamic Equity Fund - 4th October 2007, Invesco India Smallcap Fund – 30th October 2018. Fund Managers managing the schemes since: Invesco India Dynamic Equity Fund - Mr. Taher Badshah managing since 13 January, 2017 & Pranav Gokhale managing since 01 June, 2018, Invesco India Smallcap Fund - Taher Badshah – October 30, 2018 and Pranav Gokhale – March 01, 2019. Benchmark returns are calculated using total return variant of respective benchmark, wherever applicable. TRI: Total Return IndexNote: XIRR method is used to calculate SIP returns. The above investment simulation is for illustrative purpose only and should not be construed as a promise on minimum returns and safeguard of capital. Invesco Asset Management (India) Private Limited/Invesco Mutual Fund is not guaranteeing or promising or forecasting any returns. SIP does not ensure a profit or guarantee protection against a loss in a declining market. Please refer SIP Enrolment Form or contact nearest ISC for Load Structure.
SIP investment Total amount invested (Rs.)
Invesco India Dynamic Equity Fund CRISIL Hybrid 35+65 - Aggressive Index1 Nifty 50 TRI2Market value (Rs.) SIP returns (%)
XIRRMarket value (Rs.) SIP returns (%) XIRR Market value (Rs.) SIP returns (%) XIRR
1 Year 120,000 126,679 10.49% 131,374 18.05% 133,974 22.30%3 Years 360,000 431,958 12.21% 485,341 20.41% 513,197 24.45%5 Years 600,000 757,607 9.27% 887,320 15.65% 944,153 18.19%7 Years 840,000 1,159,732 9.06% 1,388,913 14.11% 1,478,011 15.86%10 Years 1,200,000 2,093,995 10.73% 2,460,538 13.75% 2,624,029 14.95%Since Inception 1,700,000 3,900,862 10.97% 4,432,034 12.57% 4,740,224 13.40%
SIP Performance of other schemes managedFund Managers: Pranav Gokhale & Taher Badshah
SIP Analysis as on November 30, 2021(Rs. 10,000 invested on the first business day of every month)
SIP Analysis as on November 30, 2021(Rs. 10,000 invested on the first business day of every month)SIP investment Total amount
invested (Rs.)Invesco India Smallcap Fund S&P BSE 250 Smallcap TRI1 Nifty 50 TRI2
Market value (Rs.) SIP returns (%) XIRR
Market value (Rs.) SIP returns (%) XIRR Market value (Rs.) SIP returns (%) XIRR
1 Year 120,000 152,378 53.60% 148,027 46.02% 133,974 22.30%
3 Years 360,000 648,548 42.25% 631,386 40.14% 513,197 24.45%
Since Inception 370,000 669,628 41.28% 650,227 39.04% 530,459 24.13%
Fund Managers: Taher Badshah & Pranav Gokhale
32
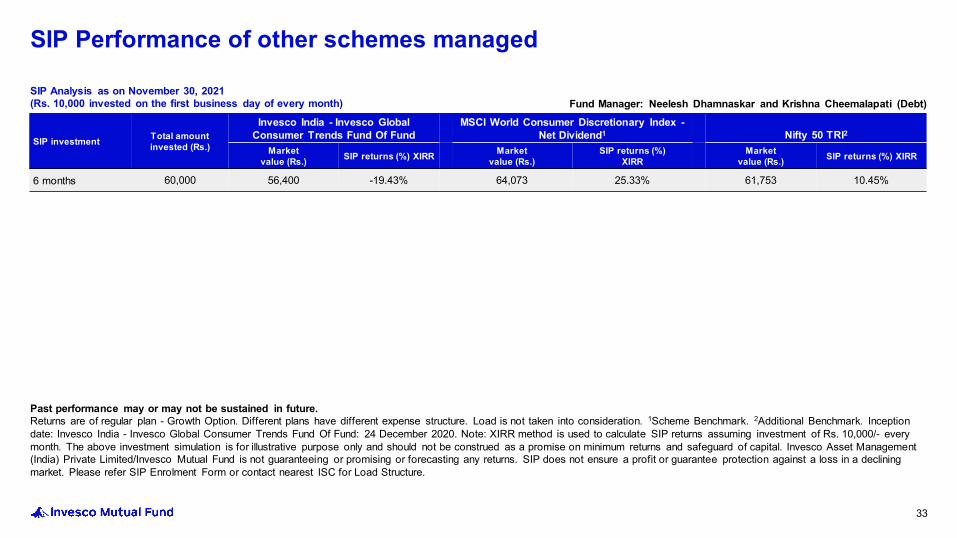
SIP Performance of other schemes managed
33
SIP investment Total amount invested (Rs.)
Invesco India - Invesco Global Consumer Trends Fund Of Fund
MSCI World Consumer Discretionary Index -Net Dividend1 Nifty 50 TRI2
Market value (Rs.) SIP returns (%) XIRR Market
value (Rs.)SIP returns (%)
XIRRMarket
value (Rs.) SIP returns (%) XIRR
6 months 60,000 56,400 -19.43% 64,073 25.33% 61,753 10.45%
Fund Manager: Neelesh Dhamnaskar and Krishna Cheemalapati (Debt)SIP Analysis as on November 30, 2021(Rs. 10,000 invested on the first business day of every month)
Past performance may or may not be sustained in future. Returns are of regular plan - Growth Option. Different plans have different expense structure. Load is not taken into consideration. 1Scheme Benchmark. 2Additional Benchmark. Inception date: Invesco India - Invesco Global Consumer Trends Fund Of Fund: 24 December 2020. Note: XIRR method is used to calculate SIP returns assuming investment of Rs. 10,000/- every month. The above investment simulation is for illustrative purpose only and should not be construed as a promise on minimum returns and safeguard of capital. Invesco Asset Management (India) Private Limited/Invesco Mutual Fund is not guaranteeing or promising or forecasting any returns. SIP does not ensure a profit or guarantee protection against a loss in a declining market. Please refer SIP Enrolment Form or contact nearest ISC for Load Structure.
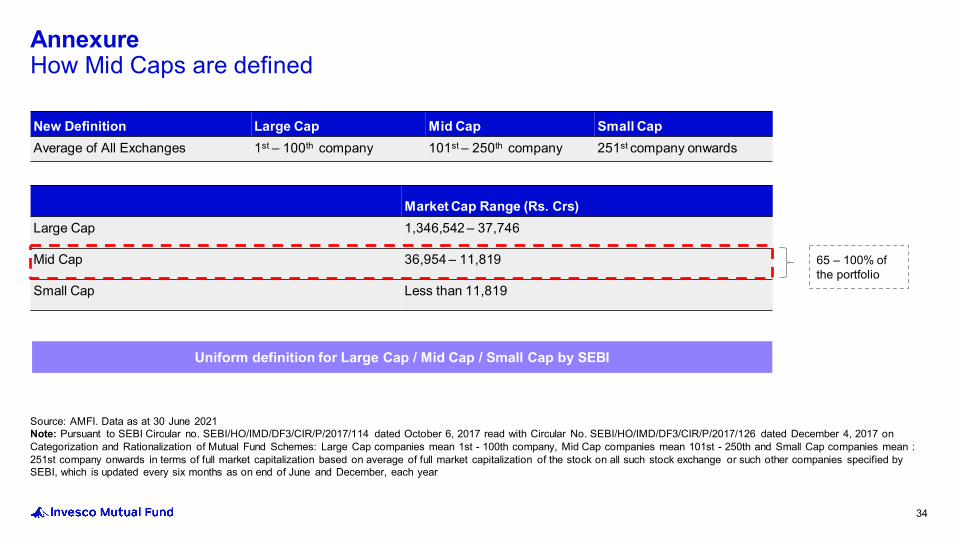
Source: AMFI. Data as at 30 June 2021Note: Pursuant to SEBI Circular no. SEBI/HO/IMD/DF3/CIR/P/2017/114 dated October 6, 2017 read with Circular No. SEBI/HO/IMD/DF3/CIR/P/2017/126 dated December 4, 2017 on Categorization and Rationalization of Mutual Fund Schemes: Large Cap companies mean 1st - 100th company, Mid Cap companies mean 101st - 250th and Small Cap companies mean : 251st company onwards in terms of full market capitalization based on average of full market capitalization of the stock on all such stock exchange or such other companies specified by SEBI, which is updated every six months as on end of June and December, each year
AnnexureHow Mid Caps are defined
New Definition Large Cap Mid Cap Small CapAverage of All Exchanges 1st – 100th company 101st – 250th company 251st company onwards
Uniform definition for Large Cap / Mid Cap / Small Cap by SEBI
Market Cap Range (Rs. Crs)Large Cap 1,346,542 – 37,746
Mid Cap 36,954 – 11,819
Small Cap Less than 11,819
65 – 100% of the portfolio
34
Disclaimer: This presentation is for information purposes only and is not an offer to sell or a solicitation to buy any mutual fund units/securities. The Fund may or may not have any present or future positions in these stocks. This document alone is not sufficient and shouldn’t be used for the development or implementation of an investment strategy. It should not be construed as investment advice to any party. All figures, charts/graphs and data included in this document are as on date and are subject to change without notice. The data used in this document is obtained by Invesco Asset Management (India) Private Limited from the sources which it considers reliable. While utmost care has been exercised while preparing this document, Invesco Asset Management (India) Private Limited does not warrant the completeness or accuracy of the information and disclaims all liabilities, losses and damages arising out of the use of this information. The content of this document is intended solely for the use of the addressee. If you are not the addressee or the person responsible for delivering it to the addressee, any disclosure, copying, distribution or any action taken or omitted to be taken in reliance on it is prohibited and may be unlawful. The recipient(s) before acting on any information herein should make his/their own investigation and seek appropriate professional advice.
Mutual Fund investments are subject to market risks, read all scheme related documents carefully.
Disclaimer
35

Get in touch
Corporate Office:Invesco Asset Management (India) Private Limited2101 A, 21st Floor, A- Wing, Marathon Futurex, N.M. Joshi Marg, Lower Parel, Mumbai – 400 013+91 22 67310000 F +91 22 23019422
To invest:Call 1800-209-0007 ∆ sms ‘Invest’ to 56677Invest Online www.invescomutualfund.com
Copyright © 2022 FDOKUMEN