Zacks Small-Cap Research
11
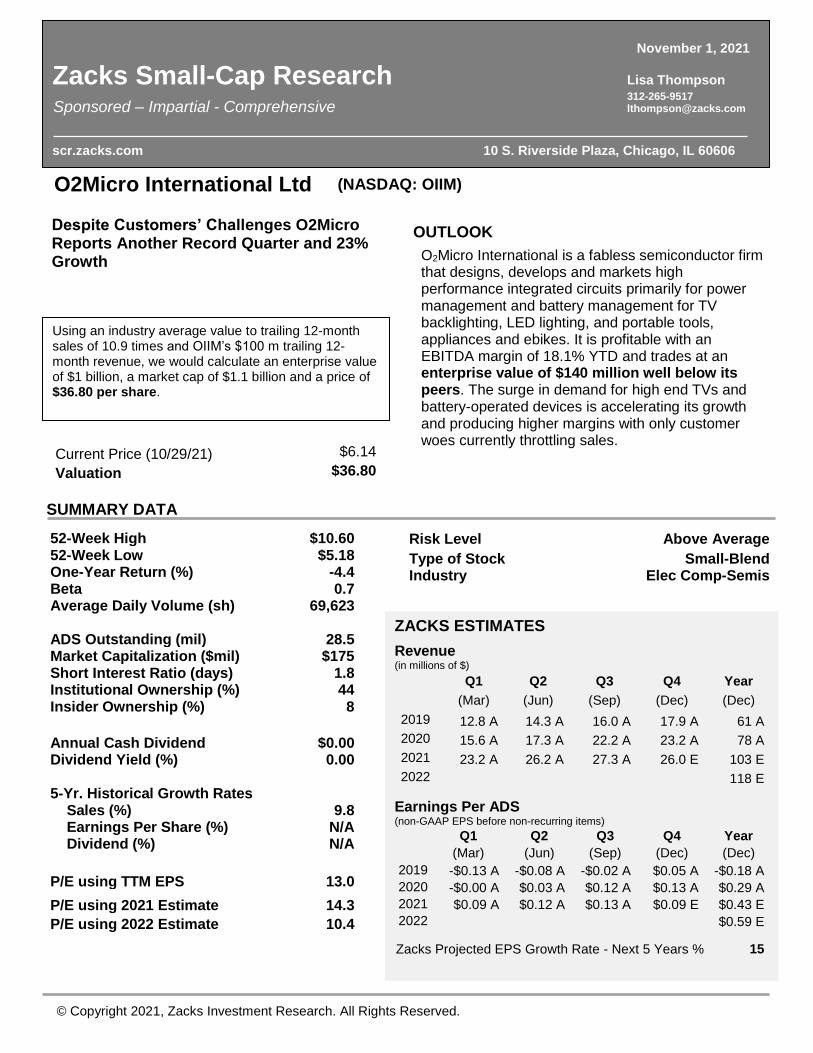
© Copyright 2021, Zacks Investment Research. All Rights Reserved. O2Micro International Ltd (NASDAQ: OIIM) Current Price (10/29/21) $6.14 Valuation $36.80 OUTLOOK SUMMARY DATA Risk Level Above Average Type of Stock Small-Blend Industry Elec Comp-Semis O2Micro International is a fabless semiconductor firm that designs, develops and markets high performance integrated circuits primarily for power management and battery management for TV backlighting, LED lighting, and portable tools, appliances and ebikes. It is profitable with an EBITDA margin of 18.1% YTD and trades at an enterprise value of $140 million well below its peers. The surge in demand for high end TVs and battery-operated devices is accelerating its growth and producing higher margins with only customer woes currently throttling sales. 52-Week High $10.60 52-Week Low $5.18 One-Year Return (%) -4.4 Beta 0.7 Average Daily Volume (sh) 69,623 ADS Outstanding (mil) 28.5 Market Capitalization ($mil) $175 Short Interest Ratio (days) 1.8 Institutional Ownership (%) 44 Insider Ownership (%) 8 Annual Cash Dividend $0.00 Dividend Yield (%) 0.00 5-Yr. Historical Growth Rates Sales (%) 9.8 Earnings Per Share (%) N/A Dividend (%) N/A P/E using TTM EPS 13.0 P/E using 2021 Estimate 14.3 P/E using 2022 Estimate 10.4 ZACKS ESTIMATES Revenue (in millions of $) Q1 Q2 Q3 Q4 Year (Mar) (Jun) (Sep) (Dec) (Dec) 2019 12.8 A 14.3 A 16.0 A 17.9 A 61 A 2020 15.6 A 17.3 A 22.2 A 23.2 A 78 A 2021 23.2 A 26.2 A 27.3 A 26.0 E 103 E 2022 118 E Earnings Per ADS (non-GAAP EPS before non-recurring items) Q1 Q2 Q3 Q4 Year (Mar) (Jun) (Sep) (Dec) (Dec) 2019 -$0.13 A -$0.08 A -$0.02 A $0.05 A -$0.18 A 2020 -$0.00 A $0.03 A $0.12 A $0.13 A $0.29 A 2021 $0.09 A $0.12 A $0.13 A $0.09 E $0.43 E 2022 $0.59 E Zacks Projected EPS Growth Rate - Next 5 Years % 15 Zacks Small-Cap Research Lisa Thompson 312-265-9517 [email protected] scr.zacks.com 10 S. Riverside Plaza, Chicago, IL 60606 November 1, 2021 Despite Customers’ Challenges O2Micro Reports Another Record Quarter and 23% Growth Using an industry average value to trailing 12-month sales of 10.9 times and OIIM’s $100 m trailing 12- month revenue, we would calculate an enterprise value of $1 billion, a market cap of $1.1 billion and a price of $36.80 per share. Sponsored – Impartial - Comprehensive
-
Upload
khangminh22 -
Category
Documents
-
view
2 -
download
0
Transcript of Zacks Small-Cap Research
© Copyright 2021, Zacks Investment Research. All Rights Reserved.
O2Micro International Ltd (NASDAQ: OIIM)
Current Price (10/29/21) $6.14
Valuation $36.80
OUTLOOK
SUMMARY DATA
Risk Level Above Average
Type of Stock Small-Blend Industry Elec Comp-Semis
O2Micro International is a fabless semiconductor firm that designs, develops and markets high performance integrated circuits primarily for power management and battery management for TV backlighting, LED lighting, and portable tools, appliances and ebikes. It is profitable with an EBITDA margin of 18.1% YTD and trades at an enterprise value of $140 million well below its peers. The surge in demand for high end TVs and battery-operated devices is accelerating its growth and producing higher margins with only customer woes currently throttling sales.
52-Week High $10.60 52-Week Low $5.18 One-Year Return (%) -4.4 Beta 0.7 Average Daily Volume (sh) 69,623 ADS Outstanding (mil) 28.5 Market Capitalization ($mil) $175 Short Interest Ratio (days) 1.8 Institutional Ownership (%) 44 Insider Ownership (%) 8
Annual Cash Dividend $0.00 Dividend Yield (%) 0.00 5-Yr. Historical Growth Rates Sales (%) 9.8 Earnings Per Share (%) N/A Dividend (%) N/A
P/E using TTM EPS 13.0
P/E using 2021 Estimate 14.3
P/E using 2022 Estimate 10.4
ZACKS ESTIMATES
Revenue (in millions of $)
Q1 Q2 Q3 Q4 Year
(Mar) (Jun) (Sep) (Dec) (Dec)
2019 12.8 A 14.3 A 16.0 A 17.9 A 61 A
2020 15.6 A 17.3 A 22.2 A 23.2 A 78 A
2021 23.2 A 26.2 A 27.3 A 26.0 E 103 E
2022 118 E
Earnings Per ADS (non-GAAP EPS before non-recurring items)
Q1 Q2 Q3 Q4 Year
(Mar) (Jun) (Sep) (Dec) (Dec)
2019 -$0.13 A -$0.08 A -$0.02 A $0.05 A -$0.18 A
2020 -$0.00 A $0.03 A $0.12 A $0.13 A $0.29 A
2021 $0.09 A $0.12 A $0.13 A $0.09 E $0.43 E
2022 $0.59 E
Zacks Projected EPS Growth Rate - Next 5 Years % 15
Zacks Small-Cap Research Lisa Thompson 312-265-9517 [email protected]
scr.zacks.com 10 S. Riverside Plaza, Chicago, IL 60606
November 1, 2021
Despite Customers’ Challenges O2Micro Reports Another Record Quarter and 23% Growth
Using an industry average value to trailing 12-month sales of 10.9 times and OIIM’s $100 m trailing 12-month revenue, we would calculate an enterprise value of $1 billion, a market cap of $1.1 billion and a price of $36.80 per share.
Sponsored – Impartial - Comprehensive
Sponsored – Impartial - Comprehensive
Zacks Investment Research Page 2 scr.zacks.com
WHAT’S NEW Q3 Revenues Hit Another Record with Growth of 23% and Margin Expansion If nothing else, Q3 results and Q4 projections for O2Micro proves we live in interesting times. This has also led to much lower visibility for the company. Product demand at O2Micro has been hit by a myriad of issues, which has mostly affected its customer base. Like everyone else worldwide, the supply chain has been hit by shortages, delivery problems, and COVID shutdowns. TV demand may have softened at Chinese manufacturers as they lose market share, but in general the issues are supply. This quarter the company was affected by plant shutdowns due to COVID from TV manufacturing customers in Malaysia and Viet Nam. It was also hit by capacity constraints at assembly plants in China that have been affected by a lack of electricity which may have been caused by a lack of coal which may have been caused by poor planning as well as shipping chaos. Despite this partial implementation of Murphy’s Law, O2Micro reported a record quarter. Considering management has no idea when plants in other countries will reopen, coal will show up, or other people’s components will be delivered to its customers, it has given lower sequential guidance as it goes into its seasonally soft fourth quarter which is typically impacted by a slow down in garden and power tool demand. Friday O2Micro announced another quarterly revenue record at $27.3 million. Revenue has now been growing sequentially since Q1 of 2020, all through the pandemic. The company is now solidly profitable with EBITDA at over an 18% margin and this should continue for the foreseeable future as demand for its products outstrips supply. The company continues to invest in capacity to meet this demand by adding testing capabilities and second and third source fabs causing an unusually high level of cap ex this year. The company expects to reap the benefit of that investment in 2022 through higher margins.
For 2022 we are still expecting revenues of $118 million with non GAAP ADSPS of $0.59 resulting in a current 2022 PE of 10.4xs. This company trades at EV/trailing 12-month sales of 1.9 times. Fabless semiconductor peers are trading at 10.9 times EV/12 month trailing sales.
For Q4 2021, O2Micro expects revenues between $25.5 million and $26.5 million or a midpoint of $26.0 million, which would be growth of 12% year over year. Battery management revenues increased approximately 104% in Q2, but were only up 54% in Q3. Sales to TV manufactures were down slightly year over year with certain customer shutdowns.
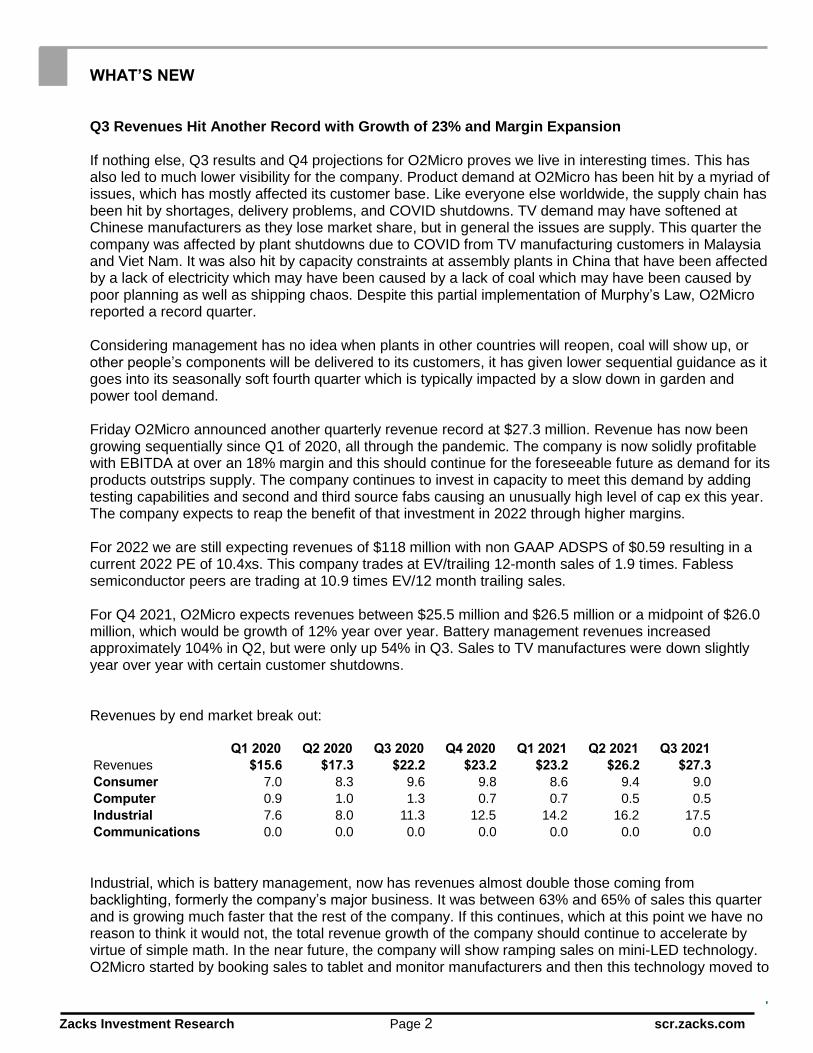
Revenues by end market break out:
Revenues
Consumer
Computer
Industrial
Communications
Q1 2020 Q2 2020 Q3 2020 Q4 2020 Q1 2021
$15.6 $17.3 $22.2 $23.2 $23.2
7.0 8.3 9.6 9.8 8.6
0.9 1.0 1.3 0.7 0.7
7.6 8.0 11.3 12.5 14.2
0.0 0.0 0.0 0.0 0.0
Q2 2021 Q3 2021
$26.2 $27.3
9.4 9.0
0.5 0.5
16.2 17.5
0.0 0.0
Industrial, which is battery management, now has revenues almost double those coming from backlighting, formerly the company’s major business. It was between 63% and 65% of sales this quarter and is growing much faster that the rest of the company. If this continues, which at this point we have no reason to think it would not, the total revenue growth of the company should continue to accelerate by virtue of simple math. In the near future, the company will show ramping sales on mini-LED technology. O2Micro started by booking sales to tablet and monitor manufacturers and then this technology moved to
Zacks Investment Research Page 3 scr.zacks.com
the TV business. Ultimately all monitors and TVs will be built using mini-LEDs. O2Micro is the leader in this and is currently working with Japanese and Korean pioneers on even more designs.
In contrast to Q2, sales to TV manufacturers were down compared to last year, lowering overall growth. If plants reopen in Q4 or early Q1, O2Micro may be able to have a stronger than usual Q1 in 2022 due to catch up. Longer term the company is working with car battery manufactures to enter the EV market. It has not yet worked out what the economics would be but products built for this market would most certainly be at higher ASPs and probably higher margins despite lower unit volumes. The company has invested heavily in R&D over the years. This year’s focus has been to increase capacity by investing in testing equipment and qualifying more fabs to be second and third sources, as the company needs to produce more to meet demand. This quarter it spent $998,000 down (from $3.5 million in Q2) on cap ex which includes expensive wafer starts that produce more volume six to nine months later and testing equipment. In 2022, the company will need to spend much less, which should also increase cash generation and increase operating margins. Q3 Results Revenues were $27.3 million compared with $22.2 million in Q3 2020, up 23%. For Q3, the gross margin was 52.0% compared to 51.8% a year ago and 51.5% in Q2 2021 at the high end of its range. The company said to expect the Q4 2021 gross margin to again be in the range of 50-52%. Reported total operating expenses were $10.6 million in the quarter compared to $8.4 million a year ago and up from $10.2 in Q2 2021. The company went from 370 employees in Q1 to 289 in Q2, 298 in Q3 303 in Q4, 327 in Q1 2021, 341 in Q2 and is now at 344. R&D expense increased to $5.1 million up from $4.1 million in 2020. SG&A was $5.4 million up from $4.3 million in Q3 2020. The company initiated several expansion projects this year, which incurred additional expenses for a few quarters. These include: implementing a ISO26262 SGS quality program, 2nd source foundries qualification tape out, and expanding the packaging and test facilities supply chain to ensure on time delivery. The company expects these investments will lead to higher margins in 2022. Operating income in Q3 was $3.6 million versus $3.1 million last year. Adding back depreciation and amortization ($1.1 million) and stock-based compensation ($443,000,) and adding the rental income, the adjusted EBITDA looks to be $5.3 million (or 19.3%) compared to $4.6 million in Q3 2020. Total other income was $342,000 versus $68,000 last year. Last year included a $171,000 unrealized loss on the company’s holding in Excelliance MOS. In Q4 O2Micro sold all of its remaining shares of Excelliance MOS stock. The company reported a GAAP net income of $3.7 million versus last year’s $2.9 million. This yielded a fully diluted GAAP EPS of $0.12 versus $0.10 a year ago. Non-GAAP income was $4.1 million, versus $3.4 million last year. This yielded a non-GAAP EPS of $0.13, versus $0.12 last year. ADS outstanding were 28.4 million and fully diluted they stood at 31.1 million compared with 28.9 million a year ago, up 7%. Balance Sheet On September 30, 2021, the company had $50.7 million in cash and equivalents (or $1.78 per ADS), up $3.4 million sequentially. Net cash generated by operating activities in the quarter was $4.3 million up from $3.6 million in Q2 2021. Capital expenditures were $998,000 versus $3.5 million in Q2 2021. Depreciation and amortization was $1.1 million yielding EBITDA of $5.3 million or 19.3% of sales.
Zacks Investment Research Page 4 scr.zacks.com
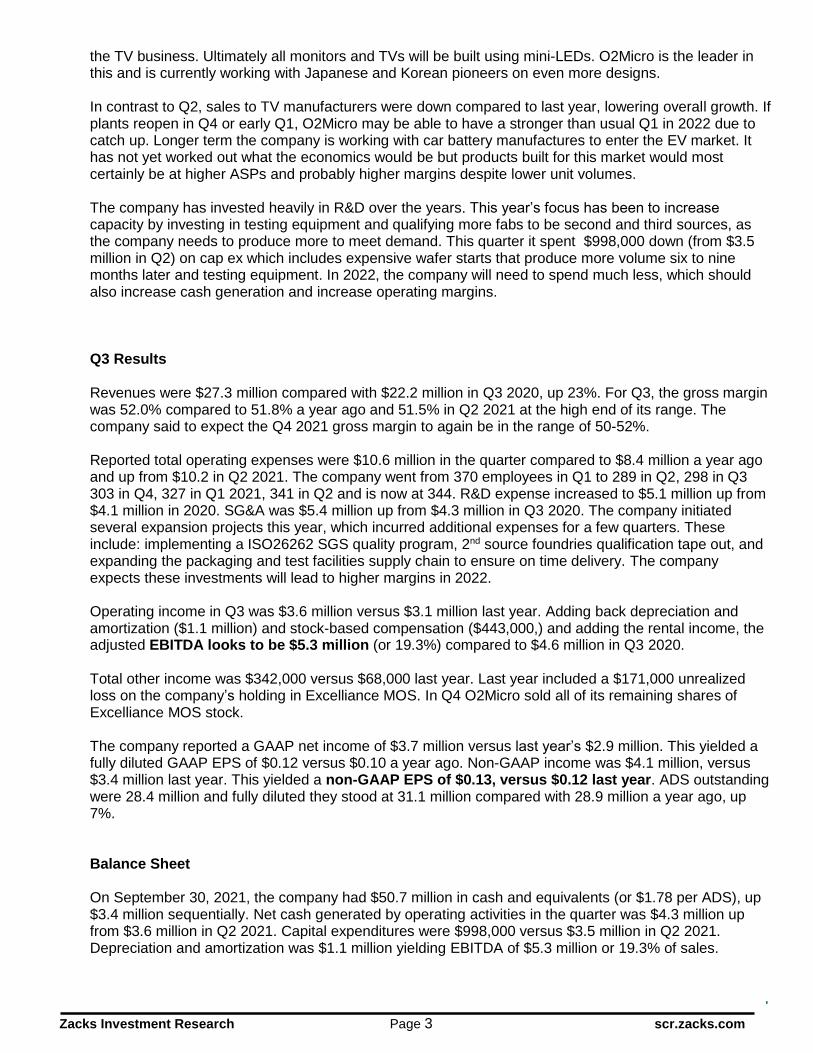
Revenue Percentages By Market
Consumer
Computer
Industrial
Communications
Q1 2020 Q2 2020 Q3 2020 Q4 2020 Q1 2021
44-46 47-49 42-44 41-43 36-38
5-7 5-7 5-7 2-4 2-4
48-50 45-47 50-52 53-55 60-62
0 0 0 0 0
Q2 2021 Q3 2021
35-37 32-34
1-3 1-3
61-63 63-65
0 0
During the quarter O2Micro announced two patent grants: A patent for dual input power management method and system O2Micro was issued 18 claims under Japan Patent No. 6894287 on June 7, 2021. The invention monitors multiple power sources as regulator inputs and prioritizes some power supply input to generate regulator output to power the system. This invention helps prolong battery pack running times by minimizing any unnecessary power dissipation through prioritizing the power source to power the battery pack controller. This technology supports battery control management and increased running times in consumer and industrial applications including electric vehicles, bikes and scooters, uninterruptible power supplies (UPS), solar and wind storage, cordless power tools, cordless vacuum cleaners and other cordless applications for home and commercial markets. A patent for auto-detecting battery cells disconnection utilizing Resistor/Capacitor Circuit (RC) analysis methodology. O2Micro was issued 14 claims under US patent US 11,038,356 B2 on Jun 15, 2021, for the invention of for auto-detecting battery cells disconnection with RC analysis methodology. The invention quickly detects the battery cell disconnection failures in the battery management system, and efficiently avoids the battery failure and hazard situations. This invention provides a reliable and effective solution to perform battery cell tap connection checks by reliably and accurately measuring cell voltages in the battery pack. This is essential to prevent both over-charging and over-discharging and can effectively enhance battery package safety in high power applications such as, electric vehicles, bikes and scooters, uninterruptible power supplies (UPS), solar and wind storage, cordless power tools, cordless vacuum cleaners and other high capacity, high current battery applications for home and industry.
VALUATION
Company Has Significant Upside As Operating Margins Improve The company trades at a fully diluted enterprise value of $140 million and is generating cash. At the end of Q3 2021, the company had $50.7 million (or $1.78 per ADS) in cash and equivalents, no debt, and valuable real estate in China and California. In California it owns a 37,180 square foot building where it has its USA operations, which was bought for $4.6 million in May 2004 and believe it is now easily worth more than $10 million. Plus it also owns other real estate in China and Taiwan. Were we to use the current average enterprise value to trailing twelve-month sales of 10.9 times and apply it to OIIM’s trailing 12-month $100 million revenues, we would calculate an enterprise value of $1.09 billion. Adding to it $50.7 million in cash and equivalents gives us a market cap of $1.14 billion or $36.80 per share using fully diluted shares.
Zacks Investment Research Page 5 scr.zacks.com
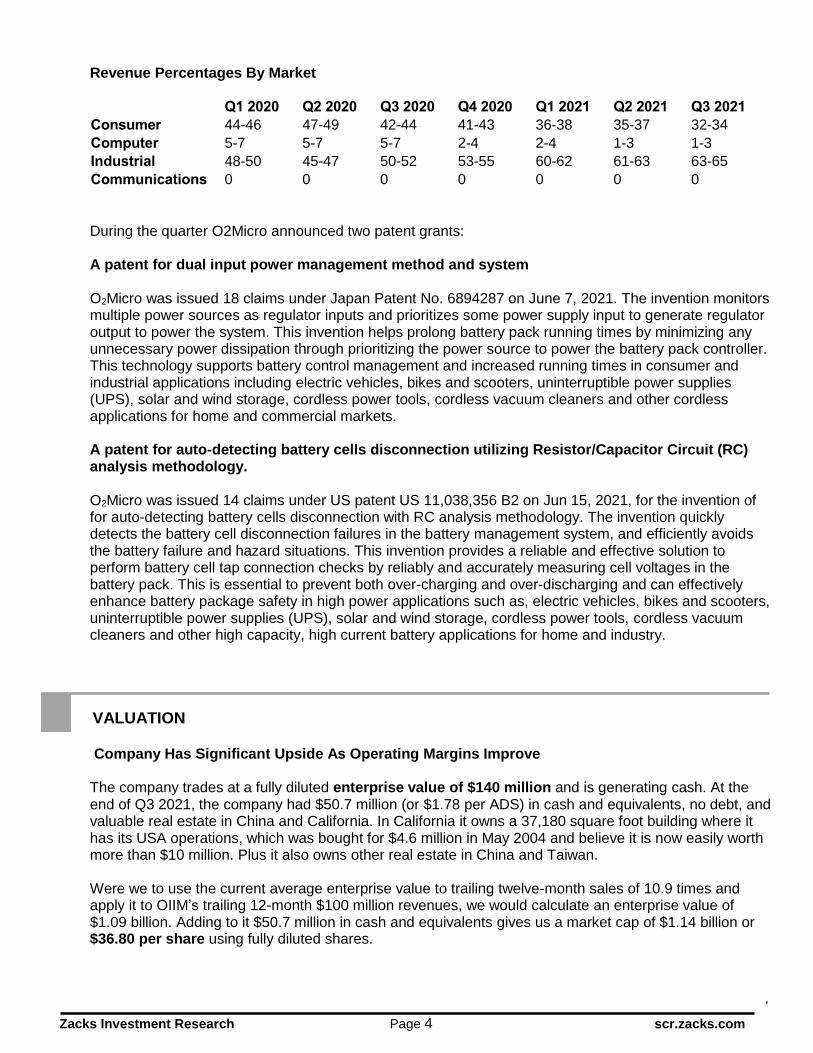
Competitors EV TTM Sales EV/Sales
Monolithic Power Systems MPWR 22,749 1,040 21.9
Microchip Technology MCHP 48,887 5,700 8.6
Texas Instruments TXN 171,103 16,760 10.2
Cirrus Logic CRUS 4,330 1,400 3.1
Average 10.9
As it is now generating profits, we can also look at the stock on a PE basis. It currently trades at 10.4 times 2022 estimated EPS and we expect 39% EPS growth from 2021 to 2022 or a PE to growth of 0.3 times. At only a 20 multiple that is double where it is now. Even on an EBITDA basis it is undervalued. This year it could generate an EBITDA of $18 million. At 10xs EBITDA its market value would be $230 million. Looking at O2 Micro from an M&A prospective we can look at other fabless semiconductor transactions. On August 26th, Analog Devices closed the acquisition of Maxim Integrated Products for an enterprise value of $68 billion. With trailing revenues of $2.63 billion that is a multiple of 25.9 times. On February 8, 2021, Japan’s Renesas Electronics bought Dialog Semiconductor for €4.9 billion ($5.9 billion) in cash. In its last 12 months it generated $1.4 billion in sales making that 4.2 times sales. Last year Dialog bought Adesto for $500 enterprise value when it was expected to report FY2019 sales of $118 million, also at 4.2 times sales. This year, AMD plans to buy Xilinx for $35 billion in stock. In its most recent four quarters is did $3.47 billion in sales making this 10.1 times sales.
In May 2018, Microchip Technology bought Microsemi for $10.15 billion, which was a valuation of 5.5 times its trailing twelve-month revenues of $1.845 billion. Two other comparable companies we had been using, Intersil and Linear Technology, were acquired at very high valuations. Intersil was acquired by Renesas for $3.2 billion at a valuation of 5.9xs the company’s trailing $542.1 million in revenue. Analog Devices acquired linear Technology for $14.8 billion. This was 9.9 times its trailing four quarters of revenue of $1.5 billion.
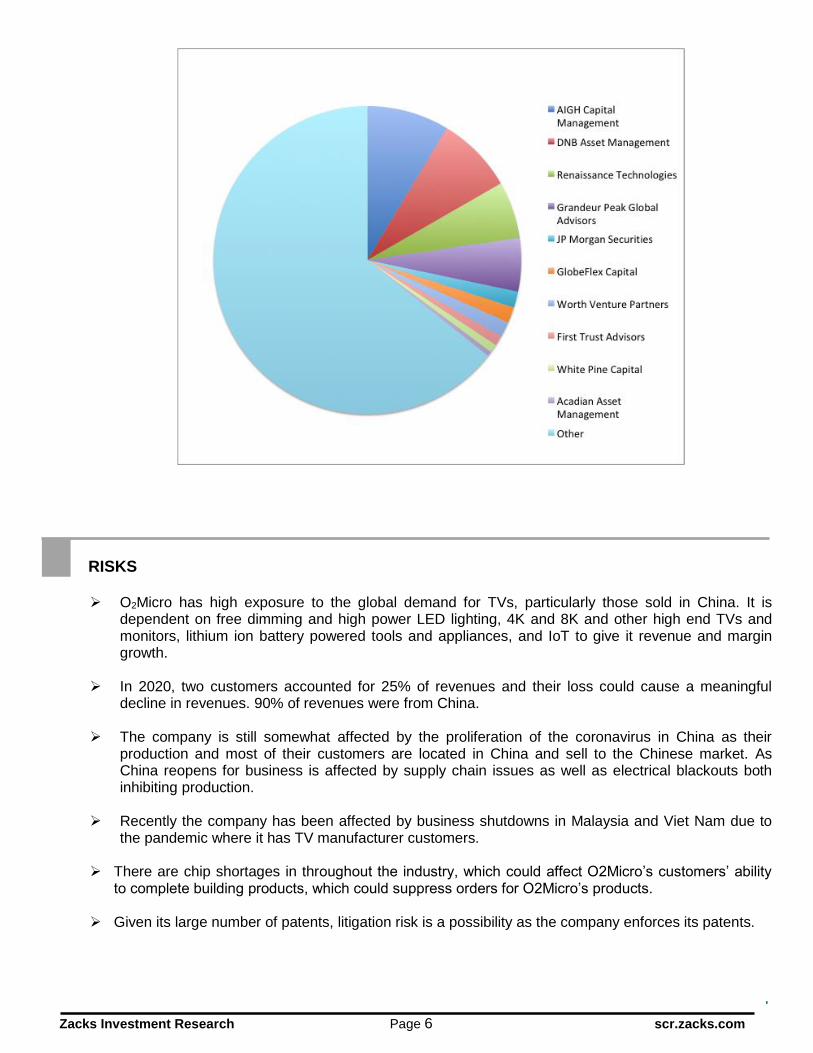
OWNERSHIP As of December 31, 2020, the aggregate number of ordinary shares beneficially owned by directors and management was 269,445,850 (5,388,917 ADS). This number includes options to purchase 94,339,350 ordinary shares (1,886,787 ADS) under the 2005 Share Option Plan and 2015 Share Incentive Plan exercisable within 60 days of December 31, 2020.
Zacks Investment Research Page 6 scr.zacks.com
RISKS
O2Micro has high exposure to the global demand for TVs, particularly those sold in China. It is dependent on free dimming and high power LED lighting, 4K and 8K and other high end TVs and monitors, lithium ion battery powered tools and appliances, and IoT to give it revenue and margin growth.
In 2020, two customers accounted for 25% of revenues and their loss could cause a meaningful decline in revenues. 90% of revenues were from China.
The company is still somewhat affected by the proliferation of the coronavirus in China as their
production and most of their customers are located in China and sell to the Chinese market. As China reopens for business is affected by supply chain issues as well as electrical blackouts both inhibiting production.
Recently the company has been affected by business shutdowns in Malaysia and Viet Nam due to
the pandemic where it has TV manufacturer customers.
There are chip shortages in throughout the industry, which could affect O2Micro’s customers’ ability to complete building products, which could suppress orders for O2Micro’s products.
Given its large number of patents, litigation risk is a possibility as the company enforces its patents.
Zacks Investment Research Page 7 scr.zacks.com
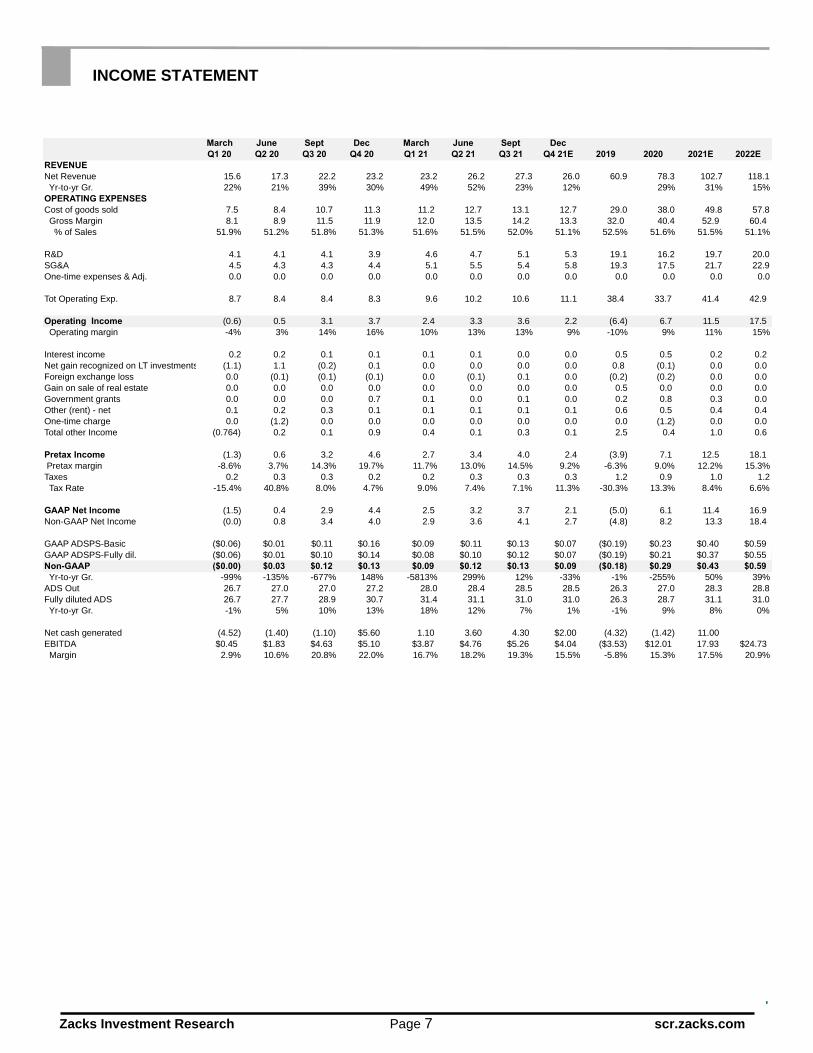
INCOME STATEMENT
REVENUE
Net Revenue
Yr-to-yr Gr.
March June Sept Dec
Q1 20 Q2 20 Q3 20 Q4 20
15.6 17.3 22.2 23.2
22% 21% 39% 30%
March June Sept Dec
Q1 21 Q2 21 Q3 21 Q4 21E 2019 2020
23.2 26.2 27.3 26.0 60.9 78.3
49% 52% 23% 12% 29%
2021E 2022E
102.7 118.1
31% 15%
OPERATING EXPENSES
Cost of goods sold
Gross Margin
% of Sales
R&D
SG&A
One-time expenses & Adj.
Tot Operating Exp.
Operating Income
Operating margin
Interest income
Net gain recognized on LT investments
Foreign exchange loss
Gain on sale of real estate
Government grants
Other (rent) - net
One-time charge
Total other Income
Pretax Income
Pretax margin
Taxes
Tax Rate
GAAP Net Income
Non-GAAP Net Income
GAAP ADSPS-Basic
GAAP ADSPS-Fully dil.
Non-GAAP
Yr-to-yr Gr.
ADS Out
Fully diluted ADS
Yr-to-yr Gr.
Net cash generated
EBITDA
Margin
7.5 8.4 10.7 11.3
8.1 8.9 11.5 11.9
51.9% 51.2% 51.8% 51.3%
4.1 4.1 4.1 3.9
4.5 4.3 4.3 4.4
0.0 0.0 0.0 0.0
8.7 8.4 8.4 8.3
(0.6) 0.5 3.1 3.7
-4% 3% 14% 16%
0.2 0.2 0.1 0.1
(1.1) 1.1 (0.2) 0.1
0.0 (0.1) (0.1) (0.1)
0.0 0.0 0.0 0.0
0.0 0.0 0.0 0.7
0.1 0.2 0.3 0.1
0.0 (1.2) 0.0 0.0
(0.764) 0.2 0.1 0.9
(1.3) 0.6 3.2 4.6
-8.6% 3.7% 14.3% 19.7%
0.2 0.3 0.3 0.2
-15.4% 40.8% 8.0% 4.7%
(1.5) 0.4 2.9 4.4
(0.0) 0.8 3.4 4.0
($0.06) $0.01 $0.11 $0.16
($0.06) $0.01 $0.10 $0.14
($0.00) $0.03 $0.12 $0.13
-99% -135% -677% 148%
26.7 27.0 27.0 27.2
26.7 27.7 28.9 30.7
-1% 5% 10% 13%
(4.52) (1.40) (1.10) $5.60
$0.45 $1.83 $4.63 $5.10
2.9% 10.6% 20.8% 22.0%
11.2 12.7 13.1 12.7 29.0 38.0
12.0 13.5 14.2 13.3 32.0 40.4
51.6% 51.5% 52.0% 51.1% 52.5% 51.6%
4.6 4.7 5.1 5.3 19.1 16.2
5.1 5.5 5.4 5.8 19.3 17.5
0.0 0.0 0.0 0.0 0.0 0.0
9.6 10.2 10.6 11.1 38.4 33.7
2.4 3.3 3.6 2.2 (6.4) 6.7
10% 13% 13% 9% -10% 9%
0.1 0.1 0.0 0.0 0.5 0.5
0.0 0.0 0.0 0.0 0.8 (0.1)
0.0 (0.1) 0.1 0.0 (0.2) (0.2)
0.0 0.0 0.0 0.0 0.5 0.0
0.1 0.0 0.1 0.0 0.2 0.8
0.1 0.1 0.1 0.1 0.6 0.5
0.0 0.0 0.0 0.0 0.0 (1.2)
0.4 0.1 0.3 0.1 2.5 0.4
2.7 3.4 4.0 2.4 (3.9) 7.1
11.7% 13.0% 14.5% 9.2% -6.3% 9.0%
0.2 0.3 0.3 0.3 1.2 0.9
9.0% 7.4% 7.1% 11.3% -30.3% 13.3%
2.5 3.2 3.7 2.1 (5.0) 6.1
2.9 3.6 4.1 2.7 (4.8) 8.2
$0.09 $0.11 $0.13 $0.07 ($0.19) $0.23
$0.08 $0.10 $0.12 $0.07 ($0.19) $0.21
$0.09 $0.12 $0.13 $0.09 ($0.18) $0.29
-5813% 299% 12% -33% -1% -255%
28.0 28.4 28.5 28.5 26.3 27.0
31.4 31.1 31.0 31.0 26.3 28.7
18% 12% 7% 1% -1% 9%
1.10 3.60 4.30 $2.00 (4.32) (1.42)
$3.87 $4.76 $5.26 $4.04 ($3.53) $12.01
16.7% 18.2% 19.3% 15.5% -5.8% 15.3%
49.8 57.8
52.9 60.4
51.5% 51.1%
19.7 20.0
21.7 22.9
0.0 0.0
41.4 42.9
11.5 17.5
11% 15%
0.2 0.2
0.0 0.0
0.0 0.0
0.0 0.0
0.3 0.0
0.4 0.4
0.0 0.0
1.0 0.6
12.5 18.1
12.2% 15.3%
1.0 1.2
8.4% 6.6%
11.4 16.9
13.3 18.4
$0.40 $0.59
$0.37 $0.55
$0.43 $0.59
50% 39%
28.3 28.8
31.1 31.0
8% 0%
11.00
17.93 $24.73
17.5% 20.9%
Zacks Investment Research Page 8 scr.zacks.com
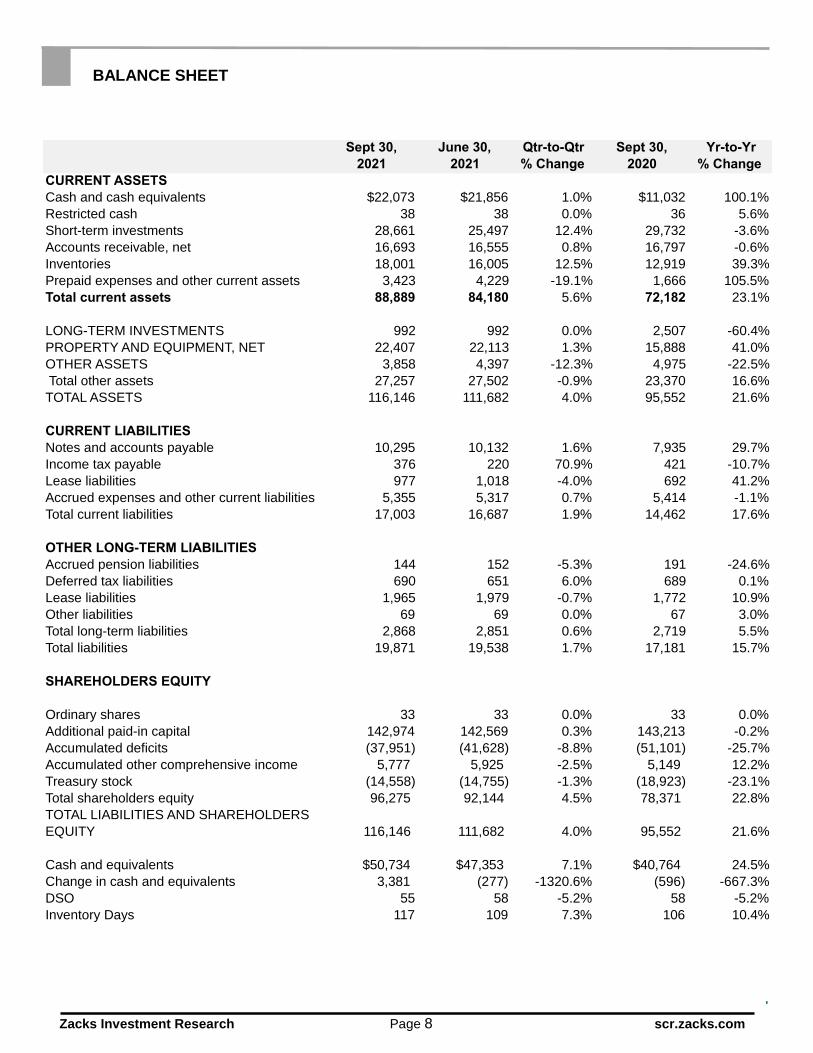
BALANCE SHEET
Sept 30, June 30, Qtr-to-Qtr
2021 2021 % Change
CURRENT ASSETS
Cash and cash equivalents $22,073 $21,856 1.0%
Restricted cash 38 38 0.0%
Short-term investments 28,661 25,497 12.4%
Accounts receivable, net 16,693 16,555 0.8%
Inventories 18,001 16,005 12.5%
Prepaid expenses and other current assets 3,423 4,229 -19.1%
Sept 30, Yr-to-Yr
2020 % Change
$11,032 100.1%
36 5.6%
29,732 -3.6%
16,797 -0.6%
12,919 39.3%
1,666 105.5%
Total current assets 88,889 84,180 5.6%
LONG-TERM INVESTMENTS 992 992 0.0%
PROPERTY AND EQUIPMENT, NET 22,407 22,113 1.3%
OTHER ASSETS 3,858 4,397 -12.3%
72,182 23.1%
2,507 -60.4%
15,888 41.0%
4,975 -22.5%
Total other assets 27,257 27,502 -0.9%
TOTAL ASSETS 116,146 111,682 4.0%
CURRENT LIABILITIES
Notes and accounts payable 10,295 10,132 1.6%
Income tax payable 376 220 70.9%
Lease liabilities 977 1,018 -4.0%
23,370 16.6%
95,552 21.6%
7,935 29.7%
421 -10.7%
692 41.2%
Accrued expenses and other current liabilities 5,355 5,317 0.7%
Total current liabilities 17,003 16,687 1.9%
OTHER LONG-TERM LIABILITIES
Accrued pension liabilities 144 152 -5.3%
Deferred tax liabilities 690 651 6.0%
Lease liabilities 1,965 1,979 -0.7%
Other liabilities 69 69 0.0%
Total long-term liabilities 2,868 2,851 0.6%
Total liabilities 19,871 19,538 1.7%
SHAREHOLDERS EQUITY
Ordinary shares 33 33 0.0%
Additional paid-in capital 142,974 142,569 0.3%
Accumulated deficits (37,951) (41,628) -8.8%
Accumulated other comprehensive income 5,777 5,925 -2.5%
Treasury stock (14,558) (14,755) -1.3%
Total shareholders equity 96,275 92,144 4.5%
TOTAL LIABILITIES AND SHAREHOLDERS
EQUITY 116,146 111,682 4.0%
Cash and equivalents $50,734 $47,353 7.1%
5,414 -1.1%
14,462 17.6%
191 -24.6%
689 0.1%
1,772 10.9%
67 3.0%
2,719 5.5%
17,181 15.7%
33 0.0%
143,213 -0.2%
(51,101) -25.7%
5,149 12.2%
(18,923) -23.1%
78,371 22.8%
95,552 21.6%
$40,764 24.5%
Change in cash and equivalents 3,381 (277) -1320.6% (596) -667.3%
DSO 55 58 -5.2%
Inventory Days 117 109 7.3%
58 -5.2%
106 10.4%
Zacks Investment Research Page 9 scr.zacks.com
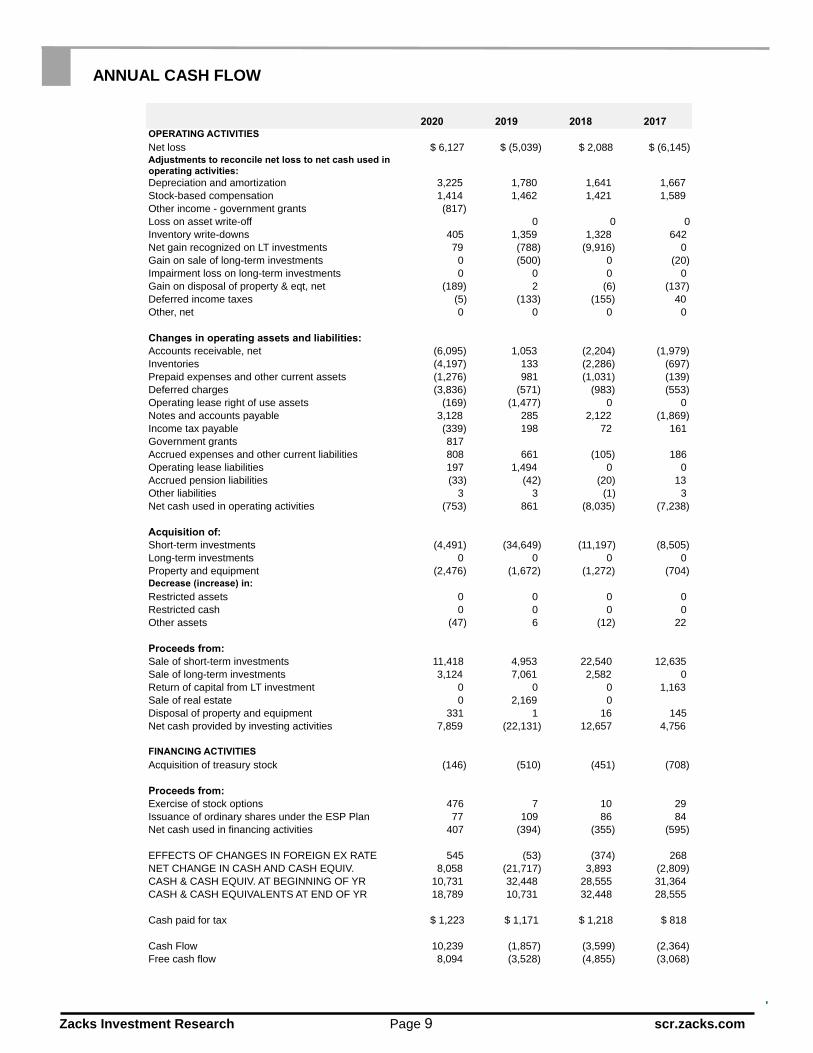
ANNUAL CASH FLOW
2020 2019 2018 2017OPERATING ACTIVITIES
Net loss $ 6,127 $ (5,039) $ 2,088 $ (6,145)Adjustments to reconcile net loss to net cash used in
operating activities:
Depreciation and amortization 3,225 1,780 1,641 1,667
Stock-based compensation 1,414 1,462 1,421 1,589
Other income - government grants (817)
Loss on asset write-off 0 0 0
Inventory write-downs 405 1,359 1,328 642
Net gain recognized on LT investments 79 (788) (9,916) 0
Gain on sale of long-term investments 0 (500) 0 (20)
Impairment loss on long-term investments 0 0 0 0
Gain on disposal of property & eqt, net (189) 2 (6) (137)
Deferred income taxes (5) (133) (155) 40
Other, net 0 0 0 0
Changes in operating assets and liabilities:
Accounts receivable, net (6,095) 1,053 (2,204) (1,979)
Inventories (4,197) 133 (2,286) (697)
Prepaid expenses and other current assets (1,276) 981 (1,031) (139)
Deferred charges (3,836) (571) (983) (553)
Operating lease right of use assets (169) (1,477) 0 0
Notes and accounts payable 3,128 285 2,122 (1,869)
Income tax payable (339) 198 72 161
Government grants 817
Accrued expenses and other current liabilities 808 661 (105) 186
Operating lease liabilities 197 1,494 0 0
Accrued pension liabilities (33) (42) (20) 13
Other liabilities 3 3 (1) 3
Net cash used in operating activities (753) 861 (8,035) (7,238)
Acquisition of:
Short-term investments (4,491) (34,649) (11,197) (8,505)
Long-term investments 0 0 0 0
Property and equipment (2,476) (1,672) (1,272) (704)Decrease (increase) in:
Restricted assets 0 0 0 0
Restricted cash 0 0 0 0
Other assets (47) 6 (12) 22
Proceeds from:
Sale of short-term investments 11,418 4,953 22,540 12,635
Sale of long-term investments 3,124 7,061 2,582 0
Return of capital from LT investment 0 0 0 1,163
Sale of real estate 0 2,169 0
Disposal of property and equipment 331 1 16 145
Net cash provided by investing activities 7,859 (22,131) 12,657 4,756
FINANCING ACTIVITIES
Acquisition of treasury stock (146) (510) (451) (708)
Proceeds from:
Exercise of stock options 476 7 10 29
Issuance of ordinary shares under the ESP Plan 77 109 86 84
Net cash used in financing activities 407 (394) (355) (595)
EFFECTS OF CHANGES IN FOREIGN EX RATE 545 (53) (374) 268
NET CHANGE IN CASH AND CASH EQUIV. 8,058 (21,717) 3,893 (2,809)
CASH & CASH EQUIV. AT BEGINNING OF YR 10,731 32,448 28,555 31,364
CASH & CASH EQUIVALENTS AT END OF YR 18,789 10,731 32,448 28,555
Cash paid for tax $ 1,223 $ 1,171 $ 1,218 $ 818
Cash Flow 10,239 (1,857) (3,599) (2,364)
Free cash flow 8,094 (3,528) (4,855) (3,068)
Zacks Investment Research Page 10 scr.zacks.com
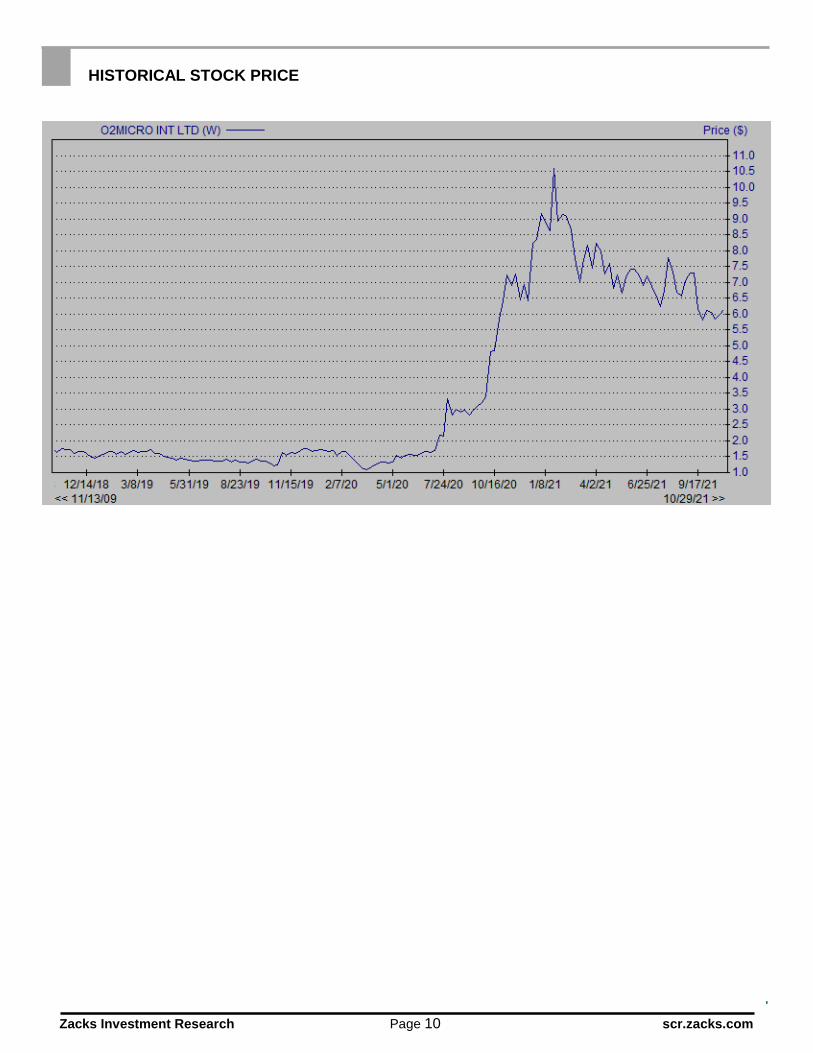
HISTORICAL STOCK PRICE
Zacks Investment Research Page 11 scr.zacks.com
DISCLOSURES
The following disclosures relate to relationships between Zacks Small-Cap Research (Zacks SCR), a division of Zacks Investment Research (ZIR), and the issuers covered by the Zacks SCR Analysts in the Small-Cap Universe. ANALYST DISCLOSURES Zacks SCR Analysts hereby certify that the view expressed in this research report or blog article accurately reflect the personal views of the analyst about the subject securities and issuers. Zacks SCR also certifies that no part of any analysts’ compensation was, is, or will be, directly or indirectly, related to the recommendations or views expressed in this research report or blog article. Zacks SCR believes the information used for the creation of this report or blog article has been obtained from sources considered reliable, but we can neither guarantee nor represent the completeness or accuracy of the information herewith. Such information and the opinions expressed are subject to change without notice. The Zacks SCR Twitter is covered herein by this disclosure. INVESTMENT BANKING AND FEES FOR SERVICE Zacks SCR does not provide investment banking services nor has it received compensation for investment banking services from the issuers of the securities covered in this report or article. Zacks SCR has received compensation from the issuer directly, from an investment manager, or from an investor relations consulting firm engaged by the issuer for providing non-investment banking services to this issuer and expects to receive additional compensation for such noninvestment banking services provided to this issuer. The non-investment banking services provided to the issuer include the preparation of this report, investor relations services, investment software, financial database analysis, organization of non-deal road shows, and attendance fees for conferences sponsored or co-sponsored by Zacks SCR. Each issuer has entered into an agreement with Zacks to provide continuous independent research for a period of no less than one year in consideration of quarterly payments totaling a maximum fee of $40,000 annually. POLICY DISCLOSURES This report provides an objective valuation of the issuer today and expected valuations of the issuer at various future dates based on applying standard investment valuation methodologies to the revenue and EPS forecasts made by the SCR Analyst of the issuer’s business. SCR Analysts are restricted from holding or trading securities in the issuers that they cover. ZIR and Zacks SCR do not make a market in any security followed by SCR nor do they act as dealers in these securities. Each Zacks SCR Analyst has full discretion over the Valuation of the issuer included in this report based on his or her own due diligence. SCR Analysts are paid based on the number of companies they cover. SCR Analyst compensation is not, was not, nor will be, directly or indirectly, related to the specific valuations or views expressed in any report or article. ADDITIONAL INFORMATION Additional information is available upon request. Zacks SCR reports and articles are based on data obtained from sources that it believes to be reliable, but are not guaranteed to be accurate nor do they purport to be complete. Because of individual financial or investment objectives and/or financial circumstances, this report or article should not be construed as advice designed to meet the particular investment needs of any investor. Investing involves risk. Any opinions expressed by Zacks SCR Analysts are subject to change without notice. Reports or articles or Tweets are not to be construed as an offer or solicitation of an offer to buy or sell the securities herein mentioned. CANADIAN COVERAGE This research report is a product of Zacks SCR and prepared by a research analyst who is employed by or is a consultant to Zacks SCR. The research analyst preparing the research report is resident outside of Canada, and is not an associated person of any Canadian registered adviser and/or dealer. Therefore, the analyst is not subject to supervision by a Canadian registered adviser and/or dealer, and is not required to satisfy the regulatory licensing requirements of any Canadian provincial securities regulators, the Investment Industry Regulatory Organization of Canada and is not required to otherwise comply with Canadian rules or regulations.