Small Ruminant Research and Development in Africa
332
Small Ruminant Research and Development in Africa Proceedings of the Third Biennial Conference of the African Small Ruminant Research Network UICC, Kampala, Uganda 5-9 December 1994 OCx - 3 S International Livestoclc Research Institute Nairobi, Kenya
-
Upload
khangminh22 -
Category
Documents
-
view
0 -
download
0
Transcript of Small Ruminant Research and Development in Africa

Small Ruminant Research
and Development
in Africa
Proceedings ofthe Third
Biennial Conference ofthe African
Small Ruminant Research Network
UICC, Kampala,Uganda
5-9 December 1994
OCx
-
3
S
International Livestoclc Research Institute
Nairobi, Kenya


Small Ruminant Research
and Development
in Africa
Proceedings oftheThird
BiennialConference ofthe African
Small Ruminant Research Network
UICC, Kampala,Uganda
5-9 December 1994
Edited by
S.H.B. Lebbie
and
E. Kagwini
July 1996
International Livestock Research Institute [ILRI]
PO, Box30709
Nairobi, Kenya

|SBN92-9146-011-7
Correct citation: Lebbie S.H.B. and Kagwini E. 1996. Small Ruminant Research and Development in Africa.
Proceedings of the Third Biennial Conference ofthe African Small Ruminant Research Network,
UICC, Kampala, Uganda, 5-9December 1994. ILRI(International Livestock Research Institute)
Nairobi, Kenya.326pp.

Abstract
Thisvolume contains papers and abstracts oftheThird BiennialConference ofthe AfricanSmallRuminant
Research Network. In addition to the keynote address, there are nine papers on Genetic Resources
Enhancement and Utilisation, seven papers on Production Systems,Policy and Economics, sixpapers on
Management and Health, 12papers on Feeding and FeedingSystems and 10papers on Performance and
Reproduction.Sixposter abstracts coveringthe above topics addtothevolume.
Keywords
/Sheep//goats//small ruminant production systems/productivity/economics/policy/weaning practices/
/agropastoral//pastoral/production constraints/feeds/feed resources//feeding systems//digestibility/
/nutrition//supplementation/diet//reproduction/reproductive wastage//performance evaluation/health/
/peste des petits ruminants//infectious diseases/vaccines/breeds/breeding systems/breed improvement/
/Africa/
Résumé
Le présentvolume rassemble les exposés et les résumés des articlesprésentésà latroisième Conférence
biennale duRéseaude recherche sur les petits ruminants. Outre le discours liminaire, il contientun total de
44 communications dont neufsur l'amélioration et l'utilisation des ressources génétiques, sept sur les
systèmes deproduction, l'économie et lespolitiques, six sur lagestion et la santé, 12sur l'alimentation et
les systèmes d'alimentation et 10sur lesperformances et la reproduction.A quoi il convient d'ajouter six
séries d'affichesprésentées à cette conférence sur l'ensemble des sujets énumérés ci-dessus.
Mots clés
/Ovins/caprins/systèmes de production des petits ruminants/productivité/économie/politiques/
/modes de sevrage/agropastoral/pastoral/obstacles à la production/aliments du bétail/ressources
alimentaires/systèmes d'alimentation/disgestibilité/nutrition/complémentation/ration/reproduction/
/pertes en reproduction/évaluation des performances/santé/peste des petits ruminants/maladies
infectieuses/vaccins/races/systèmesd'élevage/améliorationgénétique/Afrique/
Small RuminantResearch NetworkWorkshop iii


Table ofContents
Preface .............................................................................. ix
Keynote address ....................................................................... 1
Opening address ....................................................................... 5
Allocution d'ouverture .................................................................. 7
SESSION1.GENETICRESOURCESENHANCEMENTANDUTILISATION
Biotechnology optionsforimprovinglivestock production in developingcountries,with special
referencetosub-Saharan Africa
J.E.O. Rege .................................................................... 11
Influence de la sélection dupoidsdu béliersur la croissance de la descendance
C.V. Yapi-Gnaoré,A.Oya, B. Dagnogo etM.Ouattara .................... ............ . 29
Genetic analysis ofthe reproductive performance ofWestAfrican Dwarfgoatsinthe humidtropics
I.K. Odubote .................................................................... 33
Preliminaryevidence forgenetic resistance to endoparasitesin MenzandHorrolambsin the
highlands ofEthiopia
J.E.O.Rege,S.Tembely, E.Mukasa,S.Sovani,D.Anindo,A. Lahlou-Kassi andR.L. Baker . ... 37
Morphological characterisation oftheTswanagoat
43
Reproductiveperformance and level ofgastro-intestinal parasite infestation ingoats on-farm and
on-station atMachang'a,Embu, Kenya
A.M. Okeyo,BA.O.Inyangala,SM. Githigia,S.JM.Munyua,MM.Wanyoike,
C.K. Gachuiri andM.Okomo... ........ ....................................... .. ... 49
Caractérisationgénétique descaprins duNord-Cameroun
A.C. NgoTama,D. Bourzat,P.S.Zafindrajaona etJ.J. Lauvergne .......... .............. . 55
Phenotypicandgeneticparameters ofgrowth traits ofBlendedgoats atMalya,Tanzania
SM. Das,JE.O.Rege andMesfin Shibre ....... ..... ..... ..... ..... ........ .... ..... . 63
Contrôle desperformances,sélection des mâles au sein de la race ovine Djallonkéet création
d'unflock-book
B. Bonfoh,A.TraoréetT.Ayewa ...... ....... .... .... .. ... ....... ........ ....... .. . 71
SESSION2.PRODUCTIONSYSTEMS,POLICYANDECONOMICS
Some constraintstosmall ruminantproduction amongsmall-scalefarmersin LaikipiaWest
M.M.MucuthiandK. Munei ... ....... ..... ........... ...... .... ............ .... .. .. 83
Sheep rearingundertree cropplantation inGhana'sforestzone: Problems andprospects
FK. Fianu, P.C.AddaeandL.Adjorlolo .......................................... .. . 87
Systèmetraditionneld'élevage caprin sur leplateau centraldu Burkina Faso
H. Tamboura etD. Berté . .. ..... .. ..... .. ...... .. ..... .. ....... .. .... .. .. .. .. .. .. . 93
Small RuminantResearch NetworkWorkshop V

Enquêtesur l'élevage caprin dans les hautsplateauxde l'Ouest-Cameroun
Manjeli Y, TéguiaA., NjweR.M.,TchoumbouéJ. etE.E.Ayong .......... ................ . 99
Goatproductionin Botswana: Factors affectingproduction and marketingamongsmall-scalefarmers
105
Profitability and income contribution ofsmallruminantproductionto ruralAfrican households :
A case studyofKgatlengand Kwenengdistrictsin Botswana
A. Panin ...................................................................... 111
Facteursdevariationde la production laitière des caprins en milieupeul
BaDiaoM., GueyeA. etM. Seck ... ...... .. ..... .. ..... .. ...... ....... ........... . 117
SESSION3,MANAGEMENTANDHEALTH
Contagiouscaprinepleuropneumonia: Diagnosis andcontrol
FR. RurangirwaandTC. McGuire ........... ...... ... .. ........... ......... ...... . 133
Asurvey ofpathological conditionsin slaughteredgoats atZaria slaughterhouses
S.A. Oio ....................................................................... 139
Fascioliasis and nutrient metabolism in pregnantandnon-pregnantsheep
O.O.Akinbamijo,A. Lahlou-Kassi andS.Tembely ........ ..... ..... .................. . 143
Smallruminant managementpractices and control ofhelminthosisundertraditionalproduction
systemsinthe coolEthiopian highlands
S.Tembely,A. Lahlou-Kassi, S. Sovani,JE.O. Rege,R.L.BakerandE.Mukasa-Mugerwa .... . 149
Pertes en reproduction,chlamydiose,brucellose ettoxoplasmose en élevage extensiftraditionnel
de chèvresguinéennes auSénégal
M.N. Ndiaye,J.A.Akakpo et L.J. Pangui .................. .. .. .. .. .. ..... ....... ... 159
Diseases ofSmall ruminantsin Botswana 1983-92
T. Kibirige-Sebunya andT. Diteko .... ....... ..... ............ .......... ........... . 163
Theinteraction between animal nutrition andparasites : Studieswithexperimentaltrypanosomiasis
in sheep
E. Katunguka-Rwakishaya . .. .. .. .. .. .. .. ... .. ... .. .. .... .. .. .. .. .... .... .. ...... . 169
SESSION4,FEEDING ANDFEEDINGSYSTEMS
The effect of variety and amount offeredofchopped sorghumstoveron theperformance ofsheep
EL.K. Osafo, E. Owen,A.N. Said,M.Gill andJ. Sherington ........ .. .. .... .. .. ...... ... 177
Effect offeedsupplements onweightgain and carcass characteristics ofintact male Mubende
goatsfedelephantgrass(Pennisetumpurpureum)ad libitum inUganda
183
Performances des agneauxMossien alimentation extensive,semi-intensive etintensive
A.J. Nianogo, S. Nassa, L. Soma, H.O. Sanon etV. Bougouma ... .. .. .. .. .. .. .. ..... .. .. . . 189
Evolution de la note d'état corporelet de quelquesparamètresbiochimiques chezdesagnelles
Foulbé à différents stades physiologiques au Nord-Cameroun
A Njoya et NDAwa ............................................................. 197
vi Small RuminantResearchNetworkWorkshop

Effet de la supplémentation de lapaille de brousse avec différentes proportions defane de
dolique sur la production deviande ovine
H. Nantoumé,A. Kouriba,D.Togola etB.S. Coulibaly ......... ...... ... .. .. .. .. .. .. .. 205
Compensatorygrowthin Horrolambs ofEthiopia
SolomonAbegaz,Demmissie Tiyo andLemmaGizachew ... ......... ........ ... .. .. ... . 209
Effects of*browse plus' onthe utilisation ofColophospermummopane (mopane)browsebysheep
215
Effect ofcastration and diet onperformance andfeedutilisation inSaanengoats .... .... .... ... . .. .. .
VRM. Muhikambele,L.A. Mtenga, E. Owen,G.C. Kifaro,D.S.C. Sendalo, N.F. Massawe,
SM. Kiango andD.R. Nkungu ..... .. .. .. ..... .... .. ... .. ....... ....... .. .. .. .... .. 221
Calliandra leafmealingoat rations : Effects onprotein degradabilityinthe rumen and
growth in goats ....................................................................
C. Ebong .......... ... ... ... ... .. .. ........................................... 227
Comparative evaluation ofstylo(Stylosanthes guianensis)hayandconcentrate asprotein supplement
forWestAfrican Dwarfsheepfedbasal diet ofelephantgrass(Pennisetumpurpureum)
231
The effect ofsupplements ofcrop residues andagro-industrialby-products onthegrowth
performance ofSwazigoats
235
Speciesabundance,foodpreference and nutritive value ofgoat diets in the semi-arid lands of
east-central Kenya
N.K. Osolo,J.N. Kinuthia, C.K. Gachuiri,A.M. Okeyo,MM.Wanyoike andM. Okomo ..... .. 239
SESSION5,PERFORMANCEANDREPRODUCTION
Possibleimpact ofdisease and reproductivewastage ontheproductivity oftropicalsmall
ruminants:An overview
247
Growthandpartition offat depotsin male BritishSaanengoats
L.A. Mtenga, E. Owen,VRM.Muhikambele,G.C. Kifaro,D.S.C. Sendalo, N.F. Massawe,
SM. Kiango andD.R. Nkungu ... .. .. .. .. .. .. .. ... .. .... .. .. .. .. .. .. ... .. .. .. .. .. .. . 255
Etatde la situation sanitaire desproduits laitiers commercialisésdans lazonepériurbaine
de N'Djaména
P. Bornarel,N. Boulbaye, P. Hugoo etK.Gaou .. .. .. .. ... .. .. ..... ...... .. .. .. .. ... . 259
Performances de reproduction et accroissement numérique du cheptel ovin dans deuxnoyaux
d'élevage traditionnel enzone soudano-sahélienne auMali
Tiéma Niaré ................................................. ... .. ... ... .. -- ... . 265
The induction ofpubertyin female Boergoatkids
JPC.Greyling .......................................................... ... .. . 273
Milkproductionfromthe indigenous Malawigoat
RA. Cooper,JA. Kirk, L.Kamwanja andJ. Banda ... ....... .... ...... ... ... .. .. .. ... . 283
SmallRuminantResearch NetworkWorkshop vii

Synchronisation des chaleurs etgestion de lutte chezle mouton Djallonké
A.Traoré, YN. Hadzi etA.A.Midekor...............................................289
Reproductiveperformance ofTswanaewesand Boer doesinsouth-eastern Botswana
D.Seabo,A.A.Aganga andM. Mosienyane ...........................................293
Quelques données sur le sperme debélierspeulblancs ettouaregdu Niger
HamaniM, YenikoyeA. etBanoinM..... ...... ......................................297
Performances laitières etétat nutritionnel deschèvres duSahelconduitessurparcours naturels:
relationsavec la croissance deschevreaux .... ...... ...... ........ .. ..... ......... .......
CisséM., Fall Y. et I. Ly .......................................................... 303
Posters- Abstracts ..................................................... ... .......... .311
List of Participants ...................................................................313
viii Small RuminantResearch NetworkWorkshop

Preface
Limitedaccess toinformation and limited opportunityfor interaction amongscientists workinginthe same
area ofinterestaretwoofthe majorconstraintstosmallruminantdevelopmentin the developingworld,and
in particular,Africa.
It is againstthis backgroundthatthe African Small Ruminant Research Network(SRNET)has made
the promotion andimprovement ofinformation exchange on small ruminant researchand developmentone
ofits majorprioritiesin addition to collaborative research and training.The networkhasset outto achieve
this goalthroughthe organisationandsponsoringofa biennial scientificconference,amongstotherchannels.
Thisprovidesaforumforsmall ruminantscientists inAfrica andelsewhere,developers,policymakersand
farmers to meet, exchange ideas and establish partnerships.Theforum also provides opportunityfor small
ruminant researchprioritysetting.
Thisproceedings reflects the oraland poster presentation at the Network'sThird BiennialConference
held in Kampala,Uganda,from 5to9 December 1994.Some 110participants, representing32African
countries,five European countriesandvarious international and regional organisations(ILCA,OAU/IBAR
andFAO)werepresent. Five scientificsessionswereheld,atwhich44oralandsixposter presentationswere
madeanddiscussed.The sessionsfocused onproduction systems, economics andpolicy;performance and
reproduction;health andreproductivewastage;feedsandfeedingsystemsandgeneticresourcesandbreeding
forboth oral andposterpresentations.
The Networkisgratefultothe European EconomicCommunity(EEC)and ILCAfortheir continuous
promotionandsupportofthe activitiesoftheNetworkincludingthe holdingoftheThirdBiennialConference
andthe publication ofthe proceedings.Alot of thanksgotothe ILCANairobisupport office fortheusual
superb logisticalsupport.
SpecialthanksgototheUgandanGovernmentforitssupportinholdingthe conference,andin particular
to the Ministry of Agriculture, Animal Production and Fisheries and the National Small Ruminant
Co-ordination Committeeforco-hostingthe conference.TheNetworkalso appreciatesthe kind willingness
of Her Excellency, Dr Specioza Kazibwe,Vice President ofthe Government ofUganda,to be the guest
speaker.Myfinalthanks andgratitudegotoallthosewhomadethe publication ofthisproceedingspossible,
particularlyMsAnneNyamu, forEnglish editing, andMrSourouAdoutan,forFrench editing, andthe staff
ofthe PublicationsSection ofthe International Livestock Research Institute,AddisAbaba.
S.H. Lebbie
SRNETCo-ordinator
Small RuminantResearch NetworkWorkshop ix


Keynoteaddress
Small ruminants:Goatsandsheepin Uganda
H.SK.Nsubuga
ProfessorofAnimalScience, Makerere University,PO.Box7062, Kampala, Uganda
Introduction
There are about 400 million goats in the world, with
Africa accountingfor67%. In EastAfrica, Kenyahasa
goatpopulation of64million,Tanzania4.3millionand
Uganda 39 million. The trends in Ugandan small
ruminantpopulation dynamics can be seen inTable 1.
Onemethodofincreasingthe numberofgoatsandsheep
istoselectfortwinningtraitswithin a population.The
twinning rate ofEast Africangoatsis30% andtriplets
occur at the frequency of2%. Goats have a unique
feeding characteristic ofbrowsingwhich accounts for
60%while thegrazingpreferenceis only40%.
Table 1. Sheep and goats census in Uganda, 1935-94.
Year Sheep Goats
1935 1,062,139 2.335033
1945 995321 2,143,533
1950 1,065,822 2.324,232
1955 1,093,247 2.513,732
1960 865.000 2.592.000
1965 790 933 1997713
1970 827444 1,801,311
1975 700.000 2.000.000
1980 1.000.000 2,100.000
1985 700.000 2.500.000
1990 570000 3700000
1994 1,100.000
Goats andsheep make an important contribution
tothe subsistence subsector ofthe economy ofUganda
and, indeed, of many countries in Africa. Over one
million goats and sheep are slaughtered and consumed
annuallyfor meat.Theskins contribute substantiallyto
foreign exchange earnings aswell aspermittingimport
substitution for useinthe localtanneryand leather craft
industry of Uganda. Locally the skins are used
extensivelyin traditionaltechnoculture.They are used
notablyinthe makingofmats,coveringhandlesoftools
(knives, dancing costumes, ropes, drums and shields)
andcoveringornamental articles. Footwear,stringsand
specific musicalinstruments are alsomadefrom skins.
ExoticgoatsoftheToggenburgandAnglo-Nubian
breedswereimportedtoUgandaforcross-breedingwith
localgoatswithaviewto enhancingmilkyieldand meat
production in the offspring. In the early 1960s exotic
woolsheepwereintroducedintoUgandaandwerebred
on Governmentfarms with the objective of assessing
their ability tosurvive,reproduceandproducewooland
meat in Uganda's climatic,technical and management
enVIrOnnnent.
Itwasplanned thatwool sheep production could
be integratedwithbeefcattleranchingwheretick-borne
diseaseswere controlled. Sheepprefershorterpastures
than cattle and they would therefore follow cattle in
rotation managementsystemwithin fencedpaddocks.
Exotic sheep, goats and their crosses with
indigenous stock are more susceptible to helminth
infection than the local breeds. Therefore every care
should be taken to institute an effective regime of
preventive measures comprising adequate rotational
systems ofgrazing coupledwith strategicprophylactic
cover and all reinforced by regular chemotherapeutic
preventive treatments.
It hastobe emphasisedthat meatproductionfrom
small ruminants isveryimportantin Africa.This is so
because these animals are more suitable for family
consumption of5-10people,than cattle owingtotheir
comparatively small carcases(10-15kg).
Furthermore, there is lack ofregularbeefsupplies
outside the main cash-crop harvesting season.Absence
of networks of rural electrification virtually prevents
exploitationofrefrigerationtechnologyandhence limits
preservation and storagecapacity oftheperishable meat
surplus. Indeed,thereis apositive correlation between
slaughtering and consumption of beef and the
availability of cash in rural areas duringthe main crop
(coffee and cotton harvest)sales.
Before the secondworld war,goats were kept in
almost every household in the rural areas.Atthattime
children 8-15years ofage contributedthe main source
of household labour for herding the flocks ofgoats.
Duringthe last 50years schooling has deprived rural
parents oftheir source ofcheap and convenient labour
forherdingsmallruminants.Goats exhibitgreatactivity
in their search for feedsthroughbrowsing,grazing and
eating household residues. They are relatively more
difficulttoherd than sheepwhichtendto fitin wellin a
system ofjoint herdingwith cattle.
In extensive areas of northern and north-eastern
Uganda, there was a potential of rearing large flocks,
200-300 goats, using one herdsman particularly if
trained sheep dogswere introduced and the husbandry
internalisedin the farmingcommunity.
SmallRuminantResearch NetworkWorkshop

Nsubuga
Breeds ofgoats
InUgandathere are three distinct breeds ofgoat reared
for meatproduction.
The commonest type is the smallest ofthe three
and can be described asthe Small East African (SEA).
Its mature liveweightis20-25kg. It occurs extensively
in northern and eastern shortsavannah ecological areas
andthe drier areas ofBugandain the northernparts of
Luwero and Mukono districts (Buruli, Bulemezi and
Bugerere).
Thesecondtype is describedastheMubendegoat.
This is a large animal of30-35 kg live weight. It is
renowned for its popular skin on the international
market. The skin is called "Kampala skin" in trade
circles. This breed is concentrated in the Mubende
District.
Thethirdtypefalls in betweenthe firsttwoin live
weight, 25-30 kg. Its typical ecological niche is in
Kabale, Kisoro and Rukungiri in Kigezi District. It is
referredto asthe Kigezigoat.
The colourofthethreetypes aboverangesbetween
pure white topureblackandincludesallshadesbetween
thosetwo colours.
Theincidence oftwinningis rather low,estimated
at30%.Milkyields are sufficientto satisfactorily raise
one kid. In case of twins, there is often poor initial
growthwhichpointsto aninadequate supply ofmilk.
Strategyforimprovement
As with other basically meat producing species of
livestockandpoultry, increasesin meat productionfrom
goatscanbebased on the basicprinciples andpractices
ofanimalbreeding.These are exemplifiedbyselection
andcross-breeding methods.
In an exercise of this nature it is useful to use
genetic resources which have been improved but are
indigenous tothe African continent.Such an animalis
typifiedbythe Boergoat.
The Boergoat, as the nameimplies,was selected
from indigenousgoats andbred over manygenerations
bythe Boers ofSouthAfricawiththe aim ofimproving
meat production. The mature female weighs about
60-75kglive weight andthe mature maleweighs about
90-100kgliveweight.Thegoathasacream-whitebody
with a reddish-brown head.
Thetwinningrateis50%and the rate for triplets is
6%.Thebreed has ahigh milkyield and adaptswellto
semi-arid conditions. Its carcass dressingpercentage is
relatively high and its skin has excellent quality for
leather manufacture.
In 1971 Boergoatswereimportedinto Kenya and
were used for cross-breeding with the typical East
Africangoatsimilarto the one describedfor Uganda.A
comparisonwas made between theperformance ofthe
EastAfricangoatbreedandthe BoerXEast African F1
cross.Tables2and3summarisethe results
Table2 Live weight (kg) accordingto age oftheSmallEast
Africangoat and its FI crosswith the Boergoat.
Boerx
SmallEast SmallEast
Agegroup African(F1) African Difference
Birth 2.3+0.5 0.3
42days 8.3+1.5 69--1.3 1.3
150days 19 7+2.5 14 9-27 4.8
180days 21.8 -2.8 16.2- -2.9 5.6
275 days 28.2- -2.8 20.2-2.3 8.0
365days 34.3+2.4 20.0- -3.1 12.3
Table 3.Average daily gain (g)from birth to weaning and
from weaning to 1 yearold.
Breed
Boerx Small
smallEast East
Period African (Fl) African Difference
Birth toweaning 114 -16 841-18 30
(6weeks)
Weaningto365 days 64- -10 32+-10 32
Theperformance ofthe nativeSmall EastAfrican
kidswasfully comparablewith Mubende kids studied
by Sacker and Trail (1966). The crossbreds weighed
more andgrew faster than theSEAgoats at all ages.
This superiorweightperformanceimprovedwith age.
In March 1993 theFacultyofVeterinaryMedicine,
Makerere University, imported 35female and 5 male
Boergoatsfrom the NorthernCape Province ofSouth
Africa. Preliminary research results on the Boergoats,
Small EastAfrica goats and crosses between the two
breeds areshown on thefollowingextracts compiledat
Buyana Faculty Farm in Mpigi District of central
Uganda.
IntroducingtheSouthAfrican Boer
goatinto Uganda
Statement of objectives: The experiment aims to
improvetheproductivity oftheSmallEastAfricangoat
asfar as meatproductionis concernedin the context of
"How Boer goats will be best putto use". A detailed
study ofthe reproduction,growth and meat production
performance of the Boer goats will be carried out.
Diseasefactors thatlimit productionwillalsobestudied.
Introduction
The total goat population ofUganda stands today at
some39million head.Thesegoats are basically ofone
main type-the Small East African goat. It is small,
compact, hardy and specially adapted to humid
environments. Mature weights are about25to 30kg.
Theimportance ofgoatsinUgandaisbasedon meatand
skins. Some ofthe major reasons for promoting goat
production in Ugandainclude:
2 SmallRuminantResearch NetworkWorkshop
Small ruminants: Goatsand sheepin Uganda
Thehumanpopulationisgrowingsteadily creating
a significant andincreasingdemand forgoat meat
inUgandaand in theArabworld.
• The capitalinvestment forthefarmeris relatively
low, the reproductive turnover is high and
managingthegoats is not labourintensive.
• The genetic potential ofthe local goats can be
improvedbyselection and cross-breeding. Ifthis
is combined with improved feeding and health,
overallproductiongains couldbe considerable.
• In ranching areas goats can become very useful
animals in bush clearing and they can be used as
pasture improvers.
Materialsand methods
Thirty-five ewes and five rams of Boer goats were
importedfromNorthernCapeProvinceofSouthAfrica
on18March1993.ThefemalegoatswerebredinMarch
andApril.ThirtySmallEastAfrican goatswerebought
in June 1993 from Kisozi Ranch for the purpose of
cross-breedingwithBoergoatramsinAugust 1993.The
goatswerekeptunderintensivesystem ofmanagement.
Animalsgraze inthe dayand are housed overnight.
Preliminary results
The birth weight ofthe crossbred kidswas superior to
the Small EastAfrican kids. Unfortunately,there was
no correlation between the birth weight and the daily
gain.
Boergoatswere moreprolificthan theSEAgoats
considering their relatively higher twining rate
(Table 4).TheSEAindicate an interestingsex ratio of
theyoung.
Table4.The reproductive performance ofthe Boergoat and
theSmallEastAfrican goat.
Goatbreed
SmallEast
Parameters Boergoat Africangoat
No. ofdoesthatkidded 29 25
Type ofkidding(%)
Single 37 9 640
Twin 62.1 36.0
Kidsex(%)
Male 66.7 500
Female 33 3 500
Table5. Daily average gain (g/day) of lambs aged 30 days.
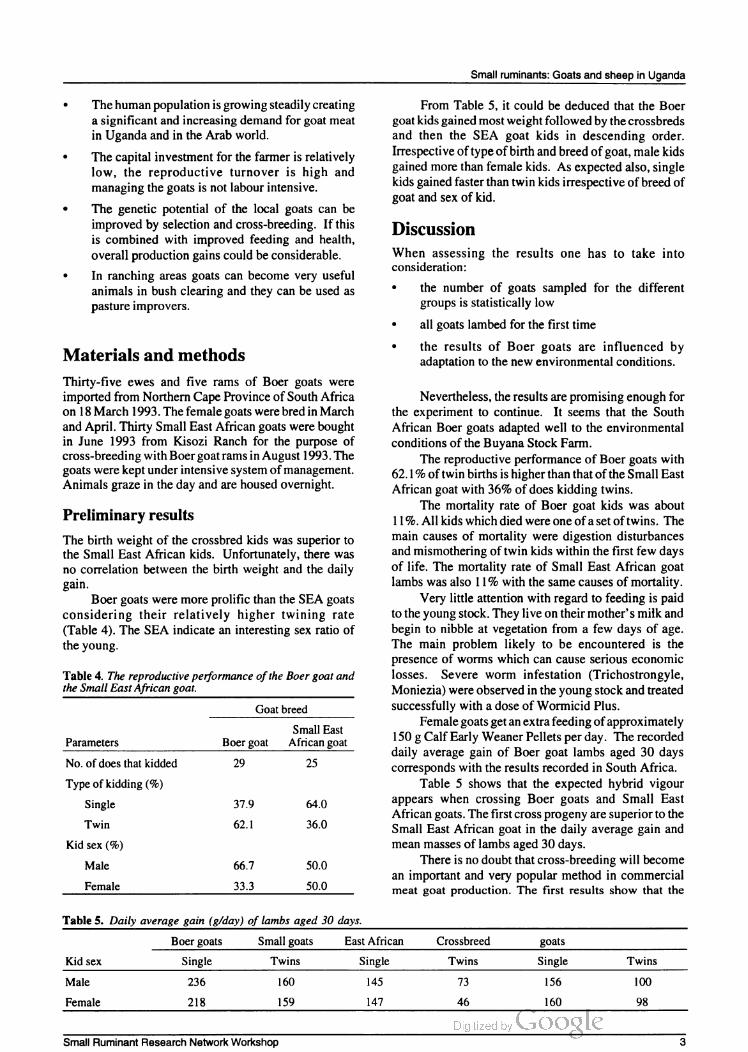
From Table 5, it could be deduced that the Boer
goatkidsgained mostweightfollowedbythe crossbreds
and then the SEA goat kids in descending order.
Irrespective oftype ofbirth andbreedofgoat,male kids
gained morethanfemale kids. As expectedalso, single
kidsgainedfasterthantwinkidsirrespective ofbreed of
goat andsex ofkid.
Discussion
When assessing the results one has to take into
consideration:
• the number ofgoats sampled for the different
groupsis statistically low
• allgoats lambedforthe firsttime
• the results of Boer goats are influenced by
adaptationtothe new environmental conditions.
Nevertheless, the results arepromisingenoughfor
the experiment to continue. It seems that the South
African Boergoats adaptedwelltothe environmental
conditions ofthe BuyanaStockFarm.
The reproductive performance ofBoergoatswith
62.1% oftwinbirthsishigherthanthat oftheSmallEast
Africangoatwith36% ofdoes kiddingtwins.
The mortality rate of Boer goat kids was about
11%.All kidswhichdiedwere oneofasetoftwins. The
main causes of mortality were digestion disturbances
andmismothering oftwin kidswithinthefirstfewdays
of life.The mortality rate ofSmall EastAfrican goat
lambswasalso 11%with thesame causes ofmortality.
Very little attention with regardtofeedingispaid
totheyoungstock.They live ontheir mother's milkand
begin to nibble at vegetation from a few days of age.
The main problem likely to be encountered is the
presence ofworms which can cause serious economic
losses. Severe worm infestation (Trichostrongyle,
Moniezia)were observedintheyoungstockandtreated
successfullywith a dose ofWormicid Plus.
Femalegoatsgetanextrafeedingofapproximately
150gCalfEarlyWeaner Pelletsperday. Therecorded
daily average gain of Boer goat lambs aged 30 days
correspondswiththe results recordedin South Africa.
Table 5 shows that the expected hybrid vigour
appears when crossing Boer goats and Small East
Africangoats.Thefirst crossprogeny are superiortothe
Small EastAfrican goat in the daily average gain and
mean masses oflambs aged30days.
There is nodoubtthat cross-breedingwillbecome
an important andverypopular method in commercial
meat goat production. The first results show that the
Boergoats Smallgoats East African Crossbreed goatS
Kid sex Single Twins Single Twins Single Twins
Male 236 160 145 73 156 100
Female 218 159 147 46 160 98
Small RuminantResearch NetworkWorkshop

Nsubuga
general excellence of the F1 generation will
consequently increase the goat breeder’s return.
Sheep
In the annual report of 1961 the Director of Veterinary
Services and Animal Industry reported research results
on the crosses of indigenous sheep with the exotic
Dorset Horn breed as follows:
A study was initiated in 1959 to compare
the Ankole Fat-tailed sheep with its Dorset Horn
breed cross. Data collected to date would
indicate that lambing percentages are
maintained and there is a marked improvement
in weight gains. Birth weights were heavily in
favour of the crossbreds and at 18 months the
latter were double the weight ofthe pure Ankole
sheep. However, as so frequently happens in
Africa, the net productive gain after mortality
was considered rather reversed the picture.
Mortality from all causes for the 3-year period
of the trial up to 6 months ofage was 17.6% in
the case ofpure Ankole sheep and 24.1%for the
crossbreds.
During 1959, 68.4% of the crossbred sheep died
and in 1960 68.2% died. The figure for 1961 was 22.1%.
It should be noted, however, that the bulk of the
mortality in 1959 and 1960 was due to a toxaemic
jaundice of unknown origin. Sheep of about 10 months
ofage were mainly affected and while some pure Ankole
sheep were involved the disease occurred almost
entirely in crossbreds. There was very little evidence of
the disease in 1961, hence the lower mortality rate of
22.1%. This is but further evidence of the vital role
played by disease factors in the upgrading and
management programmes in Africa. This study was to
be continued and extended to include back-crossing to
the Ankole.
Milk goats
Some research on imported Toggenburg exotic milk
goat and its crosses with Mubende goats was done in the
1960s and 1970s at the Livestock Experimental Station,
Entebbe.
Both the pure Toggenburg and the crosses of
Toggenburg x Mubende goats showed promising results
in terms of milk yield: up to 4 kg per goat per day for the
pure Toggenburg and 2 kg for the crossbred goats.
Furthermore, growth rate and mature weight were
improved in crossbreds compared with the indigenous
Mubende goats.
Today a number of women’s non-governmental
organisations have introduced the Toggenburg breed
and its crosses to Uganda, notably to Kasese and
Bushenyi districts in western Uganda.
Finally, a comment on Table 1 showing a virtually
stagnant census of goats and sheep in the last 60 years
1934-94. This situation poses a challenge to policy
makers and policy implementers. It is hoped this
conference will discuss and address positively future
directions in the breeding, nutrition, animal health,
management and economics of small ruminants at the
farm and national levels in Uganda as well as in
countries represented in this conference.
Meanwhile the export market for live goats and
sheep in the oil rich Middle East Arab countries appears
limitless. It is estimated to be of the order of one million
small ruminants per annum. Therein lies the challenge.
Reference
Sacker CD. and Trail J.C.M. 1966. Production characteristics
of a herd of East African Mubende goats. Tropical
Agriculture (Trinidad) 43:43—5 l .
Small Ruminant Research Network Workshop

Openingaddress
HerExcellencyVice PresidentSpecioza Kazibwe
Your Excellencies,
DistinguishedGuests,
Ladies andGentlemen.
By singular coincidence, this happens to be my first
addresstoaninternationalAfrican scientificconference
on small ruminants since my assumption ofadditional
dutiestwoweeks ago.
You are cordiallywelcome toUganda,where I
understandyour mission is todeliberate onSustainable
Small Ruminant Production in MixedCrop-Livestock
Production systems on the African continent.
Igatherthatamongthe areasfor discussion are:
a) The role ofsmall ruminantsin the conservation of
ecologyandAfrica'sfood security; and
b) The role ofwomeninsmallruminantdevelopment
in Africa.
Both these topics are central to Africa's
environmental crises andgenderresource development,
the latter ofwhich Iamdirectly respcnsiblefor andwish
tobe advised more onthe logistics.
Historicalperspective
Permit me,however,toshare withyou mythoughts on
the past, present and future challenges we must
overcome together in order to promote social and
economic progress through sustainable animal
agriculture andfoodsecurity.
From a historical perspective, the root causes of
insufficient livestock research and technology
development in Africa are manifestations of
misorientation of resources by colonial policies.The
relationship between African people and their
socio-economic environment,including food resource
development, has always been out of balance. The
foreign policies, not only destroyedthe traditional and
sustainable methods ofproduction but alsointroduced
new modes ofproduction that stressed cash crops for
export and profit rather than conservation of the
environmental ecologyandprovidingforfoodsecurity.
For example:
(i) The goat was described as "'a problem child of
African agriculture causingdeforestation and soil
erosion".
(ii) Cash crops,such as tobaccoand cotton havebeen
cultivatedinthe rainyseasonin directcompetition
for family labour to grow food crops and
conservingfodderfor livestock.
(iii) Coffee, rubber, cocoa, palm oil and sugar-cane
plantations took away land that could otherwise
have been used for food crop and animal
agriculture.
Distinguished participants, the historical
antecedents of the current environmental and food
security crisesin Africa should not pass unchallenged.
Widespreadfaminesonthe continent areaconsequence
ofenclave economies and export economiesbyforeign
agencies. This indeed facilitated the exploitation of
natural and human resources in Africa without due
attention tothe conservation and regeneration ofthese
resources. This is why small ruminants development
was sidelined in Uganda during the colonial era.
Instead, massive importations of fat slaughter cattle
from European settler's farms in Tanzania and beef,
butterandmilkfromKenyaandwhiteSouthAfricawas
pursued.
You may wish to recall from history that our
pre-colonial ancestors keptgoats and sheep as kingpin
domestic livestock species in every home.Theywere
housedin everyhutofanaveragepeasantfamilyin rural
Africa.Theywere culturally shared amongthe entire
membershipofthe Africanfamilyandtheir productivity
wassustainable.
Let me now put it to you, dear distinguished
scientists. Is it not paradoxicaltoday, that most of our
countries are still submerged in the historical
consequences of almost four centuries of
pre-independence domination? Is it not true that this
domineering influence is of unequal scientific and
economic relationship, which in turn contributes to
environmental stresses that affect livestock and
food-cropproductivityin Africa?
Putting the historical perspective to its rightful
conclusion, I am ofthe view that there is hardly any
African country today without inherited colonial
institution legacies and structures,beitin schools, army,
research institutions or government business.Some of
these legacies include urban-biased development,
instead ofruralfarminginfrastructures, andunbalanced
export-oriented strategies,instead ofsustainable food
securityprogrammes.Technological over-dependence,
scarcityofappropriatelytrained manpower,andpaucity
ofresearch information about the indigenous resource
base, are some of the bottlenecks to Africa's
post-independence development, and indeed to the
growth ofsmall ruminantproductivityin Africa.
The problems which have their roots in the
pre-independence era, have today become major
constraints to several major aspects of development,
Small RuminantResearch NetworkWorkshop 5

Openingaddress
especially in the restructuring of the livestock and
food-cropproduction sectors. None ofthese problems,
however, are amenable to short-term solutions. What
Africa mosturgently needs,isto have a strong linkage
between training, research and technology-transfer
processes. African scientists must provide the
information neededto formulate realistic policies and
agree on the most appropriate development strategies
which would be economically viable, socially
acceptable andenvironmentallysustainable.Thatway,
we can forgetthe colonialpast.
Presentsituations
Turning to the present challenges regarding food
security,Uganda's averageper capita food availability
is adequate, although nutritional deficiencies are
rampantduetoshortages ofanimalproteinsources,such
asgoat meat,beef, milk, mutton etc. Continent-wise, a
perplexingcontrast existsbetween Africa'spopulation
growth rate of 3.0 to 40% and an average food
productionincrease rate of0.5to 1%per annum.
With a population growth ofthat magnitude,the
number ofmouthstofeed doubles every20years. For
example Africa's humanpopulation todayisput at500
million andis expectedtoshootupto 1.36billion bythe
year2020;that means an extra 800 million mouthsto
feed.
The challenge is how the 400 million small
ruminantsinAfricawithan average offtakeof20%will
contribute to animal protein food security sources.
Furthermore, what role can sheep and goats play in
promoting investment in development of export
agriculture (IDEA) after satisfying the national or
regionalfoodsecurity needs?
With respectto ecologicalconservationinamixed
crop-livestockcontext,Iurgeyou, scientists, todevelop
transferable technologiesthatpromote intensive use of
animal manure waste and recycling of crop residues,
agro-industrial by-products and planted fodder
resources. The technologies should be compiled in
simple handbooks and training manuals for farmers,
instead ofhidingthem awayin incomprehensible and
unattainable internationaljournals.
Iam aware ofthe bottom-line concern ofresearch
scientists. And that is the magnitude of financial
resourcesthat Africangovernmentsinvestinto research
andespecially livestockresearch.
The colonial legacies ofpromoting cash cropsfor
export led to disproportionate allocation offunds into
crop rather than animal agriculture. Today African
countries allocate a dismal 1% of the AGDP
[agricultural gross domestic product] into research.
Uganda's investment into research has been until
recently a mere 02% oftheAGDP. These negligible
apportionments are largely utilised for payment of
salaries ratherthanprocuringequipment andchemicals.
This state of affairs must be addressed by
governments and donor communities to fully support
indigenous scientific and social research programmes.
Uganda has addressed this problem seriously andwe
have put in place a national agricultural research
organisation (NARO) with three of its six institutes
directly addressing livestock resource programmes.
Uganda also collaborates with several international
research centres including the recently concluded
agreementwith ILCA.
Future challenges
Before Iconclude, letme addressthefuture challenges
bypointingout the inevitable: thegender(women) role
in livestock research and small ruminantdevelopment.
The first issueis the training ofwomen asanimal
andfood scientists. I challenge this forum toproduce
before me an inventory and percentage of women
researchers involved in animal agriculture. It is true in
Africa thatwomen attendto the chickens, goats,sheep
and calves;they also milk cattle, make butterandghee
in predominantly male-owned herds and flocks.
Participatorysocial development dictates thatthe entire
family be involved in the ownership, care and
maintenance oftheir resources. It is a motivatingfactor
toownan animalandthen careforitswellbeing. Every
member ofthe family- man, woman and child-
shouldshare in the ownership ofsmalland large stock
as a basis for economic emancipation, be itfor school
fees, taxation,foodsecurity orany otherfamily needs.
ThatiswhyIrecommend,thatthebest gifttoone's
wife orone'schild's birthday is acow,goatorachicken.
Iappealtotheprofessors andresearcherstotrainwomen
scientists and extension workersin animalproduction.
IfurtherurgetheSmallRuminantResearchNetworkto
focusonthewomenhuman resource asyourpartners in
implementing your programmes on the African
continent.
In conclusion, we in the government of the
NationalResistanceMovementdoagreethatthepaucity
of well developed indigenous scientific research
capacity contributes to food insecurity and environ
mental degradationwhichis a reflection ofpoverty.
Uganda happens to be fortunate in that our
agricultural potential is quite high. And with better
appropriate scientific knowledge and environmental
managementweshouldbein aposition tomeetsome of
the needs of the eastern African region. We have
substantial surpluses of grain commodities. We can
equallygain surplusinmeatsupplyincludinglivesmall
ruminantsforinter-Africantrade.
Finally I would like to commend the SRNET
Co-ordinator and his counterpart team in Uganda for
their tireless effortsin bringingaboutthis conference. I
also wish to thank the distinguished delegates for
devotingmuch oftheir time tothe preparations ofthe
scientificpapersandfor attending this conference, right
hereinUganda. Iwish all ofyoufruitful deliberations.
I have therefore the pleasure to declare this
conference officially open.
Forgodand mycountry.
Thankyou.
SmallRuminantResearch NetworkWorkshop

Allocution d'Ouverture
PrYenikoye Alhassane
Président du ComitédirecteurduRéseau
Excellence Madame la Présidente,
Honorablesinvités,
Mesdames, Messieurs;
Jesuis trèsheureuxdemetrouveraujourd'huidans
cette belle ville de Kampalaetjesuis certain de partager
ce plaisir avecvous.
Après Bamenda enjanvier 1989, date de création
de notre Réseau, Nairobi en décembre 1990 etArusha
endécembre 1992, nousvoiciréunisàKampaladans le
cadre de la 3ème Conférence biennale du Réseau
africain derecherchesur lespetitsruminants.C'estpour
nous l'occasion defaire unbilanducheminparcouru,et
de dégagerpournotre Réseau de nouvelles orientations
quitiennent compteà lafois des contraintes internes et
externesà notre système de recherchezootechnique en
Afrique.
Aucoursde ses six annéesd'existence,le Réseau
aessayéd'atteindre les objectifs qui luiontétéassignés.
En effet,àtravers son approche de recherche concertée
quifavoriseparconséquent laformationet la circulation
de l'information, le Réseau a essayé, d'une part
d'améliorerla qualitédes recherches entreprisesparses
membres et d'autre part, de contribueràune meilleure
coordination de la recherchezootechnique en Afrique.
Il a également réussi à susciter une prise de
conscience significative de l'importance des petits
ruminants sur le continent en réunissant tous les deux
ans une masse critique de chercheurs africains appar
tenant aux systèmes nationaux de recherche agricole.
Cette prise de conscience est développée et renforcée
parses diversespublications.
Enfin le Réseau a contribué dans une certaine
mesure à améliorer les conditions de recherche de
quelques centres nationauxde recherche agricoleparun
apport financier appréciable obtenu auprès des
donateurs.
L'une des principales conséquences des activités
du Réseau sur les systèmes nationaux de recherche
agricole, a été le renforcement de leur capacité de
recherche, et nous pouvons affirmer que tant que le
Réseau africain de recherche sur les petits ruminants
disposera de l'appuifinancier nécessaire, il continuera
à avoirunimpactpositifsurcessystèmes nationaux.
L'insuffisance de fonds destinés à la recherche
constitue l'une des préoccupations majeures de notre
Réseau. Cette situation est générale au niveau du
continent africain et des pays en développement. En
effet, la plupart de cespays consacrentmoins de0,5%
de leur produit intérieur brut (PIB) à la recherche
développement alors que les différents forums
internationauxtenus sur ce sujet en recommandent au
minimum 1%. Cette attitude des Etats à l'égard du
financement de la recherche est due surtoutà l'absence
de politique scientifique ettechnologique. La recherche
n'est pas considérée comme une priorité par les
gouvernements africains, en particulier en période de
crise économique.
En outre, on constate que dans la plupart des
centres nationauxde recherche en Afrique,70%à90%
dessubventions allouéessont absorbéesparles charges
de personnel. Une autre raison de l'insuffisance de
financement de la recherche en Afrique est la faiblesse
ou l'inexistence dans certains cas de liens entre les
institutions nationales de recherche et le secteur
productif
Toutes ces difficultés ont des répercussions
négatives sur les performances de nos chercheurs et
partant de notreRéseau. Il est parconséquent nécessaire
de prendre en compte la dimension nationale dans la
résolutiondesproblèmesdefinancementde larecherche
menée en Afrique par les membres de notre Réseau.
Chacun d'entre nous, dans la limite de sa sphère de
responsabilité au niveau national, doit sensibiliser son
gouvernement de façon à ce que la recherche soit
intégrée comme élément de la stratégie de dévelop
pement national. A cet effet, les mécanismes de
financementpublicetprivé de la recherchedoiventêtre
reVUIS.
Il pourra être proposé les recommandations
suivantes :
1. Allocation des ressources de l'Etat à la recherche
agricole sur labase debudgets-programmes adaptés
aux besoins pluriannuels des chercheurs, pouvoirs
publics et sociétés.
2. Mise en place d'un Fonds national de la recherche
scientifique et technologique pour compenser les
subventions absorbéespar les charges de personnel.
Ce fonds sera alimentépar l'Etat, les institutions et
offices publics et para-publics, les organismes
régionaux et internationaux de recherche opérant
dans lespays.
3. Octroi d'un régime defaveur en matière de taxes et
d'impôts aux instituts nationaux de recherche
agricole sur les biens, services et dons afférents au
développementde la recherche.
4. Etablissement de liens de partenariat entre lesinsti
tutions de recherche agricole et le secteur productif
Small RuminantResearch NetworkWorkshop7

Allocution d'ouverture
(Petites et moyennes industries) dans le but de
faciliter le transfert des résultats de la recherche au
secteur productif et de canaliser les fondsgouver
nementauxvers cesinstitutions de recherche.
La mise en oeuvre de ces mesures permettra
d'améliorer la capacité de recherche de nos systèmes
nationaux, gage de réussite et de durabilité de notre
Réseau.
Cependant,construireune capacitéscientifique et
technologique présuppose une réponse globale au
besoin de réformer le financement et la gestion des
systèmes nationaux de recherche. A cet égard, il est
souhaitable que l'aide des donateurs soit orientée à la
foisvers les priorités définies danslesplans dedévelop
pement socio-économique et cultureldes pays dusud et
vers la création et le soutien des réseaux de recherche
régionaux et internationaux. Les donateurs devraient
contribuer également au financement desprogrammes
établissant les liens entre lesinstitutions de recherche et
le secteur productif, car c'est par le développement
économiqueàtravers laprospérité des entreprises que
le système de recherche peut bénéficier d'un finan
cementdurable.
Enfin, il faut favoriser le système de prêt
d'assistance technique auprès des bailleurs de fonds
(Banque mondiale)pour financer la recherche agricole
en Afrique.
Nous devons nous organiser au sein du Réseau
pour disposerd'une banque de données sur les Etats et
organismes régionauxetinternationauxquifinancent la
recherche agricole en Afrique.
Le bilan des actions entreprises auprès des
donateurs et bailleurs de fondspar le Comité directeur
depuis la conférence d'Arushavous seraprésentépar le
coordonnateur dans son rapportd'activité.
En tant que jeune réseau, nous continuerons à
rechercher le soutien de tous pour permettre à notre
structure de se développer et de se renforcer.
Le Réseau doit mettre à profit cesjournées pour
élaborer leséléments de sastratégie et fixer ses priorités
en matière deproduction etdesantédespetits ruminants
dans le nouveau cadre créé en matière de recherche
zootechniqueinternationale.
Au nom du comité directeur, du coordonnateur et
de tous les membres du Réseau, je voudrais remercier
sincèrement tous les pays, individus et organisations
dont l'appui et la compréhension ont permis à notre
Réseau dejouerpleinementson rôle au niveau africain.
Enpremier lieu, je citerai leCIPEAquia toujours
soutenufinancièrement et matériellement notre Réseau
depuis sa création. Ensuite, je citerai laCEE et le NRI
quiviennent au premier rangde nos donateurs.
Enfin, nos remerciements vont aux autorités
ougandaises pour le soutien combien utile etimportant
qu'elles ne cessent d'apporter à notre Réseau, nous
permettantainsidetenir cette3ème conférence biennale
dans cette belle et historique capitale Kampala.
Vive le Réseau africain de recherche sur les petits
ruminants.
Vive la coopération scientifique internationale.
SmallRuminantResearchNetworkWorkshop

SESSION 1
Genetic Resources
Enhancement and Utilisation


Biotechnology optionsforimprovinglivestockproduction
in developingcountries,with special reference
toSub-Saharan Africa
J.E.O. Rege
International Livestock CentreforAfrica(ILCA)
PO. Box5689,AddisAbaba, Ethiopia
Abstract
Techniques of modern biology such as molecular
cloningofgenes,genetransfer,genetic manipulation of
animalandplant embryotransfer, genetic manipulation
ofrumen microbes, chemical and biological treatment
oflowqualityanimalfeedsforimproved nutritivevalue,
genetically engineered immunodiagnostic and
immunoprophylactic agents as well as veterinary
vaccines, inter alia, are a realitytoday and are finding
theirways into research and developmentprogrammes
of developing countries. Biotechnology is offering
unprecedented opportunitiesforincreasing agricultural
productivityandforprotectingtheenvironmentthrough
reduced use of agro-chemicals. The major thrust in
biotechnology research is currently directed at solving
immediate problems of industrialised countries, with
major investments coming from transnational
companies. However, many ofthe newdiscoveriesand
products will find their biggest markets in developing
countries where the potential for improvement in
agricultural productivity and health is greatest. The
importance ofbiotechnology and its relevance is only
slowlybeing accepted bypolicy makers in developing
countries. In the presence of economic crisis, strong
fiscal constraints, rapid social change and constant
political instabilities, the difficulties associated with
major policy changes in developing countries are
enormous.Thispaperreviewsavailablebiotechnologies
withpotentialapplicationin livestockimprovementand
identifies those which have been or may be appliedin
developingcountries ingeneral, andAfricainparticular.
The review covers biotechnology applications in the
areas of animal genetics and breeding, including
conservation ofanimalgenetic resources,animalhealth,
physiology of lactation and growth, and animal
nutrition.
Introduction
Developing countries are faced with the challenge to
rapidly increase agricultural productivity to help feed
theirgrowingpopulationswithout depletingthe natural
resource base. Biotechnologyis regarded as a means to
meetboth objectivesthrough addressingtheproduction
constraints ofsmall-scale orresource-poorfarmerswho
contribute more than 70% of the food produced in
developingcountries.
Biotechnology can be defined as any technique
that uses living organisms or substances from such
organisms to make or modify a product, to improve
plants or animals or to develop micro-organisms for
specific purposes. Biotechnology is not new. Man has
used it for thousands ofyears to manufacture products
such as beer, wine and bread. Conventional plant and
animalbreedingwhichinvolves selection andmating of
phenotypicallypreferredindividualsis agood example
ofage-old application ofbiotechnology.Whatis new
about biotechnology comes from more recent
breakthroughs such as recombinant DNA technology
and associated techniques, monoclonal antibody
techniques,embryo manipulationtechnologyetc.These
have enhancedpossibilitiesfor manipulatingbiological
systemsforthebenefit ofmankind.
Among agricultural and allied fields, animal
production andhealthhaveprobablybenefittedthe most
from biotechnology. But successful application of
biotechnology hasgenerallybeen limitedto developed
countries. Specifically, there are hardly any success
stories of the application of biotechnology in the
improvement of livestock production in Africa. The
purpose of this paper is to review available bio
technologies with potential application in livestock
improvementandtoidentifythose whichhavebeen or
maybe appliedin developing countriesin general, and
Africainparticular. In addition,thepapergives a"broad
brush" examination ofpossible reasons for failure of
those technologies which have been tried. The paper
also presents examples of successful application of
biotechnology in Africa and the potential role of
biotechnology(both"old"and"new")infuture livestock
development in Africa.Thepaper starts by presenting
an overview of biotechnologies with current and/or
potential applications in the areas of reproductive
physiology, genetics and animal breeding, animal
health,physiology of lactation andgrowth and animal
nutrition. Giventhebreadth ofthe topic, notmuchdepth
isgiven tothe reviewofeach area. Rather, an attemptis
made to highlightthe technologies considered to have
current or potential application. The paper concludes
with a fleeting coverage of issues concerning the
potential environmental hazards ofgenetic engineering
and otherbiotechnologies, andthe needfortheir ethical
Small RuminantResearchNetworkWorkshop 11

Rege
evaluation and for an international regulatory
mechanism.
Overviewofavailable biotechnologies
Reproductivephysiology
One ofthe challenges for genetic improvement is to
increase reproduction rates. Several reproduction
techniques are available.The commonest ofthese are
artificial insemination (AI), embryo transfer and
associated technologies. Measurement ofprogesterone
in milk or bloodwhich is a widely used technique for
monitoring ovarian function andforpregnancytests is
also an important technology for managing the
reproductivefunction ofthe animal.
Artificialinsemination
No other technologyin agriculture, except hybrid seed
andfertiliser use, has been sowidely adopted globally
as AI. Progress in semen collection and dilution, and
cryopreservation techniques now enables a single bull
to be usedsimultaneouslyin several countriesforupto
100000inseminations ayear(GibsonandSmith 1989).
This impliesthat averysmall number oftopbulls can
be usedto serve a large cattle population. In addition,
each bullisable toproduce a large numberofdaughters
in agiventime thus enhancingthe efficiency ofprogeny
testing of bulls. The high intensity and accuracy of
selectionarisingfromAIcanleadtoafour-foldincrease
inthe rate ofgeneticimprovementindairycattle relative
to thatfrom natural mating(VanVleck 1981)
Awider and rapid use ofselected malesthrough
AI will accelerate the rate of gender improvement.
Also, use of AI can reduce transmission of venereal
diseases in a population and the need for farmers to
maintain their own breeding males, facilitate more
accurate recordingofpedigree andminimisethe cost of
introducing improved stock. However, success ofAI
technology depends on accurate heat detection and
timelyinsemination.Theformer requires a certain level
of experience among farmers while the latter is
dependent on good infrastructure, including transport
network, and availability ofreliable means oftransport.
Though AI is widely available in developing
countriesitis usedfar less,particularlyin Africa,than
in developed countries. Its use has been limited largely
to"'exploratory"purposes mainlyby research institutions.
Afew countriesincluding Botswana, Ethiopia,Ghana,
Malawi, Mali, Nigeria, Senegal andSudan have taken
the technologyto the field, mostly for programmes of
"'upgrading" indigenous stock and as a service to a
limited number ofcommercial farmers keeping exotic
dairy cattle breeds. A few others have used the
technology more widely. Kenya and Zimbabwe, for
example, have elaborate AI systems which include
national insemination services incorporating progeny
testing schemes. However, even these have gone
throughperiods ofcollapse orserious degeneration and
have had to go through "rehabilitation" phases. The
Republic ofSouthAfricaisprobablythe biggestuser of
AI technology in terms of number of inseminations.
This country alsohaswhatisperhapsthe best organised
progenytestingscheme onthe continent.
AI technology use is still more generally
associated with dairy cattle than other domestic
livestockspecies.The limitations ofAIuseinbeefcattle
includethedifficultyindetectingheatinlargebeefherds
kept on ranches and the less frequent handling of
individual cows. In sheep and goats the failure to
develop a simple, non-surgicalinseminationprocedure
hasprevented extensive exploitation ofthe technology
in sheep (Robinson and McEvoy 1993). However,the
technical success of laparoscopic intra-uterine
insemination hasprompted research into less invasive
transcervical procedures(Halbertetal 1990; Buckrellet
al 1992). Also, in Africa, research to improve the
freezing-and-thawing properties of sheep semen is
underwayin the Republic ofSouth Africa. In pigs use
of AI is hampered by the inability to successfully
cryopreserve boarsemen.
AIis credited for providingtheimpetus for many
other developmentswhichhave had aprofoundimpact
on reproductive biotechnology. Foote(1982)notedthat
studies ofoestrus detection and ovulation controlwhich
evolved out ofa need to correctly time inseminations,
ledtothe development ofembryo-transfertechnology.
Embryotransfer (ET)
Although noteconomicallyfeasible for commercialuse
on small farms at present, embryo technology can
greatly contributeto research andgeneticimprovement
in local breeds. There are two procedures presently
available for production of embryos from donor
females.Oneconsists ofsuperovulation,followedbyAI
and then flushing ofthe uterustogather the embryos.
The other, called in vitrofertilisation (IVF), consists of
recovery of eggs from the ovaries ofthe female then
maturingandfertilisingthem outside the bodyuntilthey
are ready for implantation into foster females. IVF
facilitates recovery ofa large numberofembryosfrom
a single female at a reduced cost thus making ET
techniques economically feasible on a larger scale.
Additionally, IVFmakes available embryossuitablefor
cloning.
The principal benefit of embryo transfer is the
possibility to produce several progeny from a female,
just as AI can produce many offspringfrom one male.
For example the average lifetime production ofa cow
can be increased from 4 to 25 calves. Increasing the
reproductive rate ofselectedfemales hasthe following
benefits: genetically outstandinganimals can contribute
more to the breedingprogramme, particularly iftheir
sons arebeingselectedforuseinAI;the rate ofgenetic
change can be enhanced with specially designed
breeding schemes which take advantage of increased
intensity offemale selection combined with increased
generation turnover; transport of embryos is much
cheaper than that of live animals; risk of importing
diseases is avoided; facilitates rapid expansion ofrare
12 Small RuminantResearch NetworkWorkshop

Biotechnologyoptionsforimprovinglivestock production
but economically important genetic stocks; and the
stress to exotic genotypes can be avoided by having
themborn todamsoflocalbreeds ratherthanimporting
them as live animals.
Embryotransferis still notwidelyused despite its
potential benefits. Indevelopingcountriesthis ismainly
due to absence of the necessary facilities and
infrastructure. Even in developed countries, cost
considerations still limitthe use ofcommercial embryo
transfer in specialised niches orfor asmallproportion
ofbest cowsin the best herds.Thus,in North America
andEurope,onlyaboutone out of500calvesborninthe
last decade was from ET(Seidel and Seidel 1992).
Commercialembryotransferismorepopularwith cattle
than other species. This is mainly because ET is
relatively easierin cattle than the otherspecies and also
because it is more economicalin cattle (i.e. cattle are
worthmore).Additionally,thelowreproductiverateand
the long generation interval of cattle make ET much
more advantageousin cattle.
Production ofseveral closely related, and hence
genetically similar,individualsthrough ETtechniques
canmakecritical contributionsto research. Forexample
aprojectatthe InternationalLaboratoryfor Researchon
Animal Diseases (ILRAD) to locate the genes
responsible for tolerance ofsome cattle populationsto
trypanosomiasis required large numbers of closely
related crosses of trypanotolerant and trypano
susceptible cattle.Use ofET has made itpossible to
generate suchfamiliesthereby facilitating thesearchfor
genetic markers oftrypanotolerance. Additionally, ET
couldbeusefulin studyingthe extenttowhich atrait is
influenced by the embryo (direct component) or the
reproductive tract(maternal component).
Embryosexingandcloning
Although embryosexingmaynothave dramaticeffects
on rates ofgeneticgain (Colleau 1991; Kinghorn et al
1991)it can considerablyincrease efficiency.Taylor et
al (1985) concluded from a study that an all-female
heifersystemusingETwas50%more efficientthanthe
highest achievable in a traditional system. It has been
suggested that, if multiple sexed-embryo transfer
became as routine an operation asAIis,beefoperations
basedonthissystem couldbecomecompetitivewithpig
andpoultryproduction in terms ofefficiency offood
utilisation.
Clones maybeproducedby embryo splitting and
nuclear transfer (Macmillan and Tervit 1990). These
offer the possibility for creating large clone families
(Woolliams and Wilmut 1989)from selected superior
genotypes which, in turn, can be used to produce
commercial clone lines (Smith 1989). However,some
studies have concludedthat cloningofembryoswill not
increase rates ofgeneticprogressinthenucleus,butthat
it offers considerable advantages in increasingthe rate
of dissemination of tested superior genotypes in
commercial populations (Woolliams 1989). Other
potential applications of cloning include efficient
evaluation ofgenotypex environment interactions and
testing and/or dissemination of transgenics. From a
research standpoint, production of identical siblings
should, by eliminating variability among animals,
greatly reduce the size and hence the cost of
experiments.
Hormoneuse
Use of hormonal assays to monitor reproductive
function can be rewardingfor both research purposes
andcommerciallivestockoperations.Reproductioncan
also be manipulated using hormonal treatments. But
while hormonal treatments have produced desirable
results in some studies in Africa (Aboul-Naga et al
1992), lackofawarenessabouttheiruse andthe factthat
they are not economicallyviable under mostprevailing
production circumstances limittheir use. Progesterone
and PMSG treatment and immunisation against
androstenedione increased ovulation rate in Ossimi
sheep.Also, exogenous melatonin treatment ofbarren
Rahmani ewes resulted in increased proportion of
ovulatingewesand ahigherovulationrate (Aboul-Naga
etal 1992).These responses, however, did notresultin
increased litter size because ofincreased ovawastage.
Thus, in addition to the impracticability arising from
prohibitive prices of hormonal preparations and the
problems with hormonal administration at farm level,
there are other technicalproblems associated with the
use ofthese technologies. For example, technologies
aimed at increasing litter size in traditional small
ruminant production systems should not be applied
unless management, including nutrition, can be
improved in concert to ensure the survival of the
additionalprogeny.
Reproduction can also be manipulated without
application of exogenous hormones. Aboul-Ela et al
(1988) reported that exposing ewes to rams one week
prior to mating ("the ram effect") increased the
percentage ofewes in oestrus (and hence the per cent
mated) by 27%. Such management approaches offer
practical options for increasing annual lamb (or kid)
production in situations where other technologies are
either not available or not appropriate. "Accelerated
lambing"-increasingthe numberoflambingsperyear
– can also be used to increase annual productivity.
However,in tropical and subtropical situationswhere
animals dependon seasonally availablenaturalpastures,
this practice may not be sustainable. Under such
circumstances the reproductive cycle tends to be
dictatedby availability offeeds.
Animalgeneticsand breeding
Geneticimprovement oflivestockdependson accessto
genetic variation and effective methods for exploiting
this variation. Genetic diversity constitutes a buffer
against changes in the environment and is a key in
selection and breedingfor adaptability and production
on a range ofenvironments.
In developed countries, breedingprogrammes are
basedupon performance recordingandthis has led to
Small RuminantResearch NetworkWorkshop 13

Rege
substantial improvements in animal production.
Developing countries have distinct disadvantages for
setting up successful breeding programmes :
infrastructure needed for performance testing is
normally lackingbecause herd sizes are normallysmall
and variability between farms, farming systems and
seasons are large; reproductive efficiency is low, due
mainly to poor nutrition, especially in cattle; and
communal grazing precludes implementation of
systematicbreedingand animalhealth programmes.
Multiple ovulation embryotransfer and open
nucleus breedingsystem
Multiple ovulation embryo transfer (MOET) is a
composite technologywhich includes superovulation,
fertilisation, embryo recovery, short-term in vitro
culture of embryos, embryo freezing and embryo
transfer. Benefits from MOETinclude increasingthe
number of offspring produced by valuable females,
increasing the population base of rare or endangered
breeds or species, ex situ preservation of endangered
populations,progenytesting offemales and increasing
rates ofgeneticimprovementin breedingprogrammes.
Genetic improvement of ruminants in developed
countries has made much progress in the last 35 or so
yearsthrough the use of large-scale progenytesting of
males. As has been pointed out, the general failure of
extensive use ofAIin developingcountrieshasimplied
thatprogenytesting schemes cannotbe operated with
much success. In any case the generally small
herds/flocks and uncontrolled breeding in communal
grazingsituations preclude implementation ofprogeny
testing. Smith(1988a)suggestedthattheOpenNucleus
BreedingSystem (ONBS) may be especiallyvaluable
for developingcountrieswhere the use ofAIhasbeena
failure due tothe reasonsgiven above.
The ONBS conceptis based on a scheme with a
nucleus herd/flock established under controlled
conditions to facilitate selection. The nucleus is
established from the "best" animals obtained by
screeningthebase(farmers')populationforoutstanding
females. These are then recorded individually andthe
best individuals chosen to form the elite herd/flock of
the nucleus. IfETis possible,the elite female herdis
used through MOET with superior sires to produce
embryoswhichare carriedby recipientfemalesfromthe
base population.The resulting offspring are reared and
recorded andthe malesamongthemare evaluatedusing,
asappropriate,the performanceoftheirsibsandpatèrnal
halfsibsandtheirownperformance.Fromthese,anelite
groupofmaleswithhighbreedingvaluesforthespecific
trait is selected and used in the base population for
genetic improvementthrough natural service or AI. It
should be notedthat,whileMOETimprovesthe rate of
progresssubstantially, itis possible to operate anONBS
without ETtechnology, especially in species, such as
small ruminants, with high reproductive rates. Such
schemes are beingtried for sheepinWestAsiabyFAO
(Jasiorowski 1990) and in Africa (Yapi et al 1994).
However, availability of AI and ET, in addition to
increasing rates ofgeneticgain, enhance the flexibility
of the system. For example, germplasm from other
populations can be introduced easily through semen
and/or embryos. One ofthe advantages ofa nucleus
herdisthatitprovides opportunitytorecordinformation
onmore traits thanis possibleinadecentralisedprogeny
testingscheme.
TheONBScanbeusedforthe improvementofan
indigenous or exotic breed. It can also be used to
improve a stabilisedcrossbredpopulation.The level of
thegenetic response depends on the size ofthe scheme
(that is, number ofparticipating herds/flocks andtotal
numberofanimals) andthe selectionintensity.
An ONBS can initially be developed to form a
focusfornationalsire breedingand selection activities.
In time, and with experience, the capacity can be
expanded and ET introduced to increase the rate of
geneticprogress.
At one time it was suggested that application of
MOET in nucleus breeding schemes could increase
animal geneticgainsby30-80%(Nicholas andSmith
1983). More recently it has been concluded that the
earlier figureswere over-predictions(Kelleretal 1990).
The over-predictions arose partly because the assumed
average numberofprogeny(eight)perdonorfemalewas
unrealistically high and partly because of wrong
assumptions made aboutgenetic parameters (Keller et
al 1990).The realistic average number oflive progeny
per donor flushed is in the range of2-3in sheep and
cattle and 6-8in goats (Macmillan andTervit 1990).
Consideration ofthese figuressuggestthatMOETcould
increase annual genetic gains by 10-20% in large
nucleusbreedingschemes. However,costs ofoperating
such schemes in developing countries need to be
evaluatedbefore they can be recommended.
Indicatortraits
Indicatortraits are characteristicswhich aregenetically
correlated to traits of economic importance and are
easier to measurethan the latter. Suchtraits are usually
notthe target ofgenetic improvements butprovide an
indirect means ofimprovinga targeted trait. Blair et al
(1990) reviewed some physiological and/or metabolic
characteristicswhich might be considered as potential
indicator traits.Traits such as testicular size in rams or
bulls or FSH in ewe lambs (Bodin et al 1986) have
potential as indirect predictors offertility. Indicator
traits can improve genetic response by increasing
accuracy ofselection and reducinggeneration interval.
Thevalue ofanindicator trait willdepend largelyonthe
magnitude ofco-heritability(square-root oftheproduct
ofheritabilityoftheindicator and ofthetarget trait) and
the genetic correlation between the two traits
(Woolliams and Smith 1988). Woolliams and Smith
(1988) concluded that, with high co-heritability,
selectionfortheindicatortraitalone canresultingreater
rates ofresponse than ispossible withprogenytesting,
especially when breeding values are not accurately
measuredbyprogenytesting.
Packed cell volume (PCV), an indication ofthe
extentofanaemia,iswidelyusedas anindicatortrait for
14 Small RuminantResearch NetworkWorkshop

Biotechnology options forimproving livestockproduction
pathological conditions associated with anaemia. For
example, PCVis currently used at ILRAD and ILCA
(International Livestock Centre for Africa) as an
indicator ofthe effect oftrypanosomiasis and hence of
trypanotolerance, and at ILCAas an indicator ofeffect
ofthe endoparasiteHaemonchuscontortus andhenceas
an indicator ofresistance totheparasite.
Genetic markers and marker-assisted selection
Agenetic markerfor a trait is aDNAsegmentwhichis
associated with, and hence segregates in a predictable
pattern as, the trait. Genetic markers facilitate the
"tagging" of individual genes or small chromosome
segments containinggeneswhich influence the trait of
interest.Availability oflarge numbers ofsuch markers
has enhancedthe likelihood ofdetection ofmajorgenes
influencing quantitative traits. The method involves
screeningthegenomeforgenes with a large effect on
traits of economic importance through a procedure
known as linkage analysis (Paterson et al 1988). The
chances of major genes existing for most traits of
interest, and offindingthem are consideredtobe high
(Mackinnon 1992). The process of selection for a
particular trait usinggenetic markers is called marker
assisted selection (MAS).MAS can accelerate the rate
ofgeneticprogressbyincreasing accuracy ofselection
and by reducing the generation interval (Smith and
Simpson 1986).However,thebenefitofMASisgreatest
for traits with low heritability and when the marker
explains a largerproportionofthe geneticvariance than
does the economic trait. Lande andThompson (1990)
suggestthat about50% additionalgeneticgain can be
obtained ifthe marker explains 20% ofthe additive
geneticvarianceandtheeconomictraithas aheritability
of02. MAS also facilitates increased rate ofgenetic
gain byallowing measurementin youngstockthereby
reducinggeneration interval.
Marker identification and use should enhance
futureprospectsforbreedingforsuch traits astolerance
or resistance to environmental stresses, including
diseases.Already,identification ofcarriers ofgenesfor
resistance and introduction of such genes into a
population seems feasible for resistance against
Trichostrongylus colubriformis and Haemonchus
contortus(Gogolin-Ewens et al 1990). Itshouldalsobe
possible to eliminate factors predisposing sheep to
Listeriosis or Salmonellosis (Blancou 1990).There is
alsoevidenceforamajorgeneforresistancetothe cattle
tick(Boophilus microplus)in a Hereford xShorthorn
cattle line called BelmontAdaptaur(Kerr et al 1994).
Research is currentlyunderway at ILRADto identify
genetic markers for tolerance to African trypano
somiasisinN'Dama cattle and atILCAforresistance to
endoparasitesinRedMaasaisheep.
Transgenicanimals
Atransgenicanimalisan animalwhosehereditaryDNA
hasbeenaugmentedbyaddition ofDNAfrom asource
other than parental germplasm through recombinant
DNAtechniques.Transfer ofgenes or gene constructs
allows for the manipulation ofindividualgenes rather
than entiregenomes.Therehasbeen dramaticadvances
ingenetransfertechnologyinthe lasttwodecades since
the first successful transferwas carried outin mice in
1980 (Palmiter et al 1982; Jaenisch 1988). The
technique has now become routine in the mouse and
resulting transgenic mice are able to transmit their
transgenes to their offspring thereby allowing a large
number of transgenic animals to be produced.
Successfulproduction oftransgenic livestock has been
reportedforpigs,sheep, rabbits andcattle.The majority
ofgenetransferstudiesin livestockhave,however,been
carried outin the pig. Although transgenic cattle and
sheep have been successfullyproduced, the procedure
is still inefficientinthese species(Niemann etal 1994).
Transgenesis offers considerable opportunity for
advancesin medicine and agriculture. In livestock,the
ability to insert new genes for such economically
important characteristics asfecundity, resistance to or
tolerance of other environmental stresses would
represent a major breakthrough in the breeding of
commercially superior stock.Another opportunitythat
transgenictechnologycouldprovide isintheproduction
of medically important proteins such as insulin and
clottingfactors in the milk ofdomestic livestock.The
genescodingforthese proteinshavebeenidentified and
the human factor IX construct has been successfully
introducedintosheepand expression achievedin sheep
milk(Clark et al 1990). Moreover,the founder animal
has been shown to be able to transmit the trait to its
offspring(Niemann etal 1994).To date,the majority of
genestransferred intosheephavebeengrowthhormone
encodinggene constructs.Unfortunately,in mostcases
the elevated growthhormone levels have resultedinto a
clinicaldiabetessituation leadingtoan earlydeathofthe
transgenicsheep(Rexroadetal 1990).Transgenicsheep
have recently been generated which express the visna
virus envelopegene (Clements etal 1994).
The first reports ofthe production oftransgenic
animals created a lot of excitement among biological
scientists. In the field of animal breeding, there were
diverse opinions on how the technology might affect
livestock genetic improvement programmes. Some
(Ward et al 1982) believedthatitwould result in total
reorganisation ofconventional animal breedingtheory
while others (Schuman andShoffner 1982) considered
the technology as an extension of current animal
breeding procedures which, by broadening the gene
pool,would make new and novelgenotypes available
for selection. Application ofthe technologyin animal
improvementisstillfarfrombeingachieved. However,
consideration needs to be given toits potential role in
this field.Smith etal(1987)presented acomprehensive
evaluation ofstrategies fordeveloping, testing,breeding
and disseminatingtransgenic livestockinthe contextof
quantitative improvement ofeconomictraits.
An important contribution of transgenic
technologyis in the area ofbasic research tostudythe
role ofgenes inthe control ofphysiologicalprocesses.
The understanding of the molecular control of life
Small RuminantResearch NetworkWorkshop15

Rege
processes hasimportantimplications forboth medicine
and agriculture. For example,the generation (through
mutation ofanendogenousgene)ofan organismwhich
lacksa specificgeneis apowerfultooltoinvestigate the
function of the gene product. This type of genetic
analysishasbeenfacilitatedbythe availabilityofinvitro
cultures of embryonic stem cells from mice (Bradley
1994).
Recent advances in in vitro technology (in vitro
fertilisation and maturation)willincreasethe numberof
zygotes available forgenetransferpurposes.This,plus
the utilisation ofembryonicstem cell(Stice et al 1994)
andprimodialgerm cell(Stokesetal 1994)technologies
should enhance the efficiency ofgene transfer in cattle
andsheep considerably.
Genetic characterisation ofanimalgenetic
reSOlIrCeS
Developing countries are endowedwiththe majority of
the global domestic animal diversity - landraces,
strains or breeds. Some livestock breeds in these
countries are in immediate danger of loss through
indiscriminate crossbreeding with exotic breeds.The
importance ofindigenous livestockbreeds liesin their
adaptation to local biotic and abiotic stresses and to
traditional husbandrysystems. However,mostofthese
animalgenetic resources are still not characterised and
boundariesbetween distinctpopulationsareunclear. In
such cases breeds are defined on the basis ofsubjective
data andinformation obtainedfrom local communities.
Reliance on these criteria asthe basisfor classification
for utilisation and/or conservation maybe misleading.
Additionally,historicalevidenceis not alwaysaccurate,
relying as it often does on subjective judgements.
Archival research can reveal much about the original
type of a breed or strain but it is molecular genetic
evidencewhichisfactualandprecise. It isinthis sphere
thatbiotechnology has an important role.
Geneticuniqueness ofpopulations is measuredby
the relativegenetic distances ofsuchpopulationsfrom
each other. Polymorphism in gene products such as
enzymes,bloodgroup systems and leukocyte antigens
which have traditionally been used for measuring
genetic distance are being rapidly replaced by
polymorphism at the level of DNA, both nuclear
(Jeffreys and Morton 1987) and mitochondrial (Loftus
etal 1994)as a source ofinformation forthe estimation
ofgenetic distances.The first DNApolymorphisms to
beusedwidelyforgenome characterisation and analysis
were the restriction fragment length polymorphisms
(RFLP) (Southern 1975) which detect variations
ranging from gross rearrangements to single base
changes. Minisatellites sequences of 60 or so bases
repeated many hundreds or thousands oftimes at one
unique locus within the genome have been used to
generateDNAfingerprintstypical ofindividualswithin
species (Jeffreys and Morton 1987). Microsatellites
(WeberandMay 1989)repeats ofsimple sequences,the
commonestbeing dinucleotide repeats are abundantin
genomes of all higher organisms, including livestock.
Polymorphism of microsatellites takes the form of
variation inthe numberofrepeats atanygiven locusand
is generallyrevealed asfragment lengthvariationinthe
products of polymerase chain reaction (PCR)
amplification ofgenomic DNAusingprimers flanking
the chosenrepeatsequence andspecificforagiven locus
(Kemp andTeale 1991). Ease ofidentification and of
sequence determination(Moore etal 1992)andneedfor
onlysmallamounts ofDNA, aresomeofthe advantages
ofmicrosatellites.Additionally,because microsatellite
polymorphisms canbe described numerically, theylend
themselvesto computerised data handlingand analyses
(Teale et al 1994). Microsatellites can be used in
non-PCR systems in a way similar to minisatellite
probes(Haberfeld et al 1991).
Randomly amplifiedpolymorphic DNA(RAPD)
(Williams et al 1990) has been extensively used for
genetic characterisation of a wide range of organisms.
The technique uses short (up to 10 bases) primers to
amplify nuclear DNAin the PCR.The procedure does
not require knowledge ofthe sequence ofDNAunder
study;primers are designed randomly.The basis ofthe
polymorphism detectedbythis method is thatproducts
are eithergeneratedin PCRor not.
Complete sequencing ofthegenomeistheultimate
form of genetic characterisation. Sequencing has
traditionallybeen expensive and laborious,butwiththe
advent of automated sequencing this is changing
rapidly. However,sequencingis unlikelytobe used as
a technique ofchoice forgenetic characterisation.
Nei and Takezaki (1994) reviewed statistical
methods for estimating genetic distances and for
constructing phylogenetic trees from DNA sequence
data and concluded that different analytical methods
may produce different results. Teale et al (1994)
commentedonwhat considerationstobe made in using
DNA polymorphism data for genetic distance
estimation and cautionedthatgreat care hastobe taken
in selectingcharacterisation methodsandininterpreting
the resulting data.While recognisingthe importance of
the uniparental mode ofinheritance of mitochondrial
DNA in detectingunderlying population structure not
discernible from analyses ofnuclearDNA,Loftus et al
(1994)concludedthat mitochondrialDNAanalysismay
not be sufficient to resolve breed differences within
Africa. MacHugh et al (1994) suggested that
microsatellite polymorphism may be more suitable
when trying to discriminate between closely related
populations. Regardless ofwhich method is used, the
ultimate goal in genetic characterisation for
conservation is to obtain a measure of available
diversity.
Conservation ofanimalgenetic resources
Theterms conservation, preservation, ex situ andin situ
areused here accordingtothe definitiongiven byFAO
(1992).There are severalways, differingin efficiency,
technical feasibility and costs, to conserve animal
genetic resources. Developing and utilising a genetic
16 Small RuminantResearch NetworkWorkshop

Biotechnology optionsforimproving livestockproduction
resource is considered the most rational conservation
strategy. However, there are cases where ex-situ
approaches are the onlyalternatives. Ex-situ approaches
include: maintenance ofsmallpopulationsin domestic
animal zoos; cryopreservation of semen (and ova);
cryopreservation ofembryos;andsomecombinationsof
these. Brem et al(1989) reviewed biotechnologiesfor
ex-situ conservation.
Cryopreservation ofgametes, embryos or DNA
segments can be quite aneffective andsafe approachfor
breeds or strainswhose populations are toosmalltobe
conserved by any other means. The safety of these
methods has been demonstrated by background
irradiation studies. For example, studies based on
irradiation ofmouse embryos exposedtothe equivalent
ofhundredsofyears ofbackgroundmutationshowedno
detectable damage (Whittington et al 1977).
Regeneration of offspring following transfer of
frozen-thawed embryos has been successful for all
major domestic species, exceptthe buffalo(Teale et al
1994). In cattle,the transfer offrozen-thawedembryos
is nowa commercialpractice and embryosurvival rate
afterthawing can be as high as80% with apregnancy
rate of about 50%. Cryopreservation of oocytes
followedbysuccessfulfertilisation and live births have
been achieved in the mouse. Cryopreserved bovine
oocyteshavebeensuccessfullymaturedandfertilisedin
vitro andzygotes developedto blastocyststage (Lim et
al 1991).These trends strongly suggest that long-term
cryopreservation of mammalian oocytes is possible
(Teale et al 1994).
Respective pregnancy rates of 58 and 50% for
freshandfrozen-thawedin vitroproducedembryoshave
been reported (Lu et al 1990). Also, calves have been
producedfrom transfer ofboth split andfrozen-thawed
in vitroproducedembryos.
Economic aspects ofgenetic conservation in farm
animals has been assessed by Brem et al (1984). The
study concluded that costs of ex situ live animal
conservation was moderate to high while costs of
long-term cryopreservation ofgameteswere low.
Developmentingeneticengineering,cryobiology,
cell biology and embryology will provide techniques
that may enhance our abilitytopreservegermplasm in
vitro.Techniques such as transfer ofDNAwithin and
between speciesandtheproduction ofviable transgenic
animals are far from practical application. However,
biotechnology will certainly contribute newer and
cheaper methods for preservation such as storage of
cataloguedDNA.Atpresent, otherthan live animaland
embryopreservation, the othertechniques donot allow
preservation of genomes in a form which can be
reactivated in toto at a later stage, butthey permitthe
preservation ofindividualgenes orgene combinations
for possible future regeneration.
Conservation of indigenous animal genetic
resources should be one of the priority livestock
development activities for developing countries.The
criticalimportance ofthese resourcestotheir ownersin
developing countries need not be emphasised. Their
importance to developed countries is also becoming
evident as indicated by the increasing importation of
tropicalgermplasmbythese countries. It is highlylikely
that these resources will become of increasing
importance to the industrialised countries either as
sources of unique genes or when environmental
concerns necessitate change in production systems.
Developed countries should, thus, assist in the
conservation and development of these resources.
Technologyfor cryopreservation ofsemen and embryo
is sufficiently developed to be applied in developing
countries. What is missing is financial support to
implement conservationprogrammes.Suchsupport has
beenprovidedforworld-wide conservationactivitiesfor
plant germplasm.There isalso astrong case forsupport
of animalgenetic resources conservation.
Animal health
Disease diagnosis
Successful control of a disease requires accurate
diagnosis. This has been greatly improved in recent
yearsthroughdevelopmentsinbiotechnology.The most
recent major development,the findingthatit is possible
to immortalise individual antibody-producing cells by
hybridisation to produce antibodies of a given class,
specificity andaffinity(i.e. monoclonal antibodies) has
providedatool thatpermitsthe analysis ofvirtually any
antigenic molecule (Kenneth et al 1980). The use of
monoclonal antibodies has revealed that the failure of
vaccines(e.g. ofrabies)toprovideprotectionin all parts
ofthe world was due tothe diversity in the antigenic
composition of the causative virus (Wiktor and
Koprowski 1980). The (monoclonal antibody)
technology is relatively simple and can readily be
appliedin developingcountries.Monoclonal antibodies
are currently supplied to developing countries directly
orintheform ofkits andsimple reagentsforcompletion
ofthe tests (Ferris et al 1988). For example, kits for
rinderpest virus diagnosis used in African countries
come in thisform.
The abilitytogenerate highlyspecific antigens by
recombinantDNAtechniques has made itpossible for
anincreasingnumberofenzyme-linkedimmunosorbent
assays (ELISA) to have the capacity to differentiate
between immune responses generated by vaccination
from those due to infection (Robinson and McEvoy
1993).This has madeit possible to overcome one ofthe
major drawbacks ofantibody detection tests : the fact
that, because antibodies canpersistin animalsfor long
periods, their presence may not indicate current
infection. ILRAD has developed a technique to
overcomethisproblemin diagnosis oftrypanosomiasis.
The parasite antigen detection test uses monoclonal
antibodies raised in laboratory mice (Nantulya and
Lindqvist 1989)to capture the parasite antigenswhich
are then revealed bytheir reaction with a second layer
antibody to which is conjugated an easily detectable
enzyme. This test reveals current infections and
facilitates differentiation between the major
Small RuminantResearch NetworkWorkshop 17

Rege
trypanosome species. This has important implications
for diseasecontrol, especiallybecause ofthe association
of different parasite species with different epide
miological and disease circumstances.
Theadvent ofPCRhas enhancedthe sensitivity of
DNA detection tests considerably. For example, PCR
used in combination with hybridisation analysis, has
beenshown(Brandon et al 1991)toprovide asensitive
diagnostic assayto detect bovine leukosisvirus.
Other diagnostic techniques include nucleic acid
hybridisation (NAD) and restriction endonuclease
mapping(REM). As hasbeen indicated above, one of
the mostvaluablefeaturesofthesemoleculartechniques
is their specificity and sensitivity.Agood example of
the specificity of NAD is its application in
distinguishing infections caused by peste des petits
ruminants (PPR) virus from rinderpest (Lefevre and
Diallo 1990), diseaseswhose symptoms are clinically
identical and which cannot be distinguished
antigenically with available serological reagents.This
technique also allows comparison ofvirusisolatesfrom
differentgeographical locations. Detailed overview of
biotechnological tools for diagnosis of livestock
diseases has been provided by Bourne and Bostock
(1992)andRobinsonandMcEvoy(1993).
Other available diagnostic techniqueswhich may
have application in small ruminants and/or cattle
include: nucleic acid probes (NAP) for heartwater
(Cowdria ruminantium), chlamydia psitacci,
Paratuberculosis and Bluetongue (Blancou 1990;
Knowles andGorham 1990); restriction endonuclease
reaction (RENR) for diagnosis of Corynebacterium
pseudotuberculosis(Knowles andGorham 1990); PCR
forcharacterisingsubtypes ofBluetonguefromdifferent
geographical regions (Osburn 1991); monoclonal
antibodies (MAB) for differentiating false positive
anti-Brucella titres caused by Yersinia enterocolitica
and true positive anti-Brucella titres in latent infected
animals(Haas et al 1990); andMABfor diagnosis of
Toxoplamosis, Pasteurellosis, Mycoplasma spp, PPR
and Boder Disease (Blancou 1990; Lefevre and Diallo
1990). Examples of tropical diseases for which
diagnostic tests are available are presented in Table 1.
Teale(1991)reviewedthe diagnostictechniquesthatare
currently available orwhich could be developedin the
nearfuture.
Table 1.Tropical diseasesforwhichprobes and monoclonal
antibodies (MAB)are available.
BacterialdiseasesViral diseases
Rinderpest Cowdriosis
Peste despetits Contagiousbovinepleuropneumonia
ruminants
Bluetongue Contagious agalactia
African horse Contagious caprinepleuropneumonia
sickness
Foot-and-mouth Anaplasmosis(A. centrale and
disease A. marginale)
Vesicular Haemorrhagicsepticemia(onlyMAB
stomatitis available)
Source: Lefevre (1992).
Vaccines
Conventional means of controlling major livestock
diseases include chemotherapy, vector control,
vaccination, slaughter of infected stock, and other
management practices(includinggrazing management
and controlled stock movements). Vector control
requirescontinuous application ofpesticides.These are
often unaffordable to farmers in developing country.
Moreover, where these drugs or pesticides are used,
resistance by parasites is often encountered and
reinfection following administration of drugs against
parasiticdiseasesusually occurs.Additionally,inmany
cases drugs are not readily available locally. In some
cases where they are available, they are ineffective,
either becausethey have been partlypreserved or they
are notgenuine.
Immunisation remainsone ofthe mosteconomical
means of preventing specific diseases. An effective
vaccine can produce long-lasting immunity. In some
cases, vaccination can provide lifetime immunity.
Moreover a small number ofdosesis usually required
for protection. Level of infrastructure and logistical
support required for a large-scale vaccination
programme is such that a successful vaccination
campaign canbeimplementedin remote ruralareas. In
general, vaccines offer a substantial benefit for
comparatively low cost, a primary consideration for
developingcountries.
Vaccines have conventionally been produced by
several methods some of which have become rather
static with regardto efficacy, safety, stability and cost.
Very effective vaccines against animal diseases such as
rinderpestandpigcholerahavebeeninuseformorethan
20years and have helped to significantly reduce the
incidence of these diseases world-wide. However,
vaccines ofquestionable efficacyalsoexist. Impotency,
instability, adverse side effects, and reversion of
attenuated organisms to wild (disease-causing) forms
represent some of the problems. However, research
strategies for the development ofbetter, cheaper and
safervaccines are constantlybeingsought.Throughthe
use of monoclonal antibodies and recombinant DNA
technologies, it is nowpossible to define andproduce
immunogenic components much more rapidly.These
technologies are increasinglybeingusedto clarifythe
pathogenetic mechanisms and immune response to
microbial diseases (Wray and Woodward 1990;
McCullough 1993).This should lead tothe production
ofmore effective vaccinesin the future.To date many
candidate vaccines have been produced by these
techniques. However, only few of these are being
producedcommercially.
Table2summarisessomevaccines developed by
recombinantDNAtechnology.Thereare othervaccines
undervarious stages ofdevelopment.Thefollowingare
ofparticular relevancetosmall ruminants: recombinant
vaccines againstBluetongue andRiftValleyFevermay
soon be availableforfield use (Osburn 1991);a hybrid
virus vaccine against Orf(Reid 1989), a thermostable
recombinantvaccine against PPR(Lefevre and Diallo
18Small RuminantResearch NetworkWorkshop

Biotechnology optionsforimproving livestockproduction
1990)andrecombinantvaccines againstTaenia ovis and
Echinococcus (Blancou 1990); tick gut antigens and
Haemonchus gut antigens produced by molecular
techniques offer ways for prophylaxis against these
parasites. Progress is also being made towards the
development of vaccines against Babesiosis and
Theileriosisin cattle(Wright1990)whichmayindicate
prospects for similar immune-prophylaxis becoming
availableforsheepandgoats aswell.
Table2. Example ofsome novel animal vaccines.
Species Disease Producer
Avian Coccidiosis, Genex andA.H.Robins
Newcastle virus Codon andSalsbury labs
Bovine Papillomavirus Moleculargenetics
Viraldiarrhoea California Biotechnology
Brucellosis Ribi ImmunoChem
Rinderpest USDAandUniversity of
California, Davis
Swine Parvovirus AppliedBiotechnology
Dysentery Codon
Equine Influenza, Herpes California Biotechnology
Applied Biotechnology
Companion Canine parvovirus Applied Biotechnology
Sources:Van Brunt(1987);Cunningham(1990).
Physiology oflactation andgrowth
Recombinant bovine somatotropin (BST) is a
genetically engineered synthetic analog ofthe natural
growth hormone (Bauman et al 1985). Since the 1970s
there have been a number of studies on the effects of
BSTon milkyield,reproductiveperformance andhealth
aswellas its likelyeffectonhumanswhoconsumesuch
milk. Under good management and feeding, regular
BST administration to lactating dairy cows increases
milkyieldby 15-30% and alsoincreases efficiency of
milkproduction.
BSTis now readily available and is already in
commercial use in the United States. However, the
appropriateness ofBSTusetoincrease milkproduction
intheUSAisdoubtfulasthecountry already hasamilk
surplus andthepublicis also concernedaboutits effects
on health. Indeed, the benefit of BST in the USA is
perceivedtobe towards reducingtheproduction costs
oflarge dairyfarms,butthis couldpush smallerfarmers
out ofthe market.The appropriateness ofBSTuse for
developing countries is still a matter of debate. Those
supporting its introduction argue that its use in
commercial dairyfarmscouldincreasethenationalmilk
output.Those opposedpoint out thefact thatBSTdoes
notimprove milkyieldin indigenous non-dairybreeds
andthatitsuse on crossbredand exotic dairy cattlewill
require more feeding, and that provision of adequate
nutrition isalready aproblem for most dairy operations
in developing countries.
Whether or not BST affects reproductive
performance has notyetbeen conclusively established.
Although most reports have indicated nonsignificant
effects ofBSTon reproductive performance, mostsuch
studies havebeen onsingle lactations;the effectofBST
on lifetime productivity needs tobe investigated.Some
studies (McBride et al 1990; Phipps et al 1990) have
shown that feed conversion efficiency declines in
subsequent lactations.ThestudybyPhipps et al(1990)
also indicated a decline in the incremental amount of
milk yield from BST application in subsequent
lactations. Additionally, the effect of BST on
reproductiveperformance is likelyto be more adverse
in the presence of higher biotic and abiotic stresses,
including nutritional stresses (Burton et al 1990;
Lormore et al 1990). There is also needto examine the
economics of BST application in view ofthe known
association ofits use with mastitis (Burton et al 1990)
and other infections. BST use is thus bound to be
associated with increased use of antibiotics and other
veterinary drugs.Thus,in evaluatingthe potential role
ofBSTin developing countries, one needsto consider
not onlythepossibleresponselevels ofthe cattlein these
countriestoBSTtreatment,butalsothecostofBST,the
amountand costofotherincrementalinputsrequiredfor
effective use ofBST, andthe milkprices.Ultimately,
the main technical constraintto BSTusein developing
countrieswill not onlybe its cost,but theabsence ofan
efficient delivery system; currentuse ofthetechnology
requires regularinjections.
Porcine somatotropin (PST) and recombinant
growth hormone stimulatory peptides (e.g. growth
hormone releasingfactor,GRF) alongwith BSThave
beenshowntoincreasegrowth ratesby8-38%in cattle,
sheep and pigs. In almost all cases, administration of
exogenousgrowthhormoneshavebeenassociatedwith
increased carcassprotein and reduced carcass fat(Hart
and Johnson 1986). Other growth-promoting agents
(e.g. anabolic steroids and beta agonists) have been
shown to have even larger effects but public concerns
over the possible residual effects in meats have ledto
their being banned in most developing countries.The
use ofanabolicimplantsis,however,permittedinsome
countries such astheUSA.
Animal nutrition
Nutrition represents one ofthe mostserious limitations
to livestock production in developing countries,
especiallyin thetropics. Feedresources are inadequate
in both quality and quantity, particularly duringthe dry
seasons. Biotechnological options are available for
improving rumen fermentation and enhancing the
nutritive value and utilisation of agro-industrial
by-products and other forages (Kundu and Kumar
1987).
Fibrous feeds, including crop residues, of low
digestibility constitute the major proportion offeeds
available to most ruminants under smallholder
situations in developingcountries. The associated low
Small RuminantResearch NetworkWorkshop 19

Rege
productivitycan be overcometosome extentbyseveral
means,amongwhich are:balancing ofnutrientsforthe
growthofrumen microfloratherebyfacilitatingefficient
fermentative digestionand providingsmall quantities of
by-passnutrientstobalancethe productsoffermentative
digestion, enhancing digestibility of fibrous feeds
through treatment with alkali or by manipulating the
balance of organisms in the rumen and genetic
manipulation of rumen micro-organisms, currently
acknowledged as potentiallythe mostpowerfultool for
enhancingthe rate and extentofdigestion oflow quality
feeds.Rumen micro-organismscan alsobe manipulated
by addingantibiotics asfeed additives, fats to eliminate
or reduce rumen ciliate protozoa (defaunation), protein
degradation protectors, methane inhibitors, buffer
substances, bacteria or rumen content and/or branched
chainvolatilefatty acids.
Increasingdigestibility oflow-qualityforages
Low-qualityforagesare a majorcomponent ofruminant
diets inthe tropics.Thus,muchprogress canbemadeby
improving the forage component ofthe ration. The
characteristicfeature oftropicalforagesistheirslowrate
ofmicrobialbreakdownintherumen withthe resultthat
muchofthenutrientsofthefeedarevoidedinthefaeces.
The slow rate of breakdown also results in reduced
outflow rate offeed residues from the rumen which
consequentlydepressesfeedintake.Atpresent, themain
treatment methods forforagessuch as cerealstraws are
either mechanical (e.g. grinding), physical (e.g.
temperature and pressure treatment) or a range of
chemical treatments of which sodium hydroxide or
ammonia are amongthe more successful (Greenhalgh
1984).
The lignification of the cell walls prevents
degradation by cellulase or hemicellulase enzymes.
Fortunately, it is possible to use lignase enzyme
produced by the soft-rot fungus (Phanerochaete
chrysosporium) which causes a high degree of
depolymerisation of lignin (Tien and Kirk 1983).The
enzyme acts like a peroxidase and causes cleavage of
carbon-carbon bonds. At present the levels of the
lignase enzyme produced by the basidiomycete fungi
are insufficient for the treatment of straw on a
commercial scale. However, it is conceivable that the
use ofrecombinant DNA engineering techniques will
allowthe modification ofthelignasegenes andassociate
proteins toincrease their efficiency and stability.The
ligningenehastodatebeen clonedand sequencedfrom
P. chrysosporium (Zhangetal1986;TienandTu 1987)
Improvingnutritivevalue ofcereals
Moderate protein content and low amounts of specific
aminoacidslimitthe nutritivevalue ofcereals andcereal
by-products (e.g.barleyis lowin lysine andthreonine).
This is a major limitation in the ration formulation for
non-ruminant livestock which necessitates addition of
expensive protein supplements. There are on-going
studies to enhance the low level oflysine in barley by
genetically engineeringthe graingenome(Miflin et al
1985; Shewry and Kreis 1987). Genetic modification
through insertion ofgenes into rice protoplasts and
generation of transformed plants has already been
achieved.
Removinganti-nutritivefactorsfromfeeds
Anti-nutritive factors in planttissues include protease
inhibitors, tannins, phytohaemagglutinins and
cyanogens in legumes, andglucosinolates,tannins and
sanapine in oilseed rape (Brassica napus) and other
compoundsinfeedsbelongingtothe Brassicagroup.As
withaminoaciddeficiencies,theadverse effectsofthese
compounds are more marked in non-ruminants than in
ruminants (Chubb 1983).Conventionalplant breeding
has been used to reduce and, in some cases, eliminate
such anti-nutritive factors. An example is the
introduction ofcultivars ofoilseed rape which are low
in, or free from erucic acid and glucosinolates. A
combination ofgenetic engineering and conventional
plant breeding should lead to substantial reduction or
removal of the major anti-nutritive factors in plant
species ofimportance as animalfeeds.
Transgenicrumenmicrobes(seebelow)couldalso
play a role in the detoxification ofplantpoisons(Gregg
1989) or inactivation of antinutritional factors.
Successful introduction of a caprine rumen inoculum
obtained in Hawaiiinto the bovine rumen in Australia
to detoxify 3-hydroxy 4(IH) pyridine (34 DHP), a
breakdown product of the non-protein amino acid
mimosine found in Leucaena forage (Jones and
Megarrity1986)demonstratesthepossibilities.
Improvingnutritivevalue ofconservedfeed
The conservation of plant material as silage depends
upon anaerobic fermentation ofsugars in the material
which in turn is influenced by the ability of naturally
occurring lactic acid bacteria to grow rapidly on the
available nutrients under the existing physical
environment. Unless the ensiled material is sterilised,
lactic acid bacteria are always present. However, the
ensiling conditions may not always be ideal for their
development. In addition to the number and type of
bacteria, other interrelated factors mayaffect quality of
silage, including availability of water-soluble
carbohydrates, the dry-mattercontent,thepHandextent
of air exclusion. For example, lack ofwater-soluble
carbohydrates maybe overcomebywiltingthe material
to raise the dry matter to a level atwhich less acid is
requiredto stabilisethefermentation.Theavailabilityof
sugarsin the materialandthe rate atwhichthe different
micro-organisms multiply also influences the ensilage
process.
Throughout this century, research workers have
investigated ways through which the fermentation
process in silage making can be controlled in order to
improve the feeding quality ofthe resulting silage.Use
of additives, to restrict the activity of the micro
organisms, to stimulate the fermentation bythe lactic
acidbacteria orsimply as nutrients hasbeen one ofthe
approaches.Additivesusedin the early studiesincluded
20 SmallRuminantResearch NetworkWorkshop

Biotechnologyoptionsforimproving livestock production
chloroform, toluene and cresol (to inhibit bacterial
growth) and sulphuric acid and hydrochloric acid (to
reduce the pH). Indeed, over the last40to 50years,
corrosive, acid-containing additives have been widely
used in silage making. Other fermentation inhibitors
which have been studiedinclude organic acids,salts of
acids, formaldehyde and other aldehydes, sodium
hydroxide, and antibiotics. Of these, formic acid is
probablythemostwidelystudied andhasbeen reported
to have a beneficial effect on the fermentation process
and on the nutritive value ofsilage. Sulphuric acid is
cheaper than formic acid and is popular in some
countries. However,acids are ahazard on thefarm and
can be particularly dangerous if recommended to
uninformed farmers. Salts ofacids are saferto handle
but are less effectivethanthe acidsfromwhichtheyare
derived.
The hazardous nature of some of the chemical
additives has necessitated a search for alternative
compoundsforimprovingthe ensilageprocess.Agroup
of compounds classified as fermentation stimulants
have been widelystudied.These include sugarsources
(e.g. molasses andwhey),enzymesandinoculaof lactic
acid bacteria. Molasses is of particular relevance to
smallholder farmers in developing countries in the
tropics where sugar-cane is produced and processed.
Enzymes are essential for the breakdown ofcell-wall
carbohydrates to release the sugars necessary for the
growth ofthe lactic acid bacteria. Although resident
plant-enzymes and acid hydrolysis produce simple
sugars from these carbohydrates, addition ofenzymes
derived from certain bacteria, e.g.Aspergillus niger or
Trichoderma viridi (Henderson and McDonald 1977;
Henderson etal 1982)increasesthe amountofavailable
sugars. Commercial hemicellulase and cellulase
enzyme cocktails are now available and improve the
fermentationprocess considerably(Hooper et al 1989).
However, prices of these products preclude their
viability for farm level application, especially in
developing countries.
There are two forms ofindigenous lactic acid
bacteria: the homofermentative type which converts
hexose sugars to lactic acidwith no loss ofdry matter
andtheheterofermentativetypewhichproducesarange
of compounds accompanied by loss of dry matter as
carbon dioxide. Thus, the native bacteria are not the
most efficient. Considerable research in the USA and
Europe has been directed towards the development of
microbial silage additives (inoculants). Commercial
bacterial inoculants designed to add sufficient
homofermentative lactic acid bacteria to dominate the
fermentation are now available The objective ofusing
such additives is to ensure the rapidproduction ofthe
required amount oflactic acid from the carbohydrates
present to preserve the ensiled material. Most such
inoculants contain Lactobacillus plantarum with or
without other bacteria such as L. acidophilus,
Pediococcus acidilactive and Streptococcus
thermophilus. In general, the results with bacterial
inoculants have been quite variable. However,with an
effective product, it is possible to improve the
fermentation oflow dry-matter silages andto enhance
the efficiency oftheir utilisation.
In ordertoimprovethe effectiveness ofmicrobial
inoculantsin breakingdown structuralcarbohydratesto
glucose, detailed knowledge ofthe lactobacilli bacteria
is essential.Workalreadyundertaken on the molecular
biology ofLactobacillus plantarum and other species
(Armstrong and Gilbert 1991) suggest that the rapid
progressin this area will makeitpossible to construct
novel genes encoding highly active fibre-degrading
enzymes.Suchgenes couldthen beinsertedintostrains
ofL.plantarum.
Successful silage making incorporating these
technologies canonlybe achievedwith strict adherence
torecommendedapplicationprocedures,includingrates
ofadditives, inoculantsetc.Thistechnology isavailable
in mostdeveloping regionsincludingAfrica. However,
itis notfully exploited. Indeed,inAfricasilagemaking
is still generally restricted to large-scale commercial
farms.
Improvingrumenfunction
ArmstrongandGilbert(1985)andForsberget al(1986)
have reviewedthe major areas ofrumenfunctionwhich
might benefit from transgenic technology. These
include development of transgenic bacteria with
enhanced cellulotic activity, capability to cleave
lignohemicellulose complexes, reduced methane
production capability decreased proteolytic and/or
deaminase activities, increased capability for nitrogen
"fixation"andincreased ability formicrobialproduction
ofspecific amino acids.The first successful transfer of
foreign genes into rumen bacteria (Bacteriodes
ruminicola)was reportedbyThomsonand Flint(1989).
However, we are still a long way from commercial
production ofgenetically engineeredrumen bacteria.
Although several workers have isolated genes
encoding plant structural carbohydrate-degrading
enzymesfrom rumen bacteria,there are limited reports
(Hespell and Whitehead 1990) on the genetic
engineering of these microorganisms. In contrast to
conditions in which single species of organisms are
grownin controlledenvironmentsandwherethe energy
supply is usually in excess of demand, the rumen
environment is very complex, competition between
different microbial species is intense and energy is
usuallythe limitinggrowth factor(Russell andWilson
1988). This is probably the main reason why
reintroduction ofgenetically modified rumen bacteria
intotheir natural habitat has metwith variable success
(Flint et al 1989). Advances being made in
transformation methodsfor obligate anaerobic bacteria
willcertainly resultin successfulgeneticengineeringof
arangeofrumen bacteria. However, it is notpossibleto
predict if any of these bacteria will be capable of
colonisingthe rumen.
Itcanbe concluded thatthere are severalpotential
opportunitiesfor improvingthe efficiency ofruminant
digestion andpossibilitiesfor utilisingawider range of
Small RuminantResearch NetworkWorkshop 21

Rege
feedsthan is currentlypossible. Modification ofrumen
microbialpopulation(Hespell 1987;RussellandWilson
1988; Flores 1989)is one such opportunity. However,
technical difficulties associated with making genetic
modifications to individual species of rumen bacteria
(Armstrong and Gilbert 1991) hinder progress in this
aITea.
Needfor biotechnology capacityin
developingcountries
Forthe developedcountries, the needforbiotechnology
may be to increase the level of affluence, but for
developing countries, it could reduce hunger and
starvation.The use ofbovine somatotropin toincrease
milkproduction in economieswhere farmers are being
paidtoproduceless milkillustrates this point.However,
not all available biotechnologies are appropriate or
relevanttoallcountries. Developingcountries mayneed
toadaptsome ofthesetechnologiesbefore they canuse
them. It isthereforeimportantthat developingcountries
develop capacityto maintain a strongbase of applied
andadaptive researchandsomelevel oftrainingtokeep
abreastwith newdevelopments.
Biotechnologies which could have application in
developingcountries are summarisedinTable3.While
the applications ofsome ofthe available technologies
are relatively simple, it is unlikely that developing
countrieswill be able to retain those trainedto support
implementation of biotechnology programmes if
adequate financingis not available toprovide required
equipment, chemicals etc to expand or even maintain
suchprogrammes.
The development of biotechnology capacity in
developingcountriesis also justifiedin order tosupport
research which is only ofinterestto them or thatwhich,
because ofrestrictions in developed countries, can only
be done in developing countries. For example,
veterinary regulations in most developed countries
generallyprohibittheintroductionofbiologicalmaterial
(e.g. infectious agents required for vaccine
development) or live animals for research purposes.
Therefore developed countries must develop the
capacity to undertake such research in the relevant
countries.
The disparitybetweenindustrialised countries and
developing regions oftheworld in terms ofveterinary
biotechnologyhas beensummarisedby Lefevre (1992):
Out of 152 laboratories involved in veterinary
biotechnology in 1991, only 26 are located in 17
countriesinAsia, Africa andSouthAmerica.Moreover,
some ofthese laboratories maynotbe activelyinvolved
in biotechnology but are merely interested in it. In
sub-Saharan Africa (excluding the Republic ofSouth
Africa), only ILRAD (based in Kenya) is actively
involvedinbiotechnologyresearch.However,ILRAD's
biotechnologywork is focussed on only two diseases,
trypanosomiasis and theileriosis. Because the
well-equippedandadequatelyfundedlaboratoriesdoing
research in molecular biology are found almost
exclusivelyin developed countries,thegapbetweenthe
industrialised and developing countries in technical
Table3. Possible applications of biotechnology to the solution ofproblems of livestock production in developing countries.
Scale of Probable time
economic tocommercial
Problem Possible solution impact use,years
Animaldiseases Newvaccines and newdiagnostics Large <5
Poorqualityforages Microbialtreatment offorages Moderate 5-10
Modification ofrumen microflora Moderate/large >10
Geneticimprovement offorages andtheir Moderate 5-10
symbionts
Difficultyofimplementing Selection in nucleus herds,usingAI,ET,embryo Large 5-10
selection programmes sexing
Marker-assisted selection Moderate 5-10
Difficulty ofmaintainingdairy Use ofIVF, ETand embryo sexing Large >10
cattle performance after F1 cross Selectionamong local breedsusingAI,MOET Medium/large >10
Development ofcompositebrecds Large >10
Costandenvironmental challenge Use ofETtoimport embryos Small <5
toimported cattle
Needforincreased efficiencyin Use ofrBSTand rPSTin dairyandpigproduction Large <5
intensive systems
1. Definitions: AI: artificial insemination; ET: embryo transfer, IVF in vitro fertilisation; rBST: recombinant bovine somatotropin; rPST
recombinantporcine somatotropin.
Sources:Adapted(with additions)fromCunningham(1990); Doyle andSpradbrow(1990).
22 Small RuminantResearch NetworkWorkshop

Biotechnology optionsforimproving livestock production
expertise and relevant research capacity is gettingwider
andmotivatedscientistsfrom developingcountrieswith
the expertise to carry out sophisticated research are
optingtoworkinlaboratoriesinindustrialised countries.
Another justification for local capacity in
biotechnology researchistoprovide ahomefororphan
commodities. From biotechnology research standpoint,
an orphan commoditymaybe defined as a commodity
inwhichthere is oris likelytobe little or noinvestment
in modern biotechnology in industrialised countries
either because the commodity is not important in
temperate areas orbecausethere are nolikelyprofits for
transnational companies.Thus an orphan commodityis
not necessarily a small commodity. Banana, plantain,
cassava, coconut and tropical fruits are examples of
orphan crops(Persley 1990). MostAfrican indigenous
animals, especially chickens,pigs and goats probably
fall in this category although some basic research on
thesespeciesinthe developed countriesmaybenefitthe
African populations as well. There is thus a need for
biotechnology research capacityforproblemsthat may
be unique to developing countries. Persley (1990)
suggested the establishment of a special funding
mechanism toprovide supportfor research on orphan
commoditiesbypublic andprivate sectorinstitutionsin
industrialised and developingcountries.
Biotechnologyadoption andadaptation
The case ofartificialinsemination
One ofthe reasons whytechnologies developed in the
industrialised countries tendnottobeimplementedwith
much success in developing countries is the failure to
recognise the importance of adapting technology to
local conditions. AI is a good example. Where AI
technology has been adopted in Africa, not much
consideration has been given to adapting it to the
circumstances in which it is to be applied to ensure
sustainability. Instead, AI uses have been based on
sophisticated models intended for countries withgood
communication and transport systems and with
adequate and reliable operating budgets. Such AI use
programmes have often collapsed and have hadtogo
through several phases of foreign-aid-supported
"rehabilitations" and, in some cases, have eventually
collapsed. Government subsidies ofthe AI system are
considered tobe another main cause offailure ofAIin
developing countries. Privatisation ofthe services may
change the situation. For example, in some ofthese
countries, the concept offarmer co-operatives is well
developed and applied for specific cash crops or milk
marketing. AI could easily be run by co-operatives
organisedinschemes inwhichfarmers are "grouped" on
the basis ofsuch factors astransport requirements and
similarityofsystemsofproduction.Semencan easilybe
delivered over shortdistances bymotorbikes,bicycles,
horses, donkeys etc.Under such circumstances,use of
fresh semen collected from bulls belonging to the
co-operative couldbe considered.Thiswould eliminate
the cost offreezingsemen.Suchschemeswould make
it easier to match genotypes to production systems
within a country. Indeed,suchascheme couldformthe
basis for the genetic improvement of localised
indigenousbreeds.
The case ofembryotransfer
Embryo transfer (ET) could have a major impact on
cattle breeding in developing countries (Cunningham
1990) especially as part ofa nucleus breeding scheme
(Smith 1988b). However, successfulETrequireshighly
motivated, experienced staff and a high capital
investmentin facilities, equipmentand drugs.
In general, the inappropriateness of ET for
developing countries is ascribed to lack of infra
structure. However,insome instances,ETrepresents a
solution toa lack ofinfrastructure.Thus, establishment
of multiple ovulation embryo transfer (MOET) is
consideredan attractive means ofgeneticimprovement
whereinfrastructureforprogenytesting is notavailable.
Most developing countries have limited financial
resources. In addition, equipmentand supplies tend to
be more expensive than theyarein developedcountries
dueto transportation costs,importtariffs, lack of hard
currency etc.These makeETtechnologyprohibitive in
these countries. However, it is possible to adapt ET
techniquestolocal conditionstherebyreducingthe cost.
Seidel and Seidel (1992)pointed out that a lot ofthe
fancyequipmentassociatedwith ETare notessentialfor
successful utilisation ofthe technology. For example,
fancyfreezingequipmentare nomoreeffectivethan dry
ice/alcohol baths for freezing embryos as these save
labour and are more convenient. Similarly,filters are
not essential for isolation of embryos, neither are
disposable sterile syringes and fancy plastic dishes.
Thus,by combininggoodimagination with knowledge
ofbasicprinciples, the technology can be successfully
adapted to local conditions. Therefore research,
especially ofan applied nature,onsuchtechnologiesby
institutions in developing countries is alwaysjustified
and often essential. Moreover, researchers need to be
exposedtonewtechnologiesorprocedurestoappreciate
thepowerand limitations ofsuch technologies.
Environmentalconcerns about
biotechnology
There is much euphoria about developments in
biotechnology and potential benefits, but little is said
about the risks associated with biotechnology. For
example genetically modified organisms could create
ecological disaster ifreleasedintothe environment.
Biosafetyis, therefore, an issue ofgreat concern
for many developing countries. In a recent(June 1994)
meeting of the Intergovernmental Committee on the
Convention on Biological Diversity (CBD 1992),
representatives ofdeveloping countriespointed outthat
biotechnology was evolving more rapidly than the
capacity of their countries to install effective safety
procedures forthe handlingand use of living modified
Small RuminantResearch NetworkWorkshop 23

Rege
organisms and that there was need for adequate and
transparent safetyprocedurestomanage andcontrolthe
risks associated with the use and release of such
organisms.Todealwith the basic ethical questions and
the risks associatedwithgenetic engineering, regulatory
mechanisms should be created and internationally
acceptable guidelines or regulations putin place.The
political and regulatory processes affecting
biotechnology and its products must draw upon
professional competence ofthe highest standard. In
general,however, developed countries are lukewarm to
the idea ofa legally bindinginternationalprotocol on
biosafety,possiblybecause itis a heavy responsibility
with potentially massive cost implications for the
technology-rich countries. However, biosafety is an
issuewhich mustbe addressedsooner than later.
Acknowledgement
Iwish tothankDrR.L. Bakerforassistingme, atatime
of immense pressure, in obtaining several critical
referencesusedin thispaper.
References
Aboul-Ela M.B., El-Nakhla S.M., Gabr M.G., Hassan F.A.,
Aboul-NagaA.M. and Hanrahan JP. 1988. Effect of
active immunization against androstenedione on
ovulation rate andfecundityin fat-tailed rahmania and
Finnish landrace x Rahmani crossbred ewes. In:
Proceedings ofthe 11th Interantional Congress on
Animal Reproduction and Artifical Insemination,
University College Dublin, Ireland, 26-30June 1988
Volume 4. University College Dublin, Dublin, Irish
Republic. p.487
Aboul-Naga AM., Aboul-Ela M.B. and Hassan F. 1992
Manipulation of reproductive activity in subtropical
sheep.Small Ruminant Research7:151-160
ArmstrongD.G. andGilbertH.J.1985. Biotechnologyandthe
rumen: A mini review.Journal ofthe Science ofFood
andAgriculture 36:1039-1046.
Armstrong D.G. and Gilbert H.J. 1991.The application of
biotechnology for future livestock production. In:
Proceedings of the 7th International Symposium on
Ruminant Physiology, Sendai, Japan.Academic Press,
San Diego,USA.pp.737-761.
Bauman DE., EppardJE., DeGeeterM.J. and LanzaGM.
1985. Responses ofhighproducing dairy cowsto long
term treatment with pituitary somatotropin and
recombined somatotropin. Journal of Dairy Science
68:1352-1362.
Blair H.T., McCutcheon S.N. and Mackenzie D.D.S. 1990
Components ofthe somatotropic axis as predictors of
genetic merit for growth. In: Proceedings ofthe 4th
World Congress on Genetics and Applied Livestock
Production,Edinburgh,Scotland.Vol.XVI. International
Committee forWorldCongress onGenetics Appliedto
Livestock Productivity, Edinburgh,UK.pp.246-255.
Blancou J. 1990. Utilization and control of biotechnical
proceduresin veterinary science. Revue Scientifique et
Technique de l'Office International des Epizooties
9:641-659
Bodin L., Bibe B., Blance M.R. and Ricordean G. 1986
Paramèters génétiques de la concentration plasmatique
en FSHdes agrelles de race Lacaune viande. Genetics,
Selection, Evolution 18:55-62.
Bourne J. and BostockC. 1992. Disease control. In:Thelwall
A.D. (ed), Innovation in Agro-Biotechnology. Case
Study on Animal Production. Commission of the
EuropeanCommunities.pp.71-83
Bradley A. 1994. Manipulating the mouse genome. In:
Proceedings ofthe 5th World Congress on Genetics
Applied toLivestockProduction,Guelph,Canada,7-12
August 1994. Volume 21. InternationalCommittee for
World Congress on Genetics Applied to Livestock
Production,Guelph, Ontario, Canada.pp.354-361.
Brandon RB., Daniel RCW. and Lavin MF. 1991. Early
detectionofbovineleukosisvirus DNAininfectedsheep
using the polymerase chain reaction. Research in
VeterinaryScience50:89-94
Brem G., Graf F. and Krausslich M. 1984. Genetic and
economic differences among methods of gene
conservation in farm animals. Livestock Production
Science 1:65-68.
BremG., BrenigB., MüllerM. andSpringmann K. 1989. Ex
situ Cryoconservation of Genomes and Genes of
Endangered Cattle Breeds by Means of Modern
BiotechnologicalMethods.FAOAnimalProductionand
Health Paper 76. FAO (Food and Agriculture
Organization of the United Nations), Rome, Italy.
123pp.
Buckrell BC., Buschbeck C., Gartley CJ., Kroetsch T,
McCutcheonW., Martin J., PennerW.K. and Walton
J.S. 1992. A breeding trial using a transcervical
technique for artificial insemination in sheep. In:
Proceedings of the 12th International Congress on
Animal Reproduction, The Hague, The Netherlands,
23-27August 1992.Volume3.pp. 1531-1533
Burton J.H., MacLeod G.K., McBride B.W., Burton J.L.,
BatemanK.,McMillan IandEggertR.G. 1990.Overall
efficacyofchronicallyadministeredrecombinantbovine
somatotropinto lactating dairy cows.Journal ofDairy
Science73:2157-2167.
CBD(Convention onBiodiversity). 1992.The Convention on
Biological Diversity. UNEP (United Nations
EnvironmentProgramme),Nairobi, Kenya.
ChubbLG. 1983.Anti-nutritive factorsin animalfeedstuffs.
In: Haresign W. (ed), Recent Advances in Animal
Nutrition. Butterworths, London,UK.pp.21-37
Clark A.J., Archibald AL., McClenghan M., Simons JP,
WhitelowCB.A. and Wilmut I. 1990.The germ line
manipulation of livestock: Progress duringthe lastfive
years. Proceedings of the New Zealand Society for
Animal Production 50:167-180.
ClementsJE,WallR.J., NarayanO., HaverD.,Sheffer D.,
Powell A.M., Zink M. C. and Rexroad C.E. 1994.
Transgenicsheepthat express the visnavirus envelope
gene.Theriogenology41:180(abstract).
ColleauJ.J. 1991.Using embryo sexingwithin closed mixed
multiple ovulation and embryo transfer schemes for
24 Small RuminantResearch NetworkWorkshop

Biotechnology options forimproving livestockproduction
selection on dairy cattle. Journal of Dairy Science
74:3973-3984
Cunningham EP. 1990. Animalproduction. In: PersleyG.J.
(ed), Agricultural Biotechnology: Opportunities for
International Development. CAB (Commonwealth
Agricultural Bureaux) International,Wallingford,UK.
pp. 169-175
Doyle J.J. and Spradbrow P.B. 1990. Animal health. In:
Persley G.J. (ed), Agricultural Biotechnology:
Opportunities for International Development. CAB
(Commonwealth Agricultural Bureaux) International,
Wallingford,UK.pp. 176-186
FAO (Food and Agriculture Organization of the United
Nations). 1992. The Management of Global Animal
Genetic Resources. Proceedings of an FAO Expert
Consultation. FAOAnimalProductionandHealthPaper
104. FAO, Rome, Italy.309pp.
Ferris N.P., Powell H. and Donaldson A.I. 1988. Use of
precoatedimmunoplates and freeze-dried reagents for
the diagnosis of Foot and Mouth Disease and Swine
Vesicular Disease by enzyme-linked immunosorbent
assay (ELISA). Journal of Virological Methods
19:197-206.
Flint H.J., Bisset J. and WebbT. 1989. Use of antibiotic
resistance mutations to tract strains of obligately
anaerobic bacteria introducedinto the rumen ofsheep.
Journal ofAppliedBacteriology67:117-183.
FloresD.A. 1989.Application ofrecombinantDNAto rumen
microbes for the improvement of low-quality feed
utilization.Journal ofBiotechnology 1095-112.
Foote R.H. 1982. Cryopreservation of spermatozoa and
artificialinsemination: Past,present,andfuture.Journal
ofAndrology3:85-100
ForsbergCW.,Crosby B. andThomas D.Y. 1986. Potential
for manipulation of the rumen fermentation through the
use ofrecombinantDNAtechniques.Journal ofAnimal
Science 63:310-325.
Gibson J.P. and Smith C. 1989. The incorporation of
biotechnologies into animal breeding strategies. In:
Babiuk LA., Phillips JP. and Moo-YoungM. (eds),
Animal Biotechnology. Comprehensive Biotechnology
First Supplement. Pergamon Press, Oxford, UK. pp.
203-231.
Gogolin-EwensK.J.,MeeusenENT,ScottPC.,AdamsTE.
and Brandon M.R. 1990. Genetic selection for disease
resistance andtraits ofeconomicimportance in animal
production. Revue Scientifique et Technique de l'Office
International des Epizooties9865-896
Greenhalgh JF.D. 1984. Upgrading crop and agricultural
by-productsfor animalproduction. In:Gilchrist FM.C.
and Mackie R.I. (eds), Herbivore Nutrition in the
Subtropics and Tropics. The Science Press, Pretoria,
SouthAfrica.pp. 167-184.
GreggK. 1989. Enhancement of microbial detoxification by
gene transfer. In: Proceedings ofthe 7th International
Symposium on Ruminant Physiology, Sendai, Japan.
AcademicPress,San Diego,USA.p.58.
Haas L., Moenning V. and Kaaden O.R. 1990. Use of
biotechnical methods in veterinary medicine. Revue
Scientifique et Technique de l'Office International des
Epizooties9:245-251.
HaberfeldA.,CahanerA., YoffeO., PlotskyY. and HillelJ.
1991. DNAfingerprints offarm animalsgenerated by
microsatellite and minisatellite DNA probes. Animal
Genetics22:299-305.
HalbertG.W., DobsonH.,Walton.JS., SharpeP. and Buckrell
B.C. 1990. Field evaluation of a technique for
transcervical intrauterine insemination of ewes.
Theriogenology33:1231-1243.
Hart I.C.andJohnson I.D. 1986.Growth hormoneandgrowth
in meatproducinganimals.In: ButteryPJ., HaynesNB.
and Lindsay D.B. (eds), Control and Manipulation of
Animal Growth. Butterworths, London, UK.
pp. 135-159.
HendersonA.R.andMcDonaldP.1977.Theeffectofcellulase
preparationsonthechemicalchangesduringthe ensilage
ofgrass in laboratory silos. Journal ofthe Science of
Food andAgriculture28486-490
Henderson AR., McDonald P. and Anderson D. 1982.The
effect of cellulase preparation derived from
Trichodermavivide onthe chemicalchanges duringthe
ensilage of grass, lucerne and clover. Journal ofthe
Science ofFood andAgriculture 33:16-20
Hespell RB. 1987. Biotechnology and modifications ofthe
rumen microbial system. Proceedings ofthe Nutrition
Society46407-413.
Hespell RB. and Whitehead TR. 1990. Physiology and
genetics ofxylan degradation bygastrointestinal tract
bacteria.Journal ofDairyScience73:3013-3022
Hooper PG., Sharp R., Rowlinson P. and Armstrong D.G.
1989.An Assessment of the Potential ofa Lactobacilli
Inoculant as aSilageAdditive. British SocietyofAnimal
Production, Winter Meeting, 13-15March. Paper 63
Scarborough,UK.
JasiorowskiH.A. 1990.Open nucleusbreedingschemes-new
challenge forthe developing countries. In: Zurkowski
M.(ed), Proceedings ofaConference on Open Nucleus
Breeding Systems, Biatobrzegi, Poland, 1-19January
1989. FAO(Food and Agriculture Organization ofthe
UnitedNations),Rome, Italy.pp.7-12
Jaenisch R. 1988. Transgenic animals. Science
240:1468-1473.
JeffreysA.J. andMortonD.B. 1987.DNAfingerprintsofdogs
and cats.AnimalGenetics 18:1-15.
Jones R.J. and Megarrity R.G. 1986. Successful transfer of
DHP degrading bacteria from Hawaiian goats to
Australian ruminants to overcome the toxicity of
Leucaena.Australian VeterinaryJournal63:259-262.
Keller D.S., Gearheart W.W. and Smith C. 1990. A
comparison offactors reducing selection response in
closed nucleus breeding schemes. Journal of Animal
Science 68:1553-1561.
Kemp S.J. and Teale A.J. 1991. Dinucleotide repeat
polymorphism at the bovine locus FSHB. Animal
Genetics22:435.
KennethH.F.McKearnT.J. andBehtolK.B. 1980.Monocloal
Antibodies : A New Dimension in Biological Analysis.
Plenum Press,NewYork,USA.
KerrR.J., Frisch.JE. andKinghornB.P.1994. Evidence fora
major genefortick resistance in cattle. In: Proceedings
of the 5th World Congress on Genetics Applied to
SmallRuminantResearch NetworkWorkshop25

Rege
Livestock Production, Guelph, Canada, 7-12 August
1994. Volume 20. International Committee for World
Congress onGenetics AppliedtoLivestockProduction,
Guelph, Ontario, Canada.pp.265-268
KinghornBP,SmithC. and DekkersJCM. 1991. Potential
geneticgainsin dairy cattlewithgamete harvesting and
in vitro fertilization. Journal of Dairy Science
74:611-622.
Knowles DP. Jr. and GorhamJ.R. 1990. Diagnosis of viral
andbacterial diseases. Revue Scientifique et Technique
de l'Office International des Epizooties9:733-757
KunduS.S. and KumarV. 1987. Biotechnological processes
to convert crop residues to quality feeds for livestock.
Indian Dairyman39:113-114.
Lande R. and Thompson R. 1990. Efficiency of
marker-assisted selection in the improvement of
quantitative traits. Genetics 124743-756
Lefèvre P.C. 1992. Biotechnology and animal disease
diagnosisin developingcountries. In: SchwartzJ.J. and
Franzen H. (eds), Potential and Limitations of
Biotechnology in Livestock Production in Developing
Countries. Proceedings of a Symposium, Humboldt,
University of Berlin, October 1992. Part II. ATSAF
(Council for Tropical and Subtropical Agricultural
Research), Bonn,Germany.pp. 129-138.
Lefevre PC. and Diallo A. 1990. Diagnosis of viral and
bacterial diseases. Revue Scientifique et Technique de
l'Office Internationaldes Epizooties9951-965
Lim J.M., Fukui Y. and Ono H. 1991. The post-thaw
developmental capacity of frozen bovine oocytes
following in vitro maturation and fertilization.
Theriogenology35:1225-1235
Loftus RT,MacHugh D.E., Ngere LO., Balain D.S., Badi
A.M., Bradley D.G. and Cunningham E.P. 1994.
Mitochondrial genetic variation in European, African
and Indian cattle populations. Animal Genetics
25:265-271.
Lormore M.J., Muller L.D., Deaver D.R. and Griel L.C. Jr.
1990. Early lactation responses of dairy cows
administeredbovine somatotropin andfed diets high in
energy and protein. Journal of Dairy Science
73:3237-3247
Lu K.H., Jiang H.S., WangW.L. and Gordon I. 1990
Pregnancies established in cattleby transferoffreshand
frozen embryos derived from in vitro maturation and
fertilization of oocytes and their subsequent culture in
vitro.Theriogenology33:278(abstract).
MacHugh D.E., Loftus RT, Bradley D.G.,Sharp P.M. and
Cunningham EP. 1994. Microsatellite DNAvariation
within and amongEuropean cattle breeds. Proceedings
ofthe Royal Society ofLondonSeriesB25625-31.
Mackinnon M.J. 1992. Use ofgenetic markers in genetic
improvement programmes. Proceedings of the
AustralianAssociationofAnimalBreedingandGenetics
10:245-251.
MacmillanKL.andTervitH.R.1990.Availabletechnologies
and prospective developments in reproduction and
embryology.Proceedings oftheAustralianAssociation
ofAnimalBreeding andGenetics8:9-18
McBride B.W., Burton JL., Gibson J.P., Burton J.H. and
Eggert R.G. 1990. Use of recombinant bovine
somatotropin for up to two consecutive lactations on
dairy production traits. Journal of Dairy Science
73:3248-3257
McCulloughK.C. 1993. The application ofbiotechnologyto
the diagnosis and control of animal diseases. Revue
Scientifique et Technique de l'Office International des
Epizooties 12:325-353.
Miflin B.J., KreisM., BrightSJW. and ShewryPR. 1985
Improvingthe amino acid content of cerealgrains. In:
CoppingLG. and Rodgers P.(eds), Biotechnologyand
its Application to Agriculture. Monograph 32.
Lavenham Press, Suffolk, England.pp.71-78
Moore SS., BarendseW., Berger KT,Armitage S.M. and
Hetzel D.J.S. 1992. Bovine and ovine DNA
microsatellites from the EMBL and GENBANK
databases.AnimalGenetics23463-467.
NantulyaV.M. and Lindqvist K.J. 1989. Antigen-detection
enzymeimmunoassayforthe diagnosisofTrypanosoma
vivax, T. congolense andT. bruceiinfections in cattle.
Tropical Medicine andParasitology40:267-272.
NeiM.andTakezakiN.1994. Estimation ofgenetic distances
and phylogenetic trees from DNA analysis. In:
Proceedings of the 5th World Congress on Genetics
AppliedtoLivestockProduction,Guelph,Canada,7-12
August 1994. Volume 21. InternationalCommittee for
World Congress on Genetics Applied to Livestock
Production,Guelph, Ontario, Canada.pp.405-412
Nicholas FW. and Smith C. 1983. Increase rate ofgenetic
change in dairy cattle by embryotransfer and splitting.
Animal Production 36:341-353.
NiemannH.,HalterR.andPaulD.1994 Genetransferincattle
and sheep:A summaryperspective. In: Proceedings of
the5thWorldCongressonGeneticsApplied toLivestock
Production, Guelph, Canada, 7-12 August 1994.
Volume 21. International Committee for World
CongressonGeneticsApplied to Livestock Production,
Guelph,Ontario,Canada.pp.339-346.
Osburn B.I. 1991.The Second International Symposium on
Bluetongue, African Horse Sickness and Related
Orbiviruses.WienerTierärztlicheMonatsschrift78407.
Palmiter R.D., BrinsterR.L.,HammerR.E.,TrumbauerM.E.,
RosenfeldM.G., BirnbergN.C. and EvansR.M. 1982
Dramatic growth of mice that develop from eggs
microinjected with metallothionene growth hormone
fusiongenes. Nature300611-615.
PatersonA.H., LanderE.S., HewittJ.D., PetersonS., Lincoln
S.E. andTanksleyS.D. 1988. Resolutionof quantitative
traits into Mendelian factors,using a complete linkage
map of restriction fragment length polymorphisms.
Nature 335:721-726,
PersleyG.J. 1990. Beyond Mendel's Garden: Biotechnology
in the Service ofWorld Agriculture. CAB (Common
wealth Agricultural Bureaux) International,
Wallingford,UK. 155pp.
PhippsRH.,WellerRF,CravenN. and PeelC.J. 1990.Use
of prolonged-release bovine somatotropin for milk
production in British Friesian dairy cows. I. Effect on
intake, milk production and feed efficiency in two
consecutive lactations of treatment. Journal of
AgriculturalScience(Cambridge) 11595-104
26 SmallRuminantResearch NetworkWorkshop

Biotechnology optionsforimproving livestockproduction
Reid H.W. 1989. OrfVirus Infection ofSheep. Animal
Diseases ResearchAssociationNewsSheet 16.
RexroadJrCE.,HammerR.E.,BehringerR.R.,PalmiterR.D.
and Brinster R.L. 1990. Journal ofReproduction and
Fertility(Supplement)41:119-124.
Robinson J.J. and McEvoyTG. 1993. Biotechnology-the
possibilities.Animal Production 57:335-352.
Russell.JB.andWilsonD.B.1988.Potentialopportunities and
problemsforgenetically alteredrumenmicroorganisms.
Journal ofNutrition 118:271-279.
Schuman R. and Shoffner R.N. 1982. Potential genetic
modifications in the chicken, Gallus domesticus. In:
Proceedings ofthe 2nd World Congress on Genetics
Applied to Livestock Production. Volume 6.
pp. 157-163.
SeidelGE.andSeidelS.M. 1992.Analysis ofapplications of
embryo transfer in developing countries. In: Niemann
H., Franzen H. and Smidt D. (eds), Potential and
Limitations ofBiotechnologyin Livestock Production in
Developing Countries. Proceedings of a Symposium,
Mariensee, Germany, May 1992. Part I. ATSAF
(Council for Tropical and Subtropical Agricultural
Research), Bonn,Germany.pp.68-80
Shewry P.R. and Kreis M. 1987. Biotechnology and
improvement of feeds. Proceedings of the Nutrition
Society46379-385.
Smith C. 1988a. Genetic improvement of livestock in
developing countries using nucleus breeding units.
WorldAnimalReview6:2-10.
SmithC. 1988b. Applications ofembryo transfer in animal
breeding.Theriogenology29:203-212.
Smith C. 1989. Cloning and genetic improvement ofbeef
cattle. Animal Production 49:49-62.
Smith C. and Simpson S.P. 1986. The use of genetic
polymorphisms in livestock improvement. Journal of
Animal Breeding andGenetics 103:205-217.
SmithC.,MeuwissenT.H.E.andGibson.J.P. 1987.Ontheuse
of transgenes in livestock improvement. Animal
BreedingAbstracts55:1-10
Southern E.M. 1975. Detection ofspecificsequences among
DNA fragments separated by gel electrophoresis.
Journal ofMolecularBiology98:503-517.
Stice S.,StrelchenkoN., BetthauserJ., Scott B.,JurgellaG.,
Jackson J., DavidV., KeeferC. and Mathews L. 1994
Theriogenology41:301 (abstract).
Stokes T.M., Cherny R.A. and Brandon M.R. 1994.
Production of chimaeric bovine embryos.
Theriogenology41:303(abstract).
TaylorSt.C.S.,MooreA.J.,Thiessen R.B. and BaileyCM.
1985. Efficiency offood utilization in traditional and
sex-controlled systems of beef production. Animal
Production40:401-440.
TealeA.J. 1991. Biotechnologies applied to the diagnosis of
disease,with special reference totrypanosomiasis and
theileriosis of livestock. In: Hunter A.G. (ed),
Biotechnology in Livestock in Developing Countries.
CentreforTropicalVeterinaryMedicine,University of
Edinburgh, Edinburgh,UK.pp.272-285
Teale A.J., Tan S.G. and Tan J.-h. 1994. Applications of
moleculargeneticand reproductive technologiesinthe
conservation of domestic animal diversity. In:
Proceedings ofthe 5th World Congress on Genetics
Applied to Livestock Production, Guelph, Canada,
7--12 August 1994. Volume 21. International
CommitteeforWorldCongress on Genetics Appliedto
Livestock Production, Guelph, Ontario, Canada. pp.
493-500
ThomsonA.M. and FlintH.J. 1989. Electroporation induced
transformation of Bacteroides ruminicola and
Bacteroides uniformis by plasmid DNA. FEMS
Microbiology Letters 61:101-104
TienM.and KirkK.T. 1983. Lignin degradingenzymefrom
the Hymenomycete Phanerochaete chrysosporium
burds. Science221:661-663.
TienM. andTuC.-P.D. 1987.Cloning and sequencing ofa
cDNA for a ligninase from Phanerochaete
chrysosporium. Nature(London)326:520-523.
Van BruntJ. 1987. Bringingbiotechnologyto animal health
care. Biotechnology5:677-683.
Van Vleck L.D. 1981. Potential genetic impact of artificial
insemination, sex selection, embryo transfer, cloning
and selfingin dairy cattle. In: Brackett B.G.,SeidelJr
G.E. andSeidelS.M.(eds),NewTechnologiesinAnimal
Breeding. Academic Press, New York, USA.
pp.221-242.
WardK.,SleighM.J., PowellB.C. andRogersG.E.1982.The
isolation and analysis ofthe major wool keratin gene
families. In:Proceedings ofthe2ndWorld Congress on
Genetics Applied to Livestock Production. Volume 6
pp. 146-156
Weber JL. and May P.E. 1989. Abundant class of DNA
polymorphisms which can be typed usingpolymerase
chain reaction.American Journal ofHuman Genetics
44:388-396
Whittington D.G., Lyon M. and Glenister P.H. 1977.
Re-establishment of breeding stocks of mutant and
inbredstrains ofmicefromembryosstoredat-196'Cfor
prolongedperiods.Genetical Research30287-299.
WiktorTJ.andKoprowskiH.1980.Antigen variants ofrabies
virus.Journal ofExperimentalMedicine 152.99.
WilliamsJ.G., KubelikA.R., Livak K.JC., RafalskiJ.A. and
TingeyMS.V.1990.DNApolymorphismsamplifiedby
arbitraryprimers are usefulasgenetic markers. Nucleic
AcidsResearch 18(22):6531-6535.
WoolliamsJ.A. 1989.Thevalue ofcloninginMOETnucleus
breeding schemes for dairy cattle. Animal Production
48:31-35.
Woolliams J.A. and Smith C. 1988. The value ofindicator
traitsin thegeneticimprovementofdairy cattle.Animal
Production 46:333-345.
WoolliamsJ.A.andWilmut I. 1989. Embryo manipulationin
cattle breeding and production. Animal Production
48:3-30
Wray C. and Woodward M.J. 1990. Biotechnology and
veterinary science: Production ofveterinary vaccines.
Revue Scientifique et Technique de l'Office
International des Epizooties9:779-794.
Small RuminantResearch NetworkWorkshop27

Rege
Wright I.G. 1990. Immunodiagnosis of, and immuno
prophylaxisagainstthehaemoparasitesBabesiasppand
Anaplasmasppin domesticanimals.RevueScientifique
et Technique de l'Office International des Epizooties
9:345-356,
YapiCV.,OyaA. and RegeJEO. 1994. Evaluation ofan
open nucleus breeding programme for growth ofthe
Djallonke sheepinCôte d'Ivoire. In: Proceedings ofthe
5th World Congress on GeneticsApplied to Livestock
Production, Guelph, Canada, 7-12 August 1994
Volume 20. International Committee for World
Congress onGeneticsApplied toLivestockProduction,
Guelph, Ontario,Canada.pp.421-424
ZhangYZ,ZylstraG.J,OlsenR.H. and ReddyCA. 1986
Identification of cDNA clones for ligninase from
Phanerochaete chrysosporium using synthetic
oligonucleotide probes. Biochemical and Biophysical
ResearchCommunications 137:649-656.
Options biotechnologiquespour l'amélioration de laproduction
animale dans lespays en développement: le casparticulier
de l'Afriquesubsaharienne
Résumé
Lestechniques modernes de biologie telles que le
clonage moléculaire et le transfert de gènes, la
manipulation génétique des cellules animales, le
transfert d'embryons végétaux, la manipulation
génétique de la flore microbienne du rumen,
l'amélioration chimique et biologique des aliments du
bétail, les applications dugénie génétique enimmuno
diagnosticet enimmunoprophylaxie et l'utilisation des
vaccins dans la lutte contre les maladies animales, etc.
sont aujourd'hui devenues une réalité et s'intègrent
progressivement dans les programmes de recherche
développement des pays en développement. La
biotechnologie offredespossibilitésjusque-làinégalées
d'accroissement de la productivité agricole et de
protection de l'environnement grâce à un recul de
l'utilisation desproduits agro-chimiques. De nosjours,
les efforts de recherche biotechnologique visent surtout
à résoudre les problèmes immédiats des pays
industrialisés grâce à des investissements dus pour
l'essentiel aux sociétés transnationales. Toutefois,
nombreux sont les nouvelles découvertes et les
nouveauxproduits dontlesprincipauxdébouchés seront
dans les pays en développement, lesquels offrent de
meilleures potentialités d'amélioration de la produc
tivité agricole et de la santé animale.C'est seulement
maintenantque les dirigeantsdecespays ontcommencé
àaccepter l'importance et l'utilitéde labiotechnologie.
Etant donné la crise économique, lesgraves difficultés
detrésorerie, lesbouleversements sociauxetl'instabilité
politique permanente que connaissent ces pays,
l'introduction de changements de politique majeurs
comporte des risques extrêmement sérieux. Cette
communication examine les biotechnologies à
applications potentielles en élevage et identifie celles
qui ont déjà été utilisées ou pourraient l'être dans les
pays en développement en général et en Afrique en
particulier. Elle passe en revue les applications de la
biotechnologieàlagénétique etàla sélection animales,
y compris laconservation des ressourcesgénétiques, la
santé animale, la physiologie de la lactation et de la
croissance et la nutrition animale.
28Small RuminantResearch NetworkWorkshop

Influence de la sélection dupoids du béliersur la
croissance de la descendance
Yapi-Gnaoré" A. Oya* B. Dagnogo* etM. Ouattara3
(Avec la collaboration technique deMme Yapi néeAboussouLéonie)
" IDESSADRA 01 BP633, Bouaké 01 (Côte d'Ivoire)
* sODEPRAPNso, o1 BP 1366Bouaké ol (Côte d'Ivoire)
* Laboratoire de pathologie animale,01 BP1366, Bouaké01 (Côte d'Ivoire)
Résumé
Afin de mesurer l'impactde la sélection du poids
desbéliers Djallonkésur lepoidsde leurs descendances,
200brebis Djallonké ont été misesà lamonte naturelle.
Cesbrebis, répartiesen lots de20animauxchacun, ont
reçu desbéliers sélectionnésdu Programme national de
sélection ovine et des béliers "tout-venant" non
sélectionnés achetés sur le marché local. Le type
génétique (sélectionné ou tout-venant) des béliers
n'avaitpas eu d'effet significatifsur lespoids de leurs
descendances, excepté sur le poids à 80 jours.
L'interaction du mode de naissance desagneaux avec le
type génétique des béliers a euuneinfluence modérée
(P<005) sur les poids à 80 et 180 jours. Le type
génétique desbéliers etsoninteraction avec le sexe et le
modede naissancede l'agneau, onteuuneffetimportant
(P<005)sur le gain moyen quotidien (GMQ)entre 30
et 80jours. La descendance des béliers sélectionnés
pesait respectivement en moyenne300,800et500gde
plusà 30, 80, et 180jours, ce qui correspondaità des
gainsgénétiques de56%,93% et35%par rapportàla
moyenne de poids des agneaux nés de béliers
tout-venant. Les agneaux nés de béliers sélectionnés
avaient desGMQde9et 10g/jdeplus que les agneaux
nés de béliers tout-venant, respectivement entre la
naissance et30jours et entre 30et80jours. Leprogrès
génétique réalisé s'élevait ainsi à 78 et 156% par
rapport à la moyenne de gain de poids des agneaux
tOut-Venant.
Mots clés : Djallonké, gain moyen quotidien, poids,
sélection.
Introduction
Larationalisation de l'élevagetraditionnel ovin en
Côte d'Ivoire s'est traduite en 1976par l'élaboration
d'unProgrammenationalovindont le derniervolet, mis
enplace en 1984, est le Programme nationaldesélection
ovine (PNSO). Cette structuration de l'élevage
traditionnel avait pour objectifs l'encadrement et la
formation des éleveurs et la production de géniteurs
améliorés afin d'accroître la productivité des élevages
ovins par l'amélioration d'un des principaux
paramètres, la croissance du mouton Djallonké.
L'hypothèse selon laquelle la sélection basée sur le
poids du bélier permet d'accroître la croissance des
ovins Djallonké,nepouvaitêtre vérifiéeaprèsplusieurs
années de sélection, étant donné qu'une population
témoin n'avaitpas été établie. L'objectifde laprésente
étudeest doncdemesurerl'impactde la sélection, basée
sur le poids des béliers, sur la productivité par la
comparaison des performances de croissance des
descendants de béliers sélectionnés et non sélectionnés
(tout-venant).
Matériel et méthodes
Deux cent (200) brebis n'ayant subi aucune
sélection ont été achetées et réparties en 10 lots de 20
animauxpourunemonte naturellede45jours,aprèsune
période de quarantaine auCentre national ovin (CNO)
de Béoumi. Les montes se sont déroulées du 12juillet
au 27 août 1994. Cinq lots ont reçu des béliers
sélectionnés du Programme national de sélection ovine
(PNSO); les autres lots, des béliers non sélectionnés ou
"tout venant". Les animaux étaient conduits sur du
pâturage cultivé de Panicum avant le sevrage puis sur
un pâturage mixte de Panicum et de savane naturelle
après le sevrage et recevaientune complémentation de
210à240g/jour paranimal.Celle-ciétaitcomposéede
30% de tourteau de coton et de 70% de son de blé. Les
agnelages se sont déroulés pendant la période du 6
décembre 1993 au 21 janvier 1994. Les agneaux nés
vivants ont été pesés à la naissance puis mensuel
lement. Différents poidsà âge type ainsi que lesgains
moyens quotidiens(GMQ) ont été déterminés.Ce sont
lespoidsàlanaissance(PN),à30(P30),80(P80)et 180
jours (P180) et les GMQ de la naissance à 30jours
(0-30), de 30à 80jours (30-80) et de 80à 180jours
(80-180). Une analyse de variance sur les différents
poidsàâge type et lesGMQaétéeffectuée en utilisant
laméthodedes moindrescarrés deHarvey(1988). Cette
analyseprenaiten compte lesexe, lemode de naissance
de l'agneau, le typegénétique du bélier(sélectionnéou
tout-venant), les interactions du sexe et du mode de
naissance avec letypegénétique et la régression linéaire
dupoidsde la brebis mesuré avant les accouplements.
Small RuminantResearch NetworkWorkshop 29

Yapi-Gnaoré et al
Résultats et discussions
Surles200brebis misesàlamonte,172ontagnelé
ou avorté; ce qui correspond à une fertilité de 86%.
Quinze des brebis ont agnelé avant ou peu après la
monte; ces résultats n'ontpas étépris en compte dans
les analyses.Treize ont avorté et4onteudes mort-nés.
Laprolificitéétait de 1,05
Lespoidsàâge type et lesGMQontportésur 147
agneaux. Les résultats de l'analyse de variance sur les
poids sont présentés au tableau 1 et ceux relatifs aux
GMQautableau2. Lesexe et le mode de naissance des
agneaux ont eudes effets très significatifssur lespoids
aux différents âges(tableau 1). Letype génétique des
béliers n'avaitaucuneffet sur lespoidsdeleurs agneaux,
saufsur le poidsà80jours. L'interaction du mode de
naissance avec le type génétique a eu une influence
modérée (p<005)sur les poids à 80 et 180jours. Le
poids à la naissance n'a été affecté de manière
significative par aucun des facteurs de variation
considérés(tableau 1).
Demêmeque sur les poidsà diversâgestypes, les
effetsdu sexe,du mode de naissance et la régression du
poidsde labrebis étaientimportants sur lesGMQàdes
seuils de probabilité de 1 à 5% (tableau 2). Le type
génétique etson interaction avec le sexe et le mode de
naissance de l'agneauonteuuneffetimportant(P<005)
surleGMQde30à80jours(tableau2).D'une manière
générale, la descendance des béliers sélectionnés a eu
des poids supérieurs à celle des béliers tout-venant
(tableau 3). A 30, 80, et 180 jours, elle avait
respectivementenmoyenne300,800et500gdeplus,ce
qui correspondà desgainsgénétiques de5,6%,9,3% et
3,5% qui sont relativement faiblespar rapport au taux
de 15% rapportépar Fogarty(1994)pour le poids au
sevrage d'agneauxenpaystempéré.Sakul et al. (1994)
attribuent le modeste progrès génétique à une
alimentation inadéquate. La supériorité de la
descendance desbélierssélectionnés aétéd'autantplus
accentuée que lesdoublessurpassaientleurscongénères
issus des béliers tout-venant de 600, 1900 et 1600g
respectivementà 30,80 et 180jours (tableau 3). Les
agneaux simples des béliers tout-venant étaient plus
lourds que ceux des béliers sélectionnés, mais les
différences n'étaient pas statistiquement significatives.
Les tendances observées au niveau des poids entre
agneaux de béliers sélectionnés et agneaux de béliers
tout-venant sont les mêmes que pour les GMQ
(tableau 4). Les agneaux nés de béliers sélectionnés
avaientungain depoids de9 et 10g/j de plus que ceux
Tableau 1.Analyse de la variance despoids à âge type d'agneaux Djallonké
Carrésmoyens
Sources de variation Degréde liberté PN P30 P80 P180
Sexe(S) 1 071" 934" 75 18* 2198**
Mode de naissance (MN) 1 233" 6251" 240.15" 1915"
Typegénétique(TG) 1 000 1,16 1070 ) 3,6
S *TG 1 0,13 202 1573 ) 79
MN*TG 1 0,15 2 57 2272" 250
Poids brebis 1 197" 2956" 9052" 1614"
Résiduel 140 11.80 122,17 403,39 645,3
Coef. de variation (%) 14,06 1507 16,44 13,88
*p<0001, *p<001 "p<005
Tableau2.Analyse de la variance des gains moyens quotidiens d'agneaux Djallonké
Carrés moyens
Sources de variation Degréde liberté GMQ0-30 GMQ.30-80 GMQ80-180
Sexe(S) 1 5687" 12440"
Mode de naissance (MN) 1 45619** 22566" 256
Typegénétique(TG) 1 1330 185" 183
S *TG 1 1327 2551" 132
MN*TG 1 1705 3822" 6
Poids brebis 1 18066" 6686" 1011"
Résiduel 140 107063 77846 34683
Coef. devariation (%) 2004 28.53 3059
*p<001 *p<00 "p<005
30 SmallRuminantResearch NetworkWorkshop
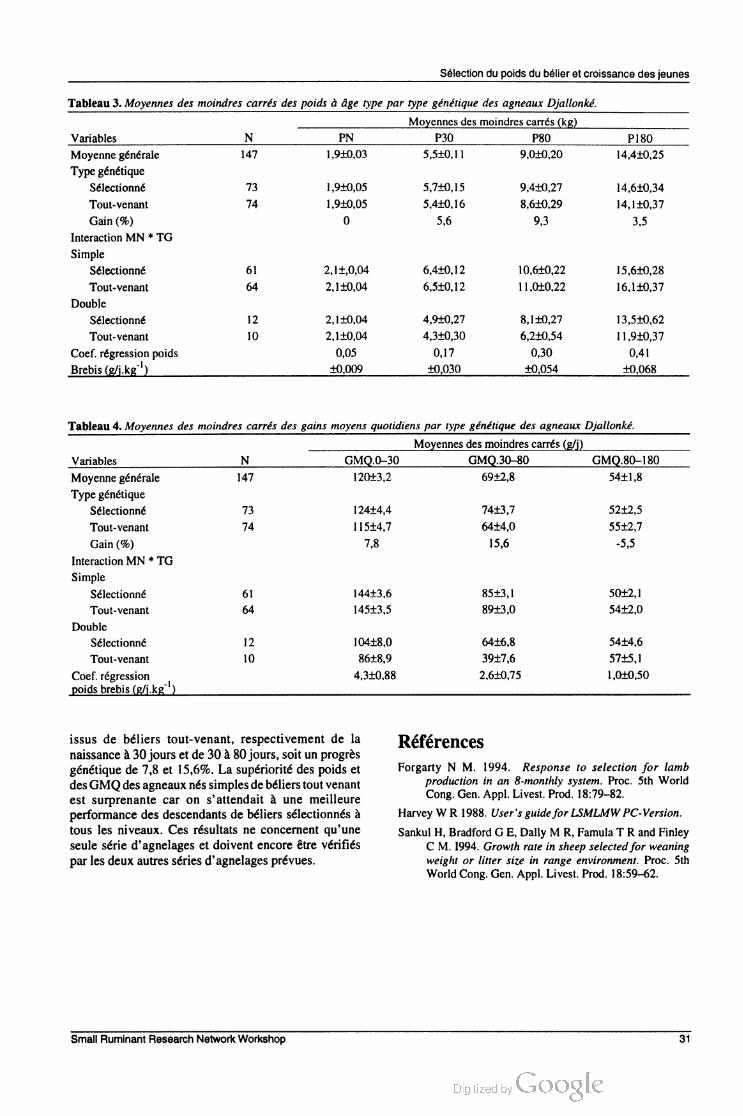
Sélectiondupoids dubélier etcroissance desjeunes
Tableau3.Moyennes des moindres carrés despoids à âge type par type génétique des agneaux Djallonké
Moyennes des moindres carrés (kg)
Variables N PN P30 P80 P180
Moyennegénérale 147 1.9+003 5,5 -0,11 90 -020 14,4H0,25
Typegénétique
Sélectionné 73 1.9+0.05 57+0,15 9,4-0,27 14,6H0,34
Tout-venant 74 1.9+0.05 54-H0,16 14,1+0.37
Gain(%) 0 5,6 9.3 35
Interaction MN*TG
Simple
Sélectionné 61 2,1iE,004 6,4t0,12 10,6 -0,22 15,6H028
Tout-venant 64 2,1+0.04 6,5 -0,12 16,1H0,37
Double
Sélectionné 12 2,1H004 49-E027 8,11H027 13,5 -0,62
Tout-venant 10 2,1H004 4,3-0,30 6,21-054 11.9+0.37
Coef. régressionpoids 0.05 0,17 0.30 0,41
Brebis (gikg ) +0009 +0.030 +0.054 +0.068
Tableau4.Moyennes des moindres carrés des gains moyens quotidienspar type génétique des agneaux Djallonké
Moyennes des moindres carrés (g/j)
Variables N GMQ0-30 GMQ.30-80 GMQ80-180
Moyennegénérale 147 120+3,2 69+2.8 54+1.8
Typegénétique
Sélectionné 73 74+3,7 52+2.5
Tout-venant 74 115+4,7 64E40 55+27
Gain(%) 7.8 15,6 -5,5
Interaction MN*TG
Simple
Sélectionné 61 144+3,6 85+3,1 50+2,1
Tout-venant 64 145+3.5 89+3.0 54+20
Double
Sélectionné 12 104+80 64E6,8 54+4,6
Tout-venant 10 86+89 39+7.6 57+5,1
Coef. régression 4.3-0.88 10- -050
poids brebis (gikg )
issus de béliers tout-venant, respectivement de la Références
naissanceà30jours et de30à80jours,soitun progrès
génétique de78 et 156%. La supériorité despoids et
desGMQdesagneauxnés simplesde bélierstoutvenant
Forgarty N M. 1994. Response to selection for lamb
production in an 8-monthly system. Proc. 5th World
est surprenante car on s'attendait à une meilleure
performance des descendants de béliers sélectionnésà
tous les niveaux. Ces résultats ne concernent qu'une
seule série d'agnelages et doivent encore être vérifiés
parles deuxautres séries d'agnelagesprévues.
Cong.Gen. Appl. Livest. Prod. 1879-82
HarveyWR1988. User'sguideforLSMLMWPC-Version.
SankulH, BradfordGE, DallyMR, FamulaTRandFinley
CM. I994. Growth rate in sheep selectedforweaning
weight or litter size in range environment. Proc. 5th
WorldCong.Gen.Appl. Livest. Prod. 18:59-62
SmallRuminantResearch NetworkWorkshop 31

Yapi-Gnaoré etal
Effect oframweightselection on offspringgrowth
Abstract
Twohundred Djallonké ewesweresubjected to natural
matingto measure the impact oframweightselection
on offspring.The animalswere dividedinto 10groups
of20 ewes each, and were allocated rams from the
National Sheep Selection Programme and other
non-selected rams acquired on the local market. The
genetictype (selected ornon-selected)oframs had no
significanteffectontheweightoftheir offspring, except
forweight at80days ofage.The interaction between
type of birth of lamb and genetic type of ram had a
moderate (P<005) effect on 80- and 180-day weight.
Genetictype andits interactionwith lambsexandbirth
type had an important effect(P<005) on dailyweight
gain between 30and80days.On average, lambsfrom
selected rams were 300, 800 and 500g heavier than
lambsfrom non-selected rams at30,80and 180days,
respectively.Thiswasequivalentto an averagegenetic
gain of56,93and35%, respectively.Frombirthto30
days andfrom30to80days ofage,dailyweightgains
oflambsfrom selected ramswere respectively9and10
ghigherthanthose oflambsfrom unselectedrams.This
represented a genetic gain of78 and 156%, res
pectively, compared to average daily weight gains of
lambsfrom unselected rams.
32 Small RuminantResearch NetworkWorkshop
Genetic analysis ofthe reproductive performance ofWest
African Dwarfgoatsin the humidtropics
I.K. Odubote
Department ofAnimalScience,Faculty ofAgriculture
ObafemiAwolowoUniversity, Ile-Ife, Nigeria
Abstract
A total of 587 kidding records of the West African
Dwarf(WAD)goats overaperiodof10years(1982-91)
wereusedforthisstudy.Themean kiddingintervaland
littersize at birthwere275.68E608days and 1.79E005
kids, respectively. Effect ofparity, season and year of
birth were significant (P<005) for kidding interval.
Parity alsohad significant effect(P<005)on litter size
at birth. Heritability estimates of 0.35E005 and
0.32E007were obtainedfrom sire and sire-damgroup,
respectively, for litter size at birth. The heritability
estimate for kidding interval was 003E001 for the
sire-dam group. Repeatability estimates of038E005
and0.33E0.03were obtainedfor litter size at birthfrom
the dam and sire-dam groups, respectively, while
0.06E004 and 004E002 were obtained for kidding
interval from dam and sire-dam groups, respectively.
Selection for multiple birth is likelyto resultin larger
litter size and culling ofdoes for long kiddinginterval
shouldbe basedon morethantwo records.
Introduction
Genetic improvement of the small ruminants is
imperative consideringtheimprovementinproductivity
that has been achieved by changes in management
practices.VanVlaenderen(1989),Aduetal(1988)and
Odubote(1992),amongotherworkers,havereportedon
theseimprovedperformances.In orderto optimisegains
from environmentalinfluences, geneticparametersand
attributes ofthe animals for economictraits should be
appraisedregularlysoastoenablebreedersto determine
the breedingtools ofchoice.
To date only limited published reports (Odubote
1992)have estimatedgeneticpropertiesfor metrictraits
in goat populations reared in tropical and subtropical
environments. Specifically, heritability and repea
tability estimates are lackingforthe Nigerian breeds of
goat except for the earlier reports of Odubote and
Akinokun (1992) on the West African Dwarf(WAD)
goat andAdu et al(1979) onthe RedSokotogoat. Due
tothe availability ofmore records,itbecamenecessary
to reappraise the genetic attributes ofthe WADgoat
population.
Materialsand methods
Recordsof587kiddingsfromWADgoat matings of11
siresto 163 doesbetween 1982and 1991wereused for
thisstudy.Thegoatswere kept atthe GoatUnit ofthe
ObafemiAwolowoUniversityTeachingand Research
Farm, Ile-Ife, in the humid tropics of Nigeria. The
rainfall pattern is bimodalaveraging1205mmperyear.
The history and management of the flock have
been reportedbyOdubote(1992).Thegoatswere kept
underzerograzingmanagement and stallfedtwicedaily
on a diet consisting ofPanicum maximum, Leucaena
leucocephala andGliricidiasepium.Concentrateswere
also fed when available. The health care package
included dipping, deworming and annual vaccination
againstpeste despetits ruminants(PPR).Animalswere
treated for pneumonia and diarrhoea when infection
occurred. Matingwas controlled and inbreedingwas
avoidedin the herd.
Statisticalanalysis
The data were analysed bythe General Linear Model
(SAS 1986)usingmixedmodelstodeterminethe effects
of the n" doe of the m" mated to the l" sire,
producing k" litter size in the j"season of the i" year
on litter size atbirth and kiddinginterval.
Significant differences between means were
determined using Duncan's New Multiple RangeTest
(Steel and Torrie 1980).The data were adjusted for
significant environmental effectsbefore estimatingthe
geneticvariance components.Thevariance components
were calculatedusing sire,dam andcombinedsire-dam
groups accordingtothe method ofBecker(1968).
Formulae:
From siregroup
h? 4o S2
os 2 2
Fromdamgroup
oD 2 - 9 E 2
From sire-damgroup:
h? - 4o S2
c S - o p 2 p2
p?
2 p2
Standarderrorsforthe estimateswerecomputedas
describedbyFalconer(1981).
Small Ruminant Research NetworkWorkshop 33

Odubote
Results and discussion
The leastsquares meansfor kiddinginterval and litter
size at birth areprovidedinTable 1.Thepartitioningof
the variance components and estimates of heritability
and repeatability are showninTable2
Kiddinginterval
Thekiddingintervalrangedfrom 187to478days.Mean
kidding interval was considerably high. This may be
probably due to the transfer of does for other
experimental purposes and the control of mating
schedule.Highkiddingintervalhasbeenassociatedwith
controlled matingandconfinement(Wilson et al1989).
The results suggest that kidding interval is highly
influencedby management restrictions.
Some cases ofrepeat breeders and abortionswere
observedintheflock.Therewasa significant decrease
inthekiddingintervalfromthefifth parity.Thetrendof
the effect oftype ofbirth andyear ofbirth on kidding
interval is notclear.Therewas,however, a decrease in
the kiddingintervalfrom 1985 onwards.This maybe
traced to changes in management practices such as
cullingofdoesforpoorproductivity.
The repeatability estimates of 0.06E0.04 and
004t002obtainedforkiddingintervalare lowbut not
significantly different from those reported earlier by
Odubote and Akinokun (1992). Also there was no
differencein the estimates usingthetwoapproaches of
computation.The estimate ofheritability could not be
done because of the negative sire component of
variance.
Littersize at birth
Contrarytoan earlierreportonthe sameflock(Odubote
et al 1993), quadruplets were observed in the present
study.The birth ratiowas 37:53:9:1 for singles,twins,
triplets and quadruplets, respectively. Mean litter size
compared favourably with the earlier reports for the
WAD breed (Adu et al 1988; Odubote and Akinokun
1992).
Table 1. Least squares meansfor kidding interval and litter size at birth in WestAfrican Dwarfgoats.
Kiddinginterval(days) Littersize at birth (no.)
Variable N Mean SE N Mean SE
Overall mean 316 275 68 6.08 587 1 79 0.05
Season ofbirth
Dry 165 26030" 574 371 1.84" 0.04
Rain 151 29106" 8.13 216 1 73a 0.06
Year ofbirth
1982 12 27631* 6.11 28 1 65ab 0.13
1983 23 36445" 1023 50 1 70ab 0.05
1984 21 31726° 9 68 41 168* 002
1985 47 26414" 470 93 1 59* 0.06
1986 62 26000" 5 45 112 1.54" 0.04
1987 44 23894" 8.03 91 1.62* 007
1988 15 26633" 7.04 32 1 67ab 0.03
1989 31 25332" 493 39 189° 0,05
1990 32 273 13" 6.80 49 1.83° 003
1991 29 27855* 5.46 52 1.84° 007
Parity
1 - 146 - 1.43* 0.02
2 116 282 14* 6.48 148 1 59ab 0.04
3 69 30436° 8.41 93 1 72ab
4 53 28869° 8.32 77 1 74bc 003
5 30 26104* 506 45 1 85* 007
6 21 25978ab 6.81 35 1 90pc 0.06
7 15 249.68" 7.84 23 2 07de 009
8 8 24801* 5.49 14 20pcde 0.14
9 4 25204" 4.82 6 1 98ed 0.13
Litter size atbirth
1 119 261.32* 5.64
2 166 28645* 307
3 27 26521* 8.45
4 4 30416° 9.63
Nreferstothe numberofobservations.
Meanswithin each class andin each columnwith different superscripts differsignificantly(P<005).
SE=standarderror ofthe mean.
34 Small RuminantResearchNetworkWorkshop

Reproductiveperformance ofWestAfrican Dwarfgoats
Table2.Partitioning ofvariance componentsandestimates ofheritability( )and repeatability(r) oflittersize at birth andkidding
intervals inWADgoats.
Variance components
Traits Sire Doe Remainder r+SE
(a) From siregroup
Littersize atbirth 006* N/A 0.65 N/A 0.35+0.05
Kiddinginterval -1202 N/A 23.64 N/A b
(b) Fromdamgroup
Littersize atbirth N/A 043" 0.70 038-005 N/A
Kiddinginterval N/A 12424 0061-004 N/A
(c) From sire anddamgroup
Littersize atbirth 005" 020** 037 0.33-003 0.32--007
Kidding interval 0.61 303 85.62 0.03 -001
N/A=not applicable;b=negativevariance component estimatesettozero.
* P<005;**P<001.
Littersize at birthtendedtoimproveovertheyears
and with parity (P<005). This may be due to the
efficiencyofreproduction asthe doe matures(Levasseur
and Thibault 1980). Secondly, since 1987, the
managementsystempermittedthe culling ofdoeswith
small litters which may partially account for the
significant increase in litter size.
The heritability estimates of 0.35E005 and
0.32-E007 obtained for litter size at birth were higher
thanthe earlierestimate of028(Odubote 1992)forthe
same flock. The estimates were also higher than
estimates reported (Adu et al 1979), Ricordeau (1981)
andWilson(1989)forotherbreeds ofgoats.The extent
towhich observed differencesin a trait are heritable is
indicative of the magnitude of expected response to
selection.Thus,selectionwouldleadtohigher littersize
at birth. However,this calls for caution (for theWAD
goat) as this may leadto a higherincidence oftriplets
andquadruplets.Thebenefit ofthe incidence oftriplets
andquadruplets shouldbe evaluatedintermsofsurvival
of the kids, dystocia in the does, effect on kidding
intervalandbodyweightofthe kidatbirth.Inthe present
study,noproblemswereobservedtobe associatedwith
multiple birthin theflock.
The repeatability estimates obtainedfor litter size
were (0.38- -0.05 and 0.33+003. As a result of the
moderate repeatabilityestimatesasingle record ofadoe
can be taken as a fair assessment of its potential.
Systematic culling ofunproductive animalsmaybe the
most important management practice to increase the
littersizeatbirth.Alsobreedingmalesfromparentswith
poorfertilityshouldbe avoidedsince effect ofstudbuck
was observed to be significant (P<005). Estimates of
genetic parameters for extensively managed goat
population are still required.
Conclusions
Efforts shouldbemadeto reducethe kiddingintervalby
changes in management restrictions especially
re-breedinginterval. Not much reliance can be placed
ontwosubsequentkiddingrecordsforcullingpurposes.
More records shouldthusbe collected before deciding
on culling levelsforunproductive does.
References
Adu IF, Buvanendran V. and LakpiniCAM. 1979. The
reproductive performance of Red Sokoto goats in
Nigeria. Journal ofAgricultural Science (Cambridge)
93:563-566
Adu IF,OdeniyiA.O. andTaiwoB.B.A. 1988. Production
characteristics ofa herd ofWestAfrican Dwarfgoats at
Ubiaja, Bendel State of Nigeria. In: Smith O.B. and
Bosman H.G. (eds), Goat Production in the Humid
Tropics. Proceedings ofaworkshop at the University of
Ife, Ile-Ife, 20-24 July 1987. Pudoc Scientific
Publishers,Wageningen,TheNetherlands.pp.140-144
BeckerW.A. 1968. Manual ofProcedures in Quantitative
Genetics.2nd edition. Academic Enterprises, Pullman,
Washington,USA.62pp.
Falconer D.S. 1981. Introduction to Quantitative Genetics.
2ndedition.Longman,London,UK.340pp.
LevasseurM.andThibaultC.1980. Reproductive life cycles.
In: Hafez E.S.E. (ed), Reproduction in FarmAnimals.
4th edition. Lea and Febiger, Philadelphia, USA.
pp. 130-149.
Odubote I.K. 1992. Genetic and Non-Genetic Sources of
Variation in Litter Size, Kidding Interval and Body
Weight at Various Ages in WestAfrican DwarfGoats.
PhD thesis, Obafemi Awolowo University, Ile-Ife,
Nigeria. 161 pp.
Odubote I.K. and AkinokunJ.O. 1992. Estimates ofgenetic
parameters for economic traits inWestAfrican Dwarf
Goat. Nigerian Journal ofAnimal Production
19:114-119.
Odubote I.K., Akinokun J.O. and Ademosun A.A. 1993.
Production characteristics ofWestAfrican Dwarfgoats
underimproved management system. In: AyeniA.O.
and Bosman H.G. (eds), Systems ofGoat Production.
Proceedings ofan International Workshop held at the
ObafemiAwolowo University, Ile-Ife, 6-9July 1992
Pudoc Scientific Publishers, Wageningen, The
Netherlands.pp.202-207.
Small RuminantResearch NetworkWorkShop 35

Odubote
SAS(Statistical Analysis System). 1986. SAS Users Guide:
Statistics.SASInc.,Cary,North Carolina,USA.923pp.
SteelR.G.D.andTorrieJ.H.1980. Principles andProcedures
ofStatistics. 2nd edition. McGraw Hill, London,UK.
633pp.
VanVlaenderenG.1989.Togo:Astudyofvillage levelsheep
andgoat development. In:TimonV.H.and BabarRP
(eds), Sheep and Goat Meat Production in the Humid
Tropics ofWestAfrica. Animal Production and Health
Paper70. FAO(Food andAgriculture Organization of
theUnitedNations),Rome, Italy.pp.142-169.
Wilson RT, Murayi T. and Rocha A. 1989. Indigenous
African small ruminant strains with potentially high
reproductive performance. Small Ruminant Research
2:107-117
Analysegénétique desperformances de reproduction de la chèvre
guinéenne dans les régionstropicales humides
Résumé
Untotal de587données departurition de chèvres
de la zoneguinéenne collectées sur une période de 10
ans (1982-1991) ont été utilsées pour cette étude.
L'intervalle moyen entre parturitions et la taille
moyennede laportéeétaientrespectivementde27568t
608jours et 1,79+005chevreaux. La parité, la saison
et l'année de la naissance avaient un effet significatif
(P<005)sur l'intervalle entre misesbas. Laparitéavait
également un effet significatif(P<005)sur la portée.
Les coefficients d'héritabilité de la portée étaient de
035t005pour lepère etde0.32E007pour lepère et
la mère.Celuide l'intervalle entre parturitions était de
003E001 pour le père et la mère. Les coefficients de
répétabilité de la portée étaient de 0.38H005pour la
mère et de 0,33E003 pour le père et la mère, contre
respectivement006t004et004E002pour l'intervalle
entre mises bas. La sélection pour des naissances
multiples devrait permettre d'accroître la taille de la
portée. Enfin, l'élimination desfemelles pour cause de
trop longs intervalles entre parturitions doit être basée
surau moins deuxdonnées.
36 SmallRuminantResearchNetworkWorkshop

Preliminary evidenceforgenetic resistanceto endoparasites
in Menzand Horro lambsin the highlands ofEthiopia
J.E.O. Rege " S, Tembely " E. Mukasa "S. Sovani"
D. Anindo"A. Lahlou-Kassi" andRL Baker*
I. International Livestock Centre forAfrica(ILCA)
PO. Box5689,AddisAbaba, Ethiopia
2. ILCA, PO. Box46847 Nairobi, Kenya
Abstract
The Menz and Horro highland sheep breeds are being
evaluated atthe ILCA Debre Birhan research station in
Ethiopiaforbetween-andwithin-breedgeneticvariation
for resistance to internal parasites. The experimental
design involves mating,for each breed, 150eweswith
10 rams to lamb at the beginning ofthe dry season
(October/November) and the wet season (June/July).
Thispaper reports data collectedfrom birth toweaning
on lambs from the first three lamb crops (i.e. born
October/November 1992; June/July 1993;
October/November 1993). The traits analysed were
birth weight(BWT),weaningweight(WWT),packed
red cellvolume (PCV) recorded atweaning, logarithm
transformed faecal egg count (LFEC) recorded at
weaningand lambsurvivalfrom birth toweaning.The
effect ofboth breed and lambinggroupwas significant
(P)for all traits analysed. Horro lambswere heavier at
birthand atweaning, had lowerPCV, higherLFECand
lower survival rate from birth to weaningthan Menz
lambs.Therewas a significant interaction ofbreed by
lambing group for all traits except BWT. For lamb
survival,WWTand PCVthe interaction took the form
ofvaryingmagnitude ofdifferencesbetweenthebreeds
in different lambinggroups rather than any change in
breed ranking. ForLFECthebreed ranking changedin
different groups with the Menz having higher LFEC
than Horro lambs in the first lambinggroup,while the
reversewastruein the othertwolambinggroups.There
was no evidence from these data that the breed
difference in lamb survival was due to resistance to
endoparasites. There was significant additive genetic
direct and maternal variance for BWTandWWT. For
BWTthe estimate ofthe direct (h*A) and maternal (h*M)
heritabilitywere007-E006and0.34E006, respectively,
while for WWT the corresponding estimates were
004005and043E007 ForPCV andLFECh*Mwas
not significantandtheoverallheritabilityestimateswere
0.34E0.14 and0.32E0.13, respectively.
Introduction
Helminthiasisis ofconsiderable significance in awide
range ofagro-climaticzonesin sub-SaharanAfrica and
constitutes one of the most important constraints to
small ruminant production (ILCA 1991; Over et al
1992). The widespread occurrence of infection with
internal parasitesingrazinganimals,the associated loss
ofproduction, the costs ofanthelmintics and death of
infected animals are some ofthe major concerns.There
are alsoincreasing environmental concernswhich may
influence anthelminticusagethrough consumerdemand
for animal products and pastures free of chemical
residues.
Current control methods for internal parasites
outside Africa focus on reducing contamination of
pastures through anthelmintic treatment and/or
controlledgrazing. In Africa,these control methods are
limitedbythe high cost ofanthelmintics,theiruncertain
availability, increasingfrequency ofdrugresistanceand
limited scope in many communalpastoral systemsfor
controlled grazing(Waller1991;Mwamachietal 1995;
Tembelyet al this conference). It appears unlikelythat
new broad-spectrum anthelmintics willbe available in
the near future because ofthe major costs associated
withthe developmentofnewproducts,andtodate only
afew commercial vaccines are available includingthe
lungworm-irradiated vaccine.Alternative approachesto
controlinternalparasites arethereforebeingconsidered.
Onesuchapproachisutilisation ofhostgeneticvariation
for resistance.
Evidence ofgenetic variation in sheep and goats
for resistance to or tolerance of gastro-intestinal
nematodes was first documented40-50years ago and
this subject has been comprehensively reviewed by
Gray(1991), Gray andWoolaston (1991), Baker et al
(1992) and Gray et al (1995). The best documented
examples of sheep breeds showing resistance to
endoparasitesinAfricaaretheRedMaasaisheepinEast
Africaandthe DjallonkésheepinWestAfrica(Preston
andAllonby1978; Preston andAllonby1979; Bakeret
al 1993; Baker etal 1994;Baker 1995).
There are about 23 million sheep and 17 million
goats in Ethiopia (FAO 1987). Three-quarters ofthe
national sheep flockis located in the highland regions
whichreceive morethan700mmofrainfallperyearand
accommodate three-quarters ofthe human population.
Gebrekiros Asegede (1990) compared four breeds of
indigenous Ethiopian sheep for their resistance to
endoparasites (predominantly Haemonchus contortus)
atAwassain southern Ethiopia.The breeds evaluated
SmallRuminantResearch NetworkWorkshop 37

Rege et al
were the Adal and BlackheadSomali originatingfrom
the semi-arid lowland regions, and the Horro and Arsi
from thehumidhighlands.The BlackheadSomaliwere
the most susceptible to endoparasites while the Arsi
were the most resistant.
Thispaperpresentssomepreliminary resultsfrom
an evaluation ofthe resistance ofMenzandHorrolambs
to endoparasites in the highlands of Ethiopia. This
research is part of an ILCA Pan-African research
programme to investigate and characterise genetic
resistance to endoparasites in some indigenous sheep
and goat breeds in sub-Saharan Africa (ILCA 1991;
ILCA1993).
Materialsandmethods
Experiment site
The Debre Birhan experiment station is located in the
central Ethiopian highlands about 120kmNEofAddis
Ababa at an altitude of2780 m above sea level. The
climate is characterised by a long rainy season
(July-September), a short rainy season (February
March) and an extended dry season (October
February). Annual rainfall averages 920 mm. Air
temperatures rangefrom anearfreezinglowof24'Cin
Novemberto233'CinJune.Thepasture at the station
is dominated by Andropogon grass (Andropogon
longipes)with variableproportions ofTrifolium spp.A
detailed presentation of relevant epidemiological data,
including predominant parasites at the experimental
station is reported elsewhere (Tembely et al this
proceedings).
Experimentalanimalsand management
Menz (indigeneous to the study area) and Horro
(introduced from a slightly lower highland area) ewes
wereoestroussynchronisedwithprogestronspongesleft
in place for 10to 12 days to permit for dry and wet
season lambings.Single sire mating occurred in night
pens for 30 days and ewes were allowed to graze
togetherduringthe day.After mating, all ewes received
concentrate supplement (200g/head per day). Female
lambs were separated from the male lambs after
weaning,but exposedto the same grazingpaddocksin
a rotational grazing system until the end of the
experimentattheage of12months.Thematingschedule
used toproduce the lamb crops analysedispresentedin
Table 1.Grazing management and health intervention
programmes aredescribedelsewhere(Tembelyetalthis
conference).
Data recorded
Liveweightswere recordedonalllambsatbirth(BWT)
andatweaning(WWT)at3-4monthsofage.Bloodand
faecalsampleswere collectedfrom all lambs at 1and2
months ofage and atweaning. Packed red cellvolume
(PCV)was determined usinga haematocrit centrifuge.
Faecal egg counts (FEC) were analysed using the
modified McMaster method (MAFF 1977).
Additionally,faecal sampleswere bulkedbybreed and
sex and cultured for larvae identification (Hansen and
Perry 1990).ThoughFECandPCVmeasurementswere
taken on all lambs at 1 and 2 months of age and at
weaning(at3 months ofage), onlythe data on weaners
is reported in this paper. Individual lambs with FEC
greaterthan2000eggspergram(epg)and/orPCVless
than 15% atthe2-monthsamplingwere drenched.
Statistical analysis
Analyses of fixed effects were performed by least
squares (Harvey 1990). The fixed effects modelfitted
included lambbreed(Menzand Horro),lambinggroup
(3 levels), lambsex(male andfemale), lambbirth type
(single ortwin born),damparity(first,secondand later)
and the interaction of breed and lambing group. In
preliminary analyses, parity was only significant for
BWT andWWT and was excluded from subsequent
modelsforthe othertraits. Birth datewasincludedinthe
modelasa linearcovariatewhenanalysingBWT.Lamb
age wasincluded as a linear covariate when analysing
WWT,PCVand FEC. Preliminary analyses identified
that most other first-order interactions were not
significant (P>005), except for birth type xparity for
WWT and lamb age x lambinggroup forWWT and
FEC.Survivalfrom birthtoweaningwas analysed as a
binomial variable (0 = dead, 1=alive) with the same
fixed effect model as for the other traits but with no
covariate or dam parity effectin the model. FECwas
analysedboth as an untransformedvariable andusing a
logarithm transformation,loge (FEC+10),to normalise
the distribution ofthis trait.
Heritabilitieswere estimated by Restricted Maxi
mum Likelihood (REML) using an animal model
applyingthe DFREMLsoftware ofMeyer(1991) and
Table 1. Mating and lambing schedules for the three lamb crops analysed
No. oframs No. ofewes" No. oflambsborn
Group Matingperiod Horro Menz Horro Menz Lambingseason Horro Menz
1 May1992 11 11 276(20) 284(20) Oct/Nov 1992 124 137
2 January 1993 10b) 1 1 286(20) 274(20) June/July 1993 116 233
3e) May1993 11 11 233(20) 224(20) Oct/Nov 1993 144 201
a) Number ofunmated control ewes are in parenthesis.
b) One ram died beforethe second matingseason.
c) Foreach breed eight new ramswere introduced and three previous ones(groups l and2) retained.
38 SmallRuminantResearch NetworkWorkshop

Genetic resistancein Ethiopianhighland lambs
fittingthesignificantfixed effectsidentifiedinthefixed
modelanalyses ofvariance.
Results
Tests ofsignificancefrom analyses ofvariance,overall
means and residualstandard deviationsforthe six traits
analysed arepresentedinTable2.Differencesbetween
breeds and lambinggroupswere significant(P)for all
traits analysed, and, with the exception ofBWT, the
interaction of breed by lambing group was also
significant(P).Theskewed,non-normal distribution of
FEC is clearly reflected in the high coefficient of
variation (CV)of11 1%whichis reducedto23.5%when
the logarithm transformationis applied(i.e.LFEC).
The least squares meansforbreed, lambinggroup
and the interaction of breed by lambing group are
presentedinTable3. Horrolambswereheavier at birth
andweaning, had lower PCV, higher LFECand lower
Table2 Analysis ofvariance, overallmean, residual standard deviation and coefficient ofvariation (CV)forbirth weight(BWT)
weaningweight(WWT),packed cellvolume(PCV), faecalegg count(FEC), logarithm transformedFEC(LFEC)and lambsurvival
from birth toweaning(SURV)
Source ofvariation BWT(kg) WWT(kg) PCV(%) FEC(epg) LFEC SURV(%)
Breed k k k »k »k k k »k k k k
Lambing gp (LG) 2k k k 2k k k »k »k k k k k
Breedx LG I1S 2k 2k 2k k k k 2k
Sex 2k 2k 2k 2k 2k 2k »k I1S
Birth type(BT) k k k k k k »k
Damparity (DP) 2k 2k 2k - - - -
Covariate
Birth date
Lambage »k k
LambagexLG »k »k
BTXDP k2k k
Total records 954 783 781 733 733 954
Overall mean 242 92 353 395 2.16 84 5
ResidualSD 0.42 1.9 44 439 0.51 31.6
CV(%) 17 2 21.0 12.4 1 1 1 23.5 374
ns=not significant; * P<005; *** P<001;*** P<0001.
Table3. Least squares means by breed, lambinggroup and breed x lambinggroup interaction for birth weight(BWT), weaning
weight(WWT),packed cellvolume(PCV), anti-log oflogarithm transformedfaecal eggcount(ALFEC)and lambsurvivalfrom birth
toweaning(SURV).
No. oflambs SURV
Effect born BWT(kg) WWT(kg) PCV(%) ALFEC(epg) (%)
Breed
Menz 573 2.16 8.4 357 153 85.8
Horro 381 2.50 8 9 33.3 183 73.1
Significance »k »k »k 2k 2k2k»k
Lambinggroup
(LG)
1 283 207 87 334 137 84 9
2 340 275 97 34.9 502 94.1
3 331 2.18 7.4 35 2 69 59 3
Significance k k k »k k k
BreedxLG
Menz 1 149 1.90 8.7 35.6 214 92.3
2 228 2.54 90 35.8 353 96.8
3 196 2.02 74 357 48 68.3
Horro 1 134 2.23 8.8 31.3 87 77 5
2 112 2 92 10.4 33 9 708 91.4
3 135 2.33 7 5 34.6 98 503
Significance InS 2k2k k 2k k k »k
ns=not significant; * P<005; ** P<001;*** P<0001.
SmallRuminantResearch NetworkWorkshop 39
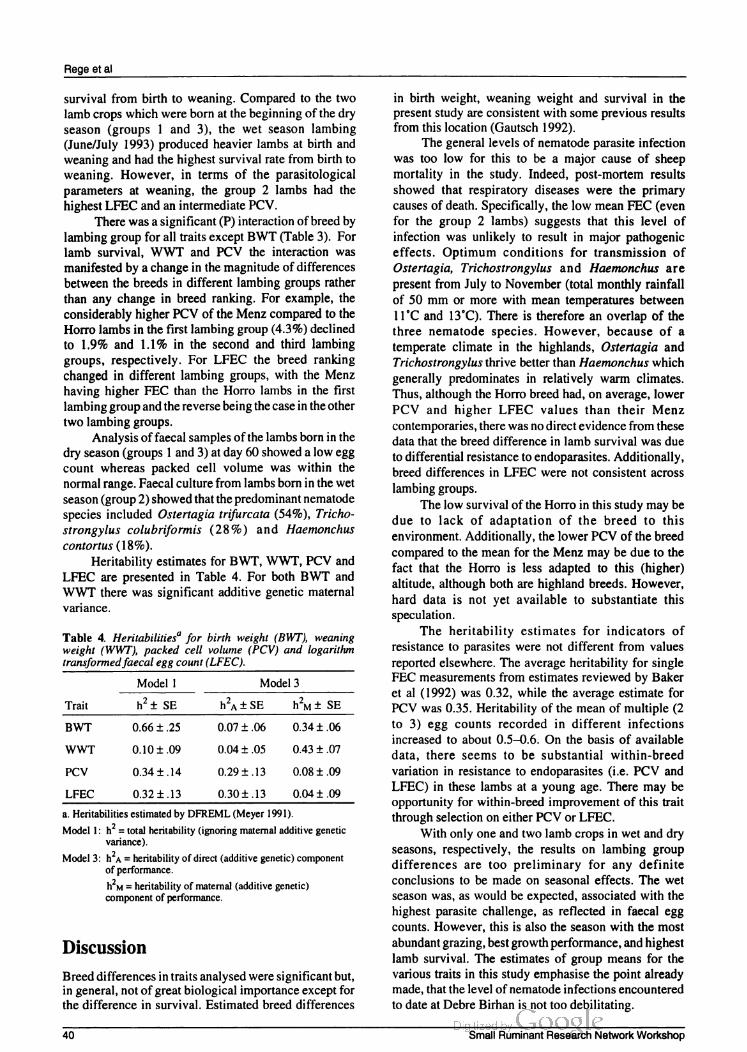
Rege et al
survival from birth to weaning. Compared to the two
lamb cropswhichwereborn at thebeginning ofthe dry
season (groups 1 and 3), the wet season lambing
(June/July 1993)produced heavier lambs at birth and
weaningandhadthe highestsurvival ratefrom birth to
weaning. However, in terms of the parasitological
parameters at weaning, the group 2 lambs had the
highest LFECandanintermediate PCV.
Therewas asignificant (P)interaction ofbreedby
lambinggroupfor all traits exceptBWT(Table3). For
lamb survival, WWT and PCV the interaction was
manifestedbyachangein the magnitude ofdifferences
between the breeds in different lambinggroups rather
than any change in breed ranking. For example, the
considerablyhigherPCV ofthe Menzcomparedtothe
Horro lambs in the first lambinggroup(4.3%) declined
to 1.9% and 1.1% in the second and third lambing
groups, respectively. For LFEC the breed ranking
changed in different lambing groups, with the Menz
having higher FECthan the Horro lambs in the first
lambinggroupandthe reversebeingthe caseinthe other
twolambinggroups.
Analysis offaecalsamples ofthe lambs borninthe
dryseason(groups 1 and3)atday60showeda lowegg
count whereas packed cell volume was within the
normal range. Faecalculturefrom lambsborninthewet
season(group2)showedthatthepredominant nematode
species included Ostertagia trifurcata (54%), Tricho
strongylus colubriformis (28%) and Haemonchus
contortus(18%).
Heritability estimatesforBWT,WWT, PCVand
LFEC are presented in Table 4. For both BWT and
WWTthere was significant additive genetic maternal
variance.
Table 4 Heritabilities" for birth weight (BWT), weaning
weight (WWT), packed cell volume (PCV) and logarithm
transformedfaecal egg count(LFEC).
Model 1 Model3
Trait h*+ SE h*AESE h*m + SE
BWT 0.66 + .25
WWT 0.10+ 09
PCV 0.34 t .14 0.29 -- .13 008 - - .09
LFEC 0.32+ .13
a. Heritabilities estimatedbyDFREML(Meyer 1991)
Model 1: h*=total heritability(ignoring maternal additive genetic
variance).
Model3: h*A= heritability ofdirect (additive genetic)component
ofperformance.
h*M =heritability ofmaternal(additive genetic)
component ofperformance.
Discussion
Breeddifferencesintraits analysedweresignificant but,
in general, not ofgreatbiologicalimportance exceptfor
the difference in survival. Estimated breed differences
in birth weight, weaning weight and survival in the
present study are consistentwith someprevious results
fromthis location (Gautsch 1992).
Thegeneral levels ofnematode parasite infection
was too low for this to be a major cause of sheep
mortality in the study. Indeed, post-mortem results
showed that respiratory diseases were the primary
causes ofdeath.Specifically, the lowmeanFEC(even
for the group 2 lambs) suggests that this level of
infection was unlikely to result in major pathogenic
effects. Optimum conditions for transmission of
Ostertagia, Trichostrongylus and Haemonchus are
present fromJulyto November(total monthly rainfall
of50 mm or more with mean temperatures between
11'C and 13'C).There is therefore an overlap ofthe
three nematode species. However, because of a
temperate climate in the highlands, Ostertagia and
Trichostrongylusthrive betterthan Haemonchuswhich
generally predominates in relatively warm climates.
Thus, although the Horrobreed had,on average,lower
PCV and higher LFEC values than their Menz
contemporaries,therewasnodirectevidencefromthese
data thatthe breed difference in lamb survivalwas due
to differential resistanceto endoparasites.Additionally,
breed differences in LFECwere not consistent across
lambinggroups.
The lowsurvivalofthe Horroin thisstudy maybe
due to lack of adaptation of the breed to this
environment.Additionally,the lowerPCV ofthe breed
compared tothe mean for the Menz maybe due to the
fact that the Horro is less adapted to this (higher)
altitude, although both are highland breeds. However,
hard data is not yet available to substantiate this
speculation.
The heritability estimates for indicators of
resistance to parasites were not different from values
reported elsewhere.The average heritability for single
FEC measurementsfrom estimates reviewed by Baker
et al (1992)was 032,while the average estimate for
PCVwas0.35. Heritability ofthe mean of multiple (2
to 3) egg counts recorded in different infections
increased to about 0.5-0.6. On the basis of available
data, there seems to be substantial within-breed
variation in resistance to endoparasites (i.e. PCV and
LFEC)in these lambs at a young age. There may be
opportunity forwithin-breedimprovement ofthis trait
through selection on either PCV orLFEC.
With only one andtwo lamb cropsinwet and dry
seasons, respectively, the results on lambing group
differences are too preliminary for any definite
conclusions to be made on seasonal effects. The wet
season was, as wouldbe expected, associated with the
highest parasite challenge, as reflected in faecal egg
counts. However,this is alsothe seasonwith the most
abundantgrazing, bestgrowthperformance,andhighest
lamb survival. The estimates ofgroup means for the
various traitsin this study emphasise the point already
made,thatthe level ofnematodeinfections encountered
to date at Debre Birhanis nottoo debilitating.
40 SmallRuminantResearch NetworkWorkshop

Genetic resistancein Ethiopian highland lambs
Exceptforfaecal egg counts, the effect ofbreedx
lambinggroup interactions were ofno majorpractical
significance. However, no final conclusions can be
drawn until more data and additional traits (post
weaninggrowth,PCV,FECaswellasreproduction)are
analysed.
References
Baker R.L. 1995. Genetics of disease resistance in small
ruminants inAfrica. In: GrayG.D.,WoolastonR.R.and
Eaton B.T.(eds), BreedingforResistance to Infectious
Diseases of Small Ruminants. ACIAR Monograph
Series 34. ACIAR (Australian Centre for the
International Agricultural Research), Canberra,
Australia.pp. 119-138
Baker R.L., Lahlou-Kassi A., Rege JEO., Reynolds L.,
BekeleT., Mukassa-Mugerwa E. and Rey B. 1992. A
review ofgenetic resistance to endoparasites in small
ruminantsandanoutline ofILCA's researchprogramme
in this area. In: Proceedings of the Tenth Scientific
Workshop of the Small Ruminant Collaborative
Research Support Program (SR-CRSP), Nairobi,
Kenya.SR-CRSP, Nairobi, Kenya.pp.79-104
Baker R.L., Reynolds L., Mwamachi D.M., Audho J.O.,
MagadiM. and MillerJE. 1993.Genetic resistance to
gastrointestinal parasites in Dorper and Red Maasaix
Dorper lambsin coastal Kenya. In: Proceedings ofthe
Eleventh Scientific Workshop of the Small Ruminant
Collaborative Research Support Program (SR-CRSP)
held at ILRAD, Nairobi, Kenya, 3-4 March 1993.
SR-CRSP, Nairobi, Kenya.pp.228-241.
Baker R.L., Mwamachi D.M., Audho JO. and ThorpeW.
1994. Genetic resistance to gastrointestinal nematode
parasites in RedMaasai sheepin Kenya. In: SmithC.,
GavoraJ.S.,BenkelB.,ChesmaisJ.,FairfullW.,Gibson
J.P., Kennedy B.W., Burnside E.B.(eds), Proceedings
of the 5th World Congress on Genetics Applied to
Livestock Production, Guelph, Canada, 7-12 August
1994. Volume 20. International Committee for World
Congress onGeneticsAppliedtoLivestockProduction,
Guelph, Ontario, Canada.pp.277-280
FAO (Food and Agriculture Organization of the United
Nations). 1987. 1987 Yearbook. FAO,Rome, Italy.
Gautsch KD. 1992. Summary ofResults ofOn-station and
On-farm Sheep Research in the Ethiopian Highlands.
ILCAConsultancy Report.
Gebrekiros Asegede. 1990. Studies on the Ecology of
Helminth Parasites in Naturally Infected Indigenous
Sheep in Awassa, Southern Ethiopia.PhDthesis,Centre
of Tropical Sciences and Parasitology, Giessen
UniversityGermany,Germany. 176pp.
GrayG.D. 1991. Breeding for resistance to Trichostrongyle
nematodesin sheep. In: OwenJ.B. and Axford R.FE.
(eds),BreedingforDiseaseResistancein FarmAnimals.
CAB (Commonwealth Agricultural Bureaux)
International,Wallingford,UK.pp. 139-161.
GrayG.D. and Woolaston RR. (eds). 1991. Breeding for
Disease Resistance in Sheep. Australian Wool
Corporation, Melbourne, Australia. 151 pp.
Gray G.D., Woolaston R.R. and Eaton BT (eds). 1995
Breedingfor Resistance to Infectious Disease ofSmall
Ruminants. ACIAR Monograph Series 34. ACIAR
(Australian Centre for International Agricultural
Research), Canberra, Australia.322pp.
HansenJ. and Perry B. 1990. The Epidemiology, Diagnosis
andControlofGastro-Intestinal ParasitesofRuminants
in Africa. A Handbook. ILRAD (International
LaboratoryforResearch on Animal Diseases), Nairobi,
Kenya. 121pp.
HarveyW.R. 1990. Users Guidefor the PC-2Version of the
LSMLMW and MIXMDL Mixed Model Least Squares
and Maximum Likelihood Computer Program. Ohio
State University,Columbus,USA.
ILCA (International Livestock Centre for Africa). 1991.
Proceedings ofthe Research Planning Workshop on
Resistance to Endoparasites in Small Ruminants,Addis
Ababa, Ethiopia,5-7February1991.78pp.
ILCA(InternationalLivestock CentreforAfrica). 1993. ILCA
1992AnnualReport andProgramme Highlights. ILCA,
AddisAbaba, Ethiopia. pp.29-36
MAFF(Ministry of Agriculture, Fisheries and Food). 1977
Manual of Veterinary Parasitological Laboratory
Techniques. Technique Bulletin 18. Her Majesty's
StationaryOffice, London,UK. 129pp.
Meyer K. 1991. DFREML-aSet ofPrograms to Estimate
Variance Components by Restricted Maximum
Likelihood using a Derivative-free Algorithm. User
Notes, Version 2.0. Mimeo. Animal Genetics and
BreedingUnit,University ofNew England,Armidale,
Australia.85pp.
Mwamachi D.M., Audho JO., Thorpe W. and Baker RL
1995. Evidencefor multiple anthelmintic resistance in
sheep andgoats rearedunderthe same management on
a farm in coastal Kenya. Veterinary Parasitology
60(3-4)303-313
OverH.J.,JansenJ. andvonOlmPW. 1992.Distribution and
ImpactofHelminthDiseases ofLivestockin Developing
Countries. FAOAnimal Production and Health Paper
96. FAO (Food and Agriculture Organization of the
United Nations), Rome, Italy.221pp.
PrestonJ.M. and AllonbyEW. 1978.The influence ofbreed
on the susceptibility of sheep and goats to a single
experimental infection with Haemonchus contortus.
VeterinaryRecord 103509-512
PrestonJM. andAllonbyEW. 1979.The influence ofbreed
onthe susceptibility ofsheeptoHaemonchus contortus.
AmericanJournal ofVeterinaryResearch33:817-823.
Waller P.J. 1991.The status ofthe anthelmintic resistance in
the world. Its impact on parasite control and animal
production. Paper prepared for the FAO Expert
Consultation on Helminth Infections of Livestock in
Developing Countries (AGA/HIL/91/12). FAO (Food
and Agriculture Organization ofthe United Nations),
Rome, Italy. 19pp.
Small RuminantResearch NetworkWorkshop 41

Rege et al
Preuvespréliminaires de résistancegénétiqueauxendoparasites
chez les agneauxMenzet Horro dans les hautsplateauxéthiopiens
Résumé
Destravauxsont actuellementencoursàla station
de rechercheduCIPEAàDebreBerhanen Ethiopie,sur
l'évaluation de la variation génétique de la résistance
aux endoparasites chez les races de moutons Menz et
Horrodeshautsplateaux. Leprotocoleexpérimentalfait
intervenir le croisement,pourchaquerace,de 150brebis
avec 10 béliers en vue d'un agnelage au début de la
saisonsèche(octobre/novembre)etde lasaisonhumide
(juin/juillet). Le présent article présente les résultats
enregistrés sur les agneaux issus des trois premiers
groupes de naissances (octobre/novembre 1992;
juin/juillet 1993; octobre/novembre 1993). Les
variables analysées sont le poids à la naissance et au
sevrage,l'hématocrite ausevrage, la transformation log
du nombre d'oeufs par gramme de fèces (OPG) au
sevrage et le tauxde survie des agneauxde la naissance
au sevrage. La race et la série d'agnelages avaient un
effet significatif (P<005) sur tous les paramètres
étudiés. Les agneaux Horro avaient des poids à la
naissance et au sevrage supérieursà ceux des Menz et
unhématocriteplusfaible. Latransformationlogde leur
OPGétaitplus élevée tandis que leur tauxde survie de
la naissance au sevrage étaitplus faible. Ily avaitune
interaction significative entre la race et le groupe
d'agnelagespour tous les caractères étudiés excepté le
poidsà lanaissance.En ce quiconcerne letauxde survie
des agneaux, le poids au sevrage et l'hématocrite, les
différences dues à l'interaction étaientplus ou moins
importantessuivant legroupe d'agnelages mais l'ordre
de succession des races ne changeaitpas.S'agissanten
revanche de la transformation log de l'OPG, cet ordre
changeaitselon legroupe.Ainsi, cettevariable était plus
élevée chezlesMenzque chezlesHorrodans lepremier
groupe d'agnelages alors qu'on observait la situation
inverse dans les deux autres groupes. Rien dans ces
donnéesnepermettaitde dire que la différence entre les
tauxde survie des agneauxMenzet Horro étaitdueà la
résistance aux endoparasites. Lesvariancesgénétiques
additives directe et maternelle des poidsà la naissance
et au sevrage étaientsignificatives. En ce qui concerne
le poids à la naissance, les coefficients d'héritabilité
directe (h*A) etmaternelle (h*M) étaientrespectivement
de 0,07h0,06 et de 0,34-E0,06, les valeurs corres
pondantes étant respectivement de 0,04E0,05 et de
043t007pourlepoids ausevrage. Enfin, le coefficient
d'héritabilité maternelle n'était pas significatif pour
l'hématocrite et la transformation log de l'OPG, les
coefficients d'héritabilité totale s'établissant
respectivementà0,34E0,14 et0,32 E 0,13
42Small RuminantResearchNetworkWorkshop

Morphological characterisation oftheTswanagoat
J.BD. Katongole,B. Sebolai andM.J. Madimabe
Botswana College ofAgriculture
Private Bag0027, Gaborone, Botswana
Abstract
A survey study was conducted in two districts of
Botswana to obtain data on the morphological
characteristics of Tswana goats. There were five
different locations chosen, namelyOodi, Artesia and
Mochudu in the Kgatleng District and Kopong and
Thamagain Kwenengdistrict. In each location,16to20
farmers withgoatswere randomlyselectedand records
takenon arandomsampleof10goatsfrom eachfarmer.
The different body dimensions that were measured
included heartgirth (HG), diagonalbody length (BL),
height atwithers (HW), bodyweight(BW) and rump
height(RH). Records were also taken on presence of
horns(HO),wattles(Wa)andbeards(Bd),coatcolours
(white,black,blackandwhite,brown,brownand white)
and hair structure (short coarse, long coarse, short
smooth and long smooth). The results showed
age-dependent sexual differences in the body
dimensions that were measured. The apparent wide
variation in coat colours and hair structure among
Tswanagoats observedin thisstudyisindicative ofthe
fact that the breed has not yet been purified through
selection breeding and therefore great opportunities
existfor itsimprovement.Thepropensitytowardwhite
coat colour and/or white in combination with other
colours especially black and brown, appears to be an
adaptive characteristic ofTswana goats to withstand
pronounced seasonal fluctuations in the intensity and
duration oflight, heatand cold.FinallytheTswanagoat
canbe classified asa multicoloured, medium size breed
with long lopping ears, short coarse hair structure,
predominantlybearded andhorned.
Introduction
The importance of goats in Botswana cannot be
over-emphasised.Theyprovideprotein food(meatand
milk)andquickcashincomesforruralfarmers.Theyare
in factthe "smallman's cattle".Their adaptive features
such as feeding behaviour, and disease and heat
tolerance enables them to effectively cope with the
stressful nature ofthevast marginal lands ofBotswana.
Alsothe recovery capacityofgoatsfrom droughtisvery
remarkable duetotheir efficientreproductivebehaviour
(twinning coupled with shorter kiddingintervals) and
variable body size with low maintenance requirements
in unfavourable environments (Horst 1984). Although
theindigenousgoatbreeds have been broadlyclassified
into two main groups, the long-eared and short-eared
(MasonandMaule 1960),morebroadmeaningfulbreed
documentation onTswanagoatsbasedontheirphysical
body characteristics is rather lacking. Therefore this
study, which is part of a multidisciplinary research
programme on the Tswana goat,provides data on the
physical body characteristics ofindigenous goats of
Botswana.
Materialsand methods
Location ofstudy
The surveys to record the different goat body
characteristics were carried out in five different
locations, namely Oodi, Artesia and Mochudi in the
Kgatleng District, and Kopong and Thamaga in the
Kwenengdistrict.Thetotal numberofgoatssurveyedin
each locationvaried between 120and 160withfemale
goats comprisingthegreatest number.
Data collection and analysis
In each ofthefive locations,16to20farmerswithgoats
wererandomly selectedandrecordstakenonarandomly
selectedsample of10goatsfrom each farmer.
The differentbodydimensionsthatwere recorded
included heart girth (cm), diagonal body length (cm),
height at withers (cm) and rump height as shown in
Figure 1.
Records were also taken on presence of horns,
wattles and beards; coat colours (1.white,2. black,3.
black andwhite,4. brown, 5. brown and white and 6.
mixed colours), hair structure (1. short coarse,2. long
coarse,3.shortsmoothand4.longsmooth)andeartypes
(l. long lopping and2. reduced ear length). All data
collectedwere analysedbythehelp ofanSAScomputer
statisticalpackage.
ReSultS
Table 1 is the summary ofthe population structure of
sampled goats in different locations ofBotswana. For
each locationthereweremorefemalegoatssampledand
measuredthan male goats.Generally over50% ofthe
female goatswere adults inthe37-48monthsage group.
Formales morethan50%were lessthanthreeyears old
with most beingbetween 1-12months.
Small RuminantResearch NetworkWorkshop 43

Katongole et al
&%
Figure1.Positions of measured body dimensions.
7 Heart girth
Dogonallength
\Sr-------
- -/
Table 1. Structure ofthe goatpopulation sampled and measured in different locations in Botswana.
Locations
Oodi Artesia Mochudi Thamaga Kopong
Variables M F M F M F M F M F
Total no. ofgoats 45 1205 39 131 41 114 57 80 40 78
Proportionbyagegroup(%)
1-12 months 33.3 18.0 51 2 14.5 439 10.5 24.6 16.2 400 12.8
13-24 months 20.1 10.5 308 12.2 31 7 3.5 14.0 7 5 12.8
25-36 months 13.3 4.8 10.3 15.3 73 12.3 15.8 23.8 250 20.5
37-48 months 33.3 667 77 58.0 17.1 737 456 550 27 5 53 9
F=female;M=male.
Body measurements are summarisedinTable2. It
can be noted that there is an age-dependent sexual
difference in bodyweights amongTswanagoats.The
maleswere heavierthan the females after 12 months of
age. Like body weight, other body measurements
increasedwith agein both sexes. However,there were
no differences between sexes belowthreeyears ofage.
Results on the incidence of different coat colours
arepresentedinTable3.Themostcommoncoatcolours
are a combination ofwhite with either black orbrown;
pure colours ofblack and brown, and mixed colours
have the lowestfrequenciesinTswanagoats.Thesex of
thegoathad noinfluence onits coat colour.
The mostfavoured hairs are the short coarse (SC)
ones exceptin Koponglocation where63% ofallgoats
sampledhadlongcoarse hairs (Table3).Goatswithlong
smoothhairs(LS)werethe leastfrequentin alllocations
followed by those with short smooth hairs (SS).
Variation in hair structures shows similar patterns in
both male andfemalegoats.
Information on the incidences of wattles (Wa),
beards (Bd), horns (Ho) and ear length (El) among
Tswanagoats can be found in Table4. Both sexes of
Tswana goats are bearded, horned, and have a very
noticeable property towards long-lopping earedness.
The wattled (Wa) and reduced ear-length (Elr)
conditions exist among Tswana goats but at low
frequency (15%) in both sexes. Generally there are
slightly more male goats affected by the reduced
ear-length conditionthan thefemale.
Discussion
This study sampled more female Tswanagoats (69%)
than males (31%) and most ofthe females were adults
in the37-48-month agegroup.Thisisthe reflection of
44 SmallRuminantResearch NetworkWorkshop

Morphological characterisation of the Tswanagoat
Table2. Body measurements (means t standard deviations) ofTswana goats of different sex and age groups.
Age groups(months)by sex*
0-12 12-24 25-36 37-48
Body measurements M F M F M F M F
Bodyweight (kg) 19 23 1964 25 39 24.14 32 28 2907 41 97 33.76
+3 93 +273 +457 +2.40 +549 +202 +567 +209
Heartgirth (cm) 63.29 63.86 7047 68.31 73 50 72 35 83 60 7803
+5 90 - -6.89 +697 +6,37 +809 +6.63 +5,67 +5,46
Height at withers(cm) 5875 58 93 62.84 62.33 6703 6555 7581 6777
+4.36 +5.49 +4 93 +427 +6,49 +4.11 +6,49 +392
Rump height(cm) 61.39 61 57 66.00 64 91 69 50 68.14 7776 70 15
+4.34 +5.54 +4.19 +4.58 +730 +406 +6.55 +3.85
Body length(cm) 5327 53.26 57 07 56.82 63.25 61 93 7024 63.14
+5 39 +529 +573 +627 +627 +627 +778 +506
*F=female;M=male.
1.Weightswerepredicatedfrom a regression model.
Table3. Incidence of coat colours and hair structures in Tswana goats from different locations in Botswana.
Locations
Characteritics Oodi Artesia Mochudi Thamaga Kopong
Goat coatcolour (%)
White 16,7 14.2 28.4 320 28.0
Black 94 12.3 76
Black andwhite 26.6 306 25.2 29 2 38.1
Brown 8.0 1 1.2 14.2 73 5.1
White and brown 300 27 6 15 5 1 1 7 13.6
Mixed colour 12.0 7 1 4.5 12.4
Hair structure(%)
Shortcoarse 42.0 72 4 600 59.1 170
Longcoarse 287 18.8 36.8 350 62.7
Short smooth 26,7 8.2 3 2 3.8 18.6
Longsmooth 2.6 0.6 00 0.1 1 7
Table4. Incidence (%) ofwattles, beards, horns and ear types in different sexes ofTswana goats from different locations.
Locations
Oodi* Artesia Mochudi Thamaga Kopong
Characteritics M F M F M F M F M F
Wattled 67 11.4 18.0 9 2 9.8 8.8 53 7 5 10.0 12.8
Bearded 57 8 60 690 61.8 58.5 63.2 77 2 700 700 64.1
Horned 756 66.7 91.6 69 2 87 7 84.2 702 61.3 72 5 68.0
Loppingears 88 9 97 1 974 99 2 976 974 98.3 98.8 900 91 0
Reducedears 11.1 2 9 2.6 0.8 2.4 2.6 1 7 1.2 100 9.8
* F=female;M= male.
the structure of goat population generally kept by
subsistence peasant farmers in the rural areas.
Generally, rural farmers are artistic breeders who
naturally and traditionally know that a constant flock
size essentially depends on a large number of
reproductivelyactivefemales thatmustbekeptforlong
periods oftime.
Results obtained in the present study on body
weight(BW)andother conformationaltraits (HW,HG,
RHandBL)are concurrentwiththose obtainedbyother
researchers (Mazumder et al 1983;Ruvuna et al 1988;
Bhattacharya 1989). Male goats generallygrow faster
and are heavier with superior body conformational
measurements than female goats. Age significantly
affects bodytraits.Onthe basis ofbody size and height
atwitherstheTswanagoatcanbe classifiedas amedium
size breed according to one ofthe goat classification
criteriasuggestedbyDevendra andMcleroy(1988).
Small RuminantResearch NetworkWorkshop 45

Katongole et al
Resultsoncoatcoloursandhairstructures revealed
that Tswana are multicolored with a variety of hair
structures.Thisis an indication thatindeedtheTswana
breed ofgoats has notbeen purifiedthrough selective
breeding.The propensitytowardswhite and/orwhite in
combination with other coat colours, especially black
and brown, eminently exhibited by goats used in the
present study appears to be an adaptation to the
pronounced seasonal fluctuations in the intensity and
duration of light, heat and cold experienced in this
region.The same holdstrue forthe observedvariation
in hair structures. Coat colours and hair structures in
goats have an important role toplayin the adaptability
ofanimalsto different ecologicalzones(Banerji 1984).
This argument is supported by the later assertion of
Hemmer(1990)tothe effect that animal domestication
canbeaidedbytheuse ofcertaincoatcoloursorpatterns
which are related behaviour through the common
metabolic pathway of pigments and catecholamine
neurotransmitters.Margetinet al(1988)reported a high
incidence ofshort-hairedness (average 963%)among
goatsbelongingtotwo differentherds.
This study has revealed high frequencies ofthe
bearded (65%) and horned (75%) conditions among
Tswana goats. Goats affected by the reduced ear
condition (ELr) were the least frequent (6%) while
occurrence oflong lopping earswasthe highest(94%).
Therewasarelativelysmallpercentage ofalmostequal
numberofwattledfemale(99%)andmale(10%)goats.
These results are in conformity with those of other
researchers.Margetinetal(1988)reportedlowandhigh
frequencies ofthe dominantwattled allelle (0.193) and
dominant standard ear length (0920) conditions,
respectively. Matassino et al(1984)studiedsamples of
nativegoatpopulationsin southern Italy andfoundthat
67% and65% ofthe goats in this studywere bearded
andhorned, respectively.
Conclusions
On the basis of the information obtained from the
present study it could be concluded that: the Tswana
goat is a multicolored medium size breed with long
lopping ears, short coarse hair structure and pre
dominantly bearded and horned; the apparent wide
variation in coat colours and hair structure among
Tswanagoatsis indicative ofthefactthatthe breed has
not yet been purified through selective breeding and
therefore great opportunities existforitsimprovement;
andthatthepropensitytowardswhite coatcolourand/or
whitein combinationwith othercoloursespeciallyblack
andbrown, appears tobe an adaptive traittowithstand
pronounced seasonal fluctuations in the intensity and
duration oflight,heatand cold.
Acknowledgements
The authors are very grateful to the ILCA Small
RuminantNetwork forthefinancialsupport, Botswana
College ofAgriculture(BCA)forthetransportprovided
duringthe surveys andto allthe collaboratingfarmers
whoofferedtheirgoatstobemeasured duringthisstudy.
References
Banerji R. 1984. Effect of solar radiation on biochemical
constituents ofbloodin goats ofdifferent coat colours.
Livestock-Adviser9(6):34-38.
Bhattacharya A.N. 1989. Characteristics ofArdhi goats in
SaudiArabia.Small Ruminant Research2(3):217-224.
Devendra C. and McLeroy G.B. 1988. Goat and Sheep
Production in the Tropics. ELBS/Longman, London,
UK.
Epstein H. 1971.The Origin ofDomesticAnimals ofAfrica.
Africana Publishing Corporation, New York, USA.
670pp.
Hemmer H. 1990. Domestication: The Decline of
Environmental Appreciation. Cambridge University
Press,Cambridge,UK.208pp.
HorstP. 1984.LivestockBreedingforProductiveAdaptability
to Unfavourable Environments. Paperpresented at the
2ndWorldCongress onSheepandBeefCattle Breeding,
Republic ofSouthAfrica, Pretoria,16-19April 1984
Margetin M., Apolen D. and Gabris G. 1988. A genetic
analysis ofsome conformation traitsin goats.Vedecke
prace-vyskumneho-ustavu-ovciarskeho-v-Trencine
14:39-50
Mason I.L. andMauleJ.P. 1960.The Indigenous Livestock of
EasternandNorthernAfrica.TechnicalCommunication
14. CAB (Commonwealth Agricultural Bureaux),
Farnham Royal,UK.
Matassino D., Lauvergne J.J., RenieriC. and Cosentino C.
1984. Preliminary researchonthevisiblegenetic profile
ofsome nativegoatpopulations reared in three regions
ofSouthern Italy. Produzione-Animale3:71-82
MazumderN.K.andMuzumderA.1983.Breedcharacteristics
of some Indian pashmina goats. Indian Journal of
Animal Sciences 53(7):779-782
Ruvuna F, CartwrightTC., Blackburn H., Okeyo M. and
ChemaS. 1988.Thegestation length,birth weight and
growth rates ofpure-bred indigenous goats and their
crosses in Kenya. Journal ofAgricultural Science
3(2)363-368
46SmallRuminantResearch NetworkWorkshop

Morphological characterisation of the Tswanagoat
Caractérisation morphologique des caprinsTswana
Résumé
Une étude a été effectuée dans deux districts du
Botswana en vue de rassembler des données sur les
caractères morphologiques des caprins Tswana. Cinq
localités ont été choisies, à savoir Oodi, Artesia et
Mochudu dans le district de Kgatleng et Kopong et
Thamaga dans celui de Kweneng.Un total de 16à20
paysanspossédant des chèvres ontétéchoisis au hasard
dans chaque localitéet des données ontété rassemblées
sur 10animauxchoisiségalementauhasarddanschaque
troupeau. Les mesures corporelles relevées sont le
périmètre thoracique, la longueur de la diagonale du
corps, la hauteuraugarrot, lepoidsvifet la hauteur de
la croupe.Ont égalementéténotées, la présence ou non
de cornes,dependeloquesetde barbiches, la couleur de
la robe (blanc, noir, pie noire, brun, pie brune) et la
structure dupoil(ras etdur,longetdur, ras et lisse, long
et lisse). Les résultats ont mis en évidence, entre les
variables corporelles mesurées, des différences liées au
sexe en fonction de l'âge. Les importantes variations
observées dans lacouleuretla structure dupelage deces
animaux montre que cette race n'a pas encore été
purifiéeparsélection etqu'elle offrepar conséquentde
grandes possibilités d'amélioration. La tendance
dominante de la couleur blanche, seule ou en
combinaison avecd'autrescouleurs,notamment le noir
et le brun, semble constituerun caractère d'adaptation
des caprins Tswana aux importantes fluctuations de
l'intensité de la lumière et de la durée d'éclairement et
aux importants écarts de température observés dans la
région.Enfin,onpeutdéfinir lescaprinsTswanacomme
une race multicolore,de formatmoyen,avecde longues
oreilles pendantes, le poils ras et dur et une prédo
minance de barbiches etde cornes.
Small RuminantResearch NetworkWorkshop 47


Reproductiveperformance and level ofgastro-intestinal
parasiteinfestationingoats on-farm and on-station at
Machang'a,Embu,Kenya
A.M.Okeyo, BA.O. Inyangala,SM.Githigia,S.JM.Munyua,
M.M.Wanyoike, C.K. Gachuiri andM. Okomo
University ofNairobi, Faculty ofVeterinaryMedicine
PO.Box29053, Nairobi, Kenya
Abstract
Monitoringofan existing pre-experimental observatory
herd of Small East African goats was carried out at
Machang'a Field Station. For comparison, a rapid
survey on 25 neighbouring farms was conducted.
On-station,faecalsamplesweretakenfrom thegoatsin
January, February andJune 1994to establish eggs per
gram (EPG) counts.The EPG's were low (0-800) in
Januaryand Februarybut shotupto as high as4200in
June. The most prevalent helminth species was
Haemonchus contortus (78%). Reproductive
parametersin goats onfarmswere examined. None of
the farmers controlled breeding, abortions were
common (75%)andudderproblemsfeaturedin42% of
farms.Selection ofbreedingstockwasbased on visual
appraisal. Kidding interval averaged 10 months, and
twinningrateswere low(12%)with ahighsurvival rate
(88%). Preweaning mortalities were very low. Other
aspects ofthe studyincludedfeedandwateravailability,
livestock compositionandherdstructure andreasonsfor
disposal ofstock.The mostprevalent diseasesincluded
pneumonia, mange, helminthiasis, heartwater,
ectoparasitism (fleas andticks) and orf.The scope for
genetic improvement ofgoats in Machang'a is great.
Farmers require education on production and animal
health aspects including ready access to veterinary
services.
Introduction
Indigenousgoatstrains and breeds are usually credited
for their relatively high tolerance of, or resistance to
parasitic diseases andharsh environmental conditions,
includinglongwalking distances,poor qualityherbage
and long watering intervals. However, these desirable
attributes areusually accompaniedbypoorgrowth,and
carcasstraitsare usuallynegativelyaffected(Cartwright
etal 1987;Ruvuna et al 1989).
The mechanisms of inheritance patterns of
resistancetointernalworms(particularly Haemonchus)
are notyet fully understood (Bullerdieck 1989; Bain
1991). Also lacking are heritability estimates for
resistance and its correlation with other growth,
reproductive and dairy traits for indigenous goats in
most parts of sub-Saharan Africa. Research results of
studies conducted locally indicate that considerable
variation existsin growth,prolificacy,fertility, carcass
traits and dairy characteristics aswell astolerance. For
example,Shavulimo(1989)in an artificial Haemonchus
indoor challenge study, showed that the East African
goat breedwas moretolerantthan the Galla. However,
some individualGallagoatswere even moretolerant of
the parasite than their East African contemporaries.
Ruvuna et al (1989) showed that some goat sires
consistentlyimparted resistancetotheir offspring.
The usefulness ofthe above observations can only
be realisedwhen large-scale characterisation is carried
out and genetic parameters generated, showing clear
genetic relationships among all traits of economic
importance (Baker 1991). It is then that meaningful
selection criteria can be set and genetic selection
programmes initiated to realise the set improvement
objectives.
Long-termgeneticstudiesthat incorporate animal
physiology,health and nutrition studies have not often
been carried out due to the absence of an inter
disciplinary approach to research, inconsistencies in
researchfundingallocations oranticipationthereof, and
lack ofappropriate and accurateuptodatetechnologies
particularly laboratory supplies and expertise. These
deficiencies have resultedin research findingsthatgive
incomplete pictures eitherthrough lack ofprecision or
depth.
Inadequate nutrition coupledwith high levels of
parasite infestation contributeto high reproductive and
productive wastage in small ruminant herds regardless
of size and production system (Preston and Allonby
1979; ILCA 1988; ILCA 1989; ILCA 1990). Such
wastage, also slows downgeneticprogress as select on
intensities are substantially reduced.
Haemonchusis one ofthe majorinternalparasites
of economic importance (Allonby 1974; Shavulimo
1989). Haemonchosis reduces productivity through
reduced efficiency of nutrient utilisation and growth
rate, in addition to mortalities which occur at severe
infestation levels. Conventional means of controlling
Small RuminantResearch NetworkWorkshop 49

Okeyoet al
haemonchosis,such asgrazing management anduse of
anthelmintics, are either not feasible or ineffective for
various reasons. These reasons include the use of
communallyownedandgrazedlands, anthelminticsthat
are notonlytooexpensiveforan ordinaryfarmerbutare
also environmentally hazardous, and the continuous
development of resistance to these chemicals by the
parasites atrates difficult fornewproductsdevelopment
to keeppacewith.
New approaches and long-term alternatives to
dealingwiththisproblemincludeidentifyingtolerant or
resistantindividual animalswithinthelocalpopulations
followedby efficientandextensive exploitation ofsuch
heritable meritsin breedingprogrammes.
In order to identify such resistant/tolerant
individuals, well designed genetic and breeding
experiments thatincorporate otherrelatedphysiological
and nutritional aspects need to be conducted. This
project,through a multi-disciplinary approach, aims to
yield the much needed prerequisite results for the
characterisation of the East African and Galla goat
breeds.
The objectives ofthisstudy are to:
• determine and compare variation in infestation
rates ofendoparasitesbetweenandwithinthe East
African andGallagoatbreeds
establish the underlying mechanisms involved in
resistance/tolerance
• establish the incidence, predisposingfactors and
causes ofpre-weaningmortalityingoatflocks (the
research flockand those ofsurroundingvillages)
• develop economically feasible and versatile
production packagesfortheir recommendation to
the regionalstock keepers.
Materials and methods
The main study will revolve around a breeding
experiment design thatis summarisedbelow
Females*
Wet Dry
Breed ofgoat Males season season Totals
EastAfrican 10 160(10) 160(10) 320(20)
Galla 10 160(10) 160(10) 320(20)
Total 20 320(20) 320(20) 640(40)
* The figures in brackets indicate number offemales left open as
controls.
Theproducts ofeach season's matingwillthen be
randomly subjected to various specific nutrition,
artificial and natural helminthiasis challenges, and
growth, carcass and reproductive performance
measurements taken at both gross and tissue levels.
Offspring of sires that show differences in tolerance
levels will be randomly assignedto allsuch treatments
in order to provide correlation estimates among the
differenttraits. Individualanimalsthatareattheextreme
ends oftheresistance scale andtheirprogenywillfurther
provide materials for molecular genetic studies. To
fortify the research data base parallel studies on the
surrounding farmers' flocks are being conducted.The
detailedprotocols are describedbyOkeyo et al(1991).
Location and environment ofthe area
surveyed
The surveywas carried outin Machang'a andMavuria
locationsofGachoka Division,EmbuDistrictin Kenya.
Twenty-five farmers, each with at least a herd of 10
goats,were interviewed.Thestudy area liesin climatic
ecozone4(aridand semi-aridlands)atan altitude of700
m above sea level.The average daily temperature is
28'C, with a mean annual rainfall of650mm,which
follows a bimodal pattern. The long rains are from
Octoberto December andthe short rainsfrom Marchto
May.The longrains are more reliableforcultivation of
food crops.
Endoparasiteinfestation profile
Apre-experimental observatory herdwasintroduced at
the researchstation inMachang'aandtheprevalence of
helminthiasisinthesegoats overthe differentseasons of
the years was monitored. Comparative work on the
farmers' herdswas done through a rapid survey ofthe
surroundingfarmsinthe MavuriaLocation.Sevengoats
died ofheartwaterfromthe Galla breedingherd newly
introduced onthe researchstation.
Faecal egg counts (EPG) were recorded over
various seasons andgenera ofthe helminths identified.
Different tick species were also identified and their
prevalence noted.
Others
Land tenure, feed and water availability, disease
prevalence and control, animal husbandrypracticesand
general livestock production systems were also
addressed.
Results and discussion
The preliminary results ofthe studies carried outsofar
are summarised inTables 1 to4. Eightyper cent ofthe
farmers lived on individually owned land, with the
remaining 20% living on land owned by the local
government(EmbuMunicipalCouncil).Theacreage of
theindividually owned farms rangedfrom4-37 acres,
with an average of11 acresperfarmer.
Grazingsystem,feed andwater availability
The grazing system practised was mainly free range,
while ensuring that the animals did not graze on
cultivated land. The grazing hours in the dry season
rangedfrom8-12hourswithanaverage of10hours. In
50 Small RuminantResearch NetworkWorkshop

Reproductive performance andendoparasitesinKenyan goats
the wet season this ranged from 8-10 hours with an
average of8hours.Thisis sobecause in thewetseason
feed is readily available andthe animals do not needto
walktoofarfor it.Also duringthewetseason, most of
the farmershavetoworkinthe farmsandhence have to
cut downthe hourstheyspend outgrazingthe animals.
About 375% ofthe farmers said they supple
mentedtheir animals' diet.Thisis done mainlyin the
dry season andthe supplementsgiven are acacia twigs
andpods, and maize stover after harvestingthe crop.
Mostofthe animalswerewateredinthe seasonal rivers,
streams,ponds and dams.About75% ofthese farmers
experienced severe problems duringthe dry season as
mostwateringpoints driedupandthe animalshadtobe
walkedlongdistancestothe existingwatersources,such
as River Thiba and dams (e.g. Kiambere dam). Stock
numbers are drastically reduced duringthis period as a
result ofdeathby starvation, exhaustion and disease.
Livestock composition and herd structure
All farmers ownedthe East African goat breed,with a
mean of25 goats per farmer with a range of 10-90
(Table 1).The mean goat herd structure was4 entire
males, 13females and8 kids.
Most ofthe farmers identified their animals by
ear-notching, one notch for the clan and one for the
family. Colour and physical characteristics were also
used in identification. Most ofthe farmers usedvisual
appraisal and mental records to estimate ages and
weights oftheir animals.
Table 1. The livestock species and average numberskept by
the localfarmers.
Livestock species Average numbers kept
Cattle 11
Sheep 7
Goats 25
Rabbits 4-6 Does
Poultry(chicken) 10-30
Bees 3-5 hives
Reproductivewastage and production
performance levels
Allthefarmers reported thattheydid not controlmating
asthe doesgraze togetherwith the bucks. Besides, itis
notuncommon tofind several farmers' flocksgrazing
together.Therearetwobreedingseasonsperyearforthe
goats accordingto80% ofthe farmersinterviewed.The
age ofthe does at first kidding ranged from 10to 24
monthswith an average of12 months(Table2).
Abortions occurred on 75% of the farms with a
range of 3-30% of the herd affected. The causes,
according to the farmers, were poor nutrition during
drought,poisoningbyfeedingonimmature acaciapods,
helminthiasis, injury during fights and poisoning by
certain minerals.
Forty-twopercentofthefarmersreportedthattheir
does experienced udder problems which affected
4-25%ofdoes inaherd.Theproblemsweremainlyteat
injuries, orflesions and occasional abscesses,butthere
was no clear-cut case of mastitis.
Onselection ofbreedingmalesandfemales, most
ofthefarmersbasedtheirdecision ongrowth rate ofthe
animals, generalphysical characteristics such as body
condition and coat colour, in additiontouddersize and
twinning rates in the case offemales. Other factors
consideredwerelineage, strength ofhindlegsandlength
ofears.Theaverage age ofmales attime ofselection for
breedingwas8 months.
The intervalbetween kiddingand the nextservice
rangedfrom2-8monthswith an average of4 months,
whilethekiddingintervalrangedfrom6-12monthsand
averaged 10months(Table2).
The twinning rates ranged from 0-40% and
- averaged 12%,with an average of88% ofthe twins
surviving. This survival depended entirely on feed
availability atthe time ofbirth. Mostfarms experienced
preweaning mortalities, with an average of 125%
parturient deaths and 26% actual preweaning deaths
(Table 2). The causes of the above deaths were,
accordingtothefarmers, diseases(46% ofcases)mostly
helminthiasis and flea infestation, poor nutrition
especiallyduringdrought,poormotheringandpredation
Table2. The structure, performance and health status of goat herds in Machang'a and Mavuria areas, Embu District, Kenya.
AFK" Reproductivewastage(%) Mortality rate ABR* KI*
Category Number (months) Abortions Parturient Preweaning (adults)" (%) (mo)
Adultfemales 13 12(10-24) 3-30 12.5 I1a 8 12(0-40) 10(6-12)
Bucks(entire) 4 I1a I1a - I1dl I1a I1dl
Kids/weaners 8 I1a I1a - 26 I1a I1dl
Total 25 12 3-30 12.5 26 8 12 12
Figures inbrackets indicate the ranges ofvalues observed.
1.AFK=age atfirst kidding.
2.ABR=abortion rate.
3. KI=kiddinginterval in months.
* 46% ofadultand kid mortalitieswere attributed to helminthiasis.
na =data not available.
Small Ruminant Research NetworkWorkshon 51

Okeyo et al
bywildanimals.Afewfarmers didnotknowthe causes
ofthe deaths.
Adult mortalitieswere also experiencedin most of
the farms, with an average oftwo deaths during the
previous year.The major causes ofthese deaths were
diseases such as hepatitis, helminthiasis, mange,
pneumoniaandin rare cases,trypanosomiasis.
Allthe farmers disposed of does by eithersale or
exchange(20%). Fivegoats are equivalentto one cow.
The main reason for sale ofanimals was to generate
income for school fees,buyingfoodin times offamine
andpayinghospitalbills. Otherreasonsforsalewerefor
destocking and culling. Males were mainly culled (in
92% ofthe farms) for income generation and other
reasons such as old age, replacement,infertility, sales
for slaughter, destocking and selection against
undesirable traits.
Diseaseprevalence and control
The mostprevalent diseases affectinggoats according
tothe farmers are listedbelow:
Pneumonia (mavuli): Coughing, anorexia eye
and nasal discharge
Mange(uvele): Scratching, dandruff, alopecia
Helminthiasis (danguru): Emaciation, rough
hair coat, diarrhoea
Heartwater (nduru): Recumbency, circling,
uneasinessfollowedbydeath
• Ectoparasitism:
Fleas(nthua): Scratching, loss ofcondition
Ticks(ngova)
Orf (meng'e): Pox lesions around nose and
mouth
Trypanosomiasis(kamocu): Wasting,then death
Foot rot(mavungu): Lameness
Most ofthe farmersinterviewedsaidthey did not
have easy accesstoveterinaryservices, andafewused
herbal medicine to try and treat the various diseases.
Hence mostillnesseswere fatal.
However,83%ofthesefarmersroutinelydrenched
their animals2-3times ayear while afew only did so
when they sawsigns ofhelminthiasis in their animals
such as diarrhoea, rough hair coat and presence of
worms in faeces. Most ofthe farmers used Wormicid
a few used Nilzan*9, and 4% used herbs, for
drenching their animals. When asked how, in their
opinion,livestockproduction couldbe improvedin the
area, the farmersgave the followinggeneral answers:
1. Improved veterinary services to help in disease
prevention and controlandconstruction ofdips etc.
2. Improved extension services to provide advice on
good husbandry practices and information on
cross-breedingtoupgrade existingstock.
3. Improved nutrition ofthe animals, eg. by supple
mentation duringthe dryseason.
4. Provision of easily accessible watering points, by
diggingboreholes anddams.
Helminthiasis
EastAfrican goats(pre-experimentalcleaningand
observatoryherd)
Faecalsamplesweretakenfrom thesegoatsinJanuary
andFebruary1994andshowed nil orlowhelminth egg
count(range0-800EPG).Thesegoatsremainedhealthy
during March through to April and started showing
unthriftnessinMay(after end ofrains)(Table3). Faecal
sampleswere takenon the firstweekofJune and found
to have high EPG.Over 60% had EPG counts ofover
1000andthe rangewas0-4200. Pooledfaecalsamples
were cultured and larvae identified. Seventy-nine per
cent of the larvae were Haemonchus contortus, 12%
Trichostrongylussppand9%Ostertagia.Sixgoats had
Moniezia expansa segments while most samples had
coccidia oocysts(Table4).
The goats were treated with Levamisole hydro
chloride andthey respondedpositively(i.e. recovered)
Theywerehealthy untilthebeginnningofthe shortrains
in mid-October when they again began to show
unthriftiness.Onegoatshowedsubmandibular oedema
at thisperiodoftheyear.AlthoughtheyhadlowEPG's
(Table3),theywere still treatedasthis couldhavebeen
because mostwormswereimmature andhad notstarted
laying eggs. Hypobiosis was also suspected since the
pastures had not developedandthe rainfallwas nothigh
enoughtosupportdevelopmentofinfective larvalstages
in the pastures.
From the results in Table 3, it is evident that the
EPG's remained low upto the beginning ofthe rains,
afterwhichtherewasanincreaseinthe numberofgoats
with high EPGcounts.Therewas a sudden increase in
EPGwiththe rains, afactorwhichcouldhave been due
tohypobiosis.
The worms identified showed that the species of
majoreconomicimportancewasHaemonchuscontortus
(Table4).Thiswormisknowntoundergohypobiosisin
unfavourableweather. Itis alsothe mostpathogenicand
was responsible forthe suddenunthriftinessobservedin
thesegoatswith the onset ofthe rains.
Galla goats
Thesewereintroducedatthe end ofAugust1994.They
were giventimetoadjust andfaecalsampleswere taken
on 14/10/94.The results are shown onTable3. Pooled
samples were cultured for larvae identification. The
majority were Haemonchus followed by Tricho
strongylus spp and Ostertagiaspp(Table4).
52 SmallRuminantResearchNetworkWorkshop

Reproductive performance and endoparasitesin Kenyangoats
Table3. The level ofhelminthiasis challenge in goats during the year at Machang'a (on-station)
EPGsMonth Numbersampled Proportion of herd(%) Remarks
January 34 0-100 81.0 670%(NIL)
7 200_400 16,7
1 >400 3.3 242%(>800)
February 23 0-100 54.8 40.5%(NIL)
15 200-400 35.8
4 >400 95 5%(>800)
June 7 0-100 14.9 2.1%(NIL)
10 200-400 21.3
17 500 -1000 255
18 >1000 38.3 21%(1800)
October* 61 0-100 80.2 56%(NIL)
16 200-400 18.2
1 >400 1.2 2.3% (>900)
1. EPG=eggspergramme offaecalsample.
2. OnlyGallagoats sampled 1.5 months afterintroduction tothe station.
Table 4.Prevalence (%) ofgastro-intestinal parasites by
species.
Helminth (worm)species Prevalence (%)
Haemonchus contortus 79
Trichostrongylus sp 12
Ostertagia sp Q)
Total 100
1. Thepercentages are based on actual larval countsfollowing
laboratory cultures.
Conclusions
Fromthe above observationsthe followingconclusions
canbe drawn:
Goatsformamajorproportion ofthestockowners'
total livestock herds.
• Thereis noorganisedgeneticselectionprogramme
in place atstock owners' level.
Reproductive wastage due to various factors
(abortions,parturient andpreweaning mortalities,
late age at first kidding, long kiddingintervals)is
high amongthe farmers' herds.
Helminthiasis coupled with other opportunistic
diseases such as pneumonia were the most
common cause ofmortalities amongthe herds.
Haemonchus contortus was the major intestinal
parasite responsible for the observed helmin
thiasis.
Poor nutrition and ectoparasite (ticks and fleas)
infestation in addition to others,were responsible
forthe observed lowproductivityingoat herds at
farm level.
The level ofworm infestation and effect on the
animals' health varied greatly depending on the
prevailingweatherconditions.
Individual animals carried different levels of
worms and coped with the burden differently
regardless ofseason ofthe year.
Acknowledgement
The research work was funded by the African Small
Ruminant ResearchNetwork(SRNET)ofILCAandthe
authors aregratefulforthe continued support.
References
Allonby EW. 1974. Ovine haemonchosis: Epidemiology,
clinical signs and diagnosis. In: Urquahrt G.M. and
ArmourJ.(eds), Helminth Disease ofCattle,Sheep and
Horses in Europe. Robert Maclehose and Company,
London,UK.
BainR. 1991.Areviewofresearch carried out atthe National
Veterinary Research Centre, Muguga, Kenya, on the
genetic resistance of sheep to infection with
gastro-intestinal nematodes.
Baker R.L. 1991. Breeding for disease resistance - some
historical perspectives, problems and prospects.
Proceedings of New Zealand Society ofAnimal
Production 51:1-13.
Bullerdieck P. 1989. Effect of anthelmintic treatment and
supplement feeding on weight gain and packed cell
volume of lambs in the coastal belt of Kenya. In:
Proceedings of the Seventh SR-CRSP Scientific
Workshop, Nairobi, Kenya, 22-23 February 1989
SR-CRSP (Small Ruminant Collaborative Research
SupportProgram)/APSK(AnimalProductionSocietyof
Kenya), Nairobi,Kenya.pp. 141-147.
CartwrightTC,LentzE.L., BlackburnHD.,TallamS.K. and
Ruvuna R.F. 1987. The potential productivity of
intensive smallholder goat dairies in Western Kenya.
Proceedings ofthe SixthSR-CRSPScientificWorkshop,
Nairobi, Kenya. SR-CRSP (Small Ruminant Colla
Small RuminantResearch NetworkWorkshop53

Okeyo et al
borative Research Support Program)/APSK (Animal
ProductionSociety ofKenya),Nairobi, Kenya.
ILCA(InternationalLivestockCentre forAfrica). 1988. ILCA
Annual Report 1987 ILCA, Addis Ababa, Ethiopia.
105pp.
ILCA(InternationalLivestockCentreforAfrica).1989.ILCA
Annual Report 1988. ILCA, Addis Ababa, Ethiopia.
156pp.
ILCA(InternationalLivestockCentreforAfrica). 1990.ILCA
Annual Report 1989. ILCA, Addis Ababa, Ethiopia.
144pp.
SM., MunyuaSJM.,GachuiriC.K. and OkomoM.
1991. Genetic Studies ofGalla andSmall EastAfrican
Goats and TheirCorrelated Growth and Reproduction
Performance under Different Nutritional and
Endoparasite Challenges. SRNET/EAST/MULTI/1
Project Proposal, 1992
PrestonJM. andAllonbyEW. 1979.The influence ofbreed
on susceptibility of sheep to H. contortus infection in
Kenya. Research in VeterinaryScience26:134-139.
Ruvuna F., Ahuya C., Okeyo M. Cartwright TC. 1989.
Growth parameters of indigenous goat breeds and
crosses with Toggenburg and Anglo Nubian. In:
Proceedings of the Seventh SR-CRSP Scientific
Workshop, Nairobi, Kenya, 22-23 February 1989
SR-CRSP (Small Ruminant Collaborative Research
SupportProgram)/APSK(AnimalProductionSociety of
Kenya), Nairobi,Kenya.pp. 11-17.
Shavulimo R.S. 1989. Endoparasites as a constraint to goat
improvement in Kenya. In: Wilson R.T. and Azeb
Melaku (eds), African Small Ruminant Research and
Development. Proceedings of a Conference held at
Bamenda, Cameroon, 18-25 January 1989. ILCA
(International Livestock Centre for Africa), Addis
Ababa, Ethiopia.pp.382-392
Performancesde reproduction etparasitismegastro-intestinal
chez les chèvres en exploitation et enstationà Machang'a,
dans le district d'Embu(Kenya)
Résumé
Un troupeau pré-expérimental de petites chèvres
d'Afrique de l'Est a étésuivià la station de recherche
de Machang'a. Pour les besoins de la comparaison,une
enquête rapide a été effectuée sur25 exploitations du
voisinage. En station,des échantillons de fèces ont été
prélevés en janvier, février et juin 1994 en vue de
déterminerlenombred'oeufspargramme(EPG). Faible
(0-800) pour les deux premiers mois, celui-ci
augmentait, allant mêmejusqu'à atteindre le chiffre de
4200 en juin. L'espèce d'helminthe la plus répandue
était Haemonchuscontortus(78%). Il ressort de l'étude
desperformancesde reproduction en milieu réelque les
éleveurs contrôlaient la monte, que les avortements
étaient fréquents (75%) et que des cas de mammites
étaient enregistrés dans 42% des exploitations. La
sélection des reproducteurs était basée sur une
évaluationvisuelle.L'intervalle entre mises bas était de
10mois, lestauxde naissancegéméllaire étaient faibles
(12%) alors que ceux de survie étaient élevés (88%) et
que les chiffres de mortalité avant sevrage étaient très
faibles. Les autresparamètres examinés par cette étude
étaient la disponibilité des aliments et de l'eau, la
composition et la structure destroupeaux et les raisons
de la cession des animaux. Les maladies les plus
fréquentes étaient la pneumonie, la gale, les helmin
thoses, la cowdriose, les ectoparasites(puces ettiques)
et l'echtymacontagieux.Lespossibilités d'amélioration
génétique de ces chèvres sont élevées. Les besoins
identifiés despaysans sont laformation auxtechniques
de production et de santé animales et l'accès aux
services vétérinaires.
54 SmallRuminantResearch NetworkWorkshop

Caractérisationgénétique des caprins du Nord-Cameroun
A.C. Ngo Tama",D. Bourzat*, PS Zafindrajaona" etJ.J. Lauvergne*
Station de recherches zootechniques etvétérinaires
BP1073Garoua(Cameroun)
*CIRAD-EMVT Laboratoire de Farcha;BP433N'djaména (Tchad)
*Laboratoire de génétiquefactorielle;INRA,Jouy-en-Josas(France)
Résumé
Une caractérisation génétique des caprins basée
sur l'utilisation des profils génétiques visibles a été
menéesurun échantillon de 1081 animauxdans28sites
au Nord-Cameroun. Tous les patrons pigmentaires
identifiés dans l'espèce caprine ontétérencontrés dans
la zone, avec prédominance de trois types: phaeo
mélanique, sauvage et eumélanique; les phénotypes
tache oculaire et eumélanique et feu étaient les plus
faiblement représentés. Le type d'eumélanine est
surtout noir ou illisible.Un cinquième de la population
portelabarbiche,etles pampilles sontrares.Lalongueur
des cornes est très variable et le type de cornage ne
correspondà aucun de ceux déjà décrits. Les oreilles
sont dressées horizontalement sans bouclure avec une
faiblereprésentation desportspédonculéettombant. Le
pelage estgénéralementras. Lesvaleurs des indices de
primarité étaient de 0,77 et 1,0 respectivement pour
l'indice deprimarité locienségrégation(IPs)et l'indice
deprimaritéaulocus agouti(IPa).Celaconfirme que les
caprins du Nord-Cameroun sont de type primaire.
L'analyse de la variance de la hauteur au garrot et des
indices de gracilité et auriculaire n'a montré aucune
différence significative entre les sites. De même,
l'observation des histogrammes a révélé l'existence
d'uneseulepopulation dans la région considérée. Cette
population est depetite taille avec lesvaleurs moyennes
suivantes: HG=48,6cm,IGS=0,87 et IAT=0.49. La
grandevariationde la taillepermetdepenserquecelle-ci
pourrait être augmentéeàtravers la sélection d'animaux
adaptésà leur milieu.
Introduction
Le cheptel caprin des deuxprovinces septentrio
nales duCameroun se chiffreà environ 1 500000têtes,
ce quireprésenteprès de55% ducheptelnational.C'est
la partie du pays qui compte le plus grand nombre de
caprins.Ceux-ci sont exploités de manière extensive et
la taille des troupeauxest trèsvariable. Lespopulations
caprines de cette région n'ont pas encore été
génétiquement caractérisées. Depuis quelques années,
des effortssont déployéspour la connaissance de leurs
performances zootechniques. Dans le cadre du Projet
régional de recherche sur les petits ruminants, un
inventaire des ressourcesgénétiques a été entrepris,un
sondage rapide,portantsurun effectifréduit, réaliséen
1992parLauvergne et al(1992)apermis d'établir que
lapopulation caprine concernée estdetype traditionnel
ou primaire. Le but de la présente étude est d'ap
profondir l'analyse génétique des populations de ces
deuxprovinces, analyse basée sur le calcul de certains
indices en rapport avec la variabilité extérieure. Les
objectifs spécifiques sont la description phénotypique
despopulations,l'estimationdesindicesdeprimaritéde
manière à isoler despoches de standardisation, si elles
existent, la mesure des hauteurs augarrotetdesindices
biométriques sur les sites, et éventuellement une
représentation cartographique de tous ces paramètres
prisindividuellement.
Matériel et méthodes
Echantillonnage
Cette étude devaitêtre menée dans chaque Centre
zootechnique etvétérinaire(CZV). Lestroupeauxet les
animaux ontétéchoisis en collaboration avec les chefs
de cescentreschargés de contacterleséleveurs depetits
ruminants dans lesvillages relevant de leur ressort. Les
troupeaux ayant au moins une dizaine de têtes étaient
retenus enpriorité. Le sondage sefaisait chezl'éleveur;
lataille de l'échantillonparsite variait enfonction de la
saison car en saison sèche,il est difficile de rassembler
leschèvres laisséesendivagation.Enrevancheensaison
pluvieuse elles sont attachéesaupiquet.D'une manière
générale, le sondage a porté sur des femelles âgées
d'environ 2 ans (au moins deux dents adultes).
L'utilisation des femelles de préférence aux mâles se
justifie par le fait qu'elles passentun tempsplus long
dans lestroupeaux alors que les mâles sont exploitésà
unâge relativementjeune.Cependant, les mâles ontété
examinéspourcertainsparamètrestels que laforme des
COITIneS.
Protocole de recueil des données
Le profilage génétique a été réalisé à partir des
normes établies par Lauvergne et révisées en 1992
Celles-cipréconisentdiverseséchelles, notamment pour
le cornage (Clutton-Brock, 1981), le patron coloré, la
SmallRuminantResearch NetworkWorkshop 55

NgoTama et al
dentition, lespanachures, lalongueurdupelage etleport
de l'oreille. Par ailleurs, un certain nombre de
phénotypes sontrépérés en termes deprésence/absence
tandisque d'autres sontmesurés.
Lesdonnées sont recueilliesà l'aided'unefiche de
sondage quipermetde rassembler desinformations sur
le site, concernant le propriétaire et les différents
paramètres; au total 12paramètres sont observés et 10
mesurés. Les mesures ont été effectuéesà l'aide d'une
canne-toise etd'unmètreruban. Lesondageaété réalisé
dans28localitésdesdeuxprovincesduNord-Cameroun
etsurun effectifde 1081 animaux.
Définition desindicesdeprimaritéet
desindices biométriques
Pour exprimer le premier stade d'évolution des
populations après la domestication,Lauvergne(1992)a
proposé l'utilisation de deuxindices
- l'indice de primarité "loci à effet visible en
ségrégation": IPs. Il a étédéfinicomme le rapport
du nombre de locià effetvisible en ségrégation
dans l'échantillon(ns)etdu nombretotalde locià
effet visibleNsidentifiés dans l'espèce, il varie de
0à 1.
- l'indice de primarité allèles au locus agouti: IPa.
Soit Na le nombre total d'allèles en agouti
considérés dans une population et na le nombre
d'allèles identifiés dans cette même population,
l'indice de primarité allèles au locus agouti se
définitcommesuit:
IPa=(na-1)/(Na-1)
- l'indice de gracilité sous-sternal(IGS): rapport du
vide sous-sternalsur laprofondeurduthorax.
- l'indice auriculaire thorax (IAT): longueur de
l'oreille sur la profondeur duthorax. Le choixde
la profondeur du thorax au dénominateur des
indices biométriques est justifié par sa faible
variation d'une population à l'autre et par le fait
qu'il permet de s'affranchir des variations de la
longueur desjambes.
Méthoded'analyse
Une analyse de la variance a été effectuée sur
chacun des trois paramètres. Les données du sondage
ontététraitéessurlogicielSPSS.
Résultats et discussion
Les résultats du sondage sont présentés aux
tableaux 1 à5etauxfigures 1 à3.
Profilsphénotypiques
Letableau 1 présente la répartition aulocusagouti.
Tableau 1:Fréquence des patronspigmentaires
Patrons pigmentaires N Fréquence
Eumélanique 1 16,8
Taches oculaires 1 0,1
Eumélanique et feu 3 0.3
Eumélanique etfeuventre clair 36 3.3
Manteléantérieur 14 1.3
Mantelépostérieur 15 1,4
Chamoisé 68 6,3
Sauvage 260 24,1
Phaeomélanique 336 31,1
Illisible 166 15,4
Tous les patrons pigmentaires identifiés dans
l'espèce caprine ont été rencontrés dans la zone,trois
sont cependant prédominants et représentent plus de
70% des caprins. Ce sont, par ordre d'importance le
phaeomélanique, le sauvage et l'eumélanique, les
phénotypes tache oculaire et eumélanique et feu étant
extrêmement rares. Mais la distribution de cespatrons
varie d'une localitéà l'autre. Dans quelquestroupeaux,
tous les animaux avaient la même couleur pour les
phénotypes phaéomélanique ettoutblancchezcertains
éleveurs surtout transhumants (Mbororo). Cette
répartition estdifférente decelle obtenue lorsdupremier
sondage dans lequel certainsphénotypes étaientabsents
(Lauvergne et al, 1992). Elle montre également que
plus l'échantillon est grand, plus la probabilité de
trouvertous lesphénotypes estélevée.Cette répartition
estprochede celle deGrupetta etal(1988)qui,àMalte,
ont obtenu un pourcentage plus élevé de
phaéomélaniques suivis des eumélaniques. D'autres
auteurs (Dunner et Canon, 1988; Sadorge et
Benadjaoud, 1988) ont rapporté une prédominance
patronsphaéomélanique et eumélanique.
Le tableau 2 présente la distribution des autres
phénotypes visibles. Letyped'eumélanine est soit noir,
soit illisible, le brun étant difficile à déterminer. Un
résultat analogue avait déjà été obtenu lors dupremier
sondage.L'altérationpigmentairefoster, caractérisépar
la présence de noisillures autourdu museau età la base
des oreilles, estprésente dans23% des cas.L'altération
pigmentaire dite roan est présente dansplus de40% de
l'échantillon,5% sonttoutblancs. Plus de 50% ontune
tache blanche sur le patron. On dit qu'ils ont une
panachure ouune ceinture.
Le port dressé horizontal est dominant, le port
dressé vertical étant absent, les oreilles sont rarement
bouclées(1,7% de caractère rencontréchez desanimaux
au port tombant ou pédonculé). Le variant oreille
raccourcie (Audiot et al.,1982) n'a pas encore été
observé.
La corne estgénéralement de type illisible, sauf
dans 11,7% de lapopulation où il s'apparenteà l'ibex
espagnol (Clutton-Brock, 1981). Aucun animal motte
n'a été rencontré dans l'échantillon considéré mais il
existe un certain nombre d'animaux auxcornes courtes
56 SmallRuminantResearch NetworkWorkshop

Caractérisationgénétique des caprins
qui n'ontpas été mesurées car il était difficile de savoir
si celles-ci avaient étécoupées ou non.Unetrèsfaible
proportion de la population (2%)porte des pampilles.
Cesobservations sont différentes de celles faites dans le
bassin méditerranéen et au Brésil où se rencontre une
plusforte représentation des animauxavec barbiche et
pampille (Martrès et Benadjaoud,1988; Franceschi et
Santucci, 1988; Branca et Casu, 1988; Renieri et
al.,1988; Grupetta et al., 1988). Un cinquième de la
population porte une barbiche. Les mêmes auteurs ont
obtenu despourcentagesplus élevéspourlabarbiche.
Tableau2: Profil visible de la chèvre du Nord-Cameroun
Caractère Phénotype Fréquence(%)
Oreilles dressé 92.9
port pécondulé 6,2
tombant 09
bouclure présence 07
absence 98,3
Cornes ibex 11.7
Type autreS 88,3
présence 100
absence 0
Pampilles présence 20
absence 980
Barbiche présence 21,4
absence 78,6
Poil ITaS 974
mi-long 2,6
long 0
Foster présence 235
absence 76,5
Eumélanine noir 59,4
brun 1,9
illisible 387
Altération normal 523
TOaIl 42,1
blanc 5.6
Panachure présence 39.2
absence 43,8
illisible 17.2
Ces résultats sontplusproches de ceuxdeZeuh et
Bourzat(1993) auTchad. Lepelage est ras etrarement
mi-long; aucun animalaupelage longn'a étérencontré;
on peut parler d'un début de standardisation de ces
paramètres. Ces observations sont totalement
différentes de celles de Djorbineva et al(1988)quiont
observé une standardisation basée sur la longueur du
poil.
Indices deprimarité
Les tableaux 3 et 4 résument les différents
phénotypes en ségrégationpar site utilisés dans le calcul
desindices de primarité.
On observe une certaine variabilité d'un site à
l'autre surtoutpour l'indice deprimaritéau locus agouti
mais en considéranttoute la zone d'étude l'IPa= 1, ce
quitraduit unegrandevariabilitéet montre quetous les
variants qui ont ségrégé depuis la domestication de
l'espèce caprine sont présents dans la population du
Nord-Cameroun.Onpeutconclureque lapopulation est
de typeprimaire. Pourl'indice de primarité des loci en
ségrégation, l'absence de certains mutants tels que
l'absence de cornes et oreilles réduites entraîne une
valeurplusfaiblequecelle de l'IPA; elle estde0,77pour
toute la population et varie d'un site à l'autre. D'une
manièregénérale,auxeffectifs réduitscorrespondent de
faiblesvaleurs d'indices deprimarité. Lesvaleurs de ces
indicessontcomparablesàceuxobtenus lors dupremier
sondage au Cameroun et au Tchad (Lauvergne et al.,
1993) aussi bien dans le bassin méditerranéen qu'au
Brésil.
Donnéesbiométriques
Le tableau 5présente les moyennes des données
biométriques de l'échantillon. L'analyse de lavariance
de la hauteuraugarrot,de lalongueur des oreilles et des
deuxindicesbiométriques n'a révélé aucune différence
significative entre les sites. La représentationgraphique
desvaleurs de cesparamètresprisindividuellementpar
deshistogrammes(figures 1,2 et3)arévélé l'existence
d'une population normale degrande variabilité, ce qui
confirme les résultats de l'analyse de laprimarité. Cette
grande variabilité, qui se traduit par des indices de
primarité élevés, offre de grandes possibilités
d'amélioration génétique de ces espèces, notammentà
travers la sélection et la création de diverses races en
fonction d'objectifs bien définis tant du point de vue
phénotypique queproductif.
Ces résultats montrent que la chèvre du Nord
Cameroun est une chèvre de petite taille (hauteur au
garrot2cm), ce qui esten accord avec les observations
antérieures effectuées sur les chèvres de la zone
soudanienne. La variabilité observée sur la hauteur au
garrot(35à67cm)permetdepenserque la taille de ces
chèvres pourrait être augmentée grâce à la sélection
d'animauxadaptésà leur milieu.
Conclusion
Les caprins du Nord-Cameroun sont une
population de typeprimaire au sein de laquelle ily aeu
peu de sélection.Ce sont des animaux de petite taille
avecune hauteuraugarrotd'environ50cmen moyenne,
de faible gracilité,dont la longueur et le type de corne
varient beaucoup, généralement sans pampilles, assez
souvent barbus, avec des oreilles au port dressé
horizontal. La couleur de la robe est variée et très
souventfauve avec ou sans raie dorsale, ou noire. Les
robes pies sont fréquentes et on note une apparition
d'animaux tout blancs. Le pelage est souvent ras et
quelquefois mi-long. Ces résultats confirment les
Small RuminantResearch NetworkWorkshop 57

NgoTama etal
Tableau3:Indice de primarité "allèles au locusAgouti"(Ipa)par site dans les populations caprines du Nord-Cameroun.
No des sites
PATRONS 1 2 3 4 5 6 7 8 9 10 11 12 13 14
42 21 13 19 98 9 21 65 40 34 82 24 10 25
Eumela 1 1 1 1 1 1 1 1 1 1 1 1 0 1
Tac oc 0 0 0 0 0 0 1 0 0 0 0 0 0 0
Efeu 0 0 0 0 0 0 0 0 0 0 0 0 0 0
Efvc 0 1 0 0 1 0 0 0 0 0 0 0 0 0
Man 0 0 1 1 1 0 1 0 1 1 1 0 0 0
Mpo 0 0 0 0 0 0 0 1 1 0 1 0 0 0
Cham 1 1 0 0 1 0 1 1 1 0 1 1 0 1
Sauv 1 1 1 1 1 1 1 1 1 1 1 1 1 1
Phéo 1 1 1 1 1 1 1 1 1 1 1 1 1 1
ILL 1 1 1 1 0 0 1 1 1 1 1 1 1 1
I1dl 5 6 5 4 7 4 6 6 5 4 6 4 2 4
Na 9 9 9 9 9 9 9 9 9 9 9 9 9 9
IPA
PATRONS 15 16 p7 18 19 20 21 22 23 24 25 26 27 28 |POP
54 46 31 | 104 28 11 32 24 22 53 11 56 51 55 |1081
Eumela 1 1 1 1 1 1 1 1 1 1 1 1 1 1 1
Tac oc 0 0 0 0 0 0 0 0 0 0 0 0 0 0 1
Efeu 0 1 0 1 0 0 0 0 0 0 0 0 0 0 1
Efeu 1 0 0 1 0 0 0 1 1 1 0 0 1 1 1
Man 0 1 0 1 0 1 0 1 1 1 0 0 1 1 1
Mpo 1 0 0 0 1 0 0 1 0 1 0 1 1 1 1
Cham 1 1 1 1 1 0 0 1 1 0 0 1 1 1 1
Sauv 1 1 1 1 1 0 1 1 1 0 1 1 1 1 1
Phéo 1 1 1 1 1 1 1 1 0 1 0 1 1 1 1
ILL 1 1 1 1 1 1 1 1 1 1 1 1 1 1 1
I1a 7 6 4 7 6 3 3 7 5 5 2 6 7 7 9
Na 9 9 9 9 9 9 9 9 9 9 9 9 9 9 9
IPA 1
Eumela = Eumélanine
Tacoc = Tache oculaire
Efvc = Eumélanique etfeu
Man = Mantelé antérieur
Mpo = Mantelépostérieur
Cham = Chamoisé
Sauv = Sauvage
Phéo = Phaeomélanique
ill = illisible
I1a = Nombre d'allèlesprésents
Na = Nombre d'allèles existants
Ipa = Indice deprimaritélocus agouti
58 Small RuminantResearch NetworkWorkshop

Caractérisation génétique des caprins
Tableau 4: Indice de primarité “loci a ejfet visible en se'grégation” par site dans les populations caprines du Nord—Cameroun
No. des Sites et effectifs
Level 1 2 3 4 5 6 7 8 9 10 l 1 12 13 14
Nums 42 21 13 19 98 9 21 65 40 34 82 24 10 25
Agouti 1 l l 1 1 1 1 l l l l l l l
Eumcla 1 1 1 1 l 1 l l l l 1 l l 1
Roan 1 1 l 1 1 1 1 l 1 l l l 0 1
Prosting 1 1 1 1 1 1 1 l 1 1 1 l 1 1
Board 1 1 1 1 1 1 l l l l 1 1 1 1
Ear length 0 0 0 0 0 0 0 0 0 0 0 0 0 0
Ear car 1 I 0 l 1 0 l 0 l l 1 l 0 0
Ear our 1 0 0 0 1 0 l 0 0 1 l l 0 0
Polled 0 0 0 0 0 O 0 0 0 O 0 0 0 0
Horms Rd 0 0 0 0 0 0 0 0 1 0 0 0 0 0
Hair L l l 0 0 l 0 0 0 1 0 1 0 0 l
Wattles 0 0 0 l l 0 l l 0 l l 0 0 0
Sporting l l 1 1 l l l 1 1 1 1 1 1 1
na 9 8 6 8 10 6 9 7 9 9 10 8 5 7
NS 13 13 13 13 13 13 13 13 13 13 13 13 13 13
Ipa 0,69 0,61 0,46 0,61 0,77 0,46 0,69 0,53 0,69 0,69 0,77 0,61 0,38 0,53
Level 15 16 17 18 19 20 21 22 23 24 25 26 27 28 POP
Nums 54 46 31 104 28 ll 32 24 22 53 11 56 51 55 1081
Agouti 1 l 1 l 1 1 1 1 l l 1 l l 1 l
Eumela 1 1 1 I 1 l 1 1 1 l l 1 1 l 1
Roan 1 1 l 1 l 1 l l l l l l 1 l l
Prosting l 1 l l 1 1 1 1 1 1 1 l 1 l 1
Board 1 1 1 l l 1 1 1 1 l 1 1 l l 1
Ear length 0 0 0 0 0 0 0 0 0 O 0 0 0 0 0
Ear car 0 1 1 1 0 1 1 0 1 0 0 1 0 0 1
Ear our 0 0 0 0 0 0 0 0 0 O 0 O 0 O 0
Polled 0 0 0 0 0 0 0 0 0 O 0 0 0 0 0
Horms Rd 1 0 0 0 1 0 1 1 0 O l 0 0 1 1
Hair L O l 0 0 1 0 0 0 1 1 l 0 0 O 1
Wattles 1 l 1 1 1 I l 1 l l 1 l l l 1
Sporting 1 1 l l 1 1 l 1 1 1 1 l l l 1
na 7 9 7 9 6 7 9 7 8 7 8 8 6 7 10
NS 13 13 13 l3 l3 l3 l3 13 13 13 13 13 13 13 13
lpa 0,53 0,69 0,53 0,69 0,46 0,53 0,69 0,53 0,61 0,53 0,61 0,61 0,48 0.53 0,53
Eumela Eumélanine
Ear car Ear camage
Ear cur Ear curling
Horns RD Horns reduction
Hair L Hair length
ns Nombre de loci presents
NS Nombre de loci en segregation
IPS Indice de primarité loci en ségrégation
Phéo Phaeomélanique
ill illisible
na Nombre d‘alleles presents
Na Nombre d’alleles existants
lpa Indice de primarité locus agouti
Small Ruminant Research Network Workshop 59

NgoTama etal
observations d'autres auteurs,notamment le fait que les
caprins de la région soudanienne sont de petite taille.
L'absence de quelques caractères tels que lepoil long,
l'absence de cornes et les oreilles réduites peuvent
s'expliquerparla taillede l'échantillon. Il est nécessaire
d'accroître les effectifspouraugmenterla possibilitéde
représentation des allèles de faible fréquence. Le degré
de primaritéélevétraduit degrandespotentialitéspour
la créationdediverses races.Cetteétudesepoursuitdans
la province de l'extrême-nord située en zone sahélo
soudanienne.
Fréquences
Tableau5:Quelquesparamètres biométriques
Paramètres Moyenne ET
Hauteur augarrot 48,62 4,70
Profondeurduthorax 26,30 297
Longueurde l'oreille 12,66
IGS 0,87 0,21
IAT 0,49 00
16O
12O
Ioo |
so| .
eo| .
4ol
2O
O |O 2O 3O 4O 5O
houteur qu gorrot (cm)
Figure 1. Histogramme de la hauteur augarrot des chèvres duNord-Cameroun.
Références bibliographiques
AudiotA,RenieriCet LauvergneJJ. 1982. Levariant oreille
raccourcie de la chèvre provençale. Rev. Méd. Vét.
Alfort, 161,683-684.
Brance A et Casu S. 1988. Profils génétiquesvisibles de la
chèvre sarde. In: J.J. Lauvergne (ed). Populations
traditionnelles et premières races standardisées
d'ovicaprinae dans lebassin méditerranéen, Coll. INRA
N°47,1986 135-143.
Clutton-Brock J. 1981. Domesticated animals from early
times. Cité par J.D. Vigne: Les grandes étapes de la
domestication de la chèvre: une proposition
d'explication de son statut en Europe occidentale.
Ethnozootechnie N*41,19881-3
DjorbinevqMK,AlexievqSA, HinkovskiTet LauvergneJ
J. 1988. Profils génétiques visibles de la chèvre du
Sakharen Bulgarie. In:J.J. Lauvergne(ed). Populations
traditionnelles et premières races standardisées
d'ovicaprinae dans le bassinméditerranéen.Coll. INRA
N"47,97-104
DunnerS et CanonJ. 1988. Profils génétiques visibles de la
chèvre du nord de l'Espagne. In: J.J. Lauvergne:
Populations traditionnelles et premières races stan
60 Small RuminantResearch NetworkWorkshop

Caractérisationgénétique des caprins
Fréquences
8O
eol
4O|
2ol
%/ /
O O,5 | l,5 2
lndice de gracilite sous-sternal ( IGS)
Figure2. Histogramme de l'indice de gracilité sous-sternal (IGS) des chèvres du Nord-Cameroun.
Fréquences
leo .
1oo .
eo .
2ol /
o* O,l O2 O3 O4 O5 O6 O,7
Indice quriculoire thorox (lAT)
Figure3. Histogramme des indices auriculaires thoraxdes chèvres du Nord-Cameroun.
SmallRuminantResearch NetworkWorkshop 61

NgoTama etal
dardisées d'ovicaprinae dans le bassin méditerranéen,
Coll. INRAN"47,159-167.
FranceschiP. etSantucciP. 1988. Profilsgénétiquesvisibles
de la chèvre corse. In J.J. Lauvergne: Populations
traditionnelles et premières races standardisées
d'ovicaprinae dans lebassin méditerranéen,Coll. INRA
N°47,1986, 145-151.
Grupettea, RenieriR, SilverstrelliMetValfreF. 1988.Profils
génétiques visiblesde lachèvreàMalteIn:JJLauvergne
(ed) Populations traditionnelles et premières races
standardisées d'ovicaprinae dans le bassin
méditerranéen,Coll. INRAN*47, 1986113-121.
Lauvergne J J. 1992. Breed development and breed
differenciation. Proc. CEC workshop and training
course. Hannover 199253-64
LauvergneJJ, ZafindrajaonaSouvenirP, BourzatD,ZeuhV.
et NgoTamaAC. 1992.Comparaison de populations
caprines au Nord-Cameroun etauTchad(rapport).
Martres et BenadjaoudA.1988. Profils génétiques visibles de
la chèvre de Haute-Roya. In: J.J. Lauvergne (ed).
Populations traditionnelles et premières races
standardisées d' ovicaprinae dans le bassin
méditerranéen,Coll. INRAN'47,1986,153-158
RenieriC, Rubino R, LaTessa D, Muscillo F, SarricaG et
ZariellaG. 1988. Profilsgénétiquesvisibles de lachèvre
du sud de l'Italie. In: JJ. Lauvergne (ed) Populations
traditionnelles et premières races standardisées
d'ovicaprinae dans le bassin méditerranéen,Coll. INRA
N'47,123-134
SadorgeAet BenadjaoudA. 1988. Profilsgénétiquesvisibles
de la chèvre du Rove. In: J.J. Lauvergne (ed).
Populations traditionnelles et premières races
standardisées dans le bassin méditerranéen,Coll. INRA
N"47, 169-174
ZeuhV et Bourzat D. 1993. Caractérisation génétique des
populations caprines au Tchad, résultats préliminaires
des caractères phénotypiques et biométriques. In
BourzatC. 1993Actes du comitéscientifique,51-72
Genetic characterisation ofnorthernCameroongoats
Abstract
Genetic characterisation of goats based on visible
geneticprofileswas carried out on 1081 animals at28
sites in northern Cameroon. All colour patterns
identifiedingoatspecieswerefoundintheareaalthough
three ofthem, namelygolden,wildandbrownwerethe
mostcommon. Phenotypessuch as eye spots andbrown
and redwere rare.The brown typewas either black or
mixed.Agoateewasfoundinone-fifthofthepopulation
andwattleswererare.Hornlengthwasvariable andhorn
typewas differentfromthe types describedsofar. Ears
were ofa horizontalupright typewithout buckle,while
pedunculated and droopingtypes were rare. Hairwas
generallyshort. Primarityindexeswere077and1.0for
segregation locusprimarityindex(IPs)andagoutilocus
primarityindex, respectively.This confirms thatgoats
in northernCameroonare ofaprimarytype.Analysis of
variance for height at withers and slenderness and
auricular indexes showed no significant differences
between sites.Astudy ofbar charts revealedthatthere
wasonlyonegoatpopulationinthestudy area.Thegoats
inthatpopulationare shortwithameanheightatwithers
(HG) of48.6 cm, an average substernum slenderness
index of0.87 anda mean auricularthoraxindexof0.49.
Given the large variability in height, it should be
possibletoincrease thisparameter through selection of
animals adaptedtothis environment.
62 SmallRuminantResearchNetworkWorkshop

Phenotypic and genetic parameters of growth traits of
Blended goats at Malya, Tanzania
S.M. Das,’ J.E.O. Rege2 and Mesfin Shibrez
l. Livestock Production Research Institute
ZRTC(C), P. O. Box 292, Mpwapwa, Tanzania
2. International Livestock Centrefor Africa (ILCA)
P. O. Box 5689, Addis Ababa, Ethiopia
Abstract
Twenty-five year (1965—89) data on the Blended goats
from Malya Research Centre totalling 4799 records
were analysed for live weights and growth traits from
birth to 72 weeks of age. The Blended goat developed
in Malya, Tanzania, is a stabilised three-way cross ofthe
Kamorai (55%), Boer (30%) and indigenous (15%)
goats. Birth weight and weaning weight (16 weeks)
averaged 2.471002 kg and 1 1.141015 kg, respectively.
Live weights at 24, 48 and 72 weeks of age averaged
12.471026 kg, 16.421032 kg and 258010.43 kg,
respectively. Average daily gain from birth to weaning,
and to 24,48 and 72 weeks of age averaged 80011.0 g,
5912 g, 4111 g and 4611 g, respectively. Year of birth,
sex of kid and type of birth significantly (P<0.001)
affected birth weight, weaning weight and live weight
at 24, 48 and 72 weeks of age. Season of birth
significantly (P<0.01) affected birth weight and live
weight at 48 and 72 weeks of age. Age of dam
significantly (P<0.01) affected birth weight and weight
at 48 weeks of age. Heritability estimates for birth
weight, weaning weight and weight at 24 weeks were
0015110036, 009910.39 and 0.014810053,
respectively. Repeatability estimates for birth weight,
weaning weight and weights at 24, 48 and 72 weeks of
age were 0.2021018, 018710.22, 053310.022,
001610.035 and 0.1741038, respectively.
Introduction
Genetic improvement is an integral part of many goat
development programmes in the tropics, where breeding
policies mostly aim to upgrade local goats by
crossbreeding with, either temperate or tropical exotic
breeds (Lavaraj and Gore 1987; Schmidt 1991).
Selective breeding, utilising the variability within a
population to upgrade that population, is less often a part
of such programmes. This is due to easy availability of
apparently superior stock from elsewhere, and due to
difficulties in running field-based performance
recording. Where local goat breeds are involved the
flocks are mainly kept in institutional farms, in which
low numbers of animals and management constraints
limit selection intensity and genetic progress (Devendra
and Burns 1983). The potential for genetic
improvement is largely dependent on the heritability of
the trait and its genetic relationship with other traits of
economic importance upon which some selection
pressure may be applied. Information on heritabilities is
essential for planning efficient breeding programmes,
and for predicting response to selection.
In Tanzania, Blended goats are kept mainly for
meat production. Thus, traits affecting economic
viability include those associated with growth. Body
weight and rate of gain are among the most econo
mically important and easily measured traits of meat
animals. Although weight is an important objective in
selection, knowledge of the phenotypic and genetic
parameters of the growth trait upon which to base
selection is of utmost importance. Genetic and
phenotypic parameter estimates are scarce in goats
reared under Tanzanian conditions and where such
information is available, analytical methods used tend
to be inadequate. The purpose of this study was to
estimate phenotypic and genetic parameters of growth
traits in a flock of Blended goats at various stages of
growth from birth to 72 weeks of age.
Materials and methods
Blended goats are three-way crosses (55% Kamorai,
30% Boer and 15% indigenous), developed at Malya,
Tanzania, which were stabilised in late 1960s (Das
1989). Phenotypically, they have large pendulous ears
and resemble Anglo-Nubians. The records of Blended
goats used in this study were collected from Livestock
Research Centre, Malya, which lies at approximately
4°S latitude and 37’s longitude, and at an altitude of
about 1050 metres above sea level. The centre covers an
area of 1800 ha of which 1400 ha have natural vegetation
of savannah grassland. The natural vegetation at Malya
comprises Combretum wood species and grass species
of Bothrichloa, Hyparrhenia, Themeda and Cynodon
types; a few paddocks are sown to Chloris gayana. At
the centre, goats were grazed from 0800 to 1700 hours
and were housed indoors at night.
Breeding of goats was done in the wet and dry
seasons. The wet breeding season extended from March
to May, while the dry breeding season extended from
September to November. Lambs were ear-tagged soon
Small Ruminant Research Network Workshop 63

Das et al
after birth and left to suckle their dams duringgrazing
untilweaning at 16weeks of age. Kidswere separated
bysexatweaningintodifferentweanerflocks. Records
taken on lambsincludedbirthandweaningweights, and
weights at24,48and72weeksofage.
Statistical analysis
The 4799 records used in the analyseswere collected
over25years(1965-89)at Livestock ResearchCentre,
Malya.The recordsincludedweightrecords from birth
to72weeks ofage.The analyses were carried out by
fixed effects models usingthe General Linear Model
(GLM) procedure ofSAS (1987). The fixed effects
includedinthe modelwere year andseason ofbirth, sex
ofkid,type ofbirth and age ofdam.The residual mean
squarewasused asthe errortermtotestthe significance
of all differences evaluated among classes. Where
analysis ofvariance depicted significant differencesfor
variables, linear contrasts of least squares meanswere
estimated to testpair-wise differences within factors.
Heritability and repeatability estimateswere computed
by the method of paternal half-sib analysis using
VARCOMPproceduresofSAS(1987).
Results and discussion
Liveweight
Overall least squares means of birth and weaning
weights were 2.47E0.02 kg and 11.14t0.15 kg,
respectively,(Table 1). Overall liveweights at the age
of24,48and72weekswere 1248E026kg,1642E035
kgand2580E044kg, respectively,(Table2).Yearof
birth, sex,type ofbirth and age ofdam significantly
affected birth and weaning weight. Season of birth
significantly affected birth weight but was not
significant for weaningweight. Weights at birth and
weaning tended to increase from 1965 to 1975 and
thereafter tended to decline. However,weaningweight
showed a small recovery in 1987. Live weights at all
agesin thepresentstudy are higherthan those reported
earlier by Das (1989) on Blended goats at the same
locationwhen data from fouryearswere analysed.
Year ofbirth, sex, and type ofbirth significantly
affected the post-weaning weights at 24,48 and 72
weeks ofage. Season ofbirth was significant for live
weights at48and72weeksbut notfor liveweight at24
weeks ofage.Age ofdamhadsignificant effects on live
weight at24and48weeks ofage,but had no effect on
live weight at72weeks ofage. Postweaningweights
tended to increase from 1965 to 1976 and thereafter
declined,insomeyears,tobelowthe liveweightat 1965
The high variation in both pre-weaning and post
weaningweights due toyear ofbirth can be explained
byvariationsin amountofannual rainfallwhichinturn
influenced pasture production and availability offeed.
Kids,priortoweaning,dependmainly on dam's milkas
food,the production ofwhich is directly related tothe
availability offeedstodoes(Peart1982;Mukundanand
Bhat1983;Grootetal1993).Seasonalinfluence onbirth
weight operates through its effect on the dam's uterine
environment mostly in late gestation (Eltawil et al
1970). Seasonofbirthplays animportantroleingrowth
performance indirectly through its influence on the
dam's nutrition and hence amount of milk available to
the unweaned lamb. In the post-weaning period its
influence is related to its effect on the quality and
quantity ofpasture available totheweaned kids.
Birth weight and live weight at all ages were
significantly affected by type of birth in the present
study.Generallybirthweight decreasedwithincreasein
litter size. Robinson et al(1977)reportedthatfor lambs
in utero,asthenumberoffoetusesincreases, thenumber
of caruncles attached to each foetus decreases, thus
reducing the feed supply to the foetus and hence
reduction in the birth weight ofthe lambs.
In this study, maleswere significantlyheavier and
grew faster from weaning onward, implying that sex
effects are more pronounced with age after puberty.
These have been attributed to hormonal differences
betweensexesandtheir resultant effects ongrowth(Bell
et al 1970).
Weaningweightwouldreflectmotheringability of
dam aswell asthe inherentgrowthpotential.Thereafter
growth potentialwouldpredominate.Age ofdamwas
foundtohave a non-significant effecton liveweight at
72weeksofage only, showingthatthemotheringability
ofdoeshad carried over effectupto48weeks of age.
Wilson(1987)found thatthe effect ofage ofdamwas
significant on birth weight and growth rate at
pre-weaning and that young ewes tend to produce
smaller progenies at birth. It is generally known that
motheringability, especially milkproduction,increases
withparity.Olderewes are largerinbodyandtendtobe
better milkers(Stobart et al 1986).The effect ofparity
ofdam on kids is thus imparted as maternal influence
whose direct influence is limitedtothe nursingperiod.
Growth-average dailygain
Overallaverage dailygainfrombirthtoweaning,andto
24,48and72weeks ofage were 77E1.3g,59t1.5g,
41t10gand46t1.0g, respectively(Table3).Year of
birth, sex, and type of birth significantly affected
average dailygainfrombirthto72weeksofage.Season
ofbirth had nosignificant effect on average dailygain
except at48weeks ofage. Age ofdam hadsignificant
effect on average daily gain up to 48 weeks of age.
Growth of kids tended to increase from year 1965 to
1976 and thereafter declined.
Itisgenerally recognisedthatthe earlypost-natal
phase ofgrowth ingoats is a critical stage becausethis
isthe stagewhenthere is little maternalprotection and
the kidis exposedto environmental stresswhich limits
rate ofgrowth.The rate ofgrowthofakid afterweaning,
however,ispartly determinedbythe geneticpotential
of the kid and the level of environmental influence,
especially during the immediate post-weaning stage.
Pre-weaninggrowth ratewas lowerthan the94.3gper
day reported by Das and Sendalo (1990)for Blended
64 SmallRuminantResearch NetworkWorkshop

Growthtraits ofBlendedgoatsinTanzania
Table 1. Least squares means ofbirth and weaning weight ofblended goat kids at LRC, Malya.
Birthweight(kg) Weaningweight (kg)
Factor N Mean SE N Mean SE
Overall 3691 247 002 2745 11.14 0.15
Year ofbirth (00001) (00001)
1965 36 2.48 008 17 10.41 0.61
1966 80 2.36 0.05 54 10:58 0.35
1967 47 2.39 007 29 9.60 0,49
1968 50 2.62 007 29 11.61 0.48
1969 135 2.56 0.05 97 12.28 0.31
1970 105 2.51 0.05 69 11.18 0.34
1971 225 2.42 0.04 173 10.81 0,23
1972 92 3.01 0.06 69 1300 035
1973 161 2.58 0.04 82 11.25 0.30
1974 211 2 57 0.04 139 12.06 0,28
1975 161 2.59 0.05 106 14.38 0.30
1976 241 2.80 0.04 167 13.60 0.26
1977 185 2.63 0.04 156 11.03 027
1978 308 2.76 0.04 165 11.37 027
1979 202 2 57 0.04 174 10.13 0,25
1980 188 244 0.04 180 10.13 0.26
1981 132 2.35 103 9.46 0.30
1982 196 2.38 0.04 130 9 99 027
1983 176 227 0.04 163 1022 0.26
1984 192 2.34 0,04 133 9.82 0.21
1985 122 2.21 113 1000 0.30
1986 99 2.13 0.06 92 11.11 0.32
1987 111 2.32 0,05 106 13.70 0.30
1988 134 2.19 0.05 113 971 0.30
1989 102 2.36 0.05 86 11.09 0.32
Season ofbirth (00001) (05438)
Dry 607 2.39 003 450 11.07 0.23
Wet 3084 2 55 002 2295 11.25 0.15
Sex (00001) (00001)
Female 1814 237 0.02 1344 10.58 0.16
Male 1877 2 57 0,02 1401 11.70 0.16
Type ofbirth (00001) (00001)
Single 2070 2.66 0.02 1567 12.44 0.16
Twin 1621 2.29 0.02 1178 0.16 0.16
Age ofdam (years) (00001) (00001)
<2 17 2.51 0.12 9 12 90 0.80
2+-3 328 235 003 246 10.16 0.18
3+-4 1063 2.38 002 751 0.12 0.12
4+-5 752 2.49 002 573 0.14 0.14
5+-6 618 2.53 0,02 475 11.23 0.15
>6 913 2 57 002 691 11.15 0.13
SEdenotesstandard error.
kidsatMalya.Blendedgoatkidsinthepresentstudyhad
higher average daily gain compared to that of Black
Bengalgoats reportedbySingh et al(1983)and Black
BengalxBeetalcrossbredgoatsreportedby Kanaujiaet
al(1986).The mean overallpost-weaninggrowth rate
was higher than that reported by Reynolds (1989)for
WestAfrican Dwarfgoatsin Nigeria.
Inthepresentstudysinglebornandmalekids grew
fasterthantwinbornandfemalekids. Itwouldseemthat
birth type effects are commonly observed at pasture
(Beischer et al 1992) and it is so mainly because of
competitionforthe limited supply ofdoe milk.Thisis
supportedbyNorton and Banda (1993)whofound no
Small Ruminant Research NetworkWorkshop65

Das etal
Table2. Least square mean weight (kg) ofBlended goat kids at 24, 48 and 72 weeks of age, LRC, Malya.
24weeks 48weeks 72weeks
Factor N Mean SE N Mean SE Mean SE
Overall 2011 12.48 0.26 1573 16.42 0.35 1401 25.80 0.44
Year ofbirth (00001) (00001) (0.0001)
1965 11 1009 1.03 8 15.65 1.25 8 23 22 1.54
1966 37 12.62 057 27 1743 070 21 25.01 096
1967 18 13.64 0,83 13 16.60 1.02 10 2567 1.40
1968 16 13.76 089 12 1755 1.07 9 31.20 1.50
1969 37 13.99 0.63 30 18.56 075 28 27 20 095
1970 30 1277 0.67 26 16.25 0.76 23 25.24 098
1971 88 11.55 0.42 67 15.6 0.52 57 2474
1972 35 11.93 0.66 28 18.15 078 21 26.86 1.08
1973 36 13 37 0.61 28 16.89 0,72 25 25.84 092
1974 83 13.02 0.48 55 18.23 0.62 140 29 56 0.63
1975 137 1578 0.43 143 19 71 0.50 92 29.46 0.68
1976 182 14.89 0.40 184 16.39 0.48 131 24 67 0.63
1977 40 16.33 0.62 41 15.61 0.68 36 26.57 0.87
1978 65 13.13 0.52 63 15.82 0.60 98 2525 067
1979 144 11.29 0.41 43 14 92 0.66 53 23 95 077
1980 172 11.58 0.40 121 14.22 0.51 81 23.82 0.66
1981 58 10.55 0.54 100 15.17 0.53 84 24.76 0.69
1982 145 10.66 0.41 123 13.12 0.50 85 23.95 0.67
1983 140 11.68 0.41 88 14.31 0.54 70 24.26 0,71
1984 76 12.37 0.49 56 16.89 0.61 56 28.27 0.76
1985 96 9 98 0,47 85 13.14 0.56 79 22.45 071
1986 93 12.80 0.47 83 18.59 0.56 48 25.26 0.80
1987 99 12.79 0.45 62 18.71 0.59 54 23.37 077
1988 104 9 95 0.45 79 16.63 0.57 75 28.73 072
1989 69 11.35 0.50 - -
Season ofbirth (07374) (00024) (00090)
Wet 1708 12.55 0.41 1397 17.26 0.34 1244 26.76 0.42
Dry 303 12.40 0.25 176 1559 0.53 157 24.85 0.69
Sex (000001) (0001) (0.0001)
Female 1005 1 1 77 027 820 15.17 0.36 774 2374 0,45
Male 1006 13.18 027 753 17.68 037 627 27 87 0.46
Type ofbirth (00001) (00001) (00001)
Single 1189 13.43 027 927 17.58 0.36 801 26,95 0.45
Twin 822 11.53 0.28 646 15.26 0.37 600 24.66 0.46
Age ofdam (0001) (OOO19) (0.1386)
<2 6 11.49 1.32 3 13.41 1.84 3 2371 2.26
2+-3 178 12.12 0.29 132 16.23 0.36 119 25 45 0.46
3+-4 541 12.27 0.21 431 16.82 0.26 357 26.09 0.34
4+-5 393 12.61 023 313 17.04 0.29 301 26.58 037
5+-6 381 13.50 0,23 295 1761 0.29 248 26.41 0.38
>6 512 12.87 0.22 399 1742 027 373 26.69 0.36
SEdenotes standarderror.
differencesingrowthbetween single andtwinbornkids
whensubjectedto artificial rearingofthe kids.
Geneticparameters
The heritability and repeatability estimates for live
weight and growth rates are presented in Table 4.
Heritability estimates obtained in this study were
moderatetolowforliveweights andaverage daily gain,
rangingfrom0099t0039forliveweight atweaningto
0.153H0053 for average daily gain from birth to 24
weeks of age. Repeatability estimates ranged from
0004H0035 for average daily gain from birth to 48
weeks ofageto0534t0022foraveragedailygainfrom
birthto24weeks ofage.
The heritability estimatesin the present study are
within the range reportedfor meatgoatsbySingh et al
(1993),whose heritability estimates for bodyweights
ranged from 0.144E0.149 for 12 months weight to
0360E0.110for6monthsweight. Heritabilityfor3and
9 months weight was calculated as 0.330E0.110 and
0295E0.107, respectively.Royetal(1989)workingon
Jamunapari kids raisedundersemiintensive conditions
reported that heritability ofbodyweights at3 and 12
months were 0432E0.152 to 0.127+0.116, respec
tively.
66 SmallRuminantResearch NetworkWorkshop

Growth traits of Blended goats in Tanzania
Table 3. Least squares means for average daily gains (g) from birth to weaning and advanced ages of blended goat kid at
LRS, Malya.
Weaning 24 weeks 48 weeks 72 weeks
Factor N Mean SE N Mean SE N Mean SE N Mean SE
Overall 2745 77 1.3 2011 59 1.5 1573 41 1.0 1401 46 1.0
(0.0001) (0.0001) (0.0001) (0.0001)
Year of birth
1965 17 69 5.2 11 45 6.1 8 39 3.7 8 41 2.9
1966 54 73 3.0 37 61 3.4 27 45 2.0 21 45 1.8
1967 29 64 4.0 18 67 4.9 13 42 2.9 10 46 2.7
1968 29 79 4.0 16 6 5.2 12 44 3.1 9 57 2.9
1969 97 87 2.7 37 68 3.7 30 47 2.1 28 49 1.8
1970 69 77 2.9 30 61 3.9 26 41 2.2 23 45 1.9
1971 173 75 2.0 88 54 2.5 67 39 1.5 57 44 1.3
1972 69 89 3.0 35 53 3.8 28 45 2.3 21 47 2.1
1973 82 77 2.6 36 65 3.6 28 42 2.1 25 46 1.8
1974 139 84 2.3 83 62 2.8 55 47 1.8 140 53 1.2
1975 106 105 2.6 137 78 2.5 143 51 1.5 93 53 1.3
1976 167 96 2.2 182 72 2.3 184 40 1.4 131 43 1.2
1977 156 74 2.3 40 81 3.6 41 38 2.0 36 47 1.7
1978 165 76 2.3 65 62 3.1 63 39 1.7 98 45 1.3
1979 174 67 2.2 144 52 2.4 43 37 1.9 53 43 1.5
1980 180 68 2.2 172 54 2.4 121 35 1.5 98 42 1.3
1981 103 63 2.6 58 49 3.2 108 38 1.5 84 45 1.3
1982 130 67 2.3 145 49 2.4 123 32 1.5 85 43 1.3
1983 163 71 2.2 140 56 2.4 88 36 1.6 70 44 1.4
1984 133 67 2.4 76 60 2.9 56 43 1.8 56 51 1.5
1985 113 69 2.5 96 46 2.8 85 33 1.6 79 40 1.3
1986 92 80 2.7 93 63 2.8 83 49 1.6 48 46 1.6
1987 106 101 2.5 99 62 2.7 62 49 1.7 54 42 1.5
1988 113 67 2.5 104 46 2.7 79 43 1.7 75 53 1.4
1989 86 78 2.7 69 54 2.9 - - - -
(0.8839) (0.5140) (0.0072) (0.0197)
Season
Dry 450 77 2.0 303 60 2.4 176 39 1.6 157 45 1.3
Wet 2295 77 1.3 1708 58 1.5 1397 44 0.9 1244 48 0.8
(0.0001) (0.0001) (0.0001) (0.0001)
Sex
Female 1344 73 1.4 1005 56 1.6 820 38 1.0 774 42 0.9
Male 1401 81 1.4 1006 63 1.6 753 45 1.1 627 50 0.9
(0.0001) (0.0001) (0.0001) (0.0001)
Type of birth
Single 1567 87 1.4 1189 64 1.6 927 44 1.0 801 48 0.9
Twin 1178 67 1.4 822 55 1.6 646 49 1.1 600 44 0.9
(0.0001) (0.0001) (0.0096) (0.3040)
Age of dam
<2 9 92 6.9 6 53 7.7 3 32 5.4 3 42 4.3
24—3 246 69 1.5 178 58 1.7 132 41 1.0 119 46 0.9
34—4 751 72 1.0 541 59 1.2 431 43 0.8 357 47 0.7
44—5 573 75 1.2 393 60 1.4 313 43 0.8 301 48 0.7
54—6 475 77 1.2 381 65 1.4 295 45 0.9 248 47 0.7
>6 691 76 1.1 512 61 1.3 399 44 0.8 373 48 0.6
SE denotes standard error.
Small Ruminant Research Network Workshop 67

Das et al
Table4. Heritabilityand repeatabilityestimates oflive weight
andgrowth traits ofBlendedgoatkids atLRC, Malya.
Heritability Repeatability
Trait estimates estimates
Birthweight 0.151+0036 0202-0018
Weaningweight 0099+0039 0.187+0022
Weight at24weeks 0.148 -0053 0.533+0022
Weight at48weeks - 0016H0035
Weight at72weeks - 0.188-H0038
ADG" uptoweaning 0.100t0039 0.171 -0022
ADGupto24weeks 0.153E0053 0.534-H0022
ADGupto48weeks - 0004-H0035
ADGupto72weeks - 0.174-H0038
1.ADG=average dailygain.
It is clear from the present and other results that
post-weaninggrowth generally has higher heritability
estimatesthanpre-weaninggrowth.Thiswouldindicate
thatenvironmentalfactors,in relationtoadditivegenetic
factors, had more influence on early kid gains than on
gains laterin the kid's life.Thismaybeattributedtothe
high maternal influence associated with kid growth
performance earlyin life. Highmaternalinfluence hasa
tendency to increase the component of variance
environmentaltothe lambtherebyloweringheritability
estimates (Thrift et al 1973).One could concentrate on
traits with highheritability as longasthere exists ahigh
positive correlationwith other traits ofeconomicvalue.
Themoderatelyhigherheritability estimatesfor24
weeks liveweightandgain inthis studyindicate that to
select kidsfor their own genetic merit for weights and
gains, itwouldbe best touse bodyweight at6months
ofage as the selection criterion rather than weaning
weight asis often practised.The 6 months liveweight
gain should be superior to weaning weight and
pre-weaninggrowth rate sinceitis much lessinfluenced
by maternal effects which tend to obscure the direct
additive genetic effect for growth. Selection directed
towardsweights at later ageswould maximise response
in birth weight and possible increased frequency of
dystocia (Thrift et al 1967;Olson et al 1976;Martin et
al 1980). However, selection for weights at later ages
wouldbe expectedto leadtoincreasedyearlingweights
which is desirable for meat animals, but may be
associated with increased maintenance costs for
breedinganimals.
Conclusion
The present results on live weightsandgrowth rates of
Blendedgoatsindicatethatin ordertoimprovebreeding
value, selection mustbebasedongenotypic ratherthan
environmental superiority. Thus variation due to
definable environmentaleffectsmustberemovedbyuse
of suitable adjustment factors. It is necessary that all
known sources of variation influencing the traits of
importance be included in the model of analysis,
otherwise the results ofthe study may not be reliable.
This can,however,be done onlyin on-station recorded
flocks.
The trait ofinterest oughttobe investigatedinthe
environment underwhichitistobetypically expressed,
since this environment may be the one which is
necessaryfor revealing certain desirable orundesirable
genes or, in contrast, thesoughtafter genetic differences
maybe oflittle importance orindistinguishable in this
environment.Statisticaltechniquespresentlyutilisedfor
the estimation of breeding values in selection pro
grammes rely on estimates ofgenetic variation within
andbetweentraits ofeconomicimportance.Theoverall
impact ofany selection programme will depend on the
directandcorrelatedresponsesthatresultfrom selection
on the selection criterion. These responses can be
predicted a priori by using estimates ofgenetic and
phenotypic relationships between alltraits ofeconomic
importance.
It is therefore, important that a breeding and
selection strategy be developed, preferably involving
farmers, such as "Open Nucleus Scheme" for further
improvement and enhancing dissemination ofBlended
goatsinTanzania.
Acknowledgements
The authors are grateful to the Commissioner for
Research and Training, Ministry of Agriculture,
Tanzania, for permission to present the paper. The
authors are thankful tothe Zonal Director,ZRTC(C),
Mpwapwaandthe staffatthe institute for contribution
in data collection and classification and alsothankfulto
Animal Breeding and Production Systems, ILCA,
Ethiopia,for analysis ofdata.
References
Beischer D.A., Pattie W.A. and Norton B.W. 1992.
Environmental factors influencing the growth of
Australian feral goats. Small Ruminant Research
(accepted).
BellG.H.,DavidsonJN.andScarborough H. 1970.Textbook
ofPhysiology and Biochemistry. Longman,Edinburgh,
UK.
DasS.M. 1989.Preliminaryresults onevaluationandbreeding
ofBlendeddairy goatsinTanzania. In:WilsonR.T.and
Azeb Melaku (eds),African Small Ruminant Research
andDevelopment. Proceedings ofa Conference held at
Bamenda, Cameroon, 18-25 January 1989. ILCA
(International Livestock Centre for Africa), Addis
Ababa, Ethiopia.pp.536-545
DasS.M. andSendaloD.S. 1990. Comparative performance
of improved meat goats in Malya, Tanzania. In:
Proceedings ofthe First Biennial Conference ofthe
African Small Ruminant Research Network held at
ILRAD, Nairobi,Kenya, 10-14December 1990 African
Small Ruminant Research Network, ILCA (Inter
national LivestockCentre for Africa), Nairobi, Kenya.
pp.445-452
Devendra C. and Burns M. 1983. Goat Production in the
Tropics. 2nd edition. CAB (Commonwealth
Agricultural Bureau),Slough,UK. 183pp.
68 SmallRuminantResearch NetworkWorkshop

Growth traits of Blended goats in Tanzania
Eltawil L.E., Hazel L.N., Sidwell GM. and Terrill CE. 1970.
Evaluation of environmental factors affecting birth,
weaning and yearling traits in Navajo sheep. Journal of
Animal Science 3 1 (5)1823—827.
Groot B., De Narayan Prasad R.A., Soni R.L., Nett P. and
Kropf W. 1993. Performance of Sirohi goats under
village conditions in Rajasthan, India. In: Recent
Advances in Goat Production. Proceedings of the V
International Conference on Goats, held in New Delhi,
India, 2—8 March I 992. International Goal Association,
New Delhi, India/International Development Research
Centre, Ottawa, Canada/Food and Agriculture
Organization of the United Nations, Rome.
Italy/Indo-Swiss Development and Fodder Production
Project, Ajmer, Rajasthan, India. pp. 534—544.
Kanaujia A.S., Pander B.L., Vinayak A.l(. and Kaira S. 1986.
Seasonal variation in reproductive parameters of does:
A note. Indian Journal of Animal Production and
Management 2(4): 168-170.
Lavaraj V.A. and Gore A.P. 1987. Cross-bred goat population
in rural community. Indian Journal of Agricultural
Economics 42:587—594.
Martin T.G., Sales D.I., Smith C. and Nicholson D. 1980.
Phenotypic and genetic parameters for lamb weights in
a synthetic line of sheep. Animal Production 30:261.
Mukundan G. and Bhat P.N. 1983. Lactation curve in Malabari
goats and their Saanen half-bred. 1. Milk production.
Indian Journal ofAnimal Science 53(6):666—669.
Norton B.W. and Banda T.T. 1993. The growth potential of
Australian cashmere goats from birth to weaning. In:
RecentAdvances in Goat Production. Proceedings ofthe
VInternational Conference on Goats, held in New Delhi,
India, 2—8 March 1992. International Goat Association,
New Delhi, India/International Development Research
Centre, Ottawa, Canada/Food and Agriculture
Organization of the United Nations, Rome,
Italy/Indo-Swiss Development and Fodder Production
Project, Ajmer, Rajasthan, India. pp. 885—892.
Olson L.W., Dickerson GE. and Glimp H.A. 1976. Selection
criteria for intensives market variation in sheep. Journal
ofAnimal Science 24:766.
Peart J.N. 1982. Lactation ofsuckling ewes and does. In: Coop
1.E. (ed), Sheep and Goat Production. World Animal
Science C. 1. Production-Systems Approach. Elsevier
Scientific Publishing Company, Amsterdam, The
Netherlands. pp. 119—134.
Reynolds L. 1989. The Integration of Livestock in Alley
Farming. Paper presented at the inaugural meeting of
the Alley Farming Network for Tropical Africa
(AFNETA), IITA, Ibadan, Nigeria, 1—3 August I 989.
Robinson J.J., McDonald 1., Fraser C. and Crafts R.M.J. 1977.
Studies on reproduction in prolific ewes. 1. Growth of
the products of conception. Journal of Agricultural
Science (Cambridge) 88:539—552.
Roy R., Prakash B. and Khan B.U. 1989. Genetic and
non-genetic sources of variation for growth in
Jamunapari kids. Indian Journal of Animal Sciences
59:874—877.
SAS. 1987. StatisticalAnalysis Systems. Procedures Guidefor
Personal Computers. SAS Institute Inc., Cary, North
Calorina, USA.
Schmidt U. 1991. Zeigenzucht in Burundi: ein Beitrag zur
Tierproduction bei Kleinbauren. Entwicklung
Landlicher Raum 91 :22—25.
Singh C.S.P., Singh D.K., Singh S., Nath S. and Mishra R.H.
1983. Growth rate in crossbred and purebred Black
Bengal goats. Tropical Veterinary and Animal Science
Research 1(1):63—68.
Singh S.K., Sood S.B. and Khan B.U. 1993. RecentAdvances
in Goat Production. Proceedings of the V International
Conference on Goats, held in New Delhi, India, 2-8
March [992. International Goat Association, New
Delhi, India/International Development Research
Centre, Ottawa, Canada/Food and Agriculture
Organization of the United Nations, Rome,
Italy/Indo-Swiss Development and Fodder Production
Project, Ajmer, Rajasthan, India. pp. 675—678.
Stobart R.H., Bassett J.W., Cartwright TC. and Blackwell
R.L. 1986. An analysis of body weights and maturing
patterns in Western Range ewes. Journal of Animal
Science 63(3):729-740.
Thrift F.A., Whiteman J.V. and Kratzer D.D. 1967. Evaluation
of udder scoring in a ewe flock. Journal of Animal
Science 26:206.
Thrift F.A., Whiteman J.V. and Kratzer D.D. 1973. Genetic
analysis of preweaning and postweaning lamb growth
traits. Journal ofAnimal Science 36:640.
Wilson R.T. 1987. Livestock production in central Mali:
Environmental factors affecting weight in traditionally
managed goats and sheep. Animal Production
45:223-232.
Paramètres phénotypiques et génétiques des caractéristiques de
la croissance chez la chèvre hybride en Tanzanie
Résumé
Un total de 4799 données de poids et de paramètres
de croissance de la naissance à l’âge de 72 semaines
rassemblées sur la chèvre hybride en Tanzanie sur une
période de 25 ans (1965—1989) ont été analysées. Mise
au point en à Malya (Tanzanie), la chèvre hybride est un
produit stabilisé obtenu à partir du Kamorai (55%), du
Boer (30%) et de la race locale (15%). Les moyens poids
à la naissance et au sevrage (16 semaines) étaient de
2,47i0,02 kg et de 11,14: 0,15 kg respectivement. Les
poids vifs à l’âge de 24, 48 et 72 semaines étaient respec
tivement de 12,47: 0,26 kg, de 16,42i0,32 kg et de
25,80i0,43 kg. Les gains moyens quotidiens de la
naissance au sevrage et à l’âge de 24, de 48 et de 72
semaines étaient respectivement de 80,01i1,0 g, de
Small Ruminant Research Network Workshop 69

Das etal
59+2g, de 41t1get de46dt1 g.L'année de naissance,
le sexe du chevreau et le type de naissance avaientun
effet significatif(P<001)sur les poidsàla naissance et
lepoidsvifà l'âgede48etde72semaines. L'âge de la
mère avaituneffetsignificatif(P<001)sur lepoids des
jeunes à la naissance età l'âge de 48 semaines. Les
coefficients d'héritabilité du poidsà la naissance, au
sevrageetà l'âgede24semainesétaientrespectivement
de 0,015E 0,036, de 0,099+0,39 et de 0,014+0.053
respectivement. Les coefficients de répétabilité des
poidsàlanaissance,ausevrageetà24,48et72semaines
étaientrespectivement de 0,202E0,18, de 0,187+0,22,
de0,533-E0022, de0,016E0035 et de0,174+0.38.
70 SmallRuminantResearch NetworkWorkshop

Contrôle desperformances,sélection des mâles ausein de la
race ovine Djallonké et création d'unflock-book
B. Bonfoh " A.Traoré* etT Ayewa"
*'Centre d'appuitechnique de Kolokopé(CAT-K)
Programme nationalPetitélevage (PNPE)
Résumé
Unprogramme de sélection de béliers Djallonké
basésur le noyau de sélection duCAT-K constitué de
750 brebis et 100 béliers membres de 10 familles ou
lignées, estprésenté.Ce noyau doits'ouvrir etintégrer
les meilleures fermes ovines améliorées (FOA) des
paysans-éleveurspour constituerune basede sélection.
Leschémade sélection s'articule autourd'unephase de
présélection basée sur le critère "poids au sevrage"
ajusté selon un poids à âge type (PAT) de 90jours.
Celui-ci est réajusté en fonction dutype de naissance
grâce àun coefficient de correction.Ce coefficient est
égal au rapport entre le poids à âge type moyen de la
classe de référence,c'est-à-dire les agneaux néssimples
etissus des mères ayant eu plus d'uneparité et le poids
àâge type moyen de la classe des agneaux nés doubles.
La deuxièmephase de sélection intervientà l'âgede 12
moisetestbaséesur lespoidsseuils (P>30,P>25,P>20
kg de poids vif) qui permettent de classer les béliers
sélectionnés respectivement en 1ère, 2ème et 3ème
catégories.Les animauxinfestés detrypanosomes avec
diminution dutauxd'hématocrite (<20) sontexclus de
la sélection.Une enquête visantà cibler les meilleures
FOA,notammentcellesappliquant leprogrammeglobal
d'amélioration zootechnique vulgarisé, a été réalisée
afin degarantir la survie des béliers prêtés et de leurs
progénitures.
Introduction
Depuis 1980, le Gouvernement togolais finance
avec despartenaires extérieurs un vaste programme de
développement de l'élevage des petits ruminants à
travers deux volets. Le 1er volet "Amélioration de
l'élevage traditionnel", vise surtout à améliorer la
couverture sanitaire du troupeau traditionnel
(vaccination contre la peste des petits ruminants,
déparasitages internes et externes) et à assurer la
vulgarisation de quelques thèmes fondamentaux
(amélioration de l'habitat làoùilexiste etsensibilisation
à sa construction avec les matériaux locaux dans les
zones où cette pratique n'est pas usuelle chez les
paysans, complémentation minéraleparapportde blocs
desels minéraux).Le2ème est le volet"Promotiond'un
élevage detypesemi-intensif"àtravers les activités d'un
Centre d'appuitechnique (CAT), chargé d'élaborer et
de proposer au service de vulgarisation des thèmes
techniques éprouvés pour promouvoir un élevage
moderne depetits ruminants.Les éléments clés de cette
modernisation sont un habitat moderne comprenant
abris et parcs, des animaux, une bonne couverture
sanitaire,une supplémentation alimentaire appropriée,
l'amélioration génétique, une bonne gestion et une
exploitation rationnelle des produits. Ce 2ème volet
repose sur l'encadrement de paysans détenteurs d'un
effectifminimumd'une vingtaine debrebis au départ et
désireuxde devenirdevéritables exploitantsd'élevages
modernes d'ovins dénommés "fermes ovines
améliorées"(FOA)(Bonneau et al., 1990).
Face à l'importante demande de géniteurs
expriméeparcespaysans dontplusde40%enmanquent
(Bonneau et al., 1990; Roulleau et Bonfoh, 1988), le
CAT-K, dont l'undesobjectifs estde diffuser leprogrès
génétique enregistré dans son noyaude sélection ovine,
tente depuis quelques années deformuler et d'exécuter
un programme national de sélection ovine basé surun
schéma de sélection à noyau ouvert (Traoré, 1991;
TraoréetBonfoh, 1993).
Pour amorcer ce processus, le CIPEA, dans le
cadre duRéseau de recherche sur les petits ruminants,a
mis en place conjointementavec le PNPE, leprotocole
de recherche SRNET/REPG/1 intitulé "Contrôle de
performances et sélection des mâles au sein de la race
ovine Djallonké et création d'un flock-book". Les
objectifs sont les suivants: connaître le potentiel
génétique et mettre au point des méthodes de son
amélioration (critères de sélection), examiner les
relations entre l'amélioration de la croissance et
l'évolution de la résistance (trypanotolérance), étudier
l'impact d'unprogramme de sélectionà noyau ouvert
sur les paramètres de productivité des troupeaux
encadréset contribueràl'élaborationd'unstandardpour
larace ovine Djallonké auTogo.
Le présent rapport fait le point sur la mise en
oeuvre de ce protocole. Il abordera, après une
présentation du matériel et des méthodes, les résultats
préliminaires relatifs à l'action de sélection ovine à la
station duCAT-K età l'enquête visantà identifier les
meilleures fermes ovines améliorées (FOA)
susceptibles d'entrer dans labase de sélection.
Small RuminantResearch NetworkWorkshop 71

Bonfoh et al
Matériel et méthodes
Donnéesécologiques dusite de recherche
Le Togo,pays de l'Afrique de l'Ouest, est situé
entre les6ème et12ème degrés de latitude nordet entre
0° et2" de longitude est. Il estbordéausudpar l'océan
atlantique et fait frontière avec le Ghana, le Bénin , le
Burkina Faso. LeTogoest caractérisépar deuxtypes de
climat. Le nord, au dessus du 8ème degré de latitude
nord, appartient à la zone de climat tropical de type
soudanien: c'est la zone de la "savane dérivée" ou
secteur préforestier caractérisé par une pluviométrie
unimodale allantde la mi-maià la mi-octobre etvariant
entre 1000et 1300mm. L'humidité atmosphérique est
maximale en février (41%). Le sud du 8ème degré de
latitude nord(oùestlocaliséleCAT-K)jouitd'un climat
tropical de transition: c'est le secteur forestierguinéen
caractérisé par une saison de pluie bimodale allant de
mars à novembre entrecoupée par une sécheresse en
juillet etaoût. Lapluviométrie annuelle moyenne varie
de 1100à1600mm.Lestempératuresfluctuententre22
et32"C.
Population animale de la base de sélection
Lapopulationanimale concernée estde750brebis
de race Djallonké réparties dans5bergeries et de 100
géniteurs confirmésrépartis dans 10famillesoulignées
localisées à la station du CAT-K.A ce noyau, il faut
ajouter les meilleures des 339 FOA encadrées par le
PNPEavecuneffectiftotalde21.089têtes dontquelque
10000brebis(PNPE, 1994).
Conduite destroupeaux
Au CAT-K, la population animale en cours de
sélection est élevée dans des conditions proches de
celles d'unsystème d'élevagesemi-intensif
un milieu d'élevage assez bien maîtrisé avec
comme habitatune bergerie moderne;
un gardiennage sur pâturage de savane (6 à 8
heuresparjour);
une complémentation alimentaire et minérale
(graines de coton et blocs de sels minéraux)toute
l'année mais modulée en fonction de la saison, de
l'étatphysiologique et de la catégorie animale;
- un approvisionnement adéquat en eau;
une intensité des traitements antiparasitaires
similaires à celle du programme de prophylaxie
vulgarisé:
absence de chimioprévention contre la
trypanosomiase;
• lutte contre les parasitoses internes (en début, au
milieu et en fin de saison des pluies pour les
adultes,à l'âge de 1,5moisetausevrageà l'âge de
3 mois quelle que soitlasaison de naissance pour
les jeunes);
lutte contre les ectoparasites(détiquage tous les15
jours en saison des pluies etune foispar mois en
saison sèche); et
• vaccinations contre la peste des petits ruminants
(PPR)et l'épididymite contagieuse ovine (ECO)
Reproduction
Les 5troupeaux de brebis duCAT-Ksont menés
surun rythme de3agnelagesen2ansgrâceà la mise en
oeuvre d'un programme de gestion de la lutte par
introduction desbéliersd'une lignée donnéepourdeux
cycles de reproduction successifs. Durant ces luttes
organisées quidurent45jours, les bélierssont lâchés le
soir dans letroupeaude brebisqui leur est attribué. Les
agneauxsontsevrésàunâgemoyende3mois(90jours)
(Bonfoh, 1994).
Sélection
Objectifs
Les objectifs opérationnels du programme de
sélection sont les suivants: améliorer la vitesse de
croissance, le formatà l'âge adulte des animaux, les
caractéristiques defécondité et de prolificité des brebis
ainsique la viabilitédesagneauxetconserverunebonne
conformation et une bonne rusticité des produits
améliorés de la race ovine Djallonké.
Critères desélection
Le poids au sevrage à l'âge moyen de 90jours,
fortement correlé avec le poids à l'âge adulte, occupe
une place de choix dans la présélection. La sélection
définitive a lieuà l'âge de 12mois avecla classification
en catégories.Outre le critère du poids au sevrage,tout
agneaumalconformé(malformations, défaut d'aplomb,
hypogonadisme)ouprésentant des caractères rappelant
letypesahélien(longueurde laqueue dépassantlejarret,
pendeloques)estexclu desélection.Par ailleurs, dans le
but de préserver les qualités de trypanotolérance des
animauxdesélection, toutanimalmanifestantdessignes
de suspicion de la trypanosomiase fait l'objet d'un
diagnosticparasitologique dont le but est de mettre en
évidence des trypanosomes et d'évaluer le taux
d'hématocrite. Les animaux infestés avec diminution
anormaledutauxd'hématocrite(<20)sont exclus de la
sélection (Traoré et Bonfoh,1993).
Organisation de la sélection
Lasélection comporte3étapesprincipales :
- Identification et contrôle des performances de
croissance sur tous les agneaux nés des luttes
organisées.
Tous lesagneauxsontidentifiésà la naissance avec
des boucles d'oreilles portant 5 chiffres dont le 1*
indique l'année de naissance (ex:3pour 1993), le 9ème
72 SmallRuminantResearch NetworkWorkshop

Performances desovins mâlesDjallonké
le numéro de troupeau des mères et le 3ème le rang de
naissance dans l'année. Au sevrage, les agneaux
présélectionnés sont tatoués à la partie glabre de la
queue.Ce tatouage sertà les identifier en cas de perte
desbouclesd'oreilles.
- Elevage et contrôle individuel des agneaux
présélectionnésà l'âge moyen de90jours dans le
centre detestage des ovins duCAT-K.
- Sélection définitive desfutursgéniteursà l'âge de
12 mois, diffusion et utilisation des béliers
sélectionnésàpartir de l'âgede 15mois(figure 1)
(Traoré, 1991;Traoré et Bonfoh, 1993).
Méthode de sélection
Sélection en station
Phase de présélection: le poids au sevrage est
ajusté enfonction de l'âgetype au sevrage(90jours)et
dutypede naissancepourdéterminerlespoidsàâgetype
(Traoréet Bonfoh, 1993). En raison de l'étalementdes
naissances(sur30à40jours)consécutifà la durée de la
NOYAU ELITE
CATK
TROUPEAUX
- - REPRODUCTRICES
Lutte par lignée CATK
T AGNEAUX AGNELLES
: E :
S à3Mois
P > PAT-- cy
TE
ANTE
: D O PRESELECT à8Mols NAISES
: : AUSEVRAGE >18kg CATK
: E ; U
: «16kg
: S :
C
: : : BASEDESE- ;FOA - -
: E ; H
: N : | | E :
: D ; R
: A : SELECTION FUTURS : sTATioNDE
N | GENITEURS : TEsTAGEcATK ;
: C E à12Mois
>2Ckg
: E : <20kg P>30kg v P > 20
P > 25
: GENITEURS GENITEURS GENITEURS
: 1ère CATEG 2ème CATEG 3ème CATEG
Figure 1. Schéma de sélection ovine au centre d'appuitechnique de Kolokopé
Small RuminantResearch NetworkWorkshop 73

Bonfoh etal
périodede lutte auCAT-K(45jours), lepoidsàâgetype
(PAT)individueldetous les agneaux est ajustégrâceà
la formule suivante:
PAT - *EP x AT(J)
où
Pj = poids aujourJde sevrage
J = âge de l'agneauà lapesée (enjours)
Pn = poidsà la naissance
AT = âgetype au sevrage (=90jours)
Le réajustement du PAT est principalement
appliquépour les agneauxnésdoubles etélevéscomme
tels;pour les agneaux nés doubles mais élevés comme
simples (suite à la mortprécoce de l'un d'eux)un tel
ajustement ne sejustifie pas, la faiblesse dupoidsà la
naissance étantrapidementcompensée. Le réajustement
du PA.T. se fait grâce à la prise en compte d'un
coefficient de correction (CC) obtenu par calcul du
rapport entre lepoidsàâge type moyen de la classe de
référence que constituent les agneaux nés simples et
issus des mères ayant euplus d'une parité et lepoidsà
âge type moyen de la classe des agneaux nés doubles.
Après ce réajustement desPATdes agneauxconcernés,
le PATmoyenà90joursde l'ensemble desagneaux est
calculé ainsi que son écart-type. Ces deuxparamètres
permettent d'établir les seuils de présélection par
"troncature"delapopulation des agneauxcandidatsà la
sélection (figure 2); cette méthode suppose une
distribution normale de la variable "poids au sevrage"
(Traoréet Bonfoh,1993).
Les agneaux dont le PAT est inférieur au PAT
moyen plus l'écart-type ne sont pas retenus pour la
sélection.
effectif
(a)
Animauxsélectionnés
3ème catégorie (34%)
Animauxéliminés
(1 - n)%
2ème catégorie
(13,5%)
1ère catégorie
(2,5%)
poids
Figure2.Seuil deprésélection des agneauxàpartirdupoids
ausevrage (Méthodepartroncature)
Phase de sélection: Elle est une phase d'élevage
desjeunesbéliersprésélectionnés sur lepoids à90jours
jusqu'à l'âged'unan.Lescontrôlesde performancesont
réalisésparlespeséesmensuelles;la sélection définitive
alieuà 12mois.Lesbéliers sélectionnés, répartisen 1ère
(P>30 kg), 2ème (25<P<30 kg) et 3ème catégories
(20>P<25kgdepoidsvif), sontmisàleurpremière lutte
à l'âge de 15mois.
Présélection enferme
Dans lesfermes ovines améliorées(FOA) où l'on
ne dispose pas forcément du poids individuel des
agneauxà la naissance, le calculduPATse fait suivant
lesmêmesprocéduresexceptéque cePATestnettement
surévalué et n'a qu'une valeur indicative autorisant
cependantdes comparaisons entreagneauxausein d'un
troupeau puis entre troupeaux de FOA (Traoré et
Bonfoh, 1993).
P.A.T. = PJ xAT
(J)
Gestioninformatique des données
Il convient de signaler qu'une informatisation de
la gestion des troupeaux de sélection du Centre est
intervenue en 1992(Traoré, 1992). Elle repose sur des
fichiers créésà partir du logiciel DBase IV: état civil,
croissance, reproduction, santé, etc. Le support de
collecte delabase dedonnéesde croissance estconstitué
d'unfichier manueletd'un fichierinformatique(Lotus
123 et Dbase IV).
Enquêted'identification despaysans-éleveurs
Dans le cadre du protocole, une enquête a été
réalisée en avril 1994 pour dresser la liste des
paysans-éleveurs susceptibles de rentrer dans labase de
sélection. L'enquête a été réalisée grâce à l'appui des
chefs desecteur duPNPEdesrégionsdesSavanes, Kara
et Centrale. Le but du questionnaire est de permettre
l'identification des paysans-éleveurs des FOA qui
appliquentdemanièresatisfaisante le programme global
d'amélioration zootechnique vulgarisépar le PNPE et
dont les éléments essentiels sont:
• la maîtrise de l'alimentation (gardiennage du
troupeau au pâturage, pratique d'une complé
mentation alimentaire et minérale optimale.);
• application d'un train de mesures sanitaires
matérialisé par le respect du programme de
prophylaxie envigueur; vaccinationcontre lapeste
des petits ruminants et contrôle des parasitoses
gastro-intestinales et externes.
Seulscespaysans-éleveurspourrontgarantir lavie
des béliers qui leurs seront prêtés pour les luttes
organisées ou contrôlées, limiter lespertes de poids des
béliers au cours des luttes et favoriser la survie de la
74 SmallRuminantResearch NetworkWorkshop

Performancesdes ovinsmâles Djallonké
progéniture et l'extériorisation du potentiel génétique
des individus (vitesse de croissance avant sevrage). Il
convientégalementde signaler que dans le cadre de ce
protocole,une mission aétéeffectuée en octobre 1993
au Programme national de sélection ovineàBouakéen
Côte d'Ivoire (Bonfoh,1993).
Résultats et discussion
Connaissancedupotentielgénétique
Lesrésultatsprésentés iciproviennent du contrôle
de performances de croissance de 2155 agneaux des
deuxsexesnésde 13agnelagesintervenus entre 1993et
1994 (tableaux 1 et2). Ces résultats sont similaires à
ceux rapportéspar le Programme national de sélection
ovine (PNSO) de Côte d'Ivoire (IEMVT-CIRAD,
1990).
Dansungroupe de 698agneauxmâles candidatsà
laprésélection,326dont le PATà3mois est supérieur
ou égal au PAT moyen de ce groupe plus l'écart-type
ontété retenus,soit untaux de présélection de46,70%.
Par rapport aux agneauxjumeaux, le poids au sevrage
desagneauxissus de naissances simples estde25%plus
élevé(tableau2).Sur un total de 176futurs béliers en
phase de sélection, 5625% ont été retenus comme
géniteursà l'âgede 12mois. Parmiceux-ci,2443% ont
pu être sélectionnés comme béliers de 1ère catégorie
avec un PAT moyen compris entre 3206t1,76 et
33,1+2,14 kg. Par ailleurs, 31,81% ont été retenus
comme béliers de2ème catégorie avecun PATmoyen
compris entre269t1,30et28,32 E0.89kg. Letaux de
sélection enregistré en bout de chaîne où 14,18% des
animaux ont été retenus comme béliers améliorateurs
peut être considéré comme relativement sévère, le
niveau de performance des FOA ne justifiant pas une
telle pressionde sélection.
Le PNSO, dans son bilan d'activités de sélection
de 1984à 1988,indique que lespoids moyensà l'âge de
12mois est de37kgpour les béliers de 1ère catégorie
et de31 kgpour ceux de 2ème catégorie. Lestaux de
sélection ont fluctué au cours de cette même période
entre48et73%desagneauxprésélectionnés.Ce niveau
élevé des résultats du PNSO serait lié au système
d'alimentation intensifpratiqué au cours de l'élevage
des animaux pour la sélection (apport de ration
composée d'un concentréconstituéde 30% detourteau
de coton etde70% de son de blé-defoin depanicum
T58et de sels minéraux).Un tel systèmesetraduirapar
des coûts deproduction plusimportants.
L'analyse préliminaire des 8 cycles de repro
duction de 1993 donne les principaux paramètres
zootechniquessuivants :
tauxdeprolificité : 14409%;
taux de fécondité : 125,06%;
taux de mortalité avantsevrage :8,6%;
• taux de mortalitéaprès sevrage : 1,30%;
taux de mortalité des brebis : 1,23%.
Pour ces mêmes agnelages, les poids moyensà la
naissancedes 1312agneauxproduitsenfonctiondusexe
et du type de naissance sont lessuivants :
mâles : simples (n=276) = 222+0,43kg
doubles(n=404) 1,75 +0,35kg
femelles: simples(n=245) 205+0,37kg
doubles(n=396) = 1,71 +0.32kg
Sélection et trypanotolérance
Il convient de signaler que dans le domaine de
l'étude des relations entre l'amélioration de la
croissance et l'évaluation de la résistance (trypano
tolérance), uneenquêteprotozoologique avec mesuredu
tauxd'hématocrite,a étéréalisée avec l'appuidu Projet
de lutte contre latrypanosomiaseanimale auTogo,chez
113 béliers sélectionnés du CAT-K âgés d'environ 2
ans. Les résultats préliminaires donnent un taux de
prévalence de 49,55% avec 1946% de cas patho
logiques(hématocriteinférieurà25). Ilfautsignalerque
des cas d'oedème testiculaire et d'orchites ont été
enregistrés chezdesbélierstrypanosomés, lesquels ont
réagi très favorablement à un traitement trypanocide
avecdu di-acéturate de diminazène (TrypanND).
Contributionà l'élaboration d'un standard
pour la race ovine Djallonké auTogo
Dans ce cadre etpourune meilleure exploitation
des béliers sélectionnés du CAT-K, un catalogue des
béliers reproducteurs a étécréé. Ce catalogue présente
l'état civil de l'animal,sa vitesse de croissance (GMQ
auxdifférentsâgestypes),sarobeetsahauteuraugarrot.
Etude de l'impact d'unprogramme de
sélectionà noyau ouvertsur lesparamètres
deproductivitédestroupeauxencadrés
Jusqu'àprésent, la sélection s'opère dans le noyau
duCAT-K. La diffusionduprogrèsgénétique aconsisté
en lavente desbéliers de2ème et3ème catégories aux
fermes ovines améliorées(80béliersvendus en 1993et
mi 1994). Laphase de prêt de béliers de 1ère catégorie
auxmeilleurspaysans-éleveurs des FOAn'apasencore
démarré. L'enquête visant à cibler cette catégorie de
paysans-éleveurssusceptibles de rentrer dans labase de
sélectionpermettraàcourtterme de mettre en oeuvre les
actions devant conduire à la mise à exécution d'un
programmede sélectionà noyau ouvert.Lamajoritédes
élevages enquêtés ne satisfontplus le niveau technique
requis pour une ferme ovine améliorée (élevage
Small RuminantResearch NetworkWorkshop 75

Tableau
1:Paramètres
zootechniques
ettaux
de
présélection
des
agneaux
mâles
Troupeau
de
brebis
No
.1 No
.2 No
. 3 No
.4 No
.5
Paramètre
A1A2
A3
A1A2
A3
A1A2
A3
A1A2
A3
A1A2
A3
Prolificité
152
.3813458
145
,2515620
156
, 1915483
131
,65
14558
145
,18
112
.50
1370
14427
148
,55
Fécondité
13008
119
.3312437
14737
13897
12894
1220
125
.31130
66
99
.359856
12400
12576
Mortalité
des
agneaux
aVant
sevrage
%13
.24848
16
:374.32
2737
1678
12
.06
23
:214,2121
.337.69872
25
.84
Poids
moyen
àla
naissance
(mâles
et
femelles
)(kg
)1 .85
1.87
1,62
1.99
1, 67
1.88
1.93
1 ,672,122.00
1.90
1,76
1,66
Taux
de
présélection
des
52
.63
51
.3848
,86
3793
500
3589
43
.3345
.76
52
.385070
agneaux
mâles
à
l'âge
de3mois
%
A1
:Agnelle
No
.1
*En
phase
de
présélection

S
Tableau2:Poidsàâgetypeausevrageenfonctiondutypedenaissanceetsexe
Troupeauxdebrebis
No.1No.2No.3No.4No.5
Typedenaissanceetsexe
A1A2A1A2A1A2A1A2A1A2
Mâles:
•Simples2006*12,13-2.3810.69+307793-204S-D*11.54+1.939.62+2:541622-E29810.06
•Doubles16.08838-2256,611E1.962004--42110.06E1.99744-1.80574-E1,3415,49+4,22750
Coefficientdecorrection1,251.261.271,201271,151.291.361.291,41
Femelles:
•Simples11,16+1,51761+1,706,41+1,64S4D*7.12+1.67682+1,7316.09+3.33898E1.96 •Doubles1767-3,15908+1,70556-1,39529-E1,671599-424903-1.52541E1,64597+1,381471+1,746.86E1,66
Coefficientdecorrection-1,231.371,211,161,221,321,141.321,31
*âgetype=120joursâgetype=90jours
S--D=agneauxsimplesetdoubles

Bonfoh et al
semi-intensif). Les problèmes rencontrés peuvent se
résumercomme suit:
insuffisance voire absence de complémentations
alimentaire et minérale;
manque d'équipements zootechniques (man
geoires, abreuvoirs)dans les bergeries;
• faibles effectifs de reproductrices(<50);
fréquence desvols d'animaux;et
affichagede mauvaisrésultatszootechniques (taux
de mortalitédesjeunes>25%).
14 paysans-éleveurs de la Région des savanes
possédant634brebis, 10paysans-éleveurs de la Région
centrale possédant 514 brebis et 3 de la Région de la
Kara avec 103 brebis soit un total de 27 paysans
éleveurs ontétéprésélectionnés et serontsoumisàune
2èmephase d'enquête afin d'arrêter la liste définitive
desFOAde la base de sélection.
Les objectifs de cette 2ème phase d'enquête sont
lessuivants :
• revoir la situation sanitaire des troupeaux etjuger
de la capacité de l'éleveurà mettre en oeuvre le
programme de prophylaxie et de complé
mentations alimentaire etminérale;
• évaluer les possibilités de pâturage et d'abreu
vement des animaux; et
• obtenir l'avis définitif du paysan-éleveur sur sa
participation aux contrôles de performance en
ferme et sur les modalités de cession des agneaux
présélectionnésauCAT-K.
Conclusion
L'amélioration génétique du format du mouton
Djallonképar la sélection des béliers peut donner de
bons résultats dans le processus d'amélioration de la
productivité des troupeaux encadrés. Les critères de
présélection (poidsvifausevrageà l'âge de90jours)et
de sélection (poidsà l'âge adulte de 12 mois) sont très
pertinents. Le calcul dupoids moyen à âge type et son
ajustement à l'aide des facteurs de correction tenant
compte du type de naissance ontpu être réalisés. Les
actions d'améliorationgénétiqueontétéessentiellement
mises en oeuvre en station.
Untotalde698agneaux ontétésoumisen 1993au
contrôle desperformancesdecroissance;46,70%ontété
présélectionnéscommefuturs béliers et 14,18% retenus
comme béliers améliorateurs. Lespoids moyens de ces
béliersà l'âge de 12 mois sont de 33,1 +2,14 kgpour
les béliersde 1ère catégorie et28,32E089kgpourceux
de 2ème catégorie. La prise en compte de la 3ème
catégorie de sélection conformément à ce qui a été
proposé dans le programme d'optimisation de la
sélection ovine auCAT-K esttoutà fait justifiée. La
mise enoeuvreduprogrammed'améliorationgénétique
en milieu villageois au sein des élevages traditionnels
d'ovins en voie d'amélioration bute sur certains
obstacles, notamment:
• le fait que les troupeauxindividuelssont depetite
taille;
la maîtrise insuffisante de l'alimentation
(gardiennage dutroupeau aupâturage);
la fréquence desvols d'animaux; et
• l'application incorrecte du programme de
prophylaxie en vigueur.
Dans le cadrede lacréation de la base de sélection,
il importe donc de mettre enplace des mesurestant sur
le plan durééquipementdesbergeries en mangeoires et
en abreuvoirs que sur l'approvisionnement en intrants
d'élevage.
Bibliographie
Bonneau L, Bonfoh B et Matchame G. 1990. Rapport
d'activité du volet Fermes Ovines Améliorées. Projet
national Petits ruminants, Atakpamé, 4ème trimestre
1990,22p+ annexes,Togo.
Bonfoh B. 1993. Rapport de mission au L.C.P.A. de
Bingerville et au PNSO. de Bouaké(Côte d'Ivoire),
Atakpamé, PNPE-CAT-K1993,30p+annexes.
Bonfoh B. 1994. Centre d'appui technique de Kolokopé
Rapport annuel 1993 Atakpamé, Togo. Programme
national petit élevage 199425p+Annexe.
Tableau3:Poids des béliers sélectionnés à l'âge de 12 mois.Troupeau d'origine.
Béliers sélectionnés
Troupeaud'origine 1èrecatégorie 2èmecatégorie Tauxde sélection (%)
Nombre Poids(kg) Nombre Poids(kg)
1 14 32,17 + 1,42 10 28,12+ 1,62 80.0
2 4 33,1 + 2,14 9 2771+ 1,27 30,23
3 13 32.38+ 1,92 12 28.28E 1,71 80,64
4 32,33+ 2.05 8 28,32+0,89 28,20
5 9 3206+11,76 17 269+ 1,30 7878
Taux de sélection 24,43% 31,81% 5625
78Small Ruminant Research NetworkWorkshop

Performances des ovins males Djallonké
PNPE. 1994. Direction du Programme national de petit
élevage: Rapport bilan des activités du PNPE,
Atakpamé. PNPE Février 1994; 57p, Togo.
lEMVT-CIRAD. 1990. Amélioration génétique du cheptel: 1a
selection du mouton Djallonké en Cote d’lvoire. Fiche
technique d'élevage tropical No. 2. Ministere de la
cooperation, mars 1990. Cote d’lvoire.
Roulleau F et Bonfoh B. 1988. Situation du volet "Fermes
contractuelles"; Bilan des résultats. Atakpamé, Projet
Petits ruminants, 1988, 23p.
Traoré A. 1991. Le Programme de selection ovine au Centre
d’appui technique de Kolokopé, Togo.
Traoré A. 1992. L’informatisation de la gestion des troupeaux
au CAT-Kolokopé. Atakpamé, Togo. 13p.
Traoré A et Bonfoh B. 1993. Optimisation du programme de
selection chez les ovins au Centre d’appui technique de
Kolokopé. Document technique No. 2/93, 21p,
Atakpamé, Togo.
Performance monitoring and selection of males in West African
Dwaf sheep and inception of a flock-book
Abstract
A Djallonké ram selection programme based on a
CAT-K selection nucleus comprising 750 ewes and 100
rams from 10 families or lines is presented. This nucleus
should integrate the best improved sheep farms of mixed
farmers to become a selection base. The selection
scheme comprises a preselection phase based on
"weaning weight" adjusted by a 90-day standard weight.
This is in turn adjusted by the birth type using a
correction coefficient. This coefficient is the ratio
between the weight at average standard age of the
reference class, i.e. single lambs born from multiparous
mothers, and the weight at average standard age of the
class of twin lambs. The second phase of selection took
place at 12 months of age and was based on the threshold
weights (W>30, W>25 and W>2O kg) used to divide
selected rams into lst, 2nd and 3rd categories. Animals
infected with trypanosomes with reduced PCV (<20)
were excluded from the selection. A survey aimed at
identifying the best improved sheep farms, especially
those using the general livestock improvement
programme being recommended, was carried out in
order to guarantee the survival of both the borrowed
rams and their offspring.
Small Ruminant Research Network Workshop 79


SESSION 2
Production Systems, Policy and
Economics


Some constraintsto Small ruminantproduction
amongsmall-scalefarmersin LaikipiaWest
MM Mucuthi" andK. Munei*
I. Laikipia Research Programme
Ministry ofAgriculture, Livestock andMarketing
Nanyuki, Kenya
2. Department ofAgricultural Economics
University ofNairobi, Kenya
Abstract
Asampleof65small-scalefarmswasselectedfromtwo
ofthesubdividedranchesin the arid and semi-arid lands
ofwest Laikipia. The objective of the study was to
determine among otherthings, some ofthe constraints
tosmallruminantproductioninthestudyarea.Thestudy
reveals that the major constraints to small ruminant
production were diseases (mainly pneumonia and
helminthiasis) and shortage of water for livestock.
Insufficientgrazingwas not seenbythe respondents as
a constraint although observations showed that the area
was overgrazed, especiallythe unoccupiedfarms.
Introduction
Itis estimatedthat82%ofthepopulationin Kenya lives
inthe rural areas. In Laikipiathisestimate isevenhigher,
at91%(GOK1991).Most ofthe peopleare small-scale
farmers living on former European ranches many of
whichhave beensubdividedinto small-scalefarms.The
farm sizes rangefrom one to 10hectareswhich makes
small-scalefarminginthe district significant. However,
many ofthe ranchesfromwhichthese farms are carved
were used for extensive livestock production and are
thus not suitablefor rain-fed agriculture.
Small-scalefarmersinthe arid andsemi-aridlands
(ASAL)face manychallengesin generatinghousehold
incomes.Onewayofhelpingthemincreasethisincome
is through promotion ofsmall ruminantproduction. It
has been reported that in this area, small ruminant
productionprovidesclosetoone-thirdofthesmall-scale
farmers' net farm incomes (Mucuthi et al 1992).
However,there are constraints that hinder maximising
returns or minimising costs in their production.
Therefore, the objective ofthe study was to identify
some ofthese constraints tosmall ruminantproduction
in the study area.
Materialsand methods
In 1990therewere28formerEuropean ranches andfive
government settlement schemes in LaikipiaWestthat
were invarious stages ofsettlement and/or subdivision.
Subdivisionwas completedin eight ofthe ranches and
maps were available. Two of these ranches were
selectedforthis study. Each ranchwassubdividedinto
four equal subclusters and the farthesttwo subclusters
to each other, i.e. one subcluster from each ranchwas
chosen asthe startingpoint.Thefarmsorsamplingunits
were not sampled randomlywithin the subclusters but
systematically from a randomly selected corner ofthe
subcluster.
Using this method, 65 respondents who were
defined as small-scale farmerswere interviewed.They
represented 9% ofthe potential respondents in each
ranch. Herd size (50 small ruminants and 10 cattle)
instead of land size was used to classify small-scale
farms,though recognisingthat land size isthe standard
measure of farm classification. Herd size was used
because Kohler (1987a)found that in West Laikipia,
small-scale farmers owned no more than 50 small
ruminants and8head ofcattle.Noprior appointments
weremadeforinterviewvisits,buteffortswere made to
interview the husband orthe wife, orin default, the de
facto head of the farm. Otherwise, the enumerator
movedtothe nextfarm. Each respondent interviewed
was askedgeneral questions relatingtosmall ruminant
productionandspecificquestionsonconstraintstosmall
ruminantproduction.
Results and discussion
The respondents identified mortality through disease,
shortage ofwaterfor livestock,stock theft, difficultyin
getting herders and lack ofenoughgrazing asthe main
constraints to small ruminant production. Mortality
through disease (53%) and lack of enough water for
livestock (21%),werethe most significantconstraintsto
small ruminantproduction. Otherstudies alsoindicate
thatdiseases are amongthe mostsignificant constraints
to small ruminantproduction in this area (GOK 1990;
Herren 1990).
The mortality rates recordedfrom this studywere
12% and27% for mature andyoungsmall ruminants,
respectively.These rates are lowerthan those reported
in other studies done in the same area (Kohler 1987a;
Kohler 1987b; Herren 1990).The lower rates noted in
thisstudymaybe associatedwith the factthat the data
werebased on eventsrecalledbythe respondents, rather
than recordedinformation.
Small RuminantResearch NetworkWorkshop83

MuCuthiand Munei
Since the respondentsgave accounts ofdeathsthat
may have occurred in the previous 12 months,itwas
possible forthem notto recallsome ofthe death events,
especiallyifthere were many orveryfew deaths and
early in the year. It is also worth noting that the
proportion of respondentsthat reported nodeathswas
quite high for both mature (24%) and young (50%)
stock. It is also common knowledge that sick animals
are,in some cases,slaughteredbefore they die andthe
meat consumed or sold and thus not reportedas a death
eVent.
Ofthe known causes of mortality (Table 1), the
pneumonia complex including contagious caprine
pleuropneumonia (CCPP)wasthe main cause ofsmall
ruminant mortality, especially among mature stock.
Helminthsanddiarrhoeawere otherimportantcauses of
mortality,withyoungstockbeingthe most susceptible
to them. Earlier studies in the area made similar
observations (Herren 1990). Kimaru (1993) notedthat
helminths can be predisposing factors to deaths from
pneumonia. It ispossible,therefore,thatthe high death
rates resulting from pneumonia may have been partly
causedbyhelminth infection, particularlyin theyoung
stock.
Table 1. Main causes of mortality in small ruminants as
reportedby respondents.
Mature stock Youngstock
Cause Frequency(%) Frequency(%)
Pneumonia complex 27 69.0 10 40
Helminths 3 8.0 5 20
Malnutrition 1 2 5 - -
Diarrhoea 1 2.5 7 28
Unspecifiedcauses 7 18.0 3 12
Total 39 100.0 25 100
Inputcost analysis ofavailable datashowsthatthe
respondentsspent overhalfoftheir totalinputcostsfor
small ruminantproduction on anthelmintics (Table 2).
This is not commensurate with the level of mortality
attributed to helminths (Table 1). The reasons for the
observed disparity may be attributed tothe following
observation. Only 37% ofthe respondents who used
anthelmintics administer them in accordance with the
manufacturers' recommendations. Ofthe others, 30%
under-dosed, thus makingthe drugsineffectiveand33%
over-dosed,thusincurringunnecessary expenses.
Table2. The mean cost of inputs used in small ruminant
production.
Input costsperhead(KS)
Total
Type ofinput Mean Range inputs(%)
Anthelminths 1 1 30 0-38.00 62
Treatmentdrugs 500 0-40.00 28
Minerals 1.80 0-6.50 10
All Inputs 18.10 0-64.90 1(00
KS=Kenya shillings.
In an environment such as the ASAL the
identification of water shortage as a second major
constraintto livestockproductionwas not unexpected.
The area has nopermanent rivers, except for a small
springinMukuru,whichitselfdoes notprovide enough
water to meet the demands for both livestock and
humans. In addition,the dams are not centrally located
norwerethey enoughtocaterforthewhole area.Onthe
average the livestock travelled a distance of7 and 10
kilometrestowateratSalamaandMukuru, respectively.
Furthermore,the damswere notwell managedas
livestockwerewatered at the samepointsthat humans
drew water for drinking. Due to this interference by
livestock,which also caused erosion aroundthe dams,
the dams silted. Therefore, to alleviate the water
shortage problem, it is necessary to improve dam
management, de-silt the existing dams, and construct
I16W OI16S.
Insufficient grazing was not seen by the
respondents as a major constraint to small ruminant
production. It was only rated third in significance.
However, stocking rate calculated usingfield data for
respondents with less than 50head ofsmall ruminants
and lessthan 10head ofcattlegave a different picture.
The sampled respondents had a total of 1496
tropicallivestockunits(TLUs)comprising835TLUsof
cattle and 661 TLUs of small ruminants. The area
available for grazing was calculated as 4217 ha
including2175 ha in the unsettled land, and 2042 ha
settled but uncultivated land (Table 3). This gives a
stocking rate of2.8haperTLU,whichwas lessthan the
recommendedstockingraterangeof3-5haperTLUfor
this area (Jaetzold and Schmidt 1982). When the
stocking ratewas calculatedusing onlythegrazingland
available in the settled land,the resultswere even more
dramatic with the stocking rate droppingto 1.4 ha per
TLU.
Table3. Estimates ofgrazing land available, its carrying
capacity and its use in the study area.
Type ofland anduse Hectares
(1)Total land available 55780
(2)Settled area,61% of(1) 34030
(3)Grazingin settled, land60% of(2) 2042.0
(4)Grazingin unoccupied land,39% of(1) 21750
(5)Totalgrazingland (3)+(4) 42170
(6)Stockingrate:
• allavailable grazing(5)/totalTLU 2.8
• in settledfarms only(3)/totalTLU 1.4
(7) Recommended carryingcapacity 3-5
Insufficientgrazingwas apparentwhen the grass
cover in the occupied and unoccupied farms was
compared. Grass coverwas determined bythe amount
of bare soil observed. We estimated less than 10%,
84 SmallRuminantResearch NetworkWorkshop
Small ruminantproduction in LaikipiaWest, Kenya
10-30% and30-50% bare soilforgood,medium,and
badgrass cover, respectively.Usingthis estimate, itwas
found that 59% ofthe occupied farms hadgood grass
cover, and only 11% had poor grass cover. The
unoccupiedfarmshadmediumsoil cover orworse.The
observation indicates that,there will soonbevery little
grass available in the unoccupied farms. Therefore,
sufficientgrazingforthesefarmerswasonlyanillusion.
An alternative source offeedto supplementgrazing is
necessary.
Itwas observedthat only27% ofthe respondents
gave anyformofsupplementaryfeedtosmall ruminants
because there was still grazing available in the
unoccupiedfarms. However,there is needtoimprove
the amountoffeed available.This canbe done byeither
of three possible ways, namely, improving the
productivity of the available grazing, destocking, or
upgradingwithbettersmallruminantbreeds like Dorper
crosses. This latter may encourage reduction in stock
numbers.
Since lack of enough grazing, at least for small
ruminants, was not seen as a significant constraint to
production, it will be difficult to convince the
respondentstoplant large areas oflandwith fodder for
small ruminants, especially where the fodder will
compete with food crop production and for labour.
Nonetheless, a start should be to encourage farmers to
use crop residues and improve the storage quality of
available crop residues, for instance maize stover,
throughpreservation.Plantingfoddertrees like leucaena
and sesbania alongthe fences and on terraceswill also
increase the amount offeed available.
Conclusions
1. The main constraints to small ruminantproduction
arepneumonia,CCPP,andhelminths. Hence,animal
diseases are a limiting factor for small ruminant
production.
2. Small-scale farmers are not conversant with the
administration of anthelmintic drugs. This caused
increased costs ofinputs and is likelytoprecipitate
helminths resistance tothe drugs.
3.Though small-scale farmers do not consider
insufficientgrazing a significant constraint,there is
evidence ofovergrazingin the study area especially
in the unoccupied farms.Additionally, grazingwill
be a majorconstraintwhenthe unoccupiedplots are
occupied.
Recommendations
1. Farmersshouldbetrained tofollowguidelinesforthe
use of the anthelmitics or other drugs; the
recommendeduse ofthe various anthelmintic drugs
for different zones, as is the case with acaricides,
should be studied. This zoning will help the
small-scale farmersto remember drug dosage rates
and it will also reduce the likelihood of the
development of resistance to these drugs by
helminths.
2. The number ofdams needto be increased and dam
managementimproved.
3. Action should be taken to correct the problem of
overgrazing.
4. To expandthe feedbase fortheir livestock, farmers
must be encouraged to feed crop residues to the
livestock.They should also be trained to preserve
these residues for strategic interventions during
drought or long dryspells.
References
GOK (Government of Kenya). 1990. Kenya Government,
Rumuruti Division Annual Reports. Divisional
VeterinaryOffice, Rumuruti, Laikipia District, Kenya.
GOK (Government of Kenya). 1991. Kenya Government,
Economic Survey 1991. Ministry of Planning and
NationalDevelopment, Nairobi, Kenya.
Herren U.J. 1990. Socioeconomic Stratification and Small
Stock Production in Mukogodo Division Kenya.
Research in EconomicAnthropology 12: 111-148
Jaetzold R. and Schmidt H. 1982. Farm Management
Handbook of Kenya. Volume II/B. Ministry of
Agriculture and German Agricultural Team, Nairobi,
Kenya.
Kohler T. 1987a. West Laikipia: Report on Small Scale
Farming andHow itCould be Assisted inDevelopment.
LaikipiaReports8.University ofBern, Switzerland,and
Laikipia Research Programme,Nanyuki,Kenya.
Kohler T. 1987b. Land Use in Transition: Aspects and
Problems of Small Scale Farming in a New
Environment: The Example of Laikipia District.
Geographical Bernensia Volume A 5. University of
Bern,Switzerland.
Mucuthi M.M., Munei K. and Sharma K. 1992. The
Contribution of Small Ruminant Production to
HouseholdIncomesforSmallScale Farmersin Laikipia
West (an ASAL) Laikipia MT. Kenya Papers D-6.
University ofBern,Switzerland/University ofNairobi,
Kenya and Laikipia Research Programme, Nanyuki,
Kenya.
Small RuminantResearch NetworkWorkshop 85

MuCuthiand Munei
Etudede quelques obstaclesà la production despetits ruminants
chez lespetits éleveurs de Laikipia-Ouest
Résumé
Cette étude a été réalisée surun échantillon de 65
petites exploitations agricoles dedeuxranchs desterres
arides et semi-aridesde l'Ouest Laikipia. Elle avaitpour
objectif de déterminer, entre autres, certains des
obstacles à l'élevage des petits ruminants dans la
région. Il ressort des résultats enregistrés que les
maladies,notamment lapneumonie et leshelminthioses
et le manque d'eau pour l'abreuvement des animaux
constituaient les principales contraintes au déve
loppement de l'élevage despetits ruminants dans cette
région. Les personnesinterrogées ne considéraientpas
le manque depâturage commeun obstacle même si les
observations effectuées ont révéléque lesterres étaient
surpâturées, notamment leszonesinoccupées.
86SmallRuminant Research NetworkWorkshop

Sheep rearingundertree crop plantation
inGhana'sforestzone: Problemsandprospects
FK. Fianu, P.C.Addae andL.Adjorlolo
DepartmentofAnimalScience, University ofGhana, Legon
Abstract
Astudywas conductedtoidentifythepotential of,and
constraintstointegratingsheepinto treecropplantations
inGhana.Ninefarmerswhopractisedthesystemwholly
(Group 1) or partly (Group 2), and five other sheep
owners who were not practising it (Group 3), were
interviewed and their husbandry practices observed.
Management standards were poor among all groups.
Diarrhoea,foot rot and skin conditions were common.
Fertility and prolificacy varied within flocks. Within
groups, prolificacy reflected breed composition: the
Djallonké and Ouda being more prolificthan Nungua
Blackhead derivatives. Constraints to adopting
integrated sheep-tree crop plantation production
includedtheft ofanimalswhilegrazing,cropdamageby
straying animals, remoteness of plantations, lack of
capital, high cost of breeding stock and absentee
ownership. Suggestions are made for enhancing the
adoption ofthetechnology.
Introduction
Cover crops are planted undertree cropplantations to
control soil erosion,improve soil fertility and smother
weeds.These covers,however,growrapidlytendingto
choke the tree crops, and have to be kept in check
through expensive labour use.On the other hand,they
can be converted into meat (Hodges 1983; Devendra
1991). Manurefromthe livestockalso cutsthe fertiliser
bill. Besides,the technology diversifies farm produce
thus reducing risk andintensifying landuse.
Stock rearing under tree crops therefore affords
Ghana, and indeed the West African subregion, an
opportunity to expand the sheep industry in the forest
zonewithoutalteringthefarmer's main activityofcrop
production.Citrus and oil palm rank after cocoa asthe
Table 1. Summary ofmeterological data atAsuansi and Kade.
main cash crops in the forest zone of Ghana. Most
households keepsomesheepandthere is a longhistory
of integrating sheep into tree crops on agricultural
stations.
Followingare afewexamples ofsheepintegration
intotree cropplantations at agricultural station levelin
differentregions ofGhana.
Wilson and Lansbury (1958) cited the 1938
investigations into the nutritive quality of leguminous
cover crops under tree crops in the Central Region.
These authors also reported on sheep grazing under
citrus plantations at Asuansi and Mankessim
Agricultural Stations. Data on weather conditions and
herbage quality duringthat study are given in Tables 1
and2, respectively.Green herbageyield averaged208
t/haperyear.Stockingratewasabout13.6sheep/ha, and
in the 11 months liveweight gain aggregated to907
kg/hain Djallonkésheep.
At the University of Ghana's Agricultural
Research Station (ARS) in Okumaning-Kade in the
Eastern Region, oil palm, citrus, cola, mango and
avocado plantations were established for agronomic
studiesin the late 1950s.Sheepwereintroducedin 1972
totake advantage ofthe lush cover crops. Centrosema
and Pueraria constitute the main diet ofthe animals in
these plantations. However, a wide range ofvolunteer
forbs and grasses, e.g. Panicum maximum, are also
selected as cultivated leguminous cover crops diminish
with heavy grazing. Table 2 gives the chemical
composition ofthe top three forages atthe ARS.The
high quality ofthese forages is apparent, although the
CaPratio ofthe legumes isslightly high.Onaccountof
dwindling herbage biomass due tothe dense overhead
canopy of many old plantations, the stocking rate
dropped from 11-18 sheep/ha in 1972 to 3 sheep/ha
Jan Feb Mar Apr May Jun Jul Aug Sep Oct Nov Dec Total(Mean)
Asuansi
Temp('C) 25 26 26 27 25 24 23 23 24 25 25 25 (25)
Rain(mm) 25 31 170 160 185 276 60 40 82 216 115 68 1458
Okumaning-Kade
Temp('C) 26 27 27 27 26 25 24 24 25 26 26 26 (26)
Rain(mm) 43 59 147 165 188 298 186 99 132 188 152 64 1720
Rainy days 4 4 13 14 16 20 18 14 16 19 15 7 160
Sources:Asuansidata adaptedfromWilson andLansbury(1958)and Kade data adaptedfromARSfiles.
Small RuminantResearch NetworkWorkshop 87

Fianu etal
Table2. Chemical composition ofsome grazed cover crops atAsuansi and Kade.
Asuansi* Kade**
Centrosema Centrosema Pueraria P. maximum
Drymatter (%) 25.4 16,7 21.5 21.9
As% ofdrymatter (DM)
Digestibility(Dig) 53.5 - - -
Crudeprotein (CP) 20 22.1 200 14.8
DigestibleCP 3.2 - - -
Crude fibre 30 - - -
Ash 6.2 - - -
Neutral-detergent fibre(NDF) - 607 69.8 74.8
Hemicellulose - 60.1 22.5 31.3
Cellulose - 30,8 33.1 369
Lignin - 13.2 13.5 369
Phosphorus(P) 0.21 0.21 0,20 0.19
Calcium(Ca) 1.35 0.51 0,45 0.28
Magnesium(Mg) 0.23 0.15 0.16
Potassium(K) 1.58 2.00 227 2.80
PPMofDM
Zinc(Zn) - 26.0 29.3 200
Copper(Cu) - 11.3 11.3 2.0
Manganese (Mn) - 360 320 187
* Source:Wilson and Lansbury(1958).
* Source: FianuandAdjorlolo(unpublished).
today. The breeds are mainly Djallonké and Nungua Results
Blackhead derivatives. Flockperformance in 1990-92
was as follows: average birth weight, 2.3E0.17 kg;
preweaningliveweightgain,80.5t34kg;post-weaning
gain,27g/d;yearlingweight,20-30kg;fertility,932%
of ewes exposed; fecundity, 130% of ewes exposed;
lamb crop,944% oflambsborn;lamb mortality,56%
oflambs born alive.
As part ofthe UNDP-Ghana GovernmentSheep
and Goat Development programme, Djallonké sheep
were introducedintoapalm plantation atJuaso,in the
AshantiRegion,from1978to1992. Here again, animals
weighed 16 kg at six months compared with eight
months elsewhere (Oppong-Anane 1981)
Notwithstanding the demonstrated potential of
integratingsheepproductionintotree cropsbythework
atthesestations, fewfarmersinGhanahaveadoptedthis
technology.The objective ofthisstudywasthereforeto
find outwhythistechnologyis notwidely adopted and
tosuggestwaystofacilitate itswide adoption.
Methodology
With the help of agricultural veterinary officers and
some farmers, nine sheep flocks integrated into
plantation tree crops were identified.Thefarmerswere
interviewed with a questionnaire as a guide. Each
plantation was visited several times to observe the
animals between September 1992 and January 1993
Three otherholdingswerestudied,whichwerenotusing
thetechnologybuthadsheepandplantations.
Profiles ofrespondents andtheirfarms
Five farmers(Group 1)were rearingsheep exclusively
undertheir oilpalmplantations. Four others (Group2)
used plantationsbut alsooccasionallygrazedtheirstock
onwastelandwhilethree(Group3)onlyusedwasteland
(Table 3). Nosheepwere being reared under citrus and
cocoaplantations. Becausegoatstendedtoroamfarther
afield causing more frequent crop damage than sheep,
only all-sheepflockswere selected for allgroups.The
sheep breeds encountered were 60% Djallonké,29%
Ouda and its crosses, 7% Nungua Blackhead X
Djallonké crosses and 4% Yankasa crosses. All the
NunguaBlackheadderivativeswerefoundinGroup1.
The ages ofthe 12farmers ranged from 33-74
years ofage.Theirformal education variedfrom nilto
tertiary.Theirplantations sizes rangedfrom 3to 16ha
and theirflock sizes ranged from 7to 58 head. Flock
sizes were, however, larger for groups 1 and2.Only
threeofthe 12farmerswere fulltimefarmers, the others
had additional occupations.
Animals aregrazedunderplantationsforanumber
ofreasons,namelytousethe copiousfeedresources and
keepdownweeds,to derive extraincome especiallyfor
meeting emergency expenses such as school fees,
hospital bills etc,and tofurnish meatforfestivities such
as Christmas and Easter celebrations. The flocks in
Group 1weremanagedbymenwhereasthoseingroups
2and3weretendedbywomen and children.
88SmallRuminantResearchNetworkWorkshop

Sheeprearing undertree cropplantationinGhana
Table3. General information on respondents.
Farmer no. Age(yrs) Sheep nos. Farm size (ha) Landtenure Formal education Otherjobs
Group 1
1 51 50 Family GCE-A CivilService
2 61 30 Abunu Elementary None
3 45 25 Family Technical Mechanic
4 60 58 Buy BSc Accounts
5 52 15 Wife Elementary Diamonds
Group2
6 74 14 Family Nil Tailor
7 47 21 Abunu Elementary None
8 62 18 Family Diploma Lumber
9 70 26 Family Elementary None
Group3
10 36 7 - Commercial Trader
11 33 19 - Elementary Trader
12 38 14 Family Ni1 Diamonds
Flockhousingandfeeding
Pensweregenerallyfencedwith planks oftimber and
roofed with thatch or salvaged aluminium sheets.The
floorswere earthen or concrete.Waterwasprovidedin
thepens adlibitum.
Forgroups 1 and2grazingwasfrom 1000to 1830
hours and stocking rates varied from 092 to 735
head/ha with an average of3.67 head/ha.Grazingwas
continuous asthepastureswere not subdivided. Flocks
in Group3wereallin Kadetownandbylawhadtobe
penned from 0900to 1600 hours and were released
thereafter to scavenge for food around town.
Supplementary feeding and feed supplements used
variedwithinandbetweengroups.Forexample,in Kade
(Table4),exceptfor one farmerinGroup 1, allfarmers
feed cassava andplantain peels as supplementstotheir
animals.Corngrain supplementationwas morepopular
among farmers who did not use their plantations for
grazingtheir animals.Thesefarmers did not, however,
supplysaltlickstotheiranimals asobservedforfarmers
in groups l and2.
Although only three farmers had planted
Centrosema and Pueraria, these plants were highly
frequentin all the plantations studied. Herbage species
grazedunderthepalmsincludedthe following:Aspilia
africana,Asystasiagangetica, Centrosemapubescens,
Euphorbia hirta, E. heterophylla, Panicum maximum,
P. laxum, Phyllanthus muellerianus and Pueraria
phaseoloides.
Breedingmanagement
The matingratiowas3to9ewesperram.Oneflockin
Group3hadnoramanddependedonother*scavenging'
flocksforramservice.Breedingwasyearroundbut76%
Table4. Feeding regime and reproductive performance ofsheep in Kade area.
Supplement Adult
Grazing Fertility Prolificacy Lamb Mortality
Farm no. hours PeelS* Corn Browse Salt (%) (%) (%) (%)
Group 1
1 6.5 - - - - - - 96.3 140 22.9 2.0
2 50 - - - - - - - 100 160 500 00
3 60 - - -- - 180 7.1 00 00
4 70 - - - - - -- 87.5 140 7 5 3.4
5 6.5 -- - - -- 88.9 150 33.3 6.7
Group2
6 50 - - - - - - - 83.3 18O 556 00
7 55 + - - - - - 81.8 170 13.3 00
8 4.5 - - - - - 100 160 40.0 00
9 -- - - - - 80 180 26,7 00
Group3
10 4.0 - - - - - - 100 150 00 0.0
11 4.0 - - - - - - 89.5 160 18.1 00
12 - - - - - - 100 160 250 0.0
*Peels ofplantain and cassava;+indicatessupplementused.
Small RuminantResearch NetworkWorkshop 89

Fianu et al
ofthe ewes lambed every eight months,20%twice a
year, and4% once ayear. Neonate lambswerepenned
for2to3weeks and allowedtograze only around the
pens. In fourfarms, lambs dropped inthe rainyseason
were provided with heat in the pen for the first two
weeks,byburningfirewood every night.
Health maintenance
FarmersinGroup3 never consulted a veterinarian but
thoseinGroup2calledthevetduringcrises, e.g. severe
diarrhoea while farmersinGroup 1 consultedtheARS
vet almost monthly. Common health problems were
helminthiasis, foot rot, skin disorders, inappetence,
coughs, fractures and cuts. Ethnoveterinary practices
were noted in allgroups,for example, sulphur drugs,
known as *M&B' were given with charcoal for
diarrhoea; foot rotwastreatedwith limejuice andskin
disorderswith sheabutter.Overallmeanlambmortality
(Table4)was significantly(P<005)higherinGroup2
(339%)thaningroups 1 (242%)and3(144%).Adult
mortality(0-67%)notedinGroup 1wasfrom injuries
inflicted byfarmerswhose crops hadbeen damagedby
the animals.
Reproductiveperformance
Fertility (number oflambing ewes as a percentage of
ewes exposedto the ram)was965%inGroup3,905%
in Group 1 and 863% in Group 2 (Table 4). The
differenceswere not significant(P>005). Lambsborn
as apercentage ofewes lambing(prolificacy) ranged
from 140-180%.Onaverage,theflocksinGroup2were
the mostprolific(173%)followedbythoseingroups3
(157%) and 1 (154%). Prolificacywas also highest in
flocks dominatedbyDjallonkés andOudasasthese are
inherently more prolific than the Nungua Blackhead.
Fertility and prolificacyvaried remarkablywith flocks
within groups.
Farmers'perceptions ofimpedimentsto
adoption
The following are the indicated constraints to the
adoption of integrated tree crop-sheep production
technologyamongsmallholderfarmers.Thepercentage
ofrespondents indicatingeach constraintisindicatedin
brackets :
Theft of animals bars absentee farmers from
integratingsheepintotheirpalms(92%).
Cropdamagebysheep(83%)leadingtotheirbeing
killed and to quarrelswith neighbours(53%)
Lack of creditto enable the farmertoputuppens
anda farmstead(75%).
Scarcity andhigh cost ofbreedingstock(75%).
Dearth of dedicated shepherds that tend the
animals(67%).
Remoteness ofplantationsfrom thetown made it
difficulttosell animals reared (42%).
Researchers'perceptions ofthe constraints
Technical know-how
The Ghanaian farmeris basically a cropproducer and
notalivestockhusbandman.Certainlythetechnology of
integratingsheepintotree cropsposes peculiartechnical
challenges that must be properly addressed through
strongextension support.
Lackofbusiness attitude towards livestock rearing
Fianu(1993)arguesthatthe mainhindrancetoadopting
livestockinnovation is the lack ofabusiness attitude to
livestockandthatthisis rootedinthe culture ofGhanian
farmers.Thus aplantation ownerwill regularly cart his
cropto distant marketsbut not his animals.
Credit is notanissueforresidingon the plantation
either, for mostfarmers normallytakeupresidencein a
makeshift shelter when they break new ground to
develop cropfarms.Theydonot seekcreditfor it.Only
a commitment to livestock rearing as a business will
motivatethe farmerto live on hisplantation on account
ofhis sheep.
Prospectivefarmers, landtenure and credit
Prospective farmerspresenta differentproblem. They
face both landtenure and credit constraintsin starting a
plantation. None ofthe palm farmers studied had any
problem with land acquisition because they were
membersofthe landowninggroupbybirth ormarriage,
orhadshare-croppingarrangementswiththe caretakers.
However,thetwofarmerswhohad50% share-cropping
arrangements(ABUNU)reportedfrequentqueriesfrom
various members of the royal family. Generally,
foreigners face serious barriers to land acquisition for
plantation tree crops or livestockrearing.Thosegaining
access to land through marriage also stand the risk of
eviction on the demise oftheirspouses.
Lack of capital is a further constraint for
prospective farmers. Most prospective farmers are
youths with the technical know-how but without
collateral.Yetitis such farmerswhocan readily break
through the cultural barriers to commercial stock
rearing.
Conclusions
Sheepintegration into plantation tree crops has agreat
potentialinGhana andWestAfricaingeneral.Thefull
realisation of this potential, however, demands a
comprehensive extension package to specifically
popularise animal rearing as a business. Then the
complementarity between tree crops and livestock can
be seenas an extrabonus totree cropping.Theprobable
major problems to be addressed by the package are
outlinedbelow.
Land tenure.State intervention by acquiring blocks of
landfor leasetoprospective farmers could help.
Credit. Recognition ofprofessional diplomas asforms
90 SmallRuminantResearch NetworkWorkshop

Sheep rearingundertree crop plantationinGhana
ofcollateralhas not alwaysworked.The loopholes can,
however,betightenedandco-operatives made conduits
for such credit which mustbe largelyin kind.
Cost ofinputs.The scarcity ofbreeding stock ispartly
because ownersare unwillingto sell,andpartlybecause
Government breeding farms cannot cope with the
demand. The answer lies in "outgrowers' selected to
multiplystocksfrombreedersfor saleto otherfarmers.
Further,the high cost ofveterinary drugs serves as a
challenge to develop traditional herbal remedies.
Ethnoveterinarypractices needtobe enhanced.
Diseases. A high rate of helminthiasis, foot rot,
coccidiosisandectoparasite infestationisfosteredbythe
humid conditions under the plantation canopy. Their
control should be central in the technologicalpackage
and manure shouldbe compostedbefore being applied
tothe crops,to checkthe recyclingofhelminths.
Canopy closure. This will drastically reduce feed
production after the 12th year of existence. Crop
residues could cometothe rescue here. It may also be
possible to reopen the canopy byjudicious pruning of
palmfronds orfellingofsomepalmtrees.Alternatively,
the trees may be widely spaced so as to avoid total
canopy closure. However,these need tobe researched
into,toworkoutthe economics ofaccepting crop losses
for lambincreases.
Overgrazing.Thiswillincrease erosion hazardthrough
soil compaction, and cause a population explosion of
Chromolaena adorata and other weeds. Crops like
citrus, maysuffer debarking.There willtherefore be a
needfor regular farm visits by technical personnel to
advise ongrazingpressure.
Damage to arable crops. This could be prevented by
fencing.Tocutdown costs, live fences couldbeplanted
usingthe tree crops.
Mixedspecies. Otherspecies ofanimalslike goats, cattle
andpoultry couldbetried. However, cattle could choke
to deathbyswallowingfallen citrus fruits, especiallyif
they are maturebut not ripe.
Record keeping.This shouldbe part ofthepackage so
as to avoid subsidisingthe animalsfrom crop sales or
viceversa.
Marketing animals. Regular and prompt marketing of
animalswhentheyreacheconomicmaturityisasine qua
non for any significant improvement in animal
production. Itcouldevenbe madea conditionforaccess
ofthepackagebyinterestedfarmers.
References
DevendraC. 1991. Potential integration of small ruminants
withtree croppingsystemsinAsiaandtheSouthPacific.
WorldAnimal Review 66:13-22
Fianu FK. 1993. Cultural barriers to adoption oflivestock
innovation in Ghana. In: Proceedings of the
Australia-Pacific Extension Conference held in Surfers
Paradise, Queensland.Volume 1.pp.275-278.
Hodges J. 1983. Integrating Crops and Livestock in West
Africa. FAOAnimal Production and Health Paper 104
FAO(FoodandAgriculture Organization ofthe United
Nations),Rome, Italy. 309pp.
Oppong-Anane K. 1981. Final Report: Government of
Ghana-UNDP Sheep and Goat Development
Programme. Paper GH 72-104. FAO (Food and
Agriculture Organization oftheUnitedNations),Rome,
Italy.
Wilson A.S.B. and Lansbury J.T. 1958. Centrosema
pubescensground coverandforage cropin cleared rain
forest in Ghana. Imperial Journal of Experimental
Agriculture26(108):351-364
L'élevage ovin sous arboriculture dans lazone forestière duGhana:
problèmes etperspectives
Résumé
Cette étude a été effectuée pour identifier les
possibilités d'intégration de l'élevage ovin à
l'arboriculture au Ghana ainsi que les obstacles
éventuelsà l'adoptionde cetteinnovation.Neufpaysans
quipratiquaient le système intégralement(groupe 1) et
partiellement (groupe 2) et cinq autres propriétaires de
moutons qui ne le pratiquaientpas (groupe 3) avaient
étaient interrogés et leurs modes d'élevage observés.
Les normes degestion utilisées étaient médiocres dans
tous les troisgroupes étudiés.Les diarrhées, le piétin et
les dermatoses étaientfréquentes. Lestauxdefertilité et
de prolificité étaient différents selon le groupe
considéré.Ausein desgroupes, la prolificitédépendait
de la race de l'animal, les Djallonké et les Ouda étant
plus prolifiques que lesindividusissus de Nungaàtête
noire. Les obstacles à l'adoption de l'intégration de
l'élevage ovinà l'arboriculture sont entre autres, levol
des moutons aupâturage, les dégats causés aux cultures
par les animaux égarés, l'éloignement des plantations
arboricoles, le manque de capitaux, le coût élevé des
reproducteurs et l'absentéisme des propriétaires. Des
suggestions ont été avancées pour promouvoir
l'adoption de cettetechnologie.
SmallRuminantResearchNetworkWorkshop 91


Systèmetraditionnel d'élevage caprin sur leplateau central
du Burkina Faso
H.Tamboura etD. Berté
INERA,BP7192,Ouagadougou(Burkina Faso)
Résumé
Soixante onze (71)troupeauxde petits ruminants
de quatre villages de la savane du plateau central du
Burkina Faso ont été suivis pendant deux ans pour
mieux caractériser le système traditionnel d'élevage
caprin. Les résultats obtenus montrent que le système
d'élevagepratiqué esttrès rudimentaire,avecdivagation
des chèvres en saison sèche et absence de
complémentation alimentaire en sus des pâturages
naturels, de soins sanitaires, et d'infrastructure
adéquate. 50,7% des troupeaux sont composés de
chèvres uniquement, contre 36,6% constitués de
moutons et de chèvres.33,8% ontplus de 10têtes de
caprins chacun, 29,5% ont entre cinq et 10 têtes, et
366% en ont moins de cinq. Entre 25 et 28% des
animauxpartroupeau sont des mâles,soitun ratio de l
mâlepour3femelles. Les animauxde 6à 18moissont
les plus nombreux, suivis de ceuxde 18à36mois. Le
poidsvifmoyenà3ans estde2069E0.67kg. LeGMQ
pendant les 120premiersjours est de 131,1g/j, contre
192g/jde0à3ans.
Introduction
Le système traditionnel demeure la pratique
dominante parmi les modes d'élevage des petits
ruminantsauBurkina Faso.Cela est encoreplusvraien
ce qui concerne l'espèce caprine locale,pratiquement
délaissée sans soins nutritionnels ou sanitaires, alors
qu'elle constitue le troupeau numériquement le plus
important et économiquement le plus exploitépar les
éleveurs et agro-pasteurs dupays. Laprésente étude a
été entreprise compte tenu du poids économique
(consommation ménagère, caisse de menues dépenses
domestiques.) et socio-culturel (rites coutumiers,
mariages, baptêmes.), ainsi que de la très large
répartition des caprins dansles exploitationspaysannes
duBurkinaFaso.Elleviseessentiellementàpromouvoir
une meilleure connaissance despratiques traditionnelles
utiliséessur le plateau central dupaysdans l'élevage et
l'exploitation des chèvres de race locale.
Méthodologie
L'enquête a couvert soixante onze(71)troupeaux
avecune fiche-questionnaire complétée par des pesées
mensuelles systématiques sur chaque animal recensé.
Les quatre (4)villages-sites de cette étude(Kamboinsé,
Pabré, Sogodin, Sakoula) sont situés sur le plateau
central du Burkina Faso, en zone subsahélienne, et
reçoivent annuellement entre 400à600mm de pluies.
Lestempératuresvarientde45'Censaisonsèchechaude
à8-10'C en saison froide et la végétation est de type
savane arbustive.
Résultats
Mode de conduite dutroupeau
Bien que les agro-pasteurs de la zone soient tous
sédentaires, la divagation reste une caractéristique
dominante pour les caprins. Elle est totale en saison
sèche,alorsqu'enhivernage, lesanimauxsontsurveillés
plus ou moins étroitement pour éviter les dégâts aux
cultures.
Lestypes d'élevages
L'étude de la répartition des espèces exploitées au
sein desélevagessuivis(tableau 1)révèle que507%des
troupeaux sont constitués exclusivement de caprins,
366% comprennent des ovins et des caprins,28% des
bovins et caprins,84% lestrois espèces,alors que seul
1,4% des troupeaux sont constitués exclusivement
d'ovins.
Infrastructuresd'élevages
66% des élevages enquêtés disposent d'une case
autoitdepaillecommeabripour l'ensemble des espèces
présentes.Ce local estsouventtrop étroitpour l'effectif
quiyloge,malaéréetsurtoutjamais balayé. Lefumier
s'entasse donc jusqu'à son ramassage au début de
l'hivernage pour lafumure des champs.
Alimentation etsoins desanté
La base de l'alimentation des animaux reste le
pâturage naturel, avec des herbacées, notamment
Loudetia togoensis, Andropogon gayanus, Cenchrus
sp.,et les ligneux.Seulsles moutonsde case, les vaches
laitières et lesbovinsàl'engrais reçoiventlesSPAI, les
fanes d'arachides et de niébé, et les tiges de sorgho
récolté. Les caprins n'en reçoivent pas. Deuxéleveurs
sur les 71 donnent la pierre à lécher artisanale à leur
animaux. Celle-ci est remplacée chez les autres par le
selgemme.
Small RuminantResearch NetworkWorkshop 93

Tamboura etBerté
Tableau 1:Types d'élevages pratiqués dans les quatre villages (Kamboinsé, Pabré, Sakoula et Sogodin)
Types d'élevages
Nombretotal Bovin+
de troupeaux Ovin+ Ovin+ Bovin+ ovin +
Villages enquêtés Bovin Ovin Caprin caprin bovin caprin caprin
Kamboinsé 13 0 0 6 4 0 - 3
Pabré 13 0 1 4 6 0 1 1
Sakoula 30 0 0 19 9 0 - 2
Sogodin 15 0 0 7 7 0 1 0
Total(%) 71 (100%) 0 1(1,4%) 36(507%) 26(366%) 0 2(28%) 6(85%)
En matièrede santé,4%des éleveurs enquêtés ont
eu recoursune fois auxdéparasitantsgastro-intestinaux
modernes. Aucun n'a jamais vacciné ni détiqué ses
chèvres.
Taille dutroupeau
La répartition des troupeaux selon les effectifs
caprinsparexploitation est présentée autableau2. Dans
les villages de Kamboinsé et Sakoula respectivement,
533% et43,3% des troupeaux ontplus de 10têtes de
chèvres, alors qu'à Pabré et Sogodin, respectivement,
538et60% destroupeaux ontmoins de cinq têtes.
Structure dutroupeau
Sex-ratio destroupeaux
Laproportion de mâlespartroupeau est de222%
à Kamboinsé,31,9%à Pabré,28%àSakoula et27,8%
à Sogodin. Dans l'ensemble de la zone étudiée, la
moyenne est de 27,5% de mâles par troupeau,
c'est-à-dire environ 250% mâles et 750% femelles
(tableau 3).
Pyramide desâges
Les figures 1A, 1B, 1C et 1D présentent les
histogrammes des effectifs caprins enfonction de l'âge
desanimauxpourchaquevillage. Lesanimauxde6à 18
mois sont lesplus nombreux,suivisde ceuxde 18à36
mois d'âge. Les animaux âgés (plus de 36 mois) sont
nettementmoins nombreux,surtoutchezles mâlesoùil
n'en existaitpratiquementpas.
Evolution pondérale des chèvres
Al'âge d'un mois, le cabripèse en moyenne 325
la courbe-type d'évolution pondérale de la chèvre
"Mossi" en élevage traditionnel selon le sexe. On
observe une légère supériorité(non significativeà5%)
desfemellesparrapportauxmâles.Letableau4présente
les gains moyensquotidiens(GMQ),quisontde572g/j
et73,8g/jrespectivementpour les mâles et lesfemelles
de0à4 mois.
Tableau2:Importance relative des troupeaux selon leur effectif caprin, par village
Effectif par troupeau
Villages Effectiftotal Moins de5têtes 5à 10 têtes Plus de 10têtes
Kamboinsé 13 3(23%) 3(23%) 7(54%)
Pabré 13 7(54%) 3(23%) 3(23%)
Sakoula 30 7(233%) 10(333%) 13 (433%)
Sogodin 15 9(60%) 5(333%) 1 (67%)
Total 71 26(36,6%) 21(296%) 24(338%)
Tableau3:Sex ratio ausein des élevages traditionnels de chèvres desvillages de Kamboinsé, Pabré,Sakoula etSogodin(Plateau
central duBurkinaFaso)
Sexe Kamboinsé Pabré Sakoula Sogodin Moyenne
Tauxde mâles 22,15 31,98 2800 27,80 27.50
Tauxdefemelles 8785 6802 72.00 7220 725
94 SmallRuminantResearch NetworkWorkshop

Elevage caprintraditionnel auBurkina Faso
Effectifs
| (têtes)
os mois 3-6mois e-te mois18-36 mois + de36mois
1-A Classes d'âge
A
7o
65-
eo
ss
so
45
4o
s5
so
25
2o
15
1o
5-
(têtes)Effectifs
0-3 mois 3-6mois 6-18mois18-36mois+ de 36mois
1-C Classes d'âge
[XX Mâles
Effectifs
(têtes)
0-3 mois 3-6 mois 6-18 mois 18-36mois+de 36mois
1-B Classes d'âge
(têtes)Effectifs
0-3mois3-6 mois 6-18mois18-36mols + de 36mois
1-D Classes d'âge
Femelles
Figure 1. Sex-ratioau niveaudes villages de: IA: Kamboinsé; IB: Pabré; 1C: Sakoula; ID:Sogodin.
Tableau 4:Gain moyen quotidien (GMQ en g/j) de caprins
Mossi en système d'élevage traditionnel(Plateau central du
BurkinaFaso)
Mâles et
Période Mâles Femelles Femelles
0-120j 572 738 131,1
0-180j 42,5 48,2 900
0-300j 41,8 40,1 81.9
0-360j 36,6 37.4 740
0-18 mois 29,6 29.3 589
0-2ans 237 25.2 97,8
0-3 ans - 19,2 19.2
Ce paramètre baisse à environ 29g/j pour la
période de 0à 18 mois.Compte tenu de l'absence de
mâles deplus de36 mois,on apu calculer leGMQpour
cette tranche d'âge. Dans les autres cas, les femelles
croissentgénéralementplusviteque lesmâlestandis que
leGMQbaisseaufuretàmesure que l'âge desanimaux
avance, quel que soit le sexe.
Discussion et conclusion
Le système d'élevage traditionnel des caprins du
plateau central duBurkinaFasopeutêtre classécomme
système agro-pastoral selon les catégorisations
SmallRuminantResearch NetworkWorkshop 95

Tamboura etBerté
Poids (kg)
25
XC Mâle Femelle
2O -
Age (mois)
Figure 2. Evolution pondérale des chèvres élevées sous
système traditionnel duplateau central.
proposéesparWilson,de Leeuwetde Haan(1983), car
10 à 50% des revenus des ménages de ce système
viennent des produits de l'élevage. Le ratio ovins/
caprins dans cette étude est nettementà l'avantage des
caprins.Untelrapportaétéégalementétabli parWilson
(1991),quiprécisequ'il varieselonlarégion : 1pour 11
en Zambie et en Centrafrique, 1 pour 2 au Nigéria, 1
pour 8 au Swaziland. A l'inverse, le Sénégal et la
Mauritanie ne comptent qu'un caprin pour2à3 ovins.
Le sex-ratio d'un mâle pour trois femelles observé ici
s'accorde avec celui rapportéparWilson(1986; 1987)
et Peacock(1983)pour la sous-région ouest-africaine.
Cela est probablement dû à la trop rapide et intense
exploitation des mâles, alors que les femelles sont
gardées le plus longtempspossible pour l'extension du
troupeau. L'absence de soins zoo-sanitaires pour les
caprins, contrairement aux ovins qui font l'objet d'un
suivi relativement meilleur au sein des élevages
traditionnels étudiés, est une caractéristique que
rapportent égalementCharray et al (1980) et Bourzat
(1985). Mais, il existe des régions d'Afrique,
notammentà l'est etausuddu continentoù, comptetenu
de l'importance très nette de la chèvre dans la
micro-industrie et l'artisanat local, cetanimalfait l'objet
d'une plus grande attention sur le plan aussi bien
sanitairequezootechnique(Wilson, 1978;WilsonetOle
Maki,1989).
Les résultats enregistrés icisur le suivi des poids
vifs et la croissance des caprins sont similairesà ceux
rapportéspar Bourzat(1985)danslamême région, mais
inférieursà ceux de Mombeshora et al (1985) et Hale
(1986) sur les chèvres locales du Zimbabwe, et
Bizimungu(1986)sur les caprins du Rwanda-Burundi.
Lesconditionstrès difficilesd'élevage et l'encadrement
technique trop sommaire des exploitations caprines de
la zone de la présente étude expliquent sans doute les
performancesenregistrées. Ilconvienttoutefoisdenoter
que ces performances, bien qu'apparemment faibles,
notamment pour la croissance (GMQ), révèlent
d'importantes potentialités intrinsèques de la race
locale. Cela suggère qu'avec un minimum d'amé
lioration du système d'élevage actuel (conduite,
alimentation, soins de santé, gestion des effectifs,
hygiène des locaux), on peut s'attendre à une pro
ductionplus substantielle (viande, lait,peaux,fumier).
Référencesbibliographiques
Bizimungu A. 1986. Productivité des petits ruminants en
milieu rural.
1.Diagnosticderecensementdubétaildans troisrégions
différentes de laCEPGL.
2. Aperçu sur les systèmes d'élevage dans trois zones
retenues dans la communauté. IRAZ-GITEGA,
Burundi.
BourzartD. 1985. La chèvre naine de l'Afrique occidentale:
monographie. Doc. Groupe N* SRC 4. ILCA,
Addis-Abeba, Ethiopie.
Charray J, Coulomb J, Haumesser J B, Planchenault D et
Pugliese P L. 1980. Les petits ruminants d'Afrique
centrale et d'Afrique de l'ouest. Synthèse des
connaissances actuelles. IEMVT, Maisons-Alfort,
France.
Hale D H. 1986. System ofproduction and productivity of
goats inthreecommunalareas ofZimbabwe.In:Adeniji
K O and Kategile J A (eds). Proceedings of the
improvement of small ruminants in Eastern and
Southern Africa. OAU/IDRC-Nairobi, Kenya, pp
181-193.
MombeshoraB,AgyemangKetWilsonRT.1985.Livestock
ownership and management in the Chibi and
Mangwende communalareasofZimbabwe(Gr.Doc. n"
SRC2). ILCA, Addis-Abeba, Ethiopie.
Peacock C P. 1983. Phase exploratoire d'une étude des
systèmesdeproductionanimale dans le Gourmamalien
donnéesdebase sur le cheptelovinetcaprin.(Doc.prog.
AZ92C).ILCA-Bamako,Mali.
Wilson RT. 1978. Livestockproduction on Maasai sheep
populations at Elangata Wuas. East Afr. Agric.J.,43,
193-199
Wilson RT. 1986. Livestock production in central Mali
Long-term studies on cattle and small ruminantsinthe
agropastoralsystem. ILCA,Addis-Abeba, Ethiopie.
Wilson R T. 1987. Productivity of traditionally small
ruminants in an agro-pastoral system in northern
Burkina Faso.Trop.Agric.,64,163-169.
Wilson RT. 1991.Small ruminantproduction andthe small
ruminant genetic ressource intropicalAfrica. FAOEd.,
Rome.
Wilson RT,de LeeuwPN et de HaanC. 1983. Recherches
sur les systèmesdeproductiondeszonesaridesduMali:
résultatspréliminaires. ILCAAddis-Abeba, Ethiopie.
WilsonRTetOleMakiM. 1989. Goatandsheep population
changesonMaasaigroupranchinsouth-westernKenya,
1978-1986.Agric.System,29,325-337
96Small RuminantResearch NetworkWorkshop

Elevage caprin traditionnel auBurkina Faso
Traditionalgoat managementsystemsinthe central
plateau ofBurkina Faso
Abstract
Seventy-onesmallruminantflocksinfourvillagesinthe
savannah area of Burkina Faso central plateau were
monitored for two years to better characterise the
traditionalgoatproduction system. Resultsshowedthat
thissystemwasvery rudimentary. Itwas characterised
by free roaming during the dry season, non
supplementation ofnaturalpastures, lack ofveterinary
care andinadequateinfrastructure.Animalsin507% of
the flocks were onlygoatswhile 366% offlocks had
both sheepandgoats.Therewere morethan 10animals
in33.8% ofthe flockswhile 29.5% had between 5 and
10and 36.6% had less than 5. Between25 and 28% of
animalsperflockwere males, hence a sex ratio ofone
male to three females. Six to 18-month old animals
outnumbered those aged 18 to 36 months. Average
3-year live weight was 2069E0.67 kg while average
daily weightgain for the first 120 days was 131.1 g/d
comparedto192g/dfrom birth to3years ofage.
Small RuminantResearch NetworkWorkshop 97


Enquêtesur l'élevage caprin dans les hautsplateaux
de l'Ouest-Cameroun
Manjeli Y,TéguiaA., NjweRM,TchoumbouéJ. etEE Ayong
Départementdezootechnie
Facultéd'agronomie et dessciences agricoles
Universitéde Dschang,BP.222, Dschang(Cameroun)
Ministère de l'agriculture,Yaoundé(Cameroun)
Résumé
Une enquête a été menée à l'aide d'un question
naire structuréauprès de 116ménages choisis au hasard
et répartis dans25villages de la province de l'Ouest
Cameroun.Leséleveursenquêtés étaientpourlaplupart
analphabètes(629%)avecunâge moyencomprisentre
31 et 60 ans (81,5%). L'élevage des chèvres est une
activité essentiellement masculine (9747%). Sur un
effectifde548caprins observés,22sontdesboucs,353
deschèvreset173deschevreaux. Lataille moyenne des
troupeaux est de 6,8 animauxpar ménage. Le système
d'élevage est de type extensif, avec divagation
permanente (5%), laquelle disparaît au profit de la
divagation avec claustration saisonnière (84%)etde la
claustration permanente (11%). Le type génétique
caractérisépar 1à 1,5mise basparan, répartiesurtoute
l'année(2609%),ensaison sèche(62.31%)ouensaison
despluies(11,60%), appartientàlaracenained'Afrique
occidentale. Les problèmes alimentaires et sanitaires
sont les principaux obstacles au développement de cet
élevage.
Introduction
Au Cameroun, les petits ruminants sont élevés
danstoutes leszonesgéoclimatiques. Leurs rôlessocio
économiquessontbien connus(VallerandetBranckaert,
1975). Le cheptel caprin de laprovince de l'Ouest est
estiméà21% du cheptel national (Minepia, 1987). La
forte densité de la population humaine (plus de 200
hts/km dans certaines régions) ainsi que la pratique
d'uneagriculture deplusenplusintensiveontdonnélieu
à une occupation quasipermanente des terres de cette
zone. Malheureusement, on ne dispose guère
d'information sur les conséquences de ce phénomène
sur la distribution et lagestion du bétail dans la région.
Laprésente étude a étéconçuepourcollecter et analyser
des données sur le système d'élevage caprin ainsi que
sur lesprincipauxproblèmes et les obstacles rencontrés
dans ce domaine dans la région des hauts plateaux de
l'Ouest-Cameroun.
Matériels et méthodes
Caractéristiquesgéoclimatiques de lazone
d'étude
La province de l'Ouest est une région de hauts
plateauxdont l'altitude varie de 1400à2000m.Les sols
sont volcaniques par endroits et le climat est de type
soudano-guinéen modifiépar l'altitude. Latempérature
varie de 16à 27"C, l'humidité relative oscille entre 49
et97%, et la pluviométrie, de l'ordre de 1600mmpar
an, est répartie sur une seule saison des pluies (mars
novembre). La végétation est de type savane arbustive
avec quelquesgaleriesforestières.
Collectes des données
L'enquête a été menée au moyen d'un question
naire structuré auprès de 116 ménages répartis dans25
villages de tous les départements de la province. Les
données ontétérassemblées entrejanvieret mars 1992,
avant le redécoupage administratif qui a vu le nombre
de départements de laprovince de l'Ouestpasserde six
à huit. Les aspects couverts par le questionnaire se
rapportentà certaines caractéristiques démographiques
des enquêtés ainsi qu'aux informations techniques et
économiquespouvantinfluer sur l'élevage caprin. Les
données ont été analysées à l'aide de la statistique
descriptive.
Résultats
Profilsocio-économique desenquêtés
Les propriétaires de caprins sont généralement
d'un âge avancé (tableau 1). L'âge moyen varie d'un
départementà l'autre.Cependant, pourl'ensemble de la
province,plus de80% des éleveurs de caprins avaient
entre 30 et 60 ans. Le propriétaire de chèvres est en
généralun chefdefamillebien installé auvillage etdont
la taille du troupeau dépend souvent du nombre
d'enfants en âge de s'occuper des animaux. Les plus
jeunes éleveurs (7%) âgés de 20à 30 ans, sont des
Small RuminantResearch NetworkWorkshop 99
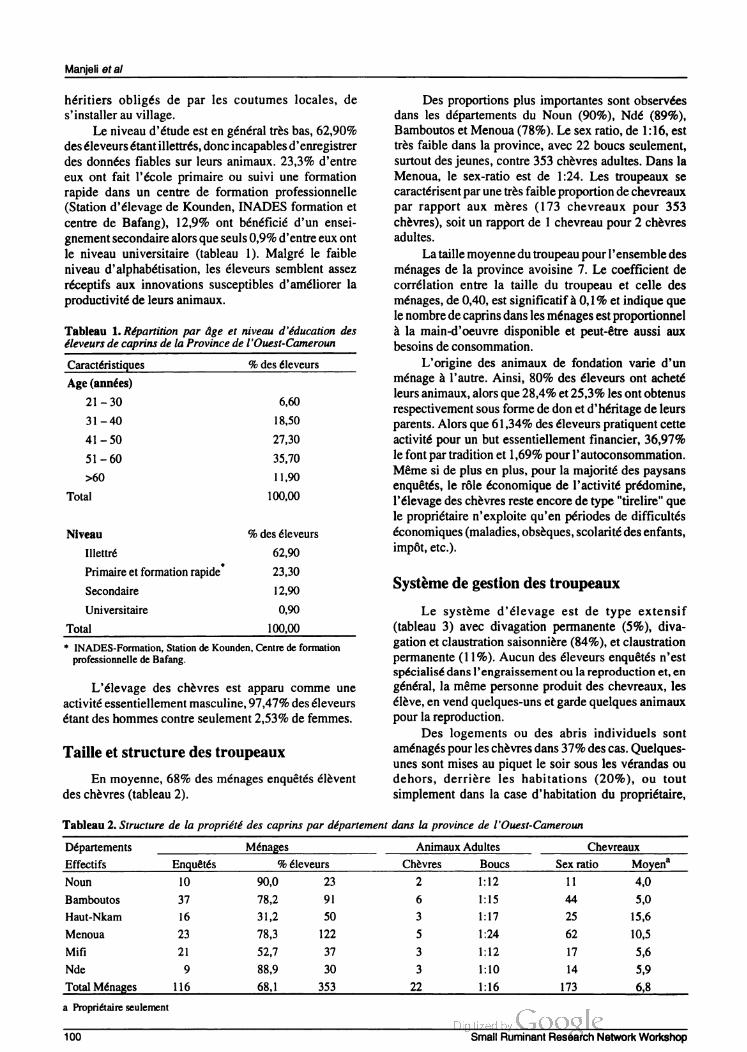
Manjeli et al
héritiers obligés de par les coutumes locales, de
s'installerauvillage.
Le niveau d'étude est engénéraltrèsbas,62,90%
deséleveurs étantillettrés,doncincapablesd'enregistrer
des données fiables sur leurs animaux.23,3% d'entre
eux ont fait l'école primaire ou suivi une formation
rapide dans un centre de formation professionnelle
(Station d'élevage de Kounden,INADESformation et
centre de Bafang), 129% ont bénéficié d'un ensei
gnementsecondaire alorsque seuls09%d'entre euxont
le niveau universitaire (tableau 1). Malgré le faible
niveau d'alphabétisation, les éleveurs semblent assez
réceptifs auxinnovations susceptibles d'améliorer la
productivitéde leurs animaux.
Tableau 1.Répartition par âge et niveau d'éducation des
éleveurs de caprins de laProvince de l'Ouest-Cameroun
Caractéristiques % des éleveurs
Age(années)
21 -30 6,60
31 -40 18,50
41 -50 2730
51 -60 3570
>60 11.90
Total 100.00
Niveau % des éleveurs
Illettré 6290
Primaire etformation rapide 23.30
Secondaire 12.90
Universitaire 0,90
Total 10000
* INADES-Formation,Station de Kounden,Centre de formation
professionnelle de Bafang
L'élevage des chèvres est apparu comme une
activitéessentiellement masculine,97,47% deséleveurs
étantdes hommes contre seulement2,53% defemmes.
Taille et structure destroupeaux
En moyenne,68% des ménages enquêtés élèvent
des chèvres(tableau2).
Des proportions plus importantes sont observées
dans les départements du Noun (90%), Ndé (89%),
Bamboutos etMenoua(78%).Le sex ratio, de 1:16, est
très faible dans la province, avec22 boucs seulement,
surtout desjeunes, contre353 chèvres adultes.Dans la
Menoua, le sex-ratio est de 1:24. Les troupeaux se
caractérisentparunetrèsfaibleproportion de chevreaux
par rapport aux mères (173 chevreaux pour 353
chèvres), soitun rapport de 1 chevreaupour2chèvres
adultes.
Lataille moyennedutroupeaupourl'ensembledes
ménages de la province avoisine 7. Le coefficient de
corrélation entre la taille du troupeau et celle des
ménages, de0,40, est significatifà0,1% etindiqueque
lenombrede caprins dans les ménages estproportionnel
à la main-d'oeuvre disponible et peut-être aussi aux
besoins de consommation.
L'origine des animaux de fondation varie d'un
ménageà l'autre.Ainsi,80% des éleveurs ont acheté
leurs animaux, alors que284% et253% les ontobtenus
respectivementsousforme de don et d'héritage de leurs
parents.Alors que 61,34% deséleveurspratiquentcette
activitépourun but essentiellementfinancier,3697%
lefontpartradition et 1,69%pour l'autoconsommation.
Même si de plus en plus,pour la majorité despaysans
enquêtés, le rôle économique de l'activitéprédomine,
l'élevage des chèvres reste encore de type"tirelire" que
le propriétaire n'exploite qu'en périodes de difficultés
économiques(maladies,obsèques, scolaritédesenfants,
impôt, etc.).
Système degestion destroupeaux
Le système d'élevage est de type extensif
(tableau 3) avec divagation permanente (5%), diva
gation et claustration saisonnière(84%), et claustration
permanente (11%).Aucun des éleveurs enquêtés n'est
spécialisédans l'engraissementoula reproduction et,en
général, la même personne produit des chevreaux, les
élève,envend quelques-uns etgarde quelques animaux
pour la reproduction.
Des logements ou des abris individuels sont
aménagéspour les chèvres dans37%des cas.Quelques
unes sont mises au piquet le soir sous lesvérandas ou
dehors, derrière les habitations (20%), ou tout
simplement dans la case d'habitation du propriétaire,
Tableau2.Structure de la propriété des caprins par département dans la province de l'Ouest-Cameroun
Départements Ménages AnimauxAdultes Chevreaux
Effectifs Enquêtés % éleveurs Chèvres Boucs Sex ratio Moyen*
Noun 10 900 23 2 1:12 11 40
Bamboutos 37 782 91 6 1:15 44 50
Haut-Nkam 16 31,2 50 3 1:17 25 15,6
Menoua 23 78.3 122 5 1:24 62 10.5
Mifi 21 527 37 3 1:12 17 5,6
Nde 9 889 30 3 1:10 14 59
Total Ménages 116 68,1 353 22 1:16 173 6,8
a Propriétaire seulement
100 Small RuminantResearch NetworkWorkshop

L'élevage caprin dans l'Ouest-Cameroun
cuisine et dépendance(23%). Il arrive cependantquede
grands troupeauxsoientsans abri, mais enfermés dans
un enclospendant la nuit(20%).
Tableau3.Systèmes degestiondes troupeauxdechèvres dans
laprovince de l'Ouest-Cameroun.
Divagation Confinement Confinement
permanente saisonnier permanent
Départements (%) (%) (%)
Noun 2,2 930 50
Bamboutos 00 870 130
Haut-Nkam 100 830 70
Menoua 0.0 83.0 170
Mifi 00 76.0 24,0
Nde 160 840 00
Ensemble de la 4,67 84.33 11,0
Province
Dans 25,57% des élevages, les chèvres ne
reçoivent aucune complémentation alimentaire. La
majorité despaysans(74,43%) donnent cependant aux
animauxune complémentation sous forme de maïs ou
de déchets de cuisine (épluchure de banane, de patate,
.).
Les principaux symptômes pathologiques
fréquemment observés chez les chèvres sont rapportés
au tableau4.
Tableau4.Principales causesde mortalitéobservées chez les
chèvres de laprovince de l'Ouest-Cameroun
Causes % des éleveurs*
Pneumonie et maladies respiratoires 60,6
Diarrhées 572
Dermatoses 37.6
Affections despieds 18,8
Accidents 16,2
Avortements 297
Mortssubites 5,1
* Unéleveurpeut releverplusieurs causes
Les pneumonies et les maladies respiratoires
représentent les affections lesplus mentionnéespar les
éleveurs (60,6%), suivies des diarrhées (57,2%) et des
dermatoses(376%).Lesavortements(29,7%),sans être
des maladies à proprement parler, sont régulièrement
cités et sont les conséquences de saillies précoces des
jeunesfemelles, aggravéespar le stress nutritionnel.Les
accidents rapportés (16,2%) concernent les animaux
écrasés par des véhicules ou tombés dans des pièges
tendus aux animauxsauvages. Les morts subites (5%)
sontduesàl'ingestiondeplantestoxiquesoudeproduits
chimiques(pesticides, insecticides, etc)ouàdescauses
non identifiées.
Peu d'éleveurs bénéficient des services des divers
centreszootechniques etvétérinaires(CZV)disséminés
dans la province. Ainsi, la protection sanitaire des
animaux n'est assurée quepar24,05% d'entre eux. Les
prestations obtenues se limitent d'ailleurs au
déparasitage externe (5%), interne (13%), ou à la fois
externe etinterne (6%).
Performances de reproduction
Prolificité
Le tableau 5 donne les différents types de
naissances enregistrées dans lazone d'étude. Il montre
que 12% des chèvres ontdonnédesnaissances simples,
alors que 88% des naissances sont multiples dont61%
de naissances doubles,2597% de naissancestriples et
1,3% de naissances quadruples.
Ageà la première mise bas
Un pourcentage non négligeable d'éleveurs
(36,71%)ignorent l'âgeà lapremière mise basde leurs
animaux(tableau 5). Pour29,11% d'entre eux, cet âge
se situe entre 11 et 18mois, les autres le situantplutôt
entre 18 et24 mois (22,78%) et même entre 24 et36
mois (11,39%).
Distribution des mises bas au cours de l'année
Pour62,31%des éleveurs de laprovince, les mises
bas ont lieu en saison sèche, tandis que 2609% es
timentqu'ellesont lieu toute l'année etquepour 11,60%
d'entre eux, elles sontplutôt concentrées en saison des
pluies (tableau 5). Dans la pratique cependant, on sait
que la chèvre locale peut mettre bastoute l'année.
Tableau 5. Performance de reproduction des chèvres de la
province de l'Ouest-Cameroun
Caractéristiques %
a) Type de mise bas
Simple 11,69
Double 61,04
Triple 2597
Quadruple 1,30
Total 100.00
b) Age(mois)
11-18 29,11
18-24 22.78
24-36 11,39
Inconnu 36,71
Total 100.00
c) Période % deséleveurs
Toute l'année 26.09
Saison sèche 62.31
Saison despluies 11,60
Total 100.00
d) Niveau % deséleveurs
1 74,36
1,5 19.23
2 6,41
Total 100.00
SmallRuminantResearch NetworkWorkshop 101

Manjeli et al
Nombre de mises bas/chèvre/an
Le nombre de mises baspar chèvre etpar an est
très variable. Il est de 1 pour74,36% des éleveurs, de
1,5pour 1923% d'entre eux et de 2pour les 641%
restants (tableau 5). Toutefois, dans les conditions
traditionnelles de cet élevage, où le sevrage est naturel
et n'intervient qu'à l'assèchement du lait maternel et
lorsque le chevreau est déjà capable de ruminer (4-5
mois d'âge), il est pratiquement impossible d'enre
gistrer2mises bas/chèvre/an. Le chiffre de 1à 1,5mise
baspar an et parchèvre semble doncplusindiqué
Age de réforme des chèvres
La réforme des chèvres dans cette province est
dictéeparle nombrede misesbaseffectuéesparl'animal
chezsonpropriétaire. L'âge de réforme varie de2à 10
anset constitue laduréedevie reproductive delachèvre,
l'éleveur conservant une bonne reproductrice aussi
longtemps quepossible.
Discussion
L'âge avancé des propriétaires est dû soit à un
certain désintéressementdesjeunes de cette activité, soit
aumanquedemoyensfinanciersouàl'exode desjeunes
vers les villes. Le nombre limité de femmes dans ce
secteurs'expliqueprobablementparlacoutumequi leur
impose l'élevage desvolailles et réserve celui dugros
bétail aux hommes. Toutefois, les choses semblent
évoluer, de plus en plus de femmes étant désormais
propriétaires degrosbétail.
Lafaibleproportion des chevreauxparrapportaux
mères pourrait être lié au faible taux de fertilité en
rapportavecune mauvaise répartition desboucsdans la
région,à la mise au piquet saisonnière desboucs, mais
aussiàuntauxélevéde mortalitédesjeunes avant l'âge
d'un an (24à32%).
Dans le Haut-Nkam, une faible proportion
d'éleveurs (31,25%) détiennent des effectifs plus
importants(15,6%)qu'ailleurs dans laprovince (Noun,
Ndé, Mifi)où l'activité est très répandue mais avec des
effectifs réduits. Dans la Menouapar contre, l'élevage
des chèvres est très répandu et les effectifs par
exploitation sont importants.
Du fait de l'explosion démographique et de
l'extension conséquente deszonesde culture, source de
nombreux conflits entre paysans, la divagation avec
claustration en saison de cultures devient le mode de
gestion leplusrépandu.Mais laclaustrationpermanente
semble constituer la tendance générale. Toutefois,
contre toute attente, despertes depoidsde l'ordre de 15
à 20% sont enregistrées pendant la saison des pluies.
Lesdifficultés rencontréespouralimenter correctement
les animauxpendant cette claustration saisonnière sont
beaucoup plus liées à l'exiguïté des parcelles
individuelles etpeut être aussià une mauvaise gestion
de l'espace, qu'à un manque de fourrage de bonne
qualité. Les mortalités enregistrées pendant la période
de claustration sontimputables,enpartie au moins,à la
pluie, responsable de nombreux cas de pneumonie
signalés.
Lesproblèmes sanitaires observés sontpeut-être
liés soit à l'éloignement des centres zootechniques
vétérinaires généralement basés dans les centres
urbains, soit à la non utilisation des médicaments et
vaccins dont le conditionnement en doses multiples
(flacons de250à 1000doses)estinadaptéauxbesoins
des éleveurs qui nepossèdentque7animauxseulement
en moyenne. De plus, la taille réduite des troupeaux
n'encouragepas les éleveursàfaireappel auxCZVdont
les agents sont perçus par les paysans beaucoup plus
comme des collecteurs d'impôtsque comme desparte
naires. Le regroupement des paysans en coopératives
d'éleveurspourraitêtreune solution.
Lestypes de naissance obtenus dans cette étude se
rapprochent de ceux rapportés ailleurs en Afrique
(Buadu,1972; Mathewman, 1977 cités par Okello et
Obwolo,1985;Wilson,1976). Les moyennes d'âgeàla
première mise bas enregistrées sont proches de celles
obtenuessurd'autres chèvrestropicales et subtropicales
(CIPEA,1979citéparOkelloetObwolo,1985;Wilson,
1976; HaumesseretColl,1975;Devendra,1970).
La concentration des mises bas en saison sèche
pourrait être associée au confinement saisonnier des
animaux qui, libérés après les récoltes, reprennentleurs
activités sexuelles versla findelasaisondespluies, avec
pour conséquence des misesbas en fin de saison sèche.
Conclusions et recommandations
La chèvre joue un rôle important dans la vie des
populations de laprovince de l'Ouest-Cameroun et ce,
comme source de protéines, la viande de chèvre étant
plus appréciée que celle de boeuf. L'élevage caprin
constitue une épargne sur pied facilement mobilisable.
Le rôlesocio-culturelde lachèvre utiliséepourdesdons,
la dot,des sacrifices,des impôts, etc. estimportant mais
mal évalué compte tenu du caractère ponctuel de ces
pratiques. Dupoint devue de lagestion dutroupeau, la
chèvre utilise des ressources alimentaires très diverses
et traverse en général la saison sèche sans grand
dommage.Son rythme de production estplus élevé que
celuidesbovinset ovins locaux.Surunplanstrictement
économique, tout produit obtenu de la production
caprine peutêtre considérécommeun bénéfice dans la
mesure où, en dehors de l'achat de l'animal, l'éleveur
n'investit que très peu dans cette spéculation.
Les principaux obstacles à la production caprine
dans la province de l'Ouest concernent l'alimentation,
le logement, la santé et le manque de capitaux. Des
recherchesdevraientportersurune meilleure évaluation
de la productivité de la chèvre locale, notamment la
fécondité, l'intervalle entre mises bas, la vitesse de
croissance et la maturité sexuelle, lesquels peuvent
constituer des facteurs d'amélioration. Une sélection
rigoureuse et le croisement devraient permettre de
décanter lapopulation caprine de laprovince detous les
102 SmallRuminantResearch NetworkWorkshop

L'élevage caprin dans l'Ouest-Cameroun
animaux improductifs ou peu productifs. On pourrait
aussi envisager l'introduction de chèvres à potentiel
génétique supérieur pour accroître les potentialités
des animaux locaux. Avec l'extension des cultures de
contre-saison qui occupent les terrespendant la saison
sèche,lachèvres'accommoderademoinsenmoinsd'un
élevage de type extensif. La claustration permanente
semble êtreà moyenterme l'unique alternativepour la
survie de cette activité. Il est donc fondamental que
l'éleveurde caprinsdelaprovincede l'Ouest-Cameroun
change de mentalité quant au rôle réel de la chèvre et
s'emploie à revoir sa méthode de production. Par
exemple,une meilleure gestion de l'espace réduit des
exploitations individuelles, notamment par
l'introduction destechniquesd'agroforesterie tellesque
la culture en couloirs desplantesfourragères, pourrait
permettre d'améliorer le disponible alimentaire et la
qualité de la ration.Uneétudeplus sérieuse devrait être
menée pour inventorier les principales maladies des
chèvres et proposer un programme de prophylaxie
adapté.
Référencesbibliographiques
DevendraC. 1975.Biologicalefficiency ofmilkproduction in
dairygoats.Wld.Rev.Anim. Prod., 11:46-53
Haumesser J B. 1975. Quelques aspects de la reproduction
chez la chèvre rousse de Maradi. Comparaison avec
d'autres races tropicales et subtropicales. Rev. Elev.
Méd.Vét. PaysTrop.28(2)225-233
Minepia. 1987. Rapport annuel, Ministère de l'élevage, des
pêches etdes industriesanimales,Yaoundé,Cameroun,
171pp.
Okello K L, Obwolo M J. 1985. Ouganda: possibilités
d'élevage caprin. Revue mondiale dezootechnie, 1985
53:27_32.
VallerandF, Branckaert R. 1975. La race ovine Djallonkéau
Cameroun. Potentialités zootechniques, conditions
d'élevage, avenir. Rev. Elev. Méd. Vét. Pays Trop.,
4:523-545.
WilsonRT.1976.Studiesonthe livestockofSouthernDarfur,
Sudan. Iv. Production traits ingoats.Trop. Anim. Hlth.
Product.,8:221-232
Survey ongoatproductionin the highplateau area of
westernCameroon
Abstract
A survey ofgoats was carried out using a structured
questionnaire in 116 randomly selected households in
25 villages of western Cameroon province. Most
pastoralistsinterviewedwereilliterate (629%)andaged
between31 and60years(81.5%).Goatproductionwas
mainly a male activity(974%).Out ofa total of548
animals studied,22were males,353were females and
173were kids.Average size offlockswas6.8animals
per household. The production system was extensive
withpermanentfree roaming(5%)progressivelygiving
waytofree roamingwith seasonalpenning(84%)and
permanentpenning(11%).Thegenetictype istheWest
African Dwarfgoat. Itis characterisedby 1 to 1.5 kid
dings ayear, occurring allyear round(26.09%),during
the dryseason (6231%)orthe rainyseason (11.60%).
Feedandhealth constraintswereidentifiedas the major
obstaclesto livestock development in this system.
SmallRuminant ResearchNetworkWorkshop 103


Goat production in Botswana: Factors affecting production
and marketing among small-scale farmers
M. Mrema and S. Rannobe
Botswana College ongriculture,
P. Bag 0027, Gaborone. Botswana
Abstract
Through government programmes, the goat population
among small-scale farmers increased from 0.6 million
in 1973 to 2.12 million goats by 1990. Yet goat sales and
consumption levels are very low. Production and
marketing are plagued by a number of constraints,
including lack of funds for investments in proper
facilities, long distances to markets and risks.
Introduction
Livestock production in Botswana is a very important
socio-economic activity. The cattle industry is the
principal sector with a major contribution to beef export
to the EEC market. However cattle ownership is highly
skewed with 10% of the population owning 60% of the
national herd in 1990 and 40% of the population not
owning any cattle (MFDP 1991). The semi-arid climate
of the region combined with its low population density
provide a great opportunity for livestock production.
Also lack of alternative investment opportunities in rural
areas has promoted investment in livestock (Chemi
chovsky et a1 1985; MFDP 1991). For smallholder
(traditional) farmers more investments are made in the
small stock sector. Over 80% ofthe small stock, 70% of
which are goats, are in the hands of traditional farmers
(MoA 1991). Women, who are among the poorest, own
more goats than their male counterparts who have more
resources and can afford to own cattle. Ownership of
goats by the poorer sector of farmers is encouraged by
the government through a number of projects/policies
and programmes discussed later in this paper.
Since all the traditional farmers live in the
communal lands (70% ofthe total area) most ofthe goats
are found in these areas. Here extensive grazing is
practised and very little controlled grazing is done.
About 5.0 million animals (2.6 million cattle. 2.2 million
small stock and 0.2 million donkeys) were found in these
areas in 1990.
The role of the Government of Botswana
(GOB)
Some of the objectives set by the GoB in the small stock
subsector are:
' To improve rural nutritional and income status
through increased productivity of milk and meat,
and sales through improved management and
genetic potential.
' Assist the marketing of small stock through
improving handling and marketing facilities.
' Use projects like Al, ram subsidy (Boer goat was
introduced to improve the indigenous goats),
Financial Assistance Policy (a grant of up to P
25,000 to start a goat or sheep project is given to a
farmer, and women are given priority) and pricing
policy as an incentive to promote the smallstock
sub-sector.
' Through the implementation of service to livestock
owners in communal areas programme (SLOCA),
provide technical assistance to Botswana
Cooperative Union (BCU) responsible for
livestock management and marketing. An increase
in prices of small stock through BCU, increased
animals sent to the official market, the Botswana
Meat Commission (BMC) from 334 goats in 1982
to 4127 goats in 1983 and to 41,997 in 1989
(MFDP 1991).
' Build dams and assist syndicates in costs ofdrilling
boreholes with a minimum of P 20,000. This is
necessary because there is very little surface water.
' Establishment of 10 trek routes covering a total of
2540 km (MFDP 1991 ) to assist those farmers who
trek their animals to BMC or municipal abattoirs.
Each of these routes has watering and kraaling
facilities and a kilometre yard to hold sick and
weak animals.
' Provide disease control measures like free
vaccination from common diseases. cordon fences
in production areas and the establishment of six
main Livestock Advisory Centres (LACs) and 25
subsidiaries.
The national production and
marketing situation
In 1985 over 99% (1.1 million goats) of the goats were
in the hands of traditional farmers on 53,000 farms. By
1990 the number of farms owning goats had increased
to 68,900 with 2.1 million goats. Most farms own
between 1 and 30 goats. Statistics show. however, that
Small Ruminant Research Network Workshop 105

Mrema and Rannobe
goats do better (because they are browsers)during dry
seasons and droughts than duringwet seasons, e.g. in
1968there were 19milliongoats, butthis numberwas
reduced to 0.6 million during the wet year of 1973.
Duringthe 1982-87 droughtyears, the goat numbers
increased dramatically. Causes ofthese losses during
wetseasonswereinvestigatedinsurveys and results are
discussed laterin thispaper.
The composition ofthe nationalflock over three
periods is shown in Table 1.Although the number of
female adult goats has been increasing slowly, it has
remained in the region of 50% of the total flock.
However, the proportion of female kids born is
declining.
Table 1. Goat composition andperformance.
of age, home consumption ofgoat meatincreased only
slightly(Table2).Thishas notimproved proteinintake
asplanned.
The increased attention given to goat production
was meant to minimise or terminate the huge sheep
products imports from South Africa (SA) and increase
exports ofgoatlive animals and meat. However,due to
low offtake rates, Botswana still imported over P 12
millionworth ofsheep meatsin 1991(CSO1992)while
goatexportstoSAin 1985and 1986were onlyworth P
1022868and P1928763, respectively.NowthisSA
marketforgoats has collapsed.This will limitthe sale
ofBotswanagoats especially sincethe domestic market
is very small. This is reflected in the reduced total
Year('000goats)
1985 1988 1990
Age Male Female Male Female Male Female
> 1 year 163.2 5758 235.1 8532 307.8 1132.8
% oftotal 14.7 51 9 14.3 52.1 15.2 55.8
<1 year 168 201.3 2592 291.6 263.2 326.4
% oftotal 155 18.2 15.8 17.8 13.0 16.1
Source:MoA(1985,1988, 1990).
National figures also show low and stagnated
productivity andmarketingparameters(Table2).While
thebirth rate increased duringthewetyears of1988/89
the death rate increased too. Sales ofgoats increased
only slightly over the three periods investigated. The
increase is attributedtothe implementation ofapricing
policyduringtheperiod,whereprice/100kgCDMwas
raisedto approachthat ofcattle (Table3).Althoughthe
aim was to increase offtake rates ofthese farmers,the
commercial farmers' offtake rate of between 12-15%
has neverbeen attained bytraditionalfarmers.
Also,while the population ofBotswanaincreased
tremendouslyfrom09million in 1981to1.3million in
1990, with506% ofthembeingchildrenunder 15years
Table2. Production and marketing ofthe national flock.
Year
Variables 1985 1988 1990
Production parameters (%)
Birth rate 40.6 45.8 40.2
Mortalityrate 197 21.0 19 7
Marketingindicators(%)
Offtake rate 3.1 4.4 5.6
Home consumption 5.2 6.9 7.5
Purchases 25 1 7 2.1
Source:MoA(1985,1988, 1990).
Table3. Comparison ofaverage price for cattle and goats 1986-93 on cold-dressed mass (CDM) basis.
Price in Pula
Cattle Goats
Exchange rate*
Year 100kg Average/animal 100kg Average/animal Pula againstUSS
1986 153.30 290 I1a 40.33 0.544
1987 166.64 328 I1a 49 98 0.639
1988 218.46 455 219 28 51.87 0517
1989 276.65 599 253.14 58.11 0.534
1990 296.38 632 27045 5772 0.534
1991 302.92 611 252.32 48.08 0.482
1992 291.44 520 25944 54.10 0.443
1993* 334.66 644 31320 59 87 0.408
na =not applicable;*uptoJune.
Sources: 1.CSO(1993);2. Bank ofBotswana(1993).
106 Small RuminantResearchNetworkWorkshop

Goatproduction andmarketing inBotswana
number ofanimals slaughtered in both the BMC and
municipalabattoirs(Table4).
Table 4. Slaughter ofgoats between BMC" and municipal
abattoirs(MA).
%MAslaughter
Year BMC MA oftotal
1987 30728 2916 8.7
1988 25717 2076 7 5
1989 31888 5087 13.8
1990 20670 5603 21.3
1991 13915 5993 30.1
1992 6396 874 51.8
1993? 2047 I1a I1a
1.BMC=BotswanaMeatCommission.
2UptoJune.
Source:CSO(1993).
Farmers'situation
Farmers'objectives
Farmers' objectivessometimesconflictwiththoseofthe
government, and since it is the farmers who make
production and marketing decisions, problems are
experiencedinimplementation ofgovernmentprojects/
policies andprogrammes. Examples ofthese conflicts
aI'C.
1. The culture ofkeepinganimals aswealth hinderthe
objectiveofincreasingofftake rates.Thisrendersthe
price policyineffective as far as small farmers are
concerned. From the surveys done in the Gaborone
region (1993/94) only2% ofthe farmers sold any
goats. These were sold only when need for cash
aI'OSC,
2. Competition for inputs with a number of other
enterprises(cropproduction and off-farmactivities)
deprive goatproduction ofthe necessary resources
neededtoimproveproductivity(e.g. labour, finance,
feed etc).
Production constraints
Major production constraints identified by the study
Were:
Poorhousing.Allanimals(onaverage40cattle, 15
goats and 13 donkeys) are housed together at all
times ofthe year in open kraals made ofthorny
branches.These kraalsare nevercleanedandmost
last for over4years. This results in outbreak of
diseasesduringwetseasons resultingin anaverage
loss of11 kids/farmerperannum.
Highmortality ofthe exoticBoergoatsintroduced
through the ram subsidyprogramme due topoor
management andinabilityto fulfilthe conditions
requiredforsuch breeds because ofthe high costs
involved.
• Thelargenumbersofanimalskeptinthesevillages
lead to overstocking and severe overgrazing
especially in winter where natural pasture is
reducedtozero.Thisresultsnotonlyininadequate
feed but alsoinpoorer qualitypastures eachyear.
Since supplementaryfeeding is hardlydonedueto
the costs involved (it costs P870/50 kg bag of
sorghum bran, P 635/35 kg bag of salt and P
23.50/50 kg bag of stock feed), starvation and
insufficientfeedingresults in high losses.
• The high costs of veterinary services, long
distances to LACs, lack oftransport and short
supplyofsomedrugs requiringfarmerstogotoSA
for them,prohibit constant and continuous use of
these services.
• Few veterinary assistants (VAs). Although the
NDP7(1991-97) requires that there be aVAto
farmer ratio of1:240the studyfoundthe ratio in
this areatobe 1:429,with an average distance of8
km between farmers; mostVAs do not have any
transportation means.
Insufficient family labour and unreliable hired
labourto cover allthe activitiesperformed atthe
sametimeonthefarms(cropproduction, livestock
production ofvarioustypes and requirements,and
offfarm activities). Hired labourisunreliable due
to increased construction activities and better
opportunities across the border in SA. A study
done by Ministry of Agriculture (MoA 1992)
showed that each farmer requires a total of208
man-days (124 man days for crops and 84 for
livestock), during the labour peak months of
December-May when crops are growing. Our
study found each family has an average of eight
members but only three adults equivalent are
available forwork at alltimes ofthe yearandtwo
adults equivalent onlyforpart ofthe days.Thisis
because 55% of the members were found to be
under 15years oldandspendmuch oftheirtime at
school.The adults, mostofwhom arewomen, are
over58years ofage.Thesewomenhave only5%
oftheirtime devotedto livestock activities.They
spend 12.7% on cropactivities,63% onhousehold
chores and 19.3% on off farm activities (beer
brewing, basket making etc). It is evident that
hiringoflabourisnecessaryifallactivities haveto
be performed efficiently. However, the cost of
hiringisprohibitiveasitcosts afarmerP092/hour
forlivestocklabourandP097/hourfor crops
This has resulted in poor management due to
labour shortages resulting in straying of animals, loss
through diseases andpoornutrition.
Inadequate water sources and long distances to
dams or boreholes haveforcedsome ofthesefarmersto
watertheir animalsin municipalsewageponds (9% of
the farmers).
Small RuminantResearch NetworkWorkshop 107

Mrema and Rannobe
Marketingconstraints
Farmers claim that BMCprices are low (Table 3) as
comparedtoprivate agentswhodonotlookatthegrade
ofthe animalandpayP100/goat(1993). However, this
unofficial channelis not reliable.
Longdistancestoabattoirs,poor roadsand lack of
transport. The study discovered that most farmers,
especiallywomen, do not own trucks that could ease
their transportproblems(Table5).The type oftransport
ownedis inappropriate fortransportinggoats. Hiring of
trucks couldcostafarmeruptoP200/trip. Butmostearn
only an average ofP3307 orUSS 1272p.a. (Mrema
1994).This restricts the number oftripsto be made to
the market.
Table5. Types oftransport owned
% offarmers
Mode of Owned Hired
transport
Female Male Female Male
Tractor 13 16 - 19.3
Donkeycarts p7 - -
Truck(lorry) 137 37 2 37 21.5
Mostofthegoatssold are ofgrades B1 andB2and
thepricesofthese are lower(Table6).Theselowgrades
are caused by long distances walked to abattoirs,
insufficient feeding and poor quality pastures among
other reasons.Thishas ledtothe beliefthatifgoats are
kept longertheyfetch higherprices.
Delaysinpaymentorproblemsin cashingcheques
issuedbyofficialchannels(BMCandits agents)alsoact
as deterrentstouse ofthese official outlets.
Table6. BMCprices (Pula)for goats according to grade,
1982-85
Year
Grade 1982 1983 1985
Super 153 215 237
Al 144 202 223
A3 96 135 149
B1 134 187 206
B2 124 174 192
B3 96 135 149
Those in Super andA grades are young goats with less than two
permanentincisors while those in B grade are older with more than
twopermanentincisors.
Source: Molefe(1985).
It is evidenttherefore that in order for maximum
output tobe realisedfromgoats,farmers needtouse all
the necessary inputs (resources), e.g. water, feed,
disease control andgeneticimprovedtechnology atthe
optimum level as portrayed by Dillon's model
(Figure 1). Falling short ofthis combination as is the
casewith mostfarmers,the results aregenerallybelow
the maximum outputorproduct.Otherfactors notinthe
model, like marketing and institutional factors,play a
major role in determining level ofproduction and
marketing.
Totalproducts (TP)
Tp MaximumTPwhen all necessary
are used
Tp
4 -- Genetic exoticgenotype
-----
Tp 3 -- Disease control measures
TP 2 _ Feeds /
Tp
Quantity ofinputs
Source:McLeod(1989).
Figure 1. Relationship between various inputs used and
livestockproduction.
Conclusion and recommendations
TheGoBisspendinglargeamountsofmoneytoachieve
its set objectives ofincreasedincome and nutrition for
poorerfarmers,importsubstitution etc. However,since
the farmer isthe decision maker on how much of each
resource (time,inputs,finances etc)toallocateto many
competingends, and since heisfacedwith a number of
his own objectives and constraints on the farm,
sometimes the intended results are never achieved.
Production, marketingandinstitutionalconstraintshave
resulted in low production and offtake and hence low
incomes alldiscouragingfarmersfromincreasinginputs
to goat production. This vicious cycle needs to be
broken.
It is therefore imperative that, since most ofthe
African small-scale farmers suffer the same fate,
governments,institutions and farmersworktogetherto
first identifyproblem areas and solve them in orderto
give way for appropriate policies and technologies to
work.
References
Bank ofBotswana. 1993.AnnualReport. Bank ofBotswana,
Gaborone,Botswana. 114pp.
CSO (Central Statistics Office). 1992. External Trade
Statistics, Department of Customs and Excise.
108SmallRuminantResearch NetworkWorkshop

Goatproduction andmarketing inBotswana
Government Printer, Gaborone, Botswana. pp. 1-2,
232-233.
CSO (Central Statistics Office). 1993. Statistical Bulletin
18(2):48-51.CSO,Gaborone,Botswana.
Chernichovsky D., Robert E.B. and Mueller E. 1985
Household Economy ofRural Botswana: An African
Case. World Bank StaffWorking Paper 715. World
Bank,Washington,DC,USA.pp. 1-12
MFDP (Ministry of Finance and Development Planning).
1991. National Development Plan 7 (1991-1997)
GovernmentPrinter,Gaborone, Botswana.pp.239-267.
MoA(MinistryofAgriculture). 1985.Agricultural Statistics.
GovernmentPrinter,Gaborone, Botswana. pp.51-63.
MoA(Ministry ofAgriculture). 1988.AgriculturalStatistics.
Government Printer,Gaborone, Botswana.pp.52-61.
MoA(MinistryofAgriculture). 1990.Agricultural Statistics.
Government Printer,Gaborone, Botswana. pp.56-67
MoA (Ministry of Agriculture). 1991 . Botswana's
AgriculturalPolicy: CriticalSectoral Issues and Future
StrategyforDevelopment.MoA,Gaborone, Botswana.
pp.3-42.
MoA (Ministry of Agriculture). 1992. Farm Management
Survey, Results 1978-1988. Survey Comparisons
Planning and Statistics Division, MoA, Gaborone,
Botswana.pp. 1-41.
Molefe D.S. 1985. Review ofthe present Sheep and Goat
Production Programmes and future prospects. In:
Morapedi N.T. (ed), Food Comes First. Seminar
Proceedings on Livestock Production, Marketing,
Training and Development. University of Botswana,
Gaborone, Botswana.pp.66-75
MremaM. 1994.An Economic Evaluation ofthe Utilisation
of Donkeys in Small Scale Farming Households in
Botswana. A paper presented at the 2nd International
Colloquium on Working Equines, Rabat, Morocco,
20-22April 1994.11 pp.
Elevage caprin au Botswana:facteurs devariation de laproduction
et de la commercialisation au niveau despetits éleveurs
Résumé
Grâce aux efforts dugouvernementdu Botswana,
les effectifs caprins despetits éleveurssontpassés dans
lepaysde0,6million en 1973à2,12millionsdès 1990
Etpourtant, les niveauxdevente et de consommation
des produits de l'élevage caprin sont très bas. La
production et la commercialisation de ces produits se
heurtent àun certain nombre d'obstacles,y compris le
faible niveau d'investissements dans les infrastructures
adéquates, l'éloignement des marchés et les risques.
Small RuminantResearch NetworkWorkshop 109


Profitability andincome contribution ofSmall ruminant
productionto ruralAfrican households:Acase study of
Kgatlengand Kwenengdistrictsin Botswana
A. Panin
BotswanaCollege ofAgriculture
Department ofAgricultural Economics, Extension and Education
Private Bag0027, Gaborone, Botswana
Abstract
This study evaluates the profitability and relative
income contribution of small ruminant production to
rural African households. The analysis is based on
1991/92 farm management survey data on 114
smallholder households from Kgatleng and Kweneng
districtsin Botswana. Budgetaryandhouseholdincome
analyses were usedto estimate the profitability ofthe
small ruminant production and its relative household
income contributions. The results show that small
ruminantproductionisbothprofitableandeconomically
viable. It returned an average income ofP2300per
animaltothe smallruminant owninghouseholds.Also,
itprovided a return of34% on capital invested in the
enterprise. Its contribution of 15% to the household
incomewas substantial,exceedingsimilar contribution
from cropproduction by58%.Smallholder farmersin
the areashould,therefore,exploitthe potential benefits
ofsmallruminant productiontoincreasetheirhousehold
income by allocating more resources to its
improvement. Furthermore,policy makers,researchers
and farmers should be made aware ofthe economic
viabilityofsmall ruminantproductioninthecountry and
elsewherein Africa.
Introduction
Theimportance oflivestockin Botswana's economyhas
longbeen recognised. Itisa majorsourceofincome and
employmentfor most ofthe rural dwellerswho are the
majority ofthe estimatedtotal populationof1.5 million
peopleinthe country(MoA1991). Livestock,primarily
cattle, are one ofthe main sources offoreign exchange
generatedbythe agricultural sector (MoA 1989).The
totalpopulation ofcattle, goats andsheepinthe country
is estimated at about2.7,2.1 andO.3 million, respect
ively(CSO 1991).
The cattle industry in the country has been well
developed.This is because it has, since the country's
independence in 1967, been receiving considerable
attention with respect to research, marketingand other
institutionalsupportfromthe governmentwhichinturn
is mainly due to the preferential trade arrangement
granted to the country's beef export bythe European
Economic Community (EEC). Ironically, the
distribution of cattle ownership in the countryis very
skewed with 30-40% ofthe rural households without
any(MoA 1991;Panin et al 1993). By contrast, almost
every rural household owns at least a unit of small
ruminant(Fane 1992). Inspite ofthe popularity ofsmall
ruminants amongthe rural households as reflected in
their ownership distribution, available evidence
indicates that the small ruminant production system
receives relatively little attention in terms ofthe above
mentioned services rendered to that of cattle (Fane
1992).This is despite the fact thatthe small ruminant
production system has proved to be suitable to the
prevailing harsh climatic conditions in the country
(Molefe 1987).
Lack ofinformation on the profitability ofthe
small ruminantproduction enterprise as well as on its
income contribution tothe ruralfolks is assumedto be
the principal reason for the non-recognition of its
importance by the policy makers and relevant
institutions andhencethe resultinglittle attention given
toits improvementin the country.Thepurpose ofthis
paper is to contribute tothe literature on the relative
economicimportance ofthe smallruminantproduction
enterpriseinAfrican ruralhouseholdsbyassessingboth
its profitability and income contributions to the rural
folks.
Study area,data collection and
analysis
Thedataonwhichtheanalysis isbasedweredrawnfrom
a farm management survey carried out in six villages
from KwenengandKgatlengdistricts in Botswana.Two
and four villages were selected from Kweneng and
Kgatleng districts, respectively.Thetwovillagesfrom
KwenengwereGabaneandMetsimotlhabe andthefour
from Kgatleng were Oodi, Morwa, Bokaa and
Modipane. The villages were similar in terms of
socio-economic characteristics. The selection of the
studyareawasjustified bythefactthatsmall ruminants
aremorepopularintheareathanmanyotherareasinthe
country.
Small RuminantResearch NetworkWorkshop 111

Panin
The two districts are located in the south-eastern
part ofthe countryandthe selectedvillages arewithin a
20-40km radius ofGaborone,the capital ofBotswana.
Like the restofthe country, the rainfall ofthe study area
isvariedin its distributionwith an annual mean ranging
from 400-500mm.The vegetation ofthe area is tree
savannah.The economy ofthe areais mainlybased on
subsistence farming,with about90% ofits total labour
forcedirectly orindirectlyengagedin agriculture (Panin
et al 1993). Mixed crop and livestock farming is the
common practice ofthe inhabitants. Cultivated areas
ranged from 1-14 ha with an average of 6 ha per
household.The major crops ofthe area are sorghum,
maize,beans and milletwith sorghum being the most
important single crop in terms of cultivated area and
utilisation. Productivity ofbothfoodcropsandforage is
relatively lowin the study area asin other areas in the
whole country.
The profitability ofthe small ruminantproduction
enterprisewasestimatedusingthe budgetary analytical
method.The budgetary analysiswasbased on cost and
returns data ofonly small ruminant household owners.
The total small ruminant owning household was 102.
The deciding factor for the inclusion of a particular
householdin this sample of102wasthatthe household
owned at least a unit of one of the small ruminant
species. Forthe enterprisebudget,the costs and returns
were estimatedfortheperiodunderreview.
Total costswere obtained by estimatingboth the
operating cost and the fixed cost. The operating cost
consists ofthe cost ofthe variable inputs used bythe
farmers.This costincludedthe expenses on medicines,
water, dipping, feeding and replacement ofthe stock.
The fixed cost was obtained by valuing the family
labour,the mostsingle importantfixed input underthe
smallholdersheepand goatsfarmingsystem inthe area.
Attemptstouse the depreciation methodto estimatethe
annual costofkraal revealed insignificantvalues,hence
thesewere excludedfromthe current analysis.Also, an
average interest rate of 12% representing the then
market rate for capital was used to reflect the
opportunity cost of capital tied up in the form of
investmentin sheep andgoats.
The returnswere obtained by estimatingthe total
valueofproductionwhichincludedthevalue ofanimals
sold and consumed by the households as well as the
value ofmilksold and consumed.Thefarm gateprices
fora unit ofeach productwasusedforthe computation
ofthe home consumedproducts.
Primary data were collected from 114 randomly
selected smallholder households from the six selected
villages through interviews with the aid ofstructured
questionnaires during the 1991/92 cropping season.
Information on several aspects of crop-livestock
farmingwas collected as well as other socio-economic
variables such as income transfers from other family
members residing andworking outsidethevillages.
Results and discussion
Ownership and distribution ofsmall
ruminants
The ownership ofthe small ruminants amongthe total
114 households studied is presented in Table 1. As
clearly shown in the table, goats were more widely
ownedthansheep.About90% ofthe samplehouseholds
possessed at least a unit ofgoat as comparedwith only
27% ofthesamesample householdswhoownedsheep.
Also,the percentage ofhouseholds owningany one of
the twospecies ofanimalwasthe same (90%) asgoat
owning households. Mixed flock ofsheep and goats
enterprisewasfoundtobe practisedbyonly27%ofthe
households in the area.The average number ofgoats
ownedacrossallhouseholdswas 19.Thisvariedgreatly
between the households as reflected in the standard
deviation (SD = 18.1). Sheep flock size also varied
considerablyamongthehouseholds, rangingbetween0
and64headwith an average ofonly27(SD=77).As
regards total number ofall ruminantsperhousehold,the
average flocksize was21.7with standard deviation of
about22.
Table 1. Ownership of small ruminants in Kgatleng and
Kweneng districts in Botswana, 1991/92(n=114)
Species All
Variables Goats Sheep ruminants
Per cent ofhouseholds
owningat least one
small ruminant 89.5 272 89.5
Meanflock size 190 27 21.7
(18.1)" (77) (21.4)
Range 0-93 0-64 0-110
a. Figuresin brackets are standard deviations.
Table 2 presents the frequency distribution of
number of animals for only ruminant owning
households. The total number of households owning
goats,sheepandbothspeciestogetherwere 102,31 and
102, respectively. The data in the table reveal very
striking information. In general, the frequency
distribution ofthe two species of animals was highly
skewed with a majority of the households owning
between 1 and 10 units of animals. However, the
skewness is highly pronounced among sheep owning
households. More than two-thirds (68%) of all sheep
owninghouseholdspossessedbetween 1 and 10units of
sheep. Incontrast,only38% ofallhouseholdswithgoats
had similar units of animals. The proportion of
households that owned more than 60 units of each
speciesofanimal orbothtogetherwas relatively smaller
at 5, 3 and 7% each for goats, sheep and both,
respectively.
Given that profitabilityper animal as reportedby
Mpho(1993)is much higher forgoats enterprise than
sheep, it is not surprisingto find outthat smallholder
112SmallRuminantResearchNetworkWorkshop

Profitability ofsmall ruminantproductionin Botswana
householdsin the study area keep averysmallnumber
ofsheep relative togoats.Anotherprobable reason for
thediscrepancybetweenbothspecies sizes mightbethat
the adaptation potential ofgoatstothe prevailingharsh
climatic conditions in the country may be higher than
that ofsheep.
Table2 Per cent distribution ofnumberofruminants among
owning households, Kgatleng and Kweneng districts,
Botswana, 1991/92
%households owning
Number of All
animals(range) Goats Sheep ruminants
1-10 38.2 67.8 33.3
11-20 24.5 22.6 23.5
21-30 14.7 6.5 17.6
31-40 8.8 n.a* 8.8
41-50 4.9 Il.d 3 9
51-60 3 9 Il.d 5 9
61-70 3 9 3.2 3 9
>70 1.0 Il.d 2.9
n.a.= not applicable.
Overall, higher numbers ofgoats are keptbythe
householdsthan sheep, suggestingthatgoats are more
popular in the study area than sheep. Similar
observationsfromvariousstudies conductedinthesame
area andsurroundings has been madebyMpho(1993),
Fane (1992)and Panin(1994).
Smallruminant enterpriseprofitability
analysis
The results of the budgetary analysis for the small
ruminant enterprise are presented in Table 3. On
average, the small ruminant production enterprise
earned a household a total netprofit ofP561.00.On a
per animal basis, an appropriate measure for the
profitability,the returnper animalwas P2300.
This suggests that a small ruminant production
enterprise is profitable. However, profitperse maynot
be the best measure ofhow efficiently the factors of
production have been utilised. The best measure of
efficiencyis thatwhich recognisesthe returnsperunit
ofinput. Since capitalhasbeen identified asone ofthe
constraints to increased agricultural production in the
area(Panin and Mahabile 1994),the return per Pula of
capital tied up in the small ruminant enterprise was
calculated.Thiswas to help in assessingwhetherit is
worth investing in such enterprise as capital has an
opportunitycost.Capital hereis referredtoasthevalue
ofthe total average number ofsheep andgoats owned
byahousehold. Data inTable3showthatthe return to
capitalwasconsiderablyhigh, about34%,exceedingthe
interest rate byalmost65%.
Table3.Small ruminant enterprise budget perhousehold in
the Kgatleng andKweneng districts in Botswana, 1991/92
Totalvalue
Variables (Pula)
A. Revenue
Salesfrom:
Animals 385 98
Milk 20751
Value ofhome consumed:
Animals 184.80
Milk 43290
SubtotalA 1221.19
B.Operating cost
Medicines 3537
Water 2023
Dipping 18 99
Feeding 8.17
Replacement 3537
Subtotal B 100.81
C. Fixedcost value offamilylabour 36000
D. Interest on capital 199 36
E. Total cost ofenterprise (B+C+D) 660.17
F.Net enterprise profit (A-E) 561.02
G. Profitper animal 23.18
Percentage return on capital* 3377
*=(56102/16613) 100=3377
Income contribution ofsmall ruminants
Thesummaryofthefarmhouseholdincome analysisfor
the small ruminant owninghouseholdsispresented in
Table4.The nethouseholdincome is derived from the
total netrevenuesfromcropand livestockproduction as
well as non-farm employment. The average net
householdincomeforthe yearunder reviewamounted
to P6306.
The relative contributions ofthe various income
Sources are shown in column three of Table 4. The
contribution from agriculture (livestock and crops)
amounted to 55.3% of total household income. This
findingcontradicts the result ofPanin et al(1993)who
found out that contribution of non-farm employment
sources (53%)in the same areawas higherthan that of
agriculture(47%).The discrepancy mightbe duetothe
difference in the samplingprocedure.While Panin etal
(1993) considered income of all selected households
irrespective of one owning animals or not, the current
analysis focused only on households owning small
ruminants.
Comparison between crop and livestock incomes
reveals thatwhile livestock accounted for49% oftotal
net income, crop production contributed a mere 6%.
Within the livestock sector, cattle contributed the
highest (33%). Nevertheless,the contribution of small
ruminantissubstantial,amountingto15%.Thisexceeds
the contribution from crops by 58%. This finding
provides enough evidence for the smallholderfarmers
to reallocate some resources from crop production to
Small RuminantResearch NetworkWorkshop 113

Panin
smallruminantproductionifonlytheyviewprofitability
andefficientutilisation ofresources astheirmaingoals.
Table 4. Summary offarm household income analysis for
Kgatleng andKwenengdistricts in Botswana, 1991/92
Amount 9/ ,
Income source (Pula) contribution
A. Net croprevenue 3890 6.2
B. Net livestockincome:
Smallruminants 921.0 14.6
Cattle 2102.7 33.3
Others 787 1.2
Subtotal 3102.4
C. Netfarmincome(A+B) 3491.4
D. Off-farmincome 2814.2 44.6
E. Total net household 63056
income(CD)
Conclusions
The study has examined the profitability and
contribution of small ruminant production as an
enterprisetoruralhouseholdincomes.The analysiswas
mainlybased on 1991/92 data on 102 small ruminant
owning households from Kgatleng and Kweneng
districts in Botswana. Itis evidentfromthe results that
small ruminant production is both profitable and
economicallyviable. It accountsfor a substantial share
(15%)ofthe total average rural householdincome. Its
contribution to the householdincome exceeds that of
crop production by 58%.Smallholder farmers should
exploit the potential benefits of small ruminants by
allocating more resourcestotheirimprovement.
References
CSO(CentralStatistics Office). 1991.AgriculturalStatistics
1990: 1990Agricultural Survey Report. Government
Printer,Gaborone,Botswana. 150pp.
FaneB. 1992.Socio-economicImportanceofSheepandGoats
Production in Botswana. Diploma dissertation,
Department ofAgricultural Economics, Extension and
Education,BotswanaCollege of Agriculture, Botswana.
(unpublished)
MoA (Ministry of Agriculture). 1989. Agricultural Sector
Assessment:A StrategyforDevelopment ofAgriculture
in Botswana.GovernmentPrinter,Gaborone,Botswana.
239pp.
MoA (Ministry of Agriculture). 1991. Botswana's
AgriculturalPolicy: CriticalSectoral Issues andFuture
Strategy for Development. Agricultural Information
Sector, Gaborone, Botswana.51pp.
Molefe D. 1987.Sheep andgoatproductionin Botswana. In:
AdenijiK.O.andKategileJA.(eds),Proceedings ofthe
Workshop on the Improvement ofSmall Ruminants in
Eastern and Southern Africa, Nairobi, Kenya 18-22
August 1986. OAU (Organization of African
Unity)/IDRC (International Development Research
Centre),Nairobi, Kenya.pp.235-243.
Mpho I. 1993.The Contribution ofSmall Ruminants toRural
Farm Household Income: A Case Study ofThree
Villages. BSc dissertation, Department ofAgricultural
Economics, Extension and Education, Botswana
College ofAgriculture,Gaborone, Botswana.
Panin A. 1994. Relative Economic Efficiency ofGoats and
Cattle Production Systems ofSmallholder Farmers in
Botswana. Working Document. Department of
Agricultural Economics, Extension and Education,
BotswanaCollege ofAgriculture,Gaborone,Botswana.
25pp.
PaninA. andMahabileM.1994.Response oflandproductivity
to wealth ofsmallholderfarmers in Botswana: A case
study.Paperacceptedforpresentationintheforthcoming
Fifth Annual Conference ofSADC-Land and Water
ManagementResearchProgrammetobeheldinMaseru,
Lesotho, 10-14October 1994.
Panin A., Glahah P., Mahabile M. and Sebolai S. 1993.
Smallholder sorghum production constraints in arid
Africa and their implications for household food
security:A case study of Botswana. QuarterlyJournal
ofInternationalAgriculture3:308-320.
Rentabilité et contribution de l'élevage despetits ruminantsau
revenu des ménages rurauxen Afrique: étude de cas des districts de
Kgatlenget Kwenengau Botswana
Résumé
Cette étude évalue la rentabilité de l'élevage des
petits ruminants et sa contribution au revenu des
ménages rurauxen Afrique.L'analyse est basée sur les
donnéesd'une enquête de gestion agricole effectuée en
1991/1992 sur 114 ménages depetits exploitants des
districts de Kgatleng et Kweneng au Botswana. Des
analyses du budgetfamilial et du revenu des ménages
ont servià évaluer la rentabilité de l'élevage despetits
ruminants et sa contribution relative audit revenu. Les
résultats ont montréque l'élevage despetits ruminants
estune activitéà la fois rentable et économiquement
114Small RuminantResearch NetworkWorkshop
Profitabilityofsmall ruminantproductionin Botswana
viable. Elle procure aux ménagesun revenu moyen de
23pulaparanimal.Par ailleurs, sarentabilité estde34%
du capital investi.Sa contribution, estimée à 15% du
revenu du ménage, était substantielle et dépassait de
58% en termes relatifs celle de la production végétale.
Les petits éleveurs de cette zone devraient par
conséquent profiter des avantages potentiels de
l'élevage des petits ruminants pour accroître leurs
revenus en allouant des ressources accrues à
l'amélioration de cette activité. Enfin, tout doitêtre mis
en oeuvrepouramener les dirigeants, les chercheurs et
les paysans à prendre conscience de la viabilité
économique de l'élevage despetits ruminants dans le
pays etailleurs en Afrique.
Small RuminantResearch NetworkWorkshop115


Facteurs de variation de la production laitière des caprins
en milieupeul
BaDiaoM,GueyeA. etM.Seck
Institut sénégalais de recherches agricoles
Direction des recherchessur lesproductions etlasanté animales
BP.2057,Dakar-Hann (Sénégal)
Résumé
Cette étude sur les facteurs de variation de la
production laitière des caprins en milieu peul a été
effectuée dans la zone des Niayes de Dakar (Sénégal).
Les paramètres de reproduction, de croissance, de
mortalitéetdeproduction laitièreysont analysés.L'âge
des femellesà la première parturition est de 16 mois,
l'intervalle entre mises bas est de 280jours et la taille
moyennede la portée est de 1,36chevreau. Le quotient
de mortalité (32,4%) est élevé. La lactation dure
184jours et laproduction prélevée s'élèveà31 kg. La
production caprine joue un rôle socio-économique
importantenprocurantdes revenus assez substantiels et
en participantà la couverture des besoins en protéines
animales.
Introduction
Au Sénégal, les Peul entretiennent des troupeaux
de bovins et de petits ruminants. Dans leurs systèmes
d'élevage, l'espèce caprine joue un rôle socio
économique important. Le déstockage facile permetà
l'éleveur de bien adapter ses ventes à ses besoins
immédiats en argent. De la sorte, la chèvre joue le rôle
de tirelire, que ne pourraient remplir en aucun cas les
bovins, représentantun capitalbientrop élevé.C'est sa
petite taille qui en fait égalementun animal de choix
pour les sacrifices et les dons.Sa reproduction rapide
(maturité sexuelle précoce, grande prolificité,
dessaisonnement) estun atout dansunpays quicomme
le Sénégal, connaît des sécheresses successives. Elle
permetdecompenser lesfortes mortalités etassure ainsi
au moins l'autorenouvellement des troupeaux, même
dans les conditions lesplus difficiles.
Dans les systèmes de production peul, le lait est
également un produit important avec deux finalités,
l'autocosommation et la commercialisation. Ce lait,
richeen protéines de hautevaleur nutritive, contribue à
la satisfaction des besoins en protéines animales des
populations rurales et constitue une source de revenus
pour les populations proches des centres de consom
mation.C'est dansle soucid'améliorercetteproduction
laitière caprine qu'un programme de recherche a été
initié en 1992 par l'Institut sénégalais de recherches
agricoles(ISRA/LNERV) avec le concoursfinancierdu
Centreinternationalpour l'élevage enAfrique(CIPEA).
L'étude préliminaire a comme objectif d'une part,
d'étudier les facteurs de variation de la production
laitière caprine en milieu peul afin d'identifier les
contraintesetd'autre part,defaire desrecommandations
susceptibles d'améliorercetteproduction.
Matériels et méthodes
Localisation
Ces travaux sont effectués au niveau des
communautés rurales de Sangalkam et de Sébikotane
situéesà environ40à50km au nord-est de Dakar dans
le département de Rufisque. Par rapport au reste du
pays, la zone des Niayes possède un microclimat
particulier caractérisépar des températures moyennes
modérées(21,4'Cenjanvier-févrieret28'Cenoctobre)
et une humidité relative assez élevée (toujours
supérieure à 50%). On distingue une saison humide
(juillet-octobre) et une saison sèche.ASangalkam, la
pluviométrie était de 365,6 mm entre 1984 et 1993,
contre 541 mm de 1941 à 1970 avec des variabilités
interannuelles de 14%. L'élevage et l'agriculture sont
par conséquent les deux principales activités écono
miques, le maraîchage constituant la plus dominante.
Cette étude couvre huitvillages etvingtéleveurs.
Matérielanimal
Les animauxsontà l'origine trypanotolérants, car
la région était infestée deglossinesavant les campagnes
de lutte menéespar le Laboratoire nationalde l'élevage
(Touré, 1981;Touré, 1983). La race caprine exploitée
dans la zone périurbaine de Dakar est un produit du
métissage entre la chèvreguinéenne et celle duSahel, le
pourcentage desangde cette dernière allant croissant.
Collecte des données
Suiviindividuel desperformances
La méthode utilisée pour la collecte et la gestion
des données est celle du "Programme pathologie et
productivité des petits ruminants (PPR)" initié par
SmallRuminantResearchNetworkWorkshop 117

Ba Diao et al
l'Institut sénégalais derecherches agricoles(ISRA)et
leCIRAD-EMVT.Ceprogramme"Panurge"basé
surun systèmede contrôle etde suividesperformances
individuelles, est destinéà fournirune estimation de la
productivité des races locales en élevage traditionnel
(Faugère et Faugère,1993)
Les troupeauxsont visitéstous les quinzesjours.
Lesdonnées enregistrées sont lessuivantes
– Suivi de la démographie du troupeau (repro
duction, exploitation, mortalités)etsuivi sanitaire.
– Contrôle bimensuel de la production laitière.
Seules les quantités de lait prélevéespar le berger
sont notées. Le contrôle laitiers'effectue avec des
pots de mesure.La conversion en poids a étéfaite
en multipliantlesquantités obtenuespar la densité
moyennedu lait(1,035).
– Suivide lacroissance des chevreauxpardespesées
mensuelles de la naissanceà 1 an.
Chaque action menée sur le terrain est consignée
surunefiche. Lesdonnées recueilliessurcesfiches sont
ensuite transcrites surun "fichier manuel" comportant
une fiche par animal. Chaque fiche contient les
informations concernant le déroulement de la carrière
de l'animal depuisson entrée dans le troupeaujusqu'à
sa sortie. La cohérence des informations recueillies est
testée sur ce fichier manuel avant la saisie sur le fichier
informatique.
Enquêtesà l'échelle destroupeaux
- Suivi des recettes et des dépenses liées à la
production laitière caprine par des enquêtes
mensuelles;
– Suivi des pratiques de conduite sur parcours :
enquêtes biannuellessur lespâturages utilisés, les
temps deparcours;
- Sondage sur la valeur alimentaire des parcours
naturels en 1992 et 1993:prélèvements mensuels
de biomasse herbacée sur 12 sites identifiés,
détermination de la matière sèche et analyse
bromatologique.Sur chaque site, la biomasse est
mesuréeà l'aide d'unpeson sur cinqbandes d'un
mètre carré prises au hasard. Ensuite un
échantillon est prélevé pour faire l'objet d'une
analyse chimique.
Analyse des données
Lesystème degestion des donnéesduprogramme
Panurge génère automatiquement certaines variables
comme l'intervalle entre misesbas, le poidsàâgetype
et le GMQ. Il assure une sortie des données sous
plusieursformatstransférablesauchoixsurdes logiciels
d'analyse. Les données des enquêtes ontétésaisies sur
Dbase;et les analyses effectuées grâce au logiciel
"Statistical Program of Social Science" SPSS
Version 4.0. Il permet d'effectuer des analyses
statistiques sur des effectifs généralementinégaux et
non proportionnels. Les modèlesd'analyse devariance
multifactoriellegénéralementutiliséssont de laforme:
= XB+e
variable expliquée;
est une matrice des coefficientsfixespour
le caractère considéré;
estun vecteurinconnu des effets fixes des
facteurs testés; et
e estun vecteurinconnu des erreurs aléatoires
normalementdistribuées.
y
où Y estunvecteurd'observations relativesà la
X
B
Résultats et discussions
Peuplementanimal
Structure démographique
Lafigure 1 représente la structure démographique
des caprins suivisau31juillet 1994. Lestroupeauxsont
essentiellementconstitués defemelles,qui représentent
75%de l'effectif total.Leurcarrière est longue,3%des
femelles dépassent l'âge de sept ans. La base large dé
noteuneféconditéélevée.Les mâlessont exploitéstrès
jeunes.Lesboucsâgésde plusd'unanreprésentent22%
des mâles.
Propriété desanimaux
Les caprins appartiennent aux femmes qui en
détiennent80%.Contrairementauxbovins, le confiage
est rare chez les caprins et ne concerne que 13% du
cheptel. Lesproprétaires sontles membres de lafamille,
desparents ou amisdesvillagesvoisins.
Conduite destroupeaux
La conduite des troupeaux est l'ensemble des
pratiques mises en oeuvre par les éleveurs sur leurs
animauxenvue d'assurer leur entretien et de les mettre
en condition de réaliser les performances qu'ils en
attendent (Landais, 1987). On distinguera ici les
pratiques d'alimentation (conduite au pâturage,
complémentation et abreuvement), de logement, de
traite et de conduite de la reproduction.
Alimentation etabreuvement
Lespâturages naturels constituent lesprincipales
ressources alimentaires des animaux dans la zone. La
productivitéde la strate herbacée est faible,voire nulle
pendant8moissurles 12de l'année. Les prélèvements
de biomasse effectués sur 12sites en 1992 et 1993 ont
révéléune production faible comprise entre 500kget
800kgde matière sèche parhectare. Lastrate ligneuse
est composée de Maytenus senegalensis, d'Acacia
albida,de Parinarimacrophyla, de Crateva religiosa.
118Small RuminantResearch NetworkWorkshop

Production laitière des caprins en milieupeul
Mâles24,6%
sox 2sx 2ox 15x 1ox 5% 094
Figure 1. Structure démographique des caprins étudiés
Les caprins sontconduits aupâturage le matinvers
dix heures et ramenés vers dix-neufheures pendant la
saison sèche ou 17heurespendant la saison despluies.
L'abreuvementsefaitunefoisparjourpendant lasaison
sèche; durant la saison despluies, les animauxpeuvent
bénéficier de l'eau des mares.Auretourdupâturage, la
complémentation est presque inexistante, les pro
ducteurs estimant que les caprins sont des animaux
résistants.Trois éleveursprétendent complémenter les
animaux lesplusfaibles et lesfemelles allaitantes avec
essentiellementdufoinde brousse. Lessous-produitsde
maraîchage sont distribués en priorité aux bovins et
OV1I1S.
Traite
La traite manuelle des chèvres s'effectue une fois
parjour, le matin, avant le départ dutroupeaupour le
pâturage. Elle est pratiquée dans90% des cas par les
femmes.
La descente du lait chez la chèvre n'est pas
stimulée par la tétée. Les chevreaux n'ont accès à la
mamellequ'unefois la traite terminée. Elle démarreune
semaine à un mois voire deux après la mise bas, en
fonction de la saison, de la taille de laportée et du rang
de mise bas.Toutes les femelles ayant mis bas ne sont
pas traites. La décision de traire une femelle dépendde
sonpotentiel estimépar l'éleveur ainsi que du nombre
depetitsàallaiter. Lesprimipares sont rarement traites.
Le sevrage est naturel et intervient entre 5et6mois. Il
peut être cependantprécoce lorsque lafemelle redevient
gravide rapidement.Tous leséleveurs ne pratiquentpas
la traite. Cinq (5) d'entres eux l'ont abandonnée en
raison de leurs effectifs faibles (2) ou parce qu'ils
Classe
d'age
> 7
6 - 7
5 - 6
4 - 5
3 - 4
2 - 3
1 - 2
O - 1
Femelles75,4%
5x 1o% 15x 2o% 25%
estiment les conditions d'exploitationpeufavorablesà
uneproduction laitière soutenue (3).
Reproduction
Les mâles et lesfemelles ne sont séparés que les
soirs lorsqu'ils sontattachésaupiquet.Les mâlesenâge
de reproductionn'ayantéténivendus,niretenuspourla
reproduction, sont castrés par les méthodes tradi
tionnelles. La castration demeure cependant une
pratique rare en raison de l'exploitation précoce des
mâles. L'accouplement sefait donc en monte naturelle
ettoute l'année.
Logement
Les caprins sont parqués au piquet en plein air
pendant toute la nuit etgénéralementà l'intérieur des
concessions pour permettre une surveillance plus
rapprochéeà cause desvols.
Conduitesanitaire
Le traitement des différentes pathologies se fait
parles méthodestraditionnelles. Les agents de l'élevage
ne sont jamais sollicités et les animaux ne sont pas
déparasités. Lavaccinationcontre les maladies n'estpas
systématiquecarelle estpayante. Leséleveurs suivisne
l'ontjamais demandée.
Résultats et discussions
Dans la zone périurbaine de Dakar, les caprins
sont exploités dans des conditions alimentaires et
sanitaires difficiles. Les producteurs n'ontpas changé
leurs pratiques de conduite malgré la présence d'une
production animale intensive dans la région.
Small RuminantResearch NetworkWorkshop 119

Ba Diao et al
Reproduction
Répartition des mises bas
La répartition des naissances est bimodale
(figure 2), avec une période principale des naissances
entre novembre et janvier (42,8% des naissances),
une seconde période entre février etjuin (402% des
naissances)et enfin une saison avecpeu de naissances,
de juilletà octobre (17% des naissances). Les saillies
fécondantes des chèvres sontplusfréquentes entrejuin
et août c'est-à-dire en fin de saison sèche et en début
de saison despluies.Cela est liéà la disponibilité des
feuilles etgousses d'arbres tels que l'acacia en fin de
saison sèche et l'abondance du pâturage en août. Les
Nbde mises bas
saillies sont également frequentes entre septembre et
janvierc'est-à-dire enfindesaisondespluiesetendébut
de saison sèche froide. Cette période reste toujours
favorable sur leplan alimentaire.
Lesfemelles ayant misbas entre juillet et octobre
ontétéfécondées entre févrieret mai. Elles ne sontpas
nombreusesà cause des conditions alimentaires plutôt
défavorables (pleine saison sèche). Dans le nord du
Sénégal, Faugère et al.(1989)observentunepériode de
mise bas en saison sèche:60à70% des naissances ont
lieu en quatre mois(décembreàmars)tandis qu'ausud
les misesbas ont lieu toute l'année avec deux regrou
pements des naissances (mars-avril-mai etseptembre
octobre-novembre).
80 _ \
N
60 _ \ \
\ N
N N N N
\ \ \ \ \ \ \ s \ \\ \ \ \ \ \ \ \ \
Mois de la mise bas
Figure2. Répartition des mises bas au cours de l'année
120 Small RuminantResearch NetworkWorkshop

Production laitière descaprins en milieupeul
Pourtoutes lesanalyses, statistiques ultérieures,on
distingueraunesaison I(novembreàjanvier),unesaison
II(févrieràjuin)etune saison III(juilletà octobre).
Ageà la première mise bas
La moyenne générale de l'âgeà lapremière mise
bas est égale à 46902E1357jours soit environ seize
(16) mois. Cet âge est supérieur à celui de 361 jours
rapporté par Faugère et al (1988) dans la région de
Kolda mais inférieur à celui de 522jours rapportépar
Faugère et al (1989) dans la région de Louga.
Intervalle entre mises bas
L'intervalle moyen entre mises bas est de28045
t949jours soitenviron neuf(9)mois. Il est inférieurà
celui de 367jours rapportépar Faugère et al(1989)à
Louga mais supérieurà celui de248 +8jours rapporté
par Faugère et al. (1988) dans la région de Kolda.
Cependant,il est comparable au chiffre de 283jours
observépar Berger citéparMoubinou(1990).
Ceparamètre estinfluencéparplusieurs facteurs
La saison de mise bas influence (P<0,05)
l'intervalle entre chevrotages. Les intervalles les
plus courts sont obtenus pendant la saison III
(hivernage)carla quantité et la qualitédufourrage
disponible permettent une reprise rapide des
activitéssexuelles desfemelles.Leschèvres ayant
mis bas au cours des saisons I et II ont desinter
valles entre misebasplus longs.Cela serait dû au
fait que le disponible fourrager se raréfieprogres
sivementde lasaison sèchefroideàlasaisonsèche
chaude.
L'année de mise bas a une influence très
significative (P<001)sur l'intervalle entre mises
bas. L'intervalle leplus court est relatifaux mises
bas de 1993.
• Lerangde la mise basauneinfluence significative
(P<005) sur l'intervalle entre mises bas.Celui-ci
diminueprogressivementde la 1èreàla4èmemise
bas. Ce résultat correspond à celui rapporté par
Faugère et al (1988)dans larégion deKolda.Cette
diminution progressive est peut-être à lier à la
croissance desfemelles, lesquelles atteignent leur
poids adulteà partir de la4ème mise bas.
Prolificité
La portée moyenne est de 1,36 chevreau, un
chiffre compris entre ceuxde 1,24 rapportépar Faugère
et al. (1989)à Louga et de 1,50 enregistrépar Faugère
et al (1988)dans la région de Kolda.
Performancesdecroissance
Poids moyen etgain moyen quotidien
Les poids moyens et les GMQ enregistrés sont
présentésauxtableaux 1 et2etles courbes de croissance
à lafigure3.
Tableau 1:Poids moyens (kg) en fonction de l'âge
Age(mois) Femelles Mâles
Naissance 1,7E04(n=78) 2.2t0,6(n=41)
1 44E 1,2(n=319) 46E 1,2(n=335)
3 8,1+ 1,8(n=283) 87E2.2(n=296)
6 125E26(n=234) 132E3(n=197)
9 158E32(n=152) 16,81E3,1 (n=102)
12 19,1+3(n=78) 20.3E3.2(n=36)
Tableau2:Gain moyen quotidien (GMQ)par classe d'âge
Classe d'âge Femelles Mâles
1-3 mois 61,4+ 22(n=274) 667E26(n=281)
3-6 mois 456E 19(n=232) 509+25(n=192)
6-12 mois 389+12(n=78) 38,7E 11 (n=36)
La croissance des chevreaux entre un et douze
mois est supérieureà celle enregistréeàLouga et Kolda
mais inférieure à celle observée à Kaolack
(CIRAD-EMVT,1991).Lepoidsadulte desfemelles (à
partir de la 4ème mise bas) atteint 25+2 kg sur 140
observations,une moyenneinférieureà celles de31 kg
observée à Kaolack et de 27 kg enregistrée à Louga
mais supérieure à celle de 23 kg rapportée à Kolda
(CIRAD-EMVT,1991).
Facteurs devariation de la croissance
L'analyse de variance montre que la saison de
naissance aun effetsignificatifàtous lesâges. De l'âge
d'un à trois mois, les chevreaux nés en saison III sont
plus lourds dufait du disponible alimentaire en saison
des pluies. Par contre à douze mois, les petits nés en
saison I deviennentplus lourds du fait de l'effet de la
croissance compensatoire pendant la saison des pluies.
L'année de naissance aun effet hautement significatif
(P<0001)sur lespoids des animauxâgés deunà trois
mois. Les pluviométries enregistrées en 1992 et 1993
sontfaibles. Mais la répartition en 1993 est meilleure et
la disponibilité en herbe du pâturage s'est prolongée
jusqu'aumoisd'avrilde l'année 1994.D'autresfacteurs
peuventjouer telsquelatempérature, l'hygrométrie,etc.
L'analyse de variance montre que le mode de
naissance a un effet significatif sur la croissance des
chevreaux âgés d'un à 12 mois. Les triplés sontplus
légers que les jumeaux et encore plus que les produits
simples. La différence estplus netteà trois mois(1 kg
de moins que les jumeaux, 1,9 kg de moins que les
produits simples).Celapeuts'expliquerpar le fait que
laproduction maternelle seraitinsuffisante pourcouvrir
totalement les besoins de deux ou trois produits. Ce
phénomène est signalé par Faugère et al (1988) qui
précisent cependant que les doublés et triplés en
pâtiraient moins longtemps du fait d'une aptitude plus
précoce à utiliser le fourrage, ce qui a également été
constaté ici sur lesGMQentre trois et sixmois(P<005).
Chez les caprins, l'effet du sexe sur le poids est
hautementsignificatif(P<0,001)àtoutâge. Les mâles
Small RuminantResearch NetworkWorkshop 121

Ba Diao et al
Poids moyens
30
25T
20
15
10
Figure3. Courbe de croissance des chevreaux
sont légèrement plus lourds à un mois (200g) et la
différenceaugmenterégulièrementpouratteindre 1,2kg
à douze mois. Les mâlesprennentplus rapidement du
poids que les femelles entre 1 et3mois.Cela estdûau
fait qu'ils naissent plus lourds et sontplus compétitifs
que celles-cipour l'utilisation du lait maternel. Par la
suite, la différence de GMQ s'estompe progres
sivement. Les mâles atteignent plus rapidement leur
poidsadultetandis que lesfemelles sonten pleinephase
decroissance.Enplus, il faudrait tenircomptede la prise
de poidssupplémentaire liée àla 1èregestation chez les
femelles.
L'effet du rang de mise bas est hautement
significatif(P<0001)au cours destroispremiers mois
de la vie.Au 1ère mois, les produits de mères multi
pares sontplus lourds que ceuxdesprimipares.Apartir
du 2ème mois, les chevreaux issus des primipares
deviennent plus lourds. Cette situation s'explique par
le fait que chez les primipares, la traite est rare et la
prolificité est inférieure à celle des multipares.
Généralement, le lait estentièrementdisponiblepourun
chevreau. Lepoidsplusfaible au 1er mois desproduits
deprimiparespeutêtre liéà laproduction laitière plus
faible des mères.
Le troupeau a un effet hautement significatif
(P<0,001)àtoutâge.Cephénomène s'explique par les
pratiquesd'élevage différentesd'un éleveuràun autre.
Mortalité
Donnéesgénérales
Lafigure4présente larépartition des mortalitésen
fonctionde l'âge audécès.L'analyse de cette répartition
Mois
permet d'identifier une période de mortalité sous la
mère, de la naissance jusqu'à 3 mois (55,1%). Cette
perte sous la mère estprincipalement due auxmaladies
(gâle) et auxtroubles de la croissance.
Lafigure5présente l'évolution de la mortalitédes
animaux au cours de l'année. Pendant le mois de mai,
on enregistre 195% de mortalité. Cetteperte en fin de
saison sèche estprobablement liée à l'affaiblissement
desfemelles en lactation suite au manque de ressources
alimentaires pendant cette saison. Lespertes en saison
des pluies correspondent à des mortalités d'animaux
sevrés essentiellementà la suite de diarrhées.
Quotientde mortalité
La mortalité est appréciée sur un effectifinitial,
l'estimateur estdoncun quotientde mortalité(et nonun
taux).Comptetenu dufait que les animaux(surtout les
mâles)sont exploités de manière précoce, le calcul du
quotient tient compte desanimaux"émigrés".Onadmet
que les animauxexploités ont été en moyenne exposés
au risque de mourir pendant la moitié de la période
considérée et que chacun compte pour un demi-sujet
dans lapopulation exposée. Les quotients de mortalité
sontcalculéspourlesquatre classesd'âge de3moispour
tenir compte de la variation du taux d'émigration en
fonction de l'âge.C'estàpartir de ces quatre quotients
qu'àétécalculélequotientde mortalitédelaclasse0-12
mois. Pour cette étude, on dispose d'une cohorte
d'animauxnés entre mars 1992etseptembre 1993
Letableau3présente lesquotients de mortalitépar
classe d'âge et par sexe. Pour la classe 0-12 mois, la
mortalitédesmâles est plus élevée (258%) que celle
122 Small RuminantResearchNetworkWorkshop

Production laitière des caprins en milieupeul
Nombre de cas
30
25 -
20 -
15 -
10 -
N
Figure4. Mortalitédes chevreaux entre0 et 12mois.
6
Age (mois)
9 10 11 12
10 _ \ ss
S N
, | s \ \ \ \ s S S §
\ \ \ \ \ \ \ \ \ \ \
0
Jan. Fév. Mars &al
Figure5. Evolution des mortalités au cours de l'année
desfemelles(23,7%). Le quotientgénéralpour lesdeux
sexes est de 32,4%. Pendant l'année, la mortalité des
mâles estplus élevée que celle des femelles, mais les
différences ne sont pas statistiquement significatives
(P>005). Pour les animauxdes deuxsexes, la mortalité
Juin Juil. Août Sept. Oct.
Mois
varie avec l'âge et estplusimportante entre 0et3mois
avant de diminuer pendant le reste de l'année. Ces
quotients de mortalité mâles etfemellessontinférieurs
à ceuxrapportésparFaugère et al(1988) dans la région
de Kolda(47% et30%, respectivementpour les mâles
Small RuminantResearchNetworkWorkshop 123

Ba Diao et al
Tableau3:Quotient de mortalitépar classe d'âge etpar sexe
Femelles Mâles Totaux
Classesd'âge I M Em Qm I M E Qm I M E Qm
0-3 mois 177 25 1 14,1 187 34 3 19,1 364 59 4 16,3
3-6 mois 151 10 2 6,6 150 10 13 70 301 20 15 68
6-9 mois 139 13 5 100 127 8 20 6,8 266 21 25 8,3
9-12 mois 121 6 14 99 5 23 5,8 220 11 37 55
0-12mois p77 - - 237 187 - - 25,8 364 - - 32,4
Qm = quotient de mortalitéthéorique
I effectifinitial
M = animaux morts
E - animauxexploités
et lesfemelles).Le quotientannuelpour les animauxdes
deux sexes est compris entre les résultats de Louga
(25%)et ceuxde Kolda(32%)(IEMVT-CIRAD,1991).
Les quotients de mortalité annuelle selon la saison de
naissance sontde32,8%pour la saison I;33,2%pourla
saison II et 292% pour la saison III. La saison de
naissance ne semble pas influencer de manière
significative le quotient de mortalité (chi* =5,99 avec
ddl=2).
Chezles caprins, letauxde naissancesgémellaires
est élevé.Cetavantage n'est-ilpas contrebalancéparun
taux de mortalité élevé?. En moyenne, 29,5% des
naissances sont simples et 35,6% sont multiples. La
taille de laportée 3a étérattachéeà la2en raison d'un
effectifinitial faible. La différence entre les portées des
naissances simple et multiple n'estpas statistiquement
significative(P<05).
Causes de mortalité
Le tableau4présente les causes de mortalitépar
âge.
Lapremière remarque est lepourcentage élevédes
causes de mortalité non identifiées (37%). Le fait que
l'éleveur ne puisse pas dire s'il s'agit de l'évolution
d'une maladie ou d'un accident montre que le contrôle
des animaux est difficile.
Tableau4:Causes de mortalitépar classe d'âge
La seconde remarque est l'absence des maladies
transmises par les tiques telles que l'anaplasmose,
affections répandues dans la zone(Guèye et al., 1986).
L'interloculeur estun élémentimportantdans laqualité
de l'information recueillie. Les enfants,qui assurent la
conduite au pâturage d'où des animaux ne reviennent
pas, n'ontpas été associés auxenquêtes. Etpourtant ils
auraientpeut-êtrepu donnerdesprécisions sur l'état et
les signes décelés sur l'animal avant son décès. Par
ailleurs, des visites tous les 15jours nous semblent
éloignées pour permettre aux techniciens d'identifier
toutes les maladies qui peuvent avoir des formes
d'évolution aigüe. Le programme PPR a d'ailleurs
instauréun suivi sanitaireà raison d'une visite tous les
trois jours(Moulin,1993).
Production laitière
Il n'apas étépossible d'estimer la quantité de lait
consomméeparles chevreaux. En milieu traditionnel,il
esttrès difficile d'utiliser la méthode de la double pesée
du chevreau avant et après la tétée. Les résultats de
recherche en station qui seront disponibles pro
chainement permettront d'estimer la quantité de lait
consommée par les chevreaux en fonction de la
croissance.
Causes Age (mois)
0-3 3-6 6-9 9-12 12-24 >24 Total
Accident 4 7 4 1 5 4 25 87
Malnutritiontroubles 36 8 2 2 4 0 52 18,1
de la croissance
Maladies dont 38 24 17 6 13 6 104 36,1
gale 14 10 10 2 5 3 44 15.3
diarrhée 12 4 1 0 2 0 18 6,2
Troubles respiratoires 3 3 0 2 0 1 9 3,1
Maladies nonidentifiées 9 7 6 2 7 2 33 11,5
Causes nonidentifiées 31 19 10 5 13 29 107 37,1
Total 109 58 33 14 35 39 288 100
% 37,8 20,1 11,5 49 122 13,5 100 -
124 Small RuminantResearch NetworkWorkshop

Production laitière descaprins en milieupeul
Donnéesgénérales
Ladurée moyenne de lactation estde 184E71jours
soit environ six(6) mois, chiffre voisin de celui de 180
jours rapportépar Charray et al. (1980) sur la chèvre
sahélienne.Chezlachèvre deMassakory, elle estde 135
+ 6jourssur 173 observations avec des extrêmes de54
et 155jours(Charray etal, 1980).La production laitière
moyenne prélevée est de 31t11 kg avec un minimum
de 11 kg etun maximum de 56 Kg.Quantà la durée
moyenne de la traite, elle est de 140+65jours. Enfin,la
production laitière moyenneprélevée parjour de traite
est de 273t162 g, avec un minimum de 61 g et un
maximum de557g.
Facteurs devariation de la quantitéde laitprélevée
Le stade de lactation influence la quantité de lait
traite (figure6). Les quantités de lait prélevéesparjour
sont maximales entre la 4ème et la 6ème semaines.
Ensuite, ellesdiminuentprogressivement,labaisseétant
plusforte au-delà de la 14e semaine.
La saison de mise bas a une influence hautement
significative (P<0001). La quantité de lait traite après
les mises bas de saison des pluies estplus importante.
Cela est lié à la disponibilité et à la bonne valeur
nutritive de l'herbe. Ladurée de latraite estpluslongue.
Cette production laitière diminue si la mise bas
intervient en saison sèchefroide, les caprinsbénéficiant
d'un pâturage de qualité moyenne. Elle devient
Production laitière
(g/jour)
médiocre avec une mise bas de saison sèche chaude,
l'alimentation étant la contrainte majeure.
Le rang de la mise bas a un effet significatif
(P<005)sur laproduction laitière. Lesfemellesprimi
paressubissent unepression detraite moinsforte que les
multipares. Laproduction laitièreaugmenteavec le rang
de lactation.Cela està lierà la diminution progressive
desbesoins de croissance desfemellesaufuretà mesure
qu'elles s'approchent du poids adulte. Les femelles
allaitant deux chevreaux produisent autant de lait trait
que celles qui n'en allaitent qu'un. Ces résultats
corroborent les observations de Koussou et Bourzat
(1993) et deChamchadine(1994).
Le troupeau a un effet hautement significatif
(p<0001)sur la quantité de lait traite. Une étude plus
poussée des pratiques d'élevage s'avère indispensable
pour expliquer ces différences.
Traite et croissance des chevreaux
Il convient de signaler qu'autableau7, on n'apas
représenté les deuxsexes séparément car il n'yapas eu
d'interaction entre la pratique de traite et le sexe.
L'effet de la traite sur la croissance des chevreaux
est significatif(P<005)entre le2ème et le6ème mois,
période au cours de laquelle la différence depoidsvade
300à800g.Cephénomènepeuts'expliquer par le fait
que la traite commencegénéralementau-delà d'un mois
après la misebasetse terminevers cinqàsix mois. Les
192--
180 --
168 --
156 --
144 --
132 --
120 --
MG= moyennegénérale
------------ SS= saison sèche (Av.-M.-J)
96 -- SP=saison despluies (Août-Sept)
Stade de lactation (semaines)
108 --
84 --l l l l 1
2 4 6 8 10 12 14 16 18 20
Figure 6. Quantitéde lait prélevée enfonction dustade de lactation
Small RuminantResearch NetworkWorkshop 125

Ba Diao et al
Tableau 5:Analyse de variance de la quantité de lait prélevéeparjour de traite, durée de la traite etproduction laitière totale
prélevée
Productionprelevée Production
totale Durée de traite prelevée/jourde traite
Facteurs devariation DDL CM CM CM
SaisonMB 2 367* 8826* 27758 * *
Durée MB 2 622* 5312NS 16925**
RangBM 4 145NS 4887NS 10495*
Eleveur 9 7892 12324***
Intervalle entre
MB 4 336NS 5162NS 2353NS
NBP 1 mois 2 520NS 3582NS 10349 NS
NBP2 mois 2 100NS 4012NS 23398NS
NBP3 mois 2 240NS 3802NS 180NS
*=P<005; **=P<001; ***=P<0001; NS=non significatif; CM=carrés moyens DDL=degré de liberté; MB=mise bas
chevreauxissus de mèresnontraites bénéficientdetoute
la production laitière maternelle. Cette différence de
poids diminue graduellement après six mois, les
chevreauxdépendantmoinsdu lait maternel.
Traite et mortalité des chevreaux
Il ressort du tableau7que la pratique de la traite a
une influence sur la mortalité des chevreaux,influence
qui n'est significative (P<0,1)quepour la classe d'âge
0-3 mois. Lapratique de traite réduit les quantités de
lait disponiblespour lesproduits allaités.Cela entraîne
despoidsplusfaibles(tableau6)et donc destroubles de
la croissance et des risques de maladiesplus élévés.
Economiede l'élevage caprin
Fluxd'animaux
Le taux d'immigration, rapport entre le nombre
d'animauxentrant dansuntroupeauet le nombre moyen
d'animauxpourune période considérée (Landais et al.,
1986) est de 2,8%par an. Les Peul achètent rarement
descaprins.L'achatporte enparticuliersurdesfemelles
le plus souventjeunes (moins de deux ans).
En deux années de suivi, 318 caprins ont été
exploités soituntauxannuelde21,2%.Cetauxest faible
comparéà ceux rapportéspour lazone sahélienne où il
Tableau 6:Influence de la traite sur la croissance des chevreaux
varie entre33et50%(Faugèreet al., 1989). Il estproche
cependant destauxde26% enregistrés dans la zone du
delta au nord du Sénégal(Tourrand, 1993) et de 23%
observés en Mauritanie (François, 1989). Lesventes et
les abattagesreprésententrespectivement61 et32%des
sorties. Les dons ettrocs sont rares et n'intéressentque
7% des animaux.Ce taux assezfaible peut s'expliquer
par l'importance de la traite dans lazonepériurbaine de
Dakar.En effet,ona observéqueplus l'éleveuradulait
de vache etdechèvre, moinsilvendd'animaux.Eneffet,
la vente de lait procure des revenus qui permettent
d'entretenir quotidiennementleménage(prise encharge
des repas). Donc la vente d'animaux n'intervient que
lorsque survient un besoin plus important (maladie,
voyage, achat d'habits, etc.). Les éleveurs qui ne
pratiquentpas la traite exploitent29% de leur cheptel
caprin, contre 19%pour ceux quiprélèvent le lait.
Le taux d'exploitation des boucs, de l'ordre de
47%,estnettementsupérieuràceluidesfemelles, lequel
est de 11%.Pour les chèvres, François(1989), Faugère
et al (1989), Tourrand (1993) ont rapporté des taux
d'exploitation voisins, compris entre 10 et 13%. Les
mâles sontexploités en prioritéparrapportauxfemelles.
Ils représentent65% et55% respectivement des ventes
et des abattages.Cette préférence pour les mâles peut
s'expliquer par leur meilleure vitesse de croissance et
parconséquent parunebonnevalorisationà lavente.En
Poids(kg)
Pratique 1 mois 2 mois 3 mois 6 mois 9 mois 12 mois
Absence de traite 4.51E1,1 6,81E1,6 167- 3 19,7- 2,6
Traite 4,5E1,3 8,3 -2,3 12,6 -29 16,1t3,2
Différence depoids NS 0,5 0,8 0.6 0.4
Niveau de signification 0 NS NS
NS=non significatif
*=p<005
126 SmallRuminantResearch NetworkWorkshop

Production laitière des caprins en milieupeul
Tableau7:Influence de la traite sur les quotients de mortalité
Classe d'age (mois)
0-3 3-6 6-9 9-12 0-12
Traite 17.6 69 8,4 5,1 33.3
Absence de traite 12.2 6,3 7.1 5.3 27.6
Différence 55 0,6 1,3 -0,2 57
Niveau de signification - - NS NS NS - -
NS=non significatif
+=significatifà 10%
effet, ils sontvendusplus chers(1500à2500FCFAde
plus) que lesfemelles.
La figure 7présente la distribution mensuelle des
animauxexploités.L'exploitation est plus fortependant
les fêtes religieuses (TabaskietTamxarit)quionteulieu
entremai etjuin au cours desdeuxdernières années. En
effet,37% des sorties ont eu lieu durant ces deux mois
de l'année.
Valorisation du lait
Dans la zone d'étude,unepartie du laitde chèvre
estvendueàunepetiteunité artisanale deproduction de
fromage. Le reste, mélangéau lait de vache, est vendu
caillé dans les marchés de la région de Dakar. L'auto
consommation existe, mais est difficile à évaluer en
raison de son caractère occasionnel. En effet, les
éleveurs des zones périurbaines consomment plus
volontiersduriz, etrarementd'importantesquantités de
lait (préparation de couscous et de bouillie).
Tauxd'exploitation
(%)
60
Revenus monétaires
Les charges monétaires sont faibles en élevage
caprin. La main-d'oeuvre familiale est exclusivement
utilisée pour la gestion du troupeau (conduite au
pâturage,traite,transformation et commercialisation du
lait). L'achat de médicamentsou d'aliments n'apas été
observé durant le suivi. Les frais d'achat de cordes ne
dépassentguère 1000FCFApartroupeau etpar an. Les
achats d'animaux sont rares comme indiquéplus haut
et ne représentent en moyenne que 6600 FCFApar
troupeauetparan.Enmoyenne, lesdépensesmonétaires
partroupeau s'élèventà7800FCFA.
Dans cettezone, lesproduits de lavente du lait et
des animauxsontpris en compte, lespeaux et lefumier
ne sont pas valorisés financièrement. Devant la
difficulté rencontrée pour estimer les quantités
autoconsommées par rapport à celles vendues, on a
considéré la quantitétotale de laitproduit (estimation
des contrôlesbimensuels)dans le calculdes recettes.Le
prixmoyendu litre de lait en 1992et 1993étaitde283F
50
40 |-
20 -
Figure7. Evolution mensuelle des exploitations
Small RuminantResearchNetworkWorkshop 127

Ba Diao et al
CFApar litre.Ceprix estvariable selon que lafemme
de l'éleveurvendle laitaumarchéouàunintermédiaire.
Les recettes de la vente de laits'élèvent en moyenneà
115000FCFAparanetpartroupeau.Cettesommeéqui
valait avant la dévaluation à 6 mois de salaire d'un
bergertravaillant dans l'élevage intensif etàprès de4
moisde salaire d'un ouvrierquigagne leSMIG(salaire
minimuninterprofessionnelgaranti, soit30000FCFA).
Le prixmoyen devente des caprins est de8400F
CFA.Les recettes de la commercialisation des animaux
s'élèvent en moyenne à44800 FCFApar an. Cette
somme serait de 73500 FCFAsitous les animaux ex
ploitésétaient destinésà lavente.
Leséleveurs quinepratiquentpas latraitevendent
en moyenne deuxanimauxdeplus que les autres et ont
un quotient d'exploitation entre 0 et 12 mois(263%)
supérieurà celui de leurs homologues quitraient leurs
animaux(23%). Ilsgagnent ainsi60900FCFApar an
contre40500FCFApour ceux quifont la traite. Cette
différence de recettes pourrait s'expliquer par la
production d'animaux plus lourds à 6 mois chez les
éleveurs nonproducteurs de lait.
L'élevage caprin génère des revenus assez
substantiels de l'ordre 53400FCFApour les éleveurs
quinepratiquentpas la traite et 148000FCFApour les
autres, soit respectivement près de3mois et8mois de
salaire d'un bergertravaillant dans lazone. Les caprins
constituentdoncuneimportante source de revenuspour
lesproducteurs.
Laprise encompte desévolutionsd'effectifs aurait
permis d'estimer lavaleurdu cheptel accumulépendant
la période d'étude en comparaison avec la valeur du
cheptel exploité. Une évaluation économique plus
complète aurait permis de mieuxanalyser le rôle de la
fumure organique dans la productivité de la partie
végétale de l'exploitation. La fonction sociale des
caprins n'estpasbien appréciée. Pourtant, les éleveurs
abattentenmoyenne3,3animauxparanàl'occasiondes
cérémoniesfamiliales etautoconsommentdu lait.
Conclusion
L'objet de cette étude est d'analyser la production
laitière caprine enélevage traditionnel etsesfacteurs de
variation.Onaconstatépour l'ensemble desparamètres
étudiés (reproduction, croissance, mortalité) que les
résultats obtenus sont intermédiaires entre ceux de la
zone de Koldaausudet cellede Lougaau norddupays.
La race exploitée (croisement race sahélienne-race
guinéenne)et les conditions climatiques intermédiaires
pourraient être des facteurs explicatifs. La production
laitière prélevée (31t11 kg)ne peutêtre comparée aux
chiffres rapportés dans la bibliographie existante car la
quantitéconsomméepar le ou les chevreauxn'apas été
prise en compte.Néanmoins,la quantitéde laittraite est
fortement influencée par les facteurs du milieu, la
saison, l'année, le rang de mise bas et surtout le
troupeau.
L'alimentation estun desfacteurs limitantspour la
production laitière. Pendant l'hivernage, cette pro
ductionestélevéedufaitde ladisponibiltéd'unpâturage
abondantdebonne qualité.Cependant, en saison sèche,
surtout chaude, la production est faible. Pourpallier ce
déficit,une complémentation s'impose surtoutpour les
femelles allaitantes.L'abreuvementdoit être également
assurépendant cettepériode.
Comme l'alimentation, la santé estun facteur de
première importance. La mortalité desjeunes est très
élevée et entrave de manière directe l'augmentation de
la production laitière dans la mesure où la disparition
précoce du ou des chevreaux entraîne presque auto
matiquement l'arrêt de la traite.Un suivi sanitaire du
troupeau est indispensable pour garantir une pro
ductivitémaximum.
Cesdeuxfacteurs constituent donc les principaux
obstaclesà l'augmentation desproductionscaprines. La
levée de ces contraintespourrait permettre d'améliorer
sensiblement laproductivité laitière en milieu éleveur.
La suite des recherches doit donc s'inscrire dans cette
dynamique.
Bibliographie
AllyMA. 1990.Caractéristiques de la reproduction chez les
ovins et caprins élevés en milieu traditionnel de
Dahra-Djoloffau Sénégal.Th. méd.vét., Dakar N°13.
88p.
Anonyme. 1989. Plan de développement de la communauté
rurale deSangalkam.Cerp Bambilor,84p.
Ba Diao M. 1991. Les systèmes d'élevage dans la zone des
Niayes auSénégal. I-L'élevage traditionnel. Etudes et
documents,ISRA,vol.4,N°14,29p.
Ba DiaoM etSeckM. 1994. Place de l'élevage caprin dans
une filière laitière périurbaine au Sénégal. Note
ISRA/LNERV,10p.
BaM. 1983.Interprétation des résultats du contrôle laitier des
vaches pie-noire, établissement d'une formule d'index
de sélection. Mémoire de 3ème cycle agronomique:
option Productions animales. IAV HASSAN II,
RABAT,131p.
Bertaudiere L. 1977.Larace caprineduSahel.Résultats d'une
année d'observation. Rapport annuel de Farcha,
IEMVT,Z19-Z48
BolinC. 1989. Israel : un élevage sans frontière. La chèvre,
171,42-47
Chamchadine M A. 1994. Comportement alimentaire et
performances laitières des chèvres sahéliennes sur
parcours naturels.Th. méd.vét.: DakarN° 1.84p.
CharrayJ, Coulomb J, Haumesser J B, Planchenault D et
Pugliese P L. 1980. Les petits ruminants d'Afrique
centrale et de l'Ouest. Synthèse des connaissances
actuelles.IEMVT.,Maisons-Alfort,France.
CIPEA. 1983. L'élevage despetits ruminantsdans les régions
tropicales humides. Etudesde systèmes(3).
CooperJBand HargroveGL. 1982.Age and month calving
adjustement of Holstein protein, milk andfat lactation
yields.Journal ofDairyScience 65:1673
128 Small RuminantResearch NetworkWorkshop

Production laitière descaprins en milieupeul
Devendra C and Burns M. 1970. Goats productions in the
tropics.Commonwealth Agricultural Bureau, London,
182p.
Faugère O et Faugère B. 1993. Suivi individuel dans les
systèmes d'élevage traditionnel. Les logiciels en
élevage: Panurge. ISRA/LNERV - CIRAD/EMVT
339p.
FaugèreO, Faugère B,Merlin PDockesCet PerrotC. 1988
L'élevage traditionneldespetits ruminants dans lazone
de Kolda (Haute Casamance). Référentiel
technico-économique (données recueillies dans 20
villages de 1984à 1987). Réfn°018/VIROLNERV,
DAKAR,187p.
FaugèreO, FaugèreB,MerlinP,DockesCetPerrotC. 1989
L'élevage traditionneldespetits ruminants dans lazone
de Louga. Référentiel technico-économique (données
recueillies dans 15 villages de 1984 à 1988).
Réfn°26/VIRO,LNERV,DAKAR,139p.
Francois J L. 1990. Projet d'encadrement des éleveurs du
Gorgol(Mauritanie): résultatsdusuivizootechnique des
petits ruminants. Doc. Minist. Franç. Coop. /ISRA,
Paris,93p.
Frebling J, Poly J, Poutous M et Chambeyron J J. 1967
Méthode de calcul desindex de production laitière. III
Justifictaion des facteurs de corrélation utilisés. Bull.
Tech. Inf.222 : 633.
GueyeA,MbengueM,DioufAetSeyeM. 1986.Tiques et
hémoparasitoses du bétail auSénégal. I-La région des
Niayes. Rev. Elev. Méd. Vét. Pays Trop. 39 (3-4) :
381-383.
IEMVT-CIRAD. 1991. Fiches techniques d'élevage.
Enquêtespar suivi individuel du cheptel. II-Exemples
desrésultats obtenussur lespetits ruminantsauSénégal,
8p.
KoussouMet BourzatD.1993.Etude de laproduction laitière
des chèvres du Sahel en milieu rural. Quantités de lait
traites;croissance deschevreaux.DansBourzat,éditeur.
Projet régional de recherche sur les petits ruminants
Cameroun,Niger,Tchad.Actes duComité scientifique,
octobre 1993:43-50
Landais E. 1987. Recherches sur les systèmes d'élevage.
Questions et perspectives. Document de travail de
l'URSAD, Versailles-Dijon-Mirecourt, Versailles,
INRA,75p.
LandaisEetFayeJ. 1986.Méthodespour la recherche sur les
systèmes d'élevage en Afrique intertropicale.Actes de
l'atelier ISRA, Mbour, Février 1986. Etudes et
Synthèses IRAD-EMVTn°20, Maisons-Alfort, 1986
733p.
Liagre L. 1987.Analyse d'un projet d'intensification laitière
périurbaine: l'exemple de la Montbéliarde auSénégal.
Mémoire defin d'études, 116p.
Moulin C H. 1993. Performances animales et pratiques
d'élevage en Afrique sahélienne. La diversité du
fonctionnement des petits ruminants dans la Commu
nauté rurale de N'diagne (Sénégal). Th. Doc.
INA-PARISGRIGNON,259p.
Quittet E. 1975. La chèvre : guide de l'éleveur. Maisons
Rustiques, Paris,288p.
TouréSM. 1981. Lutte contre les glossines par application
terrestre d'endosulfan. ISRA/LNERV - N*99/
PARASITO,5p.
TouréSM. 1983.Utilisation de pièges et d'écranspourlutter
contre les glossines. Rapport de situation et essais
réalisés auSénégal.ISRA/LNERV-N'18/PARASITO,
7p.
TourrandJF. 1993. L'élevage dans la révolution agricole au
Xaalo.Ruptureetcontinuité.Thèse d'Etat,Universitéde
ParisXII,Créteil,415p.
Remerciements
Lesauteurs remercientM.Bigot,Babène etMBodj
duService des culturesfourragèrespour leurprécieuse
aide dans l'identification des types de parcours et la
méthodologie deprélèvementdebiomasse; lepersonnel
du laboratoire de chimie du LNERVpour les analyses
bromatologiques effectuées; le programme PPR du
LNERVpour leur appui dans l'utilisation du logiciel
PANURGE; M. Kéba Diao, observateur, pour ses
efforts soutenus pour la qualité du suivi; tous les
éleveursde lazonedeSangalkam etdeSébikotane:cette
étude n'auraitpu aboutirsans leurconsentement etleur
participation; et enfin Mme Coumba Sow et Mr O
Bougalebpour leur remarquable travail dans la miseen
forme de ce document.
Factors affectinggoat milkproduction in a Fulaniarea
Abstract
This study of the factors of variation in goat milk
production in Fulani systems was carried out in the
Niayes area of Dakar,Senegal. Reproduction,growth,
mortality and milk production parameters were
analysed. Age at first kidding was 16 months and
kiddingintervalwas280days.Average litter sizewas
1.36 kids and mortality quotient was high at 324%.
Lactation length was 184 days while milk offtake per
lactationwas31 kg.Goatproduction plays animportant
social and economic role in this area, providing
substantialincome andcontributingtopeople's animal
protein needs.
Small Ruminant ResearchNetworkWorkshop 129


SESSION3
Management and Health


Contagious caprinepleuropneumonia: Diagnosis
and control
Rurangirwa"* andTC McGuire"
1. Department ofVeterinary Microbiology andPathology
Washington State University, Pullman, USA
2.SmallRuminantCRSP,P.O. Box58137 Nairobi, Kenya
Abstract
Contagious caprine pleuropneumoniais a disease
withhighmorbidity(80-100%)andmortality(60-80%)
rates. Rapid diagnosis of this devastating disease is
essential for its immediate containment. A pen-side
diagnostictest-latex agglutination-based on the
carbohydrate elaborated by Mycoplasma capricolum
subsp. capripneumoniae (Mccp) has been described.
Onewayto contain and controlthe disease is through
vaccination. A liquid vaccine is presently in use.
However, freeze-dried saponin killed Mccp has been
showntoconferprotectiveimmunityofover 12months.
The freeze-dried antigens are stable one year after
storage at4'Cor22'C.Thisindicates that afreeze-dried
vaccine is feasible andindeed preliminary field trails
have indicated that a freeze dried vaccine confers
protectiveimmunity.
Introduction
Contagiouscaprinepleuropneumonia(CCPP)isacause
ofmajoreconomic lossestogoatproduction in at least
30countriesin Africa andAsia containing a totalgoat
population ofmore than 300 million.Classical, acute
CCPPiscausedbyMycoplasmacapricolumsubspecies
capripneumoniae (Mccp) (MacOwan and Minette
1976) originally known as Mycoplasma F38. This
mycoplasmawas firstisolated from the lungs ofgoats
with pleuropneumonia in Kenya and demonstrated to
cause CCPP (MacOwan and Minette 1976).
Subsequently,Mccphasbeenisolated in othercountries
includingChad, Ethiopia, India,Oman,Sudan,Tunisia,
Turkey and Uganda, and pleuropneumonic disease
indistinguishable from naturally occurringCCPP has
been experimentally reproducedwith Mccpbyseveral
research groups. The disease is characterised by
fibrinous pleuropneumonia with increased
straw-coloured pleural fluid. Morbidity and mortality
rates may reach 100% and 80%, respectively. Close
contact among goats is necessary for spread of the
disease (MacOwan andMinette 1976).
Diagnosis
The diagnosis ofoutbreaks ofCCPPis complicatedby
other infectious agents causing similar syndromes.
Pleuropneumonic disease resemblingMccp-associated
CCPPcan also be producedbyMycoplasma mycoides
subsp.capri(Mmc)andcaprinevariants ofM. mycoides
subsp. mycoides (Mmm). Mmc was originally
considered to be the cause of CCPP, but its full
importance as a pathogen ofgoats has now become
doubtful,both because ofthe discovery oftheMccpand
because many isolates previously classified as Mmc
have subsequently beenfoundtobe caprinevariants of
Mmm.Mmchasbeenisolatedfromseveral countries in
Africa and Asia, and from Australia. The disease
reproduced experimentally with Mmc is largely
restricted to the thoracic cavity, with or without a
septicaemic phase and death. In contrast, caprine
variants ofMmmgenerally causes a syndrome which
mayinclude notonlypleuropneumoniabutalsomastitis,
polyarthritis, keratoconjunctivitis, acute septicaemic
death, sometimeswithsymptomsofthe centralnervous
system, and abortion.Mmmis a majorcause ofdisease
in goats in USA, France, Israel and India.
Experimentally, the disease caused by Mccp differs
fromthatproducedbyMmcandMmmin:beingreadily
contagious andfatalto susceptible goats; not affecting
sheep or cattle; not producing local oedematous
reactions when injected subcutaneously; and being
characterised histo-pathologically by an interstitial,
intralobular oedema ofthe lung, compared with the
thickening ofthe interlobularsepta which is seen with
Mmc and Mmm (Kaliner and MacOwan 1976).
Pasteurellahaemolytica(bothbiotypesAandT)andP
multocida have also been associated with pleuro
pneumoniaingoats,although experimental evidence of
theirpathogenicityinthis hostis meagre.
Diagnosis ofCCPPcan be dividedintofield and
laboratory diagnosis. Because this devastating disease
occursin epidemics,itis essentialthat the diagnosis be
achievedvery quickly sothat control measures such as
treatment ofthe sickgoats andvaccination ofthose at
riskis carried outimmediately.Therefore,properfield
diagnosisisparamount.
Field diagnosis
Field diagnosisis achievedthrough:
• Observation ofthepresentingclinicalsignswhich
include fever(40-42'C), coughing,dyspnea, high
morbidity (about 100%) and high mortality of
about70%. Post-mortem examination will reveal
fibrinous pleuropneumonia accompanied with
Small RuminantNetworkResearchWorkshop 133

Rurangirwa andMcGuire
increased pleural fluid, and enlarged and
oedematous mediastinallymph nodes.
• Latex agglutination test(LAT)(Rurangirwa et al
1987b). This test is based on a polysaccharide
isolated from Mccp (Rurangirwa et al 1987a)
which is used to sensitise latex beads. The
sensitised latexbeads arethenusedto detectserum
antibodies from goats infected with CCPP
(Rurangirwa et al 1987b).The specificity ofLAT
was assessed usingWM25 monoclonal antibody
which is specific for Mccp (Rurangirwa et al
1987c; Belton et al 1994) and reacts with the
polysaccharide (Rurangirwa et al 1992). The
specificity of LAT was further confirmed by
evaluating specific growth inhibiting rabbit
antisera to various mycoplasma isolates
(Rurangirwa etal 1987c).
The sensitised latexbeads are stable at4'C, room
temperature and37'Cfor over oneyear.Thus the long
shelf-life ofthebeads atdifferenttemperaturesmakesit
possible toprepare large amountswhich can be stored
until used.The latex agglutination test is an excellent
procedureforthe diagnosis ofCCPP and can be runin
two minutes on samples ofwhole blood or serum,
requires nosophisticated equipment orstorage facilities
andis adaptabletoanylaboratory orfieldconditions
an example ofa pen-side diagnostic test. The test is
carried outbymixingadropofthesensitisedbeadswith
a drop ofblood orserum from the suspected animal on
aglass slidefor oneminute andthe results readvisually
and recorded as positive or negative. LAT combined
with presenting clinical signs and necropsyindicating
fibrinous pleuropneumonia is confirmatory of Mccp
associatedCCPP.
Laboratorydiagnosis
Severalserologicaltests includingcomplementfixation
(MacOwan and Minette 1976) passive
haemagglutination (Muthomi and Rurangirwa 1972)
andenzyme-linkedimmunosorbent assay(Wamwayiet
al 1989) detect serum antibodies to Mccp. However,
routine use of these tests is constrained by lack of
equipmentandtrainedpersonnel.Similarconstraintsare
encountered in the use of DNA probes (Taylor et al
1992;Thiaucourt et al 1992)andPCR(Bascunana et al
1994).
Culture, isolation and characterisation of Mccp.
Thisprocedurewhichtakesaminimumof10daysistoo
slow to be of any practical use in the containment of
CCPPoutbreak.
Control
Since the disease occurs in epidemics, antibiotic
treatment, as the only control measure would be very
uneconomical. Therefore, efforts have been directed
towards controlling the disease by vaccination. This
section documents developmental stages ofthe CCPP
vaccine presently in use. The first immunisation trial
usingMccpwas carried outbyMacOwanandMinnette
(1978).Theyinoculated20goatsintratracheallywitha
high-passage culture ofMccp.On contact challenge of
the inoculated goats one month later, 11 of the 20
vaccinatedgoatswereprotected,whereas all20control
goats contracted CCPP. The results provided an
indication thatgoats could be protected againstCCPP
byusingMccp.
While investigatingthe effect ofstreptomycin in
goats with natural and experimentalCCPPcaused by
Mccp(Rurangirwa et al 1981a), itwasfound thatgoats
treatedwithstreptomycin onthe3rddayoftemperature
elevation(>4'C)recoveredfromthe disease andbecame
completely immune to reinfection with Mccp
(Rurangirwa et al 1981a). Serum samples from such
recovered goats caused in vitro growth inhibition of
Mccp(Rurangirwa etal 1981a).This observation ledto
a series ofexperimentsinwhichgoatswereimmunised
withsonicatedF38antigens indifferentadjuvantswhich
included Freund's complete adjuvant, Freund's
incomplete adjuvant and aluminium hydroxide
(Rurangirwa etal 1981b; Rurangirwa et al 1984).
It was demonstrated that protective immunity in
goats could be induced by using sonicated Mccp
antigens in Freund's complete and/or incomplete
adjuvants.The immunity was present for at least six
months after vaccination (Rurangirwa et al 1984).
Aluminiumhydroxide,likeantigen alone,providedonly
20% protection (Rurangirwa et al 1984). Thus, an
unequivocal protection ofgoats against CCPP with
sonicated Mccp antigens in an oil adjuvant was
demonstrated. Although oil adjuvants are not suitable
foruseinfoodanimals,use ofFreund'scompleteand/or
incomplete adjuvants demonstrated that Mccp
organisms disrupted bysonication andinjected with an
appropriate adjuvant wouldinduceprotectiveimmunity
in goats againstCCPP.
Apilot experiment revealedthat saponin couldbe
used as an adjuvantforMccpvaccines.Thisfindingwas
veryimportant because saponin does not cause obvious
tissue damage. Thus, a series of experiments were
carried outusingsaponin as an adjuvantto assess:
• immunogenicstabilityofMccpafterlyophilisation
• immunogenicity after storage at22'Cand4'C
the duration ofimmunityinducedbya single dose
ofthe lyophilised Mccp.
Lyophilisation trials (Rurangirwaet al 1987d)
Since lyophilised vaccines are easy to store and
transport,apreliminary studywasundertakentofindout
iflyophilised Mccpwouldinduce protective immunity
in goats against CCPP. Eight goats were immunised
with 8 mg/ml of freeze dried Mccp in saponin to
inactivatethe organism and serve as adjuvant.Thegoats
received a similar immunisation 21 days later. Two
months after initial immunisation, the vaccinated and
controlgoatswere challengedby contact exposure.Six
ofthe control goats and only one of eight vaccinated
goats died ofCCPP.These results led tothe conclusion
that lyophilised Mccp antigens could protect goats
134 SmallRuminantResearch NetworkWorkshop

Contagious caprinepleuropneumonia: Diagnosisandcontrol
against CCPP caused by Mccp, when an optimal
immunisingdose isusedwith an appropriate adjuvant.
Determination ofminimumimmunising
dose of lyophilisedMccp (Rurangirwaet al
1987c;Rurangirwa et al 1987d)
Seven groups offive goats each were immunisedwith
different doses containing 0.015, 0.075, 0.15, 020,
0.375,0.750,and 1.50mgprotein oflyophilisedMccp
using saponin as an adjuvant.An eighth group offive
goatswasimmunisedwith the highest dose (1.50mg)
without adjuvant. A ninth group of control goats was
immunised with saponin in phosphate-buffered saline
(PBS),pH74.Allthegoatswereimmunised againfour
weeks later. The immunisedgoats, alongwith control
goats, were contact challenged four weeks after the
secondimmunisation.
The mean time for the control goats to develop
pyrexia of40'C was 14-t1.5 days after exposure to
infectedgoats, and allthe controlgoats died ofCCPP
The goats that were immunised with 1.5 mg Mccp
antigen without saponin had an incubation period
similar to that of the control group. Two goats
immunisedwiththe lowest amountoflyophilisedMccp
(0015mgin saponin) died ofCCPP.Onegoatgiven
0075mgin saponin also died ofCCPP.There was no
pyrexia nor anysigns ofdisease in the goatsthatwere
immunisedwith >0.15mgin saponin, exceptin one of
the group immunised with 0.375 mg, which had a
temperature reaction40daysaftercontactexposure and
died ofCCPPsix days later.The resultsindicated that
the minimum immunising dose thatfullyprotected all
goatsin agroupwas0.15mg.
Immunogenicstability oflyophilised
Mccp stored at22'Cand4'Cfor3,9and
14 months (Rurangirwaetal 1987c)
In order to check the stability of the antigen upon
storage, antigen (lyophilised Mccp)wasstored at4and
22'Cforupto 14months.Goatswereimmunisedwith
two doses ofthe minimumimmunising dose (0.15 mg)
ofthe antigen afterstoragefor3and 14months at22'C
and after 3, 9 and 14 months at 4"C. The immunised
goats, together with corresponding controls, were
challenged by contact exposure three weeks after the
booster dose. Lyophilised Mccp kept for 3, 9 and 14
months induced protective immunity in all the
immunised goats. The average mean time for the
non-immunised controlgroups ofgoats, at3,9, and 14
months,todeveloppyrexiawere 15,17and22days after
contact exposure to the infected goats, respectively.
There was no indication of CCPP in the immunised
goatS.
Duration ofimmunityinduced by a single
dose(Rurangirwa etal 1987c)
Three groups of30goats each were immunised with
single doses of0.15,0.30and 1.2mgofthe lyophilised
Mccpcontainingsaponin asan adjuvant.Afourthgroup
wasinjectedwith saponin in PBS.Tengoatsfrom each
groupwere subsequently exposedtovirulent challenge
by contact 3, 6 and 12 months later. All the goats
immunisedwithasingledoseof0.15mgwereprotected.
Those immunised with a single dose of0.3 mgwere
protected, exceptin one case when at 12 months agoat
reacted and died ofCCPP. Two goats in the group
immunisedwith 1.2mgalsodied ofCCPP-onefrom
thegroup challengedat6months,andthe otherfromthe
group challenged at 12 months.
Three major conclusions were drawn from the
results ofthese immunisation trials :
1. Lyophilisation and storage ofMccp at22'C or4'C
did notaffectitsimmunogenicity.
2. Large quantities of lyophilised Mccp could be
producedandstored at22'Cor4'Cfor<14months
without affectingimmunogenicity.
3. Duration ofimmunityinducedbyasingle minimum
immunising dose of0.15 mg lyophilised F38was
>12months.Thus,thevaccine developedforCCPP
canbe lyophilised, has a minimum dose of0.15mg
and a shelf-life of>14 monthswhen stored at22'C
or 4"C, and induces immunity lasting over 12
months.
Preliminaryfield test ofthe lyophilised
vaccine (Rurangirwaet al 1991)
One hundred and fifteen, one-year-old goats from a
singlefarmwerescreenedfor antibodiestoMccpusing
a latex agglutinationtest(Rurangirwa et al 1987b)and
100 of them which lacked antibody to Mccp were
purchased. Fifty of the goats were immunised
subcutaneously with a single dose (0.15 mg) ofthe
lyophilised, saponin killedCCPPvaccine (Rurangirwa
et al 1987e) while the remaining 50 were left as
unimmunisedcontrols.Allthegoatswere maintainedon
the same farm for two months andthen transportedto
Kabete Veterinary Laboratory for contact challenge.
The challengewas carried outbyhousingthe 100goats
with five goats infected with Mccp by endobronchial
intubation (MacOwan and Minette 1976). During
contact challenge, the twogroups were grazed during
the day and housed at night together with the five
experimentallyinfectedgoats.Allgoatswere examined
daily andtheir rectaltemperatures recorded.Anautopsy
wasperformed on anygoatthat died;the gross lesions
recorded and specimens of affected organs taken for
isolation of mycoplasma and bacteria. The trial was
carried out for four months after challenge and the
survivinggoats were euthanased and autopsies carried
out.MycoplasmawereisolatedusingNewing'stryptose
broth (Gourlay 1964) and their identity as Mccpwas
confirmed by growth inhibition (Rurangirwa et al
1987c).
Twelve vaccinates and 14 controls died of
diarrhoea due to salmonella infection during the
acclimatisation period ofthree weeks at the Kabete
Veterinary Laboratory leaving 38 vaccinates and 36
controls for contact challenge. None ofthe deadgoats
Small RuminantNetworkResearchWorkshop 135
Rurangirwa andMcGuire
had lung lesions and noMccpwere isolatedfrom lung
or lymph node tissues. Thirty controlgoats developed
pyrexia atameanof39(t143SD)days afterexposure.
Twenty-seven ofthe 30affected controlgoats died of
CCPPatamean8.1(+233SD)days afterpyrexiabegan
and three recovered. Four months after contact
challenge, the three recovered control goats were
euthanased;theyhad adhesionsofthe cardiac and apical
lobestothe thoracicwallbutMccporganismswere not
isolated from their tissues.The remaining six control
goats had no signs of disease and when they were
euthanased and examined at the end offour months,
there were no lesions and Mccp organisms were not
isolatedfrom their tissues.
Failure ofsixof36controlgoatsto contractCCPP
is in contrast to containment experiments in which
almost 100% infection occurred in the contact
challenges(Rurangirwa et al 1987e). A morbidityand
mortality rate of60to80% has been reported for the
field outbreaksofCCPP(MacOwan andMinette 1977).
The experimental conditionsforthepresent studywere
settomimicfield conditions as opposedtocontainment
throughout the experimental period. Therefore, the
failure ofsixcontrolstoshowanysigns ofdisease may
be attributed to a less severe challenge than was
previouslyused(Rurangirwaetal1987e).The recovery
ofthe three control goats from CCPP after showing
clinicalsignsindicatesthat asmall numberofgoatsmay
recoverfromCCPP,especiallyifthey are not subjected
to movementstressin search offoodandwater.
All the surviving vaccinates withstood the
challenge.Therewas atemperature elevation intwo of
the goats (41 and 62 days after challenge) which
returnedtonormal aftertwodays.Therewasnopyrexia
and nosigns ofdisease in the remaining36vaccinated
goatsduringthefour-month experimentalperiod.Atthe
endofthe experimentactive lesionswere notseeninthe
36 euthanased vaccinated goats without clinical signs
andMccpwasnotisolatedfrom theirtissues. However,
in thetwovaccinateswhichhadatemperature reaction,
adhesionswerepresentinthe thoraciccavity,butMccp
was not isolatedfrom theirtissues. Thisfindingmaybe
related to individual variation or to other unknown
causes.Similar observations have been reportedbefore
(Rurangirwa et al 1987e).
In conclusion, one dose of lyophilised Mccp
vaccine induced an immunity in goats that protected
totally against mortality and was 95% efficacious
against clinical disease. In the twovaccinatedgoatsthat
had pyrexia, no detectable carrier state resulted.
Therefore, this vaccine is suitable for use in control
programmesforCCPP
The vaccine has not yet been lyophilised for
generaluse in the field although the same formulation
in liquidform is in use. Plans are nowwell advancedto
freeze-drythevaccine.
References
BascunanaC.R.,Mattsson.JG.,BolskeG.andJohanssonKE.
1994. Characterisation of the 165 rRNA genes for
mycoplasma sp. strain F38 and development of an
identification system based on the polymerase chain
reaction.Journal ofBacteriology 176:2577-2586
BeltonD.,LeachRH.,MitchelmoreD.L.andRurangirwaFR.
1994.Serologicalspecificity ofa monoclonalantibody
to mycoplasma strain F38, the agent of contagious
caprine pleuropneumonia. Veterinary Record
134:643-646.
Bolske G.,Wilhelmsson E.,Twinamasito E. and Johansson
KE. 1994.Detection ofMycoplasmacapricolum subsp.
capripneumonia in goats and sheep in Uganda. 10th
International Congress of the International
Organisation for Mycoplasmology, Bordeaux, France,
19-26July 1994
GourlayR.N. 1964.AntigenicityofMycoplasmamycoides. 1.
Examination ofbody fluids from cases of contagious
bovine pleuropneumonia. Research in Veterinary
Science5:473-482.
Kaliner G. and MacOwan K.J. 1976. The pathology of
experimental and natural contagious caprine
pleuropneumonia in Kenya. Zentralbalatt Fur
veterinarimedizin(B)23:652-661.
MacOwan K.J. and Minette JE. 1976.A mycoplasma from
acute contagious caprine pleuropneumonia in Kenya.
TropicalAnimalHealth andProduction8:91-95.
MacOwanK.J. andMinetteJ.E. 1977.TheroleofMycoplasma
strain F38 in contagious caprine pleuropneumonia in
Kenya.VeterinaryRecord 101:380-381.
MacOwan K.J. and Minette JE. 1978. The effect of high
passage mycoplasma strain F38 on the course of
contagious caprinepleuropneumonia(CCPP).Tropical
Animal Health andProduction 10:31-35
Muthomi E.K. and Rurangirwa F.R. 1983. Passive
haemagglutinationandcomplementfixationsdiagnostic
testsfor contagious caprinepleuropneumoniacausedby
F38strain ofmycoplasma.
Rurangirwa FR., MasigaWN., Muriu DN., Muthomi E.,
Murila G., Kagumba M. and Nandhoka E. 1981a.
Treatment of contagious caprine pleuro-pneumonia.
TropicalAnimalHealth andProduction 13:177-182.
Rurangirwa FR., MasigaW.N. and Muthomi E.K. 1981b.
Immunity to contagious caprine pleuropneumonia
causedbyF-38strainofmycoplasma.VeterinaryRecord
109:310
Rurangirwa FR., Masiga WN. and Muthomi E.K. 1984
Immunisation of goats against contagious caprine
pleuropneumoniausingsonicatedantigensofF-38strain
of mycoplasma. Research in Veterinary Science
36:174-176.
Rurangirwa FR., McGuire TC., Chema S. and Kibor A.
1987a. Vaccination against contagious caprine pleuro
pneumonia caused by F38. Israel Journal ofMedical
Sciences23:641-643.
RurangirwaFR., McGuireTC,MagnusonNS., KiborA.and
ChemaS. 1987b.Compositionofapolysaccharide from
mycoplasma(F38)recognisedbyantibodiesfromgoats
136Small RuminantResearch NetworkWorkshop

Contagiouscaprinepleuropneumonia: Diagnosisand control
with contagious pleuropneumonia. Research in
VeterinaryScience42:175-178
Rurangirwa FR., McGuire TC, Kibor A. and Chema S.
1987c. Latex agglutination test for field diagnosis of
contagious caprine pleuropneumonia. Veterinary
Record 121:191-193.
Rurangirwa FR., McGuireTC,MusokeA.J. and KiborA.
1987d. Differentiation of F38 mycoplasmas causing
contagious caprine pleuropneumonia with a
growth-inhibiting monoclonal antibody. Infection and
Immunity55:3219-3220
Rurangirwa FR., McGuire TC, Kibor A. and Chema S.
1987e. An inactivated vaccine for contagious caprine
pleuropneumonia.VeterinaryRecord 121:397-402
Rurangirwa FR., McGuire TC., Mbai L., Ndung'u L. and
WambuguA.1991.Preliminary field test of lyophilised
contagious caprinepleuropneumoniavaccine. Research
in Veterinary Science 50:240-241.
Rurangirwa FR., McGuireTC,WambuguA. and Kihara
S.M.1992.Identificationandcharacterisation ofatarget
antigen of a monoclonal antibody (WM-25) which
inhibits the growth of Mycoplasma strain F38. IOM
letters Volume 2 FP5/2. 9th Congress of the
International Organizationfor Mycoplasmology,Ames,
Iowa,USA,2-7August1992 InternationalOrganization
forMycoplasmology,Ames,Iowa,USA.p. 128
Taylor T.K., Bashiruddin J.B. and Gould A.R. 1992.
Relationship between members of Mycoplasma
mycoidesclusterasshownbyDNAprobesandsequence
analysis. International Journal of Systematic
Bacteriology42:593-601.
Thiaucourt F., Guerin C., MadyV. and Lefecre PC. 1992
Diagnosticde lapleuropneumoniae contagiensecaprine
ameliorations recente. Revue Scientifique et Technique
de l'Office InternationaldesEpizooties 11:859-865.
WamwayiH.M.,WafulaJS., Litamoi.J.K. and Nandokha E.
1989. Detection ofantibodytoMycoplasmaF38ingoat
sera by an enzyme-linked immunosorbent assay.
TropicalAnimalHealth andProduction 21:43-49.
Lapéripneumonie caprine contagieuse: diagnostic et contrôle
Résumé
Lapleuropneumonie caprine contagieuse est une
maladie à taux élevés de morbidité (80-100%) et de
mortalité(60-80%). Seulun diagnostic rapide permet
de maîtriser cette affection dévastatrice. Un test de
diagnostic sur le terrain utilisant l'agglutination des
particules de latex etbasésur lesglucides élaboréspar
Mycoplasmacapricolum sous-espèce capripneumoniae
(Mccp)a été décrit. La vaccination peutpermettre de
lutter contre cette maladie et de la contrôler.Un vaccin
liquide est actuellement utilisé. Toutefois, il a été
démontréque dessouches deMccplyophiliséestuéesà
la saponine pouvaient protéger les animaux par
immunité pendant plus de 12 mois. Les antigènes
lyophiliséssont stablespendantun anàunetempèrature
de conservation de4ou22'C.Cela signifie qu'onpeut
en obtenir un vaccin lyophilisé. De fait, des essais
préliminaires en milieu réel ontpermis d'établir qu'un
vaccin obtenupar lyophilisation conféraituneimmunité
protectrice.
Small RuminantNetworkResearchWorkshop 137


Asurvey ofpathological conditionsin slaughteredgoats
atZaria slaughter houses
SA. Ojo
Faculty ofVeterinary Medicine,AhmaduBello University,Zaria, Nigeria
Abstract
The prevalence of disease constitutes a serious
impedimenttosmall animalproduction in Nigeria. For
an effective goat disease control programme it is
pertinent tohave a record ofcommondiseasesprevalent
in an area.The knowledge ofthe extentto which the
publicis exposedto certain zoonotic diseases through
goat meat consumption is equallyusefulin preventive
medicine. Accordingly, slaughter housesin Zaria were
visited betweenJanuaryand December 1992to collect
information on pathological conditions found in goats
slaughteredduringtheperiod. Recordswere keptonsex,
breed,foetalwastage and on results of laboratory tests
onfaeces andworms collectedfromthedisease organs.
A total of7644 goats were examined. Helminthiasis
constituted 17.52%,pneumonia4.8%,peste des petits
ruminants3.5%,andabscessesin liver, lung andkidney
32%ofthepathological conditions noted.Ofthe 1200
organsinfectedwith diseases300(25%)portionswere
slaughteredwhile900whole organs were condemned.
Twenty-five whole carcasseswere condemned. Foetal
wastage was estimated at 16.58% ofthe 3057 does
slaughtered. Mycobacterium sp, Salmonella sp,
Staphylococcus aureus and Bacillus cereus isolated
from the disease organs were of public health
importance.Some suggestions are madefor improving
themeatinspectionpractices oftheslaughterhouses and
providing better education to the butchers and goat
traders.
Introduction
The consumption of animal protein by the average
Nigerian is very low(Olayide et al 1972;Gefu 1982)
Beef meat constitutes the major source of meat
consumed in Nigeria. Recently beefhas become very
expensive causingashifttosmallruminantsparticularly
goats.
The prevalence of disease constitutes a serious
impediment to small animal production in Nigeria by
causing high mortality and low production in flocks.
ILCA(1979) reported a kid mortality rate of362%in
Bendel State in Nigeria. Molokwu (1982) expressed
doubt on the production target indicated for goats in
1986because ofthe high kid mortality andhighdisease
prevalencein Nigerian goats.
For an effective goatdisease controlprogramme it
is pertinent to have a record of common diseases
prevalent in an area.The knowledge ofthe extent to
whichthepublicisexposedto certain zoonotic diseases
through goat meat consumption is also useful in
preventivemedicine.
Slaughter houses provide excellent opportunities
for detecting diseases of both economic and public
health importance. Accordingly, the present survey
reports onthe diseasesprevalentingoatsslaughteredat
Zaria between January 1992 and their public health
significance,andhighlightsthe administrativeproblems
encountered duringthe survey.
Materialsandmethods
The slaughter houses in Zaria were visited between
January1992andDecember1992. Datawere collected
on the pathological conditions found in goats
slaughtered duringthe period.
Enquiries were made from the trained meat
inspectors regardingformal ante-mortem examination.
Hindrances to standard meat inspection and facilities
provided for effective inspection were appraised.
Records were kept ofthe sex, breed, foetal wastage,
diseases encountered and approximate age ofthegoats.
Agingwasbasedonthe methodofMiller andRobertson
(1959).
Post-mortem inspection was done by visual
observation andpalpation andbyincision ofsuspected
organs. Furthermore, specimens of disease organs,
faeces and adultworms were collected for laboratory
studiesfor definitive diagnoses.
Results
Atotal of7644goatswere examined, ofwhich 60.1%
were males and 39.99% were females. Table 1
represents the disease conditions and their percentage
incidence. The commonest disease conditions were
helminthiasis (17.52%),pneumonia (4.80%),peste des
petits ruminants(3.50%), and abscesses in liver, lung
and kidney(3.2%).Table2showsthe common causes
ofcondemnations in the organs. Ofthe 1200 organs
infected with diseases 25% portions were salvaged
while75%whole organswere condemned. Fivewhole
carcasseswere condemnedforgeneralisedtuberculosis
and20goatswerefounddeadbeforeslaughter hence25
whole carcasses were condemned.Table 3 shows that
SmallRuminantNetworkWorkshop 139

Ojo
Table 1.Disease conditions observed in slaughteredgoatsinZaria betweenJanuary andDecember 1992.
Number of Numberwith disease
Disease conditions goats examined condition incidence
Pneumonia 7644 366 4.80
Peste de petits ruminants 7644 267 3.50
Haemonchosis 7644 948 12.40
Trichostrongylosis 7644 336 4.40
Coccidiosis 7644 38 0.50
Cysticercosis 7644 76 1.00
Abscess(liver, lungand kidney) 7644 244 320
Hydatidosis 7644 38 0.50
Mastitis 3057 62 2.03
Hygroma 7644 26 0.35
Cirrhosis 7644 90 090
Emaciation 7644 97 1.27
Mange 7644 57 075
Pericarditis 7644 83 1.09
Tuberculosis 7644 6 0.08
Foetalwastage 3057 98 3.20
Table2. Common causes oforgan condemnation in goats in Zaria slaughter houses (January to December 1992).
Reasonfor Organs Portion Whole organ
condemnation Type No. salvaged condemned
Pneumonia Lungs 300 120 180
Peste despetits ruminants Intestines 55 0 55
Metritis Uterus 24 0 24
Abscesses Liver, lung, kidney 240 48 216
Mastitis Mammarygland 84 0 84
Cirrhosis Liver 60 0 60
Pericarditis Heart 72 0 72
Splenomegaly Spleen 24 0 24
Gastroenteritis Abomasum,intestines 72 72
Tuberculosis Lymph node, lungs, 5 0 72
kidney,intestines
Caseous lymphadenitis Head 84 0 84
Miscellaneous Liver,kidney, 156 132 24
intestine,uterus
Total (1200) 300 900
507pregnant doeswere slaughtered representingfoetal
wastage of1658%.Thebreedswere equally affectedin
terms offoetalwastage.The ages ofthese slaughtered
goats rangedfrom 1 to5years.
The laboratory study findings are shown in
Table 4. Bacteria isolated included Pasteurella
multocida, Salmonella spp, Staphylococcus aureus,
Staphylococcus epidermidis, Bacillus cereus,
Escherichia coli, Corynebacteriumpseudotuberculosis,
Pseudomonas spp, Proteus spp, and Mycobacterium
Spp.
Table3. Breed and sex distribution ofslaughteredgoats and
the incidence offoetal wastage.
Sex
Pregnant Foetal
Breed Bucks Does does wastage%
RedSokoto 3771 2516 417 16.57
Kano Brown 585 383 63 16.45
Dwarfgoat 231 158 27 1708
140 Small RuminantResearchNetworkWorkshop

Pathological conditions in slaughteredgoats atZaria
Table 4. Bacteria cultured from condemned tissues of
slaughteredgoats atZaria.
Type ofbacteria Source
Udder,joints,uterus, liver,
lung, kidneyand lymph nodes
Staphylococcus aureus
Salmonellasp Lung,intestine
Bacilluscereus Udder,lymph nodes
Pasteurella multocida Lungs,uterus
Escherichia coli Intestine,lungs
Staphylococcus epidermidis Lung,uterus
Corynebacterium Parotid lymph nodes, lung
pseudotuberculosis
Pseudomonassp Uterus
Proteus sp Uterus
Discussion
Research scientists in Nigeria have notpaid sufficient
attention togoatproduction and diseases ofgoats.The
potential ofgoats as meatproducers has recentlybeen
recognised in the country. It is when the diseases
affectinggoats are identified and their epidemiology
understoodthat meaningfulpreventive andproduction
programmescanbeformulated.
This study may be valuable in the area of
monitoring conditions that are public health hazards.
Most of the observed conditions leading to
condemnation of organs in this survey are accepted as
zoonoses(Schwabe 1969)).The implication beingthat
the public has been saved from acquiringthese deadly
and debilitating disease especially tuberculosis,
hydatidosis and cysticercosis.
The low incidence of some of the conditions
reported mayindicate the lesssignificant roletheyplay
asgoatdiseasesin this area.
Helminthiasis, particularly haemonchosis,
accounted for 12.4% of the total disease condition
encountered.This certainly calls for improved control
andpreventive measuresuch as regular dewormingand
avoidance offadama area forgrazing. Akerejola et al
(1979)estimatedthe economiclossduetoroundworms
in Zaria and Kano areas in sheep and goats to be 60
million Naira.
Peste despetits ruminants(kata)which accounted
for3.5% ofthe disease incidences is ofgreat economic
importance.Amortality rate of50% ormore has been
reported(Akerejolaetal1979).NduakaandIhemelandu
(1973)put the mortality rate at 100% in veryyoung
gOatS.
Salmonella spp, Staphylococcus aureus and
Bacillus cereusisolatedfromgoat organs are ofpublic
health importance. This calls for erection ofmodern
abattoirs with laboratory and cold storage facilities.
These facilities will help in ensuring that only
wholesomegoatmeatispassedforhumanconsumption.
The lack of ante-mortem examination by meat
inspectors in this area has serious public health
implications consideringthe zoonoticbacteria isolated
from the goat organs.The high incidence (16.58%) of
foetal wastage could have been reduced ifthere were
proper ante-mortem examination. Pregnant doe
recoveryschemesmaybepursued.
The findings of this study suggest that meat
inspection practices require some improvement. The
hostile attitude ofthe butchers and goat traders has
resulted in the lenient nature ofmeat inspection. For
example somegeneralised abscess conditions requiring
more serious attentionsuch as totalcondemnationwere
justtrimmed offandpassedfor consumption.
Asource of disease spreadtothe slaughter house
workers andperhapsthe communityis the practice of
stealingand consumingdiseased meatbythe slaughter
house workers. Itis hereby recommendedthat proper
burning or burying of diseased meat should be
mandatory. This will also reduce the incidence of
consuming diseased meat by many birds and
carnivorouspet animals.
Finally, education ofbothbutchersandgoattraders
is necessary sothatthey can see the needforthorough
goat meatinspection.Thereis needtoimprovehygienic
conditions atthe slaughter houses so asto reduce meat
contamination.Thebutchersandgoattraders shouldbe
encouragedto seekveterinary assistance fortheir sick
animals.
References
AkerejolaO.O., Schillhorn Van VeenTW. and NjokuCO.
1979.Ovine and caprine diseasesin Nigeria.A review
of economic losses. Bulletin ofAnimal Health and
Production in Africa27:65-70
Gefu J.O. 1982. Socio-economic characteristics of goat
producers and their husbandry practices in northern
Nigeria. Proceedings of the Third International
Conference on Goat Production and Disease, Tucson,
Arizona, USA, 10-15January 1982. DairyGoatJournal
PublishingCompany,Scottsdale,Arizona,USA.p.357
(abstract).
ILCA(InternationalLivestockCentreforAfrica).1979.Small
Ruminant Production in the Humid Tropics. Systems
Study3. ILCA,AddisAbaba, Ethiopia.122pp.
MillerW.C. and Robertson (eds). 1959. Practical Animal
Husbandry. 7th edition.Oliver and Boyd,London,UK.
419pp.
Molokwu E.CL. 1982. Goat Production in Nigeria
Prospects and Problems. National Workshop on Small
Ruminant Diseases and Production in Nigeria,
University ofNigeria, Nsukka, Nigeria.
Nduaka O. and Ihemelandu E.CI. 1973. Observations on
pneumonia-enteritis complexin dwarfgoatsin Eastern
States of Nigeria. Preliminary reports. Bulletin of
Epizootic Diseases ofAfrica21:87-89.
Olayide S.O., Olatunbosun D., Idugosie E.O. and Abiagom
J.D.1972.AQualitativeAnalysis ofFoodRequirements,
Supplies andDemands in Nigeria 1968-1995. Federal
Department ofAgriculture,Lagos, Nigeria.
SchwabeGW.1969.VeterinaryMedicineandHuman Health.
2ndedition.WilliamsandWilkinsCompany,Baltimore,
Maryland,USA.302pp.
Small RuminantNetworkWorkshop 141

Ojo
Etudedes conditionspathologiques rencontrées chez les caprins
abattus dans les abattoirs deZaria
Résumé
Les maladies animales constituent un sérieux
obstacle au développement de l'élevage des petits
ruminantsauNigéria. Lamise enplaced'unprogramme
efficace de lutte contre les maladies des caprinspasse
par une bonne connaissance des affections les plus
fréquemment rencontrées dans la région considérée. Il
importeparailleurs de connaître les risques que courent
les populationshumaines exposéesàcertaines maladies
animales.Acet effet, des visites des abattoirs de Zaria
ontétéoganisées entrejanvier etdécembre 1992envue
de collecter des informations pertinentes sur les
conditions pathologiques rencontrées chez les caprins
abattus au cours de cette période. Des données étaient
conservéessur le sexe et la racedes animaux,les pertes
foetales, les résultats des analyses de selles et les vers
prélevés sur les organes malades. Un total de 7644
caprins ont été examinés. Les helminthiases
constituaient 17,52% des maladies observées contre
48%pour lapneumonie,35%pour lapeste despetits
ruminants et3,2%pour les abcès dufoie,despoumons
et des reins.Surles 1200organesmalades observés,300
soit25% étaientpartiellement atteints tandis que dans
les900autrescas,l'organeétait irrécupérable, aumême
titre que cinq carcasses entières. Des pertes foetales
avaient été enregistrées sur 1658% des3057femelles
abattues. Les pathogènes comme Mycobacterium sp,
Salmonella sp, Staphylococcus aureus et Bacillus
cereus, isolés des organes atteints, revêtent beaucoup
d'importance en matière de santé publique. Des
propositions ont été avancées en vue d'améliorer les
méthodes d'inspection de la viande des abattoirs et
d'améliorer la formation des bouchers et des vendeurs
de chèvres.
142 Small RuminantResearchNetworkWorkshop

Fascioliasis and nutrient metabolisminpregnantand
non-pregnantSheep
O.O. Akinbamijo " A. Lahlou-Kassi*andS Tembely*
I. Department ofAnimal Production Systems
Agricultural University, Postbus 338, 6700AH
Wageningen,The Netherlands
2. International LivestockCentreforAfrica(ILCA)
PO.Box5689,AddisAbaba, Ethiopia
Abstract
The effectofexperimentalfascioliasisonvoluntaryfeed
intake (VFI), organic matter digestibility (OMD),
nitrogen retention(NR), rate ofliveweight changesand
lamb birth weight was studied in 23 open and 17
pregnantMenzewes.Theinfectionwasimposedbyoral
dosingwith500metacercariae ofFasciola hepaticain
pregnant ewes at sixweekspost-breeding and in open
ewes. All animals were housed in concrete floored
pens and assigned to four treatment groups: infected
pregnant (PI, n=9), non-infected pregnant (PC, n=8),
infected open (OI, n=11)and non-infected open (OC,
n=12). Infected animals became anaemic asfromweek
8post-infection (pi.) and F. hepatica eggswere first
observed in the faecesfromthe 11thweekpi. During
the nitrogen retention trial (13th weekpi), organic
matterintake (OMI)and digestibility coefficientswere
not affected by fascioliasis. All parasitised ewes
exhibited higher urinary nitrogen resulting in lower
nitrogen retention and lower weight gains when
comparedwith control ewes. Lamb birth weightsfrom
infected dams were lower (P<005) compared to the
controldams. Itwasconcludedthatundertheconditions
of the present experiment, while feed intake and
digestibility coefficients were not affected, rates of
liveweight changes were negatively affected by
fascioliasis. Nitrogen balance was lower in infected
eweswithouta corresponding reduction in feedintake.
Introduction
The present study argues the relevance of a multi
disciplinary approach necessaryfor sustainable animal
production in Africa. During the 2nd Biennial
conference oftheAfricanSmallRuminantNetwork,our
previous research findings were reported on the effect
oftrypanosomiasis (Akinbamijo and Reynolds 1994).
This paper reports a composite part ofa study ofthe
genetic resistance to endoparasites usingthe Ethiopian
Menzsheep.
Helminthicinfections pose a significantproblem
to grazing livestock world-wide (Boray 1969; Dargie
1980) affecting the intake, digestibility and the
utilisation of absorbed nutrients. The interaction
between parasites and feed intake and utilisation has
raisedmanyunansweredquestionsin animalproduction
science. Fasciola hepatica, a parasite of considerable
veterinary andeconomicimportance, is knownto cause
considerable reduction in the digestibility of nutrients
and overall productivity in the hosts (Hall 1985). In
recentyears, moreandmoreworkisnowbeingfocused
on the nutritionalphysiology ofthe parasitised animal
in an attempt to explain the deleterious effects or
exonerate the potential of genetic resistance to
endoparasites ofsmall ruminants.
The impaired productivity during Ovine
fascioliasis is thoughttobe a result ofthe reducedfeed
intake and poor feed utilisation often observed in
parasitised hosts (Sykes and Coop 1976; Sykes and
Coop1977;Dargie etal 1979).
This paper reports the first results ofF. hepatica
infection on feed intake, digestibility coefficients,
nitrogen retention and liveweight changesin pregnant
and openMenzsheep.Theinfluence offascioliasis on
foetalsurvivalandlamb birth weightwas alsostudied.
Materialsandmethods
Animals
Forty adult cycling ewes with a mean live weight of
239kg(range 182-286,SD=261)wereselectedfrom
aflockofon-station rearedsheepoftheMenzbreed.To
provide uniformityin weightand conformation, allthe
eweswere allocatedinto 10blocks offour animals each
onweightbasis. In eachblock,two eweswere allotted
atrandomtotwomaingroups of*infected'and *control'
groups. Thereafter, these two main groups were
subdividedwithin blockto *pregnant' and "open' ewes.
This grouping resulted in infected pregnant (PI),
non-infected pregnant (PC), infected open (OI) and
non-infected open (OC)groups.
All animalswere drenchedwithfenbendazole and
triclabendazole against nematodes and trematodes,
respectively, andvaccinated againstpasteurellosis and
Small Ruminant Research NetworkWorkshop 143

Akinbamijo et al
clostridial infection at the beginning of the study.
AnimalsingroupsPIandPCwereoestrussynchronised
withprostaglandin(Dinoprostthromethanine Lutalyse).
Oestrus animals on heatwere bredinstantlywith rams
wearingcolour markers.
Feedingand housing
All eweswere stall-fed and offered hay ad libitum. In
addition, each animal received300g/d ofasupplement
consisting of 60% wheat bran + 40% Guizotia
abyssinica (noug). The chemical composition of the
feed offered is presented in Table 1. During the
experiment, allanimalswerefed at0900hdaily.Water
and mineral lickwere always available.
Animalswere housedin penswith concretefloors
throughout the experiment except during two
digestibility and nitrogen retention trials, when they
were housedinwooden cages.
Live bodyweight
Liveweight changeswere assessedbyweighing atthe
beginningofthe experimentandsubsequentlyatweekly
intervals. Weighing was done after an 18-hour
abstinencefromfoodto avoidvariation ingutfill. Lamb
birth weightswere taken within 12hours ofbirth or as
soon as thedamhadcompleteddryingthe lamb.Packed
cell volume (PCV) was measured by the capillary
micro-haematocrit method at the beginning of the
experimentandweeklythereafter.
Parasitologicaltechniques
Laboratory-reared F. hepatica metacercariae (Baldwin
Aquatics,California,USA)wereusedinthe experiment.
Atthestart ofthe experiment,animalsingroups PIand
OIwere inoculated orallywith500metacercariae ofF
hepatica enclosed in single gelatin capsules. As from
twoweekspre-infection, faecalsampleswere collected
per rectum and analysedforfaecaleggcount(FEC)on
aweekly basis using theM*MasterTechnique.
Digestibility andN-balanceprocedure
The digestibility and nitrogen retention trial was
conducted on all animals during the 13th week
post-infection (p.i.). Total feed ingested, faeces and
urinevoidedwere collectedforseven consecutive days
after a 14-day adaptation period. Feed refusals were
weighedjust before fresh feedwas offered.Urine was
collected in a plastic bowl containing 10 ml of50%
hydrochloric acid.Urine,feed, ort andfaecal samples
were collected per period and sampled. The samples
werefrozen(intheform theywere collected oroffered)
until requiredfor analysis.Samplesoffeed offered and
refusals andfresh faeceswere analysed for dry matter
(DM), ash and nitrogen while urine was analysed for
nitrogen only. The procedures described in AOAC
(1975) were followed. Appropriate statistical
procedures as describedbyAkinbamijo and Reynolds
(1994)wereused.
Results
ParasitisedewesindicatedasignificantlylowerPCV(as
fromweeks8till 11pi.)comparedwithnon-parasitised
ewes Figure 1. Mean differences (P<0001) between
initialandfinalPCV(%)values ongroupbasisare-50,
-10,1.1 and 1.3(RSD299)forgroups PI,PC,OIand
OC, respectively. Faecal egg count conducted from
week 11 through 14pi. was higher (P<005) in the
pregnant ewesvaryingfrom 60to 170 eggspergram
(Figure2).
Data on feedintake and nitrogen retention at 13
weeksp.i. are presentedinTable 1.Althoughpregnant
ewesconsumed slightly more(P<005)OMIthan open
ewes,there was no significant difference in intake due
to fascioliasis.Also digestibility coefficients andfaecal
nitrogen did not differ for all groups. There was no
Table 1. Mean estimates ofintake, digestibility and nitrogen balance ofexperimental ewes (Trial 2 late pregnancy).
G r oup s
Variables PI PC OI OC RMS
Il 9 8 11 12 -
Metabolic size 11.2 11.9 11.2 10 9 1.12
Intake (g/kg**)
Drymatter 71.6 72.2 62.5 66.4 6.42
Organicmatter 66.8 656 60.0 62.8 561
Digestible organic matter 29.1 29.3 29.4 31.1 4.40
Nitrogen 1.00 1.01 089 0.94 0.10
Dry-matter digestibility(%) 42.9 444 44.6 46.6 0.05
Organic-matter digestibility(%) 44.5 46.6 48.7 49.6 0.05
Urinarynitrogen (g/kg**) 0.24 0.23 0.26 0.23 0051
Faecal nitrogen (g/kg**) 0.69 0.68 0.62 0.64 0.069
0073 0,100 0003 007 0.064
PI=infected pregnant;PC=pregnant non-infected;OI=infected open;OC=open uninfected;RMS=residualmean square.
144Small RuminantResearchNetworkWorkshop

Fascioliasisandnutrientmetabolisminsheep
PCV(%)
39
38 -
37 -
36 -
35 -
34
33
32
31
30
29
27 - * .I.
26 -
25 - | | | | | | | | |
8 9 10 11 12 13 14 15 16 17 18 19 20
Weeks ofgestation
Figure1.Mean( ESE)sequential changes inpackedcellvolumeofF. hepaticapregnantinfected(groupPI pregnantnon-infected
(groupPC ) openinfected (group dIO)and open uninfected (group OC )Menzsheep.
Faecal egg counts
(eggs/g)
200
KX3 GroupP
16O H GroupOl
12O H
--
--
80 -
1
Weekspost-infection
Figure 2.Mean ( ESE)faecal egg countforpregnant (group
PI) and open(group OI)sheep.
significant difference between nitrogen balance of
infected and non-parasitised pregnant animals. Open
infected ewes, however, retained less (P<0.001)
nitrogenwhen comparedwith control ewes.
The relationships between nitrogen retention and
DOMIforpregnant ewesare:0.382(SE0033)+00152
(SE 0003) DOMI r*= 80% for PI, and -0.262
(SE0022)+ 00117 (SE0003)DOMI r*=70% for
PC. Regression equations for open ewes are 0.337
(SE0035)+00115(SE0002)DOMI r*=79%for OI,
and-0385(SE0032)+00149(SE0003)DOMI r*=
77%forOC.
Accordingly, infected eweswouldrequireahigher
DOMItoattain nitrogen equilibriumthanwouldcontrol
animals. The intercepts ofpregnant ewes also differ
significantly implicating high N losses from infected
6WeS.
Result ofthe linear regression analysis ofrate of
liveweight changeshowedthat,whileinterceptwas not
affected by treatment imposed on the ewes, the
regression coefficientwas affected. Predicted rates of
gainwere243,443,143and 17.1 (RSD= 0011)g/d
for PI,PC,OIandOCgroups,respectively.In effect,PC
ewesgained moreweightwhen comparedwith PIewes
but the difference between OI and OC did not attain
statistical significance. Ingeneral, average dailygains
during the experiment show that parasitised animals
gained less weight than did the control animals
(Figure 3).The difference in rate ofliveweight change
between open and bred ewes was significantly
influencedbypregnancy,infection and the interaction
between bothfactors.
Infected pregnant ewes had lower live weights
before lambingandbirthweights oflambsfromPIewes
were affected by fascioliasis. Lamb birth weights
observedin this studywere 1.63versus 1.89kg(SE=
007)forgroups PIandPC, respectively
Small RuminantResearch NetworkWorkshop 145

Akinbamijo et al
Live weight(kg)
30
29 -
28 -
27 -
26 -
25 -
2* | - -- -, - • • •
- , f/
-* s .
...-E. ,•*
22 | |
*\ :-/ *" .
23 - ** • . .°
--
3 4 5 6 7
| I T | I T
8 9 10 11 12 13 14 15
Weekspost-infection
Figure3.Mean changes in live bodyweightpatterns of F. hepatica infectedpregnant (group PI pregnantnon-infected (group
Pc - ) openinfected(group OIO)and open uninfected(groupOC « )Menzsheep.
Discussion
Virtually all the published work on nutrition and
host-parasite interactions indicatesthat the feedintake
ofa parasitised hostis lowerthan that ofits uninfected
counterpart(Berry and Dargie 1976;Dargie et al 1979;
Sykes et al 1980). Contrarytopreviousfindingsinsheep
infected with F. hepatica, DMIin this studywas not
affectedbyfascioliasis.
Although the level of DMI was high, the
digestibility coefficients were low and unaffected by
fascioliasis.The digestibility coefficients obtained in
this experiment are a reflection ofthe quality ofbasal
dietoffered(roughly65%ofpoorqualityhay)andhence
the low DOMI observed in the digestibility trials.
Previous reports in the literature on DMD during
fascioliasisare conflicting.HawkinsandMorris(1978),
Sykes et al(1980) and Sinclair(1975)found no effect
ofF. hepaticaonthe DMDinsheep carryingupto400
flukes. This infection load was compatible with our
infectiondose.Withthe lowintake ofdigestible organic
matter reported in this study and assuming 26 g
DOMI/kg 75 per day (ARC 1980) for maintenance,
available DOMIin excess ofmaintenance requirement
was atbest 15% maintenance requirement.
Animportant consequence ofthe infection inthis
study is that the feed conversion efficiency was
substantiallydepressedbyfascioliasis.Thisisevidentin
the inferiornitrogen retention ofinfectedsheepwithout
aconcomitant reductioninfeedintake anddigestibility.
Variationsinfeedintake andurinarynitrogen excretion
have been widely attributed toinfection in parasitised
animals(Sykesetal1980;Akinbamijoetal 1992).High
urinary nitrogen excretion provides evidence that
fascioliasis has a detrimental effect on nitrogen
metabolism. In infected ewes, nitrogen retention was
significantly lowerwhen compared with control ewes
due to high excretion ofurinary nitrogen. The main
effect ofthe infectionwasto lowerthe efficiencywith
which apparently digested and metabolised N was
retained.Roseby(1970)andHawkinsandMorris(1978)
reportedthatin sheep infectedwith 500 metacercariae
(an infection dose similar to our choice), feed
conversion was considerably depressed and rate of
liveweight gains were reduced without matching
reduction in feedintake.
The different regression equations of nitrogen
retentiononDOMIalsosupporttheview that efficiency
of utilisation of nutrients was doubtlessly lower in
infectedewes.Althoughnodigestive disturbanceswere
found,infected ewes did not retain nitrogen as much as
uninfected ewes given the same amount of DOMI.
Infected pregnant ewes gained less weight and used
bodyreservesto offsetcost ofinfection andpregnancy.
Atthe same level ofDMI,non-parasitised ewesgained
morebodyweightandmaintainedbetterbodycondition
untilterm. Duringthethird trimester,tocompensatefor
theincreasedfoetaldemands,pregnantewesconsumed
moreDMandretainedmorenitrogenthandidopenewes
(Adu 1975; Osuagwuh and Aire 1990) and nitrogen
retention did notdifferbetween PI andPCewes.While
the PI ewes seemingly gained in retaining similar
quantities ofnitrogen asPCewes,theylost out onlamb
146Small RuminantResearch NetworkWorkshop

Fascioliasisand nutrient metabolism in sheep
birth weight and body condition.Open ewes also had
different nitrogen balances between infected and
uninfected animals.
Meanbirthweightoflambsbornbyinfected ewes
was14% lowerthanthatoflambsfromuninfectedewes.
This difference strengthens the notion that animal
productivityin terms offoetal development and lamb
crop are affectedbyfascioliasis.
The onset of reduction in efficiency in feed
utilisation,dropinPCVandlowrate of liveweightgains
all ofwhich occurredin concert argue for a detrimental
effect ofF.hepaticain sheep.
In conclusion,this study demonstrated that under
the conditions ofthe present experiment (adult menz
sheep with probable acquired immunity), feed intake
and digestibility coefficients were not affected by
fascioliasis.The differences in the weightgain due to
fascioliasisinpregnantandopenewes reflectsthe lower
efficiency of feed utilisation in infected ewes as is
typical ofF. hepaticainfected sheep.Nitrogen retention
(as an index of utilisation of DOMI) was lower in
infected open ewes without parallel reduction in feed
intake.
References
Adu I.F. 1975. The Effects of Steaming Up' on the Birth
Weight, Lactation and Growth ofWestAfrican Dwarf
Sheep. PhD thesis, University of Ibadan, Ibadan,
Nigeria.
AkinbamijoO.O. and Reynolds L. 1994. Trypanosomiasis
induced reproductive wastage in West African Dwarf
sheep. In: LebbieSHB.,ReyB. and IrunguE.K. (eds),
Small Ruminant Research and Development in Africa.
Proceedings ofthe Second Biennial Conference ofthe
African Small Ruminant Research Network, AICC
Arusha, Tanzania, 7-1 1 December 1992. ILCA
(International Livestock Centre for Africa)/CTA
(Technical Centre for Agricultural and Rural
Co-operation). ILCA, Addis Ababa, Ethiopia. pp.
95-102.
AkinbamijoO.O., Hamminga B.J., WensingTh., Brouwer
BO.,TolkampB.J. andZwartD. 1992.The effectofT
vivax infection inWestAfrican Dwarfgoats on energy
and nitrogen metabolism. The Veterinary Quarterly
14:95-100.
AOAC(Association ofOfficial Analytical Chemists). 1975
Official Methods ofAnalysis. 12th edition. AOAC,
Washington,DC,USA.
ARC (Agricultural Research Council). 1980. The Nutrient
Requirements ofRuminant Livestock. Commonwealth
Agricultural Bureaux,Farnham Royal,Slough,UK.
Boray J.C. 1969. Experimental fascioliasis in Australia.
Advances in Parasitology7:96-210
BerryCI. and DargieJD. 1976.The role ofhost nutrition in
the pathogenesis of ovine fascioliasis. Veterinary
Parasitology2:371-332
Dargie J.D. 1980. The pathophysiological effects of
gastro-intestinal and liver parasites in sheep. In:
Ruckbusch Y. and Thivend P. (eds), Digestive
Physiology andMetabolism in Ruminants. Proceedings
of the 5th International Symposium on Ruminant
Physiology held at Clemont-Ferrand, 3-7September
1979. MTP International Publishers, England. pp.
349_371.
Dargie J.D., Berry C.I. and Parkins J.J. 1979. The
patho-physiology of ovine fascioliasis : Studies on the
feedintake and digestibility, bodyweight and nitrogen
balance of sheep given rations of hay or hay plus a
pelleted supplement. Research in Veterinary Sciences
26:289 -295
Hawkins C.D. and Morris R.S. 1978. Depression of
productivityin sheep infected with Fasciola hepatica.
VeterinaryParasitology4:341-351.
Osuagwuh AI.A. and Aire TA. 1990. Intrauterine growth
rates of the West African Dwarfgoat and some foetal
organs in relation to strategic feed supplementation
during pregnancy. Journal of Veterinary Medicine
37:198-204.
Roseby FB. 1970. The effects of fascioliasis on wool
production in Merino sheep. Australian Veterinary
Journal46:361-365.
Sinclair K.B. 1975. The resistance of sheep to Fasciola
hepatica: Studies on the pathophysiology ofchallenge
infections. Research in Veterinary Sciences
19:296-303.
SykesA.R. andCoopR.L. 1976. Intake andutilization offood
by growing lambs with parasitic damage to the small
intestines causedby dailydosingwithT. colubriformis.
Journal of Agricultural Science (Cambridge)
SykesAR.andCoopRL. 1977.Intakeandutilization offood
by growing sheep with abomasal damage caused by
daily dosing with O. circuminata larvae. Journal of
AgriculturalScience(Cambridge)88:671-677.
Sykes AR., Coop R.L. and Rushton B. 1980. Chronic
subclinicalfascioliasis in sheep: Effects onfoodintake,
food utilization and blood constituents. Research in
VeterinarySciences28:63-70
Small RuminantResearch NetworkWorkshop 147

Akinbamijo et al
Lafasciolose et le métabolisme nutritionnelchez les
brebisgestantes et nongestantes
Résumé
L'effet d'une facsiolose expérimentale sur
l'ingestion volontaire, la digestibilité de la matière
organique, la retention d'azote, le rythme de chan
gementdupoids et le poidsdes agneauxà la naissance
a été déterminéchez40 brebis dont23 étaientvides et
17gravides. Lesanimauxontétéinfectésparvoie orale
avec500métacercaires de Fasciolahepatica, les sujets
gravides ayant été contaminés six semaines après la
fécondation.Tous les animaux avaient été logés dans
des enclosausol cimentéet allouésà quatregroupes de
traitement: les sujets gravides infectés (PI, n=9), les
sujets gravides non infectés (PC, n=8), les animaux
vides infectés(OI, n=11)et lessujetsvides noninfectés
(OC,n=12). Les animauxinfectéssouffraientd'anémie
dès la8èmesemaine après l'infection etdes oeufsdeF
hepatica étaient observés dans leursfècesdès la 11ème
semaine après l'infection. Il ressort des résultats de
l'essai de retention de l'azote (13ème semaine après
l'infection) que la fasciolose n'avait pas d'effet sur
l'ingestionde matière organique et la digestibilité.Tous
les animaux infectés avaient un taux d'azote urinaire
élevé, d'où une retention d'azote plus faible, et
gagnaient moins de poids que les sujets témoins. Le
poidsà la naissance des agneauxnés de brebis infectées
était inférieur (P<005) à celui des petits issus de
femellestémoins.Enconclusion,onpeut dire que dans
les conditions de l'expérience, la fasciolose n'avait
aucun effetsur l'ingestion alimentaire et la digestibilité
mais ralentissait la croissance. Le bilan azotéétaitplus
faiblechezlesbrebis infectéessansque celasoit associé
àune baisse de l'ingestion alimentaire.
148 Small RuminantResearch NetworkWorkshop

Small ruminant managementpractices and control of
lnelminthosisundertraditionalproduction systemsin
the cool Ethiopian highlands
S. Tembely "A. Lahlou-Kassi" S, Sovani " J.E.O. Rege,"
RL Baker* andE Mukasa-Mugerwal
1. International Livestock CentreforAfrica(ILCA)
P.O. Box5689,AddisAbaba, Ethiopia
2. ILCA,P.O. Box46847, Nairobi, Kenya
Abstract
Formulation of cost-effective preventive control
programmesfor helminth infection in small ruminants
shouldbe based on sound epidemiological knowledge
of the time relationship between contamination of
pastures andthe seasonal availability ofinfective larvae
in a given geographic area. Epidemiological data
generatedfrom an on-station experimentinvolvingthe
use of tracer lambs and monitoring of pasture
contamination levelsin the central Ethiopian highlands
clearly showed a distinct seasonalpattern ofnematode
infection in sheep. Investigations into the occurrence
and implications of periparturient rise in tricho
strongylideggoutputinbreedingewes overthe lambing
and lactationperiod are discussed.Atrial to determine
the seasonal pattern of egg development and larval
survival on pasturewas carried out over aperiod of 12
months. Preliminary findings from this study suggest
that the relatively short larval survival times (6 to 8
weeks)present an opportunity for manipulation ofthe
parasitepopulationdynamicsinthe cooltropics. Results
fromthe combination ofthese differentstudies serve as
a basis for medium-term control strategies in this
environment and others with similar climatic
conditions.Becausethesestrategieswill dependheavily
upon the use of anthelmintics, it is likely that, if
understood by extension workers and accepted by
farmers, they will form a basis for development of
programmes for preventing production losses due to
parasitism in young stock by reducingthe number of
treatments and therefore the risk of development of
anthelmintic resistance. Alternative control measures
are also discussed.
Introduction
Helminthosis in small ruminants is of considerable
significance in a wide range of agroclimatic zones of
Africa and affects production through losses due to
mortalities and reduced weight gain (Graber 1965;
SchillhornvanVeen 1973;AllonbyandUrquhart1975;
Scott andGoll1977;Ogunrinade andOgunrinade 1980;
Fabiyi 1987; Bekele et al 1992) and other losses of
production. However,the effects ofhelminthinfections
on production of particular livestock species depend
mostly upon the age of the animals, the breed, the
parasite speciesinvolved andthe intensity oftheworm
populationwithinthe definitive host.Severalfactors are
known to determine the epidemiologicalpatterns ofthe
associated disease conditions. These include weather
conditions, husbandrypractices, andthe physiological
status ofthe animal(e.g. periparturient rise in nematode
eggoutput).
The development ofnematode eggs to infective
larvae and the survival ofthese larvae on pasture are
influenced by temperature, rainfall and other
environmental conditions. Investigations carried out on
nematode larvae ecologyin someparts ofsub-Saharan
Africa (Dinnik and Dinnik 1961;Cheijina and Fakae
1984;Onyali et al 1990;Chartier 1991)andin Europe,
Australia andthe Pacificislands (Southcott et al 1976;
Donald et al 1978; Banks et al 1990; Besier and
Dunsmore 1993) have shown that the rate of devel
opment and the longevity of eggs vary at different
temperature and humidity and in different geo
ecological regions.
The significance to lambs ofthe post-parturient
rise in worm egg output of ewes for worm burdens
acquiredbylambs hasbeen reportedbyseveral authors
(Taylor 1935; Crofton 1954; Brunsdon 1964; Gibbs
1967; Connan 1968; Brunsdon 1970; Connan 1976;
GibbsandBarger 1986;Agyeiet al 1991).Twoschools
ofthought exist onthepossible mechanismsunderlying
this phenomenon.Connan (1968), andO'Sullivan and
Donald(1970)believe thatincreasedfaecal eggcounts
and worm numbers in periparturient ewes are
attributable to a temporary impairment of acquired
immune responsivenessin lactatingewes resultingfrom
increased susceptibility to new infection on increased
prolificacy offemalewormsand resumeddevelopment
ofpreviously arrested larvae. However, Michel(1974,
1976) suggested that the phenomenon could be
explained by a mere delayin adultworm mortalityin
lactating animals.
The seasonalavailabilityandabundance ofthefree
living stage ofsheep nematodes is a key factor in the
SmallRuminant ResearchNetworkWorkshop 149

Tembelyet al
occurrence and severity ofparasitic infection.Studies
on larvae ecologyarehelpfulin designingmore rational
controlprogrammes.
In the central Ethiopian highlands,sheep are kept
under traditional managementwithin a mixed farming
system.The animalsdepend mostly ongrazingwith no
supplementandminimumhealthinterventions. Farmers
maintain onetothree ramswhichcontinuously runwith
theflockwithnocontrol ofmatingandbreeding occurs
year roundwith seasonalpeaks in conception patterns
(Mukasa-Mugerwa et al 1986).Two lambing seasons
are observedaroundJune-JulyandOctober-November.
Twenty-five to30% oftheramsare castratedbetween 1
to3years ofage. Lambsareweanedat3to4monthsof
age.
The objectives ofthis studywere to(i) determine
seasonal patterns of development and survival of
Haemonchus contortus and Trichostrongylus
colubriformis eggs to infective larvae (L3) on pasture
andtostudythe relationshipbetween suchpatternswith
environmental factors; (ii) define the availability to
sheep of metacercaria and infective nematode larvae
resulting from seasonal contamination in the central
highlands of Ethiopia; and (iii) provide pertinent
epidemiological information for designing strategic
helminth controlprogrammes.
Materialsand methods
Experimentalsite
The Debre Birhan ExperimentStation is located in the
centralEthiopianhighlands about 120kmsNEofAddis
Ababa atan altitude of2780mabove sea level(latitude
39'E, longitude 10'N).The climate is characterisedby
a long rainy season (July to September), a short rainy
season in February/March and an extended dry season
from October to February.The average annual rainfall
from 1979 to 1992was 920 mm, while the average
monthlyminimum airtemperature rangesfrom24 Cin
November to 8.5'C in August. The average monthly
maximum air temperature ranges from 18.3'C in
September to 233'C in June. The vegetation in the
station is dominated by Andropogon grasses (A.
longipes)withvariable proportions ofTrifolium spp.
Nematode larvae developmentand
survival on pasture
Tostudythe development andsurvivalofnematodefree
living stages on pasture, an area was fenced off to
prevent entry ofany animals and was divided into 39
plots each measuring one square metre.Theplotswere
separated byiron sheets and drainage ditches to avoid
cross-contamination during heavy rainfall. The grass
was cut as neededto maintain the herbage at a height
and density similar to the grazing paddocks. Pure
cultures of H. contortus and a combination of H.
contortus, T. colubriformis and Ostertagia trifurcata
were usedtoinfect3-to-6-month-old lambstoserve as
donors.Twoplotswere randomlyselected every month
anduniformly contaminatedwithfaeces obtainedfrom
the donor lambs.Eachplot received atotal of2 million
eggs atatime.Threeplots remaineduncontaminatedto
serve as controls.
Seasonal helminthparasite infection in
grazingsheep
Tostudythepopulation dynamics ofhelminthsinsheep,
atotal of84parasite-free lambswere raisedin aslatted
floor barn. Six lambs were released monthly on to
contaminated pasture at the age of eight weeks for a
period ofone monthfromJuly1992 toJune 1993.The
animalswerere-housedinparasite freepensforvariable
periods of time. Three out of the six lambs were
slaughteredtwoweekspost-grazingto assess the level
ofnematodeinfections.Theremainingthree lambswere
also slaughtered 12weeks after aperiod ofgrazingto
determinetheseasonalpattern oftrematodeinfection.A
group of 6 two-month old permanent tracers was
allowedtograzefor12monthsandwere slaughtered at
the age of48weeks. Five lambswere keptindoors to
serve as controls.The followingyear,the experiment
was repeated andinvolved93 lambs ofwhich 6were
turned outtopasture on a monthlybasis, re-housedfor
aperiodof3to 12weeksandslaughtered for nematode
andtrematodeworm counts.Concurrently, agroup of
18two-month-old lambswere released on topasture at
the beginning ofthe experiment(July 1993) andwere
slaughtered in different seasons (i.e. the long rainy
season,the dry season and the short rainy season) to
assessthe cumulative nematodeburden on lambs.Three
lambs raisedinworm-free condition were kept indoors
andserved as controls.
Grasssampleswerealso collectedfortnightlyfrom
the paddocksgrazed bythe lambs for determination of
the level ofthe pasture contaminationbyinfective (L3)
larvae.
Periparturient rise offaecaleggoutputin
breedingewes
From May1992toMay1993atotal of795 Horroand
782Menzeweswere matedto35and36rams(20to22
ewesperram), respectively,followingsynchronisation
using progesterone-impregnated sponges.Agroup of
120eweswere leftunmated(controls)toinvestigatethe
periparturient rise phenomenon over the
lambing/lactating period in the wet and dry seasons.
Duringthethird matingseason (May1993), three rams
perbreedwereretainedfromtheprevioussiregroupand
eight new ramsper breedwere introduced. Faecal egg
count (FEC), packed cell volume (PCV) and body
weight measurementswere monitoredinbreedingewes
(groups2and3)atmating, at3monthspost-mating,two
weeksbefore lambing,fourweeks after lambing, eight
weeks afterlambingand atweaning.
150SmallRuminant ResearchNetworkWorkshop

Small ruminantmanagementpracticesin Ethiopia
Table 1. Recommended time ofanthelmintic treatmentfor sheep in the central Ethiopian highlands.
Ewes Lambs
Pan/ Fas/
Month Nilv Zan Yom Pan/Nilv Fas/Zan Yom
June Yom
July* Nilv
August
September Nilv Zan Nilv
October Fas+Nilv Yom
November** Fas
December Fas
January Fas
* Firstexpected lambing.
**Secondexpected lambing.
Pan=Panacur(fenbendazole);Nilv=Nilverm super(levamisole);Fas= Fasinex(triclabendazole);Zan=Zanil (oxyclosanide);Yom=Yomesan
(niclosomide).
Results
Preliminary observations on the development and
survival ofnematode free livinginfectivestage showed
thateggs depositedin experimentalplots hadundergone
developmentfromJuly(highestyieldofinfective stage)
toNovember(lowestyield)(Figure 1). Neithereggs nor
lnfective larvae/kg dryherbage/mllllon eggs
Contamlnated:
\ July
-T T T T T
August
T- I T T
N September
T T
October
T T T T T
November
T T I T
Deoember
T Tr T
January
T T T T T
February
T T T T T T
March
T T I -T T I T T
Jul'93 Aug Sept Oct Nov Dec Jan'94 Feb Mar April
Haemonchus
- - Haemonchus/Trichostronglus/Ostertagia
Figure 1.Development and survival of nematole infective
stages onpasture.
L3 were present from deposited faeces three months
following deposition of eggs. No eggs developed into
larvaefromthosedepositedon pasturebetweenOctober
and March.
Worm counts in tracer lambs duringthetwo-year
study period (July 1992-July 1994) were similar in
pattern (Figure 2). The three main trichostrongylid
nematode parasitesidentifiedin order ofpredominance
were: Ostertagia trifircata, Trichostrongylus
colubriformis and Haemonchus contortus. The large
intestine sheep pinworm, Skrjabinema ovis (although
non-pathogenic),was consistentlyabundantthroughout
the studyperiod.Worm burden peaked in September
and October. Lungworms, Dictyocaulus filaria, were
present in lambs but in relatively small numbers.
Observations on the same tracer lambs indicated that
transmission of Fasciola hepatica took place between
SeptemberandJanuarywithapeakin December. Ifthe
animalswereleftuntreated,theygenerallydiedfromthe
infection.
Peak numbers of larvae were observed in grass
samples collected during the month of August
throughout the study period. A gradual decline in
pasture larval count over the subsequent 3 months
(September,OctoberandNovember)wasfollowedbya
non-detectable level oflarvae untilthebeginningofthe
next rainy season with a few larvae observed in May
1992 (Figure 2). Species composition was consistent
from August to November with a predominance of
Ostertagia, Trichostrongylus and Haemonchus.
Oesophagostomumwas recordedin afew cases.
Preliminary analysis of FEC in breeding ewes
showed significant (P<005) season and breed effect.
A periparturient rise in FEC was observed in both
breeds before and afterparturition in both the wet and
dry seasons, but was more pronounced in the wet
season (Figures 3,4 and 5). Body weight and PCV
were significantly affected during late pregnancy.
Acquisition ofnewlyinfective larvae mayhave largely
Small RuminantResearch NetworkWorkshop 151

Tembelyetal
epg
7000 tracers
6,0OO permanent
50OO
4,000
3,000
2,000
1,000
Number L3/kg ofdrygrass
1,400 T
1.2oo -
1.ooo -
800 -
800 -
400 -
200 -
Rainfall (mm)
400
300 -
2OO -
1OO -
0
## # g
3 # 4 :Months
Figure2. Monthly rainfall, availability ofinfective larvae on pasture and mean FEC in tracers and permanent lambs.
contributedtotheperiparturition riseinfaecaleggcount
because ofsubstantialrainfallrecordedinthe wet season
in 1993. Faecalculturefromtheewesat differentperiods
of the year indicated the predominance of
Trichostrongylus colubriformis (48%) followed by
Ostertagia trifurcata (33%), Haemonchus contortus
(17%) andDictyocaulusfilaria(08%)with no distinct
seasonalpatterns.
Discussion
Ostertagia trifurcata, Trichostrongylus colubriformis
and Haemonchus contortus were found to be the
dominant nematode species in central Ethiopian
highlands in association with the liverfluke, Fasciola
hepatica andtapewormsMoneziaspp.
Number ofnematode larvae onpasture increased
with the onset of the rains (June) peaked in
152 Small RuminantResearch NetworkWorkshop

Small ruminant managementpractices in Ethiopia
Menz mated --
Horro mated --
Menzunmated ....o...
Horro unmated - - -
--
Rainfall (mm)
: N
2OO \ \N
: N
N \ \
Month
Figure3. Faecal egg counts and PCVvalues in lactating and unmated control ewes (wet season lambing, 1992)
August/September andprogressively decreased to an
undectable level in the dry season. Worm burden in
lambsborninthewetseasonfollowedthe samepattern.
The critical time for preventive measures to initiate
treatment for different classes of stock is shown in
Table 1. Treatment of breeding ewes for nematode
infections with an effective broad-spectrum
anthelmintic (Panacur* or Nilverm* super) atthe start
of the rainy season (late June/early July) should
substantially reduce pasture contamination around
parturition and will prevent newly born lambs from
being exposed to heavily contaminated pasture. A
second treatment is advisable in September/October
(beginningofthedryseason)toreducethe effectsofany
infection from residual larvae. The firsttreatment for
fascioliasis with Zanil*is recommended in Augustto
clearup adult liverflukes acquired duringtheprevious
grazingseason.Asecond and third treatmentshouldbe
appliedin November/December andJanuary/February
with Fasinex*toremove both developingimmatureand
adult flukes acquired duringthe current grazingseason.
With regardtothe lambsandyearlingsbornin the
wet season,the first treatment againstgastro-intestinal
nematodes shouldbe consideredinAugust/September
whenthepasture larvae countis atamaximumfollowed
byasecondtreatmentinNovember. Forlambsbornin
the dryseason,the treatment schedule should be asfor
adult sheep, that is in July and September ofthe
Small RuminantResearch NetworkWorkshop 153

Tembelyet al
Menz mated Horro mated Menz unmated Horro unmated
2.8
2.6 . - --- .
2.4 -* A *- -
2.2
2
1.8
1.6 L-*
T - - - ------.-.----* ****--.....
,. .. • • • • ***e,..· ·***
Rainfall (mm)
400
300
200
1OO
Jan '93 Feb Mar Apr
Figure4. Faecal egg counts and PCVvalues in lactating and unmated control ewes (dry season lambing 1993)
followingyear.Although resultsfromthepresentstudy
cannotbe broadly applied to all agro-ecological zones
ofthe tropics, the data can beusedin computer models
(e.g. Barnes and Dobson 1990) to simulate grazing
systems for a quick and cheap screening of different
controlprogrammes.
Thevalue ofshort-termpasture spellingwould,in
practice, be minimal in the Debre Birhan area
particularly duringthe wet season.Ourstudyhas shown
thatthe time ofsurvival ofinfective larvae on pasture
varies between six and eightweeks between July and
November. However, management systems allowing
flocks to movetonewgrazing areaswithinthe limit of
that time mayprovide relatively safe pasture. Barger et
al (1994) working with goats reported encouraging
results on rotationalgrazingsystemsin the wettropical
environments ofthe Pacific islands.
Alternategrazingbysheepand cattle has alsobeen
advocated as a useful means of controlling internal
parasites in Australia (Morley and Donald 1980) but
maybe of little relevance in extensive grazingsystems
wheresheepandcattle aregrazedtogether. Itisunlikely
that development ofnew anthelminticswilltake place
in the near future. Only four distinct groups ofbroad
anthelmintics, namelythebenzimidazoles,levamisoles,
morantelandthe avermectines have reachedthe market
in the past50years.Thus, alternative control measures
should be considered. The use of mixtures or
combinations of anthelmintics could be considered in
controlprogrammeswhen resistance to one or more of
the drugfamilieshas developed.Successin dealingwith
the problem of anthelmintic resistance depends on
persuading farmers to modify their worm control
practices. In particular,farmers should be made aware
that high frequency of treatment, under-dosing and
continuous use of one anthelminticgroup will lead to
rapid development ofresistant strains.
A convenient means for the application ofsmall
amountsofhighlypotentanthelminticsoveraprolonged
period oftime is the use of controlled release capsule
154 SmallRuminantResearchNetworkWorkshop

Small ruminant managementpractices in Ethiopia
Menz mated Horro mated Horro unmated
---------
Menzunmated
epg
4,000
3,000
2,000
1,OOO
Rainfall (mm)
4OO
300
200
1OO
May'93 Jun Jul Aug Sep Toet "TNov Dec
Month
Figure5. Faecal egg counts and PCVvalues in lactating and unmated control ewes (wet season lambing 1993)
technology. It hasbeen shown thata capsule designed
topreventpasture contamination for about 100days at
critical times produces dramatic effects on the
epidemiology ofnematodeinfections(Anderson 1990).
Theuse ofthecapsulesincreasesthe certaintyofsuccess
of preventive controlprogrammes because,in contrast
to conventional treatments, rapid reinfection cannot
occur within the lifetime of the capsule despite the
occurrence of weather conditions conducive to the
transmission ofinfection.
Another methodfor controllinginternalparasites
is the use ofvaccines.To date, little success has been
achieved in the development ofprotective immunity
againsthelminthinfection with vaccines,butthe future
looks promising(Smith and Smith 1993;Smith et al
1994).The only commercially available and effective
helminth vaccine is the irradiated/attenuated larvae
vaccinefortheprevention ofbovinepneumoniacaused
bythe lungworm Dictyocaulus viviparus (Peacockand
Poynter 1980). Laboratory modelsystem usingsimilar
vaccines against a wide range of gastro-intestinal
parasites mayalsobe rewarding(Lloyd 1981). Failure
to immunise against helminth parasites has generally
been attributedtoa deficiencyintheimmunogenicity of
vaccines.
There is also an increasing body of evidence of
geneticvariationforresistancetoendoparasitesinsheep
and goats (Baker et al 1992). This has prompted
increasedinterestin the possibility ofselectingbreeds
or strains of animals which are genetically resistantto
wormparasites(Dineen 1985;Gray 1991).
Conclusion
Epidemiological knowledge,its application in grazing
management whenever feasible and access to
anthelmintics of high efficacy are key factors for the
success ofcontrolling helminthinfections in domestic
ruminants. Predictive models based on more complete
SmallRuminant ResearchNetworkWorkshop 155

Tembelyet al
information on the ecology ofhelminth infection and
anthelmintic resistance, climate and local management
factors should provide a basis for improved control
schemes,whetherbasedonchemotherapy, management
and immunisation in regions with similar climatic
conditions.While these studies are being undertaken,
current efforts targeted atthe identification andfuture
exploitation ofsheep breeds resistantto endoparasites
shouldhelpminimisethe reliance onfrequenttreatment
with anthelmintics.
References
AgyeiAD.,SapongD. andProbertA.J. 1991. Periparturient
rise in faecal nematode egg counts in West African
Dwarf sheep in Southern Ghana in the absence of
arrested strongyle larvae. Veterinary Parasitology
39:79-88.
AllonbyEW.andUrquhartG.M.1975.Theepidemiologyand
pathogenic significance ofhaemonchosis in a Merino
flock in East Africa. Veterinary Parasitology
1:129-143.
Anderson N. 1990. The challenge of endoparasitism:
developments in the control of nematode infections of
sheep. Proceedings of the New Zealand Society of
AnimalProduction 50:215-227.
Baker R.L., Lahlou-Kassi A., Rege J.EO., Reynolds L.,
BekeleT, Mukasa-Mugerwa E. and Rey B. 1992. A
review ofgenetic resistance to endoparasites in small
ruminantsandanoutlineofILCA'sresearchprogramme
in this area. In: Proceedings of the 10th Scientific
Workshop of the Small Ruminant Collaborative
ResearchSupportProgram,Nairobi,Kenya.SR-CRSP,
Nairobi, Kenya.pp.79-104
Banks D.J.,Singh R., Barger I.A., Pratrap B. and LeJambre
L.F.1990. Developmentandsurvivalofinfective larvae
of Haemonchus contortus and Trichostrongylus
colubriformis on pasture in a tropical environment.
International Journal ofParasitology20:155-160
Barger I.A.,Siale K., Banks DJD. and LeJambre LF.1994
Rotational grazing for control of gastrointestinal
nematodes of goats in a wet tropical environment.
VeterinaryParasitology53:109-116
Barnes E.H. and Dobson R.J. 1990. Population dynamics of
Trichostrongylus colubriformis in sheep: Computer
modelto similategrazingsystems andthe evolution of
anthelmintic resistance. International Journal of
Parasitology20823-831.
BekeleT.,WoldeabT, Lahlou-KassiA. and Sherington J.
1992.Factors affectingmorbidity andmortality on-farm
and on station in the Ethiopian highland sheep. Acta
Tropica52:99-109
Besier R.B. and Dunsmore J.D. 1993. The ecology of
Haemonchus contortus in a winter rainfall climate in
Australia: The survival ofinfective larvae on pasture.
VeterinaryParasitology45293-306
Brunsdon R.V. 1964.The seasonalvariationsinthe nematode
egg output of sheep: A comparison ofthe spring rise
phenomenon in breeding and unmated ewes. New
Zealand VeterinaryJournal 15:35-40
Brunsdon R.V. 1970.The spring rise phenomenon: seasonal
changesin thewormsburdens ofbreedingewes andthe
availability of pasture infection. New Zealand
VeterinaryJournal 1847-54
Chartier C. 1991. Développement et survie d'Haemonchus
contortus d'origine ovine sur parcelle à Bunia (Ituri,
Zaire).Revue d'Elevage et de Médecine Vétérinaire des
paysTropicaux44:169-174.
ChiejinaS.N. andFakaeB.B. 1984.Developmentandsurvival
ofinfective larvae ofgastrointestinalnematodeparasites
of cattle in Eastern Nigeria. Research in Veterinary
Science37:148-153.
Connan R.M. 1968.Studies on the worm populations in the
alimentary tract of breeding ewes. Journal of
Helminthology429-28
ConnanR.M.1976.Effectoflactationontheimmuneresponse
to gastrointestinal nematodes. Veterinary Record
99476-477
CroftonH.D.1954.Nematodeparasite populationinsheep on
lowlandfarm. 1.Wormeggcountsinewes.Parasitology
44:465-473.
Dineen J.K. 1985. Host and host responses: Alternative
approaches to control ofparasites andparasiticdiseases.
In: Anderson N. and Waller P.J. (eds), Resistance in
Nematodes to Anthelmintic Drugs. CSIRO
(Commonwealth Scientific and Industrial Research
Organisation),Melbourne, Australia.pp.149-157.
Dinnik J.A. and Dinnik N.N. 1961. Observations on the
longevityofHaemonchuscontortus larvae inthe Kenya
highlands. Bulletin of Epizootic Diseases ofAfrica
9:193-208.
DonaldAD., Morley FH.W.,Waller PJ., Axelson A. and
Donnelly J.R. 1978. Availability to grazing sheep of
gastrointestinalnematodeinfectionarisingfromsummer
contamination of pastures. Australian Journal of
Agricultural Research29:189-204
FabiyiJ.P. 1987. Production losses and control ofhelminths
in ruminants oftropical regions. International Journal
ofParasitology 17:435-540
Gibbs H.C. 1967. Some factors involved in the spring rise
phenomenoninsheep.In:SoulbyE.JL.(ed),Veterinary
MedicalReview"Thereactionofthe hosttoparasitism".
Proc.third Intl.Conf.WorldAssoc.Adv.Vet. Parasitol.
pp. 169-173.
GibbsH.L. and Barger I.A. 1986.Haemonchus contortus and
other trichostrongylid infections in periparturient,
lactating and dry ewes. Veterinary Parasitology
22:57-66,
GraberM.1965.Helminths ethelminthiasisfaisant obstacle à
l'amélioration de laproduction ovine en Republique du
Tchad IEMVT (Institute d'Elevage et de Médecine
Vétérinairedes paysTropicaux), FortLamy,Tchad.162
pp.
Gray D.G. 1991. Breedingfor resistance to trichostrongyle
nematodesin sheep. In:OwenJB. andAuxfordR.FE.
(eds),BreedingforDiseaseResistancein FarmAnimals.
CAB (Commonwealth Agricultural Bureaux)
International, Wallingford,UK.pp. 139-161.
Lloyd S. 1981. Progress in immunization against parasitic
helminths. Parasitology83225-242
156 Small RuminantResearchNetworkWorkshop

Small ruminantmanagementpractices in Ethiopia
Michel J.F. 1974. Arrested development of nematodes and
some related phenomena. Advances in Parasitology
12:279-366.
MichelJ.F. 1976. Nematode infections in grazing animals.
Advances in Parasitology 14:355-387.
MorleyFH.W.andDonaldA.D.1980. Farmmanagementand
systems of helminth control. Veterinary Parasitology
6:105-134.
Mukasa-MurgerwaE.,EphraimBekele andTadesseTessema.
1986. Productivityofindigenoussheepandgoats in the
Ada district ofthe Ethiopian highlands. In: Proceedings
oftheWorkshopontheImprovementofSmallRuminants
in Eastern andSouthernAfrica, Nairobi, Kenya, 18-22
August 1986. OAU (Organization of African
Unity)/IDRC (International Development Research
Centre), Nairobi, Kenya.pp.81-87.
Ogunrinade A. and Ogunrinade B.I. 1980. Economic
importance ofbovine fascioliasis in Nigeria. Tropical
Animal Health andProduction 12:155-160
Onyali I.O., Onwuliri C.O.E. and Ajayi J.A. 1990.
Development and survival of Haemonchus contortus
larvae on pasture at Vom, Plateau State, Nigeria.
Veterinary Research Communications 14:211-216.
O'Sullivan B.M. and Donald A.D. 1970. A field study of
nematode parasite populations in the lactating ewes.
Parasitology61:175-179.
Peacock R. and Poynter D. 1980. Field experience with a
bovine lungwormvaccine.In:TaylorAER.andMuller
R. (eds), Vaccines Against Parasites. Symposium of
British SocietyforParasitology 18:141-148.
Schillhorn van Veen T W. 1973. Small ruminant health
problems in Northern Nigeria with emphasis on the
helminths. Nigeria Journal ofAnimal Production
2:26-31.
Scott J.M. and Goll P.H. 1977. The epidemiology and
anthelmintic control ofovine fascioliasis in the central
Ethiopian fighlands. British Veterinary Journal
133:273-280,
SmithW.D. andSmithS.K.1993. Evaluation ofaspectsofthe
protective afforded to sheep immunized with a gut
membrane protein ofHaemonchus contortus. Research
in VeterinaryScience55:1-9.
SmithWD,SmithS.K. and MurrayJM. 1994. Protection
studies with integral membrane fractions of
Haemonchus contortus. Parasite Immunology
16:231-241.
SouthcottW.H.,MajorGW.and Barger I.A. 1976.Seasonal
pasture contaminationandavailability ofnematodesfor
grazing sheep. Australian Journal ofAgricultural
Research27:277-289.
TaylorEL. 1935. Seasonalfluctuationinthe number ofeggs
oftrichostrongylidwormsin thefaeces ofewes.Journal
ofParasitology21:175-179
Modedegestion despetits ruminants et lutte contre les
helminthoses dans lessystèmes d'élevagetraditionnel des régions
fraîches des hautsplateauxéthiopiens
Résumé
L'élaboration de programmes coût-efficaces de
prévention desinfections helminthiques chez lespetits
ruminants doit reposer sur une bonne connaissance
épidémiologique des relations temporelles entre la
contamination des pâturages et la présence de larves
infectieuses dans une zone géographique donnée. Les
données épidémiologiques d'un essai en station avec
utilisation d'agneaux traceurs et observation des
niveaux de contamination despâturages dans les hauts
plateaux du centre de l'Ethiopie ont clairement mis en
évidence le caractère saisonnier des infections de
nématodes chez les ovins. Des études effectuées sur
l'augmentationdunombred'oeufsdetrichostrongylidés
et ses conséquences chez les brebis reproductrices à
l'agnelage et au cours de la lactation ont été analysées.
Un essai de 12 mois a été effectué sur la saisonnalité
du développement embryonnaire et la durée devie des
larves sur les pâturages. Les résultats préliminaires de
cestravaux ont montré que les larves vivaientpeu de
temps(sixàhuit semaines),ce quidevraitpermettre de
manipuler la dynamique de lapopulation desparasites
dans ces régions tropicales fraîches. Les résultats de
l'ensemble de cesétudes serventde baseàdes stratégies
de lutteà moyen terme dans cetype de milieu et dans
desrégions aux conditionsclimatiques analogues. Bien
maîtrisées par les agents de vulgarisation et acceptées
par les éleveurs, ces stratégies, qui reposeront essen
tiellement sur l'utilisation d'anthelminthes pourraient,
en permettant de diminuer le nombre de traitements,
constituer labase de stratégies deprévention despertes
de production dues auparasitisme chezlesjeunes.Cela
permettra de limiter les risques de développement de la
résistance aux anthelminthes. Enfin,d'autres méthodes
possibles de lutte ont également étéexaminées.
Small RuminantResearchNetworkWorkshop 157


Pertes en reproduction,chlamydiose, brucellose et
toxoplasmose en élevage extensiftraditionnel de chèvres
guinéennes auSénégal
Ndiaye" J.A. Akakpo* et L.J. Pangui*
"ISRA/PPR, BP2057, Dakar(Sénégal)
*EISMVBP5077, Dakar (Sénégal)
Résumé
Cette étude a été conduite sur des chèvres
guinéennes enélevage extensiftraditionneldans lazone
soudanienne du Sénégal. La répartition des sujets
séropositifsà la chlamydioseà Chlamydiapsittaci, aux
brucellosesà Brucella ovis età Brucella abortus età la
toxoplasmoseàToxoplasma gondii, a été établie sur 12
cas de mortalités néo-natales,20 cas d'avortements et
11 cas de mises bas de produits chétifs.Sur ces43 cas
de pertes en reproduction, on a noté des prévalences
sérologiques de 80% en chlamydiose, de 10% en
brucellose à Brucella abortus, de 23% en brucellose à
Brucella ovis et de 58% en toxoplasmose. Les
implications desinfectionsà l'origine de ces différents
types de pertes sont discutées en fonction de leur
répartition.
Introduction
Des tests sérologiques ont été réalisés sur43 cas
de pertes en reproduction. Les infections à la
chlamydiose (Chlamydia psittaci), aux brucelloses
(Brucellaabortus)et Brucella ovis età la toxoplasmose
(Toxoplasma gondii) ont été recherchées.Cespertes en
reproduction étaient des cas de mises bas de produits
chétifs, d'avortements et de mortalités néo-natales.
L'objectifest de comparer le statut sérologique de ces
trois groupes de chèvres vis-à-vis de chacune de ces
infections afin de déterminer leur lien particulier avec
untype de perte plutôt qu'avecun autre.
Matériels et méthodes
Cette étude a été effectuée sur des chèvres
pluripares,de raceguinéenne. Lesprélèvements ont été
effectués de novembre92à mars93,période couvrant
le premier des deux pics annuels de mise bas .. Les
chèvresutilisées appartiennentà21 éleveurs établis sur
13 villages satellites de la ville de Kolda. Il s'agit de
prélèvements uniques de sérum, réalisés dansun délai
maximum de 8 jours suivant l'événement clinique
assimiléàune perte en reproduction.
Les sérums ont été conservés par congelation
jusqu'à la fin de lapériode de collectepuis testés. Les
tests sérologiques utilisés ont été la fixation du
complément en microméthodepour la chlamydiose, la
brucelloseàBrucellaabortus et la brucelloseàBrucella
ovis et l'immunofluorescence indirecte pour la toxo
plasmose. Les seuils de positivité retenus ont été la
dilution au 1/4pour lachlamydiose(Akakpo, 1987),au
1/8pour les deuxtypes de brucellose(Akakpo,1987)et
au 1/16pourlatoxoplasmose (Pangui, 1993).
Lestypes de pertes retenus sont les suivants.
- avortements: mise bas de morts-nés ou inter
ruption de lagestation non rapportée à une cause
alimentaire,toxique ou accidentelle.
- chétivité: misebasd'animauxaupoidsau contrôle
inférieur ouégalà 1,4kg(limite établie sur labase
de la moyenne despoids recueillis lejourmêmede
la naissance, estimée à 2,2 kg) ou avec un très
faible entrain à la tétée. Ces produits meurent
généralement avant l'âge de3 mois.
– mortalité néo-natale: cas de chevreaux nés
normaux mais qui meurent dans lesjours suivant
la mise bas.
Lesprévalencessérologiquespartype deperte ont
étécomparéesàl'aideduprogrammecalcstatdulogiciel
Epiinfo (Dean, 1988). Les valeurs des probabilités de
l'hypothèse nulle ontétédéterminéessuivant lescaspar
le test du khi carré oupar le contrôle d'exactitude de
Fisher(Dean, 1988).
Résultats
La répartition des cas de séropositivité suivant
les types de pertes est présentée au tableau 1. La
chlamydiose et la toxoplasmose ont les plus fortes
prévalences globales, soit respectivement79 et 58%.
Lesprévalences de la toxoplasmose et de la brucellose
à Brucella ovis présentent les plus importantes
variations d'untype de perte àun autre. Cestaux sont
nettementsupérieursà ceuxobtenus surun échantillon
aléatoire de40femelles caprines en 1991 dans lazone
de Kolda,àsavoir 13,6%entoxoplasmose(ELISA),O%
Small RuminantResearch NetworkWorkshop 159

Ndiaye et al
Tableau 1: Répartition etprévalence de la chlamydiose, de la brucellose et de la toxoplasmose enfonction du type deperte en
reproduction
Variables Chlamydia V. ovis B. abortus Toxoplasma
- - - - - -
Chétivité 9 2 2 9 1 10 5 4
829/ 189/ 99/ 56
Mortalité 10 2 2 10 1 11 9 2
néo-natale 839/ 89/ 82%
Avortement 15 5 6 14 2 18 8 10
759/ 309/ 44%
Totalpar résultat 34 9 10 33 4 39 22 16
799/ 239/ 589/
Total testé 43 43 43 38
en brucellose (Brucella abortus par séroagglutination)
et 3,5% en chlamydiose (fixation du complément en
microméthode).
En effet, la mise bas de produits chétifs accom
pagne souvent des états d'infection par des germes à
tropisme génital connus aussi pour leur effet abortif
C'est le cas de la toxoplasmose et de la chlamydiose
(Debenedetti&Waldeland, 1989).
Pour ces diverses raisons, il est convenu de
regrouperles pertesparchétivité etparavortement,dont
les statuts sérologiquesfaceà la toxoplasmose sont les
plusproches,pour les comparerauxpertesparmortalité
néo-natale (tableau3).
Discussion
En comparant par le test du khi carré les séro
positifs aux séronégatifs, on constate que la toxo
plasmose, avecuneprobabilitéseuilde 14%,différencie
le mieuxlestroistypes deperte(tableau2).
Tableau2:Probabilités de prévalences équivalentes entre les différents types de pertes.
Probabilités en%de l'hypothèse nulle
aVOrtement chétivité chétivité aVOrtement
chétivité X X X
Organisme mortalité mortalité aVOrtement mortalité
Chlamydia pX282 2pF 100 2pF 100 2pF68
B. ovis pX2:61 2pF100 2pF67 2pF68
B. abortus pX298 2pF 100 2pF 100 2pF 100
Toxoplasma pX2:14 2pF33 2pF69 2pF64
X2=probabilitéseuilselon letest du khi carré
2pF=probabilitébilatérale de Fisher.
Lesprévalences de latoxoplasmose distinguent le
mieux les troistypes de perte avecune probabilité de
l'hypothèse nulle de 14%.
En fait, c'est entre les pertespar mortalités et les
pertes par avortements que les différences de
prévalences en toxoplasmose sont les plus marquées,
l'hypothèse nulle ne dépassantpas64%.
Par ailleurs, lesprévalences entoxoplasmose chez
les chèvres qui avortent et celles qui mettent bas des
produits chétifssontplusproches qu'entre lespremières
et celles qui perdent leurs produits nés normaux par
mortalité; la probabilité de ne pas différencier les
premières est de 69% contre 33% pour les secondes.
Cette observation, sous réserve du faible effectiftesté,
corrobore les connaissances acquises en matière de
pathogénie des avortementsinfectieux.
Tableau3. Répartition de la toxoplasmose lors de mortalités
néo-natales et lors d'avortements ou mises bas de produits
chétifs
Toxoplasmose
Type + - Total
Chétivité avortement 19 4 23
Mortalité néo-natale 15 5 20
Total 34 9 43
La probabilité de l'hypothèse nulle, après test du
khicarré, n'est que de8%.
Ces résultats statistiques permettent de retenir que
la toxoplasmose est chez les chèvres pluripares, un
160 Small RuminantResearchNetworkWorkshop

Pertes en reproduction chezles caprins auSénégal
facteur de risques de pertes par mortalité néo-natale
plutôtquede pertespar avortementou chétivité.
Conclusion
Ce suivisérologique etclinique apermisd'établir
que latoxoplasmose contribue plusaux mortalités néo
natales qu'aux autrestypes deperte.Cette contribution
décelée sur un si faible échantillon est sans doute très
importante (Schwartz, 1989). Aucune conclusion
définitive ne peutpar contre être retenue quantau rôle
des infections brucelliques ou chlamydiennes dans
l'avènement d'untype de perte plutôt que d'un autre.
Bibliographie
Akakpo J A et coll. 1997. Epidémiologie des brucelloses
animales en Afrique tropicale: enquête clinique,
sérologiqueetbactériologique InRev.Sci.Tech Off. int.
Epiz,1987,6(4),981-1027
DeanJAet coll. 1988.Epiinfo, version2.1 mars 1988.Logiciel
de traitementde donnéesd'enquêtes épidémiologiques.
70pages.
Debennedetti A et coll. 1989. Anomalies précoces de la
gestation et toxoplasmose chez la chèvre. Dans :
Pathologie caprine etproductions. Etudes et synthèse de
l'EMVT2ème colloque de Niort 26-29 juin 1989.pp
563-567
PanguiLJet coll. 1993.Utilisation de l'IFIetde l'ELISAdans
une enquête sérologique de la toxoplasmose chez les
moutons de case à Dakar(Sénégal). In Rec. Med.Vet,
1993,169(1)45-46
Schwartz D. 1989. Méthodes statistiques à l'usage des
médecins et des biologistes,3ème édition,306pages.
Editeur Flammarion-Médecine etSciences. Paris.
WaldelandH et coll. 1989. Abortion ingoatsin Norway. In
Etudes et synthèses de l'EMVT. Pathologie caprine et
productions. 2ème colloque de Niort 26-29 juin 1989
pp549-550
Reproduction losses, chlamydiosis, brucellosis andtoxoplasmosisin
atraditional extensiveWestAfrican Dwarfgoatsystem inSenegal
Abstract
Thisstudywas carriedoutonWestAfrican Dwarfgoats
in extensive traditional livestockproduction systemsin
the subhumid zone of Senegal. Animals tested
seropositive for chlamydiosis caused by Chlamydia
psittaci, for brucellosis caused by Brucella ovis and
Brucella abortus, and for toxoplamosis caused by
Toxoplasmagondiiin 12casesofperinatalmortality,20
cases ofabortions and 11 cases of birth ofsubstandard
offspring, respectively. Of these 43 cases of
reproductive losses, serological prevalences of80%,
10%, 23% and 53% were recorded and were due,
respectively, to chlamydiosis,to brucellosis caused by
Brucella abortus and Brucella ovis and to
toxoplasmosis.Theimplications ofthese infectionsfor
these reproductive losseswere discussedin relation to
their distribution.
Small RuminantResearch NetworkWorkshop 161


Diseases ofSmall ruminantsin Botswana 1983-92
T. Kibirige-Sebunya andT. Diteko
Department ofAnimalHealth andProduction
Private Bag0032, Gaborone, Botswana
Abstract
Thepaperhighlights the diseases ofgoats andsheepthat
are endemicinBotswanabasedon conditions diagnosed
and recordedbythe NationalVeterinary Laboratory at
Gaborone between 1983 and 1992. The most
predominant diseases were helminthosis, coccidiosis,
heartwater, abortions and rabies. Abscesses,
pneumonia/pleuritis, mineral deficiencies and
keratoconjunctivitiswerealsocommon.Otherprevalent
conditionsincluded,skinparasitesincludingringworm,
enterotoxaemia, salmonellosis, mastitis, septicaemia,
bluetongue, contagiousecthyma(Orf), balano-posthitis,
footrot,haemoparasitesandpoisoning. Poorhusbandry
andunfavourableenvironmentalfactorsplayeda rolein
disease occurrence.There was demandfor more work
to determine causes of abortions, pneumonia/pleuritis
and eye infections and improved diagnostics for
botulism and heartwater.
Introduction
Thispaperisaretrospectivestudy ofdisease occurrence
ingoats andsheepinBotswanaduringa 10-yearperiod
(1983to 1992) based on clinical cases diagnosed and
reportedfrom the field and confirmed atthe National
Veterinary Laboratory(NVL)atGaborone,Botswana.
TheNVLprovidesa comprehensive diagnosticservice
thereby contributing to the surveillance of diseases
affectinganimalsin Botswana.
In Botswana it would appear that weather and
climatic conditions greatly influence disease
occurrence. Rainfall and temperature influence the
quality and quantity of available grazing and drinking
water andthusthe conditions ofthe animals.The latter
has direct bearing on susceptibility and resistance of
animalsto diseases(Carles 1983).
When Botswana experiences drought, livestock
travel long distances in search ofgrazing and water.
Deaths due to starvation and stress induced diseases
have been reported. Under the prevailing husbandry
practices,sheepandgoatshaveloweconomicand social
value andfarmers deworm/treat or vaccinate them less
often than theydo cattle. Ingeneral,livestockcondition
in Botswanais mostlypoorduringthewintermonths of
June to August especially in the communal areas
(District Reports 1988-92).
The present study was meant to look at the
changingpatterns ofsmall ruminant diseasestofurther
understanddisease causation,treatment, prevention and
control, andevaluate methodsof disease detection.
Materialsand methods
Samples were collected from the field from disease
cases for virology, bacteriology, histopathology,
serology,haematology,biochemistry,parasitology and
toxicology and submitted toNVLwith clinical history
on designated laboratory submission forms. Each
collection of samples from one or more animals from
each farm or locality was designated as a batch of
samples and allocated a laboratory numberwith known
species code. Batches ofspecimenswere subjected to
the appropriate comprehensive laboratory diagnosis for
suspected agents or analysedformineraldeficiencies or
haematologyprofiles. Post-mortem examinationswere
alsoperformed on carcases ofsmall stock atNVLand
appropriate samples submitted for diagnosis. Samples
for laboratory diagnosis originated from all veterinary
districts(Figure 1)
Results
During 1983-92,the total annual number ofspecimen
batches submittedtoNVLfromthe fieldincreased over
threetimestoapeakof1148batchesin 1989,declining
graduallyto683batches in 1992. Differing degrees of
confirmationswere obtainedfor different conditions.
High levels of confirmations were achieved for
abscesses and rabies at 86% and 82%, respectively,
relative to8.5%forabortions/stillbirths(Table 1).
Figure2showsthecommonestimportant diseases
withthe highestfrequencies.
Helminthosis and/or coccidiosis were the
commonest diseasesofsmallruminantsand occurredall
year round (Figure 3) with a tendency for peak
infestationsto occurduringthe firstandlastquarters of
theyear.These periodscoincidedwithsummerrainsand
high temperatures and humidity suspected to be
conducive forparasite activity.The commonestworms
identified included Haemonchus contortus,
Oesophagostomum colombianum andTrichostrongylus
Spp.
Heartwater due to Cowdria ruminantium is an
important tickborne disease with recorded losses
rangingfrom single isolated cases to dozens ofdeaths
amonggoats or sheepperflockthroughouttheyearin
the eastern part ofthe country where the vector tick
Amblyomma hebraeum was consistently detected.
Seasonalpeakincidences ofheartwaterwere recorded
during March and September when humidity and
temperaturewere high.
SmallRuminantResearchNetworkWorkshop 163

Kibirige-SebunyaandDiteko
VeterinaryDistrict:
Boundary - -
Headquarters Tshabong
&y BoTswANARoads
Ta\P- 18° aNV S
CAP CHOEE l8
Shakawe
|
: |ationa
Moremi Park Z|MBABWE
Wildlife ------ -
Reserve 19°
NGAMlLAND l Nxai Pan
CD | National
- Maun Park
- 20° Maun
Tsau - 2oo
/" " -\
2* l Makgadikgad Ramokgwebana
| Pans - - |
L . 21° - --- ----- -- ------ Game Reserve -Tx
- "FRANcIsToWN\ V
-
* /
-
Central N /Kalahari A( --
Game Reserve / N 22a
Mamuno GHANZI \ "
N
-23° Mahalapye 23 -
–----------v-- --------- N
Khutse \
Kang Game
-249 W * «wEvene |Tahane N \ -- . | kGATLENG 24o_
-.
*- ,/..KGALAGADI • T- .
-- -- 7|GABORONE
-25° Gemsbok Kanye 25o
NationalPark LOBATSE
Ramatlabama
- 26°
26°
C) 50 1OO 200
-27o
| 2oo 2 ° 22° 24o 25o 26o 27o 29°
L l 1 1 1 l l
Figure 1. Veterinary districts and headquarters.
Reported abortions, stillbirthsandneonataldeaths winter conditions when small ruminants were in poor
varied annuallywith periods ofdramaticallyincreased bodyconditionweresuspectedtohavebeenresponsible
cases.Starvation, malnutrition,intestinal parasites and forthepeaks of"winter abortion storms"(Figure3).
164 SmallRuminantResearch NetworkWorkshop

Diseases ofsmall ruminants inBotswana
Table 1. Comparisons oflaboratory confirmation ofcases in goats and sheep 1988-92
Year andno.positive/total cases andpercentages
Average%
Disease condition 1992 1991 1990 1989 1988 positive
Abscesses 13/13 22/24 4/5 42/52 2/34
(%positive) (100) (91.6) (80) (808) (676) 840
Rabies 44/50 54/66 57/66 20/26 19/24
(%positive) (88) (81.8) (864) (769) (792) 82.46
Heartwater 49/82 1 19/168 64/127 1163/223 78/96
(%positive) (598) (708) (50.4) (73.1) (81.3) 6708
Pneumonia/pleuritis 4/9 9/13 11/95 22/22 12/32
(% positive) (444) (692) (11.6) (100) (37.5)
Conjunctivitis 5/9 14/16 2/6 4/11 1/9
(%positive) (556) (875) (333) (364) (11.1) 44.78
Externalparasites 8/9 7/29 7/20 8/70 4/18
(%positive) (889) (24.1) (350) (11.4) (222) 36.32
Abortions/stillbirths 6/48 6/31 5/87 2/68 1/50
(%positive) (12.5) (194) (57) (29) (2) 8.5
There were 225 positive rabies cases in small
ruminants during1983-92,rankingaboutfourthbehind
bovine,canine andwildlife rabies.The numberofrabies
cases increasedgraduallyto about five times ofthose
detecteda decade ago(Figure 2).
Mineral deficiencies among smaii stock
comprised mostly hypophosphataemia resulting in
abnormalitiesin locomotion;therewerefewer cases of
hypocupraemia leading to cases of sway back or
paralysis ofthe hind quarters.Goitre, a consequence of
iodine deficiency, was detected intermittently in the
Number of
CaSeS
300 Rabies ZZ] Abortion/stillbirth
fXX Heartwater lntestinal parasite
250 -
200 -
p
150 -
100 - %
-%50
1L/1X3
1983 1984 1985 1986 1987 1988 1990 1992
Years
Figure2. Confirmed cases ofhelminthosis coccidiosis, heartwaterand rabies, with total cases ofabortions 1983-92
Small RuminantResearch NetworkWorkshop 165

Kibirige-SebunyaandDiteko
Number of
25
Abortions
Helminths
20-
X
315
310-
&
5-
0 -
J J A S O N D
Months
Figure3. Seasonal distribution ofcaprine and ovine cases, 1992
endemicareas ofMaun andOrapa districts. In addition,
a few fatal cases ofstarvation were reported annually
particularlyin the winter season and duringperiods of
drought. Pneumonia/pleuritis, often reported as
pasteurellosis,wascommonlydiagnosedin thefield but
these cases were largely negative for Pasteurella
multocida and P. haemolytica, the known common
causal agents. Pasteurellosis, induced by the stress of
shipping small ruminants, developed along classical
lines where the animals developed pneumonia and P.
multocidawas recoveredfromthe typical lesions.
Moraxella bovis or Branhamella ovis were
recovered from448% ofthe eye infections (Table 1)
Variations in sampling ofinfected cases andtreatment
of cases before sampling appeared to affect recovery
rates ofinfectious agents.
Sheep scab, a notifiable condition caused by
Psoroptes ovis, appeared to be endemic and restricted
tothe southern districts. Demodexmites, lice infestation
with Linognathus stropsis and differenttypes ofticks
(Amblyomma hebraemum, Boophilus spp, Hyalomma
spp and Rhipicephalus spp) were also recorded.
Streptothricosis/dermatophilosis, caused by
Dermatophilus congolensis, and ringworms were
reportedsporadically.
Miscellaneous diseases with lower occurrences
included enterotoxaemia (47 cases), mastitis (86),
septicaemia (57), viral diseases, bluetongue and
contagiousectymaorf(47), balano-posthisis(Pizzle rot)
and haemoparasites,AnaplasmaandTheileria being of
questionable pathogenicity. Botulism diagnosis was
dependent on clinical signs particularly during the
droughtperiodslinkedwithhypophosphataemialeading
to cravingforbones containingbotulism toxin.
Cases ofpoisoningcausedbyPavettaharboriiand
Dicaptalum cymosem were more commonly
encounteredwith minimal availablegrazing.
Discussion
Laboratory findings at NVL have shown that some
conditionspersistently occurredand recurredwith high
frequency in sheep and goats during 1983 to 1992,
namely helminthosis/coccidiosis, heartwater,
abortions/stillbirths and rabies. These conditions no
doubt represent important causes of loss to the small
ruminantindustry.
166 SmallRuminantResearch NetworkWorkshop

Diseases ofsmall ruminants in Botswana
Thepredominance ofthese diseasesmaypartlybe
duetopoorhusbandrywhere dewormingforintestinal
parasites andtick control measures arehaphazard,being
instituted onlywhen diseases were suspected (District
Reports 1988-1992). Also, the finding of low total
protein or albumin levels in sera of aborted animals
strengthensthesuscipionthat malnutrition orstarvation
plays an important role in most instances of abortion
(Report NVL 1983-92). There is need, therefore, to
determinethe roles ofnutrition and/orinfectious agents
in abortionsin small ruminantsin Botswana.
Notably, vaccination against heartwater is
problematic:itis costly, causes direct lossesfollowing
inoculation, is unreliable as breaks in immunity are
common,increasesthe number of carriers ofCowdria,
requires strictsupervision andis difficult to carry out on
a large scale (Windsor 1987;Camus and Barre 1988).
Nevertheless,vaccination is considered a useful means
ofpreventing heartwater without eradicatingthe total
tick population in an endemic area. Suggestions have
been madeforthe need to develop attenuated strains of
Cowdriaby culture in vitro orresearch onstrains lowin
virulence(Camus and Barre 1988). Fordiseaseswhere
vaccination ofsmall ruminantswasincreasinglybeing
practised(District Reports 1988-1992), the number of
laboratory confirmations were lower, namely
enterotoxaemia,botulism andpasteurellosis. In thecase
ofpasteurellosis, other causes, excluding Pasteurella
multocida or P. haemolytica, have been postulatedbut
remain unproven(ReportNVL1983-92)
Lackofsimple, reliable and sensitive tests hinder
heartwater diagnosis and there is need to developtests
to detect Cowdriain living animals(Camus and Barre
1988).
It would appear that good husbandry practices
directed towards reduction of mortalities on the farm
together with improved clinical and laboratory
diagnosis and research intothe aetiology ofimportant
diseases of small ruminants andimproved methods of
their diagnosis and control are needed in Botswana.
Since the important diseases of small ruminants are
endemic elsewhere in sub-Saharan Africa, local and
regional collaborative efforts with additional
international support, would be beneficial in tackling
similar problems.
Acknowledgement
The field and laboratory diagnosis and compilation of
the reportswere carried outbystaffofthe Department
ofAnimal Health and Production oftheGovernment of
Botswana.Thispaper is presented with permission of
the Director ofAnimal Health and Production.
References
Camus E. and Barre N. 1988. Heartwater: A Review. OIE
(Office International des Epizooties), Paris, France.
147pp.
CarlesAB. 1983. Sheep Production in the Tropics. Oxford
University Press,NewYork,USA.213pp.
District Reports. 1988-1993. Monthly Reports from
Veterinary Districts, Department ofAnimal Health and
Production,Botswana.
Reports NVL. 1983-1992. Annual reports of the National
Veterinary Laboratory, Department ofAnimal Health
and Production,Gaborone,Botswana.
WindsorR.S. 1987.The control ofheartwaterin Botswana. In:
Sutherst R.W. (ed),Ticks and Tick-borne Diseases.
Proceedings of an International Workshop on the
Ecology of Ticks and Epidemiology of Tick-borne
Diseases, held atNyanga,Zimbambwe,17-21 February
1986. ACIAR Proceedings 17:146-147. ACIAR
(Australian Centre for International Agricultural
Research),Canberra,Australia.
Les maladies despetits ruminantsauBotswana:1983-1992
Résumé
Cet article passe enrevue les maladiesdesovinset
caprins considérées comme endémiques au Botswana
sur labase dessymptômesobservés et décrits de 1983à
1992 par le Laboratoire national vétérinaire de
Gaborone. Les affections lesplusfréquentes étaient les
helminthiases, les coccidioses, les cowdrioses, les
avortements et la rage. Les abcès, les pneumonies/
pleurites, les carences minérales et les kérato
conjontivites étaient également fréquentes. Les autres
maladiesrencontrées sont les ectoparasites,y comprisla
teigne ainsi que les entérotoxémies, les salmonelloses,
les mastites, la septicémie, la fièvre catharrale du
mouton, l'echtyma contagieux, les balano-posthites, le
piétin, les hémoparasites et les cas d'empoisement. Les
modes de gestion inappropriés et les mauvaises
conditions de milieu favorisent l'apparition des
maladies. Des travaux supplémentaires s'avèrent
indispensables pour déterminer les causes des
avortements,despneumonies/pleurites et des maladies
desyeuxetpouraméliorerle diagnosticdubotulisme et
de la cowdriose.
Small RuminantResearch NetworkWorkshop 167


Theinteraction between animal nutrition andparasites :
Studieswith experimentaltrypanosomiasisin sheep
E. Katunguka-Rwakishaya
Department ofVeterinaryMedicine, Makerere University
PO.Box7062, Kampala, Uganda
Abstract
The present study investigated the role played by
improved nutrition in the development of
pathophysiological effects oftrypanosomiasisin sheep
giventwolevels ofprotein intake. It was observedthat
feed intake was not influenced by either the diet or
infection.The intensities ofparasitaemia as measured
by the buffy coat method indicated that there was a
tendencyforthe animals receivingthe highprotein diet
to sustain more parasite numbersthan those receiving
the low protein diet. The infected animals on a high
protein diet gained weight at the same rates as the
uninfected controls. However,infectedanimals on low
protein diet showed marked retardation ofgrowth
compared to the uninfected controls. Both groups of
infected animals exhibited similar degrees ofanaemia
butfollowingtreatment,those on the high protein diet
recoveredmuchfasterthanthose onthe lowprotein diet.
It was concluded that improved nutrition in form of
higherproteinintakesamelioratesthe adverseeffects of
trypanosomiasis and also enhancesthe rate ofrecovery
followingchemotherapy.
Introduction
Parasites, particularly gastro-intestinal helminths and
protozoa, are a major constraintto animalproductivity
throughout the world. In many tropical countries
protozoan diseases are of major importance. One
protozoan disease in particular,trypanosomiasis,is the
single mostimportant constrainttoanimalproductionin
ub-Saharan Africa. It has been frequently suggested
hatthe nutritional status ofthe host can influence the
pathogenesis ofparasitic infection and it is generally
accepted that well-nourished animals withstand
parasitism betterthanthosethat are less adequatelyfed
(Whitlock1949;Gibson 1963).
There have been numerous anecdotal accounts of
the importance of host nutrition in the pathogenesis of
trypanosomiasis in ruminants, although until very
recentlythese have remained unsubstantiated.Thus, it
has been frequently reportedfrom thefieldthat during
the dry season trypanosomiasis becomes more severe
whenthe qualityand quantity ofnutritionisparticularly
low.Thishas recentlybeeninvestigatedinTheGambia
by offering supplementary feeding during the dry
seasons to trypanosome-infected N'Dama cattle
(Agyemangetal1990; Little et al 1990).As a result of
thesupplementaryfeeding itwasfoundthatthe severity
ofthe disease, asjudgedbythe degree ofanaemia,was
significantly reduced.
Itispossible that dietmaynot onlyinfluence host
resistance to either the initial infection or re-infection
but may also affectthe ability ofthe hosttowithstand
the pathophysiological consequences of infection.
Unfortunately, thefewstudiesthathavebeen conducted
toexaminetheseinteractionsinthepasthave often been
unsatisfactorybecause ofinadequate controls orpoorly
formulated diets. More recently attempts have been
madetoovercomethese difficultiesandaclearerpicture
of the interaction between host nutrition and the
pathophysiologicalconsequences ofparasiticinfections
has started to emerge.
Thepresentstudywas designedto investigate the
influence of host nutrition on the pathogenesis of
trypanosomeinfection in sheep.
Materials and methods
Experimentalanimals,feedingand
housing
Male castrate lambs, agedsix months,were purchased
from a local hillfarm in the west ofScotland.The basic
diet consisted ofa mixture ofshredded sugar-beetpulp
(SBP), barley siftings and a mineral/vitamin trace
element mixture.Soya-bean meal(SBM)was addedto
the high protein (HP) diet only.The mean proximate
analyses ofthe two diets are showninTable 1.
Table 1. Mean proximate analyses and calculated
metabolisable energyofthehighprotein(HP)andlow protein
(LP)experimental diets(g/kgDM).
Di e t
Dietarycomposition HP LP
Dry matter(g/kg) 880 880
Crudeprotein 176 81
Crude fibre 169 192
Ether extract 5 4
Ash 77 80
Organicmatter 923 920
ME(Mj/kgDM) 9.8 10.1
Small Ruminant ResearchNetworkWorkshop 169
Katunguka-Rwakishaya
The lambs were housed in individual pens on a
concretefloorandwoodshavingswere used asbedding.
The daily allowance of 1 kg fresh matter (FM) was
offeredintwofeedsat0900and 1600h.The residuewas
collectedthefollowingmorningandweighedtogivethe
actualamount offeed consumed.
Five litres ofwaterwereoffered eachmorningand
the residue was recordedthefollowingmorning.
Chemicalanalyses offeed
Representative samples ofthe experimental dietswere
analysedperiodicallyusingstandardprocedures (MAFF
et al 1981).
Experimentalinfection
The animals were infected with Trypanosoma congo
lense 1180 (GRVPS 57/6), a cloned derivative of an
isolate made in Serengeti, Tanzania, as described by
Nantulyaet al(1984).Thetrypanosomeswere obtained
fromirradiatedmice duringthe first risingparasitaemia.
Micewerebledbycardiacpunctureandtheirbloodwas
pooled. An estimate ofparasitaemiawas made on the
pooledsample,which wasthen dilutedwithphosphate
bufferedsaline(PBS)containing1.5%glucose atpH80
togive 1x10° trypanosomesin3mlofPBS.Eachsheep
received3 mlofthe inoculum viathejugularvein.
Parasitological, haematologicaland
biochemicaltechniques
The techniques used to collect blood samples for
parasitological, haematological andblood biochemical
examination have been described previously
(Katunguka-Rwakishaya et al 1992a).
In brief,trypanosomeswere detected bythe dark
groundbuffy coat method(Murray et al 1977), and the
intensity ofparasitaemia was graded from 0 to 5 as
describedby Paris et al(1982).
Experimental design
EighteenScottishBlackface lambswereinvolvedinthis
study. They were divided into two groups of nine
animals each,onthebasis oftheir live weights andPCV,
and introduced to either a low protein (LP) or a high
protein(HP)diet.After4weeks ontheirrespective diets,
six animalsfromthe lowproteingroup(LPIgroup) and
six animals from the high protein group (HPI) were
infected with T. congolense,while three animals from
each dietary group acted as uninfected controls (LPC
and HPC).
Seventy days afterinfection (DAI),three animals
from the HPIgroup(HPIT)and three animalsfrom the
LPI group (LPIT) were treated with isometamidium
chloride,atadose rate of1 mg/kgbydeepintramuscular
injection, andthe animalswere monitoredfor afurther
21 days.
Statisticalmethods
Comparisons between groups were achieved byusing
one-wayanalysis ofvariancefollowedbytheNewman
Keuls multiple range test. Intensities ofparasitaemia
were evaluated by the non-parametric Mann-Whitney
test.These statisticswereperformed usingthe Animal
Designs 1 (Data International Service, Glasgow) and
Minitab(Ryan, Penn State University) Programmes. P
values<005were consideredsignificant.
Results
Feedandwaterintake
The meanfeedintakefor animalsinthe HPIgroupwas
093t0.03 kg/d while the LPI group consumed
098E002kg/dbetween0and70DAI.This difference
was not statistically significant. Control animals
consumed 1 kg/d. The mean water intake ofthe LPI
groupwas2.10t007litres/dwhileHPIgroupconsumed
251t0.10litres/d(P<005).Meanwaterconsumptionin
control groups was not different. The LPC group
consumed230E0.11litres/dwhileHPIgroupconsumed
2.31E0.10 litres/d.
Parasitaemia
The prepatentperiod in bothgroupswasthe same,i.e.
7-9 days after infection. Following patency,
parasitaemiafluctuated considerablywithatendencyto
be higherin HPIthan in LPIgroup(Figure 1).
Bodyweight
Infection was associated with greater retardation of
growth in the LPIgroup compared tothe LPCgroup
(Figure2).Thegain in liveweight ofthe LPIgroupwas
significantlylowerthanthatofthe LPCandHPIgroups.
HowevertheHPIandHPCgroupsgrew atsimilar rates.
There were no significant differences between the
weights ofcontrol animals.
Packed cellvolume(PCV)
Infection caused significantdecreasesin PCVvalues of
both infected groups compared with their controls
(Figure3).The declineinPCVvaluescommencedwith
the appearance oftrypanosomesin circulation and both
groups ofinfected animals showed similar degrees of
anaemia.The PCVvaluesin control animals fluctuated
between 0.32 and 0.40 litres/litre. There were no
nutritionalinfluences.
Mean corpuscularvolume(MCV)
Following infection, both infected groups showed
significant increases in MCV compared to their
uninfected controls, however the increase was
significantlygreaterinthe HPIgroupthaninLPIgroup.
In the HPI group the mean MCV increased from
170 Small RuminantResearch NetworkWorkshop

Nutrition andtrypanosomiasisin sheep
Parasitaemia score
Time afterinfection (days)
Figure 1. Parasitemiascores ofsheep infected withT. congolense and given either ahigh(--O--)or a lowprotein (-- - --)
31.2 -0.3flat0DAIto38.5+1.2f1 at29DAI. In the LPI
group,theMCVvalues increasedfrom31.0+0.7fl at0
DAI to 350E0.6 flat 36 DAI before decreasing to
32.3 -0.7 at68DAI.
In control groups the MCV fluctuated between
300+0.6and330E06flwithnosignificant differences
between LPCandHPCgroups.
Plasma albumin concentration
The mean plasma albumin concentration decreased
significantlyin bothgroups ofinfected sheep and also
showed dietary influences. In the HPIgroup,plasma
albumin decreased from 362E04g/litre at0 DAIto
287E09g/litre at21 DAI.Inthe LPIgroup, it decreased
from308E07to263E06g/litre andtendedto recover
thereafter.
In the control groups, plasma albumin
concentration fluctuated between283and320g/litre
in theLPCandbetween327and363g/litre in the HPC
group.Thevalues intheHPCgroupsweresignificantly
higherthan those in the LPCgroup.
Responsetotreatment
Body weight. Following treatment both groups of
infectedanimalsgainedweight.TheLPITgroupgained
07kgwhilethe HPITgroupgained 1.8kgduringthe3
weeks after treatment. The LPC and HPC groups
increased by 1.2 and 1.8 kg, respectively, in the same
period.
Packed cell volume. Both groups ofinfected animals
showedanimprovementin theirPCVvaluesfollowing
treatment,however, therate ofrecoverywas moderately
fasterintheHPITgroup. By20days aftertreatmentthe
PCV values of the HPIT group were 0.33E001
litres/litre whilethose oftheHPCgroupwere0.32E001
litres/litre.ThevaluesintheLPITgroupwere028E001
while controlswere0.32E001 litres/litre.
Discussion
In the present study, it was shown that improved
nutrition in theform ofincreasedprotein intake had a
marked influence on rates of growth, intensity of
parasitaemia, blood biochemical changes and rate of
recovery from anaemia following administration of
isometamidium chloride.
In agreement with the findings of Little et al
(1990), it was observedthatimproved nutrition did not
affectthe prepatentperiods. Followingthe appearance
oftrypanosomesin circulation, therewasatendencyfor
parasitaemiatobehigherinthe HPIgroup. Thereasons
for this are not clearbut maybe duetoreadilyavailable
nutrients likeproteins and lipids.
SmallRuminant ResearchNetworkWorkshop 171

Katunguka-Rwakishaya
Bodyweight (kg)
38
28
28 ─ ─ ─ ─ ─ ─ ─ ─ ─ ─ ─ ─ ─ ─ ─ ─ ─ ─ ─
7 14 21 28 35 42 49 56 63 7O
Time after infection (days)
Figure2. Bodyweights ofsheep infected withT. congolense
andgiven either ahigh (--C--) or a low(--- --)protein
diet, and of their respective uninfected controls (- -,
Greater retardation ofgrowthwas observedin the
LPIgroupwhile HPIand HPCgroupsgrew at similar
rates.These findings agree with those ofHecker et al
(1991)for Djallonkésheepandthose ofAgyemangetal
(1990) for N'Dama cattle exposed to natural fly
challenge.Verstegen etal(1991) andZwart et al(1991)
observed that development offever duringa course of
trypanosomeinfection is associatedwithincreased heat
production and increased metabolisable energy for
maintenance. The consequence of this is that the
proportion offeed that would be used for growth is
reduced asitis metabolised toprovide extra energyfor
maintenance.The animals onalowprotein dietwould
PCV litres/litre
o22 ----------------
0,40 -
0,37 -
0.34 -
O,31 -
O.28 -
O.25 -
o22 -----------
0 7 14 21 28 35 42 49 56 63 70
Time after infection (days)
Figure 3. Packed cell volumes(PCV) ofsheep infected with
T.congolense andgiven eitherahigh(- -)oralow(---)
protein diet, and of their respective uninfected controls
(--C--, --- --)
sufferthis effect much morethanthose onahighprotein
diet, and this may manifest in the form of greater
retardation ofgrowththan animals onHPdiet.
Similar degrees ofanaemia were recorded in two
groups of infected animals. This observation is in
agreement with that of Agyemang et al (1991) for
N'Dama cattle. However, Little et al (1990) reported
that the rate of development of anaemia in N'Dama
cattle inoculatedwithT. congolense andsupplemented
with groundnut cake was slower than in
unsupplemented cattle. In contrast to this report, the
present study has shown that improved nutrition does
notinfluencetrypanosome establishment andthe rate of
172 Small RuminantResearchNetworkWorkshop

Nutrition andtrypanosomiasisin sheep
development of anaemia. The anaemia in HPI was
macrocytic while itwas nomacytic in the LPIgroup.
This finding suggests enhanced erythropoietic activity
as aresponsetoinfectionintheHPIgroup.Thismaybe
responsible for the observed faster recovery from
anaemiainthisgroup.
Infection causedsignificanthypoalbuminaemiain
both dietarygroups but it appeared greater in the LPI
thanin the HPIgroup.Atthesametime controlanimals
on HP diet had significantly higher plasma albumin
concentration than those on LP diet. It has been
suggested thatuptake ofalbumin-boundfatty acids and
lipoproteins (Vickerman and Tetley 1979) and
haemodilution (Katunguka-Rwakishaya et al 1992b)
may account for the decrease in plasma albumin
concentrationsin trypanosome infected animals.
In conclusion, this study has shown that im
provement ofhost nutrition isimportantin moderating
the severity of pathophysiological effects of
trypanosomiasisand alsoinfluencestherate ofrecovery
from anaemia followingchemotherapy.
References
AgyemangK.,DwingerRH.,TourayBN.,JeanninP.,Fofana
D. andGrieveA.S. 1990. Effects ofnutrition on degree
of anaemia and liveweight changes in N'Dama cattle
infected with trypanosomes. Livestock Production
Science 26:39-51.
Gibson T.E. 1963. The influence of nutrition on the
relationships betweengastrointestrelparasites andtheir
hosts. Proceedings ofthe Nutrition Society22:15-20
HeckerPA.,CoulibalyL., RowlandsGS.,NagdaS.M. and
d'Ieteren G.DM. 1991. Effect ofplane of nutrition of
trypanosome prevalence and mortality of Djallonké
sheep exposedto high tsetse challenge. In: Proceedings
ofthe 21st Meeting ofInternational Scientific Council
for Trypanosomiasis Research and Control (ISCTRC),
Yamoussoukro, Côte d'Ivoire, 21-25 October 1991.
Katunguka-Rwakishaya E., Murray M. and Holmes P.H.
1992a.The pathophysiology ofovine trypanosomiasis :
Haematological and blood biochemical changes.
VeterinaryParasitology45:17-32.
Katunguka-Rwakishaya E., Murray M. and Holmes P.H.
1992b.Thepathophysiology ofovine trypanosomiasis
ferrokinetic and erythrocyte survival studies. Research
in VeterinaryScience 53:80-86
LittleD.A., DwingerRH.,CliffordD.J., GrieveA.S., KoraS.
andBojangM. 1990. Effectofnutritional levelandbody
condition on susceptibility of N'Dama cattle to
Trypanosoma congolense infection in The Gambia.
Proceedings ofthe Nutrition Society49:209A.
MAFF,DAFSand DANI(Ministry ofAgriculture, Fisheries
and Food, Department ofAgriculture and Fisheries for
Scotland and Department ofAgriculture for Northern
Ireland). 1981.TheAnalysis ofAgricultural Materials.
Technical Bulletin RB427. Her Majesty's Stationery
Office,London,UK.226pp.
Murray M., Murray PK. and McIntyre WI.M. 1977. An
improvedparasitologicaltechniqueforthe diagnosis of
African trypanosomiasis. Transactions of the Royal
Society ofTropical Medicine andHygiene71:325-326
NantulyaVM., Musoke A.J., Rurangirwa R.F. and Moloo
A.K. 1984. Resistance of cattle to tsetse-transmitted
challenge with Trypanosoma brucei or Trypanosoma
congolense after spontaneous recovery from
syringe-passaged infections. Infection and Immunity
43:735_738
ParisJ., MurrayM.andMcOdimbaFA.1982.Acomparative
evaluation ofthe parasitological techniques currently
available forthe diagnosis ofAfricantrypanosomiasisin
cattle.ActaTropica39307-316
VerstegenM.WA.,ZwartD.,VanderHelW., BrouwerBO.
and WensingT. 1991. Effect ofTrypanosoma vivax
infection on energy and nitrogen metabolism ofWest
African dwarf goats. Journal ofAnimal Science
69:1667-1677
VickermanK. andTetleyL. 1979. Biology andultrastructure
oftrypanosomesin relation topathogenesis. In: Losos
G. and Chouinard A. (eds), Pathogenicity of
Trypanosomes. IDRC (International Development
ResearchCentre),Ottawa,Canada.pp.23-31.
Whitlock JH. 1949. The relationship of nutrition to the
development of trichostrongylides. Cornell
Veterinarian 39:146-182.
ZwartD.,BrouwerB.O.,VandenHelW.,vandenAkkerH.N.
and Verstegen M.WA. 1991. Effect ofTrypanosoma
vivax infections on bodytemperature,feedintake and
metabolic rate ofWest African Dwarfgoats.Journal of
Animal Science 69:3780-3788.
Interaction entre l'alimentation animale et lesparasites :
étudessur la trypanosomiase expérimentale chez les ovins
Résumé
Cette étude examine le rôle d'une meilleure
alimentation dans le développement des effets
patho-physiologiques de la trypanosomiase chez des
ovins recevantdeuxrations, l'uneàtauxélevé, l'autreà
faible taux de protéine. La teneur en protéine et
l'infection n'avaient aucun effet sur l'ingestion.
L'intensitéde laparasitémie, mesurée par laméthode du
buffy coat, aindiquéque les animaux recevant la ration
àtaux élevé de protéine supportaientgénéralementun
niveau de parasitémie plus élevé que ceux recevant la
Small RuminantResearch NetworkWorkshop 173

Katunguka-Rwakishaya
ration à faible teneur. Les animauxinfectés recevant la
ration à taux élevégagnaient dupoids au même rythme
que les sujetstémoins.Al'inverse, les sujets recevant la
rationàfaible tauxdeprotéine accusaientunimportant
retard de croissance par rapport auxtémoins. Les deux
groupes d'animaux infectés souffraient d'anémie au
même degré, mais la teneur élevée en protéine était
associéeàun rétablissementplus rapide. Enconclusion,
on peut dire que l'amélioration de l'alimentation des
animaux grâce à l'accroissement du taux de protéine
alimentairepermet de contrer les effets de la trypano
somiase etd'accélérer laguérisonparchimiothérapie.
174 SmallRuminantResearch NetworkWorkshop

SESSION 4
Feedingand Feedingsystems


The effect ofvariety and amount offered of
chopped sorghum stover on theperformance ofsheep
E.L.K. Osafo " E. Owen*AN. Said*M. Gill" and J. Sherington"
I. Department ofAnimalScience
University ofScience andTechnology
Kumasi, Ghana
2. Department ofAgriculture, University ofReading
EarleyGate, ReadingRG62AT UK
3. InternationalLivestock CentreforAfrica(ILCA)
P.O. Box5689,AddisAbaba, Ethiopia
4. Natural Resources Institute (NRI)
Chatham Maritime, Chatham, ME44TB, UK
Abstract
Forty-eightindividuallyfed Menz highland ramswere
used in a 2x2 factorial treatment design to measure
dry-matter (DM) intake and liveweight [mass, M]
change over42 days [d]; 16 ofthe ramswere used to
measure digestibility. Factors investigatedwereamount
ofstover offered (25 or 50gDM/kgMd)andvariety
(bird resistant [BR] or non-bird resistant [non-BR]) of
stover. Stoverwas offeredin choppedform.Ramswere
provided with water and mineral lick, but no other
supplement.Theleafandleaf-sheathcontentsofBRand
non-BR stovers were 566 and 477 g DM/kg DM,
respectively,althoughthe aimhadbeentohaveidentical
leafand sheath contents.The chemical composition of
the stoverswere similar.Stoverintake (gDM/kgMd)
was not affected by variety (P>0.05), but was
significantly (P<0001) improved by doubling the
amount offered (BR25: 239; BR50: 31.6; non-BR25:
23.7; non-BR50: 31.6; s.e.d. 095). Increasing the
amount of stover offeredincreasedthe amount refused
(25offer rate:66gDMrefused/kgDMoffered;50offer
rate: 385 g DM refused/kg DM offered). For both
varieties, theincreaseinintake on doublingtheofferrate
was largelyexplainedby agreaterintake ofleafandleaf
sheath. Rams offered stover at 50 g DM/kg M.d
maintained live weight, those offered stover at 25 g
DM/kgMd lost weight (BR: 16.1 g/d; non-BR253
g/d). TherewasatrendfordigestibilitiesofDM,organic
matter(OM) and NDFtobe lowerfor BR stover (OM
digestibility g/kg: BR25:532; BR50: 544; non-BR25:
581; non-BR50: 559; s.e.d.: 23.6). It is concluded that
chopped sorghum stover offered generously at 50g
DM/kgM.d,with minerals but no other supplement, is
a sustainablefeedingstrategyfor maintainingweightin
near-adultrams.
Introduction
Increasingthe amount ofcrop residue offeredtosheep
to allowthe animals to refuse upto 500g/kg offered
instead ofthe conventional 100to200g/kgoffered has
beenshowntoincreaseintake andgrowth rateinstudies
with barley straw in the UK(Wahed et al 1990) and
sorghum stover in Ethiopia (Aboud et al 1990).The
improvements in intake andgrowthwere consideredto
be due to animals consuming a greater amount ofthe
more digestible leafandsheath componentsbecause of
beinggiven the opportunitytoselect.
Stover from bird resistant [BR] sorghum was
shown to be less digestible than that from non-bird
resistant [non-BR] sorghum due to the presence of
anti-nutritive phenolics in BR sorghum (Reed et al
1987). However, recent results at ILCA (Aboud et al
1990)indicatethatthe highphenolics instoverfromBR
sorghum may not be a problem provided animals are
given the opportunityto select against the pigmented,
high-phenolicfractions. Furthermore,studiesbyOsafo
(1993) showed large differences between stover
varieties in their content of leaf and sheath; nutritive
value comparisons ofsorghum stovervarieties needto
recognise this. The present experiment aimed to
comparethe intake and digestibility ofBRand non-BR
sorghum stovers ofcomparable leafandsheath contents
when offered attwo contrasting rates. Itwaspostulated
that intake and digestibilitywouldbe lowerforBRthan
fornon-BRstoverparticularlywhenofferedatthe lower
rate.
Materials and methods
Experimentaldesign
Forty-eight growing, individually-fed, Menz highland
rams(aged 15-20months),wereusedin a2x2factorial
designwith 12replicatesperblockover42days.Factors
were amount ofstover offered (25 or50g dry matter
[DM] ofstoverperkg live weight [massM] daily[d])
and variety of sorghum stover (BR; non-BR). Rams
wereblockedforM. Fromday35to42, ramsin blocks
Small RuminantResearchNetworkWorkshop 177

Osafo et al
1,4,8 and 12were placed in metabolism crates for
measuringdigestibility.
Thefourtreatmentswere BR stover offered at25
gDM/kgMd [BR25] or50gDM/kgMd[BR50] and
non-BRstoveroffered at25gDM/kgMd[Non-BR25]
or50gDM/kgMd[Non-BR50].
Feedpreparation,feedingandweighing
In light ofotherstudies(Osafo1993), itwasplannedto
use BR stover variety Seredo and a non-BR stover
variety Dinkamash, both grown at one site. However,
hailstorms causeda dramaticdropinstoveryieldswhich
necessitated using a mixture of stovers from Seredo
grown attwo sites (Debre Ziet and Melkassa) and a
mixture ofstoversfrom Dinkamash (grown atthetwo
sites) and a non-BRvariety,76T123,grown at Debre
Zeit.Stovers from eachvariety and site were chopped
separatelyusingatractormountedAlvanBlanch"Maxi"
Chaffcutter(PTOrotatingat2000rpm)andlaterbulked
atfeeding.
Rams were individually fed in pens with slatted
floors. Halfthe stover was offered at 0800 h and the
otherhalfat 1400h.Noprotein supplementwasgiven.
Water and mineral lick were offered ad libitum.
Non-fasted live weights oframswere recordedweekly.
Dailysamples ofrefusedstover,per animal,were
bulkedweeklyresultinginsixsamples ofrefused stover
peranimal.Dailysamples ofoffered stoverwerebulked
weekly.
Digestibility trial
Total faeces ofthe 16 rams in blocks 1,4, 8 and 12,
housed in metabolism crates at day35,were collected
over a 7-day period to measure digestibility. Faecal
samplesfor each ram,bulked over7days,were stored
at-4'Cforsubsequent analysis.
Chemicalanalyses and botanical
composition
Faeces and stover were analysed for DM, ash and
nitrogen usingprocedures describedbyAOAC(1984).
Neutral-detergentfibre (NDF)wasdeterminedusingthe
methodofGoeringandVanSoest(1970).Thebotanical
composition of the BR and non-BR stovers was
determinedby handseparation intothe leafand sheath
[*leaf"] andstem fractions.
Statistical analysis
Theresults ofboththefeedingandthedigestibilitytrials
were analysed as a2x2factorialdesign usingSAS.
Results
Chemicaland botanicalcomposition of
stover offered
The chemicalcompositions ofBRandnon-BRstovers
offered were similar (Table 1). Despite aiming for
identical contents, *leaf" content of BR stover was
somewhat higher (P<00140) than that of non-BR
StOVer.
Liveweight change
Liveweight change was not affected by stover variety
(Table 2). Rams offered 50 g DM stover/kg M.d
maintained their weight whereas those offered 25g
DM/kgM.d lostweight;theweight-change differences
were highlysignificant.
Table 1. Chemical and botanical composition ofstovers offered to and refused by rams.
Feed offered Feed refused(g/DM/kgM.d)
Non- Non
Variables BR tS.e. NBR + s.e. BR25 BR50 BR25 BR50 s.e.d. V A VxA
Chemical
Dry matter(g/kg) 913 5 3 907 14.5 914 911 915 906 1.26 »k
Ash(g/kgDM) 128 0.3 138 119 108 136 110 826 ns I1S
Crudeprotein 49 8.8 53 7 5 29 31 54 51 378 *** InS I1S
(g/kgDM)
Neutral-detergent 679 8.8 670 4.2 754 736 727 721 13.38 InS I1S
fibre (g/kgDM)
Botanical
Leaf+sheath 566 147 477 262 146 257 112 182 30,4 I1S
(gDM/kgDM)
Stem 434 14.7 523 26.2 854 743 888 818 30,4 I1S I1S
(gDM/kgDM)
ns=non-significant;*=significant(P<005);**=significant(P<001);***= significant(P<0001).
BR=bird resistant;NBR=non-bird resistant;V=variety;A=amount.
178 SmallRuminantResearch NetworkWorkshop

Effect ofsorghumstover on sheepperformance
Table2. Treatment effects on intake, selection and liveweight change.
Variables BR25 BR50 Non-BR25 Non-BR50 s.e.d. V A VxA
No. oframs 12 12 12 12
Initialweight[M](kg) 20.1 19 9 200 20.1 0.14 I1S IlS I1S
Growth rate(g/d) -16.1 -40 -25.3 35 6.2 I1S I1S
Stover offered(gDM/d) 537 1011 548 1019
Stover offered 22.4 48.1 25.3 49 7
(gDM/kgMd)
Stover refused (gDM/d) 59 383 74 386 15.6 I1S
Stover intake (gDM/d) 478 628 474 633 16.0 I1S I1S
Stoverintake 23 9 31.6 237 31.6 0948 k k I1S
(gDM/kgMd)
Fractions
Leaf" offered(gDM/d) 298 561 250 465
Stem offered (gDM/d) 239 450 298 555
"Leaf intake (gDM/d) 289 464 242 394 10.5 kk I1S
Stemintake (gDM/d) 188 165 233 239 12.7 k k k I1S I1S
ns=non-significant; *=significant at(P<005);**=significant (P<001); ***= significant (P<0001).
BR=bird resistant;NBR= non-bird resistant;V=variety;A=amount.
Table3. Effects ofvariety ofstover and amount offered on intake and digestibility.
Non- Non
Variables BR25 BR50 BR25 BR50 s.e.d V A FxA
Liveweight[M](kg) 17.8 170 17.8 18.2 0.43 I1S I1S I1S
Stover offered(gDM/d) 619 1067 622 1093
Stover offered(gDM/kgM.d) 32.1 553 33 7 54.5
Stover intake (gDM/d) 5580 676.4 5437 669.8 327 I1S I1S
Stover intake (gDM/kgMd) 28.9 350 29.3 33.5 091 I1S I1S
DMdigestibility(g/kg) 495.5 511.6 549.1 532.6 23.3 I1S I1S I1S
OM digestibility(g/kg) 531.6 543.8 581.4 5590 23.6 I1S I1S I1S
NDFdigestibility(g/kg) 553.1 551.2 606.2 574.1 29 2 I1S IlS I1S
ns=non-significant;*=significant (P<005);**=significant(P<001);***=significant(P<0001).
BR=bird resistant;NBR=non-bird resistant;V=variety;A=amount.
Stoverintake
There was no difference in stover intake due to stover
variety,but there was a large increase in intake due to
doubling the amount of stover offered (Table 2).
Doublingthe amountofstover offered increasedintake
of "leaf". Stem intakes were generally the inverse of
*leaf" intakes, but only variety differences were
significant.
Fractions offeredandconsumed
Intake of*leaf"was affectedbybothvarietyandamount
of stover offered (Table 2). Doubling the amount of
stover offeredincreased intake of *leaf".Stem intakes
were generally the inverse of "leaf intakes, but only
variety differenceswere significant.
Digestibility.Table3showsthe effects oftreatments on
digestibility;intakes duringthefaecal collectionperiod
are also shown. There were no significant treatment
effects onthe digestibility ofDM,organic matter [OM]
or NDF although there was a tendency (e.g. NDF
=00991)for digestibilities to be lower for BRthan
non-BRstover.
Discussion
Forthe levels ofstoverofferedthe results did nottotally
confirmthe hypothesis,as therewas noeffect ofstover
variety onintake, growth or digestibility, andtherewas
no interaction between variety and amount of stover
offered. The failure to demonstrate the hypothesised
lowerintake anddigestibility ofBRstovercomparedto
non-BRstover,waspossibly contributed tobythe fact
that the BR stover contained more *leaf" than non-BR
stover.The non-significanttendencyfor digestibilityto
be lowerinBRcomparedtonon-BRstoversuggeststhat
though BR stover may have been of lower nutritive
value, the effect was possibly masked by the higher
content of*leaf" in BRstover.There is needfor further
comparisons ofBRand non-BRstovers ofcomparable
*leaf" content and at a lower level ofoffer.
Small RuminantResearch NetworkWorkshop 179
Osafo et al
However,the results showedaclearimprovement
in intake and liveweight change when the amount of
stover offeredwasdoubled, confirmingthe earlierwork
ofAboud et al (1990) and Wahed et al (1990). The
present results also demonstrate that the increase in
intake on doubling the amount of stover offered was
largely due toagreaterintake of*leaf". It is notable that
this was achieved with the stover offered in chopped
form.
Offeringstoverat50gDM/kgMdwasassociated
with stover refusal rates of nearly400g/kg ofstover
offered.Such large quantities of refused stover do not
present disposalproblems in countriessuch as Ethiopia
as the refusals are readily used as fuel for domestic
cookingandfor otherpurposes(Osafo etal 1991).
Aninformalsurveyoffarmerpracticesin Ethiopia
(Osafo et al 1991)indicated that farmers fed sorghum
stover to sheep as a sole feed, i.e. without protein
supplement. Therefore,in the present experiment, no
supplementwas offered apart from mineral lick.The
results demonstrate an important practical feeding
strategy, namelythat choppedsorghum stover, offered
at a high rate (50gDM/kgMd),with mineral lick is
sufficient to maintain weight of rams aged 15 to 20
months. It is concluded that chopped sorghum stover
offered generously, with minerals but no other
supplement, is a sustainable feeding strategy for
maintainingweightin near-adultsheep.
Acknowledgement
The authorswishto expresstheirappreciation to ILCA
and NRI for financial support and the Institute of
Agricultural Research, Melkassa, Ethiopia, for
providingthesorghumstover.
References
AOAC(Association ofOfficial AnalyticalChemists). 1984
Official Methods ofAnalysis. 14th edition. AOAC,
Washington,DC,USA. 1141pp.
AboudA.AO.,ReedJ.D.,OwenE. andMcAllanA.B. 1990
Feeding sorghum stover ofEthiopian sheep: Effect of
stover varietyandamountoffered ongrowth,intakeand
selection. Summary. British Society ofAnimal
Production 50:592.
GoeringH.K.andVanSoestP.J. 1970 ForageFibreAnalysis.
Agriculture Handbook 379. Agriculture Research
Service, United States Department of Agriculture,
Washington,DC,USA
Osafo E.L.K. 1993. Sorghum Stover as a Forage: Cultivar
Effects on Yield and Effects of Chopping, Amount
Offered, Supplementation and Variety on Intake,
Selection andLive-weightgain in Ethiopian Sheep and
Cattle. PhD thesis,University ofReading,UK.
OsafoELK., NegatuW., DemekeM., KekenA., Kefyalew
A. and Senait R. 1991. Informal Survey on Sorghum
Stover Utilization in three Locations ofEthiopia. Draft
report of workshop held in ILCA, Addis Ababa,
Ethiopia,19December 1991.
ReedJ.D.,TedlaA.and KebedeY. 1987. Phenolics,fibre and
fibre digestibilityin the crop residue from bird resistant
and non-bird resistant sorghum varieties.Journal ofthe
Science ofFoodandAgriculture 39:113-121.
Wahed R.A.,Owen E., Naate M. and Hosking B.J. 1990
Feeding straw to small ruminants: effect of amount
offeredonintake andselection ofbarley strawbygoats
andsheep.AnimalProduction 51:208-289.
Effet de la variété et de la quantitédepaille desorgho offerte sur
les performances des ovins
Résumé
Quarante-huit béliers Menz des hauts plateaux
alimentés individuellement ont été utilisés dans une
expérience factorielle2x2destinéeàévaluer l'ingestion
de matière sèche (MS)et les variationsdu poidsvifsur
unepériodede42jours; 16d'entre eux onten outreservi
à des mesures de digestibilité. Les paramètres étudiés
étaient la quantité de paille offerte (25 ou 50gde MS
par kg de poids/jour) et la variété de la paille selon
qu'elle provient de sorgho résistant (BR) ou non
(non-BR)aux oiseauxgranivores. Lapaille étaitservie
sousformehachée. Lesbéliersne recevaientenplusque
de l'eau et de la pierre à lécher. Les variétés BR et
non-BRcontenaient repectivement566et477gdeMS
defeuilles et degainesparkgdeMS de paille bien que
l'objectif initial fût d'avoir des teneurs identiques des
deux variétés. Leur composition chimique était
analogue. L'ingestion (en g de MS/kg de poids/jour)
était indépendante de la variété(P>005) de la paille,
mais augmentait significativement(P<0,001)lorsqu'on
doublait les quantités offertes (BR25:239;BR50:31,6;
non-BR25: 237; non-BR50: 31,6; écart-type: 095).
L'accroissement de ces quantités entraînait une
augmentation desrefus(tauxde refus:25:66gdeMS/kg
de MS offert; 50: 385 g de MS/kg de MS offert).
L'augmentation de la quantité ingérée lorsqu'on
doublait les quantités offertes s'expliquait essentiel
lementparune consommation accrue de feuilles et de
180 SmallRuminantResearchNetworkWorkshop

Effect ofsorghumstover onsheepperformance
gaines. La paille à 50 g de MS/kg de poids/jour
permettait le maintien dupoidstandis que celleà25g
deMS entraînait despertes depoids(BR: 16,1 g/jour;
non-BR:25,3g/jour). Lestauxde digestibilitéde laMS,
de la matière organique (MO) et des parois cellulaires
étaientgénéralementplusfaiblespourlapaille BR(taux
de digestibilité de la MO en g/kg: BR25: 532;
BR50544;non-BR25:581; non-BR50:559;écarttype:
23,6).On peut conclure que l'offre de paille de sorgho
hachéeà hauteur de50gdeMS/kgdepoids/jour avec
de la pierre à lécher sans autre complément est une
stratégieviable d'alimentationpermettant de maintenir
lepoids de bélierspresque adultes.
Small RuminantResearch NetworkWorkshop 181


Effect offeedsupplements onweightgain and carcass
characteristics ofintact maleMubendegoatsfed elephant
grass(Pennisetumpurpureum) ad libitum in Uganda
KL Okello " C. Ebong* and J. Opuda-Asibo"
1.Department ofVeterinary PhysiologicalSciences, Makerere University
P.O.Box7062, Kampala, Uganda
2. NationalAgriculturalResearch Organisation, Namulonge
3. Department ofVeterinaryPublic Health andPreventive Medicine
Makerere University,PO.Box7062, Kampala, Uganda
Abstract
Twenty intact male Mubende goats were randomly
dividedintofivegroups offourgoats each. Eachgroup
was randomly assigned one ofthe treatments resulting
intoacompleterandomiseddesign. Alltheanimalswere
individually fed elephantgrass (E),used as basal diet,
ad libitum.Treatmentswereisonitrogenousamount(10
g N/d) of banana peels (BP), maize bran (MB),
cottonseed cake (CSC)andfresh Leucaena leaves(LL)
offered assupplements.Waterandmineralblockswere
offered adlibitum.Atthe end ofthe feeding trials (186
days), thegoatswere sacrificedforcarcass analysis and
thevariousbodyparts and organswere measured. Final
live weights did not differ significantly between
treatmentgroups (P>005) although goatsfed onCSC
were heavier than the rest. Empty body and dressed
carcassweights differedsignificantly(P<005)ingoats
fed on different diets. Dressingpercentage ingoats fed
LL,MB,andCSCwere similar andsignificantlyhigher
(P<001)than ingoatsfed on BPandEalone.ThepH
ofthecarcasswas similar across alltreatments.Weights
ofthe head, full gut, empty gut, blood, kidney, and
omentum fats did not differ significantly (P>001);
however, weights of skin, pluck and feet differed
significantly (P<001). Various carcass components
were highly correlatedwith liveweight across all diets
suggestingthat all the diets did not severely alter the
allometry ofgrowth.
Introduction
The economicimportance ofgoats in the provision of
animal proteins in developing countries has been
extensivelyreviewedelsewhere(Devendra1981).Meat
from small ruminants accounts for almost30% ofthe
meatconsumedinAfrica(Reed et al 1988). InUganda,
goatsprovide about23% ofthe totalredmeatproduced
and goat meat ranks second only to beef in sales.
However, in terms of palatability and delicacy, it is
preferred to beef. It is possible thatgoats could play a
leading role in the provision of animal proteins to
supplement other sources such as from beef, chicken,
porkandfish.
Goats are produced in Uganda using traditional
practiceswheregoats are eithertethered or lefttoroam,
browsingandgrazingonwhatevertheycanfind(Okello
andObwolo 1984).The mainfeed resourcesforgoats
are naturalpastures consisting oflegumes and browse
tree species. During the dry season, grazing land is
scarce andpastures aredeficientin energy, proteins and
minerals.This is aggravatedby lack ofalternativefeed
duringthis criticalperiod(OkelloandObwolo 1984).
In Uganda banana peels (BP), crop residues,
cottonseed cake (CSC) and maize bran (MB)
(agro-industrial by-products) can supply readily
fermentable carbohydrate and energy needed for
increasinggrowth rate in goats. Due totheir lowfibre
contentsthey canbeconsumedinadequate quantitiesto
also meetthe nitrogen requirementforthegrowinggoat
without needforadditionalsupplementation.
AstudywasinitiatedtoevaluateBP,MB,CSCand
Leucaena(LL) as supplementsto elephantgrass(E)in
goat production. The evaluation included chemical
analysis offeeds andcarcass study.
Materials and methods
Twentyyoungintact maleMubendegoats(4-6 months
ofage)purchasedfromamarketin Kampalawereused.
Eachgoatwas identified with a numbered eartag and
individually confinedina metabolic cagewith a slatted
floor. All animals were given prophylactic treatments
forendo-andectoparasites.Theyweregiven 14daysfor
adaptation to respective diets before the beginning of
data collection.Thegoats were randomly divided into
fivegroupsoffourgoatseach.Eachgroupwasrandomly
assignedone ofthefive dietarytreatments resultinginto
a complete randomised design. Treatments were
isonitrogenous amount(10gN/d)ofBP,MB,CSCand
LLoffered as supplementstoEwhichwasthe basal diet
fed ad libitum to allanimals.The controlgrouphad no
supplement.Water was available ad libitum and each
animalhad accessto a mineralblock.
Small RuminantResearch NetworkWorkshop 183

Okello et al
Proximate analysis
Samples offeedswere dried at60'Cfor48hours in an
oven.The dry samplesweregroundtopassthrough a2
mmscreen.A05gportion ofeach samplein duplicate
was analysed according to AOAC (1980).
Neutral-detergent fibre(NDF)andashwere determined
accordingtoGoeringandVanSoest(1970).
Intakeandgrowth
Feeding commenced at0800h and collection offeed
refusalswas done24h later. Feed offered and refusals
from each animalwereweighed.Samples ofeach diet
were takenforsubsequentdry matter determination and
chemical analysis. Intake was calculated as the
difference between feed offered and refused corrected
fordry-matter content.
Each goat was weighed at the beginning ofthe
experimentandeverysuccessive seven days thereafter.
Average dailygains(g/d)were calculatedas differences
between final and initial body weights divided by
number ofdays offeeding.
Carcass analysis
Attheendofthefeedingtrials(186days),thegoatswere
sacrificed. Before slaughter, live weight and skin
thickness were measured; body condition score was
assessed according to Pettit et al (1988).The animals
were decapitated and blood was drained into a bucket
andtheweightofbloodwasmeasured.
The decapitated animals were flayed by gentle
tearing ofskin from the carcass to ensure thatfat and
muscle tissues did not adhere on to the skin.The legs
were cut at thefetlockjoints.Weights ofskin,head and
legswere measuredand carcassvaluewas assessed on
the scale0-3asfollows:0=emaciatedcarcass, l=lean
carcass, 2= moderate fatty carcass and 3= full fatty
carcass.The carcasseswere evisceratedandthegut and
pluck were removed and weighed. Omentum was
carefully removed andweighed.Thegut contentwas
removed by flushing the gutwith running water.The
emptygutanddressedcarcasswereweighedseparately.
Kidney fat with capsule was removed and weighed.
Thickness ofbrisket fat and longismusdorsi muscleand
pH ofthe carcasswere measured.
Statisticalanalysis
The difference in feed intake, average daily gain and
carcass components were examined by analysis of
variance for a complete randomised design using the
STATGRAPHICS statistical package. Differences
between meanswerecomparedusingDuncan'smultiple
range test. Body and carcass cutting relationship with
liveweightwere examinedbysimple linear regression
analysis ofvariance.
Resultsand discussion
The chemical composition of the feeds in Table 1
indicatethathighmoisture andlowproteincontentsrank
bananapeels asthe leastfavourable dietfor ruminants.
Low dietaryprotein content inhibits rumen microbial
activity with resultant low intake of roughage and
sub-optimal supply ofprotein to the animal. In this
respect elephant grass and maize bran are marginally
below the critical level (1.6gN/100g) of dry feed
nitrogen requiredforproperrumen function (Elliot and
Topps 1963).
Intake
Table 2 summarises the voluntary feed intakes of
animals in the different treatment groups. Dry-matter
intake is an important factor in the utilisation of
roughage by ruminant livestock and is a critical
determinant ofenergyintake andperformancein small
ruminants(Devendra andBurns 1983). Further more it
isimportantthatfeedsupplementsshould not adversely
affect intake of basal roughage diet. Goats fed the
control diet consumedthe highest amounts ofthe basal
diet. The lack of significant differences in total
dry-matter intake indicates strong substitution ofthe
basal dietbythesupplements.
Growth
Low growth rate is acknowledged to be the major
limiting factor in goat production and the plane of
nutrition can markedlyimproveweightgain;the degree
of response varies with breed or type (Devendra and
Burns 1983). In this experimentgoats fed on leucaena
leaves supplementandelephantgrass alone lostweight
Table 1. Chemical composition offeed ingredients offeredtointactmale Mubendegoatsfed elephantgrassadlibitum as basal diet.
Dry matter(g/kg)
Drymatter Ether
Feed (g/kg) Nitrogen NDF* eXtraCt Ash
Elephantgrass(E) 2880 15 6 551.1 350 90
Banana/peels (BP) 133.2 11 0 449.1 42.5 69
Maize bran(MB) 8567 15.6 3930 450 44
Cottonseed cake(CSC) 885.5 34.4 462.1 78.0 140
Leucaena leaves (LL) 3140 30.4 479.3 290 76
* NDF=neutral-detergent fibre.
184 Small RuminantResearch NetworkWorkshop

Effect offeedsupplements onMubendegoats in Uganda
Table 2. Intake (g/d) in male intact Mubende goats fed on ad libitum elephant grass (Pennisetum purpureum) with or without
supplements ofLeucaenaluecocephala leaves, maize bran, bananapeels and cottonseed cake.
Die t s
Leucaena Cottonseed Elephant
Parameters leaves Maize bran Bananapeels cake graSS SEM Significance
Elephant grass 335210* 311E175c 356E110° 336E125* 404E160" 7.1 »k »k
Supplementintake(DM) 119E145° 222449a 127418° 175259* 13.6
Total dry-matter intake 454 -33.8 533-577 483-500 511+270 404 -160 17.6 I1S
Total organic-matterintake 353t31.4 439 -44.6 445-46.5 470-250 370-14.8 15.3 I1S
ns=P>005;*=P<005;**=P<001;***=P<0001.
Valueswiththe same superscriptin a row do notdiffer significantly.
with negative growth rates of-3.8g/d and-32g/d,
respectively(Table4). Digestible organic matterintake
indicates thatenergywas limitingonthegrowthofthese
animals (Table 2).The negative growth rates recorded
bygoats fed on elephantgrass alone was attributed to
the insufficient amount of energy and protein in the
grass. Meanwhilegoats fed on maizebran supplement
virtually maintained weight indicating that they
received only adequate nutrient for maintenance.The
bestgrowth rate of30.1 g/dwas recorded ingoats fed
the cottonseed cake supplement.Thisfeed supplement
provided energy andprotein which are critical forthe
growthofgoats.Thegrowthrate,however, is lowerthan
values obtained(91g/day)inUgandabyWilson(1958)
butitis similartovaluesobtainedinWestAfricanDwarf
goats (Zemmelink et al 1985; Reynolds 1989).
Ademosun et al(1985) also recordedgrowth rates that
were higherthan values obtainedin this experiment.
Carcass characteristics
Body condition score andcarcassvaluewere subjective
assessment. Condition score reflects subcutaneous fat
deposits which is lower in goats than in sheep(Naude
and Hofmeyr 1981). It also reflects muscular
developmentandcoverage ofthe ribs.Similarlycarcass
valuewasassessedaccordingtovisible subcutaneousfat
coverage andleannessofthe meat.Bodyconditionscore
andcarcassvaluewerebetteringoatsfedon maizebran
and cotton seed cake.These findings were reflected in
the objective measurements of fat deposits in the
omentum, kidneyandbrisket aswell as inthe thickness
ofthe longismus dorsi muscle.
Emptybodyweightanddressedcarcassweight are
functions ofliveweight(Fehretal 1976).Table3shows
that various carcasscomponentsandbodyparts(except
skin thickness)were highly correlatedwith live weight
across all diets, suggesting that all the diets did not
severely alter the allometry ofgrowth. Goats fed on
cottonseed cake and maize bran produced dressed
carcasses which were significantly heavier (P<001)
than carcasses from goats fed on the other three diets
(Table 4). These differences were associated with
differencesin fat depositsin the omentum, kidney and
brisket.
Table 5 shows thatgut contents in goats fed on
elephantgrass with Leucaena leaves were higher than
those ofgoatsfedthe otherdiets.The least gut contents
werethose ofgoatsfed maizebran.
Goats fed maize bran and cottonseed cake were
heavierthan the rest and they alsohadthe heaviest legs
and skin, suggesting that the two components were
functions of final body weight. It was observed that
goatsfed on cottonseed cake and maizebran had more
omentum andkidneyfats.
Table3. Regression coefficients (y= a+bx) ofbody part and carcass components in intact male Mubende goats.
Regressioncoefficients
Bodypart d b p Significance level
Emptybodyweight -2.02 0.86 0 905
Headweight 0.4 0.04 0.586
Skin thickness 0.2 000125 0.066 I1S
Feetweight 0.2 002 0.638
Pluckweight -9.5 0,04 0716 k k k
Dressed carcass 2.2 0.55 0.891
Fullgut weight 2.0 0.18 0283
Emptygutweight -0.02 0.18 0.282
Longismus dorsi (07 0.04 0209 2k
thickness
Testicular circumference 12.25 0,05 0475 »k k
Gutcontent 203 () 17 0,283
ns=P>005; *=P<005; **P<001:*** P<0001.
Small Ruminant ResearchNetworkWorkshop 185

Okello et al
Table 4. Body weight, carcass characteristics and meat pH of intact male Mubende goats fed elephant grass with or without
supplements.
Diets
Significance
Parameters E LL + E MB + E B? + E CSC + E SEM level
Body-weight gain (kg) -O.610.9b' -07107" 1.2117" 2.2118" 5.62115" 0.6 *
Body condition score 1.3103" 1.0100" 1.5103" 1.3107" 2.5103" 0.14 *
Carcass value 1.0100" 1.0100" 1.5103" 1.3107" 2.5103" 0.13 *
Empty body weight (kg) 10.4107" 11.6104" 14311.3" 11.5109b 16.8119" 0.53 *
Dressed carcass weight (kg) 5.6104" 6.6103" 8.4109" 6.1106" 9.511 . 1" 0.33 **
Dressing percentage 53511.2" 56.7106a 58511.4" 53.0102" 57.0107" 053 **
Carcass pH 6.0102 6.6102 6.0104 6.4101 5.9103 0.1 1 ns
ns = P>0.05; * = P<0.05; ** = P<0.01.
Values with the same superscript in a row are not significantly different (P>0.05).
E = elephant grass; LL = Leucaena leaves; MB : maize bran; BP = banana peels; CSE = cottonseed cake; SEM = standard error of means.
Table 5. Weights oforgans, body parts, omentum and kidneyfat, gut content and blood ofintact male Mubende goatsfed on elephant
grass with or without supplements.
Diets
Parameters E LL + E MB + E BP + E CSC + E SEM Significance
Head weight (kg) 1.011004 1.201004 1.241 0.09 1.010.05 1.331015 0.04 ns
Skin weight (kg) 0.941007c 0.931003" 1.251012" 0.921009" 1.511013" 0.04 **
Feet weight (kg) 0481003"° 0.531003" 0.631001" 0.451003c 0.601005a 0.01 **
Pluck weight (kg) 0.5510.06° 0.5810.03° 07410.06" 06010.036 0.8810.08a 0.03 **
Full gut weight (kg) 5.011024 6.041046 4.331055 5.051010 4.841091 0.25 ns
Empty gut weight (kg) 1.241011 1.231004 1.541015 1.581012 1.791027 0.07 ns
Gut content weight (kg) 3.781200" 4.811043" 2.791042C 3.471007"C 3.051066"c 0.19 *
Blood weight (kg) (kg) 06010.9 06410.02 07510.05 0.651003 0.861013 0.04 ns
Kidney fat weight (g) 21.4178 23.8175 16751444 90.31305 237.511233 28.3 ns
Omentum fat weight (g) 36.11172 37.0170 342811035 14631652 405011962 48.3 ns
ns = P>0.05; * = P<0.05; ** = P<0.0l.
Values with the same superscripts in a row do not differ significantly.
E = elephant grass; LL = Leucaena leaves; MB = maize bran; BP = banana peels; CSE = cottonseed cake; SEM = standard error of the means.
Table 6. Skin, brisketfat and longismus dorsi muscle thickness (cm) and testicular circumference (cm) ofintact male Mubende goats
fed on elephant grass with or without supplements.
Diets
Parameters E LL + E MB + E BP + E CSC + E SEM Significance
Skin 0.2210.01 0.2210.01 02310.01 02310.01 0.211001 0.00 ns
Brisket fat 0.711022bc 1.391029a 1.201010ab 1.641021a 0.661004c 0.10 *
Long. dorsi muscle 1.231016" l.4410.09"" 1.331018" 1.641004" 0.9910016 0.05 **
TesticularCircumference 19.25-10.75bc 20.501079b 19.6711 20"" 23.881043a 18.381038c 0.32 ***
ns = P>0.05; * = P<0.05; ** = P<0.0l; *** = P<0.001.
Values with the 'same superscripts in a row do not differ significantly.
E = elephant grass; LL = Leucaena leaves; MB = maize bran; BP = banana peels; CSE = cottonseed cake; SEM = stande error of means.
186 Small Ruminant Research Network Workshop

Effectoffeedsupplements onMubendegoats in Uganda
pH normallyindicates the keeping quality ofthe
meat. Lack ofsignificant differencesbetweentreatment
groupssuggeststhatkeepingqualitywasnotaffectedby
the differentfeeds.
Testicular circumferencewasbiggerin goats that
werefedon cottonseedcakeandmaizebran.Regression
analyses of measurements of body parts on the live
weight were highly correlated, suggesting that the
apparent dietary effect ontesticular circumferencewas
associatedwithdifferencein liveweightofthegoatsfed
onthe different diets.
Conclusion
The critical nutrients for enhancing growth of goats
seem tobesufficientamountsandthe right combination
of energy and protein. In this respect maize bran and
cottonseed cake seem tobe better feed supplementsin
providing these nutrients. These agro-industrial
by-products are abundant in Uganda andtheir use will
greatlyincrease meatproduction fromgoats.
References
Ademosun A.A., Bosman H.G. and Roessen P.L. 1985.
Nutritionalstudies withWestAfricanDwarfgoatsinthe
humidzone ofNigeria. In:WilsonR.T.andBourzatD.
(eds), Small Ruminants in African Agriculture.
ProceedingsofaConferenceheldatILCA,AddisAbaba,
Ethiopia, 30 September-4 October 1985. ILCA
(International Livestock Centre for Africa), Addis
Ababa, Ethiopia. pp.82-92
AOAC(Association ofOfficial Analytical Chemists). 1980
OfficialMethods ofAnalysis.AOAC,Washington, DC,
USA. 1018pp.
DevendraC. 1981.Meatproduction fromgoats in developing
countries. In:SmithA.J. andGunnR.G.(eds), Intensive
Animal Production in Developing Countries. BSAP
(British Society of Animal Production) Occasional
Publication4. BSAP, Edinburgh,UK.pp.395-406
DevendraC. and BurnsM. 1983. Feeding and nutrition. In:
Goat Production in the Tropics.CAB(Commonwealth
AgriculturalBureaux), FarnhamRoyal,Slough,UK.pp.
90-115.
Elliot K.C. and Topps J.H. 1963. Studies of protein
requirements of ruminants 2. Protein requirement for
maintenance of three breeds of cattle given diets
adequate in energy and lowin protein. British Journal
of Nutrition 17:539-556
FehrPM.,Sauvant D., Delage J., DumontB.L. and RoyG.
1976. Effect offeeding methodsandage at slaughter on
growth performances and carcass characteristics of
entire young male goats. Livestock Production Science
3:183-194.
GoeringH.K. andVanSoestP.J. 1970. Forage FibreAnalysis.
Agriculture Handbook, 379. Agricultural Research
Service, USDA (United States Department of
Agriculture), Washington,DC,USA.pp. 1-8
NaudeR.T. andHofmeyrH.S.1981.Meatproduction.In: Gall
C.(ed),GoatProduction.AcademicPress,London,UK.
pp.285-307
OkelloK.L. andObwoloM.J. 1984.Uganda: Review ofthe
potentialities ofgoatproduction.WorldAnimal Review
53:27-32
Pettit H., Honhold N. and Halliwell R.W. 1988. A condition
scoring scheme for small East African goats in
Zimbabwe. Small Ruminant Research Network
Newsletter 13:1-7. ILCA (International Livestock
CentreforAfrica),AddisAbaba, Ethiopia.
ReedJ., EbongC.,TannerJ.,GebruG. and Akale WorkN.
1988.The nutritive value anduse offeedsforfattening
smallruminantsin African highlands.Aperspective of
ILCA research. Small Ruminant Research Network
Newsletter 12:10-27. ILCA (International Livestock
Centrefor Africa),AddisAbaba, Ethiopia.
Reynolds L. 1989. Effects ofbrowse supplementation on the
productivity ofWestAfrican Dwarfgoats. In: Wilson
R.T. and Azeb Melaku (eds),African Small Ruminant
Research and Development. Proceedings of a
Conference held at Bamenda, Cameroon, 18-25
January 1989. ILCA(InternationalLivestockCentrefor
Africa),AddisAbaba, Ethiopia. pp.237-250
Wilson PN. 1958. The effect ofplane of nutrition on the
growthanddevelopmentoftheEastAfricandwarfgoats.
Part I.Effectofplane ofnutrition onthe liveweightgains
and external measurements of kids. Journal of
AgriculturalScience 50:198-210.
ZemmelinkG.,TolkampB.J. and MeindertsJ.H. 1985. Feed
intake andweight gain ofWestAfrican Dwarfgoats. In
SumbergJ.E. andCassaday K.(eds),Sheep and Goats
in HumidWest Africa.Proceedings ofthe Workshop on
SmallRuminant ProductionSystems in the HumidZone
ofWestAfrica, held in Ibadan, Nigeria,23-26January
1984. ILCA(InternationalLivestockCentreforAfrica),
AddisAbaba, Ethiopia. pp.29-33
Small RuminantResearch NetworkWorkshop 187

Okello et al
Effet de la complémentation sur legain depoids et
les caractéristiques de la carcasse chezdes boucs entiers
Mubende recevant de l'herbeà éléphant(Pennisetum purpureum)
ad libitum en Ouganda
Résumé
Vingt boucs entiers Mubende ont été divisés au
hasard en cinq groupes de quatre animaux chacun.
Chaquegroupea étésoumisdemanière aléatoireà l'un
des traitementsprévus dans le cadre d'unplan en blocs
aléatoires complets. Tous les animaux étaient
individuellement alimentés avec de l'herbe à éléphant
servie ad libitum. Les traitements consistaient en
l'apport d'un complémentprotéique fournissant 10g
d'azote parjour sousforme de pelures de bananes, de
son de maïs, de tourteau de coton ou de feuilles vertes
deLeucaena.L'eau et lapierreà lécher étaient offertes
adlibitum.Alafinde l'essaid'alimentation(186jours),
lesanimauxavaientétéabattus,leurs carcasses étudiées
et diversesparties du corps et divers organespesés. Les
poids vifs finals n'étaient pas significativement
différents entre les groupes de traitement (P>005)
même si les animaux alimentés avec du tourteau de
cotonpesaientplusque les autres.Enrevanche, lespoids
vides et les poids des carcasses parées étaient
significativement différents(P<005) entre lesgroupes.
Lesrendementsà l'abattage desanimauxalimentés avec
desfeuilles de Leucaena, duson de maïs etdutourteau
de coton étaient similaires mais significativement
supérieurs (P<001) à ceux des sujets recevant des
pelures debanane ouuniquementde l'herbeàéléphant.
LepHde lacarcasse étaitindépendantdutraitement.Les
poidsde la tête, desboyauxpleins ouvides,dusang,des
reins et de lagraisse de l'épiploon étaient peu différents
(P>001)alors queceuxde lapeau,de lafressure et des
pattes étaient significativement différents (P<001).
Toutes rations confondues, il existait une forte
correlation entre les poids de diverses parties de la
carcasse et lespoidsvifs,ce quisignifiequeces régimes
n'avaient pas beaucoup altéré l'allométrie de la
croissance de cesanimaux.
188 Small RuminantResearch NetworkWorkshop

Performances des agneauxMossi en alimentation extensive,
semi-intensive etintensive
A.J. Nianogo" S. Nassa",L. Soma ,HO Sanon* etV Bougouma
Institutd'études et de recherches agricoles
1 Départementde zootechnie etde biologie animale,INERA/Kamboinsé
BP.7192,Ouagadougou(Burkina Faso)
2 Départementdezootechnie etde biologie animale,INERA/Dori
B.P.7192,Ouagadougou(Burkina Faso)
3 Départementélevage,UniversitédeOuagadougou
BP.7021,Ouagadougou(Burkina Faso)
Résumé
Deux essais d'alimentation ont été conduits pour
évaluer lesperformances d'ovins mâles entiers de race
Mossi. Pour le 1er essai,24 agneaux ont été répartis au
hasard en4 lots desix animaux. Letraitementdes lots l
et3correspondà lapâture libre avecberger(PL), celui
des lots2 et4à la pâture au piquet(PP); les lots 1 et2
n'ontpas reçu de complémentation tandisque les lots 3
et4 ont reçu 25% de leurs besoins totaux en matière
sèche (sousforme d'un concentré constituéde 50% de
sondeblé etde50% de tourteau de coton). La durée du
suivi pondéral des animaux a été de 70jours. Pour le
2ème essai, 40 agneaux maintenus en stabulation
permanente ont été répartis en un lottémoin de quatre
sujets et trois lots de douze animaux recevant une
complémentationàniveauénergétiqueélevé(E),moyen
(M)oufaible (F) correspondant respectivementà0,8;
0,6 et 04UF/kg de MS. L'évolution pondérale des
animaux a été suivie pendant 12 semaines et des
abattages ontété réaliséstous les30jourspour évaluer
le rendement en carcasse. Dans le 1er essai, la pâture
librese révèle supérieureà lapâtureaupiquet (GMQde
5302gcontre27,28g)tandis que l'effet de la complé
mentationse traduitdans les deuxtypes de conduitepar
une amélioration du gain moyen quotidien (GMQ) de
685%.Lameilleure performance aétéobservée dans le
lot3(pâture libre aveccomplémentation).Dans le2ème
essai, les lots E, M et F ont enregistré des GMQ
respectivement de 79,58;3554 et875g;la différence
entre les lots E et F est statistiquement significative
(P<0,05). Les abattages ont montré que le lot E
présentait des rendements en carcasses supérieurs et
une incrustation de gras de toilette d'autant meilleure
qu'ils sont abattus plus tard. Dans cette étude, les
performances du mouton Mossiont été modestes, quel
que soit le système d'alimentation. On observe par
ailleurs que le système de conduite et la teneur en
énergie de la ration ont une influence marquée sur la
croissance des agneaux.
Introduction
Durant la saison pluvieuse, les petits ruminants
appartenant à des agriculteurs-éleveurs sont souvent
attachés par des cordesà despiquets ou des buissons,
surdesairesnon cultivées;dansd'autrescas,ilspâturent
librement, sous la garde d'enfants. D'autre part, la
complémentationestpeufréquente ensaisonpluvieuse,
la valeur fourragère des graminées naturelles étant
considérée comme bonne à cette période. Cependant,
certainséleveursentretiennent desbéliers enstabulation
permanente avec une alimentation intensive, en
préparationdela fêtede laTabaski.Quelquesétudesont
étéconduites auBurkinaFasoafin d'évaluerl'impactde
certains facteurs alimentaires sur les performances de
croissance des ovins (Dumas et Raymond, 1974;
Bourzatet al.,1983;Nianogo,1992).L'étudeprésentée
iciapourobjectifd'évaluerles paramètressuivantschez
les ovins de race Mossi.
l'influence de la complémentation et de l'entra
vement sur la croissance en cours de la saison
pluvieuse;
• l'effet des niveaux énergétiques croissants sur la
consommationvolontaire,lavitesse de croissance
et les rendements des carcasses et
l'effet de la durée de la conduite intensive sur les
rendements des carcasses et l'état d'engrais
Sement.
Matériels et méthodes
Deux essais ontété conduits sur des ovins de race
MossiàGampéla,station expérimentale de l'Université
de Ouagadougou située en zone nord soudanienne,
région caractérisée par une pluviométrie annuelle de
677mm (Soma, 1992). La végétation est une savane
claire arbustive etarborée.Sur la station, laphytomasse
maximale duparcours utilisable (plus de 300ha)varie
de6200à7.630kgdeMS/ha(Achard,1993),avecune
charge réelle d'environ32ha/UBT.
SmallRuminantResearch NetworkWorkshop 189

Nianogo et al
Essai n"1
Vingt quatre agneauxâgés de6à8mois etpesant
enmoyenne 1531kgontété répartisauhasarden quatre
lots desixpourcetteétude enfactorielrandomisé. Deux
facteurs ont été étudiés :
1. Le mode de conduite: les animauxpâturent sur les
parcours naturels, sept heures par jour, soit
librement souslagarde d'un berger, soit attachésà
unpiquetparune corde de4mètresde long.
2. Le régime alimentaire:deux lots surles quatre ont
été conduits en régime extensif (sans complé
mentation); les deuxautres (régime semi-intensif)
ontreçuauretourdupâturageunmélangedeson de
blé et de tourtreau de coton en proportions égales,
apportant0,83UF(unité fourragère)et2348% de
matière azotée digestible(MAD)parkgd'aliment.
Les besoins journaliers en matière sèche par
animal ayant été estimésà 500g(Riviere, 1991),
les quantités distribuées étaient en moyenne de
125g/jour/animal,soit une couverture de25% des
besoins en matière sèche. Le coût du kilo de
mélange étant de 33,75 FCFA, celui de la ration
journalière de chaque animal s'est donc élevéà
422FCFA.
Lesanimauxonteuunepérioded'adaptationde 14
jours et les observationsproprement dites qui ontsuivi
ont duré70jours(de juilletà septembre).
Tableau1.Schéma expérimental de l'essai n'2
Essain'2(tableau 1)
Quarante agneaux mâles entiers pesant en
moyenne 13,71 kg ont été retenuspour cet essai. Les
animaux ont reçu des traitements prophylactiques et
sanitaires au début de l'étude: vaccin, détiquage,
vermifugation aupanacur.
Ils ont été répartis au hasard en dixgroupes de
quatre,pour ensuite être assignés aléatoirementà l'un
des quatre lotssuivants :
un lottémoin (T)avec quatre ovins,abattus dès le
débutde l'essai;
trois lots de douze animaux recevant l'une ou
l'autre des trois rationsà niveau énergétique élevé
(E) , modéré (M) ou faible (F) avec respec
tivement08,06et04UF/kgdeMS.
Les quantités distribuées journalièrement
représentaient environ35%dupoidsvifdes animaux.
Des abattages suivis de découpe des carcasses selon la
méthode de Boccard et Dumont(1955) ont été réalisés
au30ème,60ème et90èmejours de l'essaià l'abattoir
frigorifique de Ouagadougou aprèsune miseàjeun des
agneauxpendant24heures.Achaque abattage, quatre
sujets ont ététirés au hasard dans chacun des trois lots
E,M, et F.
Après les deux essais, le complément, les
différentes rations, le foin et les refus ont été analysés
pour déterminer les teneurs en matière sèche (MS),
Niveau énergétique de la ration
Paramètre Elevé(E) Modéré(M) Faible (F)
Animaux
Nombre de têtes 12.00 12.00 12.00
Poidsvifmoyen(kg) extrêmes : 13 77 13.55 13,81
124et 14,8kg
"Ingrédients"(en%de laM.S)
Tourteau de coton 18.00 12,00 9.00
Graines de Coton 1.00 000 000
Son de blé 6,00 25,00 0.00
Graines de dolique 0.00 10,00 000
Sorghograins 34,00 2.00 000
Urée 000 000 200
NaCI 000 1,00 1,00
Foin Pp 21.00 1000 43.00
Coquilles d'huîtres 1,00 1,00 0,00
Coquesdegrainesde coton 19,00 39.00 45,00
Total 100.00 10000 10000
% concentré 6000 50.00 11,00
Teneurthéoriqueen énergie(UF/kgdeMS) 0,80 0,60 0,40
NB Lefoin de Pennisetumpedicellatumaétérécoltéfin août débutseptembre 1991(stadephysiologique montaison-épiaison).
MS = matière sèche.
190 Small RuminantResearch NetworkWorkshop

Rendement carcasse et croissance chez lesagneauxMossi
matière organique (MO), matières grasses (MG) et
matière azotée brute (MAB) selon les méthodes de
l'A.O.A.C.(1984)et pour la lignocellulose ouADF, les
fibresNDF, la lignine ouADLet la cellulose selon les
méthodes décritespar Robertson et Van Soest(1981).
Lesanimauxontétépesésunefois parsemaine,pendant
90jours.L'analyse statistique aété réaliséeà l'aide du
logicielS.A.S.(1982). Les moyennes ont étéséparées
grâce autest deScheffe.
Résultats
Essain"1
Le concentréservidurant l'essai n'1 a étécomplè
tementconsomméparles animaux.L'analyse chimique
du complémentadonnéune compositionproximale de
95% de MS, et destaux de la matière sèche en matière
azotée brute(MAB)de551%,en lignocellulose(ADF)
de 1576%, en fibres NDFde32,31%, en la lignin ou
ligninADLde4,49% et en cellulose de 11,18%.
Lesprincipauxrésultatssontrésumésautableau 1.
On note une supériorité du régime semi-intensifsur le
système extensif(leGMQest de61,07gcontre 1923g
quel que soit le mode degardiennage)etune supériorité
du gardiennage sur lapâture au piquet avec desGMQ
de5302get27,28grespectivement.
Essain'2
Croissance et consommation volontaire : Le foin
utilisé contenait 88,47% de MS, dont90,18% de MO,
6,69% de MAB, 4406% d'ADF, 71,91% de NDF,
496%d'ADL,1,80% dematièregrasse et apportait0,65
UF/kg de MS. La composition des concentrés est
présentée autableau2.Lesquantités deMSingérées par
les agneauxsont comparables et sont de:290,3,00et
3,19% dupoids vifrespectivementpourles lotsE,Met
F; la consommation d'eau(1,22à 1,47 litresparjouret
par animal)n'apasétéaffectée par lefacteur ration.Au
cours de l'essai, les meilleures performances de
croissance ont été observées au niveau du lot ot Eavec
unGMQde7858g(tableau2)Ce dernier estsignifi
cativement supérieur (P<005)à celui du lot F durant
toute lapériode de l'essai.
Performances à l'habillage : les données des
habillages (tableau 3) sont spécifiques à chaque lot et
suivant le rang d'abattage. Les rendements carcasse
varient de323à44,86%.Lesplus élevés sontobservés
chez les ovins du lotE.Ces rendements ont augmenté
entre le 1er et le dernier abattagepour les lots E etM;
par contre ceux du lot Fsontinférieursà celui du lot
témoin aupremieret au2ème abattage. Lesdifférences
entre les rendementscarcasse du lot Eau3èmeabattage
et ceux du lot F à tous les rangs d'abattage sont
statistiquement signi- ficatives (P<005); il en est de
mêmepour lesgraisses c'est-à-dire legras detoilette et
le graspérirénal.
Importance relative des régions corporelles : les
poidsmoyensdesdifférents morceauxaugmentent avec
laduréede l'essai,àquelquesexceptionsprès ausein de
chaque lot (tableau 4). Les animaux ayant reçu une
alimentationà niveau énergétique élevéet abattusplus
tardprésentent les régions corporellesauxpoids lesplus
élevés. Au dernier abattage, le poids moyen de la
poitrine et celuiducollier étaientsignificativementplus
élevés(P<005)dans le lotEque dans le lot F.
Tableau2.Composition chimique des concentrés et évolution pondérale des agneaux
Lots Erreur
Paramètre E M F Standard
Compositionchimique des concentrés :
MS 90.33 90,10 8898 -
MO 9467 91,74 9391 -
MAB 16,44 1375 16,44 -
ADF 22.06 32,49 51,70 -
NDF 4003 52,04 69.90 -
ADL 6,21 775 13.76 -
MG 4,20 387 4,60 -
UF/kgde MS 0.90 0,74 0,50 -
PerformanceS
Poids initial(kg) 13,77a 13,55a 13,81 0,28
Poidsfinal(kg) 2039a 16,14ab 14,56b 1,02
QMQ(g/jour)en 12semaines 79.58a 35,54a 875b 10.07
Consommationvolontaire 290a 3,00 3,19a -
(kgMS/100kgde PV)
NB. Les moyennesfigurantsurla même ligne et affectées de la même lettre ne sontpas significativement différentes(P<005).
SmallRuminantResearch NetworkWorkshop 191

Tableau
3:Poids
des
parties
de
lacarcasse
(eng)
Lots
/Rang
de
découpe
Témoin
E M F
Paramètres
1 2 3 1 2 31 2 3
Demi
-carcasse
2187
.50d
27488
378125
442500abcd
306500
3029
.21317545
2335
,83b
2274
.38c
2546
,25a
Gigot
67875b
85000
11438
127375
932
.5094000
93937
72750
718
.75c
82000
Selle
125
,00
150
.6220752
23625
18395
149
,17160
.00
126
,6713750
130
.62
Fillet
151
.87c
191
,25a
28500
36000abcde
225
.00
238
.33250
.62
153
.33
153
,12d
183
,12b
Carré
couvert
190
.37a
242
.37a
36937
404
.37a
283
,1229083
28375
21083
28
,1221062
Carré
découvert
13875b
160
.62
235
,6228000ab
186
,8719000
199
.3715750
13875b
163
,12
Epaule
457
.50a
54375
700
.62821
.87abc
586
,8758000
62000
48583
46937b
501
.87c
Poitrine
205
,00c
27625a
373
,12497
.50abcdef
304
.37b
300
.00
331
.2521500
190
.62f
235
.62c
Collier
223
,12e
290
,62a
458
,12450
.00abcde
328
,12324
.1738000
24259d
25000b
275
.62c
%Catégorie
152
.38b
5005
52
.36
51
.38ab
51
.9153
,465090
50
.4153
,54a
5301
%Catégorie
227
.29c
2535
24
,84
2492abc
25
.0325
,44
25
,88
26
,6226
,74b
26
,20a
%Catégorie
319
.66d
1975a
21
,8223
.47abcd
20
.2120
.5822
.46
1896c
19
.38b
20
,15
Carcasse
4406
,25c
5511
.26
7611
.25
8882
.50abc
6174
00
6081
.67
6380
.00
4718
.33458000b
5172
.50a
Rendement
36
,37g
38
,12a
41
,51jk
44
,86abcdef
37
.89b
3977
42
,76ihg
33
3386jeh
3700c
Graisse
périrénale
8,75dh
2750
10000fgik
146
,25abcde
55
,0056
.6783
.75
1000ci
500efg
17
.50bk
Gras
de
toilette
- -141
.2524875ab
125
,0060
.0095
.00 -875b
11
,25a
Les
moyennes
de
lamême
ligne
affectées
de
lamême
lettre
sont
significativement
différentes
(P<005
).

3
Tableau
4:Influence
du
régime
etdumode
de
conduite
sur
lacroissance
des
agneaux
Effets
principaux
Conduite
Paramètres
Libre
Piquet
Libre
Piquet
Régime
Conduite
Erreur
Standard
Poids
par
semaine
(kg
)
015
.22a
15
.22a
15
,44a
15
.37a
N.S.N.S.050
10
17
,15a
15
.98b
2093a
18
,42d
P<005
N.S.0.69
GMQ
par
semaine
(g)
1-559
.90a
1705b
94
,19c
46
,48d
P<0.05P<005
793
6-10
-4,76a
474b
6276c
40
.86d
P<005
P<005
6.86
1-1027
.57a
109Ob
78
,48c
43
,67d
P<0.05P<005
6,70
Toutes
les
moyennes
figurant
sur
lamême
ligne
etne
portant
aucun
indice
commun
sont
significativement
différentes
(P<005
).

Nianogo et al
Discussions
Croissance des agneauxen régime extensif
etsemi-intensif
La croissance enregistrée en régime extensif est
comparable à celle de 31,71 g/jour rapportée par
Nianogo(1992)sur la même station pour des agneaux
ne recevant que 5% de complémentation. Elle est
égalementsimilaire àcelle observéepar l'IMVT(Soma,
1992) en élevage extensif chez le mouton Mossi au
Yatenga et à Kaya (28,2 g/jour). En régime semi
intensif, la croissance observée se rapproche de celle
observée par Nianogo et Nassa (1992) avec 60% de
concentré sur les ovins de même race élevés dans des
cages de digestibilité et recevant du foin à base de
Pennisetumpedicellatum. Elle est cependantinférieure
à la croissance observée (90g/jour)par Berger(1979)
enCôte d'Ivoire chezdes ovins Djallonké recevantune
quantitéadlibitum de concentrés auretourdupâturage.
La supériorité du système semi-intensif s'explique
aisément car un complément apporte une quantité
constante d'énergie et d'azote, alors que la qualité
(teneur en azote et digestibilité) du pâturage baisse
régulièrementdejuilletà septembre.
Quant augardiennage,ilpermet aux animaux de
sélectionner les meilleures espèces sur le pâturage en
combinant ainsi différentes ressources. Dans ces
conditions, les ressources offertes sur une surface
donnée sont contingentes des autres ressources
disponibles au même moment et du comportement des
animauxguidéspar le berger(Auricoste et al., 1983).
Lapratiquede l'attacheaupiquetengendreuneffet
néfaste au niveaude la végétation duparcours. En effet
lepiquetage engendre une fortepression dansun rayon
déterminé par la longueur de la corde. Il entraîne la
destructiondesespècesconsommées,ce quicompromet
leur fructification, et un durcissement du sol par
piétinement, ce qui freine la germination. Tout cela
favorise l'envahissementde lazonepardes espècesnon
appétées et entraine une forte dégradation de la
végétation despâturages en cespoints.
Influence du niveau énergétique de la
ration (essain'2)
Le croît moyenjournalier de 875g du lot Fest
comparableà celui observé chez les ovins surpâturage
de saison sèche, sans complémentation. Cette faible
performance peut s'expliquer par le faible apport en
énergie digestible de la rationF. LeGMQ(gainmoyen
quotidien) de 26,27g du lotM est supérieur à celui
rapportéparNianogo(1992)chezdes ovins de lamême
station recevant seulement 5 à 10% de complé
mentation. La croissance du lot E (79,58 g/jour) est
inférieure à celle de 114 à 1348/jour obtenue par
Sawadogo (1991) avec la même race et des rations
similaires de 114 à 1348/jour. Cependant, les sujets
utilisésparSawadogo(1991) étaientplus jeunes (4-6
mois) et avaient une consommation volontaire de MS
plusélevée(3,74à3,80% dupoidsvif). Les rendements
observés dans cette étude sont relativement faibles,
probablement en raison de la courte durée de l'essai.
Sawadogo (1991) a obtenu des rendements carcasse
vrais de 46 à 50% en vingt semaines d'alimentation
intensive.
Lorsque lateneurénergétique de laration estfaible
(lotF), lesagneauxMossiprivilégient le développement
en valeur relative des morceaux de 1ère et 2ème
catégories au détriment de la 3ème : 19,49% contre
21,08et21,68%respectivement pourles lots MetE.
Conduiteintensive,semi-intensive et
extensive
La comparaison des résultats obtenus durant les
deux essaisfait ressortir lespointssuivants.
° la croissance des agneaux attachésà unpiquet et
ne bénéficiant d'aucune complémentation est
faible et similaire à celle observée avecune ration
contenant04UF/kgdeMS;
• l'apport d'un complément couvrant 25% des
besoins enMSpermetune croissance équivalente
à celle observée avec une ration complète
contenant60% de concentrés,si les agneauxsont
libres de leurs mouvements sur lepâturage;
la croissance d'agneaux recevant une ration
complète avec0,6UFestintermédiaire entre celle
observée en conduite libre sans complémentation,
et celle observée en conduite entravée avec
complémentation.
Pendant la période de l'essai, les ovins étaient
vendusàunprixmoyen de250FCFA/kgvif.Avecla
complémentation, les animaux ont consommé
l'équivalentde422Fdeconcentréparjourpourungain
additionnel de 50,91g/jour pour le pâturage libre (soit
+ 12, 725 FCFA/jour) et de +32,77g/jour pour le
pâturage aupiquet(soit+8,193FCFA/jour).
En ne tenant compte que du coûtde l'aliment, la
marge brutejournalière seraitdoncde+8,5075FCFA
dans le 1er cas et de 3,9725 FCFA dans le 2ème. On
peutparconséquentestimerque lacomplémentation est
une opération susceptible d'être rentable pour le
producteur. Il apparaîtplus rentable de complémenter
l'alimentation des animauxen saison pluvieuse que de
leur offrir une ration complète. Cependant,il est fort
possible de constituerdes rations moins chèrespour les
ovins, si l'on évite des céréales comme les graines de
sorgho.
Conclusion
Il ressort des résultats de cette étude que le
piquetage est un système à n'utiliser que pendant la
saison des pluies (protection des cultures) et dans les
zones où la main-d'oeuvre est limitée. Dans ce cas, les
194 Small RuminantResearch NetworkWorkshop

Rendementcarcasse et croissance chezles agneaux Mossi
animaux doivent, non seulement disposer d'une corde
assezlonguepour leurdonneraccèsàungrandrayonde
pâture maiségalementêtre déplacésfréquemment, afin
de favoriser les repousses, etd'améliorer la qualitédes
éléments ingérés. On devrait également observer un
intervalle minimum de 20jours entre deuxpiquetages
consécutifs au même point. Pour être efficace, ce
système doit être couplé avec une complémentation.
Cependant, cette dernière estutile seulementsi le coût
des concentrés et les objectifs de production le per
mettent.
La complémentation alimentaire se révèle
nécessaire si l'onveut obtenirdes résultatsperformants
quelque soitlemodedeconduite desanimaux.Compte
tenu deson faible coût(4,22FCFA/jour/animal) et du
gain financier escompté,elle présenteun attrait certain
pour les producteurs. Un tel système permettrait de
valoriser les concentrés qui sont largement disponibles
durant lasaison pluvieuse.
Les performances de croissance, le rendement
carcasse et ledegréd'engraissementdes agneauxMossi
dépendent de la quantité d'énergie digestible ingérée,
quel quesoit le système d'alimentation. Il appartient au
producteur de choisir la méthode de gestion des
ressources disponibles en fonction de la saison et du
niveau de rémunération du marché.
Bibliographie
Achard F., 1993. Evolution récente de la végétation dans six
stations au Burkina Faso. Thèse de doctorat, Institut
national polytechnique de Toulouse;278p.
A.O.A.C.,1984.OfficialMethodsofAnalysis.Association of
Official Analytical Chemists. (13th édition)
Washington,D.C. 1141p.
AuricosteC., DefontaineJP., FiorelliJL., LongletA.etOsty
PL., 1983. Friches, parcours et activités d'élevage.
Points de vue d'agronomes sur les potentialités
agricoles. INRAVersailles,55p.
BergerY.,1979.Sélection et amélioration des ovins-caprins.
Rapport annuel 1979, IDESSA/CRZ. de Minankro,
Bouaké(Côted'Ivoire).
BoccardR. et DumontB. L., 1955. Etude de la production de
viande chez les ovins. La découpe des carcasses.
Définition d'une découpe de référence.AnnZootech,3
: 241-257
Bourzat D. et al., 1983. Essais d'intensification de la
production animale en zone soudano-sahélienne:
Alimentation intensive dejeunes ovins dans le nord du
Burkina. Revue de l'Elevage et de la Médecine
Vétérinaire desPaysTropicaux,1987.40(2) 151-156
Dumas R. et Raymond H., 1974. L'élevage des petits
ruminants dans les circonscriptions de Kaya,
Ouahigouyaet duSahel.MaisonAlfort,IEMVT
Nianogo A. J., 1992. Paramètres de production des ovins
MossideGampéla.p.145-185dans: Proceedings ofthe
1stConference oftheSmallRuminantNetwork.CIPEA,
Addis-Abeba(Ethiopie).
NianogoA.J. et NassaS., 1992. Besoins énergétiques des
ovins Mossi : influence du niveau énergétique de la
ration sur les performances de croissance et les
performancesbouchères des ovins Mossi.p. B13dans
Rapport d'activitésdu programme Production Animale
-1992INERAOuagadougou(Burkina Faso).
Riviere R., 1991. Manuel d'alimentation des ruminants
domestiques en milieu tropical. Collection Manuels et
précisd'élevage.529p.
RobertsonJ. B.andVanSoestPJ., 1981.Thedetergent system
ofanalysisandits application tohumanfoods.Page 123
in : the analysis ofdietaryfiber.W.PT. James andO.
Theander, édition MarcellDekker,NewYork,N.Y.
S.AS.User'sGuide:Statistics 1982.S.A.S. Inst. Inc.,Cary,
NC.40p.
Sawadogo M., 1991. Influence des niveaux énergétique et
azoté de la ration sur la consommation volontaire, la
croissance et les rendements carcasse des agneaux
Mossi. Mémoire de fin d'études IDR/Université de
Ouagadougou.94p.
Soma L., 1992. Contribution à la connaissance des
performances de croissance des ovins de race locale:
essais d'intensification de la production des jeunes
ovins. Mémoire de fin d'études. IDR/Université de
Ouagadougou.96p.
Performance ofMossi lambsin extensive,semi-intensive and
intensive nutrition systems
Abstract
Two feeding trials were carried out to assess the
performance ofentireMossimalesheep. Inthe first trial,
24lambswere randomly dividedintofourgroupsofsix
animals each. Groups 1 and 3 were allowed to graze
freelywithaherder(PL)whereasgroups2and4grazed
while tethered(PP).Groups 1 and2were notsupple
mentedwhilegroups3and4received25% oftheirtotal
dry-matter needs asconcentrates containing50%wheat
bran and 50% cottonseed cake. Body weight was
monitoredfor70daysforallanimals. Inthesecond trial,
40 permanently housed lambs were divided into a
control group of four animals and three groups of 12
Small RuminantResearch NetworkWorkshop 195

A.J. Nianogo et al
lambseach.Thetreatmentgroups receivedthree energy
level diets, i.e. high (E), medium (M) or low (F)
corresponding to 08,06and04feedunitperkgDM,
respectively. Weight performance was monitored for
12weeks andsome animals were slaughtered every30
days to assess carcassyield. Results from the first trial
indicated that free grazing was superior to tethered
grazing,with average dailyweight gainsof5302gand
2728g, respectively. In both cases, supplementation
increased dailyweightgain by68.5%.Group3 lambs
recordedthe bestperformance.Resultsfromthe second
trialshowedthataverage dailyweightgainswere79.58,
3554 and875g, respectively,forE,Mand Fgroups,
withasignificantdifference(P<005)betweenEandF.
Carcass studies indicated that animals in group Ehad
higher carcass yields and that incrustation of their
epiploon fat improved with delayed slaughter. Mossi
sheepperformance was rather modestin these studies
andboththefeedingsystemandthe dietaryenergylevel
hadamarked effect on lambperformance.
196 Small RuminantResearch NetworkWorkshop
Evolution de la note d'état corporel et de quelques
paramètres biochimiques chezdes agnelles Foulbé
à différentsstadesphysiologiques au Nord-Cameroun
ANjoya etNDAwa
Institut de rechercheszootechniques etvétérinaires(IRZV)
Station deGaroua
B.P. 1073,Garoua(Cameroun)
Résumé
Quatre lots de 60 agnelles Foulbéâgées de7à9
mois ont été constitués en avril 1993 en vue d'étudier
l'effet de la complémentationprotéique etminérale de
même que dessoinssur lanoted'état corporel(NEC)et
le poids en liaison avec les paramètres métaboliques
(urée et glucose) et hématologiques (hémoglobine et
hématocrite). Le lotAa reçu complémentation etsoins,
le lot B complémentation sans soins, le lotCdes soins
sanscomplémentationetle lotDnicomplémentation ni
soins. Les animaux ont reçu200gde tourteaude coton
partête etparjourjusqu'en août et de lapierreà lécher
en permanence dans le parc de nuit. Les traitements
sanitaires ont consistéendeuxdéparasitages internes au
début età la fin des pluies etun déparasitage externe
chaquefois que l'on a noté laprésence detiques sur les
agnelles.Unevaccination contre laPPRaétéeffectuée
en octobre. Le poids et la NEC ont été enregistrés
mensuellementsurtoutes les agnelles et lesparamètres
métaboliques ethématologiques ont été mesuréssur20
agnelles par lot. Deux essais de détermination de
l'ingestion volontaire de fourragespar les agnelles ont
été effectués, l'un au cours de laphase de croissance et
l'autre durant la gestation. Pendant toute l'étude, la
complémentation alimentaire a permis une
augmentation très significative du poids etun gain de
NEC chez les agnelles. On a noté une corrélation
positive entre lepoids et laNECdes agnelles(r=0,48;
P<0001). Au cours des phases de croissance et de
gestation, la complémentation a permis une aug
mentation significative de la quantitéde matière sèche
fourragère volontairementingérée. Pendantlaphase de
gestation,il n'yapas eu d'effet de la complémentation
nidestraitements sanitaires sur l'ingestionvolontaire et
la digestibilité du fourrage par les agnelles, mais ces
deuxtraitements ont augmenté considérablement leur
consommation d'eau (P<005). La complémentation a
été associée à une augmentation (P<0,05) des
concentrations plasmatiques d'urée et de glucose chez
les agnelles.Cette étude a montré que la NEC reflète
mieux que le poids, l'état nutritionnel des agnelles
gestantes. Les dosagesde l'uréeplasmatique et dutaux
d'hématocrite peuvent être des opérations de routine
dans l'évaluation de l'état de nutrition azotée et des
troubles parasitaires chez les ovins. Une complé
mentation protéique post-sevrage et pendant la saison
sèche associéeàunplan de prophylaxie légerpermetà
moindre coûtune croissance soutenue et le maintien du
bon étatgénéral des agnelles sur pâturages naturels.
Introduction
Dans la zone soudano-sahélienne du Cameroun,
les petits ruminants souffrent d'une sous-alimentation
sévère en saison sèche due à la rareté de l'herbe et de
l'eau. L'analyse des premiers résultats du suivi
zootechnique mené depuis trois ans dans les élevages
traditionnels montre que le taux de fécondité est
relativement faible, se situant à 92% et 112%,
respectivement pour les moutons et les chèvres (Ngo
Tama et al., 1991). Defortes mortalités d'ovins de tout
âgepouvantatteindre80%dans certainstroupeaux, dues
aux symptômes respiratoires, mais aussi à des causes
non pathologiques ou inconnues, ont été enregistrées.
Des carences alimentaires pourraient être des causes
prédisposantes à cette mortalité ou responsables de la
faible productivité des petits ruminants en milieu
paysan. Les besoins nutritifs des ovins, et en particulier
des femelles, coïncident rarement avec les apports
alimentaires. Suite aux agnelages qui interviennent
souventau cours de lapériodedéfavorableque constitue
la saison sèche, lesfemelles sont obligées de mobiliser
leurs réserves corporelles pour faire face aux besoins
énergétiques de lactation. L'intérêt de ces réserves est
connu, notamment chez les femelles reproductrices.
Dedieu et al (1989) etTorre et al (1991) ont noté une
relation positive entreles réservescorporelles etlestaux
d'ovulation,de fertilité et de prolificité chez les ovins.
Les réserves corporellessontunbonindicateur de l'état
nutritionnel,etsontévaluéesvisiblementsuruneéchelle
de notation de l'état corporel(Russel et al., 1969). La
connaissance desvariations de ces réservesàtravers la
note d'état corporel (NEC) est nécessaire pour les
intégrer dans des programmes de complémentation
alimentaire des ovins. L'objectifde cette étude était de
déterminer l'impactdes complémentations alimentaires
etdestraitementssanitairessur l'évolution de laNECet
duprofil métaboliqueà différentsstadesphysiologiques
SmallRuminantResearchNetworkWorkshop 197

Njoya etAwa
ainsique leurs relations avec la satisfaction desbesoins
alimentaires des agnelles.
Matériels et méthode
Site
L'étude a été menée à la station de l'Institut de
recherches zootechniques et vétérinaires (IRZV) de
Garoua, auNord-Cameroun.Lalatitude est de9,3"Net
lapluviométrie annuelle avoisine990mmavecprès de
50% despluies entre juillet et août. Lapluviométrie a
été normale pendant la période d'étude (946 mm).
L'annéepeutêtre divisée en3saisons:unesaisonsèche
chaude defévrierà mai,une saison des pluies de maià
septembre etunesaisonsèchefroide d'octobreàjanvier.
Lepâturage estun pâturage naturel avecdesgraminées
pérennes dominantes comme Andropogon gayanus,
Hyparrhenia rufa, Cynodon dactylon, Spermacoa
stachydea, Jardinia congoensis et Heteropogon
contortus.D'autres espèces annuelles intéressantes sont
Loudetia togoensis, Pennisetum pedicellatum,
Tephrosia bracteolata, Eragotris tremula et Bracharia
spp. Des arbres et arbustes contribuent aussi à la
biomasse consommable des ovins, particulièrement
pendant la saison sèche lorsque l'herbe devient rare et
de faible valeur nutritive. Les plus fréquents sont
Daniellia oliveri, Afzelia africana, Prosopis africana,
Ficus spp., Grewia spp., Stereospermum kunthianum,
Crossopterixfebrifuga etVitex simplex.
Matérielanimal
En janvier et février 1993,350 agnelles de race
locale Foulbé,âgéesde3à4mois ontétéachetéesjuste
après lesevrage.Pendantlapériode dequarantaine, elles
étaient identifiées avec les boucles Allflex*, vermi
fugées au valbazen* et détiquéesà l'Ectopor* Deux
techniciens ontété initiésà la notation de l'étatcorporel
(NEC)des ovins.Unegrille de note aété miseaupoint,
allant de 1 à 4, avec des écarts de 0,25. La NEC a été
déterminéeparpalpation des régions dorsale, lombaire,
et autour de la queue, et par appréciation de l'aspect
général de l'animal (Russel et al., 1969). La NEC
considérée était la moyenne des notes donnéespar les
deuxtechniciens (attribution d'une note concertée). La
note 1 était assignée aux agnelles très maigres, sans
tissus musculaires ou adipeux entre la peau et l'os, et
avec les côtes et les apophyses visibles à distance. La
note 2 était attribuée aux animaux maigres, avec les
apophyses sensibles autoucher. Lanote3était assignée
auxsujets moyennementgras,avecunefaible épaisseur
de muscle et degras etla note4àceux ayantunebonne
couverture de muscle etde gras.
Constitution des lots expérimentaux
A la fin de la quarantaine en avril 1993, les
animauxontétépeséspendant3jours consécutifs.Sur
350 agnelles,240étaient retenues sur labase dupoids,
de l'âge et duphénotype(robe etfacièsd'ovin Foulbé)
Elles étaient regroupées en 60blocs de4 agnellespar
stratification sur la base de leur poids et de leurNEC.
Les agnelles de chaqueblocétaientensuite affectées de
façon aléatoire à 4 lots expérimentaux, de manière à
avoir des lots homogènes de 60 animaux chacun. Le
poids moyen initial était de 17,20,36kg et la NECde
2,83009. Lestraitementssuivants ontétéappliqués: lot
A: complémentation avectraitements prophylactiques
(pratiques améliorées); lot B: complémentation sans
traitements prophylactiques; lot C: traitements
prophylactiques sans complémentation; lot D: ni
complémentation ni traitements prophylactiques (lot
témoin).
L'étude s'est déroulée en3phases correspondant
auxstadesphysiologiques:période post-sevrage (avril -
août 1993), période de croissance (août - décembre
1993)etpériode de gestation(4premiers mois:janvier
– avril 1994). La complémentation consistait en200g
de tourteau de coton composé de 40,8% de protéines
brutes,146%deparois cellulaires ouNDFet13,1%de
lignocellulose ouADFpar agnelle etparjour,distribué
en groupe, d'avril au début d'août et ensuite de
décembre à avril 1994. La pierre à lécher (55% de
poudre d'os,40% de sel,4% decomplémentminéral et
vitaminé, et 1% de ciment) était disponible en per
manence dans le parc de nuitpour les lotsAet B. Les
traitements prophylactiques consistaient en deux
déparasitages internesaudébutetàla fin despluies (mai
et octobre respectivement) et un déparasitage externe
chaque fois que l'on notait laprésence de tiques sur les
agnelles.Les animauxontétévaccinés contre laPPRen
octobre. Les 4 lots ont été élevés séparément, gardés
chacun parun berger ; cependantune rotation des lots
dans 4 bergeries était effectuée tous les mois afin
d'annuler les effets"berger et bergerie" dans l'analyse
statistique des données. Les animauxpâturaient deux
foisparjour, de8à 12h,et de 14à 17h.L'abreuvement
avait lieu à 12 h et à 16 h.
Collecte des données
Toutesles données ontétécollectées lemêmejour,
une fois par mois, le matin avant la pâture et la
distribution du complément. L'influence de la
complémentation etdestraitements prophylactiques sur
la variabilité desparamètres sanguins a étéévaluée.A
cet effet, quatre-vingts agnelles ont été choisies au
hasard dans les quatre lots soit20agnellespar lot. Du
sang avait été prélevé à la veine jugulaire sur ces
agnelles dans deuxtubes dont le premier contenait du
fluorure de lithium et servait à la détermination de la
teneur en glucose tandis que le second contenait de
l'EDTA, et servaità déterminer l'urée, l'hématocrite et
l'hémoglobine. Les analyses de glucose, d'urée et
d'hémoglobine étaient effectuées au Centre Pasteur de
Garoua par spectrophotométrie sur analyseur
automatique Coûter". La mesure du taux d'héma
tocrite était effectuée au laboratoire de l'IRZV en
utilisantune centrifugeuse àhématocrite.
198 SmallRuminantResearch NetworkWorkshop

Note d'état corporel desagnellesFoulbéau Nord-Cameroun
Deux essaisde mesurede l'ingestionvolontairede
fourrageparles agnellesontétéeffectués.Endécembre,
3 agnelles par lot, soit 12au total ont été placées dans
des cages de digestibilitépendant6jours d'adaptation
et 6jours de collecte totale de fèces, de fourrage et de
refus.Pendant laphase degestation enavril, les agnelles
munies de sacs à fèces ont étéplacées dans des parcs
individuelspourune2èmephase de collecte.Laquantité
d'eau ingérée a été mesurée. La matière sèche des
fourrages, du refus et desfèces était déterminée après
séchageà l'étuvependant48hà60'C.
Traitementstatistique desdonnées
Lesdonnées ontététraitéesparanalyse de variance
des mesures répétées, utilisant la procédure "General
Linear Model" (SAS/STAT, 1990), sur micro
ordinateur.Surchacune desvariablesàexpliquer ontété
testés les effetscomplémentation(COMPL), traitements
prophylactiques (MEDIC) et l'interaction COMPL x
MEDIC. Des corrélations ont été calculées entre les
paramètres hématologiques, le poids et laNEC.
Résultats
Evolution dupoids et de la note d'état
corporel
L' évolution dupoids et de la NEC des agnelles
pendant les trois phases de l'étude est présentée à la
figure 1 etau tableau 1. Pendant laphase post-sevrage,
la complémentation a permis une augmentation très
significative dupoidsdesagnelles(P<001).Par contre,
les soins et l'interaction complémentation-soins n'ont
Poids (kg) Note d'état corporel
5
29 -
Polds compl. Poids non compl. - 4,8
27
NEC, compl. NEC, non compl. - 4,6-G- - -
25 4,4
23 - 4,2
21 - 4
19 - 3,8
17 - 3,6
3,4
15 -
3,2
13 -
3
11 -
2,8
9 - 2,6
7 - - 2,4
5--------------- 22
A M J J A S O N D J F M A
Mols
Figure 1. Influence de la complémentation protéique sur
l'évolution dupoids et de la note d'état corporel des agnelles
Foulbé
pas influencé l'évolution pondérale. La complémen
tation a entraînéune augmentation de laNEC(P<005).
En revanche, les traitements prophylactiques et
l'interaction avec la complémentation n'ont pas eu
d'influence significative.Lacorrelationentre lepoidset
la NEC au cours de cette phase était faible (r=046 ;
P>0,1).Aucoursde laphasede croissance,desgains de
Tableau 1: Effet de la complémentationprotéique et des traitementsprophylactiques sur le gain moyen quotidien (GMQ) et le gain
de note d'état corporel (GNEC)des agnelles
Lot
Paramètres A B C D
Etatinitial
Poids(kg) 17.5 17,8 169 16,5 0,5
NEC 2,88 273 278 296 0,13
Période
post-sevrage
GMQ(g/j) 20* 22a gb –3c 4
GNEC 008" 056" 0,14" -001* 0,13
Phase de croissance
GMQ(g/j) 26" 8b 5b 6b 3
GNEC 0.40" -004" 0,10" 0.09
Phase de gestation
GMQ(g/j) 53a g2b 12e 26d 4
GNEC -005* 025* -0,20° -0.45* 0.09
Etatfinal
Poids(kg) 277a 21.3° 217e 08
NEC 3,12* 323* 2.30 0.07
1 Ecart type de la moyenne.
Les moyennes d'une même ligne suivies de lettres différentessont significativement différentes(P<005).
Small RuminantResearch NetworkWorkshop 199

Njoya etAwa
poids étaient dus à l'effet résiduel de la complé
mentation, des traitements prophylactiques, et à leur
interaction (P<001).De lamême manière, laNECaété
signicativement améliorée par l'effet résiduel de la
complémentation (P<0,01) et des traitements
prophylactiques(P<005).Ala miseen reproduction en
janvier, lesagnellescomplementéesétaientde27%plus
lourdes et avaientune NECplus élevée que les sujets
non complémentés (figure 1). On a noté une forte
correlation entre le poids et laNECau cours de cette
phase (r=079;P<001). Pendant laphase degestation,
la complémentation a permis un gain de poids très
significatif (P<0,01). Par contre, les traitements
prophylactiques seuls ou associésà lacomplémentation
n'ontpas eu d'effet sur le gain de poidspendant cette
période. La NEC a été améliorée par la complé
mentation, les traitements prophylactiques et leur
interaction (P<005). En avril 1994, après une année
d'étude, les agnelles complémentées étaient38%plus
lourdes que celles non complémentées (figure 1). La
corrélation entre lepoids et laNECétaitfaiblependant
cettepériode(r=046;P>0,1).
Utilisation dufourrage
L'utilisation dufourrage est résuméeautableau2.
Pendant la phase de croissance, la complémentation a
permis une augmentation significative (P<005) de la
quantitéde matièresèchetotalevolontairementingérée
(MSTVI). Le taux de digestibilité du fourrage ingéré
(DFVI) est resté remarquablement identique dans les
quatre lots, permettant ainsi au complément
d'augmenter (P<001)considérablement la quantitéde
matière sèche digestible ingérée. Ni les traitements
sanitaires, ni leur interaction avec la complémentation
n'ont amélioré la MSFVI et la MSTVI ou leur
digestibilité. Pendant la phase degestation(avril 1994),
nilacomplémentation, niles traitements sanitairesn'ont
eud'effetsur l'ingestionvolontaire et la digestibilitédu
fourrage. Ces deux paramètres ont cependant consi
dérablementaugmenté(P<005)laconsommationd'eau
des agnelles.
Evolution desparamètres métaboliques et
hématologiques
L'évolution destauxd'urée etdeglucose sanguins
pendantlestroisphasesphysiologiques desagnelles est
représentée auxfigures2et3etautableau3.
Pendant la phase post-sevrage, la complémen
tation aétéassociéeàuneaugmentation significative de
la teneur plasmatique d'urée et de glucose (P<001),
alorsque lestraitementsprophylactiques n'onteuaucun
effet sur ces paramètres. Les deux traitements et leur
interaction n'ontpasinfluencélateneurenhémoglobine
et letauxd'hématocrite (tableau 3).
Ilyaeuunefortecorrélationpositive entre lestaux
d'urée etdeglucose(r=0,68;P<001),etentre lateneur
en hémoglobine et le taux d'hématocrite (r = 0,69;
P<001). Pendant la période de croissance, il n'yapas
eu d'effet résiduel de la complémentation sur les taux
d'urée et de glucose.Cependant, la teneur en urée et le
tauxd'hématocrite ontétéfortement augmentéspar les
traitements prophylactiques (P<001). On a notéune
corrélation positive très significative entre la teneur en
hémoglobine et letauxd'hématocrite(r=092;P<001).
Pendant la phase de gestation, les agnelles complé
mentées ont conservé un niveau plus élevé d'urée
(P<0,01) et de glucose (P<0,05) que celles non
complémentées. Lestraitementsprophylactiques n'ont
paseud'effet surlateneurplasmatique d'urée,mais leur
interaction avec la complémentation l'a considé
rablementaugmentée(P<001). Letauxd'hématocrite a
augmenté avec la complémentation et avec son
interaction avec les traitements prophylactiques
(P<001). Lateneur en hémoglobine aétéaméliorée par
la seule complémentation (P<001). On a noté une
corrélation positive significative entre la NEC et la
Tableau2: Influence de la complémentation et des traitements prophylactiques sur l'utilisation du fourrage par les agnelles
Etatphysiologique/Lot
Croissance Gestation
Paramètres A B C D A B C D ETM"
Poidsvif(kg) 21,0 22.5 205 19,8 1,21 238° 288° 217* 205* 24
MSFVI* (kg/100kg) 5,09 4,86 394 452 042 481*° 369° 606° o,68 437*
MSTVI* (kg/100kg) 600° 572° 394° 452° 043 5,64 437 437 606 070
DFVI* (%) 71.5 754 72.1 73.3 2,46 72.3 70,1 61,6 72.8 499
Ms* digestible (g/kg"*) 95a 96* 61b 70 7.6 123 100 93 128 13,8
Consommation d'eau(l/j) 372a 254" 198" 0.24
Ecarttype de la moyenne
* Pendant un stade physiologique donné, les moyennes de lamême ligne suivies de lettres différentessont significativement différentes (P<005)
* Matière sèche fourragèrevolontairementingérée
* Matière sèche totale volontairement ingérée
4 Digestibilitédufourrage volontairementingéré
* Matière sèche
200 Small RuminantResearch NetworkWorkshop

Noted'état corporel des agnelles Foulbéau Nord-Cameroun
Urée plasmatique (g/)
0,6
Compl. Non compl.
- -
────────
M J J A S O N D J F
Mois
Figure 2. Influence de la complémentation protéique sur
l'évolution de l'urée plasmatique chez les agnelles Foulbé
Glucose (g/)
0,75
Compl. Non compl.
-- --- -
065 -
06 -
0,55 -
0,5 I I I I I T I
M J J A S O N D J
Mols
Figure 3. Influence de la complémentation protéique sur
l'évolution duglucose chez les agnelles Foulbé
teneurenhémoglobine (r=0.58;P<005)ainsiqu'entre
celle-ci et letauxd'hématocrite (r=069;P<001).Tout
au longde l'étude,on aobservéune corrélationpositive
entre lestauxd'urée et deglucose (r=0.38;P<001), et
entre l'hématocrite et l'hémoglobine(r=074;P<001).
Discussion
Les résultatsde cette étude ontpermis de mettre en
évidenceunetrès forte liaison entre l'évolution dupoids
et celle de laNECpendant la phase de croissance des
agnelles. Cela est en accord avec les conclusions de
Sanson et al (1993) qui ont obtenuune telle corrélation
(r=0,89)entre le poids et laNECdesbrebissurpâturage
dans l'ouest des Etats-Unis. Cependant, au cours des
phasesphysiologiquesplus délicates depost-sevrage et
de gestation, la liaison a été plutôt faible. Pendant la
phase de gestation par exemple, les agnellesgagnaient
dupoids mais leurNECbaissait.Cegain depoids était
associéà la croissance dufoetus alors que la baisse de
NEC était due à la qualité médiocre des pâturages
incapables de satisfaire les besoins énergétiques et
protéiques des animaux ; cela contraignait les agnelles
àmobiliser leurs réserves corporelles pourfaireface aux
besoins accrusdegestation. LabaissedeNECétaitplus
importante chez les agnelles non complémentées de
sorte qu'à la fin de l'étude en avril, elles avaient une
NEC moyenne de 27% inférieure à celle des sujets
complémentés.Ces résultats laissent croire quependant
la gestation etdanscertainessituations de stress,laNEC
est un meilleur indicateur du niveau des réserves
corporelles que le poids. Cela est en accord avec les
résultats de Purroy et al (1987) etSanson et al(1993)
qui ont montréque la NECétaitbeaucoupplus correlée
à laquantitédes lipides et desprotéines corporelles que
le poidsvifchez les ovins. LaNECavant la mortpour
les 82 cas enregistrés était de2,290,80,contre3,040,22
pour les agnellesvivantes et complémentées(Njoya et
Awa, 1994). Cela laisse croire qu'il y a eu une
mobilisation desréserves corporellespourfairefaceaux
stress auxquels les agnelles étaient exposées avant la
mort. L'on peut envisager, dans les conditions du
Nord-Cameroun,une note cible d'au moins3. Dedieu et
al(1989)ontpréconiséunenote de3,2pourles élevages
ovins de Cévennes (France).Un mauvais état corporel
desagnelles noncomplémentéeslesprédisposeraità des
avortements, des mises bas d'agneaux chétifs non
viables,une mauvaiseproduction laitière,ou des retours
tardifs des chaleurs, etpar conséquentà une mauvaise
carrière reproductrice.On pourrait envisager d'utiliser
la NEC pour porter un diagnostic rapide de l'état
nutritionnel des ovins enzone soudano-sahélienne.
L'augmentation de la matière sèche totale
volontairement ingéréeparles agnelles complémentées
(tableau 2), sans effet dépressifsur la digestibilité du
fourrage, laisse croire que les compléments protéiques
etminérauxsontnécessairespouraméliorerl'appétitdes
agnellespourlesfourragesgrossiers,base essentiellede
l'alimentation des ruminants tropicaux. Ces résultats
SmallRuminantResearchNetworkWorkshop 201

àTableau
3:Influence
de
lacomplémentation
etdes
traitements
prophylactiques
sur
certains
paramètres
biochimiques
d'agnelles
Foulbé
à différents
stades
physiologiques
Stade
physiologique
Post
-sevrage
Croissance
Gestation
Paramètres
ABCD ETM
"A B CDETM
"AB CDETM
"
Urée
(g/)049
"047
*033
" 034
"003
0.310.360.290,250.04
027a
027a
0 ,14
" 021
* 0.03
Glucose
(g/)068
*o68°
063
" 060°
002
0.600.61059
0.610.010,600.600 ,580 ,600.02
Hématocrite
( %)29
.729
,630
.329
,4 2.76
259
* 246
* 256
*23
.1*0,86
263ab
268
*262ab
244
"0,79
Hémoglob
.(% )993
9.609.80
9,47037
888
8,508,858,100.30
936
* 934
*908
*826
"0.24
1Ecart
type
de
lamoyenne
*Pendant
lemême
stade
physiologique
,les
moyennes
de
lamême
ligne
suivies
de
lettres
différentes
sont
statistiquement
différentes
(P<005
)

Note d'état corporel desagnelles Foulbé au Nord-Cameroun
sontenaccordavecceux obtenus sur desbovins dans la
mêmestation(Njoya, 1992)oùlacomplémentationavec
du tourteau de coton avait permis d'augmenter la
consommation et l'utilisation des pâturages naturels.
Cependant, au cours de lagestation, la quantité de MS
digestible ingérée était identique quel que soit le
traitement. Lesagnelles noncomplémentées avaientun
niveau d'ingestion beaucoup plus élevé que lors de la
phase de croissance. On aurait espéré une chute de
consommation tout comme l'avaient aussi remarquée
Sykes et Field (1972) en Australie chez des ovins
recevant une ration pauvre en protéines. On peut
considérer que l'augmentation de l'ingestion de four
rage par les agnelles non complémentées est un
mécanisme destinéà leur permettre de satisfaire leurs
énormesbesoinsénergétiquesetprotéiquesdegestation.
La complémentation alimentaire a augmenté les
chiffres de glycémie et d'urémie et les traitements
prophylactiques ont eu tendance à augmenter ceux
d'hémoglobine et d'hématocrite. Lestaux d'urée et de
glucose ont évolué en fonction des saisons. Ils étaient
faibles en saison sècheindiquant ainsidessituations de
carence pendant cette période de l'année et ce, malgré
une consommation de fourrage relativement élevée.
Cela a étéconfirmévisiblementpar la baisse de laNEC
des agnelles entre février et avril (figure 1). L'aug
mentationduniveaud'urée avec lacomplémentation est
en accordavec les observations rapportéesparSykes et
Field(1973)quiontsoulignéson rôlecommeindicateur
de l'alimentationprotéique.Mêmependant la première
moitiéde lasaison despluies où le niveauprotéique des
pâturages était leplus élevé, lesagnelles onteuuntaux
d'urée plasmatique plus élevé. La réponse à une
complémentation protéique par le gain de poids et de
NEClaisse croire que lespâturages naturels de la zone
soudano-sahélienne sont carencés en protéines. La
faibleteneur englucose associéeàunefaible NECdes
agnelles non complémentées(figures 1 et3) confirme
son rôle comme indicateur de la carence en énergie.
Cela est en accord avec les conclusions de Stephenson
et Bird(1992)etde Honhold et al(1992)qui ont montré
que la concentration du glucose plasmatique était le
meilleur indicateur de l'alimentation énergétique des
ruminants sur pâturages. Les foetus dépendent de
l'approvisionnement en glucose pour leur survie
(Stephenson et Bird, 1992). Le niveau de glucose chez
l'agnellegestantepeutindiquer le statut nutritionnel du
foetus, et par conséquent prévenir des situations de
carence pouvant entraîner des avortements ou la
naissance de produits chétifs nonviables.
Conclusion
Cette étude a permis d'évaluer la note d'état
corporeldes agnelles en relation avec le poids au cours
d'une année, pendant trois stades physiologiques
différentsetsous l'influencedesfacteursalimentaires et
sanitaires. Elle a montré que la NEC était le reflet de
l'état nutritionnel et, pendant la gestation, était le
meilleur indicateur des réserves corporelles. La
complémentation alimentaire devrait être nécessaire
lorsque laNECdes ovins est inférieureà3. Les dosages
de l'uréeplasmatique et dutaux d'hématocrite peuvent
être effectués de façon routinière dansun but clinique
respectivement dans l'évaluation de l'état de nutrition
azotée et des troublesparasitaires des ovins Foulbé. Le
gain de poids et de NEC et le profil métabolique des
agnelles complémentées indiquent que les pâturages
naturels de la région sont carencés en protéines,
notammentpendant la saison sèche. En zone soudano
sahélienne, une complémentation protéique post
sevrage en saison sèche associée à un plan de pro
phylaxie léger permetà moindre coût une croissance
soutenue etun maintien de l'état général des ovins sur
pâturages naturels. Les autres avantages espérés sont
l'amélioration de la viabilité et de la carrière de
reproduction desanimaux.
Remerciements
Nousremercions Messieurs Njifotié,Kammengni,
NassourouetAwahmukalahde l'IRZVdeGaroua,pour
la collecte des données. Nos remerciements vont
également au Dr Daniel Bourzat (CIRAD-EMVT),
Directeurdu Projet régional de recherches surles petits
ruminants (Cameroun-Niger-Tchad) pour l'appui
logistique qu'il nous a apporté ainsi qu'au Dr Bernard
Faye du Laboratoire d'écopathologie, INRA, Theix
(France) pour ses conseils techniques et la lecture
critique de cet article.
Références
Dedieu D, Cournut E et Gibon A. 1989. Notation d'état
corporel et systèmes d'élevage ovin. Diagnostic et
conseilpour l'alimentationdestroupeauxenCévennes.
INR ProdAnim2(2),79-88.
Honhold N, Hill FWG, Knottenbelt DC, Perry D B and
Morton D. 1992. Reproduction in female cattle in
communalfarmingarea ofZimbabwe.TropAnim Hlth
Prod 24, 183-191.
NgoTamaAC,NjoyaA,MartrencharAet LetenneurL.1991.
Caractéristiques initiales des troupeaux de petits
ruminants suivis dans la partie septentrionale du
Cameroun. Rev SciTech.Soumis.
NjoyaA. 1992.Effectsofcottonseed mealsupplementationon
the performance andpasture utilization byZebu steers.
PhDThesis, IowaState University,Ames, Ia,USA.
NjoyaA et Awa N D. 1994. Viabilité des agnelles de race
Foulbédans diverses situations de complémentation et
de prophylaxie. Rapport annuel IRZV 1993/1994,
31-36.
Purroy A, Bocquier F et Gibon A. 1987. Méthodes
d'estimation de l'état corporel chez la brebis. Dans
Symposium "Philoethios sur l'évaluation des ovins et
des caprins méditerranéens", Santarém - Portugal,
23-25septembre 1987,24p.
RusselAJF,GunnRG and Doney DM. 1969.Subjective
assesment ofbodyfat in live sheep. J agric Sci, Camb
72,451-454,
Small RuminantResearchNetworkWorkshop 203

Njoya etAwa
SansonDW,WestTR,TatmanWR, RileyML,JudkinsM
B and Moss G E. 1993. Relationship of body
composition of mature ewes with condition score and
bodyweight.JAnimSci71,1112-1116
SAS/STAT.1990.User'sGuide:Statistics,Version6, Fourth
Edition,SASInst, Inc, Cary,NC.
Stephenson RGAand HillAR. 1992. Response toprotein
plusenergysupplementsofpregnanteweseatingmature
grass diets.AustJExperAgric32, 157-162.
SykesARandFieldAC.1972.Effects ofdietary deficiencies
ofenergy,protein and calcium on the pregnant ewe. I.
Body composition and mineral content ofthe ewes.J
agricSci, Camb78, 109-117.
SykesARandFieldAC.1973.Effects ofdietary deficiencies
ofenergy,protein andcalcium onthe pregnantewe. IV.
Serum totalprotein, albumin,globulin,transferrin and
plasmaurea levels.JagricSci, Camb80,29-36
TorreC,CasalsR,ParamioMTandFerretA.1991.Theeffects
ofbodyconditionscore andflushingonthe reproductive
performances ofRipollesabreed ewes matedin spring.
Options Méditerranéennes - Série Séminaires 13,
85-90
Monitoringbodyconditions andsome biochemicalparametersin
Foulbe ewesinvariousphysiologicalstagesin northern Cameroon
Abstract
The effects of supplementation and prophylactic
treatment on body condition and biochemical
parameters ofweaner ewes were evaluated on 240
weaner Foulbe ewes randomly allotted to4treatments
of 60 ewes each (treatment A: supplementation with
prophylaxis; treatment B: supplementation without
prophylaxis; treatment C: prophylaxis without
supplementation, and treatment D: neither supple
mentation nor prophylaxis). Supplemented groups
received 200g of cottonseed meal per ewe per day.
Treatedgroupswere dewormed atthe beginning and at
the end of the rainy season. Animals were sprayed
whenever ticks were found on them and vaccinated
against"pestedespetits ruminants"(PPR).Bodyweight
andconditionscore ofall ewesweretaken everymonth.
Blood sampleswere taken monthlyfrom 20 ewesper
treatment for the determination of urea, glucose,
hematocrit and hemoglobin values. Two digestibility
trialswere carriedout,one duringthegrowingphaseand
the other duringthe gestation phase.Weightgain and
body condition were improved by supplementation
throughoutthe study.Therewas apositive correlation
between weight gain and body condition (r = 0.48;
P<0001). Forage dry-matter intake increased with
supplementation during the growing phase but not
during gestation. However, water intake increased
(P<005)with supplementation duringgestation. Blood
urea and glucose increased with supplementation
(P<005).This studyshows that duringgestation,body
condition is a better indicator ofthe nutritive status of
ewesthan bodyweight. It alsoindicates that urea and
hematocritvalues couldbeused routinelyto assess the
protein status and parasite burden in ewes. Protein
supplementation associated with twice-a-year
deworming and regular deticking can allow a steady
growth andgoodbody condition score ofweaner ewes
grazingSudano-Sahelianpastures.
204 Small RuminantResearch NetworkWorkshop

Effet de la supplémentation de la paille de brousse avec
différentesproportions defane de dolique sur
laproduction deviande ovine
H. Nantoumé",A. Kouriba",D. Togola" et B. S. Coulibaly*
" Centre régional de recherche agronomique de Kayes
BP281, Kayes(Mali)
2 Département de la planification agricole et de l'économie rurale
BP258,Bamako(Mali)
Résumé
L'effet de la supplémentation de la paille de
brousse avecdifférentesproportions defane de dolique
(Lablabpurpurus,variété Highworth)sur laproduction
de viande ovine a été évalué en utilisant des béliers
castrés de raceToronképesantenmoyenne37,14 +6,21
kg.Lesniveauxd'apportdefane de dolique initialement
prévus dans les rationsétaient de0,25,50et75% mais
les proportions finales observées ont été de 0; 39,39;
7067et84,62%.L'ingestiontotale d'alimenta variéen
fonction du niveau de supplémentation en fane de
dolique (p<005). L'augmentation de la proportion de
fane danslaration s'esttraduiteparune amélioration de
l'ingestion totale de matière sèche. Lesperformances
pondérales ont varié (p<0,05) en fonction de la
proportion defane de dolique dans les rations. Lestrois
rations contenant respectivement0;39,39 et70,67%de
fanede dolique ontoccasionnédes pertesdepoids.Seule
celle contenant 84,62% de fane a occasionnéun gain
moyen quotidien de2g.Cependant, letauxde matières
azotéestotales des rations comportant7067et84,62%
de fane de dolique est dans les normes couramment
admises pour les essais d'engraissement. L'apport
d'énergie est resté faible et semble être le facteur
limitant de meilleures performances pondérales.
L'analyse coût/bénéfice de l'opération a permis de
dégagerun revenu additionnelpositif
Introduction
L'alimentation apparaît comme la contrainte
majeure auxproductionsanimalesauMaliengénéral et
dans la région de Kayes en particulier. Le disponible
fourrager n'estdebonne qualité et enquantitésuffisante
quependantune courtepériode de l'année,c'est-à-dire
l'hivernage quiva dejuilletà septembre. Les systèmes
d'alimentation sont principalement basés sur l'uti
lisation despâturages naturels etdes résidus de culture.
Pendant la saison sèche, les ruminants alimentés
exclusivement avec des pâturages naturels et des
chaumes de céréales perdent du poids, ce quiindique
que ces aliments sont defaiblevaleur nutritive (Pearce
et al., 1988). L'utilisation de concentrés comme
suppléments généralement recommandés pour
améliorer le niveau d'énergie et de protéines dans les
fourrages lignifiésestdifficilement applicableauniveau
despaysans.Cependant, ilimportedeprévenir les pertes
de production au niveau des paysans en utilisant des
techniques simples et les aliments disponibles. La
supplémentation des fourrages pauvres avec desfanes
de légumineuses permet d'améliorer la digestibilité
(Devendra, 1982), l'ingestion (Mosi et Butterworth,
1985) ou les deuxà lafois (Minson et Milford, 1967;
Lane, 1982; Moran et al., 1983; McMeniman et al.,
1988;Ngwah etTawah,1992).
La présente étude vise à comparer l'effet de
différents niveaux d'apport de fane de dolique sur
l'ingestionet le gaindepoidsdemoutons alimentésavec
de lapaille de brousse.
Matériels et méthodes
Caractéristiques géoclimatiques
L'essai a été conduit à Kayes, à la Station de
recherche zootechnique duToronké(SRZ/T), dans la
zone semi-aride du Mali. Les précipitations moyennes
annuelles sontde600à800mm etsontessentiellement
concentréessur lapériodede juilletàseptembre.Lazone
présente des pâturages naturels constitués princi
palement de graminées et représentant la base de
l'alimentation dubétail. Les activitéséconomiquessont
axéesprincipalement surl'agriculture et l'élevage.
Matériels
Animaux
Untotaldevingtquatre moutonsmâles castrés,de
raceToronké, prélevés dutroupeau ovin de laSRZTet
pesant enmoyenne37,14t6,21 kg, ontétéutiliséspour
cet essai.
Small RuminantResearchNetworkWorkshop 205

Nantoumé etal
Rationsalimentaires
Quatre rations à base de paille de brousse,
supplémentées avec différentesproportions de fane de
dolique ont étéutilisées dans cette étude. Les niveaux
d'apport defane de dolique initialementprévus étaient
de 0,25,50et75% de la ration totale.Cependant les
proportionsfinales observées étaient de0,39,39,7067
et 84,62%. La paille de brousse, en provenance des
alentours de la ville de Kayes, est essentiellement
composée deSchenefeldiagracilis etdeSchizachyrium
exile.Lafanede doliqueaété produiteparleprogramme
de cultures fourragères de laSRZ/T. Lapierreà lécher
KNZrougeaétéutilisée commecomplémentminéralet
vitaminique.Sa composition était la suivante: P:11%,
Mg:1,26%, NaC1:41,7%, Ca:9,0%, Fe : 1,0%,
Co:100mg/kg, I:200mg/kg, Mn:1200mg/kg,
Cu450mg/kg, Vitamine A:140000 UI/kg, Vitamine
D3:28000UI/kgetVitamine E:50UI/kg.
Méthodes
Les vingt quatre moutons, vaccinés contre la
pasteurellose et déparasités au Panacur (fenbendazole
de méthyle) ont été répartis au hasard en 8 lots de 3
animaux chacun.Chacune des4 rations a été assignée
au hasardà2lots soit6 moutons. Les animaux étaient
alimentés deux fois (08h et 18h)parjour pendant 60
jours.Ilsavaient libre accèsà l'eau etàlapierreàlécher.
Les quantités d'aliments ingérées ontété mesuréespar
peséedesquantités offertes etdesquantitésrefusées.Les
variations de poids ont été évaluées par pesée des
moutonstous les 15jours. Des échantillons d'aliments
ont été analysés au laboratoire de nutrition animale de
Sotuba. Les analyses chimiques ontportésur la matière
sèche (MS), les matières azotéestotales (MAT=azote
*625), lamatièregrasse(MG),la cellulosebrute(CB),
les cendres(C), le calcium(Ca)et le phosphore(P). Les
données ont été traitées par analyse de variance
(randomisationtotale).
Tableau 1.Composition chimique de la paille de brousse et
de lafane de dolique utilisées dans l'essai
Paille de Fane de
Eléments brousse dolique
Matière sèche (%) 9055 86,30
Matières azxotées totales (%MS) 2.90 10,28
Cellulose brute (%MS) 40,41 31,69
Matère grass(%MS) 0,61 1,48
Cellulosebrute (% 6,23 1095
Phosphore(%MS) 0,32 0,16
Calcium(%MS) 0,20 0,73
Résultats et discussions
Composition chimique
Lacomposition chimique de lapaille de brousse et
de la fane de dolique est présentée au tableau 1. Ce
tableau montre que les caractéristiques nutritionnelles
de la paille de brousse et de lafane de dolique diffèrent
enplusieurspoints.Lafane de dolique adesteneursplus
élevées en PB,MG,CetCamaisplusfaibles enCB et
en Pque lapaille de brousse.
Ingestion de matièresèche
L'effet de la supplémentation de la paille de
brousse avec de la fane de dolique est présenté au
tableau 2. Ce tableau montre que l'ingestion totale
d'alimentdépendduniveau desupplémentationenfane
de dolique(p<005).L'augmentationdelaproportionde
fane de dolique s'esttraduite parune amélioration de
l'ingestiontotale deMS.Ce résultat estconformeàceux
rapportés par de nombreux autres auteurs. Ngwa et
Tawah (1992) ont montré que l'addition de petites
quantités defane de légumineuses donnait de meilleurs
résultats sur l'ingestion de la paille de riz comparée à
l'utilisation de l'azote non protéique. Mosi et
Butterworth (1985), dans une série d'expériences ont
Tableau2.Effet des différents niveaux de supplémentation de la paille de brousse avec de la fane de dolique
Rations(Lot)
Eléments 1 2 3 4
Effectifs 6 6 6 6
Poids moyeninitial(kg/tête) 4007 34,24 37.00 35,86
Poids moyenfinal(kg/tête) 34,80 30,45 34,43 3597
Gain moyen quotidien(g/tête) -94* -46° 7d
Ingestion de paille (kg/tête) 0,60 0.40 022 0,14
Ingestion de fane de dolique(kg/tête) 000 0,26 0,53 077
Ingestiontotal(kg/tête) 0.60" 066° 075° 091d
Porportion defane (%) 000 39.39 7067 84,62
Les chiffres de la même ligne suivis de lettres différentes sont significativement différentsau seuilde5%.
206 SmallRuminantResearch NetworkWorkshop

Supplémentation etcroissance chezles béliersToronké
trouvéque la supplémentation des chaumes de céréales
(maïs, orge et blé) avec une fane de légumineuse
(Trifolium tembense) améliorait l'ingestion totale de
matièresèche.L'augmentation de l'ingestion de matière
sèche par addition de fane de légumineuse a été
rapportéepard'autresauteurs(MinsonetMilford, 1967;
Lane, 1982; Moran et al., 1983).
Performancepondérale
Il ressort du tableau 2 que les performances
pondérales ont varié (p<0,05) en fonction de la
proportion de fane de dolique dans les rations. Dans les
trois rations contenant respectivement 0, 39,39 et
7067%de fane de dolique, les moutons ont enregistré
des pertes de poids estimées à 94, 60 et 46 g
respectivement. De nombreuses études confirmentque
les fourrages de qualité médiocre (paille de brousse et
chaumes de céréales)sont sipauvres enprotéines et en
énergie digestible qu'ils ne peuventsatisfaire lesbesoins
d'entretien des animaux.Seul le lot recevant84,62% de
sa ration en fane de dolique a connu un gain moyen
quotidien de2g.
Legain depoids estproportionnelà lateneur de la
ration en fane de dolique. Ce phénomène s'explique
d'abord par le taux d'azote très faible des deux
premières rations. La littérature rapporte un taux
minimumde8%dematièresazotéestotalespourunbon
fonctionnement du rumen. C'est aux proportions de
7067 et 84,62% de fane de dolique que les rations
contiennent au moins8% de MAT.
La perte de poids du lot 3 (7067% de fane de
dolique)et legaindepoidsdu lot4(8462% defane de
dolique) s'expliquent principalement par un déficit
énergétique des rations.
Analyse coût/bénéfice
Grâce auxefforts conjugués de la recherche et des
services de vulgarisation, la fane de dolique est
actuellement produite par une large proportion
d'agro-éleveurs etoccupe lapremièreplace des cultures
fourragères vulgarisées au Mali. L'hypothèse retenue
pourl'analyse estbasée sur le faitque larationcontenant
84,26% de fane de dolique a permis non seulement
d'assurer les besoins d'entretien mais aussi un gain
quotidien de 2g. Le régime sans fane de dolique a
occasionné une perte de poids de 94g. Cependant la
ration contenant84,26% defanepermet non seulement
d'éviter une telleperte depoids,mais,d'assurerungain
de2g/j.
Le gain potentiel a été de 5760g((94+2)60j).
Lavaleur ajoutée est de4665Fcfa(5,76kgx900Fcfa).
La quantité de fane de dolique ingérée étant de 46kg
(077kg60j), soncoûtestde4370Fcfa(46kgx95Fcfa),
soit un revenu additionnel positif de 295 Fcfa (4665
Fcfa-4370Fcfa).
Conclusion
Cette étude montre que la supplémentation de la
paille de brousse avec de la fane de dolique améliore
l'ingestion de matière sèche et le gain de poids des
moutons.Cependant,même avecuneproportion élevée
de fane de dolique (8462%)dans la ration, le gain de
poids a été faible (2g/tête/jour). En effet, le taux de
matières azotées totales des rations contenant70,67 et
84,62% de fane est dans les normes couramment
admises pour les essais d'engraissement. L'apport
d'énergie est resté faible et semble être le facteur
limitant les performances pondérales. L'analyse
financière de l'opération montre que le revenu addi
tionnelest positif.Cependantpouruneintensification de
la production de viande ovine, l'apport d'un aliment
énergétique serait nécessaire.
Référencesbibliographiques
DevendraC. 1982. Perspectivesintheutilisation ofuntreated
rice strawby ruminants inAsia. In:P.T. Doyle(Editor);
The Utilisation of Fibrous Agricultural Residues as
AnimalFeeds.School ofAgriculture andForestry, The
University ofMelbourne, Parkville,Vic. 191p.
Lane I R. 1982. Effects offorage legume supplements on
intake andapparent digestibility ofgrass. In:PT. Doyle
(Editor); The Utilisation of Fibrous Agricultural
Residues as Animal Feeds.School ofAgriculture and
Forestry,The University ofMelbourne, Parkville,Vic.
191p.
McMeniman N P, Elliot R and Ash A J. 1988. Supple
mentation of rice straw with crop by-products. 1.
Legume straw supplementation. Animal Feed Science
andTechnology,19:43-53
Minson DJ and Milford R. 1967.The volontaryintake and
digestibility ofdiets containingdifferentproportions of
legumeandmaturePangolgrass(Digitaria decumbens).
Aust.J.Exp.Agric.Anim. Husb.,7:546-551
MoranJB,SatotoKBandDawsonJE. 1983.The utilisation
of rice straw fed to zebu cattle and swamp buffalo as
influenced by alcali treatment and Leucaena
supplementation.Aust.J.Agric. Res.34:73-84
MosiAKand ButterworthM H. 1985.The volontaryintake
anddigestibilityofdietscontainingdifferentproportions
oftef(Eragrostis tef)straw andTrifolium tembense hay
whenfedtosheep.Trop.Anim.Prod., in press.
NgwaAT andTawahCL. 1992. Effects of legume crop
residues and concentrate supplementation on volontary
intake andperformance ofkirdisheepfedabasaldiet of
rice straw.In:Thecomplementarityoffeedresources for
AnimalproductioninAfrica. Proc. oftheJoint FeedRes.
NetworksWorkshops heldin Gaborone, Botswana4-8
March 1991,p.239-248
Pearce G R, Lee J A, Simpson RJ and Doyle PT. 1988.
Sources ofvariation in the nutritive value ofwheat and
rice straws. In: Plant Breedingandthe Nutritive Value
ofCrop Residues. Proc. ofworkshop held at ILCA,
AddisAbaba, Ethiopia7-10Dec. 1987p. 195-229
Small RuminantResearch NetworkWorkshop 207

Nantoumé etal
Effect ofsupplementingbush strawwithvarious levels of
lablab haulm on muttonproduction
Abstract
The effect ofbushstraw supplementation withvarious
levels of Lablab purpureus var Highworth haulm on
sheep meat production was assessed on castrated
Toronké rams weighing 37.14-t621 kg on average.
Planned lablab haulm rates in the diets were 0,25, 50
and75%but actualobserved proportionswere0,3939,
70.67 and 84.62%. Total feed consumption varied
according to the proportion of lablab haulm (P<005)
inthe diet. Increasing haulm level improved total
dry-matter consumption. Weight performance also
varied (P<005) accordingtothe level of lablab haulm
in the diet.The diet containing8462%haulm resulted
in a2gaverage dailyweightgain.The otherthree diets
causedweight losses. However,total nitrogen contents
ofthe two diets with 70.67 and 84.62% lablab haulm
werein linewith accepted standardsforfatteningtrials.
Energy contentwas low andseemedtobe the limiting
factor for better weight performance. A cost-benefit
analysisgave apositive income balance.
208 SmallRuminantResearch NetworkWorkshop

Compensatorygrowth in Horro lambs ofEthiopia
Solomon Abegaz, Demmissie Tiyo andLemmaGizachew
BakoAgricultural Research Center
Institute ofAgricultural Research
PO. Box2003,AddisAbaba, Ethiopia
Abstract
Compensatorygrowth response to liberal concentrate
supplement of Horro lambs previously kept on poor
naturalpastureinthe dryseasonwasstudied. Partialfeed
conversion efficiency (FCE) and variation in carcass
characteristicswere alsostudied.Thetotalexperimental
period consisted ofthree phases of 63 (Phase 1),49
(Phase2), and74(Phase3)days.Therewerefourgroups
(1 to 4) of 10 lambs each. Group 4 was the
unsupplemented control while the other three groups
received high levels ofsupplement in the third phase
after each ofthem were keptunsupplemented eitherin
both ofphases 1 and2(Group3) orin Phase 1 alone
(Group2)or in neither ofthe twophases(Group 1). In
Phase 1,Group 1 lambsgained 1.5kglive weightwhile
lambsinthe othergroups lost20kg. Inphases2and3,
lambs in groups 2 and 3, respectively, showed
compensatorygrowth. Liveweight differencesbetween
groups 1,2and3 observedinpreviousphasesbecame
non-significantinthelastphase. PartialFCEwashigher
in lambs which showed compensatory growth than in
continuously growing lambs, particularly when
liveweight differences between them became
non-significant. All carcass measurement showed
highlysignificant(P<001)correlationwith liveweight
(coefficients ranging from 066 to 099). The study
showed that under conditions where dry season
supplementaryfeedingisimpractical, Horro lambs can
be maintained on grazing alone and subsequently fed
supplements. This enables the lambs to benefit from
compensatorygrowth andbetter partialFCEcompared
to lambs that are allowed togrow continuously under
supplementation.
Introduction
Animals subjectedto aperiod ofundernutrition often
exhibit very high growth during subsequent
realimentation (McManus et al 1972; Thornton et al
1979). This phenomenon, known as compensatory
growth,hasveryimportantimplicationsin countriesthat
dependlargely on grazingtosupportanimalproduction
(Drewand Reid 1975).
In the Ethiopian highlands, sheep are raised on
natural pasture and crop residues. There is annual
fluctuation in the quality and quantity ofthese feed
resources.Galal et al(1981)suggested lambing during
themonth ofMay(start ofthe mainrainyseason) as one
possible lamb production system. This would allow
lambstobegrownandweaned,andkeptuntil the age of
five monthsongoodpasture. Butafterthisage theyface
thepoorpasture conditions ofthe dryseason.
The current experiment was designed to study
compensatory growth in weaned lambs which were
maintained unsupplemented on poor natural pasture
duringthe dry season for variousperiods, andthen fed
liberal concentrate supplementtofinishthem.
Materials and methods
Location
The study was carried out at the Bako Agricultural
ResearchCenter (09'6'N,37'09'E, and 1650m asl)of
the Institute ofAgricultural Research, Ethiopia. The
Center receives a mean annual rainfall of about 1170
mm, out ofwhich 80% falls in the months ofMayto
September, and has mean maximum and minimum
temperatures of28'Cand 13'C, respectively.
Animalsand experimentaltreatment
Lambsusedin this studybelongtothe Horrobreed of
sheep(Galal 1983). Fortyweaned lambs ofbothsexes
with mean liveweight andageof17.8kg(SD=3.16)and
132 days (SD=11.6), respectively, were randomly
assigned to 4 treatment groups (1 to 4). The whole
experimentalperiod(2December 1988to6June 1989)
wasdividedintothreephasesof63(Phase 1),49(Phase
2), and 74 days (Phase 3). Lambs in Group 1 were
supplemented throughout the experimental period,
thoseinGroup2were supplementedin phases2and3,
andthoseinGroup3weresupplementedinPhase3only.
Lambsin Group4 received no supplement throughout
the experiment.
Feedand management
The amount ofconcentrate supplementfedin the first
twophaseswas 150g/head per daywhile in the third
phase itwas333g/headper day.The supplementwas
estimatedto contain21.5%crudeprotein(CP)and305
Mcal metabolisable energy(ME)per kilogram ofdry
matter(DM).
Small RuminantResearch NetworkWorkshop209

Solomon Abegaz et al
All lambswere kept as one flock each day ofthe
experimentand grazedfrom0830to1700hoursonpoor
natural pasture,whichhad an estimatedyield of48t/ha
with a DM content of 60% at the beginning of the
experiment. Each eveningthe animalswere separated
intotheir respective treatmentgroups.
Carcassmeasurement
Sixteen male lambs (3,5,4,and4from groups 1,2,3
and 4, respectively) were selected at the end ofthe
experiment for the measurement of carcass and
non-carcass parts, weights, and the determination of
dressingpercentage. Shrunk live weight ofthe lambs
wastakenjustbefore slaughteraftertheywere deprived
ofwaterandfeedfor about36 hours.
Statisticalanalysis
Analytical procedure for a completely randomised
design was used to analyse between treatment
differencesin liveweightandweightgain. Meanswere
separated usingthe least significant differences (LSD)
procedure (Gomez and Gomez 1984). Relationship
between weight measurements ofthe various carcass
parts and live weight was determined by regression
procedures.
Partial feed conversion efficiency (FCE) of
supplemented lambs was calculated from the total
amount of supplement offered and liveweight gain
obtained above those ofunsupplemented lambs.
Results
Fivelambs(twofromGroup 1 andonefrom each ofthe
remaininggroups)diedfromunknowncausesbeforethe
end of the experiment and were excluded from the
analysis.
Table 1 showsthatin Phase 1 lambs in Group 1
gained an average of 1.5kglive weightwhile lambs in
groups 2, 3 and 4 lost an average of20 kg. Upon
supplementation in Phase 2, lambs in Group2gained
significantly(P<005)moreweight(39kg)than lambs
in group l (2.3 kg) which received supplementation
fromthestart(group 1,23kg)orunsupplementedlambs
ingroups3(0.8kg)and4(09kg).Group3lambsgained
significantly(P<005)moreweight(108kg)thanallthe
lambs in remaining groups (87, 9.1, and 49 kg for
groups 1,2and4, respectively)inthe thirdphase.After
the start of supplementary feeding live weight of
previously unsupplemented lambs approached live
weight attained by lambs receiving concentrate
supplement from the start (Figure 1). However, the
difference ingain betweengroups 1,2and3wasfound
tobe non-significant afterthefirst55days ofPhase3.
Table 2 shows the response in gain due to
supplementation and partial FCE of lambs given
supplementaryfeed.Forthewhole experimentalperiod,
lambsinGroup3had a better partial FCE(4.18)than
lambs in groups 1 (4.82) and 2 (478). The observed
superiorityin conversion efficiency,however,declined
as liveweight differences reached non-significant levels
(last 19 days ofPhase3).
Table 3 shows mean weight and carcass
characteristics ofthetreatmentgroups.Allweightshave
shown a tendency to increase with increase in live
weight. Pooled regression ofshrunk live and carcass
weights, dressingpercentage andweight ofotherparts
on live weight was found to be highly significant
(P<001)withcorrelationcoefficientsrangingfrom066
to 099. Fat deposition as measured by omental and
kidneyfat(weighedtogether),andtailweightwere also
highly correlated with live weight (T=08 and r=07,
respectively).
Table 1. Liveweight changes and daily weight gains during each phase and the whole experimental period (meanESE)
Treatmentgroup
Overall 1 2 3 4
Number oflambs 35 8 9 9 9
Initialweight,kg 17.8-0.53 17 9+1.51* 179+096* 174-095"
WEP1,kg 16.6 -0.52 194+1.12* 155096" 162083" 155080°
WEP2,kg 18.5-0.56 21.7+1.11* 194099* 170078* 164+058°
WEP3,kg 269-0,76 304E1.Io" 28.5-1.11* 278-078* 21.3081"
GP1,kg -1.2 -0.31 1.5-0.43* -17048" -19036°
GP2, kg 1.9+0,23 23019" 39+028* 08 -020° 09-021°
GP3,kg 8.4 -0.45 87046" 91067" 108+0.67* 49+025°
Totalgain,kg 9.11-061 12.5-0.59* 106060° 98050° 39+0.26°
First55 days ofP3, kg 7.1- -0.41 7.1052* 94-H055* 4.3-0.30°
Last 19days ofP3,kg 1.3-0.13 1.6+0.18* 14 -026* 1.4+027* 06023"
WEP1,2,3=weight atthe end ofphases 1,2,3
GP1,2,3 =weight gaininphases 1,2,3
Row meanswith different superscripts are significantly different(p<005)
210 Small RuminantResearch NetworkWorkshop

Compensatorygrowth inHorro lambs ofEthiopia
Liveweight(kg) Rainfall (mm)
35
X X
Group1 Group2 Group3 Group4 Rainfall
– - 2A--------------------E] -- ---------- –-- X
–| 6O
–| 4O
-| 20
10 X-X-X X x─- | 0
0 5O 1OO 15O 200
Days
Figure 1. Growth curves of lambs in the different groups and rainfall in the respective period
Table 2. Gain response to supplementation, quantity of
supplementary feed offered and partial feed conversion
efficiency.
Treatmentgroup
1 2 3
Meangain overunsupplemented
Phase 1* 3.50 - -
Phase2" 1.45 3.05 -
Phase3° 3.80 4.20 5 90
Total 8.60 670 590
First55days ofPhase 3 2.80 3.40 5.10
Last 19days ofPhase 3 1.00 0.80 090
Totalsupplementaryfeedgiven
Phase 1 9.45 - -
Phase2 735 735 -
Phase 3 2467 24.6 2467
Total 41.47 32.02 24.67
First55days ofPhase 3 18.33 18.33 18.33
Last 19days ofPhase 3 6.33 6.33 6.33
Partial FCE
Phase 1 2.70 - -
Phase 2 5O7 2.4.1 -
Phase 3 649 5.87 4.18
Total 4.82 4.78 4.18
First55days ofPhase3FCE 655 539 3.59
Last 19 days ofPhase 3 6.33 792 703
a=gain overmeangain ofgroups2,3and4.
b=gain overmean ofgroups3and4.
c=gain over meangain ofgroup4.
Discussion
Lambs given no supplementary feed and grazed on
naturalpasture in the dry season lostweightwhile the
supplemented lambs gained weight. This shows that
under Bako conditions, natural pasture alone cannot
maintain weight or supportgrowth oflambsin the dry
season.Galal et al(1981)madeasimilarobservationfor
the same sheep breed kept on cultivated pasture in the
dryseasonwhenthestockingratewashigh.
Upon supplementation, previously un
supplemented lambswhichhadlostweightgainedmore
than the continuously supplemented lambs. Similar
compensatory responses have been reported for
Yankasa sheep(Lakpiniet al 1982)andfor BlackHead
Persian and Massai lambs (Massae and Mtenga 1992).
Onthe contrary,Galalet al(1981)found no difference
in growth rate of previously unsupplemented Horro
lambs and continuously supplemented lambs during a
final phase of ad libitum indoor feeding of a ration
composed of75%concentrate and25%hay. However,
inthestudy ofGalalet al(1981), the rationtype andthe
feeding regime could have resulted in differential
adaptation and intake level betweenthetwogroups.
Upon supplementaryfeeding,the partial FCE of
previouslyunsupplemented lambswas higherthan the
partial FCE of lambs supplemented continuously.
Orskov et al(1976)hadreportedsimilarimprovements
in FCEin sheep. Massae and Mtenga(1992)had also
found a non-significant but superior trend in FCE of
realimented lambs compared to those fed high level
Small RuminantResearch NetworkWorkshop 211

Solomon Abegaz etal
Table3. Carcass measurement values and dressingpercentage and correlations with live weight.
Treatmentgroup
Measurement Overall 1 2 3 4
Liveweight, kg 27 7 317 28.1 29.5 22.4
Slaughterweight,kg 25.8 29.8 26.5 27 2 20.8 099**
Carcassweight,kg 11 9 14.3 12.2 2.6 92 0 98**
Dressing out,% 42.8 44.9 43.1 42.7 409 066**
Tailweight, kg 07 0.8 0.8 07 0.5
Skinweight,kg 2.6 3.2 2.8 27 2.0 094**
Viscerafull,kg 56 5.8 59 6.1 4.7 078**
Legs,kg 057 0.62 0.58 0.61 047 086**
Internal organs", kg 1.24 1.32 1.25 1.32 1.10 0 92**
Omental andkidneyfat, kg 0.06 0.08 007 0.06 0.04 080**
Head,kg 1 90 2.20 1.80 200 1.60 081**
1. =liver, lung andtrachea, heart,kidney(fat-free), and spleenweighedtogether.
2.=correlation ofcarcass measurementswith live weight.
** =Significant at P<001 level.
supplement continuously. Graham and Searle (1975),
however, found no difference between FCE of
realimented and continuouslyfed sheep. Difference in
composition of gain between realimented and
continuouslyfedanimalshasbeenreported(McMannus
et al 1972; Drew and Read 1975) and as composition
may vary with age and weight, differences in these
factors may explain the discrepancyin the literature.
All carcass measurement and dressingpercentage
values have shown a tendencytoincrease with weight
and correlation coefficients pooled over all the
treatments were very high. The strong correlation
between the various carcass measurement values and
live weight suggests that within the growth stage of
lambsin this study,similar liveweights achieved either
by compensatory or continuous growth can yield a
carcass with similar composition and proportion of
parts. Previously,Galalet al(1981)reported significant
differences between realimented and continuously fed
lambsin carcassweightanddressingpercentage andfat
deposition measurements, but liveweight differences
were alsosignificant.
Conclusion
Horrolambsgrazingonpoor naturalpasture duringthe
dryseason andgivenno supplementaryfeedwerefound
toloseweight.Uponsubsequentsupplementaryfeeding
the lambsshowed compensatorygrowth and caughtup
with live weights ofcontinuouslysupplemented lambs.
Therewasnoseriouseffect ofcompensatorygrowth on
carcass characteristics,while itimproved partial FCE.
The results ofthisstudy suggestthatin the dry season
unsupplemented lambsgrazing on natural pasture can
tolerate weight losses of at least 10% with no long
lasting effect, and upon subsequent supplementation
they can experience compensatorygainwithhigh FCE.
References
Drew K.R. and Reid J.T. 1975. Compensatory growth in
immature sheep. 1. The effects of weight loss and
realimentation onthe whole bodycomposition.Journal
ofAgriculturalScience (Cambridge)85:193-204.
Galal ESE. 1983. Sheep Germplasm in Ethiopia. Animal
Genetic Information 1/83. FAO(FoodandAgriculture
Organization of the United Nations), Rome, Italy.
pp.4-12.
GalalE.S.E.,TaylorM.S.,TadesseTT.andYohanesG.1981.
Dry seasongrazing oflambs on cultivated pasture and
their subsequent finishing performance. Ethiopian
Journal ofAgricultural Sciences3:15-30
GomezA.K.andGomezA.A.1984.Statistical Proceduresfor
Agricultural Research. 2nd edition. John Wiley and
Sons,NewYork,USA.680pp.
Graham N.M.C. and Searle T.W. 1975. Studies of weaner
sheep during and after a period of weight stasis. 1.
Energy and nitrogen utilization.Australian Journal of
AgriculturalResearch26:343-353.
LakpiniCAM.,Adu IF,BuvanedramV.andUmunnaNN.
1982. CompensatorygrowthinYankasalambs.1.Feed
intake, liveweight gain, and efficiency of feed
conversion. Journal ofAnimal Production Research
2:69-80.
Massae E.E. and Mtenga L.A. 1992. Effects of plane of
nutrition on growth performance and carcass
composition on lambsin Tanzania. In: Rey B., Lebbie
S.H.B.andReynoldsL.(eds),SmallRuminantResearch
and Development in Africa. Proceedings of the First
Biennial Conference of the African Small Ruminant
Research Network, ILRAD, Nairobi, Kenya, 10-14
212 Small RuminantResearch NetworkWorkshop

Compensatorygrowth in Horrolambs of Ethiopia
December 1990. ILCA(International LivestockCentre
for Africa), Nairobi,Kenya.pp.401-415
McMannusAR.,ReidJ.T. andDonaldsonL.E. 1972.Studies
of compensatory growth in sheep. Journal of
AgriculturalScience(Cambridge)79: 1-12
Côrskov E.R., McDonald I.,Grubs D.A. and Pennie K. 1976
The nutrition of the earlyweanedlambs. IV. Effects on
growth rate,food utilization and body composition of
changes from a low to a high protein diet. Journal of
Agricultural Science(Cambridge)86:41 1-423.
Thornton R.F., Hood R.L., Jones P.N. and Re V.M. 1979.
Compensatorygrowth in sheep. Australian Journal of
Agricultural Research 30:135-151.
La croissance compensatrice chez les agneauxHorro en Ethiopie
Résumé
Cette étude porte sur la croissance compensatrice
d'agneaux Horro précédemment élevés sur pâturages
naturels de qualitémédiocre au cours de lasaison sèche
et recevant ad libitum un complément de concentré.
L'efficacitéde laconversionpartielle des aliments et les
caractéristiques des carcasses ont également été
examinées. La période d'essai a été divisée en trois
phasesde63(phase 1),49(phase2)et74(phase3)jours.
Quatre groupes (1 à4) de 10 agneaux chacun ont été
constitués. Le groupe4était legroupe témoin et n'avait
reçu aucun complément alimentaire. Les trois autres
groupes avaientreçu des niveauxélevés decomplément
au cours de laphase3alors qu'ils n'en n'avaientpas du
toutreçu soit au cours desphases 1 et2(groupe3), soit
de laphase 1uniquement(groupe2)ou durant l'une des
deux phases (groupe 1). Au cours de la phase 1, les
agneauxdugroupe l avaientgagné l,5kgalorsque ceux
des autres groupes avaientperdu2,0 kg.Au cours des
phases2 et3, les agneaux des groupes 2 et 3 respec
tivement ont connuune croissance compensatrice. Les
différences de poids observées entre lesgroupes 1,2et
3pendant les phases précédentes n'étaientplus signi
ficatives au cours de la dernière phase. Le coefficient
d'efficacité de la conversion partielle des aliments
était plus élevé chez les agneaux ayant enregistréune
croissance compensatrice que chez ceux dont la
croissance était continue, notamment lorsque les
différences de poids vif entre eux n'étaient plus
significatives.Ily avaitunecorrelation très significative
(P<001) entre toutes les mesures des carcasses et les
poidsvifs, les coefficients variant de0,66à099.Cette
étude montre que lorsque la complémentation de saison
sèche estimpraticable, les agneaux Horropeuventêtre
élevésuniquementsurpâturages naturels etrecevoirdes
complémentsparlasuite.Celaleurpermetd'enregistrer
une croissance compensatrice et d'utiliser plus
efficacementles alimentsque sileurcroissance avaitété
maintenue grâceà unecomplémentation.
Small RuminantResearch NetworkWorkshop 213


Effects of*browseplus' ontheutilisation of
Colophospermum mopane (mopane) browse bysheep
L. Hovel andD. Mpofu
Department ofResearchandSpecialistServices
Matopos Research Station,PBagK5137,Bulawayo,Zimbabwe
Abstract
Intwo experiments usingindigenous sheepthe effects
of*browseplus'(mixture ofpolyethyleneglycol[PEG],
polyvinylpyrrolidone [PVP]anda mineralandvitamin
mix)on intake and digestibility ofbushmeal(BM)was
determined. In the first experiment bushmeal special
(BMS) (BM plus browse plus') intake was higher
(P<005) than BMwhen both diets were offered ad
libitum. At similar levels of intake, dry-matter and
organic-matter digestibilitieswere higher(P<005)for
BMSthan forBM.Therewasnoapparent difference in
Nmetabolism betweenanimals receivingthetwo diets.
Inthe secondexperimentBMandBMSdidnotincrease
(P>005)hayintake and nutrient digestibilitywhenfed
as supplementstograsshay.Totaldry matterintake and
N retention were increased (P<005). No lesions were
observedon thegastro-intestinaltract,liver and kidneys
ofthe animals receivingBMorBMS. Itwas concluded
that BM and BMS could serve as feed resources for
ruminants.
Introduction
Droughtfeedingstrategies have includedthe intensive
use of browse because trees are less susceptible to
climatic fluctuations than herbaceous plants. Browse
usually has higher crude protein content than grasses
(Dube and Ncube 1993). However, the presence of
secondary compounds, mainly polyphenolics/tannins,
limits the feeding value of the browse through
depression ofintake and digestibility (McLeod 1974).
Tannins bind with dietary, enzymatic and microbial
protein to form insoluble complexes that are not
degradedinthe rumen, resultingin reduced digestibility
and intake. Information on fate of tannin-protein
complexespost-rumenhasbeenvariable. Kidney, liver
andgastro-intestinaltractdamageinanimals consuming
tanniferousforage hasbeen reported(Bailey 1978).
Polyethylene glycol (PEG) and polyvinyl
pyrrolidone (PVP) preferentially bind with tannins,
resulting in the reversal oftannin effects on forage
utilisation. Response to PEG depends on the type of
tannin and the tannin:PEG ratio(Strachan et al 1988).
Drought tolerant Colophospermum mopane
(mopane) is prevalent in the southern and western
lowveld regions ofZimbabwewhere fallen dry leaves
and pods are an important feed resource for both
domestic and wild ungulates. Fresh leaves are rarely
browsed probably due to the presence of secondary
compounds. Duringthesevere droughtof1992mopane
browse(leafandfinestem)wasfedto cattleasbushmeal
(BM;mopanebrowse comprisingleafandfine stem)by
crushing and mixing with maize bran, molasses and
coarse salt in the ratio 53.8:30:15: 1.2 (Triangle
Limited). "Browseplus'(AgricuraZimbabwe)crystals
were added ata rate of100g/t ofBMtomakebushmeal
special(BMS). *Browseplus'contains PEG, PVPanda
vitamin and mineral mix. Animal responsestofeeding
ofbothBMandBMShave notbeenstudied.Thecurrent
studywasundertakento determine the effect offeeding
BM and BMS as sole feeds orassupplements topoor
quality hayon nutrientutilisation and clinical status of
the kidneys, liver andgastro-intestinal tract ofsheep.
Materials and methods
Preparation offeeds
BMandBMSwere obtained wetfromTriangle Limited.
On arrival at the station they were sun-dried before
feeding. Natural pasture hay was cut during the dry
season andwas ofpoor quality.
Animalsandfeeding
Ten 2-year old indigenous wethers (average weight
41.1t1.0kg)wereusedinthe first experiment.Animals
were drenchedwithananthelminthic(Ranide,Agricura,
Zimbabwe) before beinghousedin metabolism crates
which allowed separate collection offaeces andurine.
The animals were blocked on the basis oflive weight
and randomly allocated to either BM or BMSwithin
each block. Feedwas offered ad libitum in two equal
meals at0800 and 1600h and the amount offeredwas
115% ofthe previous day's intake.Waterwas offered
three timesa day.
A 21-day adjustment period was followed by a
seven-day collection period. At the end of the first
collection period animals receiving BMS remained in
the experimentfor another 14days divided equallyinto
1. Presentaddress: MakoholiResearchStation,P. Bag9182, Masvingo,Zimbabwe.
Small RuminantResearch NetworkWorkshop 215

Hove and Mpofu
adjustment and collection periods. Their dry-matter
(DM)intakewas, however, restrictedtothe same level
asthose on BM.
Inthe secondexperiment14two-year oldwethers
(average weight400t1.0kg)were used.The animals
were blocked onthe basis of live weight andthe diets
were randomly allocated to the animals within the
blocks. Hayalonewasfedtofouranimalswhile each of
the supplements was fed to five animals. Animals
received 200g/head per day ofthe supplement.The
supplementwas offered duringthe first30minutes of
feeding. Haywasthen offeredat 115% oftheprevious
day's intake.A21-day adjustmentperiodfollowedby
seven days ofsamplingwasused.
Duringthe collection periods refusals andurinary
andfaecal outputwere recorded. Refusalswerepooled
overthe collection periodfor each animalandstored at
roomtemperature awaitinganalysis.Tenpercent ofthe
faeces were oven-dried at55'Cto determine dry matter
content. Urinewas collectedin vessels containing25ml
of1NH2SO4to reduce loss ofammonia.Tenpercent
oftheurinewasstoredat-20'Cforsubsequentchemical
analysis.Atthe endofthefeedingperiodthree animals
from each treatment were slaughtered for visual
detection of lesions on the liver, kidneys and the
gastro-intestinal tract.
Laboratory methods
Feed, refusals andfaecal samplesweregroundtopass
through a 1 mm screen for determination of organic
matter (OM) and nitrogen using standard procedures
(AOAC 1984). Neutral-detergent fibre (NDF) was
determinedusingthe methoddescribedbyGoering and
Van Soest (1970). Urine was analysed for nitrogen
contentusingthe Kjeldahl method.
Statistical analysis
Analysis ofvariance on all datawas carried out usinga
modelthatincludedthe effectofdiet(Genstat 1988).
Results
The chemical composition ofthehay,BMandBMSis
showninTable 1.TheNcontents ofBMandBMSwere
similarbut were higher(P<005)than those ofthehay.
However,the hay had higher (P<005) NDF content.
Therewas noapparentdamagetothe liver, kidneys and
the gastro-intestinal tract ofthe animals from the two
experiments.
Chemical composition of bushmeal
(BM), bushmeal special (BMS) and grass hay
(GH) used in the study.
Chemicalcomponents BM BMS CH
Drymatter 9.1 94 2
Organic matter 90.2 906.5 9408
Nitrogen 150 15.0 4.3
Neutral-detergent fibre 5474 555 9 841.1
Acid-detergent fibre 307.1 311 9 nd
Dry matter as% ofwetweight,other constituents asg/kgdry matter.
nd=not determined.
Intake
Animals readily ate bothBMandBMS. When offered
ad libitumDMintakefrom BMS(1.4kg/headperday)
was higher(P<005)than thatfromBM(1.3kg/headper
day)(Table2).Table3showsintake ofvarious nutrients
Nutrient intake, dry-matter and organic-matter digestibility and N retention by sheepfed bushmeal (BM)
and bushmeal special (BMS)
Parameters BM BMs BMs* SED
Intake(g/headperday)
Drymatter 12685* 12427* 14040" 61.8
Organicmatter 1158.2 1156.2 nd 23.8
NDF 6903 631.5 nd 18.0
Apparent digestibility(%)
Drymatter 588* 682" 60.1* 1.5
Organicmatter 59 9" 703b nd 1.6
Nbalance (g/headper day)
Neaten 206" 186* nd 0.2
Nin faeces 8.0 6.9 nd 1.0
Nin urine 1 7 2.1 nd 0.3
Nbalance 10 9 97 nd 1.0
Nfaeces/Nurine 50 3.5 nd 1.2
1. BMS=BMSdry matterintake restrictedtothat ofBM ad libitum.
2. BMS=BMSfed ad libitum.
Values are means offive observations;SED=standard error ofdifferences ofmeans.
NDF=neutral-detergent fibre; nd=not determined.
Within rowmeanswithdifferentsuperscripts differ significantly(P<005).
216 SmallRuminantResearch NetworkWorkshop

Effect of browseplus'on mopane utilisationbysheep
whengrass haywassupplementedwith BMand BMS.
Supplementation did not reflect grass hay intake
(P>005). However, animals receivingsupplements ate
more totalDMandOMthan those fedgrass hay alone
(P<005). Supplementing with BM did not increase
(P>005)NDFintakewhilesupplementation withBMS
resultedinhigher(P<005)NDFintakethanthe control.
Drymatter andOMdigestibility
Inthe firstexperiment,whenBMandBMSintakeswere
similar, DM and OM digestibilities were higher
(P<0.05) in animals receiving BMS (Table 2).
However, when BMS was fed ad libitum, DM
digestibilitywassimilarforthetwo diets. Inthe second
experimentDMandOMinthethree dietswere digested
toa similar(P>005) extent(Table3).
Nitrogen balance
In Experiment 1 nitrogen balance was measured in
animals consuming similar amounts ofBM and BMS.
Animals receivingBMate moreN(P<005)than those
receivingBMS(Table2). However,faecal andurinary
N output and the relation between the two was not
affected by diet (P>005). Nitrogen retained by the
animals on the two diets was similar (P>005). In
Experiment2, supplementation ofveld hay increased
(P<005) N intake although N intake by the groups
receivingsupplementswas similar(P>005) (Table 3).
Faecal and urinaryNoutputwere similar(P<005)for
allthree diets andNretentionwashigher(P<005)in the
groups receiving supplements than in those fed hay
alone.
Discussion
Although no tannin assay was carried out on BM or
BMS,Walker (1980) stated that mopane browse has
high levels of tannins. These are implicated in the
reluctance of livestock to eatfresh mopane browse. In
the current study animals readily consumed both BM
and BMSindicatingthe improved palatability due to
maize bran, molasses and salt. Itisgenerally accepted
thatpolyphenolics/tanninsinterferewithforage nutrient
utilisationbyanimalsthroughtheirprotein-precipitating
abilitywhich causes reducedintake anddigestibility of
most nutrients(McLeod1974; BarryandDuncan 1984;
Woodwardand Reed 1989).
Reversal oftannin effects onnutrient utilisationby
PEG observedin thisstudyhasbeen reportedby other
workers. Barryand Manley(1984) reported increased
OM digestibilitywhen they sprayed tanniferous Lotus
pedunculatus (lotus) fresh herbage with PEG. In
another studyStrachan et al(1988) observed increased
DM intake and unchanged digestibility by sheep
consuming a mulga (Acacia aneura) diet with PEG
inclusion. However, Nunez-Hernandez et al (1991)
observed no effects of PEG on OM intake and
digestibilitybygoatsandsheepfedmountainmahogany
(Cercocarpus montanus).
The similarityin N metabolism between animals
consuming BM and BMSwas not expected. Despite
higher Nintake by animals receiving BM,faecal and
urinaryNand N retention were not different.This is
contrarytothefindings ofNunez-Hernandezetal(1991)
whoobservedreducedfaecalNandincreasedurinaryN
when animals consuming mountain mahogany were
givenPEG. Increased excretion ofNthroughfaecesby
Table 3. Nutrient intake, dry-matter and organic-matter digestibility and nitrogen retention by sheep fed grass hay (GH)
supplemented with 200g/headperday ofbushmeal (BM) orbushmealspecial (BMS)
Parameters GH alone GH+-BM GH-BMS SED1 SED2
No. ofanimals/treatment 4 5 5
Intake (g/headperday)
GH 626.3 602.2 6752 51.4 48.4
Totaldry matter 6263* 7525b 272 25.6
Organicmatter 5880* 655 0° 25.4 23 9
Neutral-detergent fibre 5138* 544 5* 5898*
18.3
Apparent digestibility(%)
Drymatter 48.4 49.2 51.0 3.2 3.0
Organicmatter 51.3 49.5 53 4 3.1 2.9
Nitrogen balance(g/head,per day)
Nintake 3 1a 5 1b 5 1b 0.1 0.1
Nin faeces 3.1 3.3 3.8 0.3 0.3
Nin urine 1.1 1.1 07 0.2 0.3
Nbalance -1.1* 07b 0.8 07
Nfaeces/Nintake 07a 07a 0.1 0.1
SED1=standarderror ofdifferences ofmeans ofunequally replicated treatments.
SED2=standard error ofdifferences ofmeans ofequally replicatedtreatments.
Within rowmeanswith differentsuperscripts differsignificantly(P<005).
SmallRuminantResearch NetworkWorkshop 217

Hove andMpofu
animals fed high tannin forage was also observed by
BarryandDuncan(1984)whentheyfed lotustosheep.
The increase in faecal N is due to the formation of
indigestible protein-tannin complexes(Woodwardand
Reed 1989).
Total DM intake increased with BM and BMS
feedingwithno effect on basal dietintake andDMand
OM digestibilities. Strachan et al (1988) and Nunez
Hernandez et al(1991)observedincreasedDMandOM
intake with no effect on digestibility. Strachan et al
(1988) postulated that rate of rumen turnover is
increasedby PEGinclusion.The level ofPEGusedin
this study(+0.1g/headper day)is notexpectedtohave
had profound effects on digesta flow kinetics. The
higherNretentiononsupplementationwasduetohigher
Nintake.
The comparison ofpublished results with the
current study needs to be viewed with caution.
Tannin-PEG-protein interactions are affectedbymany
factors such as tannin molecularweight and structure,
protein type (Scalbert 1991)andPEGmolecularweight.
Inthestudies reviewed differentforageswereusedwith
different levels ofPEG,complicatingthe interpretation
of results. It is likely that polyphenolics present in
mopanebrowse are differenttothoseintheforagesused
bythe otherworkers.
Conclusion
This study confirms other research findingsthat PEG
reversesthe effects ofpolyphenolics/tanninson nutrient
utilisation, largely through improved nutrient
digestibility. Both BM and BMS could serve as dry
season feed resources although longerfeedingperiods
are required tohave conclusive results on physiologic
effects. Research into methods of encouraging in situ
feedingofmopanebrowsewarrantinvestigationinview
ofthe costs ofmakingbushmeal.
Acknowledgements
The assistance of Agricura and Mr J. Stambolie of
Triangle Limited in providing the feeds, and the
Nutrition Section staffat Matopos ResearchStation in
looking after the animals is acknowledged. Thanks to
DrsT.Smith andS.Sibandaforcomments on the draft
ofthispaper.
References
AOAC(Association of Official Analytical Chemists). 1984.
Official Methods ofAnalysis.AOAC,Washington,DC,
USA. 1141 pp.
Bailey E.M. 1978. Physiologic response oflivestock totoxic
plants.Journal ofRange Management31:343-347.
BarryT.N. and Duncan S.J. 1984. The role of condensed
tanninsinthe nutritionalvalueofLotuspedunculatusfor
sheep. 1.Voluntaryintake. BritishJournal ofNutrition
51:485-491.
BarryTN. and ManleyTR. 1984. The role of condensed
tanninsinthe nutritionalvalue ofLotuspedunculatusfor
sheep.2. Quantitative digestion of carbohydrates and
proteins. BritishJournal ofNutrition 51:493-504
DubeJS.andNcubeS.1993.Thepotential ofMatoposbrowse
species in livestock production. In: Dzowela B.H. and
Shumba E.M. (eds), Agroforestry Research and
Developmentin Zimbabwe. Proceedings ofthe National
Seminarheldat the UniversityofZimbabwe,3-5March
1992. National Agroforestry Steering Committee,
Zimbabwe.pp.39-46
Genstat 5 Release 1.3. 1988. Lawes Agricultural Trust,
RothamstedExperimentalStation,UK.
GoeringH.K. andVanSoestP.J. 1970. Forage FiberAnalysis
(Apparatus, Reagents, Procedures and Some
Applications). Agriculture Handbook 379. ARS
(Agriculture Research Service),USDA(United States
Department of Agriculture),Washington,DC,USA.20
pp.
McLeod M.N. 1974. Plant tannins- their role in forage
quality. Nutrition Abstracts andReviews 44803-815
Nunez-HernandezG.,WallaceJD., HolechekJL.,Galyean
M.L. and Cardenas M. 1991. Condensed tannins and
nutrient utilization by lambs andgoats fed low-quality
diets.Journal ofAnimalScience 69:1167-1177.
Scalbert A. 1991. Antimicrobial properties of tannins.
Phytochemistry303875-3883
Strachan D.B., Pritchard D.A., Clarke M.R. and O'Rourke
PK. 1988. The Efect ofPolyethylene Glycol: Tannin
Ratio on Dry Matter Intake and Digestibility ofNulga
Leaf by Steers. Queensland Department of Primary
Industries,Queensland,Australia.
WalkerB.H. 1980.Areview ofbrowseandits rolein livestock
productioninsouthernAfrica. In:Le HouérouH.N.(ed),
Browse in Africa: Current State ofKnowledge. ILCA
(International Livestock Centre for Africa), Addis
Ababa, Ethiopia.pp.7-24
Woodward A. and Reed J.D. 1989. The influence of
polyphenolics on the nutritive value of browse: A
summaryofresearch conducted atILCA.ILCABulletin
35:2-11. ILCA (International Livestock Centre for
Africa),AddisAbaba, Ethiopia.
218 SmallRuminantResearchNetworkWorkshop

Effect of browse plus'on mopaneutilisationbysheep
Effet d'un mélange"ligneuxplus"sur l'utilisation dufoin de
Colophospermum mopane chez les ovins
Résumé
Deux essais ont été effectués pour déterminer
l'effet d'un mélange appelé "ligneux plus" (poly
éthylène-glycol, polyvinylpyrrolidone et mélange
vitaminique)surl'ingestion etla digestibilitédufoin de
brousse (feuilles et tiges finement haclées de
Colosphorpermum mopane). Dans la première
expérience, l'ingestion de l'aliment composé (foin +
mélange) étaitplus élevée (P<005) que celle du foin
seullorsque les deuxalimentsétaient offerts adlibitum.
Avec le même niveau d'ingestion, les digestibilités de
la matière sèche etde la matière organique de l'aliment
composéétaient meilleures(P<005)que celle dufoin.
Il n'y avait aucune différence apparente dans le
métabolisme azoté des animaux recevant les deux
rations. Dans la seconde expérience, la consommation
de foin de brousse et d'aliment composé, servis en
complément de foin de graminée, n'augmentait
(P>005)ni l'ingestion dufoin nila disgestibilité de ses
éléments nutritifs. La consommation totale de matière
sèche et la retention de l'azote augmentaient(P<005).
Aucune lésion n'avait été observée dans l'appareil
digestif, lefoie et les reins desanimaux recevantdufoin
debrousseoul'alimentcomposé.Onpeutdoncconclure
que ces deux produits peuvent être utilisés pour
l'alimentation des ruminants.
Small RuminantResearch NetworkWorkshop 219


Effect ofcastration and diet onperformance
andfeed utilisation inSaanengoats
VRM Muhikambele,"LA Mtenga" E. Owen*GC Kfaro"
DSCSendalo"NF Massawe,"SM Kiango andD.R. Nkungu
I. Department ofAnimalScience andProduction,Sokoine University ofAgriculture
P.O. Box3004, Morogoro,Tanzania
2. University ofReading, Department ofAgriculture,EarleyGate
P.O. Box236, Reading, Berkshire, RG62AT UK
Abstract
Growth performance, digestibility and water intake
studieswere conducted on growingSaanen male and
castrategoats.Thegoatswere eitherfed adlibitum a
barley-based concentrate diet or lucerne pellets.
There were little castration and diet effects from
arrival to weaning. Males grew faster (222 vs 183
g/day), had a lower conversion ratio(3.13vs4.11 g
DM/ggain)andhigher dry-matterintake (751vs744
g/day)than castrates. However,in the24.5to365kg
liveweight period, castrates were superior to male
goats in most parameters studied. Digestibility
coefficients were higher in the barley-based diet.
Dry-matter intake as a percentage of live weight
rangedfrom2.51to386.Nitrogenwasbetterretained
ingoats on barleyconcentrate.Goatsconsumedwater
at8to 12% oftheir live weight, higher values being
for goats fed lucerne.
Introduction
Thereisscarceinformationonthe effectofcastration on
growth rate andfeedutilisationingoats. Differencesin
the rate ofgain between castrates andintact males are
unclear. In cattle and sheep,it has been conclusively
shown that entire male animalsgrowfaster and utilise
feed better than castrated animals (Bradfield 1968;
Hedrick 1968; Turton 1969; Field 1971; Price and
Yeates 1971). In contrast with this view, Mackenzie
(1970), working with British Toggenburg goats,
concluded that castration makes full use ofthe meat
potential ofsurplusgoats as castratedgoatsgrowfaster
and are heavier than entire malegoats. In corroboration
withthisviewKyomo(1978)foundthat castratedSmall
East Africangoatswereheavierthan entire malesfrom
weaningto72weeks ofage. However, Nitter (1975)
found that male German Fawn breeds ofgoats grew
fasterthancastrates,aconclusion alsoreachedbyLouca
et al (1977) with Damascus goats. The potential for
growth andfeed utilisation in Saanen entire male and
castrate goatsbased on concentrate andgrass diets has
notbeen documented.Theaim ofthepresent studywas
therefore toinvestigate the effects ofcastration and diet
onperformance ofSaanen goats.
Materialsand methods
Sixty male (entire) and six castrated British Saanen
goats were usedin an experiment totest the effect of
castration (entire males vs castrates) and the diet
(barley-basedconcentratevs lucerne pellets)ongrowth
performance and feed utilisation in a 2x2 factorial
experiment. Animals were purchased from farmers at
2-3days ofageandwererandomlyallocated tothefour
treatments.Arrivalweightwasobtainedbyweighingthe
kids on the day of collection from the farms around
Reading University (UK) where the experiment was
conducted. Castration took place at 11t1 days ofage
usingrubberrings. Besidesthetreatments,all kidswere
fed artificial milk(DenkavitLamb211)adlibitumfrom
arrival toweaningat35days ofage.
The barley-based concentrate and lucerne pellets
werefed ad libitum.Thebarleydiet consisted ofmilled
barley,soybeanmeal,fishmeal, molassinemeal, ground
limestone,salt and IsaacSpence minerals at800, 100,
50,30, 15,4and 1g/kgdry matter, respectively. Each
1000gofIsaacSpencemineralsconsistedof105.5gCa,
347gP,979gNa,1508gCl,1375gMg,97gFe,
0.8gMn,0.13gCo,021gIand 110000IUVitamin
D (manufacturer's specification).The barley dietwas
not pelleted. Lucerne was dehydrated, milled and
pelleted atthe ReadingUniversity Farm and measured
30 mm long and 10 mm thick. Animals were
individuallypennedandwaterwasavailableallthetime.
Animals were weighedweekly and dry matter intake
was recorded.
Sixentire male andsix castrategoatsfromweaning
to24.5 kg live weight were randomly allocated to the
twodietsfordigestibility, nitrogenutilisation andwater
intake studies. There was an 8-day collection period,
during which daily intake of feed and water were
measured. Faecalandurine outputswere also recorded.
Faecal andurine sampleswerepreserved accordingto
Schneider and Flatt (1975). AOAC (1975) methods
were used in analysing the chemical components of
samples.
Small RuminantResearch NetworkWorkshop 221

Muhikambele et al
Results
The chemical analyses ofthe barley concentrate and
lucerne diets are shown inTable 1.Thetwo dietswere
almostisocaloric andisonitrogenousin content.
Table1. Chemicalcomposition ofthe diets(g/kgdrymatter) 1
Barley Lucerne
COnCentrate pellets
Chemicalcomposition Mean+SD Mean- ESD
Drymatter(g/kgair dry 900H-4 900H-12
weight)
Crude protein 199-5
Ether extract 27+1 26 -1
Ash 65+5 98-1
Calcium 18 -1 31+5
Phosphorus 4-H03 2-H08
Lignin 14- -2 89-8
Energy(MJ/kg DM) 18.62+0,79 18.68H029
1. Meanofeight samples.
Castration and diet had no significant (P>005)
effects ongrowthandfeedutilisationfromarrival atthe
University Farm (4t05 days ofage)toweaning at35
days ofage (Table 2). From weaningto attaining24.5
kg live weight, entire male goats grew (39t9g/day)
faster (P<0001) than castrates. There was no effect
(P>005) ofcastration on daily feed consumption, but
because castrates took a longer time (16days)to reach
the targetweight of24.5 kg,they consumed more dry
matter.Castrate goatswere less (P<0001) efficientin
utilising theirfeedthan entire malegoats.Goatsfed the
barleyconcentratedietgrew(25g/day)faster(P<0001)
than those fed lucerne. Daily dry-matter intake was
higher(P<0001)ingoatsfed lucerne,buttheyutilised
the feed less efficiently compared togoats on barley
concentrate(P<0001).
Therewas a change in male status effect on most
characteristics studiedin the24.5to36.5kgliveweight
range. Castrate goats grew (49 -21 g/day) faster
(P<005)thanthe males.Castrategoats alsoatemore dry
matter(P<005)and more but not significant(P>005)
metabolisableenergy.Thetrendinperformanceofgoats
fed barley concentratewithin the245-365kggrowth
Table2. Effect ofcastration and diet on performance ofgoats in different weight periods*
Castration Diet
Parameters Male Castrate SED Barley Lucerne SED
Weightfrom arrival toweaning
No. ofanimals 30 30 30 30
Weightatweaning(kg) 8.16 8.10 0.31 7 98 8.27 0.31
DailyDMintake (g) 184 182 10 183 183 10
Dailyenergyintake (MJME) 373 3.84 0.16 3.81 376 0.16
Growth rate (g/day) 130 125 10 124 128 10
FCR(gDM/ggain) 1.44 1.49 009 1.49 1.44 009
Weightfromweaningto24.5kg
No. ofanimals 24 24 24 24
Weightatweaning(kg) 7 91 775 0.34 7.62 8.05 0.34
Actualweight at24.5(kg) 26.03 2559 0.44 25.42 26.48 0.48
Age at245kg(days) 117 132 50 * 118 131 50*
DailyDMintake (g) 751 744 30 605 830 30
Dailyenergy intake(MJME) 767 750 0.24 7 72 745 0.24
Growth rate(g/day) 222 183 9*** 215 191
FCR(gDM/ggain) 3.13 4.11 3.13 4.39
Weightfrom245to365kg
No. ofanimals 12 ·12 12 12
Actualweight at24.5kg 25 29 25.02 0.32 24 94 2537 0.32
(kg) 174 11.48 057
Actualweight at36.5kg 37.84 38.00 0.16 37.84 38.00 0.16
(kg)
Age at365kg(days) 194 184 174 204 9* *
DailyDMintake (g) 1094 1290 76** 1055 1334 76*
Daily energyintake(MJME) 10 99 12.69 059** 12.19 11.48 057
Growth rate(g/day) 185 234 21 7 * 237 182
FCR(gDMIggain)_ 5 94 5.51 0.56 4.45 732 056***
1. Animals on arrivalweighed40-445kg.
2. *=P<005;**=P<001;***=P<0001.Figureswithout asterisks are not significantly different P>005
222 Small RuminantResearch NetworkWorkshop

Effect ofcastrationanddiet onSaanengoats
periodwassimilarto earlierperiods.Animalson barley
concentrate grew faster by 55t22g/day(P<005), ate
less(1055vs 1334g)drymatterandslightlymore(12.19
vs 11.48 MJ) metabolisable energy and utilised their
feed more efficiently compared with those offered
lucerne.
In general, digestibility coefficients were not
affected by castration (P>005) although there was a
tendency for castrates to exhibit lower digestibility
coefficients (Table 3). However, differences in
digestibility coefficients in favour ofgoats fed barley
concentratewere significant(P<0001).Goatson barley
concentrate consumeddry matterwhichwas equivalent
to 2.51% of live weight while goats on lucerne
consumed dry matterwhichwas386% ofliveweight.
Table3. Digestibility as influenced by castration and diet.
Fehret al 1976withAlpinegoats).Thusagreatpotential
apparentlyexistsforimprovingtropicalbreeds ofgoats
by crossing with European breeds, provided proper
consideration isgiven to managementandfeeding.
Theinfluence ofcastration onpre-weaninggrowth
ratewassmall andnon-significantinagreementwiththe
findings ofPeters and Heaney(1974). Performance of
kidswas notinfluencedbydam milkyieldastheywere
artificially reared. The performance characteristics in
theweaningto24.5kginterval,infavourofmaleshave
been reported in other breeds ofgoats (Nitter 1975;
Loucaet al 1977)andin cattle andsheep(Turton 1969).
Thisis attributed mainlytosexhormones(Turton 1969;
Field 1971).The claimbyMackenzie(1970)and, more
recently, by Kyomo (1978)that castrates grow faster
Castration Diet
Male Castrate SED Barley Lucerne SED
No. ofanimals 6 6 6 6
Dailyintake
Dry matter (9) 946 1056 74 775 1222
DM(%live weight) 2 95 3.46 () 14* 2.51 3.86 () 14***
Gross energy(MJ) 17 62 19 59 1.38 14.43 2278 1 38***
Crudeprotein (g) 185 206 14 154 236 14***
Digestibility coefficients (%)
Drymatter 68 66 () 9 77 58 () 9***
Organicmatter 70 68 09 79 59 () 9***
Energy 69 67 09 78 58 () 9***
Protein 75 73 08 80 68 ()8 **
* P<005; ***P<0001.
Goats fed barley concentrate were more efficient
(P<0001)in nitrogen utilisation than goatsfed lucerne
(Table 4).The differences between male and castrate
goatswere small(P>005). Castration hadno effect on
voluntary water intake (Table 4). Goats fed lucerne
consumed morewater (P<0.001)in absolute amount as
a proportion of live weight and per kg dry matter.
Lucernefedgoats consumedabout one andahalftimes
as much dry matter and about twice as much ash as
consumedbygoatsfedthebarley concentrate.
Discussion
Dietsinthepresentstudywereformulatedinsuch away
as nottobe limitingin energy andprotein accordingto
nutrientrequirements ofgrowingdairygoats(Devendra
andMcLeroy1982). It can be concludedthatfrom birth
toweaning,the growth rate ofSaanen goats can range
from 124to 130g/daywhilefromweaningto245kg
live weight and from 24.5 to 36.5 kg live weight,
expectedgrowth rate can rangefrom 183to222and 182
to234g/day, respectively. Similar growth rate values
have been reported with other dairy goat breeds in
Europe under intensive systems (Ladipo 1973 with a
mixture ofdairygoats;Nitter 1975withGermangoats;
than males is difficult to reconcile with the present
findings.
Aninterestingandimportant aspectin the present
studyisthe reducedgrowthrate observedformalegoats
in the 24.5 to 36.5 kg liveweight period which was
accompaniedbyslight reductionin feedintake.Similar
reduction in growth rate in male goats have been
observed in Damascusgoats (Louca et al 1977) and is
attributedtobreedingseasoneffectwhichwasinAugust
to October in the present study.The observation that
feed conversion ratio (FCR) in goats increases with
increasingliveweight(Fehretal1976;Loucaetal1977)
is corroboratedbythe findings ofthis study.
The resultstendto suggest that lucerne-fedgoats
increased their dry matterintakeinanattempttosustain
thesame metabolisable energyintake asthat ofgoats on
barley concentrate, although they failed to compensate
fully. Duringtheweaningto245and245to365kg
intervals dailydrymatterintakewas37%and26%more
for lucerne-fed than for barley-fed goats, respectively.
The metabolisable energy concentration in barleywas
33%greaterthan thatinlucerne. However,theintake of
thelucerne dietwassohighthatMEintakesfrombarley
dietswere only4-6%greaterthanthosefromthelucerne
diets. Digestibility coefficients of075-082have been
Small RuminantResearch NetworkWorkshop 223

Muhikambele et al
Table4. Nitrogen retention and water utilisation as influenced by castration and diet.
Castration Diet
Parameters Male Castrate SED Barley Lucerne SED
No. ofanimals 6 6 6 6
Dry-matterintake (g/day) 946 1051 84 775 1222
Ashintake (g/day) 76 89 7 50 115
Nitrogen retention
g/day 9 20 10.66 1 07 9 97 9 89 1 07** *
%intake 32.78 33.56 1 93 40 29 2605 1 93 * *
% digested 43.19 44 99 2.65 49 94 38.25 2.65
Dailyintakes
Water(kg) 2.58 276 0,05 1 53 3.82 005***
Water(kg/kgDM) 272 2.62 0.48 1 97 3.12 048 **
Water(% live weight) 8.00 90 1.58 4.94 12.16 1 58 **
***= P30001.
quotedforbarley diets,and055-66forlucerne(Orskov
et al 1974;Waiman 1977).These values are similar to
those inthe presentstudy.
Voluntaryfoodintake aspercentage oflive weight
is a much used measure of intake capacity. The
dry-matter intakes of 251-386% obtained in the
present study are in agreementwith those reported in
other breeds ofgoats, as reviewed by Devendra and
McLeroy(1982).The elevated proportion ofnitrogen
appearingintheurine andfaeces ofgoatsfedlucerne as
reflected in less nitrogen retention is suggestive of a
greater extent offormation of ammonium and other
relatednon-protein nitrogenous substancesinthe rumen
andhindgutwhichwereabsorbed andsubsequently lost
viathe kidneyand undigestedprotein.
Waterintakeincreaseswith increase in drymatter
intake (Anand 1961).Thepresent studyshowsthatthe
goat is no exception. It has been recommended that at
environmental temperatures of 15'C and 15-20'C,
waterintake forgrowinglambs shouldbe200and2.50
kg/kgdry matterconsumed,respectively(Devendraand
McLeroy 1982).Asimilarvalue of252-262kg/kgdry
matter was obtained in the present study for a mean
temperature of17'C. Higherwaterintake forgoats fed
lucerne in the present study may have been simply a
reflection ofhigher dry matter and ash intakes bythe
animals.
References
Anand B.K. 1961. Nervous control of food intake.
PhysiologicalReview41:677-708
AOAC(Association of Official Analytical Chemists). 1975
Official Methods ofAnalysis. 12th edition. AOAC,
Washington,DC,USA.
BradfieldPG.E.1968.Sexdifferencesin thegrowthofsheep.
In: LodgeG.A. and LammingG.E. (eds),Growth and
Development ofMammals. Butterworths,London,UK.
pp.92-108
Devendra C. and McLeroy G.B. 1982. Goat and Sheep
Production in the Tropics. Longman Group Ltd,
London,UK.271pp.
FehrPM.,Sauvant D., Delage J., DumontB.L. and RoyG.
1976. Effect of feeding methods on performance of
entire young malegoats. Livestock Production Science
3:183-194.
Field R.A. 1971. Effect of castration on meat quality and
quantity.Journal ofAnimalScience32:849-858.
Hedrick H.B. 1968. Bovine Growth and Composition.
Research Bulletin Monograph 928. Agricultural
Experimental Station, Washington,DC,USA.56pp.
KyomoM.L. 1978. Meatfrom Goatsin Tanzania.PhDthesis,
University ofDar esSalaam,Tanzania.272pp.
Ladipo JK. 1973. Body Composition ofMale Goats and
Characteristics oftheir DepotFats. PhDthesis,Cornell
University, Ithaca,NewYork,USA.343pp.
Louca A., Economides S. and Hancock J 1977. Effects of
castration on growth rate, feed conversion efficiency,
and carcass quality in Damascus goats. Animal
Production 24:387-391.
Mackenzie D. 1970. Goat Husbandry. 1st edition. Faber and
Faber,London,UK.584pp.
NitterG. 1975. Preliminary resultswithintensive fattening of
young goats. Animal Breeding Abstract 43(12):684
Abstract no. 5878.
OrskovER., FraserC. andMchattie I. 1974 Cerealprocessing
and food utilization by sheep. Animal Production
18:85-88,
Peters HF. and Heaney D.P. 1974. Factors influencing the
growth oflambs reared artificially orwiththeir dams.
Canadian Journal ofAnimal Science549-18.
Price M.A. and Yeates NTM. 1971. Infertile bulls versus
steers. Journal ofAgricultural Science (Cambridge)
77:307_311.
SchneiderB.H. and FlattWP. 1975.The Evaluation ofFeed
through Digestibility Experiments. University of
Georgia Press, Athens, Georgia,USA.423pp.
TurtonJB. 1969.The effect of castration onmeatproduction
from cattle,sheep andpigs. In: Rhodes D.N.(ed),Meat
224 Small RuminantResearchNetworkWorkshop

Effect ofcastration anddietonSaanen goats
Productionfrom Entire MaleAnimals.J&AChurchill
Ltd,London,UK.pp. 1-50
WainmanFW. 1977. Digestibilityandbalance in ruminants.
Proceedings ofthe Nutrition Society 36:195-201.
Effet de la castration et du régime alimentairesur lesperformances
et l'utilisation des aliments chez les caprins de la race deSaanen
Résumé
Lesperformances de croissance, la digestibilité et
la consommation d'eau dejeunes boucsSaanen entiers
et castrés ontétéétudiées. Ils recevaient ad libitum soit
des concentrésàbased'orge, soitdufourrage condensé
de luzerne. L'effet de la castration et de l'alimentation
était insignifiant jusqu'au sevrage. Les mâles entiers
croissaientplusvite(222contre 183g/jour), avaient un
taux de conversion alimentaire plus faible (3,13 contre
4,11gdeMS/gdegain depoids)et consommaient plus
de matièresèche(751 contre744g/jour)que les castrats.
Toutefois, entre24,5et36,5kgdepoidsvif,ces derniers
étaientsupérieurs aux mâles entierspour la plupart des
paramètres étudiés. La digestibilité de la ration à base
d'orge étaitplus élevée. La consommation de matière
sèche équivalaità251à3,86% dupoidsvif Laretention
d'azote étaitplus élevée chez les animaux recevant du
concentré d'orge. Enfin, la consommation d'eau
équivalaità 8à 12% du poids vif, avec des taux plus
élevés pourles animauxrecevantdufourragede luzerne.
SmallRuminantResearch NetworkWorkshop 225


Calliandra leafmealingoat rations: Effects on protein
degradabilityin the rumen andgrowth ingoats
C. Ebong
Namulonge Agricultural andAnimalProduction Research Institute
P.O. Box7084, Kampala, Uganda
Abstract
A study was carried out to evaluate the value of
Calliandra leafmealas a soybean mealsupplementfor
goats. Goats on 75 and 100% Calliandra meal diets
consumed more dry matter and utilised the feed more
efficiently (P<0.05) that goats on other diets.
Compositing Calliandra leaf mealwith soybean meal
enhancedtheuptake andutilisation ofbothsupplements
byproviding a better amino acid profile.The results
show that while Calliandra alone can provide the
required nitrogen for growth and feed utilisation
efficiency, its nutritive value is enhanced when fed
togetherwith soybean meal.
Introduction
Calliandra calothyrsusis one ofthe multi-purpose tree
species that has been intensively evaluated in Uganda
since 1989underthe agroforestryprogramme.Theuse
ofthe cropforfodderisimpededbylowproduction of
forage biomass within smallholdings and its high
tannins and related polyphenols content. These
compounds make the leaves astringent and poorly
digestible.
Preliminary investigation (Ebong et al 1992)
indicated that astringency and adverse effects on
digestibility can be negatedby compositingthe forage
withsoybeanmeal(SBM).The objective ofthepresent
studywastoexaminethe effect oflevels ofsubstitution
of Calliandra leaf meal (CLM) for SBM on animal
performance, especially in relation to energy and
nitrogen retention.
Materials and methods
Animalsandtreatment
Thirty-six young, intact male goats were used in a
growthtrailof70days.Thesewere stratified according
to bodyweight and randomly allocated to six dietary
treatments: adlibitum elephantgrass(diet 1); adlibitum
elephantgrasspluspureSBM(diet2);25:75SBMCLM
(diet3);50:50SBMCLM(diet4);75:25SBMCLM
(diet5)pureCLM(diet 6). All compositeswere made
isonitrogenous by addition ofmaize bran.The amounts
ofmaize bran addedwas calculated usingthe Pearson
Square method.
Dailyfeed offers and refusals were weighed and
sampled for subsequent analysis. Live weight ofeach
animalwas measured atweeklyintervalsfor 10weeks.
Thereafterfour animalsfromeachtreatmentgroupwere
selected randomly and fitted with faeces and urine
collection harnesses.Totalcollectionoffaecesandurine
was undertaken for four days following an adaptation
period offive days.Samples ofurine andfaecesfrom
each animalwere taken and bulked across the days of
collectionfor subsequent analysis.
Chemicalanalysis
Samplesoffeedandfaeceswere analysedfordrymatter
(DM), nitrogen (N) (AOAC 1980); neutral-detergent
fibre(NDF), acid-detergentfibre (ADF), ligninandfibre
bound nitrogen (GoeringandVanSoest1970).
Calculations
Intake components were calculated as difference
between offers and refusals corrected for dry matter
contents ofthefeeds. Digestibilitywas calculatedasthe
proportion ofdry matterintake(DMI)not recoveredin
thefaeces.Growth ratewascalculatedasthe regression
coefficient ofweeklybodyweights on days offeeding
(ADG). Feed conversion efficiency (FCE) was
calculatedas theratioofintakepergramofbodyweight
gain.Theseparameterswere examinedbyLeastSquare
Analysis ofVarianceusingtheStatgraphicsprogramme.
Means were compared by Duncan's Multiple Range
Tests(GomezandGomez1984).
Results
The chemical composition ofthe feeds is shown in
Table 1.The results indicate that the attemptto realise
isonitrogenousfeedtreatmentswas not successful.This
may have been due to improper mixing; mixing was
undertaken by hand. It was not possible to carry out
analysisbeforethe feeding trial.
Average DMintakeandaverage dailyweightgain
(ADG) during growth are shown in Table 2. Both
parameters differed significantly (P<0001) between
diets.Goatsfed on75and 100%CLMhadthe highest
Small RuminantResearch NetworkWorkshop 227

Ebong
Table 1. Chemical composition (g/kg DM) offeedfed to goats in the growth trial.
Diets
Chemical
composition 1 2 3 4 5 6
OMI 948.3 9569 9354 948.4 946,7 9354
Nitrogen 157 567 34 9 392 437
NDF 7072 1827 224.3 202.1 191.1 242.5
ADF 425.2 173.6 1743 175.3 168.8 1640
Lignin 232.6 117.5 133.1 254 0 149.1 144.5
Ash 51.8 33.1 64.6 51.8 53.3 64.6
OMI=organic-matterintake;NDF=neutral-detergent fibre;ADF=acid-detergentfibre.
Table2.Dry-matterintake (g/d; g/kg"7) average dailygain(g/d)andfeedconversion efficiency(FCE;gfeed/gbody-weight gain)
in goatsfed elephantgrass (Pennisetumpurpureum)with orwithout supplements.
Diets
Parameters 1 2 3 4 5 6 SE
DMI(g/d) 4568230" 3664E193° 5953E185° 5296E190* 4730E190* 6589874° 144
kg07s 67231* 54528" 81329° 71925° 650E22° 79429° 1.1
ADG(g/d) 271- 40" 44965° 83978° 103389° 670E129* 58698° 3.6
FCE(g/ggain) 102E14° 6705* 48H04° 9737* 10.0+1.5° 0.8
FCE=gfeed/gweightgain;values in a rowwith the same superscript do notdiffer(P>005);SE=standard errorofthe means.
DMintakes.Thesevalues decreased progressivelywith
increasinglevelsofSBMinthe diet.Withthe exception
of diet 2 (100% SMB) and diet 5 (75% SBM) all
supplements increased DMI significantly (P<005)
above theintake ofcontrolanimals.
Average daily gain also differed between diets
(P<0001). Supplementation increased average daily
gain by 1.5-tofivefold.The highest dailygainswere
observed in animals supplementedwith diet4(50:50
SBMCLM).The differencesinperformancewere also
reflectedinfeed conversion efficiency(P<001).
Estimates of nutrientintakes, digestibility and N
retention (NR) during the metabolic trial period are
showninTable3.DM(P<005)andN(P<0001)intakes
differed significantly between diets.The highest DM
intake andOMIwere observedinthe controlgoats and
those fedon diet6(100%CLM).The lowestDMintake
andOMIvalueswereobservedinthe animalsfedon diet
4(50:50SBMCLM).Astrongquadratictrendwasalso
evident.
The highest Nintakeswere observed in goats fed
diets2and6(75and 100%SBM, respectively).Values
were observedin animalsfeddiets3,4and6(25,50and
100%SBM,respectively)were similartoeach other.
DM andOM digestibility and digestible organic
matter intake (DOMI) did not differ between diets
(P<005)(Table 3). Allvalueswere notably high(666
g/kgDM). However, apparentN digestibility differed
between diets (P<001), but no consistent trend was
established (Table 3). The lowest N retention values
were obtained in animals fed the control diets 1 and4
(no supplement and 50%SBM, respectively).Similar
retention values were observed in diets 2, 3, 5 and 6;
these were not differentfrom one another.
Discussion
This experimentis a follow-up ofthe preliminarytrial
reported earlier(Ebongetal1992). Ithas confirmedthat
compositing enhancesintakes ofbothSBMandCLM.
The mechanisms involved have not been adequately
investigated.The experiment also confirmedthat on its
own,Calliandra can supplytheNrequiredto increase
growth and possibly milk yields. However, the
nutritional value canbe improvedbycompositingwith
SBM.
However,the association ofenhancedgrowth rate
andfeed efficiencywith lowerN retentionvalueswas
not expected. Possible explanations include,improved
aminoacidbalance,partition ofenergybetweenfatand
protein deposition, or specific tissue metabolism and
development, notably the gut, liver, skin and muscle.
Thesetissues havevariable contributionsto total body
228SmallRuminantResearch NetworkWorkshop

Effects ofCalliandra leafmealingoat rations
Table 3.Intake (g/d) and digestibility (g/kgDM) and nitrogen retention (g/d) in growinggoatsfed ad libitum elephant grass
(Penniseteum purpureum) and supplements consisting of complementaryproportions ofsoybean meal (SBM) and Calliandra
calothyrsus leafmeal (CLM)
Diets
1 2 3 4 5 6 SE
Intake
Elephant grass 4682346° 6166278° 2757246d° 2178344° 2396218° 3982333" 12.2
Supplements - 2689342° 3726205* 3682392° 3709389° 2849335" 12.5
TotalDM 6842346* 5243269b° 6033269° 5046573° 5451472* 6676352* 17.1
TotalOM 6112271* 4938465* 5721255" 4789683" 5122443* 6316352* 16.6
Total N 102+05° 06
Digestibility
DM 10.2
OM 10.1
App 8469E137° 8970219° 7944E155* 766.1324" 8252221* 8036244cd 8.8
Dig.OMI 4592322 3890454 4529+272 3668629 4172432 4524+31.6 16.5
NR 73+18"° 11.1+89° 10323* 5394" 11.8+73* 11.5+32* -
Valuesinarowwiththe same superscripts do not differ(P>005);SE=standard error ofthe means.
pool ofN and fractional synthesis rates. Indication of
these requireddestructivesamplingwhichwas notdone.
Growthratesobservedingoatsfedsupplementsin
this trialis rarely cited (Ebong 1990). Itindicates that
goats respond to improved nutrition. However, the
economicjustification ofsuchinterventions needstobe
investigated further. The efficiency is likely to be
enhanced in breed and nutritional improvement
programmes.
Acknowledgements
The workwas funded by the International Livestock
Centre for Africa (ILCA) and co-ordinated by
AFRNET.Samplescollectedinthestudywere analysed
at the Faculty ofAgriculture and Forestry, Makerere
University, Kampala.TheCalliandrafeedwassupplied
bytheAFRENA(ICRAF)project at Kalengere.Weare
gratefultoMrRobertObonyo-OkerandJohn Kigongo
who dutifully attendedtothe animals.
References
AOAC(Association ofOfficial AnalyticalChemists). 1980
OfficialMethodsofAnalysis.Thirteenthedition.AOAC,
Inc.,Arlington,Virgina,USA.
GoeringH.K.andVanSoestP.J.1970.Forage Fibre Analysis
(Apparatus, Reagents, Procedures and some
Applications). Agriculture Handbook 379. USDA
(UnitedStatesDepartment ofAgriculture),Washington,
DC,USA.20pp.
GomezK.A.andGomezA.A.1984.Statistical Proceduresfor
Agicultural Research. Second edition.John Wiley and
Sons, Inc.,NewYork,USA.680pp.
Lesfeuilles deCalliandra dans la ration des caprins: effet sur la
dégradation desprotéines du rumen et la croissance des animaux
Résumé
Une étude a été menée pour estimer lavaleur des
feuilles de Calliandracomme complément dutourteau
de soja pour l'alimentation des caprins. La
consommation de matière sèche et l'efficacité de
l'utilisation alimentaire des animaux recevant 75 et
100% de feuilles de Calliandra étaient supérieures
(P<005)àcelles des sujets recevant les autres rations.
L'apport simultané de feuilles de Calliandra et de
tourteau de soja améliorait la consommation et
l'utilisation de ces deux compléments grâce à un
meilleurprofil d'acides aminés. Les résultats montrent
que,bien que lesfeuilles de Calliandrapuissentà elles
seules fournir l'azote nécessaire à la croissance et à
l'efficacité de l'utilisation alimentaire, leur valeur
nutritive estamélioréepar l'apportsimultanédetourteau
de soja.
Small RuminantResearch NetworkWorkshop 229


Comparative evaluation ofstylo (Stylosanthesguianensis)
lnay and concentrate asprotein supplementforWestAfrican
Dwarfsheepfed basal diet ofelephant
grass(Pennisetumpurpureum)
R.M. Njwe andB. Kona
Department ofAnimalScience
University ofDschang, B.P. 222, Dschang,Cameroon
Abstract
An investigation was carried out to assess the
comparative values ofstylo (Stylosanthes guianensis)
hayand concentrate asprotein supplementsforgrowing
West African Dwarf sheep. Three groups of sheep
(12-15months oldwith an averageweight of1320kg)
werefed elephantgrass(Pennisetum purpureum)alone
(EG), orthe grass andsupplementedwith either200g
stylo hay (SH)/head per day or 140 g concentrate
(CC)/head per day (each containing 27.12 g crude
protein).Theanimalswerefedinindividualmetabolism
cagesfor70days. Itwasobservedthatdry-matterintake
increased significantly (P<005) when EG (4506
g/day/kgW* ) was supplemented with SH (66.16
g/day/kgw**) or CC (7129 g/day/kgw"*). This
sametrendwasalso observedwith crudeproteinintake,
dry-matter (DM) and crude-protein (CP) digestibility.
Theproportion ofdietarynitrogen retainedbysheepwas
similar forgroups fedSH(61.47%)andCC(61.39%).
Sheepfed CCgained78g/day compared to60 and9
g/day, respectively,forthosefedonEGplusSHandEG
only. The high cost of concentrates makes them
unaffordablebysmallholderswithlimited resources, but
SHproductionin smallholderfarmsisfeasible and can
provide a good quality protein supplement that could
stimulate high weightgainsingrowingsheep.
Introduction
The increasing population density in the West and
North-Westprovinces ofCameroon is responsible for
the continuous decline in the size ofsmallholder farm
holdingsin the region. Mogavero(1986)indicatedthat
in smallfarm areasof 1.8ha,intensive agriculture based
on Arabica coffee,vegetables,food crops, raffia palm
and small livestock such as sheep, goats, pigs and
poultry is practised. Ducret and Grangaret (1986)
reported that land is exploited tothe maximum and is
often cultivated continuouslywithoutfallow.Twocrop
cycles are common duringthe rainyseason;the second
cycle is limited to a third ofthe farmland,involving
fewer crops and producing lower yields. Crop
associations are complex such that the coefficient of
land occupation ranges from 250-400%. The
productivity ofcrop associations is often high(the land
equivalent ratio rangingfrom 140-2305), ensuring on
theaverageadequatefeedingfor 12persons/ha,andmay
providesurplusforsalein someareas.Livestockdensity
is estimated at 05-06 tropical livestock units/ha
cultivated.
With such an intensive system ofproduction,itis
necessary to urgently evolve strategies ofproduction
that sustain adequate cropyields and atthe same time
ensure high productivity of livestock. Introduction of
forage legumes into the farming system has been
suggested as one of the strategies for ensuring the
sustainability oflivestock andcropyields inthis region.
Forage legumesdonotonlycontribute tosustainingsoil
fertility butalsoprovidebetterqualityfeedforlivestock
in the farming system,if available feed resources are
judiciously managed.Animalsthat are confined during
the cropping season to avoid crop damage, can be
adequately maintained on farm feed resources. Excess
forage legumeproduced duringthegrowingseason can
beconservedashayfordryseasonfeeding,whenanimal
feed is scarce. The objective of this study was to
comparetheperformance ofWestAfrican Dwarfsheep
fed stylo hay (SH) and concentrate (CC) as protein
supplementsto an elephantgrass (EG)basal diet.
Materials and methods
Fifteen West African Dwarf male sheep weighing
1325tl.85kg onaveragewith ages rangingfrom 12to
15monthswereusedin the trial.Theywere dewormed
and sprayed against externalparasites before the trial
started.The animalswere randomly divided intothree
groups offive animals each. Eachgroupwas allocated
to a treatment in a randomised complete block design.
Afteraone-weekadaptationperiodtodifferentdiets, the
experimentalperiod started.The initialbodyweight of
each animalwas determined. Each animalwas kept and
fed in a separate metabolism cage during the entire
experimentalperiod of70days.
The three experimental rations were: fresh
elephantgrass(Pennisetumpurpureum)fed alone (EG)
as a control, elephant grass plus stylo (Stylosanthes
Small RuminantResearch NetworkWorkshop 231

Njwe andKona
guianensis) hay (EG+SH), and elephant grass plus
concentrate (EG+CC). Fresh elephant grass ranging
from 1-1.5 months cut on a dailybasiswasused asthe
basal diet.Theforagewas manuallycutwith a machete
andchoppedintopieces ofabout 10cmbefore feeding
tothe animals.Twohundredgrams ofSHand 140gof
CC(each containing27.12gcrudeprotein)were fedto
each animalin the treatments alreadydesignated,in the
morningat0800hours.Thetotal daily allocationoffresh
elephant grass (2 kg/day) was fed in two equal
instalments at 0900 hours and 1600 hours. The
compositions ofEG,SHandCCare showninTable 1.
The concentrate was made up of 74% maize, 24%
unextractedgroundsoya bean,0.5% common salt,and
05% bicalcium phosphate. Fresh water and salt licks
were provided ad libitum. All animals were weighed
once a weekthroughoutthe experiment.The animals
were weighed at 0700hours before the morningfeed
was served. The amount of feed and refusals were
monitoreddailyin order to estimate intake.Samples of
fresh elephant grass, supplements and refusals were
collected dailyandtheirdry mattercontent determined.
They were subsequently bulked on a weekly basis,
ground and a sample of500g reserved for chemical
analysis.
During the last two weeks ofthe experiment, a
digestibility andN-balancetrialwas carried out. Faecal
collections were carried out in order to estimate the
digestibility of the rations.At0800hours total faecal
outputwas collected,weighed, mixedthoroughly and
10% ofeach day's collection was used for dry matter
determination.Subsequently, thesamplescollectedover
the seven-day period were combined,groundto pass
through a 1 mm sieve and stored in a plastic bag for
chemicalanalysis.Thetotalurine outputin24hourswas
collected in plasticjars containing5 ml concentrated
hydrochloric acid. Itwas mixedthoroughly,and10% of
the day's collection storedin sample bottlesin a deep
freezer.The urine samples collected over a seven-day
periodwerebulkedbefore analysisforurinarynitrogen.
Table 1. Chemical composition offeeds.
Proximate Elephant Stylo
COmpOnentS grass hay Concentrate
Drymatter% 21.46 88.04 88.01
Organic matter 88.10 9209 96.44
(%DM)
Crudeprotein(%DM) 11.56 13.56 1969
Crude fibre (%DM) 31.00 29.50 3.50
Ether extracts(%DM) 1.44 403 6.45
NFE(%DM) 44.10 45.00 66.80
Ash(% DM) 11.90 7 91 3.56
Analysis offeeds, refusals, faeces andurinewere
carried out accordingto the methods ofAOAC(1980).
Datawere analysedusingthegenerallinear modelofthe
Statistical Analysis System (SAS 1985) software.
Differences between treatments means were detected
with the Duncan's multiple range test.
Resultsanddiscussion
Feedintake,digestibility and liveweightgain valuesare
indicated in Table 2.There were significant (P<005)
differences in DMI based on metabolic weight by
animals fed unsupplemented diets andthose provided
the basal diet supplemented with either SH or CC.
MafwereandMtenga(1992)made similarobservations
that protein supplements of lablab meal in diets
containing 11.36, 1322, 15 and 1673% crude protein
resultedin matterintakesof58.7,648,69.5and720
g/day/kgw" ,respectively.VanSoest(1982)indicated
thatproteinsupplementation tendstoimproveintake by
increasingNsupplytothe rumen microbes.This has a
positive effect in increasing microbial population and
alsoimprovesthe rate ofbreakdown ofdigesta.When
the rate ofbreakdown andpassage ofdigesta increase,
there is a correspondingincrease in feedintake.
The trend of organic-matter (OM) intake was
similar to that of dry-matter intake (DMI).
Organic-matterintakebysheepfedEG onlywas39.70
g/day/kgw** and supplementation with SH andCC
Table2. Feed intake and digestibility by West African Dwarfsheepfed elephant grass and protein supplements.
Treatments
Parameters EG EG-SH EG- CC
Feedintake (g/day)
Drymatter 64076 -28.63 799 40 -13.53 698.33 -2349
Organicmatter 27809-18.80 47006-781 49504 -2302
Crudeprotein 6373 -0,94 73.55+3.03
Feed intake (g/day/kgW°*)
Dry matter 4506386° 71 27- 279*
Organicmatter 3970-340° 5897402° 64.12+2.54"
Crude protein 521+044° 799055* 53+040"
Digestibility (%)
Drymatter 5661- 497" 69.32+207* 7249-t1.59a
Organicmatter 5989458" 71.51+1.90" 7505-163*
Crude protein 6202+4.17* 7779E145° 8230- 124"
EG=elephantgrass; SH=Stylosanthes hay; CC=Concentrate.
Row meanswith different superscripts are significantlydifferent(P<005).
232 Small RuminantResearch NetworkWorkshop

Stylo asprotein supplementforWADsheep
Table3. Nitrogen utilisation byWestAfrican Dwarfsheepfed elephantgrass (EG)and protein supplements ofstylohay(SH) and
concentrate (CC)
Parameters EG EG+SH EG- -CC
N-intake(g/day) 583-0040" 1020-015" 11.76-048*
Faecal-N(g/day) 220-0.15* 228-0.10* 209-023"
Urine-N(g/day) 073-009° 246-009*
Absorbed-N(g/day) 363-0.47° 792-024" 068-028*
Retained-N(g/day) 290-040° 627-012" 722_020"
% absorbed-N 62.26 7765 82.31
% retained-N 4974 4974 61.39
Meansina rowwiththe same lettersuperscriptare notsignificantly different(P>005).
resultedin a significant(P<0.05)increase in intake to
58.97and 64.12 g/day/kgW***, respectively.
Crude-protein intake (CPI) was significantly
(P<005) different between various experimental
treatments. Animals on the controltreatmentconsumed
521gcrude protein/day/kgW"* whereasthose fedSH
andcChad anintake of 799 and953g/day/kgW"*
respectively.
Dry-matter digestibility ofsheep on EG onlywas
5661%.SupplementationoftheforagewithSHandCC
as protein sources significantly (P<005) improved
dry-matter digestibility to 69.32 and 72.49%,
respectively. However, there was no significant
difference in dry-matter digestibility between
treatments receivingprotein supplements. Butterworth
(1985) also reported that dry-matter digestibility was
improvedwhenroughagewas supplementedwith legume
Or COnCentrate.
The trend of organic-matter digestibility was
similartothat ofdry matter.Crude-protein digestibility
was significantly (P<005) different between all the
experimentaltreatments,with the highest digestibility
coefficient recorded for sheepfed theCCsupplement
(82.30%)followed closely bythose fedSH(7759%)
and then thosefedEG(6202%).
Nitrogen intake by sheep fed EG only (553
was significantly(P<005) lowerthan
grasssupplementedwithSHorCCwithintakesof1020
and 11.76 g/day/kgw"* respectively (Table 3).
Faecal-N was statistically similar for all treatments.
Significant(P<005)differenceswere also observedfor
urinary-N, absorbed-N and retained-Nwith sheep fed
SHandCCsupplement,andthesetreatmentswere also
significantly (P<005) higher than the control. When
absorbed-Nwas expressed as a percentage ofN-intake,
the efficiency ofN absorption was 6226,7765 and
8231%,respectively, forsheeponthecontrolration,SH
andCCsupplemented diets. However,when retained-N
was also expressed as a proportion ofN-intake, there
was nosignificant difference between the efficiency of
N-retentionbysheeponSH(61.47%)andCC(61.39%)
supplemented diets, butthese diets were significantly
(P<005)superiorin efficiency ofN-retentionthangrass
alonefedto sheep.
Average weightgains ofsheep maintained on EG
onlywerelow(9g/day)whereasthosefedgrassplusSH
gained60g/day,andthoseonCCsupplement gained78
g/day (Table 4). The differences between these
treatments were significant (P<005).The significant
difference in liveweight gain between the control and
supplementedtreatmentsmaybeattributedtoincreased
crude protein intake. Kay and MacDearmid (1973)
indicated that a dietary crude-protein content of 11%
was ideal for normal weight gain by sheep andgoats.
Fromthisstudy,itis evidentthathigher levels ofdietary
crude protein are required for higher weightgains by
sheep. These resultsagreewith reportsbyMafwereand
Mtenga (1992) who observed that as dietary
crude-protein levelwasincreasedfrom 11.36to 1322,
15 and 1673%, correspondinggrowth rates of34.14,
6565,6801and70.5g/day, respectively, were obtained
forweaned lambs fattened on Chlorisgayana hay and
lablab meal asprotein supplement.
Table 4. Liveweight changes in WestAfrican Dwarfsheepfed elephantgrass(EG) and protein supplements ofstylo hay(SH) and
concentrate(CC)
Parameters EG EG- -SH EG- -CC
Initialweight (kg) 13.20H-1.86 13 96 -1.73 12.60H-1.56
Finalweight(kg) 1386 -1.73 18.10H-1.64 18.04 -1.25
Weight change(kg) 0.66 -0.21 4.18-H073 544 -0.36
Average dailygain (g/day) 9+3° 60+10" 78-5*
Average bodyweight(kg) 13.53+1.79 1603 -1.65 15.32 -1.40
Metabolic weight (kgw**) 704-070 8.00HH061 773+0.54
Meansin the same rowwith the same letter superscript are notsignificantly different(P>005).
Small RuminantResearch NetworkWorkshop 233

Njwe andKona
Conclusion
It maybe concludedfrom this studythatinthe absence
of concentrate, smallholder farmers can provide 200
g/day of stylo hay supplement to yearling lambs to
obtain significantincreases in feed intake, utilisation
andweightgain.
References
AOAC(Association ofOfficial AnalyticalChemists). 1980
Official Methods ofAnalysis. 12th edition. AOAC,
Washington,DC,USA. 1018pp.
Butterworth M.H. 1985. BeefCattle Nutrition and Tropical
Pastures. LongmanGroupLtd., London,UK.500pp.
Ducret G. and Grangaret I. 1986. Quelques Aspects des
Systèmes de Culture en pays Bamileke. Centre
Universitaire de Dschang,Cameroun.33pp.
KayM. and MacDearmid E. 1973.A note on the effects of
changing the concentration of protein in the diet to
fattening beefcattle.AnimalProduction 10:205-207.
Mafwere W.D. and Mtenga L.A. 1992. Lablab (Dolichos
lablab)mealasproteinsupplementfor weanedfattening
lambs. In: ReyB., LebbieSHB.andReynoldsL. (eds),
Small Ruminant Research and Development in Africa.
Proceedings of the First Biennial Conference ofthe
African Small Ruminant Research Network, ILRAD,
Nairobi, Kenya, 10-14 December 1990. ILCA
(International Livestock Centre for Africa), Addis
Ababa,Ethiopia.pp.375-386
MagaveroJ.P. 1986.Typologie deStructure des Exploitations
Agricole de Bafou (Ouest-Cameroun). Centre
Universitaire de Dschang,Cameroun.20pp.
SAS(Statistical AnalysisSystem). 1985.SASUser's Guide.
5th edition. Statistics Institute Inc., Cary, North
Carolina,USA.
VanSoestP.J. 1982.Nutritional Ecology ofthe Ruminant.O
andBBooks Inc.,Corvallis,Oregon,USA.374pp.
Evaluation comparative dufoin destylo(Stylosanthesguianensis)
etd'un concentréutilisés comme complémentsprotéiques chez
des moutons Djallonké recevant une rationà base d'herbe
à éléphant(Pennisetumpurpureum)
Résumé
Une étude a étéeffectuée pourcomparer lavaleur
du foin de stylo (Stylosanthes guianensis) et d'un
concentré comme compléments protéiques pour des
moutonsDjallonké.Troisgroupesd'animauxâgés de 12
à 15 mois et pesant en moyenne 13,20 kg ont été
observés. Ils recevaient de l'herbe à éléphant
(Pennisetumpurpureum)seule ou avecun complément
protéique apportant 27,12 g de protéines brutes par
animal etparjour.Ce complément étaitsousforme de
foin de stylo (200 g/tête/jour) ou de concentré
(140g/tête/jour). Les animaux ont été élevés dans des
cages métaboliques individuelles pendant 70jours.
L'ingestion de matière sèche augmentait de manière
significative(P<005)lorsque l'herbeàéléphant(4506
g/jour/kgde p075 était complémentée avecdufoin de
stylo(66,16g/jour/kgde p075) ou du concentré(71,29
g/jour/kg de P 7s) Cette tendance prévalait avec la
consommation de protéines brutes, de matière sèche
(MS)etla digestibilitédesprotéinesbrutes.Laretention
d'azote alimentaire était similaire, que les animaux
reçoivent dustylo(61,47%) ou duconcentré(61,39%)
Avec le concentré, le gain de poids était de 78g/jour
contre9et60g/jour respectivementpour les animaux
recevant de l'herbeàéléphant seule ou complémentée
avecdustylo.Alors que les concentrés,comptetenu de
leurs coûts élevés, sont hors de la portée des petits
paysans aux ressources limitées, la production de stylo
ne devrait leurposer aucunproblèmeparticulier et leur
permettrait d'obtenir un complément protéique de
bonne qualité capable de guarantir des gains de poids
élevés auxovins enphase de croissance.
234 SmallRuminantResearchNetworkWorkshop

The effect ofsupplements ofcrop residues and
agro-industrial by-products onthegrowthperformance of
Swazigoats
B.H.OgwangandS.K. Karua
University ofSwaziland, P.O. Luyengo, Swaziland
Abstract
Goatproduction in Swazilandis characterisedby low
offtake resulting from lack of management of
rangelands andseasonalfluctuations in feed resources.
Periodic droughts and extensive dry spells in winter
which cause nutritional stress resultin lowproductivity
ofthe goats.The aim ofthe study reported herewasto
assess the growth response in young male Swazigoats
grazed on natural pastures to supplementation with
maize stover,sugar-cane tops and drypineapple pulp.
The major findings from the study were that (a) the
growth rates in goats under natural grazing can be
improved by protein supplementation (b) dried
pineapple pulp has considerablepotential asan energy
feed for goats (c) highergrowth rates can be achieved
by supplementing the pineapple pulp with protein (d)
maizestover and sugar-canetops,intheirpresentform,
have limitedpossibilityfor improvingweightgains in
goats.
Introduction
Goats play avery important role in Swazi custom and
culture aswell asinthe economy(Ogwangetal 1994).
However, goat production is characterised by low
offtake resulting from poor management of the
rangelands and seasonalfluctuationsin feed resources.
Periodic droughts and extensive dry spells in winter
cause severe feed shortages resulting in under
nourishment and low productivity amongthe animals.
Any effort to improve their nutrition could therefore
enhanceproductivity andutility.
The study reported here is the secondphase ofa
research project being conducted under the African
Small RuminantResearch Network onthe use ofcrop
residues andagro-industrialby-productsbysmallholder
farmers in Swaziland.The main objective ofthe study
was to measure the growth response of goats to
supplementationwith maizestover, sugar-canetopsand
driedpineapple pulp.
Methodology
Animalsandtreatment
Atthe start ofthestudy,63indigenous malegoatswere
bought from local farmers and assembled for
acclimatisation at the Universityfarm. Eleven goats
died of heartwater and worm infestations within a
three-week period. The remaining goats were
subsequentlytreated on a monthlybasiswith Deadline
to controlthe heartwater andPanacurto controlworms
and diarrhoea.Nodeaths occurredthereafter.
Out ofthe remaining52goats,48wereselectedfor
theexperimentbasedon ageandweight.Theage range,
based on dentition, was from 14 to 23 months.
Individualgoatweightsvariedfrom 12to29kgatthe
start of the feeding period. The goats were grouped
according to age and weight from which they were
randomly assigned to the treatments indicated in
Table 1.
Table 1.Assignment ofgoats(ingroups of4)to the different
dietarytreatments.
Dietary Levels ofprotein supplement
treatment 0g 80g 160g
Grazing only (4) (4) (4)
Grazing+maize stover (4) (4) (4)
Grazing+sugar-cane tops (4) (4) (4)
Grazing+pineapplepulp (4) (4) (4)
The goats were grazed on natural pastures from
1100to 1600hours afterwhichtheyweregiventhecrop
by-productsandwateradlibitum overnight.Theprotein
supplementwasgiven at0800hours.
Thegoatswereweighedattwo-weekintervals and
intakes of the crop residues and supplement were
monitoredon a regularbasis.
Feed composition
The dominantgrass species grazedwere Hyparrhenia
filipendula, H. dissoluta, Heteropogon contortus,
Eragrostis racemosa, Bothriochloa insculpa and
Brachiaria brizanthawhile the shrub speciesincluded
Acacia nilotica,A. caffra, Terminaliaphanerophlebia,
Melia azedarach, Combretum apiculatum and
Dichrostachys nyassana.The chemical composition of
the grass and shrub species duringthe study period is
presentedinTable2togetherwiththose ofmaizestover
(MS),sugar-cane tops(SCT) and dried pineapple pulp
(DPP).Theproteinsupplementwaspreparedbymixing
Small RuminantResearch NetworkWorkshop 235

ngang and Karua
Table 2. The chemical composition of natural grazing and crop by-products.
Feeds DM (%) CP (% DM) CF (% DM) EE (% DM) Ash (% DM) NFE (% DM)
Grass 95 3.5 31.3 0.7 4.7 59.8
Browse 93 10.7 13.9 — 5.7 -
Maize stover 92 4.2 34.4 2.1 4.4 54.9
Sugar-cane tops 92 4.2 34.3 2.2 6.9 52.4
Pineapple pulp 92 3.4 16.1 1.6 4.2 74.7
DM = dry matter; CP = crude protein; CF = crude fibre; EE = ether extract; NFE : nitrogen-free extract.
a commercial concentrate with yellow maize to give a
high protein concentrate (HPC) mixture with an average
protein content of 26%.
Results and discussion
Daily intakes of MS, SCT and DPP without protein
supplementation and monitored weekly from
mid-September to November 1994 are presented in
Figure l.
The daily intakes of MS and SCT were similar
averaging about 80 g over the eight-week period.
However, intake of DPP was much higher reaching a
peak of 750 g per day in the sixth week. MS and SCT
are known to be low quality roughages which contribute
little to animal production unless subjected to some
physical or chemical treatments. Dried pineapple pulp
appears to be a good source of energy for the goats.
There was no evidence of any dramatic
improvement in intake ofMS and SCT and DPP through
protein supplementation (Figures 2, 3 and 4). At a low
level of protein supplementation, the intakes of MS and
DPP were slightly depressed.
Intake (g/day)
Changes in live weights of the Swazi goats over a
75-day period under different dietary treatments are
presented in Table 3.
High level protein supplementation improved
growth rate in goats grazed on natural pastures only as
well as those fed crop-resides in addition to grazing.
Growth response to protein supplementation was more
remarkable under grazing only and when grazing was
combined with the feeding of DPP. The better improved
growth rates observed in goats grazed on natural
pastures only and those given DPP in addition to grazing
suggest that protein was more limiting in those
circumstances than was the casein animals fed SCT and
MS in addition to grazing (Table l). The DPP could also
have been better utilised because of its low crude fibre
content and high energy potential compared to SCT and
MS.
Conclusions
Growth rates in goats under natural grazing can be
improved if supplemented with adequate protein. It
seems then that under the grazing conditions studied,
protein could be a more limiting factor for goat
800
70° " MS+OHPC
SCT+OHPC
500 __ DPP+OHPC
600 "
400 -- ,I
300 —- . r r o
200
100 '
O i i .
Figure 1. Changes in daily intake ofcrop residues with time.
Weeks
236 Small Ruminant Network Research Workshop

Effect of supplement on growth performance of Swazi goats
Intake (g/day)
140
120
100
80
60
40 ._ —-—- MS+OHPC
........
MS+160gHPC
A I 4r I |
20 -'
O i t
1 2 3 4 5 6 7 8
Weeks
Figure 2. Change in daily intake ofmaize stover with time.
Intake (g/day)
120
100 -
80 "T
60 ~
40 _.__ SCT+OHPC
20 __ ....... a ....... SCT+50 g HPC
0 _ _._ - SCT+1609 HPC
° 1 2 a 4 5 6 7 8
Figure 3. Daily intake in sugar-cane tops with time.
Intake (g/day)
800
700
600
500
400
300 "'
"_ —Q—
100 ....... a ....... OPP-+809 HPC
.- DPP+1609 HPC
O
1 2 3 4 5 6 7 8
Weeks
Figure 4. Changes in daily intake ofdried pineapple pulp with time.
Small Ruminant Research Network Workshop 237

OgwangandKarua
Table3. Changes in live weight ofgoats under different dietary treatments.
Level ofprotein supplement*
0g 80g 160g
AWC(kg) ADG(g) AWC(g) ADG(g) AWC(kg) ADG(g)
Grazingonly 4.9 65.3 4.7 62.7 6.1 81.3
Grazing+maize stover 2.4 32.0 27 360 3.5 477
Grazing+sugar-cane tops 2.5 33.3 3.1 41.3 3.6 48.0
Grazing+pineapplepulp 4.5 600 6.1 81.3 6.3 840
*AWC=averageweightchange;ADG=average dietarygain.
production than energy. There is therefore a need to Reference
explore cheap and easily available protein sources.
Whenprotein is available,the energy requirement can
be further supplemented with DPP. Maize and
sugar-canetopshave limited possibilitiesforimproving
weight gainsingoatsunlesssubjectedtosome physical
or chemicaltreatments.
OgwangB.H.,MavimbelaD., VilakatiR. andKhumaloGZ
1994. Socio-economic aspects of goat nutrition in
Swaziland. In: Lebbie S.H.B.,ReyB. and Irungu E.K.
(eds), Small Ruminant Research and Development in
Africa. Proceedings oftheSecondBiennial Conference
oftheAfricanSmallRuminantResearchNetwork,AICC
Arusha, Tanzania, 7-1 1 December 1992. ILCA
(International Livestock Centre for Africa)/CTA
(Technical Centre for Agricultural and Rural
Cooperation). ILCA,AddisAbaba,Ethiopia. pp.15-18.
Effet d'une complémentation de résidus de récoltes et de
sous-produitsagro-industriels sur lesperformancesde croissance
des caprinsSwazi
Résumé
L'élevage caprin est caractérisé au Swazilandpar
une faible production, due à la mauvaise gestion des
parcours etauxfluctuationssaisonnières des ressources
alimentaires dubétail.Les sécheressespériodiques etles
longues périodes sèches l'hiver entraînent des stress
nutritionnels nuisiblesà la productivité des caprins. La
présente étude vise à évaluer la croissance de jeunes
boucs Swazi élevés sur pâturages naturels complé
mentésavecdufoin detiges de maïs,deboutsblancsde
canne à sucre et de pulpes d'ananas séchées. Il ressort
des résultats enregistrés que a) la complémentation
protéique améliore la croissance des caprins élevés sur
pâturages naturels; b) les pulpes séchées d'ananas
constituentune excellente source potentielle d'énergie
pour les caprins; c) la complémentation protéique des
pulpes d'ananas accélère la croissance des animaux; et
d)sous leurforme actuelle, les tiges de maïs et lesbouts
blancs de canneàsucre n'ont qu'un effet limité sur la
croissance des caprins.
238 SmallRuminantNetworkResearchWorkshop

Species abundance,food preference and nutritivevalue of
goat dietsinthesemi-arid lands ofeast-centralKenya
N.K. Osolo,J.N. Kinuthia,C.K. Gachuiri,A.M. Okeyo,
M.M.Wanyoike andM. Okomo
University ofNairobi, Faculty ofVeterinary Medicine,P.O.Box29053, Nairobi, Kenya
Abstract
The key forage species and nutrient composition of
forage species preferred by free-ranging East African
goats in rangelands of eastern-central Kenya were
determined.One hundred andfive forage specieswere
identifiedincluding30tree,29shrub,20grass and25
forb species. Shrubs and short trees were the most
preferredforagespecies andthusformedthebulkofthe
goat diets. Ironicallythe forage species mostpreferred
bythegoatswerenot necessarilythe mostabundanton
the ground, indicating that ease of accessibility and
palatabilitymaybeimportantdeterminantsforchoice of
a forage specie.Thatgrasses and forbs were the least
preferred could be largely explained bythe fact that
goats are naturallybrowsers.
Introduction
Raisingoflivestockbypastoralists, agro-pastoralists or
commercial ranchers is the single most important
economic activity in the arid and semi-arid lands
(ASAL) of Kenya. Over two-thirds of Kenya
(approximately492,100 km*) is classified as ASAL.
Morethan halfofthis area receives lessthan370mm of
variable rainfall annuallyandisfurther characterisedby
variabilityinpasture andwateravailability. Duringthe
peak ofthe rainy season, feed resources available to
animalsarehighin qualityandquantity andanimalsgain
weightfairlyfast.Conversely, atthe peak ofdryspell,
available forage resources are too low in quality and
quantity and animals inevitably lose weight. Important
domestic animalsinASALinclude, cattle,sheep,goats
and camels.
Recentincreases in the human population due to
better living standards, have been accompanied by
increases in total livestock numbers in the ASAL,
especially among pastoralists who, to a large extent,
dependon these animalsfortheir subsistence. Increase
in human population in high potential areas has also
resultedin migration ofpeopletotheASALinsearch of
arable land. In addition, among the indigenous
communities, there is a growing tendency towards a
more cash-oriented economy as evidenced by
subdivision of communal lands into small individual
parcels andacquisition of title deeds.Thus,families are
increasingly becomingsedentary,buton landunits too
small to meet their food needs. There is therefore
overstocking resultingin range degradation especially
around settlements andcultivatedareas.
Even with individualisation of land ownership,
diminishing household land units and the terminal
breakdown oftraditional communal grazing systems,
livestockproduction remainsthe mainstream economic
activity for these areas. In order to make meaningful
recommendations to land owners on proper manag
ement ofthese lands, especially under the currently
emerging land use/ownership paradigms, range
managers oughtto have a thorough knowledge ofthe
most suitable kinds of animals, their nutrient
requirements, forage preferences and quality of
available forage.
Information onfoodhabits ofpastorallivestockin
the EastAfricanASALis scarce. Livestockselecttheir
diet from a complex mixture ofplant species and/or
plant parts(Arnold 1960;Arnold 1962).Whyananimal
selectsone plantandnot anotheris stillapuzzle.Choice
varieswidely andseemsto dependon availability. Diet
selection may modifythe species composition ofthe
pastures in the long run(Illius 1986)withthepotential
danger of lowering the quality ofthe diet. Continued
grazing pressure increases the number ofunpreferred
plant species at the expense ofthe preferred species
(Tadingar,personalcommunication, 1984).Duetowide
temporal and spatial variationin forage preference and
nutrientcomposition ofdiets selectedbydifferentkinds
of ruminants, research information generated from a
given area and kind or class of animals, has limited
inference (space)andshould notbe appliedtotoowide
an area. It is therefore, importantto establish localfood
habits and nutrient composition data bases for the
various types of domestic and wild animals utilising
particular range types.
The mainpurpose ofthis studywasto determine
the keyforagespecies and nutrient composition ofdiets
selected by free-ranging East African goats in
rangelands ofeastern-central, Kenya.
Materials and methods
Study area andprocedures
The studywasconducted atthe University ofNairobi's
Machang'aFieldStation situatedapproximately150km
eastofNairobiand nexttoKamburuDamonthe eastern
Small RuminantResearch NetworkWorkshop 239

Osolo et al
bank ofupperTana river.The station is approximately
500 ha in area and lies at 1"S latitude,37'E longitude
and about 700 m altitude. However, the study was
limited to a 20ha area frontingthe Embu-Kitui main
road.The areagently rises from the Kamburu Dam to
thetop ofthe ridge.
The meanannual rainfallis 650mmcomingintwo
seasons-MarchthroughMay,short rainyseason and
October through December, long rains. Soils on the
station are developed from undifferentiated types of
gneisses ofBasementSystem.They are well drained,
shallow,darkredtoyellowish red,stonyloamysand to
clay(KenyaSoilSurvey, Misc. Soil PaperM 19,2nd
impr.Nairobi 1979).Machang'avegetationisdescribed
as bushed shortgrass savannah with buffel grass
(Cenchrus ciliaris) and horsetail grass (Chloris
roxburghiana) predominant. Saltbush is a common
palatable shrub suitable for re-establishingpasture on
overgrazed and erodedplaces (East African Livestock
Survey Atlas, 1967). Recommended stockingis about
three hectaresper livestockunit(LU).
Species composition and relative
abundance
At the beginning of the November/December wet
(green) season of 1993, botanical composition and
relative abundance ofbothherbaceous andwoodyplant
species layerswere determined.Thisinvolvedthe use
oflineinterceptmethod,where 10transects, 100mlong
by 200 m apart, were laid across the slope and all
herbaceous plant species intercepted by the tape
identified. Herbaceous layerdeterminationinvolvedthe
quadrat method,where ten 1 m* quadratswere laid at
equal intervals along each transect. Each quadratwas
furthersubdividedintofourquarters and differentplant
speciesoccurringin eachquarter identified, enumerated
and recorded. Fortrees and shrubs above2m high, 10
m x 10 m quadrats were used and different species
occuring within each quadrat identified, counted and
recorded.The relative abundanceforeachplant species
wascalculated asfollows :
Number of times spAoccurredRelative abundance ofspA= No oftimes all sp occurred
To convert number ofplants per m* into number
ofplants perha, thedensityvalue is multipliedby10000
IIl .
Number of bites andtimespent on
individual species
The method usedto study forage preference involved
close observation ofrandomlyselected animals(one at
a time) astheygrazedwith the others.Abase flock of
45EastAfricangoatswasusedfromwhich one animal
wasselectedforthe bite count study.The selectedgoat
wascloselyfollowedand observedbytwo enumerators
whorecordedthe numberofbites andtimespentoneach
plant species as thegoatgrazed orbrowsed. Abitewas
taken asthe act ofbreaking offorpickingupapiece of
forage.The time spentby the animal feeding on one
individual plant without walking one full step was
estimated in seconds and recorded. The animal was
observedfor30minutesbeginningat0930hours.
The flock was grazed in different areas and a
different goatwasrandomlyselectedfor observation so
thatdifferentgoatswereusedonthefivegrazingunits.
The five goats selected duringthe first roundofgrazing
rotation qualified as experimental animals for
subsequent replicates.This observation procedurewas
repeated for as long as therewas no noticeable change
in the vegetation, i.e. until the rains began ifit was a
dry-seasongrazing,oruntilthe dryseasonsetinifitwas
green-seasongrazing.
Forage digestibility and chemical
composition
Plantmaterialrepresentative ofthatselectedbythe goats
washand-clipped,sundriedforthree daysandthen oven
driedat40'Cforfourdays.Thedryforage sampleswere
ground in a Wiley Mill using a 1 mm screen. The
materialwas later chemically analysedforNDF,ADF
(VanSoest andWine 1967);NP,Ca,Mg,K,Na,Zn,
Cu,andFe (AOAC1975). Digestibilityestimatesusing
thenylon-bagtechnique(ôrskovetal 1980)for48hours
incubationwas also conducted.
Results and discussion
Vegetation: Botanical composition
Tables 1a andbgive an inventory ofihe plant species
occurring in the study area, and their relative density
(plants/ha). One hundred and five plant species were
identified comprising,30trees,29 shrubs,20grasses
and25forbs.Sincethesurveywasconductedsoon after
the onset ofthe short rains, a large number oftree and
shrubseedlingswas observed.
The most dominanttree species within the study
area was Acacia brevispica. Others included
Combretum zeheri, Commiphora riparia, Terminalia
brownii, Grewia villosa, Acacia nilotica, Boswelia sp,
Lannea flocesca and Commiphora boviniana in that
order. The most dominant shrub was Hermania
alhiensis.Others,in order ofimportance,were Grewia
bicolor, Gnidia latifolia, Premna hilderbrandtii,
Dichrostachys cinerea, Acalypha fruticosa and
Maytenus putherlickioides. Of the grasses, annuals
dominated the site due totheiroppotunistic nature.The
most dominant grass species was Aristida keniensis,
followed by Eragrostis caespitosa and Latipes
senegalense.Mostoftheperennialgrasseshadnotcome
up.Amongthe forbs, Ocimum spwas most dominant,
followed by Rhoicissus tridentata, Pentas sp,
Stylosanthes aspera andAcanthospernum hispidum.
240 Small RuminantResearchNetworkWorkshop

Goat diets in thesemi-arid lands of east-centralKenya
Table 1a. Averageplant population density(plants/ha) oftrees and shrubs in the study area.
Trees Plants/ha Shrubs Plants/ha
Acacia etbaica 10 Withaniasomnifera 10
Acacia brevispica 65 Triumfetta sp 40
Lanneatriphylla 35 Grewia bicolor 80
Combretum molle 35 Sida ovata 45
Walbergiasp 10 Combretum aculeatum 45
Grewia villosa 40 Premnahilderbrandtii 75
Acacia nilotica 40 Indogofera schimperii 15
Acaciamellifera 20 Indigofera lupatana 5
Commiphora riparia 50 Acalyphafruticosa 70
Bosweliasp 40 Grewiasimilis 35
Commiphora africana 35 Hibiscus calyphylla 15
Zanthoxylum chalybea 5 Aspangus racenosus 40
Terminalia brownii 50 Hermania alhiensis 220
Acacia tortilis 5 Ormocarpum trichocarpa 50
Combretum zeheri 55 Cassia singueana 15
Acacia hockii 25 Dichrostachys cinerea 75
Steganotaenia araliaceae 5 Thumbergia holstii 10
Ochnainermis 10 Tephrosia villosa 20
Albizia amara 10 Ipomoea kituensis 5
Lanneafloccosa 40 Maytenusputherlickioides 70
Commiphora boviniana 40 Ormocarpum kirkii 5
Commiphora campestris 10 Gnidia latifolia 80
Terminaliaspinosa 5 Hoslundia opposita 25
Dalbergiamelanoxylon 10 Indigofera clifordiana 15
Euphobia nyikae 25 Crotolaria gooformis 40
Commiphora schimperii 5 Croton dichogamus 5
Makhamiasp 15 Rutyafruticosa 5
Entadaabyssinia 5 Hibiscus micranthus 20
Lonchocarpussp 10 Zimania americana 5
Cordia gharaf 5
Table 1b. Averageplantpopulation density (plants/ha)ofgrasses andforbs in the study area.
Grasses Plants/ha Forbs Plants/ha
Setaria verticilata t* Rhoicissus trindentata 5
Dactyloctenium aegyptica 2 Ocimum sp 80
Brachiaria reptans 1 Pentas sp 5
Aristida keniensis 6 Stylosanthesfruiticosa 5
Enteropogon macrostachys 2 Achranthes aspera 3
Eragrostis superba 1 Solanum incanum 3
Chloris virgata t Alterntherapungens 2
Eragrostis caespitosa 3 Acanthospernum hispidum 4
Latipessenegalense 3 Commelinabenglhelensis t
Heteropogon controtus t Tribulusterestris 1
Michrochloa kunthii 2 Pupalia lappaceae 1
Themedatriandra t Convolvulusfavinosus 1
Digitariamacroblephera 2 Oxygonum sinuatum t
Chlorisroxburghiana t Indigoferaspicata t
Digitariagazensis 1 Ocimum bacilicum 1
Latipes senegalenses t Tephrosiapumila t
Aristida adoensis 1 Blepharishildebrandtii t
Digitariafalutina 1 Phyllanthus maderaspatens t
Tragus berteronianus 1 Barleriaproxima t
Rhynchelitrum roseum t Asystasiaschimperi t
Aristida sp t Hibiscus micranthus t
Rhoicissus triandenta t
Zornia glachidiata 1
Bidenspillosa 1
tIpomoea oenothrae
*t=trace amounts(<005plants/ha).
Small RuminantResearch NetworkWorkshop 241

Osolo et al
Foragepreference
Shrubs and shorttreeswere the mostpreferred forage
plants and hence formed the bulk ofthe goat diets
(Table 2). The five most preferred shrubs were
Maytenus putterlickioides, Premna hilderbrandtii,
Hoslundia opposita, Dichrostachys cinerea and
Combretum aculeatum in that order. However, these
plants were not the most abundant on the ground
suggesting that the plants/grazable plant parts were
possibly both more accessible and palatable and
therefore moreseriouslysought afterbythegoats.Only
Premna sp showed a close relationship between its
relative preference and its abundance on theground-
third andsecond, respectively.
Table2. Mean number ofbites and time(in seconds)spenton
variousforage species within the study area.
Among the trees, Ochna inermis and Acacia sp
were the two most preferred plants. Ochna inermis
ranked second to the most preferred shrub, Maytenus
putterlickioides. Ochna sp, however, ranked low in
availability on theground.Grasses andforbswere least
preferredwhichisbecausegoatsare naturallybrowsers,
andthese plantswere least abundant on the studyarea.
Table3representscorrelationandregression ofthe
number ofbites (preference) on nutrient components
(ADF, NDF, IVDMD, N, P, and Na). There was a
positive andsignificant correlationbetweenADF,Nand
Nawithnumberofbites;Pshowedasignificantnegative
correlation.
ADF,Nand Nahad a significant positive causal
(regression coefficient) effect on preference. NDF,
IVDMD and Phad no significant causal relationship
with preference although P and digestibility had
insignificantnegative regressioncoefficients (-1.83and
-0.12, respectively) on preference. It can therefore be
concluded that the different plant species were more
preferred due to relative contents ofADF,N or Na and
less preferredduetorelative Pcontents(Tables3and4).
A multiple regression analysis showed that the
mostimportant components thatinfluencedpreference
in this studywereN(055), andP(-3.16). NDF(025)
and ADF (023) were less important due to large
standard errors associated with the estimates.
Conversely, although the partial regression coefficients
of digestibility (-0.13) and phosphorus (-3.16)were
negative the estimates were insignificant due to large
standard errors.Workiscontinuinginthis areaandwith
more data, a clearerpicture ofthese relationships will
become evident since it is possible that other
components ofthe diets such as saponins andtannins
thatwere notconsideredinthisstudy couldhaveplayed
a major role in determining the relative dietary
preference.
References
AOAC (Association of Official Analytical Chemists). 1975.
Official Methods of Analysis. 12th edition. AOAC,
Washington,DC,USA.
ArnoldGW. 1960. Selectivegrazingby sheep oftwoforage
species atdifferentstagesofgrowth.Australian.Journal
ofAgricultural Research 11:1027-1033.
Mean
number of Mean
Foragespecies bites time spent
Maytenusputterlickioides(s*) 31 44
Ochna inermist(t) 24 36
Premnahildebrandtii(s) 23 30
Hoslundia opposita(s) 21 31
Dichrostachyus cinereas (s) 18 24
Combretum aculeatums(s) 18 20
Acacia hockii(t) 15 19
Grewiabicolor(s) 14 22
Acaciamellifera(t) 14 17
Thumbergia holstii(s) 13 16
Acalyphafruticosa(s) 13 16
Barleriaproxima(g)f 13 18
Combretum molle (t) 11 20
Ocimumspp(f) 10 13
Grass(bulked) 8 10
Boswelia hilderbrandtii(t) 7 10
Hermania alhiensis(s) 4 11
*s= shrubs,t=tree,g=grass,f=forb.
Table3. The correlation and regression coefficients between plant species preference and nutrient components.
Correlation Simple regression Partial (multiple regression
Nutrient component coefficient coefficient coefficient)
ADF(%)* 0.3400 0.35(027) -0.23(059)
NDF(%) 00001 0.16(021) 025(049)
IVDMD(%) -0.2700 -0.12(0.11) -0.13(0.21)
Nitrogen (N) 0.3000 0.30(029) 055(041)
Phosphorus (P) -00500 -1.83(1.83) -3.16(428)
Sodium(Na) 0.3400 034(003) 006(003)
*ADF=acid-detergentfibre;NDF=neutral-detergent fibre;IVDMD=in vitro dry-matter digestibility.
242Small RuminantResearch NetworkWorkshop

Goat dietsinthesemi-arid lands of east-centralKenya
Table4. Nutritive value ofsome oftheforage plantspreferred bygoats at Machang'a.
ADF ADF Ca Mg K Na Zn
Plant species % (g/kg) % (mg/kg) (mg/kg) (mg/kg) p N
Premnahildebrandtii 2673 3580 8.15 1.6 157 272 67 2.3 23.4
Grass(bulked) 27 96 3558 4.5 1.8 17.1 1 16 34 2.5 14.6
Indigofera spicata 28.98 35.53 55.3 6.2 13.3 61 32 - -
Acacia ataxanthe 23 63 36 90 200 3.8 76 75 54 - -
Bosweliahilderbrandtii 3043 42 97 1 7 6.8 76 95 54 1.0 10.8
Aspiilia mossambiscensis 30.43 42 97 32.1 4.3 24.9 48 64 1.6 29.8
Maytenusputterlickioides 38 97 46,89 155 46 7 5 163 31 0.8 18.2
Combretum sp(bulk) 30 93 36 92 8.2 3.1 10.4 48 26 3.0 21.0
Crotolaria goodformis 2039 36.14 10.3 2.5 17.6 34 64 - -
Acacia hockii 22.21 36.21 11.2 1 9 87 - 28 08 13.3
Tephrosiavillosa 35.48 53 28 11.4 2.5 10.4 55 41 - -
Uchna inermis 34 96 55 91 19.8 3.4 4 9 20 23 0.8 25.1
Dichrostachys cineria 44.24 55.10 12.2 2.8 72 109 25 -- -
Grewia bicolor 36.50 59 92 19.8 3 9 11.5 41 20 2.0 21 9
Stephania abyssinica 31.25 49.20 11 7 2.5 20.5 41 50 - -
Lantana camara 24.62 56.49 197 6.7 18.8 48 38 - -
Dalbergia melanoxylon 38.15 67 47 14.7 29 14.5 82 12 - -
Acaciamellifera 28.06 51 71 17 6 3.6 12.6 129 28 2.8 27.6
Acacia tortilis 46.44 5239 12.8 29 12.6 88 24 - -
Combretum aculeatum 27.64 48.21 15.1 2.3 11.5 82 73 3.0 21.0
Ocimum sp 28.15 44.53 16.1 4.6 21.6 55 61 1.8 25 9
Barleriaproxima 39.63 53 93 39.5 5 9 10.1 109 35 1.8 20.5
ADF=acid-detergentfibre.
ArnoldGW.1962 Factorswithinplant association affecting
the behavior and performance ofgrazing animals. In:
Crisp D.J. (ed), Grazing in Marine and Terrestrial
Environments.pp. 133-184.
Foragebehaviorand dietselection. In:GudmundssonO.(ed),
GrazingResearch atNorthern Latitudes. Plenum Press,
NewYork,USA.
OrskovE.R., De Hovell F.D. andMouldF. 1980.The use of
the nylonbagtechnique forthe evaluation offeedstuffs.
TropicalAnimalProduction 5:195-213.
Abondance des espèces,préférences alimentaires etvaleur
nutritive des rations des chèvres desterres semi-arides du
centre-estdu Kenya
Résumé
Les principales espèces fourragères et la
composition nutritive desplantespréférées deschèvres
d'Afrique de l'Est enparcours libre sur lespâturages du
centre-est du Kenya ont été déterminées. Cent cinq
espèces fourragères ont été identifiées, y compris
30 arbres,29 arbrisseaux,20graminées et25 espèces
herbacées non graminéennes. Les arbrisseaux et les
arbres de petite taille étaient les plantes préférées des
chèvres et constituaient par conséquent l'essentiel de
leur ration. Curieusement, les espèces préférées
n'étaientpas nécessairement lesplus abondantes,ce qui
indiqueque lafacilitéd'accèset l'appétibilitépourraient
être d'importants déterminants du choix des animaux.
Le peu de faveur dontjouissaient les graminées et les
autres espèces herbacées pourrait s'expliquer par la
préférence naturelle des caprinspour les ligneux.
Small RuminantResearchNetworkWorkshop 243


SESSION5
Performance and Reproduction

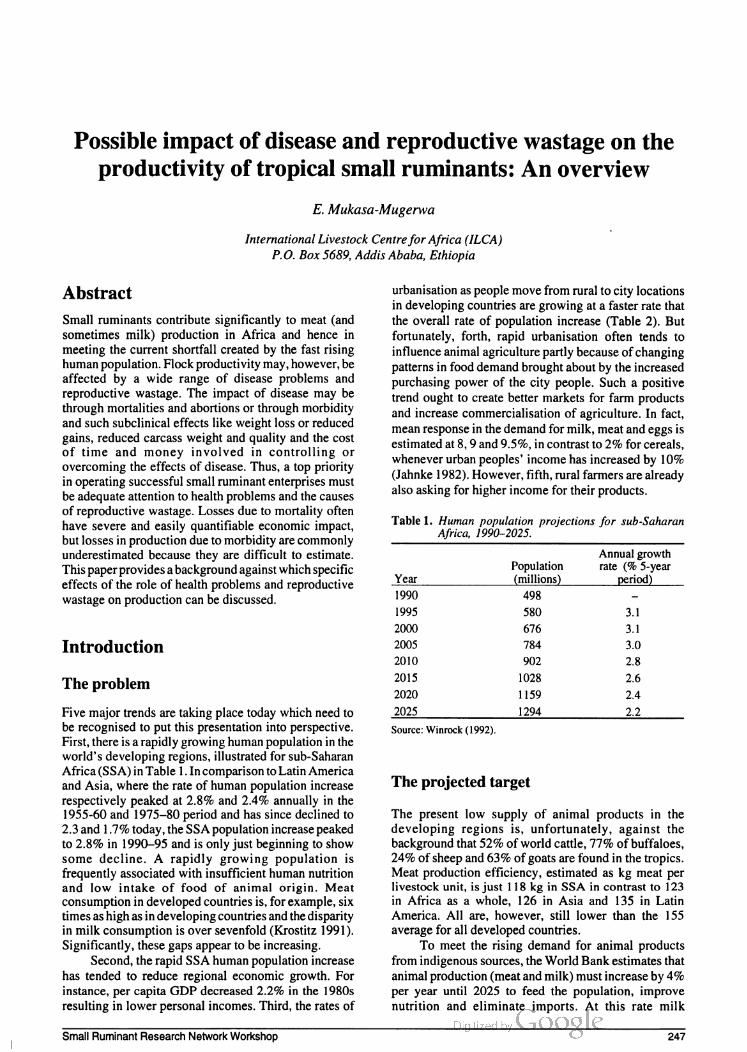
Possibleimpact ofdisease and reproductivewastage onthe
productivity oftropicalSmall ruminants:An overview
E.Mukasa-Mugerwa
International LivestockCentreforAfrica(ILCA)
PO. Box5689,AddisAbaba, Ethiopia
Abstract
Small ruminants contribute significantly to meat (and
sometimes milk) production in Africa and hence in
meetingthe current shortfall createdbythe fast rising
humanpopulation. Flockproductivitymay,however,be
affected by a wide range of disease problems and
reproductive wastage. The impact of disease may be
through mortalities and abortions or through morbidity
andsuch subclinical effects likeweight loss or reduced
gains, reduced carcass weight and quality and the cost
of time and money involved in controlling or
overcomingthe effects ofdisease.Thus, a top priority
in operatingsuccessfulsmall ruminantenterprises must
be adequate attention tohealthproblemsand the causes
of reproductive wastage. Losses dueto mortality often
have severe and easily quantifiable economic impact,
butlossesinproduction dueto morbidityarecommonly
underestimated because they are difficult to estimate.
This paperprovidesabackgroundagainstwhichspecific
effects ofthe role ofhealth problems and reproductive
wastage onproduction canbe discussed.
Introduction
Theproblem
Five majortrends are takingplace todaywhich needto
be recognised toputthis presentationinto perspective.
First, thereis arapidlygrowinghumanpopulationinthe
world's developingregions, illustratedfor sub-Saharan
Africa(SSA)inTable 1. IncomparisontoLatinAmerica
andAsia,where the rate ofhumanpopulation increase
respectivelypeaked at28% and24% annuallyin the
1955-60and 1975-80period andhas since declinedto
23and1.7%today,theSSApopulationincreasepeaked
to2.8%in 1990-95andis onlyjustbeginningtoshow
some decline. A rapidly growing population is
frequently associatedwithinsufficienthuman nutrition
and low intake of food of animal origin. Meat
consumptionin developedcountries is,forexample, six
timesashighasindevelopingcountriesandthe disparity
in milk consumption is oversevenfold(Krostitz 1991).
Significantly,these gaps appeartobe increasing.
Second,the rapidSSAhumanpopulationincrease
has tended to reduce regional economic growth. For
instance,per capitaGDP decreased2.2% in the 1980s
resultingin lowerpersonalincomes.Third,the rates of
urbanisation as peoplemovefrom ruraltocitylocations
in developing countries aregrowing at afaster rate that
the overall rate ofpopulation increase (Table 2). But
fortunately, forth, rapid urbanisation often tends to
influence animal agriculturepartlybecause ofchanging
patternsin fooddemandbrought aboutbytheincreased
purchasingpower ofthe city people. Such a positive
trend oughtto create better markets for farmproducts
and increase commercialisation of agriculture. In fact,
meanresponse inthedemandfor milk, meatandeggsis
estimated at8,9and9.5%,in contrastto2%forcereals,
wheneverurban peoples'income hasincreasedby10%
(Jahnke 1982). However, fifth, ruralfarmersare already
also askingforhigherincomefortheirproducts.
Table 1. Human population projections for sub-Saharan
Africa, 1990-2025
Annualgrowth
Population rate (%5-year
Year (millions) period)
1990 498 -
1995 580 3.1
2000 676 3.1
2005 784 3.0
2010 902 2.8
2015 1028 2.6
2020 1159 2.4
2025 1294 2.2
Source:Winrock(1992).
Theprojected target
The present low supply of animal products in the
developing regions is, unfortunately, against the
backgroundthat52% ofworld cattle,77%ofbuffaloes,
24% ofsheepand63%ofgoatsare foundinthe tropics.
Meatproduction efficiency, estimated as kg meat per
livestockunit,isjust 118kginSSAin contrast to 123
in Africa as a whole, 126 in Asia and 135 in Latin
America. All are, however, still lower than the 155
averagefor alldeveloped countries.
To meetthe rising demand for animal products
fromindigenoussources,theWorldBankestimatesthat
animalproduction(meatand milk)mustincrease by4%
per year until 2025 to feed the population, improve
nutrition and eliminate imports. At this rate milk
Small RuminantResearchNetworkWorkshop 247

Mukasa-Mugerwa
productionwould reach 19milliontonnes andcowand
goat milk 43 million tonnes. Ruminant livestock,
includingsmall ruminants, are expected to accountfor
60% ofthe expected increase in meatproduction and
almost all ofthe milk.The rest ofthe meat will come
from poultry and pigs.Currently, about66million sheep
and55 milliongoats are slaughtered annuallyfor meat
in Africa from respective populations of206 and 171
millions.About57% ofthe sheepand65% ofthegoats
inSSAarefoundinthe arid/semi-arid agro-ecozone,22
and26%, respectively, inthehumid/subhumidecozone
and 21 and9%, respectively, in the highlands (ILCA
1987).The most rapidlivestockpopulationgrowth rate
of 22% is taking place in the subhumid/semi-arid
ecozone,followed by 1.0% in the highlands andjust
0.2%in the arid areas.
Technical constraintstoproduction
Ruminant livestock are primarily raised under
traditional systems characterised by lowinputs.These
systemscannotproduce theincreasedamounts ofcrop
and livestock products for the projected increases in
human population. It is estimatedthatunless steps are
taken to address major technical constraints to
production and if current use of inputs remain
unchanged, the land area required to support the
populationbytheyear2010wouldhavetobeexpanded
by morethan 100millionha,or5%(FAO1986).
Table2. The rate ofurbanisation as per cent ofthe total
population in sub-Saharan Africa, 1960-2025
Year % urban
1960 11.8
1965 137
197O 15.9
1975 18.8
1980 22.0
1985 25.4
1990 290
2000 36.3
2010 43.5
2025 54.2
Source:Winrock(1992).
Majortechnicalconstraints tolivestockproduction
include inadequate feed supply, poor animal health,
low-yielding animal genotypes and minimal levels of
management. In particular, the need for increased
humanfoodand cash cropproductionin the tropics has
reducedthe size ofgrazinglands and landforintensive
fodder production. This has made nutrition a major
constraint to livestock production. Undernutrition
furtherincreasesthe riskto animals ofdisease.
Temperate ruminant animals are adapted to feed
sources ofrelatively high fibre contentbut sufficiently
unlignifiedtoprovide most dietary energyin the form
of cellulosic carbohydrates. In these modern
management regimes animals have access to well
balanced arrays ofnutrients,andthe level ofproduction
is largely determined byintake levels. But this is not
necessarilysoamongtropicalanimals.Tropicalpastures
and/or crop residues are often deficient in essential
nutrients particularly trace elements and nitrogen
neededbyrumen microbes for efficientgrowth(Leng
1990). It is alsopossiblethatalowproteintenergy ratio
that results from this translates into a high heat
increment in the rumen and high metabolic heat
production in the body,which at times interacts with
climatetoproduceheat stresswhichinturnreducesfeed
intake.Overall reproduction and productivity are thus
further compromised. Inability to feed animals
adequately throughout the year is the most important
technical constraintformosttraditionalanimalfarmers.
And, feed availability and cost will be the major
determiningfactorastowhetherthe4%annualincrease
targetinproduction canbe met.
Disease constraints ofsmall
ruminants
Althoughindigenousbreedsofgoatsandsheeparefairly
well adaptedto the tropical environments,the majority
of animals are raised traditionally under extensive
free-roamingmanagementsystemswith no specialised
inputintohousingcare, nutrition ordisease treatmentor
prevention.Asmallpercentage ofanimalsare,however,
raised intensively, sometimes even under a
cut-and-carrysystem ofmanagement. Here,animalsare
afforded better shelter, nutrition and health care and
often achieve higherproductivity.The type andimpact
of diseases on production varies with the level of
management.
Common diseases
Table3 lists the more important and common diseases
of small ruminants by etiological agent. Diseases
significantly reduce animalproductivity irrespective of
ecologicalzone.
Contagious caprinepleuropneumonia(CCPP)and
peste despetits ruminants(PPR) arewidely distributed
diseases which unless properly controlled, can limit
animalproduction overwide areas. Parasitic andviral
infections are mainly vector transmitted and their
prevalence is therefore largely influenced by the
environment.Noeffectivevaccine orchemotherapeutic
control methodis currently available for most ofthese
ailments. Itis estimatedthatSSA'sannual losses due to
mortality alone may be equivalentto2 billion dollars
with aboutthat sameamountdueto lossesin morbidity.
248 SmallRuminantResearch NetworkWorkshop

Disease and reproductive wastage in small ruminants
Table3. Some common diseases ofsheep and goats.
Infectious Broncho-pneumonia,contagious
caprine pleuropneumonia (CCPP),
caseous lymphadenitis,contagious
ecthyma,enteritis,peste des petits
ruminants
Parasitic Coccidiosis,helminthiasis,mange,
trypanosomiasis, tick-bornedisease
Nutritional Energy andprotein deficiencies
Reproductive Abortions, metritis,perinatal mortality,
stillbirths, mastitis
Traumatic Hernias,fractures
Parasiticinfestations
Some studies have noted that the extensive grazing
systemofmanagementfor mostsheepandgoats, results
in animal faeces being deposited widely which
significantly reduces the chances ofinfectionwith third
stage larvae (ILCA 1979). This would support the
observation by Smith et al (1986) that despite being
irregularlydrenched, parasitic gastro-enteritis(PGE)in
goats was negligible and clinically unimportant in
housed goats maintained on slatted floors. However,
otherinvestigationshavefoundahighincidenceofPGE
among roaming animals (Adeoye 1985; Ndamukong
1985).
Haemonchus contortus is the most important
species ofhelminth parasites responsible for PGEin
most ecozones exceptthe coolhighlands. Itcauses high
mortalityparticularlyamongyounganimals in the wet
season. Other species include Ostertagia, Tricho
strongylus, Cooperia, Nematodirus and
Oesophagostomum.
Coccidial oocytes are common in the faeces of
grazing animals but clinical cases are more
overshadowedbyhelminthiasis.Mortalityrates ofupto
6%have been observedin confinedgoats(Otesile et al
1983).
Literature reports are available ofsmall ruminant
infection from Babesia motasi, Anaplasma ovis, A.
marginale, Trypanosoma vivax and T. congolense
(Sadiq1985;Smith et al 1986;Opasina 1987).Thereis,
however,nodefiniteassociationbetweentheserological
demonstrations ofthese infections andclinical disease.
On the other hand the mange mite (Sarcoptes,
Chorioptes andPsoroptesspp)is common,sometimes
with incidence of24 to over 80% even for roaming
animals(Akinboade 1982;Adeoye 1985).With regular
washingthis maybe reducedto under5%(Smith et al
1986).
Bacterial and mycoplasmal diseases
Pneumoniais easilythe mostimportantbacterialhealth
problem to small ruminant production, being
responsiblefor6to31%ofmorbidityrates(Ndamukong
1985; Njau et al 1988). In addition to verminous
pneumonia caused by lung worms, micro-organisms
commonly associatedwith small ruminantpneumonia
are: Mycoplasma mycoides, Pasteurella multocida,
Streptococcus spp, Staphylococcus aureus and
Corynebacteriumpyogens.
Gastro-enteritis is a fairly common ailment of
goatsandsheep.The extenttowhichthis is attributable
to bacteria is, however, difficult to ascertain. This is
because enteritis is also commonly associated with
helminthiasisanddieteticdiarrhoea.Theothercondition
that can be mentioned is Caseous lymphadenitiswhich
may have a morbidity rate of13to 18% especiallyin
confined goats (Addo 1982; Smith and van Houtert
1988). It tendsto have low mortality.
Viral diseases
Thetwomostcommonviraldiseasesofsmallruminants
are contagious ecthyma (Orf) and peste des petits
ruminants (PPR)with morbidity rates of50to 100%.
Mortality rates are often highforPPRbutlowforOrf
Metabolic disorders
Metabolic disturbances like pregnancy toxaemia,
mineraldeficiencies and rickets have occasionallybeen
observed.Theyaremorelikely tooccuramongconfined
institutionalflockswith limited regard toproper house
design,emphasisingthe role ofmanagementsystemand
level on the spectrum and impact of diseases on
production.
Effects ofdisease oninputs
The effects ofdisease oninputs revolve aroundthe cost
of treatment or prophylaxis. This includes drugs,
chemicals and vaccines plus the cost of application
and/or veterinary care. The cost will accumulate
substantially in case treatment must be repeated or
performed regularly(e.g.for tick or tsetse control), or
when animals mustbe gatheredover long distances for
treatment.
Reproductiveproblems ofsmall
ruminants
Commonproblems
The major reproductive problems of confined or
free-roaming small ruminants include: abortions, still
births, agalactia, mastitis, metritis, dystocia and
perinatal mortality(Falade andSellers 1976;Smithand
van Houtert 1988).
Many ofthe above problems are associated with
systemic diseasesthatlowerthe overallperformance of
the animal, while others specifically cause foetal
mortality, abortion or male infertility. Foetal mortality
and abortion can be caused by vibriosis (due to
Camphylobacterfetus intestanalis),salmonellosis (due
to Salmonella abortus-ovis and S. dublin), Listeria
monocytogenes,Chlamydia,sheepticks(Ixodes ricinus)
Small RuminantResearch NetworkWorkshop249

Mukasa-Mugerwa
carrying tick-borne fever, Border disease, mycotic
abortion,Q' fever (Coxiella burnetti) andToxoplasma
gondii. It is noteworthythat Brucella abortusis not a
majorcause ofabortionin sheep.
Infertility in male animals may arise from
infectious epididymitis (caused by B. ovis and
Actinobacillusseminis).
Effects ofdisease on output
The effects of disease on output may be direct or
indirect. Direct lossesinclude mortality and morbidity.
Overalllossesdue tolivestockmortalityinsub-Saharan
Africa have been estimated atUSS2billion (de Haan
and Bekure 1991). Losses dueto morbidity as reflected
by reduced growth, lactation, work output and
reproduction (judged by lambing interval, lambing
percentage,anddelayedpubertyetc)areprobably ofthe
same magnitude.Thisis best reflectedby offtake rates
for meat,the main purpose forwhich small ruminants
are raised, which remain low (32%) in Africa.
Furthermore,mean carcassweightis only 12-13kgper
headwith the resultthat regional annual mutton/lamb
andgoatmeat productioninAfricais only880and653
t/year.
Anotherimportant effect ofdisease onproduction
is that manytimes diseases alter thevalue ofthe animal
by changingits conformation or renderingthe products
unfit for human consumption. The products are
therefore condemned for human use. Furthermore,
substantialrevenueis lostannuallybecause ofthefailure
of many potential producers to meet the sanitary
requirements oflucrative export markets.
Amongthe more indirect effects ofdiseaseisthe
inability offarmers orproducers to utilise favourable
grazinglands orresources, adoptnewsystemsofanimal
management,introduce moreproductive genotypes or
fully utilisespecificanimalproductssuchasdraftpower
because the presence of disease increasesthe fear for
subsequent morbidity or mortality.
Diseases may also indirectly affect production
through restrictions imposed on animal products as a
result of treatment or vaccination, and the
implementation of control regulations following the
outbreak ofcertain diseases.The latter may range from
the enforcement of animal movement to the actual
slaughter of sick animals or even those in contact.
Where animalsare restrictedin theirmovement,itis not
uncommon for overgrazing to follow as another
complication.
Combined effects ofdisease and
reproductivewastage on production
The impact of disease and reproductive wastage on
small ruminant (sheep and goat) production is best
estimatedbythe annual reproductive rate(RR)whichis
defined asthenumberoflambs or kidsweanedperewe
(or doe) ofreproductive age peryear.This estimate is
influenced by litter size (S), lamb mortality (M) and
lambingintervalinyears(I)asfollows:RR=S(1-M)/I.
The traitisthus significantlyinfluencedby litter size,
young mortality, interval between parturitions and
morbidity.
Litter size
Litter size in tropical sheep ranges from 1.0 to 1.5
indicatingthattwinningrate in sheep rangesfrom0and
50%. But, mean litter size maybelessthan 1 indicating
thatthe rate ofpre- andperinatal lossesin the form of
stillbirths isgreaterthan the twinning rate in the flock.
There are some recognisedprolificbreedsinAfrica,e.g.
theWestAfricanDwarfandthe MoroccanD'Manbreed
which commonlydelivertwo or moreyoung.
Litter size is largely determinedby ovulation rate
butis also modifiedbyfertilisation rate andembryonic
andfoetal losses. For example, althoughthe ovulation
rate ofD'Man ewesaverages25, onlyabout42% ofthe
eggs developtofull-termfoetuses.Ovulation ratesvary
amongbreeds,increase with ewe age up to 6-7years
andamongseasonalbreedersaregreatestinthe firsthalf
ofthe breeding season.The trait is highly repeatable
within individuals.
Youngmortality andthe role ofthe dam
Young mortality ratesin sheep andgoatsfrom birth to
weaning rangefrom5tomorethan50% andrepresent
a serious reduction in biological efficiency because
resources invested by and in dams to initiate and
maintain pregnancy are wasted. Major causes of
mortality include starvation-mismothering-exposure
(the SME syndrome),pneumonia, enteritis, accidents,
navelinfection andsepticaemia(Njauetal 1988;Jordan
and LeFevre 1989;Chaarani etal 1991).
Becausestarvationandenteritisaretwo ofthe most
importantcauses ofneonatalmortality,itis necessaryto
ascertain iflambs/kids receive adequate colostrum and
subsequent nutrition. Maternal behaviour is therefore
very critical to the newborn immune and nutritional
status.The ability ofdamsto recognise and bondwith
theiryoung occurs duringtheinitial sensitive period, a
narrow window oftime limited to the first few hours.
Dam abilityto recognise progenyincreaseswith parity
and is often impaired by overcrowding (Alexander
1984; Poindron et al 1984).
Significance of maternal behaviour in young
survival varies with management strategy and
environmental conditions. But, whatever the subtle
signals maybe,failure ofthematernal-neonatalbondin
thefirstfewhoursmayresultinpoormaternalbehaviour
andfailuretonurse adequately.Thetraitisprobablyalso
geneticallyinfluencedbutthis has notbeen adequately
investigatedin tropicalbreeds.
Among other dam traits commonly associated
withreducedyoungviabilityandsurvivability isweight
and body condition score duringgestation. Adequate
nutrition not onlyimproves conception rates at mating,
it increasesyoungbirthweight and decreases perinatal
mortality(Alexander 1984; Holst et al 1986; Barlow et
250 Small RuminantResearch NetworkWorkshop

Disease and reproductivewastage in small ruminants
al 1987; Jordan and LeFevre 1989; Yapi et al 1990;
Mukasa et al 1994). Low nutrition in early pregnancy
also resultsin90-dayfoetuseswith smallerlinear body
measurements(Parr etal 1986).
Placental size is a reasonably good index of
placentalfunction. Decreasedplacentalsize limitsfoetal
growth(Bell 1984). Placentalweightsvarywidelydue
to endocrine factors, nutrition, heat stress, and such
maternal factors as age and genotype. Although the
number of cotyledons is also quite variable, foetal
weight is more correlated to the functional cotyledon
weight and the chorio-allantoic weight (Hinch et al
1985;Parr et al 1986).
Finally, newborn rectal temperature is an
importantfactorforsurvival(Peeters et al 1991).Many
times, perinatal death results from the inability to
maintain adequate bodytemperature outside theuterus.
Barlowetal(1987)concludedthatlambswhichdiedhad
asignificantly loweraverage bodytemperature one half
hour after birth than those which survived. Wind
conditions often tendto exacerbate the heat loss.
Youngadaptation to cold stress
During cold exposure many metabolic hormones like
thyroid hormone,growth hormone, insulin,glucagon,
guthormonesand adrenal hormones maybeinvolvedin
altering intermediary metabolism. These may be
influencedbysomatostatin. In fact,growthpotential of
young lambs can be maintained during cold stress by
activeimmunisationagainstsomatostatin.Somatostatin
activityin lambsis suggested tobe concentrated in the
lower gut where it may be involved in nutrient
absorption.Thishasalsobeenreportedforhumans,dogs
and rats. These observations have important
implications for neonatal mortality rates among sheep
raisedinthehighaltitudetropicsandmayprovideuseful
toolsforselecting forperinatalsurvival.
Flockproductivityindices
Despite some limitations,productivity indices can be
used to measure the level of flock productivity.
Illustrated belowfor a studythatinvolved Menz ewe
lambs(Mukasaet al 1994), initiallambweaningweight
and subsequent parturition interval were used to
construct three indices (Fall et al 1982;Wilson 1983;
Wilson et al 1985)asfollows:
Index I = (total live weight of litter at 90 days x
365)/subsequentparturitionintervalindays
Index II = Index L/post-partum damweight(ppwt)
in kg
Index III = Index I/ppw"* ofdam(kg)
Index Iis derived in kgper ewe and represents
lambingintervalasapercentage ofayearandconsiders
lambperformance untilweaning. Becausethe damisthe
source ofmajorinputuptoweaning,productivitywas
also assessedingperkgdamweight(Index II)orin kg
per kg metabolic weight(Index III). Indices for ewes
whose offspring died before weaning were zero, the
zeros being incorporated in the means and standard
errors for the variables under consideration.The mean
value ofIndexIwas 11.0+087kg, Index IIwas520E41
gandIndex IIIwas 1.18+0.09kg. Because IndicesIIand
III are calculated in terms of dam body weight or
metabolic weight, it becomes possible to gauge the
efficiency ofavailablefeedutilisation.
Futureprospects
Disease through morbidity and mortality and poor
reproduction largely manifested as reproductive
wastage, significantly reduces flockproductivity and
may make small ruminant rearing uneconomic. The
following sequence of measures is suggested to
minimise the impact: major causes of disease and low
reproduction must be identified followed by the
application of appropriate and well thought out
prophylactic measurestocontroldiseases andminimise
reproductive wastage.
Thetype ofpackagerecommendedwill, therefore,
among others, vary with: production system, farmer
acceptability, drugs and vaccine availability and cost
and disease profile etc, particularly if the other
managementinputs are adequate.
References
AddoP.B. 1982.Caseous lymphadenitis ingoatsin Nigeria
Prevalence, natural andexperimentaltransmissions. In:
Proceedings of the 3rd International Conference on
Goat Production and Disease, Tucson,Arizona, USA,
10-15 January 1982. Dairy Goat Journal Publishing
Co.,Arizona,USA.p.372(abstract).
AdeoyeS.AO. 1985. Disease profiles ofsheep andgoatsin
twogroupsofvillagesinsouthwestNigeria:In:Sumberg
J.E. andCassady K.(eds), Sheep and Goats in Humid
West Africa. Proceedings of the Workshop on Small
Ruminant Production Systems in the Humid Zone of
West Africa, held in Ibadan, Nigeria, 23-26January
1984.ILCA(InternationalLivestockCentreforAfrica),
AddisAbaba, Ethiopia. pp. 13-16
AkinboadeCA. 1982. Studies on mange mite infections of
sheep and goats in south western region of Nigeria.
NigerianJournal ofAnimalProduction9:74-79.
AlexanderD. 1984.ConstraintstoLambSurvival. In: Lindsay
D.R. and Pearce D.T. (eds), Reproduction in Sheep.
Cambridge University Press, Cambridge, UK. pp.
199-209
Barlow R.M., Gardiner A.C., Angus K.W., Gilmour J.S.,
Mellor D.J., Cuthbertson J.C., Newlands G. and
Thompson R. 1987. Clinical, Biochemical and
PathologicalStudyofPerinatalLambsinaCommercial
Flock.VeterinaryRecord 120357-362.
Bell A.W. 1984. Factors Controlling Placental and Fetal
Growth and their Effects on Future Production. In:
Lindsay D.R. and Pearce D.T. (eds), Reproduction in
Small Ruminant ResearchNetworkWorkshop 251
Mukasa-Mugerwa
Sheep. Cambridge University Press,Cambridge,UK.
pp. 144-152
Chaarani B., Robinson R.A. and Johnson D.W. 1991. Lamb
mortality in Meknes Province (Morocco). Preventive
VeterinaryMedicine 10283-298.
FaladeS. andSellersK.C.1976.Reproductive lossesinfemale
goats. Nigerian Journal ofAnimal Production
3:131-133.
FallA.,DiopM.,SandfordJ.,WissocqY.J., DurkinJ. andTrail
J.C.M. 1982. Evaluation of the Productivities of
Djallonke Sheep andN'Dama Cattle at the Centre de
Recherches Zootechniques, Kolda, Senegal. ILCA
Research Report 3. ILCA (International Livestock
Centre forAfrica),Addis Ababa, Ethiopia.70pp.
FAO (Food and Agriculture Organization of the United
Nations). 1986.AfricanAgriculture:TheNext25Years.
MainReport.FAO,Rome, Italy.67pp.
de Haan C. and Bekure S. 1991.Animal Health Services in
sub-SaharanAfrica: InitialExperienceswithAlternative
Approaches.World BankTechnical Paper 134.World
Bank,Washington,DC,USA.49pp.
HinchG.N., KellyR.W.,DavisG.H.,OwensJL. andCrosbie
SF.1985. Factors affectinglambbirthweightfromhigh
fecundity Boroola ewes.Animal ReproductionScience
8:53-60.
HolstPJ., Killeen I.D. andCullisB.R. 1986. Nutrition ofthe
pregnant ewe and its effect on gestation length, lamb
birth weight and lamb survival. Australian Journal of
AgriculturalResearch 37:647-655
ILCA(InternationalLivestockCentreforAfrica).1979.Small
Ruminant Production in the Humid Tropics. ILCA
SystemsStudy3. ILCA,AddisAbaba,Ethiopia. 122pp.
ILCA (International Livestock Centre for Africa). 1987.
ILCA's Strategy and Long-term Plan. Addis Ababa,
Ethiopia.99pp.
Jahnke H.E. 1982. Livestock Production Systems and
Livestock Development in Tropical Africa. Kieler
WissenschaftsverlagVauk, Kiel,Germany.253pp.
Jordan D.J. and LeFevre A.S. 1989.The extent and cause of
perinatallambmortalityinthreeflocks ofMerinosheep.
Australian VeterinaryJournal66:198-201
KrostitzW. 1991. Mediumterm outlook for dairyingin the
developing countries. In: SpeedyA. and Sansoucy R.
(eds),FeedingDairy Cows in theTropics. FAOAnimal
Production and Health Paper 86. FAO (Food and
Agriculture Organization ofthe UnitedNations),Rome,
Italy.pp. 1-8
Leng R.A. 1990. Factors affecting the utilization of poor
qualityforagesby ruminantsparticularlyunder tropical
conditions. Nutrition Research Reviews3:277-303.
Mukasa E., Said A.N., Lahlou-Kassi A., Sherington J. and
Mutiga E.R. 1994. Birthweight as a risk factor for
perinatal mortality, andthe effects ofstage ofpregnant
ewe supplementation and gestation weight gain in
Ethiopian Menzsheep. Preventive VeterinaryMedicine
19:45-56.
Ndamukong K. 1985. Effects of management system on
mortalityofsmallruminantsinBamenda,Cameroon. In:
Wilson R.T. and BourzatD.(eds), Small Ruminants in
African Agriculture. Proceedings ofa Conference held
at ILCA, Addis Ababa, Ethiopia, 30 September -4
October1985. ILCA(InternationalLivestockCentrefor
Africa),AddisAbaba, Ethiopia. pp.108-116
Njau BC, KasaliO.B., Scholtens R.G. and Mesfin Degefa.
1988. Review of sheep mortality in the Ethiopian
highlands, 1982-86. ILCA Bulletin 31:19-22. ILCA
(International Livestock Centre for Africa), Addis
Ababa, Ethiopia.
Opasina B.A. 1987. Haemoparasites ofvillagegoatsin south
west Nigeria.Bulletin ofAnimalHealth andProduction
inAfrica35:130-133.
OtesileEB., KasaliO.B.andNzekwuCKN.1983.Mortality
in goats on the University of Ibadan teaching and
researchfarm.Bulletin ofAnimalHealth andProduction
inAfrica31:281-285
ParrR.A.,WilliamsAH., CampbellIP,WitcombeG.F. and
Roberts AM. 1986. Low nutrition of ewes in early
pregnancy and the residual effect on the offspring.
Journal ofAgricultural Science (Cambridge)
106:81-87.
Peeters R., BuysN., Kuhn ER., Decuypere E,SiauO. and
van IsterdaelJ. 1991.Endocrinechanges duringthe first
fourhours ofextra-uterine lifeoflambsasrelatedtobody
weight and rectal temperatures. Small Ruminant
Research5:347-355.
Poindron P, LeNeindre P. and Levy F. 1984. Maternal
behavior in sheep and its physiological control. In:
Lindsay D.R. and Pearce D.T. (eds), Reproduction in
Sheep. Cambridge University Press, Cambridge,UK
pp. 191-198.
SadiqN.A. 1985.Studieson anaplasmosis ofsmall ruminants.
In:SmallRuminant Production in Nigeria. Proceedings
of the National Conference on Small Ruminant
Production, held at NAPRI, Zaria, Nigeria, 6-10
October 1985. National Animal Production Research
Institute,Shika-Zaria,Nigeria.p.271(abstract).
SmithO.B. andvan HoutertMF.J. 1988. Health aspects of
intensive management ofWestAfrican Dwarfgoats in
the humid forest zone. Bulletin ofAnimal Health and
Production inAfrica36:342-347.
SmithO.B., AyeniAO.,OnawumiA.O. andAdemosunAA.
1986. Helminthsandprotozoan parasites ofdwarfgoats
in southwestern Nigeria.Bulletin ofAnimal Health and
Production in Africa34:67-70.
WilsonR.T.1983.Studiesonthelivestock ofsouthernDarfur,
Sudan. VIII.A comparison ofproductivityindices for
goats and sheep. Tropical Animal Health and
Production 42:63-68
WilsonRT,PeacockCP. andSayersAR.1985.Preweaning
mortality andproductivityindices forgoats and sheep
onaMasaigroupranchin South-CentralKenya.Animal
Production941:201-206
Winrock. 1992. Assessment ofAnimal Agriculture in
sub-SahahanAfrica.Winrock International, Morrilton,
Arkansas,USA. 125pp.
YapiCV., BoylanW.J. and Robinson R.A. 1990. Factors
associated with causes ofpreweaning lamb mortality.
PreventiveVeterinaryMedicine 10:145-152
252 SmallRuminantResearch NetworkWorkshop
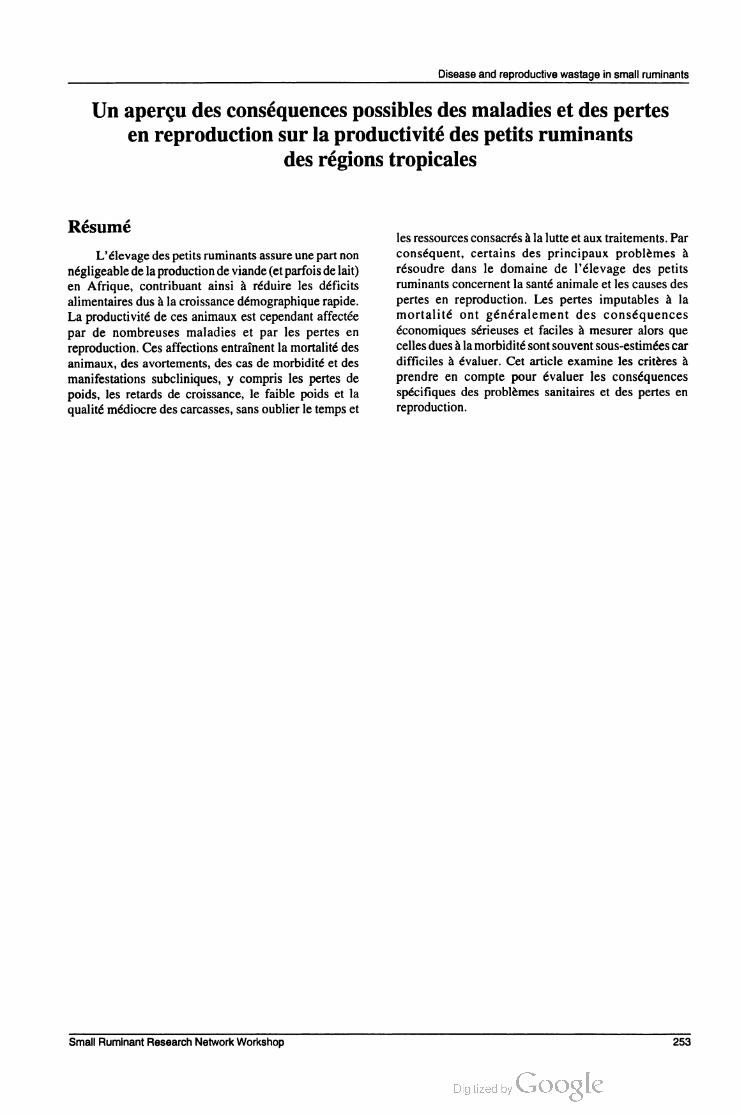
Diseaseand reproductivewastage in small ruminants
Un aperçu des conséquencespossibles des maladies et despertes
en reproduction sur la productivitédespetits ruminants
des régionstropicales
Résumé
L'élevage despetits ruminants assure unepart non
négligeablede laproductiondeviande(et parfoisde lait)
en Afrique, contribuant ainsi à réduire les déficits
alimentaires dusà la croissance démographique rapide.
Laproductivité de ces animaux est cependant affectée
par de nombreuses maladies et par les pertes en
reproduction.Ces affections entraînentla mortalitédes
animaux, des avortements, des cas de morbidité et des
manifestations subcliniques, y compris les pertes de
poids, les retards de croissance, le faible poids et la
qualité médiocre des carcasses,sans oublier le temps et
les ressourcesconsacrésà la lutte et auxtraitements.Par
conséquent, certains des principaux problèmes à
résoudre dans le domaine de l'élevage des petits
ruminants concernent la santé animale et les causes des
pertes en reproduction. Les pertes imputables à la
mortalité ont généralement des conséquences
économiques sérieuses et faciles à mesurer alors que
cellesduesàlamorbiditésontsouventsous-estiméescar
difficiles à évaluer. Cet article examine les critères à
prendre en compte pour évaluer les conséquences
spécifiques des problèmes sanitaires et des pertes en
reproduction.
Small RuminantResearchNetworkWorkshop 253


Growth andpartition offat depotsin male British
Saanengoats
LA. Mtenga " E, Owen * VRM. Muhikambele " G.C. Kfaro " D.S.C. Sendalo "
NF Massawe "SM. Kiango" andDR Nkungu
I. Department ofAnimal Science and Production,Sokoine University ofAgriculture
P.O. Box3004, Morogoro, Tanzania
2. University ofReading, Department ofAgriculture, EarleyGate
PO. Box236,ReadingRG62ATBerkshire, UK
Abstract
Thirty-four male British Saanengoats were reared on
milk substitutes and then given a barley-based
concentrate diet ad libitum. They were slaughtered
serially atbirth (3.5kg),weaning(9.5kg),245,365,
485and725kgliveweight.Weightsoffat depotswere
recorded. With the exception of channel fat, all fat
depots increased significantly (P<0.001) with
increasingslaughterweight.Growth coefficientswere
greater than 1 (P<0001), highestfor subcutaneousfat
(1.887), followed by gut fat (1.802), dissected fat
(1.687), intermuscular fats (1.619) and lowest for
channelfat(1.127). Relativeto total fat,greatest change
in proportion offat occurredbetween birth and245kg
of live weight. There was little consistent change in
proportionofsubcutaneousfat relative tochangeintotal
bodyfat.
Introduction
Fat growth and development in farm animals is of
importance from several points ofview. Firstly, as a
reserve ofenergy, fat can determine the survival ofthe
animalinperiods offoodscarcity.Secondly, asa major
carcasstissue,itmayaffectthecomplexindustryofmeat
production,includingfeeding,decidingonthe optimum
slaughterweight, andgrading ofthe carcass and meat
quality. In the latter context,somefat depots are more
valuable than others, e.g. subcutaneous and
intermuscularfatare more desirablethankidneyandgut
fats.Withinfatdepotsinthe carcass, fatinthe expensive
joints,providedit is notin excess,is morevaluablethan
fat in less expensive joints. Thirdly, Adler and
Wertherimer (1968) discounted statementsthat fat is a
passive organ andpointed out that lipogenesis occurs
mainly in the adipose tissues. Fourthly, the rigid
relationshipbetweenbodyweight,andmuscleandbone
demonstrated by Butterfield (1974) and Berg and
Butterfield (1976),impliesthatthe use ofgenetic and
environmental factors in manipulating body
composition is likely to have greater effects on the
proportion offatthan on othercarcasstissues.
Defining the pattern of fat growth in breeds of
goats istherefore essentialto anunderstanding ofbody
and carcass composition problems associated with
production and marketing. Goat carcass value is
influenced markedlybybothamountanddistribution of
fattytissue depots. In cattle,severalstudies have shown
that the partitioning of fat among the depots is
influenced by slaughterweights (Bergand Butterfield
1976). Growth and partition of fat depots in goat
carcasses has not been studied thoroughly and results
from controlled experiments are particularly scarce.
This studyattemptsto definegrowthand distribution of
fat depots in male British Saanen goats slaughtered at
differentweights.
Materialsandmethods
Atotalof34maleSaanengoatswerepurchasedat birth
and serially slaughtered at birth (3.5 kg),weaning(9.5
kg),245,365,495and725kglive weights atReading
Universityfarm.Theanimalswere artificially reared on
Denkavit Lamb ewe milk replacer untilweaning at35
days ofage.The milk replacercontained(g/kgDM)245
crude protein,200 oil,25fibre,30000IUvitaminA,
14,000 IU vitamin D3 and 30 IU vitamin E. After
weaning, they were fed ad libitum fattening
barley-based concentrate diet consisting of(g/kgDM)
barley(750), flaked maize (50), soyabean meal (100),
fish meal(50), molasses(30), limestone(15),salt(4)and
mineral supplements (1).The diet contained228g/kg
DMcrudeprotein and 174MJ/kgDM ofgross energy.
The animalswere slaughtered and kidneyfat,gut
fat and channelfat(fatfound aroundpelvis bones)from
the whole animal were separated and weighed.
Subcutaneous andintermuscular fat were obtained by
dissecting both the right and left sides ofthe carcass.
Dissected fat weight was obtained by summing up
weights ofsubcutaneous and intermuscularfat.
Mean weights of the various fat depots were
expressed as apercentage ofemptybodyweight(EBW
= liveweight-gutfillweight) and analysed. Fat depots
were also expressed as apercentage oftotalfatweight.
Datafor eachfat depotweretransformedto logarithms
to establish part andwhole allometric relationships of
SmallRuminantResearch NetworkWorkshop 255

Mtenga etal
the typeY= ax" where Y is the fat depotweight,xis
EBW, and b is the growth coefficient describing
proportionategrowth offatin a depottoEBW.
Results
Mean weights and mean weights expressed as
percentages ofemptybodyweight ofvariousfatdepots
at sixgrouped slaughterweights areshown inTable 1.
Withthe exception ofchannel fat,weight at slaughter
had a significant(P<0001) effect on the proportion of
all fat depots. Both the absolute weight and the
proportions ofthese fat depotsincreasedwithincrease
in slaughter weight. However, the increase in
proportionswassmallin the liveweight range of24.5to
49.5kg
Inthe allometric equationsforgrowth offatdepots
relative to empty body weight (Table 2), the growth
coefficients were significantly greater than 1.00,
indicating that, as empty body weight increased, the
proportion ofthesefatdepots increased,confirmingthe
results by direct comparison ofpercentagesinTable 1.
Moreofthevariationinfatdepotweights couldbe
accountedforbyvariation in emptybodyweightusing
allometricequations.The largestgrowthcoefficientwas
for subcuteneous fat, showing it to be the latest
developingdepot,whilekidneyandchannelfatwerethe
earlier developingdepots.
The relationship between the various fat depots
was also studied by expressing weights of fat as a
percentage oftotal body fat (Table 3).Total body fat
proportion progressively increased with increasing
empty body weight (Table 3). The proportion of
intermuscular fat relative to body fat showed little
consistent change with increase in totalfat weight.At
birth, most ofthe fatwas accumulatedin three major
depots: gut, kidney and intermuscular (Table 1).With
increase in totalbodyfat,the most notable changewas
theincrease inproportion ofsubcutaneousfat(Table3).
The increase was accompanied by a decrease in the
proportion ofkidneyfat.Table3 alsoindicates thatthe
major changes in proportions offat depots occurred
earlyin life, i.e. before totalbodyfat exceeded24kg
(correspondingto245kgliveweight).
Discussion
The presentfindings agree with the literature on goats
(Wilson 1958; Ladipo 1973), sheep(Hammond 1932;
Gaili1976), cattle (Jones 1976;Bergetal 1978)and pigs
(Richmond andBerg1972)inthatmostofthefatdepots
increasedinweightatafasterrate thanbodyweight.The
results in the present study indicate that subcutaneous
Table1.Meanweights(g) andmean weights expressedaspercentages(%)ofemptybodyweight(in brackets)ofvariousfatdepots. 1,2
Slaughterstage
Component Birth Weaning 24.5kg 365kg 49.5kg 72.5kg SED
No. ofanimals 4 4 8 8 8 2
Gutfat 27(082) 157(175) 901 (436) 1680(524) 2695(628) 6268(947) 040"
Totalchannelfat 8 (026) 22(025) 69 (033) 116(0.36) 138(032) 256(039) 0.04
Total kidneyfat 27 (082) 99 (1.11) 289(1.40) 7O5(2.19) 1O39(243) 2651 (399) o06"
Subcutaneousfat 6(021) 133(149) 433(2.11) 796(249) 953 (222) 3157(478) 037***
Intermuscular fat 27(082) 163(1.81) 657(320) 1138(355) 1758(4.11) 3623(547) 027***
Dissectedfat 33(1.03) 296(330) 1090(531) 1934(603) 2706(633) 6780(1025) 050"
1. For ease oftabulation,standard deviations and coefficients ofvariation are excluded.
2.SED=Average standard error ofdifference (percentage data only).
***=significant atP<0001.
Table2. Allometric regression equations showing growth offat depots relative to empty body weight "
Component b logx+a SED p?
Gutfat 1802x"- 11262 0036 9877
Total channelfat 1.127x -7044 0057 92.32
Totalkidneyfat 1455x"- 8813 0055 95.61
Subcutaneousfat 1887x"- 12956 0.103 91.26
Intermuscular fat 1619x"-9734 0039 98.14
Dissectedfat 1687x"-9930 0053 96 93
1. *,**,***indicate thatthebvalue is significantly differentfrom 1.00atP<005,P<001, orP<0001,respectively
256 SmallRuminantResearch NetworkWorkshop

Growthandpartition offatin BritishSaanen goats
Table3. Partition ofbodyfat depots in male goats slaughtered at different live weights.
Number Total * Fat depotsas% oftotalbody fat
Slaughterweight of bodyfat as%
group animals (g) ofEBW Intermuscular Subcutaneous Kidney Channel Gut
Birth (3.5kg) 4 95 2 93 27 65 700 28.33 8.87 27 99
Weaning(9.5kg) 4 575 6.41 28.24 23.24 17.32 2.90 28.30
245kg 8 2350 11.40 27 98 18.51 12.28 2 98 38.25
365kg 8 4435 13.82 25 67 17 95 15.85 2.61 37 92
49.5kg 8 6583 1535 26.71 14.46 15.83 2.08 4091
725kg 2 1599 24.10 22.70 1983 16.56 1.62 39 29
fatgrowsfasterinpost-natal lifethan all otherfat depots,
afindingsimilar tothose ofPalsson andVerges(1952)
andGaili(1976)using lambs. Kirton et al(1972) also
notedthat, apartfrom omentalfat,subcutaneousfatwas
the lastfat depotto mature.Whilstthe order offat depot
developmentwas similar to those of cattle (Williams
1978), it was slightly different from that given by
Palsson andVerges (1952),who described gut fat as
slower growing than intermuscular fat. Kirton et al
(1972)alsofoundchannelandintermuscularfatin male
lambstobe early maturing.
Thepresentresultsalso contrast sharplywiththose
reportedbyLadipo(1973),usingamixtureofmale dairy
goat breeds slaughtered between 22 and 54 kg live
weight. He reported fat depots to increase in the
following order ofincreasing rate: subcuteneous, gut
(caul and mesenteric)fat,intermuscularfat, andfinally
visceralfat(kidney, channel and heart fat). Perunit of
empty bodyweight,thegrowth rates ofintermuscular
andvisceralfatdepotsin Ladipo's studyweretwice that
ofsubcutaneousfat.Thefactthat Ladipo(1973)useda
mixture of breeds merits interpretation of the results
with caution, because breed differences have been
observed in fat growth rates and distribution in farm
animals(Bergand Butterfield 1976).
Relative to total bodyfat,gut fatwas the largest
contributor tothe total fat reaching apeak at about2.4
kgtotalbodyfat, correspondingto24.5 kg live weight
(Table3).Thisfatdepot,togetherwiththatofthe kidney
and channel fat, is usually trimmed offthe carcass in
lambs and cattle and sold as cooking fat.The ratio of
dissected carcass fat(subcutaneousplus intermuscular
fat)to otherfat depots ofthebody may,therefore,be a
moreimportantcriterionin determining meatqualityin
goats, andwas 1.87, 1.06,087,077and074 at birth
(35kg),weaning(9.5kg),245,365,495and725kg
liveweight, respectively.Table3demonstratesthatthe
greatest change in proportions ofthevarious fat depots
occurredbetween birth and24.5kglive weightin male
Saanengoats.Thisperiodmay,therefore,be critical in
thestudyofgeneticand environmentalfactors affecting
growth and distribution offatdepots.
Subcutaneous fat made the least contribution at
birth, but rose sharply to its mature proportion at
weaning. The conclusion by Ladipo (1973) that
proportions ofintermuscularfatdecreasedwithincrease
in carcass fat, can be interpreted to correspond to the
24.5to725kgliveweightintervalin the present study.
Conclusion
The present study shows thatthe various fat depots in
goatsgrowfaster relative to emptybodyweight.They
alsogrowatdifferent rates relativeto each other.There
is,however, needforfurtherstudies takingintoaccount
breed and nutrition influences in fat growth and
distribution.
References
Adler J.H. and Wertheimer H.E. 1974. Aspects of fat
depositionandmobilizationinadiposetissues. In: Lodge
G.A. and Lamming G.E. (eds), Growth and
Development ofMammals. Butterworths, London,UK.
pp. 51-65.
BergR.T. andButterfieldR.M. 1976.New Concepts ofCattle
Growth.University ofSydneyPress,Sydney,Australia.
240pp.
Berg R.T., Anderson B.B. and LiboriussenT. 1978. Growth
ofbovine tissues.3.Geneticinfluencesonpatterns offat
growth and distribution in young bulls. Animal
Production27:71-77.
ButterfieldR.M. 1974. BeefCarcassComposition.Australian
Meat Research Council Review 18.Sydney, Australia.
pp. 1-30
Gaili E.S.E. 1976. Body composition of male Sudan desert
goats.World Review ofAnimal Production 12:83-87
Hammond J. 1932. Growth and Development ofMutton
Qualities in Sheep.Oliverand Boyd, London,UK.
JonesSD.M. 1976.Aspects ofBeefProductionfrom British
Friesian Bulls (a) Genetic Variation and (b) Target
Growth Rates during the Finishing Period of
grass/cereal Systems. PhD thesis, University of
Reading,Reading,UK.475pp.
Small RuminantResearch NetworkWorkshop 257

Mtenga etal
Kirton AH., Fourie P.D. and Jury KE. 1972. Growth and
development of sheep. New Zealand Journal of
AgriculturalResearch 15214-227.
Ladipo JK. 1973. Body Composition ofMale Goats and
Characterization of their Depot Fats. PhD thesis,
CornellUniversity, Ithaca,NewYork,USA.343pp.
Palsson H.andVergesJB.1952. Effects ofplane of nutrition
on growth and development ofthe carcass quality in
lambs. Journal ofAgricultural Science (Cambrige)
42:1-149.
Richmond R.J. and Berg RT. 1972. Bovine growth and
distributioninswine asinfluencedby liveweight, breed,
sex and ration. Canadian Journal ofAnimal Science
52:47-56
WilliamsD.R.1978.Partition anddistribution offattytissues.
In: Boer H.D. and MartinJ.(eds), Patterns ofGrowth
and Development in Cattle. Martinus Nijhoff, The
Hague,The Netherlands.pp.219-232
Wilson PN. 1958. The effect ofplane of nutrition on the
growth and development of the East African Dwarf
goats. Journal ofAgricultural Science (Cambridge)
54:105-130
Croissance et répartition des dépôts adipeuxchezdes boucs
de la race deSaanen anglaise
Résumé
Trente quatre boucsde la race deSaanen anglaise
ontété alimentés avecun substitut du laitpuis avecun
concentré à base d'orge servi ad libitum. Ils ont été
abattus en série à la naissance (3,5 kg), au sevrage
(9,5kg)puis auxpoidsvifs de24,5kg,36,5kg,48,5kg
et 72,5 kg. Leurs dépôts adipeux ont été pesés. A
l'exception de celuide la graissepelvienne, lespoidsde
tous les autres types de dépôts ont augmenté
significativement avec l'accroissement du poids à
l'abattage. Les coefficientsd'accroissementétaient
supérieurs à 1 (P<0001), le chiffre le plus élevé
correspondantà lagraisse sous-cutanée(1,887),suivie
de celle des boyaux(1,802), de lagraisse de dissection
(1,687) et des graisses intermusculaires (1,619), la
valeur la plus faible étant celle dugras de bassin. Par
rapportà lagraisse totale, lesplusgrands changements
dans laproportion degraisse étaientintervenus entre la
naissance et le poidsvifde24,5kg. Enfin,il n'y avait
pas de corrélation claire entre les changements de la
proportion degraisse sous-cutanée et ceuxde lagraisse
totale.
258 Small RuminantResearch NetworkWorkshop

Etat de la situation sanitaire desproduits laitiers
commercialisés dans lazonepériurbaine deN'Djaména
P. Bornarel, N. Boulbaye, P. Hugoo etK.Gaou
Résumé
Des échantillons de laitfrais(17), lait caillé (37),
beurre solide (5)etbeurrefondu(7)sontprélevéssur 11
marchés dans un rayon d'environ 100 km autour de
N'Djaména. Les laits proviennent soit de vaches(37),
soit de chèvres (11)soitsontun mélange des deux(6).
Les beurres sont tous d'origine bovine. Pour la flore
bactérienne globale, les laits frais comportent 10
germespar millilitre et les laits caillés au moins
L'aciditénesemblaitpas avoir influésur la prolifération
des germes. Les beurres fondus présentent une flore
globaleplusimportante (2. 10°germes par gramme)que
celle des beurres solides (10") peut-être par suite de
manipulations et transvasements plus nombreux. Il
s'agit de germes non pathogènes notoires qui pro
viennent de l'environnement par suite d'une série de
manipulations sansprécautions au cours de la chaîne de
production.Deschampignons et levuresontétéisolés et
identifiés. Il faut envisager de poursuivre cette étude
bactériologique en analysant chaque étape de la chaîne
de production afin de dégager des données pratiques
pourune amélioration.
Introduction
Dans lespays africains, les produits laitiersjouent
un rôle important dans l'alimentation humaine. Le
Tchad n'échappe pasà la règle avec une prédilection
pour le lait des petits ruminants. Les conditions
d'exploitation de cesproduits, mal définies, risquent de
se prêterà la multiplication età la diffusion de germes
dont certains pourraient se révéler dangereuxpour la
santéhumaine. D'autresgermes, non identifiés comme
pathogènes mais présents engrand nombre,pourraient
perturber les techniques de production de certains
produits destinésà la commercialisation. Ilyauraitdonc
làunepossibilitéd'intervenirpourune amélioration tant
qualitativequequantitative, avecbien sûruneincidence
économique.
Matériel et méthode
Prélèvements
Les prélèvements ont été réalisés au niveau des
marchés de lazone périurbaine deN'Djaména,dansun
rayon de 100 km environ qui correspond à la zone
d'intervention du Projet régional de recherchepour les
petitsruminantspourson étudeglobalesurlaproduction
laitière. L'étude aportésurle lait et le beurretels qu'ils
sont commercialisés, donc consommés. Le lait se
présente sous forme de lait cru ou caillé. Il est condi
tionné soitdansdescalebassesaveccouvercle, soitdans
des bidons en plastique servant surtoutà transporter le
produitjusqu'àN'Djaména.Aumomentde l'achat, ces
laits sont transvasés dans le récipient apporté par
l'acheteur. Quant au beurre, il se rencontre soit sous
forme depetits morceauxconservés dans descalebasses
contenant dupetit lait ou du lait caillé, soit sous forme
liquide appelée beurre fondu, conservée dans des
bouteilles. Les laits étudiés étaient du lait de vache ou
de chèvre ouun mélange des deux.Quantaux beurres,
ils étaient exclusivement d'origine bovine (tableau 1).
Lesprélèvements ont été réalisés dans despotsstériles,
de manière aléatoire, enfonction de la proposition des
commerçants, ce qui explique le déséquilibre entre les
différentesformes. Les échantillons ontétémis aufroid
dansun récipientisotherme et transportés aulaboratoire
pourtraitementimmédiat.
Analyse microbiologique
Les techniques utilisées sont des méthodes
classiques et correspondent, en matière d'hygiène
alimentaire, aux recommandations de la législation
françaisepubliée auJournal officiel(Anonyme, 1991).
Cette analyse concerne les bactéries, les levures et
champignons; mais les virus ne sont pas recherchés
(Beerens et Luqest, 1987; Bourgeois et Leveau, 1991;
Carter andCole, 1990;Collectif, 1969; Nevot, 1947).
Les bactéries sont considérées selon trois critères :
- présence normale : c'est la flore dite acidifiante ou
lactique, utile pour une transformation ultérieure
du lait frais, cru. Elle est constante dans le beurre.
De ce point devue sont recherchés: Lactobacillus
et Streptococcus (géloseMRSetgélose Rogosa).
- pollution : lesgermesde l'environnementtrouvent
dans le lait un excellent milieu de culture. Il faut
donc les rechercher systématiquement, d'une
manière globale. Ensuite ilfautisoler et identifier
ceux quipeuventêtre dangereuxselon les critères
de l'hygiène alimentaire.
La recherche porte sur les germes fécaux
(entérobactéries engénéraletSalmonella enparticulier,
Small RuminantResearchNetworkWorkshop 259

Bornarel etal
Tableau 1:Nature, nombre, origine et répartition des échantillons de laits et de beurres étudiés
Lait Beurre
Espèces Frais(N) Caillé(N) Solide (N) Fondu(N) Total
Vache Boutelfil(5) Djermaya(3) Karal(1)
Dougui(1) Douguya(8) Karmé(1)
Gredeya (3) Mandélia(1)
Karal(4) Massaguet(4)
Karmé(5)
Linia(4)
Mandélia(3)
Massaguet(1)
Sous-total 6 31 5 7 49
Chèvre Lamadji(1) Djermaya(5)
Djermaya(5)
Sous-total 6 5 k k k 11
Mélange Lamadji(5) Djermaya(1)
Sous-total 5 1 k k k 6
Grand total 17 37 5 7 66
***= non disponible
streptocoquesfécaux) etPseudomonus(géloseVRBG, Résultats
DCLS,bouillon sélénite, de ROTHE,de LITSKY), sur
les germes anaérobiessulfito-réducteurs(géloseTSN),
sur les levures et champignons (gélose de
SABOURAUDavec etsans chloramphénicol).
- pathologie: c'est-à-dire celle de l'animal pro
ducteur ou de l'éleveur, avec une attention
particulièrepour les risques de zoonose.
L'attention s'estportée plus particulièrement sur
Staphylococcus (milieu de CHAPMAN, de BAIR
PARKER, sur Brucella (milieu BAM) et sur
Mycobacterium(milieudeLOZENSTEIN-JENSEN, de
COLESTSOS).
Les bactéries sont dénombrées selon deux
modalités : test au bleu de méthylène et comptage sur
gélosePCA("plate count agar") avecune série de trois
dilutions defacteurs 10préparées en tenant compte des
résultats du test au bleu de méthylène.
Tableau2:Dénombrement des bactéries dans le lait (germes/ml)
Numération des bactéries
Lesvaleurs moyennes(engermes/ml), regroupées
par type de lait et par origine, sont présentées au
tableau 2. Le lieu de prélèvement n'apporte aucune
information significative
La méthode au bleu de méthylène (BM)présente
unebonnecorrélationaveclecomptageenmilieugélosé
et constitue unbon outilpour la pratique courante.D'un
pointdevuegénéral,laflore bactérienne semble moins
abondante dans les beurres que dans les laits, en
particulier les laits caillés. Laflore acidifiante apuêtre
cultivée sur milieux adaptés (gélose MRS, gélose
ROGOSA),ce quipermetd'avoirun ordre degrandeur
de la flore de pollution contamination. Les résultats en
valeurs moyennes, sont exprimés en germes/gramme
(tableau3).
Type Origine N Bleu de méthylène gélose PCA
Lait frais vache 6
chèvre 6
mélange 5 de 5 hà 5h15 de 10*à 18 10"
Lait caillé vache 31
chèvre 5 de 30 mnà 1 h 30 > 10"
mélange 1 de 6 10°à 10"
Tableau3:Dénombrement des bactéries dans le beurre (germes/gramme)
Type floreglobale pollution/contamination
Solide 89 10 49 10
Fondu 1.9 10° 87 10*
260 SmallRuminantResearch NetworkWorkshop

Hygiène des produits laitiers autourde N'Djamena
Isolement etidentification
Cette phase a portésur les bactéries, les levures et
les champignons. Une grande variété de germes à été
isolée dans les laits mais aucun d'entre eux ne s'est
révélé être un agentpathogène majeur(tableau4).Une
attention toute particulière a été accordée aux
contaminants fécaux et aux staphylocoques (risque de
contamination d'origine humaine).Aucun des bacillus
isolés n'était Bacillus anthracis, agent du charbon,une
anadémie majeure auTchad. Par ailleurs, les recherches
degermes anaérobies onttouteséténégatives,de même
que celles de germes comme Yercinia, Listeria,
Corynebacterium auxquels une attention toute
particulière a été accordée sur milieu Brucella Agar
Modifié(BAM). Deux souches ont étéisoléesà partir
de deuxprélèvements distincts de laits caillés devache
(Karal, Linia). Les colonies sont apparues après trois
semaines en atmosphère enrichie en gaz carbonique et
Tableau4:Isolement et identification de germes dans les laits
globale remarquable maissansidentification degermes
notoirement dangereux(tableau 5).
Discussion
Echantillonnage
Il n'y a pas eu, dès le départ, de plan d'échan
tillonnage élaboréintégrant, en vue d'une étude, des
paramètres comme le lieu de récolte, la saison où les
modalités deproduction.On profitait d'une sortie surle
terrain pour un autre travail, pour prélever les
échantillons à condition de revenir rapidement au
laboratoirepourtraitementimmédiat.Il estpeuprobable
qu'un nouvel échantillonnage plus important de laits
caillés de mélange entraîne une modification fonda
mentale des résultats de numérations acquis, le lieu de
prélèvement n'apportant pas une information
discriminante, même s'il y a des variations de pro
duction d'une régionà l'autre.
Type de lait
Frais Caillé
Origine Bactéries (N) Champignons et levures Bactéries(N) Champignons et levures (N)
Vache [6] [31]
Serratia(1) Achromobacter(1) Candida(7)
Enterodacter (6) Acinetobacter(3) Saccharomyces(5)
Enterobacter(4) Trichosporon(1)
Escherichia(2)
Pseudomanas(2)
Micrococcus(1)
Staphylococcus (12)
Brucella(2)
Chèvre [5] [5]
Klebsiella (3) Candida3 Erwinia(1) Candida(3)
Pseudomonas(3) Trichosporon(1)
Mélange [6] [1]
Klebsiella (1) Candida(3)
Pseudomonas(1)kk»
***=non isolés-[N]=nombre d'échantillons-(N)=nombre de souches étudiées
avecune technique à deux milieux(solide et liquide).
Les colonies sont petites, circulaires, convexes,
translucides, de couleur "miel". Les germes sont des
coccobacilles GRAM négatifs, immobiles, à catalyse
positive, réduisant les nitrates, indole négatif, réaction
au rouge de méthyle et de Voges-Proskauer négative,
ruée négative.Onpeutconclureàunefortesuspicion de
Brucella.
Les résultats relatifs auxbeurres sontidentiquesà
ceux enregistrés sur les laits, avecprésence d'une flore
Tableau 5: Isolement et identification de germes dans les
beurres
Champignons
Types N Bactéries et levures
Solide 5 NC Trichosporon
Fondu 7 NC Candida(2)
NC=bactéries depollution, non caractéristiques
Small RuminantResearch NetworkWorkshop 261

Bornarel etal
Compte tenu des conditions de travail, il était
impossibledetrouverdesproduits laitiers provenantdes
autres espèces(mouton,dromadaire). Pour cette étude,
l'espèce d'origine duproduitn'aétédéterminée quesur
la base de l'affirmation duvendeur.
Numération
Laflore bactérienneglobale est moinsélevéepour
les laits frais quepour les laits caillés, quels que soient
l'origine et le lieu de récolte. Il est fréquemmentadmis
que l'aciditédu lait caillé pourrait détruire lesgermes.
Cetteforme deprésentation du lait semble assurerune
conservation acceptable puisque le produit peut être
commercialisépendantune semaine apparemmentsans
gêne connuepour le consommateur.Si lesgermes qui
se sont multipliés ne sontpas des bactériespathogènes
notoires, leur abondance est cependant le signe que
l'hygiène minimaledebase n'estpas respectée,d'où de
fortes possibilités de risques.
Les essaisdeculture de laflore lactique ayanttous
été négatifs avec les laits, qu'ils soientfrais ou caillés,
on nepouvaitdoncnila caractériser, ni la compareràla
flore de pollution/contamination. Malgréune enquête
poussée(vérification desprotocoles,des manipulations,
des réactions, essais avec des souches témoins) on n'a
putrouveraucuneexplication liéeàlatechnique utilisée.
Ilfaut donc chercher ailleurs. Le fait que lapréparation
du lait caillé soit toujours effectuée par chauffage
prolongé à température élevée pourrait expliquer la
disparition de cette flore microbienne spécifique. Etant
donné que cela concerne les deuxtypes de lait,on peut
penser que tout le lait produit subit ce chauffage, mais
unepartie seulementserait transformée en lait caillé, le
reste étant commercialisésousuneforme appelée,àtort
donc, lait frais.Auretourdumarché,le laitfraisinvendu
serait transformé à son tour en lait caillé pour une
conservation plus longue et une commercialisation
ultérieure.
L'abondance de laflore microbienne dans les laits
caillés a nécessité l'utilisation de dilutions très élevées
pour le comptage en milieugélosé(PCA). Devant des
résultats aussi élevés, le milieu utilisé a été systéma
tiquementvérifié en incubant les boîtes de petri avant
inoculation. Il n'y avait pasdepollution préalable.
En ce qui concerne les beurres, compte tenu des
conditions d'échantillonnage restreint, on ne peut que
parlerde latendancegénérale observée,àsavoir que le
beurre fonduparaîtplusbacillifère que lebeurresolide,
une situation imputable peut-être aux manipulations
supplémentaires etauxtransvasements qu'il a subis.
Champignons et levures
Les champignons et les levures n'ont pas fait
l'objet d'une numération mais leur présence est assez
constante dans l'ensemble des prélèvements
(Vanbreuseghem, 1966). Il est difficile d'en tirer une
conclusionpratiqueparticulière carcesontdes éléments
permanents de l'environnement. Ils traduisenteuxaussi
le fait qu'au cours des manipulations, le lait est très
souvent exposéà l'air ambiant.
Identification
Pour ne pas surcharger la présentation, on s'est
limité auxgermesisolés et étudiéspouvantprésenterun
certain intérêt(qualité, pathologie)(Pilet et al, 1987).
Les recherches infructueuses ou résultats "négatifs",
interprétés comme une absence,seront cependantpris
en considération pour l'analyse.
Aussibien dans les laits que dans les beurres, les
contaminantsfécauxsontextrêmementraresetc'estune
bonne chose car on pouvait craindre que certaines
pratiques d'élevage (comme par exemple le fait de
badigeonner les mammelles avec de la bouse pour
empêcher les jeunes de téter), ajoutées au manque
d'hygiène déjà constaté, n'entraînent une pollution
importantepar cette catégorie degerme. Nous relevons
cependant la présence d'Escherichia (E. coli) et de
Klebsiella(K. pneumoniae). En particulierE. colipeut
sefixersurle matérielet s'ydévelopper,créant ainsiune
source constante depollution si on neprocèdepasàune
stérilisation efficace entre deux opérations. Tous les
germes identifiés sont saprophytes et/ou commensaux,
en général ubiquistes et pathogènes occasionnels,
opportunistes dans des conditions bien particulières
(sujetdébilité, milieuhospitalier). Les germescités sont
ceux habituellement rencontrés dans les ouvrages
traitant de bactériologie alimentaire. Malgré toute
l'attention portée à sa recherche, aucune souche de
Salmonella n'a étéisolée.
A partir des colonies de la flore globale, de
nombreuses bactéries se sont révélées être, elles aussi,
des commensales ou des saprophytes sans pouvoir
pathogène. Pour être plus proche de la réalité, il vaut
mieuxdire qu'elles n'ontpuêtre associéesàaucun état
morbide.
Il faut noter queStaphylococcus aureus,ungerme
à caractèrepluspathogène et d'origine humaine n'apas
étéisolé.Demême,aucunMycobacterium n'anonplus
été isolé. Cela peut amener à penser que dans les
conditions de travail, on n'a pas été confronté avec la
tuberculose.Une étude particulière sera effectuée dans
le cadre d'un autre protocole.
En ce qui concerne les Brucella, l'identification
des deuxsouchesn'apasétéconfirméepar le laboratoire
duCentre national d'étudesvétérinaires et alimentaires
(CNEVA) de Maisons-Alfort,probablement en raison
d'une erreur de transmission. La suspicion subsiste
cependant et le problème devrait être reprispour lever
le doute.Ce voletsera exécuté dans le cadre d'un autre
programme.
Conclusion
D'un point de vue analytique, on constate la
présence d'une flore microbienne globale abondante,
maissans agentpathogène majeur(bactéries, levures et
262 Small RuminantResearch NetworkWorkshop

Hygiène des produits laitiers autourdeN'Djamena
champignons). Cependant, en matière d'hygiène
alimentaire, l'expérience montre que les risques sont
d'autantplusgrands quelesgermessontplus nombreux.
Par ailleurs,onnepeutdégageraucune conclusionen ce
quiconcerne lefacteursaison alorsqueleparamètre lieu
de récolte ne semble avoir aucune influence. Enfin, la
composition exacte des laits de mélange estinconnue.
D'unpointde vueprospectif, il imported'effectuer
une étude bactériologiquedestechniques deproduction
(traite, récipients, eau), en relation avec les techniques
de transformation,pour en dégager des consignespour
le producteur, levendeuretleconsommateur; deréaliser
une enquête épidémiologique auprès des services de
santépublique sur les pathologies en relation avec la
consommation des types de laits étudiés; de définir la
composition des laits de mélange, en intégrant les laits
en poudre reconstitués proposés sur les marchés de
N'Djaména; d'envisager les bases techniques d'une
législation en matière d'hygiène alimentaire et
d'apporter des éléments auxétudesdetype économique
pour calculer l'incidence des interventions préconisées
(matériel, désinfection, stérilisation,pertes, etc.) et des
contrôles de qualité.
Bibliographie
Anonyme. 1991. Hygiène Alimentaire. Textes généraux.
Journal Officielde laRépublique française,Paris.
Beerens H et Luquet FM. 1987. Guide pratique d'analyse
microbiologique des laits et produits laitiers, Lavoisier
etApria,édit., Paris.
Bourgeois C M et Leveau J Y. 1991. Le contrôle micro
biologique, Dans:Techniques d'analyse et de contrôle
dans les industries agro-alimentaires. Volume 3.
Lavoisier etApria,édit, Paris.
Carter G R et Cole J R. 1990. Diagnostic procedures in
Veterinary and Mycology. Academic Press Edit., San
Diego(California).
Collectif. 1969. Techniques d'analyse microbiologique des
produits laitiers. (Commission de bactériologie des
produits laitiers). Annales de la nutrition et de
l'alimentation,23.
NevotA. 1947.Contrôle Bactériologiquepratique des denrées
alimentaires d'origine animale.Flammarionédit.,Paris.
PiletC, BourdonJL,TomaB,MarchalN,BalastreCetPerson
JM. 1987. Bactériologie médicale etvétérinaire. Doin
édit., Paris.
Vanbreuseghem R. 1966. Guide pratique de mycologie
médicale etvétérinaire.Masson édit., 1966, Paris.
Health status ofmilkproducts marketedinperi-urban areas
ofN'Djamena
Abstract
Samples offresh milk(17),sour milk(37), solidbutter
(5)and liquidbutter(7)were collectedfrom 11 markets
in a 100-km radius aroundN'Djamena. Milk samples
were obtained from cows (37),goats (11) or both (6)
whileallbuttersamplescamefromcattle.Totalbacterial
count for fresh milk samples was 10'ml and at least
10/ml for sour milk samples; acidity did not seem
to affect bacteria proliferation. Liquid butter bacterial
count (2 x 10°g) was higher than that of solid butter
samples (10"ig) perhaps due to more handling and
transfers. These bacteria were well known non
pathogenicbacteriaoriginatingfromtheenvironmentas
a result of a series of careless handling during
processing.Somefungiandyeastspecieswereisolated
and identified. This bacteriological study should
continue through a step-by-step analysis of the
productionchaintoidentifypracticaldataneededforthe
improvement ofthe system.
Small RuminantResearch NetworkWorkshop263


Performances de reproduction et accroissement numérique
du cheptel ovin dans deuxnoyauxd'élevage traditionnel
enzonesoudano-sahélienne au Mali
Tiéma Niaré
IER/LHM,BP47,Mopti(Mali)
Résumé
L'élevage des petits ruminants s'étend surtoutes
leszonesagro-écologiquesduMali.Lesétudes relatives
à ces ovicaprinae sont peu nombreuses, d'où une
connaissance insuffisante des contraintes majeures au
développementde cetélevage.Cette étudefut entreprise
pour comblerenpartie cette lacune. Ellefutbasée sur le
contrôle desperformancesindividuellesdereproduction
dontlaméthodologieestprésentée.Lesfemellessuivies
étaient précoces avec un âge moyen à la première
parturition de 16+ 1,4mois, très fertiles (taux de fertilité
=132%)maispeuprolifiques(tauxde laportée= 1,08
+ 0,03). Leur bonne fertilité pourrait s'expliquer par
l'intervalleentre agnelage assezréduit(243t16,1 jours).
Letaux de viabilité de la naissance au sevrage était de
85%.Le troupeau, l'année de mise bas, la saison de la
mise bas précédente et le numéro de la portée
influencent ces principales composantes de la
productivité numérique. Le facteur alimentaire semble
être le déterminantmajeurde l'expression de celles-ci.
La nécessité d'une complémentation alimentaire en
période de soudure est discutée et, l'organisation de la
lutte apparaît comme une alternative particulièrement
intéressante. Les stratégies d'exploitation semblent
différentes selon les propriétaires.Toutefois, les ovins
constituent une forme de recours pour la gestion du
"risque"etpourlaconsolidation,àdesdegrésdivers, des
rapports sociaux à travers les différentes formes
d'exploitation. En conjonction avec le faible taux
d'exploitation du cheptel et la maîtrise des mesures de
prophylaxie sanitaire, les bonnes performances de
reproduction autorisent une croissance numérique
moyennede58% deseffectifs. Les conséquencesde cet
accroissement sont évoquées de même que les moyens
(déstockage, cultures fourragères, etc) à mettre en
oeuvre afin d'assurer le développementde l'élevage.
Introduction
Avec près de 13 millions de têtes en 1991,
l'élevage des petits ruminants touche toutes les zones
agro-écologiquesduMali. Ils nefournissent cependant
que 17 % de la viande consommée estimée à 25000
tonnes (Statistiques des abattages contrôlés en 1991,
Rapport annuel, Direction nationale de l'élevage). Les
carcasses ovines représentent le tiers de cet
approvisionnement. Les premières études pertinentes
sur ces ovicaprinae ont démarré au début des années
1980 dans la zone semi-aride. Les principaux résultats
obtenus ont fait l'objet de multiples publications
(Wilson et al, 1983; Wilson, 1986). Des études sont
actuellementen cours enstation sur le moutonToronké
à Kayes et sur le mouton du Sahelà Niono.Tous ces
travauxsontloin de couvrir ladiversité agro-écologique
des milieux d'élevage en relation avec la diversité
biologique.Globalement, en dépit de leurimportance
numérique, lespetits ruminantsontengénéralété l'objet
detrèspeudeprogrammesde rechercheparrapportaux
bovidae.Ilenrésulteuneconnaissance parcellaire etpas
mal de lacunes en ce qui concerne la connaissance des
contraintes majeuresaudéveloppementde leurélevage.
Afin de contribueràcombler cette lacune,unprotocole
de contrôle desperformancesindividuelles aété mis en
place dans deuxnoyaux d'élevage traditionnel en zone
soudano-sahélienne. En caractérisant les potentialités
des animaux (reproduction et croissance), en tenant
compte des caractéristiques environnementales, on
pourrait, en accord avec Flamant(1988), identifier les
caractèresquiexprimentuneréponse dumatériel animal
aux contraintes du système d'élevage. La présente
communication se limiteà l'exposé desperformances
zootechniques de reproduction età l'évaluation de la
dynamique destroupeaux. Le choix de la reproduction
n'est pasfortuitcar elle constitue la clédevoûte detoute
production animale et conditionne, en partie, le
renouvellement dutroupeau.L'accroissementdelapro
ductivitéd'untroupeau-dumoinsdanssa composante
numérique - voire de l'élevage en général, passe
incontestablementpar l'amélioration de la reproduction
etsa maîtrise constitue un outil privilégiépour réaliser
desprogrèsgénétiques.
Matériel et méthodes
Matérielanimal
Deux noyaux de troupeaux ovins élevés dans un
village agro-pastoral en zone soudano-sahélienne ont
fait l'objet d'un suivipériodique hebdomadaire continu
sur deux cycles annuels. Les caractéristiquesgénérales
Small RuminantResearch NetworkWorkshop265

Niaré
(structure etmodede conduite des animaux)ontétédéjà
décrites (NiaréetSangaré, 1992). Aussi, n'expose-t-on
icique laméthodologie de collecte desdonnées relatives
à la reproduction.
Lors du recensement au cours duquel tous les
animaux présents furent individuellement identifiés à
l'aide de boucle auriculaire, les principales caracté
ristiques (âge, sexe et carrière reproductrice pour les
femelles) de tous les animaux ont été consignées dans
une fiche spéciale. Les informations relatives aux
agnelages étaient enregistrées chaque semaine lors du
passage régulier et systématique de l'observateur. Ce
sont, outre lenomde l'observateur, le troupeauet la date
du contrôle, le numérode labrebis, sa date de mise bas,
le numéro de la portée, le mode de naissance et
le nombre de produit(s) né(s)vivant(s). Autotal, 172
agnelages et 73 intervalles entre agnelages ont été
répertoriés dans les deux noyaux. Au cours du même
passage, les sorties intervenues(abattages, ventes,dons,
mortalités, pertes et confiages) étaient également
consignées dans unefiche appropriée.
Méthodologie d'analyse
A partir de la base de données brutes ainsi
recueillies, les paramètres zootechniques suivants ont
été calculés : l'âge à la première mise bas (APMB),
l'intervalle entre agnelages (IEA), le taux de fertilité
(TdF), lataille de laportée (TdP)et les tauxdeviabilité
des agneaux(TdV). Le taux de viabilité périnatale est
obtenu en divisant le nombre d'agneaux nés vivants
par femelle par la taille de sa portée. L'influence des
facteurs de variation tantintrinsèques qu'extrinsèques
surcesvariableszootechniquesaétéestimée paranalyse
devariance. Le modèle croiséà effet fixe a étéutilisé.
Sa formule mathématiquegénérale est la suivante :
Vijk = +oi+ 3j+Eijk où
Vijk est la performance zootechnique de la
reproductrice k appartenant auxfacteursi etj.
u est la moyenne
oi repésente l'effet du ième niveau du premier
facteur(tableau 1). Par exemple,pour la variable IEA,
lefacteurtroupeaua2niveaux.
Bj représente l'effet du jème niveau du second
facteur analysé(tableau 1).
Eijk désigne la résiduelle d'espérance nulle.
L'homogénéité de la répartition mensuelle des
mises bas a été testée à l'aide du khi-deux. La
signification des différences entre taux de survie a été
appréciéeparcomparaison des proportions.
L'évolution des effectifs des troupeaux tient
compte de l'exploitation, de la mortalité et des entrées
d'animaux (confiages, dons, naissances). Une combi
naison linéaire de cesparamètrespermetuneévaluation
du croîtnumérique annuel quitraduit la dynamique des
effectifs des troupeaux. Ce paramètre a été calculé
commesuit
Cr = (R-1)*100où
R = Eff1/Eff est le rapportdes effectifs au
tempst+1 et t,
Cr = croît numériqueannuelen%
Résultats
Performances de reproduction
Lesperformances zootechniques de reproduction
constituent la principale composante de laproductivité
numérique d'un troupeau. Aussi, importe-t-il de les
évaluer et d'en connaître lesvariations.
Ageà lapremière misebas(APMB)
L'âge moyen des agnelles au premier agnelage
était de 16,6t1,4 mois (n =31) avec un coefficient de
variation de 24%. Cet âge varie de façon très
significative (F128 = 897, P<001) en fonction de
l'année de mise bas qui explique 25% des variations
totales (R* = 0,25). Il est de 18,6t1,9 mois en 1989
contre 14,6t1,5 mois en 1990. Globalement, l'âge
d'entrée en reproduction est,parcontre,indépendantdu
troupeau d'appartenance.
Tableau1:Liste des variables étudiées, facteurs et niveaux des facteurs analysés.
Variables Facteurs analysés Niveauxdesfacteurs
APMB Troupeau 2
Année de mise bas 2: 1989 et 1990
Troupeau 2
IEA Saisonde la mise basprécédente 3: nov-février
mars-juin
juil.-octobre
TdP Troupeau 2
Numéro de la portée 8(1-8)
266 Small RuminantResearch NetworkWorkshop

Performancesde reproduction des ovins auNord-Mali
Intervalle entre agnelages(IEA)
L'intervalle moyen entre mises bas est de 243+
16,1jours(n=73)soit8moisavecunevariabilitéindivi
duelle relativement plus grande traduite par un
coefficient de variation de 29%. L'IEA est très
significativement influencépar la saison de la mise bas
précédente (F269=9,34, P<001)qui explique le tiers
de la variationtotale (R*=0,33). Les légèresdifférences
observées dans les performances intertroupeaux
semblent dues au hasard. L'intervalle moyen entre
agnelages estplusfaible lorsque la misebasprécédente
a eu lieu en fin de saison sèche (23244 t22jours) et
pendant la saison des pluies (225,30 t 25jours) que
pendant lasaison sèchefraîche(31507+36jours).
Tauxdefertilité (TdF)
Le taux de fertilitéglobal surun cycle annuel de
suivi était de 132%. Ce taux varie d'un troupeau à
l'autre. Jlétaiten effet de 106%pour letroupeau Ietde
158% au sein du second troupeau. Dans les deux
troupeaux, la distribution mensuelle des agnelages
n'était nirégulière niuniforme surtoute l'annéed'après
le test de khi-deux (P<005). Près de la moitié des
naissances sont enregistrées au cours du trimestre
septembre-octobre-novembre.Enprolongeantjusqu'en
mars,laproportion de misesbasestde4/5(figure 1).En
outre, les résultats du même test montrent une totale
absence d'homogenéité dans la répartition mensuelle
des agnelagesd'une année sur l'autre.
Taillede laportée(TdP)
La taille moyennede laportée était de 1,08+003
agneaux (n=161) avec un coefficient de variation de
Effectifs
23%. Cette variable zootechnique est influencée
significativement par l'effet troupeau (F1.153 = 624;
P<005) ettrès significativementpar l'effet numéro de
laportée (F7153=3,18;P<001).La taille de laportée
au sein du troupeau I était de 1,04E005 contre 1,15+
007dans le second. L'influence de l'effet numérode la
portée se traduitparune augmentattion graduelle de la
taille de laportéeàpartir du3ème agnelage(1,03). Elle
est maximum au 6ème agnelage (1,26) et diminue
ensuite.
Tauxdeviabilité
Le taux deviabilitépérinatale est en moyenne de
99%. Indépendant de l'année de mise bas, il nedépend
nide l'effettroupeau nide celuide lasaison demisebas.
Au cours des deux années de suivi, les mortalités(0-6
mois) ont constitué un phénomène particulièrement
marqué. Elles ont représenté 33 et 49% des sorties
respectivement en 1989et 1990. Le taux moyenglobal
étaitde85%.Lesmortalités étaientduesessentiellement
à des maladies etéventuellementàdes accidents.Parmi
toutes les maladies, la pasteurellose était la principale
cause de décès des agneaux. Toutefois, les causes
diverses (inconnues ou dues probablement à des
carences nutritionnelles, conjonctivite, rikettsiose,
intoxication-indigestion-ballonnement) étaient aussi
prépondérantes dans le second troupeau où, en re
vanche, aucun cas de pneumonie n'a été suspecté
(tableau2).
Le taux de viabilité des mâles dans les deux
troupeauxétaitde80%contre84%pourlesfemelles.Le
tauxglobal de viabilité des agneauxétait de 79% dans
letroupeau Icontre84dans le second. Enfin,de90%en
1989il étaittombéà80%en 1990.L'écartentreces deux
50
Figure 1. Répartition mensuelle des agnelages
SmallRuminantResearch NetworkWorkshop 267

Niaré
années était statistiquement significatif contrairement
aux différences entre sexes ou entre troupeaux.
Tableau2: Causessuspectées demortalitédesagneauxavant
le sevrage
Causes de mortalité
Troupeau Pasteurellose Pneumonie Diverses
I 52.4% 33.3%
II 44,49/ 000%
Dynamique destroupeaux
La dynamique des troupeaux c'est-à-dire la
variation de leur taille dépendessentiellement destaux
d'exploitation et de mortalité et des possibilités de
reconstitution, qu'elles soient internes, c'est-à-dire liées
aux performances de reproduction ouexternesàtravers
les diversesformes d'acquisition du bétail.
Tauxd'exploitation
En 1989,avecdes effectifs exploités de 17et9, les
taux d'exploitation représentaient 8% et 31% respec
tivementpourlestroupeauxIet II. L'année suivante, ils
ont étéde6%et32% respectivementpour des effectifs
assezproches(31 et30).
Lesventes destinéesàcouvrir lesbesoinsd'argent,
les abattages et les dons ont constitué les principales
causes de cette exploitation. Les abattages ont surtout
lieu lors des cérémonies religieuses (fête de la tabaski
ouAïdElKebir)de mariage oude baptême. Il existeune
différence assez marquée entre les troupeaux suivis
quant auxstratégies d'exploitation.Ainsi, en 1989, les
abattages ont portésur63% des effectifs exploités dans
le troupeau I.Ce taux chute à25% en 1990 alors que
celui des ventes avait augmenté pour atteindre 50%.
Dans le troupeau II en revanche, les ventes ont
représentéplusdelamoitiédeseffectifs exploitésquelle
quesoit l'année (56%en89contre80% en90).
Croît numérique
Sur la base des flux d'entrée et de sortie,
l'accroissementglobalsur les deuxannées de suivi des
effectifs aété de68%pour le troupeau I et de48%pour
le troupeau II. Cet accroissement global a connu
cependantune fluctuation interannuelle variable selon
le troupeau.
En effet, dans le troupeau I, l'augmentation
d'effectifs en 1990 a été relativement modérée (23%)
par rapportà celle de 1989(36%). Par contre, l'effectif
dutroupeauIIabaisséde9%de 1989à 1990alorsqu'en
fin de cette campagne(1989), le croît était de62%,soit
presque le double de celui dutroupeau I au cours de la
mêmepériode.
Discussion
Ageà lapremière mise bas
Avecunâgeà lasailliede9à 11 mois, les agnelles
étaient relativementprécoces.L'âgeàlapremière mise
bas est conforme à celui de beaucoup d'autres races
ovines sahéliennes comme le mouton du Macina avec
16,5mois(Wilson etal., 1983)ou le mouton sédentaire
du Niger, type Oudah avec 16 mois (Charray et al.,
1980). Les agnelles paraissent plus précoces que le
mouton Peul-peul sénégalais où l'âge à la première
parturition est de 24 mois, le moutonà longue queue
grasse du Rwanda qui agnelle pour la première fois à
l'âge de713 (Wilson et Murayi, 1988) ou les brebis
croisées(Djallonkéxtype sahélien)auGhana(Kabuga
etAkowuah 1991). En revanche,aveccetâgemoyende
16,6 mois, elles paraissent moins précoces que les
agnelles du sud-est de la Côte d'Ivoire (Armbruster et
al, 1991a). Dans ce cas, les conditions d'élevage
différentes pourraient expliquer les différences d'âgeà
lapremièreparturition.L'effettroupeaun'influepas sur
cette variable zootechnique. La non signification de ce
facteur ne paraîtguère surprenante car redondant avec
l'effet année de mise bas. En fait, l'effet "troupeau"
recouvre diverses pratiques inhérentes au mode de
gestion de l'exploitation (soins de santé, mesures
d'hygiène, alimentation-complémentation, logement,
pratiques d'élevage,etc).L'âgeà lapremière mise bas
relativementfaible des agnelles agnelant en 1990(nées
en 1989)pourraits'expliquerpar l'effetbénéfique de la
complémentation effectuée dans lestroupeauxau début
de l'année 1990(Niaré etSangaré,1992). Les agnelles
nées en 1989 auraient donc peut-être bénéficié de cet
apport supplémentaire d'alimentconcentréàl'approche
de leur puberté ou pendant celle-ci. Si l'année ou la
saison de naissance des agnelles leurpermet d'agneler
àunâgerelativementprécoce (WilsonetMurayi,1988),
toute complémentationà l'approche de lapubertéparaît
tout aussibénéfique.
Intervalle entre agnelages(IEA)
En plus de leur précocité, les brebis avaient un
intervalle moyen assez réduit entre agnelages. Ce
résultatobtenusur labasede suivirégulieretpériodique
confirme les observations empiriques des agro-éleveurs
de la zone selon lesquelles l'IEA est d'environ 8 mois
(Niaréet al., 1991). DemêmeArmbruster et al.(1991a)
ont également observé un intervalle comparable chez
des ovins du sud-est de la Côte d'Ivoire ..Ces résultats
sont conformesà ceux du mouton Djallonké élevé au
Cameroun et dans le Nord de la Côte d'Ivoire. En
définitive, ces résultats prouvent qu'il est possible
d'obtenirtroisagnelagesendeuxansdans les conditions
actuellesd'élevage, ce quipeutêtreunatoutmajeurpour
le développement de l'élevage ovin enzone tropicale.
Chez les brebis dont la mise bas précédente a eu
lieu entre novembre etfévrier, c'est-à-dire au cours de
268 SmallRuminantResearch NetworkWorkshop

Performancesde reproduction des ovins au Nord-Mali
la saison sèche fraiche, l'intervalle entre agnelages est
plus élevé que chez celles agnelant en saison sèche
chaude ou pendant la saison des pluies. La rareté de
l'herbe au cours de la longue et difficile période de
saison sèche que traversent ces brebis, explique la
longuepériode précédant le retour des chaleurs suivies
de fécondation.A l'inverse, les brebis qui mettentbas
peuavantoupendant lasaisondespluiesbénéficientdes
conditions nutritionnelles requises pour revenir en
oestrus et être saillies plus rapidement. Ces résultats
confirment l'influence de la saison de la dernière mise
bas sur l'IEA observée par d'autres auteurs (Charray,
1986;Wilson etMurayi,1988)dansunmêmemilieu ou
ausein d'un même troupeau.
Tauxdefertilité
Surun cycle annuel, le taux de fertilité moyen de
ces brebis était nettement supérieurà celui des brebis
Djallonké de Côte d'Ivoire ou duCameroun(Charray,
1986). Cette bonne fertilité n'est peut-être pas
indépendante de l'intervalle assez court observé entre
agnelages.Ainsi,en l'absence de toute systématisation
de la complémentation alimentaire dans ces troupeaux
traditionnels, il n'estpas rare qu'unefemellesurtroisen
moyenne mette bas deuxfois dans l'année.
La répartition irrégulière des naissances men
suelles d'une année sur l'autre est ici un artéfact lié à
l'irrégularité du suivi. En effet, suiteàdesinterruptions
involontaires, le contrôle des performances n'a pu se
dérouler correctement entre mai et juillet 1990
L'absence de suiviaucoursde cettepériode expliquerait
cette hétérogenéitéd'uneannéesur l'autre.Globalement
en revanche, l'homogenéité dans la répartition
mensuelle des agnelages entre troupeaux a permis de
mettre en lumière l'hétérogenéité inhérente à ce
processus. Les mises bas de septembre-mars
correspondentàdes conceptions ayant eu lieu en fin de
saison sèche et pendant la saison des pluies. En zone
sahélienne, la transition saison sèche-saison des pluies
semble favorable à la conception des brebis (Traoré,
1987). En outre, c'estpendant la saison des pluies que
la qualité de la semence des béliers Djallonkésemble
meilleure (Chiboka, 1981).Un effet bénéfique majeur
de la saison des pluies est l'abondance et la meilleure
qualité du fourrage. De ce fait, l'alimentation ne
constituepasunfacteur limitant et explique le forttaux
de conception.
Taille de la portée
La taille relativement faible de la portée de ces
brebisestcomparableàcellesobtenuesailleurs(Charray
etal., 1980;Wilson et al.,1983;Charray,1986;Wilson,
1986;Armbruster et al., 1991a). Ce résultat confirme
celui déjà observé dans la même zone à travers des
enquêtes ponctuelles (Niaré et al., 1991). Même chez
des croisés Djallonkéxtypesahélien, lataille moyenne
de la portée reste faible (Kabuga etAkowuah, 1991).
Elle estplusfaible que celle des Djallonkédunordde la
Côte d'Ivoire (Filius et al., 1985), des brebis du sud
tchadien (Charray et al., 1980)et desbrebis duMacina
(Wilson et al, 1983). Malgré leur bonne fertilité, les
brebis étudiées ici sontpeu prolifiques étant donné la
faible proportion de naissances gémellaires.Toutefois,
celle-ciaugmentede plus de20points entre les3ème et
6ème agnelages. Cette chance accrue des femelles
pluripares semble constituer un phénomène assez
général peut-être liéà l'atteinte de la maturitéphysio
logique. L'énergie emmagasinée serait alors vrai
semblablement utilisée préférentiellement pour la
fonction de reproduction chezcesbrebis.
Viabilitédes agneaux
Le taux très élevé de viabilité périnatale des
agneaux suggère que les problèmes d'avortements, de
mortinatalités ou de mortalités périnatales (1-6jours)
sont minimes,voire négligeables. Dans le sud-est de la
Côte d'Ivoire, la mortalité périnatale (0-5 jours) des
agneaux est également plus faible qu'après 30jours
(Armbruster et al., 1991b). Ces résultats semblent
imputables aubon comportementmaterneldesbrebis.
De la naissance à l'âge de6 mois la mortalité des
agneaux est de 15%, et indépendante de l'intervalle
entre agnelagescontrairement auxconclusionsd'études
rapportées parWilson et al. (1983). En outre, elle ne
semble pas dépendre significativement du sexe de
l'agneau, les mâleset lesfemellesprésentant les mêmes
risques de décès. Les causes de la mortalitéjusqu'au
sevrage sont essentiellement d'origine pathologique. Il
n'estpas exclu qu'en milieu villageois, les conditions
alimentaires précaires, ajoutées aux aléas climatiques,
aient un impact sur l'état de morbidité et vrai
semblablement donc sur les chances de survie des
agneaux.
Stratégies d'exploitation et conséquences de
l'accroissementdes effectifs
De même que dans les troupeaux sénégalais
(Faugère et al., 1990), les ventes subissent d'im
portantes variations interannuelles liées au besoin des
familles. Mais au niveau du troupeau II, la logique de
commercialisation semble prédominer,comptetenu de
la moindre importance des activités agricoles du
propriétaire. Néanmoins, dans un cas comme dans
l'autre,cettevente répondàun soucidesatisfaction des
besoins vitaux. On retrouve là également le rôle
"'d'épargnefacilementmobilisable"quejouent lespetits
ruminants d'une manière générale et plus parti
culièrement les ovins. Cette épargne est surtout
mobilisée quand les propriétaires en éprouvent le
besoin. Les troupeaux ovins semblent constituer donc
unmoyen de recourspourlagestiondu"risque"(risque
de famine par exemple) mais aussi, aspect tout aussi
important, une forme de consolidation des rapports
sociaux.
Small RuminantResearch NetworkWorkshop269

Niaré
A cette fonction primaire du troupeau doit se
substituer progressivement une nouvelle dynamique
d'exploitation du cheptel qui se traduirait par un
déstockage.Celui-ci, conçu dans le cadre d'un objectif
deproductionprécis,assurera, outre lasatisfaction des
besoins vitaux de l'éleveur à travers les revenus
monétaires générés, une fonction de régulation de la
charge desparcours.
Dans le troupeau I, on observe un phénomène
d'accumulation du cheptel en raison des faibles taux
d'exploitation et de mortalité. En revanche, le croît du
second troupeau présente une grande variabilité
interannuellepourdes raisons évidentes de satisfaction
des besoins vitaux. Globalement cependant, l'aug
mentation des effectifs est réelle. Elle traduit alors la
bonneperformance de reproduction observée dans ces
troupeaux et,dansunemoindre mesure, l'acquisition de
nouveauxanimaux.
Al'échelle duterroir,cephénomènepeut,àterme,
vite dégrader lespacagespar surpâturage. En outre, la
végétationde cettezone soudano-sahélienne soumiseà
des prélèvements deplus en plusimportants verra son
potentiel de regénération diminuer. Ily a donc lieu de
craindre, ce qui, pour l'agro-pastoraliste Peyre de
Fabregues citépar Dumont (1985), pourrait être une
dégradation irréversible du fait d'une destruction
anarchique et abusive de la strate arbustive.
Faceà cette expansion démographique du cheptel
(recherchée parce qu'elle autorise la reconstitution des
troupeaux de pasteurs et d'agro-éleveurs après les
années de sécheresse) aux conséquences néfastes, les
culturesfourragèresconstituentunmoyenquiassurerait
à la fois le maintien de l'élevage, son intégration à
l'agriculture tout en garantissant, grâce au fumier, le
maintien de la fertilitédessols. Cette solutionne saurait
cependantêtreimposée. Elle auraittoutefois l'avantage
de réduire la divagation desanimaux, laquelle oblige les
paysansà clôtureràgrandsfrais les parcelles de culture
desaison sèche. Elle doit aussi s'inscrire dansune autre
conception du troupeau intégrant une nouvelle
dynamique d'exploitation qui optimiserait la gestion de
l'espacepastoralpar le bétail engénéral et les ovins en
particulier.
Conclusion
Cette étude, réalisée en zone soudano-sahélienne,
une région caractérisée parun contraste saisonnier des
disponibilités fourragères très marqué entre la saison
sèche et la saison des pluies, n'a été effectuée que sur
deux noyaux d'élevage traditionnel ovin. Sa
représentativitéà l'échelle de la zone agro-écologique
est par conséquent discutable. Des études complé
mentaires sur un nombre de troupeaux plus important
s'avèrent nécessaires avant de dégager, puis de
généraliser, des conclusions pertinentes. Toutefois, la
méthodologie de suiviindividueldes performances des
animaux rend crédible et fiable les valeurs indicatrices
descritères évalués.Lesreproductricesdes deuxnoyaux
paraissent précoces, très fertiles mais peu prolifiques.
Ces caractéristiques de reproduction sont fortement
tributaires des conditions nutritionnelles des animaux.
Un apport de complément au cours de la période de
soudure estindispensable.Parailleurs, l'organisationde
la lutte afin de faire coïncider les périodes de besoins
élevés aveccelle deproductionfourragèrepeutêtreune
alternative intéressante. En complément aux études
réalisées dans la zone semi-aride (Wilson et al., 1983),
celle-ci autorise une extension des connaissances des
ovinsàd'autres zones agro-écologiques du Mali.
Remerciements
Cetteétude aétéréaliséegrâce ausoutienfinancier
de la Fondation internationale pour la science (FIS)
(bourseB/1416-1).
Références
ArmbrusterT, Peters KJ, Hadji-ThomasAand Lamizana P
1991a. Sheep production in the humid zone ofWest
Africa 1. Reproductive performance in improved
systems in Côte d'Ivoire. J. Anim. Breed. Genet.,
180:203-209.
ArmbrusterT, Peters KJ et Hadji-ThoamsA 1991b.Sheep
productioninthehumidzone ofWestAfrica3.Mortality
andproductivity ofsheepinimprovedsystemsin Côte
d'Ivoire.J.Anim. Breed. Genet., 180:220-226.
CharrayJ 1986. Performances des brebis naines d'Afrique de
l'Ouest entretenues suivant deux rythmes différents
d'accélération de la reproduction. Rev. Elev. Méd. Vét.
Pays trop.,39(1):151-160
CharrayJ,CoulombIB,Planchenault DetPugliessePL1980
Synthèse des connaissances sur l'élevage des petits
ruminants dans lespaystropicauxd'Afrique Centrale et
d'Afrique de l'Ouest. IEMVT(Institut d'Elevage et de
Médécine Vétérinaire des PaysTropicaux), Ministère
français de la coopération,295p.
ChibokaO1981.Semen characteristics ofWestAfricandwarf
rams. Rapport,Université d'Ife (Nigéria);14p.
ChoisisJP,CervantesN et Lhoste P1990. Effets saisonniers
sur certainsparamètresde la productionbovine dans les
élevages mixtes de l'Etat de Colima au Mexique. Rev.
Elev.Méd.Vét. Pays trop.,43(1)97-104
Dumont R 1985. Pour l'Afrique,j'accuse. Terre humaine,
Plon,pp462
FaugèreO,DockesAC, PerrotCetFaugèreB1990 L'élevage
traditionneldespetits ruminantsauSénégal. I. Pratiques
de conduite et d'exploitation des animaux chez les
éleveursdela régionde Kolda.Rev. Elev.Méd.Vét. Pays
trop.,43(2):249-259.
FallA,DiopM,SandfordJ,GueyeE,WissoqYJ,DurkinJet
TrailJCM 1983. Etude sur la productivité du mouton
Djallonké au centre de recherches zootechniques de
Kolda au Sénégal. I. Paramètres de reproduction et
viabilité. Rev. Elev. Méd. Vét. Pays trop., 36(2):
183-190
270 Small RuminantResearch NetworkWorkshop

Performancesde reproduction des ovinsau Nord-Mali
FiliusYP,WenigerJHundTeuscherJ1985 Untersuchungen
uberdie Nutzleistung des Djallonkéschafes. Z
Tierzuchtg.Zuchtgsbiol., 102:371-384.
FlamantJC1988.Mieux connaître les ressources génétiques
ovines dans le cadre de leurs systèmes d'élevages :
motivations et objectifs du réseau Philoetios. Dans
Populations traditionnelles et premières racesstandar
disées d'Ovicaprinae dans le bassin méditerranéen.
Publiésous la direction deJ.J. Lauvergne;Colloques de
l'INRA(Institut nationalde la recherche agronomique),
47:39_47.
KabugaJDandAkowuahF1991. Reproductive performance
ofDjallonkéXSahelian crossbredewesinGhana.Small
Rumin. Res.,5:245-254
Niaré T, Dembélé I et Traoré M I 1991. Evaluation des
composantes de la productivité numérique du mouton
Djallonké en milieu villageois. Rev. Malienne Sci.
Techn., 1:14-21.
NiaréT et SangaréA 1992. Contrôle des performances en
milieu villageois : structures, modes de conduite et
évolution destroupeauxsuivis. Doc. mult., 10p.
Wilson RT 1986. Livestock production in central Mali :
Long-term studies on cattle andsmall ruminants in the
agro-pastoralsystem.ILCAResearch Report, 14, 111p.
Wilson RT,de LeeuwPNetde HaanC1983. Recherche sur
les systèmes des zones arides du Mali : résultats
préliminaires. ILCA Research Report,5,89p.
Wilson RTandMurayiTh 1988. Production characteristics
ofAfrican long-fat-tailedsheepin Rwanda.SmallRum.
Res., 1(1):3-17.
TraoréA 1987. Fertilité etprolificité despetits ruminants à
l'abattoirde Niono.CIPEA,programmedeszones aride
et semi-aride,N°AZ 174, 11p.
Reproductiveperformance and numericalincrease in two
traditionalsheep nucleussystemsinthesubhumidzonein Mali
Abstract
Small ruminants are found in all agro-ecologicalzones
in Mali.Duetothe limitednumberofstudies carriedout
on these speciesinthe country, little is known aboutthe
major constraints totheir development.This study has
been carried out topartially solve this problem and is
based on monitoring of individual production
performance. In thestudyfemales maturedearlywithan
age atfirst parturition of 16t1.4months; their fertility
rate was very high at 132%, but they were not very
prolific(littersize=1.08E003). This high fertility may
be due to a low lambing interval of243t16.1 days.
Survival ratefrombirthtoweaningwas85%.Herd, year
ofbirth, season ofpreviousparturition and number of
litters influencedallthe majorcomponentsofnumerical
productivity. However,feedparameters seemed tobe
the majorfactors thatdeterminedthe expressionofthese
components. The need for feed supplementation
between two consecutive growing seasons was
discussed and the organisation ofthe breeding season
wasseen as averyinteresting alternative. Management
strategies seemed to vary with different owners.
However, sheep were used as a resource for "risk"
management and for strengthening social links at
various levels through different forms of utilisation.
Given the low turnover rate and with the use of
preventive health measures, the high reproductive
performance recorded shouldresultin a58%increasein
herd size.Theimplicationsofthisincreasearediscussed
aswellasthe measures(destocking,forage crops etc)to
be implementedtopromote livestock development.
SmallRuminantResearch NetworkWorkshop 271


Theinduction ofpubertyinfemale Boergoat kids
JP.C.Greyling
Department ofAnimalScience, University ofOrangeFree State
P.O. Box339, Bloemfontein,9300, Republic ofSouthAfrica
Abstract
The effectsofseason, nutrition andpresence ofaram at
the onset ofpuberty in female Boer goat kids were
studied.Permanent presenceofavasectomisedramwith
the female goat kids induced puberty earlier (P<005)
than when the teaser ram wasintroduced to the female
goat kids twice daily. Exposure offemalegoatkids toa
higher energy diettended to alsoinducepuberty earlier
but this influence did not differ much (P>005) from
female goat kidsputon alowenergy diet. Female Boer
goatkidsborninsummerandweanedinautumnattained
puberty earlier (P<005)than those born in spring and
weanedinsummer.The results ofthis studysuggestthat
the reproductive functions, such aspuberty,in female
Boergoatkids canbemanipulatedthroughmanagement
techniquessuch aspermanent exposuretothe ram,good
nutrition andstrategicweaningandbreeding.
Introduction
In general, breeding is delayed until the animal has
attained 60-75% of its mature body weight (Shelton
1978). Mostgoatbreeds arepubertal between 5and 10
months of age and this occurs during the season of
shorteningdays,whereasthetermination thereofoccurs
during lengthening days (Riera 1982). It is generally
accepted that the breeding season centres around the
period ofshort daylightlength.
There is evidence thatthe presence oftherammay
modifythe age ofpubertyinthegoat(Shelton 1977)and
influence oestrous behaviourin does,withsome degree
of synchronisation of oestrus (Ott et al 1980). Two
physiological actions are triggered bythe presence of
the rams,viz.a neurohumoralactionwhichadvancesthe
pre-ovulatory luteinising hormone (LH) peak and an
entirelyneural actionwhichgives risetothe ram-effect.
It is postulatedthat the ram-effectis sufficienttoboth
synchronise and produce oestrus in the doe and that
exogenoushormones areunnecessary.
The onset ofpuberty is related to bodyweight
whichinturn dependsonthe level ofnutrition, age,type
ofbirth andseason ofbirth(Shelton 1978;Smith 1978).
Thus this study was initiated to investigate factors
(season, nutritionandram-effect)whichmayplaya role
intheinduction ofpubertyinthe female Boergoat kid.
Materialsand methods
FemaleBoergoatkids(n=65)borninspringandweaned
Decemberand kids(n=45)borninsummerandweaned
April were used following weaning in the first and
secondtrials, respectively, andfor observationperiods
of144 and 190days, respectively. In each trial all kids
were randomly allocated and maintained on two
nutrition regimes,vizhigh(HE)andalow(LE)energy
diets(Table 1).All kidswererandomlysubdividedinto
the followingtreatmentgroupsfor each trial:
Treatment 1: Permanent ram group (PR)- a vasec
tomisedramwasrunpermanentlywiththe
kids to act as stimulus and detect oestrus.
Treatment2:Teaser ramgroup(TR)-avasectomised
ramwasintroducedtothe kidstwice daily
toact asstimulus and detect oestrus.
Treatment 3:Control group (NR)-kids completely
isolatedfrom malesforthe duration ofthe
trial.
Table 1.Composition of the high- and low-energy diets
(pelleted)fed duringthe trials.
High energy Low energy
(LE)Ingredients (HE)
Lucernene (%) 50() 93 4
Maize meal(%) 380 -
Fishmeal(%) 100 -
Molasses(%) - 50
Monosodiumphosphate(%) 1.0 1.0
Agriculturallime(%) 0.5 -
Salt(%) 05
Trace elementmixture (%) 0.1 0.1
Energycontent(MJ/kgDM) 9 613 7 688
The live mass of each animal was monitored
weekly and the average daily weightgain calculated.
Blood samples were taken weekly from five
animals/group;serumwasextracted andstored at20'C
for subsequent determination of serum LH
concentrations (Niswender et al 1969) and serum
progesterone concentrations (Youssefnajadian et al
1972). Oestrous observationswereperformed together
with serum LH and progesterone values evaluation
twice dailyinthe PRandTRgroupstomonitorthe onset
of cyclic activity in the female kid. Data were
statistically analysed by analysis of variance, the
smallest significant difference was calculated to
Small RuminantResearch NetworkWorkshop 273

Greyling
determine which groups performed best, and the
chi-square test was implemented to compare the
oestrous response between groups (Snedecor and
Cochran 1980).
Results
Oestrus
The oestrous responses(indicative of puberty)for the
goat kids duringthe respective observationperiods are
set out in Table 2.There was a significant difference
(P<005) in the number of does exhibiting oestrus
between the PR andTRgroups during both seasons.
Theformergroup demonstrated oestrus earlier thanthe
latter. Regardingthe level of nutrition, no significant
difference in the occurrence of oestrus (puberty) was
noted for both groups of animals born during the
differentseasons.
The age to first oestrus (puberty) is set out in
Table 3. Forthepurpose ofcomparison, distribution of
the time interval of occurrence of first oestrus is
indicated. The mean age-at-first oestrus was
significantly(P<005)earlierfor all kidsweanedin the
April breeding season than for those weaned during
December(1572vs 191.1 days, respectively).
Bodyweight
Significant(P<001andP<005)differencesinthemean
percentage gain in bodyweightbetween high and low
energy dietswere found for kidsweanedin December
and April, respectively. There was no significant
difference between treatment groups within the two
levels ofnutritionregardingthepercentagebodyweight
gained.ADG did not differ significantly between the
different ram treatmentgroups.
No significant difference wasfoundforthe body
weight atwhichpubertywasreachedforthetwoenergy
dietsandtreatments thoughbodyweight atfirst oestrus
tendedtobe higherforfemalesweanedinAprilthanfor
thoseweanedin December(31.1 vs274kg)(Table 3).
No significant correlation was found between body
weight and age-at-first oestrus.
Serum luteinising hormone levels
From Table4it is evident thatLH levels between and
within treatmentgroups and observationperiodsvaried
greatly. Seasonal differences (December vs April
weaning)for the mean concentrations ofserum LHin
theperi-pubertalgoat(Figures 1to4)werepresent.The
PR(P<001)andTR(P<005)April-weanedgroups had
a higher LH levelthan the December-weaned PRand
Table2. Percentage Boergoat does exhibiting oestrus during the respective observation periods.
Weaningseason
December April
HE LE HE LE Overall(%)
Permanent ramgroup(%) 1000" 750a 1000" 1000" 93 3*
Teaser ramgroup 37 5b 500° 57 1b 483"
Overall% 706* 62.5* 786* -
HE=high energy;LE=low energy.
Valueswith the same superscripts do notdiffersignificantlyfrom each other.
Table3. Mean age and body weight (tSD) ofBoer goat does at the demonstration oftheir first visual oestrous period.
Weaningseason
December April
HE HE LE
Permanent ramgroup
Age atfirst oestrus(days) 1979+29.6" 2035 -403" 1558-548" 1533-333*
Distribution(days) 147-234 164-268 124-268 115-202
Bodyweight at first
oestrus(kg) 29056" 31.3E10.1" 28354"
Teaserramgroup
Age atfirst oestrus(days) 1785-245* 1687+532* 1710-568*
Distribution(days) 149-220 149-209 136-230 110-235
Bodyweight at first
Oestrus (Kg) 29652" 26026"
HE=high energy;LE=low energy.
Valueswiththe same superscripts donot differsignificantlyfrom each other.
274 Small RuminantResearch NetworkWorkshop

Theinduction ofpubertyin female Boergoatkids
Serum LH concentration
(ng/m)
12 -
Permanentramgroup
10 -
14 -
Teaser ramgroup
12 -
10 -
14 -
- Controlgroup
12 -
10 -
0 T T T T r- T
3 6 9 12 15 18 20
Weeks followingweaning
Figure 1.SerumLH concentration ( ESE) ofBoergoatkids subjected to different male treatments (weanedDecember)on ahigh
energy diet.
| Small RuminantResearch NetworkWorkshop 275

Greyling
Serum LH concentration
(ng/m)
14 -
12 - Permanentram group
10 -
14 -
Teaser ramgroup
12 -
10 -
14 -
12 - Controlgroup
10-
Weeksfollowingweaning
Figure2. SerumLH concentrations(ESE) ofBoer goat kids subjected to different male treatments (weaned December) on a low
energy diet.
276 Small RuminantResearchNetworkWorkshop

Theinduction ofpubertyinfemale Boergoatkids
Table4 Mean(ESD)weeklyLH concentrations(ng/ml) duringthe respective observationperiodsforpre-pubertalfemaleBoergoat
kids bred in specific seasons.
Weaningseason
December April
Treatment HE LE HE LE
Permanent ramgroup 1.78+1.36" 1.36E1.41* 389+304° 4.3+360°
Teaser ramgroup 142E196" 232+272" 1 98+178* 369+203°
Controlgroup 1 97+1 91* 203+1.89" 1.16070
HE=highenergy;LE=low energy.
Valueswiththe same superscript donotdiffer significantlyfrom each other.
TRgroups,whilethe December-weaned controlgroup
was foundto show higher (P<001) LH levelthan the
Aprilweaned controlgroup.
Significant differences in the mean serum LH
concentration were found in the PR (P<001) andTR
(P<005)groupsweanedin December(Figures 1 and2)
for the two levels of nutrition. Significant differences
(P<001)in the mean LH concentration were recorded
in theTRand controlgroupsweanedin April(Figures
3and4).
The ram-effect did not result in significantly
different mean LH levelsforthe December-weaned PR
andTR groups on the high-energy diet. The control
group, however, had a significantly (P<005) higher
mean LH levelthan the PRandTRgroups(Figure 1).
Inthelow-energygroups(Figure2), higher(P<001)LH
levelswere recordedin theTRand controlgroupsthan
in the PRgroup. The kidsweaned in April, however,
showedhigher(P<001)meanLHlevel(HEdiet)inthe
PRgroupcomparedto theTRandcontrolgroups. The
meanLHleveloftheTRgroupwasalsohigher(P<005)
than that ofthe control group (Figure 3). In the low
energy(LE)groups,the mean serumLHofthe PRand
TR groups were not significantly different, although
significantly higher than that ofthe control group
(Figure 4).
Serumprogesterone levels
Most ofthe kids weaned in December which did not
showany externalsignsofoestrusdidshowperiodically
elevated progesterone levels (>1 ng/ml) during the
observation period. In some animals,the progesterone
concentration remainedlowthroughoutthe observation
period, similar tovaluesfoundin anoestrous females.
Kids weaned in April showed the same progesterone
pattern asthose weanedin December.The occurrence
of phenomena like silent heats was, however, less
frequent,possiblyduetothehigherincidence ofoestrus
in animals weaned in April than in those weaned in
December.
Within the December weaning season, the PR
group on a high-energy diet and TR group on a
low-energy diet showed significant (P<0.05)
differences in their mean progesterone levels for the
observation period(087vs 0.65 ng/ml, respectively)
Similar significant (P<005) differences were found
betweenthe control(HE)andtheTRgroups(HE)(1.01
vs0.75ng/ml, respectively)andalsobetweenthe control
(HE)andTR(LE)groups(P<001)(1.01vs0.65ng/ml,
respectively).The controlgroup(HE) ofkidsweanedin
April maintained a significantly(P<001)higher mean
progesterone level than the TR groups (098 vs 0.66
ng/ml and 098vs07 ng/ml for HE and LEgroups,
respectively). Similarly, the controlgroup(HE)had a
higher(P<005)meanserumprogesteronelevel(098vs
076 ng/ml) for the entire observation period, when
comparedtothe permanent ramgroup(LE).
Theprogesterone levels maintainedbythePRand
control groups (HE) weaned in December, were
significantly higher (P<005; P<001) than the mean
progesterone levels in the TRgroup (HE)weaned in
April -087vs 066 ng/ml and 1.01 vs 066 ng/ml,
respectively. The controlgroup(HE)ofthe December
weanedkidsalsomaintainedasignificantlyhighermean
progesterone level than either the PR group (LE)
(P<005) the TRgroup (LE) (P<001) or the control
group (LE) (P<005) weaned in April. However, the
meanprogesterone levels ofbothTRgroupsweanedin
December were lower than those ofthe control (HE)
groupweanedin April(P<005andP<001 forthe HE
andLEdiets, respectively).
Only50%ofthe male stimulated kids(both levels
ofnutrition)weanedin Decemberdemonstrated at least
one oestrous period,comparedto833%ofthefemales
weanedin April.
Discussion
Itwould seem thatthe age at onset ofpubertyin Boer
goat does compareswellwith and,in fact,is somewhat
earlier than in most goat breeds such as the Saanen
(2179 days),Angora (240 days), Black Bengal (1965
days) and Barbari nannies (213 days) (Riera 1982;
Amoahand Bryant 1984b; Bhattacharyya et al 1984).
Valuesfor meanbodyweightandage ofthe Boer
goat doe at first oestrus recorded are in agreementwith
results obtained elsewhere on goats (Riera 1982). The
mean bodyweights at first oestrus for Boer goat kids
born in January andAugustwere 31.1 kgand27.4 kg,
respectively,comparedto300kgforSaanen kidsborn
Small RuminantResearch NetworkWorkshop 277

Greyling
Serum LH concentration
(ng/m)
14 -
12 -
10 -
Permanentramgroup
14 -
12 -Teaser ramgroup
14 -
12 -
10 -
Controlgroup
I T T T T
6 8 10 12 14 16 18 20 22 24 26 28
Weeksfollowingweaning
Figure3.Serum LH concentrations(tSE) ofBoergoat kids subjected to different male treatments(weanedApril)on ahigh energy
diet.
278 SmallRuminant Research NetworkWorkshop
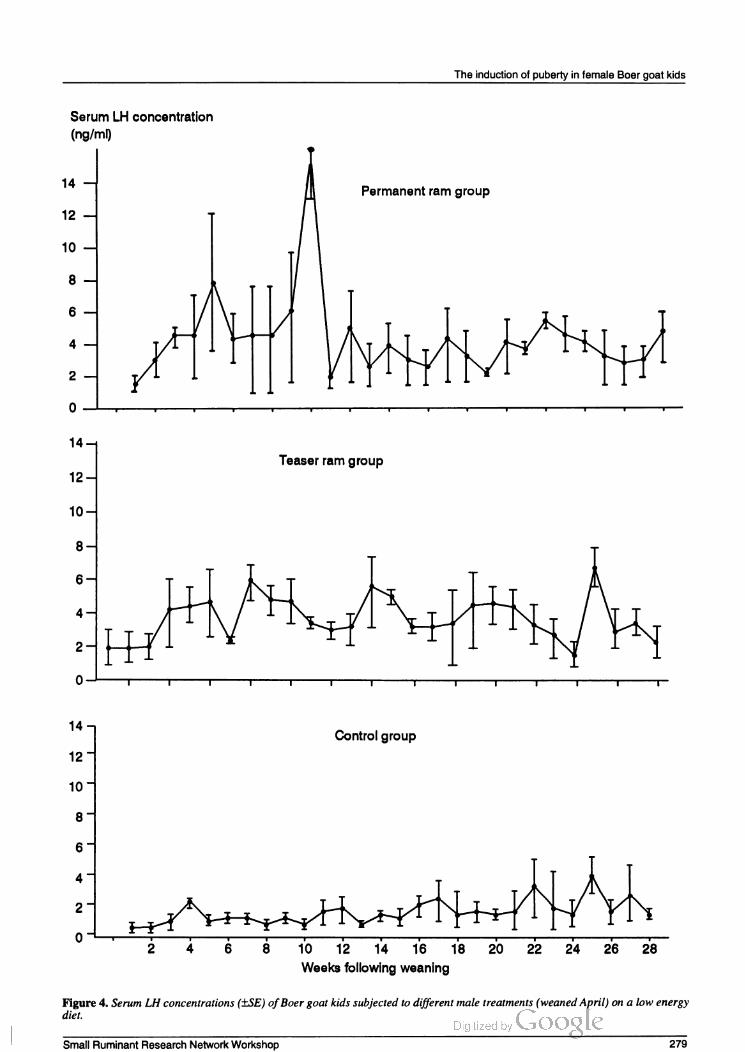
Theinduction ofpubertyinfemale Boergoatkids
Serum LH concentration
(ng/m)
14 - | Permanentramgroup
12 -
10 -
14-
Teaser ramgroup
12
10
14-
Controlgroup
12 -
10 -
- ─ T- T
2 4 6 8 10 12 a 6 e 20 22 2a 26 28
Weeksfollowingweaning
Figure4.Serum LH concentrations( ESE) ofBoergoat kids subjectedto different male treatments(weanedApril)on a low energy
diet.
Small RuminantResearch NetworkWorkshop 279

Greyling
in March/April (Amoah and Bryant 1984a). In the
present study,kidsweanedinApril(duringthe normal
breeding season) exhibited oestrus significantly
(P<005) earlierthan those weanedin December.This
phenomenon cannot be ascribed to a higher mean live
weightwithin the respective kiddingseasons,the level
ofnutrition orthe ram-effect. Itwouldseem asifseason
of birth is the main cue for the onset of puberty.
According to Quirke (1979), once ewe lambs have
attained a criticalbodyweightnecessaryfor attainment
ofpuberty, differences in live bodyweight have little
influence on the time of onset ofpuberty. There is,
however,good evidence thatinadequate nutrition may
adversely affect pituitaryfunction (Lamming 1969).
Emanatingfromtheoestrousresponse, itis evident
that thepermanentpresence ofamale didhaveamarked
(P<005) beneficial effect on the number of animals
exhibiting oestrus, inboth seasons. Amoahand Bryant
(1984a) suggestedthat contactwiththe male goat does
havean effect onthetiming ofpubertyandis associated
with rapid and highlysynchrous attainment ofpuberty
inthe majority ofkids.
The longinter-samplingperiod (weekly), aswell
as the variation in serum LH levels obtained between
individuals within groups, tend to complicate the
interpretation ofthesehormone levelsrecorded.TheLH
patternin thepre-pubertalfemale goat is characterised
bypulsatile or episodic LH releases. In the ewe lamb,
these rhythmicLHelevations firstappearbetween4and
11weeks ofage.The transition ofthe adult ewe from
anoestrusintothe breedingseason,is associatedwith a
marked reduction in response to oestradiol much the
same as in the lamb duringpuberty (Foster and Ryan
1979). From serum LH concentrations recordedin the
Boergoat, itis evident that the pituitary is active from
13 weeks of age (weaning) irrespective of season,
ram-effect or level of nutrition, although the time
intervalbetween blood samplingwastoo longto obtain
reliable pre-ovulatory peak LH values.The fact that
animals weaned in April maintained a significant
(P<005)highermeanLHlevelthan animalsweanedin
December,mayindicate greaterpituitary activityduring
the breedingseason (April).
The possible high occurrence of silent heats or
oestruseswithout ovulationis emphasisedbyindividual
serum progesterone profiles recorded during the
respective observation periods.Several kids have been
foundtoshowelevated progesterone levels (>10ng/ml)
for one or more consecutive weeks,without any overt
signs of oestrus. This occurrence of silent heats or
oestruswithout ovulation is aphenomenon which also
frequently occurs in ewe lambs at, and following
puberty(Edey et al 1978). Fromtheserumprogesterone
values obtained,it seemsthat ovarian activitystartedin
the high- and low-energy dietgroups at approximately
76t35and9.1+43weeksfollowingweaningfor kids
weanedinDecemberandat7.6E3.5and12.7-t6.8weeks
afterweaningforthekids weanedinApril.Thesevalues
correspond well tothe mean age atwhich first oestrus
was recordedin the Boergoat. The meanprogesterone
values obtained at first oestrusin the present study are
in agreementwiththose recordedinpre-pubertalsheep,
viz03 ng/ml(Berardinelli et al 1980)andwith those
recordedingoats,viz02-04ng/ml(AmoahandBryant
1984a)and029-053ng/ml(Bhattacharyyaet al 1984).
Conclusions
Contactwith male goats didhave abeneficial effect on
synchronisation and timing ofpuberty, entrained by
photoperiodicstimulation,while nutrition,as appliedin
this experiment,played a minor role.The effect ofthe
interaction between these factors on puberty is,
however,difficulttoassess. Itwould appearthat during
the pre-and post-pubertalperiod, cyclic activity ofthe
younganimalisrather erraticandirregular andbreeding
atsuch an age isimpractical and not advisable. Further
research is neededto elucidate the relative importance
of male stimulation on the initiation of puberty,
especiallyin relationtootherenvironmental(seasonand
nutrition) cues.
References
Amoah E.A. and BryantM.J. 1984a.A note onthe effect of
contact with male goats on occurrence ofpuberty in
femalegoat kids.Animal Production 38:141.
Amoah E.A. and Bryant M.J. 1984b. Effect of pattern of
lighting andtime ofbirth on occurrence ofpubertyin
femalegoat kids.Animal Production 38:83.
BerardinelliJG., DaileyR.A., ButcherR.L. andInskeepEK.
1980.Source ofcirculating progesteronein prepubertal
ewes. Biology ofReproduction 22:233.
BhattacharyyaB., SanwalPC. PandeJK. andVarshneyVP.
1984. Plasma levels of sex hormones in female kids
approaching puberty. Animal Breeding Abstracts
52.758
EdeyT, KilgourR. andBremnerK. 1978. Sexualbehaviour
and reproductive performance ofewe lambs at and after
puberty. Journal ofAgricultural Science (Cambridge)
90:83.
FosterD.andRyanK. 1979. Mechanismsgoverning onset of
ovarian cyclicity in puberty in the lamb. Annales de
BiologieAnimale,Biochimie, Biophysique 19:1369.
Lamming G.E 1969. Nutrition and reproduction. In:
Cuthbertson D. (ed),The Science ofNutrition ofFarm
Livestock Part 1. PergamonPress, London,UK.p.411.
Niswender H.D., Reichert L.E.J.R., Midgley A.R. and
NalbandovAV. 1969. Radioimmunoassayfor bovine
andovine luteinizinghormone.Endocrinology84:1166.
OttR.S., NelsonD.R. andHixonJE.1980. Effect ofpresence
ofthe male on initiation of oestrous activity ofgoats.
Theriogenology 13:183.
Quirke J.F. 1979. Oestrus, ovulation, fertilization and early
embryomortalityinprogestagen-PMSGtreatedGalway
ewe lambs. IrishJournalAgricultural Research 18:1.
RieraS. 1982. Reproductive efficiency and managementin
goats. In: Proceedings of the Third International
Conference on Goat Production and Disease, Tuscon,
280 SmallRuminantResearch NetworkWorkshop

Theinduction ofpubertyin female Boergoatkids
Arizona, USA, 10-15 January 1982. Dairy Goat
PublishingCo.,Arizona,USA. pp. 162-174
SheltonM. 1977. Management ofproduction in thegoat. In
Proceedings of a Symposium in Management of
Production in Sheep and Goats, Madison, Wisconsin,
24-25July.p. 134
SheltonM.1978. Reproductionandbreedingofgoats.Journal
ofDairyScience 61:994.
Smith M.C. 1978. Some clinical aspects of caprine
reproduction. Cornell Veterinarian (supplement 7)
68:200.
SnedecorG.W. andCochranWG. 1980. Statistical Methods.
7th edition. IowaState University Press,Ames, Iowa,
USA.507pp.
Youssefnajadian E., Florensa E., Collins W.P. and
Sommerville I.F. 1972. Radio-immunoassay ofplasma
progesterone.Journal ofSteroidBiochemistry3893
Induction de la pubertéchez des chevreauxfemelles de race Boer
Résumé
L'effetde lasaison,de la nutritionetde laprésence
d'un bélier au début de la puberté a été étudié sur des
chevreaux femelles de race Boer. La présence
permanente d'un mâle vasectomisé déclenchait la
pubertéplustôt(P<005) que si le mâle était introduit
auxfemelles deuxfoispar jour.Larationà niveau élevé
d'énergiedéclenchaitégalement la pubertéplus tôtmais
ceteffet n'étaitpastrès différent(P>005)de celuide la
ration à faible niveau d'énergie. Les chèvres femelles
Boer nées en été et sevrées en automne atteignaient la
pubertéplustôt(P<005)que celles nées auprintemps
et sevrées en été. Les résultats de cette étude montrent
qu'on peut manipuler les fonctions de la reproduction
comme lapubertéchezlesjeuneschèvresfemelles Boer
grâceà destechniques d'élevage telles que laprésence
permanente du mâle, une bonne alimentation et un
sevrage etunegestionstratégiques.
Small RuminantResearch NetworkWorkshop 281


Milkproductionfrom theindigenousMalawigoat
RA. Cooper"JA. Kirk "L. Kamwanja* and J. Banda*
I. Seale-Hayne Faculty ofAgriculture, University ofPlymouth
NewtonAbbotTQ126NQ, UnitedKingdom
2. BundaCollege ofAgriculture, University ofMalawi
Box219, Lilongwe, Malawi
Abstract
In a 2x2 factorial trial involving80 does kept under
traditional management, the milking potential of the
indigenousMalawigoatwasdetermined andthe effects
ofsupplementaryfeedingexamined. Feedingwasbased
ongrazedindigenouspasture, largely Hyparrheniaspp
onlyandwith supplementation of250-t10gmaize bran
daily. Doeswereseparatedfromtheirkids each evening
at housing and hand milked before turn out. Kiddings
occurredbetweenJuly1991andApril1992.Milkyields
from25+3dayspost-partumvariedbetween 1.5and61
litres per lactation and lactation length between 13and
252days. Lactationpatternswere similar,withpeaks of
270+99 ml on day 26 for supplemented animals and
259+99 ml on day 19 for controls but a significant
interaction between date of kidding and
supplementationwasnoted.Does kiddinginAugusthad
higher yields (31.6E17.5 vs 21.2E13.66 litres for
supplemented and unsupplemented does, respectively)
than those of does kidding in March (177E7.5 vs
9.1+5.7 litres, P<0.05). Mean daily yields for
supplemented doeswere 191 ml over weeks 1-10and
139 ml over weeks 1-20. For control animals the
equivalent figures were 158and 104 ml. Reproductive
performancewas notaffectedbymilking,with kidding
to first oestrus intervals of110+57daysforthe milked
does and 80-t52 days for unmilked does. Anoestrus
periodwas not affected bysupplementation. Most kid
mortality occurred in the first 30 days and was not
influenced by milking or level of supplementation.
Therewas no effect of doe treatmentupon kid growth
to 28 weeks, when live weights were 725E087 kg,
763E0.75 kg, 6.75E0.66 kg and 733E06 kgfor the
unmilked and unsupplemented; unmilked and
supplemented;milked andunsupplemented,and milked
supplemented animals, respectively. Itisconcludedthat
with minimal modification of traditional husbandry
methods the indigenous Malawi goat may be milked
dailywithout detrimenttoher orher offspring.
Rationale
It has been estimatedthatin some areas ofMalawithe
incidence ofmalnutrition in children under the age of
five years may be as high as 70%. The problem is
particularly severe in those children who have been
weanedoffbreast milkandwhoarenowrequiredtorely
largely on phala'(maize mealgruel). In manyareas of
theworldmilkis seen asbeing ofspecialbenefittosuch
children,providinghigh qualityprotein andhigh levels
ofminerals, especially calcium andvitamins,in avery
palatableform. Forsome,the mostusualsource ofthat
milkisthe cowbutformany,it isthegoat. In excess of
60milliongoatsarecurrentlybeingmilkedworld-wide,
producing nine million tonnes ofmilk annually (FAO
1990). Many ofthese milkinggoats are tobefound in
Africa, especially in the Arabic-speaking countries to
the north while, despite thepresence oflarge numbers
ofgoatsin sub-SaharanAfrica,the practice ofmilking
them is uncommon in the area. Malawi is a good
example ofthissituation.
Estimates ofthe number ofgoats in Malawivary
between one million (Zerfas,personal communication)
and 1.6million(Government ofMalawi1988)andyet,
with the exception ofa few areas,these goats are not
milked.Theredoesnotappeartobeanycustom ortaboo
prohibitingthe drinking ofgoat milk(Chimwaza 1982)
and in a recent surveyBanda(1992a)showedthatgoat
milkwas acceptable to manypeople and was,indeed,
preferredtothat ofthe cow or the sheep.
Theaim oftheproject reportedherewastherefore
to examinethe potentialofthe indigenous Malawigoat
as a milkproducer,when managed under a system as
similar aspossible tothatpractisedin the villages, and
in particularto answerthe following questions :
1. Howmuch milk,perdayandper lactation is onedoe
capable ofproducingwhen milked once aday?
2. Whateffectdoesthe removalofthis milkhave onthe
survival andgrowth rate ofthegoatkids?
3. Isitpossible,bysupplementing"bush"grazingwith
maize bran,toincrease milkyields economically?
Materials and methods
This trial was undertaken at Bunda College of
Agriculture,University ofMalawi, during 1991-92. In
ordertomimictraditionalmanagementasfaraspossible
animals grazed unimproved grassland as their main
forage source but duringthe dryseason theyhadaccess
to maize stover in fields and to tobacco gardens.
Animalswere broughtinfromgrazingbefore dusk and
turned out immediately after milking each morning.
Housing was constructed of blue-gum poles and
chain-link fencing under galvanised iron roofing.
Small RuminantResearch NetworkWorkshop 283

Cooper etal
Individual pens were approximately 4x4 m and each
housed 10-14 does andtheir kids.Waterwas available
inthepens overnight. Halfofthe animalsinvolved(n=
40)were offered a supplementaryfeed of250t10g of
maize bran daily, fed in the pen each morning before
turnout. Halfofthe animalsin eachgroupwere milked
once dailyin the morning.These animalswereremoved
from their kids each evening at housing and penned
separately. The following morning each doe was
hand-milked before being rejoined with her kid(s)for
the day's grazing. Milking began 25t3 days after
kiddingandusually continueduntilyield fellbelow50
ml/dayforthreeconsecutive days. Doeswhich lost their
kid(s)were removedfrom the trial.Thusthe effective
trial design was a 2x2 factorial with two levels of
supplementation andtwo levels ofmilking.
Animals were blocked by week of kidding,
beginning on 1 July 1991 and allocated to treatment
within block,accordingto litter size. Milkingcontinued
untilSeptember 1992and atotal of50 lactationswere
recorded. Milkyield for each doe was measured daily
and all oestruses and matings recorded. Does were
weighed regularly and all mortalitieswere noted.
Results
Reproduction
Datafor theperiodJuly1991toJune 1992aregiven in
Table 1.Kiddings tookplace in mostmonths oftheyear.
Overall kidding rate was 142 live births/100 does
kidding.There was no relationship between doe live
weight and number ofkidsborn(the overallcorrelation
being0.1).
Overall kid mortality averaged 335% of live
births. Fewtripletswereborn but mortalitywashigh, at
583%. For single andtwins mortalitywas304% and
35%, respectively.
The majority ofdeathstookplace within the first
30 days after birth, that is, before hand milking had
begun, and were spread throughout the year with no
significant time-of-yeareffect.Treatmentofdamhadno
effect on kid mortality. Numbers dead were 33 from
milked does vs 43 from the unmilked and 33 from
supplemented doesvs42forthe unsupplemented.
In the does, post-partum anoestrus was very
variable, rangingfrom22to214days.Therewasatrend
for longer anoestrusin milkedgoats(110E57days)than
in the unmilked (80t52days)butthe differenceswere
not significant. There was also a tendency for does
kiddingin the dryseason to have longer anoestrus than
those kiddinginthe rains. Leveltofsupplementation had
no effecton anoestrusperiod.
Milkproduction
Milkproduction per doe was extremelyvariable with
yields rangingfrom 1.5to61 litresper lactation. Does
thathadvery lowyields often did not reachthe bottom
limitof50mlperdayandthe decisionwastakento stop
milking them. Lactation length was thus extremely
variable,rangingfrom 13daysfortheverylowyielders
to252daysforthe better animals.
Total lactation yields were not significantly
affected by supplementation. Data, broken down by
month ofkidding and by lactation period, are given in
Table 2, with weekly yield totals shown in Table 3.
Overall, patterns oflactation were notdifferentbetween
treatments with peak daily yield from supplemented
animals reaching 29099 ml at 26 days from
commencement ofmilking(range 140-500 ml)while
equivalent figures for unsupplemented does were
259- 99mlat 19days(range80-450ml).Supplemented
does milkedfor longerthan controls (147+54 daysvs
117-t47 days).There was an interaction between level
of supplementation and month of kidding (Figure 1).
For does kidding in August supplementation had no
effect on yield or persistency. For does kidding in
February/March,with much oftheir lactation after the
end ofthe rainy season,supplementation ledto longer
lactations and significantly higher yields (177E07vs
9.1t1.5 litres, P<005). There was no relationship
betweendoe liveweightatkiddingand subsequentmilk
yield. The correlation coefficients were 0.42 for
supplementedanimalsand0.33forcontrols.The overall
linearregression equationwasy=-18+57w(wherew=
doe liveweightin kg).
Kidgrowth
The liveweights ofkids,byageandtreatment,aregiven
in Table 4. The kids from supplemented does were
consistently heavier than those of unsupplemented
animals while those from unmilked animals were
heavierthan those from milked onesfrom the 8thtothe
Table 1. Kidding performance ofMalawi does, July 1991-June 1992
Month ofkidding
Variable Jul Aug Sept Oct Nov Dec Jan Feb Mar Apr May Jun Total
Type ofkidding(number)
Single 9 9 14 4 2 11 2 13 9 - -
Twin 10 13 1 4 4 1 6 3 3 - -
Triplet - 1 - - - 1 - 1 - - - 1
Does kidding(number) 13 20 27 6 16 15 16 12 - 1 134
Kidsborn alive (number) 17 32 40 6 10 22 4 23 19 15 - 3 191
284 SmallRuminantResearch NetworkWorkshop
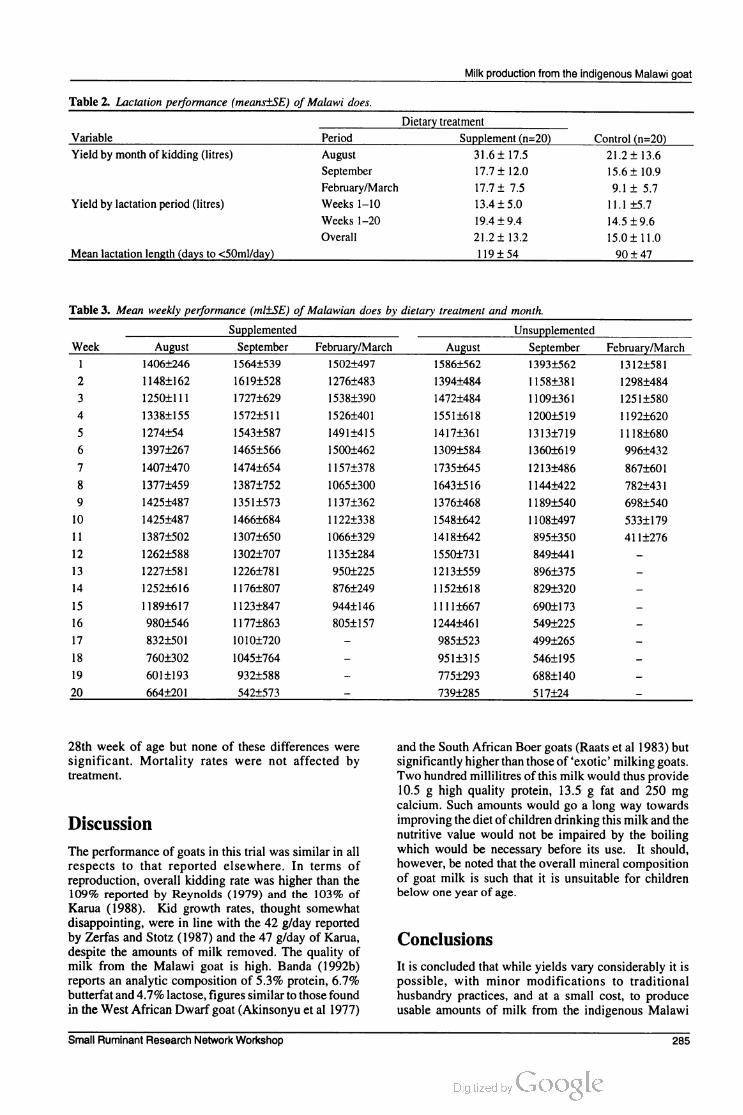
Milk production from the indigenous Malawi goat
Table 2. Lactation performance (means1SE) of Malawi does.
Dietary treatment
Variable Period Supplement (n=20) Control (n=20)
Yield by month of kidding (litres) August 31.6 1 17.5 21.2 1 13.6
September 17.7 1 12.0 15.6 1 10.9
February/March 17.7 1 7.5 9.1 1 5.7
Yield by lactation period (litres) Weeks 1—10 13.4 1 5.0 1 1.1 15.7
Weeks 1—20 19.4194 14.5 19.6
Overall 21.21132 15.01110
Mean lactation length (days to <50ml/day) 1 l9 1 54 90 1 47
Table 3. Mean weekly performance (mliSE) of Malawian does by dietary treatment and month.
Supplemented Unsupplemented
Week August September February/March August September February/March
1 14061246 15641539 15021497 15861562 13931562 13121581
2 1 1481162 16191528 12761483 13941484 1 158fl81 12981484
3 1250111 1 17271629 15381390 14721484 11091361 12511580
4 13381155 15721511 15261401 15511618 1200fi19 11921620
5 127454 15431587 14911415 14171361 13131719 11181680
6 13971267 14651566 15001462 13091584 13601619 9961432
7 14071470 14741654 1 1571378 17351645 12131486 8671601
8 13771459 13871752 10651300 16431516 1 1441422 7821431
9 14251487 13511573 11371362 13761468 1 1891540 6981540
10 14251487 14661684 11221338 15481642 1 1081497 5331179
11 13871502 13071650 10661329 14181642 8951350 4111276
12 12621588 13021707 1 1351284 15501731 8491441 -
13 12271581 12261781 9501225 12131559 8961375 —
14 12521616 1 1761807 8761249 1 1521618 8291320 —
15 1 1891617 11231847 9441146 11 111667 6901173 -
16 9801546 1 1771863 8051157 12441461 5491225 -
17 8321501 10101720 — 9851523 4991265 -
18 7601302 10451764 — 9511315 5461195 ~
19 6011193 9321588 - 7751293 6881140 —
20 6641201 5421573 - 7391285 517124 -
28th week of age but none of these differences were
significant. Mortality rates were not affected by
treatment.
Discussion
The performance of goats in this trial was similar in all
respects to that reported elsewhere. In terms of
reproduction, overall kidding rate was higher than the
109% reported by Reynolds (1979) and the 103% of
Karua (1988). Kid growth rates, thought somewhat
disappointing, were in line with the 42 g/day reported
by Zerfas and Stotz (1987) and the 47 g/day of Karua,
despite the amounts of milk removed. The quality of
milk from the Malawi goat is high. Banda (1992b)
reports an analytic composition of 5.3% protein, 6.7%
butterfat and 4.7% lactose, figures similar to those found
in the West African Dwarf goat (Akinsonyu et a1 1977)
and the South African Boer goats (Raats et a1 1983) but
significantly higher than those of ‘exotic’ milking goats.
Two hundred millilitres of this milk would thus provide
10.5 g high quality protein, 135 g fat and 250 mg
calcium. Such amounts would go a long way towards
improving the diet of children drinking this milk and the
nutritive value would not be impaired by the boiling
which would be necessary before its use. It should,
however, be noted that the overall mineral composition
of goat milk is such that it is unsuitable for children
below one year of age.
Conclusions
It is concluded that while yields vary considerably it is
possible, with minor modifications to traditional
husbandry practices, and at a small cost, to produce
usable amounts of milk from the indigenous Malawi
Small Ruminant Research Network Workshop 285

Cooper et al
18
1 16
Supplemented
Unsupplemented
111
1214
1 8
10
Weekoflactation
c.February/Marchkidding
T 6
17 16~
15e
Unsupplemerrted'
‘I
1f111
81012141818
Weekoflactation
b.Septemberkidding
-—-—Supplemented
17
\
1111 12141618
1 1O
a.Augustkidding
I e
I
—Supplemented
Unsupplemented
ll
8
Weekoflactation
l l
N D 10
v- w- \
Figure 1. Mean milk yield per week by month of kiding (dl).
286 Small Ruminant Research Network Workshop

Milk production from the indigenous Malawi goat
Table 4. Weights (mean 1 SE kg) of kids born in year l99l—92 by age and treatment group.
Treatment
Non-milked Milked
Age (wks) Non-supplemented Supplemented Non-supplemented Supplemented
Birth 1.8810125 1.881008 1.781007 2.00101 1
4 3.0010102 31410.09 3.061003 3.181024
8 3.421046 3.601019 3.171011 3.591020
12 4.171036 4.501079 3.961018 4.321029
16 4.831022 5.191065 4.551027 5.051029
20 5.581046 5.881059 5.251037 5.731036
24 6.251076 6.56:0.58 5.881052 6.391042
28 7.251087 7.6310.55 6.7510.66 7.33:0.60
52 140011.73 136713.76 132511.03 15.671088
goat; removing this milk does not have any adverse
effects on the doc or her offspring, and the milk so
obtained is capable of contributing significantly to the
diets of children aged between one and five years in the
households in which the goats are kept.
Acknowledgements
The help and encouragement of the Principal and all the
staff at Bunda College is gratefully acknowledged. This
work was funded by the Natural Resources Institute of
the UK Overseas Development Administration.
References
Akinsonyu O.A., Mba AV. and Olubajo F0. 1977. Studies
on the milk yield and composition of West African
Dwarf goats. Journal ofDairy Research 44:57—62.
Banda J.W. 1992a. Acceptability of goat’s, sheep’s and cows'
milk in Malawi. Journal of Consumer Studies and
Home Economics 16:129—138.
Banda 1W. 1992b. Genotypic andSeasonal Influences on Milk
Yield and Composition of Sheep and Goats in Malawi.
PhD thesis, University of Giessen, Germany.
Chimwaza B. 1982. FoodandNutrition in Malawi. PhD thesis,
Queen Elizabeth College, London, UK.
FAO (Food and Agriculture Organization of the United
Nations). 1990. Quarterly Bulletin of Statistics 3(4).
FAO (Food and Agriculture Organization of the United
Nations), Rome, Italy.
Government of Malawi. 1988. National Sample Survey of
Agriculture. Government Printer, Zomba, Malawi.
Karua S. 1988. Reproductive performance of indigenous
Malawi goats under traditional management. Mimeo.
Goat Development Workshop, Bikika, Zimbabwe.
Raats J.G., Wilke PI. and Du Toit J.E.J. 1983. Effect of age
and litter size on milk production in Boer goats. South
African Journal ofAnimal Science 13:240—243.
Reynolds L1. 1979. Breeding performance and growth rates
of indigenous Malawi goats. Bunda College ofResearch
Bulletin 10:90-100.
Zerfas HP. and Stotz D. 1987. An Account ofOn-farm Goat
Research. Malawi-German Livestock Development
Programme Working Paper 6. Malawi—German
Livestock Development Programme, Lilongwe,
Malawi. 8 pp.
Production laitiere des chevres locales du Malawi
Résumé
Une experience factorielle 2 x 2 a été effectuée
pour determiner les potentialités laitieres et l’effet de la
complémentation alimentaire sur 8O chevres locales du
Malawi élevées en systeme traditionnel. L’alimentation
était a base de pfiturages locaux constitués
principalement d’Hypparrhenia spp uniquement ou
complémente's avec 250110 g de son de mais par jour.
Les meres étaient séparées des petits et logées 1e soir au
coucher puis traites a la main 1e matin avant de partir
pour les piturages. Les mises bas ont eu lieu entre juillet
1991 et avril 1992. La production de lait a partir de 25 1
3 jours apres la parturition variait de 1,5 a 61 litres par
lactation pour une dure'e de lactation comprise entre 13
et 252 jours. Les caractéristiques de la lactation des
sujets recevant une complémentation était similaires a
celles des autres animaux, avec un maximum de 270199
ml au 26eme jour chez les premiers et de 259199 ml au
l9eme jour chez les seconds. Toutefois, il existait une
Small Ruminant Research Network Workshop 287

Cooper etal
interaction significative entre la date de chevrotementet
la complémentation. Les femelles qui mettaient bas en
août produisaient plus de lait (31,6t17,5 contre
21,2E13,66 l respectivementpour les animauxà ration
complémentée et les autres)que celles qui chevrotaient
en mars(177E7.5 contre9,1+5,7litres, P<005).Avec
la complémentation, laproductionmoyenne de lait était
de 191 ml/jourentre la 1ère et la 10èmesemaines et de
139ml/jourentre la 1ère etla20èmesemaines. Latraite
n'avait pasd'effet sur lesperformances dereproduction,
et l'intervalle entre la mise bas et l'oestrus suivant était
de 110-t57jours chez les animauxtraits contre 80-t52
jours chez les autres. La complémentation n'avaitpas
d'effetsur la durée de l'anoestrus. Les cas de mortalité
de chevreaux étaient essentiellement concentrés sur les
30 premiers jours. Ni la traite ni le niveau de
complémentation n'avaient d'effet sur le taux de
mortalitédesjeunes.Letraitementde lamère n'avaitpar
ailleurs aucun effet sur la croissance des jeunes
jusqu'à 28 semaines, les poids vifs à cet âge étant de
725t0,87 kg (sans traite ni complémentation),
763t075kg(sans traite mais avec complémentation),
6,75t066 kg (traite mais sans complémentation) et
7,33t0,6 kg (traite et complé mentation). On peut
conclurequ'avecde légères modificationsdes méthodes
d'élevage traditionnel, il est possible de traire les
chèvres locales du Malawi chaque jour sans
conséquence nipour elles-mêmes, nipour leurspetits.
288 SmallRuminantResearchNetworkWorkshop

Synchronisation des chaleurs etgestion de lutte chez
le mouton Djallonké
A. Traoré , YN Hadzi* etAA. Midekor
Centre d'appuitechnique de Kolocopé(CATK)
Programme nationalPetitélevage (PNPE)
B.P.65Atakpamé(Togo)
"Expert FAO, Responsable de la recherche appliquée
* Directeur duCATK
3 Stagiaire, Ecole supérieure d'agronomie de l'Universitédu Bénin
Résumé
Cetessaiestunecontributionà la maîtriseducycle
sexuel età l'étude de la fertilité du mouton Djallonké.
Ilaportésur l'étude de laréponse de labrebis Djallonké
à la synchronisation des chaleursàl'aide de l'acétate de
fluorogestone ainsiquesurle comportementsexuelet la
fertilitédubélier Djallonké soumisà différents régimes
de saillies. Les résultats de cet essai révèlent que les
brebis Djallonké répondent de façon satisfaisante à la
synchronisation des chaleurs par l'acétate de fluoro
gestone suivie de l'injection d'un ovulatoire, la
gonadotrophine sérique de jument gravide (PMSG).
Par ailleurs,onpeututiliser les béliers Djallonkédans le
cadre d'un régime de6sailliesparjour pendant6jours
successifs sans affecter leur fertilité. Des études
supplémentaires sont nécessaires afin de connaître
d'une part le seuil optimal des saillies exigibles par
bélier, et d'autre part la dose optimale de PMSG en
rapport avecuntauxde prolificité raisonnable.
Introduction
Devant l'envergure désormais nationale de son
programme d'amélioration génétique ovine, le Centre
d'appui technique de Kolocopé envisage la mise en
oeuvre d'un programme plus dynamique,basésurune
stratégie desélectionànoyau ouvert,faisant appelàune
large base de sélection couvrant l'ensemble du pays
(Traoré,1991).Ceprogramme prévoitàmoyenterme le
testage des béliers destinésà la lutte en lignée sur la
descendance. Ce test, pour être efficace, devrait se
dérouler dansun délaibrefetpermettre la comparaison
d'un nombre suffisant de descendants par bélier. Aussi
était-il intéressant d'étudier les voies et moyens d'une
optimisation de la méthodede reproduction en cours au
Centre. Laprésente communication portesur laréponse
de la brebis Djallonké à une synchronisation des
chaleursà l'aide de l'acétate de fluorogestone etsur le
comportement des béliers Djallonké soumis à des
régimes de sailliesplusoumoins intensifs.L'incidence
de l'intervalle mise bas/pose d'éponge ainsi que
l'influence de la dose dePMSGsur le délai d'apparition
et la durée des chaleurs feront l'objet d'une commu
nication ultérieure.
Matériels et méthode
Le Centre d'appui technique de Kolocopé
(CATK), créé en 1980 dans le cadre du Projet de
développement de l'élevage des petits ruminants au
Togo(PNPR) est situé dans la région des plateauxà
environ45kmaunord-estd'Atakpamé.Ilavaitpourrôle
essentiel: de servir de centre de démonstration des
techniques d'élevage améliorées des petits ruminants;
deproduire desanimauxsélectionnésàdiffuserdans les
fermes ovines améliorées encadrées par le projet; de
former des bergers et des éleveurs ainsi que des
techniciens et des étudiants aux techniques d'élevage
despetits ruminants;et de servir de cadreà la recherche
d'accompagnement envue de l'amélioration constante
de messagestechniques diffuséspar leprojet.
Matérielanimal
Lesanimauxutiliséspour l'essaisontdes moutons
de race Djallonké dont: 144 femelles âgées de 12à
34 mois vides de 2564E3,1 kg de poids moyen; 6
géniteurs de poids moyen47,33 kgâgés de41 mois; et
quelques mâles porteurs de tablier utilisés comme des
béliers détecteurs de chaleurs.
Conduite de l'élevage
Le cheptel ovin du centre,d'un effectifmoyen de
1700 têtes, est composé: de 750 brebis Djallonké
répartiesen5troupeauxde 150têtes;d'une quarantaine
de géniteurs répartis en 5 lignées; et d'un troupeau
d'antenais et d'antenaises d'effectifvariable. Le mode
dereproduction est lalutte contrôlée en cycle de8mois.
Il nécessite l'utilisation des béliers par lignées (les
béliersde chaque lignéeeffectuant2luttes consécutives
dans un même troupeau de brebis). En matière
d'alimentation, les animaux exploitent les parcours
Small Ruminant ResearchNetworkWorkshop 289

Traoré etal
naturels et les parcelles fourragères de Panicum, de
Leucaena et de Cajanus, et reçoivent en complément
toute l'année environ350gdegrainesde coton partête
et par jour. Les sels minéraux leur sont fournis ad
libitum.
Matérielet technique desynchronisation
Matériel
Le matérielde synchronisation utilisécomprenait
un "freinateur" ou agent anovulatoire: l'acétate de
fluorogestone sous forme d'éponge vaginale dosée à
40 mg (éponges pour agnelles); un ovulaire: la
gonatrophine sérique dejumentgravide (PMSG)sous
forme d'injection intramusculaire; et un ensemble
d'instruments et de produits nécessairesà lapose et au
retrait des éponges.
Synchronisation
Les brebis ont été graduellement soumises aux
opérations de synchronisation de chaleur surlabase des
prévisionsjournalières de saillies.Chaquebrebis reçoit
uneéponge vaginale doséeà40mgd'acétate defluoro
gestone, retirée après 14jours.Ce retrait est suivid'une
injectionintramusculaire de400mgdePMSG.
Saillies
Chaque bélier s'est vu affecté une trentaine de
brebissynchroniséesàdifférentesdatesenprévisiondes
régimes desaillies.Aprèsdétection des chaleursà l'aide
de béliers portant des tabliers le matin à 7h et
l'après-midià 15h,lesbrebisreconnuesen chaleurs sont
présentées à 12h d'intervalle à la saillie parun bélier
choisiselon le régime.
Retour en chaleurs
Des contrôles ont eu lieu à partir du 15ème jour
après la sailliepourconfirmer laréussite de celle-ci. Les
femelles retournées en chaleurs sont présentées à
nouveauà la saillie (2sautsà 12 h d'intervalle).
Analysesstatistiques
Lescalculs et lesanalysesstatistiques des données
sont réalisés à l'aide du logiciel STAT-ITCF. Des
analyses de variance et des tests de khi-deux ont été
effectuéspourétudier l'effetdurégime de saillie surles
tauxde retour en chaleurs,defertilité,de féconditéetde
prolificité.
Résultats et discussions
Compte tenu desvariationsdansla disponibilitéde
femelles en chaleurs, les régimes de saillies ontété de3
saillies parjour et par bélier au lieu de 4pour le 1er
régime. Letauxde synchronisation observé au coursde
cette étude (n=144)aétéde9722%.L'étude comparée
des deux régimes de saillies dont les résultats sont
présentés au tableau 1 donne destaux de 137,78% et
120,61% de féconditétotale et 186,41%et18320% de
prolificité respectivementpour les régimesde3saillies
et6sailliesquotidiennesparbélier.
Le tableau 2 donne les moyennes des différentes
performancesparrégime avecousanslebélierN*89179
quiamanifestédes signesévidentsdefaible fertilité.Les
analyses devariance des différentstauxde reproduction
n'ontpaspermis de mettre en évidence des différences
statistiquementsignificatives.
Le taux de synchronisation observé au cours de
cetessai est dumême ordre degrandeurque les chiffres
de 100et91% rapportéspar Lahlou-Kassiet Boukhilq
(1989) respectivement pour les races D'man et
Timahdite synchronisées avec de l'acétate de
fluorogestone etune dose de 400UIde PMSG.On ne
dispose que detrèspeud'informations surla réponse de
labrebis Djallonkéàune synchronisation des chaleurs.
En Côte d'Ivoire, il a été rapportéun taux de 87% de
femelles en chaleurs après une synchronisation à base
de 40 mg d'acétate de fluorogestone suivie d'une
injection de300UIdePMSG(TouréetMeeusen 1980).
Lors d'un essai antérieur mené au CATK, les brebis
synchronisées onttoutesétéinséminées entre56h et57h
en moyenne après le retrait deséponges sans détection
préalable des chaleurs (Rouleau, 1988); bien que des
variations des paramètres de reproduction enregistrés
aient été notées dans les deux régimes de saillies
(tableau 2), les tests statistiques indiquent qu'ils ne
présententpas de différence significative.(Tableau 1).
Par conséquent, on pourrait envisager d'utiliser
sanspréjudiceà leur fertilité les bélierspourun régime
de 6 saillies par jour pendant 6jours. Cela poserait
d'autant moins de problèmes que ces géniteurs
sortiraientd'unepériode derepossexuel.Cependant, les
différences observées entre différents béliers d'un
même régime montrent l'intérêt du suivi de la fertilité
desgéniteurs.Dans laprésente étude, le bélierN"89179
adonnédesperformancesinférieuresà celles des autres
(tableau 2). Son exclusion améliore les résultats du
régimeà6saillies (tableau3).
Les examens macroscopiques et microscopiques
de son sperme, bien qu'effectués8semaines après son
utilisation, ontpermis d'en attester la mauvaise qualité
(présence de sang,faible motilité, etc.).
Le taux de fertilité de cet essai esttrèsproche de
celui rapporté par Rouleau (1988) et où les brebis
avaient été inséminées après synchronisation sans
détection préalable des chaleurs (69,77% contre 69%).
Cecidénote la trèsbonne réponse de labrebis Djallonké
à la synchronisation des chaleurs. La prolificité
moyennede 184,80% estplus élevée que celle indiquée
par Amegée (1978), Armbruster (1987) et Dettmers
(1976). Malgré la présence du bélierN"89179, l'écart
peu prononcé entre les taux de prolificité des deux
régimes montre que ce paramètre zootechnique dépend
beaucoupplus de la femelle que du mâle. Le tauxtrès
élevé enregistré est probablement dûà la forte dose de
PMSGutilisée(400UI).Maisilconvientdesignalerque
Rouleau(1988)obtenaitégalementuntauxdeprolificité
290 Small RuminantResearch NetworkWorkshop

Synchronisation deschaleurs chezle mouton Djallonké
Tableau 1:Principaux paramètres de reproduction chez les brebis selon les régimes de saillies et les béliers
Régime
3 saillies/Bélier No. 6 Saillies/Bélier No.
Paramètre 89113(n=21) 2474(n=23) 915(n=29) 89190(n=23) 004(n=19) 89179(n=25)
TRC(%) 14,2 21,7 207 13.4 21,1 44
TFr(%) 68,2 68 86,2 783 70 48
TFc(%) 118,2 140 1552 1478 130 84
TP(%) 1733 2059 180 1889 1859 175
n=nombre de brebissynchronisées
TRC :tauxde retour en chaleur
TFr :taux defertilité(brebisgestantespar rapport auxbrebis synchronisées)
TFc :taux defécondité(nombre d'agneaux néspar rapport auxbrebissynchronisées)
TP :taux deprolificité(nombre d'agneauxpar rapport auxbrebis ayant misbas).
Tableau2.Moyennes desparamètresde reproduction chez les brebis dans les deux régimes de saillies avec ou sans le bélier
n ° 89179
6 saillies
3 saillies2=73 avec le sans le
Paramètres* No. 89179p = 67 No. 89179 n=42
TRC(%) 1848 27.48 19.22
TFr(%) 74,13 65,42 74,13
TFc(%) 13778 120,61 13891
TP(%) 1864 18320 1873
élevéavec des doses de250à275UIdePMSG. Pour le
mouton Djallonkéqui n'estpas unebonne laitière, cette
situation n'estpas souhaitable car elle entraîne un fort
taux de mortalité. Dans la présente étude, le taux de
mortalité a été de 16,02% contre 1,76% au CATK en
1990(Hadzi, 1990). L'incidence de la dose de PMSG
sur les caractéristiques des chaleurs et les taux de
prolificité doivent donc faire l'objet de travaux plus
poussés.
Conclusion
Les résultats de l'étude de la maîtrise de la
reproduction du mouton Djallonké ont conduit aux
conclusions préliminaires suivantes: les brebis
Djallonké répondent de façon satisfaisante aux
techniques de synchronisation par l'acétate de
fluorogestone suivie d'injection de PMSG; les béliers
Djallonképeuventêtreutilisésdans le cadred'unrégime
de6sailliesparjourpendant6jourssuccessifssansune
baisse sensible defertilité; la poursuite de l'essaisur les
régimes de saillies est nécessaire afin d'approcher le
seuil optimal de saillies pouvant être effectuéespar le
mâle sans porter préjudice à sa fertilité; et il serait
souhaitable de mener des essais destinés à étudier
l'influence de différentesdoses dePMSGet l'incidence
de l'intervalle detemps entre l'agnelage et la synchro
nisation sur différentsparamètres de reproduction.Cela
permettra de mieux cerner les problèmes relatifs à
l'adaptation des dosesde PMSGauxraces locales.
Références
AmegeeY.1978.Laprolificitédumouton Djallonkéenmilieu
villageois auTogo. Rev Elev. Méd.Vét. PaysTrop.36
(1): pp.85-90
ArmbrusterT. 1987. Laproduction de l'élevage ovin dans la
régionforestière de laCôte d'Ivoire. Rapportprovisoire.
CIPEA,AddisAbeba. 132p.
DettmersA. 1976. Performance ofHairSheepin Nigeria in:
Fitzhugh,H.A.; Gradford,G.E. (eds). 1983. HairSheep
ofWestAfricaandtheAmericas. Boulder.Colorado.pp.
201-218.
HadziYN. 1990. Rapport annuel.Centre d'appuitechnique
de Kolocopé-Projet nationalpetits ruminants,Togo.
Lahlou-KassiAetBouklilqR. 1989.Manipulationdela saison
sexuelle chez le mouton: in African Small Ruminant
Research and Development. Proceedings of a
conference heldatBamenda,Cameroun.pp.329-347.
Rouleau F. 1988. Opérations d'inséminations artificielles
conduites à Kolocopé. Rapport de mission
TCP/TOG/6757-Ministère du développement rural -
Togo.56p.
SmallRuminantResearch NetworkWorkshop 291

Traoré et al
TouréMetMeeusenS.1980.Opération pilote d'insémination
artificielle sur la race Djallonké. Dans Production
Animale en Côte d'Ivoire.- Revue d'information du
ministère dedéveloppement rural,Côte d'Ivoire.
Traoré A. 1991. Programme de sélection ovine au Centre
d'appuitechnique de Kolocopé-Documenttechnique;
avril 1991,CATK/PNPE
Oestroussynchronisation and matingmanagementin
WestAfrican Dwarfsheep
Abstract
This trial is a contribution to better control over the
sexual cycle ofDjallonkésheep and better knowledge
oftheir fertility characteristics.The trial studied the
response ofDjallonkéewestotheuse offluorogestone
acetate for oestrus synchronisation and the sexual
behaviour and fertility of Djallonké rams used for
various service schemes. Results indicated that
Djallonké ewes responded satisfactorily to oestrus
synchronisation using fluorogestone acetate followed
byaninjection ofPregnantMareSerumGonadotrophin
(PMSG), an ovulation-inducing substance. Djallonké
ramscanbeusedin asixtimesadayservice schemefor
sixconsecutive dayswithout affectingtheir fertility.
292 Small RuminantResearch NetworkWorkshop

Reproductiveperformance ofTswana ewes and Boer does
in South-eastern Botswana
D. Seabo,A.A.Aganga andM. Mosienyane
Department ofAnimalScience and Production, Botswana College ofAgriculture
Private Bag0027, Gaborone, Botswana
Abstract
The reproductive performance over a five-yearperiod
(1989-93) ofTswana ewes and Boer does keptunder
semi-intensivemanagementatEstate ManagementUnit
farm ofthe College atSebele-Gaborone,Botswana,was
analysed. A total of70 lambings and 152 kiddings
involving202 lambs and 288 kids were subjected to
statistical analysis.Theparameters studiedwere age at
first parturition(AFP), parturition intervals (PI), annual
parturition rate (APR), birth weight (BW) and
correlation between damweight(DW)andyoungbirth
weight.The resultsshowedthatforTswanaewes,AFP,
PI,APRand BWwere 1800+1.39 months,365+28.50
days, 1.00 and 330+0.89 kg, respectively, while for
Boergoatstheywere 1800E069months,350E24days,
1.00 and323t0.76kg, respectively.Tswanaewes are
seasonal breeders, they lamb in late spring and early
summer(October-December). Maletofemale sex ratio
was 49.0% for the 202 lambs and 52.78% for the 288
kidsrecorded.The rate ofsingleandtwin lambingswere
8059% and 1941%, respectively, while the rate of
single, twin, triplet and quadruplet kiddings were
2829%, 5328%, 1645% and 1.32%, respectively.
Mortality and stillbirths were 3.43% and 0.5%,
respectively, for sheep while mortality, stillbirths and
abortions for goats were 1042%,278% and 066%,
respectively. The analysesshowthatTswana ewesand
Boerdoes are early maturingbreeders.Therewasapoor
correlation (r* = 002 for sheep r*= 004 for goats)
between the dam's bodyweight andtheyoung's birth
weight.
Introduction
Tswana sheep are indigenous to Botswanawhile Boer
goats are imported from South Africa. The Tswana
sheepis fat-tailedwith some coarse negligible wool on
the coat. The coat colour is predominantly black and
white andis mainly kept for mutton.The Boergoat is
whitewitha reddish brownheadandneck.Thegoathas
broad droopy ears,hornsandisusedfor neat, milk and
skin.
In 1990,there were 2096000goats and317000
sheep (MoA 1990); 267,000 sheep were under
traditional management and about 50,000 were on
commercialfarms while abouttwo million goatswere
under traditional management and 62,000 were on
commercial farms.The average flock sizes were 17.5
sheep and 302 goats per farm. Mannathoko (1993)
reportedthat the totalnumberofsheepslaughteredatthe
Botswana Meat Commission (BMC) abattoirs were
5963 and 3573 head for 1992 and 1993, respectively,
while thegoatsslaughteredwere6685and3456forthe
sameyears, respectively.The offtake ofboth sheep and
goats was 1 1.0% (MoA 1990). Small stock play an
important role in the socio-economic life of the
Botswana. Smallruminant ratioto cattle is about44%.
This studyexaminesthe reproductiveperformance
of Tswana ewes and Boer does which are the
predominantbreeds ofsmall stockin Botswana.
Materials and methods
The data forthis studywere collected from a flock of
TswanaewesandBoerdoes keptunderasemi-intensive
system ofmanagement atthe Estate ManagementUnit
(EMU) Sebele-Gaborone, in south-eastern Botswana.
Theflockgrazed dailyforeighthours on naturalpasture
and was housed at night in kraals with corrugated
roofing.Sheepandgoatswerefed lucerne orgroundnut
hay as supplementary feeds in winter and drought
periods.Theywere also provided with bonemeal and
salt or dicalciumphosphate andsaltmixture mixedin a
2:1 ratio as mineral lick.Theflockwastreated against
ectoparasites, e.g. ticks once a week in summer and
every otherweekinwinterandendoparasitesthreetimes
ayear, i.e. everyfour months routinely. Flushing ofthe
ewes and doeswaspractisedjust before matingfortwo
weeks. Mating occurred on pasture usingtwoTswana
rams and two Boer bucks in May-June every year.
Veterinary carewasprovidedwhenever necessary.
The parturition period was October-December
every year; parturition records included sex, birth
weight and type of birth. The analyses covered a
five-yearperiod(1989-93)andinvolved 170lambings
of 202 lambs and 152 kiddings of 288 kids. The
parametersevaluatedwere ageatfirst parturition (AFP),
parturition interval(PI),birth weight(BW)and type of
birth (TB). Data were analysed using descriptive
analysis for means and t-test used to test significant
differences between means atP<005(Steel andTorrie
1980)
Small RuminantResearchNetworkWorkshop 293

Seabo et al
Results
BW, frequency ofTB, stillbirth and preweaning
mortalityvalues are shown in Table 1. Sexwas not a
significant source ofvariation in lamb survival.There
was ahigh incidence ofmultiple birthsinboth species.
Abortionsandstillbirthincidenceswereverylowinboth
species. The average birth weights of singles were
higher(P<005)than those oftwins. In mostyearsthe
maleswere heavier (P<005) at birth than the females.
Therewaspoorcorrelation(r*=002sheepandr*=004
goats)betweendam'sbodyweightandtheyoung's birth
weightin theflock.
Table1. Mean andstandard deviations ofsome reproductive
parameters ofTswana ewes andBoerdoes.
Parameters Tswanasheep Boergoats
Numberofmature breeding 170 152
females
Gestationperiod(days) 15000- -0.23 150.00- -0.19
Age at firstparturition 18.00- -1.39 18.00HH069
(months)
Parturition interval(days) 365 -28.50 350- -24
Liveweight ofdam(kg) 42.82+8.51 4768 -7.73
Birthweight (kg)
Young 3.31+0.87 3.23-076
Males 3.33 -1.04 335-077
Females 3.10--071
Singles 3.45 -0.96 3.23 -0.62
Twins 291 -1.07 3.38-H070
Triplets - 273-0.50
Quadruplets - 2.60 -0.18
Frequency (%)
Singles 80.45 27 97
Twins 19.55 54. 57
Triplets - 16.04
Quadruplets - 1.43
Stillbirths 0.61 529
Abortions - 0.61
Pre-weaningmortality 3.36 10.43
(%)(1-3 months)
Prolificacyrate (%) 119 9 193.42
Productivitytoweaning/ewe 1152 167.32
doe (%)
Discussion
Tswana sheep can be improved genetically by careful
selection,improved nutrition and managementwith a
lambinginterval of365E2850 days (Table 1). This
study showed a gestation period of 150-t023 days for
sheep. Capote and Vazquez(1986) reported that the
gestation length and lambing interval in Suffolk x
Criollo ewes averaged 1487 days and 3182 days,
respectively.They stated that 54% ofthe lambs born
werefemalesand58%ofthe lambings occurred during
thedryseason.Theyconcludedthat neithersexoflamb,
nor season of lambing had a significant effect on
gestation length,buttherewas a significant interaction
oftype oflambing(single ortwin)andsexoflamb.Adu
et al (1985) studied the reproductive performance of
Balami and Desert Sudanese sheep in a dry hot
environment.Theyobservedthat lambingintervalwas
significantly shorter in Desert Sudanese ewes than in
Balamiewes(254vs279days)butthe numberoflambs
bornpereweperannuminbothbreedswassimilar(1.6).
This studyshowed age atfirst lambing of1800E1.39
months. KabugaandAkovuah(1991)reportedthat age
at first lambing averaged 5062 days in Djallonké x
Sahelian crossbred ewes.Theyfoundthatthe interval
between parturitions averaged279days,and litter size
and number oflambs producedperyear averaged 1.1
and 1.5, respectively.
Age atfirst kidding of1800t067months shows
a shortgeneration intervalforthe Boergoats.Thisis in
linewith 11.33-1847months reportedby Husain et al
(1990) for Bengal goats in Bangladesh.The kidding
interval observed in this study averaged 350.00t24
dayswhichislowerthanthe451t166days reportedby
Lawaret al(1991)forAngoragoatsin India and higher
thanthe2742and2936days reportedbyDickson et al
(1990) for Anglo-Nubian and French Alpine goats,
respectively.
Mean birth weight of331-t087 kgforTswana
lambsis higherthan the2.44kgreportedfor Djallonké
xSahelian crossbred lambs by Kabuga and Akowuah
(1991).The Boer kids recorded323E076kgfor birth
weightwhich is higher than the 1.47kg reported for
Bengal kids by Verma et al (1991). Boer goats are
classified as medium sized breed by Devendra and
McLeroy (1987). There was low abortion rate and
preweaning mortality in both lambs and kids which
couldbe due tothe adequate managementpractices and
thegoodveterinarycare received onthefarm.
Vermaetal(1991)reportedthat litter sizewas not
affected by parity in Black Bengal goats. They also
found that the percentages of single, twin and triplet
birthswere747,240and1.3, respectively, in aherd of
20female Bengalgoats. Mellado et al(1991) reported
the reproductive performance of40 Anglo-Nubian
female goats.They observed thatthe interval between
kiddings averaged 301 days and prolificacy averaged
1.77. Multiple birth wasveryfrequentin the herd over
a five-yearperiod. Maternalsize inTswana sheep and
Boer goats did not influence young birth weight
significantly. Milne (1987) reported that maternal size
appears to become a less important determinant of
energetic efficiency during gestation as litter size
increases. Prolificacyrate ofBoergoatsinthisstudywas
19342%.Thisis higherthan the 1.77(177%)reported
for Nubian goats in northern Mexico (Mellado et al
1991)where fecundity rate wasfound to be correlated
with rainfall inthe monthpreceedingmating.
294 Small RuminantResearch NetworkWorkshop

ReproductioninTswana ewes and Boer doesinBotswana
Values obtained in this study are indications that
Tswana sheep and Boer goats are highly productive
under good management and productivity can be
improveduponbyplannedbreedingprogrammes.This
willobviouslyincreasethe level ofgoatandsheepmeat
production for local consumption and export in
Botswana.
Acknowledgement
The authorswould liketo express their gratitude tothe
management of Estate ManagementUnit(EMU) at
Sebele-Gaboroneforpermission topublishthe data.
References
Adu I.F., Taiwo B.B.A. and Buvanendran V. 1985.
Reproductive and lambgrowth performance ofBalami
andDesertSudanesesheepintheSahelo-SudanSavanna
Zone of Nigeria. Journal ofAnimal Production
Research5:67-76.
CapoteJ. andVazquezJ. 1986. Reproductiveperformance in
a flock of Suffolk X Cuban Criollo ewes.
Ciencias-de-la-Agricultura28:126-132.
Devendra C. and McLeroy G.B. 1987. Goat and Sheep
Production in the Tropics. Longman Scientific and
Technical Publishers,Singapore.
Dickson L., Garcia B.E., Rivero R. and Garcia B.O. 1990
Productionandreproductiveperformance ofNubianand
FrenchAlpinegoatsimportedintoLaraState.Venezuela
VI Congreso Venesolano de zootecnia, 20 al 24 de
Noviembre de 1990,SanCristobal,Venezuela.
Husain S.S.,Mostafa K.G. and RahmanM.M. 1990. Studies
onthe reproductivecharacteristics ofBlackBengalgoats
in some selected areas under rural conditions.
BangladeshJournal ofAnimalScience 19:1-7.
Kabuga J.D. and Akowuah F. 1991. Reproductive
performance ofDjallonke XSaheliancorssbredewesin
Ghana.Small RuminantResearch5:245-254.
LawarU.S.,WaniU.S.,SrivastavaA.K. and PatilS.G. 1991 .
A note on reproductive performance ofAngora goats.
Livestock-Adviser 16:22
MannathokoM.M. 1993. BotswanaMeatCommissionAnnual
Report 1992/93(BMC).
MelladoM., Foote R.H. andGomezA. 1991. Reproductive
efficiency of Nubian goats throughout the year in
NorthernMexico.SmallRuminantResearch6:151-157
Milne J.A. 1987. The effect of litter and maternal size on
reproductive performance of grazing ruminants.
Symposia of the Zoological Society of London
57:189_201.
MoA(Ministry ofAgriculture). 1990.Agricultural Statistics
Ministry ofAgriculture.CSO(CentralStatistics Office),
Gaborone, Botswana.
SteelR.G.D. andTorrieJH.1980.Principles andProcedures
ofStatistics with Reference to the Biological Sciences.
McGraw-HillBookCompanyInc.,NewYork,USA
Verma RR.P., Singh B.K., Singh M.P. and Balraj-Singh.
1991. Factors affecting reproductive performance in
Black Bengal goats. Indian Veterinary Journal
68:235-239
Performances de reproduction des brebisTswana et des chèvres
femelles Boer dans le Sud-est du BotSwana
Résumé
Les performances de reproduction de brebis
Tswana et de chèvres Boer élevées en système
semi-intensifpendant cinq ans(1989-1993)à la ferme
duBotswanaCollegeofAgricultureàSebele-Gaborone
ont été analysées.Un total de 70agnelages et de 152
chevrotementsportant respectivementsur202 agneaux
et288chevreaux ontfait l'objet d'analyses statistiques.
Les paramètres étudiés étaient l'âge à la première
parturition, l'intervale entre misesbas, letauxannuel de
parturition, le poidsà la naissance et la correlation entre
lepoids de la mère et celui dujeuneà la naissance. Les
brebisTswana avaientun âgeà la première parturition
de 18,00HE1,39 mois, un intervalle entre mises bas de
365+ 28,50jours,untaux annueldeparturition de 1,00
et lepoidsàlanaissance de leurs agneauxétaitde3,30E
0,89 kg. Pour les chèvres Boer, les chiffres
correspondantsétaientrepectivementde 1800+0,69kg,
de350E24jours,de 1,00et de323E076kg. Lesbrebis
Tswanasont des reproductrices saisonnières quimettent
bas vers la fin du printemps et le début de l'été
(octobre-décembre).Lesexratio étaitde490%pourles
202agneaux et de 52,78%pour les288chevreaux. Les
taux des naissances simples et gemellaires étaient
respectivement de8059%et de 1941% chezles brebis,
les naissances de produits simples, de jumeaux, de
triplets et de quadruplets représentant respectivement
28,29%, 53,28%, 16,45% et 1,32% des naissances
totales chez les chèvres. Les taux de mortalité et de
mortinatalité étaient respectivement de 3,43% et de
0,5% chez les ovins alors que ceux de mortalité, de
mortinatalité et d'avortement étaient respectivement de
1042%,2,78% et0,66% chezles caprins. Les analyses
ont montré que les brebisTswana et les chèvres Boer
sont des races précoces. Enfin, il y avait une faible
corrélation (r* =0,02pourles ovinset r2 =004pour les
caprins) entre lepoids de la mère et celui dujeuneà la
naissance.
Small RuminantResearch NetworkWorkshop 295


Quelques donnéessur le sperme de bélierspeul blancs
ettouaregduNiger
HamaniM, YenikoyeA. et BanoinM.
Facultéd'agronomie,UniversitéAbdouMoumouni,BP237,Niamey(Niger)
Les volumes de sperme, la motilité massale des
spermatozoïdes, la concentration en spermatozoïdes, la
productiontotale despermatozoïdesparrécolte, lestaux
de spermatozoïdes anormaux ou morts ont été étudiés
chezonze béliers adultes de race peul ettouareg.Avec
une et deux éjaculations successives respectivement,
chez les béliers peul, le volume moyen est de 0,895t
0,31 ml et0,93-E0,53ml, la motilité massale de3+1,3 et
3,2 t 1,2, la concentration moyenne en spermatozoïdes
de 377710°E124510° spz/ml et 3694 I0°E134510°
spz/ml et le nombre total de spermatozoïdes par récolte
de 361410°E175810° et 372310°285410°spz/ml.
Chezles bélierstouareg,pourune et deux éjaculations,
levolume moyenest respectivement de 1,13E031 mlet
1,78+0,48 ml, la motilité massale moyenne de3.4E09
et3,11E0,1, la concentration moyenne en spermatozoïdes
nombretotalde spermatozoïdes par récolte de 480510°
E1631.10°et 641410°211910°
Introduction
Le Niger abrite une population totale de 7,793
millions detêtesde petits ruminantsdont3,045millions
d'ovinset4,748millionsdecaprins.On distingue,parmi
les ovins, des moutonsà laine et des moutonsà poils;
ces derniers sont numériquement lesplus importants et
se composent de deux races: la peul et la touareg.
L'amélioration des performances de reproduction des
animaux nécessite la connaissance des paramètres de
reproduction des femelles et des mâles.Jusqu'ici, les
paramètres de reproduction des animaux connus en
milieusahélienetparticulièrementauNiger,sontlimités
à l'étude de la femelle, notamment en ce qui concerne
la productivité numérique en milieu traditionnel, les
paramètres de reproduction des brebis en station et en
milieu traditionnel, et les facteurs influant sur ces
paramètres. Chez le mâle, peu d'études ont été
effectuées sur le comportement du bélier en station
(Gaillard, 1979; Harouna, 1987). La connaissance des
performances de reproduction du mâle et des facteurs
qui l'affectentpeuventaiderà améliorergénétiquement
les races par la sélection des meilleurs géniteurs et à
augmenter la productivité numérique du troupeau en
agissant sur la fécondation, la viabilité de l'oeuf et la
fréquence des sailliesfécondantes.C'estpourtoutes ces
raisons que la présente étude sur la connaissance des
paramètresde reproductionchezle mâle a étéentreprise.
Les résultats présentés se rapportent à des études
préliminaires au cours desquelles les animaux ont été
testés grâce à des techniques connues mais toutà fait
originalespourcesanimaux, notamment l'utilisation du
vaginartificiel et la détermination de laconcentration en
spermatozoïdespar la densité optique. Les résultats de
cette mise aupointtechniqueservirontdepointde départ
pour les études ultérieures portant sur l'influence de
différents facteurs (climat, alimentation, conditions
d'élevage, etc.) etsur la fertilitédu mâle.
Matériel et méthodes
Les animaux
L'expérience a été réalisée au parc de la Faculté
d'agronomie de l'Université Abdou Moumouni à
Niamey(longitude2'08, latitude 13'30, altitude216m).
Elle aportésur onze béliers répartis en deuxlots,le 1er
de six béliers peul blancs, le 2ème de cinq béliers
touareg. Le 1ergroupe est composéd'animauxâgés de
1 à 2 ans etpesant entre 35,5 kg et43,5 kg. Ceux du
2èmegroupe étaient âgés de2à4ans etpesaient entre
37,5 et 55 kg. Ces animaux ont été déparasités et
vaccinés contre la peste, la pasteurellose et les deux
types de charbons. Ilsviventenstabulation libre et leur
alimentation est à base de bourgou (Echinochloa
stagnina), de son de riz, de tiges de mil, de maïs, de
sorgho, de fanes de niébé, d'oligo-éléments sousforme
de pierreà lécher et d'eau ad libitum.
Collecte et analyse dusperme
Le sperme a été collecté au vagin artificiel, en
présence d'une brebis en chaleur ou non.Une ou deux
éjaculations sonteffectuéesparrécolte.
Examensimmédiats
Aussitôtaprès la récolte, levolume etlacouleurde
l'éjaculat sont relevés à travers le tube collecteur. La
motilité massale est notée (de0à5)par observation au
microscope photonique d'une goutte de sperme pur,
déposée surune lame.
Small RuminantResearch NetworkWorkshop 297

Hamani et al
Détermination de la concentration en
spermatozoïdes
Le sperme est dilué par mélange de 20 ml de
solution de dilution (NaClà 9%+formolà 1%) et de
0,05mlde spermepur,ce quicorrespondàune dilution
au 1/401.La densité optique du sperme dilué est lue au
spectrocolorimètreréglé surunelongueurd'onde de520
mm. Le comptage des spermatozoïdes est effectué au
microscope photonique à l'aide d'une cellule de
Malassez. Chaque prélèvement de sperme dilué est
comptéquatrefois,puis la moyenne est calculée.
Détermination destauxdespermatozoïdes
anormauXOu mOrtS
Lasemenceest diluéepar mélange d'unvolumede
sperme frais et de quatre volumes de lait frais. La
préparationde lalame sefaitenydéposanttrois gouttes
de colorant (éosine/nigrosine), puis une goutte de
sperme dilué; le tout est mélangépendant 10secondes
et laissé au repospendant50secondes. Le mélange est
ensuite étalé à l'aide d'une lamelle en un film fin et
régulier.
Pour le comptage des différentes classes de
spermatozoïdes, la lame est placée sur la platine du
microscope et différents champs sont examinés à la
lumière directejusqu'àun totalde 150spermatozoïdes.
Tout spermatozoïde coloré en partie ou en totalité, en
rougeouenrose,estconsidérécommemortaumoment
de la coloration.
Testsstatistiques
L'analyse de la variance à deux critères de
classification aétéutiliséepourcomparerles effets race,
le nombre d' éjaculations et leur interaction sur les
paramètres mesurés. Destests relatifsà la régression et
à la corrélation entre les concentrations en sperma
tozoïdes et les densités optiques ont été effectués. Des
comparaisons inter-raciales de ces coefficients de
régression ont été effectuées et la signification des
coefficients de corrélation correspondants a été
recherchée(Dagnelie,1975)
Résultats
Volume de l'éjaculat
Levolume moyen de l'éjaculat est de0,895E031
mlchezles bélierspeulblancs contre0.93E0,53mlchez
les touareg. Il existe des variations individuelles du
volume de l'éjaculat chez les deux races. De même
l'interaction race x nombre d'éjaculations modifie de
façonsignificative(P<005)levolume.Ainsi, lorsqu'on
augmente le rythme de collecte, levolume de l'éjaculat
du bélier touareg est supérieur à celui du bélier peul
blanc.
Motilité massale
La motilité masalevarie en moyenne entre3 et3,4
selon larace et le rythmede collecte.Toutefois,cesdeux
facteurs, de même que leur interaction, n'ont aucune
influence significative(P>005)surla motilitémassale.
Concentration et nombre total de
spermatozoïdes
La concentration moyenne en spermatozoïdes
(spz)paréjaculat est de3771,21 (+175825).
et415649( E791,75). 10°spz/ml respectivementpour la
racepeul et la touareg.
De trèsimportantesvariationsindividuelles ontété
enregistrées chezles bélierspeulblancs(figure 1), alors
que les variations sontbeaucoup moins marquées chez
les touareg. Ni la race, ni la fréquence de collecte, ni
l'interaction entre ces deux facteurs n'influencent de
manière significative (P>005) la concentration en
spermatozoïdes.
Le nombre total de spermatozoïdespar récolte est
influencépar l'interactionracexnombred'éjaculations,
les valeursétantplus élevées chezles touareglorsque la
fréquence de collectepasse de 1 à2(tableau 1).
Tauxdespermatozoïdes anormaux
Deuxbélierspeulblancs et troisbélierstouaregont
serviàladétermination de ceparamètre.Lepourcentage
de spermatozoïdes anormauxvarie de 1,9à 13pour les
bélierspeul blancs (tableau2) contre4à 11,5pour les
bélierstouareg(tableau3).
Tableau 1:Caractéristiques morphologiques du sperme de béliers peul blancs et touareg
Nbtotal de
Nbd'éjaculations Nb Volume de Motilité Concentration en spz récolte
par récolte Races d'animaux sperme(ml) Massale spz(x10°/ml) (x10°/ml)
1 Peul 6 0895(+0,31) 3.0(+1,3) 3777(E1245) 3614( E 1758)
Touareg 5 1,13(+0.31) 3.4(+0.9) 4156( 791) 4805(+ 1631)
2 Peul 6 093( E 053) 3.2( E 1,2) 3694( E1345) 3723( E2854)
Touareg 5 1,78(+0,48) 3,1 (+ 1,0) 3580( E 406) 6414(t2119)
298 SmallRuminantResearch NetworkWorkshop

Etudes sur le sperme des béliersauNiger
Tableau2:Taux de spermatozoides anormaux et morts chez les béliers peul blancs
- Volume Motilité Concentration Tauxde spz Tauxde spz
Bélier (ml) Couleur massale en spz(x10°/ml) aI1OTITTaUlX mOItS
P1 1,22(+0,19) Blanchâtre 4,12(+0.21) 3660(+41) 4.5(+2.6) 18.5(+4,15)
P2 1.5 Blanchâtre 35(+05) / 9(+ 4) 29( E4)
Tableau3:Taux de spermatozoides anormaux et morts chez les béliers touareg
Volume Motilité Concentration Tauxde spz Tauxdespz
Bélier (ml) Couleur massale en spz(x10/ml) aI1OTIT1aU1X ImOItS
T2 1,35(+0.21) Blanchâtre 2.75(+0.423) 4064(+341) 1 1 (+0.43) 41,25(+4,8)
T4 1.35(+0,15) Blanchâtre 325(+0.25) 4405.71 45+05) 365(+ 1,5)
T6 0.6 Blanchâtre / 1 1 22
Tauxdespermatozoïdes morts
Les mêmes animaux qui ci-dessus ont servi à la
détermination de ce paramètre. Le pourcentage de
spermatozoïdes mortsvariede 145à33chezles béliers
peulblancs (tableau2)contre22à4605chezles béliers
touareg(tableau 3).
Relation entre la concentration en
spermatozoïdes et la densité optique
La relation entre la concentration en sperma
tozoïdes dansun milieubiologique et la densitéoptique
du milieu mesurée au spectrocolorimètre a étéutilisée
pour établir une courbe d'étalonnage en vue de
déterminer la concentration en spermatozoïdes.
Trente éjaculatsdechaque race ontété utiliséspour
établir les courbes d'étalonnage. Avec la semence de
béliers peul blancs (figure 1), on observe une grande
dispersiondes concentrationsen spermatozoïdes le long
de la courbe, ce qui traduit une grande variation
individuelle.
L'équation de la droite ainsi obtenue est
Y= 8225,2xD.O+ 18,2(Y étant la concentration en
spermatozoïdes).
Le coefficient de corrélation r, de 0,97; est
hautement significatif (P<001) (figure 1). Avec la
semence de béliers touareg(figure 2), le regroupement
des points traduit des variations plus faibles entre
les individus en ce qui concerne la concentration en
spermatozoïdes. L'équation de la droite est
Y=75906xDO.+316,7
(Y étant la concentration en spermatozoïdes). Le
coefficient de corrélation r de 0,86 est hautement
significatif (P<0,001) (figure 2). Il n'y a pas de
différence significative entre les coefficients de
régression des deux droites(P<005).
Discussion
L'aspectvisqueuxetblanchâtre(crémeux, laiteux)
du sperme des béliers peul blancs et touareg est
semblable à celui du bélier peul bicolore (Harouna,
1987) et des moutons djallonké et peul duCameroun
(Nielsen et al., 1985). Le volume moyen de sperme
collecté lors d'une éjaculation chez les deux races de
béliers (0,895à0930ml) estvoisin de celui du bélier
peul bicolore (072à 1,50ml)(Harouna, 1987) ou des
races européennes (08à 1,2 ml) [Colas et al, 1975].
Toutefois, des différences raciales importantes de
volume apparaissent lorsque le nombre d'éjaculations
est doublépar récolte, le bélier touareg ayanttendance
àproduire plus desperme que le bélierpeulblanc:
(1,78 +0.48 et093E053mlrespectivement).
Il a également été montré que le volume de la
semence chez le bélier est fonction de l'âge et de la
croissance corporelle(Colas et al., 1975). Lesdeux lots
d'animauxutilisés icisont d'âge et de poids différents,
les béliers peul blancs étantplusjeunes (1 à 2 ans) et
moins lourds(35,5à43,5kg) que lestouareg(2à4ans
et375à55kg).
La motilité massale varie au cours des différentes
collectes chez les deux races; une variation de ce
paramètre au cours de collectes successives a été notée
chez le bélier peul bicolore (Harouna, 1987), chez les
racescamerounaises Djallonkéet Fulani(Nielsen et al.,
1985)etchezle bélierIle-de-France(Colas, 1980). Cette
donnée subjective etimprécisepeut constituer,en l'état
actuel des connaissances,un critère de tri des animaux
dans la mesure où il traduit tout de même une plus ou
moins forte proportion de cellules vivantes (Colas,
1980).
Les concentrations moyennes en spermatozoïdes
sont comparables entre les racespeulblanche ettouareg
et comparables à celles des béliers peul bicolores
(Harouna., 1987), Djallonké et Fulani du Cameroun
(Nielsen et al., 1985) et Romanov (Colas, 1975).A la
différence du volume de sperme, la concentration en
Small RuminantResearch NetworkWorkshop 299

Hamani et al
Concentration en
spermatozoïdes
(x109m)
8000
7000
[Spzj =82252xD.O.+ 18,2
r=0,976000
5000
4000 -
3000 -
2000 -
1OO0 -
0
0,4
1 1
o5 07 08 09
Densité optique (DO)
Figure1. Corrélation entre la densité optique et la concentration en spermatozoïdes de lasemence de bélierpeul
spermatozoïdes des éjaculats est étroitement liée à la
fréquence de collecte (Colas et al., 1975). Ainsi, une
faible fréquence de récolte analogueà celle utilisée ici
ne permet pas de récupérer toute la production
spermatique,uneproportion du sperme s'éliminant de
façon permanente par l'urine chez le bélier (Colas,
1980). Il est donc probable que les concentrations
rapportées dans cette étude soient sous-estimées par
rapportà laproductiontesticulaire.
Desvariationsindividuelles de laconcentration en
spermatozoïdesontéténotéessurtoutchezlebélierpeul
blanc.Cesvariations raciales peuvent être rapprochées
des facteurs environnementaux et des conditions
d'élevage très différentes qui caractérisent les deux
niches écologiquesoùvivent les deuxraces de moutons
(Ibrahim, 1974). La très grande variation de la
concentration en spermatozoïdes constatée chez le
bélierpeul blanc offre des possibilités de sélection de
Ccttc IaCe.
La production totale de spermatozoïdes est
variable selon la race, le bélier touareg ayant une
production plus importante que le bélier peul blanc
(641424.10°spzet3723.10°spzrespectivement). Il est
par conséquent probable que la multiplication des
cellules spermatiquessoitplusimportante chezle bélier
touareg que chez le bélier peul blanc. Les travaux de
Banoin (1993, résultats non publiés) qui montrent que
l'index mitotique des follicules ovariens estplusgrand
chez la race touareg que chez la race peul blanche
corroborent cette hypothèse. Toutefois, des études
ultérieures s'avèrent nécessaires sur la production
spermatique parunité detemps chezces deux races de
moutonenvue de confirmer cette hypothèse.
Les taux de spermatozoïdes anormaux se situent
entre4,5et 11%.Colas(1981), dansuneétude effectuée
sur des ovins de race Ile-de-France,a rapporté lestaux
defertilitéde50à60%pouruntauxdespermatozoïdes
anormauxcomprisentre 10et20%puis entre40et50%
pour destauxdefertilitéde moins de 50%.Ainsi,pour
les spermes analysésici, ce paramètre se situe dans des
limites acceptablespour la fertilité.
Lestauxde spermatozoïdes morts déterminésdans
cette étude se situent entre 18,5 et 45% et sont donc
relativementélevésparrapportauxlimites de20à30%
considérés comme acceptables pour un bon géniteur.
Cependant, il est établi que ce paramètre varie en
fonctionde latempérature. Lefaitque la collecte ait été
effectuée en conditionde températuresélevéesexplique
peut-être les chiffres élevés obtenus. Par ailleurs, ce
paramètre connaîtdesvariations individuelles que l'on
ne saurait ignorer. Enfin, on sait que le taux de
spermatozoïdes morts diminue avec le nombre
d'éjaculations: Etant donné qu'on n'a travaillé ici
qu'avec une éjaculation par récolte, il est possible
d'améliorer ces taux avec un nombre plus élevé
d'éjaculationsparprélèvement.
Conclusion
Les paramètres étudiés se rapprochent globa
lement des chiffres enregistrés chez d'autres races
africaines et européennes. Ces paramètres témoignant
ensemble de la qualitédusperme, l'étude de l'effet des
300 Small RuminantResearch NetworkWorkshop

Etudessur lesperme desbéliers au Niger
Concentration en
spermatozoïdes
(x 10%m)
8OOO
7000
[Spzj = 7590,6xD.O. +316,7
6000 r= 0,86
5000
4000
2000
1000
o 0,1 02 03 o4
1 -- T T
o5 o6 07 08 09
Densité optique (DO)
Figure2. Corrélation entre la densité optique et la concentration en spermatozoïdes de la semence de bélier touareg
différentsfacteurs de l'environnement est envisageable
en relation avec lasaison.
Référencesbibliographiques
BarilG, ChemineauP,CognieY,GuerinY,LeboeufB,Orgeur
P et Valet J C, 1993. Manuel de formation pour
l'insémination artificielle chez les ovins et les caprins.
EtudeFA.O., Production et santéanimales,231 p.
Bourzat D, Wilson R T., 1989. Principaux aspects
zootechniquesde la production des petits ruminantsdans
lessystèmes agro-pastorauxdu Yatenga(Burkina Faso
Etudes del'IEMVT,31, 145p.
ColasG,PersonnicD,CourotM,OrtavantR., 1975. Influence
du rythme de la récolte sur la production de
spermatozoïdes chez le jeune bélier romanov. Ann.
Zootech.,24(2), 189-198.
ColasG., 1980.Variation saisonnière de la qualitédusperme
chezle bélierIle-de-France.I—Etude de lamorphologie
cellulaire et de la motilité massale. Reprod. Nutr.
Dévelop,20(6),1789-1799
ColasG. 1981.Variation saisonnière de la qualitédu sperme
chez le bélier Ile-de-France. II- Fécondance: relation
avec les critères qualitatifs observés in vitro. Reprod.
Nutr. Dev.,21,399-407
DagnelieP,1975.Théorie et méthodes statistiques,vol2.Les
presses de Gembloux.
Dicko M S, Sayers R., 1988. Recherche sur le système
agro-pastoral de production de la zone semi-aride du
Niger: étude de la composante animale. C.I.P.E.A.,
Niger, 148p.
Gaillard Y., 1979. Comportement sexuel du bélier Oudah.
Rev. Elev.Med.Vét., PaysTrop.,32(4), 379-389
Harouna A., 1987. Etude de quelques caractéristiques
morphologiques du sperme de bélier peul bicolore du
Niger. Rapport de stage, 17p.
Haumesser J B, Gerbaldi P. 1980. Observation sur la
reproduction et l'élevage du mouton oudah nigérien.
Rev. Elev.Med.Vét., PaysTrop.,33,93-101.
IbrahimAT. 1975.Contributionà l'étudede l'élevage ovinau
Niger. Etat actuelet propositions d'amélioration. Thèse
de doctoratvétérinaire, Dakar, n" 13.
Nielsen M,Galet, SyolensC, Hardouin J. 1985. Note sur la
stérilisation provoquée en milieu tropical. Rev. Elev.
Med.Vet., PaysTrop.,38(2), 195-199
YenikoyeA,AndréD,RavaultJP, MarianaJC, 1981. Etude
de quelques caractéristiques de reproduction chez la
brebispeul du Niger.Reprod. Nutr. Develop.,21 (6A),
937_951.
Yenikoye A. 1984. Variations annuelles du comportement
d'oestrus,dutaux et despossibilités d'ovulation chez la
brebis peul du Niger. Reprod. Nutr. Dev.,24,11-19
Yenikoye A, Marichatou H. 1993. Productivité et activité
ovariennes de la brebis peul dans le système d'élevage
traditionnel au Niger. In Improvingthe Productivity of
Indigenous African Livestock, I.A.E.A/, Vienna,
133-142.
Small RuminantResearchNetworkWorkshop 301

Hamani et al
Some data on the semen of White Fulani and Tuareg rams in Niger
Semen yield, mass motility of spermatozoa, semen
spermatozoa concentration, total number of sperma
tozoa per ejaculation and percentage of abnormal and
dead spermatozoa were studied in l 1 Fulani and Tuareg
adult rams. With one and two successive emissions in
Fulani rams, average sperm volume was 0.8951031 ml
and 0.931053 ml, respectively; mass motility was 311.3
and 3211.2 units; spermatozoa mean concentration was
3777 x 10611245 X 106 per ml and 3694 x 10611345 x
106 while total number of spermatozoa per emission was
3614 X 10611758 x106 and 3723 x 10 12854 X 10". In
Tuareg rams, for one and two emissions, average sperm
volume was 1.131031 m1 and 1.781048, respectively;
mean mass motility was 3.410.09 and 3.1101 m1; mean
spermatozoa concentration was 4156 x 10 1791 x 106
and 3580 x 1061406 x 106 while total number of
spermatozoa per emission was 4805 x 10611631 x 10
and 6414 x 10612119 x 106. Breed x number of
emissions had a significant effect (P<0.05) on volume
of sperm and total number of spermatozoa in semen but
not on mass motility and spermatozoa concentration
(P>0.05). Depending on the breed, it is therefore better
to use two emissions per "yield" to determine sperm
volume and total number of spermatozoa. Percentage of
abnormal spermatozoa was similar in both breeds. It
varied from 4.5 (10.5) to 11 (10.43) and was within
normal limits for fertility. Percentage of dead
spermatozoa varied from 18.5 (14.15) to 41.25 (14.8)%
for both breeds, which is rather high. However, this
should be related to other environmental and individual
factors, including temperature, individual biological
parameters, number of emissions etc. Regression
between semen spermatozoa concentration and optical
density was studied using a spectrocolorimeter. For
Fulani rams, the equation of the regression line was Y =
8225.2 X + 18.2 (where Y is the spermatozoa
concentration and X is the optical density). The highly
significant (P<0.01) correlation coefficient (r = 0.97)
indicated a strong relationship between the two
variables. For Tuareg sperm, the equation of the
regression line was Y = 7590.6 X + 317.7 and the
correlation coefficient (r = 0.86) was also highly
significant (P<0.05). These results suggest that
morphological characteristics of the sperm of Tuareg
rams are different from those of Fulani rams semen
when collection frequency is greater than 1. Taken
together these parameters indicate the quality of sperm.
It is concluded that studies of various environmental
factors should be carried out in relation with seasons.
302 Small Ruminant Research Network Workshop

Performances laitières et état nutritionnel des chèvres
duSahelconduitesSurparcours naturels: relations
avec la croisSance des chevreaux
CisséM., Fall Y. et I. Ly
Institutsénégalais de recherches agricoles
BP2057, Dakar(Sénégal)
Résumé
Laproductionlaitièrede22chèvresduSahelâgées
de 2 ans et demi en moyenne, élevées sur parcours
naturels,a étéétudiée parla méthodede la doublepésée
avant et après la tétée.Soninfluence sur la croissance
des chevreauxa égalementété examinée. Les quantités
de laitconsomméespar les chevreauxont représenté56
à65% de la production totale. Laproduction laitière a
étéplus élevée chez les chèvres ayant misbaspendant
la saison despluies etàportée multiple.Laglycémie a
connuunpic dans les24-48heures après la parturition
(1,25 et 0,78g/l dans les lots ayant mis bas respec
tivementen saison despluies et en saisonsèche)puis a
progres- sivement diminué. La même tendance a été
observée pour l'urémie avecunpic décalé, se situant
vers les 4-6èmes semaines de lactation. Il existe une
corrélation étroite entre la consommation de lait des
chevreaux (r = 0,55) et leur croissance pendant les
soixante premiersjours.L'indice deconsommationaété
de6,24pour les chevreaux.
Introduction
Dans les pays de la zone sahélienne, où la
malnutrition protéino-énergétique est l'une des
principales causes de mortalité et de morbidité surtout
chez les jeunes, le lait et la viande de chèvre s'avèrent
souvent être les seules ou l'une des rares sources de
protéines de qualité disponibles. De plus, étant une
espèceà cycle courtpouvantvivre dans les conditions
assez difficiles de la zone sahélienne où le disponible
fourrager dépasse rarement huit mois dans l'année, la
chèvre regagneun intêretincontestable.AuSénégal en
particulier, la chèvre du Sahel est traditionnellement
exploitée pour laproduction laitière par lesfemmes en
milieu rural et dans les zones périurbaines. Malgréce
regain d'intêretpour les chèvres, les connaissances sur
leurs performances laitières et sur leurs métabolismes
demeurent assez limitées. Par ailleurs, pendant la
période quivade la naissance au sevrage, la croissance
des chevreaux dépend étroitement des performances
laitières de leursmères(Amegée, 1984)
Cette étude avait pour objectif d'évaluer les
potentialités laitières deschèvresduSahelconduitessur
parcours naturels par des mesures directes et de
caractériser leur état nutritionnel par le dosage de
certains métabolites. Les relations entre leur niveau de
production laitière et lacroissance des chevreauxontété
également établies.
Matériel et méthodes
Animauxetschéma de l'expérience
Vingt deux chèvres âgées de 2 ans et demi en
moyenne et ayant misbas entrejuillet etoctobre ontété
utilisées dans cette étude. Elles ont été conduites de
manière identique, avec8heures de pâture/jour (8-17
heures), interrompues par une heure d'abreuvement
(entre 13et 14heures)àlaferme deSangalcam,dans la
zone périurbaine(régionde Niayes),à40kmaunord-est
de Dakar. La composante végétale du parcours et le
comportementalimentaire des chèvres ontété rapportés
dans une étudeprécédente (Cissé et al.,1993)
Apartirdu 14èmejourpost-partum, leschèvresont
été alternativement réparties en 2 lots: un lot non
complémenté (lot 1) et un lot complémenté (lot 2)
recevant lesoir,auretourdupâturage500g/animal/jde
concentré(66% de maïs,30%detourteau d'arachide et
4% deCMV), devaleur nutritive calculée en énergie et
en azote de 1,12UFet 190gMAD/kg de MSrespec
tivement.
Prélèvements et mesures
Quantitésde laitproduites et composition du lait
Lesquantitésde lait produitesontété mesuréespar
la méthodede ladoublepeséeduchevreau avantetaprès
latétée(Cissé etal., 1993).Un contrôle laitierindividuel
s'effectuait trois fois par semaine au cours des deux
premières semaines post-partum, puis une fois par
semaine pendant le reste de la lactation. Les tétées
avaient lieu à 8, 13, 18 et 22 heures. Les mesures
s'effectuaient ainsi quatre fois parjour parpesée de la
traite du matin, des quantités buespar le/les chevreaux
etde latraiteàfondde la mère, après la tétée.Lespetits
Small RuminantResearch NetworkWorkshop 303

Cissé etal
étaient séparés des mères la veille du contrôle laitier, au
soir. Lapesée despetits et des quantités de lait traites
s'effectuaientà l'aide d'une balance Sartorius de0,1 g
de précision et de 16kg de portée. Un échantillon de
100ml de lait auquel on ajoutait 1ml de formol était
constituéàpartirdes traites du matin etde 18heures en
vue de l'analyse de composition chimique. Lesteneurs
en matièresgrasses, enprotéines eten lactosedu lait ont
été déterminées.
Notation de l'état corporel
L'état corporela étéappréciéselonune échelle de
notation de 6points(0=condamné, l=très maigre,2=
maigre,3=moyen,4=gras,5=très gras)parobservation
et palpation des régions sternale et lombaire (Cissé et
al., 1994)une foispar mois,surchaque chèvre.
Prélèvements sanguins
Des prises de sang ont été individuellement
effectuées sur toutes les chèvres, en fin de gestation,
dans les24-48heures après laparturition,puistous les
14jours,à compterde la date de mise bas. Le sanga été
immédiatement centrifugé et le plasma récupérépuis
réparti dans plusieurs cupules et congelé à -20'C
jusqu'à l'analyse. Les kits commerciauxontété utilisés
pour le dosage duglucose etde l'urée. Leglucose a été
doséselon la méthodeà laglucose-oxydase deTrinder
(1969) (kit Sera-Pak, Miles Italiana), et l'urée par la
méthode de Gutmanni et Bergmeyer (1974)(kit urée
enzymatiqueUVH.P., Biotrol)(Cissé et al., 1991).
Croissance des chevreaux
Le contrôle de croissance a étéhebdomadaire. En
fait, le poids des chevreaux était régulièrement
enregistréau momentdu contrôle laitier.
Résultats
Quantités de laitproduites
L'apport de complémentaeuun effet positif(mais
non significatif) sur la production laitière moyenne
(tableau 1). Les quantités de lait consomméespar les
chevreaux ont représenté 56à 65% de la production
totale.
La production laitière a étéplus importante chez
les chèvres qui ont misbaspendant la saison despluies
(figure 1).L'effetde lataillede laportée aétésignificatif
surlaproduction totale de lait et sur les quantités de lait
consommées (tableau 1), le volume de la tétée étant
positivement lié au nombre de chevreaux.
Tableau 1:Quantités de laitproduitespar les chèvres (en g/j/animal de lait brut) et composition du lait (g/kg)
Sources de variation
Apportde Saison de Taille
Moyenne concentré mise bas portée Covariable
Semaines3à6*
Lait total 10194 23,7 ns 151,4 ns 2424+ 192.2
Laitconsommé 641,9 22,5 ns -19,8ns 2372 ** 111,6
Lait trait 416,7 -31,8 ns 52,0 ns 21 1,6 ns I1S 204,6
Tauxbutyreux 36,4 -4,2ns 20ns I1S 73
Tauxprotéique 43,8 5,6 ns 4,6 ns InS 87
Taux de lactose 41,0 0,2 ns 8,8 ns I1S 89
Semaines3à10*
Laittotal 9704 25.3 ns 178,6 ns 259.4+ 216,6
Lait consommé 615.5 150 ns 3,2 ns 243.3* 1355
Laittrait 384,1 -24,6 ns 44,5 ns 1570ns I1S 1780
Tauxbutyreux 375 -3,2 ns 3,5 ns I1S 7.1
Tauxprotéique 48,7 5,1 ns 2,1 ns I1S 55
Taux de lactose 40.5 2,6 ns 6,8+ I1S 6,2
Semaines3à14*
Laittotal 841,0 -40ns 202,6 ns 186,8ns 226,4
Lait consommé 552.4 -23,0ns -3,2 ns 2249** 1145
Laittrait 323,5 -14.9 ns -83,8 ns 101,9 ns IlS 1499
Tauxbutyreux 37.0 -2,8 ns 3,6 ns I1S 7.1
Tauxprotéique 49.2 4,2 ns 1,8 ns I1S 52
Taux de lactose 38,8 -0,3 ns 78* I1S 57
1 Moyenne ajustée
* Sources de variation l'effet des facteurs respectifs constitue la différence (complémenté-non complémenté), (saison despluies-saison sèche),
(portée multiple-portée simple). Il est significatifà 1%**,5%*,10%+, ou non significatif(ns).
3 Ecart-type résiduel
+-+Période de complémentation: l"mois (semaines3à6de lactation), 2 premiers mois(semaines3à 10)et période totale (semaines 3à 14).
304Small RuminantResearch NetworkWorkshop
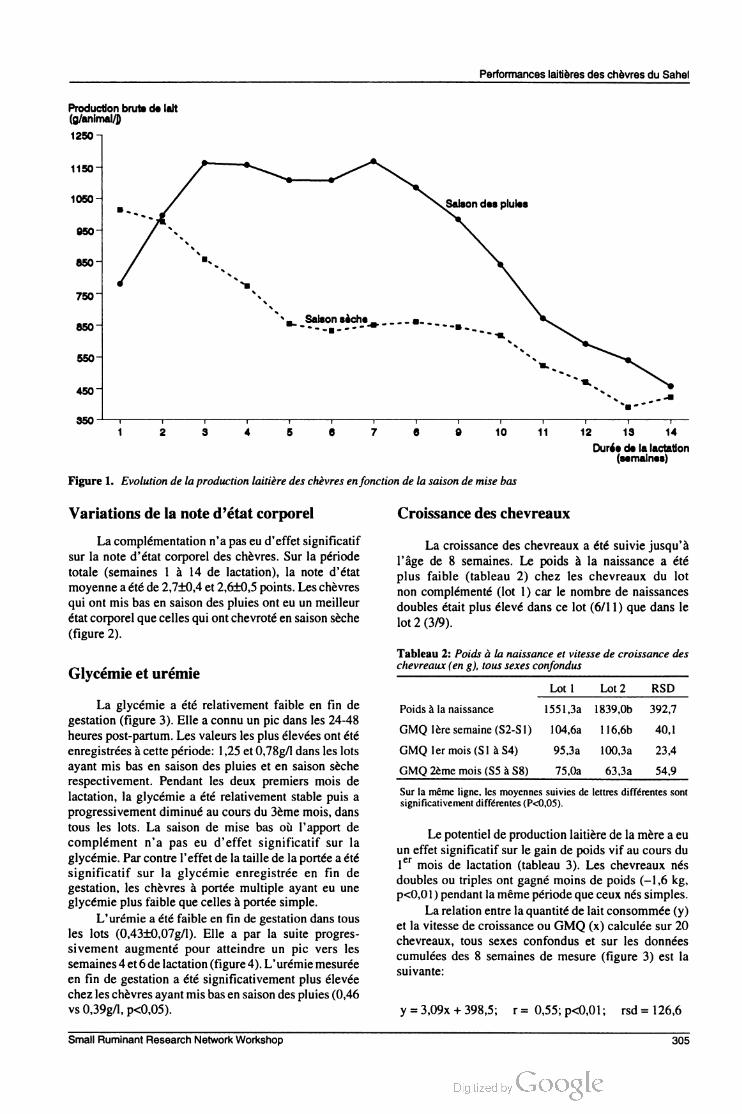
Performances laitières des chèvres duSahel
Production brute de lait
(g/animal/)
1250-
115O-
1050
750-1
550
450T
` -- - ----- - -- --..
Saison despluies
8 9 1O 11 12 13 14
Durée de la lactation
(semaines)
Figure 1. Evolution de laproduction laitière des chèvres enfonction de la saison de mise bas
Variations de la note d'état corporel
Lacomplémentation n'apaseud'effet significatif
sur la note d'état corporel des chèvres.Sur la période
totale (semaines 1 à 14 de lactation), la note d'état
moyenneaété de27E04et26t05points.Les chèvres
qui ont mis bas en saison des pluies ont euun meilleur
état corporelque celles quiontchevrotéensaison sèche
(figure2).
Glycémie et urémie
La glycémie a été relativement faible en fin de
gestation (figure 3). Elle a connuunpic dans les24-48
heurespost-partum. Les valeurs lesplus élevées ontété
enregistréesàcettepériode: 1,25 et0,78g/l dans les lots
ayant mis bas en saison des pluies et en saison sèche
respectivement. Pendant les deux premiers mois de
lactation, la glycémie a été relativement stable puis a
progressivement diminué au coursdu3ème mois, dans
tous les lots. La saison de mise bas où l'apport de
complément n'a pas eu d'effet significatif sur la
glycémie.Par contre l'effet de lataille de laportée aété
significatif sur la glycémie enregistrée en fin de
gestation, les chèvres à portée multiple ayant eu une
glycémieplusfaible que cellesà portée simple.
L'urémie a étéfaible en fin degestation danstous
les lots (043E007g/l). Elle a par la suite progres
sivement augmenté pour atteindre un pic vers les
semaines4et6 de lactation(figure4).L'urémie mesurée
en fin de gestation a été significativement plus élevée
chezleschèvres ayantmisbas ensaison despluies(0,46
vs0.39g/l,p<005).
Croissance des chevreaux
La croissance des chevreaux a été suivie jusqu'à
l'âge de 8 semaines. Le poids à la naissance a été
plus faible (tableau 2) chez les chevreaux du lot
non complémenté(lot 1) car le nombre de naissances
doubles étaitplus élevédans ce lot(6/11) que dans le
lot2(3/9).
Tableau2: Poids à la naissance et vitesse de croissance des
chevreaux(en g), toussexes confondus
Lot l Lot2 RSD
Poidsà la naissance 1551.3a 1839Ob 3927
GMQ 1ère semaine (S2-S1) 104,6a 116,6b 40,1
GMQ ler mois(S1 àS4) 95.3a 100.3a 23.4
GMQ2ème mois (S5àS8) 750a 63.3a 549
Sur la même ligne, les moyennes suivies de lettres différentes sont
significativement différentes(P<005).
Le potentiel deproduction laitière de la mère aeu
un effet significatif sur le gain de poidsvifau cours du
1* mois de lactation (tableau 3). Les chevreaux nés
doubles ou triples ontgagné moins de poids (-1,6 kg,
p<001)pendant lamêmepériode queceuxnés simples.
La relation entre la quantité de laitconsommée(y)
et la vitesse de croissance ouGMQ(x) calculée sur20
chevreaux, tous sexes confondus et sur les données
cumulées des 8 semaines de mesure (figure 3) est la
suivante:
y=309x+3985; r= 0,55;p<001; rsd= 1266
Small RuminantResearch NetworkWorkshop 305

Cissé etal
Note d'état corporel
3,5
3 --
Saison desplules
2,5--
..-- - *
- ---* "**--- .. _ --- " "** -- -.-...
2 - *- -
- * Salson sèche
1,5--
1
1 2 4 8 1O 12
Durée de lalactation
(semaines)
Figure2. Variations de la note d'état corporel des chèvres enfonction de lasaison de mise bas.
Glycérine (g/)
1,4 - -
1.2 --
Saison des plules
Saison sèche
0,6 --
0,4
O 1 2 4 8 8 10 12 14
Durée de la lactation
(semaines)
Figure3. Evolution de laglycémie des chèvres enfonction de lasaison de mise bas.
306 Small RuminantResearch NetworkWorkshop

Performances laitières des chèvres duSahel
Urée (g/)
075- -
065--
--
055
0,45--
035--
0,25 +
O 6 8 10 12 14
Durée de la lactation
(semaines)
Figure4. Evolution de l'urémie des chèvres enfonction de la saison de mise bas.
Tableau3:Poids des chevreaux, tous lots confondus
Sources devariation
Moyenne Taille portée Sexe Saison Covariable RSD
Poidsvif
moyen(g) 2093,1 -5774*
(S1-S2)
Gain de
poidsvif(g) 29059
(S4-S1)
-16204** 469.7 ms
81,4 ns -291,2 ns I1S 172,1
663,4 ns 1099.1
S=semaine de lactation
Covariable=potentieldeproduction laitière de la mère.
Effetsexe= différence "mâle-femelle"
L'indice de consommation, c'està dire la quantité
de lait nécessaire par unité de gain de poids a été de
6,24-E09.
DiscuSSion
La réponse de production laitière suite à l'apport
de complément de valeur nutritive 1,12 UF et 190g
MAD/kg de MS a été relativement faible si on tient
compte dufait que les besoins deproduction laitière de
lachèvre s'élèventà04UFet50gMAD/kgde laità4%
de matière grasse (Rivière, 1977, citéparCissé et al.,
1993). Parmiles facteurspouvant expliquer cettefaible
réponse, il y a de manière vraisemblable l'âge
relativement jeune des chèvres qui devaient en plus
satisfaire des besoins de croissance et le disponible
alimentaire de la saison sèche qui devait se situer en
dessous d'un seuil critique (Cissé et al., 1993). En
revanche, la production plus importante de lait pendant
la saison des pluies està lier à la disponibilité et à la
bonnevaleur nutritive de l'herbe consommée.
Parailleurs, les chèvresayantmisbasen saison des
pluies ont eu les meilleures notes d'état corporel
(figure 2). En effet les réserves corporelles des chèvres
ayant chevroté pendant la saison sèche étaient
certainement plus sollicitées pour couvrir les besoins
d'entretien et de production laitière. On peut aussi
s'attendre à des répercussions sur les performances de
reproduction(Cissé et al.,1992)
Le profil biochimique ne peut en aucun cas se
substitueràun bilan complet de rationnement qui seul
permet de vérifier si les besoins nutritionnels sont
couverts. Ilpeut cependant compléter et étayer le bilan
nutritionnel. Le glucose est leparamètre le plussouvent
mesuré dans les profils biochimiques des ruminants,
Small RuminantResearch NetworkWorkshop 3O7

Cissé etal
bien que son rôle chez ces animaux ait une moindre
signification que chez les monogastriques. Une
hyperglycémie a été constatée dans les 24-48 heures
après la mise bas. Elle a déja étésignalée par certains
auteurs et serait probablement due au stress de la
parturition qui entraîne des décharges de gluco
corticoïdes (Gueorguiev et al., 1995). La baisse de la
glycémie constatée par contre avec l'avancée de la
saison sèchepeutêtre le refletd'un déficiténergétique.
L'urémie aprogressivementaugmentéaprès lamisebas.
On peut l'attribuer à la reprise de l'appétit ou à un
hypercatabolisme qui résulterait de l'involutionutérine
pendant le premier mois post-partum (Remond et
Journet, 1978).
LeGMQenregistré au cours des7premiersjours
est tout à fait comparable à celui rapporté sur les
chevreauxsahéliensdeLouga(Faugere etal, 1989).Sur
lapériodetotalede l'étude, la vitesse de croissance aété
néanmoins plus importante en station qu'en milieu
éleveur où desGMQde l'ordre de 60g/jsont rapportés.
L'indice de consommation obtenu au cours de cet essai
(6.24) est tout à fait comparable à celui obtenu par
Amegée (1984) chez l'agneau Vogan. Ces résultats
peuvent trouver une application pratique dans la
détermination indirecte de la production laitière des
chèvrespar lavitesse de croissance de leurs chevreaux.
Remerciements
Cetravailapuêtreréaliségrâceà l'appuifinancier
duRéseau africainde recherchessurles petits ruminants
(SRNET), ILRI, Addis-Abeba, Ethiopie.
Référencesbibliographiques
Amegee,Y., 1984. Le mouton deVogan(croisé djallonkéx
sahélien)auTogo. I.Laproduction lactée etses relations
avec la croissance. Rev. Elev. Méd. Pays trop, 37
82-90
CisséM.,Chilliardy.,Coxamv., DaviccoM.J., and Remond
B., 1991. Effectsofslow-release bovinesomatotropinin
dairy heifers and cows fed two levels of energy
concentrate. II. Plasma hormones and metabolites. J.
DairySci.,74,1382-1394
Cissé M., Awad M. et Ahokpé B., 1993. Comportement
alimentaire et performances laitières de la chèvre du
Sahel exploitant des parcours naturels.In Proc. biennial
Conf. ofAfr.feeds Res. Net.,6-10Dec., 1993, Harare,
Zimbabwe,inpress.
CisséM.,LY I.,Manga R. and BoyeC., 1994.Use ofbody
condition score for the in vivo estimation ofbodyfatin
the Sahelgoat.VIIIth Int.Symp. Nutr. Physiol,25-30
Sept. 1994, Willigen, Germany. In Proc. Soc. Nutr.
Physiol.,p325.
Cissé,M.,M'baye,M.,Sane, I., Korrea,A. andN'diaye, I.,
1992.Seasonalchangesinbodycondition ofsenegalese
Sahelgoat. Relationshipto reproductive performance.
Proc. 2nd Bien. Conf ofthe African Small Ruminant
Research Network, AICC, 7-1 1 Dec. 1992, Arusha,
Tanzania.
Faugere,O., Faugere, B., Merlin, P., Dockes,C., Perrot,C.
(1989). L'élevagetraditionnel des petits ruminants dans
la zone de Louga. Référentiel technico-économique
(données recueillies dans quinze villages de 1984 à
1988 Réf n*26/VIRO, LNERV,Dakar, 139p.
Gueorguiev IP; GuerguievaTM. andTomovTA., 1995.
Relation between milk secretion intensity, cortisol,
glucose, non-esterifiedfatty acids andtriacylglycerolin
dairy cows. Rev.Méd.Vét., 146,5,357-362
Remondb. et JournetM., 1978. Effetduniveaud'apportazoté
à des vaches au début de la lactation sur la production
laitière et l'utilisation de l'azote. An. Zootech., 27,
139-158.
Milkproduction and nutritionalstatus ofSahelgoats on natural
pastures: Relationshipwith kidgrowth
Milkproductionfrom22goatsaged2.5yearson average
and raised on natural pastures was studied using the
weight measurementby difference method before and
aftersucking; its effect on kidgrowthwas alsostudied.
Milk consumption ofthe kids was56to 65% oftotal
milk production.This production was higher in goats
kidding during the rainy season and in those with
multiple births. Glycaemia was highest 24-48 hours
after kidding(1.25and0.78g/lin animalsgivingbirth
in the rainy and dry seasons, respectively) and then
decreasedgradually.The same trendwas observedfor
uraemiawithashiftedpeakatbetween4thand6thweek
of lactation.There was a strong correlation (r=0.55)
between milk consumption ofthe kids andtheirgrowth
duringthe first60 days. Kids' consumption indexwas
6.24.
3O8 Small RuminantResearchNetworkWorkshop

Posters — Abstracts


Posters/abstracts
Studieson kid mortality duringthefirstfour months
oflifein Nigerian RedSokotogoat
SA. Ojo
Faculty ofVeterinary Medicine,AhmaduBello University, Zaria, Nigeria
Studies were carried out on some possible factors
influencing kid mortality rate in the Nigerian Red
Sokotogoat duringthe first four months of life.The
factorsconsideredincludedbirthweight,seasonal birth,
birthyear,parity, birth type, and sex ofkid. Necropsy
andmicrobiologicalexaminationswere alsodone onthe
dead kids. Birth year, parity and season of birth
significantly(P) affected the mortality rate while birth
type andsexofkidhad nomarked effect. Kid mortality
was found to be 32% (P) up to four months of life.
Necropsy examination revealed pneumonia 3684%,
starvation 15.80%, haemonchosis 12.40% and
ectoparasitism 9.40% as the main causes of kid
mortality.
Housingsmall ruminantsin Botswana:
Acase study ofthe Kwenengand Kgatleng districts
JA. Karim-Sesay andK.K.Morake
Department ofAgricultural Engineering d& Landuse Planning
BotswanaCollege ofAgriculture, Private Bag0027, Gaborone, Botswana
This study, as part of an on-going Botswana Small
Ruminant ResearchNetwork(BSRRN)project,wasan
attempt to identify and characterise the various
traditionalhousingsystemsusedforsmall ruminantsin
rural Botswana. Data for the analysis were collected
from93randomlyselectedfarmsin a pilotquestionnaire
surveyconductedintheKwenengandKgatlengdistricts
betweenFebruaryandApril1993.The resultsshowthat
varyingproportionsofthefarmerskeepsmallruminants
for meat (97.62%), cash income (88.32%), social
obligations (7085%), milk production (24.39%) and
forthe skin(644%).The commonest structurefoundin
both districts was the acacia bush kraal (45.16%),
followedbythe bushpole kraal(31.18%), andthegum
poleandwirekraal(16.13%). However,thebrick/block
shelter (4.30%),the diamond meshwire kraal(2.15%)
andthe diamond wire shelter(1.08%)were onlyfound
in the Kgatleng District indicating, perhaps, greater
awareness ofinnovations andpotentialadoption ofnew
technology. The acacia bush kraals were generally
circularorovalin shapewhilethe rest were rectangular.
Themeanage ofthe kraalsintheKwenengDistrictwas
493years(SD=90)while thatin the Kgatleng District
was354years(SD=194).The mean area ofthe kraal
inthe KwenengDistrictwas 14495m(SD=2965)with
a stocking density of 1.97m/animal(SD=058). In the
Kgatleng District the mean area was 125.13 m
(SD=45.74) while the stocking density was 1.24
m/animal(SD=0.52). Suggestions are made that could
improve the design and overall efficiency of the
traditional kraalsfoundinthe study area.
Astudy ofvillagesheepproductioninthewestern region ofGhana
K.Oppong-Anane
AnimalProduction Department, Ministry ofFoodandAgriculture
P.O. Box5779,Accra-North, Ghana
A 12-month retrospective survey of management
system,productivity andhealth care of26villageflocks
ofsheepwasundertakeninthewesternregion ofGhana.
Allthe flocks were ownedby adults with the majority
belonging to men. Cash to meet urgent needs ofthe
familywasthe main reason for keepingsheep. Most of
the sheepwere heldin simplepens at night and left out
tograzeon roadsidevegetation andfallowfieldsduring
partofthe day.Supplementaryfeedofhouseholdwastes
were often provided during confinement. The stock
population showed an increase of 15% over the
12-month period. Adult and young-stock mortalities
were 178 and 324%, respectively, and higher in the
flocksthatwere notvaccinated against pestes despetits
ruminant(PPR). Half ofthe flocks were subjected to
ectoparasite controlin the form ofhand-dressing, and
endoparasite control was undertaken in 46% of the
flocks. Footrot occurredin27% ofthe holdings.
Small RuminantResearch NetworkWorkshop 311

Posters/abstracts
EndoparasitesofgoatsinGaborone,Botswana
E.Z. Mushi andJ.F.W. Isa
Botswana College ofAgriculture, PrivateBag0027, Gaborone, Botswana
About24%of585goatssampledhadasignificantworm
eggcount.Thislowinfestation rate couldbe duetothe
fact that sampling was performed during the rainy
seasonandtheinfectivelarvaewerewashedintothesoil.
Somedegree ofinnate resistance andacquiredimmunity
could alsoplay arole. Chabertia andHaemonchuswere
the commonestworm eggs encountered.
Dry matter herbageproductivity and aspects
ofchemicalcomposition infourforageshrub legumes
at a subhumidsiteinGhana
P. Barnes
Animal Research Institute,Achimota, Ghana
Four forage shrubs Leucaena leucocephala, Gliricidia
sepium, Flemingia macrophylla and Cajanus cajan
were evaluated for herbage productivity in two years
aftertheyhadbeen establishedin hedgerows4m apart
andwithin-rowspacing of 15cm. Herbage dry-matter
yieldswereassessed afterharvestingat 1 and2years of
primarygrowth. Duringthe thirdyear regrowth yields
atcuttingintervals of6weeks(3cuts), 12weeks(l cut)
and 18weekswere assessedforthefourspecies.Crude
protein,calciumandphosphorus contentswere assessed
for the entries during the regrowth yield assessments.
Gliricidiasepiumconsistentlyoutyieldedthethree other
species in primary growth and regrowth after cutting
with yields exceeding two tonnes per hectare in the
regrowth assessments. InCP%,Ca% and P% analysis
Leucaena leucocephala was outstanding with highest
values being290%, 1.74% and 0.36% for the three
analyseditems, respectively.
Enquêtesur l'élevage ovin dans la régionforestière de l'Est-cameroun
Manjeli, yl . Njwe, RM". Téguia, A", Tchoumboué J" et Tangang*
Département de Zootechnie, Facultéd'Agronomie et desSciencesAgricoles
Université deDschang,B.P.222, Dschang, Cameroon
*Ministère de l 'Agriculutre, Yaoundé,Cameroun
Une enquête a été menée en 1990à l'aide d'un
questionnaire et d'interviews auprès de 202 élevages
traditionnels de la régionforestière de l'Est-Cameroun.
L'analyse des données montrent que: la majorité des
éleveurs de moutonsde la région(79%)ont moinsde45
ansd'âge et les ovins appartiennentsurtoutauxhommes
(92%). Letauxd'alphabétisation des éleveurs(35%)est
relativement bas. La taille moyenne du troupeau est
généralement de2-5animaux(52%)et la majorité des
animaux (70%) sont hérités des parents. Les animaux
sont laissés en divagation permanente toute l'année et
l'herbe est assez abondante pour assurer une
alimentation convenable. Des mises bas précoces
(18-20mois) sont signaléespar66% des éleveurs. Les
naissances doubles sont les plus fréquentes et la
fécondation est observée toute l'année. Les principaux
symptômes pathologiques enregistrés sontlesdiarrhées
(34%),latoux(6%)et lesgales(5%). Lesmaladiessont
exclusivement traitées avec des moyens locaux dont
l'efficacité n'estpastoujoursgarantie. Lesprincipales
contraintesà l'élevage des ovins sont le comportement
social, lasanté et la commercialisation.
312 SmallRuminantResearch NetworkWorkshop

LIST OF PARTICIPANTS
BOTSWANA
E. Mushi
Botswana College of Agriculture
P. Bag 0027
GABORONE
D. Seabo
Botswana College of Agriculture
P. Bag 0027
GABORONE
J.A. Karim-Sesay
Botswana College of Agriculture
P. Bag 0027
GABORONE
A. Panin
Botswana College of Agriculture
P. Bag 0027
GABORONE
J.B.D. Katongole
Botswana College of Agriculture
P. Bag 0027
GABORONE
M. Mrema
Botswana College of Agriculture
P. Bag 0027
GABORONE
BURKINA FASO
A. J. Nianogo
University of Ouagadougou
B .P. 702 1
OUAGADOUGOU
H. Tamboura
Institut d’Etudes et de Recherches Agricoles
BR 7192
OUAGADOUGOU
CAMEROON
R. Njwe
University of Dschang
PO. Box 222
DSCHANG
A. Njoya
Institut de Recherche Zoot.
HP. 1073
GAROUA
Y. Manjeli
University of Dschang
PO. Box 222
DSCHANG
COTE D’IVOIRE
A. Oya
SODEPRA CENTRE/PNSO
01 BR 1366
BOUAKE 01
S. Cissé
Centre National Ovin CI
B.P. 173
BEOUMI
ETHIOPIA
J.E.O. Rege
ILCA
PO. Box 5689
ADDIS ABABA
B. Shapiro
ILCA
PO. Box 5689
ADDIS ABABA
E. Mukasa-Mugerwa
ILCA
P.O. Box 5689
ADDIS ABABA
S. Tembely
ILCA
PO. Box 5689
ADDIS ABABA
L. Yigezu
NVI, Debre Zeit
PO. Box 19
DEBRE ZEIT
Small Ruminant Research Network Workshop 313

List of Participants
Solomon Abegaz
IAR, Ethiopia
Bako Research Centre
PO. Box 3
BAKO
FRANCE
Marichatou Hamani
INRA CR de Tours
B.P. 37380
NOUZILLY
GHANA
K. Oppong-Anane
Ministry of Food and Agriculture Ghana
PO. Box 5779
ACCRA NORTH
P.K. Fianu
Department of Animal Science
University of Ghana, Legon
ACCRA
A. Kote
Ministry of Agriculture
PO. Box 5779
ACCRA
E.L.K. Osafo
Department of Animal Science
University of Science and Technology
KUMASI
N.F. Touade
IAO/UN
P.O. Box 1628
ACCRA
P. Barnes
Animal Research Institute
ACHIMOTA
KENYA
S.H.B. Lebbie
ILCA
PO. Box 46847
NAIROBI
J. Ndikumana
ILCA
PO. Box 46847
NAIROBI
P.N. de Leeuw
ILCA
PO. Box 46847
NAIROBI
A.M. Okeyo
University of Nairobi
PO. Box 59052
NAIROBI
F.R. Rurangirwa
SR-CRSP
PO. Box 58137
NAIROBI
P. M. Oine
Nairobi University
PO. Box 29053
NAIROBI
M. M. Mucuthi
LRP
PO. Box 347
NANYUKI
P.P. Semenye
KARI/MIAC
PO. Box 58137
NAIROBI
J .T. Musiime
OAU/[BAR
P.O. Box 30786
NAIROBI
MALAWI
J. W. Banda
Bunda College of Agriculture
PO. Box 219
LILONGWE
MALI
H. Nantoume
Institut d'Economie Rurale (IER)
B.P. 258
BAMAKO
T. Niare
Institut d’Economie Rurale
LHM
B.P. 47
MOPTI
314 Small Ruminant Research Network Workshop

List of Participants
MOROCCO
L. Derqaoui
IAV Hassan II
B.P. 6202
RABAT
NIGER
A. Yenikoye
University of Niamey
B.P. 10896
NIAMEY
NIGERIA
I.K. Odubote
Department of Animal Science
Faculty of Agriculture
Obafemi Awolowo University
ILE-IFE
S.A. Ojo
Ahmadu Bello University
Faculty of Veterinary Medicine
AHMADU BELLO
Y. Akinbamijo
Obafemi Awolowo University
ILE-IFE
I.F. Adu
University of Agriculture
P.M.B. 2240
ABEOKUTA
SENEGAL
M. Cisse'
ISRA Sénégal
LNERV
B.P. 2057
DAKAR
M. Ndiaye
ISRA
B.P. 2057
DAKAR
Maty Ba-Diao
Institut Sénégalais dc R.A., ISRA
B.P. 2057
DAKAR
SWAZILAND
B.H. ngang
University of Swaziland
P.O. Luyengo
SOUTH AFRICA
J.P.C. Greyling
Department of Animal Science
University of Orange Free State
PO. Box 339
BLOEMFONTEIN
TANZANIA
S.M. Das
Ministry of Agriculture
Box 202
MPWAPWA
L.A. Mtenga
Sokoine University of Agriculture
Box 3004
MOROGORO
TCHAD
Mian-oudanang
Laboratoire de Farcha
B.P. 433
NDJAMENA
TOGO
Y. Pessinaba
Programme National Petit Elevage
B.P. 65
ATAKPAME
B. Bonfoh
PNPE-CATK
B.P. 65
ATAKPAME
Y. Hadzi
PNPE-Siége
B.P. 65
ATAKPAME
UGANDA
Her Excellency Specioza Kazibwe
Vice-President
Government of Uganda
S.G. Ngobi
MAAIF
PO. Box 102
ENTEBBE
F. Kasirye
Makerere University
PO. Box 7062
KAMPALA
Small Ruminant Research Network Workshop 315

List of Participants
B. Kanyima
Makerere University
PO. Box 7062
KAMPALA
N. Twinamasiko
MAAIF, Entebbe
PO. Box 102
ENTEBBE
R. Kijjambu
Trade and Finance
PO. Box 16106
KAMPALA
W. Mugisha
MAIIF
PO. Box 102
ENTEBBE
D.L.T. Ddungu
MAIIF
PO. Box 102
ENTEBBE
J.R. Tulyahikayo
SEREFACO CO.
PO. Box 6916
KAMPALA
W.K. Ndyanabo
NAARO
PO. Box 7084
KAMPALA
E. Katunguka-Rwakishaya
Makerere University
PO. Box 7062
KAMPALA
M. G. Nassuna
Makerere University
P.O. Box 7062
KAMPALA
J. Opuda-Asibo
Makerere University
PO. Box 7062
KAMPALA
V. Kasenge
Makerere University
PO. Box 7062
KAMPALA
G.H. Kiwuwa
Makerere University
PO. Box 7062
KAMPALA
T. Kibiringe-Sebunya
NARO/KARI
PO. Box 7065
KAMPALA;
or
National Veterinary Laboratory
P. Bag 0035
GABORONE
BOTSWANA
H.K. Nsubuga
Makerere University
PO. Box 7062
KAMPALA
J.B. Kasirye
MAAIF
PO. Box 10540
ENTEBBE
J.J. Otim
SPA/AVS
PO. Box 7168
KAMPALA
J. Matovu
World Bank, Kampala
PO. Box 4463
KAMPALA
F. Bareeba
Makerere University
Dept. of Animal Science
PO. Box 7062
KAMPALA
K. Okello
Makerere University
Department of Veterinary Physiological Sciences
PO. Box 7062
KAMPALA
C.M. Dhatemwa
MAAIF
PO. Box 102
ENTEBBE
M.M. Onega
D.C. Veterinary School
PO. Box 513
ENTEBBE
316 Small Ruminant Research Network Workshop

List of Participants
T. Kagwisagye
MAAIF
P.O. Box 1264
JINJA
J. Okedi
NARO
PO. Box 295
ENTEBBE
G.S. Byenkya
NAARI
PO. Box 7084
KAMPALA
B. Kyokwijuka
Ministry of Agriculture, Animal Industry
and Fisheries
PO. Box 16213
KAMPALA
J.J . Hoona
Ministry of Agriculture, Animal Industry
and Fisheries
PO. Box 102
ENTEBBE
M. Mukuru
Heifer Project International
PO. Box 14225
KAMPALA
D. S. Iga
DANIDA
PO. Box 11243
KAMPALA
EB. Rwamushwa
PARC Coordinator
PO. Box 102
ENTEBBE
J.F. Kamya
Ministry of Agriculture, Animal Industry
and Fisheries
PO. Box 102
ENTEBBE
T.C. Bamusonighe
MAAIF
PO. Box 513
ENTEBBE
C.W. Bunoti
MAIIF
P.O. Box 102
ENTEBBE
J.S. Mugerwa
MU/FAF
PO. Box 7062
KAMPALA
J .R. Nkuuhi
Makerere Veterinary Faculty
Makerere University
PO. Box 7062
KAMPALA
S.R. Nyakairu
MAAIF
PO. Box 102
ENTEBBE
J. Wagonda-Muguli
MAIIF
PO. Box 102
ENTEBBE
D. Nyakahuma
Directorate of Animal Resources
PO. Box 218
ENTEBBE
ZIMBABWE
L. Hove
Makoholi Research Station
Private Bag
MASVINGO
G. Jerome
CIRAD-EMVT
PO. Box 1201
MASVINGO
Small Ruminant Research Network Workshop 317


SBN 92-9146-011-7 Printed at lLRl, Addis Ababa, Ethiopia