Small ruminant production in smallholder and pastoral/extensive farming systems in Kenya
14
Small Ruminant Research 77 (2008) 11–24 Available online at www.sciencedirect.com Small ruminant production in smallholder and pastoral/extensive farming systems in Kenya I.S. Kosgey a,b,c , G.J. Rowlands c , J.A.M. van Arendonk b,∗ , R.L. Baker c a Department of Animal Sciences, Egerton University, P.O. Box 536, 20107 Njoro, Kenya b Animal Breeding and Genetics Group, Wageningen University, P.O. Box 338, 6700 AH Wageningen, The Netherlands c International Livestock Research Institute (ILRI), Naivasha Road, P.O. Box 30709, Nairobi 00100, Kenya Received 16 November 2006; received in revised form 10 December 2007; accepted 20 February 2008 Abstract A survey was conducted by way of personal interviews with 562 respondents comprising 459 farmers and 103 butchers/traders in selected districts in the central and western parts of Kenya, consisting of three predominantly smallholder and four predominantly pastoral/extensive districts. The study aimed to provide a better understanding of smallholder and pastoral/extensive sheep and goat farming systems in the tropics, by taking Kenya as an example. The results showed that 58% of the pastoral/extensive farmers and 46% of the smallholders indicated livestock as their main activity. Small ruminants ranked closely behind cattle in their importance. Thirty-four percent of the households kept only sheep, 18% only goats and 48% both species. The survey demonstrated the relative importance to the farmers of tangible benefits of farming sheep and goats (e.g., regular cash income, meat, manure and, in the case of goats, milk) versus intangible benefits (e.g., the role of small ruminants as an insurance against emergencies). Regular cash income and an insurance against emergencies were the highest priorities. Seventy-eight percent of the farmers reported animal sales over the previous 12 months of the survey date. Of these sales, the income was spent on school fees (32%), purchase of food (22%), farm investment (18%), medical expenses (10%), off-farm investment (9%), social activities (5%) and re-stocking (4%). Indigenous genotypes were predominant among the pastoralists and mixed crosses predominant among the smallholders. A range of traits: growth rate, body size, body shape, drought tolerance, meat quality, fertility, disease and heat tolerance, prolificacy and temperament were all considered important for both sheep and goats in both farming systems and across the different genotypes. Compared with other pure breeds, the Red Maasai sheep and the Small East African goats were rated poorly in terms of body size, body shape, growth and fertility, but highly in terms of drought and (for the Red Maasai) heat tolerance by both smallholder and pastoralist farmers. In general, crosses were perceived less favourably than indigenous pure breeds. Body size and performance ranked as the most important traits in the choice of breeding males. Approximately half the farmers inherited their males, reared them on the farm and kept them for an average of 2–3 years. Uncontrolled mating within the household’s flock was predominant in both farming systems. Over 98% of the farmers reported incidence of disease, especially pneumonia (in pastoral/extensive areas), helminthosis, tick-borne diseases, diarrhoea and foot-rot. Over 95% of the farmers fed supplements in both dry and wet seasons. Pure exotic and indigenous × exotic genotypes fetched higher prices than indigenous genotypes due to their heavier body weight. In conclusion, the foregoing issues need attention in genetic improvement programmes, with more emphasis on the conservation and utilisation of indigenous small ruminant genotypes. © 2008 Elsevier B.V. All rights reserved. Keywords: Small ruminants; Smallholder; Pastoral/extensive; Kenya; Tropics ∗ Corresponding author. Tel.: +31 317 482335; fax: +31 317 483929. E-mail address: [email protected] (J.A.M. van Arendonk). 0921-4488/$ – see front matter © 2008 Elsevier B.V. All rights reserved. doi:10.1016/j.smallrumres.2008.02.005
-
Upload
independent -
Category
Documents
-
view
0 -
download
0
Transcript of Small ruminant production in smallholder and pastoral/extensive farming systems in Kenya
A
spf4Ticis(IotCbprtbhPIa©
K
0
Small Ruminant Research 77 (2008) 11–24
Available online at www.sciencedirect.com
Small ruminant production in smallholder and pastoral/extensivefarming systems in Kenya
I.S. Kosgey a,b,c, G.J. Rowlands c, J.A.M. van Arendonk b,∗, R.L. Baker c
a Department of Animal Sciences, Egerton University, P.O. Box 536, 20107 Njoro, Kenyab Animal Breeding and Genetics Group, Wageningen University, P.O. Box 338, 6700 AH Wageningen, The Netherlands
c International Livestock Research Institute (ILRI), Naivasha Road, P.O. Box 30709, Nairobi 00100, Kenya
Received 16 November 2006; received in revised form 10 December 2007; accepted 20 February 2008
bstract
A survey was conducted by way of personal interviews with 562 respondents comprising 459 farmers and 103 butchers/traders inelected districts in the central and western parts of Kenya, consisting of three predominantly smallholder and four predominantlyastoral/extensive districts. The study aimed to provide a better understanding of smallholder and pastoral/extensive sheep and goatarming systems in the tropics, by taking Kenya as an example. The results showed that 58% of the pastoral/extensive farmers and6% of the smallholders indicated livestock as their main activity. Small ruminants ranked closely behind cattle in their importance.hirty-four percent of the households kept only sheep, 18% only goats and 48% both species. The survey demonstrated the relative
mportance to the farmers of tangible benefits of farming sheep and goats (e.g., regular cash income, meat, manure and, in thease of goats, milk) versus intangible benefits (e.g., the role of small ruminants as an insurance against emergencies). Regular cashncome and an insurance against emergencies were the highest priorities. Seventy-eight percent of the farmers reported animalales over the previous 12 months of the survey date. Of these sales, the income was spent on school fees (32%), purchase of food22%), farm investment (18%), medical expenses (10%), off-farm investment (9%), social activities (5%) and re-stocking (4%).ndigenous genotypes were predominant among the pastoralists and mixed crosses predominant among the smallholders. A rangef traits: growth rate, body size, body shape, drought tolerance, meat quality, fertility, disease and heat tolerance, prolificacy andemperament were all considered important for both sheep and goats in both farming systems and across the different genotypes.ompared with other pure breeds, the Red Maasai sheep and the Small East African goats were rated poorly in terms of body size,ody shape, growth and fertility, but highly in terms of drought and (for the Red Maasai) heat tolerance by both smallholder andastoralist farmers. In general, crosses were perceived less favourably than indigenous pure breeds. Body size and performanceanked as the most important traits in the choice of breeding males. Approximately half the farmers inherited their males, rearedhem on the farm and kept them for an average of 2–3 years. Uncontrolled mating within the household’s flock was predominant in
oth farming systems. Over 98% of the farmers reported incidence of disease, especially pneumonia (in pastoral/extensive areas),elminthosis, tick-borne diseases, diarrhoea and foot-rot. Over 95% of the farmers fed supplements in both dry and wet seasons.ure exotic and indigenous × exotic genotypes fetched higher prices than indigenous genotypes due to their heavier body weight.n conclusion, the foregoing issues need attention in genetic improvement programmes, with more emphasis on the conservationnd utilisation of indigenous small ruminant genotypes.2008 Elsevier B.V. All rights reserved.
eywords: Small ruminants; Smallholder; Pastoral/extensive; Kenya; Tropics
∗ Corresponding author. Tel.: +31 317 482335; fax: +31 317 483929.E-mail address: [email protected] (J.A.M. van Arendonk).
921-4488/$ – see front matter © 2008 Elsevier B.V. All rights reserved.doi:10.1016/j.smallrumres.2008.02.005
minant
(
(
(
(
(
12 I.S. Kosgey et al. / Small Ru
1. Introduction
The importance of small ruminants (i.e., sheep andgoats) to the socio-economic well being of people indeveloping countries in the tropics in terms of nutri-tion, income and intangible benefits (e.g., savings,insurance against emergencies, cultural and ceremo-nial purposes) cannot be overemphasized (Kosgey,2004). Small ruminants also play a complementaryrole to other livestock in the utilisation of avail-able feed resources and provide one of the practicalmeans of using vast areas of natural grassland inregions where crop production is impractical (Bakerand Rege, 1994). Therefore, improvement programmesare necessary to increase and sustain the productiv-ity of small ruminants in these areas so as to meetthe demands of the human population on them. How-ever, development of genetic improvement programmesfor sheep and goats will only be successful whenaccompanied by a good understanding of the differentfarming systems and when simultaneously address-ing several constraints—e.g., feeding, health control,general management, and cost and availability ofcredit and marketing infrastructure (Baker and Gray,2004).
Many small ruminant genetic improvement pro-grammes have not been very successful in developingcountries in the tropics (Solkner et al., 1998; Rewe etal., 2002; Wollny et al., 2002; Kosgey et al., 2006).An important reason is that genetic improvement pro-grammes have mostly been implemented without takinginto consideration all the needs of the farmer (Kosgeyet al., 2006). In addition, poor performance of importedbreeds from the temperate developed world into tropi-cal countries has created a negative image for geneticimprovement programmes (Turner, 1978; Rewe et al.,2002; Ayalew et al., 2003). Few studies have elab-orated on the many factors affecting the productionand farming of small ruminants in the tropics. Conse-quently, there is generally scanty information, from thefarmers’ perspective, on the entire spectrum of smallruminant farming, a situation limiting the scope ofimprovement interventions. The current study attemptsto provide a better understanding of smallholder and pas-toral/extensive farming systems, and complements paststudies in the tropics (e.g., Mucuthi et al., 1992; Otienoet al., 1993; Mwendia, 1997; Peeler and Omore, 1997;Mahanjana and Cronje, 2000; Jaitner et al., 2001; Seleka,
2001; Wollny et al., 2002). The study aims to help in thedevelopment of effective breeding programmes for smallruminants in the tropics. More specifically, the surveyaimed to:Research 77 (2008) 11–24
a) establish why smallholder and pastoral/extensivefarmers keep sheep and goats,
b) determine the relative importance to the farmersof tangible benefits of farming sheep and goats(e.g., cash income from meat, milk and manure)versus intangible benefits (e.g., the role of smallruminants to act as a source of income for futureneeds—banking or insurance),
c) understand why farmers in different production sys-tems keep particular breeds,
d) know what attributes of sheep and goats farmersthink are important,
e) establish from where farmers access their breedingrams and bucks, and how long they keep them, and
(f) understand the constraints that apply to successfulfarming of small ruminants.
2. Materials and methods
2.1. Sampling and questionnaire methodology
The survey was conducted by way of personal interviewswith farmers (household survey) and butchers/traders (marketsurvey) by teams of trained enumerators in selected districts inthe central and western parts of Kenya (see Kosgey, 2004 fordetails). The survey of farmers covered seven districts, and thatof traders/butchers covered three districts. The household sur-vey was designed such that there were three districts that werepredominantly smallholder with mixed crop-livestock farmers(i.e., Nakuru, Nandi and Nyeri) and four that were predom-inantly pastoral/extensive (i.e., Baringo, Laikipia, Narok andTrans-Mara). Nyeri district also contains some medium- andlow-potential pastoral/extensive areas, of which one divisionwas selected. Although largely pastoral, Baringo also con-tains a smallholder, mixed crop-livestock highland area. Onelargely smallholder division was picked in the highlands andone pastoral division in the lowlands. A number of smallholderhouseholds were also selected during the random sampling ofthe two divisions of Laikipia district. One division in Nakurudistrict was selected from the medium-potential and one fromthe high-potential zones. The survey areas within each districtwere replicated at both the division and location levels, i.e.,two divisions and two locations per division were picked ineach district using prior information obtained from the fieldstaff. Most locations had three or fewer sub-locations and allwere sampled. For locations that contained more than threesub-locations, three were selected at random. Consequently, atotal of 14 divisions, 28 locations and 68 sub-locations weresampled, representing approximately 6% of all sub-locationsin the seven districts.
2.1.1. Household surveyThe household survey used a set of structured question-
naires which were a slightly modified version of those designedfor the livestock breed survey in the southern African region

minant
(tcbakfgatttfaan
aahtstfiwwimsoc
2
hNaihwe
2
ttfAwirlaof
I.S. Kosgey et al. / Small Ru
Rowlands et al., 2003). These questionnaires were designedo obtain information from respondents on general householdharacteristics, purposes of keeping small ruminants, animalreeds, traits of importance, breeding management, flock sizesnd structures, animal health, feeding management, and mar-eting and prices of animals. Most questions were asked in theorm of open questions. The enumerator ticked the answersiven by farmers against a prepared list in the questionnaire,nd then, where appropriate, asked the farmer to rank the tophree. The main exception was for the question pertaining toraits of perceived importance. In this case, the enumerator wenthrough a list of predetermined traits one by one and asked thearmer whether he considered the trait to be either a good, aver-ge or poor characteristic of the breed(s) he/she kept, or to betrait that was not of importance or about which he/she had
o opinion.Sampling was done through clustering of households within
sub-location. A cluster of households was formed withingiven radius, the length of which depended on the house-
old density. Transects were drawn within the cluster to makehe sampling as random as possible. Only households withheep and/or goats were picked along the transects, skippinghose that did not have any small ruminants. A minimum ofve households per sub-location owning sheep and/or goatsere sampled for the household survey. The sample numberas increased when there were more than 1000 households
n the sub-location according to the last census. In this case ainimum of 0.5% of the households in the sub-location were
ampled. Data on households and human populations werebtained from the Central Bureau of Statistics (CBS, 1999)ensus.
.1.2. Market surveyAn interview of butchers/traders was done alongside the
ousehold survey in three districts (Baringo, Nakuru andandi) to establish meat prices of different categories of
nimals (i.e., pure exotic, exotic × indigenous crosses andndigenous). Butchers/traders within certain clusters of theousehold survey (and close by when not occurring within)ere interviewed. Where possible a minimum of five butch-
rs/traders were interviewed per sub-location.
.2. Data analysis
Data were entered into a database in Access, the struc-ure of which can be found in Rowlands et al. (2003). Forhe purposes of analysis, the farmers were divided into twoarming systems, namely smallholder and pastoral/extensive.
further sub-division into small ruminant species ownershipas also used, namely those owning only sheep, those own-
ng only goats, and those owning both sheep and goats. The
esults are presented mainly in the form of descriptive tabu-ar summaries. Chi-square (χ2) or t-tests were carried out asppropriate to assess the statistical significance or otherwisef particular comparisons. Logistic regression with terms forarming system and breed was used to compare the qualities ofResearch 77 (2008) 11–24 13
traits (proportion of farmers ranking a trait to be good) acrossbreeds.
Indices were calculated to provide overall ranking of (a) thepurposes of keeping sheep or goats and (b) the traits used forchoosing rams and bucks according to the formula: index = sumof [4 for rank 1 + 3 for rank 2 + 2 for rank 3 + 1 for a tick] givenfor an individual purpose or trait divided by the sum of [4for rank 1 + 3 for rank 2 + 2 for rank 1 + 1 for a tick] summedover all purposes or traits. Similar indices were calculated forranking importance of livestock by species and source of cashincome.
3. Results
3.1. General household information
Four hundred and fifty-nine respondents (218smallholder and 241 pastoral/extensive farmers) wereinterviewed for the household survey. Of these, 158(48% and 22%, respectively, of the corresponding totalsfor smallholders and pastoral/extensive farmers) ownedonly sheep, 83 (18% and 18%) owned only goats and218 (34% and 60%) owned both sheep and goats. Themajority of the farmers (89%) were sedentary and the restnomadic. The majority of the pastoral/extensive farm-ers (58%) indicated livestock to be their main activity(see Table 1). The corresponding percentage of 46%for smallholders was significantly lower (χ2
1 = 5.91,P < 0.05). Thirty-three percent of smallholders and 25%of pastoral/extensive farmers put crops first. Primaryincome from salary/wages ranked third.
The importance of small ruminants in the two farm-ing systems is demonstrated in Table 2. Goats outrankedcattle when goats were the only small ruminant species.This was partly due to the fact that 40% of these farmersdid not own and, hence, rank cattle. Where both sheepand goats were owned each species was ranked similarlybehind cattle. Sheep were also ranked second behind cat-tle when goats were not owned. Chickens were rankedthird. In general, the rankings of the importance of sheepand goats were very similar for both smallholder andpastoral/extensive farmers.
3.2. Average flock sizes and flock structures
Smallholders owned an average of 2.3 ± 2.5 (S.D.)lambs (<4 months), 1.7 ± 2.7 weaners (5–12 months)and 4.4 ± 4.7 ewes and rams (>12 months) with a max-
imum flock size of 18 lambs, 18 weaners and 30 adults.The corresponding numbers for pastoral/extensive farm-ers were much larger: 14.5 ± 24.3, 13.6 ± 24.8 and36.6 ± 74.6, respectively, with a maximum flock size
14 I.S. Kosgey et al. / Small Ruminant Research 77 (2008) 11–24
Table 1Ranking of source of income within household by small ruminant species and farming system
Income source Farming system
Smallholder Pastoral/extensive
Householdsa Householdsb Rankingc Householdsa Householdsb Rankingc
Sheep: smallholder (n = 105); pastoral/extensive (n = 53)Livestock 103 45 0.42 52 33 0.49Crops 99 37 0.39 41 10 0.31Salary/wages 33 18 0.13 19 9 0.15Relative’s remittances 10 1 0.02 3 0 0.01Home industries 4 1 0.01 4 1 0.03Otherd 5 3 0.02 1 0 0.01
Goats: smallholder (n = 40); pastoral/extensive (n = 43)Livestock 37 17 0.39 43 19 0.49Crops 35 14 0.37 23 12 0.26Salary/wages 18 8 0.17 15 9 0.17Relative’s remittances 4 0 0.02 5 2 0.04Home industries 3 1 0.02 1 0 0.01Otherd 4 0 0.03 3 1 0.03
Sheep and goats: smallholder (n = 73); pastoral/extensive (n = 145)Livestock 70 39 0.44 145 87 0.49Crops 71 21 0.39 110 38 0.33Salary/wages 20 9 0.10 39 14 0.10Relative’s remittances 9 1 0.03 13 2 0.03Home industries 4 1 0.02 7 0 0.01Otherd 3 2 0.02 14 4 0.04
a Households considering item to be an important source of income.b Households ranking income source first.c y sum [3
ock trad
Index = sum of [3 for rank 1 + 2 for rank 2 + 1 for rank 3] divided bfor a farming system.
d Includes business (retail shops, rental houses, pharmacy and livest
reported of 150 lambs, 170 weaners and 594 adults.For goats (same age classes as sheep), the smallholdersowned an average of 2.6 ± 3.5 kids, 2.8 ± 4.8 weanersand 5.7 ± 7.9 adults (maximum 16 kids, 21 weanersand 33 adults). The corresponding figures for the pas-toral/extensive systems were 9.2 ± 12.2, 8.5 ± 11.4 and23.1 ± 31.5 (maximum 100 kids, 70 weaners and 200adults). There were no overall significant differencesbetween flock sizes for the two species within the twofarming systems. However, by paired t-test comparisonof means, farmers with both sheep and goats owned moreof the latter than the former (young animals and weaners(P < 0.001); adults (P < 0.01)).
3.3. Purposes of keeping sheep and goats
Table 3 presents purposes of keeping sheep and the
ranking of the importance of these purposes by farm-ing system (results not shown for goats but the scenariowas similar). The results indicate the relative impor-tance to the farmers of tangible benefits of farmingfor rank 1 + 2 for rank 2 + 1 for rank 3] for all sources of cash income
ing), bee-keeping and Pastorhood (Priest).
sheep (e.g., regular cash income, meat, manure and,in the case of goats, milk) versus intangible benefits(e.g., the role of small ruminants as an insurance againstemergencies). Most smallholder and pastoral/extensivefarmers (on average 72%) put first the keeping of sheepeither for regular cash income or as an insurance againstemergencies. Although not statistically different by aχ2 test, the emphasis among pastoral/extensive farm-ers tended to be towards regular cash income (Table 3).Manure received a higher ranking among smallholderthan pastoral/extensive farmers. For goats, regular cashincome featured most strongly as an insurance againstemergencies. Only a few farmers kept sheep or goatsprimarily for breeding in both farming systems, and thispurpose was among the lowly ranked. An interesting pur-pose, rarely reported in Kenya, is the milking of sheep,especially by the pastoral communities where milking
was ranked first by 6% of households (see Table 3).None of the surveyed farmers kept goats for mohair, butthey used them to pick ticks from the bushes/grazingfields that could subsequently be removed from their
I.S. Kosgey et al. / Small Ruminant Research 77 (2008) 11–24 15
Table 2Household ranking of the importance of livestock by small ruminant species and farming system
Species Farming system
Smallholder Pastoral/extensive
Householdsa Householdsb Householdsc Rankingd Householdsa Householdsb Householdsc Rankingd
Sheep: smallholder (n = 105); pastoral/extensive (n = 53)Cattle 93 93 87 0.44 45 45 31 0.40Sheep 105 105 12 0.34 52 52 21 0.40Chicken 96 93 6 0.20 45 41 1 0.18Othere 18 7 0 0.02 17 7 0 0.02
Goats: smallholder (n = 40); pastoral/extensive (n = 43)Cattle 23 23 21 0.31 27 27 18 0.30Goats 40 40 18 0.43 43 43 23 0.47Chicken 35 33 0 0.22 37 33 0 0.18Othere 7 4 1 0.03 15 6 2 0.05
Sheep and goats: smallholder (n = 73); pastoral/extensive (n = 145)Cattle 66 65 49 0.39 135 133 86 0.40Sheep 73 69 13 0.28 144 139 32 0.30Goats 73 64 9 0.26 145 142 26 0.27Chicken 72 19 2 0.07 103 15 0 0.02Othere 11 2 0 0.00 71 4 1 0.01
a Total households owning species.b Households considering livestock species to be important (i.e., a rank of 1, 2 or 3).c Households ranking livestock species first.d Index = sum of [3 for rank 1 + 2 for rank 2 + 1 for rank 3] divided by sum [3 for rank 1 + 2 for rank 2 + 1 for rank 3] for all species for a farming
system.e Includes pigs, donkeys, rabbits, bees, fish, and other types of poultry (ducks, guinea fowl, geese and turkeys).
Table 3Purpose of keeping sheep and the ranking of the importance of these purposes by farming system
Purpose Farming system
Smallholder (n = 178) Pastoral/extensive (n = 198)
Householdsa Householdsb Rankingc Householdsa Householdsb Rankingc
Regular cash income 107 69 0.20 149 80 0.22Meat 138 16 0.19 156 22 0.16Insurance/emergency 104 62 0.18 128 59 0.17Manure 146 6 0.17 106 1 0.09Planned investment 52 14 0.07 71 6 0.05Ceremonies/celebrations 73 1 0.07 141 3 0.10Wool 21 7 0.03 44 13 0.05Dowry 39 1 0.03 79 0 0.04Cultural rites 12 0 0.01 62 2 0.04Milk 8 1 0.01 29 11 0.03Skin 35 0 0.02 30 0 0.01Breeding 10 0 0.01 15 0 0.01Otherd 24 1 0.01 46 1 0.04
a Households ranking purpose important (i.e., 1, 2, 3 or just a tick).b Households ranking purpose first.c Index = sum of [4 for rank 1 + 3 for rank 2 + 2 for rank 3 + 1 for tick] divided by sum [4 for rank 1 + 3 for rank 2 + 2 for rank 3 + 1 for tick] for
all purposes of keeping small ruminants.d Includes blood, fat, pelt, to learn stockmanship and to keep oneself busy.

16 I.S. Kosgey et al. / Small Ruminant Research 77 (2008) 11–24
Table 4Number and percentage of households owning small ruminant breeds by farming system and district
Farming system Breed District Households %householdsa
Nakuru Nandi Nyeri Baringo Laikipia Narok Trans-Mara
Sheep
Smallholder (n = 178)
Red Maasai 4 14 7 10 1 1 1 38 21Dorper 1 6 2 2 8 0 0 19 11Merino 1 6 0 0 0 2 0 9 5Other purebreedsb 0 4 0 0 0 1 0 5 3Mixed crosses 54 34 25 0 7 0 0 120 67
Pastoral/extensive (n = 198)
Red Maasai 13 0 4 20 2 29 32 100 51Dorper 7 0 1 0 10 1 2 21 11Merino 0 0 0 1 1 17 0 19 10Other purebreedsb 0 0 0 0 0 15 0 15 8Mixed crosses 15 0 14 0 6 10 3 48 24
Goats
Smallholder (n = 113)
Small East African 5 6 6 18 2 1 1 39 35Galla 0 0 0 0 1 0 0 1 1Other purebreedsc 4 0 3 0 2 1 0 10 9Mixed crosses 19 15 21 1 8 0 0 64 58
Pastoral/extensive (n = 188)
Small East African 14 0 0 39 1 39 38 131 70Galla 0 0 0 0 4 4 0 8 4Other purebreedsc 0 0 0 1 8 0 1 10 5Mixed crosses 8 0 8 0 10 12 3 41 22
ds owne
a These percentages do not add up to 100% because some householb Corriedale, Hampshire Down and Romney Marsh.c Alpine, Boer, Saanen, Toggenburg and Dual Purpose.bodies, leading to control of ticks and tick-bornediseases.
Three hundred and fifty-seven (78%) householdsreported small ruminant sales within 12 months pre-ceding the interview. Their income was spent on schoolfees (32%), purchase of food (22%), farm investment(18%), medical expenses (10%), off-farm investment(9%), social activities (5%) and re-stocking (4%). Thetrend of expenditure in both farming systems was sim-ilar and generally comparable across small ruminantspecies, except perhaps for smallholder sheep farmerswho appeared to be more selective in their expenditure.This may be due to small flock sizes, and hence, less totalincome to share across the different areas of expenditure.
3.4. Breeds and breeding management
3.4.1. Breeds kept, their origin, lifespan, and traitsof economic importance
The number of households that owned different smallruminant breeds by farming system and district areshown in Table 4. Households owning mixed crosseswere predominant in smallholder production for both
d more than one breed.
sheep and goats, followed by the indigenous geno-types. In the pastoral/extensive system, the situation wasreversed with most households owning the indigenousgenotypes (mainly the Red Maasai—51% of the house-holds and the Small East African goat—70%). Animalswere mostly inherited or bought. The exotic genotypeswere bought mostly from the market or commercialfarms but the indigenous ones were generally inher-ited. Half of both the smallholder and pastoral/extensivefarmers reared their own males for breeding purposeson the farm (51% for smallholder and 52% for pas-toral/extensive farmers for sheep; 43% and 62% forgoats, respectively). When males were not reared, small-holders tended to borrow them (29% for sheep; 28% forgoats) whereas pastoral/extensive farmers tended to buy(28% for sheep; 20% for goats). Artificial inseminationwas not used in any of the flocks surveyed. In areas wherefamilies mixed and herded animals on common fields,matings took place at random with males present in the
flocks. The males were then referred to as communal.Such mating, however, was reported by only 4% of thefarmers on average. Males were kept until about 2–3years of age on average, and up to a maximum of 8 and 6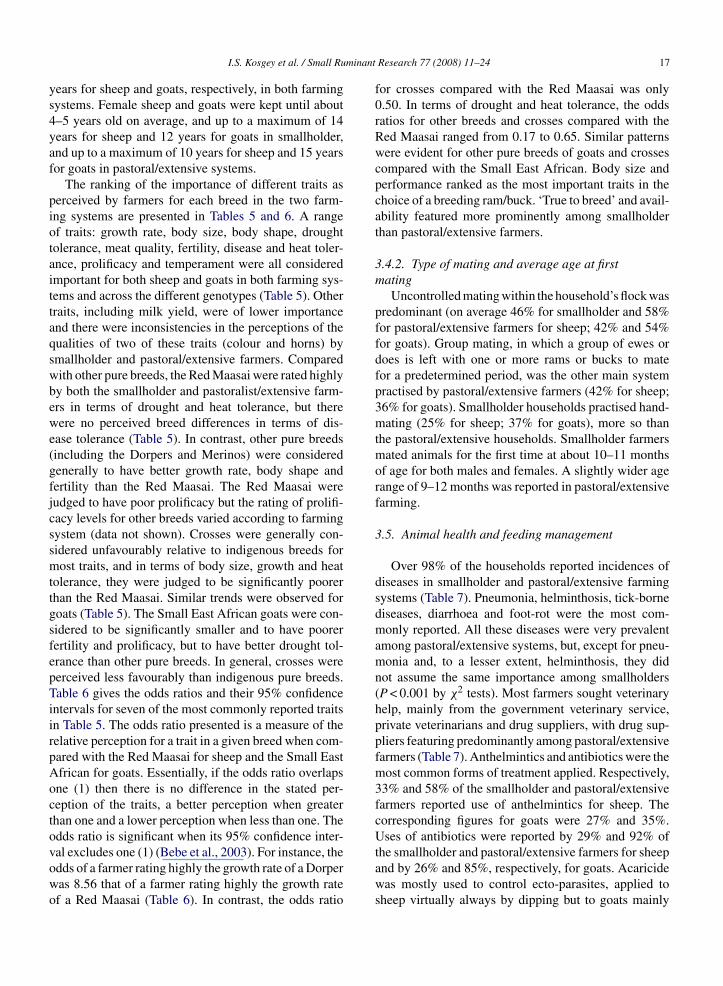
minant
ys4yaf
piotaittaqswbewe(gfjcssmttgsfepTiirpAoctovowo
I.S. Kosgey et al. / Small Ru
ears for sheep and goats, respectively, in both farmingystems. Female sheep and goats were kept until about–5 years old on average, and up to a maximum of 14ears for sheep and 12 years for goats in smallholder,nd up to a maximum of 10 years for sheep and 15 yearsor goats in pastoral/extensive systems.
The ranking of the importance of different traits aserceived by farmers for each breed in the two farm-ng systems are presented in Tables 5 and 6. A rangef traits: growth rate, body size, body shape, droughtolerance, meat quality, fertility, disease and heat toler-nce, prolificacy and temperament were all consideredmportant for both sheep and goats in both farming sys-ems and across the different genotypes (Table 5). Otherraits, including milk yield, were of lower importancend there were inconsistencies in the perceptions of theualities of two of these traits (colour and horns) bymallholder and pastoral/extensive farmers. Comparedith other pure breeds, the Red Maasai were rated highlyy both the smallholder and pastoralist/extensive farm-rs in terms of drought and heat tolerance, but thereere no perceived breed differences in terms of dis-
ase tolerance (Table 5). In contrast, other pure breedsincluding the Dorpers and Merinos) were consideredenerally to have better growth rate, body shape andertility than the Red Maasai. The Red Maasai wereudged to have poor prolificacy but the rating of prolifi-acy levels for other breeds varied according to farmingystem (data not shown). Crosses were generally con-idered unfavourably relative to indigenous breeds forost traits, and in terms of body size, growth and heat
olerance, they were judged to be significantly poorerhan the Red Maasai. Similar trends were observed foroats (Table 5). The Small East African goats were con-idered to be significantly smaller and to have poorerertility and prolificacy, but to have better drought tol-rance than other pure breeds. In general, crosses wereerceived less favourably than indigenous pure breeds.able 6 gives the odds ratios and their 95% confidence
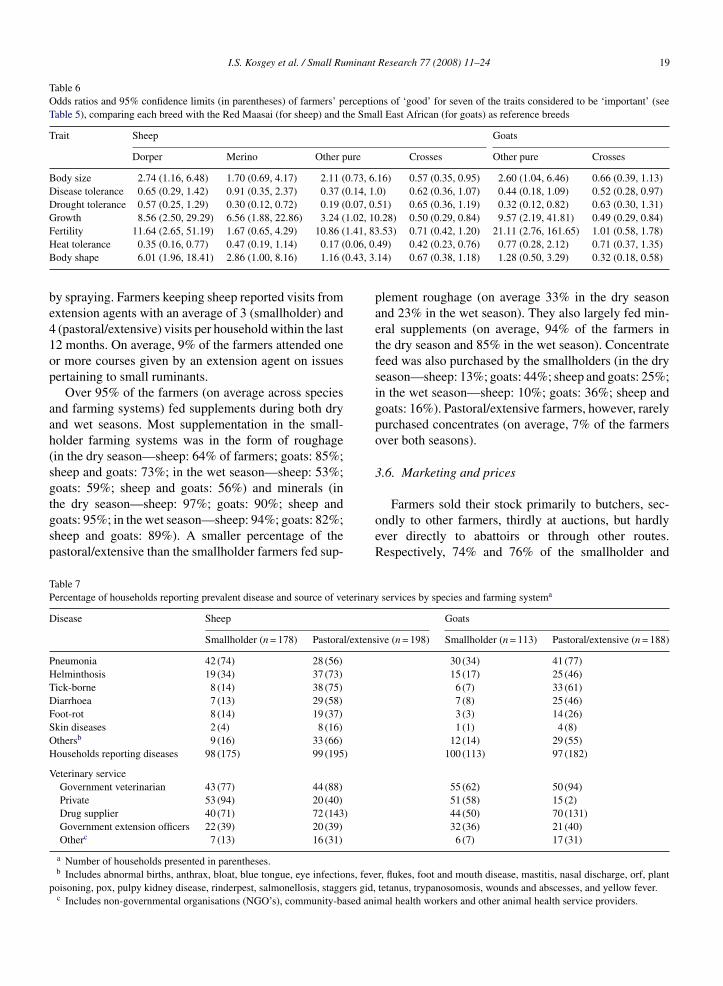
ntervals for seven of the most commonly reported traitsn Table 5. The odds ratio presented is a measure of theelative perception for a trait in a given breed when com-ared with the Red Maasai for sheep and the Small Eastfrican for goats. Essentially, if the odds ratio overlapsne (1) then there is no difference in the stated per-eption of the traits, a better perception when greaterhan one and a lower perception when less than one. Thedds ratio is significant when its 95% confidence inter-
al excludes one (1) (Bebe et al., 2003). For instance, thedds of a farmer rating highly the growth rate of a Dorperas 8.56 that of a farmer rating highly the growth ratef a Red Maasai (Table 6). In contrast, the odds ratioResearch 77 (2008) 11–24 17
for crosses compared with the Red Maasai was only0.50. In terms of drought and heat tolerance, the oddsratios for other breeds and crosses compared with theRed Maasai ranged from 0.17 to 0.65. Similar patternswere evident for other pure breeds of goats and crossescompared with the Small East African. Body size andperformance ranked as the most important traits in thechoice of a breeding ram/buck. ‘True to breed’ and avail-ability featured more prominently among smallholderthan pastoral/extensive farmers.
3.4.2. Type of mating and average age at firstmating
Uncontrolled mating within the household’s flock waspredominant (on average 46% for smallholder and 58%for pastoral/extensive farmers for sheep; 42% and 54%for goats). Group mating, in which a group of ewes ordoes is left with one or more rams or bucks to matefor a predetermined period, was the other main systempractised by pastoral/extensive farmers (42% for sheep;36% for goats). Smallholder households practised hand-mating (25% for sheep; 37% for goats), more so thanthe pastoral/extensive households. Smallholder farmersmated animals for the first time at about 10–11 monthsof age for both males and females. A slightly wider agerange of 9–12 months was reported in pastoral/extensivefarming.
3.5. Animal health and feeding management
Over 98% of the households reported incidences ofdiseases in smallholder and pastoral/extensive farmingsystems (Table 7). Pneumonia, helminthosis, tick-bornediseases, diarrhoea and foot-rot were the most com-monly reported. All these diseases were very prevalentamong pastoral/extensive systems, but, except for pneu-monia and, to a lesser extent, helminthosis, they didnot assume the same importance among smallholders(P < 0.001 by χ2 tests). Most farmers sought veterinaryhelp, mainly from the government veterinary service,private veterinarians and drug suppliers, with drug sup-pliers featuring predominantly among pastoral/extensivefarmers (Table 7). Anthelmintics and antibiotics were themost common forms of treatment applied. Respectively,33% and 58% of the smallholder and pastoral/extensivefarmers reported use of anthelmintics for sheep. Thecorresponding figures for goats were 27% and 35%.Uses of antibiotics were reported by 29% and 92% of
the smallholder and pastoral/extensive farmers for sheepand by 26% and 85%, respectively, for goats. Acaricidewas mostly used to control ecto-parasites, applied tosheep virtually always by dipping but to goats mainly
18I.S.K
osgeyetal./Sm
allRum
inantResearch
77(2008)
11–24
Table 5Percentage of households perceiving different traits for each sheep and goat breed to be good and the number of households (in parentheses) perceiving the trait to be important (i.e.,poor + average + good)
Trait Sheep Goats
Red Maasai(n = 138)
Dorper(n = 40)
Merino(n = 28)
Other purea
(n = 20)Crosses(n = 168)
Small EastAfrican (n = 170)
Other pureb
(n = 29)Crosses(n = 105)
Body size 59 (133) 79 (38)* 70 (27) 75 (20) 43 (161)* 54 (166) 75 (28)* 43 (104)Disease tolerance 75 (131) 65 (37) 73 (26) 53 (19) 62 (157) 83 (163) 67 (27) 68 (99)*Drought tolerance 81 (131) 69 (39) 56 (27)** 45 (20)*** 70 (152) 88 (165) 68 (28)* 77 (91)Growth 56 (127) 92 (38)*** 89 (28)** 80 (20)* 44 (153)** 57 (162) 93 (28)** 40 (102)*Fertility 62 (132) 94 (35)** 73 (26) 95 (19)* 48 (149) 59 (161) 96 (26)** 52 (93)Heat tolerance 79 (126) 56 (36)** 63 (27) 39 (18)*** 59 (138)** 79 (157) 74 (23) 70 (83)Body shape 62 (121) 89 (37)** 81 (27)* 65 (20) 44 (126) 69 (153) 73 (26) 41 (91)***Prolificacyc 29 (126) 47 (32) 46 (26) 41 (17) 17 (136) 34 (155) 80 (25)*** 34 (59)Temperament 66 (114) 60 (30) 78 (27) 94 (18)* 60 (127) 54 (138) 54 (28) 43 (83)***Meat quality 81 (103) 100 (34) 79 (24) 100 (19) 70 (96) 88 (152) 96 (24) 70 (60)*Colourc 71 (78) 81 (31) 81 (21) 92 (13) 46 (72) 80 (86) 91 (23) 60 (42)Hornsc 56 (43) 70 (10) 50 (8) 0 (1) 36 (25) 55 (67) 63 (19) 25 (32)*Milk 27 (33) 92 (12)** 56 (16)* 38 (13) 63 (19)* 27 (105) 65 (23)* 27 (63)Wool 0 (0) 0 (0) 77 (13) 75 (8) 39 (31) – – –Fat 0 (2) 100 (1) 0 (0) 0 (0) 0 (2) – – –
***P < 0.001; **P < 0.01; *P < 0.05 when compared with the Red Maasai (sheep) or the Small East African (goats) as the reference breed in a logistic regression analysis of r/n, where n = numberof farmers rating a trait important and r = number of farmers rating a trait good. Individual breed × farming system r/n values (10 for sheep and 6 for goats) were used in the analysis with termsfor breed and farming system in the model.
a Breeds: Corriedale, Hampshire Down, Romney Marsh.b Breeds: Alpine, Boer, Dual Purpose, Galla, Saanen, Toggenburg.c Responses for sheep for smallholder and pastoral/extensive farmers were not consistent for prolificacy, colour and horns, and so no overall significance values are given for sheep.
I.S. Kosgey et al. / Small Ruminant Research 77 (2008) 11–24 19
Table 6Odds ratios and 95% confidence limits (in parentheses) of farmers’ perceptions of ‘good’ for seven of the traits considered to be ‘important’ (seeTable 5), comparing each breed with the Red Maasai (for sheep) and the Small East African (for goats) as reference breeds
Trait Sheep Goats
Dorper Merino Other pure Crosses Other pure Crosses
Body size 2.74 (1.16, 6.48) 1.70 (0.69, 4.17) 2.11 (0.73, 6.16) 0.57 (0.35, 0.95) 2.60 (1.04, 6.46) 0.66 (0.39, 1.13)Disease tolerance 0.65 (0.29, 1.42) 0.91 (0.35, 2.37) 0.37 (0.14, 1.0) 0.62 (0.36, 1.07) 0.44 (0.18, 1.09) 0.52 (0.28, 0.97)Drought tolerance 0.57 (0.25, 1.29) 0.30 (0.12, 0.72) 0.19 (0.07, 0.51) 0.65 (0.36, 1.19) 0.32 (0.12, 0.82) 0.63 (0.30, 1.31)Growth 8.56 (2.50, 29.29) 6.56 (1.88, 22.86) 3.24 (1.02, 10.28) 0.50 (0.29, 0.84) 9.57 (2.19, 41.81) 0.49 (0.29, 0.84)F 1.41, 83H 0.06, 0.B 0.43, 3.
be41op
aah(sgtgsp
TP
D
PHTDFSOH
V
p
ertility 11.64 (2.65, 51.19) 1.67 (0.65, 4.29) 10.86 (eat tolerance 0.35 (0.16, 0.77) 0.47 (0.19, 1.14) 0.17 (ody shape 6.01 (1.96, 18.41) 2.86 (1.00, 8.16) 1.16 (
y spraying. Farmers keeping sheep reported visits fromxtension agents with an average of 3 (smallholder) and(pastoral/extensive) visits per household within the last2 months. On average, 9% of the farmers attended oner more courses given by an extension agent on issuesertaining to small ruminants.
Over 95% of the farmers (on average across speciesnd farming systems) fed supplements during both drynd wet seasons. Most supplementation in the small-older farming systems was in the form of roughagein the dry season—sheep: 64% of farmers; goats: 85%;heep and goats: 73%; in the wet season—sheep: 53%;oats: 59%; sheep and goats: 56%) and minerals (in
he dry season—sheep: 97%; goats: 90%; sheep andoats: 95%; in the wet season—sheep: 94%; goats: 82%;heep and goats: 89%). A smaller percentage of theastoral/extensive than the smallholder farmers fed sup-able 7ercentage of households reporting prevalent disease and source of veterinary
isease Sheep
Smallholder (n = 178) Pastoral/extens
neumonia 42 (74) 28 (56)elminthosis 19 (34) 37 (73)ick-borne 8 (14) 38 (75)iarrhoea 7 (13) 29 (58)oot-rot 8 (14) 19 (37)kin diseases 2 (4) 8 (16)thersb 9 (16) 33 (66)ouseholds reporting diseases 98 (175) 99 (195)
eterinary serviceGovernment veterinarian 43 (77) 44 (88)Private 53 (94) 20 (40)Drug supplier 40 (71) 72 (143)Government extension officers 22 (39) 20 (39)Otherc 7 (13) 16 (31)
a Number of households presented in parentheses.b Includes abnormal births, anthrax, bloat, blue tongue, eye infections, feveoisoning, pox, pulpy kidney disease, rinderpest, salmonellosis, staggers gid,c Includes non-governmental organisations (NGO’s), community-based ani
.53) 0.71 (0.42, 1.20) 21.11 (2.76, 161.65) 1.01 (0.58, 1.78)49) 0.42 (0.23, 0.76) 0.77 (0.28, 2.12) 0.71 (0.37, 1.35)14) 0.67 (0.38, 1.18) 1.28 (0.50, 3.29) 0.32 (0.18, 0.58)
plement roughage (on average 33% in the dry seasonand 23% in the wet season). They also largely fed min-eral supplements (on average, 94% of the farmers inthe dry season and 85% in the wet season). Concentratefeed was also purchased by the smallholders (in the dryseason—sheep: 13%; goats: 44%; sheep and goats: 25%;in the wet season—sheep: 10%; goats: 36%; sheep andgoats: 16%). Pastoral/extensive farmers, however, rarelypurchased concentrates (on average, 7% of the farmersover both seasons).
3.6. Marketing and prices
Farmers sold their stock primarily to butchers, sec-ondly to other farmers, thirdly at auctions, but hardlyever directly to abattoirs or through other routes.Respectively, 74% and 76% of the smallholder and
services by species and farming systema
Goats
ive (n = 198) Smallholder (n = 113) Pastoral/extensive (n = 188)
30 (34) 41 (77)15 (17) 25 (46)6 (7) 33 (61)7 (8) 25 (46)3 (3) 14 (26)1 (1) 4 (8)
12 (14) 29 (55)100 (113) 97 (182)
55 (62) 50 (94)51 (58) 15 (2)44 (50) 70 (131)32 (36) 21 (40)6 (7) 17 (31)
r, flukes, foot and mouth disease, mastitis, nasal discharge, orf, planttetanus, trypanosomosis, wounds and abscesses, and yellow fever.mal health workers and other animal health service providers.

20 I.S. Kosgey et al. / Small Ruminant Research 77 (2008) 11–24
Table 8Average prices (US$)a and their standard errors for different categories of animals by small ruminant species
Species Genotype Animal category
Weaner Adult
nb Male Female n Male n Female
SheepIndigenous 80 11.55 ± 0.49 11.99 ± 0.48 82 23.16 ± 1.40 83 20.35 ± 1.03Indigenous × exotic 84 15.23 ± 0.48 15.72 ± 0.48 82 28.49 ± 1.36 83 25.39 ± 1.00Exotic 82 16.60 ± 0.47 16.91 ± 0.51 81 33.53 ± 1.32 81 29.09 ± 1.03
GoatsIndigenous 90 11.88 ± 0.45 12.29 ± 0.44 95 25.23 ± 0.99 95 21.24 ± 0.75Indigenous × exotic 75 14.25 ± 0.47 14.87 ± 0.49 75 27.43 ± 1.12 75 24.93 ± 0.92
16.04
Exotic 61 15.47 ± 0.49a US$ 1.00 ≈ Kshs 75.00 (Kenya shillings) at the time.b Applies to both male and female.
pastoral/extensive sheep farmers did not have a prefer-ence for a particular season for selling their animals.The corresponding percentages for goats averaged 84%.The remainder either sold animals in the wet or dryseasons only. Farmers selling during the dry seasonslightly outnumbered those selling in the wet season.Pure exotic and indigenous × exotic genotypes, in thatorder, fetched higher prices than indigenous genotypesfor both species (P < 0.001) (Table 8) but prices var-ied significantly across districts, especially for sheep(all genotypes) and indigenous goats. The average priceratios for indigenous to indigenous × exotic and exoticgenotypes were 1:1.3:1.4 for male and female weanersheep, and 1:1.2:1.5 and 1:1.3:1.4 for male and femaleadult sheep, respectively. The corresponding ratios forgoats were 1:1.2:1.3 for weaners and 1:1.1:1.3 and1:1.2:1.3 for male and female adults, respectively. Gen-erally, farmers preferred meat from exotic sheep and theircrosses to that from indigenous breeds. In contrast, mostfarmers preferred indigenous goat meat to that from theexotics and their crosses.
4. Discussion
4.1. Overview
It is important to have good understanding of aproduction system and the relative importance of thedifferent constraints prior to initiating any geneticimprovement programme (Baker and Gray, 2004). Thepurpose of the present survey was to provide a betterunderstanding of smallholder and pastoral/extensive pro-duction systems in the tropics, by taking Kenya as an
example. Smallholder farmers are found mainly in themedium- to high-potential areas (Rege, 1994). Small-holder farmers tend to keep animals for family needs,rather than purely as an economic enterprise. In this sys-± 0.52 60 32.13 ± 1.31 61 28.20 ± 1.13
tem, livestock may provide agricultural inputs, such asmanure, and render the enterprise more secure by usingresidual capacities of production factors with low oppor-tunity cost such as non-arable land, excess labour, byconverting crops and crop residues into high value ani-mal products and by balancing production and marketrisks (Jahnke, 1982). The importance of livestock to theproduction system is indicated in the present study inwhich 46% of the smallholders put livestock as their pri-mary activity compared with 33% who put crops first.Pastoralist farmers rely even more on livestock as theirmain source of livelihood (58% in the present study) andusually own relatively large numbers of animals underextensive or communal grazing and management. Theyare found mainly in the medium- to low-potential areas.In recent times, pastoralist communities, especially inthe medium-potential areas, have been changing frompurely keeping livestock towards agro-pastoral systems.This change is seen in the present study where 25% of thepastoral/extensive farmers put crop production as theirmain activity. Encroachment of crop farmers from othercommunities and adoption of crop-based food by thepastoralist communities are now common features in thedistricts surveyed.
The results of the survey revealed a number of per-tinent issues (i.e., opportunities and constraints) that, ifaddressed adequately, could help in developing effectivesmall ruminant breeding programmes and in increasingthe general productivity of the animals. Small rumi-nant production was seen not only to be important bothby smallholder and pastoral/extensive farmers, rankingclosely behind cattle, but also to provide a variety ofbenefits ranging from tangible to intangible ones. This
agrees with other observations (Field, 1985; Okello,1985; Jaitner et al., 2001; Seleka, 2001). This knowl-edge of the reasons for keeping small ruminants isa prerequisite for deriving operational breeding goals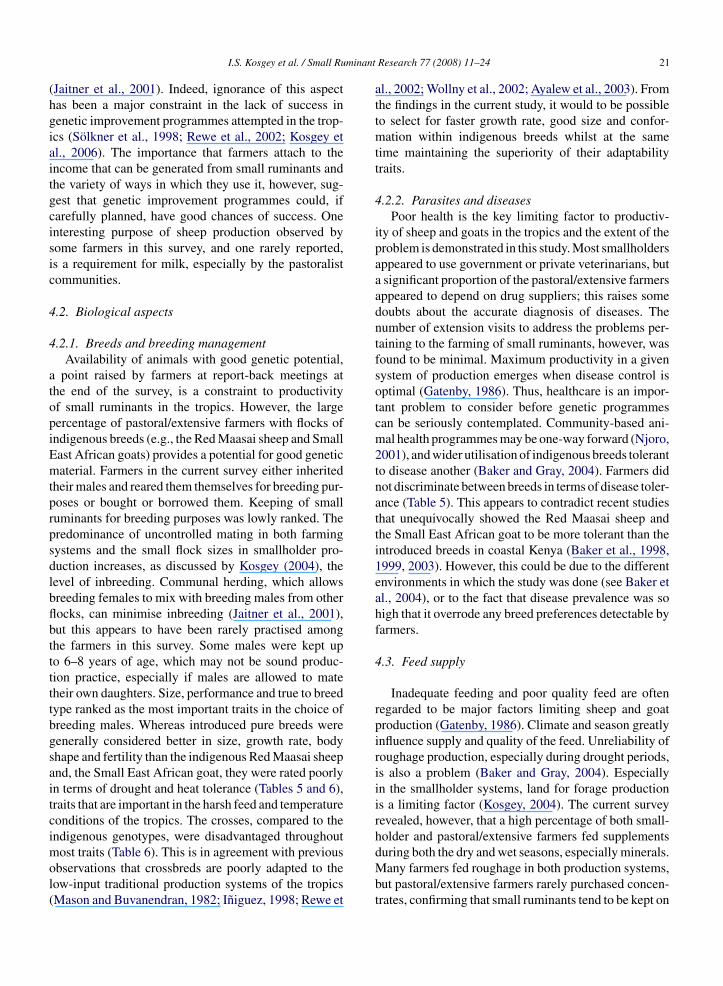
minant
(hgiaitgcisic
4
4
atopiEmtprpsdlbflbtttttbgsaitcimol(
I.S. Kosgey et al. / Small Ru
Jaitner et al., 2001). Indeed, ignorance of this aspectas been a major constraint in the lack of success inenetic improvement programmes attempted in the trop-cs (Solkner et al., 1998; Rewe et al., 2002; Kosgey etl., 2006). The importance that farmers attach to thencome that can be generated from small ruminants andhe variety of ways in which they use it, however, sug-est that genetic improvement programmes could, ifarefully planned, have good chances of success. Onenteresting purpose of sheep production observed byome farmers in this survey, and one rarely reported,s a requirement for milk, especially by the pastoralistommunities.
.2. Biological aspects
.2.1. Breeds and breeding managementAvailability of animals with good genetic potential,
point raised by farmers at report-back meetings athe end of the survey, is a constraint to productivityf small ruminants in the tropics. However, the largeercentage of pastoral/extensive farmers with flocks ofndigenous breeds (e.g., the Red Maasai sheep and Smallast African goats) provides a potential for good geneticaterial. Farmers in the current survey either inherited
heir males and reared them themselves for breeding pur-oses or bought or borrowed them. Keeping of smalluminants for breeding purposes was lowly ranked. Theredominance of uncontrolled mating in both farmingystems and the small flock sizes in smallholder pro-uction increases, as discussed by Kosgey (2004), theevel of inbreeding. Communal herding, which allowsreeding females to mix with breeding males from otherocks, can minimise inbreeding (Jaitner et al., 2001),ut this appears to have been rarely practised amonghe farmers in this survey. Some males were kept upo 6–8 years of age, which may not be sound produc-ion practice, especially if males are allowed to mateheir own daughters. Size, performance and true to breedype ranked as the most important traits in the choice ofreeding males. Whereas introduced pure breeds wereenerally considered better in size, growth rate, bodyhape and fertility than the indigenous Red Maasai sheepnd, the Small East African goat, they were rated poorlyn terms of drought and heat tolerance (Tables 5 and 6),raits that are important in the harsh feed and temperatureonditions of the tropics. The crosses, compared to thendigenous genotypes, were disadvantaged throughout
ost traits (Table 6). This is in agreement with previousbservations that crossbreds are poorly adapted to theow-input traditional production systems of the tropicsMason and Buvanendran, 1982; Iniguez, 1998; Rewe et
Research 77 (2008) 11–24 21
al., 2002; Wollny et al., 2002; Ayalew et al., 2003). Fromthe findings in the current study, it would to be possibleto select for faster growth rate, good size and confor-mation within indigenous breeds whilst at the sametime maintaining the superiority of their adaptabilitytraits.
4.2.2. Parasites and diseasesPoor health is the key limiting factor to productiv-
ity of sheep and goats in the tropics and the extent of theproblem is demonstrated in this study. Most smallholdersappeared to use government or private veterinarians, buta significant proportion of the pastoral/extensive farmersappeared to depend on drug suppliers; this raises somedoubts about the accurate diagnosis of diseases. Thenumber of extension visits to address the problems per-taining to the farming of small ruminants, however, wasfound to be minimal. Maximum productivity in a givensystem of production emerges when disease control isoptimal (Gatenby, 1986). Thus, healthcare is an impor-tant problem to consider before genetic programmescan be seriously contemplated. Community-based ani-mal health programmes may be one-way forward (Njoro,2001), and wider utilisation of indigenous breeds tolerantto disease another (Baker and Gray, 2004). Farmers didnot discriminate between breeds in terms of disease toler-ance (Table 5). This appears to contradict recent studiesthat unequivocally showed the Red Maasai sheep andthe Small East African goat to be more tolerant than theintroduced breeds in coastal Kenya (Baker et al., 1998,1999, 2003). However, this could be due to the differentenvironments in which the study was done (see Baker etal., 2004), or to the fact that disease prevalence was sohigh that it overrode any breed preferences detectable byfarmers.
4.3. Feed supply
Inadequate feeding and poor quality feed are oftenregarded to be major factors limiting sheep and goatproduction (Gatenby, 1986). Climate and season greatlyinfluence supply and quality of the feed. Unreliability ofroughage production, especially during drought periods,is also a problem (Baker and Gray, 2004). Especiallyin the smallholder systems, land for forage productionis a limiting factor (Kosgey, 2004). The current surveyrevealed, however, that a high percentage of both small-holder and pastoral/extensive farmers fed supplements
during both the dry and wet seasons, especially minerals.Many farmers fed roughage in both production systems,but pastoral/extensive farmers rarely purchased concen-trates, confirming that small ruminants tend to be kept on
minant
22 I.S. Kosgey et al. / Small Rulow-input systems. Although the feed quality and quan-tity of many tropical grasses is often inadequate (e.g.,Carles, 1983; Gatenby, 1986; Charray et al., 1992), itwould appear from this survey that farmers are doingtheir best to attend to the nutrition of their stock fromtheir limited means. Use of genotypes that are adaptedto efficiently utilise poor quality feed (Baker and Rege,1994) may be one option but this trait was not includedamongst those used to characterise breeds in this survey.
4.4. Socio-economic aspects
Although not studied in the present survey, the differ-ent socio-cultural ways of different communities (e.g.,the Maasai of Narok and Trans-Mara districts and theirSamburu counterparts in Laikipia compared with theKikuyu smallholders of Nyeri) will be important toconsider in the adoption of any breeding programme(Mbuku, 2006; Verbeek, 2006). Previous improvementprogrammes of small ruminants ignored this fact andended up unsatisfactorily (Solkner et al., 1998; Rewe etal., 2002; Kosgey et al., 2006). The difficulty, however, isthat the infrastructure necessary for collection of reliablepedigree and performance data does not exist (Kiwuwa,1992) and, furthermore, it is unlikely that performancerecording is logistically feasible in large numbers ofsmallholder flocks (Baker and Gray, 2004).
Farmers sold their stock primarily to butchers, andalso to individual farmers and at auctions, but hardly everto abattoirs, suggesting possibilities of non-competitiveprices. Animals were often sold throughout the year, pre-sumably often when prices were low, and this supportsthe results of other reports indicating that ad hoc salesof animals to meet emergencies prevail (e.g., Seleka,2001; Budisatria, 2006). Farmers would likely not adoptimproved management practices whilst proceeds fromsale of animals are low (Seleka, 2001). Some farmers,however, only sold in the dry or wet seasons, indicat-ing a necessity to explore the possibilities of organisedmarketing of animals so that farmers can reap maximumbenefit from sales (Budisatria, 2006). Current market-ing information in the tropics is largely informal andobtained by talking to buyers or sellers who have con-ducted transactions. The fact that most butchers/traderswere paying premium prices for pure exotic and indige-nous × exotic crosses of both sheep and goats couldinfluence the type of genotypes adopted by the farmers.However, the relative sheep prices found in the cur-
rent study are very similar to the 40–60% advantagesobserved by Baker et al. (2004) in live weight for Dor-per versus Red Maasai sheep in a semi-arid environmentin Kenya. Therefore, it is possible that butchers or tradersResearch 77 (2008) 11–24
were paying more for heavier exotic animals or exoticcrosses (and not, for example, for any improved confor-mation) with the price per kg probably constant acrossstock classes.
5. Conclusion
The results from the present survey reveal several con-straints that need to be taken into consideration whendesigning and implementing genetic improvement pro-grammes for sheep and goats. It is thus necessary to lookat the production system in a holistic way and involve tar-get groups in devising effective small ruminant breedingprogrammes. An integrated systems approach to smallruminant improvement is likely to be the best option. Forexample, in a study of adoption of indigenous × exoticcrossbred goats in smallholder production systems inEthiopian highlands, Ayalew et al. (2003) found thatthe non-genetic improvement strategies – better feed-ing practices and greater attention to basic healthcare –were more successful than genetic improvement strate-gies alone. The ultimate beneficiary in that study wasthe indigenous goat and not the exotic genotype that hadbeen originally planned. If any genetic improvement isappropriate in the smallholder or pastoral/extensive envi-ronment in this study in Kenya, then emphasis on geneticimprovement of the indigenous genotypes may prove tobe the best option.
Acknowledgements
We are greatly indebted to The Netherlands Foun-dation for the Advancement of Tropical Research(WOTRO) and the International Livestock ResearchInstitute (ILRI, Nairobi, Kenya) for financial assistanceto carry out this study. We also greatly acknowl-edge the support of the personnel of the then Kenya’sMinistry of Agriculture and Rural Development forsuccessful logistic support and subsequent adminis-tration of questionnaires to farmers. Co-operation ofthe farmers, butchers and traders from the districtssurveyed is warmly acknowledged. We greatly acknowl-edge Ms. Sonal Nagda (ILRI-Nairobi) for handling thedatabase. Egerton University (Njoro, Kenya) is grate-fully acknowledged for granting the first author studyleave.
References
Ayalew, W., Rischkowsky, B., King, J.M., Bruns, E., 2003. Crossbredsdid not create more net benefits than indigenous goats in Ethiopiansmallholdings. Agric. Sys. 76, 1137–1156.

minant
B
B
B
B
B
B
B
B
C
C
C
F
G
I
J
J
K
I.S. Kosgey et al. / Small Ru
aker, R.L., Gray, G.D., 2004. Appropriate breeds and breedingschemes for sheep and goats in the tropics. In: Sani, R.A., Gray,G.D., Baker, R.L. (Eds.), Worm Control for Small Ruminants inTropical Asia, Monograph, No. 113. Australian Centre for Interna-tional Agricultural Research (ACIAR), pp. 63–95 (also availablefrom http://www.ilri.org or from http://www.worminfo.org).
aker, R.L., Mugambi, J.M., Audho, J.O., Carles, A.B., Thorpe, W.,2004. Genotype by environment interactions for productivity andresistance to gastro-intestinal nematode parasites in Red Maasaiand Dorper sheep. Anim. Sci. 79, 343–353.
aker, R.L., Mwamachi, D.M., Audho, J.O., Aduda, E.O., Thorpe,W., 1998. Resistance of Galla and Small East African goats in thesub-humid tropics to gastrointestinal nematode infections and theperi-parturient rise in faecal egg counts. Vet. Parasitol. 79, 53–64.
aker, R.L., Mwamachi, D.M., Audho, J.O., Aduda, E.O., Thorpe, W.,1999. Genetic resistance to gastro-intestinal nematode parasites inRed Maasai Dorper and Red Maasai × Dorper ewes in the sub-humid tropics. Anim. Sci. 69, 335–344.
aker, R.L., Nagda, S., Rodriguez-Zas, S.L., Southey, B.R., Audho,J.O., Aduda, E.O., Thorpe, W., 2003. Resistance and resilience togastro-intestinal nematode parasites and relationships with produc-tivity of Red Maasai Dorper and Red Maasai × Dorper crossbredlambs in the sub-humid tropics. Anim. Sci. 76, 119–136.
aker, R.L., Rege, J.E.O., 1994. Genetic resistance to diseases andother stresses in improvement of ruminant livestock in the tropics.In: Proceedings of the Fifth World Congress on Genetics Appliedto Livestock Production, vol. 20, University of Guelph, Canada,August 7–12, 1994, pp. 405–412.
ebe, B.O., Udo, H.M.J., Rowlands, G.J., Thorpe, W., 2003. Small-holder dairy systems in the Kenya highlands: breed preferencesand breeding practices. Livest. Prod. Sci. 82, 117–127.
udisatria, I.G.S., 2006. Dynamics of Small Ruminant Develop-ment in Central Java, Indonesia. Ph.D. Thesis. WageningenUniversity, The Netherlands, 144 pp. (also available fromhttp://www.library.wur.nl).
arles, A.B., 1983. Sheep Production in the Tropics. Oxford UniversityPress, New York, 213 pp.
BS, 1999. Central Bureau of Statistics, Population and Housing Cen-sus. CBS, Nairobi, Kenya.
harray, J., Humbert, J.M., Levif, J., 1992. Manual of Sheep Produc-tion in the Tropics. CTA and C.A.B. International, Wallingford,UK, 187 pp.
ield, C.R., 1985. The importance to Rendille subsistence pastoralistsof sheep and goats in Northern Kenya. In: Wilson, R.T., Bourzat, D.(Eds.), Small Ruminants in African Agriculture, Proceedings of aConference. ILCA, Addis Ababa, Ethiopia, September 30–October4, 1985, pp. 188–198.
atenby, R.M., 1986. Sheep Production in the Tropics and Sub-tropics.Longman Inc., New York, 351 pp.
niguez, L., 1998. Community breeding programmes for small rumi-nants in the Andean region. In: Proceedings of the Sixth WorldCongress on Genetics Applied to Livestock Production, vol. 25,Armidale, NSW, Australia, January 11–16, 1998, pp. 249–256.
ahnke, H.E., 1982. Livestock Production Systems and LivestockDevelopment in Africa. Kieler Wissenschaftsverlag Vauk, Kiel,Federal Republic of Germany, 253 pp.
aitner, J., Sowe, J., Secka-Njie, E., Demple, L., 2001. Ownership
pattern and management practices of small ruminants in TheGambia—implications for a breeding programme. Small Rumin.Res. 40, 101–108.iwuwa, G.H., 1992. Breeding strategies for small ruminant produc-tivity in Africa. In: Rey, B., Lebbie, S.H.B., Reynolds, L. (Eds.),
Research 77 (2008) 11–24 23
Small Ruminant Research and Development in Africa, Proceedingsof the First Biennial Conference of the African Small RuminantResearch Network. ILRAD, Kenya, December 10–14, 1990, pp.423–434.
Kosgey, I.S., 2004. Breeding Objectives and Breeding Strategiesfor Small Ruminants in the Tropics. Ph.D. Thesis. Wagenin-gen University, The Netherlands, 272 pp. (also available fromhttp://www.library.wur.nl).
Kosgey, I.S., van Arendonk, J.A.M., Udo, H.M.J., Baker, R.L., 2006.Successes and failures of small ruminant breeding programmes inthe tropics: a review. Small Rumin. Res. 61, 13–28.
Mahanjana, A.M., Cronje, P.B., 2000. Factors affecting goat produc-tion in a communal farming system in Eastern Cape region of SouthAfrica. S. Afr. J. Anim. Sci. 30, 149–154.
Mason, I.L., Buvanendran, V., 1982. Breeding Plans for RuminantLivestock in the Tropics. FAO Anim. Prod. Health Paper, 34, Rome,Italy, 89 pp.
Mbuku, S.M., 2006. Characterisation of the Breeding Practices ofSheep and Goat Keepers in Northern Kenya. M.Sc. Thesis. EgertonUniversity, Njoro, Kenya, 84 pp.
Mucuthi, M.M., Munei, K., Sharma, K.C., 1992. The contributionof small ruminant production to household income, with specialemphasis on sheep production, for small scale farmers in the ASAL:a case study of Laikipia West. In: Proceedings of the Tenth Scien-tific Workshop, ILRAD, Nairobi, Kenya, February 26–27, 1992,pp. 109–116.
Mwendia, C.W., 1997. Review of Kenyan Agricultural Research Sheepand Goats, vol. 35. CAZS, University of Wales, Gwynedd, UK, 129pp.
Njoro, J.N., 2001. Community initiatives in livestock improvement:the case of Kathekani Kenya. In: Community-based Managementof Animal Genetic Resources, Proceedings of the Workshop, Mba-bane, Swaziland, May 7–11, 2001, pp. 77–84.
Okello, K.L., 1985. A survey of the productivity and functions ofgoats in Uganda. In: Wilson, R.T., Bourzat, D. (Eds.), Small Rumi-nants in African Agriculture, Proceedings of a Conference. ILCA,Addis Ababa, Ethiopia, September 30–October 4, 1985, pp. 208–217.
Otieno, L., Ackello-Ogutu, C., Mullins, G., Reynolds, L., 1993. Farm-ers’ reasons for owning small ruminants in a case study of smallruminant production and marketing in the semi-humid zone ofKaloleni division Coast province. In: Proceedings of the EleventhSmall Ruminant Collaborative Research Support Program (SR-CRSP), Kenya, pp. 189–193.
Peeler, E.J., Omore, A.O., 1997. Manual of Livestock Production Sys-tems in Kenya—Cattle Sheep and Goat Systems, 2nd edition.DFID/KARI National Agricultural Research Project II, NationalVeterinary Research Centre, Kikuyu, Kenya, 138 pp.
Rege, J.E.O., 1994. Indigenous African small ruminants: a case forcharacterisation and improvement. In: Proceedings of the Sec-ond Biennial Conference of the African Small Ruminant ResearchNetwork, UICC, Kampala, Uganda, December 5–9, 1994, pp.293–295.
Rewe, T.O., Ogore, P.B., Kahi, A.K., 2002. Integrated goat projectsin Kenya: impact on genetic improvement. In: Proceedings of theSeventh World Congress on Genetics Applied to Livestock Produc-tion, vol. 33, Montpellier, France, August 19–23, 2002, pp. 385–
387.Rowlands, G.J., Nagda, S., Rege, J.E.O., Mhlanga, F., Dzama, K.,Gandiya, F., Hamudikwanda, H., Makuza, S., Moyo, S., Matika,O., Nangomasha, E., Sikosana, J., 2003. A Report to FAO on theDesign Execution and Analysis of Livestock Breed Surveys—A

minant
The lessons of livestock improvement failure: revising breeding
24 I.S. Kosgey et al. / Small Ru
Case Study in Zimbabwe. International Livestock Research Insti-tute, Nairobi, 212 pp.
Seleka, T.B., 2001. Determinants of short-run supply of small rumi-nants in Botswana. Small Rumin. Res. 40, 203–214.
Solkner, J., Nakimbugwe, H., Valle Zarate, A., 1998. Analysis of deter-minants for success and failure of village breeding programmes. In:
Proceedings of the Sixth World Congress on Genetics Applied toLivestock Production, vol. 25, Armidale, NSW, Australia, January11–16, 1998, pp. 273–280.Turner, H.N., 1978. Sheep and the smallholder. World Anim. Rev. 28,4–8.
Research 77 (2008) 11–24
Verbeek, E., 2006. Factors Influencing Small Ruminant Breedingand the Design of Sustainable Small Ruminant Community-basedBreeding Programs in Kenya. M.Sc. Thesis. Wageningen Univer-sity, The Netherlands, 83 pp.
Wollny, C.B.A., Banda, J.W., Mlewah, T.F.T., Phoya, R.K.D., 2002.
strategies for indigenous Malawi sheep? In: Proceedings of theSeventh World Congress on Genetics Applied to Livestock Pro-duction, vol. 33, Montpellier, France, August 19–23, 2002, pp.345–348.