Factors and Components Affecting Dairy Smallholder Farmers ...
Upload
khangminh22Category
view
3download
0
DETERMINANTS OF ARTIFICIAL INSEMINATION USE BY SMALLHOLDER
DAIRY FARMERS IN LEMU-BILBILO DISTRICT, ETHIOPIA
SIME SHIFERAW TEFERA
A Thesis Submitted to the Graduate School in Fulfilment for the Requirements of the
Master of Science Degree in Agricultural and Applied Economics of Egerton University
EGERTON UNIVERSITY
NOVEMBER, 2013

ii
DECLARATION AND APPROVAL
Declaration
I declare that this thesis is my original work and has not been presented in any other university for
the award of a Degree, Diploma or a Certificate.
Sime Shiferaw Tefera
Reg. No. KM17/3151/11
Signature: …………………………………………..
Date: ………………………………………………..
Recommendation
This work has been submitted with our approval as University supervisors.
1. Prof. Job K. Lagat (PhD)
Department of Agricultural Economics and Agribusiness Management, Egerton University
Signature: …………………………………………..
Date: ………………………………………………..
2. Dr. Hillary K. Bett (PhD)
Department of Agricultural Economics and Agribusiness Management, Egerton University
Signature: …………………………………………..
Date: ……………………………………………….
iii
COPYRIGHT
Whole or no part of this work may be reproduced, stored in any retrieval system or transmitted in
any form or by any means including electronic, recording, photocopying or otherwise without the
prior written permission of the author or Egerton University on behalf of the author.
Sime Shiferaw Tefera©2013
All rights reserved

iv
DEDICATION
I dedicate this work to my beloved wife Mebrat Beyecha and my daughter Meklit Sime.
v
ACKNOWLEDGEMENT
Above all, honour and thanks go to the Almighty GOD for his mercy, care, strength and
guidance during the entire period of my study. I wish to acknowledge the staff of the Department
of Agricultural Economics and Agribusiness Management, Egerton University for their support
since I enrolled for my study. Special thanks go to my University supervisors Prof. Job. K. Lagat
and Dr. Hillary. K. Bett for their unreserved effort to reconstruct this thesis work starting from the
proposal. I would also like to extend my appreciation to Collaborative Masters of Agricultural and
Applied Economics (CMAAE) and German Academic Exchange Service (DAAD) through
African Economic Research Consortium (AERC) for providing me the opportunity to undergo
specialised and rigorous training both in Egerton and Pretoria Universities by covering the school
fees, stipend and research fund. I also extend my honest thanks to Mr. Endale Nigussie, all the
respondent farmers, enumerators and Lemu-Bilbilo district agricultural office staffs for their
invaluable support during data collection process. I do not forget to express the love I have to my
daughter Meklit Sime who was born when I was doing the first year coursework. Last but not least,
I would like to express my heartiest love and respect to my wife Mebrat Beyecha for her unlimited
care and positive ideas throughout my stay abroad.

vi
ABSTRACT
Despite Ethiopia possessing the highest number of livestock in Africa, its benefit to the
country and smallholder farmers is small. This is to a large extent attributed to the dominance of
low producing local cattle breeds. Though the government introduced Artificial Insemination (AI)
technology to improve this condition, the adoption rate by smallholder farmers is still low. The main
objective of this study was, therefore, to examine the adoption of AI technology by smallholder dairy
farmers in Lemu-Bilbilo district, Ethiopia. The specific objectives were to characterize adopters and
non-adopters of AI, to determine factors affecting adoption of AI and to determine the extent of
adoption and factors affecting the extent of adoption. Purposive selection of the area and random
sampling procedures were employed to select a sample of 196 smallholder dairy farmers. Data was
collected using interview schedule via semi-structured questionnaires. The data was analyzed
using Statistical Package for Social Sciences and STATA. Adopter and non-adopter farmers were
significantly different with respect to education level, off-farm income, membership in dairy
cooperatives, extension contacts, experience with crossbreeds, feeding concentrates to cows, access to
credit, income from milk products sales and distance from AI station. The double-hurdle model was
used for econometric analysis whereby the two stages were run separately as Probit and truncated
regression, respectively. Contacts with extension agents, access to credit, income from milk sales,
feeding concentrate to cows and family size influenced the probability of adoption without
affecting the extent of adoption. While membership in dairy cooperatives and off-farm income
positively affected the probability and extent of AI adoption, distance from AI station and access
to crossbred bull services influenced both variables negatively. A further walking distance of one
hour to the AI station was associated with 27% and 14.4% reduction in the probability and extent
of adoption, respectively. Membership in dairy cooperatives and off-farm income can be
instrumental in AI adoption due to milk market guarantee and the strengthening of financial
capacity from off-farm income. Farmers located at farther distances from AI station and those with
access to crossbred bulls preferred to use bulls than AI. Access to AI should be improved by expanding
AI stations throughout the district along with training more AI technicians. Awareness creation
especially on the difference between using AI and bull service must be done. Deploying adequate
number of extension workers, educating farmers in farmers' training centres and field day visits can be
the way forward. Dairy cooperatives and microfinance institutions must be established and
strengthened. Ways of milk marketing at farm-gate should be designed, infrastructural
development (especially road) should be considered.

vii
TABLE OF CONTENTS
DECLARATION AND APPROVAL .......................................................................................... ii
COPYRIGHT ............................................................................................................................... iii
DEDICATION.............................................................................................................................. iv
ACKNOWLEDGEMENT .............................................................................................................v
ABSTRACT .................................................................................................................................. vi
LIST OF TABLES .........................................................................................................................x
LIST OF FIGURES ..................................................................................................................... xi
LIST OF ABBREVIATIONS AND ACRONYMS .................................................................. xii
CHAPTER ONE ............................................................................................................................1
INTRODUCTION..........................................................................................................................1
1.1 Background of the Study ....................................................................................................... 1
1.2 Statement of the Problem ...................................................................................................... 3
1.3 Objectives of the Study ......................................................................................................... 3
1.4 Hypotheses of the Study ........................................................................................................ 4
1.5 Justification of the Study ....................................................................................................... 4
1.6 Scope of the Study................................................................................................................. 4
1.7 Definition of Terms ............................................................................................................... 5
CHAPTER TWO ...........................................................................................................................6
LITERATURE REVIEW .............................................................................................................6
2.1 Livestock Production and its Importance in Ethiopia ........................................................... 6
2.1.1 Dairy Production in Ethiopia .......................................................................................... 7
2.2 Artificial Insemination .......................................................................................................... 8
2.2.1 Artificial Insemination in Ethiopia ................................................................................. 8
2.3 Adoption of Technology ....................................................................................................... 9
2.3.1 Role of Adoption of AI Technology............................................................................. 10
2.3.2 Factors Affecting Adoption of Technology.................................................................. 10

viii
2.4 Theoretical and Conceptual Framework ............................................................................. 11
2.4.1 Theoretical Framework................................................................................................. 11
2.4.2 Conceptual Framework................................................................................................. 13
CHAPTER THREE .....................................................................................................................15
METHODOLOGY ......................................................................................................................15
3.1 Description of the Study Area ............................................................................................. 15
3.1.1 Description of Lemu-Bilbilo District ........................................................................... 15
3.2 Sample Size Determination ................................................................................................. 17
3.3 Data Sources and Method of Data Collection ..................................................................... 17
3.4 Method of Data Analysis .................................................................................................... 18
3.4.1 Descriptive Statistics .................................................................................................... 19
3.4.2 Empirical Models ......................................................................................................... 19
3.4.3 Data Analysis ................................................................................................................ 21
3.5 Definition of Variables included in Models and their Expected Effects............................. 27
3.6 Preparation of Variables in the Empirical Model ................................................................ 31
3.6.1 Multicollinearity Test ................................................................................................... 31
3.6.2 Heteroscedasticity ......................................................................................................... 33
CHAPTER FOUR ........................................................................................................................34
RESULTS AND DISCUSSION ..................................................................................................34
4.1 Descriptive Results .............................................................................................................. 34
4.1.1 Socio-economic and Institutional Characteristics of Adopters and non-Adopters ....... 34
4.2 Empirical Results ................................................................................................................ 39
4.2.1 Factors Determining the Probability of Adoption of Artificial Insemination .............. 39
4.2.2 Factors Determining the Extent of use of Artificial Insemination ............................... 44

ix
CHAPTER FIVE .........................................................................................................................49
CONCLUSION AND RECOMMENDATION .........................................................................49
5.1 Conclusion ........................................................................................................................... 49
5.2 Recommendation ............................................................................................................ 49
5.3 Further Research ............................................................................................................ 50
REFERENCES .............................................................................................................................51
APPENDICES ..............................................................................................................................60
Appendix I: Conversion Factors used to Estimate Tropical Livestock Units (TLU)................ 60
Appendix II: Extent of Adoption .............................................................................................. 60
Appendix III: Test Statistics of Double-Hurdle model ............................................................. 61
Appendix IV: Questionnaire ..................................................................................................... 62

x
LIST OF TABLES
Table 1: Distribution of sample farm household heads by kebele ................................................ 18
Table 2: Variables and their measurement as used in the Probit model ....................................... 23
Table 3: Variables and their measurement as used in truncated regression model ...................... 26
Table 4: Variance inflation factor of continuous explanatory variables ....................................... 32
Table 5: Contingency coefficients of dummy explanatory variables ........................................... 33
Table 6: Socio-economic and institutional characteristics of AI adopters and non-adopters for
continuous variables ....................................................................................................... 35
Table 7: Socio-economic and institutional characteristics of adopters and non-adopters for dummy
variables .......................................................................................................................... 37
Table 8: Probit model estimates of the determinants of probability of AI adoption .................... 40
Table 9: Truncated regression model estimates of the determinants of extent of AI use ............. 44

xi
LIST OF FIGURES
Figure 1: Conceptual Framework ................................................................................................. 14
Figure 2: Map of Arsi zone, showing Lemu-Bilbilo district ........................................................ 16

xii
LIST OF ABBREVIATIONS AND ACRONYMS
AEASA Agricultural Economics Association of South Africa
AESE Agricultural Economics Society of Ethiopia
AAAE African Association of Agricultural Economists
AI Artificial Insemination
ARDU Arsi Rural Development Unit
AZADD Arsi Zone Agricultural Development Department
CSA Central Statistics Agency
EASE Ethiopian Agricultural Sample Enumeration
ESAP Ethiopian Society of Animal Production
FDRE Federal Democratic Republic of Ethiopia
GDP Gross Domestic Product
GTP Growth and Transformation Plan
ILRI International Livestock Research Institute
IPMS Improving Productivity and Market Success
MoARD Ministry of Agriculture and Rural Development
MoFED Ministry of Finance and Economic Development
NAIC National Artificial Insemination Centre
NBE National Bank of Ethiopia
NGO Non Governmental Organization
OBPED Oromiya Bureau of Planning and Economic Development
VIF Variance Inflation Factor
WRI World Resources Institute

1
CHAPTER ONE
INTRODUCTION
1.1 Background of the Study
Ethiopia is an agrarian economy located in the horn of Africa. Agriculture sector employs
more than 80 percent of the population and contributes about 43 percent to the total GDP and 90
percent to the foreign exchange earnings (MoARD, 2010). With its 49.33 million heads of cattle,
Ethiopia is the leading country in cattle population in Africa and ninth on the world (CSA, 2008).
The contribution of livestock and livestock products to the agricultural GDP of Ethiopia accounts
for 40 percent, excluding the values of draught power, transport and manure. Smallholder farming
is considered one of the most important in the agricultural sector in Ethiopia. It is a source of
income, food security and indicates prestige and social status in the rural community (Kedija et
al., 2008). More than 99 percent of Ethiopia's cattle have been reported to be indigenous breeds
and small Zebu types that are poor in major economically important traits. Crossbreeds and pure
exotic breeds constitute only 0.5 and 0.1 percent of the total cattle population, respectively (EASE,
2003).
In the previous decades, the productivity of livestock sector dominated by traditional
practices failed to satisfy the food security needs of the country’s population at times resulting in
severe food scarcity. The development strategy of the Ethiopian government recognizes the
leading role of agriculture in the economy and stipulates that for the country to register rapid
economic prosperity, it should follow the path of Agricultural Development Led Industrialization
(FDRE, 2002; Abraham, 2009).
The per capita milk consumption of Ethiopia estimated at 19 kg per year; is lower than
African and world per capita averages, which are 27 kg and 100 kg per year, respectively (ESAP,
2004). In Ethiopia, one of the leading causes of infant mortality is malnutrition. Although milk is
considered nature’s perfect food for the growing infant, the ever rising scarcity and high cost of
milk and dairying has made it impossible to meet the demand. Reports also showed that there is
increasing trend in import of milk and dairy products and a considerable amount of foreign
exchange is spent on the import of dairy products (Felleke, 2003). The value of imports of milk

2
products in the first half year increased from 48 billion Birr in 2005 to over 114 billion Birr in
2010. The price of milk in Ethiopia is more than tripled in 10 years. This clearly depicts the
presence of a wide gap between the supply and demand of milk and milk products (Land O’Lakes,
2010; NBE, 2011).
In order to improve the low productivity of the indigenous Zebu cattle, selection of the
most promising breeds and crossbreeding of these indigenous breeds with high producing exotic
cattle has been considered as a practical solution (Mekonnen, T. et al., 2010). Selection and
controlled breeding of superior animals has been found to increase productivity. The development
and use of Artificial Insemination technique has also revolutionized cattle production and genetic
improvement, particularly in the dairy sector in developed countries (Henning et al., 2010).
Artificial insemination is the single most important technique ever devised for genetic
improvement of animals in all aspects including milk and beef production (Kaaya et al., 2005).
While more than 70 percent of animals are bred using AI in the developed world, the
technology is almost practically not available in 25 developing countries 16 of which are found in
Africa (Kaaya et al., 2005). In Ethiopia, AI technology was introduced 5 decades ago through
Chilalo Agricultural Development Unit (CADU) project which was importing semen. But later on,
because of the importance of the technology, National Artificial Insemination Centre (NAIC) was
established in Addis Ababa in the year 1981 (ESAP, 2008; Abraham, 2009). In Arsi zone, where
Lemu-Bilbilo district is located, cattle rearing along with land cultivation is the most common
economic activity as 99.6 percent of the households in the zone own cattle (MoARD, 2007).
Artificial insemination was started in the Lemu-Bilbilo district in 1971 soon as the technology was
introduced in to the country.
Although Ethiopia has the largest livestock population in Africa, productivity and
production have remained low. Unlike other African countries such as the neighbour Kenya, the
large cattle population of Ethiopia has relatively limited numbers of exotic dairy cattle and their
crosses. Less than 1 percent of the dairy cattle population of Ethiopia is exotic or crossbred cows
(EASE, 2003). According to the Tegegne and Hoekstra (2011), Kenya has more than 100 times
crossbred cows than Ethiopia. Consequently, milk productivity in Ethiopia is low. According to
CSA (2008) report, the total annual milk production from about 10 million milking cows in

3
Ethiopia is estimated at about 3.2 billion litres, which is translated into 1.54 litres per cow per day
(Kedija et al., 2008).
1.2 Statement of the Problem
The majority of farmers in Ethiopia who depend on rearing local cattle breeds along with
growing grains, as their main source of food and income are unable to meet their basic household
demands. This is due to the increasing cost of production and price fluctuations of grain crops; and
the minimum amount of milk yield they obtain from the Zebu breeds. To mitigate the increasing
inability of keeping indigenous breeds to support livelihoods of farmers, the Government of
Ethiopia has introduced AI technology as a means to improve the production and productivity of
the domestic cattle breeds by crossing them with exotic ones. However, despite the dominance of
low yielding local breeds and the government’s effort to provide AI at low price; the utilization
rate of AI in the country in general and in Lemu-Bilbilo district in particular is very low. The result
of a study conducted in Fogera district of northern Ethiopia, showed that 90.6 percent of the
farmers use natural mating (Anteneh et al., 2010). The situation in Lemu-Bilbilo is also not
different (Haji, 2003). Hence, there is urgent need to identify the factors responsible for the low
utilization of AI service in Lemu-Bilbilo district.
1.3 Objectives of the Study
General Objective
The general objective of this study was to contribute to the improvement in the livestock
sector which helps to alleviate food insecurity and poverty in Lemu-Bilbilo district of Ethiopia.
Specific Objectives
i. To characterize adopters and non-adopters of Artificial Insemination in Lemu-Bilbilo
district
ii. To determine factors affecting adoption of AI technology by smallholder dairy farmers
iii. To determine the extent of adoption and factors affecting the extent of adoption of AI

4
1.4 Hypotheses of the Study
i. There is no significant difference between the demographic and socio-economic
characteristics of adopters and non-adopters of AI
ii. The socio-economic and institutional factors have no significant effects on adoption of AI
iii. The socio-economic and institutional factors have no significant effects on the extent of AI
utilization
1.5 Justification of the Study
Meeting the demand for dairy products of rapidly growing Ethiopian population especially
of those residing in urban areas with the low producing indigenous cattle has been difficult. Unless
improvements are made; with the current situation in Ethiopia, estimates have shown that in the
year 2020 there will be an increase of 148 percent over current consumption of milk by urban
dwellers (Land O’Lakes, 2010). In response to that, the government of Ethiopia is allocating a lot
of its budget to provide the farmers with many modern agricultural technologies which can
improve production and productivity. One of these is AI technology which is being provided at a
much lower price. However, the response rate by the farmers is not as expected. There has not
been any study undertaken as to why the utilization of AI service by rural farmers of Ethiopia and
Lemu-Bilbilo district is low.
This study, therefore, targeted to identify the factors affecting adoption and the extent of
using AI technology which will help the policy makers and extension staff to address the technical
and economic constraints and enhance production and productivity through active participation of
farmers. This study can contribute to improving the efficiency of agricultural research, technology
transfer, and agricultural policy formulation. In addition, the finding from this study adds to the
body of knowledge regarding the causes of low utilization of AI by farmers in Ethiopia.
1.6 Scope of the Study
This study was limited to assessing factors affecting the adoption and extent of utilization
of AI technology by smallholder dairy farmers. The study was conducted on smallholder dairy
farmers in Lemu-Bilbilo district in Arsi zone of the Oromiya regional state in Ethiopia. The data
was collected for one month in May 2013.

5
1.7 Definition of Terms
Kebele is the smallest administrative unit in Ethiopia
Smallholder dairy farmer is operationally defined as farmer who has been keeping maximum of
ten cows, and whose primary occupation is subsistence agriculture.
Zebu is a word used to represent different local cattle breeds in Ethiopia.
Birr is the currency used in Ethiopia and 1 US dollar equals 18.8 Birr as of August 2013.

6
CHAPTER TWO
LITERATURE REVIEW
2.1 Livestock Production and its Importance in Ethiopia
In the last years, the average growth rate of the agricultural GDP has been about 10 percent
per annum. The Government of Ethiopia has shown a strong interest and commitment in the
support to the agricultural sector, considering it as a key driver of the economic and human
development of the country. The central role held by agriculture is highlighted in the current Five
Year Growth and Transformation Plan (GTP) 2010-2015 and Agricultural Sector Policy and
Investment Framework 2010-2020 (MoARD, 2010; MoFED, 2010; NBE, 2011).
The contribution of livestock and livestock products to the agricultural economy of the
country is significant as its share in total foreign exchange earnings is about 15 percent. Among
the main livestock product exports are hides and skins, live animals and meat (Desta, 2002; NBE,
2011). The contribution of livestock sector can equally well be expressed at household level in the
mixed crop-livestock systems in the highlands of the country. Livestock provide food in the form
of meat and milk, and non-food items such as draft power, manure and transport services, and fuel
for cooking. Livestock are also a source of cash income through sales of the above items, and
animal hides and skins. In addition, they act as a store of wealth and determine social status within
the community (Benin et al., 2003). Livestock also serve as means of saving and capital in rural
areas where banking and insurance services are non-existent (Anteneh et al., 2010).
The livestock sector of Ethiopia has great potential in supporting the country’s effort to
escape from poverty. Though the current contribution of the sector to the national economy is high,
it is not utilized to its full capacity. About 99.5 percent of the cattle population in the country are
indigenous breeds which are poor in major economic traits (EASE, 2003). Improvements in
genetic makeup of the herd could be considered as one of the strategies to increase the overall
production and productivity in the country.

7
2.1.1 Dairy Production in Ethiopia
Dairy production is an important part of the livestock production systems in Ethiopia.
Cattle, camel and goats are the main livestock species that supply milk, with cows contributing
81.2 percent of the total milk output (Felleke, 2003). Ethiopia has a huge potential to be one of the
key countries in dairy production for various reasons. These include a large population of milk
cows in the country estimated at 9.9 million (CSA, 2008), a conducive and relatively disease free
agro-ecology, particularly the mixed crop-livestock systems in the highlands that can support
crossbred and pure dairy breeds of cows, a huge potential for production of high quality feeds
under rain-fed and irrigated conditions, existence of a relatively large human population with a
long tradition of consumption of milk and milk products and hence a potentially large domestic
market, existence of a large and relatively cheap labour force and opportunities for export to
neighbouring countries and beyond (Ahmed et al., 2003; Anteneh et al., 2010).
Different researchers have used different classification to describe the dairy production
system of Ethiopia. However, the mostly identified and used ones are smallholder dairy farming
system in the crop-livestock mixed farming system in the highlands, urban and peri-urban dairy
system found around and inside big cities/towns, pastoral and agro-pastoral system in the lowlands,
and intensive (large-scale commercial) dairy farms (Felleke and Geda , 2001; Kebede, 2004;
Anteneh et al., 2010).
Kebede (2004) concluded that the production of milk in East African countries in general
and in Ethiopia in particular is dominated by smallholder dairy production system. In the highlands
where the subsistence smallholder farmers are predominant, crop and livestock production are an
integral part of their livelihood. As reported by Felleke and Geda (2001), the highland area can be
regarded as a mixed farming system, in which crop and livestock are interdependent. The highland
smallholder milk production using indigenous cattle is the predominant milk production system
with very few cross bred or exotic breed. There is high potential of increasing the cash income a
farmer earns through rearing high yielding cattle breeds via utilization of new technology. The
results of a study by Haji (2003) showed that keeping crossbred dairy cattle assures food security
in a family by increasing the milk yield and raising genetic potential.
8
2.2 Artificial Insemination
Artificial Insemination is a breeding process in which sperm collected from the male are
processed , stored and artificially introduced in to the female (Khanal, 2010). The first scientific
research in AI of domestic animals was performed by L. Spallanzani in 1780. He deposited fresh
dog semen in the uterus of a bitch utilizing a pointed syringe. Sixty- two days later the bitch
whelped, and all three pups resembled the bitch and the sire (Dalton, 1999). However, the
technology was widely introduced in 1940s and gained a rapid initial diffusion. Considering its
positive influence on genetic improvement and profitability, AI is one of the farmer-friendly and
widely adopted breeding technologies (Johnson and Ruttan, 1997).
Studies have shown that AI is without doubt economically advantageous compared to
natural service because the need to keep a bull and the costs associated with it are avoided, it is
cheaper than natural service, increased efficiency of bull usage, it makes it possible for farmers to
have access to high quality germ-plasm and thus make permanent improvement of their stock
faster and more efficiently, and the spread of venereal diseases is easily controlled (Vashist and
Pathania, 2000; Khanal, 2010; Shehu et al., 2010). But AI has also few disadvantages which can
be overcome through proper management. These are: proper implementation requires special skill
and practice, it requires more labour and facilities, preservation and transportation of semen is
difficult under severe climatic conditions (Khanal, 2010; Shehu et al., 2010).
2.2.1 Artificial Insemination in Ethiopia
The history of Artificial Insemination in Ethiopia goes back to the time of Italian invasion
when they introduced the technology to the country through Asmara. But the utilization by farmers
started in 1960s when Chilalo Agricultural Development Unit (CADU) project provided the
service by importing semen and liquid nitrogen. In 1973 the project established liquid nitrogen
production laboratory in Arsi zone, Asella town. However, because of the high importance of the
technology to the farmers and the economy; the government established National Artificial
Insemination Centre (NAIC) in Kaliti Addis Ababa in 1981(ESAP, 2008; Abraham, 2009).
NAIC is responsible for the production and distribution of semen to all regions in the
country. According to a report in 2010; the centre produces 170, 000 units of bull semen per year
9
with a goal of doubling this amount within five years. In addition to producing bull semen, NAIC
serves as a training centre for AI technicians and provider of liquid nitrogen for freezing bull
semen. There are 10 liquid nitrogen centres throughout Ethiopia; these centres also serve as the
distribution point of bull semen (Abraham, 2009; Land O’Lakes, 2010). The government AI
system is heavily subsidized; with the AI service and semen costing 6 Ethiopian Birr (ETB). The
actual cost of the service and semen is 22 ETB. Private sector involvement in providing the service
is quite recent and is limited to the intensive dairy farms in and around Addis Ababa (Land
O’Lakes, 2010).
2.3 Adoption of Technology
Adoption process is the change that takes place within individual with regard to an
innovation from the moment that they first become aware of the innovation to the final decision to
use it or not (Ray, 2001). Adoption is a mental process through which an individual passes from
first knowledge of an innovation to the decision to adopt or reject. According to Feder et al. (1985),
adoption refers to the decision to use a new technology, method and practice by a farmer or
consumer. Adoption of technology involves a process in which awareness created, attitudes are
changed and favourable conditions for adoption are provided (Ghosh et al., 2008). The last two
decades have seen user adoption models being proposed, tested, refined, extended and unified.
These models have contributed to our understanding the factors of user technology adoption and
their relationships. Many studies have been conducted on the issue of technology adoption based
on these models (Mwangi et al., 2004; Kaaya et al., 2005; Rezaei and Bagheri, 2011; Howley et
al., 2012).
In this study, for a farmer to be considered as adopter; he/she has to witness owning at least
one calf which was born using AI technology. The extent of adoption is described as the level or
intensity of use of a given technology. The number of hectares planted with improved seed, the
amount of input applied per hectare and the proportion of animals born using a breeding technique
are referred to as the intensity of adoption of the respective technologies (Nkonya et al., 1997).
10
2.3.1 Role of Adoption of AI Technology
New technology is always a critical factor in changing the structure of the industry. Johnson
and Ruttan (1997) found breeding technologies as the most significant factor contributing to farm
productivity in the livestock sector since 1940s. According to Rees et al. (2010), the use of
breeding technologies like AI can increase the production efficiency of the herd and enhance the
genetic characteristics of the herd, while the study by Gillespie et al. (2004) states that the usage
of breeding technologies allow for the timely production of greater number of quality animals with
a given set of resources. The development and use of AI techniques have revolutionized cattle
production and genetic improvement, especially in the dairy sector, in developed countries
(Henning et al., 2010).
A study in Himachal Pradash state of India indicated that with the increase in AI facilities
and AI centres there was an increase in the number of crossbred cattle population and a decline in
the indigenous cattle population. The percentage of crossbred cattle increased due to the positive
impact of cross-breeding with AI program in the state. The share of milk from the crossbred cows
to the total milk registered an increase from 11 to 17 percent, indicating the beneficial effects of
cross-breeding program (Vashist and Pathania, 2000).
A paper in Kenya showed the major role AI plays in elevating poor peasant livestock
keepers to commercial small scale dairy farmers' level. Most of the zebu cattle owners are poorer
members of the farming community who cannot afford to purchase grade or pure dairy cattle
breeds in order to begin commercial dairy enterprises in the high agricultural potential areas. The
adoption of AI technology, especially through the upgrading, has enabled about 80 percent of
current suppliers of milk in Kenya to enter into commercial dairying within reasonably short period
than would have been if direct importation of dairy cows had been adopted (Oluoch et al., 1999).
2.3.2 Factors Affecting Adoption of Technology
In many areas of African countries, technologies are becoming available, but adoption has
been slow or has not been sustained. According to Feder et al. (1985), immediate and uniform
adoption of innovations in agriculture is quite rare as adoption behaviour differs across socio-
economic groups, overtime and geographical location. Some technologies have been well adopted,

11
while others have been adopted by only very small groups of farmers. Studies have found that
farmers' technology adoption decisions are generally affected by a number of demographic, socio-
economic and institutional factors. In an economic sense, farmers adopt technology if the utility
associated with adopting it is greater than the utility associated with not adopting (Beshir et al.,
2012; Asfaw et al., 2011; Kassie et al., 2012).
According to Feder et al. (1985), the different factors that influence technology adoption
in developing countries can be grouped in to three main categories. Firstly, factors related to the
characteristics of farmers which include age, gender, education level, experience in the activity,
farm size, labour availability, level of wealth, and risk-aversion behaviour influence technology
adoption. Second group of factors are those related to the characteristics and relative performance
of the technology. These include food and economic functions of the product, the perception by
individuals about the characteristics, complexity and performance of the innovation, its availability
and that of complementary inputs, the relative profitability of its adoption compared to substitute
technologies, the period of recovery of investment and the susceptibility of the technology to
environmental hazards. Third group of factors consist of institutional factors; which include
availability and quality of information on the technologies, availability of credit, the land tenure
system, accessibility of markets for products and input factors and the availability of adequate
infrastructure (Dandedjrohoun et al., 2012).
The findings of research paper by Rees et al. (2010), indicated that the adoption of artificial
insemination technology is influenced by human capital, measured by age and information usage,
as well as natural capital. The present study differs from previous studies in that: First, this study
addresses the adoption of AI technology, which is an important factor in influencing dairy
productivity and, ultimately industry structural change. Second, the adoption decisions are
modelled using double hurdle model that allows for estimation of the extent of the technology
adoption.
2.4 Theoretical and Conceptual Framework
2.4.1 Theoretical Framework
From a theoretical perspective, the decision to adopt a technology can be viewed as being
driven by how much utility a household gains from its choice. Utility is viewed as an observable

12
index determined by a set of explanatory variables that an individual uses to rank a set of decision
alternatives. Because it is unobserved, utility can be treated as a random variable (Ngugi et al.,
2003).
The theory of utility maximization is generally used to explain the response of the farmer
to a new technique, in this case AI technology. According to utility theory, the farmer will adopt
a new technique if the utility obtained from it exceeds that of the old one. The individual effort is
an endogenous process that involves comparing the costs and benefits of adopting a technology. It
is reasonable to expect that when an individual considers investigating a technology, he will take
into account the current expenditure in terms of time and other goods as evaluated against
immediate and future returns. Whether or not a household adopts a technology depends on the
costs and benefits of the technology (Shiferaw and Holden, 2001).
The assumption made in this study is that a household maximizes utility when choosing AI
technology. However, we do not observe its utility, but only its choice of technology. The utility
of each alternative is in turn determined by a set of exogenous variables, Zi and an error term. The
exogenous variables are household characteristics and institutional factors. Adoption is assumed
to occur if the utility of using AI is higher than the utility of other alternatives.
Let Uij be the utility the farmer obtains from using AI technology with j = {0,1} indicating
the adoption or non-adoption of AI technology and i = {1,2,…,n}indicating the farmers
characteristics. These characteristics are not all observed, but a linear relationship is postulated for
the ith farmer between the utility derived from the jth technology and a vector of observed farmer’s
characteristics Zi.
𝑈𝑖𝑗 = 𝑍𝑖𝛽𝑗 + ɛ𝑗 ; 𝑗 = 0,1 𝑎𝑛𝑑 𝑖 = {1,2, … , 𝑛} … … … … … … … … … … … … … … … … … … . (1)
The decision of the farmer is a process of two mutually exclusive alternatives: either he adopts
𝑗 = 1 or does not 𝑗 = 0. The assumption is that a farmer chooses the option that gives him the
largest utility. The ith farmer will adopt the technique j if Ui1>Ui0 and the qualitative variable Di
indexes the adoption decision:
If 𝑈𝑖1 > 𝑈𝑖0 , then 𝐷𝑖∗ = 1 𝑎𝑛𝑑 0 𝑜𝑡ℎ𝑒𝑟𝑤𝑖𝑠𝑒
𝑃𝑖 = 𝑃𝑟(𝐷𝑖∗ = 1) = 𝑃𝑟(𝑈𝑖1 > 𝑈𝑖0) … … … … … … … … … … … … … … … … … … … … … … … (2)

13
Where, 𝑃𝑖 is the probability of ith household adopting AI.
This can be further expressed as a function of independent variables, that is,
𝑃𝑖 = 𝑃𝑟(𝑍𝑖𝛽1 + ɛ1 > 𝑍𝑖𝛽0 + ɛ0) … … … … … … … … … … … … … … … … … … … … … … . … . (3)
= 𝑃𝑟(𝑍𝑖𝛽1 − 𝑍𝑖𝛽0 > ɛ0 − ɛ1)
= 𝑃𝑟(𝛽1 − 𝛽0)𝑍𝑖 > 𝑢𝑖)
= 𝑃𝑟(𝛼𝑍𝑖 > 𝑢𝑖)
𝑃𝑖 = 𝐹(𝛼𝑍𝑖′) … … … … … … … … … … … … … … … … … … … … … … … … … … … … … … … … … (4)
Where,
𝑢𝑖 = ɛ0 − ɛ1 is the random error term
𝛼 = 𝛽1 − 𝛽0 is vector of parameters to be estimated
𝐹(𝛼𝑍𝑖′) is the cumulative distribution function (cdf) of the error term 𝑢𝑖
Thus, the probability of the ith farmer to adopt the new technology is the probability that the utility
of the new technology is larger than the utility of the old one or the cumulative distribution F
evaluated at 𝛼𝑍𝑖′ (Ngugi et al., 2003).
2.4.2 Conceptual Framework
If farmers are consumers of agricultural technology, then according to random utility
theory, they will choose to adopt the alternative technology package that gives them highest utility.
Farmers are faced with a variety of factors which influence their decision making in view of
maximizing utility. Adoption is conceptualized as a function of farmers’ characteristics,
technology attributes, institutional factors and resource factors. Further, the decision to adopt a
technology is a behavioural response arising from a set of alternatives and constraints facing the
decision maker (Wanjiku et al., 2003).
Smallholder farmers have different personal characteristics which affect their decision
making. Socio-economic and institutional factors play great role in affecting the probability of
adoption and extent of technology utilization. Based on hypothesized factors which influence AI
use in the study area, the conceptual framework for this study is given as follows.
Institutional Attributes:
Credit access, Extension, Feeds
(concentrates), Membership in
Cooperatives, Distance from AI
station, Access to exotic or
crossbred bull service
Household Attributes:
Age, Gender, Education level,
Family size, Herd size, Land size,
Experience in keeping crossbreeds,
Milk sales, Off-farm income, Years
of using AI
Technology Attributes:
Effectiveness of AI service
(Efficiency of Inseminators,
Quality of semen used)

14
Figure 1: Conceptual Framework
Source: Adopted from Kibet et al. (2011)

15
CHAPTER THREE
METHODOLOGY
3.1 Description of the Study Area
Arsi zone is one of the 17 zones of the Oromiya Regional State, which lies between 6° 45'-
8° 58'N latitude and 38° 32'- 40° 50'E longitude. Arsi zone shares boundaries with East Shewa,
West Hararghe, Bale zones and the Regional State of Nations, Nationalities and People of Southern
Ethiopia. The zone has an average altitude of 1500 to more than 4000 meters above sea level
(OBPED, 2011). Based on 2007 national census, the total population of Arsi zone was 2, 635,515.
The zone has 26 districts with a total land area of 23,881km2 (CSA, 2008; OBPED, 2011). Crop
production is carried out mainly during the long rainy season. The zone is also known for its
livestock production. According to OBPED (2011), there were about 2.74 million cattle, 1.33
million sheep and goats, 476,721 equines, 1.3 million poultry, and 112,557 beehives in this zone.
3.1.1 Description of Lemu-Bilbilo District
This study was conducted in Lemu-Bilbilo district, which is located between 7°10'14''-
7°40'20''N latitudes and 39°4'59''- 39°38'56''E longitudes. Lemu-Bilbilo district with its capital at
Bekoji town is situated 235km southeast of the capital Addis Ababa. The district has a total area
of 1212.5km2 and is divided in to 25 kebeles. The altitude of the district ranges from 1500 meters
above sea level around Wabe-Shebelle River to 4195 meters above sea level at mount Kaka. The
area receives an average annual rainfall of around 1100mm and has an average annual temperature
ranging from 6 to 26°C (AZADD, 2000).
According to CSA (2008), the district has a total population of 180,695 out of which 12.92
percent were urban dwellers. Mixed farming system is the main economic activity practiced in
Lemu-Bilbilo district. The most important crops grown are barley, wheat, linseed, field-pea, faba-
bean and lentil. This district is rich in livestock resources possessing 309,383 cattle, 64,347goats,
301, 917 sheep, 66,373 horses, 52,743 donkeys, 4232 mules, 70,744 poultry and 16, 991 bee
colonies (OBPED, 2011). AZADD (2000) indicated that the average livestock holding per
household in Lemu-Bilbilo district was 10 cattle, 10 sheep and 3 equines.

16
Figure 2: Map of Arsi zone, showing Lemu-Bilbilo district
Source: Central Statistics Agency of Ethiopia (2004)

17
3.2 Sample Size Determination
The sample size was estimated using Cochran (1963) formula.
𝑛 =(𝑝)(𝑞)𝑍2
(𝑒)2… … … … … … … … … … … … … … … … … … … … … … … … … … … … … … … … . … … (5)
Where, n = sample size
p = proportion of the population containing the major interest
q=1-p
e = acceptable/allowable error = 0.07
p=0.5 and q=1-p = 1-0.5= 0.5,
Z = 1.96
𝑛 =0.5 × 0.5 × (1.96)2
(0.07)2
n=196
The study used 95 percent of confidence level (Z=1.96). Since the variability between the two
groups of farmers is not known, the maximum variability principle suggested by Cochran (1963)
was used. Therefore, p = 0.5, and q = 0.5. Using an allowable error of 7 percent, the total sample
size was 196.
3.3 Data Sources and Method of Data Collection
Primary and secondary data were collected for the study. The sources of primary data were
the smallholder dairy farmers residing in Lemu-Bilbilo district. The primary data from the selected
farmers was collected through interviews using semi-structured questionnaire. Data on
respondents’ demographic, social, institutional and economic variables that are useful for this
study were collected. In addition to administering the semi-structured questionnaires, secondary
data on the history of AI in Lemu-Bilbilo district was obtained from the district agricultural offices
to supplement the primary data. Eight trained enumerators were involved in the data collection.

18
Multistage sampling design was employed to select the sample. First, Arsi zone was
selected purposively because it is among the richest zones in cattle population in the country and
AI was initially introduced in Ethiopia to this zone. Second, Lemu-Bilbilo district was selected
purposively because 96.7 percent of the people in this district keep cattle as part of the mixed
farming system (Haji, 2003). This district was also selected because of its cattle population and
livestock extension activities that have been carried out since the advent of Chilalo Agricultural
Development Unit (CADU) and Arsi Rural Development Unit (ARDU) projects and it is among
the districts where AI practices were undertaken initially by these projects. Then, out of the 25
kebeles in the district, 4 kebeles (Bekoji-Negesso, Chiba-Mikael, Dawa-Bursa and Tamegn-
Aware) were selected purposively based on the availability and access of the AI technology.
Farmers in each kebele were stratified in to two groups: those who adopted AI and not adopted.
The list of adopters of AI was obtained from the records at the district animal health and artificial
insemination office; whereas the list of non-adopters was obtained from the list at kebele
administration office. From the two groups (adopters and non-adopters), simple random sampling
was applied to select 98 adopters and 98 non-adopters as indicated in Table 1.
Table 1: Distribution of sample farm household heads by kebele
Name of Kebele Total household
head*
Sample Farm household heads
Male Female Adopter Non-adopter Total
Male Female Male Female
Number Number Number Number Number
Bekoji-Negesso 702 101 22 3 22 2 49
Chiba-Mikael 500 60 24 0 21 4 49
Dawa-Bursa 692 112 23 1 24 1 49
Tamegn-Aware 550 26 24 1 24 0 49
Total 2444 299 93 5 91 7 196
Source: *Kebele Administration Office
3.4 Method of Data Analysis
The study utilized both descriptive statistics and econometric models to analyze the collected data.

19
3.4.1 Descriptive Statistics
Descriptive statistics was used to explain the different socio-economic and institutional
characteristics of sampled households. These include mean, standard deviation and percentages
for the adopter and non-adopter farmers in AI technology. The statistical significance of the
variables was tested for both dummy and continuous variables using chi-square and t-tests.
3.4.2 Empirical Models
The variable representing adoption of AI technology is a dummy variable that takes a value
of 1 for adopter or 0 for non-adopter depending on whether or not a sample farmer has cattle bred
with AI. This binary variable is related to several sets of factors (either continuous or dummies)
that were believed to influence adoption decision of the technology.
Limited dependent variables models are often used to evaluate farmers’ decision-making
process concerning adoption of agricultural technologies (Olwande et al., 2009). Those models
assume that farmers are faced with two alternatives (adoption or no adoption) and the choice
depends upon identifiable characteristics (Pindyck and Rubinfeld, 1997). In adopting new
agricultural technologies, the farmer is also assumed to maximize expected utility from using a
new technology subject to some constraints (Feder et al., 1985). In several studies (Mignouna et
al., 2011; Rezaei and Bagheri, 2011; Howley et al., 2012), a Probit or Logit model is specified to
explain whether or not farmers adopt a given technology without considering the intensity of use
of the technology. The Probit or Logit models cannot handle the case of adoption choices that have
a continuous value range (Kaliba et al., 2000).
Tobit model has been used to identify factors influencing adoption and the extent/intensity
of technology adoption. This model as employed by different researchers (Kaaya et al., 2005; Foti
et al., 2008; Fikru, 2009) has advantage over Logit and Probit in that it reveals both the probability
of adoption and extent of technology adoption. Tobit, also called a censored regression, is used
when a dependent variable has a zero value for a significant fraction of the observations. Since
there are non-adopters in a technology application, the value given for these is zero and using
standard OLS results provide biased and inconsistent parameter estimates (Greene, 2007).

20
The Tobit model of Tobin (1958) has been used to analyze data under the assumption that
the two decisions (adoption and extent of adoption) are affected by the same set of factors (Greene,
2007; Fikru 2009). However, in principle, the decisions on whether to adopt and how much to
adopt can be made jointly or separately. When the decisions are made jointly, the Tobit model is
appropriate for analyzing the factors affecting the joint decision (Greene, 2007; Teklewold et al.,
2006). This assumption has been the norm in previous research into the determinants of the
intensity of technology adoption (Pender and Kerr, 1998; Kaaya et al., 2005). However, adoption
and intensity of use decisions are not necessarily made jointly. The decision to adopt may precede
the decision on the intensity of use, and the factors affecting each decision may be different
(Gebremedhin and Swinton, 2003), as assumed in this research. In this case, it is more suitable to
apply a ‘double-hurdle’ model in which a Probit regression on adoption (using all observations) is
followed by a truncated regression on the non-zero observations (Cragg, 1971). The other problem
with Tobit model is that it attributes the censoring to a standard corner solution thereby imposing
the assumption that non-adoption is attributable to economic factors alone (Cragg, 1971).
The double-hurdle model can overcome these shortfalls of Tobit. The double-hurdle model
is a parametric generalization of the Tobit model, in which two separate stochastic processes
determine the decision to adopt and the level of adoption of the technology (Greene, 2007;
Gebremedhin and Swinton, 2003). The double-hurdle model is applied in such a way that, both
hurdles (the decision for adoption and extent of adoption) have equations associated with them,
incorporating the effects of farmer's characteristics and circumstances. Such explanatory variables
may appear in both equations or in either of the two. Most importantly, a variable appearing in
both equations may have opposite effects in the two equations (Moffat, 2005). The double-hurdle
model allows for the possibility that the two decisions are affected by a different set of variables.
Whether a Tobit or a Double-Hurdle model is more appropriate, can be determined by
separately running the Tobit and the Double-Hurdle models and then conducting a likelihood ratio
test that compares the Tobit with the sum of the log likelihood functions of the Probit and truncated
regression models (Greene, 2007). This test has been done by several researchers (Gebremedhin
and Swinton, 2003; Moffat, 2005; Espineira, 2006; Teklewold et al., 2006), and the test results
revealed the superiority of the Double-hurdle model over the Tobit. Similarly in this study, the
likelihood ratio test favoured the double-hurdle model over Tobit (Appendix III). Hence, double-

21
hurdle model was used to estimate the decision of farmers to adopt AI technology and the extent
of adoption.
The double-hurdle, originally by Cragg (1971), assumes that households make two
sequential decisions with regard to adopting and extent of use of a technology. Each hurdle is
conditioned by the household’s socio-economic characteristics. In the double-hurdle model, a
different latent variable is used to model each decision process (Olwande et al., 2009).
3.4.3 Data Analysis
Objective 1
This objective was analyzed using descriptive statistics. This involved the use of
percentages, means and standard deviations. Standard t-test and chi-square test were used to
compare differences in characteristics between adopters and non-adopters.
Objective 2
The first hurdle is an adoption equation estimated with a Probit model. The Probit model
represents the probability of a limit observation, which is given by the following equation
(Olwande et al., 2009).
𝐷𝑖 = 1 𝑖𝑓 𝐷𝑖∗ > 0,
𝐷𝑖 = 0 𝑖𝑓 𝐷𝑖∗ ≤ 0
} … … … … … … … … … … … … … … … … … … … … … … … … … … … … … … … … … … (𝟔)
𝐷𝑖∗ = 𝛼′𝑍𝑖 + 𝑢𝑖
Where,
𝐷𝑖∗ = The latent variable that takes the value of 1 if the farmer adopts AI technology and 0 otherwise
𝑍𝑖= Vector of household characteristics that affect the adoption of AI technology
𝛼 = Vector of parameters
𝑢𝑖 = The standard error term i= 1, 2…n. (n is the number of observation)
The dependent variable of the econometric model for this objective was farmers’ decision to adopt
AI technology. Its value is either 0 or 1; that is those farmers who used the technology were given
value of 1, and 0 otherwise. Based on literature reviews and the discussions held with stakeholders,
the explanatory variables selected for this study were broadly categorized under demographic,

22
socio-economic and institutional factors. A brief description of the explanatory variables selected
for this study and their likely influence on adoption of AI are presented in Table 2.

23
Table 2: Variables and their measurement as used in the Probit model
Variables Type of
variable
Measurement of the Variables Expected
Sign
Dependent Variable
Decision to Adopt AI or not (ADAI) Dummy 1 for those who have used AI 0 otherwise
Independent Variables
Distance from AI station (DISTAS) Continuous Walking hours from home -
Access to credit (ACRDT) Dummy 1 for those who have access 0 otherwise +
Extension visits (EXTN) Continuous Number of extension visits per year +
Age of the household head (AGHHH) Continuous Number of years +/-
Education level of household head (EDUC) Continuous Number of years spent in school +
Gender of household head (GEND) Dummy 1 for male and 0 otherwise +/-
Family size (FMSZ) Continuous Number of family members living together +
Experience with exotic/cross breeds (EXPCRS) Continuous Number of years +
Livestock owned (TLU) Continuous Tropical livestock units +
Land size (LNDS) Continuous Land owned in hectares +
Feeding concentrate-feeds to cattle (CONCFD) Dummy 1 for those who feed concentrates 0 otherwise +
Income from milk and its product sales (INCMLK) Continuous Monthly income from milk product sales in Birr +
Off-farm income (OFRM) Dummy 1 for those with additional income 0 otherwise +
Access to exotic/crossbred bull (ACBUL) Dummy 1 for those with access 0 otherwise -
Membership in Dairy Cooperatives (MDCOP) Dummy 1 for members 0 otherwise +

24
Objective 3
The second hurdle of double-hurdle model involves an outcome equation, which uses a
truncated model to determine the extent of adoption of the technology in question (Olwande et al.,
2009). This second hurdle uses observations only from those respondents who indicated a positive
value of use of AI. The truncated model, which closely resembles the Tobit model, is expressed
as:
𝑌𝑖 = 𝑌𝑖∗ 𝑖𝑓 𝑌𝑖
∗ > 0 𝑎𝑛𝑑 𝐷𝑖∗ > 0
𝑌𝑖 = 0 𝑜𝑡ℎ𝑒𝑟𝑤𝑖𝑠𝑒
𝑌𝑖∗ = 𝛽′𝑋𝑖 + 𝑣𝑖
} … … … … … … … … … … … … … … … … … … … … … … … … … (7)
Where,
𝑌𝑖 = the observed response on the proportion of calves born using AI technology
𝑋𝑖= is vector of explanatory variables hypothesized to influence the extent of AI use
β is a vector of parameter and
𝑣𝑖 is the standard error term
The error terms, are distributed as follows:
{𝑢𝑖 ∽ 𝑁(0,1)
𝜈𝑖 ∽ 𝑁(0, 𝜎2)} … … … … … … … … … … … … … … … … … … … … … … … … … … … … … … … … … (8)
The error terms 𝑢𝑖 and 𝜈𝑖 are usually assumed to be independently and normally distributed. It is
assumed that for each respondent the decision whether to adopt the technology and the decision
about the adoption level are made independently.
And, finally, the observed variable in a double-hurdle model is:
𝑌𝑖 = 𝐷𝑖𝑌𝑖∗ … … … … … … … … … … … … … … … … … … … … … … … … … … … … … . . … … … … … …(9)
The Log likelihood function for the Double-Hurdle model is given by:
𝐿𝑜𝑔 𝐿 = ∑ 𝑙𝑛 [1 − Φ𝛼Zi (𝛽𝑋𝑖
′
𝜎)]
0
+ ∑ 𝑙𝑛 [Φ𝛼𝑍𝑖
1
𝜎𝜙 (
𝑌𝑖 − 𝛽𝑋𝑖′
𝜎)]
+
… … … … … … … … … . (10)
Where 𝚽 denotes the standard normal CDF (Univariate or Multivariate) and ϕ is the univariate
standard normal PDF. 𝑍𝑖, 𝑋𝑖, β, α, σ as defined earlier (Moffat, 2005).
25
The dependent variable of the econometric model for this objective was the extent of use of
AI technology; which was measured as the proportion of calves born using AI out of the total
calves born within the past two years. The explanatory variables selected for this objective were
broadly categorized under demographic, socio-economic and institutional factors. A brief
description of the explanatory variables selected for this study and their likely influence on the
extent of adoption of AI are presented in Table 3.
26
Table 3: Variables and their measurement as used in truncated regression model
Variables Type of
variable
Measurement of the Variables Expected
Sign
Dependent Variable
Proportion of cattle bred with AI (PCAI) Continuous Number of calves born using AI out of total calves
Independent Variables
Distance from AI station (DISTAS) Continuous Walking hours from home -
Access to credit (ACRDT) Dummy 1 for those who have access 0 otherwise +
Extension visits (EXTN) Continuous Number of extension visits per year +
Age of household head (AGHHH) Continuous Number of years +/-
Education level of household head (EDUC) Continuous Number of years spent in school +
Gender of household head (GEND) Dummy 1 for male and 0 otherwise +/-
Family size (FMSZ) Continuous Number of family members living together +
Experience with exotic/cross breeds (EXPCRS) Continuous Number of years +
Livestock owned (TLU) Continuous Tropical livestock units +/-
Land size (LNDS) Continuous Land owned in hectares +
Feeding concentrate-feeds to cattle (CONCFD) Dummy 1 for those who feed concentrates 0 otherwise +
Income from milk and its product sales (INCMLK) Continuous Monthly income from milk product sales Birr +
Off-farm income (OFRM) Dummy 1 for those with additional income 0 otherwise +/-
Access to exotic/crossbred bull (ACBUL) Dummy 1 for those with access -
Membership in Dairy Cooperatives (MDCOP) Dummy 1 for members 0 otherwise +
Effectiveness of the AI service (AIQLTY) Dummy 1 if effective 0 otherwise +
Years of using AI (YRADPT) Dummy Number of years since the farmer adopted AI +
27
3.5 Definition of Variables included in Models and their Expected Effects
Based on the literature review and the discussions held with stakeholders, the explanatory
variables selected for this study and their hypothesized influence on probability and extent of
adoption of Artificial Insemination technology are presented as follows.
Age of the household head (AGHHH): This is a continuous variable measured in years.
It was expected to affect the probability and extent of AI adoption either positively or negatively.
Through time, household heads acquire experience in farming and/or technology use. Moreover,
older farmers may accumulate more wealth than younger ones and therefore, influence the
dependent variables positively. In contrast, older farmers are more risk averse and less likely to be
flexible than younger farmers and thus have a lesser likelihood of adopting new technologies.
Hence, farmer's age may negatively influence both the decision to adopt and extent of adoption.
Therefore, the effect of age of household head on adoption and extent of adoption of AI may be
indeterminate a priori.
Total family size (FMSZ): This is a continuous variable measured by the number of
family members and was expected to affect the decision to adopt and extent of adoption of AI
technology positively. Total household size is the source of labour in the rural households; more
family member means that proportionally, the number of active working group in that household
is expected to be high and therefore, there is a possibility of having more alternative sources of
income to use the technology in question.
Education level (EDUC): This is a continuous variable measured by the number of years
the household head has spent in formal schooling at the time the survey was completed. Education
augments one's ability to receive, decode, and understand information relevant to making
innovative decisions (Wozniak, 1984). Therefore, education level of a household head was
expected to influence adoption and use of AI positively.
Gender of the household head (GEND): This is a dummy variable in the model, which
takes a value of 1 if the household head is male and 0, if the household head is female. Gender
differentials can be related to access and utilization of a technology and indeed, one may expect
that female-headed households are less experienced and hence will not use AI technology

28
intensively because they know little about the consequences of this technology. The opposite
expectation may be that, female-headed households tend to be more concerned for the family than
male-headed ones. This may arise from the fact that females are more responsible for child care
and home management, and are more concerned about the possible desirable consequences arising
from using technology. Therefore, it was expected that the gender of the household head would
have either a positive or a negative impact on the adoption and intensity of adoption of AI
technology.
Total landholdings (LNDS): It is a continuous variable expressed in terms of hectares of
total land owned including both cultivated and grassland. Land ownership is an indicator of wealth
and social status within a community. It was expected to have a positive effect on farmers’ decision
to use AI and extent of utilization. As the size of the land owned increases, the likelihood of the
household to produce more and get high income would increase and this in turn enhances the
chances of adopting new technology. Possession of large land size helps the farmers to allocate
some part the land for growing different grasses for their livestock. In addition, farmers with large
land size are likely to cultivate more and collect more crop residues which can be used as feed for
their livestock.
Livestock ownership (TLU): This refers to the total number of livestock measured in
Tropical Livestock Unit. Based on Makeham and Malcolm (1986) standard conversion factors, the
livestock population number was converted into Tropical Livestock Unit (see appendix I). The
livestock owned by farm household is considered as a proxy indicator of wealth. Households that
own larger number of livestock are relatively rich as compared to those who own less number of
livestock. Farmers with larger herd size are assumed to have more cash and thus the variable was
expected to positively influence adoption and extent of adoption of AI technology.
Off-farm income (OFRM): Additional income earned from outside agricultural activities
increases the farmers’ financial capacity and expected to increase the probability of investing on
new technologies. The variable is a dummy variable taking the value of 1 if the farmer has income
source outside of agricultural activities, 0 otherwise. Hence, this variable was hypothesized to
affect adoption and intensity of use AI positively.

29
Experience in keeping crossbred/exotic cattle (EXPCRS): This is the number of years
a household has been keeping crossbred/exotic cattle. Farmers, who have more experience in
keeping crossbred cattle, develop a skill on how to manage these cattle and have seen the
advantages of keeping these over local breeds compared to less experienced or inexperienced ones.
Therefore, experience in keeping crossbred cattle was expected to have positive relation with
decision to adopt AI technology and extent of adoption.
Contact with development agents (EXTN): This is a continuous variable measured by
the number of days per year an extension agent had visited the farmer during the past one year.
The higher the linkage between farmers and development agents, the more the information flow
and the technological (knowledge) transfer from the latter to the former. Here, the frequency of
contact between the extension agent and the farmers was hypothesised to be the potential force
which accelerates the effective dissemination of adequate agricultural information to the farmers,
thereby enhancing farmers' decision to adopt new technologies. Thus, those farmers who had
frequent contacts with development agents were expected to use AI technology, as opposed to
those who had no or few contacts.
Distance from AI station (DISTAS): This is measured in terms of the walking hours
required to travel from the respondent's residence to the nearest AI station. Farmers residing near
the AI station have a location advantage and can take their cows to get the service more easily and
frequently than those who live in more distant locations. Therefore, location advantage was
expected to increase the adoption and extent of adoption of AI.
Income from milk sales (INCMLK): This refers to monthly income in Birr obtained from
sales of milk and milk products. Since farmers are rational producers, the income they earn from
previous milk sale initiates them to produce more milk by adopting the suitable technology and
hence earn more. Moreover, the amount of income left from consumption could be used to utilize
the available technology. Therefore, a household with better income from milk sales was expected
to have higher chances of adopting AI technology.
Feeding concentrates to cattle (CONCFD): This is a dummy variable which takes a value
of 1 if a farmer uses concentrate feeds for cattle or 0, otherwise. In order to make use of
technologies, farmers should be able to get what the output of the technology requires. That is,
30
since crossbred animals need more feeds to provide high yield, farmers who feed their cows with
concentrate feeds are more likely to adopt AI technology than those without. Thus, this variable
was hypothesized to affect adoption and intensity of adoption of AI positively.
Access to credit (ACRDT): This is a dummy variable, which indicates whether the farmer
has access to credit or not. Adoption and utilization of AI technology requires certain amount of
capital as the crossbred cattle born with this technology need more feeds and management. The
availability of farm credit especially from formal sources becomes a vital component of the
modernization of agriculture and to improve the wealth status of farmers. Hence, credit was
hypothesized to influence adoption of AI technology positively.
Membership in dairy cooperatives (MDCOP): Belonging to an association or
cooperative as member can influence farmer’s decision to adopt an improved technology. In most
farming communities farmers form or join associations or cooperatives of various kinds for all
sorts of reasons. Service cooperatives are more likely to be aware of new practices as they are
easily exposed to information. Moreover, farmers may use the membership opportunity to sell
their milk and milk products, and this causes them to adopt the AI technology which helps them
produce more milk. This is a dummy variable which takes a value of 1 if the farmer is member in
a dairy cooperative or 0, otherwise.
Access to crossbred/exotic Bull (ACBUL): Bull service is one way of getting crossbred
cattle in rural areas especially where access to AI service is limited either because of distance or
because of absence of infrastructures. Farmers who have access to both AI and crossbred bull
services have two alternatives and hence, can choose between the two as compared to those who
have only one choice. Therefore, the availability of crossbred/exotic bull service was hypothesized
to negatively affect the use and intensity of use of AI technology. The variable takes the value of
1 if farmers have access to crossbred/exotic bull, 0 otherwise.
Years of using AI (YRADPT): This variable only considers those farmers who have
already adopted AI and hence affects only the extent of adoption. It is a continuous variable
measured by the number of years since the farmer has started using AI technology. Farmers who
have more experience of using AI service are more likely to use it intensively as compared to those

31
with less experience of using it. Therefore, the variable was hypothesized to affect extent of
adoption positively.
Effectiveness of the AI service (AIQLTY): This measures the quality of the AI
technology when compared to the bull services. This variable is included only on the second
dependent variable as it considers farmers who have already used the technology. It is a dummy
variable which takes the value of 1 if the technology is considered as effective, and 0 otherwise.
In this study AI technology is considered as effective if the cows served with AI in the past two
years conceived in one or two services. And it is considered as ineffective if the cows served with
AI conceived in more than two services or failed to conceive. This variable indirectly takes in to
account the efficiency of the AI inseminators and the quality of the semen used for insemination;
although the heat detection ability and timing of the farmer also affects the quality of the service.
Therefore, the relationship between effectiveness of AI and the extent of AI adoption was
hypothesized to be positive.
3.6 Preparation of Variables in the Empirical Model
3.6.1 Multicollinearity Test
Before running the econometric analysis, hypothesized explanatory variables were checked
for problems of multicollinearity. Multicollinearity problem arises when some or all of the
explanatory variables have perfect or exact linear relationship (Gujarati, 2004). The existence of
multicollinearity might cause the estimated regression coefficients to have the wrong signs and
smaller t-ratios that might lead to drawing the wrong conclusions. Therefore, it is important to
check whether serious problems of multicollinearity existed among and between the potential
continuous and dummy explanatory variables, of the model estimation.
Following Gujarati (2004), the problem of multicollinearity for continuous explanatory
variables was assessed using a technique of variance inflation factor (VIF) and Tolerance Level
(TOL), where each continuous explanatory variable is regressed on all the other continuous
explanatory variables and coefficient of determination is computed. The measure of
multicollinearity associated with variance inflation factor is defined as:
𝑉𝐼𝐹(𝑋𝑖) = (1 − 𝑅𝑖2)−1 … … … … … … … … … … . . … … … … … … … … … … … . (11)

32
Where Ri2 is the coefficient of determination when the variable Xi is regressed on the other
explanatory variables
𝑇𝑂𝐿(𝑋𝑖) = (1 − 𝑅𝑖2) … … … … … … … … … … … … … … … … … … … … … … … … … … … … … (12)
As Ri2 increases toward unity, that is, as the collinearity of one regressor with the other regressors
increases, VIF also increases. The larger the value of VIF, the more collinear is the variable Xi. As
a rule of thumb, if the VIF of a variable exceeds 10, which will happen if Ri2 exceeds 0.90, that
variable is said be highly collinear. Similarly, TOL approaches to 1 when the variable is not
correlated with others. In this study, the values of VIF were less than 10, and hence no signals of
multicollinearity problems (Table 4).
Table 4: Variance inflation factor of continuous explanatory variables
Variable VIF TOL
Total land size 2.20 0.455
Tropical Livestock Unit 1.92 0.522
Age of household head 1.84 0.544
Family size 1.39 0.719
Education level 1.39 0.722
Experience with crossbred 1.28 0.781
Income from milk product sales 1.27 0.788
Distance from AI station 1.22 0.820
Extension visits per year 1.16 0.864
In order to see the degree of association between dummy explanatory variables,
contingency coefficients were computed. Contingency coefficient is a chi-square based measure
of association which assumes a value between 0 and 1 (Healy, 1999). The contingency coefficient
is computed as follows:
𝐶 = √2
𝑁 + 2 … … … … … … … … … … … … … … … … … … … … … … … … … … … … … … … … (13)
Where C = Coefficient of contingency, 2 = Chi-square random test and N = total sample size.
The decision rule for contingency coefficients states that a value of 0.75 or above indicates a
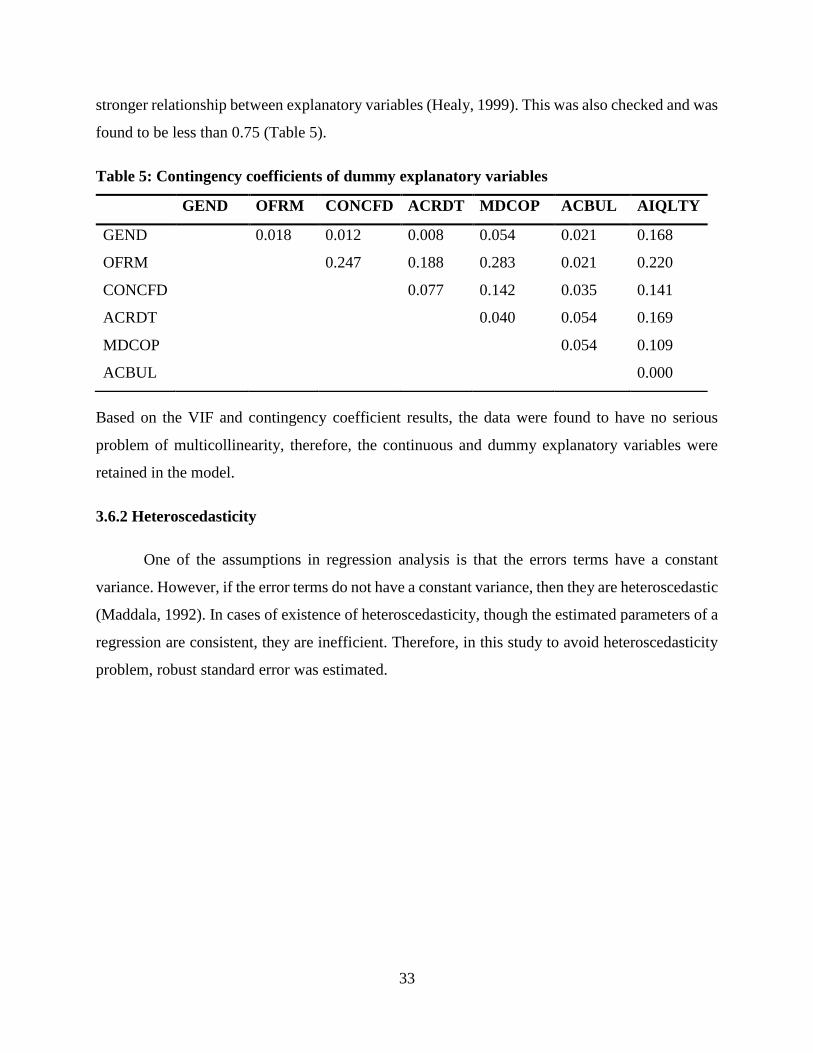
33
stronger relationship between explanatory variables (Healy, 1999). This was also checked and was
found to be less than 0.75 (Table 5).
Table 5: Contingency coefficients of dummy explanatory variables
GEND OFRM CONCFD ACRDT MDCOP ACBUL AIQLTY
GEND 0.018 0.012 0.008 0.054 0.021 0.168
OFRM 0.247 0.188 0.283 0.021 0.220
CONCFD 0.077 0.142 0.035 0.141
ACRDT 0.040 0.054 0.169
MDCOP 0.054 0.109
ACBUL 0.000
Based on the VIF and contingency coefficient results, the data were found to have no serious
problem of multicollinearity, therefore, the continuous and dummy explanatory variables were
retained in the model.
3.6.2 Heteroscedasticity
One of the assumptions in regression analysis is that the errors terms have a constant
variance. However, if the error terms do not have a constant variance, then they are heteroscedastic
(Maddala, 1992). In cases of existence of heteroscedasticity, though the estimated parameters of a
regression are consistent, they are inefficient. Therefore, in this study to avoid heteroscedasticity
problem, robust standard error was estimated.

34
CHAPTER FOUR
RESULTS AND DISCUSSION
This chapter presents the results from the descriptive and econometric analyses. The
descriptive analysis made use of such tools as percentage, mean and standard deviation. In
addition, the t and chi-square statistics were employed to compare adopters and non-adopters with
respect to some explanatory variables. Econometric analysis was carried out to identify the most
important factors that affect the probability and extent of adoption of artificial insemination
technology.
4.1 Descriptive Results
4.1.1 Socio-economic and Institutional Characteristics of Adopters and non-Adopters
The socio-economic and institutional characteristics of adopter and non-adopter farmers are
presented in two tables: Table 6 and Table 7. Table 6 describes continuous variables while Table
7 describes discrete variables.
A comparison of means was done for continuous variables affecting the two groups. Out of the
nine continuous institutional and socio-economic characteristics considered, five were found to be
significant at 5 percent significance level. These were education level, experience in keeping
crossbred cattle, extension visits per year, distance of farmers’ residence from AI station and
income earned from milk and milk product sales. The hypothesis that socio-economic and
institutional characteristics between adopters and non-adopters are not different was rejected in
these cases since t calculated was greater than t critical, as presented in Table 6.

35
Table 6: Socio-economic and institutional characteristics of AI adopters and non-adopters
for continuous variables
Characteristics Adopters
(N=98)
Non-adopters
(N=98)
t-value P-value Total sample
(N=196)
Mean Std. D Mean Std. D Mean Std. D
Age of household head 45.04 12.35 45.54 14.51 0.260 0.795 45.29 13.44
Family size 6.51 2.42 6.89 3.02 0.965 0.336 6.70 2.74
Education level 5.21 3.91 3.54 3.29 -3.245 0.001*** 4.38 3.70
Total land size 3.34 2.58 3.43 2.48 0.241 0.810 3.38 2.53
Tropical livestock unit 11.75 5.76 11.42 8.10 -0.323 0.747 11.59 7.01
Experience in crossbred
cattle
7.95
5.63
4.98
5.12
-3.864
0.000***
6.46
5.57
Extension contacts 2.98 1.96 1.79 1.30 -5.016 0.000*** 2.38 1.77
Distance from AI station 0.87 0.54 1.61 1.03 6.296 0.000*** 1.24 0.90
Income from milk 972.02 756.88 480.61 593.86 -5.057 0.000*** 726.31 721.85
*, ** and *** show significance at 10, 5 and 1 percent respectively.
The level of education attained by the household head showed that on average, AI users had
spent a longer period of time in school (5.21 years) than non-users who spent 3.54 years. There
was a significant difference between the average years of schooling of the two groups at 1 percent
significance level. Successful breeding of animals using AI involves knowledge of record keeping,
observation for signs of heat which requires a minimum level of education. Education increases
the farmers’ capacity to comprehend technical recommendations that require a certain level of
literacy or numeracy. Tambi et al. (1999) reported similar results.
Farmers who keep crossbred cattle are in better position to evaluate the advantage of
keeping these over local breeds. The most common crossbred cattle were those bred with Holstein
Friesian. On average, the experience of the household heads in keeping crossbred cattle for all the
respondents was 6.46 years, while independently the average years of experience; were 7.95 and
4.98 for adopters and non-adopters respectively. This difference between adopters and non-
adopters was significant at 1 percent level.
36
The mean number of extension visits per year for the whole sample was 2.38 times for the
year 2012/13, the minimum number of visits being 0 and the maximum 10. The adopter farmers
were on average visited 2.98 times, whereas the non-adopter farmers were contacted 1.79 times
during the same period. This difference was significant at 1 percent probability level. Similar
results were found by Mignouna et al. (2011), where the adopters of Imazapyr-resistant maize
technology had significantly higher contact with extension visits than non-adopters. Nkonya
(1997) and Enki et al. (2001) also reported similar results.
The distance in hours that the farmers travelled on foot to get to the nearest AI station was
assessed. Farmers living near the AI station have a location advantage and can contact the service
providers more easily and frequently than those who live in more distant locations. In line with
this, the average time required to reach the nearest AI station was 0.87 hours for adopters and 1.61
hours for non-adopters. The nearest and the farthest farmers needed to walk for 0.15 and 4 hours
respectively to get to the AI station while the average distance for the whole sample was 1.24
walking hours. This means that non-users have to spend more time and money to get to a technician
thus making the service less accessible and more expensive. The mean difference between the
distances covered by adopters and non-adopters was statistically significant at 1 percent level of
probability. The study result is in agreement with the results of Murage and Ilatsia (2011).
Livestock production, crop production and off-farm activities were important income
sources for the sampled dairy farmers. The average pooled monthly income earned from milk and
milk products sales was 726.31 Birr. On average, adopters of AI reaped more cash from milk
product sales (972.02 Birr) than non-adopters (480.71 Birr). The mean difference between the two
groups was significant at 1 percent probability level. This study conforms to the findings of Foti
et al. (2008) in which the proportion of income earned from livestock was higher for adopters of
the selected soil fertility and water management technology than for non-adopters.
A summary of socio-economic and institutional characteristics for dummy variables of the
AI users and non-users is presented in Table 7. The chi-square test results revealed that off-farm
income, access to credit facility, membership in dairy cooperatives and feeding cattle with
concentrate feeds were significant at 1 percent level of probability. Hence, the null hypothesis that

37
socio-economic and institutional characteristics between adopters and non-adopters are not
different was rejected at 5 percent significance level.
Table 7: Socio-economic and institutional characteristics of adopters and non-adopters for
dummy variables
Characteristics Adopters
(N=98)
Non-adopters
(N=98)
χ2 value P-value Total sample
(N=196)
No. Percent No. Percent No. Percent
Gender
Female 5 5.10 7 7.14 12 6.1
Male 93 94.90 91 92.86 0.355 0.551 184 93.9
Off-farm income
No 50 51.02 87 88.78 137 69.9
Yes 48 48.98 11 11.22 33.196 0.000*** 59 30.1
Feeding concentrates
No 21 21.43 56 57.14 77 39.3
Yes 77 78.57 42 42.86 26.203 0.000*** 119 60.7
Credit access
No 30 30.61 65 66.33 95 48.5
Yes 68 69.39 33 33.67 25.023 0.000*** 101 51.5
Dairy Cooperative member
No 57 58.16 88 89.80 145 74.0
Yes 41 41.84 10 10.20 25.471 0.000*** 51 26.0
Access to crossbred bull
No 21 21.43 18 18.37 39 19.9
Yes 77 78.57 80 81.63 0.288 0.591 157 80.1
*, ** and *** show significance at 10, 5 and 1 percent respectively.
During slack periods, farmers earn additional income by engaging in various off-farm
activities. This raises their financial position to acquire new inputs. Therefore, in this study, it was
hypothesized that there is a positive correlation between the amount of off-farm income and the
level of adoption of AI technology. About 30.1 percent of the household heads reported that at
least one of their family members was engaged in off-farm activities, which helped them to earn
additional income. Nearly half of the adopter households (48.98 percent) had additional income
from non-farm activities as compared to about 11.22 percent of non-adopters. The Chi-square test

38
indicated a systematic association between adoption of AI technology and off-farm income at 1
percent level of significance. The result is in agreement with the finding of Mal et al. (2012).
Access to credit is one way of improving farmers’ access to new production technology as
it increases the farmers' economy to purchase improved breeds of cattle, improved forages and
concentrate feeds, fertilizer and other inputs. The result presented in Table 7 indicates that, among
adopters 69.39 percent had access to credit services and 30.61 percent had no access. On the other
hand, about 33.67 percent of non-adopters had access to credit and 66.33 percent had not. Hence,
there is a significant difference between adopters and non-adopters with regard to access to credit
services at 1 percent level of significance. Farmers without cash and no access to credit will be
disadvantaged in adopting new technologies, hence supporting the findings of Kaaya et al. (2005)
and Simtowe and Zeller (2007).
Feed is an important factor farmers consider before accepting technologies related to
livestock production (Mekonnen, H. et al., 2010). While most farmers use crop residues in addition
to the common free grazing, some dairy farmers give additional concentrate feeds to boost the
production and maintain the condition of their cows. The common concentrate feeds in the area
were residue from lentil oil factory (fagulo), brewery residue (atela), wheat-bran, molasses and
mineral salt (amole-chewu). In this study, about 78.57 percent of households who adopted AI
technology had used concentrates to feed their cows while only 42.86 percent of the non-adopters
had fed their cows with concentrates. The Pearson chi-square test indicated that there is a
systematic association between adoption of AI and feeding concentrates to cows. Kaaya et al.
(2005) found similar results where providing supplementary concentrate feeds to cows
significantly discriminated between users and non-users of AI technology in Uganda.
Participation in an organization is expected to have an indirect influence on the adoption
behaviour of farmers as it exposes them towards innovative ideas and practices. Dairy cooperative
group is one of farmers’ association groups that were expected to have significant relationship
with adoption of AI as farmers may use the union to find market for their produces. The only dairy
cooperative unions in the area are Bekoji dairy cooperative and Lemu-Ariya dairy cooperative.
The result in Table 7 indicates that 26 percent of the total sampled households were members of
the dairy cooperatives while 74 percent were not members. Nearly 42 percent of AI adopters were

39
members of dairy cooperative union where as only about 10 percent of the non-adopters were
members in dairy cooperative. The result revealed that there is significant relationship between
membership in dairy cooperative and the adoption of artificial insemination technology at 1
percent level. Similar results were reported by Mignouna et al. (2011) and Kaaya et al. (2005).
4.2 Empirical Results
The two stages of the double-hurdle model were run separately as Probit and truncated
regression. The parameter estimates of the Probit and truncated regression models employed to
identify factors influencing a farmer’s decision about adopting artificial insemination technology
and its extent of adoption are presented in Table 8 and 9, respectively. Results of the analyses
revealed that the probability of adoption and extent of adoption of AI were influenced by different
factors and at different levels of significance for different factors. The discussion of the results
about the significant variables is presented as follows.
4.2.1 Factors Determining the Probability of Adoption of Artificial Insemination
The determinants of probability of adoption were identified through a Probit model, which
is the first stage or Tier 1 of Cragg’s double-hurdle model. The Probit results presented in Table 8
revealed that out of the 15 explanatory variables considered in the model, 9 were found to
significantly influence the probability of adopting artificial insemination. The log likelihood
estimates of the Probit regression model indicated that off-farm income (OFRM), family size
(FMSZ), feeding concentrates to cows (CONCFD), contacts with extension agents (EXTN), credit
access (ACRDT), distance from AI station (DISTAS), income from milk sales (INCMLK),
membership in dairy cooperative (MDCOP) and access to crossbred bull (ACBUL) were important
factors influencing the decision of smallholder dairy farmers to adopt AI technology. The marginal
effects of the Probit model show changes in the probability of adoption of AI for additional unit
increase in the continuous independent variables and for the change from 0 to 1 for dummy
variables.

40
Table 8: Probit model estimates of the determinants of probability of AI adoption
*, ** and *** show significance at 10, 5 and 1 percent respectively.
Earning off-farm income influenced the decision behaviour of farm households to adopt
artificial insemination positively at 1 percent level of significance. Farmers who were earning
income from off-farm activities had 31.6 percent more probability of adopting AI than farmers
without off-farm income, ceteris paribus. Theoretically, off-farm income can help to overcome a
working capital constraint or may even finance the purchase of a fixed investment type of
innovation. The result implies that households with off-farm income have a higher potential of
ADAI Marginal
Effects
Robust Std.
Error
Z P>z
Gender of household head -0.0237 0.5151 -0.12 0.908
Age of household head -0.0031 0.0118 -0.65 0.513
Family size -0.0499 0.0506 -2.48 0.013**
Education level -0.0010 0.0403 -0.06 0.949
Total landholding 0.0261 0.0712 0.92 0.357
Total livestock owned -0.0056 0.0253 -0.56 0.577
Off-farm income 0.3160 0.2960 2.83 0.005***
Experience with crossbred cattle 0.0145 0.0262 1.39 0.164
Feeding concentrates to cattle 0.3998 0.2605 4.03 0.000***
Extension visits per year 0.0674 0.0792 2.14 0.032**
Distance from AI station -0.2745 0.1582 -4.36 0.000***
Credit access 0.3410 0.2517 3.51 0.000***
Income from milk product sales 0.0002 0.0003 2.18 0.029**
Membership in dairy cooperative 0.2561 0.3284 2.04 0.041**
Access to exotic/crossbred bull -0.2545 0.3031 -2.22 0.026**
Constant 0.7756 0.13 0.899
Number of observations 196
Log likelihood -68.859
Wald chi2(15) 78.21
Prob >chi2 0.000

41
becoming adopters, thus they are more likely to pass through the first hurdle than those with no
off farm-income. Empirical evidence of similar findings has been reported by Feder et al. (1985),
and Mal et al. (2012).
Contrary to the expectations, family size had a negative and significant influence on
adoption of AI at 5 percent level. The marginal effect of family size implies that an increase in
number of family size by one member is associated with a decrease in the probability of household
head’s decision to adopt AI by about 5 percent, having other variables held constant. The negative
sign implies that the more the number of family members, the less will be the probability of using
AI. The possible explanation is that, due to the subsistence nature of the farmers they would rather
spend the little they get on dependants than on new technology. Though the result disagrees with
some (Asfaw et al., 2011; Idrisa et al., 2012), it is consistent with the results of Aksoy et al. (2011)
and Simtowe and Zeller (2007).
The positive coefficient of concentrate feed in the adoption equation supports the
hypothesis that farmers who have already practiced provision of additional concentrate feed are
more likely to adopt AI technology. The positive effect of concentrate feeds suggested that farmers
who feed their cows with supplementary feeds have 40 percent higher probability of AI adoption
than those who do not. The introduction of complementary practices enhances the adoption and
diffusion of the introduced technological innovation (Teklewold et al., 2006). Adopting AI
technology to get improved dairy breeds and the practice of feeding concentrates together provides
synergistic benefits as crossbred cows have larger responses to supplementary feeding. The results
are similar with the findings of Kaaya et al. (2005) and Tambi et al. (1999).
Access to extension services had the expected positive and significant effect at less than 5
percent significance level on probability of adoption of AI. It can be derived that ceteris paribus,
for each additional extension visit a farmer received, the probability of using AI was higher by
6.74 percent. Extension as a source of agricultural information has been reported to increase
adoption and use of new agricultural technologies (Feder et al., 1985). Extension contact
determines the information that farmers obtain on production activities and the procedures of cattle
breeding using AI. The effect of exposure to extension programmes is enormous. For instance,
Teklewold et al. (2006) found that farmers who had access to extension contact adopted poultry

42
technologies 31 percent greater thhan farmers who did not get contact with extension agents. This
could be due to increased farmers’ interaction with development agents in the form of multiple
visits, and technical support to farmers increases farmers’ knowledge of the available technologies
and their potential benefits. The result agrees with the findings of adoption studies in Nigeria
(Idrisa et al., 2012), Uganda (Kaaya et al., 2005) and Tanzania (Nkonya et al., 1997).
Access to credit services influenced the probability of AI adoption positively and
significantly at 1 percent significance level due to access to finance for this technology.
Agricultural credit services are the major sources for improved agricultural technologies to solve
financial constraints. If farmers can get access to credit, they can purchase improved technologies.
According to the results, relative to farmers who face credit constraint, farmers who have access
to credit were about 34.1 percent more likely to adopt AI technology. Since using AI results in
more demanding breeds; farmers would need to plant forages, buy concentrate supplements and
get more feeds either from crop residues or hay. These activities require funds which force the
farmers to take credit. The finding that credit significantly increases the likelihood of adoption is
in line with a priori expectations and concurs with findings from a number of studies; for instance,
Feder et al. (1985); Teklewold et al. (2006); Simtowe and Zeller (2007); Idrisa et al. (2012); Mal
et al. (2012) which have shown that the lack of access to credit significantly inhibits the adoption
of high yielding varieties even when fixed pecuniary costs are not large.
The coefficient of distance to AI station had the expected negative sign and significant
effect on the probability of AI use. Result in Table 8 revealed that, holding other factors constant,
the probability of adopting artificial insemination reduced by 27.45 percent for a further walking
distance of one hour to the AI station. This clearly indicates the importance of proximity to the
source of technology. Proximity to source of technology such as AI station can be an important
factor in determining the likelihood of adoption, especially in developing countries where linkage
to extension services is weak (Idrisa et al., 2012). Farmers that are close to sources of improved
technologies take the advantage of their proximity and tend to adopt the innovations compared to
farmers that are far away. With particular reference to the study area, poor road network coupled
with difficult terrain make movement difficult thus inhibiting communication and accessibility of
farmers to the technology. The result is in agreement with the findings of Murage and Ilatsia (2011)
in which distance from AI inseminator significantly affected breeding services in Central Kenya.

43
The monthly income earned from milk and milk product sales had a significant and positive
influence on the decision of smallholder dairy farmers to adopt AI. When all other factors are held
constant; an increase in monthly income from sale of milk products by 100 Birr is associated with
an increase in the probability that a dairy farmer would adopt AI by 2 percent. This is plausible as
earning income from milk product sales strengthens the financial capacity of the farmers so that
they have more disposable income to buy the necessities for the crossbred animals such as
supplementary feeds and grass land, and are willing to adopt AI services. Thus, the higher the
amount of milk produced and sold from the farm, the higher the probability of using AI. Previous
studies have also indicated the positive influence of farm income on adoption and use of new
agricultural innovations (Feder et al., 1985; Kaaya et al., 2005).
Membership in dairy cooperative significantly and positively influenced the likelihood of
AI adoption by smallholder dairy farmers. For a discrete change in this dummy variable from 0 to
1, the probability of AI adoption was higher by 25.61 percent. The dairy cooperatives buy milk
from the member farmers and as such they have the guarantee of the market. Milk being perishable
product; unless there is assured market, farmers do not invest in producing more milk by adopting
AI. However, cooperatives make them eager to get the breeds which can produce more milk by
adopting AI. The study result is consistent with the finding of Beshir et al. (2012) in which
household’s membership in farmers’ organization significantly increased the likelihood that the
farmer would adopt inorganic fertilizer.
Access to crossbred bull was significant at 5 percent level and had negatively influenced
the probability of adopting AI. The marginal effect of the result indicated that; ceteris paribus,
dairy farmers who had access to crossbred bull service were 25.45 percent less likely to adopt AI
technology than those without access. This result is logical because farmers who have access to
bull services would prefer bull service over AI. Coupled with limited understanding (awareness)
of farmers about the difference between the off-springs born with AI and bull; the lower cost of
bull service and low success rates associated with AI made farmers to prefer bull services. Murage
and Ilatsia (2011) reported similar results in their study in Kenya.

44
4.2.2 Factors Determining the Extent of use of Artificial Insemination
The extent of adoption was determined as proportion of calves born with artificial
insemination given the total calves born within the past two years per household. The overall
average extent of AI adoption in the study area was 0.28 (see appendix II). This means out of the
total calves born for AI adopter households within the past two years, 28 percent were those
conceived with AI.
The determinants of the extent of AI adoption were identified through a truncated
regression model, which is the second stage or Tier 2 of Cragg’s double-hurdle model. The results
are presented in Table 9. The result of the truncated regression shows that a total of 17 explanatory
variables were considered in the econometric model out of which, 8 were found to significantly
affect the intensity of adopting artificial insemination. The log likelihood estimates of the truncated
regression model indicated that education level (EDUC), years of experience in keeping crossbred
cattle (EXPCRS), off-farm income (OFRM), access to crossbred bull (ACBUL), distance from AI
station (DISTAS), membership in dairy cooperative (MDCOP), the quality/effectiveness of AI
services (AIQLTY) and the years of using AI (YRADPT) were important factors influencing the
extent of AI utilization by the smallholder dairy farmers in Lemu-Bilbilo district.
The level of education of the respondents as measured by the number of years spent in
school was a very important factor that significantly influenced the extent of adoption of artificial
insemination technology in the study area. The marginal effect shows that, conditional on adoption
of AI, the extent of use increases by 1.93 percent for an additional year of schooling of a farmer.
This positive relationship between level of education and extent of adoption of AI is plausible as
education increases the capacity of farm households to acquire information and knowledge of
improved technologies and promote the decision to use it on own farm. Educated farmers are more
likely to be conversant with the associated negative effects of using bull service such as inbreeding
and related diseases and therefore are more likely to use AI service. Similar results were reported
by Aksoy et al. (2011) and Murage and Ilatsia (2011).
Table 9: Truncated regression model estimates of the determinants of extent of AI use
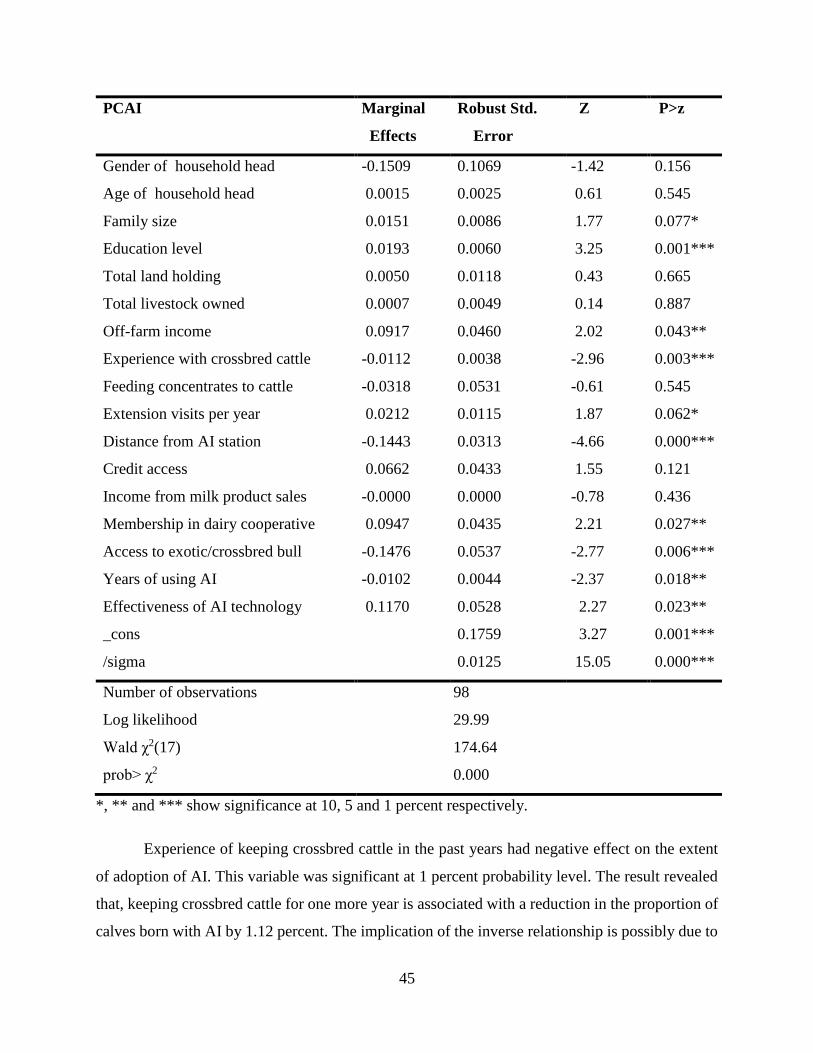
45
*, ** and *** show significance at 10, 5 and 1 percent respectively.
Experience of keeping crossbred cattle in the past years had negative effect on the extent
of adoption of AI. This variable was significant at 1 percent probability level. The result revealed
that, keeping crossbred cattle for one more year is associated with a reduction in the proportion of
calves born with AI by 1.12 percent. The implication of the inverse relationship is possibly due to
PCAI Marginal
Effects
Robust Std.
Error
Z P>z
Gender of household head -0.1509 0.1069 -1.42 0.156
Age of household head 0.0015 0.0025 0.61 0.545
Family size 0.0151 0.0086 1.77 0.077*
Education level 0.0193 0.0060 3.25 0.001***
Total land holding 0.0050 0.0118 0.43 0.665
Total livestock owned 0.0007 0.0049 0.14 0.887
Off-farm income 0.0917 0.0460 2.02 0.043**
Experience with crossbred cattle -0.0112 0.0038 -2.96 0.003***
Feeding concentrates to cattle -0.0318 0.0531 -0.61 0.545
Extension visits per year 0.0212 0.0115 1.87 0.062*
Distance from AI station -0.1443 0.0313 -4.66 0.000***
Credit access 0.0662 0.0433 1.55 0.121
Income from milk product sales -0.0000 0.0000 -0.78 0.436
Membership in dairy cooperative 0.0947 0.0435 2.21 0.027**
Access to exotic/crossbred bull -0.1476 0.0537 -2.77 0.006***
Years of using AI -0.0102 0.0044 -2.37 0.018**
Effectiveness of AI technology 0.1170 0.0528 2.27 0.023**
_cons 0.1759 3.27 0.001***
/sigma 0.0125 15.05 0.000***
Number of observations 98
Log likelihood 29.99
Wald χ2(17) 174.64
prob> χ2 0.000

46
the fact that farmers start to own their own crossbred bulls and hence prefer to use them rather than
going for AI. Since the education level and knowledge of most farmers about breeding is limited,
they consider the off-springs produced by the crossbred bulls and AI as the same. The result
contradicts with the hypothesis and the findings of other researchers (Idrisa et al., 2012; Kaliba et
al., 2000) as farming experience is mostly associated with the positive use of the technology in
question. However, there are also findings which support this result (Mal et al., 2012; Kaaya et
al., 2005).
The coefficient of earning income from off-farm activities is another factor that positively
and significantly affected the extent of AI use by smallholder dairy farmers. On average, the
proportion of calves born with AI for farmers who had off-farm income was higher by 9.17 percent
as compared to those who did not have off-farm income. The possible explanation of this result is
that off-farm income earned might solve the financial constraints to hire labour and to purchase
inputs like livestock feeds. Having additional sources of income for smallholders could help them
keep more crossbred cows as managing these breeds need more income than keeping local cows.
This result supports the hypothesis and complies with the results obtained in the descriptive
analysis. Similar results were obtained by Mwangi et al. (2004) where farmers with more income
sources utilized AI technology in Bomet district of Kenya.
The negative influence of access to crossbred bull on the extent of AI adoption was
significant at 1 percent level. The result, similar to in the case of first hurdle, implies that farmers
who could easily access crossbred bulls were reluctant to use AI intensively as compared to those
who did not have access to crossbred bull. The variable was significant at 1 percent, and on average
the extent of AI utilization for farmers who had access to crossbred bull was lower by 14.76 percent
than farmers who did not have access. In this case, since the respondents have already adopted the
AI, it means they have owned crossbred cattle/bulls. Hence, they prefer using their own bulls
instead of going for the poorly accessible AI technology and incurring costs besides the risks of
the low conception rate associated with the technology. This translates to increased production
costs to the farmer, a fact that makes most farmers resort to natural mating which is believed to
have high success rates and more accessible. The result conforms to the findings of Mwangi et al.
(2004) and Murage et al. (2006).

47
Distance from AI station had the expected negative sign and significant influence on the
extent of utilization of AI technology by farmers. The negative sign of the coefficient implies that
farmers who live closer to the source of technology are more likely to adopt the technology and
are also more likely to use intensely compared to farmers who live farther away from the AI station.
The marginal effect of distance from AI station on the extent of AI use was -0.144. The possible
explanation for such trend is the level of risk which tends to increase with increase in distance to
source of technology. That is, as the estrus time in cows lasts only for limited hours, for successful
AI service farmers have to follow the heat signs and take the cows to the inseminators on time.
Hence, since there are risk factors associated with using AI for farmers located at distant places;
they prefer to use bull services. When studying the determinants of service use among rural
households in Zambia, Wanmali and Jane (1995) found that services that were farthest from the
household were least used.
Being member of dairy cooperative has been found to positively affect the extent of use of
artificial insemination. The result indicated that; member of dairy cooperatives had 9.47 percent
more proportion of calves born with AI than non-members. The dairy cooperatives, besides buying
the produce of member farmers, serve to educate farmers about how they can keep and manage
their cows and about the marketing of their produces. Interaction with different information
sources and clubs helps farmers gather information and knowledge about breeding services and
performance of the different breeds. Membership in dairy cooperatives in the study area mostly
assured the market for their produce. Therefore, as compared to non-members, farmers who were
members of dairy cooperatives used AI intensively to produce more milk by owning better breeds.
A similar observation has been made by Mwangi et al. (2004) and Njoroge et al. (2004) who linked
low usage of AI to farmers’ difficulty in milk marketing.
The results revealed that; the quality of the AI service provided influenced the extent of AI
use positively and significantly at less than 5 percent. On average, farmers who rated AI as
effective service were associated with possessing 11.7 percent higher proportion of calves born
with AI than those who rated it as ineffective. While the quality/effectiveness of AI service was
measured by the number of services per conception; it depends on the ability of inseminators,
quality of the semen, and heat detection ability and timing of the farmers. Repeats in insemination
lead to delayed conception and calving, longer calving intervals, and loss of money in terms of

48
unrealized sales from milk and in-calf heifers. This explains why the number of cows conceiving
at the first service is a crucial variable for extent of use of AI. The result is in line with the findings
of Kaaya et al. (2005) and Mwangi et al. (2004).
Contrary to the hypothesis made, the experience of using AI technology was negatively
related to the extent of using the technology. As the number of years increase since a farmer started
using AI, the extent of AI utilization declines. The result in Table 9 shows that, for every added
year of experience in using AI, the extent of AI reduces by 1.02 percent. The probable reason given
by Kaaya et al. (2005) for this negative relationship is that AI is more likely to be adopted on farms
with unimproved cattle. Initially, farmers adopt and use AI for the purpose of improving their dairy
cattle productivity and when such herds are improved to the farmers’ satisfaction AI is only used
for routine breeding. Such a farmer is likely to use natural service as it is less costly and readily
available. In this case farmers with graded cattle herds were found to be more likely to use the bull
instead of AI.

49
CHAPTER FIVE
CONCLUSION AND RECOMMENDATION
5.1 Conclusion
Different socio-economic characteristics of both categories of farmers (AI adopters and
non-adopters) were determined. There was significant difference between the two categories of
the farmers in terms of education level, off-farm income, membership in dairy cooperatives,
contacts with extension agents, experience in keeping crossbreeds, feeding concentrates to cows,
access to credit services, income from milk products sales and distance from AI station (p<0.05).
The interesting aspect of the econometric results is the distinct differences in explanatory
variable effects between the two hurdles. Specifically, contacts with extension agents, access to
credit, income from milk sales, feeding concentrates to cows and family size influenced the
probability of adoption positively (except family size) without affecting the extent of adoption in
the second hurdle. Education level of household head whereas had positive impact on the extent
of AI use without affecting the probability of adoption.
Membership in dairy cooperatives and income from off-farm activities can be instrumental
in AI adoption due to milk market guarantee and the strengthening of financial capacity from off-
farm income. Farmers located at farther distances from AI station and those with access to
crossbred bulls preferred to use bulls than AI.
5.2 Recommendation
Access to AI can be improved by expanding service giving stations in the district along
with training more technicians. Private sector and NGOs have to be encouraged to involve in
providing AI service as this can help improve technology dissemination. To enhance extension
contact, integrated and participatory rural development strategies can be used. This can work
because development agents create strong social and cultural links with the people they assist.
Therefore, organizing regular in-service and on-job training, providing adequate incentives and
remuneration as well as employing adequate number of development agents will be necessary
conditions to change the farmers’ attitude toward agricultural transformation.

50
Establishing more microfinance or any other credit providing institutions all over the
district can help to expand credit access to dairy farmers. To ensure widely adoption of AI, it is
also vital to establish more dairy cooperatives and strengthen the existing ones as they are sources
of information besides serving as way of milk marketing for the farmers.
Farmers can be made to acquire more knowledge about AI technology and its difference
with using bull services by establishing farmers training centres and through adult education. Rural
development strategies should not only emphasize on increasing agricultural production but
simultaneous attention should be given to promoting off-farm activities in the rural areas.
5.3 Further Research
This study determined the factors responsible for adoption and use of AI technology but
did not determine the profitability of the technology. Therefore, further research to determine
profitability of this technology is recommended. Considering the costs of every input used and
benefits obtained from the products will be important in formulation of effective and efficient
policies necessary for improvement of the dairy sector.

51
REFERENCES
Abraham, A. (2009). Agricultural biotechnology research and development in Ethiopia. African Journal
of Biotechnology 8 (25): 7196-7204.
Ahmed, M.M., Emana, B., Jabbar, M.A., Tangka, F., and Ehui, S. (2003). Economic and nutritional
impacts of market-oriented dairy production in the Ethiopian highlands. Socio-economic and
Policy Research Working Paper 51. ILRI (International Livestock Research Institute), Nairobi,
Kenya.
Aksoy, A., Külekçi, M., and Yavuz, F. (2011). Analysis of the factors affecting the adoption of
innovations in dairy farms in Erzurum Province, Turkey. African Journal of Agricultural Research
6(13): 2966-2970.
Anteneh, B., Tegegne, A., Beyene, F., and Gebremedhin, B. (2010). Cattle milk and meat production and
marketing systems and opportunities for market-orientation in Fogera woreda, Amhara region,
Ethiopia. IPMS (Improving Productivity and Market Success) of Ethiopian Farmers Project
Working Paper 19. ILRI (International Livestock Research Institute), Nairobi, Kenya.
Asfaw, S., Shiferaw, B., Simtowe, F., and Haile, M. G. (2011). Agricultural technology adoption, seed
access constraints and commercialization in Ethiopia. Journal of Development and Agricultural
Economics 3 (9): 436-447.
AZADD (Arsi Zone Agricultural Development Department). (2000). Annual Report. Asella, Ethiopia.
Benin, S., Ehui, S., and Pender, J. (2003). Policies for Livestock Development in the Ethiopian Highlands.
Environment, Development and Sustainability 5 (3-4): 491-510.
Beshir, H., Emana, B., Kassa, B., and Haji, J. (2012). Determinants of chemical fertilizer technology
adoption in North eastern highlands of Ethiopia: the double hurdle approach. Journal of Research
in Economics and International Finance 1 (2): 39-49.
Cochran, W. G. (1963). Sampling Techniques. 2nd Edition. John Wiley and Sons, Inc. New York.

52
Cragg, J. (1971). Some statistical models for limited dependent variables with application to the demand
for durable goods. Econometrica 39 (5): 829-844.
CSA (Central Statistical Agency). (2008). Agricultural Sample Survey 2007/08. Volume II. Report on
livestock and livestock characteristics. Addis Ababa, Ethiopia.
CSA (Central Statistical Agency). (2008). Summary and Statistical Report of the 2007 Population and
Housing Census Results. Addis Ababa, Ethiopia.
Dalton, J.C. (1999). Factors important to the efficiency of Artificial Insemination in Single-Ovulating and
Super-ovulated Cattle. Phd Dissertation submitted to the Virginia Polytechnic Institute and State
University, Virginia, USA. http://scholar.lib.vt.edu/theses/available/etd-042299-
071254/unrestricted/ETD.PDF. Accessed 06 July 2012.
Dandedjrohoun, L., Diagne, A., Biaou, G., N’cho, S., and Midingoyi, S-K. (2012). Determinants of
Diffusion and Adoption of Improved Technology for Rice Parboiling in Benin. Review of
Agricultural and Environmental Studies 93 (2): 171-191.
Desta, K.B. (2002). Analysis of Dairy Cattle Breeding Practices in Selected Areas of Ethiopia. PhD thesis,
Humboldt University of Berlin, Department of Animal Breeding, Berlin, Germany.
EASE (Ethiopian Agricultural Sample Enumeration). (2003). Statistical Report on Farm Management
Practice, Livestock and Farm Implements Part II, Results at the Country Level. Central
Agricultural Census Commission. Addis Ababa, Ethiopia.
Enki, M., Kassa, B., and Dadi, L. (2001). Determinants of Adoption of Soil Conservation Measures in
Central Highlands of Ethiopia. The Case of Three Districts of North Shoa. Agrekon 40(3): 293-
315.
ESAP (Ethiopian Society of Animal Production). (2004). Farm Animal Biodiversity in Ethiopia: Status
and Prospects. Proceedings of the 11th Annual conference of the ESAP, August 28-30,
2003.ESAP, Addis Ababa.
ESAP (Ethiopian Society of Animal Production). (2008). Artificial Insemination and its application in
Animals. Working Manual. Emiru Zewdie (Ed). Addis Ababa, Ethiopia. (Amharic Version).

53
Espineira, M.R. (2006). A Box-Cox Double-Hurdle Model of Wildlife Valuation: The Citizen’s
Perspective. Ecological Economics 58 (1): 192-208.
FDRE (Federal, Democratic Republic of Ethiopia). (2002). Industrial Development Strategy. (Amharic
Version), Addis Ababa, Ethiopia.
http://ebookbrowse.com/gdoc.php?id=286404838&url=47c4e64ddc127fab83f0b13e49baadad.
Accessed 04 March 2013.
Feder, L., Just, R.E., and Zilberman, O. (1985). Adoption of Agricultural Innovation in Developing
Countries: A Survey. Economic Development and Cultural Change 33: 255- 298.
Felleke, G. (2003). Milk and Dairy Products, Post-harvest Losses and Food Safety in Sub-Saharan Africa
and the Near East. A Review of the Small Scale Dairy Sector – Ethiopia FAO Prevention of Food
Losses Programme, Addis Ababa, Ethiopia. Available online at:
http://www.fao.org/fileadmin/templates/ags/docs/dairy/P1assessmentcoverethiopia.pdf Accessed
24 August 2012.
Felleke, G., and Geda, G. (2001). The Ethiopian Dairy Development Policy: A Draft Policy Document.
MOA/FAO, Addis Ababa, Ethiopia.
Fikru, A. (2009). Assessment of adoption behaviour of soil and water conservation practices in the Koga
watershed, highlands of Ethiopia. A Thesis Presented to the Faculty of the Graduate School of
Cornell University, joint program with Bahir Dar University, Ethiopia.
Foti, R., Gadzirayi, C., and Mutandwa, E. (2008). The adoption of selected soil fertility and water
management technologies in semi-arid Zimbabwe: An application of the Tobit model. Journal of
Sustainable Development in Africa 10 (3).
Gebremedhin, B., and Swinton, S.M. (2003). Investment in soil conservation in northern Ethiopia: the
role of land tenure security and public programs. Agricultural Economics 29: 69–84.
Ghosh, R.K., Goswami. A., and Maitra, N. J. (2008). Adoption behavior of dairy farmers in cooperative
farming systems. Indian Research Journal of Extension Education 8 (1): 31-35.

54
Gillespie, J.M., Davis, C.G., and Rahelizatovo, N.C. (2004). Factors influencing the adoption of breeding
technologies in U.S. hog production. Journal of Agricultural and Applied Economics 36: 35-47.
Greene, W.H. (2007). Econometric analysis. 6th Edition. Macmillan, New York, USA.
Gujarati, D.N., (2004). Basic Econometrics. Fourth Edition. McGraw-Hill Companies, New York, USA.
Haji, B. (2003). Adoption of Crossbred Dairy Cows in Arsi Zone: The Case of Tiyo and Lemu-Bilbilo
Woreda. MSc thesis presented to School of Graduate Studies, Alemaya University, Ethiopia.
Healy, F.J. (1999). Statistics: a tool for social research. Fifth Edition. Wadsworth Publishing Company,
California, USA.
Henning, J.I.F., Mare, F.A., and Willemse, B.J. (2010). Profitability Analysis of Different Reproduction
Methods with Dohne Merinos. A contributed paper at the AEASA conference 2010, Cape Town,
South Africa.
Howley, P., Donoghue, C.O., and Heanue, K. (2012). Factors Affecting Farmers’ Adoption of Agricultural
Innovations: A Panel Data Analysis of the Use of Artificial Insemination among Dairy Farmers in
Ireland. Journal of Agricultural Science 4 (6).
Idrisa, Y.L., Ogunbameru, B.O., and Madukwe, M.C. (2012). Logit and Tobit analyses of the determinants
of likelihood of adoption and extent of adoption of improved soybean seed in Borno State, Nigeria.
Greener Journal of Agricultural Sciences 2 (2):37-45.
Johnson, N.L., and Ruttan, V. W. (1997). The Diffusion of Livestock Breeding Technology in the US:
Observations on the Relationship between Technical Change and Industry Structure. Journal of
Agribusiness 15 (1): 19-35.
Kaaya, H., Bashaasha, B., and Mutetikka, D. (2005). Determinants of utilization of artificial insemination
(AI) services among Ugandan dairy farmers. Eastern Africa Journal of Rural Development 21 (1):
34-43.

55
Kaliba, A.R.M., Verkuijl, H., and Mwangi, W. (2000). Factors Affecting Adoption of Improved Seeds
and Use of Inorganic Fertilizers for Maize Production in the Lowland Zones of Tanzania. Journal
of Agricultural and Applied Economics 32 (1): 35-48.
Kassie, M., Jaleta, M., Shiferaw, B., Mmbando, F., and Mekuria, M. (2012). Adoption of interrelated
sustainable agricultural practices in smallholder systems: Evidence from rural Tanzania.
Technological Forecasting and Social Change 80 (3): 525-540.
Kebede, B. (2004). Milk production in East Africa with special reference to Ethiopia. Ethiopian science
and technology commission. Addis Ababa, Ethiopia.
http://www.anarb.it/Bruna2004/inglese/Presentazioni/papers/kebede.pdf. Accessed 04 March
2013.
Kedija, H., Tegegne, A., Kurtu, M.Y., and Gebremedhin, B. (2008). Traditional cow and camel milk
production and marketing in agro-pastoral and mixed crop–livestock systems: The case of Mieso
District, Oromia Regional State, Ethiopia. IPMS (Improving Productivity and Market Success) of
Ethiopian Farmers Project Working Paper 13. ILRI, Nairobi, Kenya.
Khanal, A.R. (2010). Adoption of Breeding Technologies in the U.S. Dairy Industry and their influences
on Farm Profitability. An MSc Thesis Submitted to the Graduate Faculty of the Louisiana State
University and Agricultural and Mechanical College, Louisiana, USA.
Kibet, N., Obare, G.A., and Lagat, J.K. (2011). The role of Extraneous Incentives and Drivers in Farm
Enterprise Diversification: A study of Passion-Fruit (Passiflora edulis) Uptake in Uasin-Gishu
County, Kenya. Asian Journal of Agricultural Science 3 (5): 358-365.
Land O'Lakes, Inc. (2010). The Next Stage in Dairy Development for Ethiopia: Dairy Value Chains, End
Markets and Food Security. USAID and Land O’Lakes, Inc. Addis Ababa, Ethiopia.
http://ethiopia.usaid.gov/sites/default/files/DairyIndustryDevelopmentAssessment.pdf. Accessed
30 May 2012.
Maddala, G.S. (1992). Introduction to Econometrics. Second Edition. Macmillan Publishing Company,
New York.

56
Makeham, J.P., and Malcolm, L.R. (1986). The Economics of Tropical Farm Management. First edition.
Cambridge University Press, New York.
Mal, P., Anik, A.R., Bauer, S., and Schmitz, P.M. (2012). Bt Cotton Adoption: A Double-hurdle
Approach for North Indian Farmers. AgBioForum 15(3): 294-302.
Mekonnen, H., Dehninet, G., and Kelay, B. (2010). Dairy technology adoption in smallholder farms in
“Dejen” district, Ethiopia. Tropical Animal Health and Production 42(2): 209–216.
Mekonnen, T., Bekana, M., and Abayneh, T. (2010). Reproductive performance and efficiency of artificial
insemination smallholder dairy cows/heifers in and around Arsi-Negelle, Ethiopia. Livestock
Research for Rural Development 22 (61).
Mignouna, D.B., Manyong, V.M., and Rusike, J., Mutabazi, K.D.S., and Senkondo, E.M. (2011).
Determinants of Adopting Imazapyr-Resistant Maize Technologies and its Impact on Household
Income in Western Kenya. AgBioForum 14(3): 158-163.
MoARD (Ministry of Agriculture & Rural Development). (2007). Livestock Development Master Plan
Study. Phase I Report: Volume B – Meat Production. Addis Ababa, Ethiopia.
MoARD (Ministry of Agriculture and Rural Development). (2010). Ethiopia’s Agriculture Sector Policy
and Investment Framework: Ten Year Road Map (2010-2020). Draft. Addis Ababa, Ethiopia.
MoFED (Ministry of Finance and Economic Development). (2010). Growth and Transformation Plan
2010/11-2014/15 Volume I, Addis Ababa, Ethiopia.
Moffat, P.G. (2005). Hurdle models of loan default. Journal of the Operational Research Society 56 (9):
1063-1071.
Murage, A.W., and Ilatsia, E.D. (2011). Factors that determine use of breeding services by smallholder
dairy farmers in Central Kenya. Tropical Animal Health and Prod 43:199–207.
Murage A. W., Ilatsia, E. D., and Muasya, T. K. (2006). Liberalization of artificial insemination services
in Kenya and implication for a dairy cattle improvement programme: Proceedings of 10th Biennial
KARI scientific conference and research forum held 12-17 Nov 2006, Nairobi, Kenya.

57
Mwangi, J.G., Ronoh, T.W., and Asiabaka, C.C. (2004). Factors Related to the Use of Artificial
Insemination by Subsistence Dairy Farmers in Bomet District, Kenya. International Journal of
Agricultural and Rural Development 5: 164-175.
NBE (National Bank of Ethiopia). (2011). National Bank of Ethiopia 2010/2011 Annual Report. Addis
Ababa, Ethiopia.
Ngugi, D., Mukundu, D., Epperson, J., and Acheampong, Y. (2003). Determinants of Household
Participation in Rural Development Projects. Selected Paper for presentation at the Southern
Agricultural Economics Association Annual Meeting, Mobile, Alabama.
http://ageconsearch.umn.edu/bitstream/35251/1/sp03ng05.pdf. Accessed 08 February 2013.
Njoroge, L., Baltenweck, I., Ouma, R., Staal, S., and Romney, D. (2004). Breeding services in Kenya: an
examination of trends and factors predisposing adoption of artificial insemination technology. East
Africa Regional Animal Production Society Conference, 15–18 March 2004, Nairobi, Kenya.
Nkonya, E., Schroeder, T., and Norman, D. (1997). Factors affecting adoption of improved maize seed
and fertilizer in North Tanzania. Journal of Agricultural Economics 48: 1-12.
OBPED (Oromiya Bureau of Planning and Economic Development). (2011). Physical and Socio-
Economic Profile of Arsi zone and Districts, Regional State of Oromia, Addis Ababa, Ethiopia.
http://www.oromiyaa.com/english/images/arsi%20zone.pdf. Accessed 12 March 2013.
Oluoch, K.W., Ariga, E.S., Okeyo, A.M., Waithaka, M.M., and Kyalo, A.M. (1999). Agricultural
Technology, Economic Viability and Poverty Alleviation in Kenya. A paper for the ‘Agricultural
Transformation Policy in Sub-Saharan Africa’ Workshop, Nairobi, Kenya. on 27-30 June, 1999.
Olwande, J., Sikei, G., and Mathenge, M. (2009). Agricultural Technology Adoption: A Panel Analysis
of Smallholder Farmers’ Fertilizer use in Kenya. CEGA Working Paper Series No. AfD-0908.
Centre of Evaluation for Global Action. University of California, Berkeley.
Pender, J., and Kerr, J.M. (1998). Determinants of farmers’ indigenous soil and water conservation
investments in semi-arid India. Agricultural economics. The Journal of the International
Association of Agricultural Economists 19: 35-46.

58
Pindyck, R., and Rubinfeld, D. (1997). Econometric Models and Economic Forecasts. Fourth Edition,
The McGraw-Hill Companies, Inc. New York.
Ray, G.L. (2001). Extension communication and management. Second Edition. Naya Prakash, Calcutta,
India.
Rees, L., Parcell, J., Patterson, D., Smith, M., and Poock, S. (2010). Beef reproductive technology
adoption–Impact of production risk and capitals. Paper presented at the Southern Agricultural
Economics Association Annual Meeting, Orlando, Florida, USA.
Rezaei, M., and Bagheri A. (2011). Comparative analysis of characteristics of adopters and non-adopters
of artificial insemination in Ardabil Province of Iran. Emirates Journal of Food and Agriculture
23 (5): 466-472.
Shehu, B.M., Rekwot, P.I., Kezi, D.M., Bidoli, T.D., and Oyedokun, A.O. (2010). Challenges to Farmers’
Participation in Artificial Insemination (AI) Biotechnology in Nigeria: An Overview. Journal of
Agricultural Extension 14 (2).
Shiferaw, B., and Holden, S. T. (2001). Farm level Benefits to Investments for mitigating Land
Degradation: empirical evidence from Ethiopia. Environment and Development Economics 6 (3),
335-358.
Simtowe, F., and Zeller, M. (2007). The Impact of Access to Credit on the Adoption of hybrid maize in
Malawi: An Empirical test of an Agricultural Household Model under credit market failure. AAAE
Conference Proceedings August 20-22, 2007, Accra, Ghana.
Tambi, N.E., Mukhebi, W.A., Maina, W.O., and Solomon, H.M. (1999). Probit analysis of livestock
producers’ demand for private veterinary services in high potential agricultural areas of Kenya.
Agricultural Systems 59 (2), 163-176.
Tegegne, A., and Hoekstra, D. (2011). Mass Artificial Insemination Interventions to enhance dairy and
beef production in Ethiopia. Issue Brief, ILRI, Nairobi, Kenya.
Teklewold, H., Dadi, L., Yami, A., and Dana, N. (2006). Determinants of adoption of poultry technology:
a double-hurdle approach. Livestock Research for Rural Development 18 (40).

59
Tobin, J. (1958). Estimation of Relationships for Limited Dependent Variables. Econometrica 26:24-36.
Vashist, G.D., and Pathania, M.S. (2000). Assessment of Impact of Artificial Insemination Programme in
Cattle in Himachal Pradesh. Indian Journal of Agricultural Economics 55 (3): 574.
Wanjiku, J., Ackello-Ogutu, C., Kimenye, L.K., and Place, F. (2003). Socio-economic factors influencing
the intensity of use of bio mass transfer in food crop production in western Kenya. African Crop
Science Conference Proceedings 6: 661-667.
Wanmali, S., and Jane, H. (1995). Determinants of Service Use among Rural Households in Eastern
Province, Zambia. IFPRI (International Food Policy Research Institute).
Wozniak, G.D. (1984). The Adoption of interrelated innovations: A Human Capital approach. Review of
Economics and Statistics 66 (1): 70-79.

60
APPENDICES
Appendix I: Conversion Factors used to Estimate Tropical Livestock Units (TLU)
Livestock type Tropical Livestock Unit
(TLU)
Camel 1.0
Cattle 0.7
Horse 0.8
Mule 0.7
Donkey 0.5
Sheep 0.1
Goat 0.1
Source: Makeham and Malcolm (1986)
Appendix II: Extent of Adoption
Variable N Minimum Maximum Mean
Extent of adoption 98 0.2 1.00 0.28

61
Appendix III: Test Statistics of Double-Hurdle model
Type of statistics Probit,D Truncated, Y(Y>0)
Wald χ2 78.21 174.64
Prob> χ2 0.00*** 0.00***
LOG-L -68.86 29.99
AIC(-LOG-L+k/N) 0.43 -0.13
χ2-Test Double Hurdle versus Tobit Γ=193.44> χ2(17) = 33.41

62
Appendix IV: Questionnaire
Title: Determinants of Use of Artificial Insemination by Smallholder Farmers in Lemu-
Bilbillo District, Ethiopia
Department of Agricultural Economics and Agribusiness management, Egerton University,
Introduction
This survey is being conducted by postgraduate student at Egerton University- Kenya in
Partial fulfillment of a master degree in Applied Agricultural Economics. Therefore the purpose
of this research is purely academic. You are kindly requested to provide information through
interview in the questionnaire.
N.B Information given will be treated as confidential and shall only be used for this study.
Section A: General Information
A.1 Questionnaire code number [……….…………….……..]
A.2 Enumerator’s Name [……………………………………]
A.3 Date of Interview [………………………………………]
A.4 Name of household head [………………………………]
A.5 PA […………………..] District [...…………………….]
Section B: Household composition and characteristics
B.1 Gender of the hh head 1. Male 2. Female
B.2 Age……….years.
B.3 Religion 1. Muslim 2. Orthodox Christian
3. Protestant 4. Others (Specify) ………………………..

63
B.4 Marital status 1. Married 2. Single 3. Divorced
4. Widowed 5. Others (Specify) ……………………..
B.5 How many persons have you been living in the household for at least six months?
(Family size)?
Household Members Number
Men
Women
Children
Total
B.6 Have you been to school?
1. Yes 2. No
B.7 If yes, indicate the years of schooling…………years.
B.8 Farming experience: Number of years since started cultivating land………years
Number of years since started rearing cattle……...years
B.9 List your major source of income by order of importance.
1. Crop production […………...]
2. Livestock production […..…..]
3. Both equally […….……….....] 4. Others (Specify) [………....…]
B.10 Do you have other means of earning income other than farming? Off-farm income
1. Yes 2. No

64
B.11 If yes, indicate the amount of income earned during last one year from off-farm activities.
Source of Income Amount (Birr)
Casual village labor
Handcraft
Local beverage
Remittance
Selling fire wood
Business net income (shops, trade, tailor, etc)
Others
Section C: Institutional Factors
C1. Extension services
C1.1 Is there any development agent assigned to your PA? 1. Yes 2. No
C1.2 Have you ever consulted a development agent? 1. Yes 2. No
C1.3 If yes, about which did you consult?
1. Crop production 2. Animal production
3. Both 4. Other (specify) […………..……………..…….]
C1.4 Have you received extension advice on breeding services and crossbred cattle
practices during the last 3 to 5 years? 1. Yes 2. No
C1.5 If yes, which of the following have you heard so far?
1. Crossbred 2. Improved feeding 3. Bull services 4. AI service
5. Others (Specify)[…………………………………………………]
C1.6 On average how many times has the development agent visited you with in past one
year? ..…..days.

65
C1.7 Have you found the advice given to you very important in improving your livestock
production? 1. Yes 2. No
C2. Credit Provision
C2.1 Did you get credit during the last 3 production years? 1. Yes 2. No
C2.2 If yes, who did provide you with the service?
1. Development Bank 2. Commercial Bank
3. Agricultural Bureau 4. NGO 5. Local moneylender
6. Service cooperatives 7. Others (specify)………………………………..
C2.3 For what development activities did you get credit during the year?
1. To purchase fertilizer …………….. birr
2. To purchase crossbred cows……….birr
3. To purchase seed ………………… birr
4. To use AI service…………………...birr
5. Others (specify)……………………. birr
C2.4 On what basis did you get credit? 1. Individual basis 2. Group basis
C2.5 What was the duration for loan repayment?...........years
C2.6 What was the interest rate for the credit you received?............... %
C2.7 If you have not used credit so far for livestock, what were the main reasons?
1. Due to high interest rate 2. Shortage of down payment
3. Inaccessibility to credit 4. Unavailability 5. Others (specify)
C3. Membership in Cooperatives
C3.1 Are you a member of any cooperative union? 1. Yes 2. No

66
C3.2 If yes, which cooperative?
1. Input supply coop. 2. Saving and Credit coop.
3. Producer marketing coop. 4. Welfare/funeral coop
5. Local administration 6. Water users coop
7. Others (Specify)………………………………………………………………...
C3.3 Is there any dairy cooperative in your area? 1. Yes 2. No
C3.4 If yes, are you a member of the dairy cooperative? 1.Yes 2. No
C3.5 If yes, what have you benefited being member in the dairy cooperative?
1. Sell my Products (On time market)
2. Access to improved breeds
3. Credit services
4. Others (Specify)……………………………………………………………
C3.6 Are you satisfied with the services from dairy cooperative? 1. Yes 2. No
C4. Road Availability
C4.1 How long do you walk to get transport services?.................hours
C4.2 What type of road is there in your area?
1. All season road 2. Dry season road 3. Only on market days
C5.Veterinary Services
C5.1 Is there a veterinary/animal health station in your area? 1. Yes 2. No
C5.2 If yes, how far is it located from your stay?.........walking hours.
C5.3 Have you ever gotten animal health services? 1. Yes 2. No
C5.4 If yes, who has provided animal health services for livestock in your area?
1. Agricultural Bureau 2. NGO
3. Private 4.Others (Specify) ……………………….……

67
C5.5 How frequently do you get vaccination service in your area?
1. Very frequent 2. Yearly 3. Only during outbreak
4. Less frequent 5. Never
Section D. Crop Cultivation and Land Ownership
D.1 How many hectares in total land holdings do you own?.....................
D.2 How many hectares of cultivated land do you own?.......................
D.3 Do you have rented land? 1. Yes………hectares 2. No
D.4 Indicate the utilization of the land:
1. Cultivated for crop……….ha 2. Grass land (can't be plowed)………ha
3. Covered with different forages…….ha
D.4 Crop grown, production and utilization during 2011/12
Type of crop Area planted ha Total production
Wheat
Barley
Lentils
Pea
Beans
Linseed
Others(specify)

68
Section E. Livestock Production
E.1 Type of livestock kept (local, crossbred)
Type of lives stock Local (number) Crossbred (number) Exotic (number)
Cattle Cows
Bulls
Oxen
Heifers
Calves
Small
ruminant:
Sheep
Goats
Equines:
Horses
Donkeys
Mules
Poultry Chicken
Pigs
E.2 Describe why you keep livestock? (Mark with X)
Purpose Cattle Sheep and
Goats
Equines Poultry Pigs
Local Crossbred/
Exotic
Milk
Meat
Eggs
Plowing
Transportation
Cash
Others
69
E.3 Do you have crossbred/exotic cattle? 1. Yes 2. No
E.4 If yes, which one do you have? 1. Ox 2. Cow 3. Heifer 4. Calf
E.5 When did you get that? In year………or ……….years ago.
E.6 How did you obtain the crossbred/exotic cattle first?
1. Purchase from agricultural bureau……….birr
2. Purchase from local market………….. birr
3. Born by using AI
4. Born by using bull service
5. Obtained on credit from agricultural bureau
6. Purchased in the village/from relatives
E.7 Though now not, did you have crossbred cattle before? 1. Yes 2. No
E.8 If yes, in which year? From year ..............to…………
E.9 Indicate the source of crossbred/exotic cattle by then:
1. Purchase from agricultural bureau……….birr
2. Purchase from local market………….. birr
3. Born by using AI
4. Born by using bull service
5. Obtained on credit from agricultural bureau
6. Purchased in the village/from relatives
E.10 Do you want to have crossbred/exotic cattle? 1. Yes 2. No
E.11 Do you prefer crossbred cattle over local breeds? 1. Yes 2. No

70
E.12 If yes, what made you prefer them?
1. Higher milk yield 2. Higher sales income 3. Better plowing power
4. Others (specify)……………………………………………………..
E.13 Through which way do you think you can get that?
1. Purchase from agricultural bureau……….birr
2. Purchase from local market………….. birr
3. Using AI service
4. Using bull service
5. Obtain on credit from agricultural bureau
6. Purchase in the village/from relatives
E.14 Are crossbred cows available in your area if you want to buy? 1. Yes 2. No
E.15 If yes, in your opinion how is the price of crossbred heifers?
1. Very expensive 2. Expensive 3. Fair price 4. Cheap
F. Livestock Feeding and Management
F.1 What are the major livestock feeding systems you use?
1. Free grazing 2. Zero grazing 3. Rotational grazing
F.2 Specify type of pasture land and its availability found in your area.
1. Communal grazing 2. Individual grazing
3. Both depending on seasons 3. Others (specify)………………………
F.3 Do you have feed shortage for your livestock? 1. Yes 2. No

71
F.4 If yes, what do you think are the main causes for the problem?
1. Lack of rain 2. Lack of grazing land 3. Increased livestock population
4. Poor pasture quality 5. Others (specify) …………………………………
F.5 Do you grow any fodder and forage crops? 1. Yes 2. No
F.6 If yes, how many hectares of your land is allocated to that? ………………
F.7 Do you have access to different forage crops if you want to grow? 1. Yes 2. No
F.8 If yes, where do you obtain it from?
1. Agriculture offices 2. Private sales 3.NGOs
4. Other (specify)……………………………………………….…………
F.9 Do you feed concentrates to your livestock? 1. Yes 2. No
F.10 If yes, which livestock category you often feed concentrates?
1. Local cows 2. Crossbred cows 3. Oxen
4. Only lactating ones 5. Other (specify)……………………………..
F.11 Are concentrates available in the market at required amount and time?
1. Yes 2. No
F.12 Do you use hay (from traditional pasture) for livestock feeding? 1. Yes 2. No
F.13 What are the main sources of livestock feed during dry season?
1. Crop residues 2. Hay
3. Tree legumes (leaves) 4. Others (specify)………………….…
F.14 Do you use crop residues (straw) for livestock feeding? 1. Yes 2. No
F.15 If yes, where do you get it from?
1. From own farm 2. By purchasing 3. Others (specify)………………….

72
F.16 If purchased specify the total cost you incurred to buy crop residue during
2011/12……. birr.
G. Breeding Services (Technology Availability)
G.1 Which breeding services do you use for you cattle?
1. Any bull around 2. Selected local bulls in the area
3. Crossbred/exotic bull around 4. AI service
5.Others (specify)………….................................................
G.2 Is there any crossbred/exotic bull used for service in your area? 1. Yes 2. No
G.3 If yes, have you ever used the crossbred/bull service? 1. Yes 2. No
G.4 If yes, how much does it cost per service? ………birr
G.5 How far is the crossbred/exotic bull located from your place?............walking hours.
G.6 Have you ever heard of AI? 1. Yes 2. No
G.7 If yes, when did you first hear about AI? In year............or ……….years ago.
G.8 Do you have access to use AI in your area? 1. Yes 2. No 3. I don’t know
G.9 If yes, how far is the AI station from your place?................... walking hours.
G.10 Have you ever used AI? 1. Yes 2. No
G.11 If yes, when did you first use AI? In year............or ……….years ago.
G.12 When is the AI service available?
1. Always 2. On market days 3. Mornings only
4. Other (specify)…………...
G.13 At present, how many of the cattle you own are bred using AI?................cattle heads.
G.14 How many calves were born at your home within the last two years using any
breeding service? ………calves.

73
G.15 How many of those calves were bred with AI?...........calves
G.16 How many of these were bred using crossbred/exotic bull service?...........calves
G.17 What is the price of AI per service?............birr
G.18 In your opinion, how expensive is the price of AI service?
1. Expensive 2. Fair price 3. Cheap
G.19 If you have used AI before, in how many inseminations did your cow/s conceive?
1. One 2. Two 3. Three 4. Other (specify)……………….
G.20 If you have used AI service, how do you rate the efficiency of AI in conception
compared to bull service? 1. Very good 2. Good 3. Poor
G. 21 What do you think of your heat detection ability?
1.Very good 2. Good 3. Poor
G.22 In your opinion is the AI service in your area effective or not?
1.Yes 2. No 3.No idea
G.23 What do you think is/are the major problem/s with using AI?
1. Distance to AI station 2. Inefficiency of the service
3. Inefficiency of the Inseminators 4. Availability of the service
5. Others (specify)……………………………………………………….
G.24 What do you think are the advantages of using AI over crossbred/exotic bull service?
1. Timely availability 2. Lower price
3. No fear of diseases 4. Others (specify)……………………
G.25 Which one do you prefer from AI service and crossbred/exotic bull service?
....................Why?..............................................................................................................................
H. Milk Production and Market Service
H.1 How many litres of milk do your cows give per day?
74
1. Local………litres/cow/day 2. Crossbred…… litres/cow/day
3. Exotic…….litres/cow/day 4. Other (specify)…………………..
H.2 Do you sell livestock products like milk and milk products? 1. Yes 2. No
H.3 If yes, how many litres of milk do you sell per day?............ Per month?.................
H.4 How many kilograms of butter do you sell per month?..........kg and cheese?..........kgs
H.5 What is the price of milk in your area?...................birr/liter.
H.6 Where do you sell your milk?
1. At farm gate 2. Taking to nearest town 3. Only on market days
4. Through dairy cooperative 5. Other (specify)………………………………
H.7 If you do not sell milk and milk products, what are the reasons?
1. Price too low 2. No surplus to be marketed
3. No market 4. Others (Specify)…………………………………
H.8 Have you ever faced problem in finding market for your milk? 1. Yes 2. No
H.9 If yes, what did you do as a solution?
1. Convert to butter and cheese 2. Consume at home
3. Feed to calves 4. Other (specify)………………….…………
H.10 For how far do you have to walk from your home to sell your dairy products?
...............walking hours.
H.11 At which season do you mostly sell your dairy products?..................................
H.12 What are the major livestock and livestock products marketing constraints you have
observed? …………………………………………………………………………………………
Thank the interviewee very much for his/her time and useful information.
Copyright © 2022 FDOKUMEN