Coffee Markets, Smallholder Credit, and Landscape Change ...
Upload
khangminh22Category
view
1download
0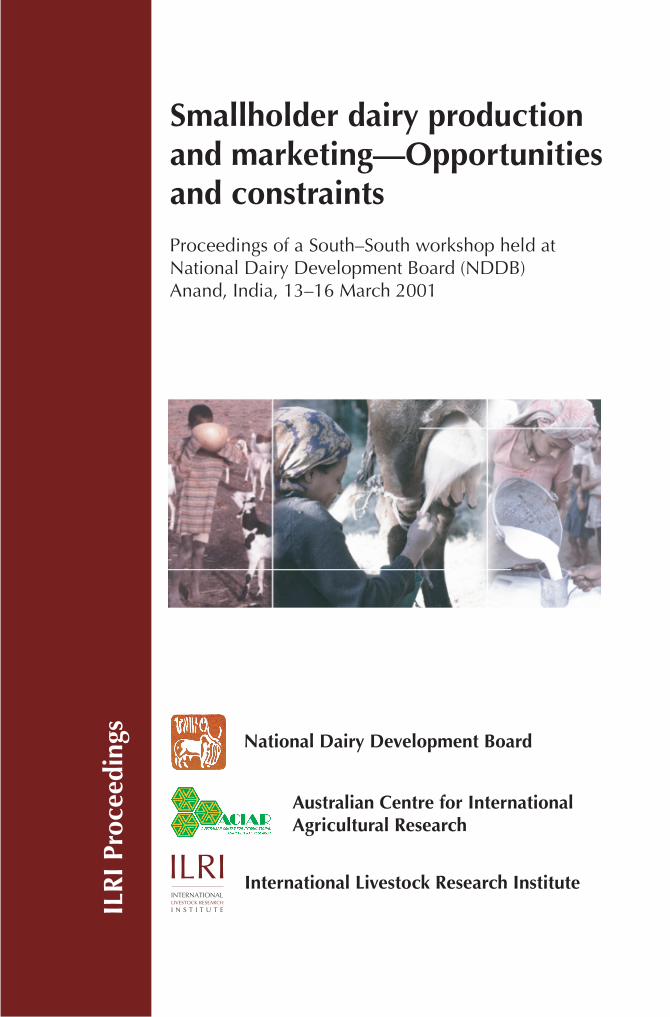
Smallholder dairy production �and marketing—Opportunities and constraints
ILR
I Pr
ocee
ding
s
Proceedings of a South–South workshop held at�National Dairy Development Board (NDDB)�Anand, India, 13–16 March 2001
International Livestock Research Institute
Australian Centre for International�Agricultural Research
National Dairy Development Board

Smallholder dairy production �and marketing—Opportunities and constraints
Proceedings of a South–South workshop held at �National Dairy Development Board (NDDB)�Anand, India, 13–16 March 2001
International Livestock Research Institute�P.O. Box 30709, Nairobi, Kenya
Australian Centre for International�Agricultural Research�P.O. Box 1571, Canberra ACT 2601, Australia
National Dairy Development Board�P.O. Box 40, Anand-388 001, Gujarat, India
D. Rangnekar and W. Thorpe
editors
Table of ContentsAcknowlegements . . . . . . . . . . . . . . . . . . . . . . . . . . . . . . . . . . . . . . . . . . . . . . . . . . . . . . vi
Background and rationale for South–South workshops—an introduction to the workshop
on smallholder dairy production and marketing—Constraints and opportunities . . . . . . vii
Welcoming address . . . . . . . . . . . . . . . . . . . . . . . . . . . . . . . . . . . . . . . . . . . . . . . . . . . . viii
A. Patel
Opening address . . . . . . . . . . . . . . . . . . . . . . . . . . . . . . . . . . . . . . . . . . . . . . . . . . . . . . xiii
D. Taylor
Executive summary . . . . . . . . . . . . . . . . . . . . . . . . . . . . . . . . . . . . . . . . . . . . . . . . . . . . . . 1
Theme 1: Country and regional overviews
Smallholder dairy production and marketing in Bangladesh. . . . . . . . . . . . . . . . . . . . . . . 7
M. Saadulah
The current status of smallholder dairy systems in Sri Lanka . . . . . . . . . . . . . . . . . . . . . . 22
B.H.W.M.U.S. Bandara
An overview of smallholder dairy production and marketing in Nepal . . . . . . . . . . . . . . 33
D.D. Joshi and K.C. Tarak Bahadur
Pakistan smallholder dairy production and marketing . . . . . . . . . . . . . . . . . . . . . . . . . . 47
R.H. Raja
Smallholder dairy production and marketing in India: Constraints
and opportunities . . . . . . . . . . . . . . . . . . . . . . . . . . . . . . . . . . . . . . . . . . . . . . . . . . . . . . 65
M.P.G. Kurup
Problems and prospects of smallholder dairy production
and marketing in South Asia: An overview . . . . . . . . . . . . . . . . . . . . . . . . . . . . . . . . . . 88
K. Singh and R.S. Pundir
Dairy development in Thailand and a case study on environmental
impacts of peri-urban dairy colonies. Part I. Smallholder dairy development . . . . . . . . . 105
C. Chantalakhana and P. Skunmun
Current situation and prospect for dairy production in China . . . . . . . . . . . . . . . . . . . 116
J.X. Liu, Y.M. Wu and Z.E. Zhou
The smallholder dairy production and marketing systems in Vietnam . . . . . . . . . . . . . 130
N.Q. Suc and D.V. Binh
Smallholder dairy production systems in East and South-East Asia: Expanding
importance, environmental impacts and opportunities for improvements . . . . . . . . 141
C. Devendra
Smallholder dairy production and marketing in Kenya . . . . . . . . . . . . . . . . . . . . . . . . 160
H.G. Muriuki
An overview of dairy development in Tanzania . . . . . . . . . . . . . . . . . . . . . . . . . . . . . . . 174
L.R. Kurwijila
Smallholder dairy production and marketing in eastern and southern Africa:
Regional synthesis . . . . . . . . . . . . . . . . . . . . . . . . . . . . . . . . . . . . . . . . . . . . . . . . . . . . 185
H.G. Muriuki and W. Thorpe
South–South Workshop iii
Smallholder dairy production and marketing constraints in Nigeria . . . . . . . . . . . . . . . 201
M.L. Yahuza
Smallholder dairy production and marketing in Ghana . . . . . . . . . . . . . . . . . . . . . . . . 215
E.O. Otchere and S.A. Okantah
Theme 1: Country papers and regional overviews . . . . . . . . . . . . . . . . . . . . . . . . . . . . . 225
Theme 2: Implications of international trade regulationsfor smallholder dairy production and marketing
Implications of international trade regulations (World Trade Organization
Agreement on Agriculture and Codex Standards) for smallholder
dairy development . . . . . . . . . . . . . . . . . . . . . . . . . . . . . . . . . . . . . . . . . . . . . . . . . . . . 231
V.P. Sharma
The competitiveness of smallholder dairy production: Evidence from
sub-Saharan Africa, Asia and Latin America . . . . . . . . . . . . . . . . . . . . . . . . . . . . . . . . . 250
S.J. Staal
Theme 2: Implications of international trade regulations
for smallholder dairy production and marketing . . . . . . . . . . . . . . . . . . . . . . . . . . . . . 265
Theme 3: National dairy policies (including policies related to research,extension, development and training) for smallholder production andmarketing
National policies supporting smallholder dairy production and marketing:
India case study . . . . . . . . . . . . . . . . . . . . . . . . . . . . . . . . . . . . . . . . . . . . . . . . . . . . . . . 271
S. Parthasarathy
A case study on environmental impacts of peri-urban dairy colonies
in Thailand: Environmental impacts of old and new dairy farms . . . . . . . . . . . . . . . . . . 282
P. Skunmun and C. Chantalakhana
Evolution of dairy policies for smallholder production and marketing
in Tanzania . . . . . . . . . . . . . . . . . . . . . . . . . . . . . . . . . . . . . . . . . . . . . . . . . . . . . . . . . . 298
L.R. Kurwijila
Theme 3: National dairy policies (including policies for related research,
extension, development and training) for smallholder production
and marketing. . . . . . . . . . . . . . . . . . . . . . . . . . . . . . . . . . . . . . . . . . . . . . . . . . . . . . . . 320
Theme 4: Institutional structures to sustain smallholder dairy marketing
Small-scale processing and marketing in Bangladesh including reference
to micro-credit facilities (good market access)—Milk Vita: A case study. . . . . . . . . . . . . . 327
G.C. Saha and S.A.M.A. Haque
Institutional structure to sustain smallholder dairy marketing—The Amul model . . . . . . 342
B.M. Vyas
Small-scale milk marketing and processing in Ethiopia . . . . . . . . . . . . . . . . . . . . . . . . . 352
Tsehay Redda
iv South–South Workshop
Impacts of liberalisation in Kenya’s dairy sector. . . . . . . . . . . . . . . . . . . . . . . . . . . . . . . 368
J. Omiti
Institutional structure to sustain smallholder dairy production
and marketing in China . . . . . . . . . . . . . . . . . . . . . . . . . . . . . . . . . . . . . . . . . . . . . . . . 380
J.X. Liu and Z.E. Zhou
Theme 4: Institutional structures to sustain smallholder dairy marketing . . . . . . . . . . . 388
Theme 5: Effective and efficient livestock services for smallholderdairy production
Package of improved livestock services through co-operatives: A case study
of the Mehsana District Milk Producers’ Union Ltd., Gujarat, India . . . . . . . . . . . . . . . 393
M.P.G. Kurup
Contributions of Heifer Project International (HPI) to small-scale
dairy development in Cameroon . . . . . . . . . . . . . . . . . . . . . . . . . . . . . . . . . . . . . . . . . 414
R.M. Njwe, L.N. Kwinji, A.L. Gabche and E.N. Tambi
Impact of integrated dairy and crop production technologies
on smallholder dairy production in Haryana, India . . . . . . . . . . . . . . . . . . . . . . . . . . . 431
B.N. Mathur and R.V. Singh
Decentralisation of services in Uganda: The formation
of National Agricultural Advisory Services (NAADS) . . . . . . . . . . . . . . . . . . . . . . . . . . 445
S.N. Nahdy (author not presenter)
Theme 5: Effective and efficient livestock services for smallholder dairy
production . . . . . . . . . . . . . . . . . . . . . . . . . . . . . . . . . . . . . . . . . . . . . . . . . . . . . . . . . . 464
Theme 6: Making the research and extension paradigm responsiveto farmer needs
Forage legume technologies: Participatory experiences with farmers
and community -based organisations in Central Kenya . . . . . . . . . . . . . . . . . . . . . . . . . 469
D.M. Mwangi and C Wambugu
A case study on adoption of urea molasses mineral blocks . . . . . . . . . . . . . . . . . . . . . . . 484
I. Patel
Farmers’ perceptions of service delivery and policy support
from smallholder dairy in Nepal: Nepal case study. . . . . . . . . . . . . . . . . . . . . . . . . . . . . 499
D.D. Joshi
Participatory research and extension for dairy technology
development and transfer in Vietnam: A case study. . . . . . . . . . . . . . . . . . . . . . . . . . . . 508
D.D. Vu and D.V. Cai
Theme 6: Making the research and extension paradigm responsive
to farmers’ needs . . . . . . . . . . . . . . . . . . . . . . . . . . . . . . . . . . . . . . . . . . . . . . . . . . . . . . 514
Recommendations of the workshop . . . . . . . . . . . . . . . . . . . . . . . . . . . . . . . . . . . . . . . 518
List of participants . . . . . . . . . . . . . . . . . . . . . . . . . . . . . . . . . . . . . . . . . . . . . . . . . . . . 521
South–South Workshop v
AcknowledgementsThe workshop organisers wish to thank Dr Amrita Patel (Chairman, National Dairy
Development Board, NDDB), Mr Deepak Tikku (Managing Director, NDDB), Dr Hank
Fitzhugh (Director General, International Livestock Research Institute, ILRI) and Dr
David Taylor (Deputy Director General, ILRI) for their strong support and encouragement
during the planning and implementation of the workshop.
The organisers and participants are grateful for the financial support provided by
NDDB and the Australian Centre for International Agricultural Research (ACIAR) which
made the workshop possible. ILRI also acknowledges the financial support of all its
investors, particularly those providing unrestricted support which contributed to the
preparation of the workshop and these proceedings.
Workshop organisers:
Dr A.K. Joseph (NDDB); Dr Datta Ranganekar (NDDB); Dr N.V. Belavadi (NDDB); Dr
B.K. Patnaik (NDDB); Dr H.A. Nadiadwala (NDDB); Dr William Thorpe (ILRI) and Dr
Michael Smalley (ILRI)
Language editors:
M. Smalley, A.M. Nyamu, Mulugeta Bayeh, Tesfaye Jemaneh, Mezgebu Abegaz, A.S. Ngu
and B. Waites
vi South–South Workshop
Background and rationale for South–Southworkshops—an introduction to theworkshop on smallholder dairy productionand marketing—Constraints andopportunitiesMany national, regional and international organisations are working in partnerships using
development-oriented livestock research to achieve sustainable improvements to the
livelihoods of resource poor livestock keepers in developing countries, to make animal
products more affordable and accessible for the poor, and to conserve natural resources in
developing countries.
Many of these key partners are from developing countries—the ‘South’. Despite the
importance of livestock research for national economic and social development, and the
scarcity of national and regional resources to implement research and development
(R&D), many institutes and countries research the same constraints and issues without
learning what has been done by others—what has worked and why, and what has not
worked and why. And without agreeing procedures that will permit comparisons and the
exchange of information across regions.
Whilst there are some opportunities for national scientists, development specialists
and policy makers to meet and discuss within countries, there are few opportunities for
people to meet within regions and even fewer opportunities for colleagues from different
regions to meet and share experiences. Discussions and exchanges of ideas across regions
that share common R&D opportunities are particularly important because they encourage
wider learning from what has been done, and encourage new partnerships between those
working on shared problems.
The International Livestock Research Institute (ILRI) is working with others to
organise a series of South–South workshops which will provide a setting and programme
that encourages participants to share experiences, both successful and unsuccessful, that
have addressed common technical and policy constraints, and on the methodologies and
tools that were developed and tested while acquiring those experiences.
The workshops are expected to result in agreement on shared policy, R&D issues for
the next 5–10 years, identify opportunities for new joint R&D project activities, and help
ILRI develop its own research agenda and partnerships.
The first South–South workshop, on ‘Smallholder dairy production and
marketing—Constraints and opportunities’, was jointly organised by ILRI and the National
Dairy Development Board (NDDB) of India, with financial support from NDDB and the
Australian Centre for International Agricultural Research (ACIAR). The workshop was
held in Anand, headquarters of NDDB, from 13th to 16th March 2001.
South–South Workshop vii
Welcoming addressA. PatelChairman, NDDB
It is indeed a privilege to welcome all participants to this workshop. This is a moment that
those involved in the preparations have been looking forward to for close to two years and
we are particularly pleased that there are colleagues from so many countries in Africa and
Asia participating in this South–South workshop, and whose papers will form such an
important part of the workshop over the next three days.
May I particularly welcome you to Anand and to the institutions that make this small
town such an important part of dairying in India. We are fortunate to be able to use the
facilities of the Institute of Rural Management. The Institute was promoted by the National
Dairy Development Board (NDDB) of India to prepare managers to serve smallholder
enterprises. Every year 60 or more young women and men graduate with postgraduate
diplomas in rural management and a number of them go on to serve in rural institutions.
It was the success of the Kaira District Co-operative Union, popularly known as Amul,
that has inspired the co-operative dairy programme in India over the last five decades. It has
also led to the creation of organisations like the Gujarat Co-operative Milk Marketing
Federation Ltd, which is responsible for marketing the products of all the co-operative’s
dairies in this particular state. The Tribhuvandas Foundation, which is Asia’s largest NGO,
works in over 600 villages in the State in the field of maternal and infant care. What is
unique about the programme of the Foundation is that it rides on the back of milk. It is the
village milk co-operative that appoints a village health worker and pays an honorarium to
the village health worker to undertake the work. So it is milk paying for health. We hope
you will share our belief that smallholder dairying can transform the lives of millions of
people. Most of the co-operatives, health care and education in this area of Gujarat result
from smallholder dairy farmers joining together to create resources, not only benefiting
themselves but also creating a better community for all.
It is what has happened in Kaira District, and today throughout India, that convinces us
that smallholder dairying holds enormous untapped potential to benefit tens of millions of
families not only in our country but also throughout the South. Dairying in India and, we
understand, in other parts of Asia and Africa, is predominantly an occupation of the small
farmer. Seventy-five per cent of the close to 10 million dairy co-operative members in India
are small, marginal and even landless producers. For these members dairying has provided
employment, generated incomes and opened the doors to a better life.
We are particularly anxious that more and more women associate themselves with
co-operatives, not just as members, but also willing to take a role in governance. Through
participation and thrift groups promoted by the dairy co-operatives women are already
taking steps on the road towards empowerment. More and more girls are being educated in
villages with milk co-operatives.
viii South–South Workshop

When this workshop was first proposed, the NDDB was happy to support it. Just as we
believe that smallholder dairying offers millions a road to a better life, so also do we
recognise that this road is not a smooth one. It is in fact filled with obstacles that must be
overcome if the potential of smallholder dairying is to be fulfilled. I hope this workshop
will focus our collective attention on a wide variety of experiences with smallholder
dairying: the obstacles that have been faced, and the ways in which they have been
addressed and overcome.
We must also draw on our experiences to develop an agenda for the future. Our hope is
that there will be some very important outcomes from our discussions over the next three
days. First, we will all learn from each other and, I trust, be inspired by what has been
achieved in different parts of Asia and Africa. Second, we will draw attention to priority
areas of research. Let me stress that by research NDDB means far more than breeding,
feeding and the management of animals. Rather we include the process of adoption of
innovations; the economics of smallholder dairying; the implications of international trade
regimes; and, most importantly, the development of institutions and structures outside
government to effectively serve smallholder milk producers.
The real challenge we need to address over the next three days is the approach to
sustainable dairy development recognising that fundamental to all our planning and
programme implementation are the limited natural resources that are available, and that
the most important, water, is in serious jeopardy in almost every country.
May I now speak briefly about NDDB and our support to this workshop. As I
mentioned, the success of the Kaira District Union inspired the development of
smallholder dairying in India. The vehicle for that development was the National Dairy
Development Board, a creature of government founded in 1965 and which, over the last 36
years, has worked to promote, finance and support dairy co-operatives throughout India.
During that time, we have gained considerable experience in applied dairy science, in the
design, construction, operation and maintenance of dairy plants, in animal feed and
nutrition, and in the marketing of milk and milk products. We are proud of what we have
achieved and prouder still of India’s milk producers for what they have achieved. Yet we
realise that although much has been done it is just one step on a very long journey.
Regrettably, far too often the results of good research seem to fail to reach the large
numbers of milk producers who might benefit. Poorly focused research also takes place
because a scientist pursues her or his own interest rather than learning from the milk
producers what they need. Products are developed which the market rejects while there may
well be demands that we fail to recognise. It is of the utmost importance that we find ways to
link scientists and technologists with the farmers and the consumers to ensure that the
powerful tools of science and technology produce the greatest benefits for the greatest
numbers. This is not to discount the rights and responsibilities of scientists to pursue their
own directions and ideas. Some of the greatest contributions to mankind have come from
such lonely and even courageous efforts, but at the same time we must recognise that tens
and even hundreds of millions of rural families live at the edge of hunger and endless
privation. Our first responsibility as an educated elite is to help them become productive
and find the means to a better life.
South–South Workshop ix
Welcoming address

This, I hope, will be the underlying theme of the workshop deliberations. The workshop
has brought together a wealth and wide diversity of experience in smallholder dairying. We,
at NDDB, are excited by the opportunity the workshop presents for us. We will be listening
and learning from all of you. Your experiences, and the challenges you have faced and
overcome will provide us with insights and new ways of looking at old problems, not to
mention alerting us to new challenges and opportunities. I know our colleagues from ILRI
are equally excited to have the opportunity to listen to and learn from scientists and policy
makers from so many nations.
If I may, I would like to mention a subject which greatly concerns NDDB. The subject
that concerns me, that concerns all dairymen in India is the evolution of the rules of
international trade. We are concerned that the way these rules are developing poses a
serious threat to smallholder dairying. If dairying did not offer such an important vehicle for
equitable economic growth we would not be so apprehensive. But we remain convinced that
dairying can and should benefit rural people throughout the South and that unless we all
speak more forcefully and with a single voice the tremendous potential that exists may be
extinguished before its impact is even visible.
As some of you may know India’s dairy development was implemented through a
programme called Operation Flood, a programme that extended over 25 years and which
used donated dairy commodities to build markets and to generate the resources needed to
promote co-operatives, to provide inputs and services to farmers to build dairy plants, and to
carry out supporting research. The policies of our government gave a preferred role to dairy
co-operatives along with the substantial responsibilities for the delivery of services. They also
importantly protected India’s young dairy industries from external competition.
Commodity imports were channelled through the Dairy Board. These imports were sold at
prices comparable to farm-gate milk prices, and not used to subsidise our urban consumers.
As a consequence we were able to develop dairying to the point where we, along with New
Zealand, enjoy a comparative price advantage.
For today’s economists and free marketeers, these policies are not acceptable. Yet we
have to recognise that these very policies transformed unemployment in our country into
employment, and provided incomes for millions of our rural producers.
Today the World Trade Organization would prefer never to see another Operation
Flood with its limit on imports. In fact, probably every country represented at this
workshop has agreed to allow free trade in milk and milk products and probably most
countries represented in the workshop have low tariffs on dairy commodities, far lower
than in the European Union and North America. That is despite the fact that none of the
countries represented at this workshop can afford to subsidise milk production and dairy
commodity exports to the massive extent done in Europe and North America. And while
the Uruguay Round did result in agreements to reduce such subsidies the effect was
tokenism and not substantive.
However, not satisfied with these comparative advantages, the effort is now to use
international bodies such as Codex to legitimise non-tariff barriers that would otherwise be
unsustainable. I will not go into the details of these various attempts to skew international
trade in favour of the North because there is a session devoted to this, but NDDB asks that if
you are seriously committed to smallholder dairying you carefully study the potential
x South–South Workshop
Patel

destructive force that the international trade regime can unleash against your efforts, and
that you prevail upon your governments to be watchful.
Today, as we begin this workshop, participants come from many different countries,
each with a different perspective. By and large, there have been few if any similar
opportunities for such a meeting in the past. If we simply exchange ideas, build relationships
and identify a research agenda we will no doubt have served an important purpose. I hope,
however, there will be one more outcome, possibly even more significant in the long term. It
is my hope that this South–South workshop will find more common themes, common
purposes and common goals than we find differences. It is my hope that these will become
the foundation for a whole new dream. A dream of what dairying can do to improve the lives
of millions throughout the South and, because a dream is not enough, I hope we will begin
to take the first steps to work together, to think together and to speak together as a voice for
smallholder dairying throughout the South. It is only such a voice, the voice of all of us that
will slow what will otherwise be inexorable progress toward total domination of dairying by
the North.
Let me then close with a thought, that this meeting can be the moment when
smallholder dairying emerged from the background and began to achieve its potential
throughout the South. Those of us gathered here can create the force and momentum for
this to happen.
Let us seek, therefore, to find our common voice for the good of our smallholder
brothers and sisters throughout the world.
Thank you.
South–South Workshop xi
Welcoming address
Opening addressD. TaylorDDG(P), ILRI
Thank you Dr Patel. It is my privilege to respond to your very warm introduction. I will start
on behalf of all the participants by thanking you and your colleagues in NDDB (National
Dairy Development Board, India) for the hospitality and the warm welcome you have
shown all of us.
As we have heard, this meeting is going to be a model for future interactions. But we
cannot organise these important events without financial support so immediately I
recognise the financial support from NDDB and from ACIAR (Australian Centre for
International Agricultural Research) and thank both for their support; we also appreciate
the participation of Dr Bill Winter from ACIAR.
This is the first of a number of South–South workshops that ILRI will plan and
implement with partners. Because of the way ILRI is evolving this type of workshop will
become more important in the future. As Dr Patel pointed out, all of us must interact with
and learn from our end users, including dairy producers and consumers. This is just as
important to ILRI as is our interaction with our partners at the high technology, high
science end of ILRI’s work. Increasingly ILRI will place emphasis on what the farmers say to
us and what they want. ILRI will be developing a research programme and activities with
that goal in mind. We will, I hope, be acting as a conduit between the smallholder and
advanced research institutions wherever they may be, be it in Oxford or Cambridge in UK,
Harvard in USA or Hyderabad in India. So ILRI’s role will include being a facilitator. The
facilitation may include only a minor role for ILRI but nonetheless we hope we will be an
important and a friendly partner. ILRI is a research institute, but one that uses research for
sustainable development.
ILRI comes to this South–South workshop to learn about the experiences of colleagues
in India, and from the other countries in Asia and in Africa represented in the workshop so
that we can bring these lessons to bear on our evolving research agenda on the constraints
to sustainable smallholder dairying in the countries of the South. We also want to reinforce
our partnerships, and form new ones, for the design and implementation of our work. The
smallholder dairy subsectors of developing countries are an important component of
ILRI’s agenda.
Dr Patel used the phrase ‘milk paying for health’. This is a very important strategy. We
cannot underestimate the value of milk in the early protein nutrition for young children.
The consumption of milk by young children provides good nutrition and resistance against
disease, and it also supports the development of the child’s cognitive responses. This is
something that has been ignored for many years but today it is absolutely clear that there are
certain micronutrients essential for the full development of cognitive abilities which are
South–South Workshop xiii
best obtained from animal products, including milk. And the full development of these
cognitive skills is one more factor which will allow individuals to climb out of poverty.
ILRI anticipates that the discussions over the next three or four days will be marked by
the exchange of information and experiences across the regions of Asia and Africa and that
the resulting information will allow us to better fulfil our mandate.
ILRI agrees with NDDB that research for the development of smallholder dairying must
look very carefully at all the issues, including the technologies and policies needed to allow
smallholder farmers to get their product to market and build their assets.
ILRI also agrees with Dr Patel in wanting this workshop to produce a clear agenda of
priority issues. This is important for ILRI because on the basis of those priorities both ILRI
and its partners in this research will identify and build its research agenda for the benefit of
smallholders, and see where there are the best practices and where we can learn from other
institutions. This workshop is also important because it will provide ILRI with an
opportunity to strengthen our partnerships.
Dr Patel described the challenges from the evolving rules for international trade being
promoted by the World Trade Organization. I know it is a concern to our colleagues in
sub-Saharan Africa and South-East Asia. ILRI is not a political organisation, but it is an
organisation involved with policy research. It is not for ILRI to dictate a research or
development agenda to any nation, but ILRI can facilitate discussions and the gathering and
interpretation of information. ILRI facilitates and implements research on controversial
and difficult issues, like world trade and smallholder dairying, to provide data and
information for others, including our partners, to use and reach their decisions on policies
and best practices. ILRI must be in a situation where it provides accurate information for
national policy and decision makers to allow them develop their own policies.
Once again, thank you Dr Patel for your opening remarks and thanks to the organisers
of this meeting for bringing us together and arranging a programme which will encourage
the exchange of information and experiences across country and regional boundaries for
the benefit of smallholder diary producers.
Taylor
xiv South–South Workshop
Executive summaryIdentifying the major issues affecting dairy’s contribution to the improvement of the
livelihoods of the poor in countries of the South is a major challenge faced by many
governments and development agencies. To contribute to meeting that challenge, India’s
National Dairy Development Board (NDDB) and the International Livestock Research
Institute (ILRI), co-sponsored by the Australian Centre for International Agricultural
Research (ACIAR), hosted a South–South workshop on smallholder dairy production and
marketing—Constraints and opportunities in March 2001. The workshop was held at
NDDB’s headquarters in Anand, India.
Participants were drawn from countries in sub-Saharan Africa (SSA) and Asia; their
backgrounds reflected the contrasting dairy development scenarios seen in SSA and Asia.
They were joined by representatives from ACIAR, ILRI, NDDB and Switzerland.
The workshop objectives were to:
• Facilitate information exchange and discussion amongst smallholder dairy research
scientists and development specialists from Asia and sub-Saharan Africa
• Share the successful and unsuccessful experiences gained from addressing constraints
(including policy and institutional issues) to, and opportunities for, smallholder dairy
production, processing and marketing
• Describe the methodologies and tools that were developed and tested
• Agree on the major research and development (R&D) issues (including those related to
policies and institutions) for the next 5–10 years and
• Identify opportunities for new partnerships for R&D activities to address the agreed
issues.
The workshop was structured around six themes within which invited papers were
presented. The papers were followed by plenary and group discussions.
The themes were:
1. Regional and country overviews
2. International trade regulations
3. National dairy policies
4. Market institutions
5. Livestock services and
6. The research and extension paradigm.
Papers were contributed from 16 countries: West and Central Africa: Cameroon,
Ghana, Nigeria; Eastern and Southern Africa: Ethiopia, Kenya, Tanzania, Uganda; South
Asia: Bangladesh, India, Nepal, Pakistan, Sri Lanka; and South-East and East Asia: China,
Malaysia, Thailand, Vietnam.
The papers and the extensive discussion that focused on the six workshop themes
demonstrated:
South–South Workshop 1
• the commonality of many of the issues related to smallholder dairy production and
marketing in the countries of the South
• the richness of the experiences in the South applicable to the improvement of the
livelihoods of the landless, the marginalised and smallholders through dairy
• the key role that market-orientation and participatory approaches play in fostering
effective efforts in support of dairy development
• the large benefits, actual and potential, of exchanging experiences amongst the
countries of the South
• the importance of taking advantage of the new generation of information technologies
to ensure more effective exchange of information within the South and
• the willingness and enthusiasm of the participants to work together to plan the agreed
actions and to mobilise the resources required for their implementation.
The following four major R&D issues related to the development of smallholder
dairying and its competitiveness in countries of the South were identified for follow-up.
South–South information exchange andnetworkingThe need for continued sharing of information, experiences and research findings with
emphasis on networking among the countries of the South was considered very important.
ILRI (www.cgiar.org/ilri), offered to assist in establishing a network through exploring
opportunities with FAO (www.fao.org). Participants agreed that the need for information
exchange and networking was particularly relevant for issues related to:
• Collective-action groups: The collective action of smallholders (such as that practised in
the Anand model in India) was seen by workshop participants as an important
mechanism for successful dairy development. Information exchange on the strengths
and weaknesses of the approach was needed with emphasis on identifying the principles
and best practices that determine the successful adoption and adaptation of the
approach (see below).
• Participatory research and extension: The lessons from participatory research and
extension approaches and methodologies presented to the workshop particularly
interested the participants. They wanted more information about and contact with
programmes in developing countries practicing participatory approaches to the
development, testing and transfer of productivity-enhancing technologies. The
workshop participants were particularly interested in testing the approaches, methods
and tools to crop–dairy systems and to improving integrated nutrient management.
It was suggested that links were established with the CGIAR’s System-wide Program on
Participatory Research and Gender Analysis (PRGA) led by Centro Internacional de
Agricultura Tropical (CIAT). The PRGA website (www.prgaprogram.org/prga/)
provides access to information on participatory research and extension approaches,
2 South–South Workshop
Executive summary
methodologies and tools, and to current examples of their application to
livestock-related constraints and opportunities.
• Milk marketing research: The over-riding importance to smallholder dairy
development of effective milk collection and marketing strategies was highlighted in
the workshop presentations and in the discussion sessions. Information exchange
and networking on the lessons learnt on appropriate marketing strategies was
therefore a key topic to be addressed through the continuing interactions amongst the
countries of the South.
• Policy research: In the same way, the workshop participants agreed the importance of
sharing the lessons learnt from policy studies as related to dairy development, role of
governments etc. Participants stressed the need for exchanging information on
approaches and methods for carrying out policy research, for the presentation of the
research outcomes to policy makers and their advisers and for advocating policy reforms
related to smallholder dairy production and marketing.
Championing the collective action (co-operative)approachAs mentioned above, an important conclusion of the workshop was that the time-tested
Anand model of dairy co-operatives, with changes as may be necessary to suit local
environments, was a good model for smallholder dairy development in countries of the
South. NDDB (www.nddb.org) agreed to play the lead role in information dissemination
and supporting the development of farmer organisations.
Enhancing the understanding of WTO regulations andtheir implications for smallholder dairy developmentThe representatives from most of the participating countries wanted to be kept well
informed and updated on a continuing basis of the implications for smallholder dairy
production and marketing of the World Trade Organization (WTO) regulations. The
Institute of Rural Management (www.irm.ernet.in), Anand, (IRMA) and NDDB offered to
provide a forum for articulating the issues affecting smallholder dairy development in
countries of the South and to help draw up plans of action.
Improving research and extension (R&E) systems toserve smallholder dairyingA major issue highlighted by the workshop participants was the need for more effective
R&E systems, including the delivery of livestock services (e.g. veterinary and artificial
South–South Workshop 3
Executive summary

insemination; AI), to support smallholder dairy development. It was proposed that one way
forward was to study and understand the successes and failures of the different approaches
tried in various countries and to share those lessons through the proposed South–South
information exchange and networking (see above). It was agreed that NDDB and IRMA
would collate information from South Asia, while ILRI (subject to funding) would mount a
parallel effort in sub-Saharan Africa.
The details of the issues, concerns and opportunities discussed by participants for each
theme are reported in the following pages of the proceedings:
Theme 1. Regional and country overviews, pages 7–228
Theme 2. International trade regulations, pages 231–268
Theme 3. National dairy policies, pages 271–323
Theme 4. Market institutions, pages 327–390
Theme 5. Livestock services, pages 393–466
Theme 6. The research and extension paradigm, pages 469–517
The recommendations of the workshop are reported on pages 518 to 520.
Finally, it was agreed that the proceedings of the workshop would be produced in three
formats: a conventional book; a multi-layered CD with linkages to resource materials on
the workshop themes and on the major R&D issues identified by the participants; and, in
electronic form on the NDDB (www.nddb.org), ILRI (www.cgiar.org/ilri) and related
websites.
4 South–South Workshop
Executive summary

Theme 1: Country andregional overviews
Smallholder dairy production andmarketing in BangladeshM. SaadullahDepartment of Animal Science, Bangladesh Agricultural University,Mymensingh, BangladeshE-mail: [email protected]
IntroductionDairying is nearly always a part of mixed farming systems in Bangladesh. It has a direct
impact on income generation, poverty alleviation and availability of animal protein.
Quantification of the contribution of livestock, including poultry, shows that dairying is the
predominant source of income generation (Miyan 1996). Although the supply of
domestically produced animal products (milk, meat and eggs) has increased by about 1.2%
annually (DLS 2000), the per capita daily availability of milk and meat is only 32.6 ml and
10.2 g against the requirement of 250 ml and 120 g, respectively. Consequently, consumers
face an acute shortage of livestock products like milk, meat and eggs for which supply fails to
meet the requirements of 85, 89 and 75% of the population, respectively. The major
constraints to dairy cattle production are the shortages of quality feeds and fodder, the
breeds of cattle, poor management practices, limited access to veterinary care and
disorganised marketing systems. In addition, there is a lack of institutional support,
research and training, which would be beneficial to the farming environment.
Livestock populationPopulation: Presently, there are about 23.4 million cattle, 0.82 million buffalo, 33.5 million
goats, 1.11 million sheep, 138.2 million chickens and 13.0 million ducks (DLS 2000). It has
been reported by the Bangladesh Bureau of Statistics (BBS 1999), that 52.0% of male cattle,
62.3% of female cattle and 60.9% of cattle <3 years old are raised by small- and
medium-sized farms.
Farm characteristics
Types of farm householdFigure 1 shows data from the national census of agriculture in which households are
classified by size of landholding. Data indicate that 79.9% of households are small-scale
South–South Workshop 7
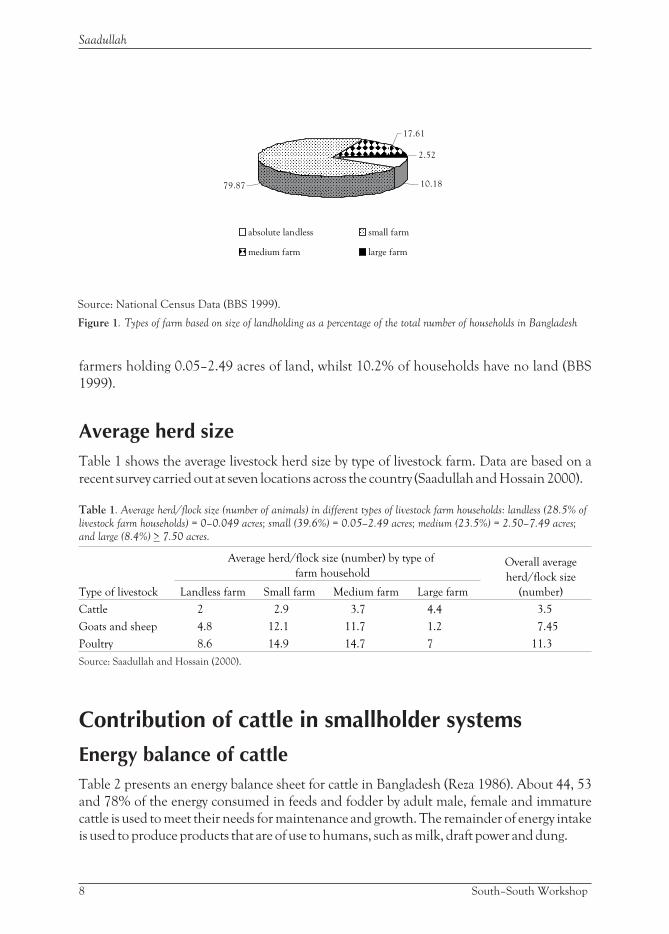
farmers holding 0.05–2.49 acres of land, whilst 10.2% of households have no land (BBS
1999).
Average herd sizeTable 1 shows the average livestock herd size by type of livestock farm. Data are based on a
recent survey carried out at seven locations across the country (Saadullah and Hossain 2000).
Table 1. Average herd/flock size (number of animals) in different types of livestock farm households: landless (28.5% of
livestock farm households) = 0–0.049 acres; small (39.6%) = 0.05–2.49 acres; medium (23.5%) = 2.50–7.49 acres;
and large (8.4%) > 7.50 acres.
Type of livestock
Average herd/flock size (number) by type of
farm householdOverall average
herd/flock size
(number)Landless farm Small farm Medium farm Large farm
Cattle 2 2.9 3.7 4.4 3.5
Goats and sheep 4.8 12.1 11.7 1.2 7.45
Poultry 8.6 14.9 14.7 7 11.3
Source: Saadullah and Hossain (2000).
Contribution of cattle in smallholder systems
Energy balance of cattleTable 2 presents an energy balance sheet for cattle in Bangladesh (Reza 1986). About 44, 53
and 78% of the energy consumed in feeds and fodder by adult male, female and immature
cattle is used to meet their needs for maintenance and growth. The remainder of energy intake
is used to produce products that are of use to humans, such as milk, draft power and dung.
8 South–South Workshop
Saadullah
17.61
2.52
79.87 10.18
absolute landless small farm
medium farm large farm
Source: National Census Data (BBS 1999).
Figure 1. Types of farm based on size of landholding as a percentage of the total number of households in Bangladesh

Cows as a source of draft powerIt has been reported that 36% of cows between 3 and 10 years old and 60% of cows >10 years
are used for milk production and draft power (BBS 1986). Saadullah (1995) found that the
work involved in moving draft loads significantly decreased cows’ milk yields; however, the
situation could be improved in terms of milk yield by supplementing improved diet during
work.
Table 2. Energy balance sheet for cattle in Bangladesh.
Energy input
Energy output
Category
of cattle
Amount of energy (kcal/day per animal) % used for self
maintenanceIntake (kcal/day per animal) Work Milk Dung Total
Adult male 9489 602 – 4638 5240 44
Adult female 10,756 545 825 4351 5721 53
Immature 7200 – – 2805 2805 78
Source: Reza (1986).
Cattle as a source of fuel and fertiliserAs an input to cropping systems, manure continues to be an important link between crop
and animal production in Bangladesh. The yearly total cattle manure/dung production in
Bangladesh is estimated to be 80 million tonnes of which 68 and 52% is used as manure in
rural and urban areas, respectively. The use of dung as a household fuel is mostly on small
farms and represents 25% of total production (DLS 2000).
Employment generationThe livestock sector generates 20% of full-time employment in Bangladesh (DLS 2000).
Generation of self-employment and the total income shares of dairy cows and goat raising
tend to increase with a decrease in farmer’s resources, especially land area, suggesting that
animals are of particular importance for landless and small-scale farmers (Alam 1994). The
pattern of utilisation of labour on dairy farms (Alam 1994) is shown in Table 3. Alam (1994)
also reported that, on average, each mini dairy farm created the opportunity for
employment of 1.78 man-days/day. The number of employed labourers was highest with
large farms (2.50 man-days/day) followed by medium (1.65 man-days/day) and small farms
(1.50 man-days/day). On average, each farm employed 1.07 male labourers and 0.71 female
labourers each day. The use of female family labourers was highest (1 labourer/day) in the
case of small farms. Alam (1994) did not interpret his findings in terms of labour used per
livestock unit.
South–South Workshop 9
Smallholder dairy production and marketing in Bangladesh
Table 3. Pattern of utilisation of labour on dairy farms.
Type of
farm
Man-days used/farm family per day Total
(man-days)
Overall total
(man-days)Family labour Casual labour Permanent labour
Male Female Male Female Male Female Male Female Male + female
Large 0.25 – 0.5 – 1.5 0.25 2.25 0.25 2.5
Medium 0.5 0.75 0.4 – – – 0.9 0.75 1.65
Small 0.5 1 – – – – 0.5 1 1.5
Source: Alam (1994).
Dairying as a means of livelihoodRearing of dairy cattle has been increasingly viewed as a means of alleviating poverty in
Bangladesh and is believed to improve the livelihoods of landless and small households.
Many non-governmental organisations (NGOs), such as Proshika Manobik Unnayan
Kendra (PROSHIKA), BRAC (Bangladesh Rural Advancement Committee), Grameen
Bank and Aftab Dairy, are involved in the promotion of micro-credit for small livestock
enterprises including dairy cattle, poultry and goat production. Many smallholders,
particularly in mixed farming systems, prefer the flow products (milk, draft power and
manure) rather than the end products (meat, hides and skins) since selling their animals for
slaughter entails the permanent loss of flow products. Individuals can expand their labour
force by raising cows and processing primary products into marketable secondary products,
such as butter, cheese and yoghurt and by selling manure as fuel and fertiliser. Income from
the sale of these primary and secondary products and by-products can be used to
meet/provide farm household expenses, savings, investments and insurance, and its value
tends to increase over time.
Feeding systemsCattle and buffalo are fed principally on agricultural by-products, such as crop residues.
They are grazed on natural pastures of non-arable land. During the day, they are allowed to
graze on communal grazing land, natural pasture, homestead forest or fallow land.
Sometimes, cows with calves are kept tethered just outside the house. Since no arable land is
available for livestock feed production, non-arable land contributes most of the green
fodder for ruminant animals. Non-arable land outside the farm is usually public wasteland
found around canals, rivers, roadsides and railways. Using shrub and tree leaves, and tender
shoots and twigs as fodder is traditional in the villages. Recently, there has been increasing
recognition of the use of shrub and tree fodder as livestock feed (Saadullah 1989).
10 South–South Workshop
Saadullah
Dairy consumptionMilk production in Bangladesh is reported to have increased from 14.9 thousand tonnes in
the year 1993–94 to 16.2 thousand tonnes in the year 1997–98 (Ahmed 2000). This
increase was due to recent government policy and to NGOs involvement (e.g. subsidies to
establish small dairy farms, soft fund loans from the government as well as NGOs and
improved veterinary health care) in dairy development activities. The same report also
indicated that milk, milk products and meat from cattle contribute 58% of total available
animal protein followed by 28% from poultry meat and eggs, 8% from goats, 5% from
edible meat offal and 5% from sheep and buffalo.
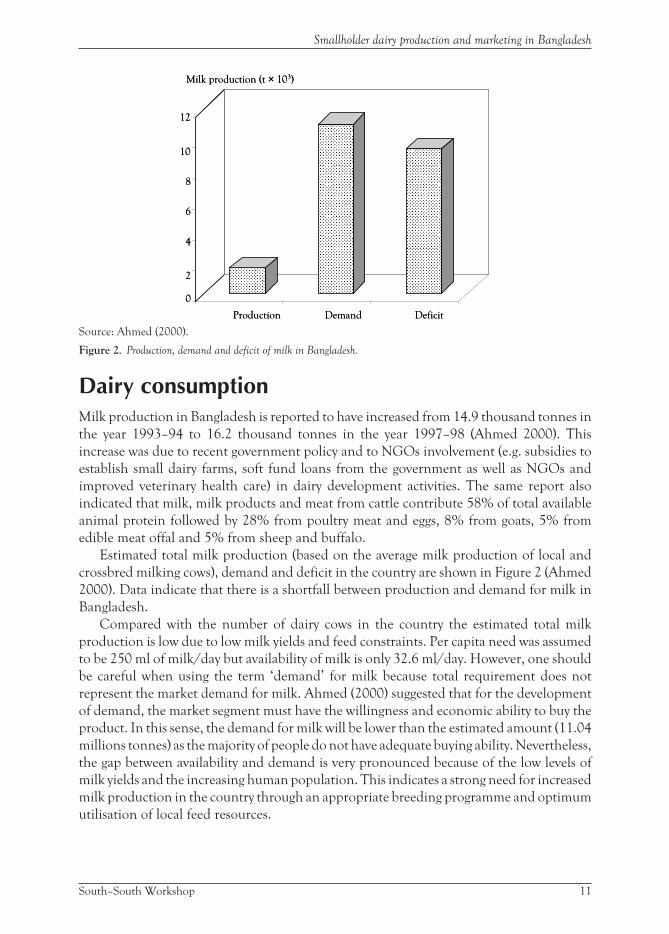
Estimated total milk production (based on the average milk production of local and
crossbred milking cows), demand and deficit in the country are shown in Figure 2 (Ahmed
2000). Data indicate that there is a shortfall between production and demand for milk in
Bangladesh.
Compared with the number of dairy cows in the country the estimated total milk
production is low due to low milk yields and feed constraints. Per capita need was assumed
to be 250 ml of milk/day but availability of milk is only 32.6 ml/day. However, one should
be careful when using the term ‘demand’ for milk because total requirement does not
represent the market demand for milk. Ahmed (2000) suggested that for the development
of demand, the market segment must have the willingness and economic ability to buy the
product. In this sense, the demand for milk will be lower than the estimated amount (11.04
millions tonnes) as the majority of people do not have adequate buying ability. Nevertheless,
the gap between availability and demand is very pronounced because of the low levels of
milk yields and the increasing human population. This indicates a strong need for increased
milk production in the country through an appropriate breeding programme and optimum
utilisation of local feed resources.
South–South Workshop 11
Smallholder dairy production and marketing in Bangladesh
0
2
4
6
8
10
12
Production Demand Deficit
Milk production (t × 103)
0
2
4
6
8
10
12
Production Demand Deficit
Milk production (t × 103)
Source: Ahmed (2000).
Figure 2. Production, demand and deficit of milk in Bangladesh.
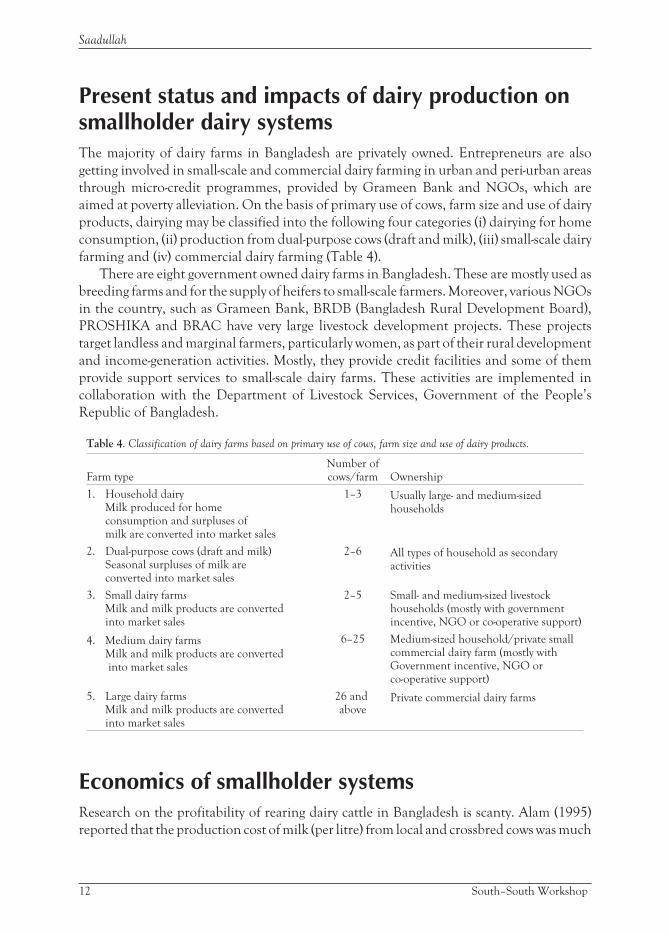
Present status and impacts of dairy production onsmallholder dairy systemsThe majority of dairy farms in Bangladesh are privately owned. Entrepreneurs are also
getting involved in small-scale and commercial dairy farming in urban and peri-urban areas
through micro-credit programmes, provided by Grameen Bank and NGOs, which are
aimed at poverty alleviation. On the basis of primary use of cows, farm size and use of dairy
products, dairying may be classified into the following four categories (i) dairying for home
consumption, (ii) production from dual-purpose cows (draft and milk), (iii) small-scale dairy
farming and (iv) commercial dairy farming (Table 4).
There are eight government owned dairy farms in Bangladesh. These are mostly used as
breeding farms and for the supply of heifers to small-scale farmers. Moreover, various NGOs
in the country, such as Grameen Bank, BRDB (Bangladesh Rural Development Board),
PROSHIKA and BRAC have very large livestock development projects. These projects
target landless and marginal farmers, particularly women, as part of their rural development
and income-generation activities. Mostly, they provide credit facilities and some of them
provide support services to small-scale dairy farms. These activities are implemented in
collaboration with the Department of Livestock Services, Government of the People’s
Republic of Bangladesh.
Table 4. Classification of dairy farms based on primary use of cows, farm size and use of dairy products.
Farm typeNumber ofcows/farm Ownership
1. Household dairyMilk produced for homeconsumption and surpluses ofmilk are converted into market sales
1–3 Usually large- and medium-sizedhouseholds
2. Dual-purpose cows (draft and milk)Seasonal surpluses of milk areconverted into market sales
2–6 All types of household as secondaryactivities
3. Small dairy farms
Milk and milk products are convertedinto market sales
2–5 Small- and medium-sized livestockhouseholds (mostly with governmentincentive, NGO or co-operative support)
4. Medium dairy farmsMilk and milk products are convertedinto market sales
6–25 Medium-sized household/private smallcommercial dairy farm (mostly withGovernment incentive, NGO orco-operative support)
5. Large dairy farmsMilk and milk products are convertedinto market sales
26 andabove
Private commercial dairy farms
Economics of smallholder systemsResearch on the profitability of rearing dairy cattle in Bangladesh is scanty. Alam (1995)
reported that the production cost of milk (per litre) from local and crossbred cows was much
12 South–South Workshop
Saadullah

higher than the selling price. One of the important reasons for loss incurred by farmers in
dairy farming was the low price of milk. Availability of large quantities of low price,
imported powder milk in the local market has contributed significantly to the low price of
milk. As a result, local producers and milk marketing organisations cannot compete with
the milk importers. Another important reason for loss in dairy farming was the low milk
yield per cow (1.5 litres/day for local and 2.5 litres/day for crossbred cows). In contrast,
Kabir and Talukder (1997) reported that dairy farming with both local and crossbred cows
was highly profitable in Bangladesh. The profitability of crossbred cows was, however, much
higher than that of local cows. Based on a three-year sample survey of 19 dairy farms (7 with
local and 12 with crossbred cows) in the Tangail District, Table 5 presents the estimated
gross costs and benefits earned from dairy farming with 10 local or 10 crossbred cows over a
period of three lactations.
The average lactation period and daily milk production of local and crossbred cows were
240 and 284 days and 4.8 and 6.7 litres, respectively. The total costs included feed, labour,
veterinary care, artificial insemination (AI) and miscellaneous costs. The returns included
the value of the milk, dung and calves produced. The financial analysis of Kabir and
Talukder (1997) also revealed that the earning capacity from investment in dairying far
exceeded the opportunity cost of capital in formal capital markets. Moreover, it was noted
that the financial incentive offered by the government has provided some stimulus to small
private investors to undertake dairy farming. The sustainability of the outcome depends
largely on the assured supply of accompanying inputs such as feed and veterinary services,
and improved milk marketing facilities closer to the doorsteps of the farmers.
Table 5. Estimated gross costs and benefits earned from dairy farming.
Lactation
year
Total cost (taka) Gross return (taka)
Local (n = 10) Crossbred (n = 10) Local (n = 10) Crossbred (n = 10)
1 54,524 58,179 4380 4380
2 92,585 98,798 148,636 247,966
3 117,054 124,911 173,007 297,117
Note: US$ 1 = taka 57 at 2001 exchange rate.Source: Kabir and Talukder (1997).
Participation of women in livestock productionIn rural Bangladesh, women are major but largely unrecognised contributors to agricultural
and economic productivity. The involvement of rural women in decision-making activities
(independently or as part of a group), in particular in decisions relating to feeding, breeding,
management, veterinary health care and marketing products of dairy cattle are illustrated in
Table 6. Furthermore, Paul and Saadullah (1991) reported that women carry out 25% of
crop, 17% of cattle, 21% of goat and 52% of milk sales.
South–South Workshop 13
Smallholder dairy production and marketing in Bangladesh
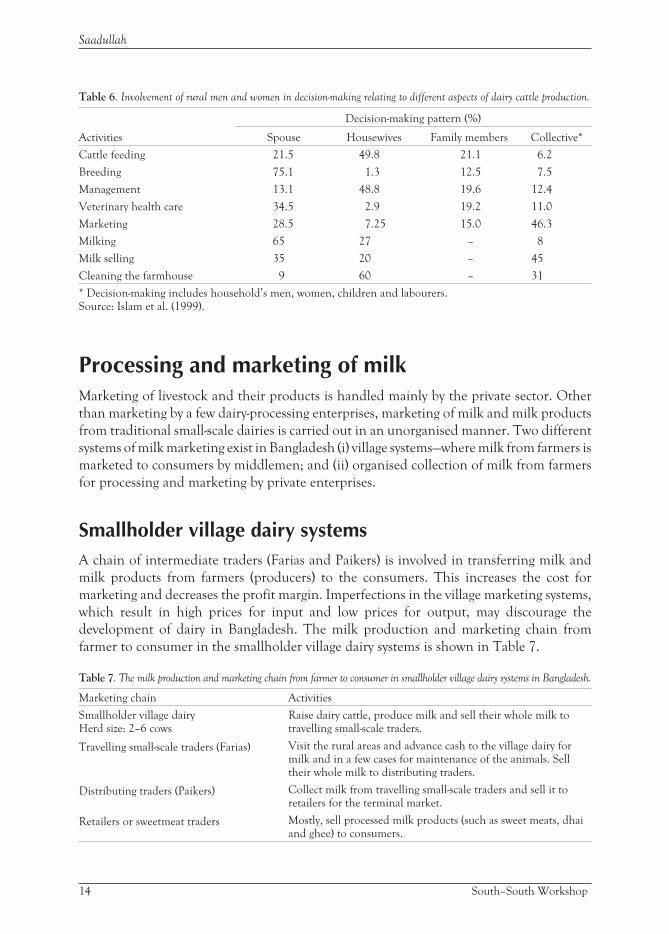
Table 6. Involvement of rural men and women in decision-making relating to different aspects of dairy cattle production.
Activities
Decision-making pattern (%)
Spouse Housewives Family members Collective*
Cattle feeding 21.5 49.8 21.1 6.2
Breeding 75.1 1.3 12.5 7.5
Management 13.1 48.8 19.6 12.4
Veterinary health care 34.5 2.9 19.2 11.0
Marketing 28.5 7.25 15.0 46.3
Milking 65 27 – 8
Milk selling 35 20 – 45
Cleaning the farmhouse 9 60 – 31
* Decision-making includes household’s men, women, children and labourers.Source: Islam et al. (1999).
Processing and marketing of milkMarketing of livestock and their products is handled mainly by the private sector. Other
than marketing by a few dairy-processing enterprises, marketing of milk and milk products
from traditional small-scale dairies is carried out in an unorganised manner. Two different
systems of milk marketing exist in Bangladesh (i) village systems—where milk from farmers is
marketed to consumers by middlemen; and (ii) organised collection of milk from farmers
for processing and marketing by private enterprises.
Smallholder village dairy systemsA chain of intermediate traders (Farias and Paikers) is involved in transferring milk and
milk products from farmers (producers) to the consumers. This increases the cost for
marketing and decreases the profit margin. Imperfections in the village marketing systems,
which result in high prices for input and low prices for output, may discourage the
development of dairy in Bangladesh. The milk production and marketing chain from
farmer to consumer in the smallholder village dairy systems is shown in Table 7.
Table 7. The milk production and marketing chain from farmer to consumer in smallholder village dairy systems in Bangladesh.
Marketing chain Activities
Smallholder village dairyHerd size: 2–6 cows
Raise dairy cattle, produce milk and sell their whole milk totravelling small-scale traders.
Travelling small-scale traders (Farias) Visit the rural areas and advance cash to the village dairy formilk and in a few cases for maintenance of the animals. Selltheir whole milk to distributing traders.
Distributing traders (Paikers) Collect milk from travelling small-scale traders and sell it toretailers for the terminal market.
Retailers or sweetmeat traders Mostly, sell processed milk products (such as sweet meats, dhaiand ghee) to consumers.
14 South–South Workshop
Saadullah
Co-operative and private milk processing and packagingenterprisesOrganised collection, processing and marketing of milk is accomplished by the Bangladesh
Milk Producers’ Co-operative Union Ltd, Savar Dairy Farm (government owned), BRAC,
Aftab Dairy and a few private dairy enterprises in the country. The Bangladesh Milk
Producers’ Co-operative Union Ltd is the oldest dairy venture in the country and it provides
feeds, vaccines and AI services for 40 thousand participants (personal communication).
Very recently BRAC, Aftab Dairy and other small-scale milk processing enterprises have
also become involved in collection of milk from contact farmers in urban and peri-urban
areas for processing, packaging and marketing in peri-urban and urban areas. Private milk
processing enterprises carry out their activities in limited areas and so are unable to provide
services to dispersed dairy farms all over the country. The chain of marketing milk from
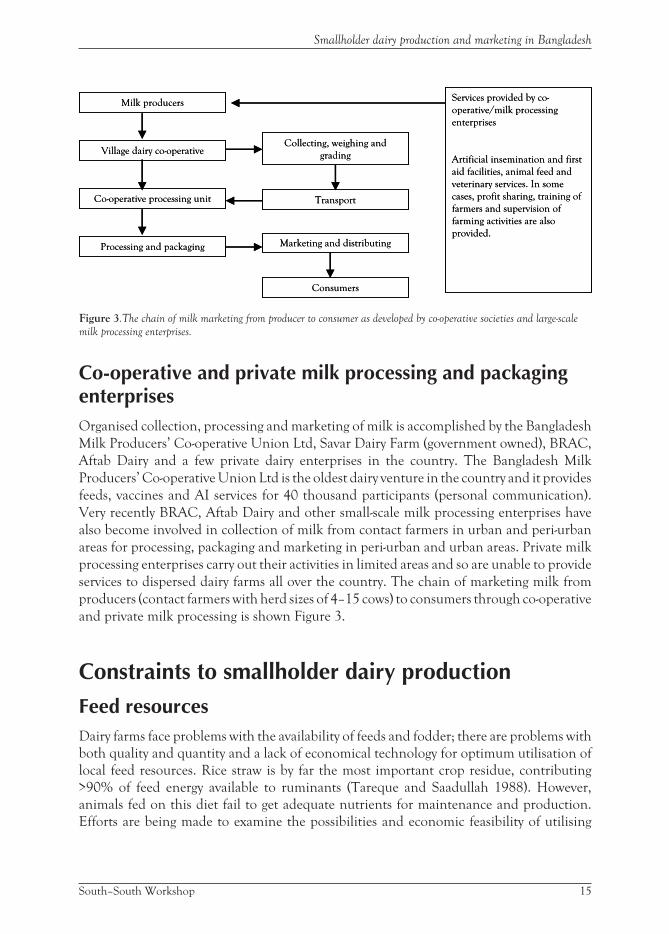
producers (contact farmers with herd sizes of 4–15 cows) to consumers through co-operative
and private milk processing is shown Figure 3.
Constraints to smallholder dairy production
Feed resourcesDairy farms face problems with the availability of feeds and fodder; there are problems with
both quality and quantity and a lack of economical technology for optimum utilisation of
local feed resources. Rice straw is by far the most important crop residue, contributing
>90% of feed energy available to ruminants (Tareque and Saadullah 1988). However,
animals fed on this diet fail to get adequate nutrients for maintenance and production.
Efforts are being made to examine the possibilities and economic feasibility of utilising
South–South Workshop 15
Smallholder dairy production and marketing in Bangladesh
Milk producers
Village dairy co-operative
Co-operative processing unit
Processing and packaging
Collecting, weighing and
grading
Transport
Marketing and distributing
Consumers
Services provided by co-
operative/milk processing
enterprises
Artificial insemination and first
aid facilities, animal feed and
veterinary services. In some
cases, profit sharing, training of
farmers and supervision of
farming activities are also
provided.
Figure 3.The chain of milk marketing from producer to consumer as developed by co-operative societies and large-scale
milk processing enterprises.

non-conventional feeds, to improve feeding value of various agricultural and industrial
by-products, and to prohibit the export of by-products such as bran, oilseed cake and
molasses from Bangladesh. Furthermore, it has been established that fodder legumes can be
integrated into rice production without having a negative impact on the yield of rice (Akbar
et al. 2000).
Breeds of cattleCattle breeds available are mostly indigenous and only 2.8% of cattle are crossbred. The
average level of milk production of the indigenous cows is about 221 litres/lactation (Miyan
1996). However, crossbred cows in some milk pocket areas produce 600–800
litres/lactation. The local cattle are nondescript and are crossbred with Sahiwal, Sindhi or
Hariana. The major disadvantages of the local cattle are (i) low productivity, (ii) failure to let
milk down without presence of the calf, and (iii) late maturation. However, these cattle are
well adapted to the local feed resources, local housing facilities and scavenging systems.
They have low nutritional requirements, heat tolerance, larger rumen volumes and possibly
a more efficient digestion of low quality feed (Mould et al. 1982). Most importantly, their
performance is also good in terms of feed efficiency (kg feed required/kg of product). Efforts
are being made to improve milk production through crossbreeding with exotic breeds.
Artificial insemination (AI) and reproductive performancePresently, AI activities are carried out by the Bangladeshi Government’s Department of
Livestock Services (DLS) from 22 centres, 423 subcentres and 554 AI point. The total
number of AIs carried out each year is about 1.5 million (DLS 2000). In order to extend AI
activities, a massive development project focusing on AI is being undertaken for the
development of cattle for milk and meat production.
As regards the reproductive performance of dairy cows, Khan et al. (1999) reported that
the number of services per conception, interval before first post-partum heat and calving
interval, respectively, were 1.57, 138 and 450 days in Pabna (local cows), 1.63, 142 and 482
days in Sindhi crossbreds and 1.61,185 and 532 days in Jersey crossbreds. Traits such as
interval before first post-partum heat and calving interval differed markedly (P<0.01)
between the local and crossbred dairy cows. However, it has been reported that the
management practices of the smallholder farms under scavenging conditions promote the
occurrence of post-partum anoestrus and limit behavioural manifestations of oestrus
(quoted by Ahmed 2000). Ahmed (2000) also concluded that detection of oestrus and of the
return of oestrus after unsuccessful AI is clearly difficult under these condition; he noted
that such inefficiencies have been documented. Moreover, it was observed that cows
managed intensively tended to conceive at a higher rate (53%) than those reared extensively
(43%).
16 South–South Workshop
Saadullah
Climate and diseaseDiseases present a major constraint to cattle production in Bangladesh; the extent of losses
due to disease is very high. The country’s climate, along with the poor nutritional status of
cattle, contributes to a high incidence of cattle diseases, especially in the calves. The major
diseases are anthrax, haemorrhagic septicaemia (HS), foot-and-mouth disease (FMD), black
quarter (BQ), diseases caused by infestation with liver flukes and calf diarrhoea (Ahmed
2000). Khan et al. (1999) reported that most crossbred cows suffered very badly from
parasitic infestations compared with the local cattle; moreover, they reported that the
incidence of parasitic diseases was very high in calves. FMD was found to cause heavy loss to
farmers. Incidence of some cattle diseases differs between the seasons. For example, the
incidence of HS is highest in the rainy season. In contrast, the incidence of other diseases,
such as anthrax and BQ, is sporadic. In response to the dire need for preventive vaccines
against livestock and poultry diseases, 11 different types of vaccine (anthrax, HS, FMD, BQ
and various poultry vaccines) are produced at two research institutes in Bangladesh. The
total quantity of vaccine produced each year is about 250 million doses (DLS 2000). There
are eight field disease investigation laboratories located in different parts of the country
including a central laboratory in Dhaka; they are managed by the Bangladeshi
Government’s DLS. These laboratories serve as centres to help DLS veterinary officers to
make correct and prompt diagnoses of livestock diseases.
Government policy and activities for dairydevelopmentRecent livestock development activities of the Bangladeshi Government’s DLS have
attracted the attention of development partners, international organisations and NGOs.
The livestock subsector has emerged as an important source of gainful employment and
income for the vast majority of the rural poor for their poverty alleviation. Important
features of government policies towards the livestock subsector include (i) the
non-involvement of the government in production, processing and marketing activities, (ii)
support of the private sector and NGOs in dairy development activities through research,
extension, training, credit and the development of appropriate infrastructure, (iii)
reduction of import tariffs on equipment, animals, raw materials and other inputs, and (iv)
reduction and eventual elimination of subsidies on inputs, including veterinary drugs,
vaccines and AI services.
The government has been providing subsidies for mini dairy farms since 1993. This
policy resulted in an increase in milk production from 1.49 million tonnes in 1993–94 to
1.62 million tonnes in 1997–98 indicating a growth rate of 9%. In contrast, the annual
growth rate was only 1.26% during the period prior to this policy (from 1987 to 1994). Due
to increasing domestic milk production importation of milk decreased from taka 450
million in 1989–90 to taka 146 million in 1995 (Ahmed 2000). There were only 2490 dairy
farms in 1990–91 but this number increased to 29.6 thousand by 1997–98 (DLS 2000).
South–South Workshop 17
Smallholder dairy production and marketing in Bangladesh
The major activities of the DLSThe major activities of the DLS include (i) conservation of livestock (by providing veterinary
health care/ensuring veterinary coverage), (ii) development of livestock (development of
breeds, productivity and appropriate technology), (iii) provision of extension services
(training, entrepreneur development, assistance to establish farms, feeds and fodder
production, and technology transfer), and (iv) employment generation (assistance for
credit, input supply and technical support to NGOs working with livestock development).
Institutional issuesThe NARS (national agricultural research system) has the Bangladesh Agricultural
Research Institute (BARC) as its apex body, and its affiliated research institutions are under
the control of the concerned ministries, i.e. the Ministry of Agriculture and the Ministry of
Fisheries and Livestock. The Ministry of Fisheries and Livestock controls the DLS with its
affiliated research institutions (the Livestock Research Institute, the Animal Husbandry
Research Institute, the Bangladesh Livestock Research Institute, veterinary colleges and the
central cattle breeding centre).
University education and research is co-ordinated by the University Grants
Commission, an autonomous body under the Ministry of Education. BARC also provides
some funds to the universities for specific research projects under contractual
arrangements. The majority of research in Bangladesh Agricultural University is of an
academic nature. However, in some cases, researchers undertake specific project-based
research funded by the Ministry of Science and Technology or other aid agencies (e.g. the
World Bank, USAID (United States Agency for International Development), IFS
(International Foundation for Science) and IAEA (International Atomic Energy Agency).
The Grameen Bank, a famous credit institution, is providing loan funds to the landless
and to smallholders under a micro-credit programme on (i) general and processing, (ii)
agriculture and forestry, (iii) livestock and fisheries, (iv) services, (v) trading, (vi) peddling,
and (vii) shopkeeping. Yunus and Jolis (1998) reported that prior to May 1998, the value of
loans disbursed by Grameen Bank, through 65,960 Grameen centres, exceeded US$ 2.4
billion. The total value of loans that this bank disburses each year exceeds the combined
total value of rural loans disbursed by all the other banks in Bangladesh. As of May 1998,
Grameen Bank had 1112 branches serving 2.33 million borrowers at their doorsteps in
38,551 villages. In any working day, Grameen collects an average of US$ 1.5 million in
weekly repayment instalments.
In addition to credit services, as part of their rural development and income generation
activities, BRAC, the Agricultural Bank, PROSHIKA and a few small-scale enterprises
provide milk collection, processing and marketing outlets to small-scale dairy farms and
supportive services for dairying to landless and small-scale farmers. These are implemented
in collaboration with the DLS.
The Bangladesh Milk Producers’ Co-operative Union Ltd is the oldest and only dairy
venture in the country providing feeds, vaccines and AI facilities for a large number of
18 South–South Workshop
Saadullah
participants in selected milk pocket areas. However, this co-operative is incapable of
providing feed, marketing and veterinary health care services to dispersed dairy farmers all
over the country; therefore, milk collection, distribution, processing and marketing services
in non-supported areas of Bangladesh are less organised.
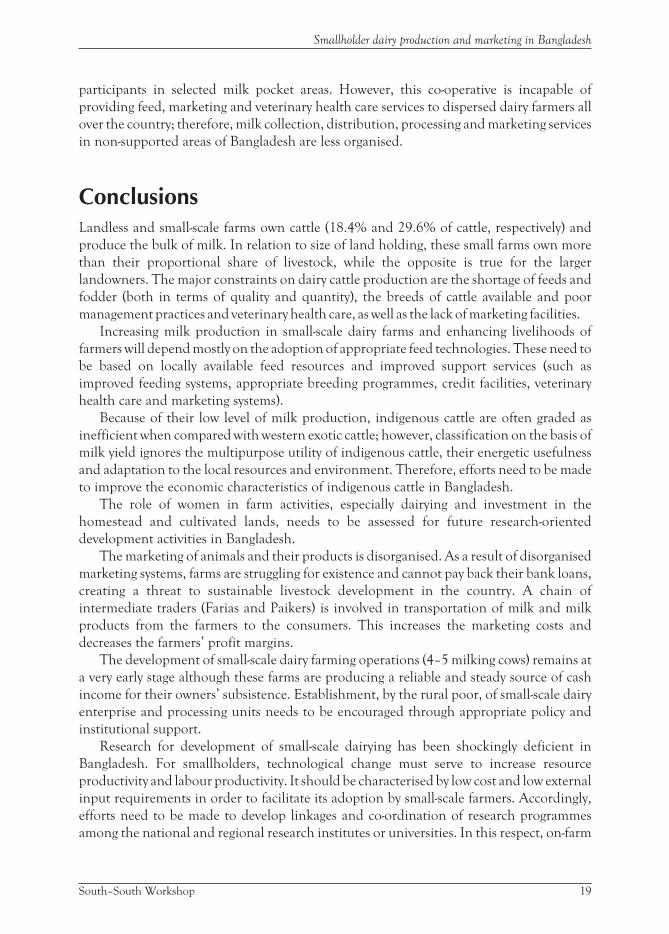
ConclusionsLandless and small-scale farms own cattle (18.4% and 29.6% of cattle, respectively) and
produce the bulk of milk. In relation to size of land holding, these small farms own more
than their proportional share of livestock, while the opposite is true for the larger
landowners. The major constraints on dairy cattle production are the shortage of feeds and
fodder (both in terms of quality and quantity), the breeds of cattle available and poor
management practices and veterinary health care, as well as the lack of marketing facilities.
Increasing milk production in small-scale dairy farms and enhancing livelihoods of
farmers will depend mostly on the adoption of appropriate feed technologies. These need to
be based on locally available feed resources and improved support services (such as
improved feeding systems, appropriate breeding programmes, credit facilities, veterinary
health care and marketing systems).
Because of their low level of milk production, indigenous cattle are often graded as
inefficient when compared with western exotic cattle; however, classification on the basis of
milk yield ignores the multipurpose utility of indigenous cattle, their energetic usefulness
and adaptation to the local resources and environment. Therefore, efforts need to be made
to improve the economic characteristics of indigenous cattle in Bangladesh.
The role of women in farm activities, especially dairying and investment in the
homestead and cultivated lands, needs to be assessed for future research-oriented
development activities in Bangladesh.
The marketing of animals and their products is disorganised. As a result of disorganised
marketing systems, farms are struggling for existence and cannot pay back their bank loans,
creating a threat to sustainable livestock development in the country. A chain of
intermediate traders (Farias and Paikers) is involved in transportation of milk and milk
products from the farmers to the consumers. This increases the marketing costs and
decreases the farmers’ profit margins.
The development of small-scale dairy farming operations (4–5 milking cows) remains at
a very early stage although these farms are producing a reliable and steady source of cash
income for their owners’ subsistence. Establishment, by the rural poor, of small-scale dairy
enterprise and processing units needs to be encouraged through appropriate policy and
institutional support.
Research for development of small-scale dairying has been shockingly deficient in
Bangladesh. For smallholders, technological change must serve to increase resource
productivity and labour productivity. It should be characterised by low cost and low external
input requirements in order to facilitate its adoption by small-scale farmers. Accordingly,
efforts need to be made to develop linkages and co-ordination of research programmes
among the national and regional research institutes or universities. In this respect, on-farm
South–South Workshop 19
Smallholder dairy production and marketing in Bangladesh

research, which is based on farmers’ perceptions and priorities rather than on scientists’
professional preferences, criteria and priorities, has many advantages.
AcknowledgementsThe author wishes to express his sincere thanks for the invitation and provision of travelling
expenses to participate in this workshop.
ReferencesAhmed N. 2000. Dairy development in Bangladesh: Prospect and constraint.
Akbar M.A., Islam M.S., Bhuiya M.S.U., Islam M.R. and Hossain M.A. 2000. Integration of fodderlegumes into rice-based cropping systems in Bangladesh: Production of Lathyrus sativus and its useas a supplement to straw-based rations of dairy cows. Asian-Australasian Journal of Animal Sciences
13:526–528.
Alam J. 1994. Economics of mini dairy farm in selected areas of Bangladesh. Bangladesh Livestock ResearchInstitute, Savar and Dhaka, Bangladesh.
Alam J. 1995. Livestock resources in Bangladesh—Present status and future potential. University Press Ltd,Motijheel CA, Dhaka, Bangladesh.
BBS (Bangladesh Bureau of Statistics). 1986. Report on Bangladesh livestock survey 1983–84.Bangladesh census of agriculture. BBS, Dhaka, Bangladesh.
BBS (Bangladesh Bureau of Statistics). 1994. Statistical Pocket Book of Bangladesh. BBS, Dhaka, Bangladesh.
BBS (Bangladesh Bureau of Statistics). 1999. Structure of agricultural holdings and livestock population
census of agriculture 1996. Volume 2. BBS, Dhaka, Bangladesh.
DLS (Department of Livestock Services). 1998. Development and activities of livestock. (in Bengali).Department of Livestock Services—An overview. DLS, Dhaka, Bangladesh.
DLS (Department of Livestock Services). 2000. Department of Livestock Services—An overview. DLS,Dhaka, Bangladesh.
Islam M.H., Rahman A.K.M.M., Hashem M.A. and Hossain S.M.I. 1999. Women’s participation indairying. Bangladesh Journal of Animal Science 28:1–2.
Kabir M.H. and Talukder R.K. 1997. Returns from investment in dairying in a selected area ofBangladesh—a comparative financial analysis of local and cross breed dairy farms. Bangladesh
Journal of Agricultural Economics 20(1):67–84.
Khan A.A., Ali A., Hussain S.S. and Bhuiyan A.K.F.H. 1999. Reproductive performance of differentgenetic group of cows under farm condition. Bangladesh Journal of Animal Science 1:2.
Miyan H.A. 1996. Towards sustainable development: The national conservation strategy ofBangladesh. Consultancy report on the livestock sector. Ministry of Environment and Forestry,Dhaka, Bangladesh.
Mould F., Saadullah M., Haque M., Davis D., Dolberg F. and Orskov E.R. 1982. Investigation ofsome of the physiological factors influencing intake and digestion of rice straw by native cattle inBangladesh. Tropical Animal Production 7(3):174–181.
Paul D.C. and Saadullah M. 1991. Role of women in homestead of small farm category in an area ofJessore, Bangladesh. Livestock Research for Rural Development 2(3):23–29
20 South–South Workshop
Saadullah
Reza A. 1986. Energetic Bangladeshi cattle in their environment: A report. University GrantsCommission, Dhaka, Bangladesh.
Saadullah M. 1989. Availability of shrubs and tree fodders for farm animals in Bangladesh. In:Devendra C. (ed), Proceedings of a workshop on shrubs and tree fodders for farm animals in East and
South-East Asia. IDRC (International Development Research Centre), Singapore.
Saadullah M. 1995. Working animal production and research in Bangladesh with special referenceto working cows. International Conference on Increasing Animal Production with Resources(IAPLR), held 27–30 October 1995, Ministry of Agriculture, Zhanjiang, China.
Saadullah M. and Hossain M.M. 2000. Report on the quantification of locally available feedresources and feeding systems of animal in different regions of Bangladesh. BangladeshAgricultural Research Council, Dhaka, Bangladesh, and Bangladesh Agricultural University,Mymensingh, Bangladesh.
Tareque A.M.M. and Saadullah M. 1988. Feed availability requirements for animals. In: DevendraC. (ed), Consultation on expanding non-conventional feed resources and fibrous agricultural residues;
Strategies for expanded utilization. IDRC (International Development Research Centre), Singapore.
Yunus M. and Jolis A. 1998. Banker to the poor. University Press Ltd, Dhaka, Bangladesh.
South–South Workshop 21
Smallholder dairy production and marketing in Bangladesh

The current status of smallholder dairysystems in Sri LankaB.H.W.M.U.S. BandaraDepartment of Animal Production and HealthP.O. Box 13, Peradeniya, Sri Lanka
BackgroundSri Lanka lies just off the south east tip of India. The surface land area of the country is
65,525 square kilometres including inland water bodies. In 1999 there was an estimated
human population of 19.04 million with a population density of 304 persons per square
kilometre; a modest population growth rate of 1.4%; 72.2% of the people lived in rural
areas, 21% in urban areas and 6.8% in the estate sector; 91.8% of the population over five
years of age was literate; and life expectancy at birth was 72.5 years. Gross National Product
(GNP) per capita in 1999 was US$ 803, the average monthly income of an average
household unit was US$ 124.9 and the monthly expenses of the average household unit in
the same year were US$ 122.7 (Central Bank 2000). In the same year, 1999, average per
capita expenditure on milk and milk products was generally low, particularly among the
rural sector—the average expenditure on milk and milk products was 3.3% and on meat was
1.5% (MLDEI 2000). Under-nutrition (>30%), under-employment (>40%),
unemployment (8.9%), inequity and food insecurity are serious economic issues.
Therefore, there are serious economic issues that need to be addressed by any development
programme, and the dairy industry is no exception.
The contribution of the agriculture sector to the Gross Domestic Product (GDP) was
20.7% in 1999 and the livestock sector contributed 8.0% to the agricultural GDP. The
formal dairy sector contributed 11% of the livestock GDP and beef production another
15% (MLDEI 2000).
The dairy industry is important and has tremendous potential in developing the
economy in the country. Milk production has been a traditional industry that has survived
thousands of years. For many reasons milk, an important food item, needs to be available in
the market with out any shortages. It plays a key role in infant feeding and alleviating
nutritional poverty in all other age groups. Milk production is important not only because of
the nutrition it provides to the people, but also due to the extensive employment
opportunities the industry offers. For these reasons Government gives high priority to
reaching self-sufficiency in milk production. While recognising the importance of active
participation of the private sector in developing the dairy industry, the government has
decided to play a leading role at the beginning and set the stage for rapid development
(MLDRI 1995).
22 South–South Workshop
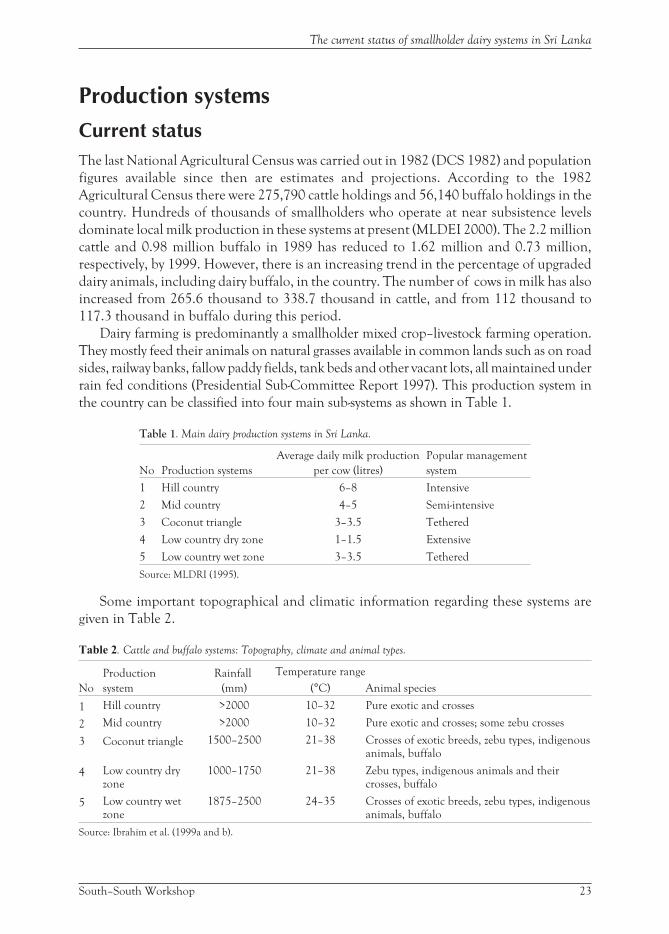
Production systems
Current statusThe last National Agricultural Census was carried out in 1982 (DCS 1982) and population
figures available since then are estimates and projections. According to the 1982
Agricultural Census there were 275,790 cattle holdings and 56,140 buffalo holdings in the
country. Hundreds of thousands of smallholders who operate at near subsistence levels
dominate local milk production in these systems at present (MLDEI 2000). The 2.2 million
cattle and 0.98 million buffalo in 1989 has reduced to 1.62 million and 0.73 million,
respectively, by 1999. However, there is an increasing trend in the percentage of upgraded
dairy animals, including dairy buffalo, in the country. The number of cows in milk has also
increased from 265.6 thousand to 338.7 thousand in cattle, and from 112 thousand to
117.3 thousand in buffalo during this period.
Dairy farming is predominantly a smallholder mixed crop–livestock farming operation.
They mostly feed their animals on natural grasses available in common lands such as on road
sides, railway banks, fallow paddy fields, tank beds and other vacant lots, all maintained under
rain fed conditions (Presidential Sub-Committee Report 1997). This production system in
the country can be classified into four main sub-systems as shown in Table 1.
Table 1. Main dairy production systems in Sri Lanka.
No Production systems
Average daily milk production
per cow (litres)
Popular management
system
1 Hill country 6–8 Intensive
2 Mid country 4–5 Semi-intensive
3 Coconut triangle 3–3.5 Tethered
4 Low country dry zone 1–1.5 Extensive
5 Low country wet zone 3–3.5 Tethered
Source: MLDRI (1995).
Some important topographical and climatic information regarding these systems are
given in Table 2.
Table 2. Cattle and buffalo systems: Topography, climate and animal types.
No
Production
system
Rainfall
(mm)
Temperature range
(°C) Animal species
1 Hill country >2000 10–32 Pure exotic and crosses
2 Mid country >2000 10–32 Pure exotic and crosses; some zebu crosses
3 Coconut triangle 1500–2500 21–38 Crosses of exotic breeds, zebu types, indigenousanimals, buffalo
4 Low country dryzone
1000–1750 21–38 Zebu types, indigenous animals and theircrosses, buffalo
5 Low country wetzone
1875–2500 24–35 Crosses of exotic breeds, zebu types, indigenousanimals, buffalo
Source: Ibrahim et al. (1999a and b).
South–South Workshop 23
The current status of smallholder dairy systems in Sri Lanka
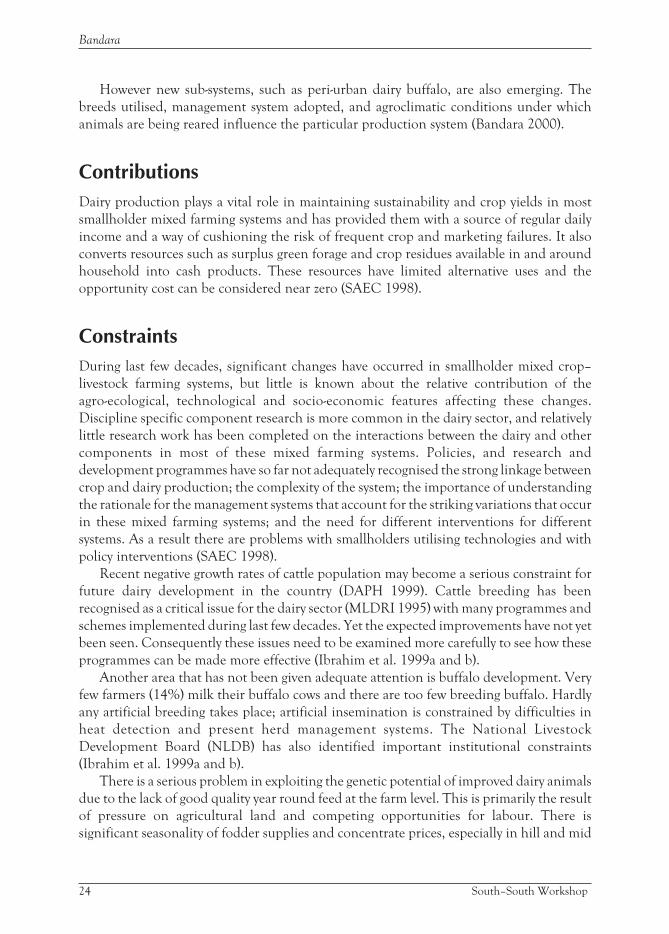
However new sub-systems, such as peri-urban dairy buffalo, are also emerging. The
breeds utilised, management system adopted, and agroclimatic conditions under which
animals are being reared influence the particular production system (Bandara 2000).
ContributionsDairy production plays a vital role in maintaining sustainability and crop yields in most
smallholder mixed farming systems and has provided them with a source of regular daily
income and a way of cushioning the risk of frequent crop and marketing failures. It also
converts resources such as surplus green forage and crop residues available in and around
household into cash products. These resources have limited alternative uses and the
opportunity cost can be considered near zero (SAEC 1998).
ConstraintsDuring last few decades, significant changes have occurred in smallholder mixed crop–
livestock farming systems, but little is known about the relative contribution of the
agro-ecological, technological and socio-economic features affecting these changes.
Discipline specific component research is more common in the dairy sector, and relatively
little research work has been completed on the interactions between the dairy and other
components in most of these mixed farming systems. Policies, and research and
development programmes have so far not adequately recognised the strong linkage between
crop and dairy production; the complexity of the system; the importance of understanding
the rationale for the management systems that account for the striking variations that occur
in these mixed farming systems; and the need for different interventions for different
systems. As a result there are problems with smallholders utilising technologies and with
policy interventions (SAEC 1998).
Recent negative growth rates of cattle population may become a serious constraint for
future dairy development in the country (DAPH 1999). Cattle breeding has been
recognised as a critical issue for the dairy sector (MLDRI 1995) with many programmes and
schemes implemented during last few decades. Yet the expected improvements have not yet
been seen. Consequently these issues need to be examined more carefully to see how these
programmes can be made more effective (Ibrahim et al. 1999a and b).
Another area that has not been given adequate attention is buffalo development. Very
few farmers (14%) milk their buffalo cows and there are too few breeding buffalo. Hardly
any artificial breeding takes place; artificial insemination is constrained by difficulties in
heat detection and present herd management systems. The National Livestock
Development Board (NLDB) has also identified important institutional constraints
(Ibrahim et al. 1999a and b).
There is a serious problem in exploiting the genetic potential of improved dairy animals
due to the lack of good quality year round feed at the farm level. This is primarily the result
of pressure on agricultural land and competing opportunities for labour. There is
significant seasonality of fodder supplies and concentrate prices, especially in hill and mid
24 South–South Workshop
Bandara

country areas, which is where most of the upgraded dairy animals are found. Many of these
upgraded dairy animals depend on bought-in concentrate feed even to meet some of their
maintenance requirements during the driest months of the year. Management of common
grasslands such as communal grazing land, public land, roadside etc. is also weak.
Hardly anything worthwhile has happened in the fodder development in the country.
Land is not specifically allocated for forage, and grasses are not accepted as a ‘crop’, even
though farmers do not fully utilise available local feed resources for many reasons (MLDEI
2000). As a result available local feed resources are being wasted in large quantities at present.
Compound cattle feed is not popular among most smallholders. Instead they use feed
ingredients such as coconut cake and rice bran. Few large scale feed millers control the feed
industry in the country at present. Rapid growth has been seen in the production of poultry
feeds. However over 80% of the ingredients are imported and so production of compound
feeds is an externally dependant system and vulnerable to changes in the world market.
Milk production and marketing
Current statusThe average producer price of milk is around US$ 0.12/litre. The average cost of
production ranged from US$ 0.09/litre in hill country to US$ 0.05/litre in the dry zone.
The average net revenue of milk is low and ranged from US$ 0.05/litre in hill country to
US$ 0.07/litre in the dry zone. Average price of fresh milk has increased from 8 Indian
rupees (Rs)/litre in 1994 to US$ 0.24/litre in the year 2000. Prices of powdered milk have
increased by 50% during this period on an average (MLDEI 2000).
The growth rate of the local dairy industry over the last decade has been estimated to be
around 2.5% per annum, in contrast to the projected market growth rate of 5.2%. During
the same period average monthly milk production of cow milk has increased from 14.4 to
21.7 million litres and, for buffalo milk, from 5.4 to 6.9 million litres. Much of this
productivity change has resulted from the proportion of upgraded animals and low disease
challenges for these upgraded dairy animals. In 1998 the per capita availability of cow and
buffalo milk was 8.15 kg and 3.60 kg respectively. Per capita consumption of milk increased
from 13 kg in 1981 to 36 kg in 1999. However, the Medical Research Institute
recommendation is to have a minimum 60 kg of milk and milk products per capita in the
country (MLDEI 2000).
It is estimated that the formal milk processors used one-third of the domestic milk
production with an equal percentage being used by the informal sector. Milk collecting
organisations and private milk collectors play a key role in the formal milk collection
network while small scale processors, restaurants, hotels, canteens, neighbouring
consumers etc. are dominant in the informal milk market. The increase in domestic milk
production has not been reflected in the formal milk market and most of the growth in the
domestic production has gone to the informal milk market (Ibrahim et al. 1999a and b).
Within the next five years domestic milk production will cover only 25% of the
requirements of the formal milk market, and the balance will be imported from overseas. The
South–South Workshop 25
The current status of smallholder dairy systems in Sri Lanka

import bill to import 429 thousand tonnes of infant milk powder and another 54 thousand
tonnes was US$ 107 million in 1999. There is a rising trend for the amount of milk imports.
However, there is no significant change in the percentage (45%) covered by the imports to the
total milk available in the country during last two decades (Ibrahim et al. 1999a and b).
OpportunitiesAssuming a 4% rate of real GDP growth, income and population growth alone will generate
an increase in aggregate demand for dairy products of slightly over 14 million tonnes by
2010. This increased demand provides important opportunities for domestic producers to
increase their production (NDDB 1998).
Imports of dairy products remain vulnerable to macro-economic factors. Changes in
prices of the world milk powder market and local exchange rates (with the recent
introduction of free floating Indian rupees against foreign currencies) will challenge the
competitiveness of the imported dairy products in the future.
Unlike milk powder, the consumption of fresh milk appears to increase with income
suggesting that as incomes increase over time demand could shift toward liquid milk. This
will present good opportunities for smallholders who are involved in domestic dairy
production. Domestic producers have a comparative advantage in the liquid milk market as
reconstituted milk is not a good substitute. Therefore, the means to increase the market for
such sales need to be considered (Ibrahim et al. 1999a and b).
The informal milk market plays a larger role than many have assumed. This is an
important outlet for many smallholders. It provides much valuable income generating
opportunities for small entrepreneurs. Further, the informal market is crucial for ensuring
the economic viability of dairy production for many producers as it typically provides higher
prices (Ibrahim et al. 1999a and b).
ConstraintsIn spite of the fact that the Medical Research Institute recommends a consumption level of
60–65 kg/person per year, per capita availability is only about 36 kg/person per year.
Therefore Sri Lanka has the lowest milk-consumption in South Asia at present (MLDEI
2000).
Powdered milk is more popular among consumers mainly due to the fact that it
guarantees quality, convenience in handling and has the possibility of storing under room
temperature for several weeks. Because of this popularity, large-scale processors are
compelled to convert liquid milk in to powdered milk and incur heavy costs for transport of
liquid milk from rural areas to their processing factories (MLDEI 2000).
Pricing systems prevailing in the country are biased towards satisfying millions of
consumers rather than the producers. Relatively, the high opportunity cost of labour
relative to the farm gate price of milk discourages farmers from being involved with
intensive dairy farming. A rough estimate of farm gate price of milk to wage ratio is 1:13 at
present. Then the value of one litre of milk sold at farm gate is only 1/13th of a daily casual
26 South–South Workshop
Bandara
wage. As a result farmers are unwilling to spend time on activities related to intensive dairy
farming (Ibrahim et al. 1999a and b).
As the profit margin is very low there have not been adequate incentives offered to the
producers to invest in dairy herds. Adequate recognition has not been given in the past to the
important role played by smallholders despite the difficulties they experience in operating at
near subsistence level. As they have very limited economic opportunities many of them will
continue to remain in the dairy farming for many more years to come (SLVA 1995).
The intense advertising efforts by importers of milk powder extolling the virtue of
imported milk have weaned the consumer away from the consumption of local milk.
Finding effective alternatives for highly promoted, heavily subsidised, cheap imported milk
powder can be considered as one of the biggest challenges any dairy development
programme has to face at present (MLDEI 2000).
Unhealthy competition among milk collectors at the grass roots level has created
another set of problems for the quality of milk collected and to the viability of running a
collection programme. The lack of satisfactory milk testing facilities at village level milk
collecting centres has added further to the deteriorating situation.
Most farmers produce buffalo curd under very poor hygienic conditions. As a result the
quality of these product is questionable and poor. Many pathogenic microbes such as E. coli,
Staphylococcus aureus, fungi and mould species at levels way above safety levels have been
found in many curd samples obtained from the market (Bandara 2000).
There is no responsible regulatory system in place to ensure the quality of milk collected
and marketed in the country (MLDEI 2000).
Institutional infrastructure and livestock servicesThe institutional support is provided both by public sector as well as private sector
institutions. The public sector is mainly engaged in providing public goods and supply of
inputs whilst the provision of necessary marketing facilities is mainly handled by the private
sector.
Current statusThe Ministry of Livestock Development and Estate Infrastructure (MLDEI), provincial
ministries responsible for livestock development in the provinces, Department of Animal
Production and Health coming under the central Government (DAPH), the Provincial
Departments of Animal Production and Health (PDAPH), National Livestock
Development Board (NLDB) and Kiriya Milk Industries of Lanka Organisations are the
main public sector organisations responsible of dairy development. However, many other
government institutions including the Ministry of Agriculture, Ministry of Land and
Environment, Central Environment Authority, Mahaweli Authority, Coconut Research
Institute, Department of Agriculture, universities etc. all have direct involvement in
developing the livestock sector in the country (Ibrahim et al. 1999a and b).
South–South Workshop 27
The current status of smallholder dairy systems in Sri Lanka

With the establishment of provincial councils in 1988 the smallholder dairy sector is
supported by a state sponsored service delivery system provided by the PDAPH in the
provinces. They provide these services through 212 government veterinary offices
established all over the country. Each veterinary office is manned with a veterinary surgeon
and three livestock development instructors on an average. They are further supported by
87 private artificial insemination technicians especially in the wet zone to implement AI
programmes more effectively (DAPH 1999).
ConstraintsThe investment in the agriculture sector, including livestock, as a share of the public sector
has declined from 18% in 1989 to 10% by 1999. One of the notable reasons for not
adequately improving the dairy industry in the country has been the lack of substantial
investment both by public and private sectors (MLDEI 2000).
Concessions have been given to the private sector under the Board of Investment (BOI)
programme to use local milk and promote local dairy industry and local milk collection.
However, almost all of the private sector imports almost all its requirements and so give an
additional problem to local dairy industry. It seems that most collectors and processors are
not much worried about problems of local producers (MLDEI 2000).
Livestock services
Current statusThe Ministry of Livestock Development and Estate Infrastructure (MLDEI) and the
provincial ministries are responsible for livestock development in the provinces and for
developing necessary policies, and for finding and channelling funds coming through the
public sector to implementing organisations and monitoring the dairy industry in the
country (MLDRI 1995).
Present responsibilities of the DAPH include assisting ministries in policy planning and
monitoring, man power training, backstopping provincial extension activities, managing
the animal quarantine activities, production and distribution of vaccines, undertaking
research into the problems of the livestock industry, administration of legislation related to
livestock and co-ordination of special livestock development programmes.
All public sector field programmes are implemented through the field staff of the PDAPH
and they are responsible for preventive and curative health care, artificial insemination and
follow-up services, farmer education and training while participating in the implementation
of special target oriented livestock development projects (MLDRI 1995).
NLDB has been principally involved in the operation and maintenance of livestock
farms and issue of breeding materials including planting materials to the field programmes.
Except in the areas where farmers are being organised under the co-operative umbrella,
the majority of smallholders are the suppliers to the collection network operated by the
28 South–South Workshop
Bandara

Kiriya Milk Industries of Lanka Limited and Nestles Lanka Limited. These two processing
establishments account for 75% of formal milk collection. The farmer co-operative
organisations like Coconut Triangle Milk Union (CTMU), Mid Country Milk Union
(MIDCOMUL) and a few others convert a small percentage of milk produced into value
added products. Apart from two main processors there are a few other organisations like
Araliyakelle milk processors, Kotmale dairy processors, New Lanka Dairies Ltd. etc. that
have recently ventured into the milk processing market. The area served by these new
processors is limited in extent (Ibrahim et al. 1999a and b).
ConstraintsAccording to the present cost of living a minimum of US$ 3 is needed for an average
smallholder family to meet their minimum day-to-day requirements. This is one of the
decisive factors in selecting suitable economic activities for their living. Therefore any
smallholder oriented dairy development programme must have the capability of ensuring a
reasonable contribution to relieve their economic burden within a short period of time.
Reasonably productive and healthy animals, quality feed in adequate quantities year
round at affordable prices, dependable and fair marketing facilities, good cattle sheds with
an adequate waste disposal system are some of the important essentials for smallholders to
remain in the dairy industry.
There are programmes of varying magnitude to address most of these components. Most
of these programmes are being implemented independently by different organisations or
some time by separate divisions of the same organisation. As a result smallholder farmers do
not have the opportunity to maximise the use of their resources and to exploit the
complementary effects of these different programmes.
Disease constraints to dairy productivity are associated with the delivery of quality
veterinary services, especially for prevention purposes. Though there are many new
veterinary offices and alternative arrangements such as mobile veterinary clinics in place,
the majority of farmers still find difficulty in getting prompt veterinary service especially in
emergencies (MLDEI 2000).
High calf mortality rate (>25%) is a problem among upgraded animals. Calf diarrhoea,
worm infestations and infectious diseases are the most common cause of these deaths. Poor
calf management, inadequate calf salvaging and health care programmes also contribute to
the situation (MLDEI 2000).
Restricted cattle movements and conflicts between crop farmers and buffalo owners
have continued for a long time and trespassing by animals and the consequent crop damage
frequently cause severe social problems.
Although the development of forages is essential, there are no strong institutional
arrangements to spearhead a useful programme for this purpose (Ibrahim et al. 1999a and b).
Many organisations are involved in dairy development in the country. They do research,
supply necessary inputs and services, formulate and implement policies, strategies and
development plans. However, understanding, interaction and co-ordination among them is
still weak (MLDEI 2000).
South–South Workshop 29
The current status of smallholder dairy systems in Sri Lanka
According to the cost of living and cost of milk production provided earlier in this paper
a minimum of 15 litres daily production is needed to earn a reasonable income from dairy
farming at the smallholder level. Three cow equivalents of upgraded dairy animals with an
adequate cattle shed and a fodder plot of over twenty perches are needed to allow a
smallholder to make this profit.
However, the majority of smallholders do not have these minimum requirements.
There is a need to improve their dairy farms. On average a minimum of US$ 500 of new
investment is needed for each smallholder. However this is beyond their capacity at present
due to their subsistence living conditions. Credit programmes are available in commercial
banks. However, farmers have to pay back these loans within 3–4 years with an annual
interest of 18–20%. More concessionary credit programmes are needed that take into
account the prevailing returns and profit margins of smallholder farmers.
Manpower available in the public sector is grossly inadequate to cater to the service
needs of the dairy sector. Inadequate participation of the private and co-operative sectors in
the delivery of these services is a weakness of the industry at present (MLDEI 2000).
Co-operative development in the dairy sector has been occurring for a number of years
particularly during the past three decades. Yet today only about 16% of the farmers are
members of such co-operatives. There is a possibility of implementing certain components
of the public sector development programmes through these organisations. However, the
lack of trained staff, questionable accountability, transparency and financial discipline of
some of these organisations have a negative effect of entrusting them with such
responsibilities at present.
Most of the private sector institutions that are involved with milk collection and
processing have not shown much interest in delivering other services to their suppliers. Also
public sector institutions have not tried to develop their programmes with the ultimate
objective of handing over those programmes to the private sector within a specified time
period, or to implement joint programme with the private sector keeping similar objectives
in mind (MLDEI 2000).
Researchers in many areas have developed beneficial technologies. However, due to the
absence of demand and farmer-driven research–extension–farmer linkages, the benefits of
these innovations have not been fully exploited (MLDEI 2000).
The lack of focus on measurable performance indicators, other than supporting large
unconnected aspects of dairy development, and the absence of a regular monitoring
programme to assess the impact of dairy development is another serious obstacle to present
development efforts (MLDEI 2000).
Research systemsThe Council for Agricultural Research Policy (CARP) is the principal organisation that
finally decides research policy and priority areas for research activities in the agriculture
sector including livestock. The Veterinary Research Institute (VRI) has leadership role for
animal health research related to the dairy sector. The VRI has also undertaken many
collaborative research programmes with other national and international agriculture
30 South–South Workshop
Bandara

research institutions and academics. They identify research needs mainly by interacting
with staff of the DAPH and PDAPH who are involved with field programmes. The existing
field network in the PDAPH is used for technology transfer.
Policy issuesThe policy framework for dairy development has been designed in accordance with the
macro-economic policies of the government. Accordingly, the main objective of the policies
is to provide public goods by the state and to allow the private sector to cater to the provision
of private goods. Hence the Government is keen to facilitate the activities of the farmers and
private sector agencies in dairy production, marketing, and to create a competitive industry
structure for the dairy sector. The promotion of liquid milk consumption is also a major
objective of the present policy framework. Because of the current economies of scale the
state is obliged to continue to provide some services to dairy farmers (MLDEI 2000).
The Government has adopted open market policy in trading dairy products. However,
there is a 10% duty rate and 5.5% defence levy in addition to the 2.5% of stamp duty on
imports of dairy products at present. With the implementation of international trade
agreements such as the World Trade Organization (WTO), the South Asian Association for
Regional Co-operation (SAARC) Preferential Trading Arrangement (SAPTA) and the
South Asia Free Trade Area (SAFTA), it is likely that the international prices of dairy
products will increase in the world market. Therefore, the present effective rate of taxation
of dairy products at nearly 19% may be sufficient to give the required protection for the
domestic dairy industry unless market conditions change (Ibrahim et al. 1999a and b).
The government policy on animal feed is to promote a competitive animal feed industry.
Accordingly the government has allowed free trading of animal feed ingredients except maize
and by-products of animal origin for the manufacture of livestock feed. However, the use of
manufactured cattle feed has remained at a negligible level. One contributing factor to this is
the Goods and Services Tax (GST) charged at 12.5% on the value addition. However, because
milk is not subject to GST, farmers do not have the opportunity to obtain a credit for the GST
charged for the manufactured feed they use (Ibrahim et al. 1999a and b).
Dairying is not the main source of income for most of the smallholders and, in most
instances, it is not the activity of the husband of the family. In fact housewives do most of the
dairy related activities while also attending to their other family obligations. Although nearly
40% of the members of registered dairy co-operatives are women they are rarely represented in
the management or executive committees of these organisations. However, when housewives
do have a role in managing household dairy activities and their dairy co-operative a substantial
improvement can be seen in the economy of the family and the organisation.
Dairying is generally a component of a partially closed mixed farming system at the
smallholder level. Some of the waste of the dairy unit such as dung, urine and wasted feeding
materials are used as manure for crop farming and some of crops and crop wastes are fed to
the animals. In addition the cultivation of forages has helped to control soil erosion and
improve soil fertility. Hence dairying at smallholder level is an environmentally friendly
activity when it is properly managed within the farming system (SAEC 1998).
South–South Workshop 31
The current status of smallholder dairy systems in Sri Lanka

ReferencesBandara B.H.W.M.U.S. 2000. Current status of buffalo production in Sri Lanka. In: The Proceedings
of the third Asian buffalo congress, held in Kandy, Sri Lanka, 27–31 March 2000.
Central Bank of Sri Lanka. 2000. Sri Lanka socio-economic data 1982–2000.
DCS (Department of Census and Statistics). 1982. Agriculture census and statistics.
DAPH (Department of Animal Production and Health). 1999. Livestock Data 1999. LivestockPlanning & Economic Unit, DAPH, Colombo, Sri Lanka.
Ibrahim M.N.M., Staal S.J., Daniel S.L.A. and Thorpe W. 1999a. Appraisal of the Sri Lanka dairy sector.
Volume 1. Synthesis report. Department of Animal Science, University of Peradeniya; ILRI(International Livestock Research Institute), Nairobi, Kenya; and Ministry of LivestockDevelopment and Estate Infrastructure, Colombo, Sri Lanka.
Ibrahim M.N.M., Staal S.J., Daniel S.L.A. and Thorpe W. 1999b. Appraisal of the Sri Lanka dairy sector.
Volume 2. Main report. Department of Animal Science, University of Peradeniya; ILRI(International Livestock Research Institute), Nairobi, Kenya; and Ministry of LivestockDevelopment and Estate Infrastructure, Colombo, Sri Lanka.
MLDEI (Ministry of Livestock Development and Estate Infrastructure). 2000. Policy strategy for dairy
industry. Ministry of Livestock Development and Estate Infrastructure, Colombo, Sri Lanka.
MLDRI (Ministry of Livestock Development and Rural Industry). 1995. Policy and programmes.Ministry of Livestock Development and Rural Industry, Colombo, Sri Lanka.
NDDB (National Dairy Development Board). 1998. An investment proposal for the dairy development
project in Sri Lanka. NDDB, Anand 388001, India.
Presidential Sub-Committee Report. 1997. Dairy industry in Sri Lanka: Status, limitations and suggestions
for revival. Presidential Sub-Committee on Animal Production and Health Sector, Colombo, SriLanka.
SAEC (South Asia Eco-regional Consortium). 1998. Increasing livestock productivity in mixedcrop–livestock farming systems in South Asia. SAEC, New Delhi, India.
SLVA (Sri Lanka Veterinary Association). 1995. Strategies for revitalizing the dairy industry. SLVA,Colombo, Sri Lanka. 48 pp.
32 South–South Workshop
Bandara
An overview of smallholder dairyproduction and marketing in NepalD.D. Joshi1 and K.C. Tarak Bahadur2
1. Director, National Zoonoses and Food Hygiene Research Centre (NZFHRC), Tahachal, GPO Box 1885,Kathmandu, Nepal2. Executive Director, National Dairy Development Board (NDDB), Kathmandu, Nepal
Introduction
Background information about the countryNepal is located in the South Asia Region. It is landlocked between its two large neighbours,
India and China. It is a small country with a land area of 147,181 km2 inhabited by more
than 23 million people. As per United Nations criteria, it is a least developed country with a
gross national product (GNP) per capita of about US$ 210 in 1997. The country is one of
the poorest in the world. Literacy rate was 41% for males and 14% for females in 1995
(World Bank 1998). Eighty-nine per cent of the population lives in rural areas and
agriculture, engaging about 81% of the population, contributes about 40% of gross
domestic product (GDP).
Nepal can be roughly divided into three geographic ecoregions, each with its own
distinctive environment, peoples, economy, customs and culture. Different landscapes
have shaped different lifestyles. The first geographic ecoregion, the Terai Region, is the
narrow strip of flat land running along the southern border; it averages only 20 km in
width and constitutes less than one-fifth of Nepal’s total area. Yet the flat, fertile Terai
contains virtually the only reasonable farmland in Nepal and supports nearly half of the
population. Seventy per cent of the country’s arable land is in the Terai; over 60% of its
grain is grown here. The hot lowland Terai is a geographic extension of northern India’s
Gangetic Plain, and Indian influences have shaped its cultures and societies. The
second geographic ecoregion, the Hill Region, is a rugged Region with deep valleys and
terraced ridges covering about half of its total area. The name is misleading since Nepal’s
hills would rank as mountains anywhere else. About 45% of the population lives in this
‘up and down’ Region, farming terraced fields patiently carved out of the hillsides by
generations of farmers. The third geographic ecoregion, the Mountain Region, includes
the Himalayan Mountains. This Region welds the Indian subcontinent to Asia,
extending over 3800 km in a great arc from the Hindu Kush range of Afghanistan to
eastern Tibet. Twice the height of the Alps, it is the undisputed king of mountain
ranges, claiming the world’s 86 highest peaks before another range manages to interject
a contender.
South–South Workshop 33
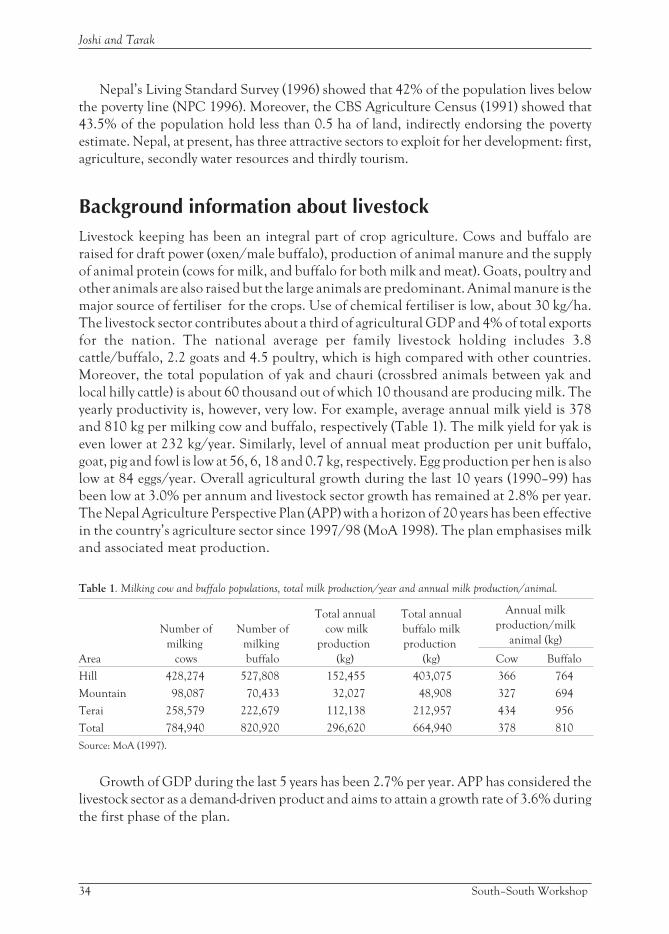
Nepal’s Living Standard Survey (1996) showed that 42% of the population lives below
the poverty line (NPC 1996). Moreover, the CBS Agriculture Census (1991) showed that
43.5% of the population hold less than 0.5 ha of land, indirectly endorsing the poverty
estimate. Nepal, at present, has three attractive sectors to exploit for her development: first,
agriculture, secondly water resources and thirdly tourism.
Background information about livestockLivestock keeping has been an integral part of crop agriculture. Cows and buffalo are
raised for draft power (oxen/male buffalo), production of animal manure and the supply
of animal protein (cows for milk, and buffalo for both milk and meat). Goats, poultry and
other animals are also raised but the large animals are predominant. Animal manure is the
major source of fertiliser for the crops. Use of chemical fertiliser is low, about 30 kg/ha.
The livestock sector contributes about a third of agricultural GDP and 4% of total exports
for the nation. The national average per family livestock holding includes 3.8
cattle/buffalo, 2.2 goats and 4.5 poultry, which is high compared with other countries.
Moreover, the total population of yak and chauri (crossbred animals between yak and
local hilly cattle) is about 60 thousand out of which 10 thousand are producing milk. The
yearly productivity is, however, very low. For example, average annual milk yield is 378
and 810 kg per milking cow and buffalo, respectively (Table 1). The milk yield for yak is
even lower at 232 kg/year. Similarly, level of annual meat production per unit buffalo,
goat, pig and fowl is low at 56, 6, 18 and 0.7 kg, respectively. Egg production per hen is also
low at 84 eggs/year. Overall agricultural growth during the last 10 years (1990–99) has
been low at 3.0% per annum and livestock sector growth has remained at 2.8% per year.
The Nepal Agriculture Perspective Plan (APP) with a horizon of 20 years has been effective
in the country’s agriculture sector since 1997/98 (MoA 1998). The plan emphasises milk
and associated meat production.
Table 1. Milking cow and buffalo populations, total milk production/year and annual milk production/animal.
Area
Number of
milking
cows
Number of
milking
buffalo
Total annual
cow milk
production
(kg)
Total annual
buffalo milk
production
(kg)
Annual milk
production/milk
animal (kg)
Cow Buffalo
Hill 428,274 527,808 152,455 403,075 366 764
Mountain 98,087 70,433 32,027 48,908 327 694
Terai 258,579 222,679 112,138 212,957 434 956
Total 784,940 820,920 296,620 664,940 378 810
Source: MoA (1997).
Growth of GDP during the last 5 years has been 2.7% per year. APP has considered the
livestock sector as a demand-driven product and aims to attain a growth rate of 3.6% during
the first phase of the plan.
34 South–South Workshop
Joshi and Tarak
Milk consumption patternFluid milk consumption among households in urban areas is widespread. About 88% of
urban households consume fluid milk regularly and another 7% occasionally. The average
quantity purchased is 1.03 litres/day per household, with 1.1 litres in the Hill and 0.9 litres
in the Terai regions. However, the habit of drinking milk regularly has not yet been
developed in Nepal. Milk is drunk regularly by family members of less than 20% of
households. Even among children, the percentage of regular consumers of milk is low at
18%. In urban areas, the use of milk for tea is popular; about 94% of households use milk
for tea whilst 60% drink it as milk.
In terms of brand, consumers preferred milk from the Dairy Development Corporation
(DDC) and from farmers (42% and 36%, respectively). Consumer preference for the brands
from the private sector was much lower. The favoured packaging was the inexpensive plastic
pouch (by 58%) and the favoured portion size was half a litre. Milk sold from the formal sector
was bought mostly (about 80%) by consumers at a cost of approximately 20 Nepalese rupees
(NRs) per litre (US$ 1 = NRs 76 on 1 November 2001). Higher prices were paid for milk
bought from the informal sector. There were also systems of ‘udder to consumer’s pot’ milk
supplies at NRs 24–30/litre, depending on the place. Most of the consumers (about 80%)
were paying the DDC price (NRs 22/litre) for their milk.
Consumers have the tradition of boiling their milk; they are aware that the quality of
milk is low and that they need to repeatedly boil their milk during the day. There is a need to
improve the safety of milk. The share of milk consumed by children and elderly people
seems to be low. For this reason, it is necessary to advertise and promote the nutritional
qualities of fresh milk for key age groups of consumers. Children would be an important
target group. For milk products, consumption is primarily concentrated on traditional
products like ghee (45% of households) and yoghurt (33% of households). Proportions of
households consuming other milk products are very small, e.g. dairy whiteners 6%, butter
<3%, cheese <3%, sweets <3% and other products <1%.
Demand for and supply of dairy products (milk andmilk products)
Present production pattern in dairyDairy development activities by His Majesty’s Government (HMG) in Nepal began in 1952
with the establishment, under the Department of Agriculture, of a small-scale milk
processing plant on an experimental basis in Tusal, a village in the Kabhrepalanchok
District. Yak cheese factories were also started with FAO (Food and Agriculture
Organization of the United Nations) assistance, the first one being set up in Langtang,
Rasuwa District, between 1952 and 1953. In 1995, the Dairy Development Section was
established under the Department of Agriculture. Moreover, a Dairy Development
Commission was formed in 1955 to guide the dairy development activities. With the
South–South Workshop 35
An overview of smallholder dairy production and marketing in Nepal

growing prospect of expanding the dairy sector, the First Five-Year Plan (1952–57) stressed
the need for developing a modern dairy industry. The Dairy Development Commission was
converted into the Dairy Development Board in 1962. In order to meet the growing milk
demand in Kathmandu, the board was converted into the Dairy Development Corporation
(DDC) in July 1969 under the Corporation Act of 1964.
The DDC gradually established various milk supply schemes to meet the growing demand
for processed milk and milk products. The Biratnagar Milk Supply Scheme was established in
1973, the Hetauda Milk Supply Scheme in 1974, the Kathmandu Milk Supply Scheme in
1978, the Cheese Production and Supply Scheme in 1979 and the Pokhara Milk Supply
Scheme in 1980. The schemes were involved both in milk collection and processing of milk
products. In 1989, many of the schemes of the DDC were rehabilitated with assistance from
the Danish International Development Agency (DANIDA). Dairy plant capacities were
increased from about 74 thousand to about 180 thousand litres/day after the rehabilitation.
In 1990, the Ten-Year Dairy Development Plan for 1991–2000 (TYDDP) was designed
(DANIDA/MoA 1991) and approved. As recommended by the TYDDP, a skim milk power
plant was established in Biratnagar in 1991.
At present, the DDC has a milk collection network in 36 districts throughout the
country. The amount of milk collected annually by the DDC for the years between 1989 and
1998 is shown in Figure 1. The DDC and private sectors are involved in collection and
processing of milk supplied from the rural areas; their respective shares are roughly 50:50
(Figure 2). The milk sheds have over 900 Milk Producers’ Co-operatives (MPCs) with
approximately 100 thousand producers. There are as many as 75 thousand farm families
supplying 214 thousand litres of milk/day to collection centres. Each farmer supplies about
3 litres of milk/day. Approximately 50% of the milk produced in Nepal is produced in
districts within the existing DDC grid. Current chilling capacity in the milk grid is
approximately 320 thousand litres/day. The formal sector collects about 20% of the milk
produced in the existing four milk sheds.
36 South–South Workshop
Joshi and Tarak
0
100
200
300
400
500
600
700
1989 1990 1991 1992 1993 1994 1995 1996 1997 1998
Year
Milk collection (t)
0
100
200
300
400
500
600
700
1989 1990 1991 1992 1993 1994 1995 1996 1997 1998
Year
Milk collection (t)
Figure 1. Total milk collection by DDC.

The DDC has an installed minimum capacity of 182 thousand litres/day and maximum
processes 214 thousand litres/day in the peak season with an average of 198 thousand
litre/day per day. The private sector has an installed capacity of 384 thousand litres/day but
is only utilising 167.2 thousand litres/day in the peak season with an average volume
processed of about 156 thousand litres/day. Processing capacity of the sector is not being
utilised (DDC 1999).
The private sector share in the market has been increasing steadily. It was less than 2% in
1980. Presently, the private sector share has reached 46% with a yearly growth of about
15%. However, the private share involvement is mostly (72%) in the central region.
Regional milk production trends indicate that the eastern, central and western regions
each produce between 22 and 27% of milk and the mid-western and far-western regions
produce about 12% each. Growth rate in milk production ranges from 2.2–5.3% per year
with the highest growth in the eastern (4.01%) and far-western (5.3%) regions. By
eco-region, the proportions of national production are 8, 56 and 35% for the Mountain,
Hill and Terai regions, respectively. The corresponding growth rates are 1, 2.8 and 5.2% per
year, respectively, with the highest growth in the Terai Region.
The MPCs collect milk from member farmers and supply milk to chilling centres owned
by the DDC. The DDC has 43 chilling centres located in 28 districts, collecting milk from
34 districts and supplying milk to 6 different milk supply schemes. The milk supply schemes
of the DDC also receive milk directly from the MPCs rather than via chilling centres. The
milk collection channels for the private sector dairies are fairly similar to those of the DDC.
Very few private sector dairies own chilling centres or receive milk through chilling
centres. Himalayan Dairy has seven chilling centres located in four districts and Sitaram
Gokul Milks collects milk through eight chilling centres located in five districts. None of the
other dairies have chilling centres but they collect directly from the farmers or from
contractors and milk vendors.
South–South Workshop 37
An overview of smallholder dairy production and marketing in Nepal
0
20
40
60
80
100
120
1981
1982
1983
1984
1985
1986
1987
1988
1989
1990
1991
1992
1993
1994
1995
1996
1997
1998
1999
2000
DDC Private
0
20
40
60
80
100
120
1981
1982
1983
1984
1985
1986
1987
1988
1989
1990
1991
1992
1993
1994
1995
1996
1997
1998
1999
2000
DDC Private
Figure 2. Market share (%) of the DDC and the private sector in milk sales for 1981–2000.
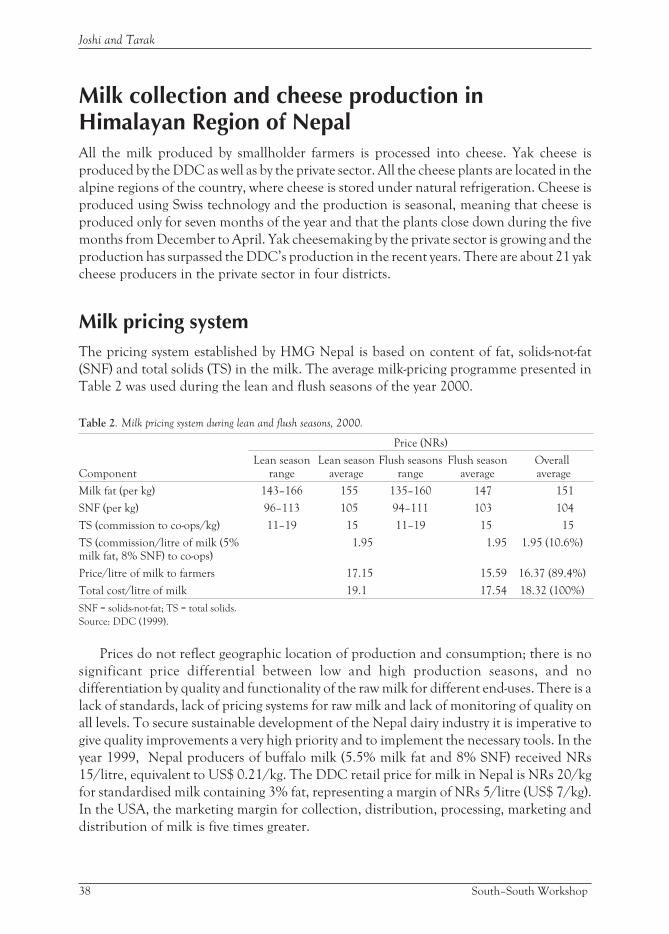
Milk collection and cheese production inHimalayan Region of NepalAll the milk produced by smallholder farmers is processed into cheese. Yak cheese is
produced by the DDC as well as by the private sector. All the cheese plants are located in the
alpine regions of the country, where cheese is stored under natural refrigeration. Cheese is
produced using Swiss technology and the production is seasonal, meaning that cheese is
produced only for seven months of the year and that the plants close down during the five
months from December to April. Yak cheesemaking by the private sector is growing and the
production has surpassed the DDC’s production in the recent years. There are about 21 yak
cheese producers in the private sector in four districts.
Milk pricing systemThe pricing system established by HMG Nepal is based on content of fat, solids-not-fat
(SNF) and total solids (TS) in the milk. The average milk-pricing programme presented in
Table 2 was used during the lean and flush seasons of the year 2000.
Table 2. Milk pricing system during lean and flush seasons, 2000.
Component
Price (NRs)
Lean seasonrange
Lean seasonaverage
Flush seasonsrange
Flush seasonaverage
Overallaverage
Milk fat (per kg) 143–166 155 135–160 147 151
SNF (per kg) 96–113 105 94–111 103 104
TS (commission to co-ops/kg) 11–19 15 11–19 15 15
TS (commission/litre of milk (5%milk fat, 8% SNF) to co-ops)
1.95 1.95 1.95 (10.6%)
Price/litre of milk to farmers 17.15 15.59 16.37 (89.4%)
Total cost/litre of milk 19.1 17.54 18.32 (100%)
SNF = solids-not-fat; TS = total solids.
Source: DDC (1999).
Prices do not reflect geographic location of production and consumption; there is no
significant price differential between low and high production seasons, and no
differentiation by quality and functionality of the raw milk for different end-uses. There is a
lack of standards, lack of pricing systems for raw milk and lack of monitoring of quality on
all levels. To secure sustainable development of the Nepal dairy industry it is imperative to
give quality improvements a very high priority and to implement the necessary tools. In the
year 1999, Nepal producers of buffalo milk (5.5% milk fat and 8% SNF) received NRs
15/litre, equivalent to US$ 0.21/kg. The DDC retail price for milk in Nepal is NRs 20/kg
for standardised milk containing 3% fat, representing a margin of NRs 5/litre (US$ 7/kg).
In the USA, the marketing margin for collection, distribution, processing, marketing and
distribution of milk is five times greater.
38 South–South Workshop
Joshi and Tarak
The government policy of fixing the producer and retail prices is a major deterrent to the
development of the dairy industry. Prices are set under a climate of political influence with
no relevance to general market conditions inside Nepal or to border prices.
Projected demand and supply of milkThe institutional demand for fluid milk in urban areas is 226 thousand litres/day; the DDC
supplies 46%, the private sector 31% and the farmers 23%. Demand for milk products
varies by season and is influenced by festival periods. Eighty per cent of ice cream
consumption and 65% of yoghurt consumption occurs in the summer months. The
regional distribution of processing plant capacity is shown in Table 3.
In 1999, the National Dairy Development Board (NDDB)/DANIDA Support Project
(DSP) conducted a benchmark survey of quality of milk and milk products in Nepal. The
survey included the major milk processing and marketing areas of the eastern, central and
western regions of the country and covered the milk chain, from the farmers to the retail
outlets in the market place. The milk chain included smallholder farmers, milk co-operatives,
traders, chilling centres, processing plants and the market. Quality checks were carried out for
raw milk, pasteurised milk, cream, butter, ghee, cheese, paneer, ice cream and dahi.
Milk qualityThe problem of milk quality worsens when there are deliberate attempts to reduce milk
quality made with the intention of monetary gains. At some units, raw milk is exposed to
various kinds of adulteration; substances are added to change the chemical composition of
the milk to increase payments. At each point in the chain, quality control and monitoring
activities are not performed effectively. The problem of quality in milk collection will be
solved to a greater extent if chilling of milk can be performed as close to the milk production
point as possible. Milk collection involves the maintenance of milk quality by maintaining
the cold chain from the point of production until the point where the milk reaches the
processing plant. The milk must be kept cool during transportation until it is pasteurised
because the process of chilling retards bacterial growth.
Cost of milk production in Nepal is high because of factors such as low productivity per
animal, poor feed and fodder supplies, inadequate extension services, poor research etc.
The cost of producing one kilogram of milk in Nepal is between NRs 13.5 and 15.5
depending on the type of farm, location etc. Internationally, the cost of milk production in
Nepal is higher (by 50% or more) than in countries such as New Zealand and Australia. The
relatively high cost of producing milk of a general low quality is a major constraint in
achieving the goals of the Nepalese dairy industry.
The Food Act 1966 was promulgated with the following objectives: to protect
consumers against hazards to their health from adulterated food; to protect and safeguard
consumers against fraudulent and malfeasant practices in the food business; to ensure fair
practice by food handlers; to help minimise dumping of hazardous and substandard food
articles; and to determine and maintain the quality and standard of food.
South–South Workshop 39
An overview of smallholder dairy production and marketing in Nepal
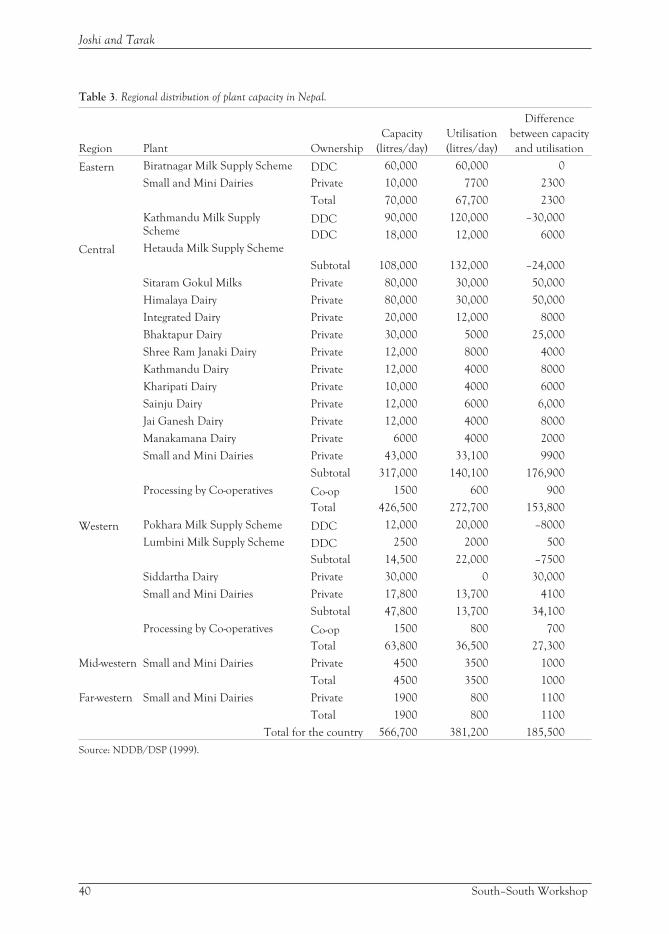
Table 3. Regional distribution of plant capacity in Nepal.
Region Plant Ownership
Capacity
(litres/day)
Utilisation
(litres/day)
Difference
between capacity
and utilisation
Eastern Biratnagar Milk Supply Scheme
Small and Mini Dairies
DDC
Private
60,000
10,000
60,000
7700
0
2300
Total 70,000 67,700 2300
Central
Kathmandu Milk SupplyScheme
Hetauda Milk Supply Scheme
DDC
DDC
90,000
18,000
120,000
12,000
–30,000
6000
Subtotal 108,000 132,000 –24,000
Sitaram Gokul Milks Private 80,000 30,000 50,000
Himalaya Dairy Private 80,000 30,000 50,000
Integrated Dairy Private 20,000 12,000 8000
Bhaktapur Dairy Private 30,000 5000 25,000
Shree Ram Janaki Dairy Private 12,000 8000 4000
Kathmandu Dairy Private 12,000 4000 8000
Kharipati Dairy Private 10,000 4000 6000
Sainju Dairy Private 12,000 6000 6,000
Jai Ganesh Dairy Private 12,000 4000 8000
Manakamana Dairy Private 6000 4000 2000
Small and Mini Dairies Private 43,000 33,100 9900
Subtotal 317,000 140,100 176,900
Processing by Co-operatives Co-op 1500 600 900
Total 426,500 272,700 153,800
Western Pokhara Milk Supply Scheme DDC 12,000 20,000 –8000
Lumbini Milk Supply Scheme DDC 2500 2000 500
Subtotal 14,500 22,000 –7500
Siddartha Dairy Private 30,000 0 30,000
Small and Mini Dairies Private 17,800 13,700 4100
Subtotal 47,800 13,700 34,100
Processing by Co-operatives Co-op 1500 800 700
Total 63,800 36,500 27,300
Mid-western Small and Mini Dairies Private 4500 3500 1000
Total 4500 3500 1000
Far-western Small and Mini Dairies Private 1900 800 1100
Total 1900 800 1100
Total for the country 566,700 381,200 185,500
Source: NDDB/DSP (1999).
40 South–South Workshop
Joshi and Tarak
Government efforts in livestock developmentThe Department of Livestock Services (DLS) is a department of the Ministry of Agriculture
and Co-operatives of HMG Nepal. It aims to increase the total contribution of the livestock
sector to GNP by developing the livestock sector with diversification, commercialisation
and conversion of livestock farming, particularly smallholder livestock production, into an
income generating and prosperous profession. The objectives of DLS include increasing the
production of milk, assisting in quality improvement of milk, helping in market
identification and management, and encouraging the livestock base industries.
The Third Livestock Development Project, mainly funded by the Asian Development
Bank, is currently ongoing in the DLS. The project has an agro-processing and marketing
component, which focuses on development of milk collection, improvement of milk
hygiene, improvement of manpower skills in the dairy industry, encouragement of
small-scale dairy processors and on increasing the production of traditional dairy products.
The Nepal Bureau of Standards and Metrology (NABS) was established under Quality
Standardisation Act 2037. The NABS is involved primarily in the preparation of national
standards, implementation of national standards and certification, and providing analytical
services through its laboratories. It also provides certification of private sector laboratories
and certification of weights and measures, including legal and scientific metrology.
The Department of Co-operatives (DoC), which is a regulatory body assigned by the
Co-operative Act 2048, is headed by the Registrar of Co-operatives. All the MPCs are
registered at the DoC and they abide by the co-operative regulations. The National
Co-operative Development Board (NCDB) was constituted following the NCDB Act, to
formulate national level policy and planning for the promotion and development of
co-operatives.
In the livestock sector, HMG Nepal has implemented the Livestock Sector Master Plan
(LSMP) since 1993. The plan covered 10 years. In 1995, a Twenty-Year Agriculture
Perspective Plan (APP) was designed with the strategy of agriculture led growth for rapid
economic growth and poverty alleviation in the country. The APP envisaged an overall 5%
annual growth in agriculture for the following 20 years. Broadly, the livestock sector strategy
was designed in line with the LSMP, which was due to be completed by the year 2000.
Livestock sector strategy under APP emphasised meat and milk production, animal
nutrition (specifically nutritional fodder supply), animal health and marketing. The Ninth
Five-Year Plan (1997–2002) in execution from 1997–98 has embraced the entire APP into
the plan (NPC/HMG Nepal 1998). The ninth plan has also expressed a longer-term
perspective in various sectors, particularly in the smallholder dairy farmer sector.
The TYDDP for 1990–2000 (DANIDA/MOA 1991) provides an extensive study of the
dairy sector before 1990. The study includes a market analysis for milk and some milk
products, the Livestock Master Plan 1993, the feasibility study for the Third Livestock
Development Project 1995 and the various reports prepared by the NDDB and the DSP to
the NDDB.
The NDDB was established in 1992 under a separate act, as a national body to formulate
and recommend policies and plans for dairy development in Nepal, and to strengthen the
dairy sector by co-ordinating the activities of private and public sector dairies.
South–South Workshop 41
An overview of smallholder dairy production and marketing in Nepal
Economics of the smallholder systemAgriculture is pivotal to poverty reduction in Nepal, as 89% of the population is rural and a
large proportion of it is poor. In the long term, HMG Nepal has projected some key
economic indicators for the smallholder livestock farmer population in particular and the
rural population in general.
The influence of religion and cultural practices on the adoption and practice of dairy
production and marketing by smallholders is favourable in the mid-Hill and Terai regions,
whereas in the Mountain Region adoption is restricted only to the Sherpa community. At
present, in all three regions, the smallholders have the opportunity to produce livestock
products but lack, or have very little, scope to access markets or to achieve profitable prices
for milk and milk products. The government or dairy industries must give thought to this
aspect in order to improve the economic situation of these smallholder dairy farmers.
Policies for livestock environmental management inNepalThere is little responsibility for the environmental aspects of milk production in the
different areas of Nepal (World Bank 1998); however, certain assessments and studies are
being carried out in the country, some of which are mentioned below.
Methane emissionsWhen combined with animal nutritional interventions, a programme resulting in disease
eradication could produce an overall reduction in ruminant methane emissions of up to
42%. Thus measures which improve overall animal health would be expected to reduce
ruminants’ production of methane gas, resulting in improved efficiency of production as
well as significantly lower levels of methane production/kg of milk, meat, or fibre produced
(Heidmann et al. 2000).
In 1998, Appropriate Technology International-USA (ATI-USA) in association with
Nepal’s National Zoonoses and Food Hygiene Research Centre and NDDB formulated a
proposal for greenhouse gas emissions reduction through enterprise development and for
improved livestock feeding by using molasses–urea blocks (MUBs) in small-scale dairy
production (Joshi et al. Unpublished). This proposal was based on earlier work by Joshi et al.
(1997), which showed that by introducing MUBs milk production efficiency in dairy
animals was increased and thus methane production was reduced.
Biogas energyBiogas plants anaerobically convert animal dung, human excrement and other biomass
wastes into combustible methane gas. This ‘biogas’ can be used effectively in simple gas
42 South–South Workshop
Joshi and Tarak
stoves and lamps to replace the use of scarce fuelwood, agricultural residues, ‘dung cakes’
and highly cost subsidised kerosene. In addition, the resulting slurry from biogas plants can
be collected easily and used as a fertiliser to enhance agricultural productivity. The biogas
technology is a proven and established technology in many parts of the world. The Biogas
Support Programme (BSP) in Nepal, in its first and second phases, has successfully
constructed more than 20 thousand biogas units in Nepal. Up to July 1998, a total of 37
thousand units had been installed under the BSP, benefiting more than 200 thousand
members of rural households. From a local perspective, the use of biogas has helped to
significantly improve the indoor air quality of homes employing biogas stoves in place of
wood stoves. In addition, installation of biogas plants has resulted in better management
and disposal of animal dung and human excrement (Mendis and van Nes 1999).
Environmental aspects including the transportation of milkin tankers from the milk collecting centres to the dairyprocessing plantsEnvironmental aspects include wear and tear of roads, air pollution from the trucks and
energy use (diesel and oil). Major environmental issues in relation to processing and
packaging of milk and milk products are: energy consumption (electricity and oil for boilers
etc.); smoke from chimneys; wastewater which can contain chemical and milk residues etc.;
noise from trucks, machinery etc.; whey from cheese production, if whey is discharged into
the drains; consumption of wood (for boiling/heating of milk in very small dairy and cheese
processing plants e.g. yak cheese plants in the mountainous region); and disposal of
packaging materials for milk (plastic pouches, cartons etc.). Effluent from dairy plants, in
particular from cheese processing plants, can be a source of heavy pollution to the
environment. If untreated, wastewater from a dairy led into a nearby river can pollute the
water very badly. As a result, the people who used to use this water for drinking and washing
will lose their water source.
Some DDC processing plants have effluent treatment plants but they are not used, most
probably because of the high cost of operating them. Unfortunately, none of the private
dairies have installed effluent treatment plants. HMG Nepal does not have consistent
policies regarding products and processing plants although there are various acts, standards
and regulations that relate to environment pollution by the dairy industries in Nepal. It is
important to examine the prevailing laws relating to the dairy sector and to assess their
implementation with regard to environment pollution.
Constraints in livestock development• inadequate delivery of animal health service
• lack of long-term appropriate livestock policy
• poor livestock farm management
South–South Workshop 43
An overview of smallholder dairy production and marketing in Nepal
• poor indigenous livestock and lack of exotic livestock/breeding stock in the country
• inadequate fodder resources
• lack of capital among the smallholder dairy farmers
• poor marketing facilities for live animals and animal products
• lack of supporting services such as research on farmer’s problems; and,
• influence of socio-cultural values on livestock raising.
Beside the above-mentioned constraints, the following points could be the major issues
or constraints for milk production, processing and milk marketing facilities in Nepal (DDC
1999; NDDB/DSP 1999):
• Milk supply to the formal sector increases during the flush season, but this sector does
not have the capability to purchase all the milk that the smallholder dairy farmers
produce, and because of this ‘milk holiday’ exists. The flush season starts around
September and ends in February. The monthly collection is highest during January
(9.6% of yearly collection) and lowest during April (6.8% of yearly collection).
Collection during the flush season (six months) represents 55% of total annual
collection, whilst collection during the lean season (the subsequent six months)
represents about 45% of the total.
• The government is not making transparent policy, and policy guidelines are not
followed strictly. Therefore, the environment is not very conducive to private sector
investment. As a result, the private sector is unsure about making investment. Issues,
such as the lack of decision in DDC restructuring and price control by HMG Nepal
through the DDC, are impeding private sector growth. At the current price structure,
the cost of raw milk is higher in Nepal than in India. Dairy plants have to manufacture
various dairy products utilising expensive raw materials and later compete with similar
products in the market that are manufactured from lower cost raw materials,
manufactured by companies with better marketing networks. This puts the domestic
industries at a disadvantage. Moreover, lack of quality control in the import of skim milk
powder has resulted in the production of low quality of milk by dairies. Furthermore, in
relation to legal issues, the implementation of the Food Act 1996 has been very weak.
• Milk as a political tool. Often the issues such as milk pricing, establishment of a dairy
processing unit and welfare of farmers etc. are used as political tools. There is a great
need to educate consumers and for dairies to launch new products, although market
penetration will be tough.
• Problems for export. Although many concessions are provided by HMG Nepal for
export-oriented companies, the conditions imposed recently by the Government of
India on Nepalese agro-products make it difficult for export.
• Lack of a business approach. The DDC runs with a traditional production oriented
approach without a market focus and consumer oriented culture. Both the DDC and the
private dairy sector have concentrated on manufacturing basic dairy products, such as
pasteurised milk in plastic pouches, and butter and ghee from the excess milk fat. So far,
the dairy sector in Nepal has made little effort to find new markets for existing products.
• The private sector lacks manpower and technology for product diversification.
Whatever has been done is based on experience rather than on the basis of formal
44 South–South Workshop
Joshi and Tarak
technical training. Product diversification needs investment and high quality raw
materials; accordingly, many dairies find it a problem. Development of human resources
and training is an important factor of the development of the dairy sector.
• Farmers are not as aware of co-operative principles. Appropriate mechanisms should be
developed for creating awareness of co-operative principles and to make the co-operative
movement successful. There are many weaknesses in the implementation part of the
Co-operative Act 1992. Of all the co-operatives registered under the act, 80% are
agriculture and rural based, about 28% of these are milk co-operatives. One of the
critical issues is that there is a lot of confusion in operating the co-operatives at grassroots
levels. Another problem is that the co-operative issues are politicised in many places.
Milk Producers’ Co-operatives are established with political colours and cannot fulfil
their actual co-operative based objectives. There is a lack of co-ordination between the
DoC that has regulatory functions and the National Co-operative Development Board
(NCDB) that has promotional functions.
• Livestock insurance policy. Access to this insurance is very much limited to the rich dairy
farmers. Smallholder farmers have very little access to the insurance agencies because
they do not have capital to show against the loan taken from the Agricultural
Development Bank and other commercial banking agencies in the country.
ReferencesCBS (Central Bureau of Statistics). 1991. Agriculture Census Report 1991. National Planning
Commission, Kathmandu, Nepal.
DANIDA (Danish International Development Agency) and MoA (Ministry of Agriculture). 1991.Ten-Year Dairy Development Plan (1991–2000). MoA, Kathmandu, Nepal.
DDC (Dairy Development Corporation). 1999. Annual Report. DDC, Lainchaur, Kathmandu,Nepal.
Heidmann P., Sollod A.E. and Joshi D.D. 2000. Ruminant methane production and chronicdisease. In: Proceedings of the second methane mitigation conference held at Novosibirsk, Russia, 18–23
June 2000. Siberian Branch of Russian Academy of Sciences, Institute of Coal and CoalChemistry, Novosibirsk, Russia. pp. 153–160.
Joshi D.D., Stem C., Orlic M., Worth T. and Sollod A.E. 1999. Improving dairy efficiency andreducing methane production in Nepal. In: Chattarjee K. (ed), Proceedings of the AIJ conference held
in New Delhi, India, 8–10 January 1997. Development Alternatives, New Delhi, India. pp.226–239.
Mendis M.S. and van Nes W.J. 1999. The Nepal Biogas Support Program: A case study on the use ofanimal dung for rural household energy and greenhouse gas (ghg) mitigation. In: Proceedings of the
second methane mitigation conference in Novosibirsk, Russia, 18–23 June 2000. Siberian Branch ofRussian Academy of Sciences, Institute of Coal and Coal Chemistry, Novosibirsk, Russia. pp.199–206.
MoA (Ministry of Agriculture). 1997. Statistical information on Nepalese agriculture. MoA, Kathmandu,Nepal.
MoA (Ministry of Agriculture). 1998. Nepal Agriculture Perspective Plan (1997/98). Ministry ofAgriculture and Cooperatives, His Majesty’s Government of Nepal, Singhadarwar, Kathmandu,Nepal.
South–South Workshop 45
An overview of smallholder dairy production and marketing in Nepal

MoF (Ministry of Finance). Economic survey report 1999. His Majesty’s Government of Nepal/MoF,Baghdarwar, Kathmandu, Nepal.
NDDB (National Dairy Development Board)/DSP (DANIDA Support Project). 1999. NDDB/DSP
Report 1999. NDDB, Kathmandu, Nepal.
NPC (National Planning Commission). 1996. Nepal living standard survey. NPC, Kathmandu, Nepal.
NPC (National Planning Commission). 1998. Ninth five-year plan. NPC, Kathmandu, Nepal.
Word Bank. 1998. World Development Report 1998/99. Knowledge for development. The World Bank,Washington, DC, USA.
46 South–South Workshop
Joshi and Tarak
Pakistan smallholder dairy production andmarketingR.H. RajaAnimal Husbandry Commissioner/Joint Secretary, Ministry of Food,Agriculture and Livestock (Livestock Wing), Islamabad, Pakistan
IntroductionAnimal husbandry, more precisely the keeping of domestic buffalo, cattle, sheep and goats,
provides the population of Pakistan with a variety of commodities essential for its nutrition.
Milk and milk products are the most important and with an annual combined consumption
of more than 12 million tonnes, Pakistan maintains the highest consumption level per
capita of all Asian countries.
There are about 5.5 million livestock production units, most of them represented by
smallholders who often do not even own or lease land, responsible for this output. Fresh
milk and its preparations are appreciated and consumed by almost everyone. Therefore,
many of the family units keeping only a few milch animals need the entire milk produced for
their own consumption. This explains why the major part of fresh milk is not sold. The 5.5
million production units have to feed some 50 million household members and very likely
to give milk to another 10 to 20 million persons, either in exchange for services rendered or
for charitable reasons.
The traditional raw milk marketing system is supplying rural and urban consumers quite
effectively but its capacity is limited by the perishability of the product. Seasonal
fluctuations in raw milk supply are met with dilution (lean season) during the marketing
process or reduced procurement (flush season).
Occasional shortages in fresh milk supply, high production costs in the peri-urban areas
and the availability of dried milk powder in the market have led to a partial substitution of
fresh milk by reconstituted milk. Nevertheless, the fresh milk equivalent of imports has
never exceeded 4% of domestic milk production.
In addition to traditional raw milk marketing and cottage or household manufacture
of dairy products like yoghurt, ghee and sweetmeats, a number of modern industrial dairy
processing units have been established, competing with traditional traders for market
share.
South–South Workshop 47

Present supply of milk
Domestic productionIn 1999–2000, about 25.6 million tonnes of liquid raw milk were available in Pakistan for
human consumption. Smallholders, keeping one or a few milch animals, produce 65% of
all buffalo and cows’ milk.
Seasonal fluctuation in milk production are the result of changing climatic conditions
in the course of a year, and seasonal factors affecting parturition date and feed availability
(and the lactation cycles of milch animals). It is common knowledge in Pakistan that
production is highest during the winter months and lowest in the summer. The magnitude
of these fluctuations, together with demand, is discussed further.
ImportsTotal imports of dairy products for the fiscal year (FY) 1999–2000 were 15,768 t worth 1214
million Pakistan rupees (US$ 1 = 51.8 Rs., 1st January 2000).
Present consumption of milk and dairy products
Milk consumptionConsumption estimates for milk and dairy products in 1999–2000 are as follows:
Table 1. Milk consumption pattern 1999–2000.
Product (× 103 t)
Fresh milk 1006
UHT* milk 69
Butter 60
Ghee 177.04
Other dairy products 82.5
* UHT = ultra heat treated.
Seasonal fluctuations in milk production andconsumptionThe production (supply) and consumption (demand) for milk and milk products in
Pakistan are characterised by conflicting seasonal fluctuations. Milk production is at its
maximum during the period between January and April and at its minimum during
May–August when fodder is limited. Milk consumption is at its peak in summer. At this
time, because of the warmer ambient temperatures, people increase their milk intake and
consume a greater range of dairy products including ice cream and yoghurt.
48 South–South Workshop
Raja
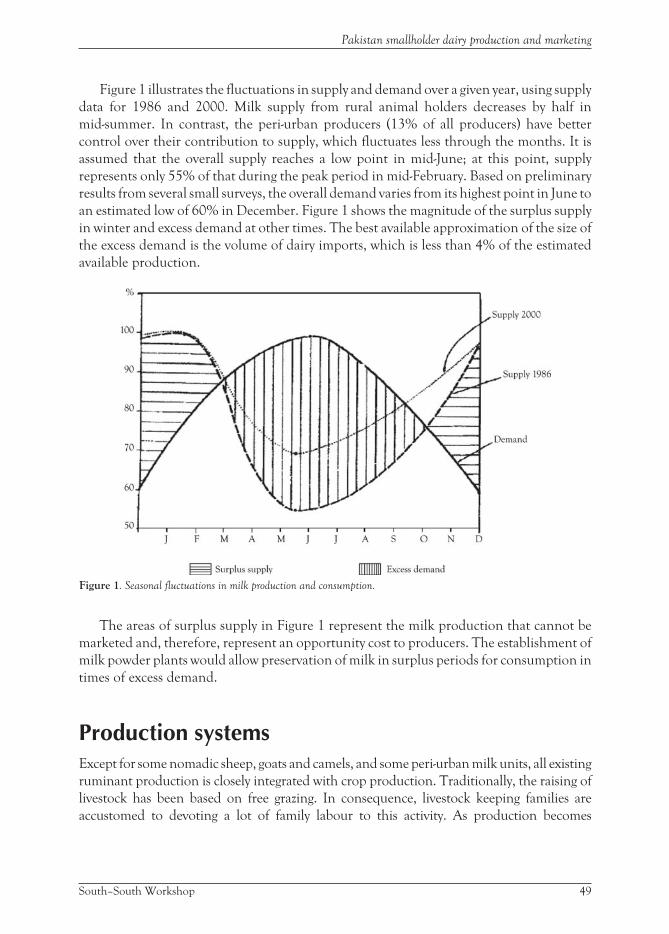
Figure 1 illustrates the fluctuations in supply and demand over a given year, using supply
data for 1986 and 2000. Milk supply from rural animal holders decreases by half in
mid-summer. In contrast, the peri-urban producers (13% of all producers) have better
control over their contribution to supply, which fluctuates less through the months. It is
assumed that the overall supply reaches a low point in mid-June; at this point, supply
represents only 55% of that during the peak period in mid-February. Based on preliminary
results from several small surveys, the overall demand varies from its highest point in June to
an estimated low of 60% in December. Figure 1 shows the magnitude of the surplus supply
in winter and excess demand at other times. The best available approximation of the size of
the excess demand is the volume of dairy imports, which is less than 4% of the estimated
available production.
The areas of surplus supply in Figure 1 represent the milk production that cannot be
marketed and, therefore, represent an opportunity cost to producers. The establishment of
milk powder plants would allow preservation of milk in surplus periods for consumption in
times of excess demand.
Production systemsExcept for some nomadic sheep, goats and camels, and some peri-urban milk units, all existing
ruminant production is closely integrated with crop production. Traditionally, the raising of
livestock has been based on free grazing. In consequence, livestock keeping families are
accustomed to devoting a lot of family labour to this activity. As production becomes
South–South Workshop 49
Pakistan smallholder dairy production and marketing
Figure 1. Seasonal fluctuations in milk production and consumption.
commercialised and home produced or purchased feeds take the place of grazing, families
tend to retain their customary approach to labour without thought to the returns involved.
The following production systems are practised:
• Cattle
– Smallholder irrigated areas
– Smallholder barani (rainfed) areas
– Progressive farming of crossbred cattle
• Buffalo
– Peri-urban commercial and household
– Rural smallholder—market oriented
– Rural smallholder— subsistence
– Rural commercial
CattleTraditionally, cattle are kept by about 5–6 million rural households, primarily to provide draft
power for crop production with milk as a by-product for family consumption or for sale. Some
cattle are kept in peri-urban milk units along with buffalo. There is also a new progressive class
of cattle farmer developing commercial production with improved crossbred type cattle. So
far, this category represents an insignificant part of the national herd and milk supply;
however, it could provide the model for long-term development of milk production in the
country. Cattle production systems are described for rural small-scale units in irrigated and in
barani (rainfed) areas, and for the progressive type of farmer.
Irrigated areasAbout 55% of the indigenous cattle population is kept by 2.5 million small mixed
crop–livestock production units in the irrigated areas; of these 60% are in the Punjab, 20%
in Sind and 14% in NWFP (North-West Frontier Province). Traditionally, male cattle have
been kept primarily to provide farm traction and the female herd needed to produce the
working animals has also produced some milk as a by-product for human consumption.
With the introduction of tractors, the importance of work animals is declining, milk and
meat production are becoming relatively more important and the genetic weaknesses of
indigenous animals for these purposes are becoming more apparent.
In irrigated areas, the typical unit consists of three cattle, kept alongside buffalo that are
raised for milk production. Most cattle are of non-descript type, but some pure indigenous milk
breeds are included. On average, the cattle herd includes about 40% adult females and 20–25%
adult males; the remainder are calves and followers. As far as possible, feed is derived from
grazing. About 25% of total feed comes from straws, 60% from fodder crops and <10% from
purchased concentrates. With current yields of fodder crops, these cattle units require fodder
production from about 0.7 ha of land during the rabi (spring) and kharif (autumn) seasons.
50 South–South Workshop
Raja
Rainfed (barani) areasCattle in barani areas are also raised primarily for draft use, but the keeping of buffalo in
such areas is less common and cattle herds with an average size of about five head are often
the only large ruminants kept. About 30% of the typical herd is adult females and 40% is
adult males; the balance is calves and followers. Following the onset of the rains and the
harvest of cereals, grazing of crop stubble, waste areas and pasture provides 40–50% of total
annual feed. The remainder of the feed is provided by straws, some cut green fodder and a
small amount of concentrates, usually for working draft animals. These cattle require the
fodder production from about 0.14 ha of land.
Progressive farmers, crossbred cattleA few progressive farmers are developing commercial milk production units based on the
use of artificial insemination (AI) to produce Friesian crossbred progeny. These farms may
be devoted entirely to milk production or may be part of larger mixed crop–livestock units.
Currently, they are very few in number but the system used could be important as a model
for future development.
BuffaloAbout 5.4 million households keep buffalo, almost all for milk production. Small-scale
rural units of less than six head account for roughly 4.8 million and peri-urban units a
further 0.6 million of these households. There are also a few rural commercial production
units, which have been established very recently.
Peri-urban milk productionThis centuries-old system has grown in recent times in response to increasing price and
demand for milk in urban markets, as well as because of difficulties in collecting and
transporting milk from rural areas. Production growth has been aided by development
of motorised road transport and an effective input supply network. The system
embraces production unit types ranging from large exclusively commercial and
somewhat exploitive enterprises, such as at the Landhi Cattle Colony near Karachi, to
small village merchants or shopkeepers who keep one buffalo at their house to satisfy
family milk requirements.
Commercial scale units located around the main cities, especially in the Sind Province,
in general have herds ranging from 10–200 head (average 50). Almost all the animals are
adult females, 90% are buffalo and 95% of these are actually in production. Turnover of
animals is high. Selected third or fourth lactation females are purchased either close to
calving or with calf at foot. Because of the high value of milk, calves remain with their
mothers for only four to seven days before, in most cases, being sold for slaughter. Even in
South–South Workshop 51
Pakistan smallholder dairy production and marketing

the absence of the calf, the high level of feeding encourages the cow to letdown her milk.
The lactation period lasts for 250–300 days and the animal, when dry, is sold for slaughter
(about 50% of cases) or is returned to the rural areas until again ready to calve. Replacement
cows are purchased according to need for milk sale contract obligations. As few entire
breeding males are kept and pregnancy depresses milk yield, many cows are not mated
during lactation. Of those returned to the rural areas, no more than 50% are in calf. With
the growth of AI, the number of cows served and subsequently salvaged from slaughter is
however increasing slowly.
Commercial units employ family and hired labour, which must be paid at rates applying
in urban areas. The system depends on: investment in or hire of buildings, and simple
equipment; delivery of milk to market twice daily after milking; and payment for veterinary
medicines, electricity and water municipal charges, and milk transport. Some income is
earned from the sale of farm-yard manure.
Small peri-urban units exist in the major centres but are more prevalent in the smaller
centres and villages. Distances travelled to obtain replacement cows and feeds are shorter
than for commercial units, but production costs and milk prices are generally lower with the
result that production techniques are less intensive and exploitive. Calves are suckled while
cows are in milk and many cows are mated if bulls or AI services are available in the village.
When dry, most cows are returned to the rural supply areas; if male, their calves are sold for
slaughter and, if female, the calves are sold or sent to the rural areas for growing-out as
replacement stock. Milk is used primarily to satisfy family needs and the surplus, if any, is
delivered to households or shops.
Smallholder rural milk productionAlmost 80% of total milk supply is derived from about 5.4 million mixed crop–livestock
units mostly in irrigated areas, which keep buffalo primarily for milk production and
indigenous cattle for draft purposes with milk as a by-product. Production units are small-
scale with about 75% of all buffalo and cattle in herds of no more than six head. Rural milk
production is predominantly a subsistence activity; about 56% of all milk produced is
consumed on the farm. Access to milk markets, however, influences consumption patterns
and production methods. Thus, rural smallholder production is categorised broadly into:
(a) market oriented; and (b) family subsistence. Within these two categories, there are
further subcategories, namely land owning, sharecropping and farm labouring which
influence the management techniques employed.
Smallholder market milk productionSmallholders owning buffalo and cattle in rural areas with satisfactory milk market access,
who are able to produce milk in excess of family requirements, have introduced some
changes in traditional production methods. The typical family production unit consists of
five buffalo, which include three adult females, one to two female followers and
occasionally a male calf but rarely any adult males. With a calving interval of two years,
52 South–South Workshop
Raja

normally half the adult females are in production at any time; however, the situation can
vary widely.
Smallholders, who are also owners of land, devote 10–20% of their crop area to forage
crops and are able to provide more of the total feed requirements from this source.
Sharecroppers are obliged to give working animals first priority in use of fodder crops, whilst
landless families must purchase fodder as well as straws. In such cases, a significant part of
the feed supply is provided by hand weedings from rabi and kharif cereal crops.
Smallholder, subsistence milk productionSmallholders in rural areas with no satisfactory milk market aim to produce enough milk
for family requirements at minimal cost. They are generally not prepared to spend cash on
inputs but as milk is an important item of subsistence, they are prepared to allocate
non-cash resources of land and labour to its production. About 70% of smallholder milk
producers fall into this category either because no satisfactory market exists in their village
or because they have not got the resources to enable them to produce a marketable
surplus.
The average subsistence unit consists of about three buffalo, including up to two adult
females. Grazing provides 50–60% of total feed requirements at zero cost, straws (bhusa)
provide about 25%, green feed crops provide 10–15% and purchased concentrates provide
< 5% that is used exclusively for cows in milk. The system is traditional and makes heavy
demands on family labour, largely in relation to livestock grazing.
Once a milk market is introduced, traditional farmers begin to sell surplus liquid milk.
Family consumption tends to decline and some commercial techniques are adopted.
Feeding is improved through greater use of green fodder crops and purchased
concentrates, milk yields increase as a result of better nutrition, the interval between
calvings decreases and eventually the percentage of productive animals in each herd is
increased.
Rural commercial unitsThe emergence of a new commercial category of dairy farm is a recent phenomenon.
Although very important as a future vehicle for extending improved production techniques,
the number of producers in this category is < 1000 and their contribution to total milk
supply is small. The typical unit (90% buffalo and 10% cattle) consists of about 40 buffalo of
which 60% are adult females and about 60% of these are producing milk. These production
units may be part of a larger mixed crop–livestock farm or a specialised farm devoted entirely
to milk production. Fodder crops provide more than 50% of total feed; straws, either home
grown or purchased, provide about 35% and the remainder is purchased concentrates. In
locations with rivers, rain or waterlogged areas, grazing is used as a substitute for some or all
of the straw and green feed components of feeds for dry animals.
South–South Workshop 53
Pakistan smallholder dairy production and marketing

Marketing of milk and dairy products
Marketing of raw liquid milkBecause of the various systems of milk production in Pakistan and the task of supplying
fresh milk regularly to consumers and manufacturers in both rural and urban areas,
different marketing systems have been developed that often involve several intermediaries
who form the marketing chain. Intermediaries are rural milk traders (katcha dodhis), highway
collectors (pacca dodhis), rural vendors/processors, commission agents, urban wholesalers,
shopkeepers/processors and street and door-to-door vendors.
The present annual net volume of raw milk marketed is estimated at 10.99 million
tonnes or 43% of total domestic milk production. In handling this volume, the major
marketing systems have approximately the following shares (see table 2).
Table 2. Marketing of raw liquid milk in 1999–2000.
Marketing system(intermediaries)
Volume of milk
(× 103 t)
Quantity marketed
(% of total)
Rural milk trader – rural vendor/processor 1099 10.0
Rural milk trader – highway collector – urban vendor/processor 3297 30.0
Rural milk trader – collector – dairy processor 143 1.3
Collection centre – dairy processor 77 0.7
Urban contractor/wholesaler – vendor/processor 2198 20.0
Producer – rural/urban consumer – no intermediary 4176 38.0
Marketing through rural milk tradersTraditionally, the most important middlemen are the numerous rural milk traders,
commonly called katcha dodhis. Equipped with a bicycle or horse cart, or in some cases now
with a motorcycle and two to four milk cans, they make daily visits on average to 15–20
small milk producers, collecting some 75–90 litres of raw milk. This may take three hours
and the distance cycled can easily be 20 km. Most of the katcha dodhis are independent,
only a few are employed by larger highway collectors. Under the traditional system,
women sell the milk.
Where competition is strong, usually in production areas with good access, the katcha
dodhis often have contracts with the producers to secure milk supply for a certain period.
Then the purchasing price may be fixed, interest free advances may be given or both ties will
be used. The value of advances usually corresponds to the value of milk supplied within two
to four weeks. As most katcha dodhis do not have sufficient resources to finance their
suppliers, they in turn get advances from the larger collectors and sometimes from rural
shopkeepers. If no advances are granted, payment is normally effected within one week after
milk collection.
With a few exceptions, milk is collected only in the morning, the evening milk being
used mainly for home consumption. Milk is always collected by volume, never by weight,
54 South–South Workshop
Raja
using measures of varying types and sizes. Milk producers normally supply pure,
unadulterated milk; however, to prevent deterioration of the milk during their collecting
tour, especially in the hot season, the katcha dodhis add certain quantities of ice to lower
the temperature. The ensuing dilution may well result in a 10–20% increase of the milk
volume.
Marketing through rural and highway milk collectorsThe highway milk collectors, or pacca dodhis, obtain their supply of milk almost exclusively
from the katcha dodhis. The daily volume collected by a pacca dodhi often exceeds 2000 litres,
especially in the Punjab. The number of katcha dodhis supplying a single pacca dodhi ranges
from 8 to 500, with a maximum of about 70 per collection point.
At their collection points along or near the main roads, most pacca dodhis check the milk
visually, test fat and solids-not-fat contents with their fingers and measure the volume by
pouring the milk into their own cans. If the quality meets requirements, the agreed price will
be paid. In some cases, cream separation is carried out to check the fat content (110 litres of
buffalo milk should yield at least one litre of cream) or the coagulation test is used to
determine the content of total solids (evaporation of one litre of milk in an open pan).
Collectors supplying dairy plants all use fat testing equipment.
The pacca dodhis do not own chilling facilities, but most of them have one or more motor
vehicle. Only the smaller collectors send milk to town by public transport or join other
collectors who own or hire a small pick-up truck. Before sending the cans to the urban
vendors or processors, especially during the summer season, more ice is added to the milk;
moreover, sometimes preservatives, such as hydrogen peroxide, are also added. Subject to
the distance to be covered, the milk reaches the urban markets at times between 0900 and
1200 hours.
One pacca dodhi may supply between 1 and 40 clients, depending on the milk volume
marketed and the demand of the individual contractor, milk shop or manufacturer.
Advances from shopkeepers seem to be rare. Normally, the milk supplied is paid for upon
the next delivery. Many collectors engage in fresh cream marketing. Principal clients are ice
cream factories and butter or ghee manufacturers.
Both katcha dodhi and pacca dodhi add ice to the milk, which reduces the original fat and
solids-not-fat contents by up to 20% but increases their margins. The rural collector has cash
expenses of about Rs. 1/litre for ice and octroi (communal merchandise tax), the highway
collector pays a similar amount and eventually Rs. 1/litre for hired transport. The vendor
increases his margin through the sale of sweetened milk and the manufacture of dahi or
sweetmeats.
If the pacca dodhi separates part of the cream from the milk traded, thus reducing the fat
content to 4.3%, he can increase his margin through cream sales to about Rs. 1.04/litre
sold. Consequently, the urban consumer pays Rs. 1.00 more per litre than the rural
consumer does for milk of lower quality. Of course, farm-gate trader and consumer prices
are subject to seasonal fluctuations. In summer, the urban consumer might well get milk
with a fat content <4%.
South–South Workshop 55
Pakistan smallholder dairy production and marketing
Milk collectors supplying dairy processorsSince the establishment of milk processing plants, highway milk collectors have been their
most important and effective suppliers. Despite rigid quality testing and payment according
to butterfat content, plants procure the major part of their raw milk through the private
milk collectors. This leads to difficulties during the lean production season when the supply
gap results in price increases, which the manufacturers were not willing or able to pay.
Milk sale to collection centres of dairy processorsNeither factory linked livestock farms nor dairy co-operatives have managed to become
major suppliers to dairy processing plants. Size and production of the commercial farms
have limited their contribution. Of the milk marketed by the functioning co-operatives and
Village Livestock Associations, created in some districts of Punjab to supply the Lahore Milk
Plant (their designated long-term marketing partner), only a small proportion is channelled
to the dairy plants.
To improve the handling of raw milk and achieve a better quality for processing at the
plant site, some dairy plants have started to equip milk collection centres with chilling units
and to use insulated road tankers for bulk transport from the centres to the plant. This
enables them to buy milk direct from the katcha dodhis. Some plants already collect 80% of
their procurement themselves. Large-scale collectors supply the balance milk.
Milk collection is undertaken by dodhis or co-operative organisations (e.g. at Renala
Khurd), but the milk producers may also deliver to the centres themselves and this way may
receive a higher price. The farm-gate price in winter is Rs. 8–10 and in summer Rs. 10–12
per litre (6% fat basis). A bonus of Rs. 1.00/litre is paid by some processing plants, if the
milk is put into chilling tanks provided by the plants but operated by the producers.
Direct marketing and contract saleSome producers manage to market their milk without the help of dodhis. They produce
quantities large enough to contract fixed regular supplies with urban wholesalers/retailers
or they sell straight to consumers (at the farm, in their own urban retail outlets or at the
consumer’s door).
The peri-urban milk producers, especially in Sind, sell most of their milk on a contract
basis (one year, fixed price) to urban distributors, milk shops and institutional consumers
(hotels and restaurants). Milk in excess of the contracted quantities is sold through
commission agents in the ‘free’ wholesale market (auction sale). If a milk producer cannot
supply the agreed quantity in full, he is obliged to make up the deficit from outside
purchases (e.g. in the wholesale market). Some of the milk producers at Landhi Cattle
Colony have established an association. Most peri-urban and rural commercial milk
producers who market milk themselves do not maintain additional or better facilities
than the pacca dodhis. Milk, with ice added, is transported in their own cans and usually
with their own vehicles to the customers or the wholesale markets. Only a very few
56 South–South Workshop
Raja

producers (e.g. a dairy co-operative, a private cattle farm and some government dairy
farms) use chilling facilities and insulated storage tanks. In general, milk is distributed in
cans with volumes of 40–50 litres.
Milk producers who own transport facilities usually deliver milk to their urban
contractor receiving about Rs. 14/litre of undiluted milk. Contractors are often milk shops
converting part of the milk into customary products. In summer, the margins of the
intermediaries are much higher as more ice is added to cool the milk.
Milk retailersThe final middlemen in raw milk marketing are the milk shops, which in urban centres
often also exercise distribution functions (supply of the small retailers) and/or transform
milk into local yoghurt (dahi), yoghurt drinks and a simmered, sweetened concentrate
(khoa) for sweet dishes or ice cream. They often separate cream from part of the milk
bought.
The major part of the raw milk reaching the milk shops is sold untreated within one to
two hours after arrival. Some shops, particularly those operated by commercial milk
producers keep the milk in cooling tanks (500–1000 litres contents) or fill a certain
proportion into plastic sachets, which after sealing are kept in a refrigerator. Milk, which is
not sold immediately, is boiled for sale later or converted into dahi, khoa etc. Nevertheless,
the consumers boil all liquid milk bought before drinking.
Marketing of processed liquid milkThe only type of processed liquid milk that is found in markets all over the country is
sterilised long-life (ultra heat treated; UHT) milk produced by eight domestic dairy plants.
Standardised UHT milk is marketed in 200-ml, 250-ml, 500-ml and 1-litre packages,
mostly tetrahedron or tetra briks. The 500-ml packages account for about 60% of the total
quantity sold, 200- and 250-ml packages for 20–25% and the 1-litre tetra briks for
15–20%.
The marketing chain is short; from the factories, the milk is transported by truck to
regional distributor–wholesalers who in turn supply general stores and supermarkets in the
big cities. Regional distribution of sales demonstrates that the majority of milk is consumed
within a limited area around the processing plants.
Ex-factory prices vary according to the destination of sales and freight costs involved.
The distributor–wholesaler receives commissions of between Rs. 1.00 and 2.00/litre,
depending on brand and package size. Most manufacturers refund or replace damaged and
expired packages.
Compared with the margins in the marketing of raw liquid milk (especially the extra
margins resulting from dilution), the margins on processed milk are much smaller and
cannot be increased by adulteration. However, retailers do not deal exclusively in UHT
milk, it is just one of many items sold; this applies to most wholesalers as well.
South–South Workshop 57
Pakistan smallholder dairy production and marketing

Marketing of dairy productsTraditional dairy products like dahi and khoa are manufactured and sold by most milk shops
across Pakistan. On average, these shops convert about 20% of the raw milk purchased into
dahi and/or khoa. During Ramadan and in summer, dahi consumption increases
considerably.
Local or desi ghee is mainly produced by farmers in areas that are not penetrated by milk
collectors. The major part of ghee is home consumed but an estimated annual volume of
34% is marketed through wholesalers, vendors and shopkeepers, both in rural and urban
areas. Because of its relatively high price (consumers have to pay between Rs. 160 and
180/kg), it cannot compete with vegetable ghee or oil, which costs only a third of the price
and is used increasingly as a substitute.
In contrast, desi butter seems to have a stable market, especially during the winter
months. The quantity marketed may reach 60 thousand tonnes/year. The larger dairy shops
in the cities and special creameries are the principal manufacturers of local butter. They
usually buy cream from wholesalers or pacca dodhis and each day produce only what can be
sold within one day.
Some milk processing plants have introduced a number of new dairy products into the
market:
• Yoghurt (natural and flavoured)
• Drinking yoghurt
• Sweetened, flavoured milk
• UHT and pasteurised cream
• Butter
• Ghee
• Cheese and
• Ice cream mix.
The quantities sold, however, are very modest for most items; only yoghurt and butter
sales have reached significant volumes. Three major yoghurt manufacturers sell about 4000
t annually. Consumer prices of Rs. 17–21 per 450 ml cup (3.5% fat) assure a good margin
despite high packaging costs. The modern butter manufacturers produce about 800 t/year.
It is mainly packed and sold in portions of 200 g with ex-factory prices from Rs. 30–35/pack
and consumer prices from Rs. 35–40/pack.
The ice cream industry, producing 9–10 thousand tonnes of ice cream/annum, uses
mainly dairy ingredients, especially fresh cream. Fresh milk is mostly substituted by
imported milk powder.
Marketing of milk powderIn the past, more than 60% imports, mainly whole milk powder, was sold by the importers
to wholesalers and then distributed to a large number of retailers (e.g. grocery stores) where
the private households could buy it. About 2666 t, almost exclusively skim milk powder,
were used by the poultry feed industry and food processors, the dairy plants consuming
58 South–South Workshop
Raja
some 1600 t and the ice cream factories approximately 1000 t. Since 1978–79 only licensed
importers who obtain certain quotas are allowed to import milk powder. UHT milk plants
are direct importers. The introduction of a fixed import duty for all kinds of milk powder
has slightly increased domestic milk powder prices.
Milk marketing constraintsThe marketing of raw liquid milk, principally produced by a large number of
smallholders, is a difficult and time-consuming task, especially against the background of
poor infrastructure, unfavourable climatic conditions during a major part of the year and
a low technology level.
From production areas that have poor road access, marketable quantities of milk are
not, or are only partly, collected. The katcha dodhis cannot spend more than three to four
hours on one collecting tour because of the perishability of the produce. Poor transport
conditions also increase their costs considerably (e.g. by necessitating frequent repairs).
As the producers tend to meet their own milk requirements from the evening milk,
virtually no dodhis go on a second collecting tour each day, although more milk would be
available.
During the flush season of milk production, larger marketable quantities are not absorbed
by the collectors, as with a copious supply it is more difficult to sell the milk with attractive
margins despite lower farm-gate prices. Even the modern milk processing plants face problems
relating to an over-supply in the flush season and during introduced milk holidays.
The quality of milk supplied to the consumers and many of the dairy processors is often
very poor due to skimming, dilution and addition of dirty ice or chemical agents. At the
critical points in the milk marketing chain (e.g. where the rural collectors sell to the highway
collectors), chilling facilities are rarely available.
The conditions of milk handling are often unhygienic. Containers and cans are not
well cleaned and lids are frequently sealed with a wad of straw. Despite the addition of
ice or preservatives, bacterial activity can increase considerably. Although the Pure Food
Ordinance and the Pure Food Rules require hygienic handling of milk and prohibit
mixing, colouring, staining or powdering of milk with any matter or ingredient, high
rates of adulteration are reported by the food inspectors. Severe penalties can be enacted
but, in reality, only small fines are imposed with minimal impact on the unhygienic
practices.
With few exceptions, milk producers have been unable to organise themselves, take
over marketing functions and remove the deficiencies of the traditional marketing
system.
The major constraints to the marketing of processed liquid milk are the higher price in
comparison with that of raw milk and the often-quoted consumer dislike of heat-treated
homogenised milk because of its taste and lower fat content. It is difficult to say which of the
two constraints is more important in the stagnating of UHT milk sales. Definitely, the dairy
processing industry could do more in terms of consumer education to overcome the quality
prejudice.
South–South Workshop 59
Pakistan smallholder dairy production and marketing
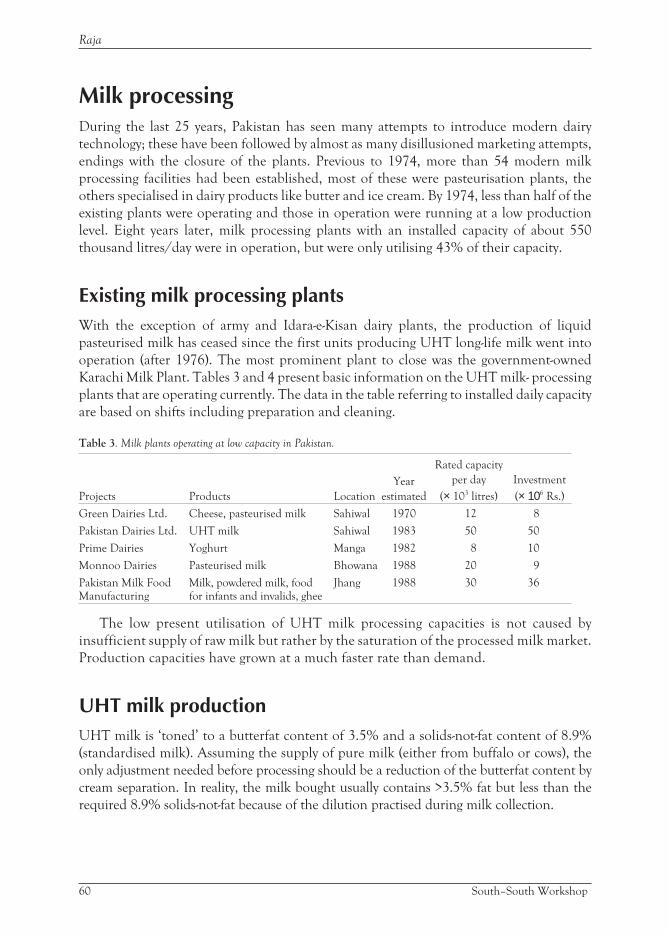
Milk processingDuring the last 25 years, Pakistan has seen many attempts to introduce modern dairy
technology; these have been followed by almost as many disillusioned marketing attempts,
endings with the closure of the plants. Previous to 1974, more than 54 modern milk
processing facilities had been established, most of these were pasteurisation plants, the
others specialised in dairy products like butter and ice cream. By 1974, less than half of the
existing plants were operating and those in operation were running at a low production
level. Eight years later, milk processing plants with an installed capacity of about 550
thousand litres/day were in operation, but were only utilising 43% of their capacity.
Existing milk processing plantsWith the exception of army and Idara-e-Kisan dairy plants, the production of liquid
pasteurised milk has ceased since the first units producing UHT long-life milk went into
operation (after 1976). The most prominent plant to close was the government-owned
Karachi Milk Plant. Tables 3 and 4 present basic information on the UHT milk- processing
plants that are operating currently. The data in the table referring to installed daily capacity
are based on shifts including preparation and cleaning.
Table 3. Milk plants operating at low capacity in Pakistan.
Projects Products Location
Year
estimated
Rated capacity
per day
(× 103 litres)
Investment
(× 106 Rs.)
Green Dairies Ltd. Cheese, pasteurised milk Sahiwal 1970 12 8
Pakistan Dairies Ltd. UHT milk Sahiwal 1983 50 50
Prime Dairies Yoghurt Manga 1982 8 10
Monnoo Dairies Pasteurised milk Bhowana 1988 20 9
Pakistan Milk FoodManufacturing
Milk, powdered milk, foodfor infants and invalids, ghee
Jhang 1988 30 36
The low present utilisation of UHT milk processing capacities is not caused by
insufficient supply of raw milk but rather by the saturation of the processed milk market.
Production capacities have grown at a much faster rate than demand.
UHT milk productionUHT milk is ‘toned’ to a butterfat content of 3.5% and a solids-not-fat content of 8.9%
(standardised milk). Assuming the supply of pure milk (either from buffalo or cows), the
only adjustment needed before processing should be a reduction of the butterfat content by
cream separation. In reality, the milk bought usually contains >3.5% fat but less than the
required 8.9% solids-not-fat because of the dilution practised during milk collection.
60 South–South Workshop
Raja
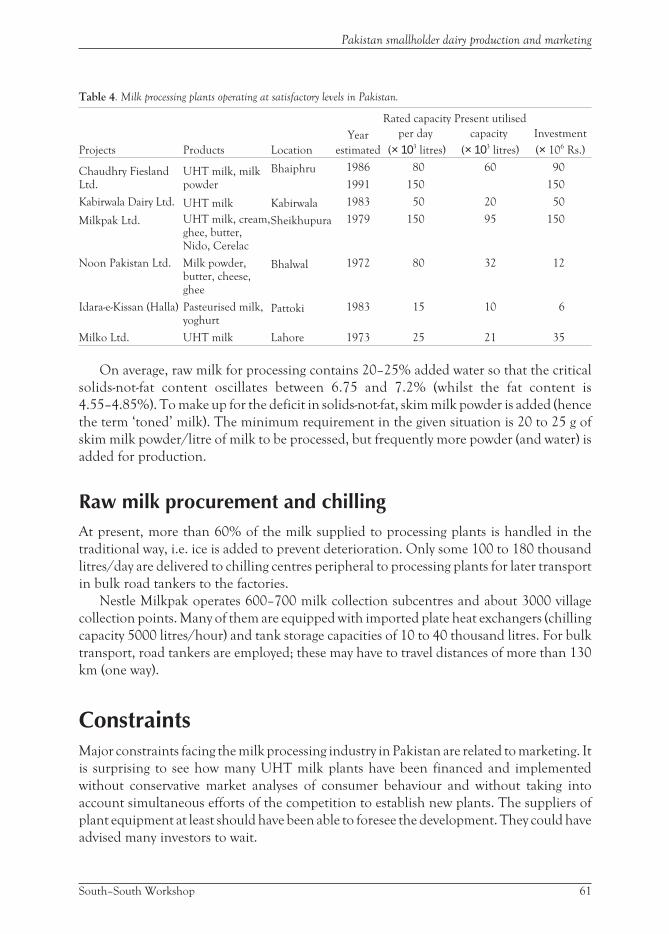
Table 4. Milk processing plants operating at satisfactory levels in Pakistan.
Projects Products Location
Year
estimated
Rated capacity
per day
(× 103 litres)
Present utilised
capacity
(× 103 litres)
Investment
(× 106 Rs.)
Chaudhry FieslandLtd.
UHT milk, milkpowder
Bhaiphru 1986
1991
80
150
60 90
150
Kabirwala Dairy Ltd. UHT milk Kabirwala 1983 50 20 50
Milkpak Ltd. UHT milk, cream,ghee, butter,Nido, Cerelac
Sheikhupura 1979 150 95 150
Noon Pakistan Ltd. Milk powder,butter, cheese,ghee
Bhalwal 1972 80 32 12
Idara-e-Kissan (Halla) Pasteurised milk,yoghurt
Pattoki 1983 15 10 6
Milko Ltd. UHT milk Lahore 1973 25 21 35
On average, raw milk for processing contains 20–25% added water so that the critical
solids-not-fat content oscillates between 6.75 and 7.2% (whilst the fat content is
4.55–4.85%). To make up for the deficit in solids-not-fat, skim milk powder is added (hence
the term ‘toned’ milk). The minimum requirement in the given situation is 20 to 25 g of
skim milk powder/litre of milk to be processed, but frequently more powder (and water) is
added for production.
Raw milk procurement and chillingAt present, more than 60% of the milk supplied to processing plants is handled in the
traditional way, i.e. ice is added to prevent deterioration. Only some 100 to 180 thousand
litres/day are delivered to chilling centres peripheral to processing plants for later transport
in bulk road tankers to the factories.
Nestle Milkpak operates 600–700 milk collection subcentres and about 3000 village
collection points. Many of them are equipped with imported plate heat exchangers (chilling
capacity 5000 litres/hour) and tank storage capacities of 10 to 40 thousand litres. For bulk
transport, road tankers are employed; these may have to travel distances of more than 130
km (one way).
ConstraintsMajor constraints facing the milk processing industry in Pakistan are related to marketing. It
is surprising to see how many UHT milk plants have been financed and implemented
without conservative market analyses of consumer behaviour and without taking into
account simultaneous efforts of the competition to establish new plants. The suppliers of
plant equipment at least should have been able to foresee the development. They could have
advised many investors to wait.
South–South Workshop 61
Pakistan smallholder dairy production and marketing

62 South–South Workshop
In spite of the comparatively high price of the finished product, low capacity utilisation
prevents most UHT milk processing plants from recovering much more than their variable
costs. Next to the raw materials, packaging is the most important cost element.
Unfortunately, sophisticated and expensive packaging forms part of UHT technology.
Alternatives to tetra packaging that meet the high requirements are scarce and do not offer
substantial savings.
Import regulations do not permit the lease of machinery. Thus, UHT milk producers
are tied to the equipment bought and the level of technology until they have written it off.
Lease contracts would give them more flexibility, i.e. to return a packaging machine or
exchange it against a more suitable one. Consequently, several plants suffer from the
disadvantage of obsolete equipment (e.g. 200- and 250-ml tetrahedron packaging).
The slow growth of demand for UHT milk and the strong competition for market shares
call for differentiation and a larger variety of products to improve capacity utilisation and
processing margins. So far, only a few of the dairy plants have tried and managed to diversify
their production and tap new markets (i.e. processing and packaging of fruit juices).
The supply of raw milk to UHT milk plants seems no longer to be a bottleneck as far as
quantity is concerned. In fact, during the flush production season, available milk surpluses
have not been bought by the processors because of the marketing problems mentioned
previously. In contrast, quality of raw milk at the factory gate is often not satisfactory. Most
of the UHT milk plants are not well located with regard to surplus milk production areas,
exceptions being Pakistan Dairies, Kabirwala Dairy and to some extent Chaudhry Dairies.
Long transportation distances and insufficient chilling facilities increase procurement costs
and negatively affect milk quality.
Future demand for milk and dairy productsThe demand for liquid milk and dairy products in Pakistan will definitely continue to
increase, the most important reason being growth of the human population. Other
variables influencing demand are the growth of personal incomes and the evolution of
prices. The demand for 2010 has been predicted and the results are presented in Table 5.
Table 5. Demand for milk and dairy products in 2010.
Products × 103 t
Fresh and boiled milk 25,604
Dry and condensed milk 68
Butter 165
Ghee 327
Total (fresh milk equivalent) 36,900
For 2010, the demand for dairy products is projected to be 36.9 million tonnes (fresh
milk equivalent), whilst the available production (after wastage and ice dilution) is projected
at about 34.3 million tonnes. This suggests that, even assuming possible general
Raja
improvements in animal husbandry, Pakistan will still have an excess demand that will need
to be met by imports, unless the human population grows at a lower rate than in the past.
Suggested strategy for the future development ofmilk marketing and processing in PakistanThe dairy sector in Pakistan is challenged by a rapidly growing demand for liquid fresh and
boiled milk. Although market production of commercial dairy farms is likely to become
more important, the bulk of raw milk supply will continue to be provided by a large number
of rural smallholders. Consumer behaviour, giving preference to liquid raw milk, is not
expected to change fundamentally, but in the future, more attention will be paid to hygiene
and quality.
The traditional milk collection and marketing system, despite some deficiencies, has
served quite effectively as a link between producers and consumers. It would not be wise to
replace it; however, to meet the future requirements some adjustments and improvements
will be necessary.
Milk chilling centresTo procure as much as possible of the milk available for sale from the producers, collection
activities will have to extend to the hitherto neglected areas with poor, time-consuming
access and to include the surplus from the evening milking. Perishability of the produce
necessitates cooling within four hours of milking. Therefore, the establishment of milk
chilling facilities in close reach of a greater number of producers becomes essential.
Such facilities would serve the following functions: quality control of the milk delivered
(e.g. density, acidity, fat content); cooling from ambient temperature to +4oC; and storage
until collection for transport (in bulk or special containers), possibly to larger collection
centres and then to processing plants or milk shops.
An ideal solution would seem to be the establishment and operation of chilling centres
by the milk producers themselves. Despite the failure of dairy co-operatives and Village
Livestock Associations, past experience indicates that this possibility of better integrating
small milk producers, especially in remote areas, into the marketing system and
strengthening their bargaining power should not be ignored. Encouragement and technical
assistance could be given to the producers to establish their own milk collection systems.
Commercially organised dairy enterprises that produce milk on their own farms and/or
collect milk from other producers to sell it subsequently to processors, milk shops or
through their own outlets, are probably in the best position to invest in chilling centres.
Alternatively, milk chilling could be offered as a service to milk traders, processors (e.g.
ice cream factories) and institutional consumers who are interested in a regular supply of
quality milk. Such a chilling service might be operated, for instance, by a private enterprise
specialising in storage and transport. However, potential investors would first have to be
identified.
South–South Workshop 63
Pakistan smallholder dairy production and marketing
Institutional support for animal productiondevelopmentProvision of services for the development of animal production is a provincial responsibility
discharged through the ministry, directorate general or directorate of animal husbandry as
the case may be. In each case, the organisation responsible is staffed and organised primarily
for the provision of animal health services. Animal production services are secondary and
consist mostly of:
• Breed improvement programmes
• Government farms
• Livestock production research
• Information services
• Livestock production extension and
• Training.
Government policiesIn general, government policy towards the livestock sector is non-interventionist. The
government is not directly involved in production enterprises and is disengaging itself from
the few remaining government owned processing facilities. The private sector is encouraged
to develop production, processing and marketing enterprises.
Increased supply for urban markets is to be developed from rural irrigated areas where
there is thought to be untapped supply and a large demonstrated potential for increasing
production. To encourage this development, dairy farms were exempted from income tax
until June 1988; government land may be leased in large blocks for establishment of dairy
farms; semen of exotic dairy breeds may be imported duty free and credit is available
through the Agriculture Development Bank of Pakistan (ADBP). Furthermore,
milk-processing plants qualify for a number of incentives, which include duty free import of
machinery and equipment and restrictions on the import of dairy products.
64 South–South Workshop
Raja
Smallholder dairy production and marketingin India: Constraints and opportunitiesM.P.G. KurupNational Dairy Development Board (NDDB), Indiae-mail: [email protected]/[email protected]
IntroductionThe Indian livestock system is the endeavour of smallholders; there are no big players in it.
Livestock keeping is a centuries-old tradition for millions of Indian rural households and
domesticated animals have been an integral part of the farming systems from time
immemorial. While livestock do yield economic outputs, it is difficult to explain many aspects
of household behaviour with respect to livestock, purely from the angle of economic
rationality and maximisation. Consequently, treating the livestock production system as a
pure input–output type economic system often misrepresents the Indian reality (GoI 1996).
Traditionally, farmers keep livestock in proportion to the ‘free’ crop residues and family
labour available in their own household production systems and convert these into food, fuel
and farm power—making each household a virtually self-contained production system with no
purchased inputs and few marketed outputs. This age-old trend has undergone rapid change
in recent decades. Although the organisation of livestock production in small units persists,
household production systems are increasingly becoming integrated into input as well as
output markets. As a result of gradual transition from subsistence to market system, the
economic dimensions of livestock keeping have assumed increasing significance in household
behaviour. Thus, in understanding its true significance the livestock sector in India needs to
be viewed as a sector linked with the livelihoods of millions of rural households—over 70% of
all rural households—who depend on livestock farming for supplementary incomes.
The country and its attributesIndia is a country of subcontinental size and character, a country of many contradictions, a
melting pot of many cultures and races, a polyglot with many languages and dialects. The
total land area is about 3.28 million square kilometre, made up of 28 states and 7 union
territories. Together they have over 510 districts; their exact numbers changing, as many
states are reorganising their district configuration. The population was 846 million in 1991,
with some 75% of the people living in rural areas. Between 1991 and 2000 the population
grew at the rate of approximately 1.57% annually and crossed the 1 billion mark in 2000.
Forests account for 23% of the total land, while permanent pastures and grazing areas cover
less than 4%. In 1996, the net sown area in the country was about 142 million hectares
South–South Workshop 65

(47%), the gross cropped area 187 million hectares (cropping intensity 1.3) and the gross
irrigated area 71.5 million hectares (38%). India includes areas with widely varying climates
and rainfalls. It is classified into 15 different agro-climatic zones ranging from alpine to
desert; a very large part of the country can generally be described as semi-arid.
India has a thriving agriculture sector, predominantly rain-fed, with burgeoning outputs
and food surpluses. While wheat and rice are the most popular crops, Indian agriculture has
a rich diversity of crops ranging from cereals, millets, oilseeds, pulses, cotton, jute, tobacco,
tea, coffee, fruits, vegetables, tubers, spices, flowers and aromatic and medicinal plants to a
wide variety of plantation crops. Agriculture continues to be a major contributor to the
gross domestic product (GDP): 24.7% in 1998–99 at constant prices (1993–94 base year).
The agricultural sector is also the single largest employer, even in 1991 over 65% of the main
work force were engaged in agriculture either as cultivators (107 million) or as agricultural
labourers (74 million). However, at the turn of the century there are indications of a major
shift in employment patterns with burgeoning opportunities opening up in the services
sector. The Indian economy is robust; in 1999–2000 (at constant prices with 1993–94 as
base year), the GDP and the national income both grew at 5.9% and the per capita income
in real terms grew at 4.2% (Figure 1).
Smallholder profileLand holdings in India are in general small and fragmented; medium and large holdings
account for less than 10% of the holdings (Table 1). The predominant farming system
across the major holding categories is mixed crop–livestock farming, in all regions of the
country. Distribution of land, however, is grossly inequitable; marginal producers and
smallholders account for over 78% of the holdings but they own or operate less than 33% of
the total farm land.
66 South–South Workshop
Kurup
0
2
4
6
8
10
12
14
16
18
1993–94 1994–95 1995–96 1996–97 1997–98 1998–99 1999–2000
Rs (× 103)
Constant prices (at 1993–94) Current prices
0
2
4
6
8
10
12
14
16
18
1993–94 1994–95 1995–96 1996–97 1997–98 1998–99 1999–2000
Rs (× 103)
Constant prices (at 1993–94) Current prices
Figure 1. Per capita national income.
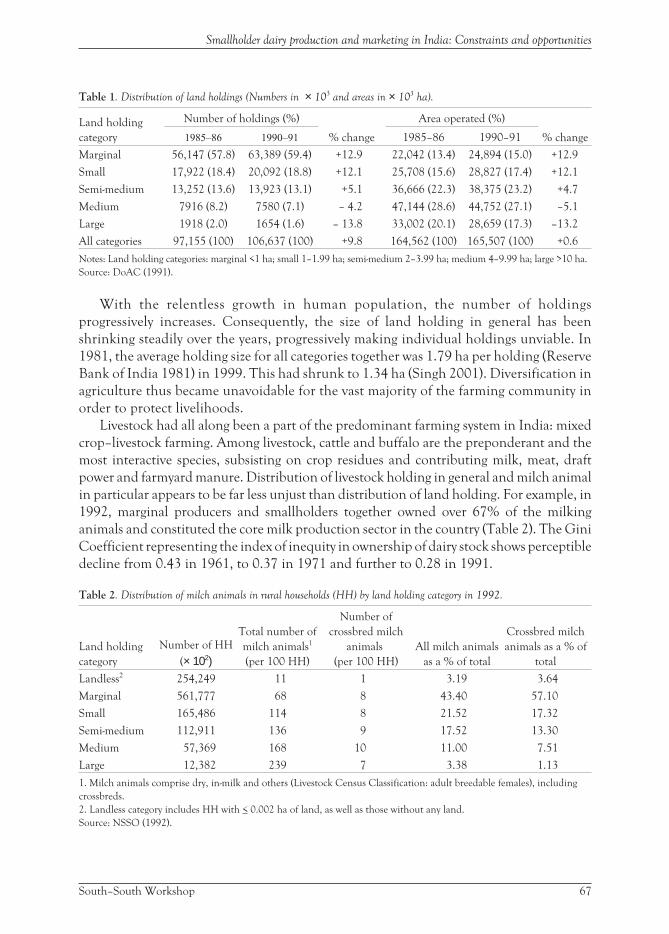
Table 1. Distribution of land holdings (Numbers in × 103 and areas in × 103 ha).
Land holding
category
Number of holdings (%)
% change
Area operated (%)
% change1985–86 1990–91 1985–86 1990–91
Marginal 56,147 (57.8) 63,389 (59.4) +12.9 22,042 (13.4) 24,894 (15.0) +12.9
Small 17,922 (18.4) 20,092 (18.8) +12.1 25,708 (15.6) 28,827 (17.4) +12.1
Semi-medium 13,252 (13.6) 13,923 (13.1) +5.1 36,666 (22.3) 38,375 (23.2) +4.7
Medium 7916 (8.2) 7580 (7.1) – 4.2 47,144 (28.6) 44,752 (27.1) –5.1
Large 1918 (2.0) 1654 (1.6) – 13.8 33,002 (20.1) 28,659 (17.3) –13.2
All categories 97,155 (100) 106,637 (100) +9.8 164,562 (100) 165,507 (100) +0.6
Notes: Land holding categories: marginal <1 ha; small 1–1.99 ha; semi-medium 2–3.99 ha; medium 4–9.99 ha; large >10 ha.
Source: DoAC (1991).
With the relentless growth in human population, the number of holdings
progressively increases. Consequently, the size of land holding in general has been
shrinking steadily over the years, progressively making individual holdings unviable. In
1981, the average holding size for all categories together was 1.79 ha per holding (Reserve
Bank of India 1981) in 1999. This had shrunk to 1.34 ha (Singh 2001). Diversification in
agriculture thus became unavoidable for the vast majority of the farming community in
order to protect livelihoods.
Livestock had all along been a part of the predominant farming system in India: mixed
crop–livestock farming. Among livestock, cattle and buffalo are the preponderant and the
most interactive species, subsisting on crop residues and contributing milk, meat, draft
power and farmyard manure. Distribution of livestock holding in general and milch animal
in particular appears to be far less unjust than distribution of land holding. For example, in
1992, marginal producers and smallholders together owned over 67% of the milking
animals and constituted the core milk production sector in the country (Table 2). The Gini
Coefficient representing the index of inequity in ownership of dairy stock shows perceptible
decline from 0.43 in 1961, to 0.37 in 1971 and further to 0.28 in 1991.
Table 2. Distribution of milch animals in rural households (HH) by land holding category in 1992.
Land holding
category
Number of HH
(× 102)
Total number of
milch animals1
(per 100 HH)
Number of
crossbred milch
animals
(per 100 HH)
All milch animals
as a % of total
Crossbred milch
animals as a % of
total
Landless2 254,249 11 1 3.19 3.64
Marginal 561,777 68 8 43.40 57.10
Small 165,486 114 8 21.52 17.32
Semi-medium 112,911 136 9 17.52 13.30
Medium 57,369 168 10 11.00 7.51
Large 12,382 239 7 3.38 1.13
1. Milch animals comprise dry, in-milk and others (Livestock Census Classification: adult breedable females), including
crossbreds.
2. Landless category includes HH with < 0.002 ha of land, as well as those without any land.
Source: NSSO (1992).
South–South Workshop 67
Smallholder dairy production and marketing in India: Constraints and opportunities
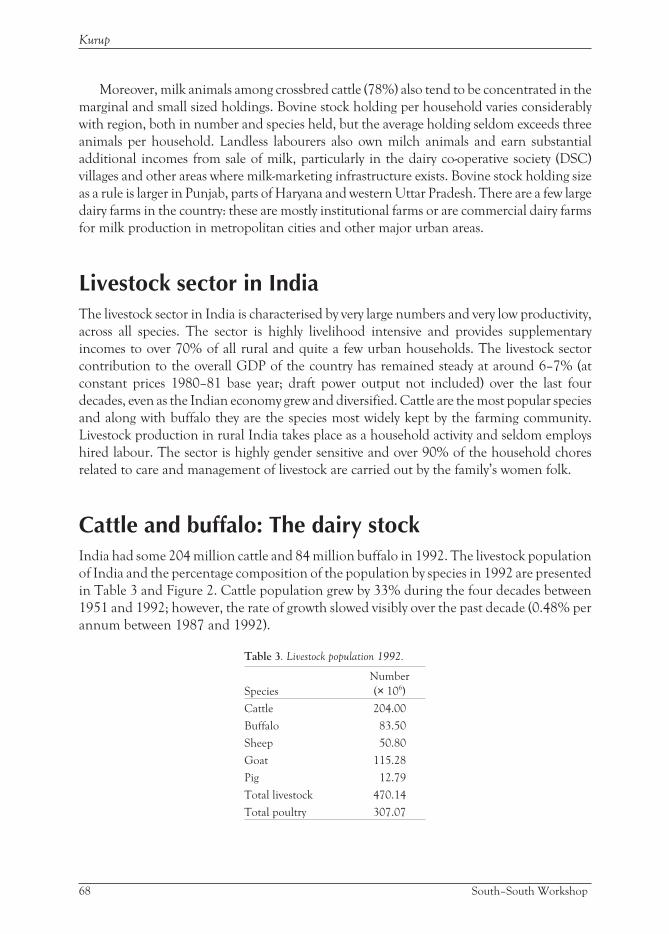
Moreover, milk animals among crossbred cattle (78%) also tend to be concentrated in the
marginal and small sized holdings. Bovine stock holding per household varies considerably
with region, both in number and species held, but the average holding seldom exceeds three
animals per household. Landless labourers also own milch animals and earn substantial
additional incomes from sale of milk, particularly in the dairy co-operative society (DSC)
villages and other areas where milk-marketing infrastructure exists. Bovine stock holding size
as a rule is larger in Punjab, parts of Haryana and western Uttar Pradesh. There are a few large
dairy farms in the country: these are mostly institutional farms or are commercial dairy farms
for milk production in metropolitan cities and other major urban areas.
Livestock sector in IndiaThe livestock sector in India is characterised by very large numbers and very low productivity,
across all species. The sector is highly livelihood intensive and provides supplementary
incomes to over 70% of all rural and quite a few urban households. The livestock sector
contribution to the overall GDP of the country has remained steady at around 6–7% (at
constant prices 1980–81 base year; draft power output not included) over the last four
decades, even as the Indian economy grew and diversified. Cattle are the most popular species
and along with buffalo they are the species most widely kept by the farming community.
Livestock production in rural India takes place as a household activity and seldom employs
hired labour. The sector is highly gender sensitive and over 90% of the household chores
related to care and management of livestock are carried out by the family’s women folk.
Cattle and buffalo: The dairy stockIndia had some 204 million cattle and 84 million buffalo in 1992. The livestock population
of India and the percentage composition of the population by species in 1992 are presented
in Table 3 and Figure 2. Cattle population grew by 33% during the four decades between
1951 and 1992; however, the rate of growth slowed visibly over the past decade (0.48% per
annum between 1987 and 1992).
Table 3. Livestock population 1992.
Species
Number
(× 106)
Cattle 204.00
Buffalo 83.50
Sheep 50.80
Goat 115.28
Pig 12.79
Total livestock 470.14
Total poultry 307.07
68 South–South Workshop
Kurup

In contrast, buffalo population almost doubled over the same period, growing much
faster (almost 2% per annum between 1987 and 1992). The justification for the
uncontrolled growth of the cattle population had all along been the need to produce work
animals in adequate numbers for the crop sector. This is no longer valid, as electrical and
mechanical sources of power have largely replaced draft animals in the farm power sector
and have progressively circumscribed their role in farm operations. The share of animals in
farm power has decreased drastically from 72% in 1961, to less than 25% by 1991, even
though the total energy input/hectare for crop production has increased three-fold over the
same period. These changes are reflected in the dynamics of the cattle population including:
a major reduction of work animal numbers ( 1992); a male:female ratio in the population
that is progressively moving in favour of the female (1:0.8 to 1:1.3); a steadily increasing
proportion of adult breedable females among indigenous females (slowed down from 1987
as crossbreds took over); and spectacular growth of the number of crossbred cows in the
population. All these factors herald a perceptible shift in the priority of the farming
community from production of work animals to production of milch animals. The buffalo
is the mainstay of the Indian dairy industry and the growth in buffalo population is entirely
demand driven. Buffalo population trends are in favour of an overall consolidation of the
population as the predominant dairy stock; there have been steep reductions in the
numbers of males and a progressively increasing proportion of breedable females among all
females (Table 4).
Some 70% of the Indian cows and 60% of the buffalo have very low productivity.
Organised breeding operations, particularly the artificial insemination (AI) services
under the government departments, reach only about 20% of the breeding animals
among cattle and less than 5% of the buffalo. In 1999, about 19 million AIs were carried
out in the country by the state departments. These constituted 5 million AIs by the milk
co-operative system (3.30 million in cattle, 1.68 million in buffalo) and 0.5 million
together by non-governmental organisations, voluntary organisations and private AI
practitioners, bringing the total number of AIs for breeding cattle and buffalo to about
24.5 million.
South–South Workshop 69
Smallholder dairy production and marketing in India: Constraints and opportunities
Cattle
43%
Buffalo
18%
Sheep
11%
Goat
25%
Pig
3%
Source: Department of AH&D (1998).
Figure 2. Livestock population (Percentage composition).

Table 4. Growth of proportion of females among cattle and buffalo populations 1982–92.
Animal category
Livestock Census
Round 1982
Livestock Census
Round 1987
Livestock Census
Round 1992
Total
Adult
females Total
Adult
females Total
Adult
females
Indigenous cattle (× 106) 180.31 55.71 188.28 56.39 189.32 56.70
Crossbred cattle (× 106)1 8.80 2.98 11.41 4.54 15.22 6.36
Buffalo (× 106) 69.78 32.50 75.97 39.13 83.50 43.08
Indigenous cattle AGR2 (%) – – 0.88 0.24 0.11 0.11
Crossbred cattle AGR2 (%) – – 5.93 10.47 6.66 8.01
Buffalo AGR (%) – – 1.77 4.08 1.98 2.02
1. Crossbred cattle were enumerated separately only from Census Round 1982 onwards.2. AGR = simple annual growth rate.Source: animal numbers: Directorate of Economics and Statistics (1982, 1987 and 1992); AGR were derivedfrom the census numbers.
The breeding policy recommended for cattle and buffalo in 1962 was: (i) selective
breeding of the pure Indian dairy breeds of cattle for milk production and work; (ii)
upgrading of the nondescript Indian cattle with selected Indian donor stock; (iii) selective
breeding of the major buffalo breeds for milk; and (iv) upgrading of the nondescript and
minor breeds of buffalo by the Murrah buffalo breed. The policy for selective breeding of
the Indian breeds of cattle and buffalo, however, did not take off for various reasons: (i)
improvement in production and productivity were gradual; (ii) absence of proven sires
among the breeds; and, above all, (iii) the absence of Breeders’ Organisations for each of the
breeds in their respective home tracts.
Crossbreeding of nondescript Indian cattle on field-scale started only in 1964 with the
launch of the Intensive Cattle Development Project by the Government of India. By 1969,
crossbreeding had become the official policy of the government. Pioneering work on
large-scale crossbreeding in different parts of India by the Bharathiya Agro-Industries
Foundation and the strong recommendations of the National Commission on Agriculture
in 1974, laid all adverse criticism of the strategy to rest and legitimised crossbreeding as a
powerful tool to rapidly enhance milk production in India. Crossbreeding gained
momentum and economic relevance as the co-operative network under Operation Flood
moved into providing the much needed market stimulus and price support for milk. The
government had no intention to crossbreed pure Indian breeds of cattle, but in practice the
spectacular increases in milk yields in crossbred progenies generated overwhelming demand
and necessitated the expansion of the crossbreeding programme nation-wide even to the
home tracts of the pure Indian breeds.
The technical programme for crossbreeding, approved by the government, was to use
the nondescript Indian cattle as the foundation stock and to breed them with semen from
exotic donor breeds to produce halfbreds, with equal inheritance from the two widely
different parents, one contributing endurance and the other the much needed higher
productivity. The policy thereafter, was to breed the halfbreds among themselves in
subsequent generations, to create large inter-mating populations of halfbreds, perpetually
70 South–South Workshop
Kurup
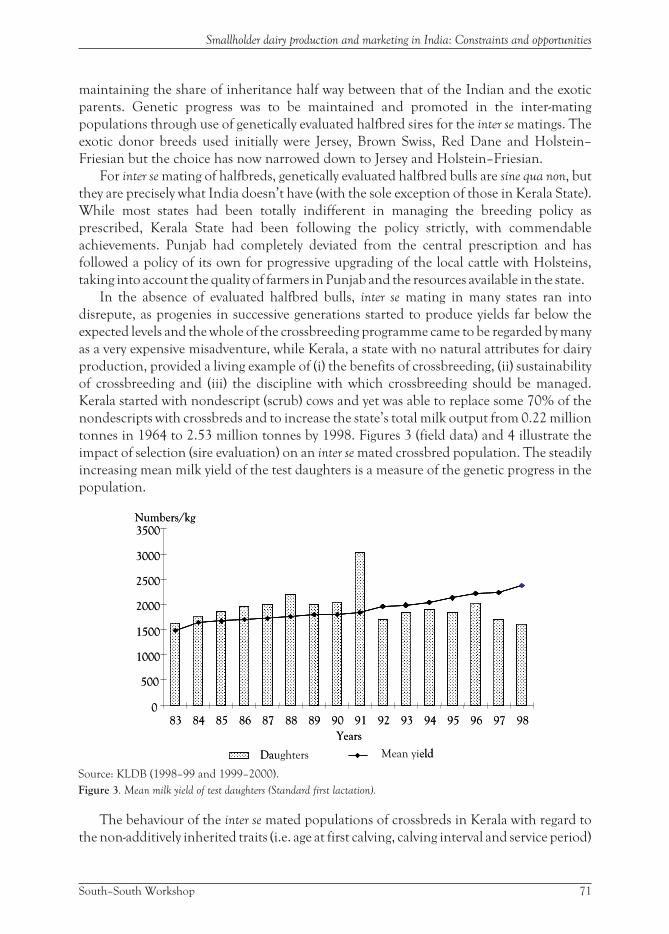
maintaining the share of inheritance half way between that of the Indian and the exotic
parents. Genetic progress was to be maintained and promoted in the inter-mating
populations through use of genetically evaluated halfbred sires for the inter se matings. The
exotic donor breeds used initially were Jersey, Brown Swiss, Red Dane and Holstein–
Friesian but the choice has now narrowed down to Jersey and Holstein–Friesian.
For inter se mating of halfbreds, genetically evaluated halfbred bulls are sine qua non, but
they are precisely what India doesn’t have (with the sole exception of those in Kerala State).
While most states had been totally indifferent in managing the breeding policy as
prescribed, Kerala State had been following the policy strictly, with commendable
achievements. Punjab had completely deviated from the central prescription and has
followed a policy of its own for progressive upgrading of the local cattle with Holsteins,
taking into account the quality of farmers in Punjab and the resources available in the state.
In the absence of evaluated halfbred bulls, inter se mating in many states ran into
disrepute, as progenies in successive generations started to produce yields far below the
expected levels and the whole of the crossbreeding programme came to be regarded by many
as a very expensive misadventure, while Kerala, a state with no natural attributes for dairy
production, provided a living example of (i) the benefits of crossbreeding, (ii) sustainability
of crossbreeding and (iii) the discipline with which crossbreeding should be managed.
Kerala started with nondescript (scrub) cows and yet was able to replace some 70% of the
nondescripts with crossbreds and to increase the state’s total milk output from 0.22 million
tonnes in 1964 to 2.53 million tonnes by 1998. Figures 3 (field data) and 4 illustrate the
impact of selection (sire evaluation) on an inter se mated crossbred population. The steadily
increasing mean milk yield of the test daughters is a measure of the genetic progress in the
population.
The behaviour of the inter se mated populations of crossbreds in Kerala with regard to
the non-additively inherited traits (i.e. age at first calving, calving interval and service period)
South–South Workshop 71
Smallholder dairy production and marketing in India: Constraints and opportunities
0
500
1000
1500
2000
2500
3000
3500
83 84 85 86 87 88 89 90 91 92 93 94 95 96 97 98
Years
Numbers/kg
Daughters Mean yield
0
500
1000
1500
2000
2500
3000
3500
83 84 85 86 87 88 89 90 91 92 93 94 95 96 97 98
Years
Numbers/kg
Daughters Mean yield
Source: KLDB (1998–99 and 1999–2000).
Figure 3. Mean milk yield of test daughters (Standard first lactation).
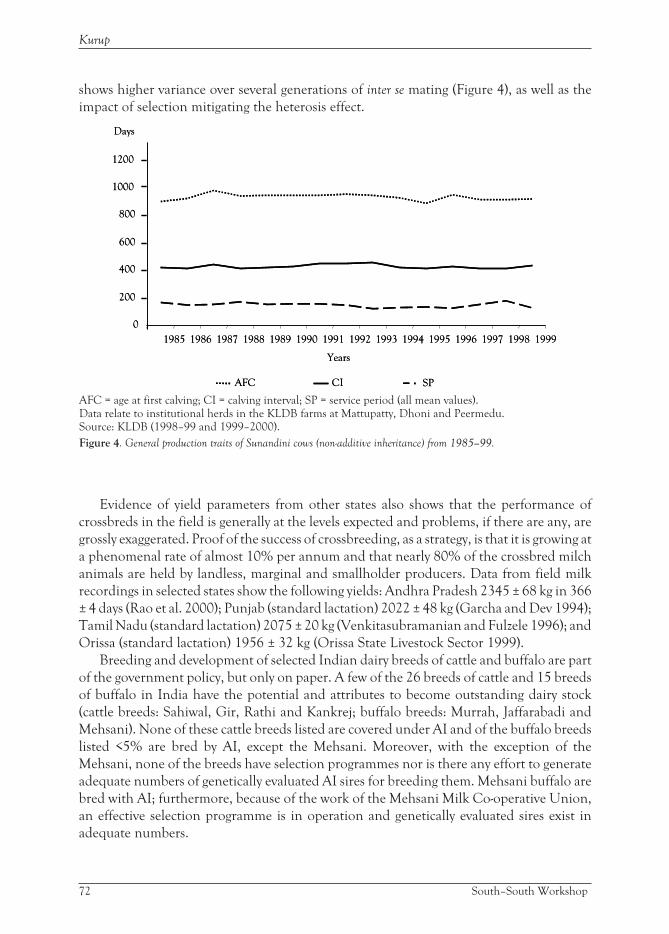
shows higher variance over several generations of inter se mating (Figure 4), as well as the
impact of selection mitigating the heterosis effect.
Evidence of yield parameters from other states also shows that the performance of
crossbreds in the field is generally at the levels expected and problems, if there are any, are
grossly exaggerated. Proof of the success of crossbreeding, as a strategy, is that it is growing at
a phenomenal rate of almost 10% per annum and that nearly 80% of the crossbred milch
animals are held by landless, marginal and smallholder producers. Data from field milk
recordings in selected states show the following yields: Andhra Pradesh 2345 ± 68 kg in 366
± 4 days (Rao et al. 2000); Punjab (standard lactation) 2022 ± 48 kg (Garcha and Dev 1994);
Tamil Nadu (standard lactation) 2075 ± 20 kg (Venkitasubramanian and Fulzele 1996); and
Orissa (standard lactation) 1956 ± 32 kg (Orissa State Livestock Sector 1999).
Breeding and development of selected Indian dairy breeds of cattle and buffalo are part
of the government policy, but only on paper. A few of the 26 breeds of cattle and 15 breeds
of buffalo in India have the potential and attributes to become outstanding dairy stock
(cattle breeds: Sahiwal, Gir, Rathi and Kankrej; buffalo breeds: Murrah, Jaffarabadi and
Mehsani). None of these cattle breeds listed are covered under AI and of the buffalo breeds
listed <5% are bred by AI, except the Mehsani. Moreover, with the exception of the
Mehsani, none of the breeds have selection programmes nor is there any effort to generate
adequate numbers of genetically evaluated AI sires for breeding them. Mehsani buffalo are
bred with AI; furthermore, because of the work of the Mehsani Milk Co-operative Union,
an effective selection programme is in operation and genetically evaluated sires exist in
adequate numbers.
72 South–South Workshop
Kurup
0
200
400
600
800
1000
1200
1985 1986 1987 1988 1989 1990 1991 1992 1993 1994 1995 1996 1997 1998 1999
Years
Days
AFC CI SP
0
200
400
600
800
1000
1200
1985 1986 1987 1988 1989 1990 1991 1992 1993 1994 1995 1996 1997 1998 1999
Years
Days
AFC CI SP
AFC = age at first calving; CI = calving interval; SP = service period (all mean values).Data relate to institutional herds in the KLDB farms at Mattupatty, Dhoni and Peermedu.Source: KLDB (1998–99 and 1999–2000).
Figure 4. General production traits of Sunandini cows (non-additive inheritance) from 1985–99.
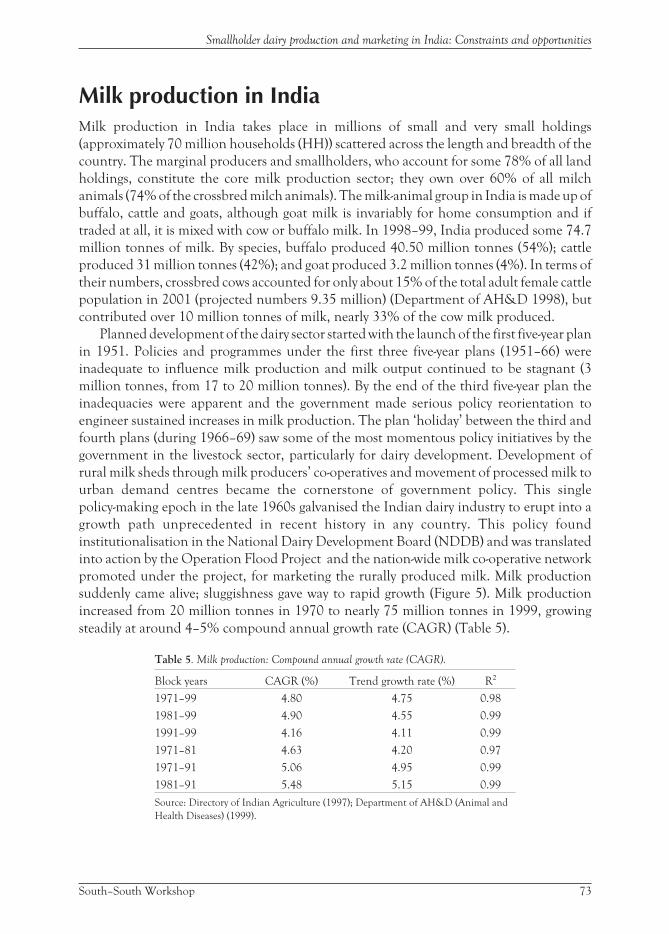
Milk production in IndiaMilk production in India takes place in millions of small and very small holdings
(approximately 70 million households (HH)) scattered across the length and breadth of the
country. The marginal producers and smallholders, who account for some 78% of all land
holdings, constitute the core milk production sector; they own over 60% of all milch
animals (74% of the crossbred milch animals). The milk-animal group in India is made up of
buffalo, cattle and goats, although goat milk is invariably for home consumption and if
traded at all, it is mixed with cow or buffalo milk. In 1998–99, India produced some 74.7
million tonnes of milk. By species, buffalo produced 40.50 million tonnes (54%); cattle
produced 31 million tonnes (42%); and goat produced 3.2 million tonnes (4%). In terms of
their numbers, crossbred cows accounted for only about 15% of the total adult female cattle
population in 2001 (projected numbers 9.35 million) (Department of AH&D 1998), but
contributed over 10 million tonnes of milk, nearly 33% of the cow milk produced.
Planned development of the dairy sector started with the launch of the first five-year plan
in 1951. Policies and programmes under the first three five-year plans (1951–66) were
inadequate to influence milk production and milk output continued to be stagnant (3
million tonnes, from 17 to 20 million tonnes). By the end of the third five-year plan the
inadequacies were apparent and the government made serious policy reorientation to
engineer sustained increases in milk production. The plan ‘holiday’ between the third and
fourth plans (during 1966–69) saw some of the most momentous policy initiatives by the
government in the livestock sector, particularly for dairy development. Development of
rural milk sheds through milk producers’ co-operatives and movement of processed milk to
urban demand centres became the cornerstone of government policy. This single
policy-making epoch in the late 1960s galvanised the Indian dairy industry to erupt into a
growth path unprecedented in recent history in any country. This policy found
institutionalisation in the National Dairy Development Board (NDDB) and was translated
into action by the Operation Flood Project and the nation-wide milk co-operative network
promoted under the project, for marketing the rurally produced milk. Milk production
suddenly came alive; sluggishness gave way to rapid growth (Figure 5). Milk production
increased from 20 million tonnes in 1970 to nearly 75 million tonnes in 1999, growing
steadily at around 4–5% compound annual growth rate (CAGR) (Table 5).
Table 5. Milk production: Compound annual growth rate (CAGR).
Block years CAGR (%) Trend growth rate (%) R2
1971–99 4.80 4.75 0.98
1981–99 4.90 4.55 0.99
1991–99 4.16 4.11 0.99
1971–81 4.63 4.20 0.97
1971–91 5.06 4.95 0.99
1981–91 5.48 5.15 0.99
Source: Directory of Indian Agriculture (1997); Department of AH&D (Animal and
Health Diseases) (1999).
South–South Workshop 73
Smallholder dairy production and marketing in India: Constraints and opportunities
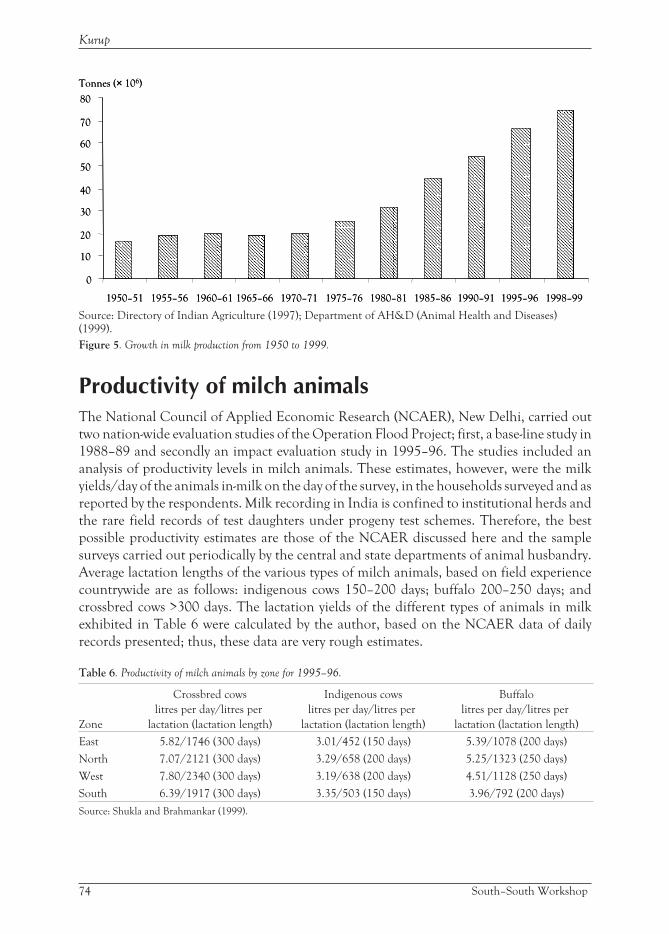
Productivity of milch animalsThe National Council of Applied Economic Research (NCAER), New Delhi, carried out
two nation-wide evaluation studies of the Operation Flood Project; first, a base-line study in
1988–89 and secondly an impact evaluation study in 1995–96. The studies included an
analysis of productivity levels in milch animals. These estimates, however, were the milk
yields/day of the animals in-milk on the day of the survey, in the households surveyed and as
reported by the respondents. Milk recording in India is confined to institutional herds and
the rare field records of test daughters under progeny test schemes. Therefore, the best
possible productivity estimates are those of the NCAER discussed here and the sample
surveys carried out periodically by the central and state departments of animal husbandry.
Average lactation lengths of the various types of milch animals, based on field experience
countrywide are as follows: indigenous cows 150–200 days; buffalo 200–250 days; and
crossbred cows >300 days. The lactation yields of the different types of animals in milk
exhibited in Table 6 were calculated by the author, based on the NCAER data of daily
records presented; thus, these data are very rough estimates.
Table 6. Productivity of milch animals by zone for 1995–96.
Zone
Crossbred cows
litres per day/litres per
lactation (lactation length)
Indigenous cows
litres per day/litres per
lactation (lactation length)
Buffalo
litres per day/litres per
lactation (lactation length)
East 5.82/1746 (300 days) 3.01/452 (150 days) 5.39/1078 (200 days)
North 7.07/2121 (300 days) 3.29/658 (200 days) 5.25/1323 (250 days)
West 7.80/2340 (300 days) 3.19/638 (200 days) 4.51/1128 (250 days)
South 6.39/1917 (300 days) 3.35/503 (150 days) 3.96/792 (200 days)
Source: Shukla and Brahmankar (1999).
74 South–South Workshop
Kurup
0
10
20
30
40
50
60
70
80
1950–51 1955–56 1960–61 1965–66 1970–71 1975–76 1980–81 1985–86 1990–91 1995–96 1998–99
Tonnes (× 106)
0
10
20
30
40
50
60
70
80
1950–51 1955–56 1960–61 1965–66 1970–71 1975–76 1980–81 1985–86 1990–91 1995–96 1998–99
Tonnes (× 106)
Source: Directory of Indian Agriculture (1997); Department of AH&D (Animal Health and Diseases)(1999).
Figure 5. Growth in milk production from 1950 to 1999.

Services for dairy productionAll services for dairy production come from the state governments through their
departments of animal husbandry. The departments have very large networks of veterinary
institutions (poly clinics, veterinary hospitals, veterinary dispensaries and livestock aid
centres) spread throughout the states and provide free veterinary services. The total number
of veterinary institutions in India in 2001 is about 51 thousand. The veterinary hospitals
and dispensaries are staffed invariably by qualified veterinarians and the livestock aid
centres by para-vets (livestock inspectors). For delivering these services, the state
governments employ about 36 thousand qualified veterinarians and 70 thousand para-vets.
Some 30 thousand of these institutions also provide AI services. The emphasis of these
departments is on curative veterinary care as a welfare measure and they have grossly
neglected preventive veterinary care. India, consequently, has several animal epidemics
ravaging the animal populations and causing annual losses amounting to about 100 billion
rupees (Rs), nearly 10% of the total output value of the entire livestock sector in India in
2001. Furthermore, the poorest of the poor in the country, the smallholders, bear the brunt
of these avoidable losses.
The services of government institutions are delivered at the institutions; the farmers have
to take their animals to the institution to receive the services. The departments of animal
health have very severe budget constraints and they spend almost 90% of their budgets on
salaries and other establishment costs. There is no money left for supplies and the institutions
receive only a token supply of medicines and consumables for animal treatment.
Consequently, the farmers have to buy their veterinary medicines and consumables from the
local trade. The services are poor and because of institutional delivery they have only a limited
reach. Because of the overwhelming presence of the governments in the service delivery sector,
free markets for these services have not developed. There are only a few (insignificant
numbers) private practitioners of animal health services. A similar situation exists for AI.
Other than the government, there is the milk co-operative system, which provides high
quality livestock services, both veterinary and AI, to its members. These services are limited
to the co-operatives’ areas of operation and account for less than 10% of total services in
terms of areas covered. In the case of AI, however, the co-operatives also have a large network
of village-based institutions, consisting of over 12 thousand DCSs with AI facilities where
farmers can get AI services delivered in their villages. There are also a few voluntary and
non-governmental agencies providing livestock services, but they are so few that they
present an insignificant percentage of the total.
India does not have a livestock extension support service except in the milk co-operative
system.
Availability and consumption of milkThe output value of the milk group in 1998–99 was Rs 826.24 billion, some 67% of the total
output value of the livestock sector (Rs 1230.76 billion at current prices). By 1999, milk had
emerged as the single largest product in Indian agriculture (74.7 million tonnes/annum)
South–South Workshop 75
Smallholder dairy production and marketing in India: Constraints and opportunities
and India became the single largest milk producing country in the world. Per capita
availability of milk decreased from 124 grammes/day in 1951 to 107 grammes/day by 1970,
but grew steadily thereafter and reached 211 grammes/day by 1999, in spite of the growth of
human population by some 250% during this period. Levels of milk consumption vary
widely between regions and economic groups, and also between urban and rural
households. The changing milk consumption pattern in households countrywide is
presented in Table 7.
Table 7. Milk consumption pattern.
National Sample SurveyOrganization (NSSO) Round
Milk consumption1 litres/HH per month
(grammes/capita per day)
Average size of HH number of
persons
Rural Urban Rural Urban
1987–88 = 43rd Round 16.25 (108)2 20.06 (142) 5.08 4.71
1991 = 47th Round 18.71 (125) 22.80 (161) 5.00 4.73
1993–94 = 50th Round 19.29 (131) 21.79 (161) 4.90 0.50
1. Consumption figures are for the household segment and do not include consumption of milk products, or outside
home consumption of milk or milk products.
2. Figures in parentheses indicate consumption in grammes/capita per day.
Source: Department of AH&D (1999).
The NCAER studies discussed earlier, among other things, also analysed the per capita
milk consumption pattern by type of household and by membership of DCSs in Operation
Flood areas. Over 75% of the member households surveyed belonged to the landless,
marginal and smallholder producers. The council came to the conclusion that milk
consumption levels in Operation Flood areas were substantially higher than national
averages and attributed the higher consumption to the economic impact of Operation
Flood on the economy of the landless, marginal producers and smallholders (Table 8).
Table 8. Per capita milk consumption in Operation Flood areas 1989–96 (grammes/capita per day).
Zone
Member household (HH) Non-member HH All HH
1988–1989 1995–1996 1988–1989 1995–1996 1988–1989 1995–1996
East 190 242 190 234 190 238
North 530 475 460 592 490 530
West 220 221 190 224 210 221
South 170 309 160 279 170 302
Source: Shukla and Brahmankar (1999).
Demand and supply for milk and milk productsMilk and milk products constitute an integral part of the daily diet of all Indian
households, without exception, across all regions and all social and economic categories.
However, consumption levels vary considerably, depending on income levels. Per capita
availability of milk in India is approaching the nutritional norm, but consumption of milk
and milk products is yet to reach its per capita potential. Rising incomes countrywide and
76 South–South Workshop
Kurup
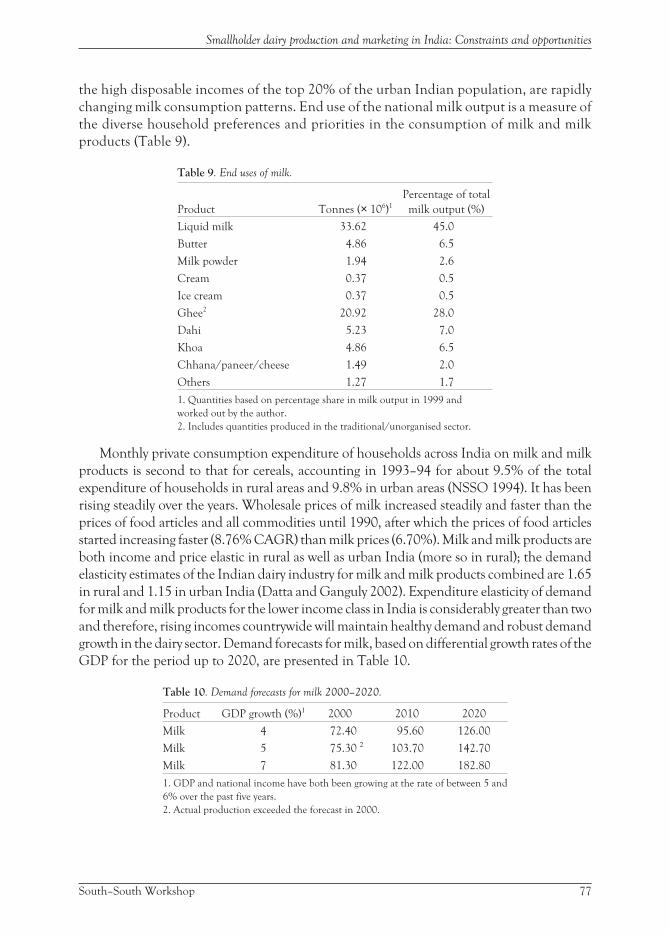
the high disposable incomes of the top 20% of the urban Indian population, are rapidly
changing milk consumption patterns. End use of the national milk output is a measure of
the diverse household preferences and priorities in the consumption of milk and milk
products (Table 9).
Table 9. End uses of milk.
Product Tonnes (× 106)1
Percentage of total
milk output (%)
Liquid milk 33.62 45.0
Butter 4.86 6.5
Milk powder 1.94 2.6
Cream 0.37 0.5
Ice cream 0.37 0.5
Ghee2 20.92 28.0
Dahi 5.23 7.0
Khoa 4.86 6.5
Chhana/paneer/cheese 1.49 2.0
Others 1.27 1.7
1. Quantities based on percentage share in milk output in 1999 and
worked out by the author.
2. Includes quantities produced in the traditional/unorganised sector.
Monthly private consumption expenditure of households across India on milk and milk
products is second to that for cereals, accounting in 1993–94 for about 9.5% of the total
expenditure of households in rural areas and 9.8% in urban areas (NSSO 1994). It has been
rising steadily over the years. Wholesale prices of milk increased steadily and faster than the
prices of food articles and all commodities until 1990, after which the prices of food articles
started increasing faster (8.76% CAGR) than milk prices (6.70%). Milk and milk products are
both income and price elastic in rural as well as urban India (more so in rural); the demand
elasticity estimates of the Indian dairy industry for milk and milk products combined are 1.65
in rural and 1.15 in urban India (Datta and Ganguly 2002). Expenditure elasticity of demand
for milk and milk products for the lower income class in India is considerably greater than two
and therefore, rising incomes countrywide will maintain healthy demand and robust demand
growth in the dairy sector. Demand forecasts for milk, based on differential growth rates of the
GDP for the period up to 2020, are presented in Table 10.
Table 10. Demand forecasts for milk 2000–2020.
Product GDP growth (%)1 2000 2010 2020
Milk 4 72.40 95.60 126.00
Milk 5 75.30 2 103.70 142.70
Milk 7 81.30 122.00 182.80
1. GDP and national income have both been growing at the rate of between 5 and
6% over the past five years.
2. Actual production exceeded the forecast in 2000.
South–South Workshop 77
Smallholder dairy production and marketing in India: Constraints and opportunities

Milk processing, value addition and marketingThe milk market in India is predominantly in the non-organised sector and is traditional
and fragmented. The organised dairy industry represents less than 20% of the total milk
produced in the country and is made up of three distinctly different sectors: the
government, the co-operative and the private. In terms of volumes of milk handled,
installed processing capacities and marketing infrastructure, the co-operative sector is by
far the largest. Furthermore, the co-operative sector includes some 10 million landless,
marginal and smallholder milk producer families, all members in the nearly 82 thousand
DCSs across the country. However, in terms of installed processing capacities alone, the
co-operative and private sectors have more or less matching capacities and the
government only a small presence (Table 11 and Figure 6). Together they have the capacity
to process about 33% of daily average milk production in the country, but they actually
handle <20%.
Table 11. Milk processing capacity.
Sector
Number of
plants
Capacity
(× 106 litres/day)
Co-operative 218 32.47
Private 366 30.26
Government 39 3.87
Total 623 66.60
Much of the processing capacity created by the private sector in the wake of the
liberalisation of the Indian economy in 1991 remains idle; only about 60% of the installed
capacity of the private sector is operated on a day-to-day basis. In the government sector too,
most of the primary processing facilities installed in rural areas (mainly milk chilling centres)
are not functional and dairy plants in the smaller towns and cities are grossly under utilised.
In the co-operative sector, all plants are used to their full capacity and remain under utilised
only during the lean production season. A little over 30% of the milk produced is retained
78 South–South Workshop
Kurup
Co-operative
49%
Private
45%
Government
6%
Co-operative
49%
Private
45%
Government
6%
Figure 6. Processing capacity (%) by sector.
in producer households. About 50% of milk is traded in through the traditional channels;
about half of this is traded without any processing, whilst the other half, going into
traditional product and sweetmeat manufacture, undergoes some traditional processing
(acid coagulation and/or heat treatment) before it is traded.
These processing capacities include liquid milk processing and manufacture of
products: milk powders, table butter and white butter, cheese, ghee, condensed milk and
milk sweets. The special infrastructure for the dairy industry mostly belongs to the
co-operative system and the NDDB, while the government and the private sector have only
limited infrastructure, such as road milk tankers and a limited cold chain. The co-operative
infrastructure covers all aspects of the industry including: milk collection (bulking, chilling
and pre-plant transport, through a network of over 82 thousand DCSs countrywide);
processing and value addition (liquid milk and milk products plants); transport (road, milk
tankers, and broad gauge and metre gauge rail milk tankers); and cold chain/storage (cold
stores, deep freezes, refrigeration trucks, warehouses and automatic milk vending units). In
addition, there are thousands of shops selling milk-based sweetmeats, all privately owned,
with their own traditional recipes, processes and products, which are outside the ambit of
the organised dairy industry.
Some 45% of the milk produced (92 million litres/day in 1999) is consumed as liquid
milk. The bulk of it is traded in the traditional channels, most of it through several tiers of
contractors. Some 16 million litres is traded as processed packaged milk: 13.5 million
litres by the co-operative sector and 2.5 million litres by over 300 private sector brands. A
very large percentage of these private sector brands is substandard, often unhygienic, as
quality and hygiene standards are seldom enforced. The co-operative network supplies
wholesome milk to some 800 cities, towns and urban agglomerations daily, mostly as
pasteurised, packaged milk but some in modern automatic bulk vending units in
metropolitan cities.
Milk products from the organised sector are marketed through a vast network of
wholesalers, distributors and tens of thousands of retailers, separate chains of them for each
brand and company. By far the largest manufacturer of milk foods in the country is the
Gujarat Co-operative Milk Marketing Federation (GCMMF), the apex co-operative body of
the Gujarat milk co-operatives, which is also the single largest food company in India, with
both national and global markets. Almost all of the milk and milk products produced in
India are traded and consumed in India itself, with export forming a tiny share of the whole.
Nevertheless, although the volumes are small, India now has a presence in the world
markets and regularly exports milk products and long-life milk to countries in West Asia,
South-east Asia, South Asia and North America. The GCMMF is the prime exporter; in
1999, it exported some 1700 t of milk powder, 400 t of ghee, 100 t of table butter, 25 t of
cheese and some 100 t of other products. This constituted almost 80% of all exports in
1999. The total value of the exports for all exporters together was some Rs 466 million in
1999. The level of imports into the country during the same year was some 17,252 t of skim
milk powder and 5224 t of butter oil. To complete the market picture for milk and milk
products in India, a sample of the milk producer prices in the DCSs, and retail prices of milk
and milk products marketed by the organised sector in the domestic markets are presented
in Table 12.
South–South Workshop 79
Smallholder dairy production and marketing in India: Constraints and opportunities

Table 12. Producer prices of milk in dairy co-operative societies (DCSs) and consumer prices in domestic markets: A sample.
S. No. Product Price in Rs1
A Liquid milk: producer prices in DCSs in December 2000
1 Punjab: cow milk containing fat 3.8%, SNF 7.80% 7.61
2 Punjab: buffalo milk containing fat 7.0%, SNF 8.60% 11.51
3 Bihar: cow milk containing fat 4.50%, SNF 8.50% 10.82
4 Bihar: buffalo milk containing fat 6.10%, SNF 8.80% 11.29
5 Mehsana: cow milk containing fat 4.40%, SNF 8.60 8.81
6 Mehsana: buffalo milk containing fat 7.40%, 9.80% 13.69
7 Tamil Nadu: cow milk containing fat 4.40%, SNF 8.10% 8.90
8 Tamil Nadu: buffalo milk containing fat 6.70 %, SNF 8.90% 10.76
B Liquid milk: consumer prices in metropolitan cities
1 Delhi: FCM, TM, DTM in 500 ml sachets FCM 17.00, TM 14.00, DTM 11.00
2 Calcutta: FCM, TM, DTM in 500 ml sachets FCM nil, TM 13.00, DTM 11.50
3 Bombay: FCM, TM, DTM in 500 ml sachets FCM 18.00, TM 13.00, DTM 10.50
4 Madras: FCM, TM, DTM in 500 ml sachets FCM 16.00, TM 13.00, DTM 10.50
C Milk products: consumer price in domestic markets
1 Skim milk powder 500 gramme pack 63.00
2 Baby food 500 gramme pack 67.00
3 Dairy whitener 500 gramme pack 69.00
4 Cheese, Cheddar 400 gramme tin 75.00
5 Cheese, Cheddar slices 200 gramme pack 42.00
6 Cheese spread 200 gramme tub 26.00
7 Cheese, Emmental 200 grammes 60.00
8 Cheese, pizza 250 grammes 60.00
9 Ghee 500 gramme sachet 77.00
10 Brown beverages 500 gramme jar 75.00
11 Sweetened condensed milk 400 gramme tin 36.00
12 Paneer 200 gramme pouch 21.00
1. All prices as in December 2000. US$ 1 = Rs 46; SNF = solids-not-fat; FCM = full cream milk; TM = toned milk; DTM =
double toned milk.
Source: Datta and Ganguly (2002).
Impact of dairy production on the smallholdersMilk production in India is the endeavour of the marginal producers and smallholders; they
constitute the core milk production group and own 66% of the ‘in-milk’ animals (NSSO
1992). The popularity of large ruminants (cattle and buffalo) with this class of landholders is
primarily because of the complementarity between land and animals in their traditional
crop–livestock farming system. The animals subsist largely on the free crop residues/crop
by-products available in the household and in return, contribute dung for fuel/enriching
the soil and farm draft power for crop production. With the increasing integration of these
80 South–South Workshop
Kurup

farm households with the output markets, cattle and buffalo also generate substantial daily
incomes for the farm family, enhancing the viability of both the household and the farming
system. Dairy production in addition enables them to utilise the idle family labour and
enjoy higher family nutritional standards.
Table 13. Observations on milk producer households in dairy co-operative society (DCS) villages.
Impact indicators Observations
1. Participation of weaker sections Over 75% of the DCS membership are landless, marginal andsmallholder producers
2. Milk retention at home 47% of the milk produced is retained at home, daily
3. Milk marketed 53% of the milk produced, daily
4. Milk consumption/capita per day 339 grammes
5. Milch animal holding Animals per HH (number) Percentage of animal holdings
5.1 Landless (15.3%)1 1.82 9.90
5.2 Marginal (38.2%) 1.63 39.80
5.3 Small (21.9%) 2.05 25.90
5.4 Semi-medium (10.3%) 2.45 12.20
5.5 Medium (4.2%) 2.88 3.30
5.6 Large (10.1%) 3.75 8.90
6. Family labour Average time spent on livestock management: 4.3 hours/day(55%)
7. Share of family labour for livestock care Men 60% of their working time; women 35% of their workingtime
1. Figures in parentheses are the percentage of DCS members by landholding category.
Source: Shukla and Brahmankar (1999).
The impact study on Operation Flood (Shukla and Brahmankar 1999) provides
interesting insights into the impact of dairy production on the economy and behaviour of the
smallholder producers in the DCS villages. In summary, landless, marginal and smallholder
producers (the core group) accounted for over 75% of the membership of the DCSs; about
76% of the milch animals owned by DCS members belonged to the core group; a large
number of landless producers owned milch animals and earned substantial incomes from
dairy production; and dairy production contributed, on average, 40% of the household
income in the East, 32% in North, 21% in the South and 34% in the West Zones.
Table 14. Share of household income (%) from different sources.
Household Dairying Crop husbandry Others Total
Landless 53.08 0.00 46.92 100
Marginal 30.14 46.55 23.30 100
Small 29.67 53.75 16.58 100
Semi-medium 26.25 58.98 14.76 100
Medium 25.33 62.77 11.91 100
Large 19.02 71.48 9.50 100
All 27.28 55.36 17.36 100
Source: Shukla and Brahmankar (1999).
South–South Workshop 81
Smallholder dairy production and marketing in India: Constraints and opportunities
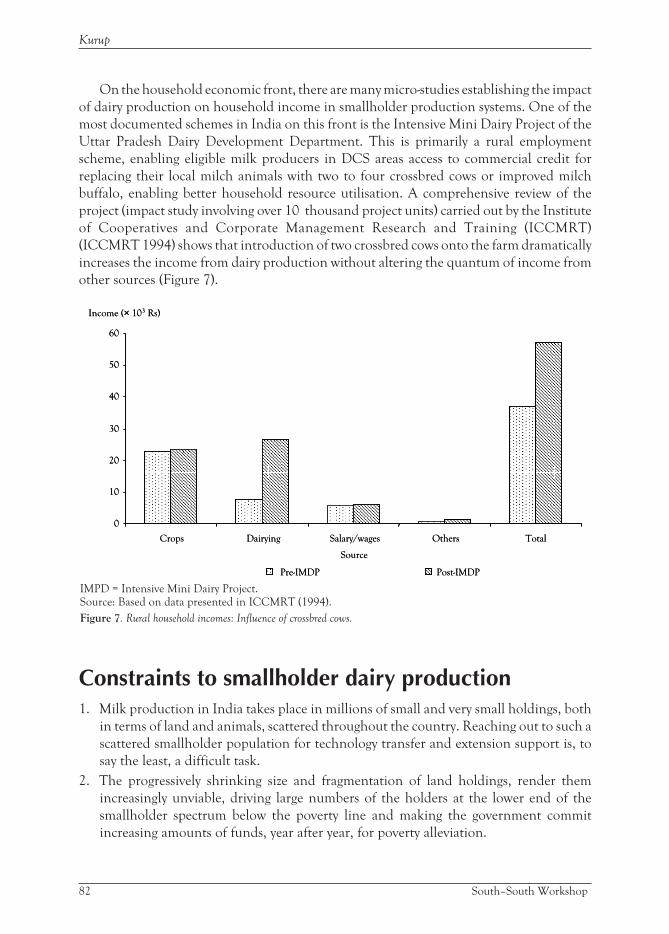
On the household economic front, there are many micro-studies establishing the impact
of dairy production on household income in smallholder production systems. One of the
most documented schemes in India on this front is the Intensive Mini Dairy Project of the
Uttar Pradesh Dairy Development Department. This is primarily a rural employment
scheme, enabling eligible milk producers in DCS areas access to commercial credit for
replacing their local milch animals with two to four crossbred cows or improved milch
buffalo, enabling better household resource utilisation. A comprehensive review of the
project (impact study involving over 10 thousand project units) carried out by the Institute
of Cooperatives and Corporate Management Research and Training (ICCMRT)
(ICCMRT 1994) shows that introduction of two crossbred cows onto the farm dramatically
increases the income from dairy production without altering the quantum of income from
other sources (Figure 7).
Constraints to smallholder dairy production1. Milk production in India takes place in millions of small and very small holdings, both
in terms of land and animals, scattered throughout the country. Reaching out to such a
scattered smallholder population for technology transfer and extension support is, to
say the least, a difficult task.
2. The progressively shrinking size and fragmentation of land holdings, render them
increasingly unviable, driving large numbers of the holders at the lower end of the
smallholder spectrum below the poverty line and making the government commit
increasing amounts of funds, year after year, for poverty alleviation.
82 South–South Workshop
Kurup
0
10
20
30
40
50
60
Crops Dairying Salary/wages Others Total
Income (× 103 Rs)
Source
Pre-IMDP Post-IMDP
0
10
20
30
40
50
60
Crops Dairying Salary/wages Others Total
Income (× 103 Rs)
Source
Pre-IMDP Post-IMDP
IMPD = Intensive Mini Dairy Project.Source: Based on data presented in ICCMRT (1994).
Figure 7. Rural household incomes: Influence of crossbred cows.
3. Institutional credit at the farm level for dairy production is extremely hard to access on
account of procedural complexities, inordinate delays and high interest rates, despite
the existence of tens of thousands of rural credit institutions including: rural credit
co-operative societies, regional rural banks and rural branches of commercial banks.
Lack of good quality credit circumscribes the potential of the smallholders for dairy
production. Even at the turn of the century, over 50% of farm level credit for
smallholder dairy production in India comes from traditional moneylenders.
4. Inputs and services for milk production enhancement are exclusively in the domain of
the state governments (some 51 thousand veterinary institutions, 36 thousand graduate
veterinarians and over 70 thousand para professionals and a host of production support
institutions). Except in the areas covered by the co-operatives under Operation Flood,
inputs and services are uniformly of substandard quality and are delivered at stationary
centres requiring transport of animals to the centres for the services to be received.
Public funds for the livestock sector are mostly squandered on services that are largely
for generating private good (i.e. curative veterinary care, not preventive veterinary care).
5. India has many animal epidemics ravaging the cattle and buffalo populations but
control of diseases is lowest among the priorities of the government (<3% of the
government veterinarians engaged in disease control). This has resulted in enormous
losses in terms of lost production (Rs 50–100 billion/year, nearly 10% of the output
value of the livestock sector) and has precluded India from joining the global markets for
dairy products. As smallholders own >70% of milch animals, they are the ones who bear
the brunt of the avoidable production losses and the investment risks.
6. India has perhaps the largest single AI network in the world (63 frozen semen
production stations, 33 million doses of frozen semen produced/year, 40 thousand AI
delivery outlets and an army of AI professionals). However, it is also one of the most
inefficient and poor quality AI services: <20% of the breeding cattle and not even 5% of
the breeding buffalo are bred by AI; bulls used for AI are not genetically evaluated and so
the AI system does not produce superior progenies generation after generation; in spite
of over 25 million AIs in a year the system produces <2 million progenies/year (<10%
conception); and the overwhelming presence of the state governments in AI services
delivery has totally prevented the emergence of free markets for AI.
7. There are widening deficits in the supply of feeds and fodder countrywide (dry fodder
such as straws/stover: production = 400 million tonnes, deficit 31%; green fodder:
production = 575 million tonnes, deficit 23%; and feed concentrates: production = 46
million tonnes, deficit 47%). Demand estimates are based on nutritional requirements
and are unrealistic. Enlarging ruminant populations compel smallholder producers to
practice livelihood strategies inimical to nature, leading to enormous environmental
costs for the burgeoning dairy production. Lack of adequate fodder and fuel wood
supplies have compelled livestock owners to allow overgrazing on common property
resources and forestlands, leading to denudation of common property resources and
deforestation of forestlands. Nearly 100 million hectares have become wasteland, nearly
a third of the total landmass of the country.
South–South Workshop 83
Smallholder dairy production and marketing in India: Constraints and opportunities

8. Government policies based on social and religious compulsions inhibit the alternate use
of large ruminants, limiting the scope and viability of dairy production. These policies
deny the smallholders of >40% of their potential income, which would have been
available from the sale of male and unproductive stock as meat animals. These policies
add untold numbers of unproductive stock to the bovine populations.
9. Large ruminants account for >90% of the livestock load on land. On a cattle equivalent
basis, their numbers are already beyond the ability of the land to support and the
continuing relentless increase in their population seriously threatens the sustainability
of all animal agriculture.
10. Liberalisation of the Indian economy and the advent of the World Trade Organization
(WTO) regulations opened up global competition in the dairy sector, exposing the
smallholder producer to unfair and unequal market regimes. The Indian Government
has fallen far short of providing them with the levels of protection and support measures
permissible under WTO; thus, failing to create for Indian smallholder producers the
much talked about level playing field even in their domestic markets.
11. The legal and regulatory framework of the government too has not kept pace with
changes in the economic regimen and the WTO. The Co-operative Societies Act
continues to be restrictive rather than enabling, even though the Anand Pattern Milk
Producers’ Co-operatives have emerged as the most stunningly effective institutional
model for smallholder dairy production. Even though processing and value addition is
pivotal to smallholder dairy production and only 15% of the milk produced in the
country is processed by the organised dairy industry, the government has not liberalised
its regulatory framework to attract the much needed capital into the processing and
value addition sector.
12. After 50 years of planned development, the government still does not have a unified
policy framework for its livestock sector and policies so far have been mostly ad hoc
pronouncements to meet development needs. Policies, therefore, have only a marginal
presence in the livestock sector, have often failed to galvanise purposeful action, have
made extensive use of direct action by government departments and yet government
presence is almost invisible in areas where it is most direly needed.
Opportunities in smallholder dairy production1. Modifying the production organisation in the dairy sector in India, by enhancing milch
animal quality and holding size within smallholder farming systems, will enable better
utilisation of available family resources. It will enormously improve production and
enhance viability across the system. The Punjab Model or the Intensive Mini Dairy
Model of Uttar Pradesh, could be used in all the major milk sheds.
2. Improving the quality of farm level credit and access to credit will enable the lower 30%
among the smallholder spectrum to move up from subsistence farming to progressively
viable crop–livestock farming, adoption of intermediate technologies (like crossbred
cattle) and achievement of progressively higher outputs and farm incomes.
84 South–South Workshop
Kurup

Reorganisation of credit institutions, simplification of procedures, reduction of interest
rates and removal of collateral security requirements, are all logical steps in the credit
reform process.
3. Restructuring of the departments of animal husbandry in states, reorienting their
mandate from curative to preventive veterinary care, moving delivery of livestock
services away from the government, progressive privatisation of the services, a
nation-wide programme for prevention and control of animal epidemics and creation of
disease-free zones will all reduce avoidable production losses to smallholders, reduce
investment risks for them, reduce the yield gap, improve output and will facilitate
India’s entry into global product markets, improving quality and viability of the entire
Indian dairy industry.
4. Given the vast AI infrastructure, delivery network and manpower that India already has,
newer institutional models, better delivery systems, better quality AI sires and more
effective AI are all possible. The results would be superior progeny generations (larger
numbers of crossbred cows and improved buffalo), better dairy stock, reduced costs and
higher incomes for smallholders.
5. India has a vast scientific manpower and research infrastructure (13 animal sciences
research institutes, over 900 animal scientists, some 1000 support staff, 17 agricultural
universities and 34 veterinary colleges) under the Indian Council of Agricultural
Research (ICAR) system, to provide the dairy sector research support. However,
reorientation of their research priorities, greater user participation and industry
funding of the research establishment will enable the growing of globalisation of the
Indian dairy industry to gain immense cost and quality advantages.
6. With the waning demand for work animals for farm power, India now has a tremendous
opportunity to reduce the overall cattle numbers through breeding better draft animals,
encouraging sharing of draft animals and promotion of agro-service centres in major
villages for custom hiring of tractors and farm implements. Reduction in bovine
numbers will progressively reduce the adverse environmental impact of smallholder
dairy production and will render the entire animal agriculture in India sustainable.
7. Restructuring the governments’ legal and regulatory framework (modernising the
Co-operative Societies Act, for example), thus liberating the co-operative movement,
will enable smallholders to extensively adopt the proven Anand Pattern Producers’
Co-operative Model to manage their assets and business interests. This will help them to
vertically integrate production, processing, value addition and marketing of milk and
milk products in domestic as well as global markets, converting India’s comparative
advantages in dairy production into globally competitive advantages.
8. Introduction of newer production technologies (like AI) and intermediate technologies
(like crossbred cows) in mixed crop–livestock farming systems in India are not
supported by extension services, which are essential for technology transfer. Though a
fairly successful attempt to set up an extension support system for the livestock sector
was made during the first two five-year plans, this gradually degenerated into service
delivery by the departments of animal husbandry in almost all states. Absence of
meaningful extension support in the livestock sector has undermined the potential of
South–South Workshop 85
Smallholder dairy production and marketing in India: Constraints and opportunities

the smallholder production systems and has rendered investment in the sector for
production enhancement and technology transfer, at least in part, unprofitable.
ReferencesDatta T.N. and Ganguly B.K. 2002. Analysis of consumer expenditure pattern in states with special reference
to milk and milk products. National Information Network, NDDB (National Dairy DevelopmentBoard) (In press). 20 pp.
Department of AH&D (Animal Health and Diseases). 1998. National Project for Cattle and Buffalo
Breeding. Department of AH&D, GoI (Government of India), New Delhi, India.
Department of AH&D (Animal Health and Diseases). 1999. Basic animal health statistics AHS series6. GoI (Government of India), New Delhi, India.
Department of AH&D (Animal Health and Diseases). 1999. Basic animal health statistics 1999. AHSseries 7. GoI (Government of India), New Delhi, India.
Directorate of Economics and Statistics. 1982. Livestock Census Tables. Government of India, NewDelhi, India.
Directorate of Economics and Statistics. 1987. Livestock Census Tables. Government of India, NewDelhi, India.
Directorate of Economics and Statistics. 1992. Livestock Census Tables. Government of India, NewDelhi, India.
Directory of Indian Agriculture. 1997. Published by the Centre for Monitoring Indian Economy(CMIE), Mumbai (see http://www.cmie.com)
DoAC (Department of Agriculture and Co-operation). 1991. Agriculture census 1990–91. GoI(Government of India), New Delhi, India.
Garcha D.S. and Dev D.S. 1994. Factors affecting milk yield performance of crossbred cattle underfield condition of Punjab. Journal of Dairying, Foods and Home Science 13(1):48–32.
GoI (Government of India). 1996. National Livestock Policy Perspectives: Report of the Steering Group
(NLP), New Delhi, India.
ICCMRT (Institute of Co-operative and Corporate Management Research and Training). 1994.Evaluation study of the Saghan Mini Dairy Project Phase I. 1991–94.
KLDB (Kerala Livestock Development Board). Annual Report 1998–99 Thiruvananthapuram-27,Kerala, India (http://www.livestockkerala.net/)
KLDB (Kerala Livestock Development Board). Annual Report 1999–2000 Thiruvananthapuram-27, Kerala, India (http://www.livestockkerala.net)
NSSO (National Sample Survey Organisation). 1992. Land and livestock holding survey: NSS 48th
Round. NSSO Report 408 (see http://www.nic.in/stat/stat_act_t13.htm)
NSSO (National Sample Survey Organisation). 1994. NSS 50th Round 1993–94. (seehttp://www.nic.in/stat/stat_act_t13.htm)
Orissa State Livestock Sector Review. 1999. Report of the Steering Committee, July 1999. (seehttp://www.orissagov.com/ecosurvey/animal/A1.htm)
Rao S.J., Rao B.V.R. and Rao G.N. 2000. Performance of crossbred cows and buffalo under villageconditions of Visskhapatnam District of Andhra Pradesh. Indian Journal of Dairy Science 53(3)222–226.
Reserve Bank of India. 1981. All India Input Survey 1980–81. (see http://www.rbi.org.in/)
86 South–South Workshop
Kurup
Shukla R.K. and Brahmankar S.D. 1999. Impact evaluation of Operation Flood on the rural dairy sector.
NCAER (National Council of Applied Economic Research), New Delhi, India (seehttp://www.ncaer.com/)
Singh G. 2001. Impact of mechanisation on draught power use in agriculture. Central Institute ofAgricultural Engineering (CIAE), Bhopal, India.
Venkitasubramanian V. and Fulzele R.M. 1996. Factors influencing production performances ofcross and indigenous cattle under field conditions. Indian Journal of Dairy Science 49(5):301–306.
South–South Workshop 87
Smallholder dairy production and marketing in India: Constraints and opportunities

Problems and prospects of smallholderdairy production and marketing in SouthAsia: An overview*
K. Singh1 and R.S. Pundir2
1. Reserve Bank of India Chair Professor-cum-Director2. Research Associate, Institute of Rural Management, Anand 388001, India
AbstractThe dairy sector in the South Asian countries of Bangladesh, India, Nepal, Pakistan and Sri
Lanka is characterised as follows: by small-scale, widely dispersed and unorganised milch
animal holders; low productivity; lack of assured year-round remunerative producer price
for milk; inadequate basic infrastructure for provision of production inputs and services,
and for procurement, transportation, processing and marketing of milk; and lack of
professional management. Other important characteristics of the dairy sector in these
countries are the predominance of mixed crop–livestock farms and the fact that most of the
milch animals are fed on crop by-products and residues, which have a very low opportunity
cost. In addition, dairy development policies and programmes followed in these countries,
including those relating to foreign trade, are not congenial to promoting sustainable and
equitable dairy development.
Low productivity of milch animals is a serious constraint to dairy development in all the
countries under review. This is due mostly to low genetic potential of the milch animals, and
inadequate and inappropriate feeding and animal health care. The productivity of dairy
animals in all five selected countries could be increased substantially through crossbreeding
of the low yielding nondescript cows with high yielding selected indigenous purebreds or
suitable exotic breeds in a phased manner and by better feeding, disease control and
management. The cattle breeding policy should also provide for the production of good
quality bullocks to meet the draft power requirement of agriculture. Upgrading of
nondescript buffalo through selective breeding with high yielding purebreds should be
given a high priority in all areas where buffalo are well adapted to the agroclimatic
conditions. While fixing procurement price, producers’ interest should receive the utmost
attention. The producer price should at least cover the long-run average cost of milk
production and provide a reasonable mark-up.
88 South–South Workshop
* The authors of this paper are grateful to the authors of the India (Kurup 2002), Bangladesh (Saadullah2002), Pakistan (Raja 2002), Nepal (Joshi and Tarak Bahadur 2002) and Sri Lanka (Bandara 2002) countrypapers, prepared for this South–South Workshop, for allowing them to draw upon their papers and toanonymous reviewers for their valuable comments on an earlier draft of the paper. However, they alone areresponsible for the views and opinions expressed in the paper and for errors of omission and commission, ifany, in the paper.

Dairy plants, cattle feed factories, technical inputs and services should be managed
professionally and run as commercial enterprises and not as social welfare schemes. The role
of governments in these countries should be to direct, co-ordinate and regulate the activities
of various organisations engaged in dairy development, to establish and maintain a level
playing field for all stakeholders and to create and maintain a congenial socio-economic,
institutional and political environment for smallholder dairy development.
On the whole, the smallholder dairy sector has high potential to be a dependable source of
livelihood for the vast majority of rural poor in the South Asian countries. The AMUL model
of small-scale dairy production and marketing, as evolved and refined over the last 50 years in
India, offers an appropriate strategy for promoting sustainable, equitable and gender-sensitive
smallholder dairy development in not only South Asian countries but also in all other
developing countries of the world. The model needs to be replicated in these countries, with
adaptations being made to suit the peculiar conditions of each specific country.
The new world trade regime ushered in by the World Trade Organization (WTO) poses
several challenges and opens up many opportunities for smallholder milk producers in
South Asian countries. There is need for these countries to enhance their competitive
economic advantage in dairy products in terms of both quality and cost. Furthermore, it is
high time that the South Asian governments formulated and announced comprehensive
dairy development policies for each of their countries. These should form an integral part of
their national development policies and due consideration should be given to their direct
and indirect effects on other sub-sectors of the economy and vice versa.
Key words: smallholder, dairy production and marketing, constraints, opportunities, SWOT
analysis, World Trade Organization, AMUL model of dairy development, South Asia.
IntroductionThe livestock sector occupies an important place in the economies of South Asian
countries. It contributes to their economies in four different ways, as it provides: (a) energy
in the form of draft and traction power for various activities and fuel for cooking and other
heating purposes; (b) food in the form of milk, milk products and meat; (c) raw materials in
the form of wool, hair, skins, hides, bones, hoof and horns and a number of other products
of pharmaceutical and industrial use; and (d) manure for crops. The livestock sector in the
South Asian countries is characterised by the preponderance of smallholders typically
possessing only one or two milch animals, low productivity, lack of proper feeding and
animal health care, an inadequate supporting infrastructure for supply of feed and
veterinary medicines, procurement, processing, storage, transport and marketing of milk.
There exists a vast untapped potential for increasing the multifarious contributions of
the dairy sector to the economies of the South Asian countries. What is needed to realise
this potential is, among other things, a comprehensive and integrated dairy development
policy and determination and total commitment from politicians and bureaucracy at all
levels in order to effectively implement the policy.
South–South Workshop 89
Problems and prospects of smallholder dairy production and marketing in South Asia

This paper presents an overview of the structure and performance of the dairy sector in
five selected South Asian countries, namely, Bangladesh, India, Nepal, Pakistan and Sri
Lanka. It identifies the problems and prospects of smallholder dairying with special
reference to production and marketing. The paper is mainly based on the country papers of
these five countries prepared for and presented at the South–South Workshop and partly
on other relevant literature available to the authors and amenable to review and analysis
within a few days. This overview begins with a brief demographic and socio-economic
profile of the South Asian countries under review.
A profile of the South Asian countriesTable 1 presents a brief demographic and socio-economic profile of the South Asian
countries under review. The five selected countries vary a great deal in terms of geographical
area, total population, density of population and literacy rate. They are, however,
comparable in terms of per capita gross domestic product (GDP), and the proportion of
their population living below the poverty line. Moreover, culturally and historically they
share many common features and could be considered as comprising the Indian
subcontinent. Overall, they are all poor developing countries.
Table 1. Some salient demographic and socio-economic features of the selected South Asian countries.
Sourceof data Feature Bangladesh India Nepal Pakistan Sri Lanka
1 Total geographical area(million km2) 1992
0.13 3.28 0.14 0.77 0.65
2 Total population (million) 1992(% of rural population)
114 (52) 884 (74) 20 (55) 119 (67)17 (78)
3 Density of population (no./km2) 1992 791 265 142 149 257
4 Adult literacy rate (%) 1997 38.9 53.5 38.5 40.9 90.7
5 Per capita GDP (1987 US$) 1997 218 465b 219 417 551
6 Percentage of population below poverty line(US$ 1 a day 1985 PPP$) (1989–94) a 28.5 35.97 53.1c 11.6 4.0
7 Human Development Index (HDI) (1997) 0.440 0.545 0.463 0.508 0.721
a. Data refer to the most recent year available during the period specified.b. Data refer to only part of the country.c. Data relate to 1996.Sources: Malhotra (1997) for sources 1–3; and UNDP (1999) for sources 4–7.
Salient characteristics of the dairy sector in theselected countriesThe dairy sector in the selected countries has emerged as an important source of livelihood
for a vast majority of the rural population, especially the poor. Besides being a source of
supplementary income and nutrition, the sector also provides draft power, fuel and organic
90 South–South Workshop
Singh and Pundir

manure. More importantly, the sector contributes significantly to the national economies of
these countries; for example, milk is the single largest contributor (in the agricultural sector)
to the national GDPs of India and Pakistan.
Milk is the cheapest source of all nutrients when compared with other food items. Thus,
it has an important role in national nutritional programmes, particularly for those below
poverty line, children and expectant mothers. It is a boon for South Asia, where per capita
incomes are low and for about 40% of the region’s population incomes are below the level
necessary to ensure adequate nutrition.
Table 2 presents a few salient characteristics of the dairy sector in the selected
countries. The dairy sector in these countries is characterised by small-scale, poor,
scattered and unorganised milk producers and low productivity. Nevertheless, it
contributes significantly to the national economies of all the countries in the region. In
India, for example, marginal producers and smallholders together hold about 78% of the
milking animals in the country. As per the findings of studies conducted by the National
Council for Applied Economic Research, cited in the India Country Paper, over 75% of
the milk producing households surveyed belonged to the landless, marginal and
smallholder categories. The study revealed, inter alia, that landless, marginal and small
producers accounted for over 75% of the membership of the dairy co-operative societies
and some 76% of the milch animals owned by the members belonged to these groups of
producers. According to the India Country Paper, milk production contributes, on
average, 40% in the East Zone, 32% in the North Zone, 21% in the South Zone and 34%
in the West Zone to the household income.
In India, some 70% of the cows and 60% of the buffalo are nondescript and have very
low productivity. To convert this huge population of low producing milch animals into
high yielding milch animals, India needs a sound breeding policy. As discussed in the
India Country Paper, the breeding policy needs to consist of: (i) selective breeding of
Indian dairy cattle for milk production; (ii) upgrading of the nondescript Indian cattle
through breeding with selected Indian donors; (iii) selective breeding of the major buffalo
breeds for milk production; and (iv) upgrading of nondescript and minor breeds of
buffalo through breeding with the Murrah buffalo breed. Crossbreeding, as a tool to
improve the quality of milch animals, is a time-tested technique in the country. However,
organised breeding operations, mainly artificial insemination services under the
government departments, reach only about 20% of the breeding animals among cattle
and <5% of the buffalo. Kerala State in India, while having no natural attributes for dairy
production, provides a living example of the benefits and sustainability of crossbreeding.
Kerala has been able to replace some 70% of its nondescript cattle with crossbreds and to
increase the state’s total milk output from 0.22 million tonnes in 1964 to 2.53 million
tonnes by 1998.
Evidence from other states in India also shows the positive yield performance of
crossbreds. Proof of the success of crossbreeding as a strategy is the growing number of
crossbred animals; numbers are increasing at the phenomenal rate of almost 10% per
annum and 80% of the crossbred milch animals are held by the landless, marginal and
smallholder producers.
South–South Workshop 91
Problems and prospects of smallholder dairy production and marketing in South Asia

Table 2. Some salient features of the dairy sector of the selected South Asian countries.
Source
of data Feature Bangladesh India Nepal Pakistan Sri Lanka
1 No. of livestock holders(million)
9.7 70 2.98 5.5 0.43
2 Total milk production(million tonnes) 1997
2.16 72 1.08 20.96 0.26
3 Total cattle population(million) 1998
23.4 209.49F 7.03F 18.00* 1.6
4 Total buffalo population(million) 1998
0.85F 91.78F 3.4 21.21 0.72
5 Average number of milchanimals (cows + buffalo)per family
4–3 1–2 3–4 3–4 2–3
6 Average milk yield 1998(kg/annum) for cows
206 877 380 1039 322
7 Percentage of cropped areaunder fodder crops
n.a. 4 n.a. n.a. n.a.
8 Average price of milk in UScents (1993–94)
22.8 24.1 20.4 29.2 21.2
9 Average consumption ofmilk (g/capita/day) 1997
48 205 131 399 n.a.
10 Average consumption ofmeat (g/capita/day) 1997
9.68 13.27 26.44 42.52 14.03
11 Annual export of milk andmilk products (thousandUS$) 1998
n.a. 6541 1051 1149 812
12 Annual import of milk andmilk products (thousandUS$) 1998
111,717 1690 3416 52,762 186,722
13 Annual export of meat andother livestock products(thousand US$) 1998
41 783,015 0 664 3124
14 Annual import of meat andother livestock products(thousand US$) 1998
10,938 82 0 20 7038
n.a. = data not available.
F = FAO estimates.
Sources: 1, 5, 6 and 7 = Country papers: Bangladesh, India, Nepal, Pakistan and Sri Lanka; 2 = GOI (1999); 3 & 4 =
FAO (1998); 9 & 10 = World Development Report (1998–99) & FAO (1999a); 11–14 = FAO (1999b).
Note: Data for export and import of meat and other livestock products include: (1) fresh, chilled and frozen meat (2) fresh
bovine meat; (3) fresh sheep meat; (4) swine meat; and (5) fresh poultry meat.
According to the National Sample Survey Organisation (NSSO) in India, the average
monthly private consumption expenditure of households on milk and milk products
(1993–94) was 9.5% of total expenditure for households in rural areas and 9.8% in urban
areas, and it had been rising steadily over the years (NSSO 1998). It was second in
magnitude only to the expenditure incurred on cereals. Furthermore, the demand forecasts
for milk at a GDP growth rate of 4% for 2010 and 2020 have been worked out to be 95.6 and
92 South–South Workshop
Singh and Pundir
126 million tonnes, respectively, while at a GDP growth rate of 7% for the same period the
forecasts are 122 and 182.8 million tonnes, respectively (Kumar 1999). As the expenditure
elasticity of demand for milk and milk products for the lower income class in India is well
over two, the rising per capita incomes for that class will sustain the current increasing trend
in their demand (NDDB 1997; cited in the India Country Paper).
Some 45% of milk produced in India is consumed as liquid milk. The bulk of it is traded
through traditional channels, comprising several tiers of private milk vendors, contractors
and mini dairies. Only about 16 million litres of milk are processed and packaged. Out of
this, 13.5 million litres is processed in the co-operative sector and 2.5 million litres by over
300 million private sector operators. A large percentage of the milk handled by the private
sector is substandard and often unhygienic, as quality and hygiene standards are seldom
enforced in the private sector.
As regards exports of dairy products, India has made its presence felt in world markets. It
regularly exports milk products and long-life milk to countries in West Asia, South-East
Asia, South Asia and North America. The Gujarat Co-operative Milk Marketing Federation
(GCMMF), which is the biggest food sector enterprise in India, is the major exporter of
dairy products (for details see Vyas 2002). In 1999, it exported about 1.7 thousand tonnes of
milk powder, 400 million tonnes of ghee, 100 million tonnes of table butter, 25 million
tonnes of cheese and about 100 million tonnes of other products valued at 466 million
Indian rupees. This constituted almost 80% of all exports in that year. During the same year,
imports of dairy products into the country amounted to some 17,252 million tonnes of
skimmed milk powder and 5224 t of butter oil (DGCIS, Calcutta; cited in the India
Country Paper).
In Pakistan, there are about 5.5 million units producing livestock, most of them are
smallholders owning one or two milch animals and no land. These smallholders produce
about 65% of all buffalo and cow milk. About 56% of all milk produced in Pakistan is
consumed by the producers themselves. After their own consumption requirements have
been met, they sell milk to 10–20 million households, either in exchange for services or for
charity reasons. About 5–6 million households in the country keep cattle, primarily to
provide draft power for crop production, with milk considered a by-product. Some milch
cows are kept along with buffalo in peri-urban milk units, which have grown in recent times
in response to the increasing demand for and price of milk in urban markets. There are
nearly 4.8 million small-scale rural units owning <6 head and 0.6 million peri-urban units.
Almost 80% of the total milk supply is derived from about 5.4 million mixed crop–livestock
farms located mostly in irrigated areas. These farms keep buffalo primarily for milk
production and indigenous cattle for draft purposes.
The demand for liquid milk and dairy products in Pakistan is likely to continue to
increase. The most important reason for this is the rapid growth of the human
population. Other variables influencing demand are the growth of per capita income and
the increasing price of milk. For the year 2010, the demand for dairy products is projected
to be 36.9 million tonnes of fresh milk equivalent, whereas production is estimated at
about 34.3 million tonnes. Unless the population grows at a lower rate than in the past,
there will be a shortfall between supply and demand; the excess demand will have to be
met by imports.
South–South Workshop 93
Problems and prospects of smallholder dairy production and marketing in South Asia
Livestock rearing is an integral part of the farming system in Bangladesh. Landless and small
(0.05–2.49 acres) farmers, who account for 79.9 and 10.2% of all farmers, respectively, own
18.45 and 29.6% of the total cattle population and produce most of the country’s milk. The
Bangladesh Country Paper also reported that only 8.4% of the farms were large (>7.5 acres of
land) and that these farms accounted for 32.4% of the total cattle population. Landless and
small farmers depend largely on livestock for their subsistence. The self-employment generation
and total income share of the animals tend to increase as the farmers’ resources, especially land
area, decrease. This suggests that animals are of great importance for landless and small farmers.
In Bangladesh, livestock and poultry rearing are viewed as means of alleviating poverty and
improving the livelihoods of landless farmers and smallholders.
As regards the production and demand scenario in Bangladesh, there is a shortfall in
production. The present availability of milk/capita per day is about 32.06 g against a
demand of 129 g. Alam (1995, as quoted in the Bangladesh Country Paper) reported that
cost of production per litre of milk for local and crossbred cows was much higher than the
price per litre of milk and thus milk production was a losing concern. One of the important
reasons for the loss incurred by the farmers was the low price of milk, which mainly resulted
from the cheap supply of imported milk powder.
As shown in Table 1, the GDP per capita in Sri Lanka in 1997 was US$ 551, which is the
highest among the five Asian countries reviewed. The average per capita expenditure on
milk was generally low, particularly in the rural areas. The average expenditure on milk and
milk products incurred by a spending unit was 3.3% in 1999. Presently, the country is facing
serious economic problems including under-nutrition (>30), underemployment (>40%),
unemployment (approximately 8.9%), and inequality of food security. The dairy sector
holds high promise as a means of alleviating these problems.
Dairy farming is mainly a smallholder dominated mixed farming system in Sri Lanka.
The agricultural sector’s contribution to the GDP was 20.7% in 1999, while that of livestock
to the agricultural GDP was 8.0%. The formal dairy sector contributes 11% of the livestock
GDP and beef production a further 15%. In 1998, the average per capita availability of cow
milk was 22.33 g/day and buffalo milk 9.86 g/day as compared with a minimum
requirement of 164.38 g/day for milk and milk products in the country. The growth rate of
the local dairy industry over the last decade has been estimated at around 2.5%, whilst the
projected market growth rate is 5.2%.
Of the five South Asian countries under review, Nepal is the least developed with a per
capita GDP of about US$ 219 in 1997 (Table 1). Approximately 89% of the population of
Nepal lives in rural areas. About 81% of the population is involved in agriculture and this
sector contributes about 40% of Nepal’s GDP. About 42% of the population of Nepal lives
below the poverty line. Furthermore, concentration of poverty is greatest in the rural areas
and in the entire agriculture sector.
In Nepal, the livestock sector contributes about one-third of agricultural GDP and 4%
of the country’s total exports. The average livestock holding is 3–4 cattle/buffalo per
household, which is the highest among the five South Asian countries. However,
productivity is very low at approximately 378 and 810 kg of milk/annum per milking cow
and buffalo, respectively. The Dairy Development Commission, which was established in
1955 and converted into the Dairy Development Board in 1962, is mainly responsible for
94 South–South Workshop
Singh and Pundir

guiding dairy development activities in the country. In order to meet the growing milk
demand in Kathmandu, the board was converted into the Dairy Development Corporation
(DDC) in July 1969. The DDC and private sector are involved in collection and processing
of milk supplied from rural areas; their shares are roughly equal (50% each). About 75
thousand farm families supply 214 thousand litres of milk/day to collection centres. Each
farmer may be supplying about three litres/day. Share of the private sector in the market has
been increasing steadily; it was <2% in 1980 but presently has increased to 46%, indicating
an average annual growth of about 15%.
As regards consumption, about 88% of urban households in Nepal consume fluid milk
regularly and another 7% occasionally. The average quantity purchased is about one
litre/day per household. In an international perspective, the cost of milk production in
Nepal is about 50% higher than that in New Zealand and Australia. Furthermore, the
marketing margins in collection, distribution, processing, marketing and distribution of
milk are as low as only 20% of those in the USA.
Smallholder milk producers are vulnerable to fluctuations in the prices of both milk and
the inputs that go into milk production. Due to these characteristics, they have very low or
practically no bargaining power vis-à-vis those to whom they sell their produce and from
whom they buy their supplies. Consequently, they are exploited on both fronts, i.e. selling
their milk and buying their production inputs. This heightens the need for government
intervention in the sector through policies aimed at equalising opportunities, at
strengthening the bargaining power of milk producers in rural areas and at restraining the
powerful from exploiting the weak. In fact, the governments have intervened in the dairy
sector by launching rural development programmes in all the selected countries.
Milk production is less vulnerable than crop production to weather-induced risks and
hence serves as an informal means of insurance for milk producers. Kurosaki (1995) in a
study of risk and insurance in a rural household economy in Pakistan observed that
livestock holding contributed to a reduction in income variability through the negative
correlation of livestock income with crop income and through ex-post disaggregation of
livestock assets contingent on a realised income in the crop sector. Empirical results of the
study suggested that increases in the share of the livestock subsector in terms of agricultural
value added should have improved the welfare of households with substantial livestock
holdings. Furthermore, the study revealed that, since smaller farms have relatively larger
livestock herds in the Pakistan Punjab, the recent phenomenon might have had an equity
improving effect as well. Studies carried out by Rosenzweig and Wolpin (1993) and
Townsend (1994) also corroborate these findings.
SWOT analyses of the dairy sectors of the selectedcountriesThe dairy sector in the selected South Asian countries has many strengths and weaknesses.
The new era characterised by privatisation and globalisation has opened up many
opportunities but also poses many threats to the smallholders. This section attempts a brief
South–South Workshop 95
Problems and prospects of smallholder dairy production and marketing in South Asia
Strength, Weaknesses, Opportunities, Threats (SWOT) analysis of the dairy sector for each
of the selected countries based on the information available in the country papers and other
published sources.
BangladeshStrengths: Plenty of surface (river) water available for seasonal fodder cultivation on
common lands; extensive waterways available for cheap transportation; very high rate of
growth of buffalo population; good scope for establishing feed manufacturing plants; good
scope for culling of less productive/unproductive animals; and a good stock of indigenous
cattle breeds adapted to the local feed resources and environment.
Weaknesses: Small and scattered animal holdings; low milk yields; shortage of feed and
fodder; lack of organised marketing of milk; low non-remunerative producer prices, leaving
no incentive for producers to increase milk production; import of milk powder at low prices,
which discourages indigenous production; high incidence of parasitic animal diseases;
inadequate institutional and infrastructural facilities; inadequate public and private
investment in the sector; poor quality of animal health care and breeding services; lack of
professional management; and lack of a well-defined national policy for dairy development.
Opportunities: Substantial scope for increasing productivity and the production of milk
through a producer-oriented price policy; substantial scope for adoption of modern
production, processing and marketing technologies; huge unfulfilled demand for milk and
milk products; and good scope for problem-solving and action-oriented research.
Threats: Heavy dependence on imports of dairy products; exposure of domestic milk
producers to unfair competition from cheap imported dairy products; lack of incentives for
increasing domestic production; and inadequate public and private interest in
modernisation of the sector.
IndiaStrengths: Sizeable population of high yielding cows and buffalo; huge domestic market for
milk and milk products; good infrastructural and institutional support for dairying; high
producer’s share (89%) in the consumer’s price of milk; availability of all kinds of machinery
and equipment for dairy plants at the most competitive rates in the world; a well-developed
and professionally managed system of dairy co-operatives set up under Operation Flood;
and the largest network of artificial insemination (AI) centres in the world.
Weaknesses: Small and scattered animal holdings; low milk yields; a large population of
unproductive cattle; socio-cultural constraints on culling less productive/unproductive
animals; shortages of feed and fodder in many milksheds; competition between man and
animals for scarce land and water resources; undue interference by the government in the
affairs of dairy co-operatives; lack of strict regulation by the government of the unethical
practices of unscrupulous private operators; lack of access for smallholders to institutional
credit; lack of professional management; and lack of a well-defined national policy for dairy
development.
96 South–South Workshop
Singh and Pundir
Opportunities: Potential for increasing the productivity of milch animals and export of
high quality dairy products since the new world trade regime came into effect; scope for
dairy sector reforms by restructuring the Departments of Animal Husbandry in Indian
states and reorienting their mandates; good scope for problem-solving and action-oriented
research funded by private agencies; and good scope for privatisation of animal health care
services in selected areas.
Threats: Unregulated competition from national and multinational private companies;
dumping of cheap dairy products on Indian markets by developed countries; unethical
practices by unscrupulous private dairy operators; and inadequate public and private
investment in modernisation of the sector.
NepalStrengths: Relatively larger livestock holdings compared with other South Asian countries;
a high growth rate of livestock production; and promotion of dairy development by the
government through investment.
Weaknesses: Small and scattered animal holdings; low milk yields; lack of basic
infrastructure; poor quality of milk and widespread adulteration of milk by private milk
vendors; no product diversification; inadequate processing capacity; lack of capital
investment; low and non-remunerative producer prices; poor quality of animal health care
and breeding services; lack of professional management; and lack of a well-defined national
policy for dairy development.
Opportunities: Potential for increasing domestic milk production through
improvement in the genetic potential of local milch animals, better animal feeding and
disease control, and a producer-oriented price policy.
Threats: Imports of dairy products at cheap prices pose a threat to domestic milk
production; and inadequate public and private investment in modernisation of the sector.
PakistanStrengths: Endowed with very good breeds of buffalo and cows; highest per capita
consumption of milk in Asia; regular culling of less productive/unproductive animals; a
high ratio of agricultural land to agricultural population; and emergence of commercial
dairy farms on a large scale.
Weaknesses: Small and scattered animal holdings; prevalence of traditional raw milk
marketing systems; poor quality of milk; lack of remunerative producer price for milk; milk
processing predominantly dependent on obsolete UHT technology; mushrooming growth
of cattle colonies in suburban areas; high cost of milk production; a long chain of
middlemen; inadequate infrastructural and institutional facilities and support; low
utilisation of installed capacity of dairy plants; the existence of the bandi system (under
which the middleman predetermines the producer’s sale price for the entire year at the rate
most beneficial to him); poor quality of animal health care and breeding services; lack of
professional management; and lack of a well-defined national policy for dairy development.
South–South Workshop 97
Problems and prospects of smallholder dairy production and marketing in South Asia

Opportunities: Huge unsatisfied domestic demand for milk and milk products; and
substantial scope for increasing domestic milk production through improvement in the
marketing system and by ensuring a year-round remunerative price to milk producers.
Threats: Unregulated imports of dairy products at cheap prices; inadequate public and
private investment in modernisation of the sector; and vested interests in perpetuating the
dependence on imports of dairy commodities.
Sri LankaStrengths: Plentiful supplies of coconut, molasses and rice bran available locally for feeding
animals; high margins available to dairy processing plants; scope for fodder cultivation
along with coconut cultivation.
Weaknesses: Small and scattered animal holdings; low milk yields; shortages of feed;
poor infrastructural/institutional facilities and support; negative trends in cattle and
buffalo population growth in the last decade; low utilisation of installed milk processing
capacity; unhealthy competition among private milk collectors; poor quality of animal
health care and breeding services; lack of professional management; and lack of a
well-defined national policy for dairy development.
Opportunities: Scope for increasing domestic milk production through improvements
in the genetic potential of local milch animals; and better animal feeding, disease control
and management.
Threats: Heavy dependence on imports of dairy products at cheap prices; inadequate
public and private interest in modernisation of the sector; and vested interests in
perpetuating the dependence on imports of dairy commodities.
In summary, the dairy sector in the South Asian countries has only a few strengths but
many constraints and weaknesses. The major weaknesses include low productivity, low
non-remunerative producer prices for milk and a lack of basic supporting infrastructure. In
rural areas, milk is mainly produced by small and marginal farmers, and landless and
agricultural labourers. In many instances, the producer price does not even cover the
out-of-pocket cash costs of milk production. This is mainly because of unregulated
competition from heavily subsidised cheap imports of milk powder and butter oil from
developed countries. While fixing procurement price, producers’ interests should receive
the utmost attention. The producer price should at least cover the long-run average cost of
milk production and provide a reasonable mark-up. Studies on cost of milk production and
its financial viability should be initiated by the Departments of Animal Husbandry or the
Dairy Development Boards/Corporations in the selected countries. Such studies should be
carried out in all major agro-climatic zones and be repeated at regular intervals of three years
or so to determine whether milk production is profitable and to furnish an objective basis
for fixing the producer price of milk. The studies may be entrusted to reputed universities or
research organisations operating in the regions selected for the studies.
Other major constraints relate to the lack of appropriate means to transport milk to
lucrative urban markets and the wide price spread between the producer and the consumer
(see Table 3). The producer is usually exploited by the middleman, particularly during the
98 South–South Workshop
Singh and Pundir

Table 3. Price spread for milk in selected South Asian countries 1993–94.
Country
Producer price for
milk (US cents)
Consumer price for
milk (US cents)
Percentage share of
producer in
consumer price
Percentage of locally
produced milk to total
consumption
Bangladesh 22.8 53.2 47 80.5
India 24.1 27 89 100.0
Nepal 20.4 30.6 67 99.5
Pakistan 29.2 55.2 53 99.2
Sri Lanka 21.2 40 52 37.8
Source: Malhotra (1997).
flush season. In many areas of Pakistan, a system of bandi exists, under which the middleman
predetermines the producer’s sale price for the entire year at the rate most beneficial to
him/her.
Seemingly, environmental effects did not receive any explicit attention in the country
recommendations for the design and implementation of dairy development policies and
programmes. Concern over the environmental effects of livestock production and
processing is a relatively recent focus. Nevertheless, in the authors’ opinion, such concern is
justified and should be translated into action in the form of policies and programmes that
are environmentally friendly, and yet financially and economically viable and sustainable.
There are many grey areas in our knowledge of the nature and magnitude of the various
constraints on smallholder dairy development in South Asian countries. What is needed is a
long-term research programme aimed at identifying and quantifying both positive and
negative factors affecting smallholder dairy development. The new research knowledge
generated could then be utilised to design and implement appropriate dairy development
policies and programmes.
India’s AMUL model of dairy development: A boonfor smallholdersThe AMUL model of small-scale dairy production and marketing, as evolved and refined
over the last 50 years in India, offers an appropriate strategy for promoting sustainable,
equitable and gender-sensitive smallholder dairy development, not only in South Asian
countries but also in many other developing countries of the world. The genesis and basic
ingredients of the model are discussed briefly in Vyas (2002).
The salient features of the AMUL model include: (1) a single commodity approach; (2) a
three-tier organisational structure; (3) producer-elected leadership and decentralised
decision making; (4) employment of professional managers and technicians; (5)
accountability of professional managers, technicians and other employees to the
member-producers through their elected leaders; (6) provision of all necessary inputs and
services to member-producers at reasonable, often subsidised rates; (7) integration of
production, procurement, processing and marketing functions; (8) continuous and
South–South Workshop 99
Problems and prospects of smallholder dairy production and marketing in South Asia
concurrent audit; (9) cash payment to producers for their milk—daily or weekly; and (10)
contribution to village amenities (Singh 1999).
The Anand Pattern Dairy Co-operatives (APDCs) provide their members with a
complete package of inputs and services necessary for enhancing milk production. The
package includes animal health care through both regular as well as emergency visits by
veterinary doctors, AI, balanced cattle feed, improved fodder seeds, and extension
education and training. More importantly, the APDCs provide a year-round and assured
market for the producers’ milk at a remunerative price.
In summary, the AMUL model is producer-oriented, people-centred and holistic. It
emphasises the integrated development of all the important facets of the dairy industry,
namely: production, procurement, processing, pricing, marketing, training and
management. Moreover, it advocates the use of appropriate technical, economic and
institutional instruments to promote smallholder dairy development.
Challenges and opportunities for small livestockholders under the new world trade regimeAll the selected South Asian countries are signatories to the agreement that led to the
establishment of the WTO and therefore, are obliged to follow the dictates of the new world
trade regime spearheaded by the WTO. The new regime concerning dairy products became
effective on 1 July 1995. Liberalisation of world trade in dairy products under the new trade
regime poses new challenges and has opened up new export opportunities for the dairy
industry in South Asian countries. There is need for these countries to enhance their
competitive economic advantage in dairy products, in terms of both quality and cost, and to
enhance their credibility in international markets. The role of governments in these
countries should be to direct, co-ordinate and regulate the activities of various organisations
engaged in dairy development, to establish and maintain a level playing field for all
stakeholders and to create and maintain a congenial socio-economic, institutional and
political environment for smallholder dairy development through appropriate policies and
programmes.
The new trade regime is not expected to affect the overall world trade in milk and milk
products. However, there will be some redistribution in terms of regions of origin and
destination. It is expected that the decreased volume of subsidised exports of dairy products
from several developed countries will be offset, to some extent, by increased export from
countries like India, which do not subsidise their exports of dairy products.
In order to benefit from the new trade opportunities, India and other South Asian
countries will need to set and enforce high quality standards for various dairy products
through an independent non-governmental authority and to improve the basic
infrastructure (particularly the ports) and the air transport system. They will also need to
improve their competitive advantage in milk production by improving milk yields to reduce
the per litre cost of production and by improving the quality of their products by adopting
the latest processing and packaging technologies and professional management.
100 South–South Workshop
Singh and Pundir

Compliance with phytosanitary specifications will also be necessary in order to increase the
export of dairy products. A general switch to higher-value dairy products consequent upon
increased access to high-priced markets in developed countries is also likely to occur (for
more details see Sharma 2002).
In today’s context, trade between neighbours is the harbinger of goodwill and economic
uplift. In this context, the South Asian Preferential Trade Arrangement (SAPTA), which
became operational in December 1995, is a welcome and significant development. It aims
to facilitate trade among South Asian countries through preferential tariffs. The South
Asian countries have identified a substantial number of commodities for preferential
trading among themselves. Previously, they used to import/export some of these
commodities indirectly from their neighbours through distant third parties. Besides the
preferential tariff, the other gain to South Asian trade from SAPTA should be a drastic
reduction in transportation costs. It is hoped that, following SAPTA, trade in dairy products
among South Asian countries will usher in an era of prosperity in the region (Malhotra
1997).
Conclusions and their implicationsThe dairy sector in the South Asian countries of Bangladesh, India, Nepal, Pakistan and Sri
Lanka is characterised by: small-scale, scattered and unorganised milch animal holders; low
productivity; inadequate and inappropriate animal feeding and health care; lack of assured
year-round remunerative producer price for milk; inadequate basic infrastructure for
provision of production inputs and services; inadequate basic infrastructure for
procurement, transportation, processing and marketing of milk; and lack of professional
management. Other important characteristics of the dairy sector are the predominance of
mixed crop–livestock farms and the fact that most of the milch animals are fed on crop
by-products and residues, which have very low opportunity costs. Additionally, dairy
development policies and programmes followed in these countries, including those relating
to foreign trade are not congenial to the promotion of sustainable and equitable dairy
development.
Low productivity of milch animals is a serious constraint to dairy development in all the
countries under review. The productivity of dairy animals in the five selected countries
could be increased by crossbreeding the low yielding nondescript cows with high yielding
selected indigenous purebreds or suitable exotic breeds in a phased manner. The cattle
breeding policy should not only focus on milk yield but should also provide for the
production of good quality bullocks to meet the draft power requirement of agriculture.
Upgrading of nondescript buffalo through selective breeding with high yielding purebreds,
such as Murrah, Mehsani or Nili Ravi, should be given high priority in all areas where
buffalo are well adapted to the agro-climatic conditions.
While fixing procurement price, producers’ interests should receive the utmost
attention. The producer price should at least cover the long-run average cost of milk
production and provide a reasonable mark-up. Studies on cost of milk production and its
financial viability should be initiated by the Departments of Animal Husbandry or the
South–South Workshop 101
Problems and prospects of smallholder dairy production and marketing in South Asia
Dairy Development Boards/Corporations in the selected countries. Such research need to
be carried out in all the major agro-climatic zones and should be repeated at regular intervals
of approximately three years to determine whether milk production is profitable and to
furnish an objective basis for fixing producer price of milk. The studies may be entrusted to
reputed universities/research organisations operating in the regions selected for the studies.
Despite all the problems it faces, the dairy sector holds high promise as a dependable
source of livelihood for the vast majority of the rural poor in the South Asian countries. The
AMUL model of small-scale dairy production and marketing, as evolved and refined over
the last 50 years or so in India, holds high promise for smallholder dairy development in
these countries. The model needs to be replicated in all the South Asian countries with
adaptations made to suit the specific conditions of the countries concerned.
Liberalisation of world trade in dairy products under the new trade regime of the WTO
poses new challenges and has opened up new export opportunities for the dairy industry in
South Asian countries. These countries need to enhance their competitive economic
advantage in dairy products, in terms of both quality and cost, and to enhance their
credibility in international markets. The role of governments in these countries should be to
direct, co-ordinate and regulate the activities of various organisations engaged in dairy
development, to establish and maintain a level playing field for all stakeholders and to create
and maintain a congenial socio-economic, institutional and political environment for
smallholder dairy development. There is need for each South Asian government to
formulate and announce a comprehensive dairy development policy for their country. Such
policy should be an integral part of their national development policy and due
consideration should be given to its direct and indirect effects on other subsectors of the
economy and vice-versa.
While exploring possibilities for the future of smallholder dairying in the South Asian
Region, it is essential for us to acknowledge the variations among individuals and groups of
milk producers, countries and regions and the impact of factors as diverse as dietary
preferences, alternative occupations, trade regulations and subsidies. In the various
production systems and less favourable climates of the South Asian countries, low
production is related to the inherent poverty of individual producers and to the producer’s
ability to utilise by-products in the intensive manner used in more developed countries.
In the past, management has been the key factor in the success of smallholder dairying.
This is evidenced by the experiences of AMUL, Operation Flood and many other successful
dairy development projects. The future of smallholder dairying will also rely on the
continued adaptation of management techniques to suite markets, environments and
socio-economic conditions. Managing dairy plants and cattle feed factories is not the
business of the government; it is better left to professional managers who are employees of
the milk co-operatives and hence are accountable to their member milk producers.
Integration of dairy farming with crop production systems in South Asia is a special
feature of smallholder dairying, which is not understood widely in dairy monoculture
production systems. An integrated crop–dairy production system model indicates the
incremental benefits in the form of draft power, meat and a range of other products
provided through dairying as an adjunct to crops and productive use of crop by-products
and residues, both of which have very low opportunity costs. Furthermore, milk production
102 South–South Workshop
Singh and Pundir
is less vulnerable to weather-induced risks than crop production and hence serves as an
informal means of insurance for milk producers.
ReferencesBandara B.H.W.M.U.S. 2002. The current status of smallholder dairy systems in Sri Lanka. In:
Rangnekar D. and Thorpe W. (eds), Smallholder dairy production and marketing—Opportunities and
constraints. Proceedings of a South–South workshop held at NDDB, Anand, India, 13–16 March 2001.NDDB (National Dairy Development Board), Anand, India, and ILRI (International LivestockResearch Institute), Nairobi, Kenya.
Bhasin N.R. 1997. A grand opportunity. In: Gupta P.R. (ed), Dairy India 1997. 5th edition. A-25Priyadarshini Vihar, New Delhi, India.
Falvey L. 1999. The future for smallholder dairying. In: Falvey L. and Chantalakhana C. (eds),Smallholder dairying in the tropics. ILRI (International Livestock Research Institute), Nairobi,Kenya. pp. 417–432.
FAO (Food and Agriculture Organization of the United Nations). 1998. Production year book 1998.
FAO, Rome, Italy.
FAO (Food and Agriculture Organization of the United Nations). 1999a. Production year book 1999.FAO, Rome, Italy.
FAO (Food and Agriculture Organization of the United Nations). 1999b. Trade yearbook 1999. FAO,Rome, Italy.
GoI (Government of India). 1999. Basic animal husbandry statistics 1999. Department of AnimalHusbandry, Government of India, New Delhi, India.
Griffin M. 1997. India: Slumbering giant of the international dairy trade. In: Gupta P.R. (ed), Dairy
India 1997. 5th edition. A-25, Priyadarshini Vihar, New Delhi, India.
Gupta P.R. (ed). 1997. Dairy India 1997. 5th edition. A-25 Priyadarshini Vihar, New Delhi, India.
Hiremath B.N. and Sriram M.S. 1996. Competition, financial viability and sustainability of Chitoor
Union: A case study. Institute of Rural Management, Anand, India.
Joshi D.D. and Tarak Bahadur K.C. 2002. An overview of smallholder dairy production andmarketing in Nepal. In: Rangnekar D. and Thorpe W. (eds), Smallholder dairy production and
marketing—Opportunities and constraints. Proceedings of a South–South workshop held at NDDB, Anand,
India, 13–16 March 2001. NDDB (National Dairy Development Board), Anand, India, and ILRI(International Livestock Research Institute), Nairobi, Kenya.
Kumar P. 1999. Food demand and supply projections for India. Indian Agricultural Research Institute,New Delhi, India.
Kurosaki T. 1995. Risk and insurance in a household economy: Role of livestock in mixed farming inPakistan. The Developing Economies 33(4):464–483.
Kurup M.P.G. 2002. Smallholder dairy production and marketing in India: Constraints andopportunities. In: Rangnekar D. and Thorpe W. (eds), Smallholder dairy production and marketing—
Opportunities and constraints. Proceedings of a South–South workshop held at NDDB, Anand, India, 13–16
March 2001. NDDB (National Dairy Development Board), Anand, India, and ILRI (InternationalLivestock Research Institute), Nairobi, Kenya.
Malhotra R. 1997. SAARC dairy grid. In: Gupta P.R. (ed), Dairy India 1997. 5th edition. A-25Priyadarshini Vihar, New Delhi, India.
NSSO (National Sample Survey Organisation). 1998. NSS Report of the 50th Round: 1993–94. NSSO,New Delhi, India.
South–South Workshop 103
Problems and prospects of smallholder dairy production and marketing in South Asia

Raja R.H. 2002. Pakistan smallholder dairy production and marketing. In: Rangnekar D. andThorpe W. (eds), Smallholder dairy production and marketing—Opportunities and constraints.
Proceedings of a South–South workshop held at NDDB, Anand, India, 13–16 March 2001. NDDB(National Dairy Development Board), Anand, India, and ILRI (International Livestock ResearchInstitute), Nairobi, Kenya.
Rosenzweig M.R. and Wolpin K.I. 1993. Credit market constraints, consumption smoothing andthe accumulation of durable production assets in low-income countries: Investments in bullocksin India. Journal of Political Economy 101(2):223–244.
Saadullah M. 2002. Smallholder dairy production and marketing in Bangladesh. In: Rangnekar D.and Thorpe W. (eds), Smallholder dairy production and marketing—Opportunities and constraints.
Proceedings of a South–South workshop held at NDDB, Anand, India, 13–16 March 2001. NDDB(National Dairy Development Board), Anand, India, and ILRI (International Livestock ResearchInstitute), Nairobi, Kenya.
Sharma V.P. 2002. Implications of international trade regulations (World Trade Organizationagreement on agriculture and Codex Standards) for smallholder dairy development. In:Rangnekar D. and Thorpe W. (eds), Smallholder dairy production and marketing—Opportunities and
constraints. Proceedings of a South–South workshop held at NDDB, Anand, India, 13–16 March 2001.NDDB (National Dairy Development Board), Anand, India, and ILRI (International LivestockResearch Institute), Nairobi, Kenya.
Singh K. 1999. Rural development: Principles, policies and management. 2nd edition. Sage Publications,New Delhi, India.
Townsend R.M. 1994. Risk and insurance in village India. Econometrica 62(3):539–591.
UNDP (United Nations Development Programme). 1999. Human Development Report 1999. OxfordUniversity Press, New York, USA.
Vyas B.M. 2002. Institutional structure to sustain smallholder dairy marketing—The AMUL model.In: Rangnekar D. and Thorpe W. (eds), Smallholder dairy production and marketing—Opportunities
and constraints. Proceedings of a South–South workshop held at NDDB, Anand, India, 13–16 March
2001. NDDB (National Dairy Development Board), Anand, India, and ILRI (InternationalLivestock Research Institute), Nairobi, Kenya.
World Bank. 1998–99. World Bank Development Report 1999. Oxford University Press, Delhi, India.
104 South–South Workshop
Singh and Pundir
Dairy development in Thailand and a casestudy on environmental impacts ofperi-urban dairy colonies. Part I.Smallholder dairy developmentC. Chantalakhana1 and P. Skunmun2
1. Professor Emeritus2. Senior Livestock ScientistKasetsart University, P.O. Box 1014, Kasetsart P.O., Bangkok 10903, Thailand
IntroductionIn the 1940s and early 1950s, dairy farming in Thailand was considered unimportant. It was
mainly in the hands of small-scale dairy cattle raisers, of Indian or Pakistan origin, who
mostly lived in the suburban areas of Bangkok. At this time, most dairy products consumed
by Thai people were produced from imported products, mainly powdered milk and infant
milk powder; consumption of fresh whole milk was very limited. Promotion of dairy cattle
rearing was confined to experimental scale and was carried out by the Department of
Livestock Development and Kasetsart University; both belonged to the Ministry of
Agriculture and Co-operatives (MOAC) at that time. Interest in dairy farming only became
significant during the late 1950s when groups of farmers, especially those in Ratchaburi
(Nong Pho), Nakhon Pathom and Ayutthaya Provinces, started to form dairy colonies. They
showed that dairy farming using crossbred cattle and technologies that were relatively new at
that time (such as artificial insemination (AI), forage crops, balanced rations or concentrate
mixtures) could be economically viable and profitable. Furthermore, by this time milk
consumption in Thailand (including the consumption of fresh milk) had started to rise at a
faster rate than previously.
From 1961, the milk processing industry began to develop and expand its production
of milk for drinking, using both fresh milk and milk recombined from imported
ingredients. However, dairy farmers, who were mostly small-scale with few milking cows,
were confronted by several serious constraints. Among those constraints were the
problems of milk marketing and distribution to consumers. A further constraint was the
relatively low milk yield per dairy cow in Thailand (3–5 kg/day); this poor yield was
aggravated by a lack of appropriate knowledge and technology for dairy production in the
humid tropics.
During the 1960s, several dairy development projects were tested in Thailand, including
government projects by the Department of Livestock Development (belonging to the
MOAC), as well as some projects sponsored by foreign aid, such as the Thai–Danish Dairy
South–South Workshop 105

Project in Muak Lek (Saraburi Province) and the Thai–German Dairy Project in Chiang
Mai Province. After several years of dairy promotion in various parts of the country, many
different problems and their solutions had been identified and many lessons had been
learned through such experiences. The final conclusion that was eventually drawn from the
various dairy development projects, which encountered different degrees of difficulties in
dairy rearing in the different regions of the country, was that dairy production in Thailand
was sound technically, economically and socially, especially in its contribution towards
better nutrition and improved well-being of the Thai people.
In the meantime, an increasing number of Thai consumers, who were traditionally not
milk drinkers, began to realise the nutritional value of milk. The increase in demand for
fresh milk become quite evident in the 1970s, and the numbers of dairy farmers and dairy
cows continued to grow, including those in the provinces of Ratchaburi, Nakhon Pathom,
Ayutthaya, Saraburi and Chiang Mai. By this time, the government’s agricultural policies
stated clearly a policy on the promotion of dairy production.
In 1971, the Thai–Danish Dairy Farm, which started in 1962 with assistance from the
Government of Denmark, was handed over to the MOAC to become the Dairy Promotion
Organisation of Thailand (DPOT). Similarly, the Thai–German Dairy Project, which
started in 1965 with assistance from West Germany, was handed over to the Department of
Livestock Development (DLD) in the latter part of 1977. These two agencies, DPOT and
DLD, continued to play a significant role in dairy development in Thailand, along with
other agencies concerned with dairy production, training and education, processing and
marketing. The infrastructure for dairy development (such as facilities for farmer training,
AI centres and other technical facilities, milk collection centres, dairy processing plants,
research, education and other development facilities) received increasing support from the
government, and from private investors during the 1970s. However, marketing of fresh
milk remained a problem to dairy farmers; while dairying was expanding to almost all
regions of the country, fresh milk faced market competition from recombined milk
prepared using cheap imports of skimmed powdered milk.
Dairy production in Thailand began to boom in the early 1980s, particularly following
the enaction of two important legislative regulations in 1983. The Ministry of Industries
introduced the skimmed milk importation regulation which requires producers of
pasteurised or UHT (sterilised) milk to use a mixture of at least 1:1 raw fresh milk to
recombined milk. At the same time, the Ministry of Commerce introduced the import and
export products regulation, which introduced a permit system for imports of milk; this
regulation has similar effects to the Ministry of Industries regulation. For example,
according to the latest import and export products regulation, imports are allowed on the
guarantee that the manufacturer will purchase 20 kg of fresh milk for each 1 kg of imported
powdered milk.
Currently, local milk production comprises only about 20% of the total consumption;
the rest has to be imported. Between 1994 and 1997, the demand for drinking milk and
milk products in Thailand increased by almost 3% per year, while domestic milk
production increased by almost 20% per year. Nevertheless, milk demand was larger than
supply, the deficit ranged from 131 to 400 thousand tonnes of milk/year (Table 1).
106 South–South Workshop
Chantalakhana and Skunmun
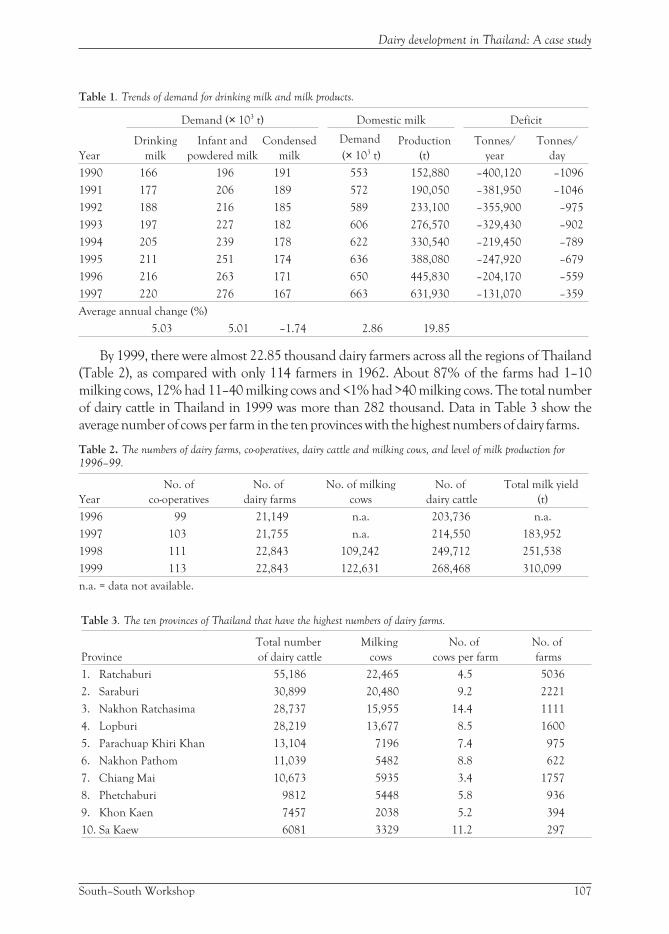
Table 1. Trends of demand for drinking milk and milk products.
Demand (× 103 t) Domestic milk Deficit
Year
Drinking
milk
Infant and
powdered milk
Condensed
milk
Demand
(× 103 t)
Production
(t)
Tonnes/
year
Tonnes/
day
1990 166 196 191 553 152,880 –400,120 –1096
1991 177 206 189 572 190,050 –381,950 –1046
1992 188 216 185 589 233,100 –355,900 –975
1993 197 227 182 606 276,570 –329,430 –902
1994 205 239 178 622 330,540 –219,450 –789
1995 211 251 174 636 388,080 –247,920 –679
1996 216 263 171 650 445,830 –204,170 –559
1997 220 276 167 663 631,930 –131,070 –359
Average annual change (%)
5.03 5.01 –1.74 2.86 19.85
By 1999, there were almost 22.85 thousand dairy farmers across all the regions of Thailand
(Table 2), as compared with only 114 farmers in 1962. About 87% of the farms had 1–10
milking cows, 12% had 11–40 milking cows and <1% had >40 milking cows. The total number
of dairy cattle in Thailand in 1999 was more than 282 thousand. Data in Table 3 show the
average number of cows per farm in the ten provinces with the highest numbers of dairy farms.
Table 2. The numbers of dairy farms, co-operatives, dairy cattle and milking cows, and level of milk production for
1996–99.
Year
No. of
co-operatives
No. of
dairy farms
No. of milking
cows
No. of
dairy cattle
Total milk yield
(t)
1996 99 21,149 n.a. 203,736 n.a.
1997 103 21,755 n.a. 214,550 183,952
1998 111 22,843 109,242 249,712 251,538
1999 113 22,843 122,631 268,468 310,099
n.a. = data not available.
Table 3. The ten provinces of Thailand that have the highest numbers of dairy farms.
Province
Total number
of dairy cattle
Milking
cows
No. of
cows per farm
No. of
farms
1. Ratchaburi 55,186 22,465 4.5 5036
2. Saraburi 30,899 20,480 9.2 2221
3. Nakhon Ratchasima 28,737 15,955 14.4 1111
4. Lopburi 28,219 13,677 8.5 1600
5. Parachuap Khiri Khan 13,104 7196 7.4 975
6. Nakhon Pathom 11,039 5482 8.8 622
7. Chiang Mai 10,673 5935 3.4 1757
8. Phetchaburi 9812 5448 5.8 936
9. Khon Kaen 7457 2038 5.2 394
10. Sa Kaew 6081 3329 11.2 297
South–South Workshop 107
Dairy development in Thailand: A case study

Traditionally, Thai people are not milk drinkers. In 1956, it was reported that per capita
milk consumption (drinking milk) was as low as 0.15–20.00 cm3. (Supamala 1969).
However, by 1987 per capita consumption of drinking milk in Thailand had increased to
2.32 kg/year. The increase in consumption of drinking milk, as well as other milk products
such as sweetened condensed milk, has continued steadily every year. In 1994, it was
estimated that Thai people consumed almost 7 kg of drinking milk/year per person. Milk
consumption, especially consumption of drinking milk, is confined almost totally to urban
or peri-urban populations where marketing facilities and purchasing power exist.
Production systemsBetween 95% and 99% of dairy farms in Thailand can be classified as small-scale or
smallholder farms under mixed crop–livestock farming systems. Some of the older dairy
colonies have become peri-urban smallholder dairying systems but these still rely on the use
of crop wastes and residues, such as corn stover from neighbouring farming areas, as a
source of feed supply. For smallholder dairy farms in rural areas, the dairy operation is
generally integrated with the production of rice, upland crops, orchard crops or various
plantation crops. There is a general tendency for the number of milking cows owned by each
smallholder to increase. Moreover, there is a steady shift in the role of dairying from
providing a source of supplementary income to being a major or specialised enterprise in
mixed farming systems.
Almost all dairy cows in Thailand are crossbreds between Holstein–Friesians (HF) and
zebu breeds (such as Red Sindhi or Sahiwal). Most of these animals are F2 or F3 crosses, many
of them produce milk yields as high as 5 thousand kg in 305 days but most of them produce
around 2500–3000 kg per lactation. These crossbreds are relatively well adapted to local
conditions and are well accepted by farmers. Purebred HF could be reared to increase the
level of milk production, but the cost of production per kg of milk remains economically
unviable. Milk yields of some highly selected F3 or F4 crossbreds are as high or higher than
the average milk yields of some purebreds.
The use of crop residues, such as corn stover, rice straw, soybean stems or pineapple peel
is very common. The use of silage or hay is less common. Silage is used only by large-scale
dairy farms. For routine use as cattle feed, hay is too expensive. However, shortages of
roughage feeds are serious in dry or summer seasons and farmers have to buy hay or straw, or
have to increase their use of commercial mixed rations. Animal health care and AI are
generally offered as dairy co-operative or government services.
Most farmers receive credit from the Bank of Agriculture and Agricultural
Co-operatives (BAAC). Moreover, many of them receive loans from commercial banks,
relatives or local money lenders. In general, dairy training for farmers is provided by dairy
co-operatives, DPOT, DLD or the Department of Co-operatives Promotion (DCP).
Data in Table 4 show the cost of components of dairying in Thailand (Skunmun and
Chantalakhana 2000). Feed costs constitute 51–67% of the costs involved in dairying
(average = 58%).
108 South–South Workshop
Chantalakhana and Skunmun
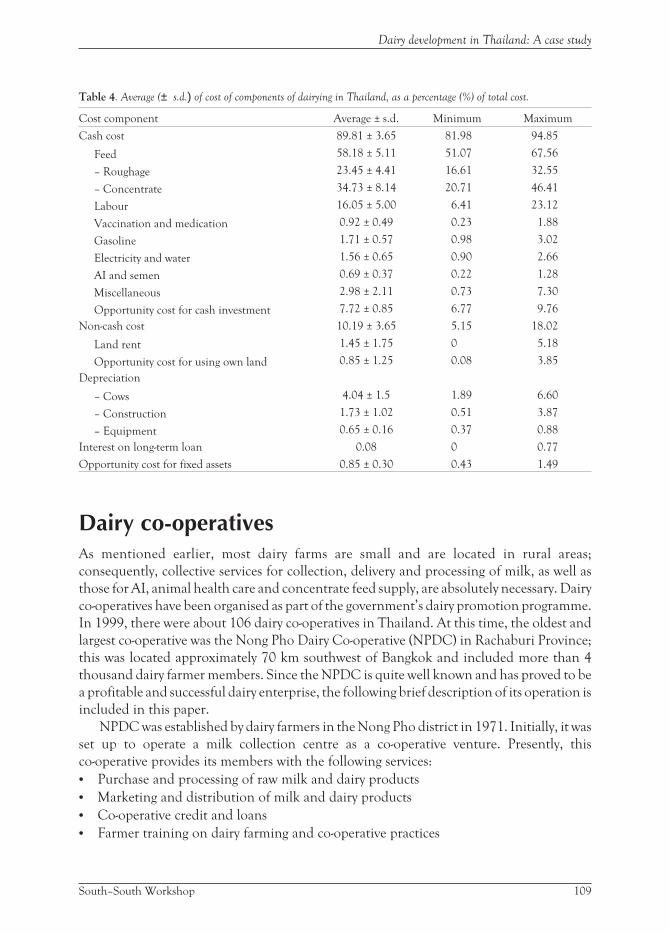
Table 4. Average (± s.d.) of cost of components of dairying in Thailand, as a percentage (%) of total cost.
Cost component Average ± s.d. Minimum Maximum
Cash cost 89.81 ± 3.65 81.98 94.85
Feed 58.18 ± 5.11 51.07 67.56
– Roughage 23.45 ± 4.41 16.61 32.55
– Concentrate 34.73 ± 8.14 20.71 46.41
Labour 16.05 ± 5.00 6.41 23.12
Vaccination and medication 0.92 ± 0.49 0.23 1.88
Gasoline 1.71 ± 0.57 0.98 3.02
Electricity and water 1.56 ± 0.65 0.90 2.66
AI and semen 0.69 ± 0.37 0.22 1.28
Miscellaneous 2.98 ± 2.11 0.73 7.30
Opportunity cost for cash investment 7.72 ± 0.85 6.77 9.76
Non-cash cost 10.19 ± 3.65 5.15 18.02
Land rent 1.45 ± 1.75 0 5.18
Opportunity cost for using own land 0.85 ± 1.25 0.08 3.85
Depreciation
– Cows 4.04 ± 1.5 1.89 6.60
– Construction 1.73 ± 1.02 0.51 3.87
– Equipment 0.65 ± 0.16 0.37 0.88
Interest on long-term loan 0.08 0 0.77
Opportunity cost for fixed assets 0.85 ± 0.30 0.43 1.49
Dairy co-operativesAs mentioned earlier, most dairy farms are small and are located in rural areas;
consequently, collective services for collection, delivery and processing of milk, as well as
those for AI, animal health care and concentrate feed supply, are absolutely necessary. Dairy
co-operatives have been organised as part of the government’s dairy promotion programme.
In 1999, there were about 106 dairy co-operatives in Thailand. At this time, the oldest and
largest co-operative was the Nong Pho Dairy Co-operative (NPDC) in Rachaburi Province;
this was located approximately 70 km southwest of Bangkok and included more than 4
thousand dairy farmer members. Since the NPDC is quite well known and has proved to be
a profitable and successful dairy enterprise, the following brief description of its operation is
included in this paper.
NPDC was established by dairy farmers in the Nong Pho district in 1971. Initially, it was
set up to operate a milk collection centre as a co-operative venture. Presently, this
co-operative provides its members with the following services:
• Purchase and processing of raw milk and dairy products
• Marketing and distribution of milk and dairy products
• Co-operative credit and loans
• Farmer training on dairy farming and co-operative practices
South–South Workshop 109
Dairy development in Thailand: A case study
• Feed mill and dairy concentrate feeds
• AI services and other technical advice and
• Dairy tools and equipment.
In 1992, there were 4358 farmer members, with similar numbers of men and women.
The farmer members were organised into 32 different zones or groups according to the
location of their farms. The members of each group of farmers elected (annually) a group
leader or representative. Out of 32 group leaders, 15 were then elected by overall members
to form the executive committee of the co-operative; their duties were to formulate policy, as
well as to oversee the management of the co-operative activities. Each executive committee
served a one-year term. However, if elected repeatedly, a member of the committee could
serve for an indefinite period of time.
In 1992, the co-operative’s milk processing plant received about 126 t/day of raw milk
produced by farmer members. Farmers from the 32 groups, representing more than 90
villages, deliver the milk twice a day to the collecting centres or to the milk plant; most of the
farmers were within a radius of 20 km whereas the most distant farmers were 30 km away.
Payment for milk was made every ten days (on the 5th, 15th and 25th day of the month).
Milk price was based on fat content as well as bacterial counts. About half of the milk was
processed into pasteurised milk in plastic sachets and the rest into UHT milk in hard pack
containers. The UHT milk was sold through a sales agent in Bangkok, while the pasteurised
milk was distributed by the co-operative.
The co-operative’s feed mill produced around 100 t of mixed feeds/day. The demand
for dairy feeds continued to increase at a very fast rate. In 1992, the increase in dairy feed
production was 30% as compared with the previous year. Animal feeds were sold on credit
to the farmers and payment for feeds was deducted from the milk payment.
The AI service, using imported frozen semen of pedigree-quality bulls was offered to
farmer members at cost price. Requests for AI were made by the farmer at the time of milk
delivery to the milk collection centres. Kasetsart University Veterinary Clinic and the
Department of Livestock Development provided veterinary services; the farmers had to pay
only the cost of the drugs when they needed to treat sick animals.
Lessons learntIn order to achieve success with a dairy development programme the following four
categories of supportive factors are required: (a) technical inputs (b) institutional support (c)
government policies; and (d) farmers’ socio-economic conditions. A lack of any of these
supportive factors could limit the level of achievement in any dairy development
programme. Figure 1 shows various factors related to dairy production system in Thailand.
Technical inputsA primary prerequisite in dairy production is the availability of technical inputs that consist
of: (1) suitable dairy breeds for hot and humid environments; (2) availability of good quality
110 South–South Workshop
Chantalakhana and Skunmun

feeds, especially roughages and clean water; (3) good farm management and herd
husbandry; and (4) appropriate control and prevention of tropical animal diseases and
parasites. In general, these factors are well recognised and have been extensively
documented; they will not be elaborated in detail here.
Institutional supportVarious types of institutional support are required in order to facilitate growth in dairy
production. These include credit institutions, farmer training facilities, milk collection
centres, processing and marketing facilities, dairy farmer co-operatives or groups, and
South–South Workshop 111
Dairy development in Thailand: A case study
Government policy/dairy promotion and extension programmes
Socio-economic factors
•Off-farm jobs
•Education
•capital
Breeding stock
Farm
Family
Socio-economic factors
•Roughages
•concentrates
Dairy farm
Dairy herd
•Cows
•Heifers
•calves
Dairy co-operative
•Services
•Milk collection center
Animal care Farm
management
housing/facilities
Diseases and
parasite control
Fresh milk
Dairy products/packaging
Milk market processing
and manufacturing
ConsumersCampaign for increasing
milk consumption
Consumer’s socio-economic
conditions
•Income
•Education etc.
Imported milk and
dairy products
Government policy/dairy promotion and extension programmes
Socio-economic factors
•Off-farm jobs
•Education
•capital
Breeding stock
Farm
Family
Socio-economic factors
•Roughages
•concentrates
Dairy farm
Dairy herd
•Cows
•Heifers
•calves
Dairy farm
Dairy herd
•Cows
•Heifers
•calves
Dairy co-operative
•Services
•Milk collection center
Animal care Farm
management
housing/facilities
Diseases and
parasite control
Fresh milk
Dairy products/packaging
Milk market processing
and manufacturing
ConsumersCampaign for increasing
milk consumption
Consumer’s socio-economic
conditions
•Income
•Education etc.
Imported milk and
dairy products
Figure 1. Factors affecting dairy production systems in Thailand.

research and extension services. Without this support dairy development programmes can
face serious constraints. As shown earlier, most dairy farmers are resource-poor
smallholders who mainly depend on bank loans for farm investment. Most of these farmers
have little formal education and only a limited knowledge of dairy husbandry;
consequently, at least two to three months of intensive practical training is required to
provide them with a reasonable background in dairy farming. Once dairy production
begins, a milk collection and cooling centre is required to collect milk from the dairy farms
and then to transport the milk to a milk processing plant for processing and packaging, as
well as marketing of the products. Farmers constantly require dairy extension services to
provide AI, as well as animal health care (such as vaccination) and other services to improve
their farming efficiency. Research on various aspects of dairy production, including
socio-economic and policy studies, is required in order to find solutions to various
problems. Government departments and universities need to be well equipped in dairy
research. There is a need for facilities capable of conducting research to identify appropriate
scientific and technological interventions for the improvement of local dairy production.
The lack of effective dairy extension services and inadequate research support appear to be
major constraints to the efficiency of dairy production in Thailand.
Government policiesIt is quite obvious that dairying cannot be expanded easily if related government policies are
not supportive of dairy farming. Government policies that have been implemented and
have produced major positive impacts on dairy production in Thailand include: (1) the
Ministry of Commerce’s (1985) regulation on dairy product manufacturing, which requires
producers of recombined milk to use a ratio of fresh milk to recombined milk of 1:1 or 1:20
for skimmed powdered milk to fresh milk; (2) a milk drinking campaign by the government
to increase the consumption of drinking milk from about 2 to 10–15 kg/person by the end
of 2000; (3) a school milk programme launched in 1994–95 to promote milk drinking
among school children living outside urban areas in order to improve children’s health; and
(4) diversification of rice farming to dairy farming in order to reduce paddy farming in
certain areas. Furthermore, the price of milk has been regulated indirectly by some
government measures; the current milk price paid to farmers is approximately 1/3 of the
retail price.
Socio-economic factorsVarious socio-economic factors, for instance farmer’s off-farm income, availability of capital
investment, milk price, price of land, farmer’s level of education and training, and
availability of family labour, have direct influence on dairy farmers’ decisions as to whether
they want to expand and improve their dairy operations. As mentioned earlier, a number of
farmers initially became involved in dairy farming as a secondary career, while either the
husband or wife (mostly the husband) had another form of regular employment in town.
Several farmers worked as policemen, teachers or truck drivers while their wives stayed at
112 South–South Workshop
Chantalakhana and Skunmun
home and took care of their dairy farms. The price of land in most areas of Thailand has
increased tremendously compared with the prices during the previous decade. Some
farmers have sold part of their land for cash and forage plot area has became very limited;
this has increased the farmers’ problems of obtaining adequate good quality roughage for
dairy cows during the summer time. The scarcity and cost of hired labour is also a problem.
Moreover, most children with better education find good jobs in the city and rarely return to
dairying.
Opportunities for dairy promotion andimprovementThe promotion of dairy production has been quite successful, especially during the past ten
years, despite many difficulties and limitations. The opportunity for expansion of dairy
production in Thailand is potentially high due to the following factors.
Economic viabilityThe per capita consumption of liquid milk in Thailand has increased at the rate of around
20% per year. Furthermore, the amount of drinking milk consumed per person doubled
between 1990 and 1994 (from 3.44 to 6.81 kg/person). However, the average annual
consumption of drinking milk by Thai people is relatively low as compared with that of
Singaporeans (58 kg/person) or Malaysians (46 kg/person), which indicates that a
substantial increase in per capita milk consumption is possible in Thailand. In fact, the Thai
government’s milk drinking campaign aimed to increase per capita consumption of
drinking milk to 15 kg/person by the end of 1996. In addition, there are many other
indications that an increasing percentage of Thai people will become regular milk
consumers, e.g. improving levels of education, higher incomes, more efficient milk
marketing and an increased awareness of health issues.
Some milk manufacturers in Thailand have been exporting dairy products (such as
sterilised drinking milk and condensed sweetened milk) to neighbouring countries.
Hopefully, in the near future, more dairy products may be exported to such countries as a
result of improving political and economic conditions.
Government policiesAs mentioned previously, the Thai government has implemented various policies and
administrative measures in order to promote dairy production in Thailand.
As a result of various uncertainties and a decrease in the export price of rice, the Thai
government’s long-term policy is to decrease the area of paddy rice production by
diversification of rice farming to the production of other commodities, such as dairy
South–South Workshop 113
Dairy development in Thailand: A case study

products. Hence, in some areas of Thailand, paddy fields will become forage plots for dairy
farming. Such policy will enhance a rapid expansion of dairy production.
Production inputsFeeds are one of the major inputs for dairy production that are relatively abundant in
Thailand, especially concentrate feeds such as fishmeal, cereals, cassava chips, and
agricultural by-products and wastes. Roughage feeds are scarce in the dry and summer
seasons but in the long term, with appropriate methods of collection and preservation, this
feed scarcity could be resolved easily. Many available agricultural wastes and by-products,
such as sugarcane tops, straw, pineapple peel, corn stover and tree leaves are not yet fully
utilised for dairy feeding. In some areas, forage crops can be grown all year round. Moreover,
hay or silage making may be feasible. Nonetheless, these feed production techniques have
not been used to full capacity due to certain limitations, which could be overcome by
research and extension efforts. Recently, the funding of dairy research has received top
priority in Thailand; hopefully, in the near future, practical dairy information will become
available to dairy farmers that will enable them to improve the efficiency of their dairy
operations. Currently, major research efforts aim to improve the milk yield of cows from
8–10 to 10–15 kg/day or up to 4500 kg/lactation (300 days), while reducing calving interval
from 450–500 to 360–370 days.
It should be noted that in Thailand there are many areas of land that are unsuitable for
crop production but can be useful for dairy farming. With the application of animal manure
to improve soil fertility, as well as the use of appropriate forage systems involving
leguminous plants, dairy farming could enhance the quality of the environment and
ecosystems, especially by improving the quality of less-fertile soils.
For further dairy development some important strategies are required. First, in terms of
policy, it is very important to establish a national body or ‘Milk Board’, which consists of
representatives from the different sectors with an interest in dairy enterprise, to formulate
and oversee national dairy policies in order to promote the national dairy industry. Second,
to target major inputs to ensure the strengthening of dairy training for farmers and the
provision of an effective dairy extension system. Provision of mobile extension units that
give on-farm advice to farmers is one of the most effective ways to improve dairy efficiency.
Third, a national programme for dairy herd improvement in Thailand (DHIT; similar to
the Dairy Herd Improvement Association in the USA) must be organised for the selection
and multiplication of superior quality dairy sires and cows. All dairy cows with milk yields
below the national standard must be culled from dairy herds through a government-
supported scheme, which provides some compensation for the dairy farmers; these culled
cows could be used for beef production in other areas. Finally, there is real need for strong
and continuing support for dairy research. A well-co-ordinated programme in dairy
research, with highly selected topics that aim to solve the problems of real farmers or
development-oriented topics, must be formulated and supported. With these strategies, a
substantial expansion and improvement in dairy production is expected within the next
decade.
114 South–South Workshop
Chantalakhana and Skunmun

ReferencesSkunmun P. and Chantalakhana C. 2000. An economic analysis of smallholder dairy farms in
Thailand. Asian–Australasian Journal of Animal Science 13 (supplement A):50–53.
Supamala P. 1969. Dairy production situation in Thailand. Kasikorn Journal 42(1):25–27. (in Thai)
South–South Workshop 115
Dairy development in Thailand: A case study

Current situation and prospect for dairyproduction in ChinaJ.X. Liu,1 Y.M. Wu1 and Z.E. Zhou2
1. College of Animal Sciences, Zhejiang University (Huajiachi Campus), Hangzhou 310029, China2. Animal Production and Health Bureau, Zhejiang Department of Agriculture, Hangzhou 310020, China
Dairy production was not an important industry in China before 1949 when the People’s
Republic of China was established. In 1949 in China, there were only 0.12 million head of
dairy cattle producing 0.21 million tonnes of milk for a population of 450 million. Fifty
years since then, the number of dairy cattle has increased to 4.265 million head and
production of dairy products has increased to 6.621 millions tonnes (National Bureau of
Statistics 1999). Dairy industry has become an important business in agriculture. However,
milk production/capita per year in China (6.6 kg) is far lower than the world’s average (Jiang
1999). Many problems exist, which constrain further development of the dairy industry. In
this paper, basic information on the dairy industry, the development course, current dairy
industrial systems, contribution of smallholder producers and constraints facing the
Chinese dairy industry are reviewed.
Basic information on the dairy industry in China
Number and regional distribution of dairy cattleThe total number of dairy cattle was 4.265 million heads in 1998 (National Bureau of
Statistics 1999). Most of these are distributed in pasturing areas and northern China. About
70% of dairy cattle are raised in Xinjiang (0.977 million head), Inner Mongolia (0.726
million head), Helongjiang (0.685 million head) and Hebei (0.636 million head). The
provinces where dairy cattle numbers exceed 0.1 million head are Shanxi (0.106 million
head), Shandong (0.122 million head) and Shaanxi (0.112 million head). In order to ensure
the milk supply for residents in large- and medium-sized cities, dairy production has also
been developed in the suburbs of cities. The numbers of dairy cattle in Beijing, Shanghai
and Tianjing are 55, 58 and 27 thousand head, respectively.
Breeds of dairy cattleThe main breed of dairy cattle is the Chinese Holstein, formerly called Chinese
Black-and-White cattle. The breed was given its present name in 1992 by the Ministry of
Agriculture, China. Chinese Holstein cattle originated from both exotic and indigenous
sources. Exotic breeds were the offspring of dairy cattle imported from Canada, the USA,
116 South–South Workshop
France and northern Europe. Many of these cattle are the result of crossbreeding of local
breeds with imported Holsteins. In 1972, when the breeding of the Chinese Holstein
began, numbers of cows and average milk yield were 0.073 million head and 3335 kg/year
per head, respectively (Li 1999). The breeding programme was finished in 1985 when the
corresponding records were 0.503 million head and 4358 kg/year per head. In 1996, there
were 1.055 million head of Chinese Holstein cows and milk yield was 4550 kg/year per
head. Milk yields of 6000–7000 kg/year per head have been recorded in Beijing, Shanghai
and Tianjing. Chinese Holsteins are widely raised in suburbs of cities and farming areas to
supply pasteurised milk, milk powder and other milk products to urban citizens. The milk
produced from Chinese Holstein cattle accounts for about 85.2% of total output in China.
There are other breeds of dairy cattle in northern pasturing areas. Sanhe cattle are bred in
Inner Mongolia grassland areas; they have a strong resistance to cold and are well suited to
grazing systems. Milk production is above 3500 kg with a milk fat content of 4.2% and a milk
protein content of 3.5%. Contents of vitamins and minerals in milk are superior to those in
milk from the Holstein breed. Milk from Sanhe cattle is mainly consumed by local herdsmen
as pasteurised milk, milk tea and milk curd. Some is also processed into milk powder.
Xinjiang Brown cattle originated from the hybrid of Swiss Brown cattle and local
Yellow cattle. They are excellent breeds of dairy cattle for the Xinjiang grassland areas. In
addition, the Wenzhou buffalo, a local breed in the eastern part of southern China, is
used to produce milk. In some remote regions of China, buffalo milk is also produced
from crossbred animals, derived by crossing local breeds of buffalo with milk buffalo
imported from India. Buffalo milk has a high milk fat content and is mainly processed
into butter. Dairy goats are a subsidiary source of milk in some mountain areas of
southern China.
Feeding systems and milk productionDairy cattle in suburbs of big cities are house reared. Most of them are tied up in cattle
houses but some are reared loose in barns. Milk production in these areas is quite high. On
average, milk yield is around 7000 kg/year per head in Beijing, Shanghai and Tianjing (Li
1999). Some herds produce more than 8000 kg of milk/year per head.
In farming areas most dairy cattle are house reared. On average, milk yield is 5000–6000
kg/year per head in northern areas, but is only 4000–5000 kg in southern areas because of
high ambient temperatures. Based on data from the Chinese Association of Dairy Cattle,
smallholder dairy production accounts for 76.8% of the total dairy cattle population (Li
2000). Overall mean of milk yield (3516 kg/year per head) in China is lower than the world
average.
In the present time, most smallholder dairy farms carry out a basic feeding system in
which dairy cattle are offered roughages (ad libitum) plus silage and are supplemented with a
mixture of concentrates according to the level of dairy yields. Roughages are mainly
mixed-hay, harvested from local natural grasslands or ammoniated straws. Most silage is
made from whole corn or corn stalk cultivated locally. The concentrates are produced
locally or imported from other regions or other countries.
South–South Workshop 117
Current situation and prospect for dairy production in China
Dairy breeding and reproductionArtificial insemination (AI) is widely used in reproduction of dairy cattle. There were 79 AI
service stations in 1996. Of these, 42 stations (53%) had less than 10 bulls; 27 stations (34%)
had between 10 and 30 bulls; and 10 stations (13%) had more than 30 bulls. In general,
breeding bulls include dairy and meat types. Chinese Holstein bulls are mainly reared in
three places: the Beijing AI Service Station of Dairy Breeding Centre, the Shanghai Dairy
Breeding Centre and the Heilongjiang Animal Reproduction and Breeding Guide Station.
Breeding bulls originated from three sources: introduction of bulls from abroad,
introduction of frozen embryos from abroad and selection from local farms in China.
Centres for Supervising and Inspection of Frozen Semen Quality, which are located in
Beijing and Nanjing but are affiliated to the Ministry of Agriculture, are responsible for
inspecting and examining frozen semen from the different AI service stations.
Technical services system for smallholder producersGovernmental stations of animal production and health are responsible for the breeding and
health programmes, and extension of advanced technology to smallholder farmers. AI is used
widely in dairy production. Animal production and health stations organise the introduction
of frozen semen from excellent bulls in other regions and offer technical services for AI to
smallholder farmers. They also provide advisory services and training programmes on feeding,
management, and prevention and treatment of diseases. The concentrates required by
smallholder dairy farms are mainly made and supplied by local state-owned feed plants.
In addition, there are provincial, municipal and prefectural associations for the dairy
industry, which also play an important role in development of smallholder dairy production.
These associations hold training courses and provide extension demonstrations to improve
farmers’ knowledge of dairy science and extend new technology. Even the most illiterate
farmer is responsive to the new technology, provided its economic benefits are clearly
demonstrated in the prevailing farm situation. Associations also arrange for farmers to attend
and participate in symposia or workshops to exchange their experiences and lessons.
Development courseSubstantial development of dairy production in China started in 1999. Depending on the
economical character, the five-decade development to date may be divided into three stages:
the restrained development period (1949–78), the high speed outspreading period
(1979–92) and the structural adjustment period (1993–present) (Fang 1999; Tuo 1999).
Restrained development period (1949–78)This period was characterised by insufficient investment and short supply. After proceeding
for 29 years, numbers of dairy cattle only reached 0.48 million head and total milk yield
118 South–South Workshop
Liu et al.
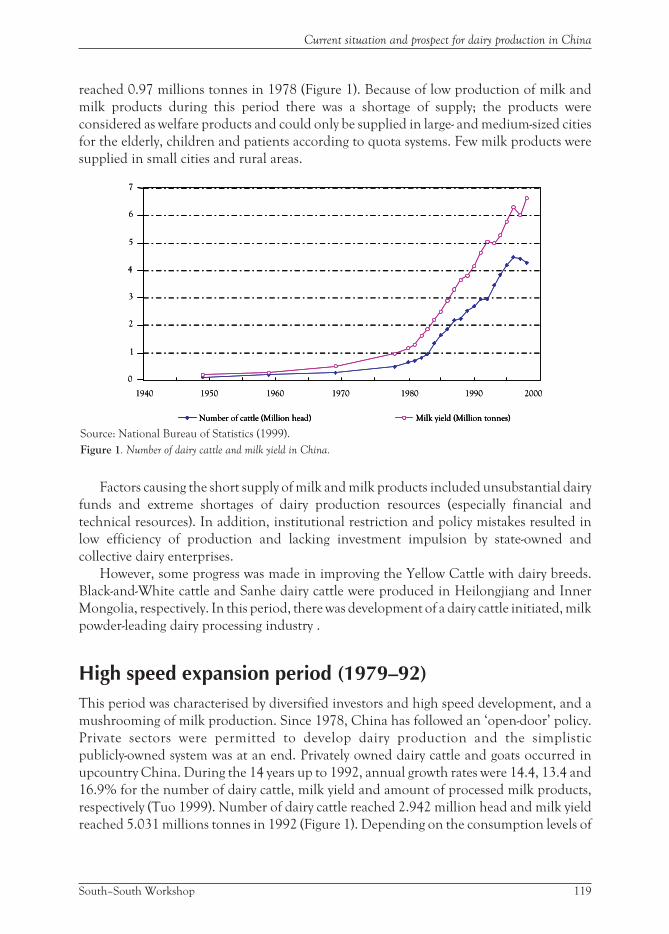
reached 0.97 millions tonnes in 1978 (Figure 1). Because of low production of milk and
milk products during this period there was a shortage of supply; the products were
considered as welfare products and could only be supplied in large- and medium-sized cities
for the elderly, children and patients according to quota systems. Few milk products were
supplied in small cities and rural areas.
Factors causing the short supply of milk and milk products included unsubstantial dairy
funds and extreme shortages of dairy production resources (especially financial and
technical resources). In addition, institutional restriction and policy mistakes resulted in
low efficiency of production and lacking investment impulsion by state-owned and
collective dairy enterprises.
However, some progress was made in improving the Yellow Cattle with dairy breeds.
Black-and-White cattle and Sanhe dairy cattle were produced in Heilongjiang and Inner
Mongolia, respectively. In this period, there was development of a dairy cattle initiated, milk
powder-leading dairy processing industry .
High speed expansion period (1979–92)This period was characterised by diversified investors and high speed development, and a
mushrooming of milk production. Since 1978, China has followed an ‘open-door’ policy.
Private sectors were permitted to develop dairy production and the simplistic
publicly-owned system was at an end. Privately owned dairy cattle and goats occurred in
upcountry China. During the 14 years up to 1992, annual growth rates were 14.4, 13.4 and
16.9% for the number of dairy cattle, milk yield and amount of processed milk products,
respectively (Tuo 1999). Number of dairy cattle reached 2.942 million head and milk yield
reached 5.031 millions tonnes in 1992 (Figure 1). Depending on the consumption levels of
South–South Workshop 119
Current situation and prospect for dairy production in China
0
1
2
3
4
5
6
7
1940 1950 1960 1970 1980 1990 2000
Number of cattle (Million head) Milk yield (Million tonnes)
0
1
2
3
4
5
6
7
1940 1950 1960 1970 1980 1990 2000
Number of cattle (Million head)Number of cattle (Million head) Milk yield (Million tonnes)Milk yield (Million tonnes)
Source: National Bureau of Statistics (1999).
Figure 1. Number of dairy cattle and milk yield in China.

milk and milk products, the Chinese dairy industry was in turn changed from being a sellers’
market to a buyers’ market.
The dairy industry expanded rapidly with the high-speed development of dairy
production. A large number of milk processing plants were newly built or reconstructed.
There were nearly 900 milk processing plants in 1990; an 80% increase compared with the
number in 1980.
These achievements profited from several factors. First, the government carried out a
series of policies to develop state-owned, collective and private farms, which stimulated
investment enthusiasm by producers, processors and conveyancers/sellers. Secondly,
science and technology contributed greatly to dairy production, resulting in modernisation
of the dairy industry. Thirdly, aid projects by the World Food Programme (WFP) and
European Economic Community (EEC) also contributed to the development of dairy
production in China.
In this period, the economic system in China was being reformed greatly. The
government took up a series of preferential policies to encourage private investors to set up
and develop smallholder dairy production. These policies included: (1) providing long-term
loans with low interest rates or no interest to private dairy farmers; (2) remitting taxation for
dairy enterprises; and (3) supplying feed of a comparatively low price to dairy farms and
enhancing progressively the purchasing price of milk from farms. At the same time, various
organisations providing technical services, such as dairy breeding centres, AI stations and
veterinary stations were founded in different regions of the country. They were mainly
responsible for providing technical services to dairy farmers; including breeding,
reproduction, health and technological training etc. The techniques of dairy breeding and
AI were extensively investigated and widely applied in dairy production in this period.
Structural adjustment period (1993–present)In 1993, milk production fell to 4.987 millions tonnes from 5.03 millions tonnes in 1992,
indicating the first decrease in production (–0.25%) after a long period, starting in the late
1970s, where production had increased annually. This slight decrease in production was a
signal that the dairy industry had entered into a new development period—structural
adjustment. The dairy market was fully opened in this period. Numbers of dairy cattle and
new processing enterprises still increased, while traditional products such as milk powder
were relatively superfluous. Meanwhile, foreign dairy enterprises advanced into the Chinese
market. The Chinese Government and dairy enterprises started to conduct structural
adjustment of dairy production and marketing systems. These reflected the change from a
planned system to a market-oriented system in the Chinese economy. There were three
characteristic changes in the dairy industry in this period.
Cancellation of government subsidies
Before the early 1990s, there were double prices for almost all goods in China. The
government subsidised dairy farms with concentrate feeds for animals. Farms could buy
120 South–South Workshop
Liu et al.

feeds from state-owned feed plants at lower prices while they had to sell their milk to
state-owned dairy processing plants at a fixed price. In addition, farms also received
subsidies for their milk marketing. With entry into the adjustment period, these subsidies
were gradually cancelled. Meanwhile the government strictly controlled the pricing of milk.
Therefore, cost of dairy production increased in almost all farms and farmers could make
little profit or reduction in deficit.
Change in structure of ownership
Dairy enterprises with joint venture and foreign capital developed quickly. In succession,
multinational companies with abundant capital moved into China. Although introduction
of foreign capital and technology improved the supply and management of the dairy
industry enriched the dairy market in China, new problems occurred in dairy production.
Some dairy enterprises were unwilling to produce milk with low profitability and purchased
raw milk at relatively high price, resulting in competition for milk sources. On the other
hand, some dairy enterprises, that had little capital and used outdated techniques, were
bankrupted and dairy farms associated with these enterprises were phased out. As a result,
there was readjustment of the distribution of milk sources.
Adjustment in the administrative system for dairy production
Subsidised policies under the planned system covered up a severe limitation for the dairy
industry—production, processing and marketing of milk were independent of each other. It
implied that production, supply and marketing were not synchronised, resulting in unfair
distribution of profits between different sectors. This situation exerted an adverse influence
on dairy production. Adjustment in the administrative system became necessary to promote
dairy production. It was not a simple administrative measure, but involved all aspects of the
dairy industry.
During the adjustment period, inevitably, the number of dairy cattle and milk yields
fluctuated. Compared with those in 1992, dairy cattle population and milk production
decreased in 1993, recovered in 1994 and increased in 1995. The fluctuation was more
apparent in both eastern China and around big cities where level of consumption of
pasteurised milk was high and there existed a sensitive response in the relationship between
supply and demand. For example, total milk output in 1995 increased in China, but milk
production decreased in 11 provinces, a >20% decrease being recorded in some provinces.
Current dairy industrial systemsFrom the late 1970s, throughout the high speed outspreading period and the adjustment
period, a great change took place in the dairy productive structure in China. Before 1980,
almost all dairy cattle were raised in the state-owned and collectively operated farms. Dairy
products were processed in light industries and privately-owned plants and then marketed
by state-owned commercial branches. Responsibility and obligation were clearly
South–South Workshop 121
Current situation and prospect for dairy production in China
demarcated between agriculture, industry and commerce, and all prices were planned,
decided and managed by the government. With reform of economic ownership in rural
areas, individual farmers have been able to raise dairy cattle and dairy goats since the early
1980s. Beginning with only one or a few dairy cattle per farm, farm size increased to include
tens and hundreds of dairy cattle. Up until 1989, for example, the total number of dairy
cows kept by smallholders in Beijing, Shanghai, Tianjing, Xi’an, Nanjing and Wuhan
reached 38 thousand head, which was 21% of the total number in these six cities.
Leading enterpriseWith regard to dairy industrial systems, a combination of enterprise and farmers is the main
institutional structure for the dairy development programme in China (Tuo 1999). In
addition to milk processing and marketing, and feed processing, the enterprises are also
involved in other activities. In China they are called ‘leading enterprises’. The leading
enterprise may be a food processing co-operation, industrial group or a business unit, which
may be state-owned, collectively owned or in private ownership. Such leading enterprises
generally hold milk processing plants or facilities. There is easier access to capital for
commercial enterprises, because their assets and land titles can be secured as collateral. The
leading enterprises co-ordinate themselves with local administrative departments to obtain
land, usually they rent the land. In addition, they serve as support organisations to help
farmers with a series of services (Jia 2000). Farmers may obtain dairy cattle from the leading
enterprise by lease or low-price purchase. Along with local administrative bureaus and
professional associations, leading enterprises also supply farmers with technical advice on
feeding, management and health, technological training etc.
There are two types of systems depending on the scale of the leading enterprise.
Giant dairy groupsWith reorganisation and conformity of the dairy industry that was characterised by
recombination of assets, some giant dairy groups have been formed and have become the
leading enterprises regionally or nation-wide. Among them are the Shanghai Dairy
Corporation (Group), the Shijiazhuang Sanlu Dairy Company, the Heilongjiang
Wandashan Dairy Factory and the Inner Mongolian Yili Industrial Corporation Ltd. Due
to their abundant capital, advanced technology and numerous trained personnel, these
giant leading enterprises (groups) deal with their business not only inside the group, but
they also invest in other industries in different regions, combine and annex other
enterprises, and extend industrial chains. Their business covers almost all areas of
agriculture, industry and commerce, and processing and marketing. With the formation of
specialised systems of production and management within the leading enterprises, national
dairy resources have been reasonably configured and assets of the dairy groups have
expanded rapidly. At present, national dairy brands such as Guangmin, Sanlu, Yili,
Wandashan and Sanyuan can compete with foreign brands.
122 South–South Workshop
Liu et al.
Leading enterprises for smallholder producersAccording to a survey carried out in over 25 provinces including Beijing, Tianjing,
Heilongjiang and Henan, smallholder dairy production accounted for 76.8% of total dairy
cattle (Li 2000). Milk is a perishable product. Absence of chilling facilities, high ambient
temperatures and lack of hygiene are the major problems faced by smallholder producers in
marketing milk. Milk production based on smallholder producers can be sustained only if
facilities are provided to process and market milk. The government and/or private
entrepreneurs have supported and financed the establishment of leading enterprises that
collect, process and market milk as pasteurised milk, milk powder and/or fruit milk.
However, the scale of these enterprises is not as large as in the giant dairy group.
Depending on the ownership of land and animals, there are several types of
institutional structure for combining the efforts of enterprise and smallholder farmers in
China.
Enterprises that do not hold land or farms
These enterprises have to collect milk from individual farmers and then process and market
the milk. This is an original organised structure. Usually the enterprise makes contracts in
advance with individual farmers; these contracts include details of the price and quality of
milk. Depending on farm size, the enterprise may make contract with several individual
farmers. Farm size ranges from a few to hundreds of dairy cattle. In some cases enterprises
collect from specialised villages where many dairy farmers exist.
Enterprises that possess their own land or hold leases on land
These enterprises build animal houses and then lease them to farmers or loan them to
farmers on an impromptu basis. Then the milk processing plant affiliated to the enterprise
assures to purchase milk from the farmers at reasonable prices, which depend on the quality
of the milk. Specialised villages and regions can be set up for dairy cattle keeping.
Farmers or collectives who set up a joint-stock company as aleading enterprise
The enterprise is responsible for rent of land, planning of production, and processing and
marketing of milk. Farmers are producers of milk and also stockholders in the enterprise.
Therefore, they can benefit from milk production as well as from profit sharing.
Enterprises that hold both their own milk-processing plant anddairy farms
Within the enterprise there are different divisions, some of which are responsible for cattle
feeding, some for milk processing and marketing and some for feed processing and even
South–South Workshop 123
Current situation and prospect for dairy production in China

trade. Strictly, these enterprises may not be classified into the category of smallholder.
However, they can be considered to be advanced smallholder dairy production systems.
When the enterprise is in private ownership, the enterprise per se is a combination of milk
processing plant and dairy farm.
Contributions of smallholder producers
Benefits toadjustmentof thecompositionofanimalproductionWith a huge population and limited land, shortage of feed resources has been the primary
constraint to development of animal production in China. The Chinese Government has
recently paid much attention to utilisation of locally available feed resources in order to develop
sustainable animal production and has given top priority to adjustment of the composition of
animal production (Ministry of Agriculture 2000). An important policy in 2000 was to ‘stabilise
swine and egg production, accelerate the development of meat-type cattle and sheep production
and to give first priority to develop dairy animal and wool production’.
Development of smallholder dairy producers is in line with government policy and is
beneficial to structural adjustment of animal production. Smallholder producers can in
general be described as being a low input system. Almost all cattle are kept indoors and
fodder is brought to them. Unlike large dairy farms, smallholder cattle owners typically feed
their cows on a variety of feedstuffs, such as crop residues, hay prepared from wild weeds,
alcohol by-products and brewers’ by-products, as well as cabbage and beetroot. These feeds
are available in varying amounts all year round. Most of them are highly fibrous, and
monogastric animals such as pigs and poultry cannot utilise them. These feeds will make a
major contribution to sustainable animal production systems.
Smallholders as the base of the leading enterprises thatprocess and market milkCombination of enterprise and farmers is a basic dairy industrial system in China. The
smallholder producers form an important socio-economic group as they hold 76.8% of total
dairy cattle in China. Cattle rearing in the village by smallholders is a family business and
generally a part-time activity. This makes the business a flexible one in the sense that, depending
on circumstances, the smallholders can add or sell one or two head of cattle quite easily. The
smallholder farmers produce raw milk for leading enterprises to process and market. It is the
smallholder producers that constitute the base of sustainable leading enterprises.
Improvement of rural livelihoodsDairy production has been important in the improvement of rural livelihoods. Presently,
considerable profits can be made from dairy cattle rearing. Results of our survey show that a
124 South–South Workshop
Liu et al.
smallholder farmer may benefit by about US$ 400/year from keeping and feeding a dairy
cow. Attributed to dairy production, animal husbandry has been a backbone industry in
many regions and has increased further the contribution of dairy production to rural
livelihoods. Smallholder production not only increases the income of farmers, but also
contributes to rural labour markets and the employment of farmers. Farmers may be
smallholder producers and also employees in leading enterprise.
Constraints faced by the Chinese dairy industryWith the high-speed development of the dairy industry, milk production and processing
capacity have increased rapidly in China. The rate of supply is gradually exceeding the actual
demand for milk and milk products by Chinese citizens. Dairy products have even become
overstocked and unmarketable in some regions. At the end of 1997, there was a surplus of
50 thousand tonnes of milk powder, representing 15% of total milk powder output in
China (Tuo 1999). The following subsections consider the major constraints faced by the
Chinese dairy industry.
Unfavourable administrative systemsAdministrative departments are familiar with the planned economy system which has been
in place for a long time since the founding of the People’s Republic of China. Each
department does things in its own way and sometimes there is a lack of close co-operation.
There is little capable, centralised and high efficiency organisation to co-ordinate the dairy
production, processing and marketing systems. There often appears to be extreme
contradiction between the profits of producers, processors and marketers.
Although dairy associations co-ordinate to some extent the relationships between
enterprises and between enterprise and farmer, they are not administrative organisations
and have no power or capacity to deal effectively with the relationships. As a result, dairy
production, supply and marketing are not aligned with each other and this restricts
development of dairy production and decreases the efficiency of production.
Contradiction between small enterprise and large marketThere are presently over 900 milk processing plants, 90% of which only have capacity to
process less than 100 t of raw milk per day. They have few technical staff, inferior processing
facilities and a limited variety of dairy products. Limited capital and technology prevent
small enterprises from forming industrial chains from milk production to marketing. The
products are, therefore, of low quality and production results in a low level of profit or even
a deficit.
Furthermore, small-scale private enterprises are generally incapable of coping with
spontaneous and marketing risks. They lack stability and may go out of business rapidly,
leaving the dairy industry at any moment when the prices of feeds and milk fluctuate. This
South–South Workshop 125
Current situation and prospect for dairy production in China
lack of stability may be catastrophic for dairy industry. Proven examples of such effects are
the sudden rapid decreases in dairy production and resultant fluctuations in the prices of
milk and milk products, which occurred during 1988–99 and during 1993–94.
The limited variety of dairy productsCurrently, there is lack of recognition that consumers often ask for ‘new’ tastes, flavours and
textures, advocate nutrition and health, and favour convenience. Consequently, most dairy
enterprises only produce a limited variety of milk products. The predominant product is
milk powder, which account for 54% of processed milk products (Luo 1999). In some
provinces, milk powder represents as much as 90% of all dairy products. Condensed milk
and malt milk each account for 20% of processed milk products. Very small amounts of
yoghurt, fermented milks, cheese and butter are produced, which in other countries with
developed dairy industries are of similar importance to pasteurised milk
Small-scale and relative weakness of leading enterpriseExcept for limited enterprises, most milk processing enterprises are of small-scale with
inferior processing facilities, especially those belonging to the private sector. The dairy
products are of low quality and the profits are low or non-existent. These enterprises are
involved ceaselessly in irregular and invalid competition with each other. They compete
for milk sources during the lean season when there is not enough milk to meet the
demand, but in the flush season they demand lower prices, lower the class of milk and
may even refuse to purchase milk from farmers. Thus, there is spectacular contradiction
between continuity of milk production and discontinuity of milk marketing by the
processing plants. This, to some extent, exerts an adverse effect on the productive
enthusiasm of dairy farmers.
Once China participates in the World Trade Organization, the competition will be
keener, particularly with international products. At present, 13 of the top 25 milk
producing countries have exported their dairy products to China; imported dairy products
amounted to 100 thousand tonnes in 1998, equivalent to 20% of total dairy product
production in China (Chen 2000).
Environmental aspectsWith development of dairy production, competition between humans and animals
coexisting in the same places is getting severe. Space is limited and there is also
environmental pollution from animal manure. There are strict regulations for land use, so
farmers cannot build animal houses in their fields without permission. Our survey shows
that farm size is very small, but on average farmers hold 3–5 head of dairy cattle each. While
they are making great contributions to the dairy industry, smallholder producers are
126 South–South Workshop
Liu et al.

incapable of dealing with animal manure, which is one of the major constraining factors for
dairy production in China.
Prospect for the dairy industry in ChinaIt is said that Chinese people seek the taste, smell and colour of foods more than the
nutritional value. Diet is like a culture for Chinese people. For a long period of time, milk
has been even cheaper than soft drinks, such as Coca-Cola and Sprite. However, Chinese
people are paying increasing attention to their nutrition and health. Milk has been
recognised to be a nourishing food. ‘A cup of milk strengthens a nation’ is not only a
slogan, but also a real action. Since last year, the central government has been carrying out
a programme for school milk in China (Ministry of Agriculture/State Development
Planning Commission/Ministry of Education/Ministry of Finance/Ministry of Health/
State Bureau of Quality and Technical Supervision/State Administration of Light
Industry 2000). Demand for milk and milk products has increased year after year with the
development of the national economy and improvement in the livelihoods of Chinese
citizens. In order to meet the increasing milk demand, it is necessary to energetically
develop dairy production. The following subsections consider the prospects for the dairy
industry in China, based on the current situation and the projected demand for milk
(Wang 1999).
Dairy processing plants become larger but fewerThere are too many milk processing plants of various sizes (approximately 1000 plants) in
China. In the future, through intense competition, small-scale plants with inferior
facilities will be bankrupted, while those that have abundant capital and assets with
advanced technology and superior resources will increase in size and develop well. The
large-scale enterprises should be able to process and market hundreds or thousands of
tonnes of raw milk daily. Milk products within one city or one region may be controlled by
several milk enterprises. In Hangzhou for example, there are presently only three
milk-processing enterprises that dominate the production of milk processing and
marketing.
Necessity for improvement of the quality of raw milkFor a long period of time milk supply was inadequate. Consequently, the Chinese dairy
industry has paid great attention to the quantity of milk but less to the quality, nutritional
and hygienic. It has been recognised widely that quality of raw milk is the most important
factor affecting quality of commercial milk and milk products. Only good quality milk and
milk products can be marketed well. Improvement of milk quality is a systematic work of
course. It not only depends on feed formulation, breed of dairy cattle, environmental
South–South Workshop 127
Current situation and prospect for dairy production in China
sanitation and milking management, but also involves storage and transportation of milk,
and education and professional moral of milk producers.
Socialised service systemsThere is a need for innovative programmes that increase the resources (credit, land, feeds,
research and technology) and extension-oriented support services (marketing, training, field
programmes and demonstration centres) available to dairy farmers. In addition to the
current systems, advisory services for finance, credit and legal aspects are needed by the
farmers. Prevalence of diseases, such as tuberculosis and brucellosis, should be monitored
regularly and inspections made to ensure animal health and safety for producers and
consumers. Another function of the support services is to further propagandise the
nutritional value of milk and to advocate milk consumption.
Modernisation of the dairy industryThe trend towards modernisation of the Chinese dairy industry seems a certainty in the new
century. Through the efforts of dairy scientists, administrators and producers, the current
situation will improve greatly. Extension workers and producers will require a good
knowledge of advanced dairy science and technology. Dairy farms will be able to produce
raw milk of high quality from improved cows. Dairy processing enterprises will have
excellent facilities and will produce a variety of milk products of high quality. The milk
marketing system will improve and consumers will be able to purchase pasteurised milk and
milk products at their convenience. Each industry within the dairy system will need to
co-ordinate well with the others. The dairy industry will then be able to achieve sustainable
development.
ReferencesChen X. 2000. Are we ready to join the WTO? Shanghai Dairy 23:(1):8–9.
Fang Y.S. 1999. Present situation and developing trend of dairy production in China. China Dairy
Cattle 6:5–7.
Jia Z.G. 2000. Investment in dairy industry to found production base and speedy development ofdairy production with one action. China Dairy 2:6–7.
Jiang J.P. 1999. Way to speed up development of dairy production in China. In: Wang H. (ed),Five-decade development of dairy production in China. Ocean Publishing House, Beijing, China. pp.408–410.
Li Y.F. 1999. How to develop the milk production in suburb of cities? In: Wang H. (ed), Five-decade
development of dairy production in China. Ocean Publishing House, Beijing, China. pp. 445–450.
Li Y.F. 2000. Grasping of opportunity to promote the development of dairy production in China.China Dairy Cattle 3:4–5.
128 South–South Workshop
Liu et al.
Luo C.X. 1999. Current situation and development prospect of dairy industry in China. In: Wang H.(ed), Five-decade development of dairy production in China. Ocean Publishing House, Beijing, China.pp. 421–429.
Ministry of Agriculture. 2000. Adjustment of composition of animal agriculture: Key point in animaldevelopment in 2000. (http://www.cav.net.cn/xmj/jyh/new032102.html)
Ministry of Agriculture, State Development Planning Commission, Ministry of Education, Ministryof Finance, Ministry of Health, State Bureau of Quality and Technical Supervision and StateAdministration of Light Industry. 2000. Circular letter relating to the implementationprogramme for school milk in China. (Http://www.agri.gov.cn/news/2000/1115/homepage.htm)
National Bureau of Statistics. 1999. China statistical yearbook. China Statistics Press, Beijing, China.pp. 399–407.
Tuo G.Z. 1999. Five-decade retrospection and vista of dairy production in China. In: Wang H. (ed),Five-decade development of dairy production in China. Ocean Publishing House, Beijing, China. pp.3–13.
Wang Y. 1999. Development prospect on dairy industry in China in 21 century. In: Wang H. (ed),Five-decade development of dairy production in China. Ocean Publishing House, Beijing, China. pp.450–455.
South–South Workshop 129
Current situation and prospect for dairy production in China

The smallholder dairy production andmarketing systems in VietnamN.Q. Suc and D.V. BinhNational Institute of Animal Husbandry, Thuy Phuong, Tu Liem, Hanoi, VietnamTel. 084–4–8387236 Fax. 084–4–8389775
E-mail: [email protected]
Introduction
The typical character of production systems in the differentagro-ecological zones of VietnamVietnam is a tropical country located in South-East Asia. The total area of the country is 33
million hectares. It is divided into seven agro-ecological zones (Map 1).
130 South–South Workshop
Source: Binh and Suc (1995).
Map 1. The seven agro-ecological zones of Vietnam.
Northern Mountainous and Midland Region
The major features of this Region are a large land area, green hills or barren stony
mountains, isolated hamlets, under-developed markets, poor living standards and a low
level of education. Buffalo production is well developed; the Region’s buffalo constitute
42.8% of the national buffalo herd. Pig keeping is also popular; the Region’s pigs constitute
24.3% of the national pig herd. Nevertheless, productivity of the livestock enterprises is low.
Transportation, communication and irrigation systems are the biggest constraints to
development of this Region.
Red River Delta Region
This area has a high population density and land is scarce. Nevertheless, the Region is the
second largest rice producer in the country. Cattle (especially dairy cow) production has
increased with increasing demands for milk. The number of local pig breeds has fallen
sharply, while the number of exotic pig herds is increasing rapidly.
Northern Central Coastal Region
This is a narrow strip, dominated by mountains in the west. In this Region, there is a
tendency to promote industrial crops such as peanuts, coffee and rubber. The markets are
under-developed, and dairy and beef cattle production is limited; however, buffalo
production is well developed. Pig production is based on local breeds and their crosses.
Southern Central Coastal Region
In this Region, the population is concentrated within the cities. Beef cattle production is
well developed; the Region’s cattle constitute 27.8% of the national beef herd. Pig
production in the Region is mainly from crossbreds. Goat (including dairy goat) and sheep
raising is common in the dry areas. This Region is characterised by a prolonged dry season,
so there are many constraints to the provision of feed for animals.
Central Highland Region
The major features of this Region are shortages of both food and labour. This Region is
famous for industrial crops such as coffee and rubber. The dry season is prolonged and lack
of water is the major constraint to the region. Reforestation is vitally important but difficult.
Beef cattle production is well developed. Pig breeds consist of local and exotic crossed types.
In the dry season, there is a major shortage of animal feed.
North-eastern Mekong Region
This is a peri-urban area and it benefits from ready access to markets. Development of cash
and industrial crops is promising; these include coffee, sugar-cane and cashew nuts. Most of
South–South Workshop 131
The smallholder dairy production and marketing systems in Vietnam
the pigs, chickens and ducks are of improved breeds. Dairy cattle are having positive impacts
at the household level.
Mekong Delta Region
This Region is the most important rice growing area in the country. Moreover, the majority
of the national duck population (57.6% of total) is also found here. Fishing and shrimp
production are also well developed.
The population of VietnamIn 1999, the human population of Vietnam was 76.328 million. About 70% of the total
labour force works in agriculture. Living standards are still very low with 11% of households
considered to be very poor. Undernutrition affects approximately 36% of children. There
are many jobless people in the villages and mountainous areas (Ly 1996).
Vietnam’s economyVietnam’s economy is predominantly agricultural. Rice is the main staple crop. During the
past 10 years, owing to government guidelines reviewing the agricultural policy of the early
1990s, Vietnam’s agricultural and rural economy has developed at a fast pace. This has
helped improve the socio-economic situation and create the right conditions for deep and
broad reforms in other socio-economic fields. The rural economy accounts for about 40%
of GDP (gross domestic product) and about 40% of total exports. It is a source of
employment and income for much of the Vietnamese population, as well as a source of
supply for many industries. In 1990, agriculture provided 38.74% of GDP; however, in
1999 this contribution was reduced to 25.43% while industry’s contribution increased
from 22.67% to 34.49% (Vang and Thuy 1999).
Agriculture is an important part of the domestic economy of Vietnam. The cultivated area
is about 11 million hectares. The agriculture is based mainly on rice production (77% of the
cultivated area) supported by other crops such as maize, potatoes, sweet potatoes, cassava,
groundnuts, soybeans, sugar-cane, fruit trees and other perennial commercial tree crops such
as coffee, tea, rubber and coconut. According to GSOV (2000), agricultural output
contributed 25.43% of GDP in 1999, of which cultivation constituted 79.4% and livestock
production (mainly pigs, buffalo, cattle and poultry) constituted 18.2% (MARD 2000).
The delivery systems for livestock services
Support for breeding animal production
The government supports farmers with part of a fund for the conservation and development
of animal breeds. The animal breeding centres have to provide good breeding animals to the
132 South–South Workshop
Suc and Binh
farms. The poor farmers have a right to buy breeding animals on credit with a low interest
rate (1% per year) from a bank.
Veterinary services
In some areas, there are quite good veterinary networks with diagnostic centres and
veterinary stations from which veterinarians can provide assistance to the farmers in
preventative vaccination and treatment. Nevertheless, in general, veterinary services are still
lacking in Vietnam, a country where tropical diseases often have serious effects. Recently,
the government issued a ‘veterinary code’. All institutions and economic sectors have been
asked to follow this code to improve animal health care and also to protect the environment.
Artificial insemination (AI)
AI has been used in pigs and cattle for more than 30 years. The level of use of AI in the sow
population of the north has only reached 30–60%, but AI is used for about 80% of dairy
cows. Each province has at least one AI station, which can store and deliver viable semen to
farms in the districts. Artificial inseminators can store semen for 2–4 days and then use it to
supply the animal producers on the farms.
Feed resources
In recent years, there has been dramatic improvement in the area of feed production, 24.5
millions tonnes of feed being produced annually. This has greatly decreased the pressing
feed deficit. Each year, 1 million tonnes of rice bran, 10–15 thousand tonnes of fish meal,
10–20 thousand tonnes of soybean and 20–25 thousand tonnes of oilseed cake are
produced to provide animal feeds.
Fodder and green feed
The grasses in natural pastures have poor nutritive values. Improvement of natural pastures
is expensive and has a low efficiency because of lack of water and fertiliser. Therefore, grass
cultivation has been studied and developed for many years. Moreover, agricultural
by-products such as maize, soybeans, rice straw and potatoes are available, and are being
utilised and processed for feeding animals.
Research and extension work in animal production
To meet the Vietnamese demands of industrialisation and modernisation, animal
production research has included the following activities:
• establishment of links between animal production research and marketing to assist
smallholders to develop sustainable agricultural systems
• improvement of productivity of local animal breeds (dairy and meat cattle, dairy goats,
pigs and poultry) by crossing with imported improved breeds
South–South Workshop 133
The smallholder dairy production and marketing systems in Vietnam

• improvement of feeding systems with the use of local resources to obtain a higher
efficiency of feed conversion
• prevention and control of diseases such as foot-and-mouth disease (FMD) and
leptospirosis of ruminants and pigs.
All results of research have been transferred to the farmers by training the farmers in new
technologies, and by providing farmers with improved breeds and varieties of forages for use
on their farms.
Dairy production in VietnamIn Vietnam and in other countries, dairying is recognised as an instrument for social and
economic development. According to the General Statistical Office of Veitnam, the cost of
imported milk products has increased from US$ 58.8 million to US$ 70.4 million during
three years of 1995–1997. It is, therefore, urgent that local milk production is developed
rapidly to reduce the cost of imports. Furthermore, both creation of employment by
changing the structure of the livestock sector and protection of the environment are very
important. The current system of dairy production and marketing in Vietnam is illustrated
in Figure 1.
Impact on smallholder dairy productionA long time ago, dairy production from dairy cows was only carried out on state farms.
Since 1985, however, with the support of the government, dairy production has been
134 South–South Workshop
Suc and Binh
System of dairy production and marketing
MARD
(Department of Rural Extension)
Provinces
(Division of Extension)
Milk processing
Vinamilk,
JV. (foremost Nestle)
Local milk processors
Institutions
Enterprises
Projects
Small households (fresh milk)
System of dairy production and marketing
MARD
(Department of Rural Extension)
Provinces
(Division of Extension)
Milk processing
Vinamilk,
JV. (foremost Nestle)
Local milk processors
Institutions
Enterprises
Projects
Small households (fresh milk)
Figure 1. Dairy production system in Vietnam.

expanded to include smallholders in the villages of Vietnam. Now, small producers,
dispersed throughout the rural areas, are the main source of most of the nation’s milk
supply. A programme for development of dairy production has been set up to encourage
dairy cattle and dairy goat production at household level. Consequently, the number of
dairy cattle has increased rapidly during the last few years. At the end of 1985, Vietnam’s
dairy cow herd constituted 3910 head of cattle. However, in June 2000, this number had
increased to 32 thousand head, out of which about 20 thousand were reproductive cows
and 13 thousand were producing milk. The majority of dairy cows in Vietnam (94%) are
crosses (F1 and F2 generations) between the Holstein–Friesian and the Sindhi breeds. The
remaining 6% are pure bred Holstein–Friesian animals, which are mainly kept on
breeding farms (MARD 2000).
Recent figures show that 95% of all dairy cows are raised by smallholders, the remaining
5% are raised in dairy cattle breeding farms. The breeding farm sector mainly keeps pure
bred Holstein–Friesian animals in herds of 500–1400 head. The remainder of the dairy
herd is kept on about 5600–5800 of the 115 thousand household farms in Vietnam.
Usually, there are 3–5 dairy cows per farm, but some household farms have 20–50 dairy
cows (MARD 2000).
Private management of dairy cow production in small households and application of
new technologies obtained through research have combined to improve level of milk
production by dairy cows in the last few years. Lactation milk yield of cows has increased
from 2330 kg in 1995 to 3200 kg in the year 2000. Moreover, total milk production has
increased at the rate of 33% per year, from 21 thousand tonnes in 1995 to 39.6 thousand
tonnes in 1999. Meanwhile, the demand for milk has increased by 20% per year. Therefore,
the requirement for milk imports is still increasing at 25% per year (GSOV 2000).
Development of dairy goat production for poor farmersRecently, dairy goat production has caught the attention of the Government of Vietnam.
The Goat and Rabbit Research Center has taken responsibility for this initiative and at
present is researching and developing goat production in the country. The dual-purpose
(meat and milk) goat breed, the ‘Bach thao’, which has a large body size and an average milk
yield of 1–2 litres/day, has increasingly affected meat and milk production at the farmer
level since 1993. In 1994, three breeds of dairy goat (Jumnabary, Barbari and Beetal) were
imported from India with the aim of improving milk productivity of local goat breeds in
Vietnam (Binh et al. 1996).
Dairy goat production is a suitable livestock enterprise for poor farmers, especially in
mountainous areas, because of low investment costs for the dairy breeds, goat housing,
feeding and management. Goats require only simple feeds, e.g. natural resources or
agricultural by-products. Goat meat and milk have high nutritional values and are
particularly useful in the diets of children and the elderly. Moreover, goat leather is a
special and expensive product, which can provide a high income for producers. In
Vietnam, approximately 3600 t of goat milk are produced annually. In 1997, an FAO
project initiated goat milk cheese production in five provinces of Vietnam. Under this
South–South Workshop 135
The smallholder dairy production and marketing systems in Vietnam
project, the dairy goat population of Vietnam increased from 15 thousand head in 1990
to 35 thousand head in 1999.
Furthermore, the wellbeing of poor farmers has been improved by raising dairy goats
that are managed using local resources. In 1994, the price of goat milk was US$ 0.5/kg
while cow milk cost US$ 0.25/kg (Binh et al. 1996). The system for goat milk collection,
processing and consumption in Vietnam has been expanded at village level.
Impact of systems of milk collection and processing on thedevelopment of dairy productionEight big dairy companies, namely Vinamilk, Foremost, Nestlé, Bavi, Hanoi, Phu Dong,
Moc Chau and Quy giao, carry out most of Vietnam’s milk collection and processing.
Vinamilk is the biggest company; in 2000, it collected and bought 320 thousand tonnes of
fresh milk, of which about 90% of the total milk production is from Hanoi and Ho Chi
Minh City and some urban provinces of Dong Nai and Long An. This company exported
powder milk, dried fresh milk and a dried nutritional supplement to the value of US$ 26.8
million in 1998 and US$ 83 million in 2000. The Foremost Company collects and buys the
majority of milk produced in the Binh Duong Province and some areas of Ho Chi Minh
City (MARD 2000).
The marketing mechanism for milk is established by the extension institutions and
processing companies. The milk producers make contracts, directly or indirectly, with the
milk processing companies. All collected milk is transported by refrigerated lorry to the
processing factories 50 km away. However, the milk from Moc Chau, 200 km from the
processing factory, has to be pasteurised and kept overnight at temperatures between 0oC
and 4oC. The purchase price of milk is 3500 dong/kg (US$ 1 = 14 thousand dong in 2000),
but it may depend on quality of the milk (milk fat percentage and milk density).
Unmarketed fresh milk is made into yoghurt or cream by local consumers or small-scale
processors. The milk processing companies have supported in the investment to farmers for
buying dairy cow to develop the dairy production.
Milk is a relatively new agricultural product in Vietnam, but its production has
increased from 20 thousand tonnes in 1990 to 39.6 thousand tonnes in 1999, an average
growth rate of 18.9% per year. In contrast, average annual growth rates for pork, poultry
meat, beef and buffalo meat, and eggs are only 7.7, 3.65, 0.2 and 6.9%, respectively.
Nevertheless, total milk consumption in Vietnam is about 450–460 thousand tonnes/year,
but only 7–10% of this amount is produced in the country (Vang and Thuy 1999). Per
capita fresh milk production is 0.23 kg in 1995. It was increased to 0.53 kg in 2000 while
per capita recent consumption is at an average of 7.9 kg per year. So, the domestic milk
production forms only 6.7% of milk consumption, the other 93.3% is imported. About
70% of imported milk is in the powder form and is processed into condensed milk and
yoghurt; it is sold in most towns and villages (MARD 2000).
136 South–South Workshop
Suc and Binh
Opportunities and constraints for the developmentof dairy production in VietnamDevelopment of dairy production in Vietnam has many potential advantages:
• Milk consumption, particularly among people living in cities and industrial areas, is
increasing rapidly. An increase in domestic production could meet some of this growing
demand and reduce the level of milk imports.
• Vietnam’s dairy cow and dairy goat production systems demonstrate that smallholder
dairy production and marketing systems, including milk collection and processing, can
create employment opportunities and improve the socio-economic conditions in rural
areas.
• Rearing of dairy cows and goats at the household level can be economically efficient and
can provide a high income. During the last decade, the margin between production costs
and prices obtained from fresh milk has benefited farmers, mainly because of low feed
costs, high prices of milk products and regular milk collection systems from their houses.
• Technologies for dairy production and milk processing are being adapted and improved
to suit conditions in Vietnam. Moreover, effective production technologies are being
transferred to private households for sustainable and integrated farming systems.
Nevertheless, the development of dairy cattle and goat production faces, among others,
the following constraints:
• Technologies for dairy cattle and goat production, breeding management, feed
processing, disease prevention, and milk collection and processing have not been
introduced throughout the country.
• A deficit of protein sources in animal feeds and lack of high quality green fodder, such as
legumes, affect a large part of the country and are limiting factors in dairy animal
production.
• There is limited access to capital, infrastructure and facilities, which will inhibit
development of dairy production.
Policies and direction for dairy production inVietnamDuring the past 10 years, the agricultural economy of Vietnam has not been affected by the
region’s economic crisis and has even achieved some successes. Animal production,
especially milk production, has increased because of many changes in policy.
The national programme for development of dairyingThis was established with a view to improving socio-economic status across the country.
This programme not only increases the domestic supply of fresh milk, thereby reducing
foreign currency costs of importing milk, but also creates employment and higher
South–South Workshop 137
The smallholder dairy production and marketing systems in Vietnam

incomes for farmers. Therefore, the government has prioritised the development of dairy
cattle and dairy goat production based on optimised utilisation of local resources (land,
labour, markets, technology, loans etc.) including the systems of milk collection,
processing and marketing under the framework of private farms, co-operatives,
companies and associations. Milk processing companies will be located close to the areas
where dairy products are produced, helping farmers to achieve greater benefits from their
animal production.
Policy for development of dairy production in householdfarmsNow that farming households are recognised as independent economic units with the right
to use their land over long periods of time (30–50 years), they are bosses for themselves who
can decide how and what to produce and where to get their inputs. Other policies on
lending and provision of support to families include the use of part of the benefits from
industrial production to develop the dairy production based on using two paramount
resources such as available labour and land.
Foreign investment in agricultureUp to the end of 1999, about 200 projects on agriculture and rural development, including
many projects on milk production and processing, had been carried out with a total
estimated funding of US$ 1.5 billion in overseas development assistance. Moreover, a
further 363 projects had been carried out with US$ 3.766 billion in foreign direct
investment. Overseas development assistance capital is very important for Vietnam’s
agricultural and rural development, infrastructure construction, transfer of technology and
exchange of management experiences, and labour training. The state makes the most out of
preferential loans and other bilateral and multilateral co-operation in technological and
scientific works for the development of livestock production.
Subsides for improving dairy animal breedingBreeding centres for dairy cattle and goats have been established by the state and private
sector and will be provided with breeds that are suitable for each agro-ecological region.
Many exotic breeds have been imported to improve the milk productivity of local breeds.
The Ministry of Agriculture and Rural Development (MARD) provides about US$ 1.2
million/year for the upkeep of the nucleus herd of livestock for breeding. From 1995 to
1998, the World Bank provided US$ 10 million for a programme to improve Vietnamese
cattle. The dairy and beef company under MARD has farms in Ba vi, Moc Chau and Lam
Dong with a nucleus of 200–900 milking cows producing young breeding animals of good
quality for state and private farms.
138 South–South Workshop
Suc and Binh
Rural creditThe Agriculture Development Bank of Vietnam was established in 1998, as a fully state
owned bank. It has a client network of about 7000 credit co-operatives throughout the
country. Between 1993 and 1998, the interest rate on rural credit was high at 2–4% per
month. In 1999, however, the interest rate was reduced to 1.1% per month and an even
lower rate of 0.6% per month was provided for poor farmers.
Policy for international co-operation in research anddevelopmentPolicy for international co-operation in research and development of animal production,
animal product processing and marketing has been attended to by the government.
ConclusionsVietnam’s recent success in increasing dairy production development is based on the
application of technical progress to animal production, the mechanism of milk collection,
processing and marketing, and efficient support from research and extension institutions.
The most important lesson learnt from this success is the need to set up a system of milk
collection and processing in Vietnam, which supports the farmers as they develop other
assets, such as dairy production in household farms.
Hopefully, dairy production in Vietnam, especially smallholder dairy production, will
continue to have good opportunities for improvement and will be able to keep pace with
other countries in the South. This should be possible assuming that dairy production in
Vietnam receives stronger support from the government and that it has opportunities for
co-operation with international organisations.
ReferencesBinh D.V., Suc N.Q. and Ly L.V. 1996. Research and development of the goat in Vietnam. In: Pryor
W.J. (ed), Exploring approaches to research in the animal sciences in Vietnam: A workshop held incity of Hue, Vietnam, 31 July–3 August 1995. ACIAR Proceedings 68:60–62. ACIAR (AustralianCentre of International Agricultural Research), Canberra, Australia.
GSOV (General Statistical Office of Vietnam). 2000. 1999 Statistical Yearbook. Statistical PublishingHouse, Hanoi, Vietnam. 283 pp.
Ly L.V. 1996. A review of animal science research in Vietnam. In: Pryor W.J. (ed), Exploringapproaches to research in the animal sciences in Vietnam: A workshop held in city of Hue,Vietnam, 31 July–3 August 1995. ACIAR Proceedings 68:15–20. ACIAR (Australian Centre ofInternational Agricultural Research), Canberra, Australia.
MARD (Ministry of Agriculture and Rural Development). 2000. Project for development of dairy
production in Vietnam 2000 to 2010. MARD, Hanoi, Vietnam.
South–South Workshop 139
The smallholder dairy production and marketing systems in Vietnam

Thuong N.V 1995. Some results of study of beef and dairy cattle in Vietnam. In: Pryor W.J. (ed),Exploring approaches to research in the animal sciences in Vietnam: A workshop held in city ofHue, Vietnam, 31 July–3 August 1995. ACIAR Proceedings 68:46–49. ACIAR (Australian Centreof International Agricultural Research), Canberra, Australia.
Vang N.D and Thuy L.T. 1999. Livestock production in Vietnam from 1990 to 1998. Report of theworkshop on the implications of the Asian economic crisis for the livestock industry, held inBangkok, Thailand. 275 pp.
140 South–South Workshop
Suc and Binh

Smallholder dairy production systems inEast and South-East Asia: Expandingimportance, environmental impacts andopportunities for improvementsC. DevendraInternational Livestock Research Institute (ILRI)P.O. Box 30709, Nairobi, Kenya
AbstractSmallholder dairy production systems in East and South-East Asia are discussed with
reference to type of systems, characteristics, potential importance, environmental impacts
and opportunities for improvement. Key features of the industry include: rapid expansion
and increasing consumption of milk; a means to generate ready income; significant benefits
to child nutrition; effects on poverty reduction and stability of households; strong market
orientation; and promotion of linkages between rural and urban areas. Three types of dairy
systems are identified and described: smallholder systems, smallholder co-operative dairy
production systems and intensive dairy production systems. The first two systems are by far
the most important and are associated with increasing intensification and specialisation.
Dairy production mainly involves the use of Holstein–Friesian crossbred cattle. The
expansion and intensification of smallholder dairy production is fuelled by an increased
demand for milk, but is associated with problems of milk handling and distribution,
hygiene and environmental pollution. The major constraints to production are, inter alia:
limited choice of species; poor breeding programmes and unavailability of animals; lack of
feed resources and inefficient feeding systems; poor management of animal manure; poor
hygiene and human health hazards; and lack of organised marketing and market outlets.
Specific areas for research and development, and opportunities for improved dairy
production in the totality of production to consumption systems are identified; suggestions
for performance indicators in such systems are included. A holistic focus involving
interdisciplinary research and integrated natural resource management is necessary in
shared partnerships between farmers and scientists to demonstrate increased productivity
and sustainable dairy production systems.
IntroductionSmallholder dairy production in East and South-East Asia is a particularly important
avenue of food production from cattle, buffalo and goats. Unlike South Asia where there is
South–South Workshop 141
a strong tradition of milk consumption, in East and South-East Asia, dairy production is
expanding in importance and milk is consumed increasingly widely by the younger
generation. These aspects and potential future impact are associated with a number of key
features, which inter alia include:
• Rapid expansion, increasing consumption and strong market demand
• Recognition of the advances and impacts made in India through Operation Flood
• A means to generate ready income, build assets and socio-economic benefits
• Significant benefits to child nutrition
• Impact on poverty reduction and household stability and
• Potential for increasing the current level of production.
Among ruminant production systems, dairy production systems are by far the most
dynamic. Dairying systems are influenced greatly by the reality and instant benefits of daily
milk production, immediate sales to urban markets, linkages between rural and peri-urban
areas, and public and private sector participation. The daily movement of one or more forms
of transport to collect milk produced on the farm, delivery to milk collection centres for
immediate processing, subsequent delivery to urban areas, the concurrent delivery of
purchased feeds and drugs, and contact with extension personnel, clearly reflect the dynamic
linkages that exist between rural and urban areas, and their development. Many of these issues
are interrelated with changes in one factor invariably affecting the other; when these issues are
viewed in holistic terms, the dairy sector provides major development potential.
It is not surprising therefore that all governments in the region, without exception, have
given particular attention to the promotion of dairy development. China, for example, has
placed major emphasis on the dairy industry while it also stabilises the production of pork and
poultry (Zhang 2001). The situation in China is interesting and is reflected in the following facts:
• Decentralisation of milk production from government-controlled state farms to
smallholder units since the early 1980s
• Thrice a day milking to maximise milk production and sales
• Priority to dairy development because of its impact on child nutrition and school
milk programmes
• Promotion of dairy development through microcredit schemes
• Evidence of a 100% return rate to credit schemes on account of daily income generation
through the sale of milk
• Together, these aspects have fuelled rapid expansion of the industry with some
replacement of pig production by dairy activities.
In tandem with this development, most governments in the region have therefore
made direct interventions in various forms to include policy elements and also
subsidies. Additionally, the industry as a whole has strong production and post-
production components, and also involves widespread participation of the private
sector. In view of the rapid expansion and variable levels of development in East and
South-East Asia, the opportunities for improved dairying and development of more
sustainable production systems are considerable. Major challenges exist therefore in
examining and improving the prevailing dairy production systems, current levels of
production and post-production systems. The task is compelling at a time when
142 South–South Workshop
Devendra
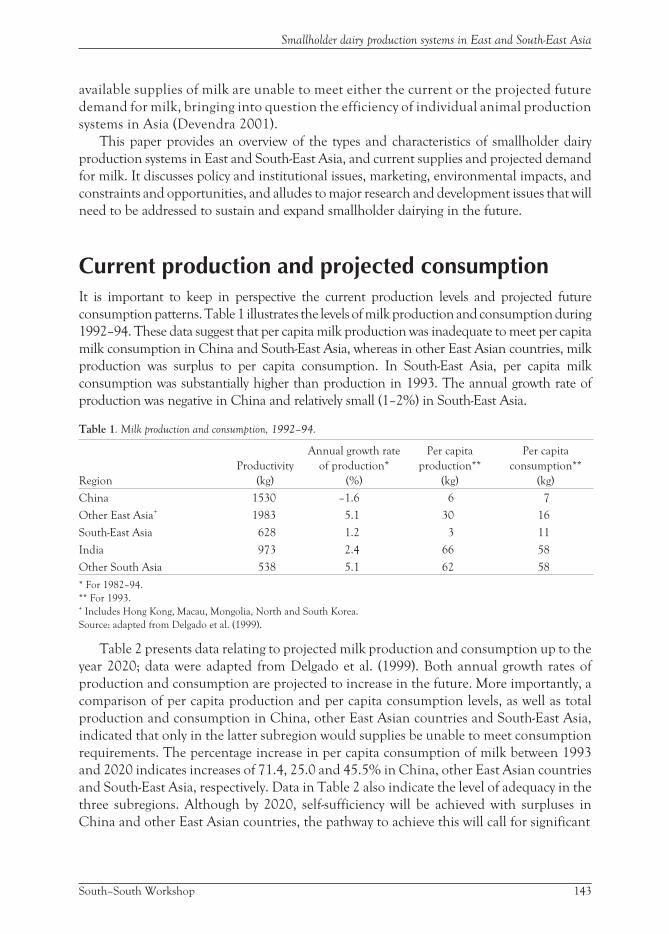
available supplies of milk are unable to meet either the current or the projected future
demand for milk, bringing into question the efficiency of individual animal production
systems in Asia (Devendra 2001).
This paper provides an overview of the types and characteristics of smallholder dairy
production systems in East and South-East Asia, and current supplies and projected demand
for milk. It discusses policy and institutional issues, marketing, environmental impacts, and
constraints and opportunities, and alludes to major research and development issues that will
need to be addressed to sustain and expand smallholder dairying in the future.
Current production and projected consumptionIt is important to keep in perspective the current production levels and projected future
consumption patterns. Table 1 illustrates the levels of milk production and consumption during
1992–94. These data suggest that per capita milk production was inadequate to meet per capita
milk consumption in China and South-East Asia, whereas in other East Asian countries, milk
production was surplus to per capita consumption. In South-East Asia, per capita milk
consumption was substantially higher than production in 1993. The annual growth rate of
production was negative in China and relatively small (1–2%) in South-East Asia.
Table 1. Milk production and consumption, 1992–94.
Region
Productivity
(kg)
Annual growth rate
of production*
(%)
Per capita
production**
(kg)
Per capita
consumption**
(kg)
China 1530 –1.6 6 7
Other East Asia+ 1983 5.1 30 16
South-East Asia 628 1.2 3 11
India 973 2.4 66 58
Other South Asia 538 5.1 62 58
* For 1982–94.
** For 1993.+ Includes Hong Kong, Macau, Mongolia, North and South Korea.
Source: adapted from Delgado et al. (1999).
Table 2 presents data relating to projected milk production and consumption up to the
year 2020; data were adapted from Delgado et al. (1999). Both annual growth rates of
production and consumption are projected to increase in the future. More importantly, a
comparison of per capita production and per capita consumption levels, as well as total
production and consumption in China, other East Asian countries and South-East Asia,
indicated that only in the latter subregion would supplies be unable to meet consumption
requirements. The percentage increase in per capita consumption of milk between 1993
and 2020 indicates increases of 71.4, 25.0 and 45.5% in China, other East Asian countries
and South-East Asia, respectively. Data in Table 2 also indicate the level of adequacy in the
three subregions. Although by 2020, self-sufficiency will be achieved with surpluses in
China and other East Asian countries, the pathway to achieve this will call for significant
South–South Workshop 143
Smallholder dairy production systems in East and South-East Asia
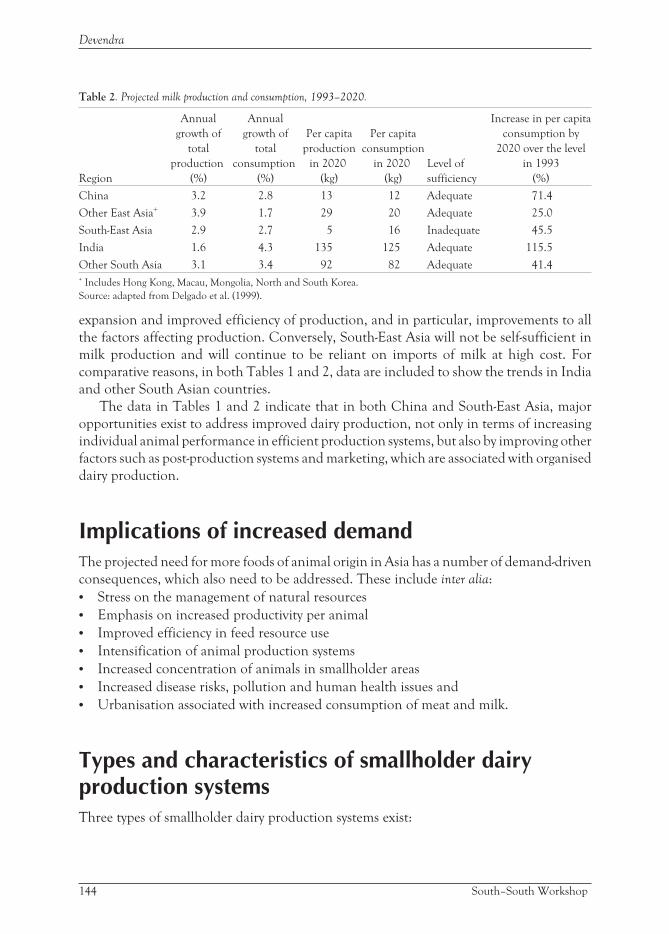
Table 2. Projected milk production and consumption, 1993–2020.
Region
Annual
growth of
total
production
(%)
Annual
growth of
total
consumption
(%)
Per capita
production
in 2020
(kg)
Per capita
consumption
in 2020
(kg)
Level of
sufficiency
Increase in per capita
consumption by
2020 over the level
in 1993
(%)
China 3.2 2.8 13 12 Adequate 71.4
Other East Asia+ 3.9 1.7 29 20 Adequate 25.0
South-East Asia 2.9 2.7 5 16 Inadequate 45.5
India 1.6 4.3 135 125 Adequate 115.5
Other South Asia 3.1 3.4 92 82 Adequate 41.4+ Includes Hong Kong, Macau, Mongolia, North and South Korea.
Source: adapted from Delgado et al. (1999).
expansion and improved efficiency of production, and in particular, improvements to all
the factors affecting production. Conversely, South-East Asia will not be self-sufficient in
milk production and will continue to be reliant on imports of milk at high cost. For
comparative reasons, in both Tables 1 and 2, data are included to show the trends in India
and other South Asian countries.
The data in Tables 1 and 2 indicate that in both China and South-East Asia, major
opportunities exist to address improved dairy production, not only in terms of increasing
individual animal performance in efficient production systems, but also by improving other
factors such as post-production systems and marketing, which are associated with organised
dairy production.
Implications of increased demandThe projected need for more foods of animal origin in Asia has a number of demand-driven
consequences, which also need to be addressed. These include inter alia:
• Stress on the management of natural resources
• Emphasis on increased productivity per animal
• Improved efficiency in feed resource use
• Intensification of animal production systems
• Increased concentration of animals in smallholder areas
• Increased disease risks, pollution and human health issues and
• Urbanisation associated with increased consumption of meat and milk.
Types and characteristics of smallholder dairyproduction systemsThree types of smallholder dairy production systems exist:
144 South–South Workshop
Devendra
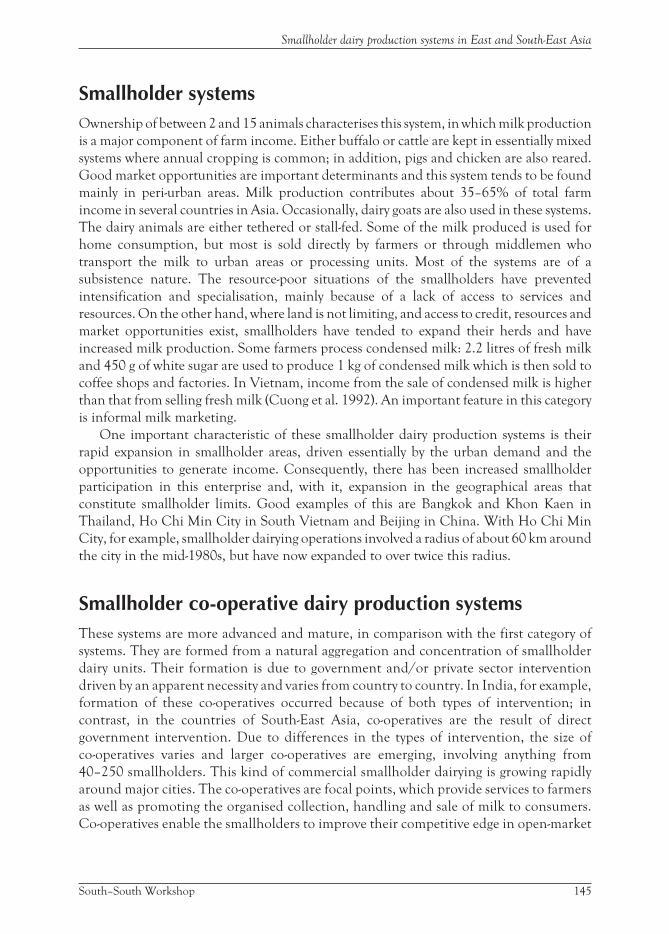
Smallholder systemsOwnership of between 2 and 15 animals characterises this system, in which milk production
is a major component of farm income. Either buffalo or cattle are kept in essentially mixed
systems where annual cropping is common; in addition, pigs and chicken are also reared.
Good market opportunities are important determinants and this system tends to be found
mainly in peri-urban areas. Milk production contributes about 35–65% of total farm
income in several countries in Asia. Occasionally, dairy goats are also used in these systems.
The dairy animals are either tethered or stall-fed. Some of the milk produced is used for
home consumption, but most is sold directly by farmers or through middlemen who
transport the milk to urban areas or processing units. Most of the systems are of a
subsistence nature. The resource-poor situations of the smallholders have prevented
intensification and specialisation, mainly because of a lack of access to services and
resources. On the other hand, where land is not limiting, and access to credit, resources and
market opportunities exist, smallholders have tended to expand their herds and have
increased milk production. Some farmers process condensed milk: 2.2 litres of fresh milk
and 450 g of white sugar are used to produce 1 kg of condensed milk which is then sold to
coffee shops and factories. In Vietnam, income from the sale of condensed milk is higher
than that from selling fresh milk (Cuong et al. 1992). An important feature in this category
is informal milk marketing.
One important characteristic of these smallholder dairy production systems is their
rapid expansion in smallholder areas, driven essentially by the urban demand and the
opportunities to generate income. Consequently, there has been increased smallholder
participation in this enterprise and, with it, expansion in the geographical areas that
constitute smallholder limits. Good examples of this are Bangkok and Khon Kaen in
Thailand, Ho Chi Min City in South Vietnam and Beijing in China. With Ho Chi Min
City, for example, smallholder dairying operations involved a radius of about 60 km around
the city in the mid-1980s, but have now expanded to over twice this radius.
Smallholder co-operative dairy production systemsThese systems are more advanced and mature, in comparison with the first category of
systems. They are formed from a natural aggregation and concentration of smallholder
dairy units. Their formation is due to government and/or private sector intervention
driven by an apparent necessity and varies from country to country. In India, for example,
formation of these co-operatives occurred because of both types of intervention; in
contrast, in the countries of South-East Asia, co-operatives are the result of direct
government intervention. Due to differences in the types of intervention, the size of
co-operatives varies and larger co-operatives are emerging, involving anything from
40–250 smallholders. This kind of commercial smallholder dairying is growing rapidly
around major cities. The co-operatives are focal points, which provide services to farmers
as well as promoting the organised collection, handling and sale of milk to consumers.
Co-operatives enable the smallholders to improve their competitive edge in open-market
South–South Workshop 145
Smallholder dairy production systems in East and South-East Asia

economies. Good examples of this system are found in several areas, especially in
proximity to major cities, as found in Thailand, the Philippines, Vietnam and China. In
the Philippines, for example, specific government intervention includes the promotion of
dairy co-operatives for groups of farmers producing milk from swamp × Murrah
cross-breds and also from Holstein–Friesian cattle crossbreds.
Two examples of this category are instructive. The first is in the Nang Pho Dairy
Co-operative, Ratchaburi Province, about 100 km south of Bangkok in Thailand. A survey
of 43 farms indicated that 95% of them were <0.32 ha in area (Skunmun et al. 1999). A
more recent survey of 10 farms in the same area gave a range of 0.02–0.48 ha. Most farms
had between 0.32–1.12 ha of additional land, mainly rented or owned to grow fodder. The
majority of cattle sheds were attached to the house or were between two and five metres from
the house. The net cash return (as a percentage of total income) was 68.9% and the average
cost of milk production was US$ 0.22/kg (Skunmun and Chantalakhana 2000). The
authors suggested that attention to the following areas could further reduce the cost of
production: feeds, reduction of the number of herd replacements and maintenance of
production records. It is interesting to note that from dairy operations alone, only three
farms made profits, emphasising the importance of crop–animal systems and also the scale
of operations.
Another example, on a much larger scale, is the Landhi Cattle Colony in Karachi,
Pakistan, which has about 220 thousand animals in a 5-km radius. About 95% of these
animals are buffalo and 5% are cattle of which half are crossbreds. It began originally as a
mechanism to concentrate animals outside the city limits, but has grown into a large and
complex enterprise within the city. Pregnant animals are purchased from rural areas and
exclusively stall-fed on cereal straws, green fodders and concentrates. Female calves
produced are sold, except for a small number that are kept as replacements for breeding.
Male calves are fattened for four months and slaughtered. At the end of their lactation, the
original females are also slaughtered. Indiscriminate growth of the colony, without
regulatory and policy interventions, has resulted in a serious situation, which is made more
complex by very poor hygiene, health hazards such as contaminated ground water, ever
increasing quantities of unused manure and other impacts on the environment.
Intensive dairy production systemsThe third category of smallholder dairying is intensive production systems. The expansion
of smallholder dairy production, increasing experience and open-market opportunities
have led to the development of more intensive and specialised production systems. This
trend is reflected in Table 3, which shows that small and marginal farms, and medium and
large farms contributed 42 and 35% of the volume of total milk produced.
These relatively large, intensive and increasingly specialised systems are characterised by
the following features:
• Relatively large numbers of animals, about 60–250/per farm, involving both buffalo
and cattle
146 South–South Workshop
Devendra

Table 3. Distribution of dairy animals and milk production among landless, small/marginal and medium/large-scale
producers in India.
Type of farmers % of farmers % of dairy animals % of milk production
Landless 26 22 23
Small and marginal 49 42 42
Medium and large 25 36 35
Source: Jong (1996).
• Application of improved stall-feeding systems using purchased chopped straws, green
fodder and concentrates at high cost
• Use of capital intensive infrastructure e.g. dairy equipment and other inputs and
• Existence of well-organised marketing systems and access to markets.
Within smallholder dairy systems, however, intensive dairy production units are least in
number and are usually in the hands of more knowledgeable dairy farmers, who also have
access to credit facilities and services.
Considered together, the three types of smallholder dairy production systems have the
following features:
• They occur commonly in peri-urban areas and are distinctly market-oriented.
• They are a component of integrated crop–animal production systems.
• Purebred Holstein–Friesian cattle, their various crossbreds including Holstein–Sahiwal
crossbreds are used widely. In the Philippines and the south-western parts of China, in
the Guangxi and Yunnan Provinces, swamp × river buffalo crossbreds are also used for
milk production.
• The level of exotic blood is highly variable and ranges from about 25 to 75% on farm.
Crossbreeding programmes have generally not been successful, including the
production and use of stable crossbreds.
• Short-term productivity gains from use of crossbreds are considered to be more
important, as they bring immediate benefits, than the rational use of indigenous breeds
and maximisation of their production through selection.
• The choice of buffalo and cattle for milk production is dependent on location, as well as
availability of animals.
• Dairy goats are used marginally for milk production, especially in China but also in Vietnam
and Indonesia, where they supply precious animal proteins for household nutrition.
• There seems to be little or no data comparing the efficiencies of milk production between
indigenous buffalo and cattle, cattle crossbreds and goats in smallholder systems.
• In socio-economic terms, dairying provides an attractive means to generate daily income.
This has important implications on human nutrition, participation of women,
household stability, repayment of loans and self-reliance.
• Expanded and demand-driven dairy production has led to intensification and
specialisation of smallholder production systems, with emerging problems relating to
milk handling, hygiene and environmental pollution, and to human health hazards.
• Intensification has limited the ability of smallholders to compete with larger
enterprises because of smallholders inadequate access to subsidies, which benefit
South–South Workshop 147
Smallholder dairy production systems in East and South-East Asia

larger farmers. Removal of these subsidies provides better opportunities for the
smallholders; and
• Women and children are heavily involved in the milking and management of dairy animals.
Constraints to productionThere are several constraints to production, which include inter alia:
1. Choice of species and breeds within species, and availability of animals for dairying. The
latter accentuates dependence on the importation of animals and germplasm
2. Poor breeding programmes and lack of availability of stable crossbreds
3. Lack of feed resources and inefficient feeding systems with associated high costs of
milk production
4. Limited management of animal manure and urine
5. Poor hygiene and human health hazards
6. Lack of organised marketing and market outlets.
It is not intended to discuss these constraints to production in detail, given the focus on
these issues in the country case studies, but it is relevant to highlight some of the more
important issues because it is necessary to overcome emerging problems.
Choice and availability of animalsBuffalo and cattle are used for dairying with complementary advantages, but a more serious
problem is the availability of animals. Often good quality Holstein–Friesian crossbreds are not
available or their cost prohibits use by small farmers, unless the animals are made available by
government schemes. Several countries in the region have therefore embarked on massive
importations of germplasm in the form of live animals, and frozen semen and ova from
various industrialised countries. Nevertheless, sustainable breeding programmes are
necessary to ensure the continuing availability of dairy animals. Many of the larger farms
attempt to produce their own crossbreds mainly through artificial insemination (AI), but not
without problems associated with the application and associated costs.
Feed resources and improved feeding systemsFeeding and nutrition have repeatedly been highlighted as the major constraints in animal
production systems globally (ILRI 1995) and subregionally in South-East Asia (Devendra et al.
1997). Improved animal nutrition in dairy production is therefore a major consideration.
Of the non-genetic factors affecting production, this is especially important since cost of
feeding accounts for about 40–60% of the total cost of milk production in intensive
systems. In smallholder systems, inadequate land and size of operation are further
constraints on production. In the cooler temperate Beijing area of China, dairy production
has expanded significantly through the integration of triticale into the cropping system, as a
148 South–South Workshop
Devendra

replacement for barley during the winter–spring period. This has involved a shift from rice
cropping alone to rice–triticale double cropping, resulting in higher grain and forage yields,
increased silage production, improved composition of milk from dairy cows, increased
economic benefits from grain–forage cropping systems compared with grain–grain
cropping, and dairy production (Wang et al. 1993).
It is important, therefore, that improved feeding systems and improved efficiency of
feed use are viewed clearly in a farming systems perspective. In this context, the following
prerequisites are considered important:
• Knowledge of availability of all feeds (forages, crop residues, agro-industrial by-products
and non-conventional feed resources) throughout the year
• Synchronisation of feed availability to requirement by animal species
• Assessment of the extent of feed surpluses and deficits
• Development of strategies to cope with the shortfalls
• Increased feed production (e.g. production of multipurpose tree legumes and
development of food–feed systems)
• Justification for purchased concentrates
• Priorities for use of crop residues
• Development of feed conservation measures and,
• Strategic supplementation for milk production, especially during critical dry seasons.
In many situations, long dry periods of between four and seven months, such as in
the eastern islands of Indonesia, north-east Thailand, central Vietnam, many parts of
China and countries in South Asia, result in inadequate availability of feeds.
Furthermore, feeds that are available at this time are of poor quality, which further
exacerbates animal productivity. In such environments, it is therefore essential that all
avenues for feed production be considered with the main objective being to ensure the
maximum possible availability of animal feeds. In this context, the development of a
food–feed system is an important strategy. The system is one that maintains, if not
increases the yield of the food crop, sustains soil fertility and provides dietary nutrients
for the animals. The subject, together with various case studies, has recently been
reviewed (Devendra et al. 2001).
These prerequisites need to be considered in holistic terms to promote efficiency in feed
resource use and, associated with this, increased productivity of the animals. In the absence
of such a holistic focus, research and development efforts concerning feed resource use will
continue to be of a ‘piecemeal’ approach, mainly component technology interventions with
variable success rates.
Improved animal health careImproved animal health care is also essential as it imposes a serious source of loss. Diseases
often rank, with the availability of feed resources and nutrition, as the major constraints to
production. A variety of diseases (e.g. mastitis and brucellosis) affect the calf and milking
cow. Losses due to disease are variable across countries and are dictated largely by the level of
management, knowledge base, access to drugs and services, and the efficiency of extension
South–South Workshop 149
Smallholder dairy production systems in East and South-East Asia
services. Losses are naturally greater in the high number of newer farms and much less in the
more established farms where efficient preventive health care and treatment can overcome
the disease problems.
In many parts of South-East Asia, proliferation of new dairy farms is challenged by
disease problems, often through poor hygiene as a source of loss. Government and private
sector interventions have been concerned largely with reducing the losses through provision
of appropriate medication. In peri-urban areas, an emerging problem that will need
increasing attention is the hazard to human health associated with intensive and stall-fed
dairy production.
Management of animal manureAnimal manure produced on farm, represents a major health hazard. The problem
increases with increasing herd size and intensification, and is associated with a number of
issues including: quantity and quality of manure and urine produced; inadequate removal,
frequency of removal and storage in proximity to where the excreta is produced; labour
availability; methods used for manual disposal; value and use of dung; and linkages to rural
areas. In most situations, the systems for manure management and use are very haphazard
and present serious problems to both animals and humans. The human health hazards in
intensive smallholder systems are much more serious than initially realised, because of
inadequate supervisory and sanitary measures, without which the situation can worsen.
This was highlighted in an investigation on the effects of dairy wastes on water and soil
resources in smallholder dairy systems in Thailand (Chantalakhana et al. 1998). Results
showed that:
• Waste water from older established dairy barns and crowded farms constituted a great
risk to the environment because of the high COD (chemical oxygen demand), BOD
(biological oxygen demand) and presence of coliform organisms
• Both wastewater and leaching, from piled up manure and manure drying on bare
surfaces were implicated in ground water contamination
• Waste water from dairy farms, well water and public waterways in the locality all
provided evidence of a cumulative problem associated with a lack of effective waste
management practices, therefore constituting critical sites for monitoring and
• Monitoring of wastewater could be based on relatively simple tests that correlate broadly
with more sophisticated chemical and biological tests.
Organised marketing and market outletsThe high demand for milk and milk products necessitates an organised link with
production. Availabilities of a market drive, organised marketing and access to market
outlets are therefore important prerequisites for the distribution and sale of milk produced.
In the absence of these, prospects for promotion of efficient milk production will always be
vulnerable and a risk.
150 South–South Workshop
Devendra

Environmental impactsOne important consequence of expanding dairy production, intensification and
specialisation of traditional systems is the need for efficient manure and urine waste
disposal systems. Large concentrations of animals, poor infrastructure, the movement of
animals, poor husbandry and unhygienic milk handling systems are sources of major disease
outbreaks and threats to human health. In general, efficient waste disposal systems are not
in place and are often non-existent; in consequence, dairy wastes present a major health
hazard for humans. The situation becomes more serious in peri-urban areas and is
compounded by poor infrastructure, and lack of regulations, monitoring and enforcement.
Zoonotic diseases such as tuberculosis and brucellosis can be passed to humans. Depending
on the proximity of the dairy wastes to cities, these and other diseases may spread to human
populations. Additionally, concentrations of animals and their wastes produce various
gases (carbon dioxide, methane and nitrous oxide), which have detrimental affects on the
atmosphere and global warming.
Nevertheless, the presence of efficient collection and disposal systems for manure and
urine can promote their beneficial use. When returned to the field to fertilise crops and
fodder, dairy wastes can contribute to the increased availability of feeds for dairy animals.
Such nutrient transactions also promote linkages between rural and peri-urban areas.
Opportunities for improvement
Feed resources and improved feeding systemsImproved feeding systems that ensure optimum performance, and efficient and low cost
milk production need to consider the following issues:
• Feed availability and feeding systems
• Seasonality of production
• Basal roughage resources
• Strategic and effective use of supplements
• Access to low cost and potentially important feeds and
• Extent of use of feed resources from the farm.
Associated with the above, it is pertinent to note four important points that are relevant
to feeds and feeding:
• Ruminant production systems are unlikely to change in the foreseeable future. Proposed
new systems and returns from them would therefore have to be demonstrably superior
and supported by massive inputs of capital and other resources (Mahadevan and
Devendra 1986; Devendra 1989). However, there will be increasing and predictable
intensification and a shift within systems. This situation is increasingly likely with
decreasing availability of arable land. The principal aim should therefore be to address
improved feeding and nutrition, in which the objective is maximum use of the available
South–South Workshop 151
Smallholder dairy production systems in East and South-East Asia

feed resources, notably crop residues and low quality roughage, and various leguminous
forages as supplements;
• During the recent Asian economic crisis, the smallholder dairy farms that collapsed were
those which depended on the use of imported feeds, notably maize and supplements
• Good profits from dairy production systems accrue from systems that use the maximum
possible amount of indigenous materials, especially feeds. An approach that promotes
and maximises such use and self-reliance is therefore essential and
• The quality and quantity of manure and urine produced depend on the type and
quantity of feeds used. Improvement in intake, digestibility and output of manure can be
ensured by feeding good quality green forages and crop residues, as well as by strategic
use of protein supplements.
Year-round feeding systemsA parallel strategy concerning opportunities to increase feed availability is the objective of
developing sustainable year-round feeding systems. In this quest, maximising feed
production is essential. The following approaches are feasible:
1. Intercropping with cereal crops
2. Relay cropping
3. Food–feed cropping systems
4. Intensive use of available crop residues
5. Forage production on rice bunds
6. Alley cropping and
7. Three-strata forage systems in dry land areas.
Priorities for the use of crop residuesGiven the range of crop residues available, priorities for their use are essential in prevailing
animal production systems. These priorities will depend on the quantities available, relative
nutritive values, the potential value to individual ruminants species, the state of knowledge
regarding their use to enhance animal production, and the potential for technology transfer
and application. Table 4 summarises the three categories of crop residues, their nutrient
potential and the animal species that make the best use of them. These aspects have been
reviewed elsewhere (Devendra 1997 and 2000).
Management of animal manure and nutrient recyclingCrop production in developing countries depends largely on the use of organic manure
from animals. Inorganic fertilisers are often too expensive or unavailable to farmers who
wish to use them; this emphasises clearly the importance of animals, the value of crop–
animal integration and interactions, and the contribution of animal manure to sustainable
152 South–South Workshop
Devendra

Table 4. Factors affecting crop residue use by animals in Asia.
Type of residue Nutrient potential Species (product/service)*
Good quality (e.g. oilseed cakes andmeals, cassava leaves)
High-protein, high-energysupplement, minerals
Pigs, chicken, ducks, ruminants(meat, milk)
Medium quality (e.g. coconut cake,palm kernel, sweet potato vines)
Medium-protein Pigs, chicken, ruminants (meat,milk)
Low quality (e.g. cereal straws, palmpress fibre, stovers)
Low-protein, very fibrous, bulky Ruminants (meat, draft), camels,donkeys, horses (draft)
* Ruminants refer to buffalo, cattle, goats and sheep.
Source: Devendra (1987).
agriculture. Organic materials have been used, widely and beneficially, to improve soil
fertility and crop yields. In north-east Thailand, for example, where 80% of the soils are of
the sandy type, animal dung continues to be very valuable for crop production (Supapoj et
al. 1998). The use of animal dung in crop cultivation serves directly to supply the soil with
nitrogen, phosphorous and potassium. The dung improves the physical, chemical and
biological properties of soil, including improvements in soil structure and nutrient
availability, and infiltration and water retention capacity, and stimulation of nitrogen fixing
soil bacteria (Turner 1995). Additionally, humus in the dung improves soil pH value and
therefore, phosphorous release. For reasons of cost, farmers often use a combination of
inorganic fertilisers and organic materials to improve soil organic matter and soil fertility.
A considerable quantity of under-utilised and inefficiently used animal manure and
urine is available in smallholder dairy units; improvement of its use to increase agricultural
productivity represents a major challenge.
Opportunities for research and developmentThe improvement of smallholder and market-oriented smallholder dairy production in
smallholder and rain-fed mixed farming systems offers considerable research and
development opportunities. Many of the improvements in dairy production through
crossbreeding and through various interventions in animal nutrition and health have been
supply-driven, without farmer participation and conducted on experimental stations.
Component technologies that have been validated on farm have seldom been adopted. A
lack of farming systems perspective has meant that important interactions between animal
nutrition, genotype and disease, and between animal and crop production, have not been
considered together. Moreover, socio-economic and policy factors that influence the
dynamics of the systems have not been addressed.
Specific areasSome specific areas, which merit research and development attention, include inter alia:
• Recognition that dairy activities involve the totality of production-to-consumption systems
• Better understanding of the socio-economic factors influencing the dynamics of the systems
South–South Workshop 153
Smallholder dairy production systems in East and South-East Asia
• The effects of specific improvements and components of the systems with maximum
potential for intervention
• Synchronisation of feed availability and quality with the physiological and productive
needs of different species (buffalo, cattle) and genotypes (unimproved, improved) of
dairy animals throughout the year
• Genotype × nutrition × disease interactions and the effects of animal health interventions;
• The effects of improved nutrient flows and recycling on crop yield and crop residue
quality in mixed farming systems and
• Development of strategies for more efficient feeding of animals and nutrient recycling
through the introduction of legumes into cropping patterns.
Addressing these and other issues calls for a more holistic focus involving
interdisciplinary approaches, which together can affect potential improvements in a
cost-effective manner.
Expanding dairy production into rain-fed areas andpromotion of rural developmentDairy production, more than any other animal production system, has demonstrated
spectacular growth in the linkages between rural and urban areas. The daily production,
processing and consumption of milk have promoted these linkages in many countries
through a network of interrelated activities. Transport and transport costs act as a
constant link between rural and urban areas and integrate both these areas. The daily
shipment of milk, purchased feeds and supplements, semen for AI and drugs are
examples that are concerned with this process. These movements and activities increase
with decreasing proximity to markets in urban areas. Rural development is encouraged
further by the presence of co-operatives that provide necessary services and ensure returns
to farmers.
An additional potential opportunity for further expansion concerns the use of rain-fed
areas. Currently, smallholder dairy production is mainly found in the irrigated areas where
land is already overused; however, potential opportunities exist for expansion of
smallholder operations, especially in rain-fed lowland areas where soil moisture and crop
production are relatively high. Justification for this approach, driven by the need for more
food of animal origin, is associated with the following considerations in Asia:
• Available rain-fed area account for about 82% of the land area in Asia. They are found
mainly in the arid/semi-arid zones but also in the subhumid zones (TAC 1992 and 1994)
• The rain-fed areas, in the lowlands and uplands, contain 51–55% of the total population
of cattle and small ruminants in Asia
• Within the 86% of the total human population of Asia living in these areas, poverty and
the ‘poorest of the poor’ are found
• Natural resource degradation is intense and
• Major challenges exist for integrated natural resource management, poverty alleviation
and improved food security.
154 South–South Workshop
Devendra
Importantly, such expansion and the associated need for more productive animals, feed
production and nutrient transfer, and their collective use in smallholder dairy systems
provide major opportunities to link rural and smallholder areas, which in particular will
benefit resource-poor farmers. Integrated management of natural resources will be
prominent and could address FAO’s concept of area-wide integration, in which markets can
be linked to nutrient surplus and nutrient deficit areas. However, appropriate policies and
infrastructure may be needed to ensure the efficiency of this process. The promotion of
linkages between rural and smallholder areas in the use of production inputs,
intensification, nutrient flows and marketing of produce needs to be pursued to ensure that
the activities are compatible with reduced pollution, and minimal disease risks and human
health issues.
An example of how a feed in rural areas can be processed and fed to animals, and the
manure produced can be processed for crop cultivation, thus linking rural and smallholder
areas, concerns a plant in Jakenan, Solo in Indonesia. Rice straw is bought from farmers at 30
thousand rupiahs (Rp) per truck (US$ 1 = Rp 9511, March 2001), subjected to microbial
treatment and then fed to animals at the rate of about 3.5 kg of straw plus 3 kg of groundnut
straw/head per day in stall-feeding systems. The production system is in stages, from calves to
adults. The animals used are Holstein–Friesian crossbreds, which show body weight gains of
0.7–0.8 kg (live weight) per day, and dairy cattle. The former produce about 15–25 kg of
dung/head per day; about a thousand kg of processed manure (PM) is produced each month.
The dung produced is removed from the barns every fortnight. The wet dung is dried at 60°C,
stored and bagged. This process destroys all the residual toxins, weed seeds, and
micro-organisms and renders a high quality product. This is sold at 300 Rp/bag. About 250 t of
PM is sold every month. The chemical composition of PM is 80% organic matter; 1.5% total N;
1.6% P2O5; 1.8% K2O; >2.8% CaO; and >0.5% Mg. The product has a pH value of 5.5–7.5.
The PM has been applied not only to rice but also to vegetables, sugarcane, tobacco and
potatoes. The advantages indicated include:
• Reduced cost of crop production by about 10%
• Increased rice yields by about 51% (equivalent to 2.8 t/ha). On farmers fields, the
increased yields have been about 2.2 t/ha
• Similar increased yields recorded for tobacco and vegetables.
Furthermore, attempts have been made to mix the PM with poultry manure in a 3:1
ratio and to use PM in integrated systems involving dairy–fish operations. In these
integrated systems, the returns as a percentage of total income are 40% from PM, 30% from
dairying, 20% from sale of calves and 10% from sale of fish.This scheme is impressive and
has been expanded and linked to involve several parts of Central, East and West Java,
Sulawesi and Riau, in which farmers have benefited significantly in terms of increased
income from the use of PM.
SustainabilityIn general, smallholder systems are constrained by numerous problems including access to
services, credit and resources, so much so that strategies to cope with these problems, such as
South–South Workshop 155
Smallholder dairy production systems in East and South-East Asia

diversification of resource use, represent the major objectives in subsistence systems. Over
time, however, specialisation, intensification and increased income enable expansion of
smallholder operations, especially among the more innovative and progressive farmers.
Whether or not the systems are sustainable will depend largely on a holistic view of the
enterprise, the efficiency of natural resource management, strategic use of production
resources and appropriate technology that addresses the totality of production-
to-consumption systems, which is highly relevant to market-oriented smallholder dairy
production. It is essential that such strategies also consider long-term environmental
consequences. Defined in this way, sustainable smallholder dairy production systems are
those that can demonstrate:
• Efficiency in the management of natural resources and beneficial effects through crop–
animal interactions (e.g. nutrient recycling)
• No evidence of resource degradation (e.g. maintenance of soil fertility)
• Promotion of maximum use of indigenous materials and a high degree of self-reliance
• Maximisation of the use of available labour and creation of employment opportunities
and
• Improved livelihoods for the rural poor.
Performance indicatorsThe multidisciplinary approaches, coupled with integrated natural resource management
need to be identified to ensure sustainable agriculture and environmental protection.
This is a complex and by no means easy task, but research and development programmes
need to be sensitive to these aspects in their intent and scope, to be coupled to
methodologies for efficient use of resources, to comprise appropriate technology
interventions and to increase dairy production. Finally, it is important to stress in the
search for the realisation of these objectives, that the research and development activities
are a shared partnership between farmers and scientists in which the farmers are the target
beneficiaries; the ultimate benefits need to be translated into improved livelihoods for
these resource-poor farmers.
Performance indicators, hand in hand with economic analysis, largely reflect the success
of the programme. Table 5 presents suggestions of some performance indicators
appropriate to developing country situations, with no claims to being exhaustive. Possible
performance indicators are summarised in three categories. The efficiency and
management of integrated natural resources will largely determine animal performance and
productivity, profitability and impact on household stability, improved livelihoods and
rural development. Thus, for example, excessive use of purchased feeds and concentrates
will result in high feed cost as percentage of the total production cost, implying in practice
that maximum use needs to be made of all available feed ingredients as well as home mixing
of these to produce desirable low cost, but effective concentrates. Likewise, improved
nutrient balance and soil fertility will stimulate crop yields with increased production of
feeds for animals.
156 South–South Workshop
Devendra

Table 5. Some performance indicators are appropriate to developing country situations.
Type Indicator
1. Natural resources • Increased soil fertility
• Reduced soil erosion
• Feed cost as percentage of total costs
• Production per unit of water
• Nutrient balance
• Positive crop–animal interactions
• Level of pollution
• Sustainability
2. Profitability • Returns as a percentage of total cost of production
• Return on assets
• Change in net worth
• Cash surplus
3. Households • Number of children going to school
• Malnutrition/human health
• Extent of off-farm work Stability ofco-operation/revolving funds
ConclusionsSmallholder dairy production systems are expanding avenues of food production from
animals in developing countries. The potential to sustain this expansion is enormous, but
necessitates addressing several major constraints and issues that affect the totality of
production to consumption systems, as well as the environment. The considerable research
and development opportunities that exist provide major challenges for demonstration of:
increased productivity from dairy cattle; efficient management of natural resources;
improved livelihoods for poor farmers; and the development of sustainable production
systems that are consistent with environmental integrity.
ReferencesChantalakhana C., Korpraditsakul R., Skunmun P. and Poondusit T. 1998. Environmental
conditions and resource management in smallholder dairy farm in Thailand. II. Effects of dairywastes on water and soil. Asian–Australasian Journal of Animal Science 12:220–225.
Cuong L.X., Le V.L. and Huynh D. 1992. Feeding systems and potential for improving dairy cattle inVietnam. Proceedings of the 6th Asian–Australasian Animal Science Congress 11:259–270.
Delgado C., Rosegrant M., Steinfeld H., Ehui S. and Courbois C. 1999. Livestock to 2020: The next
food revolution. Food, Agriculture, and the Environment Discussion Paper 28. IFPRI(International Food Policy Research Institute), Washington, DC, USA; FAO (Food andAgricultural Organization of the United Nations), Rome, Italy; and ILRI (InternationalLivestock Research Institute), Nairobi, Kenya. 72 pp.
Devendra C. 1987. Expanding the use of crop residues and agro-industrial by-products in Asia andthe Pacific. Proceedings of the feed resources in Asia and the Pacific Asian Productivity Organisation,
Tokyo, Japan. pp. 106–141.
South–South Workshop 157
Smallholder dairy production systems in East and South-East Asia

Devendra C. 1989. Ruminant production systems in developing countries: Resource utilisation. In:Feeding strategies for improved productivity of ruminant livestock in developing countries. IAEA(International Atomic Energy Agency), Vienna, Austria. pp. 5–30.
Devendra C. 1997. Crop residues for feeding animals in Asia: Technology assessment and adoption.In: Renard C. (ed), Crop residues in sustainable crop/livestock farming systems. CAB (CommonwealthAgricultural Bureau) International, Wallingford, UK. pp. 241–268.
Devendra C. 2000. Strategies for improved feed utilisation and ruminant production systems in theAsian region. Asian–Australasian Journal of Animal Science 13 (Supplement July 2000, B):51–58.
Devendra C. 2001. Productivity enhancement and animal production systems in Asia. Proceedings of
the Asian Agriculture Congress held at Manila, Philippines (In press).
Devendra C., Sevilla C. and Pezo D. 2001. Food–feed systems in Asia. Asian–Australasian Journal of
Animal Science 14:1003–1113.
Devendra C., Thomas D., Jabbar M.A. and Kudo H. 1997. Improvement of livestock production in
rain-fed agro-ecological zones of South-East Asia. ILRI (International Livestock Research Institute),Nairobi, Kenya. 107 pp.
ILRI (International Livestock Research Institute). 1995. Global agenda for livestock research. In:Gardiner P.R. and Devendra C. (eds), Proceedings of a consultation. ILRI, Nairobi, Kenya. 118 pp.
de Jong R. 1996. Dairy stock development and milk production with smallholders. PhD thesis, WageningenAgricultural University, Wageningen, The Netherlands. 308 pp.
Mahadevan P. and Devendra C. 1986. Present and projected ruminant production systems ofSouth-East Asia and the South Pacific. Forages in South-East Asia and the Pacific. ACIAR
Proceedings 12:1–6. ACIAR (Australian Center for International Agricultural Research),Canberra, Australia.
Mathur B.N. 2000. Problems and challenges confronting the dairy industry in India. Asian–
Australasian Journal of Animal Science 13(Supplement July 2000, A):447–452.
Skunmun P. and Chantalakhana C. 2000. An economic analysis of smallholder dairy farms inThailand. Asian–Australasian Journal of Animal Science 13 (Supplement July, 2000 A):50–53.
Skunmun P., Boonsom S., Kaewjuwan S. and Chantalakhana C. 1999. Environmental conditionsand resource management in smallholder dairy farms in Thailand: Production systems andmanagement of resources. Asian–Australasian Journal of Animal Science 12:215–219.
Supapoj N., Nablang K. and Konboon Y. 1999. Using organic material to improve lowland rice. In:Ladha J.K., Wade L., Doberman A., Reichart W., Kirk G.J.D. and Piggin C. (eds), Rainfed lowland
rice: Advances in nutrient management research. IRRI (International Rice Research Institute), LosBanos, Philippines. pp. 161–168.
TAC (Technical Advisory Committee). 1992. Review of CGIAR priorities and strategies. Part I. TACSecretariat, FAO (Food and Agricultural Organization of the United Nations), Rome, Italy.250 pp.
TAC (Technical Advisory Committee). 1994. Review of CGIAR priorities and strategies. Part II. TACSecretariat, FAO (Food and Agricultural Organization of the United Nations), Rome, Italy.229 pp.
Turner M. 1995. The sustainability of rangeland to cropland nutrient transfer in semi-arid WestAfrica: Ecological and social dimensions neglected in the debate. In: Powell J.M.,Fernandez-Rivera S., Williams T.O. and Renard C. (eds), Livestock and sustainable nutrient cycling in
mixed farming systems of sub-Saharan Africa. Volume II. Technical Papers. Proceedings of an international
conference held in Addis Ababa, Ethiopia, 22–26 November 1993. ILCA (International LivestockCentre for Africa), Addis Ababa, Ethiopia. pp. 435–452.
158 South–South Workshop
Devendra

Wang Z., Guo Y.X., Xu Y.C., Wang L.C., Wang P.G. and Tan Y.F. 1993. Study on the integratedrice–silage triticale farming system. In: Guo Y.X. (ed), Rice-based crop production structure in China.Chinese Academy of Agricultural Sciences, Beijing, China. pp. 302–316.
Zhang C.G. 2001. Dairy industrial policy in China. (Mimeo). Institute of Agricultural Economics,Chinese Academy of Agricultural Sciences, Beijing, China. 10 pp.
South–South Workshop 159
Smallholder dairy production systems in East and South-East Asia

Smallholder dairy production andmarketing in KenyaH.G. MuriukiMinistry of Agriculture and Rural DevelopmentP.O. Box 30028, Nairobi, Kenya
SummaryKenya has a population of about 29 million people, a land area of about 571 thousand
square kilometers and a varied climate stretching from humid in the coastal areas to cool
temperate in the interior highlands. Its land productivity potential also varies from high
potential, constituting less than 20% of the total land area, to very low potential in dry areas
in the north-eastern parts of the country.
Agriculture is the backbone of Kenya’s economy, contributing over 25% of the gross
domestic product (GDP); it is the lifeline of about 80% of the country’s poor and
contributes 70% of the national employment.
Kenya has a unique smallholder dairy system, which is the most developed in
sub-Saharan Africa with an estimated dairy herd of 3 million head. Most of the dairy cattle
are crosses of Friesian–Holstein, Ayrshire, other dairy breeds and local zebus. The
smallholder dairy farms are concentrated in the crop–dairy systems of the high productivity
potential areas of the country, produce about 60% of total milk production and contribute
over 80% of the marketed output.
Dairy marketing in Kenya is mainly of liquid milk where over 80% is sold raw with the
participation of itinerant milk traders (hawkers) who control about 28% of marketed milk
(Staal et al. 1999), despite a policy that discourages them.
Dairy is important in the livelihoods of many farm households in rural Kenya and in
terms of generating incomes and employment, including off-farm employment.
The presence of a large population of dairy cattle, a large and growing human
population who include milk as part of their diets and a supportive environment are
indications of the opportunities that exist for smallholder dairying in Kenya.
Investment in the national rural infrastructure such as rural access roads, water supply
and electricity and economic improvement in the country will allow for increased milk
supply and consumption, and will contribute to increased employment.
IntroductionKenya has a total area of 582,646 km2, of which 11,230 km2 is under water ( CBS 1999), and
a human population of 28.7 million (CBS 2001). Its climate varies from warm and humid
160 South–South Workshop

in the coastal areas to cool temperate in the highlands. The annual rainfall ranges from less
than 200 to over 2000 mm in some parts of the highlands.
According to land productivity potential, the country can broadly be divided into three
regions (Figure 1):
• High potential areas with an annual rainfall of more than 750 mm, spreading from
central Kenya through to the central Rift Valley to western Kenya and the coastal strip.
• Medium potential areas with an annual rainfall of more than 625 mm but less than 750
mm, located in parts of central-eastern Kenya and neighbouring the high potential
coastal strip.
• Low potential areas with an annual rainfall of less than 625 mm, stretching from north
and north-eastern Kenya to the southern parts bordering Tanzania.
Kenya’s economy is based largely on agriculture, which contributes over 25% of the GDP.
Agriculture also provides raw materials for agro-industries; accounting for about 70% of all
industries. Over 80% of the country’s population rely on agriculture for employment and
general livelihood. The contribution of livestock to the economy is most appreciated in the
South–South Workshop 161
Smallholder dairy production and marketing in Kenya
Source: Ominde (1988).
Figure 1. Kenya’s land productivity potential.

drier parts of the country. According to Gem Argwings Kodhek (Tegemeo Institute of
Agricultural Policy and Development, personal communication), dairy is the second largest
contributor to the agricultural GDP, second only to beef.
Dairy productionThe dairy industry is the most developed of the livestock subsectors and is comparatively
well developed relative to the dairy industries of other countries in sub-Saharan Africa. The
industry, like other agricultural subsectors, is dominated by small-scale farmers.
Milk is produced primarily from cattle (the main source of marketed milk in Kenya),
camels and goats, which contribute 84, 12 and 4%, respectively (Table 1).
Table 1. Estimated population of milk animal species/breeds and percentage contribution to annual milk
production (1997).
Species Breed type
Estimated number
(× 103)Milk production(% contribution)
Cattle Improved dairy type
Zebu
3203
9545
59.8
24.6
Camels Camelus dromedarius 800 11.5
Goats Indigenous (East African)
Improved dairy type
10,500
34
4.0
0.1
Source: MoARD unpublished (Kenya Dairy Development Policy Proposal for 2000).
The major types of cattle kept for milk production are the improved exotic breeds and
their crosses (collectively called ‘dairy cattle’) and the indigenous (zebu) cattle, which
provide milk for communities in the drier parts of the country. The Sahiwal, though a zebu,
is usually grouped together with the exotic cattle because it is regarded as an improved
dual-purpose breed. The improved dairy cattle contribute about 60% and the zebu cattle
about 25% of the total national milk output (Table 1). Market-oriented dairy farming in
Kenya, where exotic cattle are dominant, is concentrated in the crop–dairy systems of the
high potential areas where feed supply and disease control are much better than in the arid
and semi-arid lands (ASALs) of the country. Zebu cattle, which constitute about 70% of the
total population of cattle in Kenya, are, however, widely distributed and are found in all
agro-ecological zones of the country due to their adaptation to highly diverse environments.
About 70% of the herd is found in the ASALs of the country.
The dairy herd is mainly composed of purebred Friesian–Holstein, Ayrshire, Guernsey,
Jersey and their crosses. The crosses constitute over 50% of the total herd while the
Friesian–Holstein and Ayrshire dominate the pure breeds.
Dairy production systems in Kenya can largely be classified as large- or small-scale.
Small-scale producers (the smallholders) dominate dairy production owning over 80% of
the 3 million dairy cattle, producing 56% of the total milk production and contributing
80% of the marketed milk (Peeler and Omore 1997). In a recent study by the Smallholder
Dairy (Research and Development (R&D)) Project (SDP) (Staal et al. 1999), covering the
162 South–South Workshop
Muriuki
majority of the milk producing regions in the country, most of those surveyed were
smallholders and 73% of these had dairy cattle. These findings confirmed the importance of
dairy in Kenya’s agricultural sector and the country’s economy. The study also confirmed
that dairy production is conducted on small farms with crossbred cow herds, which range in
size from one to three head, and that production is based on close integration of livestock
and crops. Dairying is a multi-purpose cattle system providing milk, manure and a capital
asset to the farmer.
Smallholder dairying in KenyaAs mentioned earlier, dairy production in Kenya is predominantly run by smallholders.
Nevertheless, market-oriented dairy farming in Kenya, based on exotic cattle, started
almost a century ago when European settlers introduced dairy cattle breeds and other
exotic forms of agriculture from their native countries. Several factors, which include the
presence of significant dairy cattle populations, the importance of milk in the diets of
most Kenyan communities, a suitable climate for dairy cattle and a conducive policy and
institutional environment, have been contributing factors to the success of dairy
production by smallholders (Conelly 1998; Thorpe et al. 2000). The success is also
attributable to the fact that milk serves as a cash crop providing a continuous stream of
cash throughout the year for households growing other cash crops whose income is
realised only once or twice a year.
Improved dairy cattle production by indigenous Kenyans was not carried out until after
1954 when the Swynnerton Plan of 1954 allowed them to engage in commercial agriculture
(Conelly 1998). By 1963, when Kenya attained independence, the dairy herd had expanded
to about 400 thousand exotic cattle largely in the hands of the settlers.
After independence, there was a rapid transfer of dairy cattle from the settler farms to
the smallholders resulting in a decline in the cattle population on large-scale farms to 250
thousand head by 1965. To encourage dairy production by smallholders, the government
effected a number of changes in the provision of livestock production and marketing
services, resulting in highly subsidised services. In 1971, the government abolished the
contract and quota system of dairy marketing to Kenya Co-operative Creameries (KCC) to
allow for the inclusion of smallholder producers.
The continued provision of highly subsidised livestock and other services by the
government proved unsustainable due to budgetary and other constraints. By the late
1980s, the quality of livestock services provided by the government had declined,
prompting it to adopt structural adjustment and economic restructuring which, among
other changes, included liberalisation of the dairy industry with a view to increasing the role
of the private sector (Omore et al. 1999). In the period preceding the 1980s, parastatal and
other quasi-government institutions such as KCC and Kenya Farmers Association played
major roles in marketing and delivery of agricultural commodities, services and inputs.
With their collapse, there is increased reliance on the private sector, including
community-based organisations (CBOs), for delivery of livestock and other agricultural
services formerly in the government domain.
South–South Workshop 163
Smallholder dairy production and marketing in Kenya

Development of smallholder dairy production systems in the Kenya highlands has been
marked by declining farm size, upgrading to dairy breeds and an increasing reliance on
purchased feeds, both concentrates and forage (Staal et al. 1997). In areas such as Kiambu
District, purchased fodder has become very important in dairying. The area planted with
fodder for sale is equal to the area planted with maize, the staple food crop.
Dairy production by smallholders is a multi-purpose cattle system producing milk and
manure, and serving as a capital asset. It is characterised by small crop–livestock farms, each
comprising a few acres. The dairy cattle are mostly adult cows. As mentioned earlier, an
important feature of the smallholder system is that milk is a cash crop for households who
generally grow other cash crops and use manure to fertilise food and cash crops. Cash crops
in these farms may include coffee, tea, market vegetables, pyrethrum and, in some cases, cut
flowers. The main food crop is maize, but others include beans, sweet potatoes, potatoes,
vegetables (such as kale) and in a few cases, wheat. The major cattle feeds are natural grass
and planted fodder, mainly Napier grass. Other feeds, which depend on area and
availability, include maize crop residues, compounded feeds, milling by-products and
weeds. Where farms are small, cattle are confined and fed through a cut-and-carry system in
which feed materials are brought to the animals (Baltenweck et al. 1998; Staal et al. 1999).
The importance of manure in dairy adoption has largely been overlooked. Studies by the
Smallholder Dairy Project, Lekasi et al. (1998) have shown that nutrient cycling through
dairy animals and use of manure is a key driving force to dairy adoption and to sustaining
smallholdings. In some cases dairy cattle have been kept mainly to supply manure for coffee
plants and food crops.
Cattle breeding in the smallholder sector depends on the availability and cost of
artificial insemination (AI) services and/or bull service. Use of AI was very popular when
it was provided almost free-of-charge by the government but use of bulls has been
increasing since the collapse of the government AI services, following their liberalisation.
There has been increased reliance on the private sector, including CBOs, to provide AI
and other livestock services in place of the collapsed government services; however, as yet
they have not been able to fill the gap. Either because of this or other circumstances,
calving intervals are long, with an official national estimate of 450 days and recent studies
indicating an average of 590 days in Kiambu (Staal et al 1998a). There have been
discussions, at the policy level, on how the change from a government controlled to a
liberalised economy, including dairy subsector, should have been managed to avoid
disruptions of service provision to the farmers. Nevertheless, no ‘concrete’ plans have
been put in place to address the issues discussed.
Milk production in the smallholder sector is constrained by a number of factors; the
major ones being the level of dairy cattle feeding, animal genetics and disease challenges.
Disease challenge has become more important where dairy production practices have
spread into less productive areas because of the need for more agricultural land. In these
areas, grazing systems dominate and disease risks are high. Disease challenge, especially of
tick-borne diseases e.g. East Coast fever (ECF), is equally important in the high potential
areas as a result of the collapsed government services and failure of the private sector to fill
the gap. Other important factors that influence dairy development, besides animal
management related issues, include poor and inadequate infrastructure.
164 South–South Workshop
Muriuki

Milk marketing and marketing channelsAs mentioned earlier, milk production in Kenya is based on several different species of
livestock but for marketed milk, the most important species is cattle.
It is estimated that of the 2.4 million tonnes of milk produced annually from all species,
cattle produce about 2 million tonnes, of which 1.6 million tonnes is from the dairy herd
and mainly from the smallholders.
On-farm consumption (non-marketed milk) accounts for about 40% of milk and the
remaining 60% is marketed through various channels (Figure 2). Less than 15% of
marketed milk flows through milk processors (Thorpe et al. 2000), who include Brookside,
Spin Knit, Premier, KCC and other smaller private processors. The balance of marketed
milk is sold as raw milk. Non-processed milk marketing channels include: direct milk sales
to consumers by farm households (58%); and milk collected by dairy co-operative societies,
self help groups and individual milk traders who also sell either directly to consumers or to
processors.
Differences in milk marketing channels exist between and within the country’s various
regions. Until recently, marketing through KCC dominated in areas with high production
and low consumer concentration or few alternative market outlets. Nairobi city and its
environs, which is the largest single market in the country, accounts for over 60% of the
South–South Workshop 165
Smallholder dairy production and marketing in Kenya
Farm production (smallholder)
Marketed milk Milk retained at home
Co-op. + SHG + traders
KCC + private processors
70% 30%
40%60%
Marketed consumption
Total consumption
Household consumption Consumption by calf
58% 38%
25%75%
86.5%
Farm production (smallholder)
Marketed milk Milk retained at home
Co-op. + SHG + traders
KCC + private processors
70% 30%
40%60%
Marketed consumption
Total consumption
Household consumption Consumption by calfMarketed consumption
Total consumption
Household consumption Consumption by calf
58% 38%
25%75%
86.5%
Note: Percentages indicate the proportions from the source; SHG = self help groups; KCC = KenyaCo-operative Creameries.
Source: Modified from Omore et al. (1999).
Figure 2. Milk marketing channels.

formally marketed milk whilst Coast Province and parts of Western Province are among the
milk deficit areas in the country.
Women and school age children contribute greatly to labour for dairy activities, especially
to milk production and marketing, which involve waking up very early in the morning to feed
and milk cows, and to take the milk to market. This labour input has been viewed negatively,
raising concern relating to gender imbalances in labour distribution at the farm level.
Supply and demand situationKenya has largely been self sufficient in milk and milk products, except in years of extreme
bad weather. Very little however is known about the real demand for milk and milk
products. Consumption in the country is mainly in the form of liquid milk.
Available statistics show that milk production in Kenya nearly doubled from about 1.3
million tonnes in 1981 to about 2.5 million tonnes in 1990, but has since stagnated
(MoARD unpublished—Dairy Development Policy Proposal). This reduction in milk
production is, however, difficult to explain given the fact that there has not been any
observed major milk shortfall in the country. Consequently, recent statistics may
underestimate milk production. This possibility is made more likely by the results of recent
studies by the Smallholder Dairy Project (Ouma et al. 2000), which showed underestimation
in one of the districts in Central Kenya.
On the other hand, milk demand is expected to continue to increase due to growth of
the human population for which the highest rate of growth is expected in the urban centres.
It has been estimated that annual consumption of milk and dairy products in
developing countries will be more than double between 1993 and 2020, from
approximately 168 to 391 million tonnes (Thorpe et al. 2000). Population growth,
urbanisation and increased purchasing power are expected to drive this increase in
consumption. Estimated growth in the consumption of milk and dairy products in
developing countries is 3.3%. This compares with the 2.6% annual growth reported by
Leaver et al. (1998) for developing countries in the short term. In Kenya, the 3.3% projected
annual growth in consumption seems to be in line with the country’s 3% per year
population growth and the continued urbanisation. It is, however, doubtful whether this
growth will be achieved in the near future, especially the proportion of growth in
consumption expected from increased purchasing power, since the economic trend in the
country indicates otherwise.
The Kenya Dairy Master Plan report (MoLD 1991) estimated that per capita
consumption of marketed milk was 125 kg/year in the urban areas and 19 kg/year in the
rural areas. Milk producing rural areas, however, were reported to have a higher per capita
consumption. Preliminary results of a study carried out in Nairobi and Nakuru by the
Smallholder Dairy Project indicate higher levels of consumption and a reversal of the
urban–rural levels of consumption, with Nakuru rural areas having higher levels of
consumption per capita than both Nakuru and Nairobi urban centres (Ouma et al. 2000).
The Dairy Master Plan (MoLD 1991) predicted a national milk surplus (i.e. higher
marketed supply than consumption) by the year 2000. Nevertheless, using KCC data for
166 South–South Workshop
Muriuki
intake and sales, another study (Muriuki 1991) predicted a possible shortfall in marketed
milk by the same year. The main reason for the predicted shortfall was the observation of a
continued rise in demand for marketed milk as human population continued to grow,
especially in the urban centres, while the observed growth in milk production was slow.
Another factor that could increase demand for milk is growth in personal incomes.
However, per capita income in Kenya has been declining; thus, no increase in milk demand
is expected from this source.
On the supply side, most of the increase in marketed milk has been based on continued
increase in size of the dairy cattle population. This population has, however, stagnated over
the last decade. The milk yield per cow has been very low, with an annual yield of 1300
kg/cow. Lactation averages are also low for the officially recorded herds, comprised of the
national dairy cow elite mainly owned by large-scale farmers. Available information from
the Dairy Recording Services of Kenya (formerly the Kenya Milk Records) for the year 2000
show an average lactation (305 days) yield of 4477 kg for the Friesian–Holstein, which was
the highest for all the dairy breeds recorded (Esther Gicharu, Dairy Recording System of
Kenya, personal communication).
Considering the above scenario, indications are that both demand and supply have the
potential to increase. On the demand side, per capita income especially for the urban
population will be critical, while on the supply side, many factors will be in play: feeds and
feeding, market infrastructure, relative milk price, production systems etc.
Given the current economic situation, where real income levels seem to be declining and
going by the past trends, supply and demand balance is not expected to change significantly.
Even with the prevailing economic conditions, Kenya is self-sufficient in milk and milk
products; this situation is likely to persist for some time to come unless the economic and
market situations change. Nonetheless, if any change does occur the situation is more likely to
move towards shortfalls in milk production than production of a surplus.
Dairy as a source of livelihoodIn Kenya, there are about 625 thousand smallholder dairy farmers (Peeler and Omore 1997)
whose main source of income is dairying. About 40% of the milk produced is retained at
home for household consumption and for calf feeding. This confirms the importance of
dairy both as a source of income for rural household and as a source of household nutrition.
Per capita milk consumption for households producing milk on the farm is higher than the
national rural average (MoLD 1991) emphasising the importance of milk in the diets of the
Kenyan rural community who constitute three quarters of the poor people in the country.
The ability of dairy enterprises to earn regular income and to contribute to the household
diet on a daily basis throughout the year is an advantage over other farm enterprises. This is a
pointer as to why dairy is favoured as a cash crop for most farm households in the high
potential areas of Kenya, even where other cash crops do equally well.
Dairy production also creates employment for the rural communities at the farm level
and off-farm employment to informal milk traders, co-operatives and others dealing with
milk marketing. Recent studies indicated that labour for dairy production activities was
South–South Workshop 167
Smallholder dairy production and marketing in Kenya

provided mainly by the family but 60% of household were found to hire labour, with 20%
retaining permanent labour throughout the year (Staal et al. 1998b).
At a Land O’Lakes Regional Round Table meeting held in Malawi in March 2000 (Staalet al. 2000) indicated that for every 100 litres of milk/day, the processing sector employs
0.2 to 0.4 persons; milk bars employ 1.2 to 2 persons and itinerant traders (hawkers) employ
3 persons. These figures have been contested by the milk processors who want to believe that
the processing subsector has a higher ‘multiplier’ effect than the informal sector.
Nevertheless, the ability to create employment is very important in a country where level of
unemployment is very high and the economic situation is poor.
It has been noted that adult women in Kenya are more involved in intensified dairying
than adult men (Tangka et al. 1999). Women contribute more labour in activities such as
collecting and processing of feed, feeding, milking, marketing of milk, cleaning of sheds and
fetching of water for animals. Although women carry out most of the work in dairying
activities, they also appreciate that they are better off due to income increases and stability
(Mullins et al. 1996).
Access to income by women, not only from dairy enterprises but also from other
agricultural enterprises such as tea and coffee, is of concern at policy level. Men have been
accused of receiving the cash payment from farm earnings and misappropriating it on
personal enjoyment. Dairy income, however, is controlled primarily by women and very
little of this income shifts into the control of men. For example, Tangka et al. (1999) found
that women had some control over dairy income in 76% of surveyed households.
Participation of itinerant milk traders (hawkers) has generated much controversy in
Kenya, mainly because of perceived health risks to the consumer. What is not in dispute,
however, is that the informal market, which handles the bulk of marketed milk (Thorpe et
al. 2000), pays higher farm gate prices, offers lower consumer prices and generates
employment for rural people. It is also reported that milk traders earn higher daily wages
than the general average for their category of workers. Other benefits from dairying include
animal manure, which is used on the farm or sold for cash. Manure is important in
sustaining smallholdings and accounts for the apparent profitability of dairying, even where
dairying appears to be a loss making enterprise.
National effort towards development of smallholder dairyingThe adoption of dairy production by the smallholder in Kenya owes much to the
government’s policy and effort, which have deliberately developed the sector. This was
more pronounced soon after independence. The donors have also contributed through
specific programmes and projects. The United Nations Children’s Fund (UNICEF), the
Food and Agriculture Organization of the United Nations (FAO) and the Danish
International Development Agency (DANIDA) have made major efforts to develop the
dairy industry, especially the processing subsector. KCC developed most of its
infrastructure through the interventions of these donors, especially DANIDA. Other
notable programmes include the National Dairy Development Project (NDDP) and the
Rural Dairy Development Project (RDDP) sponsored by the Dutch and Finnish
168 South–South Workshop
Muriuki

Governments, respectively. The NDDP’s major activities were towards improved
production while the RDDP focused on marketing.
Current efforts include the SDP, funded mainly by the Department for International
Development (DfID) and the Kenya Government, who contribute in kind, and the
Livestock Development Project (LDP), which is sponsored by the Finnish Government.
The SDP’s goal is to contribute to sustainable improvements in the livelihoods of poor
people in Kenya and their purpose is to improve access by smallholder dairy farmers to
technologies, advice and information. The project is an integrated research and
development programme implemented through collaboration between the Ministry of
Agriculture and Rural Development (MoARD), the Kenya Agricultural Research Institute
(KARI) and the International Livestock Research Institute (ILRI). With declining farm sizes
due to pressure on land from the expanding population and access to formerly
public-delivered research and development services, a major issue is how to make the
smallholder farmer more productive within the existing economic situation. SDP has plans
to address these issues by testing and validating service delivery mechanisms through
farmers’ organisations. One concept that was tested recently is the delivery of dairy feed to
society members through credit arrangements with their co-operative society’s processing
plant, where the payment system is based on deductions from payouts. Other areas that the
project is considering for testing include delivery of extension services through milk
processors and other market agents, and through contract arrangements. To make impact
in these areas, the project is refocusing its purpose and putting more emphasis on
influencing policy and institution reforms through informed ideas.
The LDP’s overall objective is to improve the standard of living for the rural population
within the programme area, the western Kenya region, through increased milk production
and consumption. A major feature of the LDP is its holistic approach combining efforts to
increase milk production and improve the efficiency of the milk system.
The above are just some of the projects targeting dairy improvement. There are also other
efforts through non-governmental organisations and other community specific projects.
Environmental impact of dairy productionEnvironmental problems arise from: natural calamities such as drought and floods; human,
livestock, crop and forest diseases; soil erosion, degradation, infertility and desertification;
and human activities which exacerbate natural problems or create new man-made
problems, such as pollution, encroachment into other land uses leading to deforestation
and negative impacts on wildlife and on pastoralists (MoARD 1995).
Population increases in Kenya, which are currently estimated at 3% per year, have
created pressure on land, forest and water resources.
According to an FAO report on the Dairy Development Project (FAO 1993), the
possible negative environmental impacts of promoting dairy development in Kenya are
overgrazing of natural pastures, and pollution by cooling and processing plants. The Dairy
Master Plan (MoLD 1991) had raised the issue of overgrazing but little attention was given
to this issue. The major concern arose from the fact that as the pressure on land increases,
South–South Workshop 169
Smallholder dairy production and marketing in Kenya

there could be further subdivision of the already small parcels of land in the highly
populated areas. This is particularly worrying as each new household is likely to own cows
regardless of the size of its parcel of land. One ‘school of thought’ was that if dairy
production continued to rely on natural grazing, an increase in the Kenyan dairy population
would lead to overgrazing since the dairy population had already reached its threshold by
1990. The FAO report (FAO 1993), however, observed that in the context of Kenya,
development of dairying would not entail overgrazing because the additional feed would
not be obtained from the areas which are already over-exploited; instead, farmers would
tend to rely more on grown fodder and increased use of concentrates.
Other concerns relating to environmental degradation are consequent to the movement
of communities from high potential areas to marginal lands, as a result of pressure on land
without consideration to the land’s carrying capacity. The immigrants tend to move with
their practices including the keeping of dairy cattle. The result is usually overgrazing and
other forms of land abuse, such as deforestation and other demands, e.g. for fuelwood. The
spread of farming practices, such as dairy production, to less productive areas of the country
where less land use intensification has occurred and where grazing systems dominate, makes
disease challenges and land degradation risks more important because of their influence on
adoption and performance of dairy production.
While one cannot rule out possibilities of pollution from milk cooling and processing
plants, the problem may not be significant. A possible source of pollution is the packaging
materials used for milk, which tend to be abandoned as rubbish. Pollution from cattle waste
is unlikely until there is more commercial intensification; currently, demand for manure is
higher than supply. Under the current situation, manure is an integral part of the
smallholder crop–dairy system and is a driving force to dairy adoption in some parts of the
country. Manure is a medium for nutrient cycling through the animal and sustains
smallholder systems.
While there has been concern over possible environmental degradation by livestock, no
major study has been carried out to establish the situation and possible impact of current
production and processing practices. Other possible sources of environmental problems
include the use of cattle dips, poor choice of location for cattle dips and uncontrolled use of
prescription drugs. The collapse of the government veterinary services, as a result of
structural adjustments and economic reforms may exacerbate these problems, as there has
been an emergence of alternative service providers who are only semi-qualified and are likely
to misuse drugs.
Some current common practices of smallholders, such as the planting of fodder species,
e.g. Napier grass, are environmental friendly and help to protect the soil from erosion etc.
Smallholder production opportunities and constraintsIn the past, adoption of dairy farming in Kenya has been favoured by several factors
including: the presence of smallholder communities who kept cattle and who included milk
as an important part of their diets; the presence of a significant dairy cattle population; a
subtropical geography suitable for dairy cattle farming; and a conducive policy and
170 South–South Workshop
Muriuki

institutional environment provided by successive governments (Thorpe et al. 2000). This
combination of factors has led to a unique smallholder dairy industry in Kenya.
Furthermore, opportunities for smallholder dairy production in Kenya are enhanced by
the fact that the country has the genetic base and holds 85% of the dairy cattle population of
eastern Africa (Thorpe et al. 2000); a well developed milk processing sector putting it ahead
of its neighbours; and the recent re-launching of the East African Community that has
resulted in formation of a common market for a combined population of about 81 million
people (Daily Nation, 16 January 2001).
The contribution of dairying to the sustainability of smallholder crop–dairy systems
through its roles in nutrient cycling, regular cash generation ability, employment creation
and provision of farm household nutrition makes it an easy choice as a vehicle to address
rural poverty.
Development of smallholder dairying is, however, constrained by many factors
including: feed scarcities, disease challenges, the poor state of infrastructure such as rural
access roads, and water and electricity supplies, limited access to suitable credit and the
general poor national economic performance. Other problems include slow legal and policy
reforms and poor access to production and marketing services including those for
agricultural inputs.
Infrastructure such as rural access roads, and water and rural electricity supplies have a
major influence on milk marketing efficiency and are perhaps the most limiting factors to
the development of the smallholder dairy.
ConclusionsSmallholder dairying dominates both milk production and marketing in Kenya. The history
of the dairy industry in Kenya spans almost a century, but not until the 1960s did the
smallholder get into commercial dairy production. Dairying is a source of income not only
to the estimated 625 thousand smallholder households, but also to a larger number of
individuals employed in milk marketing. Moreover, it plays a crucial role in sustaining
smallholder crop–dairy systems through nutrient cycling within the system.
The current milk production level of 4–5 litres/cow per day can be improved. This will,
however, only occur if there is investment in market infrastructure and a general
improvement in the economy.
Dairy is an important factor in the effort to reduce poverty in the rural areas of
Kenya. Most smallholders start very poor and struggle to acquire their first cow as a
means to get out of poverty and to sustain their household; therefore, owning a cow is a
means of survival.
Dairy also creates employment opportunities through both the informal and formal
market channels. From information obtained through the SDP, it appears that the informal
sector is the more efficient in terms of prices, net incomes and employment creation. It has
been argued that the road to dairy development cannot be through the informal sector, but
the reality as seen in many developing countries is that the sale of raw milk, which drives the
informal sector, is going to continue for a long time to come.
South–South Workshop 171
Smallholder dairy production and marketing in Kenya

ReferencesBaltenweck I., Staal S.J., Owango M., Muriuki H., Lukuyu B., Gichungu G., Kenyanjui M., Njubi
D., Tanner J. and Thorpe W. 1998. Intensification of dairying in the greater Nairobi milk-shed:
Spatial and household analysis. Smallholder Dairy (Research & Development) Project.MoA/KARI/ILRI Collaborative Research Report. ILRI (International Livestock ResearchInstitute), Nairobi, Kenya.
CBS (Central Bureau of Statistics). 1999. Statistical abstract 1999. CBS, Office of the President andMinistry of Planning and National Development, Nairobi, Kenya.
CBS (Central Bureau of Statistics). 2001. 1999 Population and housing census. Volume I. CBS, Officeof the President and Ministry of Planning and National Development, Nairobi, Kenya.
Conelly W.T. 1998. Colonial era livestock development policy: Introduction of improved dairycattle in high-potential farming areas of Kenya. World Development 26:1733–1748.
FAO (Food and Agriculture Organization of the United Nations). 1993. Kenya Dairy Development
Project preparation report. Report 34/93 CP–KEN 33. FAO, Rome, Italy.
Leaver J.D., Santos F. J. and Anderson S. 1998. Meeting consumer demands for milk and identifyingresearch priorities. In: Gill M., Smith T., Pollott G.E., Owen E. and Lawrence T.L.J. (eds),Proceedings of a symposium organised by the British Society of Animal Science held at Nairobi, Kenya,
27–30 January 1998. BSAS Occasional Publication 21. BSAS (British Society for AnimalScience), Edinburgh, UK. pp. 43–51.
Lekasi J.K., Tanner J.C., Kimani S.K. and Harris P.J.C. 1998. Manure management in the Kenyahighlands: Practices and potential. The Henry Doubleday Research Association, Brainsdale,Victoria, Australia. 35 pp.
MoARD (Ministry of Agriculture and Rural Development). 1995. Agricultural sector review. ASIPSecretariat, Kilimo House, Nairobi, Kenya.
MoARD (Ministry of Agriculture and Rural Development). Kenya Dairy Development Policyproposal 2000. Unpublished.
MoLD (Ministry of Livestock Development). 1991. Kenya Dairy Master Plan. Report prepared for theMinistry by the Danish International Development Agency, August 1991. MoLD, Nairobi, Kenya.
Mullins G., Wahome L., Tsangari P. and Maarse L. 1996. Impact of intensive dairy production onsmallholder farm women in Coastal Kenya. Human Ecology 24:231–253.
Muriuki H.G. 1991. Liquid milk supply and demand in the formal (KCC) market in Kenya: Agovernment price fixed market. MSc thesis, University of Illinois at Urbana-Champaign, USA.
Ominde S.H. 1988. Kenya’s population growth and development to the year 2000.
Omore A., Muriuki H., Kenyanjui M., Owango M. and Staal S.J. 1999. The Kenya dairy subsector: A
rapid appraisal. Smallholder Dairy (Research and Development) Project Report. Nairobi, Kenya.51 pp.
Ouma E., Staal S.J., Omore A., Wanjohi P., Njoroge L. and Njubi D. 2000. Consumption patterns of
dairy products in Kenya. MoA/KARI/ILRI Collaborative Research Report, Smallholder Dairy(Research & Development) Project, Nairobi, Kenya.
Peeler E.J. and Omore A. 1997. Manual of livestock production systems in Kenya. 2nd edition. KARI(Kenya Agricultural Research Institute), Nairobi, Kenya. 138 pp.
Staal S. and Muriuki H. 2000. Policies and the informal sector in the dairy industry. Paper orallypresented at a Land O’Lake Round Table Meeting in Malawi. (unpublished).
Staal S., Delgado C. and Nicholson C. 1997. Smallholder dairying under transactions costs in EastAfrica. World Development 25:779–794.
172 South–South Workshop
Muriuki

Staal S., Chege L., Kenyanjui M., Kimari A., Lukuyu B., Njubi D., Owango M., Tanner J., ThorpeW. and Wambugu M. 1998a. Characterisation of dairy systems supplying the Nairobi milk market: A
pilot survey in Kiambu District for the identification of target groups of producers. Smallholder Dairy(R&D) Project. KARI/MoA/ILRI Collaborative Dairy Research Programme, ILRI, Nairobi,Kenya. pp. 85.
Staal S., Owango M., Muriuki H., Lukuyu B., Musembi F., Bwana O., Muriuki K., Gichungu G.,Omore A., Kenyanjui M., Njubi D., Baltenweck I. and Thorpe W. 1998b. Dairy systems
characterisation of the Nairobi milk shed: Application of spatial and household analysis. MoA/KARI/ILRI Collaborative Research Report. Smallholder Dairy (Research and Development)Project, Nairobi, Kenya.
Staal S.J., Kruska R., Balteweck I., Kenyanjui M., Wokabi A., Njubi D., Thornton P. and Thorpe W.1999. Combined household and GIS analysis of smallholder production systems: An applicationto intensifying smallholder dairy systems in Central Kenya. Paper presented at the thirdinternational symposium on Systems Approaches for Agricultural Development (SAAD-III) heldat Lima, Peru, 8–10 November 1999, National Agrarian University, La Molina, Lima, Peru.
Tangka F., Ouma E.A., Staal S.J. and Shapiro B. 1999. Women and the sustainable development ofmarket-oriented dairying: Evidence from the highlands of East Africa. Paper presented at theInternational Sustainable Development Research Conference held at University of Leeds, Leeds,UK, 25–26 March 1999.
Thorpe W., Muriuki H.G., Omore A., Owango M.O. and Staal S. 2000. Dairy development inKenya: The past, the present and the future. Paper presented at the annual symposium of theAnimal Production Society of Kenya, Nairobi, Kenya, 22–23 March 2000.
South–South Workshop 173
Smallholder dairy production and marketing in Kenya
An overview of dairy development inTanzaniaL.R. KurwijilaDepartment of Animal Science and Production, Sokoine University of AgricultureP.O. Box 3004, Morogoro, Tanzania
IntroductionTanzania, with an estimated human population of 29 million, is endowed with 88.6
million hectares of land suitable for agriculture, of which only 6% is currently cropped
(MoAC/ SUA/ILRI 1998). About 60 million hectares of rangelands are ideal for
livestock but only 40% of these lands can be used for livestock production due to tsetse
infestation of the remaining rangelands. The carrying capacity of the rangelands has
been estimated at 20 million animal units but in 1996 there were only 16 million animal
units (MoAC 1997).
Tanzania has an estimated 3.87 million agricultural households, of which 17% are
female headed. Most households (average size = five persons) are dependent on growing
crops only, while 4 out of 10 also keep livestock. Only 0.4% of rural households are solely
dependent on keeping livestock. Most households keep small herds of livestock (average
number being 14). Of the 21 million agricultural household members, approximately 8.7
million (≥10 years old) work full time on the farm.
Although Tanzania ranks third in Africa after Ethiopia and Sudan in size of cattle
population, productivity is relatively low. Livestock production as a whole contributes 18%
of the total gross domestic product (GDP) and 30% of agricultural GDP. The dairy industry
contributes 30% of the livestock GDP, beef contributes 40% and other livestock contribute
30% (MoAC 1997). A recent rapid appraisal study (MoAC/SUA/ILRI 1998) gave an
updated assessment of the performance of the Tanzanian dairy industry. The population of
livestock in Tanzania in 1995 was estimated at 15.6 million cattle (in about 1.114 million
households), 10.7 million goats (in about 1.26 million households), 3.5 million sheep (in
about 520 thousand households), 435 thousand pigs and 26 million poultry. Seven regions
(Kigoma, Morogoro, Pwani/Dar, Lindi/Mtwara and Ruvuma) have insignificant cattle
populations (<5 animals/km2) mostly due to tsetse infestation. Exotic dairy cattle and their
crosses numbered about 246 thousand head, which includes estimates for Dar es Salaam
but excludes dairy cattle kept in other urban centres.
Milk production has not kept pace with population growth, especially the urban
population (Sumberg 1997). Total milk production from indigenous cattle and improved
cattle is estimated at 643 thousand tonnes (79%) and 171 thousand tonnes (21%),
respectively. Large-scale farms produce only about 30 million litres out of the 171 million
174 South–South Workshop
litres produced by improved dairy cattle; smallholder cattle produce the rest. Most
smallholder production is concentrated in the regions of Arusha and Kilimanjaro where
approximately 66% of dairy cattle are located. Per capita milk availability varies widely
geographically depending on local cattle populations and seasonally due to feed
availability. The overall per capita milk availability is low (20–22 kg/annum) compared
with Kenya (80 kg/annum), the average for Africa (35 kg/annum) and the world average
(105 kg/annum). Constraints to increased dairy production have been cited in the
Agricultural and Livestock Policy Document to be: i) poor nutrition; ii) diseases and
parasites; iii) weak extension services; iv) inadequate supply of dairy stocks; v) inadequate
research; vi) non-availability of credit services; vii) disorganised milk marketing; and (vii)
poor processing facilities.
Against this background of opportunities and constraints, the Agriculture and
Livestock Policy sets a target of increasing the per capita supply of milk to 26 kg/annum by
the year 2000 implying a dairy herd increase to about 500 thousand head by the same year.
To overcome the identified constraints and make use of available opportunities (suitable
land, climate, a large cattle population, growing demand for milk and milk products etc.),
the dairy industry needs to develop appropriate policies and development strategies within
the framework of the macro-economic and the Agricultural and Livestock Policy
environment prevailing in Tanzania. Over the years, the overall objectives of Tanzania’s
dairy development policy have been attainment of national self-sufficiency in milk and dairy
products and contribution to poverty alleviation.
The purpose of this paper is to give an update of the dairy industry in Tanzania including
milk production systems, the efficiency and economics of milk production, impact of
smallholder production on poverty alleviation, nutrition, the environment, dairy
consumption and marketing. The paper concludes by looking at future prospects and
constraints.
Milk production and marketing systems in Tanzania
Dairy production systemsA rapid appraisal study identified five dairy production systems that have evolved in
Tanzania over time (MoAC/SUA/ILRI 1998). These are:
i) Smallholder dairy farming, integrated with perennial crops like banana and coffee,
found in the northern regions (Kilimanjaro/Arusha), Kagera Region in the north-west
and the southern highlands of Tanzania.
ii) Smallholder dairy farming integrated with annual crops like maize and cereals found in
the central part of Tanzania.
iii) Specialised medium-scale dairy farms found near big urban centres such as Dar es
Salaam, Tanga, Mwanza and Musoma. On these farms with 10 to 50 cows, milk
production is the main economic activity. There is little crop cultivation and a limited
level of mechanisation.
South–South Workshop 175
An overview of dairy development in Tanzania

iv) Peri-urban dairy is found in the coastal belt, mainly near Dar es Salaam, Tanga,
Morogoro and other urban centres where many civil servants and businessmen have
taken up dairying as a means of generating additional income.
v) The traditional, semi-sedentary system, which accounts for 75% of total milk
production. However, this sector is relatively forgotten in dairy development policies,
which generally aim at the crossbred cattle dairy farming. ‘Because of its size, this
sub-sector represents the biggest potential for increasing milk production in Tanzania,
yet very little effort has been directed at improving milk offtake from this sub sector’
(Kurwijila 1996; Kurwijila et al. 1997). The Austroproject Association is one of the
exceptions, being an organisation that supports this group of mainly Maasai herders, in
collecting and marketing their milk.
vi) Parastatal large-scale dairy farms. The government through the dairy farming company
(DAFCO), operated at least 7 dairy farms with a total of over 3000 dairy cattle. In spite of
having the best dairy animals in the country, the performance of the DAFCO farms did
not measure up to expectations due to a number of management problems. Milk
production declined from 7.5 litres/cow per day in 1982 to 6.7 litres/cow per day in
1994 (Keregero 1988; Mtumwa and Mwasha 1995). Most of these farms have been
privatised or are in the process of being privatised.
Animal health services delivery systemsUntil recently, the delivery of animal health services was embedded in the agriculture
extension system with the government paying for cost of extension personnel, transport
and some drugs, especially those used for tick control. Following market liberalisation in the
mid-1980s, the veterinary service has been increasingly run by the private sector. The
government still pays the salaries of extension veterinary staff, and meets the costs of disease
surveillance and vaccinations against epidemic and transboundary diseases such as CBPP
(contagious bovine pleuropneumonia) and rinderpest. Due to the poor infrastructure of the
animal health delivery system, especially in rural areas, the use of para-veterinary staff is
encouraged.
Related to this is delivery of artificial insemination (AI) and breeding services. The
government runs a national AI centre at Usaa River in Arusha but the service has not been
very efficient with < 5000 inseminations being recorded per year. Fully privatised veterinary
and AI services are still confined to very few urban and peri-urban centres where farmers are
accessible and able to pay for the services. Government policy is to move towards a private
sector serviced and government regulated animal health delivery system within the next
10–15 years.
Efficiency and economics of milk productionThe competitiveness of any dairy industry depends on the efficiency with which milk is
produced. This may be measured in biological terms such as calving intervals, feed
176 South–South Workshop
Kurwijila

conversion efficiency and milk production/cow per day, which translate into cost of
production per litre. Smallholder production reveals a similar trend to that shown by data
from the Tanga Smallholder Dairy Development Programme (Msanga et al. 2001; Table 1).
The general decline in performance of both first lactation heifers and multiparous cows is a
reflection of reduction in use of several essential inputs (feeding, veterinary services etc.) and
extension services as the number of farmers and cows increases in the dairy development
programme.
Table 1. Milk production trend under Tanga Smallholder Development
Programme (1990–95).
YearNumber of
cowsLS mean*
first lactation yield (SE)LS means repeatedlactation yield (SE)
1990 99 2084 (79) 1993 (132.1)
1991 167 1996 (63.5) 1881 (93.1)
1992 248 1904 (56.2) 1952 (80.8)
1993 74 1668 (87.0) 2178 (115.3)
1994 120 1358 (71.4) 1774 (106.1)
* LS means = least squares means; SE = standard error.
Adapted from Msanga et al. (2001).
The cost of production varies depending on the production system. It is reported to be
lower in the rural based traditional system, where milk fetches as little as 80 Tanzanian
shillings (TSh) per litre (US$ 1 = TSh 900 , November 2001), than in urban and peri-urban
areas where milk production costs have been estimated to be in the range of TSh
165–200/litre (de Wolf 1999). In the southern highlands, smallholder dairy farmers are
reportedly producing milk at TSh 60–80/litre (Mugittu 1999). The value of dairying
extends beyond milk sales. Manure and heifers are particularly important outputs of the
enterprise, especially in the zero grazing systems of the Kagera and Kilimanjaro
coffee/banana economy where manure is ranked second after milk (Silas et al. 1998).
Milk production, supply and demandImprovements in milk supply in Tanzania have largely been due to increases in cattle
numbers rather than increases in productivity. The number of indigenous cattle increased
by 20% between 1984 and 1997. The number of crossbred dairy cattle increased from 142
thousand to 250 thousand over the same period (an increase of 6% per annum). Although
the improved dairy herd has grown at a rate of 6%, this has not had a big impact on per
capita consumption because the dairy herd is still a very small proportion of the total herd.
The relative growth rate in urban and peri-urban areas during the same period is reported to
have been much higher. In Dar es Salaam, for example, the number of dairy cattle increased
from about 2 thousand in 1984 to over 20 thousand by 1995. The spatial distribution of
milk supply is skewed in favour of regions with high zebu and/or dairy cattle populations,
such as Kilimanjaro, Arusha, Dar es Salaam/Coast, Mara, Mwanza, Kagera, Singida and the
South–South Workshop 177
An overview of dairy development in Tanzania

major urban centres. This is associated with much higher levels of per capita milk
consumption in urban centres (30 litre/annum) than in rural areas (15–20 litres/annum).
It was estimated that by 1998 the traditional livestock sector was producing about 438
million litres of milk per year, while the commercial sector produced 250 million litres of
milk. Though the offtake from the dairy herd contributes only about 20% of total milk
production, it is estimated that it contributes 95% of the marketed milk. Over the last two
decades, total milk production has increased at the relatively low rate of about 2.8% per
annum, i.e. the same rate as population growth. Therefore, despite the large number of
cattle in Tanzania, production of milk and milk products has not satisfied the demand,
particularly in the urban market (Table 2).
Table 2. Milk production and consumption trends in Tanzania 1970–98.
Year
Population
(×106)
Milk production
(×106 kg)Per capita consumption
(kg)
1970 13.3 302 22.9
1980 17.5 391 22.1
1985 21.7 436 20.1
1990 25.9 500 19.3
1995 28.1 585 21.0
1997 30.2 675 22.4
1998 31.1 687 22.1
Source: MALDC (1997–98 to 1998–99).
Tanzania’s per capita milk supply of 22 litres/annum is one of the lowest in sub-Saharan
Africa. This is partly due to the predominance of the low milk producing zebu cattle (with
yields of about 200 kg/annum) and a relatively small improved dairy herd producing below
potential (with yields of about 1800 litres/cow per annum versus potential yields of 2500
litres/cow per annum), lack of milk marketing infrastructure, low purchasing power and the
cultural food consumption habits of consumers.
According to the MoAC/SUA/ILRI (1998) study estimates, milk demand projections
to the year 2010 (based on current consumption levels, urbanisation levels of 5% per
annum, a population growth of 2.3% per annum, an overall income elasticity for dairy
products of 0.8 and a modest real GDP growth of 1% per annum) indicate that demand
could increase by 60% to 1.5 billion litres of milk annually (see Figure 1) or a per capita
consumption of 44 and 30 litres/annum, respectively, in urban and rural areas.
Milk production (under the following assumptions: no change in current cattle herd
productivity and structure; an increase in zebu cattle population of 1.7% per annum and a
dairy herd expansion of 4.6% per annum) would increase by 43% to 1.33 billion
litres/annum resulting in a shortfall of some 170 million litres/annum (466 thousand
litres/day). Milk production would have to increase at the rate of 3% per annum to keep pace
with demand. Should the economic performance of the economy improve by 2% GDP or
more, the gap between supply and demand will be even greater, signifying an opportunity for
smallholder dairy producers to use dairying as an attractive avenue for poverty alleviation.
Policy guidelines are required to enable farmers to fully exploit this potential opportunity.
178 South–South Workshop
Kurwijila
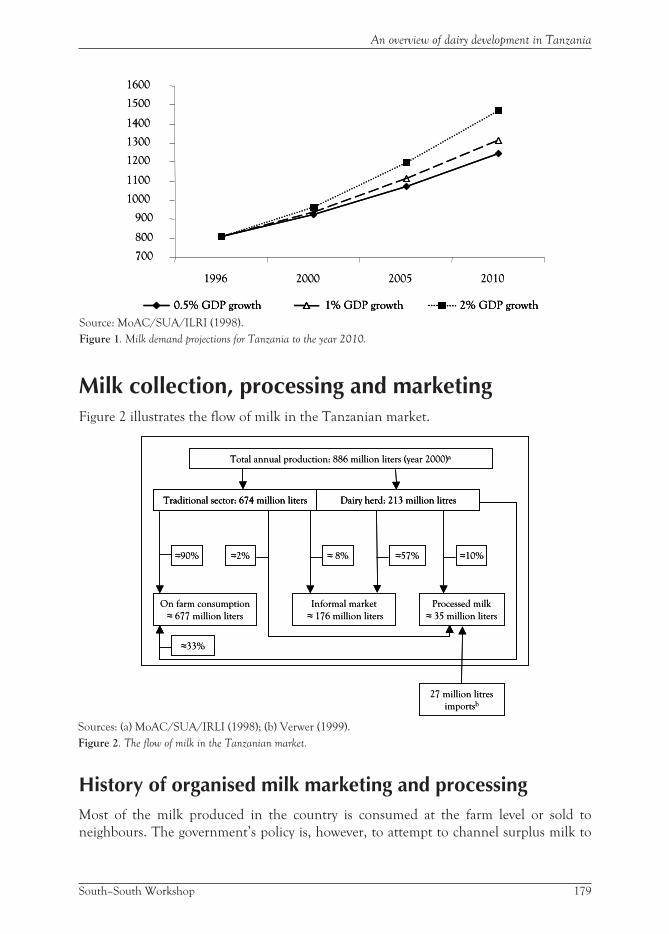
Milk collection, processing and marketingFigure 2 illustrates the flow of milk in the Tanzanian market.
History of organised milk marketing and processingMost of the milk produced in the country is consumed at the farm level or sold to
neighbours. The government’s policy is, however, to attempt to channel surplus milk to
South–South Workshop 179
An overview of dairy development in Tanzania
700
800
900
1000
1100
1200
1300
1400
1500
1600
1996 2000 2005 2010
0.5% GDP growth 1% GDP growth 2% GDP growth
700
800
900
1000
1100
1200
1300
1400
1500
1600
1996 2000 2005 2010
0.5% GDP growth0.5% GDP growth 1% GDP growth1% GDP growth 2% GDP growth2% GDP growth
Source: MoAC/SUA/ILRI (1998).
Figure 1. Milk demand projections for Tanzania to the year 2010.
Total annual production: 886 million liters (year 2000)a
Traditional sector: 674 million liters Dairy herd: 213 million litres
≈57% ≈10%≈ 8%≈2%≈90%
On farm consumption
≈ 677 million liters
Informal market
≈ 176 million liters
Processed milk
≈ 35 million liters
≈33%
27 million litres
importsb
Total annual production: 886 million liters (year 2000)a
Traditional sector: 674 million liters Dairy herd: 213 million litresTraditional sector: 674 million liters Dairy herd: 213 million litres
≈57% ≈10%≈ 8%≈2%≈90%
On farm consumption
≈ 677 million liters
Informal market
≈ 176 million liters
Processed milk
≈ 35 million liters
≈33%
27 million litres
importsb
Sources: (a) MoAC/SUA/IRLI (1998); (b) Verwer (1999).
Figure 2. The flow of milk in the Tanzanian market.
dairy plants for commercial processing, with a view to supplying urban markets with
hygienic milk and milk products.
In the past, rural milk collection was organised by the processing plants. A network of
collection routes, on the village feeder roads, was established by each plant. On these routes,
collection centres equipped with cooling facilities were provided and operated by Tanzania
Dairies Limited (TDL). In addition, a number of producers delivered their milk directly to
the processing plants, earning a collection fee.
At this time, seven processing plants owned by TDL were processing milk. However, the
ability of TDL to collect and process raw milk was very low and with ageing of plant
machinery and milk collection infrastructure, the capacity to collect and process raw milk
declined drastically over time. The effectiveness of milk collection depended on the
availability of adequate transport, road conditions and the operation of milk cooling
centres. Due to the ageing of machinery, poor maintenance, frequent breakdown of vehicles
and unattractive official producer prices, less milk was collected by the plants leading to low
capacity utilisation of the established dairy plants.
The share of local fresh milk processed by TDL reached its highest level in 1979, 14.3
million litres (35.64%) out of a total of 40.1 million litres processed (Lohay 1988). TDL
relied heavily on the recombining of World Food Programme (WFP) milk powder and
butter oil.
Current milk marketing and processingThe marketing policy has undergone significant changes as part of the overall process of
structural adjustment. The marketing of milk and milk products in the formal sector was
previously done by TDL, but most of the milk produced was sold directly to consumers.
After liberalisation and privatisation of TDL, the private sector has been investing in
collection, processing and marketing. This has resulted in improved availability of milk in
urban centres and better prices for the producers, although consumer prices remain high.
Some parastatal organisations and private companies have established other small
processing units. This has improved the total processing capacity from 290 thousand
litres/day under TDL to the current level of 401 thousand litres/day (Table 3). However,
the total daily intake is only about 80 to 90 thousand litres/day. During the dry season, milk
intake from local sources decreases by as much as 30%. Some processors in Dar es Salaam
use imported milk powder to fill the gap.
In spite of these positive developments, the marketing of milk is still dominated by
informal milk marketing. It has been reported that less than 10% of milk produced in the
country is marketed as processed milk and milk products. The market is highly fragmented.
High milk producing areas are situated far away from milk centres in the major urban
centres. The range of dairy products on the market is still very limited. Over 90% of the milk
marketed informally is sold as raw milk by informal market intermediaries with all the
attendant health risks (MoAC/SUA/ILRI 1998). In some towns like Mwanza, Tabora and
Shinyanga, itinerant milk vendors supply nearly all the fresh milk consumed (Sumberg
1996; Stewart 2000; SUA/ILRI 2000).
180 South–South Workshop
Kurwijila

Table 3. Milk processing plants in existence after privatisation in 1995.
S.
No.Lo-
cation Plant name
Yearestab-lished
TDL Plantsbefore liberal-
isation (×103
liters/day)
Private dairyplants after
liberalisation
(×103 liters/day)
Highest level ofmilk
processed/day(year) Status
1 DSM Royal Dairy 1968 90 90 3836 (1994) Privatised, operating
Natures Choice 1994 0 4.5 Second hand, private,closed
Azam 1993 0 3 Private, operating
Tommy Dairy 1998 0 15 New, private, operating
REKIEnterprises
1997 0 6 New, private, operating
2 Tanga Ex-TDL plant 1980 30 30 2240 (1985) Not yet privatised,closed
Tanga Fresh 1998 0 10 n.a. New, private, operating
Tanga DairyCo-operativeUnion (TDCU)
1993 0 10 n.a. New, private, operating(milk chilling only)
3 Arusha (Ex-TDL)Arusha DairyCompany
1969 60 60 10,137 (1979) Privatised, operating
Arusha DairyCompany
1995 0 60 n.a. Privatised, operating
4 Mara (Ex-TDL)Musoma Dairy
1970 45 45 15,391 (1977) Privatised, operating(UHT)
(Ex-TDL) UtegiPlant
1970 45 45 10,000 (1977) Not yet privatised,closed
Baraki Sisters 1995 0 3 n.a. Private, operating
New Mara Milk 1998 0 6 n.a. New, operating
5 MwanzaVictoria Dairy 2000 0 10 n.a. New, operating
Lake Side 1970 5 n.a. Private, closed
6 Kagera 9 Mini-dairies(100–500litres/day)
1994 0 1.8 n.a. KALIDEP, semi-private,operating
7 Moro-goro
Universityplant (SSA)
1976 0 3 700 (1976) Public, operating
8 Tabora Ex-TDL plant 1945 5 5 1475 (1984) Privatised, closed
9 Coast Mojata 1995 0 6 n.a. New, private, operating
10 Iringa ASAS 2000 0 5 3000 (2001) New, private, operating
NJOLIFA/CEFA
1997 0 10 n.a. Not operating
11 Mbeya Ex-TDL 1979 16 16 3542 (1986) Closed
12 Moro-goro
Melela bustanifarm
1995 0 0.5 n.a. Operating
Total installed capacity 291 401.8
n.a. = data not available.Updated from Kurwijila et al. (1997).
South–South Workshop 181
An overview of dairy development in Tanzania
Milk importsDuring the 1970s and 1980s Tanzania enjoyed food commodity aid from the WFP, the EU
and other bilateral sources. The largest amount of recombined milk received in a year was
about 35 million litres of liquid milk equivalent (LME) in 1983 (Lohay 1988) which
declined to about 7 million litres LME in 1993. The WFP/EU dairy commodity aid stopped
in 1995. Since then milk imports have declined somewhat. In 1999, the Netherlands
Economic Institute (NEI) estimated that 5 million litres LME of recombined milk were
imported into Tanzania (NEI 1999). A recent detailed study of the Tanzania Revenue
Authority’s data on dairy imports into Tanzania has shown that total milk imports between
1995 and 1998 amounted to 109.6 million litres LME, equivalent to 27.4 million litres
LME per annum (Verwer 1999). This figure is similar to the TDL total import of 27.9
million litres in 1985. It appears therefore that in response to the market forces prevailing in
Tanzania, other importers have moved in to fill the gap left by WFP/EU commodity aid.
Currently imports come in through non-governmental organisations (NGOs) and religious
organisations, and in the form of emergency relief aid from the EU’s European
Commission Humanitarian Office (Verwer 1999).
The official government policy is to allow milk imports as long as proper taxes are paid.
Recent outcries from the private milk-processing sector have forced the government to
review this policy with a view to reviewing tax regimes vis-à-vis subsidised milk imports to
protect the local industry against dumping.
Conclusions• The dairy industry in Tanzania has come a long way. From the state-owned farms and
processing plants of the 1970s and 1980s, the private sector including smallholder farmers
is playing an increasingly important role in milk production, processing and marketing.
• Traditional dairy cattle still contribute a significant amount (over 75 of the estimated
886 million litres of milk produced and consumed).
• The contribution of the smallholder production is presently about 30% and is
increasing, but accounts for over 85% of marketed milk.
• Total processing capacity is about 400 thousand litres/day, about 67% of the capacity
required to supply Tanzania with about 500 thousand litres of milk/day in the 236
million litre/annum milk market. Current actual processing throughput is only about
80–90 thousand litres/day; this is achieved by about a dozen small-scale to medium-scale
dairy processing plants.
• The per capita consumption remains low at about 22 litres/annum, but demand is
conservatively estimated to grow to 1.33 billion litres, leaving a supply gap of about 170
million litres/annum (466 thousand litres/day) by the year 2010. Imports are
currently estimated at 27 million litres LME/annum (74 thousand litres/day) and are
projected to increase.
182 South–South Workshop
Kurwijila

• The prognosis for the future of the dairy industry in Tanzania is good given the way
dairying is spreading rapidly to non-traditional dairying areas in response to the economic
opportunities it provides to milk producers and the growing domestic market demand.
ReferencesKeregero M.M. 1988. The role of the livestock sector in preventive nutrition programmes. Proceedings
of the Tanzania Society of Animal Production 15:280–296.
Kurwijila L.R. 1996. Challenges and coping strategies for the Tanzania dairy industry to satisfy thefuture demand for milk and milk products by the growing human population. Proceedings of the
Tanzania Society of Animal Production 23:1–22.
Kurwijila L.R., Jorgensen P. and Mdoe N.S.Y. 1997. Market oriented dairying: The case of Tanzania.
Paper presented at the FAO workshop held at Anand, India, 1–3 December 1997. FAO (Food andAgriculture Organization of the United Nations), Rome, Italy. pp. 86–102.
Lohay A.B. 1988. Contribution of the milk processing industry towards the national nutritionaldemand in Tanzania. Proceedings of the Tanzania Society of Animal Production 15:243–279.
MoAC (Ministry of Agriculture and Co-operatives). 1997. The agricultural policy of Tanzania.Government Printer, Dar es Salaam, Tanzania.
MoAC (Ministry of Agriculture and Co-operatives)/SUA (Sokoine University of Agriculture)/ILRI(International Livestock Research Institute). 1998. Rapid appraisal of the Tanzania dairy subsector:
Executive summary. Volume 1. ILRI, Nairobi, Kenya.
MALDC (Ministry of Agriculture, Livestock Development and Co-operatives). Budget speech,1997/98 to 1998/99.
Msanga Y.N., Brayant M.J. and Katule A.M. 2001. Effect of environmental factors on lactationperformance of crossbred dairy cattle on smallholder farms in northern Tanzania. Tanzania
Journal of Agricultural Science 3. (in press).
Mtumwa A. and Mwasha P.S. 1995. The strategy for sustainable dairy development in Tanzania.Proceedings of the Tanzania Society of Animal Production 22:1–13.
Mugittu F.V. 1999. A survey of cost of smallholder milk production in the southern highlands ofTanzania. Southern Highlands Dairy Development Programme, Tanzania. Unpublished report.
NEI (Netherlands Economic Institute). 1999. Livestock sector review. Ministry of Agriculture andCo-operatives, Dar es Salaam, Tanzania. Mission Report. NEI, Rotterdam, The Netherlands.
Silas O., Masuruli B. and Stanslaus D. 1998. Privatisation of the dairy sector services: Its effect to thesmallholder farmers in Kagera and the role of KALIDEP project. In: de Wolff et al. (eds),Proceedings of the 2nd National Dairy Development Conference held at Arusha, Tanzania 5–7 August
1998. Ministry of Agriculture and Co-operatives. pp. 18–29.
Stewart P. 2000. Project proposal towards the revival of the Tabora Dairy. Unpublished.
SUA (Sokoine University of Agriculture)/ILRI (International Livestock Research Institute). 2000. APRA report on milk marketing study in Greater Dar es Salaam and Mwanza milk market.Unpublished report.
Sumberg J. 1996. Livestock production in peri-urban areas of Africa: An analysis of Dar es Salaam,Mwanza and Shinyanga in Tanzania. Unpublished research report submitted to the ODALivestock Systems Research Programme. Overseas Development Group, University of EastAnglia, Norwich, UK.
South–South Workshop 183
An overview of dairy development in Tanzania
Sumberg J.E. 1997. Policy, milk and the Dar es Salaam peri-urban zone: A new future or an olddevelopment theme? Land Policy 14(4):277–293.
Verwer S. 1999. Exporting milk to Tanzania and Jamaica. PhD thesis, University of Wageningen,Wageningen, The Netherlands.
de Wolf J. 1999. Economics of dairy farming in Dar es Salaam. Proceedings of the Tanzania Society of
Animal Production 26:29–37.
184 South–South Workshop
Kurwijila
Smallholder dairy production andmarketing in eastern and southern Africa:Regional synthesisH.G. Muriuki1 and W. Thorpe2
1. Ministry of Agriculture and Rural Development, P.O. Box 30028, Nairobi, Kenya2. International Livestock Research Institute, P.O. Box 30709, Nairobi, Kenya
IntroductionThe production of milk for the market (dairy production) in eastern and southern Africa
(E&SA) has some common characteristics. In all countries except South Africa and
Zimbabwe, it is dominated by smallholders. With the exception of Sudan and Somalia,
where camels make a major contribution, cattle are by far the largest source of marketed
milk (Table 1). Milk is produced in three systems: by pastoralist herds; by herds kept by
agro-pastoralists; and by crop–livestock farmers (Walshe et al. 1991). The demand for milk
by the producer household and its neighbours, the potential to produce a surplus over these
requirements and the accessibility of ‘external’ markets, particularly urban centres,
determine the level of milk off-take and therefore the importance of marketed milk
production in each of these systems (de Leeuw et al. 1999). Consequently, in E&SA the
importance or otherwise of smallholder dairy systems reflects the proximity to major
markets, the dietary and cattle (or camel) keeping habits of the local population and the milk
production potential of the farming system.
While in the arid, semi-arid and highland zones of E&SA there is a long tradition of
cattle (or camel) keeping and milk consumption, cattle production in the more humid zones
has been constrained by tick-borne diseases and trypanosomosis, resulting in the
predominance of sheep and goats and minimal milk production and consumption (de
Leeuw et al. 1999; Kurwijila 2002a). As a result, smallholder dairy systems in E&SA tend to
be concentrated in the (subhumid) highlands, the wetter semi-arid and drier subhumid
areas, and near to or within urban consumption centres (Walshe et al. 1991). Less
proximate production occurs only in those regions with concentrations of traditional
consumers and/or with an efficient market infrastructure (Kurwijila 2002a; Muriuki 2002;
Omiti 2002; Tsehay 2002).
The majority of the rural systems producing marketed milk in E&SA are integrated
crop–dairy systems, which benefit from the positive synergies between the dairy enterprise,
staple food crops (generally maize) and any cash cropping (Kurwijila 2002a; Muriuki 2002;
Staal 2002). On the other hand, the potential for marketed milk production from
pastoralist and agro-pastoralist systems generally depends on the cost of collection and
transport of milk that is surplus to producer household needs, which is largely determined
South–South Workshop 185

Table 1. Total milk availability for sub-Saharan Africa (SSA) and in selected countries of eastern and southern Africa, 1985 and 1998.
SSA and selected countries ofeastern and southern Africa
Total milk availability (× 103 t)
Percentage of total milk availability
Cows’ milk Buffalo milk
Milk of other
species Net imports
1985 1998 Change 1985 1998 1985 1998 1985 1998 1985 1998
Total SSA 13,728 17,432 2704 57 63.5 0 0 26.9 26.5 16.1 9.9
Ethiopia 1125 1170 45 60.7 80.1 0 0 19.6 19 19.7 0.9
Kenya 1656 2421 765 89.6 94 0 0 7.6 5.9 2.8 0.1
Madagascar 484 536 52 94.7 97 0 0 0 0 5.3 3
Somalia 2412 2263 –149 19.5 24.9 0 0 77.1 74.6 3.4 0.5
Sudan 2637 4557 1920 63.9 64.1 0 0 31.8 35.3 4.3 0.6
Tanzania, United Republic of 530 724 194 81.1 85.4 0 0 12.8 13 6.1 1.5
Uganda 377 485 108 94 98 0 0 0 0 6 2
Zimbabwe 530 552 22 98.1 105.1 0 0 0 0 1.9 –5.1
Source: Tambi et al. (2001).
186
by the distance to a consumption centre (Omiti and Staal 1996; Omiti 2002). If there is
demand for an easily transported dairy product such as butter, which dominates the
Ethiopian dairy market (Tsehay 2002), these costs will be lower than for liquid milk.
Conversely, where demand for fresh liquid milk and production is close to a concentration
of consumers, pastoralists and agro-pastoralists are able to compete with peri- and
intra-urban dairy producers, as shown by Maasai herders in Tanzania supplying the major
market of Dar es Salaam (Kurwijila 2002a).
It is these characteristics of smallholder dairying which explain the large variation in
dairy consumption, production and marketing amongst and within the countries of E&SA,
and which determine the technical, policy and institutional challenges affecting
smallholder dairy development.
Milk availability and consumptionTambi et al. (2001) have reported a comprehensive analysis of the patterns of change from
1985 to 1998 in dairy consumption and production in developing countries, including
results for individual countries in E&SA. The measure of milk consumption used in their
study is a simplification of the system used by the Food and Agriculture Organization of the
United Nations (FAO) in its ‘food balance sheets’. It uses ‘domestic supply’ without
adjustments for changes in stocks and is referred to as ‘milk availability’, calculated as
domestic production plus net imports. In the absence of documented studies on actual
consumption in the majority of countries in E&SA, the estimates of Tambi et al. (2001) give
a reasonable comparative picture of the regional variation in dairy consumption.
The analyses show that in 1998, developing countries had over 228 million tonnes of
milk available for consumption and other uses. Of this total, India alone had 31% and
sub-Saharan Africa (SSA) only 8%. Whilst camels’ milk was not important in west, central
and southern Africa, it was in eastern Africa (Table 1). Nevertheless, cows’ milk dominates
marketed milk production throughout the region. In SSA, net imports accounted for only
10% in 1998, down from 16% in 1985. These imports were mainly serving consumers in
West and Central Africa. In E&SA, net imports formed a very small proportion of available
milk (Table 1) indicating the high degree of self-sufficiency in production of milk and dairy
products in the region, which is an oft-stated national policy (e.g. in Ethiopia, Tsehay 2002;
and Tanzania, Kurwijila 2002b).
Between 1985 and 1998, of all developing country regions except West Asia and North
Africa (WANA), SSA had the smallest percentage increase in total milk availability (27%).
Kenya and Sudan accounted for over 70% of the change (Table 1). The insecurity and
political instability in many eastern and southern African countries, e.g. Angola and
Somalia, contributed to the region’s relatively poor performance, which in turn affected
availability per capita.
What is more, from 1985 to 1998, milk availability in SSA grew less rapidly than the
human population, such that by 1998 SSA experienced a decrease of approximately 4 kg in
milk availability per capita (Table 2). While cows’ milk production per capita decreased in
several countries in E&SA, it increased for the region as a whole because Sudan and
South–South Workshop 187
Smallholder dairy production and marketing in eastern and southern Africa: Regional synthesis

Kenya—the region’s largest milk producers—reported significant increases in cows’ milk
production. Although net imports and production from other species declined in Kenya,
the increase in cows’ milk production more than compensated for the decline. As a result,
there was an overall increase in total milk availability per capita, which was reported as 85 kg
in 1998 (Table 2). This value was approximately four times higher than the availability in
Ethiopia and Tanzania, and approximately double that of Zimbabwe (countries including
large areas with endemic trypanosomosis and tick-borne diseases), but much lower than for
Sudan and Somalia, countries with many pastoral people.
Neighbouring countries, such as Ethiopia, Somalia, Tanzania and Uganda, exhibited
different patterns of change of milk availability (Table 2). In Ethiopia (including Eritrea),
per capita availability decreased between 1985 and 1998 by 21% from the already low level
of 26 kg. This was due to decreases per capita in net imports and in milk production from
‘other species’. Somalia, Tanzania and Uganda each experienced a decline in domestic
production and net imports. In southern Africa, Zimbabwe exhibited a similar pattern of
change to those of the eastern African countries. Between 1985 and 1998, availability per
capita decreased by 14 kg, mainly because of declining production of cows’ milk and a
reduction in net imports (Table 2). These changes reflect the rapid growth of the country’s
human population, the decline of the dairy herd in the large-scale commercial sector and
the slow development of smallholder dairying (Smith et al. 1998).
Kurwijila (2002a) reports that dairy consumption has risen faster in urban and
peri-urban areas of Tanzania than in rural areas because of the growth in peri-urban and
intra-urban dairy herds and the increased availability of milk and dairy products for urban
consumers. In Dar es Salaam, for example, the dairy cattle herd increased from about 2
thousand in 1984 to over 20 thousand head by 1995. Consequently, the per capita
consumption is much higher in urban centres (40 litres/annum) than in rural areas (15–20
litres/annum) (Kurwijila 2002a). On the other hand, Muriuki (2002) cites recent results for
the central region of Kenya, where smallholder dairy production is a major part of the
farming system. These data show that dairy consumption is higher in rural producer areas
than in the major urban centres of Nakuru and Nairobi where, unlike in Dar es Salaam,
urban dairy production is not common.
These results suggest the need in the E&SA region for more detailed studies of dairy
consumption levels and their patterns, and for a better understanding of the factors
affecting these levels and their likely trends over the next 10–20 years. Only with use of
reliable estimates of current and projected demand will producers, processors, market
agents, and the technicians and policy makers who serve them, be able to support the
development of smallholder dairy through efficiently meeting consumers’ needs.
Dairy production systemsAs for milk availability, Tambi et al. (2001) have estimated the changes in milk production
from 1985 to 1998 in developing countries. For E&SA, the results relate to cattle, the
dominant dairy species in most countries in the region (Tables 3 and 4). In addition, the
authors ‘decomposed’ the changes in milk production due to changes in total herd size
188 South–South Workshop
Muriuki and Thorpe

Table 2. Per capita milk availability (kg) for sub-Saharan Africa (SSA) and in selected countries of eastern and southern Africa, 1985 and 1998.
SSA and selected countries of eastern andsouthern Africa
Total milk availability (kg) Cows’ milk (kg) Buffalo milk (kg) Milk of other species (kg) Net imports (kg)
1985 1998 1985 1998 1985 1998 1985 1998 1985 1998
Total SSA 59.5 55.4 33.9 35.2 0 0 16 14.7 9.6 5.5
Ethiopia 25.6 20.1 15.6 16.1 0 0 5 3.8 5 0.2
Kenya 83.3 85.1 74.7 80.1 0 0 6.3 5 2.4 0.1
Madagascar 47.8 36.7 45.3 35.6 0 0 0 0 2.6 1.1
Somalia 367.2 256 71.7 63.7 0 0 283.2 191 12.3 1.3
Sudan 122.9 164.4 78.5 105.3 0 0 39.1 58.1 5.2 1
Tanzania, United Republic of 24.3 23 19.7 19.7 0 0 3.1 3 1.5 0.4
Uganda 25.6 24.2 24.1 23.8 0 0 0 0 1.5 0.5
Zimbabwe 63.1 49.2 62 51.7 0 0 0 0 1.2 –2.5
Source: Tambi et al. (2001).
Table 3. Cattle numbers and milking cows in sub-Saharan Africa (SSA) and in selected countries in eastern and southern Africa, 1985 and 1998.
SSA and selected countries in eastern andsouthern Africa
Total cattle (× 103) Change Milking cows (× 103) Change Milking cows (%) Change
1985 1998 1985–98 1985 1998 1985–98 1985 1998 1985–98
Total SSA 154,630 192,586 37,957 24,310 31,967 7656 15.7 16.6 0.9
Ethiopia 28,000 34,514 6514 3567 4507 940 13 13 0
Kenya 12,727 13,418 691 3209 4494 1284 25 33 8
Madagascar 10,255 10,331 76 1735 1870 135 17 18 1
Somalia 4454 5433 980 1158 1413 255 26 26 0
Sudan 20,536 33,119 12,583 3510 6083 2573 17 18 1
Tanzania, United Republic of 12,593 14,163 1570 2680 3267 586 21 23 2
Uganda 5064 5438 374 1013 1358 345 20 25 5
Zimbabwe 5582 5429 –154 1170 1317 147 21 24 3
Source: Tambi et al. (2001).
189
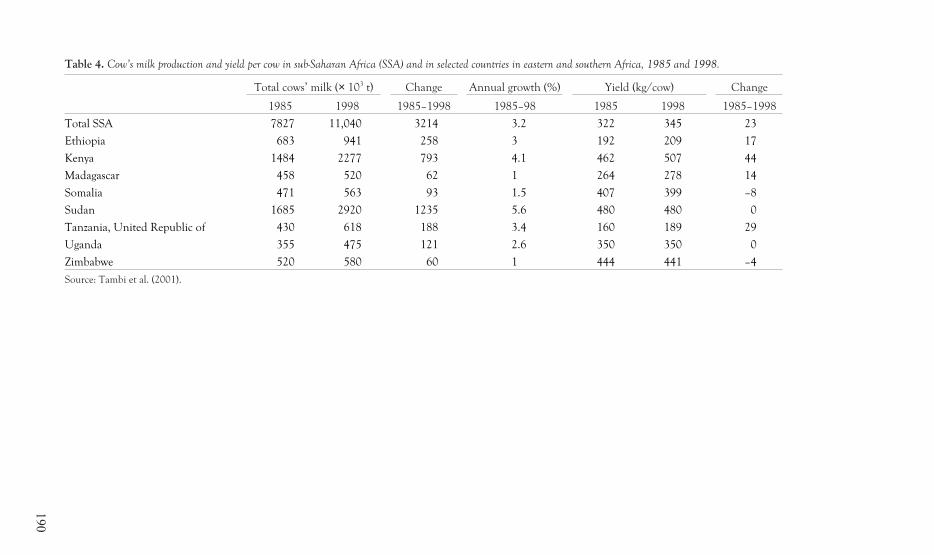
Table 4. Cow’s milk production and yield per cow in sub-Saharan Africa (SSA) and in selected countries in eastern and southern Africa, 1985 and 1998.
Total cows’ milk (× 103 t) Change Annual growth (%) Yield (kg/cow) Change
1985 1998 1985–1998 1985–98 1985 1998 1985–1998
Total SSA 7827 11,040 3214 3.2 322 345 23
Ethiopia 683 941 258 3 192 209 17
Kenya 1484 2277 793 4.1 462 507 44
Madagascar 458 520 62 1 264 278 14
Somalia 471 563 93 1.5 407 399 –8
Sudan 1685 2920 1235 5.6 480 480 0
Tanzania, United Republic of 430 618 188 3.4 160 189 29
Uganda 355 475 121 2.6 350 350 0
Zimbabwe 520 580 60 1 444 441 –4
Source: Tambi et al. (2001).
190
(herd effect), the proportion of animals milked (milking effect) and the productivity per
animal (productivity effect) (Table 5). The analyses showed that SSA had the lowest milk
production per cow of all regions of the developing world. Similarly, between 1985 and 1998,
SSA had the smallest increases in the proportion of animals milked and their productivity.
Most cows’ milk production in SSA was concentrated in eastern Africa; Sudan, Kenya,
Ethiopia, Somalia and Tanzania were the top five countries producing about two-thirds of
the total cows’ milk in the continent (Table 4). For the period 1985 to 1998, these eastern
African countries demonstrated different patterns of change in cows’ milk production, in
part because unlike the cattle population in Kenya, the large cattle populations of Sudan,
Ethiopia and Eritrea had relatively limited numbers of exotic dairy cattle and their crosses
(Table 6; Tsehay 2002). Partially as a consequence, milk yields increased by only 17
kg/animal per year in Ethiopia and Eritrea (Table 5); this small increase accounted for
one-quarter of the total increase in milk production. An increase in the size of the cattle herd
by 6.5 million head also contributed significantly to the increase in milk production. In
Sudan, milk yield per milking cow stagnated, whilst the high growth in the cattle herd
accounted for >80% of the increase in milk production (Table 5). A similar pattern was
noted in Uganda, where milk yield was static with the increase in milk production coming
mostly from expansion of the herd and the proportion of animals milked.
In Kenya, where 60% of milk comes from dairy cattle (Muriuki 2002), milk yields/cow
were more than double those in Ethiopia (Table 4), but they grew only marginally faster
(about 44 kg/animal) than in Tanzania. An increase in the proportion of milking animals
from 25 to 33% of the herd contributed >60% of Kenya’s 800 thousand tonnes increase in
milk production. The increase in productivity contributed about one-fifth of the increase in
milk production (Table 5). By contrast, in Somalia increases in cattle numbers were
responsible for the entire increase in milk production, while in Zimbabwe a change in the
herd structure towards increased milking was responsible for the entire increase in milk
production between 1985 and 1998 (Table 5).
Relative to all other countries in E&SA, Kenya has a very large herd of exotic breed dairy
cattle and their crosses. The Kenyan dairy herd probably accounts for over 75% of all
specialised dairy cattle in E&SA (Table 6). These dairy cattle, the descendents of the cattle
from European settler farms established almost a century ago (Conelly 1998), are
predominantly owned by smallholders (Muriuki 2002). Several major factors have
contributed to the widespread adoption of dairying by smallholders in Kenya (Muriuki
2002; Omiti 2002) including: the importance of milk in the diets of most Kenyan
communities; a favourable production environment (mid to high altitudes with bimodal
rainfall); the presence of the original settler dairy cattle population; and policy and
institutional environments (through to the early 1990s) conducive to large- and small-scale
dairying. As for Kenya, in Tanzania the exotic breed-based dairy cattle population produces
the majority of the country’s marketed milk (Table 6; Kurwijila 2002a). It is significant that,
in common with the systems in Kenya, approximately 65% of Tanzania’s dairy cattle are
located in the bimodal rainfall northern highlands in smallholder crop–dairy systems that
support high human population densities (Omore and Staal 1998). It is these areas of good
potential for biomass production, combined with ready markets for milk, which have
significant potential for smallholder dairy development in E&SA.
South–South Workshop 191
Smallholder dairy production and marketing in eastern and southern Africa: Regional synthesis
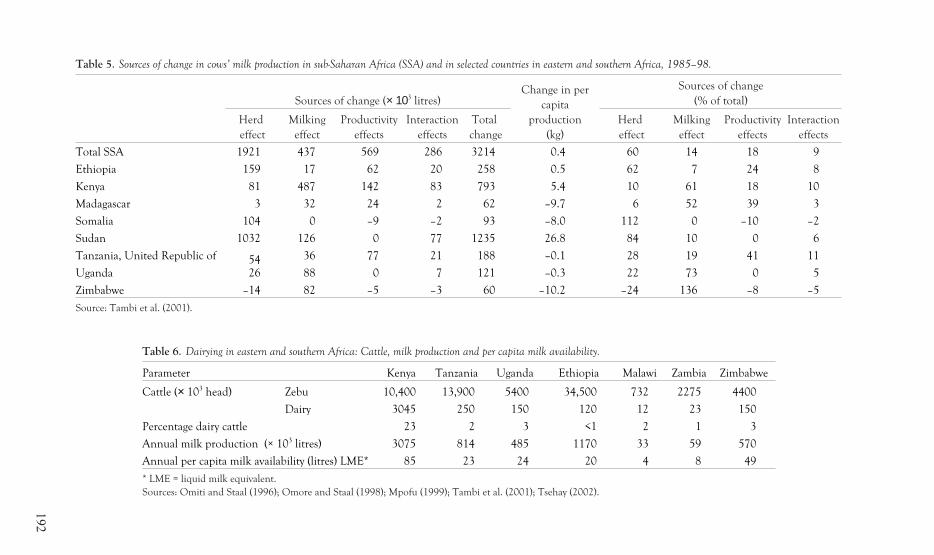
Table 5. Sources of change in cows’ milk production in sub-Saharan Africa (SSA) and in selected countries in eastern and southern Africa, 1985–98.
Sources of change (× 103 litres)Change in per
capita
production
(kg)
Sources of change
(% of total)
Herd
effect
Milking
effect
Productivity
effects
Interaction
effects
Total
change
Herd
effect
Milking
effect
Productivity
effects
Interaction
effects
Total SSA 1921 437 569 286 3214 0.4 60 14 18 9
Ethiopia 159 17 62 20 258 0.5 62 7 24 8
Kenya 81 487 142 83 793 5.4 10 61 18 10
Madagascar 3 32 24 2 62 –9.7 6 52 39 3
Somalia 104 0 –9 –2 93 –8.0 112 0 –10 –2
Sudan 1032 126 0 77 1235 26.8 84 10 0 6
Tanzania, United Republic of 54 36 77 21 188 –0.1 28 19 41 11
Uganda 26 88 0 7 121 –0.3 22 73 0 5
Zimbabwe –14 82 –5 –3 60 –10.2 –24 136 –8 –5
Source: Tambi et al. (2001).
Table 6. Dairying in eastern and southern Africa: Cattle, milk production and per capita milk availability.
Parameter Kenya Tanzania Uganda Ethiopia Malawi Zambia Zimbabwe
Cattle (× 103 head) Zebu 10,400 13,900 5400 34,500 732 2275 4400
Dairy 3045 250 150 120 12 23 150
Percentage dairy cattle 23 2 3 <1 2 1 3
Annual milk production (× 103 litres) 3075 814 485 1170 33 59 570
Annual per capita milk availability (litres) LME* 85 23 24 20 4 8 49
* LME = liquid milk equivalent.
Sources: Omiti and Staal (1996); Omore and Staal (1998); Mpofu (1999); Tambi et al. (2001); Tsehay (2002).
192
By contrast, in Malawi, South Africa and Zimbabwe, the mid altitude, mono-modal
rainfall agro-ecologies of southern Africa (with their lower potential for biomass production),
the risk for cattle diseases and, until recent years, the policy and institutional environments
have inhibited adoption of dairy production by smallholders. Consequently, their dairy cattle
populations are small relative to their total cattle populations (Table 6; Smith et al. 1998;
Mpofu 1999). Furthermore, as yet, market mechanisms are not in place to extract milk from
traditional systems, which, in any case, are largely in agro-ecologies adverse to producing milk
in excess of the needs of the producer households and their neighbours.
Most countries in E&SA have, therefore, not benefited in the way that Kenya has and to
lesser extents Tanzania and Uganda have from smallholder dairy development. As Muriuki
(2002) reports, dairying in Kenya has become a very significant source of income to the
estimated 625 thousand smallholder producer households and to those employed in the
marketing of milk, in total some 25% of all households. In addition, dairying plays a crucial
role in sustaining smallholder crop–dairy systems through nutrient cycling within the
systems (Kurwijila 2002a; Muriuki 2002; Staal 2002) which, along with the adoption of
planted forage and agro-forestry technologies, has played a crucial role in the development
of crop–dairy systems that sustain increasingly high human population densities, even in
some semi-arid areas (Tiffen et al. 1994).
In the face of sub-division of family farms as land passes from generation to generation,
adopting dairying and owning a dairy cow (most households own only one or two) is,
therefore, a means of survival for many smallholder families in Kenya (Muriuki 2002). It is
also a potential means of accumulating some capital. Incremental daily inputs of labour,
land, feed and other inputs over time are accumulated and compounded in the form of an
additional cow or heifer, or a saleable male (Staal 2002). These animals may be sold when
needed to meet lump-sum expenditures, such as school fees or medical bills, or to invest in
upgrading farm facilities. As such in E&SA and particularly in Kenya, smallholder dairy
represents an important tool in reducing poverty in rural and peri-urban areas. Whereas, at
times it is argued that those already owning dairy cattle are not poor, most smallholders
practising dairying were poor and struggled to acquire their first cow. Dairying was a means
to escape poverty and to sustain their families, with particular benefits accruing to women
and children (Kurwijila 2002a and b; Muriuki 2002; Omiti 2002; Tsehay 2002; Staal 2002;
Tangka et al. 1999).
Throughout E&SA, returns to dairying vary considerably because producer prices for
milk vary between surplus and deficit and between urban and rural areas, and because costs
of production vary depending on the production system and whether outputs other than
milk are valued products (Kurwijila 2002a). For example, in northern Tanzania, manure
and heifers are particularly important outputs in the coffee/banana × zero-grazed dairy-
based economies where manure is ranked second in value after milk (Rugambwa et al.
1995). However, Kurwijila (2002a) concludes that the cost of producing milk in Tanzania is
seemingly higher than in neighbouring Kenya and Uganda, where farmers accept lower
prices for both milk and heifers.
In Kenya, the costs of and returns to production have been estimated recently for two
contrasting sites (Staal 2002). The first was an area of relatively extensive crop–dairy
production in Nakuru, Rift Valley, where farmers keep three to five crossbred dairy cattle
South–South Workshop 193
Smallholder dairy production and marketing in eastern and southern Africa: Regional synthesis
and rely mostly on grazing. The second was in Kiambu in the intensive central highlands,
where land sizes are smaller (an average of two acres), so farmers keep two to three high-grade
dairy cattle. Because the land is not able to provide adequate animal nutrition, farmers
purchase some fodder and concentrate feeds. Profits to dairy production were US$ 0.02 and
0.04/litre for the extensive and intensive sites, respectively. These were returns after normal
wage costs (currently, rural wages are approximately US$ 25/month) had been deducted for
the family labour. They suggest that smallholder dairying can compete well against
alternative enterprises available to the farmers. Staal (2002) suggests that these two sites are
representative of the important dairy production areas of highland eastern Africa and that
the results imply good opportunities for smallholder dairy producers in the region.
In summary, there is much variation in the level of adoption of market milk production
(dairy production) by smallholders in E&SA. Particularly Kenya, and to some extent
Tanzania and Uganda, have significant dairy subsectors based on smallholders, the outputs
of which are reflected in high per capita availabilities of milk (Tables 2 and 6). By contrast,
the high per capita availability of milk in Zimbabwe (Table 6) and South Africa reflect their
continuing dependence on large-scale production units. Factors explaining this marked
variation and underpinning the high adoption of smallholder dairying in East Africa
include: the importance of milk in the diets of rural communities and urban consumers; a
favourable production environment (mid to high altitudes with bimodal rainfall); the
availability of the original settler dairy cattle populations; and policy and institutional
environments (through to the late 1980s/early 1990s) conducive to smallholder dairying.
Constraints to increased productivity in current systems include: inadequate year-round
feeding; losses from cattle diseases, particularly tick-borne diseases; and poor access to input
and output market services. In much of E&SA, the lack of adequate feed (particularly in the
mono-modal rainfall areas) and disease challenge, interacting with a lack of veterinary
services, inhibit the adoption of dairying by smallholders. Because of the resultant low milk
production densities (litres/km2), these constraints impose a very high cost on attempts to
introduce milk collection schemes and related output market services. Until these
interacting inhibitory factors are addressed, increased milk production in the region (and in
West and Central Africa) is likely to continue to result from expansion of the indigenous
cattle population and some increase in the proportion milked, with relatively little coming
from increases in productivity (which are usually associated with the use of exotic dairy
breeds and their crosses).
Milk marketing systemsIn most of E&SA, milk production and marketing systems are those described by Tsehay
(2002) for Ethiopia: an urban system; a peri-urban milk system; and a rural system. While in
Ethiopia, butter is the predominant traded product (Tsehay 2002), generally consumers in
E&SA demand fresh liquid milk and its marketing is dominated by traditional (the so called
‘informal’) markets, with only small proportions of total production being marketed
through a cold-chain, pasteurised process (the so called ‘formal’ market). For example, in
Ethiopia the proportion of total marketed milk sold formally is very small (Tsehay 2002);
194 South–South Workshop
Muriuki and Thorpe

in Tanzania and Uganda it is estimated at <5% (Omiti and Staal 1996; Kurwijila 2002a) and
in Kenya it is about 15% (Omore et al. 1999). Approximately 30–35% of production is
consumed on farm (by the family and calves), with the balance (generally four to six litres)
marketed.
In the dominant traditional (or ‘informal’) markets, the milk may pass straight from the
producer to a domestic or institutional consumer, or it may pass through two or more
market agents before reaching the consumer (Staal et al. 1997; Omiti 2002). Tsehay (2002)
and Kurwijila (2002a and b) have noted the importance of intra-urban dairy production in
Ethiopia and Tanzania, which, as for peri-urban systems, shortens the market chain for the
fresh milk that is preferred by the majority of consumers. As the majority of those
consumers have no access to refrigeration, invariably, the custom is to boil the milk to
extend its shelf life (Walshe et al. 1991; Omiti and Staal 1996; Kurwijila 2002a; Muriuki
2002; Redda 2002).
As Omiti (2002) has discussed for Kenya, the macro-economic reforms implemented or
being implemented in E&SA, have increased the competition for marketing functions
(such as collection, transportation, processing and distribution/retailing) and have resulted
in increased income and employment opportunities, especially for small-scale milk traders
(Omiti and Muma 2000). Many sell <120 litres of milk per day, but this business activity
enables them to earn a daily income equal to approximately twice the national average
(Omore et al. 1999; Staal 2002), which represents a significant contribution to poverty
reduction. Similar estimates are available for Tanzania (Kurwijila 2002b) and Uganda
(Omiti and Staal 1996), and presumably are estimable for southern African countries like
Malawi and Zimbabwe, where there are some indications that enforcement of regulations
banning the informal marketing of milk is being relaxed. In the face of these strong informal
markets, many governments are having to address how best to ensure fair competition
between the ‘formal’ and ‘informal’ markets to the benefit of producers and consumers,
most of whom are in low-income households (Muriuki 2002; Omiti 2002).
Input servicesIn the same way that policy and institutional reforms are being implemented to support
competitive milk marketing, public institutions and the private sector in many E&SA
countries are trying to develop innovative and progressive institutional mechanisms for
input services. These include efforts to encourage the formation of rural savings and credit
co-operative organisations. As Omiti (2002) points out, where cash is a serious constraint to
dairy development for subsistence-oriented farmers, designing appropriate institutional
mechanisms of availing credit is a prime concern.
Other input markets serving smallholder dairying are also major concerns. The 1980s
and 1990s have seen most E&SA countries experience the collapse of some and the decline
of the remainder of government input services (veterinary, artificial insemination (AI) and
extension advisory services) for smallholders, with an increased reliance for service delivery
on the private sector, including community-based organisations (CBOs) and co-operatives
South–South Workshop 195
Smallholder dairy production and marketing in eastern and southern Africa: Regional synthesis
(Owango et al. 1998). Clinical and preventive veterinary services have been a prime target
for privatisation (Tambi et al. 1997 and 1999).
Nahdy (2002) articulates eloquently these issues as faced by Uganda and describes its
government’s radical plans for restructuring research and extension services, and their
decentralised funding and management by local communities. Complementary to and
underpinning this will have to be a mindset shift by technicians and their managers to
participatory approaches for research and extension services for smallholders, such as the
steps reported by Mwangi and Wambugu (2002) for improving the availability of feed
resources in Central Kenya. Their efforts are building upon the experiences gained in
Coastal Kenya, where gender-sensitive, client-oriented research and extension support was
developed for smallholder dairy producers and the early adopters of dairy production
(Maarse et al. 1998).
As Kurwijila (2002b) states, with the current move to privatise most government
services, the challenging question is how to internalise costs such as those for research and
extension services, training, the control of epidemic diseases and the delivery of AI services
which have elements of public goods; the cost of these services may well be beyond the reach
of smallholder farmers, at least in the short term. The Ugandan example (Nahdy 2002) is
one approach, which includes the implicit gradual scaling down of donor/government
subsidies (Kurwijila 2002b; Omiti 2002). Certainly, the priority for the shift from public to
private delivery of input services is a managed transition (Kurwijila 2002b; Muriuki 2002),
not the often observed sudden withdrawal of operating funds to government agencies to the
detriment of the livelihoods of many rural households.
Policy and institutional issuesAlthough it has been shown that in E&SA smallholders are competitive in dairy
production, it is probable that policy interventions will be required to sustain their viability,
especially to support the more widespread adoption of dairying by smallholders within the
region (Omiti 2002; Staal 2002). This is because the small scale of milk production and
marketed output implicit to smallholder systems can often result in low bargaining power
and limited ability to capture economies of scale in marketing. As was described in the
section on milk marketing systems, farmers use a variety of strategies to overcome this. The
first approach is generally to sell their milk directly through the informal market to
consumers, thereby achieving higher prices and reducing transactions costs (Staal 2002).
The use of milk traders to bulk milk, and perform distribution and marketing services is also
common. Dairy farmer co-operatives and other farmer groups, if efficiently managed, can
improve the market position of smallholder farmers through collective actions ( Owango et
al. 1998; Kurwijila 2002b; Muriuki 2002; Omiti 2002; Tsehay 2002). Policies that support
these activities, and do not interfere with individual market activities of farmers and traders,
are likely to sustain competitiveness of producers and contribute effectively to improved
rural and peri-urban livelihoods.
Kurwijila (2002b) has also stressed the need for improvements in processing, quality
assurance and efficiency if the smallholder dairy subsector in Tanzania and elsewhere is to
196 South–South Workshop
Muriuki and Thorpe
survive in an increasingly liberalised global market. He argues that this will require self
regulation rather than control from the government, which, by implication, means that the
industry will have to organise itself to better face the challenges of today and tomorrow.
Currently, there is movement in E&SA towards stakeholder-managed national dairy boards
with efforts to ensure the effective representation of and voice for the smallholders and their
market agents who dominate dairy production and marketing.
Likewise, the continued privatisation of input services will function for those services
and regions where smallholders can afford the costs of targeted quality services (Tambi et al.
1999; Kurwijila 2002b), but for other services and in more marginal areas, public support
may continue to be needed (Tambi et al. 1997; Omiti 2002; Staal 2002). These input
services include research and extension, as discussed by Nahdy (2002) and others. Last, but
by no means least, is the urgent need in the E&SA region for more investment in national
infrastructure such as rural access roads, water supplies and electricity distribution (Muriuki
2002). Such investment would ensure that these essential public services are available to
support the smallholder production and marketing of perishable products like milk.
Conclusions and challengesDelgado et al. (1999) presented a convincing case for continued demand-driven dairy
development to 2020 through which smallholders, including those in E&SA, if given
adequate technological, policy and institutional support, will benefit by meeting the projected
large increases in milk consumption. The projected estimates of increased demand for milk
are based upon the expected growth of the human population, its urbanisation and its
increased purchasing power (Delgado et al. 1999). In E&SA, as elsewhere, the ‘white
revolution’ as some have called it, is therefore linked to overall economic performance
(especially the creation of urban jobs). Current political and economic uncertainties in
E&SA, the importance to dairy development of government reform processes, including the
need for urgent public investment in infrastructure (especially roads and water supplies),
allied to the unfolding tragedy of AIDS and its effects on communities and their productivity,
suggest that some re-examination of the projections for E&SA may be required. A
re-examination would serve to guide and stimulate more-focused national and regional
programme support for smallholder dairy development.
An important part of that re-evaluation should be ex-post impact assessment studies of
dairy development in the region, including evaluation of the returns to the many major
project investments during the last 40 years (e.g. in Tanzania; Kurwijila 2002b). Many useful
lessons can be learnt from the successes and the more numerous failures of past efforts.
These analyses should be guided by the broad conclusion from this synthesis (and the
earlier study by Walshe et al. 1991) that the factors explaining the marked variation in
adoption of smallholder dairying in E&SA are: whether or not milk is important in the diets
of rural communities and for urban consumers; whether there is a favourable agro-
ecological environment for producing milk in excess of the needs of the producers’
households and their neighbours; whether urban consumer centres are accessible by
smallholder producers; whether there are sources of dairy genotypes; and whether policy
South–South Workshop 197
Smallholder dairy production and marketing in eastern and southern Africa: Regional synthesis
and institutional environments are conducive to smallholder dairying. Without good access
to efficient output and input markets (including research and extension services),
favourable production environments will not be enough to stimulate smallholder
production in the areas of E&SA where, as yet, dairy development has been slow.
Therefore, the major challenges to be faced in E&SA are the need for:
• Better information on the demand for milk and dairy products and the determinants of
that demand
• An understanding of the lessons learnt from the wide variation in dairy development in
the region and identification of the determinants of that variation
• Communication of those lessons to policy makers and development planners backed by
estimates of the aggregate value to society of dairy development, especially smallholder
dairy development and
• Stimulation of a change of mindset amongst many advisers and technicians from a
supply-driven to a demand-driven development process.
ReferencesConelly W.T. 1998. Colonial era livestock development policy: Introduction of improved dairy
cattle in high-potential farming areas of Kenya. World Development 26:1733–1748.
Delgado C., Rosegrant M., Steinfeld H., Ehui S. and Courbois C. 1999. Livestock to 2020: The next
food revolution. Food, Agriculture and the Environment. Discussion Paper 28. IFPRI(International Food Policy Research Institute), Washington, DC, USA; FAO (Food andAgriculture Organization of the United Nations), Rome, Italy; and ILRI (International LivestockResearch Institute), Nairobi, Kenya. 72 pp.
Kurwijila L.R. 2002a. Dairy development in Tanzania: Country paper. In: Rangnekar D. and ThorpeW. (eds), Smallholder dairy production and marketing—Opportunities and constraints. Proceedings of a
South–South workshop held at NDDB, Anand, India, 13–16 March 2001. NDDB (National DairyDevelopment Board), Anand, India, and ILRI (International Livestock Research Institute),Nairobi, Kenya.
Kurwijila L.R. 2002b. An overview of dairy policies in Tanzania. In: Rangnekar D. and Thorpe W.(eds), Smallholder dairy production and marketing—Opportunities and constraints. Proceedings of a
South–South workshop held at NDDB, Anand, India, 13–16 March 2001. NDDB (National DairyDevelopment Board), Anand, India, and ILRI (International Livestock Research Institute),Nairobi, Kenya.
de Leeuw P.N., Omore A., Staal S. and Thorpe W. 1999. Dairy production systems in the tropics. In:Falvey L. and Chantalakhana C. (eds), Smallholder dairying in the tropics. ILRI (InternationalLivestock Research Institute), Nairobi, Kenya. pp. 19–37.
Maarse L., Wenholt W. and Chibudu A. 1998. Making change strategies work: Gender sensitive, client
oriented livestock extension in Coast Province, Kenya. Royal Tropical Institute, Amsterdam,Netherlands. 114 pp.
Mpofu N. 1999. Sourcing of dairy cattle by smallholder farmers in southern Africa. Market-orientedSmallholder Dairy Project Working Document 6. ILRI (International Livestock ResearchInstitute), Nairobi, Kenya. 15 pp.
Muriuki H.G. 2002. Smallholder dairy production and marketing in Kenya. In: Rangnekar D. andThorpe W. (eds), Smallholder dairy production and marketing—Opportunities and constraints.
198 South–South Workshop
Muriuki and Thorpe
Proceedings of a South–South workshop held at NDDB, Anand, India, 13–16 March 2001. NDDB(National Dairy Development Board), Anand, India, and ILRI (International Livestock ResearchInstitute), Nairobi, Kenya.
Mwangi D.M. and Wambugu C. 2002. Forage legume technologies: Participatory experiences withfarmers and community based organisations in central Kenya. In: Rangnekar D. and Thorpe W.(eds), Smallholder dairy production and marketing—Opportunities and constraints. Proceedings of a
South–South workshop held at NDDB, Anand, India, 13–16 March 2001. NDDB (National DairyDevelopment Board), Anand, India, and ILRI (International Livestock Research Institute),Nairobi, Kenya.
Nahdy S.M. 2002. Decentralisation of services in Uganda: The formation of national agriculturaladvisory services. In: Rangnekar D. and Thorpe W. (eds), Smallholder dairy production and
marketing—Opportunities and constraints. Proceedings of a South–South workshop held at NDDB, Anand,
India, 13–16 March 2001. NDDB (National Dairy Development Board), Anand, India, and ILRI(International Livestock Research Institute), Nairobi, Kenya.
Omiti J.M. 2002. Impacts of liberalisation in Kenya’s dairy sector. In: Rangnekar D. and Thorpe W.(eds), Smallholder dairy production and marketing—Opportunities and constraints. Proceedings of a
South–South workshop held at NDDB, Anand, India, 13–16 March 2001. NDDB (National DairyDevelopment Board), Anand, India, and ILRI (International Livestock Research Institute),Nairobi, Kenya.
Omiti J. and Muma M. 2000. Policy and institutional strategies to commercialise the dairy sector in Kenya.
Occasional Paper 6/2000. IPAR (Institute of Policy Analysis and Research), Nairobi, Kenya.
Omiti J. and Staal S. (eds). 1996. The Ugandan dairy subsector: A rapid appraisal. ILRI/NARO/MAAIFResearch Report. ILRI (International Livestock Research Institute)/NARO (NationalAgricultural Research Organization of Uganda)/MAAIF (Ministry of Agriculture, AnimalIndustry and Fisheries of Uganda), Kampala, Uganda. 137 pp.
Omore A. and Staal S. (eds). 1998. The Tanzania dairy subsector: A rapid appraisal. Volume 3—Main
Report. ILRI (International Livestock Research Institute), Nairobi, Kenya.
Omore A., Muriuki H., Kenyanjui M., Owango M. and Staal S. 1999. The Kenya dairy subsector: A rapid
appraisal. Smallholder Dairy (Research & Development) Project Report. Ministry ofAgriculture/Kenya Agricultural Research Institute/International Livestock Research Institute,Nairobi, Kenya. 51 pp.
Owango M.O., Staal S.J., Kenyanjui M., Lukuyu B., Njubi D. and Thorpe W. 1998. Dairyco-operatives and policy reform in Kenya: Effects of livestock service and milk marketliberalisation. Food Policy 23:173–185.
Rugambwa V.K., de Wolf J., Stanslaus D. and Lutalala E.M. 1995. Credit facilities and heifer supplywithin the Kagera Livestock Development Programme, Tanzania. In: Proceedings of the FAO (Food
and Agriculture Organization of the United Nations) workshop on market orientation of small-scale milk
producers and their organisations held at Morogoro, Tanzania, 20–24 March 1995. pp. 66–76.
Smith T., Titterton M. and Dube D. 1998. Dairy production systems in Zimbabwe. Paper presentedat the BSAS (British Society of Animal Science) conference on food, lands and livelihoods held atNairobi, Kenya, 27–30 January 1998.
Staal S.J. 2002. Smallholder dairy competitiveness. In: Rangnekar D. and Thorpe W. (eds),Smallholder dairy production and marketing—Opportunities and constraints. Proceedings of a South–South
workshop held at NDDB, Anand, India, 13–16 March 2001. NDDB (National Dairy DevelopmentBoard), Anand, India, and ILRI (International Livestock Research Institute), Nairobi, Kenya.
Staal S., Delgado C. and Nicholson C. 1997. Smallholder dairying under transactions costs in EastAfrica. World Development 25:779–794.
South–South Workshop 199
Smallholder dairy production and marketing in eastern and southern Africa: Regional synthesis
Tambi E., Mukhebi A.W., Maina O.W. and Solomon H.M. 1997. Privatisation of animal health services
in Kenya: An evaluation of the Kenya Veterinary Association Privatisation Scheme (KVAPS). OAU(Organization of African Unity)/IBAR (Inter-African Bureau for Animal Resources)/PARC(Pan-African Rinderpest Campaign)/ILRI (International Livestock Research Institute) Report.ILRI, Nairobi, Kenya. 84 pp.
Tambi N.E., Mukhebi W.A., Maina W.O. and Solomon H.M. 1999. Probit analysis of livestockproducers’ demand for private veterinary services in the high potential agricultural areas ofKenya. Agricultural Systems 59:163–176.
Tambi E., Nicholson C., Staal S. and Thorpe W. 2001. Patterns of change in dairy production andconsumption in developing countries from 1985 to 1998. Market-oriented Smallholder Dairy
Research Working Document 7. ILRI (International Livestock Research Institute), Nairobi, Kenya.65 pp. (In press).
Tangka F., Ouma E.A., Staal S.J. and Shapiro B. 1999. Women and the sustainable development ofmarket-oriented dairying: Evidence from the highlands of East Africa. Paper presented at theinternational sustainable development research conference held at the University of Leeds, UK,25–26 March 1999.
Tiffen M., Mortimore M. and Gichuki F. 1994. More people, less erosion: Environmental recovery in
Kenya. ACTS Press, Nairobi, Kenya.
Tsehay Redda. 2002. Small-scale milk marketing and processing in Ethiopia. In: Rangnekar D. andThorpe W. (eds), Smallholder dairy production and marketing—Opportunities and constraints.
Proceedings of a South–South workshop held at NDDB, Anand, India, 13–16 March 2001. NDDB(National Dairy Development Board), Anand, India, and ILRI (International Livestock ResearchInstitute), Nairobi, Kenya.
Walshe M.J., Grindle J., Nell A. and Bachmann M. 1991. Dairy development in sub-Saharan Africa: A
study of issues and options. World Bank Technical Paper 135. Africa Technical Department Series.The World Bank, Washington, DC, USA. 97 pp.
200 South–South Workshop
Muriuki and Thorpe
Smallholder dairy production andmarketing constraints in NigeriaM.L. YahuzaProject Manager, National Livestock Project Division (NLPD), Federal Department of Livestock and PestControl Services, 9 Yakubu Gowon Way, PMB 2222, Kaduna, Nigeria
SummaryLivestock production contributes about 12.7% of the agricultural GDP (gross domestic
product) in Nigeria. Pastoral communities produce the bulk of milk consumed in the rural
and urban areas of Nigeria.
The gap between supply and demand for dairy products is widening as a result of
increases in population and urbanisation. Imports that used to bridge part of the gap have
been declining as a result of devaluation of the Nigerian naira, (N), (US$ 1 = N 113.5 in
November 2001) and reductions in the importation of milk powder and butter oil.
Consequently local collection, processing and marketing of milk is becoming increasingly
competitive. The World Bank and the National Livestock Project Division (NLPD) seized
the opportunity provided by this development to initiate a pilot dairy co-operation
programme in Kaduna State.
The programme has progressed well and has been accepted by pastoralists. Over 36
associations have been formed of which 18 (with 1820 members) have been registered as
co-operative societies. A number of associations are supplying milk to the scheme. An apex
organisation, the Kaduna Federation of Milk Producers’ Co-operative Association Limited,
which trades under the name MILCOPAL, has been established.
MILCOPAL is responsible for the procurement, transportation, processing and
marketing of milk on behalf of all the registered co-operative societies. The board of the
federation, made up of all the chairpersons of the various societies including the Managing
Director of the federation, is responsible for fixing the price of milk.
The programme has made a profound impact on the lives of the participating
pastoralists. It has also established that small quantities of milk produced by smallholders
can be collected, processed and supplied to urban areas. However, there are still some
problems regarding seasonal fluctuations in production and consumption. Furthermore, a
large volume of milk has to be collected from various routes to make the operation viable. A
lot still needs to be done to ensure the sustainability and replication of the programme in
other areas of the country.
South–South Workshop 201
IntroductionLivestock play a very important role in Nigerian agriculture contributing about 12.7% of
the agricultural GDP (CBN 1999). The livestock population comprises about 14 million
cattle, 34 million goats, 22 million sheep and about 100 million poultry (RIM 1990). Other
livestock species of economic importance are donkeys, pigs and camels. The livestock
subsector is dominated by traditional systems of production, processing and marketing.
Transhumance pastoralists in the drier north of the country rear a very high proportion of
the cattle herd and many sheep and goats.
Accurate statistics on livestock production and marketing are not available and
therefore, detailed projections of the supply and demand of the livestock subsector cannot
be realistically made. It is clear, however, that over the last decade the supply of meat, milk
and eggs has failed to keep pace with the increasing population. Somehow, the price
elasticity of dairy products has not effectively affected demand.
The supply of animal products has been declining over the past two decades, while
demand has been increasing, as a result of increases in population and urbanisation.
Consequently, Nigeria has remained a net importer of livestock and livestock products.
Restrictions placed on imports of animal products and foodstuffs in the 1980s coupled with
the introduction of the Structural Adjustment Programme (SAP), which saw a massive
devaluation of the Nigerian currency, initially reduced the importation of meat and dairy
products. However, during the period 1995 to 1999, expenditure on the importation of
food and live animals has tended to increase (Table 1).
Table 1. Importation of food and live animals (Nigerian naira (N ) × 106.
Item 1995 1996 1997 1998 1999
Food and live animals 88,349.9 75,954.6 100,640.3 102,165.1 103,489.9
Source: CBN (1999).
Recent statistics on the importation of dairy products in Nigeria are not easy to come
by. However, devaluation of the local currency has significantly reduced the importation
of milk powder and butter oil on which the local dairy plants depended. The large number
of closed dairy plants throughout the country provides evidence of this problem (CBN
1999).
Dairy development in NigeriaThe various activities of the Nigerian dairy industry (viz. milk production, importation,
processing, marketing and consumption) have been going on in the country for over 60
years. These activities are, however, unorganised except for the relatively few processing
firms that produce and market reconstituted milk products from imported powdered milk.
Despite the unorganised nature of the industry, the dairy industry represents an important
component of the agricultural sector of the economy with great economic, nutritional and
social implications (Olaloku 1976).
202 South–South Workshop
Yahuza

The industry provides a means of livelihood for a significant proportion of rural pastoral
families in the subhumid and semi-arid ecological zones of Nigeria. According to FAO
(1988), an estimated 183 thousand rural households derived some income from the dairy
industry in 1986. The industry, through commercial dairy processing plants and marketing
segments, provides employment and value. Currently, however, very few of the 63 known
processing plants are operating. Those that are still functioning operate at less than 20% of
capacity. At present, the market has been taken over by ‘cottage’ outfits that process and
market yoghurt in urban areas. Most of these use milk powder to produce yoghurt.
Improvement of the living standard of Nigerians has been the major focus of various
national development plans (first in 1962/68 and the fourth in 1981/85 ). Consequently,
the dairy industry, through which better nutrition can be provided to the citizens, was given
adequate attention in these development plans. In some selected areas, the government
established dairy farms with local and imported breeds of cattle. In addition, milk collection
centres including mobile collection points were established.
Milk collection schemesThese began in the late 1920s when the Veterinary Department set up units in northern
Nigeria to which pastoral women brought fresh milk for cream separation and processing into
clarified butter fat (CBF). The women were paid only for the cream while the skim milk was
returned to them. The various governments of the then northern region encouraged the
establishment of milk collection and cooling units. The CBF scheme was set up to encourage
the pastoralists to keep their cattle in one place throughout the year, offering them ‘an
immediate market for all the milk they could produce’ (National Archives 1934–48).
The collection scheme was primarily set up to export CBF to England, where the fat was
used to make expensive brands of toilet soap (National Archives 1934–48). Other private
enterprises, including the United Africa Company, entered the export business, offering
higher prices than the government to encourage middlemen to collect more CBF from the
pastoralists; this increased CBF exports from 10 t in 1933 to 2400 t in 1939 (Walker 1981).
The delivery of milk for cream separation demonstrated the possibilities of whole milk
collection. Therefore, the then Veterinary Department set up a milk processing plant at
Vom (Jos-Plateau) in 1939, originally to produce butter and later to produce cheese (Walker
1981). Some milk came from the Vom dairy herd kept by the department, but mostly it
came from Fulani women through a network of collection centres. A similar scheme was
launched at Kano in 1940.
Growth of the dairy industry in Nigeria could be attributed to wartime (World War II)
restrictions on dairy produce imports and a ban on CBF exports. For these reasons, the
annual output of the Vom Dairy for 1949–50 was 123.8 thousand kg of butter, 50.8
thousand kg of CBF and 36.7 thousand kg of cheddar-type cheese to suit the taste of
expatriate customers (Buchanan and Pugh 1955).
With the lifting of restrictions, after World War II, the government effort did not have
any lasting effect. The dairy plant at Vom eventually closed in 1954, due to the availability of
imported butter of higher quality in urban markets. According to Walker (1981), the
South–South Workshop 203
Smallholder dairy production and marketing constraints in Nigeria
indigenous products were of low quality and they were difficult to sell in competition with
imported products which were only slightly more expensive.
The West African Milk Company is now renting the site of the farm and has stocked it
with Friesian × White Fulani crosses. A small processing plant has also been established at
the site. Milk from the animals is being used to produce pasteurised fresh milk, yoghurt,
butter and cheese. Performance data are not available and therefore the economical viability
of producing milk from Friesian × White Fulani crosses is not known; however, several
problems exist with this production system. First, even though these crossbreds have far
higher milk yields than indigenous cattle, they are very expensive to maintain because of
their high susceptibility to diseases. Second, the market for products produced by the
company is located far away from the production plant.
Establishment of dairy farms and processing plantsBefore independence in 1960, dairying in Nigeria was influenced by the colonial
experience, which placed complete reliance on large government farms to meet the growing
demands of the cities. After the colonial period, and as part of the government’s strategy to
encourage dairy industrial development, the federal, regional and/or state governments
established several dairy-processing plants throughout the country. Among these were
Madara Limited in Jos, Plateau State, and Agege Dairy Farm near Lagos. The first herd of
indigenous cattle was upgraded with imported Bos taurus cattle, which by 1975 produced
nearly 200 thousand litres of milk/year from 69 milking cows. Other government dairy
farms were established at Ibadan, Kaduna, Maiduguri, Minna, Ilorin and Kano.
Perhaps, the major achievement of these interventions has been the creation of
awareness of the need for dairy development as part of the overall efforts to improve on the
performance of the livestock subsector. One of the direct results of this awareness has been
the establishment of milk processing plants by both the private and public sectors, as a
means of catalysing domestic production. However, the availability of cheap imported milk
powder in particular and other diary products in general has created a disincentive for the
development of a domestic dairy industry, particularly as the processing plants have
completely neglected the appropriate pricing and milk collection aspects (NLPD 1992).
Since the introduction of the Structural Adjustment Programme in 1986, the
processing plants have been operating at less than 20% of full capacity because the price of
imported milk powder and butter oil has become prohibitive.
Milk production from traditional herdsThe livestock resource survey carried out by the Federal Department of Livestock and Pest
Control Services in 1990 puts the cattle population of Nigeria at 13.9 million (RIM 1990). Of
these, 13.5 million (96%) are in the hands of the pastoral Fulani. This pastoral herd is the most
important source of domestic milk in Nigeria. Only a few imported cattle breeds such as
Friesians and Brown Swiss, and their crosses are being kept in experimental milk production
farms owned by government agencies. A few privately owned commercially oriented dairy farms,
204 South–South Workshop
Yahuza
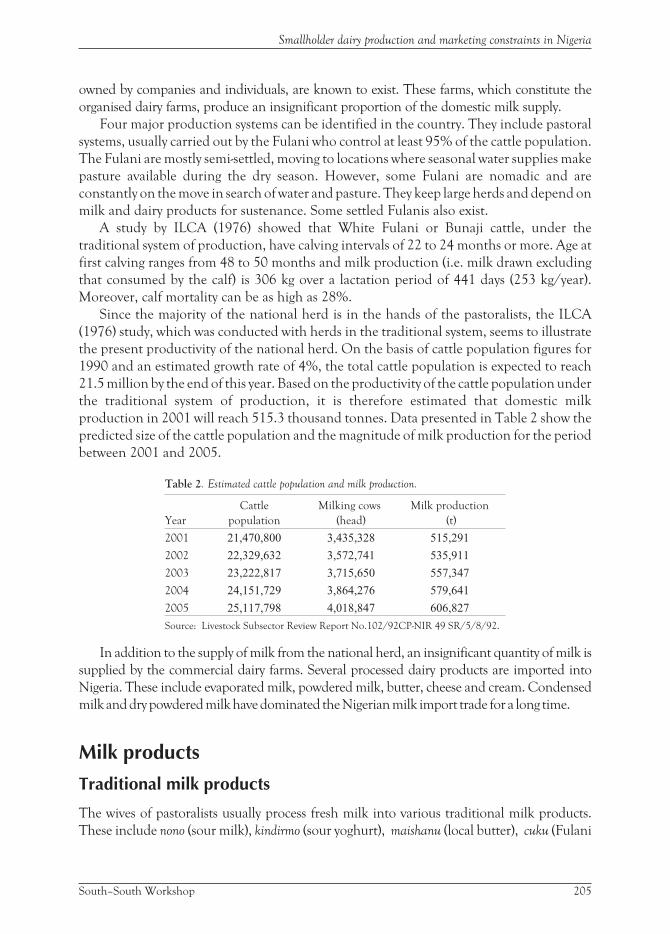
owned by companies and individuals, are known to exist. These farms, which constitute the
organised dairy farms, produce an insignificant proportion of the domestic milk supply.
Four major production systems can be identified in the country. They include pastoral
systems, usually carried out by the Fulani who control at least 95% of the cattle population.
The Fulani are mostly semi-settled, moving to locations where seasonal water supplies make
pasture available during the dry season. However, some Fulani are nomadic and are
constantly on the move in search of water and pasture. They keep large herds and depend on
milk and dairy products for sustenance. Some settled Fulanis also exist.
A study by ILCA (1976) showed that White Fulani or Bunaji cattle, under the
traditional system of production, have calving intervals of 22 to 24 months or more. Age at
first calving ranges from 48 to 50 months and milk production (i.e. milk drawn excluding
that consumed by the calf) is 306 kg over a lactation period of 441 days (253 kg/year).
Moreover, calf mortality can be as high as 28%.
Since the majority of the national herd is in the hands of the pastoralists, the ILCA
(1976) study, which was conducted with herds in the traditional system, seems to illustrate
the present productivity of the national herd. On the basis of cattle population figures for
1990 and an estimated growth rate of 4%, the total cattle population is expected to reach
21.5 million by the end of this year. Based on the productivity of the cattle population under
the traditional system of production, it is therefore estimated that domestic milk
production in 2001 will reach 515.3 thousand tonnes. Data presented in Table 2 show the
predicted size of the cattle population and the magnitude of milk production for the period
between 2001 and 2005.
Table 2. Estimated cattle population and milk production.
Year
Cattle
population
Milking cows
(head)
Milk production
(t)
2001 21,470,800 3,435,328 515,291
2002 22,329,632 3,572,741 535,911
2003 23,222,817 3,715,650 557,347
2004 24,151,729 3,864,276 579,641
2005 25,117,798 4,018,847 606,827
Source: Livestock Subsector Review Report No.102/92CP-NIR 49 SR/5/8/92.
In addition to the supply of milk from the national herd, an insignificant quantity of milk is
supplied by the commercial dairy farms. Several processed dairy products are imported into
Nigeria. These include evaporated milk, powdered milk, butter, cheese and cream. Condensed
milk and dry powdered milk have dominated the Nigerian milk import trade for a long time.
Milk products
Traditional milk products
The wives of pastoralists usually process fresh milk into various traditional milk products.
These include nono (sour milk), kindirmo (sour yoghurt), maishanu (local butter), cuku (Fulani
South–South Workshop 205
Smallholder dairy production and marketing constraints in Nigeria

cheese) and wara (Yoruba cheese). These products are usually hawked around the local area by
women or are sold in specific locations, such as the livestock markets in certain towns.
Due to the short shelf life and the fact that hawking is carried out on foot, these products
are usually only available within walking distance of Fulani settlements. For the same
reasons, these products are also more readily available in the northern states of the country.
Reconstituted dairy products
A number of dairy-processing plants exist in different parts of the country. Most are
urban-based and are, particularly the government owned ones, supposed to collect milk from
their catchment areas in order to stimulate local production. This aspect has, however, been
abandoned and the processing plants rely mostly on combining and reconstituting imported
milk powder. The various products from these processing plants include ice cream, chocolate
milk, yoghurt, cheese and long life milk. The last census undertaken for these plants (NLPD
1992) put the number of these plants at 63. Most have, however, closed down and those that
are still operating do so at less than 20% of their full capacity. Reasons for closure include,
among others, shortages of raw materials (particularly imported powdered milk) and
breakdown of machinery and equipment as a result of lack of spare parts etc.
Markets for dairy productsMarketing of milk and milk products involves a large number of individuals, including the
pastoralists, processors, milk product distributors and retailers. The marketing systems
follow the production pattern, which distinguishes between traditional producers, who
operate mainly in the rural or semi-urban markets, and the reconstituted milk product
producers and milk product importers who operate in the urban markets.
Traditional markets
The traditional marketing system, which involves local dairy products such as madara (fresh
milk), nono (sour milk), kindirmo (yoghurt), maishanu (local butter) and wara, wagashi and
chuku (cheese), is dominated by Fulani women and girls who are directly engaged in the
collection, processing and sale of the dairy products. The milk produced by the cows is for
both household consumption and direct sales to local consumers as fresh milk, clarified fat
(ghee) or other forms of traditional dairy products.
These milk products are carried on the women’s heads, in calabashes and gourds, as they
walk to sale points such as rural markets, roadside settlements and semi-urban areas.
Urban markets
The urban milk and milk product markets are the concern of the distributors, wholesalers,
depots, bicycle boys, retailers and other market outlets. The milk products include
206 South–South Workshop
Yahuza
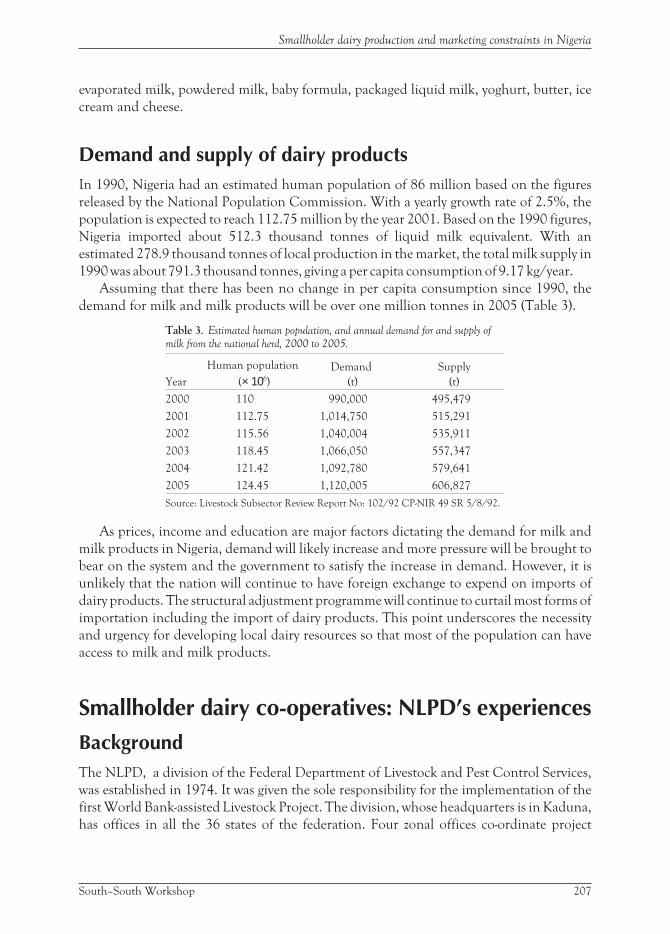
evaporated milk, powdered milk, baby formula, packaged liquid milk, yoghurt, butter, ice
cream and cheese.
Demand and supply of dairy productsIn 1990, Nigeria had an estimated human population of 86 million based on the figures
released by the National Population Commission. With a yearly growth rate of 2.5%, the
population is expected to reach 112.75 million by the year 2001. Based on the 1990 figures,
Nigeria imported about 512.3 thousand tonnes of liquid milk equivalent. With an
estimated 278.9 thousand tonnes of local production in the market, the total milk supply in
1990 was about 791.3 thousand tonnes, giving a per capita consumption of 9.17 kg/year.
Assuming that there has been no change in per capita consumption since 1990, the
demand for milk and milk products will be over one million tonnes in 2005 (Table 3).
Table 3. Estimated human population, and annual demand for and supply of
milk from the national herd, 2000 to 2005.
Year
Human population
(× 106)
Demand
(t)
Supply
(t)
2000 110 990,000 495,479
2001 112.75 1,014,750 515,291
2002 115.56 1,040,004 535,911
2003 118.45 1,066,050 557,347
2004 121.42 1,092,780 579,641
2005 124.45 1,120,005 606,827
Source: Livestock Subsector Review Report No: 102/92 CP-NIR 49 SR 5/8/92.
As prices, income and education are major factors dictating the demand for milk and
milk products in Nigeria, demand will likely increase and more pressure will be brought to
bear on the system and the government to satisfy the increase in demand. However, it is
unlikely that the nation will continue to have foreign exchange to expend on imports of
dairy products. The structural adjustment programme will continue to curtail most forms of
importation including the import of dairy products. This point underscores the necessity
and urgency for developing local dairy resources so that most of the population can have
access to milk and milk products.
Smallholder dairy co-operatives: NLPD’s experiences
BackgroundThe NLPD, a division of the Federal Department of Livestock and Pest Control Services,
was established in 1974. It was given the sole responsibility for the implementation of the
first World Bank-assisted Livestock Project. The division, whose headquarters is in Kaduna,
has offices in all the 36 states of the federation. Four zonal offices co-ordinate project
South–South Workshop 207
Smallholder dairy production and marketing constraints in Nigeria

activities in states within the zone. When the Second Livestock Development Project
(SLDP) was approved, as a follow-up of the completed First Livestock Development Project,
the NLPD was again given the responsibility for implementing the project nation-wide. The
SLDP became effective in April 1987 and was closed in June 1995.
During a mid-term review of the SLDP, a pilot dairy development programme was added
to the SLDP in order to seize the opportunity provided by the devaluation of the naira,
which made local milk collection, processing and marketing competitive. Kaduna State was
chosen as the area in which the pilot programme was to be implemented. Producers were
organised into groups and the small quantities of milk produced by pastoral families were
collected, processed and marketed on their behalf. The profit was returned to the producers
for use in other community development endeavours.
Kaduna State lies within the subhumid agro-ecological zone of north central Nigeria;
this zone has an annual rainfall ranging from 600 to 1000 mm. The area is suitable for the
production of crops such as sorghum, yam and maize. The state also provides a dry season
sanctuary for cattle because of its relatively high rainfall, which supports the growth of
pasture.
The cattle population of the state is estimated at 1.007 million head. More than 90% of
these are owned and managed by traditional, semi-settled pastoralists (RIM 1992). The
cattle, mostly Bunaji, are managed and milked by the men; however, the women, who
usually use the proceeds for the financing of household expenditures, carry out the
processing and marketing of milk and dairy products (Waters-Bayer 1985).
Supply of and demand for dairy products in Kaduna StateDaily milk offtake per lactating cow averages 0.74 litres/day, ranging from 0.36 litres in the
dry season to 1.27 litres in the wet season (World Bank 1993). Thus, in 1990, total milk
offtake in the state was estimated to be between 20 and 25 thousand litres. Nevertheless,
milk offtake has the potential to increase to between 75 and 95 thousand litres if milking is
carried out twice a day, and nutrition and market channels are improved.
In 1991, a total of 275 thousand tonnes of dairy products was imported into Nigeria; the
national average per capita consumption for the population being estimated at 3.1 kg. The
average annual imported quantity sold in Kaduna State (population = 3.9 million in 1991)
was estimated at approximately 2.0 kg of liquid milk equivalent per capita. When the total
annual imported quantity of around 8 thousand tonnes is added to the 21 to 27.4 thousand
tonnes (low and high estimates) sold from domestic production, the total average per capita
consumption is estimated to be 7.3–10 kg/year.
Organisation and management of milk co-operativesDairy was not included in the SLDP because during the design and appraisal phases,
economic conditions favoured importation of highly subsidised raw materials (mainly milk
powder and butter oil) rather than reliance on local sources of raw milk. A seven-fold
devaluation of the naira, coupled with the doubling of powdered milk prices in the
208 South–South Workshop
Yahuza
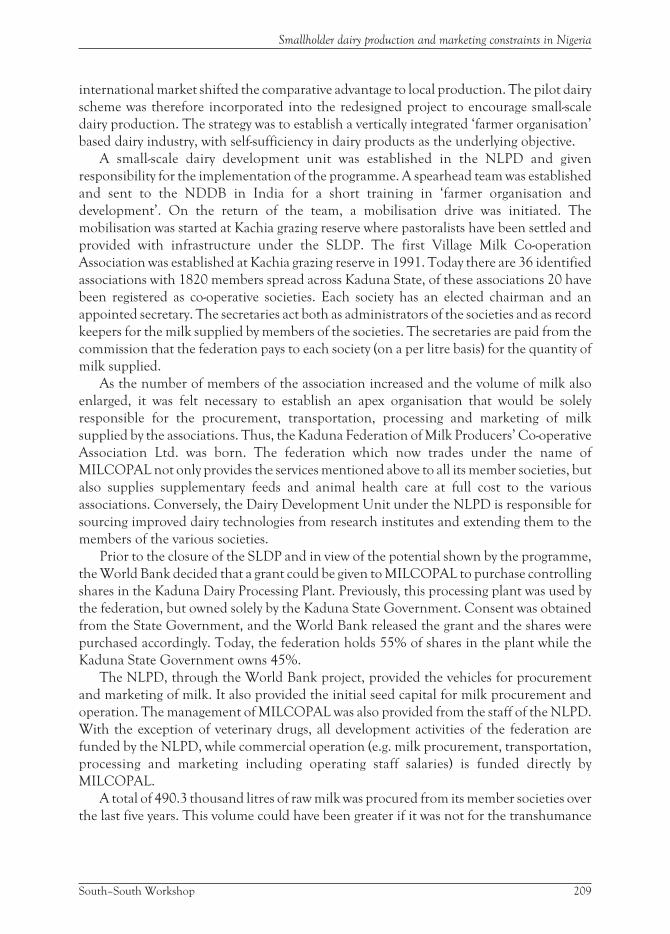
international market shifted the comparative advantage to local production. The pilot dairy
scheme was therefore incorporated into the redesigned project to encourage small-scale
dairy production. The strategy was to establish a vertically integrated ‘farmer organisation’
based dairy industry, with self-sufficiency in dairy products as the underlying objective.
A small-scale dairy development unit was established in the NLPD and given
responsibility for the implementation of the programme. A spearhead team was established
and sent to the NDDB in India for a short training in ‘farmer organisation and
development’. On the return of the team, a mobilisation drive was initiated. The
mobilisation was started at Kachia grazing reserve where pastoralists have been settled and
provided with infrastructure under the SLDP. The first Village Milk Co-operation
Association was established at Kachia grazing reserve in 1991. Today there are 36 identified
associations with 1820 members spread across Kaduna State, of these associations 20 have
been registered as co-operative societies. Each society has an elected chairman and an
appointed secretary. The secretaries act both as administrators of the societies and as record
keepers for the milk supplied by members of the societies. The secretaries are paid from the
commission that the federation pays to each society (on a per litre basis) for the quantity of
milk supplied.
As the number of members of the association increased and the volume of milk also
enlarged, it was felt necessary to establish an apex organisation that would be solely
responsible for the procurement, transportation, processing and marketing of milk
supplied by the associations. Thus, the Kaduna Federation of Milk Producers’ Co-operative
Association Ltd. was born. The federation which now trades under the name of
MILCOPAL not only provides the services mentioned above to all its member societies, but
also supplies supplementary feeds and animal health care at full cost to the various
associations. Conversely, the Dairy Development Unit under the NLPD is responsible for
sourcing improved dairy technologies from research institutes and extending them to the
members of the various societies.
Prior to the closure of the SLDP and in view of the potential shown by the programme,
the World Bank decided that a grant could be given to MILCOPAL to purchase controlling
shares in the Kaduna Dairy Processing Plant. Previously, this processing plant was used by
the federation, but owned solely by the Kaduna State Government. Consent was obtained
from the State Government, and the World Bank released the grant and the shares were
purchased accordingly. Today, the federation holds 55% of shares in the plant while the
Kaduna State Government owns 45%.
The NLPD, through the World Bank project, provided the vehicles for procurement
and marketing of milk. It also provided the initial seed capital for milk procurement and
operation. The management of MILCOPAL was also provided from the staff of the NLPD.
With the exception of veterinary drugs, all development activities of the federation are
funded by the NLPD, while commercial operation (e.g. milk procurement, transportation,
processing and marketing including operating staff salaries) is funded directly by
MILCOPAL.
A total of 490.3 thousand litres of raw milk was procured from its member societies over
the last five years. This volume could have been greater if it was not for the transhumance
South–South Workshop 209
Smallholder dairy production and marketing constraints in Nigeria

practised by the pastoralists that drastically reduced the quantity supplied in the dry season.
Some collection routes had to be abandoned because they were unviable.
However, there are indications that milk collection will increase as dry season milk
supplies are slowly increasing consequent to increases in the purchase of supplementary
feeds and a tendency among pastoralists towards sedentarisation (Figure 1).
Marketing of dairy productsSeasonal variation in the supply and marketing of milk and other dairy products poses a
serious challenge to MILCOPAL. In the rainy season when feeds and water are available,
productivity of the animals increases substantially and more milk is available to be supplied
by the various societies. Unfortunately, as indicated in Figure 2, demand for milk and other
dairy products is lowest during the rainy season.
During the rainy season, MILCOPAL has to produce butter from the excess milk. In
addition, more effort has to be put into marketing to enable the federation to dispose of all
the milk products; this extra work is very costly to the organisation. However, there have
been recent improvements in the previously unpromising market for butter.
During the dry season, when production is low as a result of low availability of forage
resources, demand for milk products is highest. Sometime the federation has to supplement
milk supply with powdered milk in order to retain its customers. The customers do not seem
to be able to differentiate between products made from natural cow milk and those made
from milk powder, as their loyalty does not seem to alter.
Of the three products produced and marketed by MILCOPAL, viz. yoghurt, fresh milk
and butter, yoghurt seems to be the most popular (Figure 3).
210 South–South Workshop
Yahuza
108,613
89,09088,220
105,78098,670
0
20
40
60
80
100
120
1996 1997 1998 1999 2000
Year
Milk (× 103 litres)
108,613
89,09088,220
105,78098,670
0
20
40
60
80
100
120
1996 1997 1998 1999 2000
Year
Milk (× 103 litres)
Source: World Bank (1993).
Figure 1. Annual milk procurement.

Fresh milk, which costs the federation less to process and is probably more profitable,
appears to be unpopular with Nigerian consumers as it accounts for only 30% of total
products sold. Therefore, the future of the dairy industry in Nigeria and perhaps that of the
operations of the federation will depend more on the production of yoghurt and other sour
milk products, which seem to be very popular with Nigerian consumers, than on sales of
fresh milk. Packaging will, however, pose a very serious challenge. Currently, the federation
South–South Workshop 211
Smallholder dairy production and marketing constraints in Nigeria
33,673.50
49,917.50
32,918.50
41,865.5040,062.50
45,490
58,315.5053,547.50
50,186.5053,001.50
0
10
20
30
40
50
60
70
1996 1997 1998 1999 2000
Milk (× 103 liters)
Dry season Wet season
33,673.50
49,917.50
32,918.50
41,865.5040,062.50
45,490
58,315.5053,547.50
50,186.5053,001.50
0
10
20
30
40
50
60
70
1996 1997 1998 1999 2000
Milk (× 103 liters)
Dry season Wet season
Source: World Bank (1993).
Figure 2. Dry and wet season supply of milk by the various co-operative societies.
52,046
19,822 18,441
41,289 42,848
84,469
1035 822 1224 1170 633
30,990 35,15445,265
62,168
0
10
20
30
40
50
60
70
80
90
1996 1997 1998 1999 2000
Litres equivalent (× 103)
P. fresh milk (litres) Yoghourt (litres) Butter (as litres of milk)
52,046
19,822 18,441
41,289 42,848
84,469
1035 822 1224 1170 633
30,990 35,15445,265
62,168
0
10
20
30
40
50
60
70
80
90
1996 1997 1998 1999 2000
Litres equivalent (× 103)
P. fresh milk (litres) Yoghourt (litres) Butter (as litres of milk)
P. fresh milk = pasteurised fresh milk.Source: MILCOPAL Annual Marketing Report.
Figure 3. Consumer preferences for dairy products in Kaduna State.

resorts to serving out large shapeless quantities in order to keep production cost low and
maintain affordable prices.
Cost/benefit analysis of the operation of the farmerorganisationAs stated above, the development costs of the federation are being shouldered by the NLPD.
These include, among others, the payment of salaries for the seconded staff, the costs of
provision of animal health care (excluding the cost of the drugs), and the sourcing and
dispersal of dairy technologies. In addition, the initial seed capital was provided as a grant to
the federation. It is doubtful that the federation’s commercial operations would have
survived this long without continuous injections of funds, in the form of grants from the
NLPD. (Annex I).
The most important lesson learnt from the operation of MILCOPAL is that smallholder
agro-pastoralists in Nigeria can supply milk to urban centres. It is evident, however, that dairy
development requires considerable amounts of skilled manpower for milk handling,
processing and marketing, for organising farmer associations and for training farmers how to
manage these associations. This skilled input has been required even though the volume of
milk (490,373 litres in 5 years) collected and marketed has been lower than that expected. A
valuable lesson learnt from the pilot scheme is that trained and experienced manpower would
be very useful in expanding the programme in Kaduna State and the nation in general.
The pilot Dairy Co-operative Development Programme has had a profound impact on
the socio-economic status of the participating pastoralists, especially the women. Women
have benefited most, because collection of milk from their doorsteps has relieved them of
the enormous burden of hawking their milk to markets far away from their places of abode.
The programme has also provided the pastoral families with a regular income. A few of the
societies have used their commission to carry out some community development
programmes. For example culverts have been constructed across roads to facilitate
collection of milk in the rainy season.
ReferencesBuchanan K.M. and Pugh J.C. 1955. Land and people in Nigeria: The human geography of Nigeria and its
environment. University of London Press, London, UK.
CBN (Central Bank of Nigeria). 1999. Annual report 1999. CBN, Lagos, Nigeria.
FAO (Food and Agriculture Organization of the United Nations). 1988. Agricultural development in
Nigeria 1965–80. FAO, Rome, Italy.
ILCA (International Livestock Centre for Africa). 1976. Livestock production in the sub-humid zone of
West Africa. System Study 2. ILCA, Addis Ababa, Ethiopia.
Livestock subsector review. Report 102/92 CPNIR 49 SR/5/8/92.
MILCOPAL Kaduna Federation of Milk Producers’ Co-operative Association Ltd. Anualmarketing report.
212 South–South Workshop
Yahuza
National Archives. 1934–48. Archives, A. 1934–1948. Ghee (butter) industry (clarified butter fat or ‘CBF’),
Zaria Province ACC. 1697. National Archives, Kaduna, Nigeria.
NLPD (National Livestock Project Division). 1992. National dairy survey. NLPD, Kaduna, Nigeria.
Olaloku E. 1976. Milk production in West Africa: Objectives and research approaches. Journal of the
Association for the Advancement of Agriculture in Africa 3:5–13.
RIM (Resource Inventory and Mangaement). 1990. Livestock resource survey 1990.
Walker D.A.W. 1981. Livestock development in Nigeria 1914–79. A brief historical review. WorkingDocument 1. NLPD (National Livestock Project Division), Kaduna, Nigeria.
Waters-Bayer A. 1985. Dairyng by settled Fulani agropastoralists in central Nigeria. The role of women and
implications for dairy development. ODI Pastoral Development Network Paper 20c. ODI (OverseasDevelopment Institute), London, UK. 24 pp.
World Bank. 1992. Feasibility study of the rehabilitation and operation of the Kaduna dairy plant. TheWorld Bank, Washington, DC, USA.
World Bank. 1993. Feasibility study on the viability of the Kaduna Federation of Milk Producers’ Co-operative
Association Ltd.
South–South Workshop 213
Smallholder dairy production and marketing constraints in Nigeria
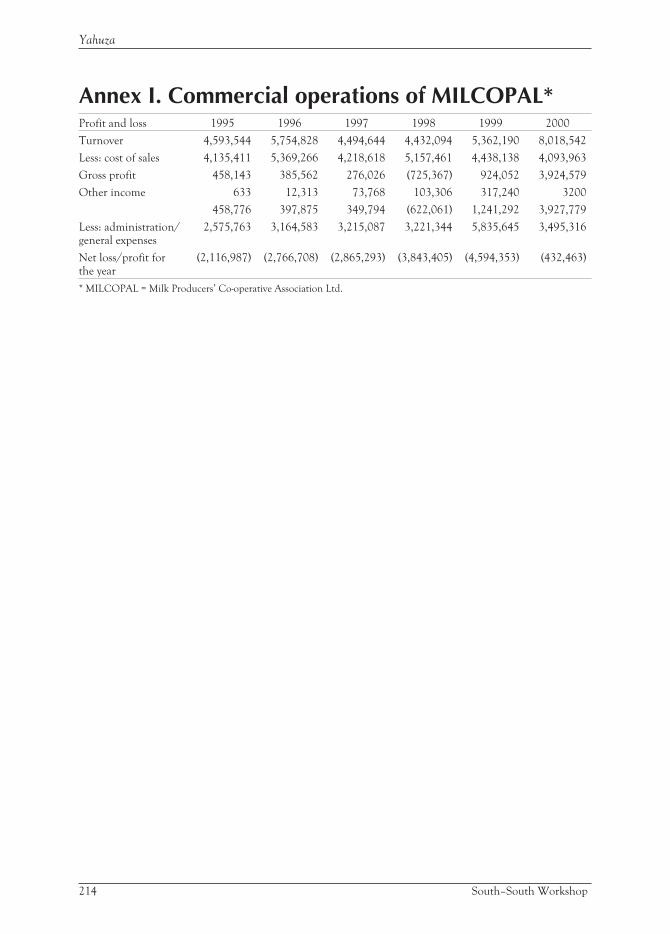
Annex I. Commercial operations of MILCOPAL*Profit and loss 1995 1996 1997 1998 1999 2000
Turnover 4,593,544 5,754,828 4,494,644 4,432,094 5,362,190 8,018,542
Less: cost of sales 4,135,411 5,369,266 4,218,618 5,157,461 4,438,138 4,093,963
Gross profit 458,143 385,562 276,026 (725,367) 924,052 3,924,579
Other income 633 12,313 73,768 103,306 317,240 3200
458,776 397,875 349,794 (622,061) 1,241,292 3,927,779
Less: administration/general expenses
2,575,763 3,164,583 3,215,087 3,221,344 5,835,645 3,495,316
Net loss/profit forthe year
(2,116,987) (2,766,708) (2,865,293) (3,843,405) (4,594,353) (432,463)
* MILCOPAL = Milk Producers’ Co-operative Association Ltd.
214 South–South Workshop
Yahuza
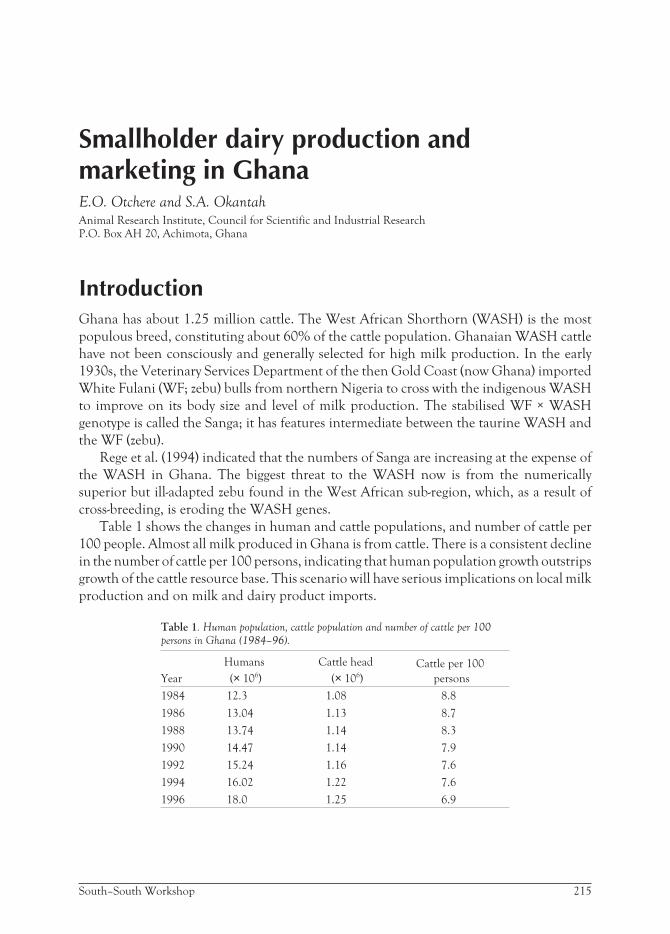
Smallholder dairy production andmarketing in GhanaE.O. Otchere and S.A. OkantahAnimal Research Institute, Council for Scientific and Industrial ResearchP.O. Box AH 20, Achimota, Ghana
IntroductionGhana has about 1.25 million cattle. The West African Shorthorn (WASH) is the most
populous breed, constituting about 60% of the cattle population. Ghanaian WASH cattle
have not been consciously and generally selected for high milk production. In the early
1930s, the Veterinary Services Department of the then Gold Coast (now Ghana) imported
White Fulani (WF; zebu) bulls from northern Nigeria to cross with the indigenous WASH
to improve on its body size and level of milk production. The stabilised WF × WASH
genotype is called the Sanga; it has features intermediate between the taurine WASH and
the WF (zebu).
Rege et al. (1994) indicated that the numbers of Sanga are increasing at the expense of
the WASH in Ghana. The biggest threat to the WASH now is from the numerically
superior but ill-adapted zebu found in the West African sub-region, which, as a result of
cross-breeding, is eroding the WASH genes.
Table 1 shows the changes in human and cattle populations, and number of cattle per
100 people. Almost all milk produced in Ghana is from cattle. There is a consistent decline
in the number of cattle per 100 persons, indicating that human population growth outstrips
growth of the cattle resource base. This scenario will have serious implications on local milk
production and on milk and dairy product imports.
Table 1. Human population, cattle population and number of cattle per 100
persons in Ghana (1984–96).
Year
Humans
(× 106)
Cattle head
(× 106)
Cattle per 100
persons
1984 12.3 1.08 8.8
1986 13.04 1.13 8.7
1988 13.74 1.14 8.3
1990 14.47 1.14 7.9
1992 15.24 1.16 7.6
1994 16.02 1.22 7.6
1996 18.0 1.25 6.9
South–South Workshop 215
Institutional issuesAnimal agricultural development is presently handled by the Ministry of Food and
Agriculture (MoFA) through the Animal Production Department (APD), Veterinary
Services Department (VSD) and the Livestock Planning and Information Unit (LPIU). The
activities of the APD and VSD include:
• breed improvement
• forage and pasture development
• stock water development
• disease control
• vaccination
• tsetse and trypanosomosis control, vaccine production and laboratory services among
others.
The LPIU facilitates the task of decision making by providing information on the
livestock industry in an easily accessible and comprehensible format. The LPIU also
monitors and evaluates the impact of new activities initiated by the APD and VSD.
The country operates a unified agricultural extension system (UAES) administered by
the Department of Agricultural Extension Services (DAES) of the MoFA. The APD, VSD
and national agricultural research system (NARS) provide subject matter specialists to train
frontline extension staff to disseminate, on a wide scale, technologies that are beneficial and
economically important for livestock production.
The Animal Research Institute of the Council for Scientific and Industrial Research
(CSIR), under the Ministry of Environment, Science and Technology, provides major
animal agricultural research support to the MoFA. Additional research support is given by
the Animal Science Departments of the University of Ghana, Kwame Nkrumah University
of Science and Technology, the University of Cape Coast and the University for
Development Studies. The universities are under the Ministry of Education.
Production systemsCattle production is mostly sedentary and agropastoral with limited transhumance. In recent
times, large nomadic herds have invaded Ghana from Burkina Faso and Niger. Such nomadic
herds had been forced out of Ghana because of the tendency of such herds to destroy crops.
In Ghana, a mutually beneficial solution for farmers and nomads needs to be identified. This
should be possible since the size of Ghana’s national cattle herd is rather low.
In the northern savannah, cattle herd sizes are generally small, usually between 10 and
50 head. Ownership patterns are complex and the herd may belong to one owner, one
family or one village.
In the southern savannah, herds are generally larger in size, frequently between 50 and
200 head. In many cases, however, these herds are the property of absentee owners and are
cared for by hired Fulani herdsmen. The absentee cattle owners may be businessmen, civil
servants or farmers. Normally, the herdsmen’s only remuneration is the right to milk sold
216 South–South Workshop
Otchere and Okantah

from the herd. In some cases, however, the Fulani may also be given the third calf from any
cow (Hill 1964).
This arrangement has implications for technology adoption. Recent studies by the
Animal Research Institute have shown that strategic supplementation of cow feeds
increases milk yields, improves calf growth and decreases calving intervals (Obese et al.
1999; Okantah et al. 2000a, b). However, it has not been possible for this strategy to be
adopted because neither the herdsman who gets more milk nor the owner who gets more
calves is prepared to pay for the supplements.
Diseases and cattle productionDiseases constitute a major constraint in cattle production. The major diseases that kill
cattle are rinderpest, contagious bovine pleuropneumonia (CBPP), anthrax and blackleg.
Routine vaccinations have allowed greater control of these diseases. Moreover, the VSD has
established a system of surveillance through routine sero-monitoring for rinderpest,
brucellosis and CBPP. This has facilitated early disease detection and control.
Other important diseases are trypanosomosis and dermatophilosis. The indigenous
WASH has a low milk yield but is tolerant to trypanosomosis and dermatophilosis. In
contrast, the Sanga produces more milk but does not have the same degree of tolerance to
trypanosomosis and dermatophilosis. Imported exotic dairy breeds (e.g. Holstein–Friesian
and Jersey) or their crosses have not survived under Ghanaian conditions, notably because
of the scourge of dermatophilosis (Koney 1996) and poor environmental adaptation. Exotic
cattle introduced to the country were found to require high levels of nutrition and
management in the humid Ashanti region (Alhassan and Owusu 1980; Gyawu et al. 1988)
and were adversely affected by heat stress on the Accra Plains (Okantah et al. 1993).
Tuberculosis and brucellosis in cattle are also important because of their public health
significance. Only a few limited surveys have been carried out on the prevalence of bovine
brucellosis in Ghana. Oppong (1966) reported a prevalence rate of 23.4% on the Accra
Plains. In southern Ghana, a prevalence rate of 55.3% has been reported more recently
(VSD 1997). Available information on bovine tuberculosis in Ghana is scarce (Bonsu et al.
2000). Table 2 shows data indicating prevalence of infection of tuberculosis in some areas of
southern Ghana.
Table 2. Prevalence of bovine tuberculosis in southern Ghana.
Location Prevalence (%) Source
Accra Plains 7.0 VSD 1997
Katamanso 2.6 ARI 1997
Nungua 1.0 Bonsu 1998
Aveyime 4.0 Bonsu 1998
Dangbe-West 13.8 Bonsu 1998
Volta region 1.0 VSD 1997
Pokoase 19.0 ARI 1997
Source: KNUST and ARI (no date).
South–South Workshop 217
Smallholder dairy production and marketing in Ghana
Available data indicate that the diseases affect cattle production in general and milk
production in particular. Of greater importance is the need to take cognisance of the
existence of public health risks in the consumption of raw milk.
Protein malnutrition in GhanaMalnutrition is not new in Ghana if we note the length of time the term kwashiorkor, a Ga
word, has been in use in medical literature. Protein malnutrition is still with us. At present,
food of animal origin constitutes only 5% of the average Ghanaian’s diet. The rest is made
up of starchy staples such as cereals, roots and tubers (Levin 1997). In Ghana, about 30% of
children under 5 years of age are underweight. Incidence of malnutrition in the northern
regions of Ghana is very high among children aged between 12 and 23 months. Nearly 70%
of children in this age group are less than 80% of the standard weight for age, indicating that
children in this age group do not receive enough foods of adequate quality to support
normal growth. Indications are that urban malnutrition is increasingly a problem and needs
to be given serious attention (Levin 1997).
Contribution of milk to human nutrition in GhanaThe contribution of cow milk to human nutrition is a function of the level of consumption
in different dietary situations. In Ghana, its significance lies in its contribution of those
nutrients, which are deficient in traditional staples such as cereals, roots and tubers.
Some adult Ghanaians, however, are intolerant to milk because of their inability to
digest lactose (milk sugar); these individuals lack the enzyme to enable them digest milk
sugar. One wonders, therefore, if milk could have any role to play in the alleviation of
protein malnutrition in Ghana. According to Olaloku (1974) extensive studies, in India for
example, show that lactose or milk intolerance is not a reliable guide for deciding whether
milk should be used to improve the diets of malnourished populations. Such studies have
shown that even in milk intolerant individuals, protein-calorie malnutrition responds
readily to milk administration, thus demonstrating satisfactory absorption of some milk
proteins in the small intestines. Moreover, processing of milk into fermented products
provides alternate safe forms of milk suitable for inclusion in the diets of lactose tolerant
and intolerant individuals.
General herd management and milk production bysmallholder herdsGeneral routine herd management and milking have been described (Otchere 1966;
Okantah 1992; Okantah et al. 1995). Milk is extracted, particularly by smallholder herders,
for home consumption and for sale. Milking is often once a day and invariably in the
218 South–South Workshop
Otchere and Okantah

morning. The presence of the calf is always necessary to induce milk let-down (Otchere
1966; Okantah et al. 1995).
Otchere (1966) reported a milk yield of 738 ml/cow per day over a 240-day period for
Sangas maintained on free-range native pasture and corralled at night, with no supplemental
feeding. The mean butterfat content for a total of 349 samples from once-a-day milking was
4.48%. Okantah (1992) reported mean daily partial milk yields of 0.9 and 0.7 kg for the wet
and dry season, respectively, on the Accra Plains. In the northern Guinea savannah in
northern Ghana, Karbo et al. (1998a) reported similar observations. Cumulatively these
data indicate that indigenous cattle kept by smallholders are generally low milk producers. It
should, however, be pointed out that the milk yield figures above did not represent the
genetic potential of the animals used in the studies because: (a) the amounts did not include
milk consumed by calves; (b) the cattle had not been selected for high milk yield; and (c) the
environment had not been improved enough to really enable the animals to demonstrate
their full genetic make-up for high milk yield.
It has been demonstrated that large quantities of milk are available from several
thousands of low-yielding cattle in the smallholder system (Okantah 1992). Consequently,
the Ministry of Food and Agriculture initiated a pilot milk collection project on the Accra
Plains. This exercise has been extended to Sekyedumasi and peri-urban Kumasi in the
Ashanti Region. In 1998, the pilot milk collection project collected 85,587 litres of milk
from smallholder farmers in peri-urban Accra (LPIU 1999).
Demand for dairy products in GhanaMilk production in Ghana is low and as such there is low per capita milk consumption.
Currently, local annual milk production is conservatively estimated at 36.5 thousand tonnes.
Most of it is from smallholder agropastoral producers. There is a big shortfall between
domestic milk production and consumption. The deficit is made up through imports of milk
and milk products. Table 3 shows the volume of dairy product imports from 1995 to 1999.
The fluctuations in imports are due to variation in the availability of foreign exchange for
importation. With a removal of dairy subsidies in European nations, the cost of imports of
dairy products would constitute a heavy drain on the meagre foreign exchange resources of the
nation. The current economic environment, under which the local currency (the cedi) has
eroded in value, should be a positive incentive for increased local milk production. It may
even make it possible for local production to compete favourably with imported products.
Table 3. Imports of dairy products into Ghana.
Year Quantity (× 103 t)
1995 10,469.7
1996 5649.6
1997 6140.7
1998 10,101.0
1999 7470.4
Source: LPIU various occasional papers.
South–South Workshop 219
Smallholder dairy production and marketing in Ghana
Economics of smallholder systems and benefits toproducersKarbo et al. (1998b) reported that smallholder milk producers in peri-urban Tamale in
northern Ghana (northern Guinea savannah) generated substantial daily income
throughout the year from the sale of milk. A study was conducted in the transition zone to
evaluate the potential contribution of milk sales to farmers’ income as compared with the
income from crop production. The analysis revealed that the potential income contribution
from milk sales was the same as that from crop production (Nsiah-Ababio 1998). A
comparison of the two systems is somewhat difficult because milk production depended on
access to free communal grazing land. In a survey conducted in the Techiman District of
Brong Ahafo Region, it was observed that producing ‘wagashi’ (cottage cheese) from fresh
milk added a value of 54% to milk compared with sales of the fresh product
(SFSP–GTZ–MoFA 1998).
Small milk collection projects have been initiated and studies on the economic
feasibility of such small-scale milk collection centres have been undertaken. A comparison
of capital expenditure, operational costs and revenue has demonstrated that such centres
are viable (Adu 1997).
Clearly, smallholder milk producers enjoy economic benefits especially when small cash
incomes are available throughout the year. Smallholder systems also offer employment to
both producers and processors. In addition, it can be inferred that milk consumption by
smallholders’ families improves their nutritional status.
Marketing and processing of milk and milkproductsKarbo et al. (1998a) in a survey carried out in peri-urban Tamale in the northern region of
Ghana reported no problems with marketing fresh milk. Respondents complained of not
having enough milk for sale. The lack of marketing problems with milk and milk product
sales could imply the viability of a peri-urban dairy project. Consumers, however,
complained about the unhygienic conditions under which milk was collected and processed
at the rural level. Milk processing in this survey was reported to be the domain of women.
The main processed product was a soft cheese called wagashi. Sales of wagashi in urban
Tamale were not high probably because of the very elementary level of processing and
presentation.
Similar observations to those above have been reported in studies of smallholders in the
Ashanti region (KNUST and ARI, no date). Women process unsold milk from smallholder
herds into wagashi.
In the Ashanti region, however, the Beef and Dairy Research Station of the Kwame
Nkrumah University of Science and Technology (KNUST) in Kumasi, produces
pasteurised milk, yoghurt and occasionally cheese and butter. These are marketed on the
university campus. Furthermore, a pilot milk collection centre in Sekyedumasi procured
220 South–South Workshop
Otchere and Okantah
fresh milk from Fulani herdsmen and processed it into sweetened milk and yoghurt for sale
in nearby Ejura or far away Kumasi.
Another survey on processing and marketing of milk among peri-urban agropastoralists
on the Accra Plains in Ghana revealed an association between the sale of processed milk and
distance from consuming metropolitan centres (Okantah et al. 1999). In districts close to
urban centres less milk was processed, with most milk being sold fresh. On the other hand,
in districts further removed from urban centres, 66.7–76.2% of farmers processed milk into
cheese, obviously to increase its shelf life. Similarly consumption of processed milk by
farmers was associated with the proximity or distance of districts to urban centres, though in
all districts fresh milk was readily consumed.
Milk marketing and processing in southern Ghana is similar to that described above.
Marketing opportunities are, however, better because of the high population of Accra and
its environs. The Amrahia Dairy Farm of the Animal Production Directorate (APD) of the
Ministry of Food and Agriculture (MoFA) operates a milk collection scheme in southern
Ghana. The farm produces and pasteurises its own milk and also produces some yoghurt.
The farm serves as an outlet for milk produced by smallholders. The policy now is to get the
private sector to take over the milk collection scheme.
Other quasi-governmental institutions, which produce and process small quantities of
milk, are the Animal Research Institute and the University of Ghana Agricultural Research
Station, Legon.
There are two multinational dairy enterprises in Accra, namely Fan Milk Limited and
Nestle, Ghana Limited. They use imported milk powder and butter oil for reconstitution.
These enterprises have shown keen interest and willingness to purchase local fresh milk for
processing.
In 1990, the total production of reconstituted milk and ice cream by Fan Milk and
Nestle was 2.08 and 0.998 million litres, respectively, but by 1996 the production of these
products had increased to 27.6 and 3.582 million litres. From the level of imports of milk
and milk products into Ghana, there are clearly good prospects for processing fresh milk
produced locally by smallholders.
There is, however, a strong distrust of outsiders (researchers etc.) by traditional
smallholder livestock producers. Consequently, the social goals of livestock producers and
their attitudes towards new technologies, labour investment as well as willingness to change
traditional practices are not well understood by researchers and policy makers.
In Ghana, there appears to be a lack of accurate data for effective economic analysis of
livestock projects compared with crop production projects. As such, in the formulation of
integrated agricultural projects the livestock subsector is often the weakest link because of
the lack of sufficient accurate data.
Detailed feasibility studies have been made for specific livestock ventures in Ghana and
as commercial ventures, they have seemed to be profitable. Nevertheless, most commercial
livestock ventures (ranches and milk processing plants) have closed down after a few years of
operation because they have proved unprofitable. On the other hand and rather
surprisingly, the traditional sector has survived the odds, even though they have been
described as non-productive.
South–South Workshop 221
Smallholder dairy production and marketing in Ghana
PolicyA Ghanaian National Livestock Breeding Policy workshop was held in 1992 and, by 1995
both Livestock Breeding Policy and Animal Breeding Plans had been formulated (Okantah
and Boa-Amponsem 1992; Ahunu et al. 1995). The major recommendations were to:
• select and develop the indigenous WASH as a beef animal
• develop the Sanga as a dual-purpose cattle
• develop exotic (dairy) and Sanga crossbred cattle for milk and meat production.
In view of the zoonotic threats from consumption of milk produced in the traditional
sector, a policy needs to be formulated on boiling milk produced by the smallholders. Policy
on acculturation of milk consumption among children in primary and secondary schools is
also necessary so that lactose intolerance is not a problem when they become adults.
Concluding remarksThe dairy industry in Ghana is in its infancy. The domination of smallholder milk
producers will persist for a considerable length of time. The Animal Research Institute
recognises the great potential that smallholder cattle producers have to move the country
forward towards self-sufficiency in milk production. The institute’s short- to medium-term
strategy, therefore, is to focus research efforts on developing appropriate technologies for
development and extension agencies to use to facilitate modern dairy production in Ghana.
ReferencesAdu S. 1997. An economic feasibility of establishment of a small-scale milk collection centre in cattle
rearing communities in Ghana. BSc dissertation, Faculty of Agriculture, Kwame NkrumahUniversity of Science and Technology, Kumasi, Ghana.
Ahunu B.K., Boa-Amponsem K., Okantah S.A., Aboagye G.S. and Boadu M.K. 1995. Animalbreeding plans for the Republic of Ghana. A report submitted to the Ministry of Food andAgriculture. Ministry of Food and Agriculture, Accra, Ghana.
Alhassan W.S. and Owusu Y. 1980. Lactation responses to concentrate feeding in the humid tropics.Tropical Animal Health and Production 12:171–176.
ARI (Animal Research Institute). 1997. Annual Report of Animal Research Institute, CSIR 1997.ARI, Council for Scientific and Industrial Research, Achimota, Ghana.
Bonsu O.A. 1998. The prevalence of tuberculosis in cattle in the Dangbe-West District—Public health
implication. MSc thesis, School of Public Health, University of Ghana, Legon, Ghana. 40 pp.
Bonsu O.A., Laing E. and Akanmori B.D. 2000. Prevalence of tuberculosis in cattle in theDangbe-West district of Ghana, public health implications. Acta Tropica 76:9–14.
Gyawu P., Asare K. and Karikari P.K. 1988. The performance of imported Holstein–Friesian cattleand their progeny in the humid tropics. Bulletin of Animal Health and Production in Africa
36:362–366.
222 South–South Workshop
Otchere and Okantah
Hill P. 1964. A socio-economic report on cattle ownership and Fulani herdsmen in theAshaiman/Dodowa District of the Accra Plains. Institute of African Studies, University ofGhana, Ghana. (mimeo).
Karbo N., Bruce J. and Okantah S.A. 1998a. A survey on peri-urban dairy in northern Ghana. Paperpresented at the 1st Biennial National Agricultural Research Project (NARP) conference held atAccra, Ghana, 16–20 November 1998.
Karbo N., Bruce J. and Okantah S.A. 1998b. Evaluating the yield potential of peri-urban dairy innorthern Ghana. Paper presented at the 1st Biennial National Agricultural Research Project(NARP) conference held at Accra, Ghana, 16–20 November 1998.
KNUST (Kwame Nkrumah University of Science and Technology) and ARI (Agricultural ResearchInstitute). (No date). Literature review. SUA/KNUST/ARI/NRI/ILRI milk marketing,processing and public health project. 32 pp.
Koney E.B.M. 1996. Dermatophilosis in Ghana: Effect on livestock industry. Tropical Animal Health
and Production 28:35–85.
Levin C. 1997. Ghana’s agricultural sector and prospects for the future. Lecture presented at theInstitute of Economic Affairs, Accra, Ghana, 29 May 1997.
LPIU (Livestock Planning and Information Unit). 1999. 1998 Annual Progress Report. NationalLivestock Services Project. Ghana Ministry of Food and Agriculture, Accra, Ghana.
Nsiah-Ababio R. 1998. Potential contribution of milk sales to farmers’ income. BSc dissertation,Faculty of Agriculture, Kwame Nkrumah University of Science and Technology, Kumasi, Ghana.
Obese F.Y., Okantah S.A. and Oddoye E.O.K. 1999. Post-partum reproductive performance ofsanga cattle in smallholder peri-urban dairy herds in the Accra Plains of Ghana. Tropical Animal
Health and Production 31:181–190.
Okantah S.A. 1992. Partial milking of cattle in smallholder herds on the Accra Plains: Some factorsaffecting daily partial milk yield and milk composition. Animal Production 54:15–21.
Okantah S.A. and Boa-Amponsem K. 1992. Livestock development in Ghana: A proposal onbreeding aspects revisited. Paper presented at a Ministry of Food and Agriculture workshop onformulating a National Breeding Policy for Ghana 25th GASA symposium.
Okantah S.A., Aggrey S.A. and Amoako K.J. 1993. The effect of diurnal changes in ambienttemperature on heat tolerance in some cattle breeds and crosses. Bulletin of Animal Health and
Production in Africa 41:33–38.
Okantah S.A., Gyawu P., Asante Y., Oddoye E.O.K., Obese F.Y., Abdulai M. and Mumuni A. 1995.Characterization of peri-urban dairy production in Ghana. Paper presented at IDRC/CARNETperi-urban dairy project post-survey workshop held at Accra, Ghana, 29 May to 2 June 1995.
Okantah S.A., Oddoye E.O.K., Obese F.Y., Gyawu P. and Asante Y. 1999. A survey of processing andmarketing characteristics of peri-urban agropastoral dairying in Ghana. Ghana Journal of
Agricultural Science. (In press).
Okantah S.A., Obese F.Y. and Oddoye E.O.K. 2000a. Effect of farm (herd) and season of calving onreproductive performance of sanga cows in smallholder peri-urban dairy farms in the AccraPlains. Ghana Journal of Agricultural Science 33. (In press).
Okantah S.A., Obese F.Y. and Oddoye E.O.K. 2000b. Effect of farm and season on the growthperformance, body condition score and milk yield of sanga cattle in smallholder peri-urban farmsin the Accra Plains of Ghana. Ghana Journal of Agricultural Science 33. (In press).
Olaloku E.A. 1974. Problems and possibilities of milk production. In: Loosli J.K., Oyenuga V.A. andBabatunde G.M. (eds), Animal production in the tropics. Heiemann Educational Books (Nigeria)Ltd., Ibadan, Nigeria. pp. 43–65.
South–South Workshop 223
Smallholder dairy production and marketing in Ghana
Oppong E.N.W. 1966. Bovine brucellosis in southern Ghana. Bulletin of Epizootic Diseases in Africa.
14:397–403.
Otchere E.O. 1966. Preliminary observations on milk production among the Fulanis on the Accra Plains. BScdissertation, Faculty of Agriculture, University of Ghana, Legon, Ghana. 28 pp.
Rege J.E.O., Aboagye G.S. and Tawa C.L. 1994. Shorthorn cattle of West and Central Africa. I.Origin, distribution, classification and population statistics. World Animal Review 78(1):2–13.
SFSP–GTZ–MoFA (Ministry of Food and Agriculture). 1998. Survey of milk production in theTechiman District of Brong Ahafo region. Paper presented at the SFSP–GTZ–MoFA workshopin co-operation with the Dairy Science Unit, Animal Science Department, Kwame NkrumahUniversity of Science and Technology, Kumasi held at Sunyani, Ghana, October 1998.
VSD (Veterinary Services Department). 1997. Annual report of the Veterinary Services Department,
Ghana. Ministry of Food and Agriculture, Accra, Ghana. 17 pp.
224 South–South Workshop
Otchere and Okantah
Theme 1: Country papers and regionaloverviewsPlenary discussionAfter the presentation of the regional overview papers, participants raised issues that affect
the opportunities for smallholder dairy development. Other concerns related to the
perceptions of policy makers and of development agencies to dairy as a contributor to the
sustainable improvement of rural and peri-urban livelihoods.
These issues and concerns were:
1. The presentations did not emphasise several issues that affect smallholders in the
developing world:
• the role, relevance and importance of smallholders to agriculture and their
contribution to national economies
• there are major constraints to smallholder production including:
– the absence of, or the difficulty of accessing, credit facilities
– livestock diseases (such as foot-and-mouth), especially those affecting trade
– the overwhelming presence of government in service delivery resulting in inefficient
services (such as the delivery of artificial insemination)
– recurring deficits of feeds and fodder
• the threats to these constraints represent for smallholder livelihoods and
• the risk aversion strategies practised by smallholders.
2. Low productivity of dairy systems is common to countries of the South. How can this be
improved in a sustainable manner (considering resources and constraints) through
consensus between farmers and policy makers?
3. Milk is not the only product a smallholder dairy producer gets from his/her buffalo,
camels, cattle, sheep and goats.
4. There is no common definition of a smallholder:
• they can be defined by farming system
• the number of cows should be considered (rather than just land area), otherwise
landless dairy producers will be excluded
• other descriptors may be important: individual; illiterate; subsistence; poor;
• the definitions must take into account country differences.
5. The availability of credit may not be an issue in some countries, but the type of credit (its
suitability for smallholders) might be.
6. The North is pushing for free trade but subsidising its producers. Until subsidies are
removed, competitiveness cannot be estimated realistically.
South–South Workshop 225
7. National policies in some countries are in conflict with smallholders’ interests. For
example, in many countries, especially in South Asia and South-East Asia, national
policies tend to support imports of dairy products, but not local production.
8. National and smallholder agenda should not be separate and need to be considered
together in the context of the World Trade Organization (WTO) agreements.
These and the related issues raised during the plenary discussions following the
presentations in themes 2 and 3 were subsequently discussed in small groups of workshop
participants.
The outcomes for theme 1 are given below.
Group discussionIn common with the other theme groups, the group discussion of theme 1 was structured
around a set of questions. These addressed issues affecting the adoption and productivity of
smallholder dairying at the farm and national levels.
The questions discussed by the group were:
1. Are the production objectives of smallholder dairy farmers driven by minimising risks
and the use of external inputs? If so, how will that influence approaches to increasing
productivity (or should it be reducing risks)?
2. What factors are driving the intensification of smallholder agriculture? How can
dairying contribute and what will determine its success?
3. Is disease risk a major biological factor limiting the adoption and productivity of
smallholder dairy in our regions? If so, how can current research programmes draw more
effectively upon the expertise in the South to address smallholders’ needs for improved
disease control practices?
4. When and where will productivity rather than herd increases be important to dairy
development and why, and what differences in research and development (R&D)
approaches will be required?
The group’s responses were described as follows.
How does risk aversion influence approaches to increasingproductivity?
Farmers tend to avoid adopting (new) productivity-enhancing technology unless there are
mechanisms to accommodate risks and uncertainties in input and output markets. We
need to devise approaches with farmers who are considering adopting new technologies by
taking into account farmers’ perceptions, and the risk-bearing and risk-avoidance
mechanisms that exist in society.
Socio-economic factors must be considered in all these approaches. Farmers’ participation
in the selection of technologies is important for successful adoption.
226 South–South Workshop
Country papers and regional overviews

Type of risk Approach
Technical risks (yield,variability, mortality)
• Appropriate breed selection
• Feed availability
• Veterinary services
Market risk • Cooperative approach (fair prices, supply of inputs,collective bargaining power)
Financial risk • Type of credits (in-kind, low interest, SACCOS)
• Group lending, micro-credit—Grameen Bank approach
Management risks • Training in specific skills
• Demonstration
• Extension services
How can dairying contribute to the intensification of smallholderagriculture?
• Contribution of livestock/dairy to national GDP needs to be assessed.
• Contribution of livestock/dairy to household income, employment, food security to be
assessed/defined.
• Understanding crop/livestock integration/interaction in systems across the countries
of the South and identifying livestock-friendly cropping systems.
Consider contributions in terms of:
– Draft power
– Manure and fibre
– Household liquidity
– Asset build-up
• Maximising efficiency of nutrient flows within the dairy farm
– Minimising use of external input (fertilisers, feeds/fodders).
– Support to other farm activities (economic integration), e.g. manure for horticultural
crops.
How can research expertise on livestock diseases in the Southcontribute to improved disease control practices for smallholders?
Observation: Livestock disease is a major risk faced by smallholders
• Results on disease control to be shared among countries in the South (e.g. Theileria
vaccine, improved FMD vaccine etc.).
• Consider the influence of genotype × nutrition × disease interactions—for specific
locations, countries, livestock species — and exchange the information.
• Importance of recognising genetic resistance to disease and its utilisation and preservation
through crossbreeding and selection. Sharing of such information is important.
• Identify diseases common in the South that cause heavy economic losses, e.g. mastitis,
brucellosis, and FMD, and exchange the information.
South–South Workshop 227
Country papers and regional overviews

• Alternative animal health care delivery systems wherever co-operative systems do not
exist (informal farmers’ groups, user groups, any other village forum, use of village-based
animal health workers or para-vets where vets do not exist).
• Co-operation on the creation of disease-free zones across borders is crucial for the
control of contagious diseases.
When and where will increases in herd size or productivity beimportant?
• Depends on type of farming system and location of the country.
• No uniform approach is desirable or possible.
• It should take into account social and economic factors appropriate for the country to
the farming system in question.
• Factors like availability of agricultural land, crop residues, employment implications etc.
are the usual determinants of herd size or the productivity debate.
• Short-cut methods to genetic improvement through selection, e.g. use of open nucleus
breeding as against progeny testing programmes, which require a lot of resources.
• Additional inputs have to be considered before deciding on intensification or extensive
(large herd size) production systems: cost of labour, land, feed resources and genotype of
the animal.
After the plenary presentation of the outcomes of the group discussion, these additional
points were stressed:
• Intensification of dairying (and its reverse) depends on the price and availability of
labour and not of land.
• Herd size will generally match the availability of agricultural by-products.
• Need to understand farmers’ preferences and perceptions before proceeding in terms of
risk management.
ConclusionsThe presentations, the supporting country and regional papers and their discussion highlighted
the complexity of smallholder dairy systems in countries of the South and the multiple and
interacting factors affecting their contributions to the livelihoods of dairy producers and traders
and influencing the satisfaction of consumers of milk and dairy products. Yet, at the same time,
it was clear that many of the issues related to smallholder dairy production and marketing
systems are shared by many of the countries in the South and that there were many promising
opportunities for effective collaboration to address issues of common interest.
228 South–South Workshop
Country papers and regional overviews

Theme 2: Implications ofinternational trade regulations forsmallholder dairy production and
marketing
Implications of international traderegulations (World Trade Organizationagreement on agriculture and CodexStandards) for smallholder dairydevelopmentV.P. Sharma
Indian Institute of Management, Ahmedabad 380 015, India
IntroductionThe past few decades have seen much progress towards trade liberalisation around the
world. However, trade liberalisation in the agricultural sector has been more difficult as
many governments continue to implement restrictive trade policies. In the 1990s, the
Uruguay Round of the General Agreement on Trade and Tariffs (GATT) made some
progress towards liberalising the world agricultural markets. One of the agricultural sectors
most affected by trade restrictions has been the dairy sector. For example, for several
decades, the European Union (EU), Japan, Canada and the United States of America all
have had extensive tariffs and quotas related to dairy trade. As reported by the Organization
for Economic Co-operation and Development (OECD 1999a), the 1996–98 average
measure of member countries’ producer support estimates (PSEs) for dairy is highest for all
the commodities reported in absolute terms (US$ 49 billion) and second only to rice as a
percentage of gross value of production (52%). Among the consumer support estimates, the
OECD ranks milk first again in absolute terms (US$ 37 billion) and third as percentage of
consumer expenditures (47%). According to the OECD (1999b), the EU was the largest
exporter of cheese and second in butter exports only to New Zealand during 1993–97.
These export levels occurred because of the large export subsidies. The 1996–97 World
Trade Organization (WTO) notification data reveal that 82% of the EU cheese exports,
100% of butter and 99% of skim milk powder (SMP) were subsidised. By 2000, when the
Uruguay Round Agreement on Agriculture (URAA) provisions are fully implemented for
developed countries, it is estimated that almost 60% of world dairy trade will still be
exported with subsidies (US Dairy Export Council 1998). The volume of EU exports
subsidised as a percentage of total—i.e. both subsidised and unsubsidised—exports averaged
more than 80% for coarse grains, rice, butter, SMP, cheese and other milk products (USDA,
ERS 1999). Market access provisions allow for tariff rate quotas (TRQs) with prohibitively
high rates of over-quota duty (as high as 300%). Thus, even after full implementation, world
dairy markets will continue to be characterised by highly subsidised exports, limited market
South–South Workshop 231
access and heavy government interventions. This raises questions about the effects of trade
liberalisation on the world dairy markets.
The objective of this case study is to investigate how trade liberalisation is likely to affect
the welfare of small-scale producers and consumers and dairy prices in various developing
countries with special focus on India. The following section reviews trade policies of the dairy
sector and explores the possibility and likely effects of various policy changes under the WTO
for the dairy sector. The Sanitary and Phytosanitary (SPS) and Technical Barriers to Trade
(TBT) Agreements are presented next, focusing on those provisions that are relevant for the
dairy sector. Global competitiveness of the Indian dairy industry is analysed briefly. Finally,
conclusions and policy implications of the study are presented in the last section.
Trade policy and the WTOGovernment policies typically generate various trade distortions that imply departure from
competitive market equilibrium. They include import policies and domestic agricultural
policies, as well as export policies.
Import policiesImport policies consist of tariff and non-tariff barriers, usually designed to discourage
imports. These include import quotas, minimum import prices, discretionary import
licensing etc. While tariff barriers have an indirect impact on import volumes (through their
price effects), most non-tariff barriers restrict trade by affecting import volumes directly.
In the URAA, countries agreed to open markets by prohibiting non-tariff barriers,
converting non-tariff barriers to tariffs and reducing tariffs over a period of 6 years by a
simple unweighted average of 36% with a minimum rate of reduction of 15% for each tariff
line for developed countries. For developing countries, the reduction is 24% on average
and a minimum of 10% per tariff line over 10 years. Countries were obligated to provide a
minimum level of import opportunities for products that were previously protected by
non-tariff barriers (3–5% for developed, 1–4% for developing and current access
maintained by all countries), by establishing tariff rate quotas (TRQs). This import system
established a quota and a two-tiered tariff regime for affected commodities. A lower tariff
applies to imports within the quota, while a higher tariff applies to imports exceeding the
quota. Overall, 36 countries, including 14 OECD members, scheduled more than 1300
TRQs, of which 183 are for dairy products.
Several concerns associated with the TRQ regime have arisen during the
implementation of URAA. These are important for world dairy markets and bear
implications for upcoming negotiations. The average fill rate for notified dairy products in
OECD countries in 1997 was 62%, which is similar to the level of the previous 2 years.
However, relying on the fill rate as an indicator of market access has limitations. First,
notification is not uniform across countries. Some countries notify imports up to the TRQ
level only, while others report all imports. Conversely, some countries report the volume
232 South–South Workshop
Sharma

under the licenses issued, rather than actual imports. Another problem with the average fill
rate is that it gives equal weight to all TRQs, irrespective of trade volume. For example, Japan
has two scheduled SMP categories, with fill rates of 56 and 46%, resulting in an average fill
rate of 50% for SMP. Yet with corresponding TRQs of about 7 thousand and 86 thousand
tonnes, the average fill rate as conventionally calculated overestimates market access in this
case. The broad product classification for TRQs allowed under the URAA has prevented
opening up minimum access in some subproducts within this broad product category.
Some countries calculated the quota at a broad level of product aggregation, such as dairy
products, and then allocated the total TRQ rather arbitrarily among subproducts,
minimising trade in import-sensitive commodities. In the process, the countries chose those
types of products where additional imports would hurt less. These were sometimes those
products produced at low levels in the country, or product categories for which the
countries had preferential import conditions. For instance, Japan’s schedule of 12 dairy
TRQs consists of 95 tariff lines. The 8 dairy TRQs in the US schedule contain 96 lines,
while Canada’s 11 TRQs have 32 lines and the EU’s 12 dairy TRQs have 57 lines. The
countries calculated the quota quantity required under the minimum access commitments
for the whole aggregate of dairy products and then allocated this quantity to individual types
of dairy products in a more disaggregated level.
Dairy markets in many developed countries are highly protected. For example, US dairy
markets are protected by Section 22 of the Agricultural Adjustment Act of 1933, as
amended, which prevents dairy imports from interfering with the USDA’s dairy price
support programme. The Section 22 import quotas have contributed to keeping US dairy
product prices substantially above world prices. For example, during 1992 and 1993, US
prices for SMP, cheese and butter were on average 50, 51 and 21% higher, respectively, than
world prices for these products (Dobson and Cropp 1995). The relationship was similar
during the post-WTO period, when SMP, cheese and butter prices were significantly higher
than world prices (Sharma and Sharma 2000).
The requirement for developed countries to reduce tariffs by 36% by the end of the
implementation period is unlikely to have major impact on protection levels. This is for two
major reasons. First, the base period, 1986–88, was a period of very low world market prices
for a number of important agricultural commodities compared with longer run averages
and relative to more recent prices. This indicates that when tariff equivalents in the base
period were calculated, they were automatically high compared with a more representative
period. Second, as the calculation of tariff equivalents for existing non-tariff barriers was left
to the countries concerned, most countries were guilty of ‘dirty tariffication’, that is the
newly calculated base-level tariffs provided even higher protection than the non-tariff
barriers they replaced in the base period. According to an estimate presented by Hathaway
and Ingco (1995), some EU tariffs and the US tariffs contain considerable ‘dirt’ and this
‘dirty tariffication’ appears to have occurred in the sensitive commodities such as dairy and
fishery products. The extent of ‘dirt’ in tariffication varied widely among countries and
commodities—the magnitude appears to be largest in the EU and European Free Trade
Association (EFTA) (Ingco 1995).
Looking at individual import markets and products within the dairy sector, it appears
that in the developed countries the bound tariffs are normally over 100% and as high as
South–South Workshop 233
Implications of international trade regulations for smallholder dairy development

370% for yoghurt in Japan and 300% for butter in Canada. In contrast, the tariffs are as low
as zero and do not exceed 65% in developing countries (Sharma 2000). Therefore, while
supposedly opening up barriers, tariffication in effect increased the protection of the EU
and US markets by significant amounts.
To determine whether tariff reductions under the URAA will lead to increased market
access and generate pressure for policy changes in the developed countries, it is necessary to
examine the extent to which there is ‘water’ in the tariffs for agricultural products. A ‘watery’
tariff is one that is greater than needed to bridge the gap between the domestic and world
market price. This is important because lowering the tariff will not increase market access
until the tariff equals the percentage gap between domestic and world price. A comparison
of EU tariff equivalents with applied tariffs during 1995–97 (Figure 1) reveals a substantial
margin of ‘water’ in the EU’s tariffs for dairy and meat products. Between 1995 and 1997,
the EU’s tariffs were very ‘watery’ for SMP and butter. For SMP, this stems from a small
price gap (tariff equivalent) and high tariffs, whereas for butter, although the price gap was
large, the applied tariffs were in excess of 130% between 1995 and 1997.
In many developed countries, tariffs have not been set in ad valorem terms but as specific
tariffs, which has important implications for the transmission of world price changes to the
domestic market. The specific tariff, in addition to protecting the level of domestic price (as
an ad valorem tariff does), also reduces the degree of transmission of changes in the world
market to the domestic market. The level of protection of non-ad valorem varies inversely
with import price—a decline in import price yields an increase in the level of protection and
vice versa. Given that non-ad valorem tariffs tend to be less transparent than ad valorem tariffs,
it is not surprising that countries would apply this form of tariff to their most highly
protected products.
234 South–South Workshop
Sharma
0
20
40
60
80
100
120
140
Butter SMP Eggs Chicken
meat
Turkey meat Pork
% ad valorem
Tarriff equivalent Water
Source: USDA, ERS (1999).
Figure 1. ‘Water’ in the EU tariffs for selected commodities, 1995–97.
Under the URAA, countries had a great deal of flexibility in deciding how much each
agricultural tariff would be cut, so average reductions vary by country. The required
unweighted average of 36% tariff reductions with the only constraint being a 15% cut on
each tariff, left countries with much freedom to decide how to allocate their tariff
reductions. Countries tended to reduce low tariffs by significant amounts, while reducing
only slightly the existing high tariffs if the product was of trade importance. The smallest
cuts tended to be made on over-quota tariffs of products protected by TRQs. Included in
this category for Canada are dairy and poultry products; for Japan, grain and dairy products;
and for the US, sugar, peanuts and dairy products. Not only were these tariffs reduced by
significantly smaller amounts than other tariffs but also they tended to be higher to begin
with. This practice allowed countries to reduce tariffs on commodities that did not compete
with domestic production, while keeping high tariffs on products more sensitive to
competition.
An important set of issues in implementing the market access provisions under the
URAA relates to special safeguard provision (SSG), which may be used for products which
have undergone tariffication (Article 5 of the URAA). This provision comes in two forms: a
‘price triggered’ and a ‘quantity triggered’ provision. In the quantity triggered form of SSG,
an additional duty can be imposed if imports exceed their average ‘during the preceding
three years for which data are available’ by no more than 5%. Under the price triggered form
of the SSG, an additional duty can be imposed if the c.i.f. (cost, insurance and freight)
import price of the shipment concerned falls below 90% of the 1986–88 average reference
price (‘trigger price’). The more the c.i.f. price falls below that trigger price, the higher the
additional duty can be in accordance with a precise schedule included in the URAA.
Sometimes even quantity and/or trigger prices were manipulated so that countries could
more easily use SSG provisions. However, presently access to the SSG provisions is not
universal and only 38 members have reserved the right in their schedule to apply the SSG.
According to an estimate by Konandreas (1999), during the 1995–98 period there have
been 200 instances when the SSG has been used (72 price triggered and 128 quantity
triggered). Out of these, 35 were dairy products (15 price triggered and 20 quantity
triggered), which amounts to about 18% of the total cases. Thus the use of SSG is higher in
dairy than in other products.
Export policiesExport policies include both export restrictions and export promotion instruments. While
most export policies were associated with food aid in earlier years, export promotion
policies (mainly export subsidies) have become dominant features of the current world
situation. These policies directly or indirectly influence world markets. Typically the prices
in the world markets become more volatile under these policies. For instance, the EU uses
world markets as a means of surplus disposal policies. Without price support and surplus
disposal policies, both the EU markets and the world markets would absorb a supply shock.
But with these policies, the shock is entirely absorbed by world markets. Thus dairy export
policy in the EU and the US increases fluctuations of world markets.
South–South Workshop 235
Implications of international trade regulations for smallholder dairy development
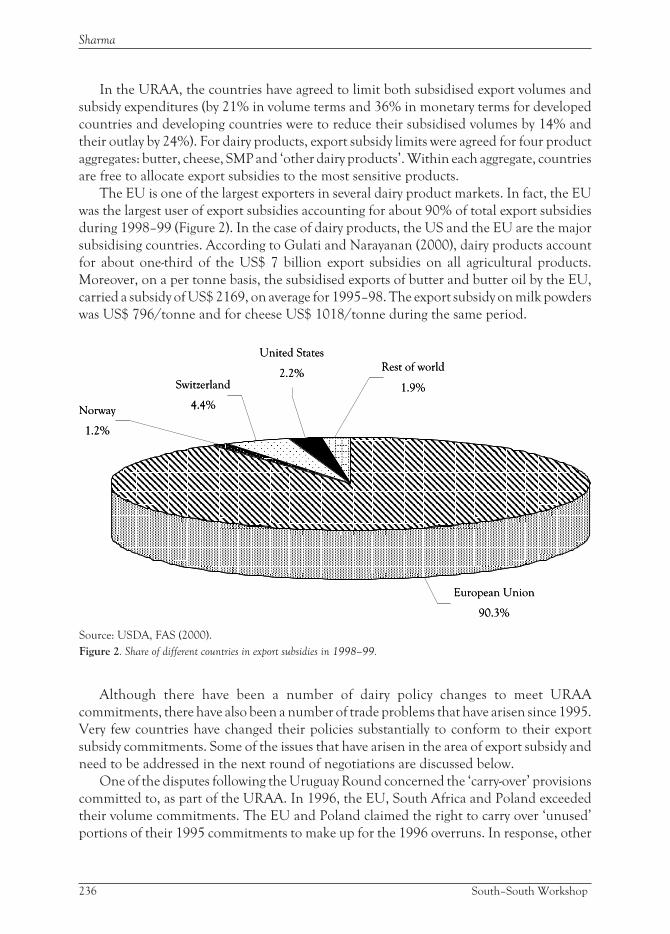
In the URAA, the countries have agreed to limit both subsidised export volumes and
subsidy expenditures (by 21% in volume terms and 36% in monetary terms for developed
countries and developing countries were to reduce their subsidised volumes by 14% and
their outlay by 24%). For dairy products, export subsidy limits were agreed for four product
aggregates: butter, cheese, SMP and ‘other dairy products’. Within each aggregate, countries
are free to allocate export subsidies to the most sensitive products.
The EU is one of the largest exporters in several dairy product markets. In fact, the EU
was the largest user of export subsidies accounting for about 90% of total export subsidies
during 1998–99 (Figure 2). In the case of dairy products, the US and the EU are the major
subsidising countries. According to Gulati and Narayanan (2000), dairy products account
for about one-third of the US$ 7 billion export subsidies on all agricultural products.
Moreover, on a per tonne basis, the subsidised exports of butter and butter oil by the EU,
carried a subsidy of US$ 2169, on average for 1995–98. The export subsidy on milk powders
was US$ 796/tonne and for cheese US$ 1018/tonne during the same period.
Although there have been a number of dairy policy changes to meet URAA
commitments, there have also been a number of trade problems that have arisen since 1995.
Very few countries have changed their policies substantially to conform to their export
subsidy commitments. Some of the issues that have arisen in the area of export subsidy and
need to be addressed in the next round of negotiations are discussed below.
One of the disputes following the Uruguay Round concerned the ‘carry-over’ provisions
committed to, as part of the URAA. In 1996, the EU, South Africa and Poland exceeded
their volume commitments. The EU and Poland claimed the right to carry over ‘unused’
portions of their 1995 commitments to make up for the 1996 overruns. In response, other
236 South–South Workshop
Sharma
European Union
90.3%
Switzerland
4.4%
United States
2.2%
Norway
1.2%
Rest of world
1.9%
European Union
90.3%
Switzerland
4.4%
United States
2.2%
Norway
1.2%
Rest of world
1.9%
Source: USDA, FAS (2000).
Figure 2. Share of different countries in export subsidies in 1998–99.

countries argued that flexibility in provisions in the agreement were meant only to allow a
country to pay back when it exceeded its limits, not as an opportunity for countries to ‘bank’
unused subsidies.
Countries can also easily modify the form of their support, as there is sufficient room for
shifting subsidy from one component to others. Countries can substitute their export
subsidies to output-related deficiency payments, which are allowed in the blue box.1 For
example, the US in its 1996 Farm Act has re-targeted funds previously dedicated to export
subsidies to market promotions. It has now expanded its Export Credit Guarantee
Programmes, where commercial credit is extended to finance agricultural export sales to low
or middle-income countries. These programmes are covered under the green box2 policies
and are allowable without limits under the URAA. Similarly, the EU and Canada instituted
export-marketing policies that allow them to circumvent their subsidy commitments.
As with other provisions, export commitments are expressed in terms of aggregate within
certain product groupings. Countries are able to maintain barriers by concentrating their
export subsidies on those few key products most important to the economy. For example, the
EU is most reliant on subsidies for dairy products, bovine meats, poultry and fresh fruits and
vegetables. The US and New Zealand had challenged Canada’s milk pricing policy through
the WTO Dispute Settlement mechanism. The allegation was that export subsidies are
generated when milk for use in export products were sold in Canada at lower prices than
would be obtained if the dairy products were sold on the domestic market. The WTO panel
ruled in March 1999 that Canada was effectively subsidising the export of milk products
through its use of ‘special milk class’ pricing, whereby certain dairy exports are undertaken
with milk priced lower than is available for otherwise similar domestic milk products.
The base period (1986–90) from which reductions in export subsidies were negotiated,
were periods of historically high levels of subsidies in most of the countries. A number of
countries have also taken advantage of what is known as the ‘front-loading’ option, where
they could use the 1991–92 period as the starting point for the export subsidy reduction
rather than 1986–90. The amounts of subsidised exports, which can be exported by both
the US and the EU during the implementation period are significantly increased if the
1991–92 base is used for commodities and this flexibility in starting point has reduced the
impact of export subsidy reductions.
The above results indicate clearly that so far very few countries have changed their
policies substantially to conform to their export subsidy commitments. The EU and the US,
by far the largest exporters of subsidised commodities, continue to rely on subsidies to
bridge the gap between high domestic support prices and lower world prices. High base
South–South Workshop 237
Implications of international trade regulations for smallholder dairy development
1. The blue box has resulted from the Blair House agreement between the USA and the EU, and was agreed toaccommodate EU compensation payments and US deficiency payments. The direct payments legitimateunder the blue box come in several forms: payments made on fixed areas and yields, payments made on85% or less of the base level of production, livestock payments made on a fixed number of head (in beefsector, compensatory payments are made on the basis of a maximum stocking rate per hectare).
2. Green box policies need to meet a number of criteria, specified in Annex 2 of the Agreement onAgriculture. Green box policies include expenditure on government service programmes like research, pestand disease control, training services, extension and advisory services, marketing and promotion services,infrastructure and environmental services, public stockholding for food security purposes, domestic foodaid, natural disasters etc.
levels, from which cuts were required, have permitted most countries to accommodate
required reductions under their current policies. The countries appear to have
implemented policies that allow them to circumvent those commitments and undermine
the substantial export subsidy disciplines of URAA.
Domestic policiesDomestic agricultural policies can have a sizeable effect on agricultural trade. These policies
include subsidising production or consumption, production control, price support and
price discrimination schemes. Production, consumption and storage subsidies are
commonly used instruments in dairy policies around the world. For example, the EU has
production subsidies for casein (to absorb surplus SMP) and storage subsidies for butter.
The EU also subsidises dairy consumption in SMP for animal feeding. A production
subsidy shifts the supply curve down, while a consumption subsidy shifts demand upwards.
This influences both prices and quantities in the country affected, as well as world markets if
the country is involved in international trade.
Some limitations on domestic support were thought to be essential for the successful
achievement of WTO’s trade goals aimed at establishment of ‘a fair and market oriented
agricultural trading system… and correcting and preventing restrictions and distortions in
world agricultural markets’. The provisions in the URAA put controls over many
trade-distorting domestic policies used to support farm prices and incomes (trade-distorting
domestic support measures to be reduced by 20% by developed and 13.3% by developing
countries). Other domestic policies were exempt from any controls.
The URAA classifies supports into several categories—those that are acceptable because
they are minimally trade distorting and those that are not acceptable as they are obviously
trade distorting; those that have ceiling levels and those which do not have ceiling levels. In
the final agreement, domestic policies deemed to have the largest effect on production and
trade, (amber box policies) are to be disciplined by requiring limitations or gradual
reductions in related support levels. Policies presumed to have the least effect (no more than
‘minimal trade-distorting effects’) on production and trade (green box policies) are exempt
from any disciplines.
Domestic support is disciplined through the use of an Aggregate Measure of Support
(AMS)3 calculated for each product but committed for reduction in terms of total for all
commodities. Due to broad aggregation of commitments under the Uruguay Round, this is
an area where there has been limited substantive gain over the past five years. Some of the
issues that have arisen in the domestic support area are discussed below.
Generally the interventions in developed countries have taken the form of policies to
support the incomes of the producers and shield them from impact of price variability in
international markets. The incidence of these protective policies has been highest in
238 South–South Workshop
Sharma
3. AMS is an index, which measures the supports considered to production and trade distorting under theWTO. Three elements are included in the AMS calculations: (i) market price support (to be calculated onthe basis of the gap between the world market price and the domestic administered price multiplied by thequantity of production eligible to receive that administered price); (ii) non-exempt direct payments; and(iii) other subsidies not exempted from reduction commitment.

developed countries including the EU, Japan, the US and Switzerland. In the case of milk,
Japan, the EU, Canada and the US have a very high level of protection, while Australia and
New Zealand have relatively low protection (Figure 3). The 1996–98 OECD average milk
nominal assistance coefficients (NAC) were 2.08 for producers and 1.92 for consumers, so
the gross value of farm receipts and the value of consumer expenditure were each about
twice what the same quantities would have been worth at world prices. The PSEs for dairy
were 58% in 1998 (marginally lower than 59% in 1986–88) compared with 37% for all
commodities (down from 41% in 1986–88).
The domestic support provision seems to legitimise the types of subsidies provided by
developed countries, while placing ceilings and reduction commitments on those subsidies
developing countries tend to provide. Furthermore, the developed countries have an added
advantage as they have traditionally provided high subsidies and are only called upon to
reduce them. Developing countries, however, have not traditionally provided subsidies (or
only in minimal amounts) and are not permitted to introduce or increase their subsidies.
Under the domestic support provisions of the URAA, governments can continue assisting
their agricultural sectors and rural economies through those programmes presumed to have
the smallest effects on production and trade—the ‘green box’ policies. These include
domestic food aid, certain types of income support, research, inspection, natural disaster
relief and other programmes like crop insurance, environmental programmes and rural
assistance.
In the original WTO agreement, 26 countries made commitments to reduce domestic
support. The EU, Japan and the US are by far the largest providers of amber support in
absolute terms, accounting for about 90% of total AMS for the 24 countries that had
reported an AMS as of June 1998. An analysis of these notifications shows that all countries
South–South Workshop 239
Implications of international trade regulations for smallholder dairy development
0
10
20
30
40
50
60
70
80
90
Japan Canada European
Union
United
States
Mexico Australia New
Zealand
OECD
%
Source: OECD (1998).
Figure 3. Producer subsidy equivalents (PSEs) for milk in selected OECD countries, 1995–97.
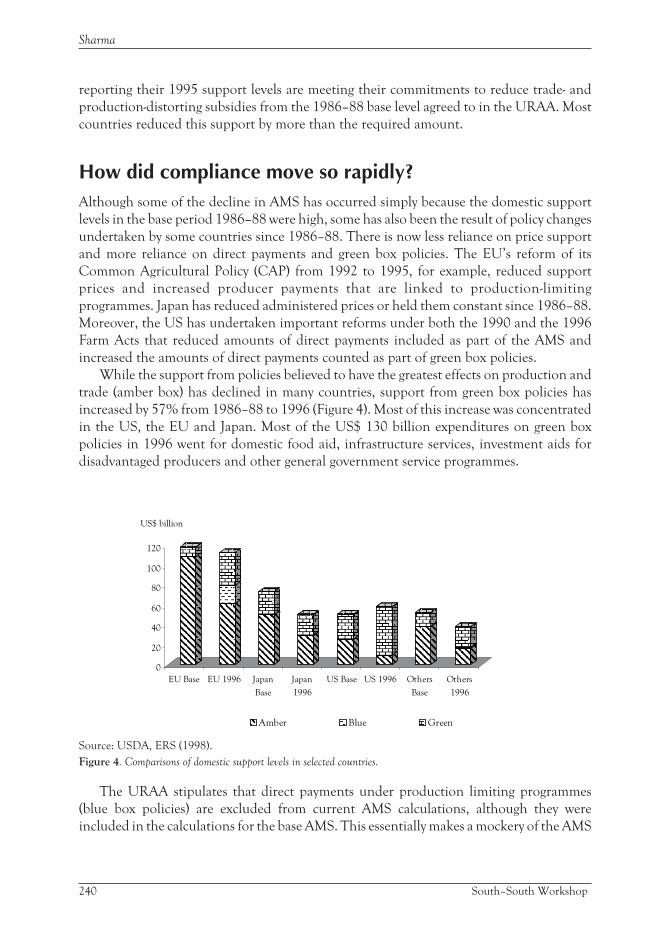
reporting their 1995 support levels are meeting their commitments to reduce trade- and
production-distorting subsidies from the 1986–88 base level agreed to in the URAA. Most
countries reduced this support by more than the required amount.
How did compliance move so rapidly?Although some of the decline in AMS has occurred simply because the domestic support
levels in the base period 1986–88 were high, some has also been the result of policy changes
undertaken by some countries since 1986–88. There is now less reliance on price support
and more reliance on direct payments and green box policies. The EU’s reform of its
Common Agricultural Policy (CAP) from 1992 to 1995, for example, reduced support
prices and increased producer payments that are linked to production-limiting
programmes. Japan has reduced administered prices or held them constant since 1986–88.
Moreover, the US has undertaken important reforms under both the 1990 and the 1996
Farm Acts that reduced amounts of direct payments included as part of the AMS and
increased the amounts of direct payments counted as part of green box policies.
While the support from policies believed to have the greatest effects on production and
trade (amber box) has declined in many countries, support from green box policies has
increased by 57% from 1986–88 to 1996 (Figure 4). Most of this increase was concentrated
in the US, the EU and Japan. Most of the US$ 130 billion expenditures on green box
policies in 1996 went for domestic food aid, infrastructure services, investment aids for
disadvantaged producers and other general government service programmes.
The URAA stipulates that direct payments under production limiting programmes
(blue box policies) are excluded from current AMS calculations, although they were
included in the calculations for the base AMS. This essentially makes a mockery of the AMS
240 South–South Workshop
Sharma
0
20
40
60
80
100
120
EU Base EU 1996 Japan
Base
Japan
1996
US Base US 1996 Others
Base
Others
1996
US$ billion
Amber Blue Green
Source: USDA, ERS (1998).
Figure 4. Comparisons of domestic support levels in selected countries.

reduction commitments by the developed countries. Similarly, the exemption of the EU’s
area compensation and headage payments from their current AMS calculation has a
significant effect on current AMS. Therefore, most of the developed countries needed no
real change or reduction in their domestic support subsidies to fulfil their AMS reduction
commitments.
By stipulating that the AMS reductions are not product specific, but sector wide,
measured in terms of total AMS, countries have been able to shift support among different
products. In the case of the EU, this has involved changing the composition of assistance to
less sensitive products like cereals and oilseeds while assistance is maintained or increased
for some other commodities like dairy products, sugar and beef in fulfilling AMS
commitment.
Experience so far shows that AMS has not been binding for any country and most of the
developed countries have already achieved all the required reductions in domestic support
in one way or another. Hence, their domestic support commitments will not act as a direct
constraint on agricultural policies for the immediate future.
Impact of the URAA on international prices ofdairy productsIt was expected that lower exports of subsidised dairy products by the EU and USA would
increase world market prices. Estimates of the impact of the WTO Agreement on world
prices for dairy products ranged from a 4% increase in butter to an increase of about 20%
for cheese (Andrews et al. 1994). However, the world prices of major dairy products in
general showed a gradual decline (ranging from a decrease of 3.89% for cheese to about
11% in case of SMP) in the post-WTO period (Sharma and Sharma 2000).
For SMP, prices declined from US$ 2150/t (FOB New Zealand = the mid-point of
export price reported by the New Zealand Dairy Board) in July 1995 to a low of around
US$ 1225/t in June–July 1999. The SMP prices recovered during the last half of 1999,
rose from around US$ 1225/t to over US$ 1475/t FOB New Zealand in the span of 6
months (June–December 1999) (FAO 2000). The increase in import demand was the
main driving force for moving prices up. However, SMP market prices in USA and the EU
were about one-and-a-half times higher than the world market prices, which shows the
presence of high export subsidies. In case of whole milk powder (WMP), the international
market prices continued to decline in the post-WTO period. The WMP prices declined
from about US$ 2250/t in the first half of 1995 to as low as US$ 1425/t in May–October
1999. However, WMP prices also increased towards the end of 1999, rising about 5% to
US$ 1500/t in December 1999. International prices appear to be following a slowly
upward trend, but remain well below the pre-WTO period of around US$ 2100/t level.
Demand for WMP, like SMP, appears to have strengthened this year following the
economic recovery in Asia.
Butter prices, which had maintained their level better than other dairy products in
1998, fell sharply in the last half of 1999 reaching a level of US$ 1225/t. Much of the down
South–South Workshop 241
Implications of international trade regulations for smallholder dairy development

turn has occurred recently, as demand from Russia (the main market for butter, which
traditionally imports most of its butter requirements between December and February) has
failed to materialise. World butter prices declined from US$ 2000/t FOB New Zealand in
January 1996 to a level of about US$ 1225/t during August–December 1999. This year,
Russian imports are expected to again decline and for this reason, any recovery in butter
prices in the near future is doubtful. The world cheddar cheese prices also showed a
declining trend in the post-WTO period. The EU has become the price setter for
international trade in dairy products. One reason for this was the devaluation of the Euro
against the US dollar. In addition, the EU has been aggressive in raising export subsidies on
milk products to enhance competitiveness. The US also pays heavy export subsidies for
different milk products under the Dairy Export Incentive Programme (DEIP); these
subsidies distort and depress international prices.
Sanitary and technical regulationsSanitary and technical regulations and the administrative procedures such as inspection,
certification and product requirements raise important trade issues. Surveys by the
European Commission’s Trade Directorate and the Office of the US Trade Representative
show that numerous domestic regulations impede imports, including those in the dairy
sector, in almost all countries (OECD 1999c). Regulatory issues are likely to become
increasingly important as tariffs on dairy products fall. This section provides information on
the international arrangements dealing with non-tariff issues, focusing on those relevant for
the dairy sector.
A major accomplishment of the Uruguay Round has been the introduction of new rules
for solving disputes, through the WTO’s Dispute Settlement Body. The WTO now tackles
non-tariff barriers through the Sanitary and Phytosanitary (SPS) agreement and a
strengthened Technical Barriers to Trade (TBT) agreement. It gives more importance to
international bodies, such as the Codex Alimentarius—an international code of standards
for human health protection and fair practices under the Food and Agriculture
Organization of the United Nations (FAO) and the World Health Organization (WHO)
–the Office International des Epizooties (animal health) and organisations operating in the
framework of International Plant Protection Convention. Dispute settlement involves
well-defined procedures of notifications, the calling of a panel when necessary and possibly
of an appellate body. However, debates and decisions within the Codex Alimentarius, for
example, have become more controversial.
The Sanitary and Phytosanitary (SPS) AgreementThe more specific SPS agreement was crafted to authorise only those domestic measures
based on an objective risk analysis and to reject those that constituted a ‘disguised trade
restriction’. The SPS agreement covers health risks (food safety) arising from additives,
contaminants, toxins and pathogens contained in food products. The agreement recognises
242 South–South Workshop
Sharma
the right of governments to restrict trade to protect human, animal or plant health, but such
measures must be transparent and consistent. There must be equal treatment for all nations
and between imports and domestic products. A central role is given to the principle of
equivalence. That is, a WTO member shall accept other countries’ SPS measures as
equivalent, even if they differ from its own, provided that the foreign measures achieve the
importing members an appropriate level of protection. Members’ measures that are based
on international standards are deemed to be in accordance with the SPS agreement.
Members may introduce or maintain SPS measures that result in a higher level of protection
than that achieved by the relevant international standards if there is a scientific justification,
or if it is a consequence of a level of SPS protection deemed appropriate by the member
based on an appropriate assessment of risks.
The WTO panels and appellate body rulings have repeatedly emphasised the need to
assess risks as stated in the SPS agreement (Article 5.1) and to conform to the need to
provide scientific evidence (Article 2.2). The SPS agreement states that countries are
entitled to determine the level of precaution they deem appropriate and that ‘in cases where
relevant scientific evidence is insufficient, a member may provisionally adopt sanitary or
phytosanitary measures on the basis of available pertinent information’ (Article 5.7). As a
general rule, the precautionary principle can not be invoked unless proper risk analysis is
first carried out. However, uncertainties persist about the nature and extent of the potential
risks that may be taken into consideration and on the interpretation of how long a
‘temporary’ measure can last.
The Technical Barriers to Trade (TBT) AgreementThe TBT agreement defines rules to assess the justification for domestic measures affecting
trade. The 1979 agreement was revised substantially during the Uruguay Round
negotiations. It states that a technical regulation (compulsory) or a standard (normally
implemented on a voluntary basis), as well as the enforcement procedures must be justified
by a ‘legitimate objective’ such as national security, safety for consumers or the
environment, animal and plant health, or fairness of trade. The agreement also seeks to
ensure that national measures are transparent and minimise restrictions on trade.
Compliance with relevant international standards is encouraged. The TBT agreement
covers all measures not covered by the SPS agreement. In terms of dairy products, the TBT
agreement covers packaging, composition and labelling as well as quality requirements, i.e.
production and processing methods as well as final product characteristics and nutritional
aspects.
However, the quickening pace of technological development and innovation in the
dairy sector makes it increasingly profitable to harmonise product definitions, packaging
and labelling requirements. WTO panel decisions have established the general principle
that international rules do not permit WTO members to restrict the imports of products on
the basis of how they are produced. The TBT agreement limits the scope of this principle by
accounting for processes and production methods, but the degree in which measures
referring to processes and production methods can be legitimate remains under debate.
South–South Workshop 243
Implications of international trade regulations for smallholder dairy development

National measures based on processes and production methods are more likely to be
admitted if the production method clearly affects the quality of the product. Scientific
considerations about nutritional and sanitary quality of new dairy products are therefore
likely to play an increased role in trade.
Competitiveness of the Indian dairy industryTo anticipate what might happen to Indian dairy product trade flows in the case of reduced
protection for the world dairy industry arising from the WTO, we must know how cost
competitive this industry is, in addition to knowing policy details and negotiating
arguments. The key question is: under more liberal trade, would India increase its imports
or exports?
This is an important and contentious issue, which can have a significant impact on the
welfare of millions of dairy farmers and the processing industry in India and abroad. This
section seeks to answer this question, by estimating different indicators of global
competitiveness and the impact of various factors on competitiveness of the Indian dairy
industry. Competitiveness is a complex term and can be defined in several ways ranging
from the domestic resource cost ratio concept to the competitive advantage concept
encompassing segmented markets, differentiated products, economies of scale and so on.
The nominal protection coefficient (NPC) is the most popular measure of global
competitiveness (Corden 1971; Balassa and Schydlowsky 1972; Gulati et al. 1990), which
is quite simple and easy to understand. The NPC of a commodity measures the ratio of
domestic prices relative to world prices. If the NPC is greater (less) than one then the
commodity under consideration is protected (taxed), compared with the situation that
would have prevailed under free trade. The NPC of different commodities are calculated
under two alternative hypotheses: (i) the importable hypothesis, when the foreign product
is an actual or potential substitute for the domestic commodity in the domestic market,
and (ii) the exportable hypothesis, where the domestic product is or potentially could be
exported to compete in foreign export markets. For the present study, NPCs were
computed under the importable hypothesis because India is not a major exporter of dairy
products, but will have to face the competition of highly subsidised imports.
The estimates of NPC based on mid-point of export price (FOB) reported by the New
Zealand Dairy Board (US$/tonne) under the importable hypothesis are presented in Table
1. The value of NPC for SMP was below unity in all the years except 1999, which reflected
marginal competitiveness during the period 1995 to 1998. In contrast, the values of NPC
for WMP and butter were above unity in all the years, which indicated either high domestic
prices or low international prices, hence non-competitiveness. However, these indices were
not steady from year to year—mainly due to variation in the world price of dairy products,
which is most volatile. During the period (1995–99) there was a downward trend in the
world prices of most dairy products due to large subsidies given by the EU and the US, while
there was no significant increase in the domestic prices. On average, the NPC of SMP was
lower than the NPCs for WMP and butter. These results of nominal protection indicators
244 South–South Workshop
Sharma
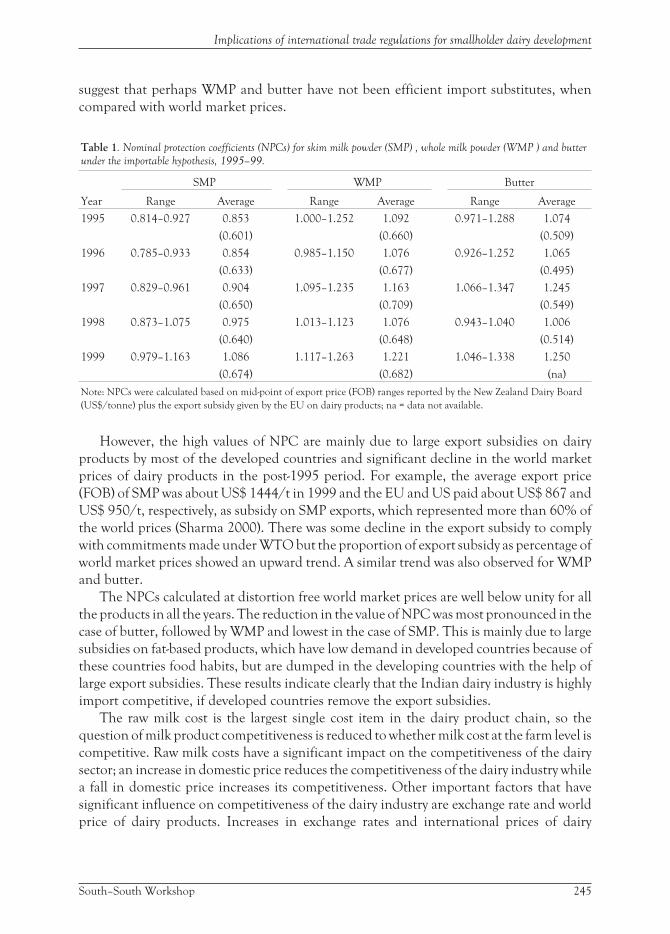
suggest that perhaps WMP and butter have not been efficient import substitutes, when
compared with world market prices.
Table 1. Nominal protection coefficients (NPCs) for skim milk powder (SMP) , whole milk powder (WMP ) and butter
under the importable hypothesis, 1995–99.
Year
SMP WMP Butter
Range Average Range Average Range Average
1995 0.814–0.927 0.853 1.000–1.252 1.092 0.971–1.288 1.074
(0.601) (0.660) (0.509)
1996 0.785–0.933 0.854 0.985–1.150 1.076 0.926–1.252 1.065
(0.633) (0.677) (0.495)
1997 0.829–0.961 0.904 1.095–1.235 1.163 1.066–1.347 1.245
(0.650) (0.709) (0.549)
1998 0.873–1.075 0.975 1.013–1.123 1.076 0.943–1.040 1.006
(0.640) (0.648) (0.514)
1999 0.979–1.163 1.086 1.117–1.263 1.221 1.046–1.338 1.250
(0.674) (0.682) (na)
Note: NPCs were calculated based on mid-point of export price (FOB) ranges reported by the New Zealand Dairy Board
(US$/tonne) plus the export subsidy given by the EU on dairy products; na = data not available.
However, the high values of NPC are mainly due to large export subsidies on dairy
products by most of the developed countries and significant decline in the world market
prices of dairy products in the post-1995 period. For example, the average export price
(FOB) of SMP was about US$ 1444/t in 1999 and the EU and US paid about US$ 867 and
US$ 950/t, respectively, as subsidy on SMP exports, which represented more than 60% of
the world prices (Sharma 2000). There was some decline in the export subsidy to comply
with commitments made under WTO but the proportion of export subsidy as percentage of
world market prices showed an upward trend. A similar trend was also observed for WMP
and butter.
The NPCs calculated at distortion free world market prices are well below unity for all
the products in all the years. The reduction in the value of NPC was most pronounced in the
case of butter, followed by WMP and lowest in the case of SMP. This is mainly due to large
subsidies on fat-based products, which have low demand in developed countries because of
these countries food habits, but are dumped in the developing countries with the help of
large export subsidies. These results indicate clearly that the Indian dairy industry is highly
import competitive, if developed countries remove the export subsidies.
The raw milk cost is the largest single cost item in the dairy product chain, so the
question of milk product competitiveness is reduced to whether milk cost at the farm level is
competitive. Raw milk costs have a significant impact on the competitiveness of the dairy
sector; an increase in domestic price reduces the competitiveness of the dairy industry while
a fall in domestic price increases its competitiveness. Other important factors that have
significant influence on competitiveness of the dairy industry are exchange rate and world
price of dairy products. Increases in exchange rates and international prices of dairy
South–South Workshop 245
Implications of international trade regulations for smallholder dairy development
products increase the competitiveness of the industry quite significantly by reducing the
values of NPCs in all cases. In contrast, reductions in global market price and exchange rate
reduce the competitive strength of the industry. Since the international prices and exchange
rates are highly volatile and are outside the direct influence of government and industry, the
only way to increase the competitiveness of the Indian dairy sector is by reducing the cost of
raw milk. The raw milk cost can be reduced either by raising the milk yield or by reducing the
cost of milk production. Since, reduction in cost is not possible, the option available to
reduce cost of production per unit of milk and thus keep domestic prices low, is to increase
the yield level of dairy animals. The average milk yield per animal in India is one of the
lowest in the world. Therefore, in order to remain competitive in the international market,
there is a need to enhance productivity of milch animals and to introduce measures to
improve sanitary standards with legal back-up in the milk production and processing sectors
in the global free trade regime.
The above results indicate clearly that Indian dairy industry is highly competitive, if all
export subsidies given by developed countries in general and the EU and US in particular,
are eliminated in line with the current WTO rules for industrial products.
Conclusions and policy implicationsAgriculture was a centre piece of the Uruguay Round of trade negotiations that created the
WTO. This paper analyses the implications of the WTO agreement on agriculture, and the
SPS and TBT agreements for smallholder dairy production and marketing. The experience
of the first five years of implementation of the WTO agreements suggests a mixed picture,
both in terms of implementation of its various provisions and its impacts. Many distortions
in agricultural markets still remain and not all the expected benefits have materialised.
Based on our findings and review of policies and market realities, we find the following
weaknesses in the Uruguay Round agreements of relevance to agricultural trade in general
and the dairy sector in particular:
• In the URAA, member countries agreed to convert all non-tariff barriers to tariffs and to
reduce them. However, experience shows that these new disciplines provided for
flexibility in implementation and many developed countries have found ways to limit
impacts on their domestic agricultural sectors. Moreover, universal tariffication did not
result in low and stable tariffs for dairy products. The formulae used in the Uruguay
Round allowed some countries to inflate the tariff equivalents of previously non-tariff
measures for particular products and to minimise the rate of reduction in tariffs for
sensitive products. In some cases, countries used relatively large cuts on low tariffs and
small cuts on high tariffs to meet the overall 36% average reduction requirement.
• Some countries have access to the provision of special safeguards, which allow them to
increase tariffs above the ceiling levels in order to protect their domestic market from a
surge of imports or very low world prices. In general, only developed countries have
access to the SSG provision.
• Experience with regard to domestic support shows that restraints on internal support
measures do not limit spending and have not been binding for any country. Moreover,
246 South–South Workshop
Sharma
the level of support offered to domestic industries in the US and the EU has not been
influenced by these commitments. Despite the fact that the US is meeting its AMS
commitments, the US has notified the expenditures under green box policies that were
almost twice as much as they were during the base period, 1986–88. There is an apparent
shift from amber to green box programmes. The same situation occurred in the EU.
• Export subsidies have a major detrimental effect on the world market prices, which affect
the income and returns of farmers and industry in the importing and non-subsidising
export countries. The dairy sector is again a major offender as regards export subsidies.
There is a high concentration of subsidies to a few countries and a few commodities.
Only 25 of the 134 WTO members have a right to subsidise exports and the bulk of
export subsidies is accounted for by two to three countries. The two biggest players on
the international scene in the dairy sector, the US and the EU, together accounted for
more than 90% of all subsidised dairy exports in 1995.
• Some implementation problems associated with export subsidy commitments have also
emerged. Recent decisions to carry-forward and rollover unused export entitlements,
aggregation of commodities in certain product groups and Canada’s special class pricing
systems have had a damaging impact on world markets.
• Some of the countries have also misused the provisions of the SPS and TBT agreements
without sound scientific basis.
The results of competitiveness analysis reveal that protection to SMP was lower than
WMP and butter in all the years. The estimates of NPC at distortion free world market
prices (if all export subsidies are abolished) show that all the dairy products considered in
the analysis are efficient import substitutes. The major reasons for the high level of
protection afforded to major dairy products in India were that: (i) the international prices
for most dairy products declined significantly in the post-WTO period, and (ii) export
subsidies on these products increased substantially. International price of dairy products
and exchange rate are the two important international level parameters that have a major
influence on the competitiveness of this industry, but the industry and even the country
have no control over these parameters. Domestic market price is another significant
determinant of competitiveness of the industry and this is the only factor that is within the
control of industry and the nation.
The findings of this study have important implications for policy making in the dairy
sector. It is clear that the Indian dairy industry has achieved remarkable progress during the
last two-and-a-half decades. However, the situation is changing very fast and the Indian dairy
sector is moving towards an open economy environment of liberalisation due to
commitments made to the WTO, as well as domestic economic reforms. These changes
have significant implications for the Indian dairy industry and can threaten the success of
the ‘white revolution’ in achieving self-sufficiency in milk production. With the opening up
of the Indian dairy industry and the moving of most dairy products to Open General
License (OGL) coupled with low import tariffs, imports of milk powders have increased
substantially from 282 t in 1995–96 to about 18 thousand tonnes in 1999–2000. This
inflow of cheap imports will lower domestic product prices but will have a negative impact
on the incomes of the millions of rural producers and processors. Moreover, the world dairy
prices are highly distorted with heavy export subsidies and domestic support, which depress
South–South Workshop 247
Implications of international trade regulations for smallholder dairy development
the domestic prices and create unhealthy and unfair competition for the domestic industry.
India was the only country, which had committed a zero per cent bound rate of duty for milk
powders and 40% for butter and butter oil compared with 100–150% for milk and cream,
which are practically not traded in the world market. Recently, India renegotiated the zero
bound tariffs of milk powders with the US, Australia and the EU under Article XXVIII of
GATT, which is consistent with the TRQ provisions of WTO, but it took almost 6 months
to notify these tariffs. Such delays can have significant adverse impacts on the dairy sector.
Export subsidies have adverse impacts on world market prices. There is general
consensus around the world that export subsidies are the most trade distortive measures
and can no longer be justified. Hence, in the next round of negotiations the government
must focus on securing significant reductions in export subsidies, resulting in their eventual
elimination and prohibition in the dairy sector. Moreover, they must focus on restriction of
the carry forward and rollover export provisions.
Since the access to the provision of SSG is not universal, the Indian dairy industry would
expect to see either the removal of ‘special safeguard duty’ provisions of the URAA or the
making of them available to all member countries. The Indian dairy industry is also concerned
to ensure that SPS and TBT measures continue to be based on the application of sound
scientific principles and do not become de facto barriers to trade. India should press for
abrogation of Articles 3.2 and 5.7 of the SPS agreement, which have proven to be
controversial. India should take a lead in bringing together all developing countries and
should negotiate/participate actively in WTO negotiations to protect smallholder producers’
interests from unfair and distorted trade competition in an open economy environment.
The government should evolve a mechanism to monitor international prices and other
developments in the world market and take corrective actions, such as anti-dumping duties
and suitable tariff rates, to protect the dairy industry from unfair competition. The Indian
dairy industry and particularly organisations/institutions like the National Dairy
Development Board (NDDB), should take a lead role in monitoring trends in the global
market (especially related to domestic support and export subsidy levels, and international
prices) and provide the relevant information to help the government during the negotiation
process.
The major policy implication of this study is that the Indian dairy industry is highly
competitive but must be protected from distorted and unfair trade competition in a
liberalising economic environment.
ReferencesAndrews N., Roberts I. and Hester S. 1994. The Uruguay Round outcome: Implications for
agricultural and resource commodities. In: Outlook 94. Proceedings of the national agricultural and
resource conference held at Canberra, Australia, 1–3 February 1994. Volume 1. World commoditymarkets trade. ABARE, Canberra, Australia. pp. 171–179.
Balassa B. and Schydlowsky D.M. 1972. Domestic resource costs and effective protection once again.Journal of Political Economy 80:63–69.
Corden W.M. 1971. The theory of protection. Oxford University Press, London, UK.
248 South–South Workshop
Sharma
Dobson W.D. and Cropp R.A. 1995. Economic impacts of the GATT agreement on the US dairy industry.
Department of Agricultural Economics, Marketing and Policy Briefing Paper Series 50.University of Wisconsin–Madison, Madison, Wisconsin, USA.
FAO (Food and Agriculture Organization of the United Nations). 2000. Commodity and market review
1999–2000. Commodities and Trade Division, FAO, Rome, Italy.
Gulati A. and Narayanan S. 2000. Cork the genie back into the bottle. Economic Times. 17th August2000.
Gulati A., Hansen J. and Pursell G. 1990. Effective incentives and India’s agriculture: Cotton, groundnuts,
wheat and rice. Policy, Planning and Research Working Paper 332. The World Bank, Washington,DC, USA.
Hathaway D.E. and Ingco M.D. 1995. Agricultural trade liberalization and the Uruguay Round. In:Martin W. and Winters L.A. (eds), The Uruguay Round and developing economies. World BankDiscussion Paper 307. The World Bank, Washington, DC, USA.
Ingco M.D. 1995. Agricultural trade liberalization in the Uruguay Round: One step forward, one step back?Policy Research Working Paper 1500. The World Bank, Washington, DC, USA.
Konandreas P. 1999. Next round of negotiations in agriculture with special reference to dairy sector.Paper presented at the international symposium on international prospects for dairying in thenext WTO negotiating round held at Buenos Aires, Argentina, June 3–4 1999.
OECD (Organization for Economic Co-operation and Development). 1998. Policies in OECD
countries: Measurement of support and background information. OECD, Paris, France.
OECD (Organization for Economic Co-operation and Development). 1999a. Agricultural policies in
OECD countries: Monitoring and evaluation 1999. OECD, Paris, France.
OECD (Organization for Economic Co-operation and Development). 1999b. Agricultural outlook:
1994–2004. OECD, Paris, France.
OECD (Organization for Economic Co-operation and Development). 1999c. Food safety and quality
issues: Trade considerations. Consultants’ report by J.C. Bureau, E. Gozlan and S. Marette, revisedby W. Jones. OECD, Paris, France.
Sharma V.P. 2000. Assessing the effects of the WTO agreement on Indian dairy industry: What canwe learn from past five years? Indian Dairyman 52(11):7–26.
Sharma V.P. and Sharma P. 2000. Performance and competitiveness of Indian dairy industry. Reportsubmitted to the Ministry of Agriculture, Centre for Management in Agriculture (CMA). IndianInstitute of Management (IIM), Ahmedabad, India.
United States Dairy Export Council. 1998. Dairy export subsidies and the WTO Canada case. World
Dairy and Outlook 3(4):3–4.
USDA, ERS (United States Department of Agriculture, Economic Research Service). 1998.Agriculture in Uruguay Round: Analyses of government support. Staff Report AGES880802, December1988. ERS, USDA, Washington, DC, USA.
USDA, ERS (United States Department of Agriculture, Economic Research Service). 1999.Implementation of Uruguay Round tariff reduction, agricultural outlook November 1999. ERS, USDA,Washington, DC, USA.
USDA, FAS (United States Department of Agriculture, Foreign Agricultural Service). 2000. Export
subsidies disadvantage US agricultural exports. FAS, USDA, Washington, DC, USA.
South–South Workshop 249
Implications of international trade regulations for smallholder dairy development
The competitiveness of smallholder dairyproduction: Evidence from sub-SaharanAfrica, Asia and Latin AmericaS.J. Staal
International Livestock Research Institute, P.O. Box 30709, Nairobi, Kenya.Tel. 254–2–630743; E-mail: [email protected]
IntroductionWhere crop production is feasible, livestock production is an essential component of
farming systems. It provides food, traction, manure and fibre, and performs other social and
economic functions. There is growing recognition, however, of the contribution of
livestock production to income generation for smallholder farmers through the production
of higher-valued products compared with most crops. One of the key income-generating
livestock activities available to resource-poor and even landless households is market-
oriented milk production. Not only does this generate income on a steady daily basis, but it
has also been shown to contribute to capital accumulation of resource-poor households,
enabling them to invest in education or other productive activities and assets. Further, that
income is often partially accrued by the women of the household, subsequently yielding
positive effects on child welfare and nutrition.
This paper presents several sets of evidence regarding the level of competitiveness of
smallholder dairy production. Smallholder dairy production refers to market-oriented milk
production by resource poor households, which may or may not have land holdings located
in urban, peri-urban or rural areas. Although there are differences across countries and
systems, the size of herds may range from a single cow to 15 or more in higher-income
countries.
The paper begins by examining projections for strong growth in dairy demand globally
and particularly in developing countries. Subsequently, two types of competitiveness are
examined: competitiveness in local domestic markets and competitiveness internationally.
First, local competitiveness is addressed through a set of case studies from sites in countries
in Asia, sub-Saharan Africa (SSA) and Latin America. Secondly, detailed budget case studies
are presented from two countries. International competitiveness is then examined using the
same range of case studies. National-level data on milk imports are presented to illustrate a
key underlying driving factor to continued smallholder viability, that of the nature of
demand. Finally, some policy issues are highlighted that continue to influence smallholder
dairy producer competitiveness.
250 South–South Workshop

The continuing livestock revolutionClear evidence is now available that smallholder livestock producers in developing
countries are being presented with growing market opportunities. A recent study by
Delgado et al. (1999) updated in Delgado et al. (2001) examined the trends for livestock
demand and production to 2020, with a focus on developing countries. Based on a global
food model, they predicted where and to what degree demand for livestock products will
grow and simultaneously predicted where the increased production needed to meet that
demand will occur.1
The projected changes are dramatic, particularly because of increases in per capita
income in Asia and elsewhere in developing countries. Furthermore, because of growing
human populations and urbanisation, consumption of animal products will increase
significantly in all developing countries by 2020. In developing countries, consumption of
meat and milk is predicted to grow by up to 50% in the period from 1983 to 2020, to
approximately 44 and 87 kg/capita per annum, respectively (Delgado et al. 1999). In Table
1, projected growth in meat and milk consumption is shown for the period from 1997 to
2020. Much of the growth in meat consumption will occur in pork and poultry, although, in
addition, beef consumption per capita is expected to grow by more than 30%. In simple
monetary value terms, these dramatic changes in overall livestock production, which are
already well on their way, will be larger than the Green Revolution of the 1960s and 70s.
Table 1. Projected growth in total milk and meat consumption for selected regions, 1997 to 2020.
Meat Growth
rate
Milk Growth
rateRegion 1997 2020 1997 2020
× 106 t/year %/year × 106 t/year %/year
China 53 104 3.0 10 23 3.5
India 4 9 3.5 60 132 3.2
Latin America 35 45 2.4 54 82 1.8
Sub-Saharan Africa 6 11 3.2 17 35 3.3
Developing countries 111 213 2.9 194 372 2.7
Developed countries 98 114 0.7 251 276 0.4
World 208 303 1.8 445 654 1.7
kg/capita %/year kg/capita %/year
China 43 71 2.8 8 16 4.3
India 4 7 3.3 62 104 3.0
Latin America 54 69 1.2 112 127 0.6
Sub-Saharan Africa 10 12 0.9 30 37 1.0
Developing countries 25 35 1.7 43 61 1.8
Developed countries 75 84 0.5 194 203 0.2
World 36 44 1.0 77 87 0.6
Source: adapted from Delgado et al. (2001)
South–South Workshop 251
The competitiveness of smallholder dairy production in SSA, Asia and Latin America
1. The IMPACT model is a global food model of 22 commodities including seven livestock commodities,covering 36 separate regions/countries, and with annual iterations to 2020. It incorporates expectedgrowth in population and income, and changes in productivity (Delgado et al. 2001).

Although milk consumption growth is not as dramatic when viewed in overall global
terms (an expected annual growth rate of 1.8% to 2020), growth of milk consumption in
developing countries will be much more significant. From 1997 to 2020, milk
consumption in developing countries is expected to grow from 194 to 372 million tonnes
(t)/year, a 92% increase, at an average annual growth rate of 2.7%, compared with 0.7% in
developed countries. China is projected to experience the highest rate of growth in milk
consumption at 3.5%, followed closely by sub-Saharan Africa (SSA) and India at 3.3 and
3.2%, respectively (Table 1); however, these increases are from relatively low initial levels.
In per capita terms, the growth rates are lower, illustrating the effect of population growth
on demand, but also underlining the importance of changes in consumption due to
income level and urbanisation. In sharp contrast, consumption in developed countries is
expected to remain almost constant. This phenomenon is thus centred almost entirely in
the developing world.
From the point of view of smallholder producers, however, the following important
questions remain: where will the increased milk production needed to meet this demand
take place and will smallholder livestock producers be able to participate in this market
opportunity?
In answer, increased production is expected to occur generally in the same areas where
increased demand is expressed. Increased importation from more distant parts of the
globe is not expected. This simply follows the current pattern, where a relatively small
proportion of production is traded globally: ≤10% of volume of global livestock production is
traded internationally (FAOSTAT). In spite of the public attention sometimes given to
livestock and dairy product trade issues, livestock products are not easily traded. Dairy
products require extensive transformation or high cost to preserve and transport them,
after which they may not compete well in quality against local fresh products. Thus, the
IMPACT model predicts that countries that are deficit in livestock products will generally
import feed rather than meat and milk, leading to rapid increases in feed grain imports in
some areas. The implication for imports of milk by developing countries is similar.
Although imports will increase as consumption of dairy products increase, as a
proportion of total consumption they are expected to remain constant or decrease.
Delgado et al. (2001) project a 69% increase in milk imports2 to developing countries,
from 20 to 34 million tonnes/year during the period 1997 to 2020. As a proportion of
developing country production, however, the level of imports will decrease from 10 to
9%. This process is well established. For the developing world as a whole, however, net
milk imports per capita decreased from 5.3 kg in 1985 to 4.7 kg in 1998 (Nicholson et al.
2001). Consequently, the proportion of milk produced in developing countries will
increase. By 2020, developing countries will produce just over 50% of all milk globally, an
increase from 38% in 1997. Smallholders, who currently produce most of the world’s
milk, may be well placed to capture the opportunities presented by the Livestock
Revolution.
252 South–South Workshop
Staal
2. ‘ Milk imports’ are measured in liquid milk equivalent units (LME) and include all dairy products.
Local competitiveness of smallholder dairyproduction
Sources of competitiveness locallyCritical to understanding the competitiveness of smallholder dairy production is the
appreciation that it is generally a labour-intensive activity, relying on the use of family and
hired labour instead of mechanisation. Thus, cows are usually milked by hand, fodder is
cultivated and gathered manually and milk may be carried by foot or bicycle to sales points.
Clearly, such a system of production relies on the lack of better alternative employment
opportunities and on the absence of more valuable agricultural enterprises. This means that
other crops and livestock production that are practical and marketable locally do not offer
significantly better returns, but also that industrial development has not succeeded in
providing adequate numbers of better-paying jobs. In such circumstances, the opportunity
costs of farmer labour are low, which is generally reflected in low observed casual wage rates
in rural areas.
The competitiveness of smallholder dairy production is thus partially dependent on low
opportunity costs for labour. This may be the primary determinant of smallholder
competitiveness locally, within a given economic region or nation, where wages are
generally homogenous. Figure 1 provides some examples of this effect. Using recent case
studies from SSA, Asia and Latin America, variation in observed rural wages with typical
herd size from the same farming system is examined.3 The consistent pattern is an increase
in herd size with an increase in rural wage rates. The logic behind this is clear. As wages
increase, including the alternative employment opportunities for family members, farmers
attempt to substitute other inputs for the relative costly labour component. Portable
milking machines may be introduced and hand tractor carts may be used to carry feed and
fodder. Land may also be substituted for labour as the latter becomes relatively more costly,
in which case farmers shift to a greater reliance on grazing rather than on intensive fodder
production. For these capital inputs to be cost effective, they typically require greater
volumes of production, since they offer economies of scale. Herd sizes thus increase, and the
structure of competitive production shifts away from smallholders, towards what may be
described as medium-sized commercial production. To ensure returns from the increased
capital investment, production may also become more specialised, with fewer of the
crop–livestock interactions that typically occur on a mixed crop–dairy farm. Within a given
economic environment, where wages and employment opportunities are low and generally
similar, evidence suggests that smaller dairy production units are more competitive and
successful than larger ones.
Another aspect of smallholder dairy success, that is sometimes overlooked, is the value
that smallholders capture from non-dairy product outputs of the dairy enterprise, such
as manure and savings. Particularly in high potential agricultural areas where population
South–South Workshop 253
The competitiveness of smallholder dairy production in SSA, Asia and Latin America
3. Unpublished results from case studies carried out in November to December 2000 by the InternationalLivestock Research Institute (ILRI) and collaborators under the project on Transregional Analysis ofCrop–Livestock Systems.
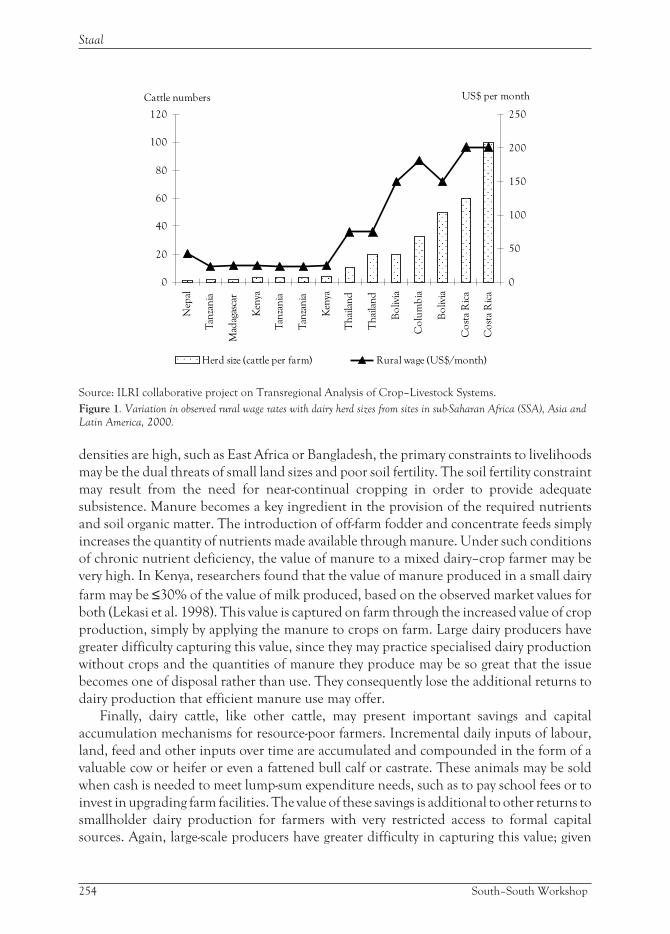
densities are high, such as East Africa or Bangladesh, the primary constraints to livelihoods
may be the dual threats of small land sizes and poor soil fertility. The soil fertility constraint
may result from the need for near-continual cropping in order to provide adequate
subsistence. Manure becomes a key ingredient in the provision of the required nutrients
and soil organic matter. The introduction of off-farm fodder and concentrate feeds simply
increases the quantity of nutrients made available through manure. Under such conditions
of chronic nutrient deficiency, the value of manure to a mixed dairy–crop farmer may be
very high. In Kenya, researchers found that the value of manure produced in a small dairy
farm may be ≤30% of the value of milk produced, based on the observed market values for
both (Lekasi et al. 1998). This value is captured on farm through the increased value of crop
production, simply by applying the manure to crops on farm. Large dairy producers have
greater difficulty capturing this value, since they may practice specialised dairy production
without crops and the quantities of manure they produce may be so great that the issue
becomes one of disposal rather than use. They consequently lose the additional returns to
dairy production that efficient manure use may offer.
Finally, dairy cattle, like other cattle, may present important savings and capital
accumulation mechanisms for resource-poor farmers. Incremental daily inputs of labour,
land, feed and other inputs over time are accumulated and compounded in the form of a
valuable cow or heifer or even a fattened bull calf or castrate. These animals may be sold
when cash is needed to meet lump-sum expenditure needs, such as to pay school fees or to
invest in upgrading farm facilities. The value of these savings is additional to other returns to
smallholder dairy production for farmers with very restricted access to formal capital
sources. Again, large-scale producers have greater difficulty in capturing this value; given
254 South–South Workshop
Staal
0
20
40
60
80
100
120
Nep
al
Tan
zan
ia
Mad
agas
car
Ken
ya
Tan
zan
ia
Tan
zan
ia
Ken
ya
Th
aila
nd
Th
aila
nd
Bo
livia
Co
lum
bia
Bo
livia
Co
sta
Ric
a
Co
sta
Ric
a
Cattle numbers
0
50
100
150
200
250
US$ per month
Herd size (cattle per farm) Rural wage (US$/month)
Source: ILRI collaborative project on Transregional Analysis of Crop–Livestock Systems.
Figure 1. Variation in observed rural wage rates with dairy herd sizes from sites in sub-Saharan Africa (SSA), Asia and
Latin America, 2000.
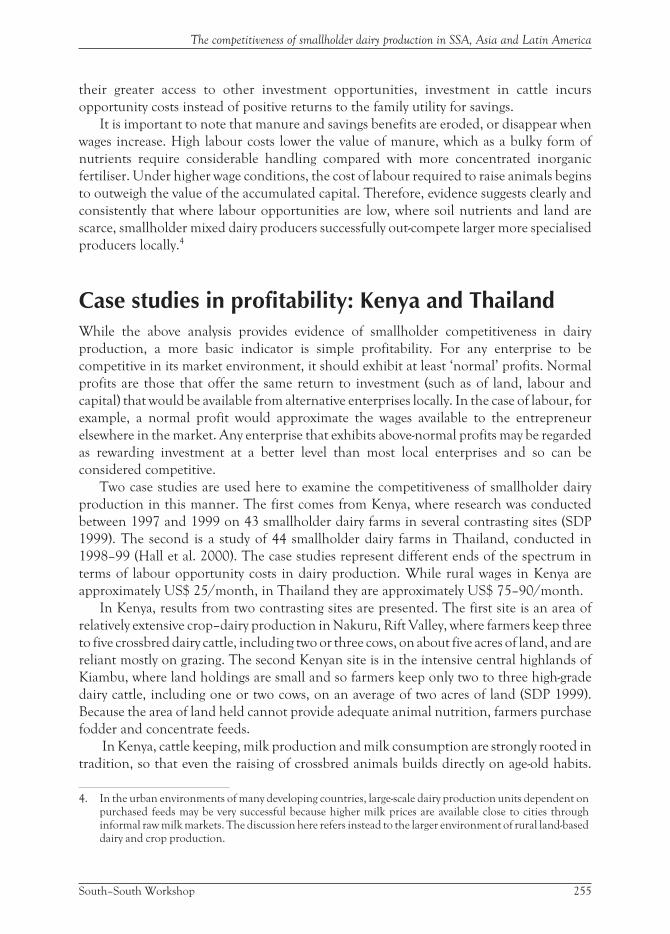
their greater access to other investment opportunities, investment in cattle incurs
opportunity costs instead of positive returns to the family utility for savings.
It is important to note that manure and savings benefits are eroded, or disappear when
wages increase. High labour costs lower the value of manure, which as a bulky form of
nutrients require considerable handling compared with more concentrated inorganic
fertiliser. Under higher wage conditions, the cost of labour required to raise animals begins
to outweigh the value of the accumulated capital. Therefore, evidence suggests clearly and
consistently that where labour opportunities are low, where soil nutrients and land are
scarce, smallholder mixed dairy producers successfully out-compete larger more specialised
producers locally.4
Case studies in profitability: Kenya and ThailandWhile the above analysis provides evidence of smallholder competitiveness in dairy
production, a more basic indicator is simple profitability. For any enterprise to be
competitive in its market environment, it should exhibit at least ‘normal’ profits. Normal
profits are those that offer the same return to investment (such as of land, labour and
capital) that would be available from alternative enterprises locally. In the case of labour, for
example, a normal profit would approximate the wages available to the entrepreneur
elsewhere in the market. Any enterprise that exhibits above-normal profits may be regarded
as rewarding investment at a better level than most local enterprises and so can be
considered competitive.
Two case studies are used here to examine the competitiveness of smallholder dairy
production in this manner. The first comes from Kenya, where research was conducted
between 1997 and 1999 on 43 smallholder dairy farms in several contrasting sites (SDP
1999). The second is a study of 44 smallholder dairy farms in Thailand, conducted in
1998–99 (Hall et al. 2000). The case studies represent different ends of the spectrum in
terms of labour opportunity costs in dairy production. While rural wages in Kenya are
approximately US$ 25/month, in Thailand they are approximately US$ 75–90/month.
In Kenya, results from two contrasting sites are presented. The first site is an area of
relatively extensive crop–dairy production in Nakuru, Rift Valley, where farmers keep three
to five crossbred dairy cattle, including two or three cows, on about five acres of land, and are
reliant mostly on grazing. The second Kenyan site is in the intensive central highlands of
Kiambu, where land holdings are small and so farmers keep only two to three high-grade
dairy cattle, including one or two cows, on an average of two acres of land (SDP 1999).
Because the area of land held cannot provide adequate animal nutrition, farmers purchase
fodder and concentrate feeds.
In Kenya, cattle keeping, milk production and milk consumption are strongly rooted in
tradition, so that even the raising of crossbred animals builds directly on age-old habits.
South–South Workshop 255
The competitiveness of smallholder dairy production in SSA, Asia and Latin America
4. In the urban environments of many developing countries, large-scale dairy production units dependent onpurchased feeds may be very successful because higher milk prices are available close to cities throughinformal raw milk markets. The discussion here refers instead to the larger environment of rural land-baseddairy and crop production.
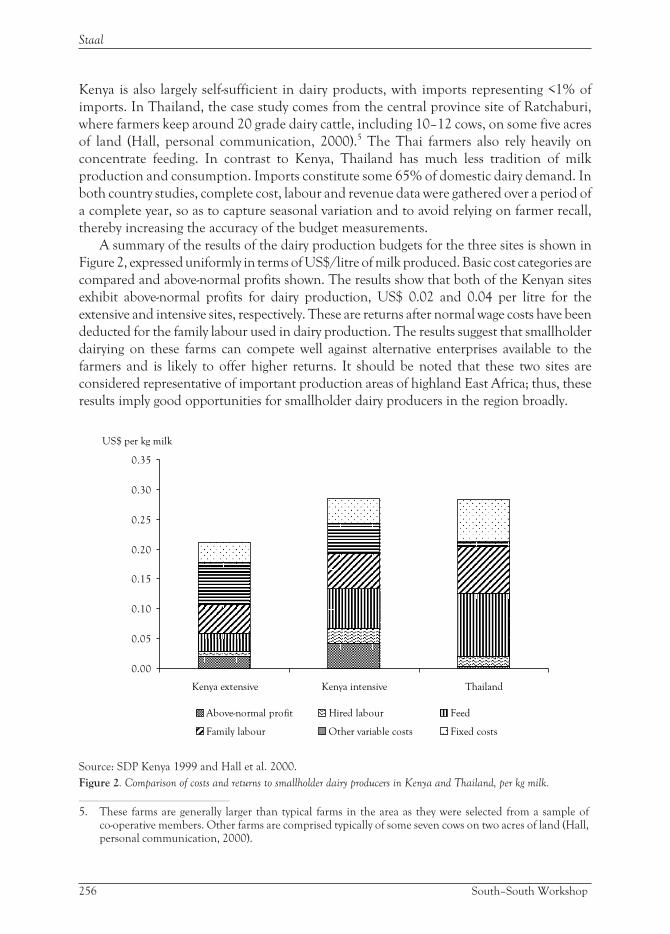
Kenya is also largely self-sufficient in dairy products, with imports representing <1% of
imports. In Thailand, the case study comes from the central province site of Ratchaburi,
where farmers keep around 20 grade dairy cattle, including 10–12 cows, on some five acres
of land (Hall, personal communication, 2000).5 The Thai farmers also rely heavily on
concentrate feeding. In contrast to Kenya, Thailand has much less tradition of milk
production and consumption. Imports constitute some 65% of domestic dairy demand. In
both country studies, complete cost, labour and revenue data were gathered over a period of
a complete year, so as to capture seasonal variation and to avoid relying on farmer recall,
thereby increasing the accuracy of the budget measurements.
A summary of the results of the dairy production budgets for the three sites is shown in
Figure 2, expressed uniformly in terms of US$/litre of milk produced. Basic cost categories are
compared and above-normal profits shown. The results show that both of the Kenyan sites
exhibit above-normal profits for dairy production, US$ 0.02 and 0.04 per litre for the
extensive and intensive sites, respectively. These are returns after normal wage costs have been
deducted for the family labour used in dairy production. The results suggest that smallholder
dairying on these farms can compete well against alternative enterprises available to the
farmers and is likely to offer higher returns. It should be noted that these two sites are
considered representative of important production areas of highland East Africa; thus, these
results imply good opportunities for smallholder dairy producers in the region broadly.
256 South–South Workshop
Staal
0.00
0.05
0.10
0.15
0.20
0.25
0.30
0.35
Kenya extensive Kenya intensive Thailand
US$ per kg milk
Above-normal profit Hired labour Feed
Family labour Other variable costs Fixed costs
Source: SDP Kenya 1999 and Hall et al. 2000.
Figure 2. Comparison of costs and returns to smallholder dairy producers in Kenya and Thailand, per kg milk.
5. These farms are generally larger than typical farms in the area as they were selected from a sample ofco-operative members. Other farms are comprised typically of some seven cows on two acres of land (Hall,personal communication, 2000).

In Thailand, the farms and herds are somewhat larger, but they represent smallholders
in the context of their more commercialised farming environment. The results from these
farms show no above-normal profits (Figure 2). Overall, returns to dairy production are
estimated to be zero at -US$ 0.002/litre, which represents a return that is approximately
equal to a normal profit.6 Again, this return is the amount after the costs of family labour
have been valued (at the local market wage) and deducted. The results suggest that dairy
production offers about the same return to labour as that available from alternative
enterprises and general employment in the area; these factors are implicitly valued in the
wage rates and land rental rates used in the cost calculations. While this result does not
indicate the same degree of competitiveness as that seen in Kenya, it nevertheless suggests
that for some farmers, depending on personal preferences, dairy production will yield a
viable enterprise and livelihood compared with local alternatives. The same study found
that for farms that increased the level of inputs in disease control and genetic improvement,
returns were increased and above-normal profits were reported (Hall et al. 2000). Possibly
reflective of these results is the fact that the number of milk cows in Thailand doubled
between 1992 and 1999 (TOAE 2000). It should be remembered that this increase in cow
numbers is in the context of a domestic dairy market that has previously relied heavily on
imports to meet most of its demand.
Case studies from different settings suggest that smallholder dairy production can
compete successfully against alternative local activities. It should be noted that in these case
studies it was not possible to value the contribution of manure, which if positive, can be
regarded as a profit above that shown. Comparisons of scale and wage opportunities
indicate that where employment opportunities are low, smallholders will retain an edge.
Further, the Kenya and Thailand cases indicate that normal- or above-normal profits are
available from smallholder dairy production. The Thailand case suggests that smallholders
can compete even in the context of a mainly import market. In the next section,
international competitiveness is examined more closely.
Smallholder competitiveness internationallyWhile the above analysis showed evidence that smallholders can compete locally, a
frequently raised issue is whether farmers in developing countries can compete
internationally. This debate may be highlighted as World Trade Organization agreements
gradually reduce the level of border tariffs, potentially opening new markets for dairy trade,
at least in those countries that have traditionally maintained high trade barriers.
How large is the dairy trade?A starting point for examining the international competitiveness of dairy production may
be to identify the scale of the issue. Figure 3 compares the proportion of global production
that was traded internationally during 1975–98 for two major food commodities—milk and
South–South Workshop 257
The competitiveness of smallholder dairy production in SSA, Asia and Latin America
6. Estimated from the results of Hall et al. (2000).

wheat.7 In the case of wheat, the proportion has varied from about 15 to 22% of total world
production. For dairy products, the proportion traded is less and has remained at just over
10% since the mid 80s, although it appears to have been lower previously. Although these
results are not conclusive, they seem to suggest that dairy trade faces some of the same
obstacles faced by other livestock products, for which an even smaller proportion is traded.
As mentioned in the first section of this paper, these obstacles are related to the need to
transform and preserve livestock products before they can be traded. It should be noted,
however, that <1% of rice production is traded internationally, in spite of the relative ease of
bulking and transport. This low level of trade may be related to the subsistence nature of a
large proportion of rice production. In contrast, much of wheat production is highly
commercialised. Aside from the regulatory environment and strategic domestic
considerations, the volume of trade relative to production may thus be influenced by some
combination of these factors, structure of production and physical characteristics of the
product.
Competitiveness measured through import parityA common approach, to evaluating the extent to which local producers can compete against
imported products, is to calculate import parity prices of products.8 This is one part of the
domestic resource cost approach to measuring comparative advantage (Chenery 1961).
Import parity price in the case of milk is calculated by starting with the world price for whole
258 South–South Workshop
Staal
0
5
10
15
20
25
1975 1977 1979 1981 1983 1985 1987 1989 1991 1993 1995 1997
% Traded globally
Milk Wheat
Source: FAOSTAT.
Figure 3. Percentage of world milk and wheat production that was traded, by volume, 1975–98.
7. Milk here is milk equivalents, representing all types of dairy products traded.
8. Export-parity prices are generally used in situations where a country is a net exporter.

milk powder (WMP), and adding to it the costs of transport to the local market and the costs
of transformation into liquid milk. To compare with farm-gate prices, the cost of local milk
collection is deducted from the reconstituted liquid milk cost. This then represents the
import parity price of milk at the farm gate, directly comparable to the prices received by
farmers. If the import parity price is lower than the farm price, local producers have
difficulty competing because consumers are likely to prefer the lower cost import. If the
import parity price is higher than the farm price, local producers may be competitive, as
their milk is cheaper than imports. These price comparisons ignore differences in quality,
which should be kept in mind.
Approximate import parity prices were calculated for selected case study countries.9
Because detailed transport and processing costs were not available for each country, two
different margins were applied to the world milk prices based on transport and processing in
Kenya (Staal 1995) and Thailand (Hall 2000) in order to attain a range of potential import
parity outcomes. Therefore, these estimates provide only rough indications of the potential
comparisons of import parity prices over time with current farm prices. Import parity prices
were estimated for WMP prices of US$ 1500–2500/t, the general range of world market
price for that commodity in recent years. In late February 2001, the world market price was
about US$ 2050/t (USDA 2001). Figure 4 compares the import parity estimates with
recently observed farm gate prices for the case study countries. Generally, the results show
that observed farm gate prices are scattered across the potential range of import parity prices
(Figure 4) shown in units of US$/litre of liquid milk equivalent. The graph reinforces the
recognition that local competitiveness will vary considerably and will depend not just on
fluctuations in world milk powder prices, but also heavily on local costs of transport,
handling and processing. Observed prices in some of the country cases are in the lower
range of import parity prices suggesting that many smallholder producers can compete
effectively against the threat of imported dairy products. Naturally, this will vary from
country to country, depending partly on import tariff regimes and transport costs to
international markets. Nevertheless, this type of analysis is based heavily on the assumption
that imported and domestic fresh dairy products are perfect substitutes. As shown in the
next section, international competitiveness may be based largely on the nature of domestic
demand for milk and dairy products, and in the minds of traditional milk consumers, the
substitutability of imported and fresh products may be limited.
Traditions of dairy consumption and imports—Thefresh milk premiumMilk and dairy product consumption is not a traditional habit in all cultures of the world.
Regions where milk is not traditionally consumed beyond infancy include large parts of
South-East and East Asia, and those parts of SSA where trypanosomiasis has precluded
cattle keeping, such as coastal West Africa and much of Central Africa. Nevertheless, in
South–South Workshop 259
The competitiveness of smallholder dairy production in SSA, Asia and Latin America
9. ILRI collaborative project on Transregional Analysis of Crop–Livestock Systems (unpublishedobservations).
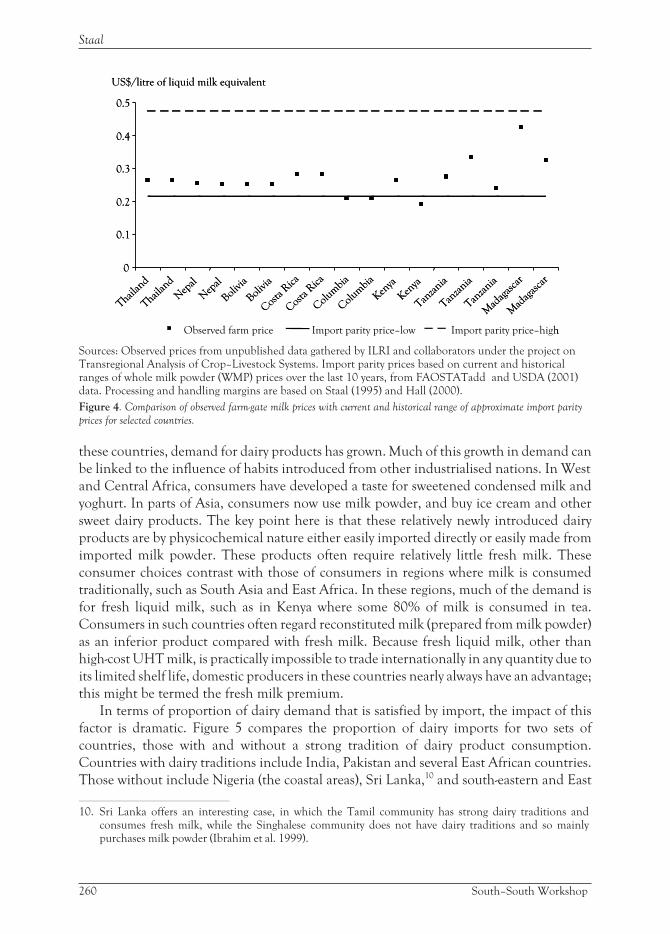
these countries, demand for dairy products has grown. Much of this growth in demand can
be linked to the influence of habits introduced from other industrialised nations. In West
and Central Africa, consumers have developed a taste for sweetened condensed milk and
yoghurt. In parts of Asia, consumers now use milk powder, and buy ice cream and other
sweet dairy products. The key point here is that these relatively newly introduced dairy
products are by physicochemical nature either easily imported directly or easily made from
imported milk powder. These products often require relatively little fresh milk. These
consumer choices contrast with those of consumers in regions where milk is consumed
traditionally, such as South Asia and East Africa. In these regions, much of the demand is
for fresh liquid milk, such as in Kenya where some 80% of milk is consumed in tea.
Consumers in such countries often regard reconstituted milk (prepared from milk powder)
as an inferior product compared with fresh milk. Because fresh liquid milk, other than
high-cost UHT milk, is practically impossible to trade internationally in any quantity due to
its limited shelf life, domestic producers in these countries nearly always have an advantage;
this might be termed the fresh milk premium.
In terms of proportion of dairy demand that is satisfied by import, the impact of this
factor is dramatic. Figure 5 compares the proportion of dairy imports for two sets of
countries, those with and without a strong tradition of dairy product consumption.
Countries with dairy traditions include India, Pakistan and several East African countries.
Those without include Nigeria (the coastal areas), Sri Lanka,10 and south-eastern and East
260 South–South Workshop
Staal
US$/litre of liquid milk equivalent
0
0.1
0.2
0.3
0.4
0.5
Thailan
d
Thailan
d
Nep
al
Nep
al
Bolivi
a
Bolivi
a
Cos
taRica
Cos
taRica
Col
umbi
a
Col
umbi
a
Kenya
Kenya
Tanza
nia
Tanza
nia
Tanza
nia
Mad
agas
car
Mad
agas
car
Observed farm price Import parity price–low Import parity price–high
US$/litre of liquid milk equivalent
0
0.1
0.2
0.3
0.4
0.5
Thailan
d
Thailan
d
Nep
al
Nep
al
Bolivi
a
Bolivi
a
Cos
taRica
Cos
taRica
Col
umbi
a
Col
umbi
a
Kenya
Kenya
Tanza
nia
Tanza
nia
Tanza
nia
Mad
agas
car
Mad
agas
car
Observed farm price Import parity price–low Import parity price–high
Sources: Observed prices from unpublished data gathered by ILRI and collaborators under the project onTransregional Analysis of Crop–Livestock Systems. Import parity prices based on current and historicalranges of whole milk powder (WMP) prices over the last 10 years, from FAOSTATadd and USDA (2001)data. Processing and handling margins are based on Staal (1995) and Hall (2000).
Figure 4. Comparison of observed farm-gate milk prices with current and historical range of approximate import parity
prices for selected countries.
10. Sri Lanka offers an interesting case, in which the Tamil community has strong dairy traditions andconsumes fresh milk, while the Singhalese community does not have dairy traditions and so mainlypurchases milk powder (Ibrahim et al. 1999).
Asian nations. Those without dairy traditions import up to 80% of their domestic
production, as in the case of Vietnam. Those with strong dairy traditions import a fractional
amount, generally <1% but up to 2% in the case of Uganda.
Clearly, an important factor here is the fact that countries that are traditional consumers
of milk are also traditional producers. Typically, milk production is well integrated into
local agricultural systems; thus, these countries have the capacity to supply their own
markets. The starting advantage in the traditionally consuming and non-consuming
countries is generally oppositely placed. In traditional dairy countries, imports generally
have difficulty competing with strongly demanded fresh milk, even if imports offer lower
prices. Contrastingly, in non-traditional dairy countries, local milk producers may have
difficulty competing with low cost imported products that meet consumers’ preferences.
It is interesting to note, however, that in Thailand, a country where large-scale dairy
product consumption has been learned relatively recently and where imports continue to
supply about 65% of the market, the number of dairy cattle approximately doubled between
1990 and 1999, from about 75 thousand to 140 thousand (TOAE 2000). This suggests that as
non-traditional consumers move beyond consumption of milk powder and yoghurt, and
develop an interest in fresh liquid milk, that the fresh milk premium may begin to occur even
where imports have traditionally dominated. Future domestic producer competitiveness,
including smallholder competitiveness, may grow as demand for liquid milk grows.
Policies to enhance smallholder dairy competitivenessIn spite of the above evidence suggesting that in many areas smallholders remain
competitive in dairy production, policy interventions can continue to provide additional
support to their viability. The small scale of milk production and marketed output
implicit to smallholder systems can often result in low bargaining power and limited
ability to capture economies of scale in marketing. Farmers use a variety of strategies to
South–South Workshop 261
The competitiveness of smallholder dairy production in SSA, Asia and Latin America
0
20
40
60
80
100
India Pakistan Ethiopia Korea
Republic
Sri Lanka Thailand
% of dairy imports
Countries with strong dairy traditions Countries with weak dairy traditions
Kenya Somalia Uganda India Nigeria Vietnam
%
0
20
40
60
80
100
India Pakistan Ethiopia Korea
Republic
Sri Lanka Thailand
% of dairy imports
Countries with strong dairy traditions Countries with weak dairy traditions
Kenya Somalia Uganda India Nigeria Vietnam
%
Source: Nicholson et al. (2001), using FAO data.
Figure 5. Percentage of domestic milk availability that is imported, countries with strong dairy traditions and countries
with weak dairy traditions.
overcome this. The first strategy is generally to sell direct through the informal market to
consumers, hotels etc. thereby obtaining higher prices for their milk and reducing
transactions costs (Staal et al. 1997). Use of milk traders to bulk milk, and perform
distribution and marketing services is also common. Finally, dairy farmer co-operatives
and other farmer groups can improve the market position of small farmers through
collective actions. Policies that support these activities and do not interfere with
individual market activities of farmers and traders are likely to sustain competitiveness of
producers.
Smallholders may also have poor access to livestock services and credit compared with
larger-scale producers. These services may include veterinary services and artificial
insemination, and credit for feeds and replacement cattle. Formal services typically favour
larger producers, who may be more willing to pay the full costs of such services. Formal
public services continue to be constrained by access to adequate resources; continued
privatisation is needed for those services and regions where smallholders can afford the
costs of targeted quality services (Ahuja et al. 2000). In areas that are more marginal and for
other services, public support may continue to be needed.
Finally, other policies may exist that favour more capital-intensive dairy production.
These may include the requirement of collateral for credit, which excludes smallholders,
and differential access to development project or programme resources.
Lessons learned and conclusionsGlobal trends in livestock demand and production point clearly to strong growth potential,
especially in developing countries. Growth in milk demand will play an important role in
this and will present new opportunities for smallholder producers in countries where the
growth is expected to be greatest.
This paper presents evidence suggesting that smallholder dairy producers remain
competitive in many areas. Local competitiveness is supported by several key factors,
including low opportunity costs of labour and the ability of small mixed farms to capture
more efficiently the value of nutrient cycling. It should be noted that it is not a policy or
development objective to maintain low opportunity costs in support of smallholder
dairying. Certainly the goal is the opposite, higher wages and better employment
opportunities. The key point here is that where wages and opportunities remain low for
whatever reason, smallholder dairy production will provide a viable activity and one which
is unlikely to be threatened significantly by large-scale production, unlike perhaps the case
of poultry production.
Evidence is also presented to suggest that in some cases, countries with mainly
smallholder dairy production can compete internationally. This may depend on future
trends in world milk prices. Nevertheless, the pattern of dairy imports globally suggests
strongly that the fresh milk premium will continue to support local producers, especially in
countries where milk is consumed traditionally, but potentially to an increasing extent in
countries where milk consumption habits are growing.
262 South–South Workshop
Staal
AcknowledgmentsContributions towards data sources and analyses came from members of the project on
Transregional Analysis of Crop Livestock Systems, particularly Isabelle Baltenweck, M.N.M
Ibrahim, Federico Hollman, Mario Herrero, the Smallholder Dairy Project (Kenya), Liston
Njoroge and Robert Ouma. I am grateful to David Hall for access to his data and analysis
from Thailand and to Simeon Ehui for comments. Financial support for gathering case
study information was provided by the Systemwide Livestock Programme of CGIAR.
Responsibility for the accuracy of the data presented and for the views expressed is reserved
exclusively by the author.
ReferencesAhuja V., George P.S., Ray S., McConnell K.E., Kurup M.P.G., Ghandhi V., Umali-Deininger D.
and de Haan C. 2000. Agricultural services and the poor: Case of livestock health and breeding services in
India. Indian Institute of Management, Ahmedabad, India; the World Bank, Washington, DC,USA; and the Swiss Agency for Development and Co-operation, Bern, Switzerland.
Chenery H.B. 1961. Comparative advantage and development policy. American Economic Review
51(1):18–51.
Delgado C., Rosegrant M., Steinfeld H., Ehui S. and Courbois C. 1999. Livestock to 2020: The next
food revolution. Food, Agriculture and the Environment Discussion Paper 28. IFPRI(International Food Policy Research Institute), Washington, DC, USA; FAO (Food AgricultureOrganization of the United Nations), Rome, Italy; and ILRI (International Livestock ResearchInstitute), Nairobi, Kenya. 72 pp.
Delgado C., Rosegrant M. and Meijer S. 2001. Livestock to 2020: The revolution continues. Paperpresented at the annual meeting of the International Agricultural Trade Research Consortium,Auckland, New Zealand, 18–19 January 2001.
FAOSTAT. FAO on-line database. http://apps.fao.org
Hall D.C. 2000. Three essays in animal health economics. PhD dissertation, Texas A&M University,College Station, Texas, USA.
Hall D.C., Ehui S. and Shapiro B. 2000. Economic impact and sustainability of animal health programs on
dairy farms in central Thailand. Working paper. Department of Agricultural Economics, TexasA&M University, Texas, USA; and ILRI (International Livestock Research Institute), Nairobi,Kenya.
Ibrahim M., Staal S.J., Thorpe W., Tanner J. (eds). 1999. Appraisal of the Sri Lanka dairy sub-sector.Volume 1. Synthesis of main results. Volume 2. Main report. Ministry of Livestock Development &Estate Infrastructure, University of Peradeniya, Sri Lanka; and ILRI (International LivestockResearch Institute), Nairobi, Kenya.
Lekasi J.K., Tanner J.C., Kimani S.K. and Harris P.J.C. 1998. Manure management in the Kenya
highlands: Practices and potential. Natural Resources Systems Programme, Department ofInternational Development (DFID), UK; and the Henry Doubleday Research Association.Emmerson Press, Kenilworth, UK. 35 pp.
Nicholson C., Tambi E., Staal S.J. and Thorpe W. 2001. Patterns of change in dairy production and
consumption in developing countries from 1985 to 1998. MOSD Working Paper 7. ILRI(International Livestock Research Institute), Nairobi, Kenya.
South–South Workshop 263
The competitiveness of smallholder dairy production in SSA, Asia and Latin America

SDP (Smallholder Dairy Project). 1999. Smallholder Dairy Project. Unpublished survey data. Jointproject of the Ministry of Agriculture and Rural Development, Kenya Agricultural ResearchInstitute (KARI) and International Livestock Research Institute (ILRI), Nairobi, Kenya.
Staal S.J. 1995. Peri-urban dairying and public policy in Ethiopia and Kenya: A comparative economic and
institutional analysis. Florida University Graduate School, Florida, USA. 275 pp.
Staal S.J., Delgado C. and Nicholson C. 1997. Smallholder dairying under transaction costs in EastAfrica. World Development 25(5):779–794.
TOAE (Thai Office of Agricultural Economics). 2000. Agricultural economic indicators of Thailand,
2000. Government of Thailand Press, Bangkok, Thailand.
USDA (United States Department of Agriculture). 2001. http://www.ams.usda.gov/dairy/mnsc/inter.htm.
264 South–South Workshop
Staal
Theme 2: Implications of internationaltrade regulations for smallholder dairyproduction and marketingPlenary discussionFollowing the presentation of the international trade and smallholder competitiveness papers,
participants raised issues and concerns regarding the impact of trade regulations on
smallholder dairy development and, related to that, the probable drivers of domestic dairy
production, especially consumption patterns of dairy products.
The issues and concerns were:
1. The negotiation skills and strategies of the South are not as well developed as those of the
North. This leads to unfair international agreements. There is the need to strengthen the
South’s capacity for negotiation.
2. The relationship (or lack thereof) between smallholders and the World Trade
Organization (WTO) should not be ignored. If the price of imported milk is low, it may
replace domestic milk demand/ consumption and therefore endanger milk production
and family livelihoods because of the multiple roles of dairy.
3. While raising domestic production through increasing yields and reducing costs was
seen as important, there were different views on the impact of imports on domestic
production.
4. Some participants felt that where the demand for fresh milk is strong, i.e. where there is
a tradition for consumption of milk and dairy products, imports of cheap powder will
not threaten local markets.
5. Others said that traditional preferences for fresh milk can change, and imports reduce the
demand for fresh milk, which reduces the price of domestically produced milk, making
smallholders suffer.
6. This was reinforced by the comment that where there are smallholders, there is poverty and,
regardless of traditional consumption patterns, poor people will buy the cheaper product.
7. It was emphasised that for many smallholders, dairy is only one component of the
farming system and it should not be dealt with in isolation. Nor can it be the only route
to poverty alleviation.
8. In the same context, it was noted that an important role of dairying in smallholder farming
systems was to provide alternate sources of income for families when crops fail (risk
spreading).
These and the related issues from the plenary discussion of the presentations in themes
1 and 3 were subsequently discussed in small groups of workshop participants.
The outcomes for theme 2 are given below.
South–South Workshop 265

Group discussionAs for the other themes, the group discussion of theme 2 was structured around a set of
questions. The questions addressed the determinants of dairy demand and the linkages,
real or perceived, between international trade in dairy products and the competitiveness of
smallholder dairy.
The questions discussed by the group were:
1. What are the determinants of the competitiveness of smallholder dairy?
2. Are the effects on smallholder producers of international trade regulations (relating to
dairy products) well understood and reliably estimated? If not, what will be the factors
that will have to be considered in estimating the effects?
3. Do we have reliable estimates of dairy demand by region/country/area and the structure of
that demand? How will variation in those estimates and in the structure of demand
(including substitutability) affect smallholder dairy development policies and programmes?
4. Are there issues related to international trade regulations of importance to smallholder
dairying and how can developing countries best address those issues?
The group responses were given below.
What are the determinants of the competitiveness of smallholderdairy?
Issues to be understood: the significant determinants of international competitiveness are:
• Costs of production
• Efficiency of processing plants
• Quality of products
• Exchange rates
• Current international prices and subsidies
• Consumer preferences
• Importance of informal vs. formal markets.
Are the effects on smallholder producers of international traderegulations (relating to dairy products) well understood andreliably estimated? If not, what will be the factors that will have tobe considered in estimating the effects?
• It appears that not all countries have fully understood the implications of international
trade agreements, despite signing these agreements. Asymmetry in knowledge on
international trade regulations exists among South countries.
• Countries need to be sensitised on the basic structure of the WTO and its basic
components, namely the various agreements such as the Agreement on Agriculture and
Sanitary and Phyto-sanitary (SPS) measures.
266 South–South Workshop
Implications of international trade regulations for smallholder dairy production and marketing
• Imports of subsidised dairy products (subsidies in a variety of forms such as domestic
support, export subsidies etc.) will adversely affect local prices, and thereby incomes and
employment generated by smallholder dairy production that is common among countries
of the South. Even in countries that do not have access to subsidised products, depressed
international prices due to such subsidies may depress local income.
• There is also a need to consider differences in some countries like Vietnam. Import
taxes have a possible negative impact on local consumption.
• There is also a need to consider the effects of other non-tariff trade barriers such as
technical standards and phyto-sanitary measures, and their significant potential to
adversely affect trade from countries of the South. Conflicting provisions in SPS
agreement of WTO allows certain countries to fix standards that are higher than required
to satisfy standards set by international bodies such as Codex Alimentarius Commission,
OIE etc.
Relative importance of different markets:
– Potential to export (degree of self sufficiency)
– Relative importance of processed products
– Consumption patterns
– Local price structures
Do we have reliable estimates of dairy demand by region/country/area and the structure of that demand? How will variation inthose estimates and in the structure of demand (includingsubstitutability) affect smallholder dairy development policies andprogrammes?
• Not all countries have reliable data collection structures in place, but India does.
• There are reliable estimates from formal markets but not from informal markets.
• There is a need to unify methods relating to data collection, analytical methods and
application across countries.
Are there issues related to international trade regulations ofimportance to smallholder dairying and how can developingcountries best address those issues?
• There is a need for a working group to be set up to study the implication of WTO rules
for local dairy industry.
• There is a need for a provision in the rules that allows for an importing country to
impose duty relative to subsidies.
• Duties should be harmonised and be universal.
In their plenary presentation, the group emphasised these key issues:
• Distortions exist in the current policy environment governing international trade in
dairy products.
Implications of international trade regulations for smallholder dairy production and marketing
South–South Workshop 267
• The need to review export subsidies and subsidies in general including domestic support.
• The need to review non-tariff trade barriers.
• Each country needs to review its import duties in relation to its needs to protect sufficiently
its domestic industry.
• Recommendations from this conference should reach policy makers in countries of the
South.
• ILRI, or another international organisation, should undertake comparative studies on
these issues and take into consideration the points raised in this conference.
After these group outcomes were presented in a plenary session, discussion highlighted
the following:
• There was consensus in the group about the unfairness of international competition.
• The spirit of WTO is that every human can take advantage of cheaper goods.
• Trade has to be fair. No country should subsidise goods and people should be able to
choose what they buy.
• South politicians signed agreements without realising the implications of doing so.
There is the need for an extension to the WTO deadlines to allow countries in the
South to deliberate again.
ConclusionsThe presentations, the supporting papers and their discussion highlighted the sensitivity of
international trade issues and the urgency for a better understanding in countries of the
South of WTO regulations and their implications for domestic competitiveness and dairy
development. The strengthening of capacities in the South for effective negotiation related to
international trade regulations was also required. Steps towards achieving those objectives are
presented in the workshop recommendations.
268 South–South Workshop
Implications of international trade regulations for smallholder dairy production and marketing
Theme 3: National dairy policies(including policies related to
research, extension, developmentand training) for smallholder
production and marketing
National policies supporting smallholderdairy production and marketing: India casestudyS. Parthasarathy1
Assistant Director General, International Crops Research Institute for the Semi-Arid Tropics (ICRISAT),Patancheru 502 324, Andhra Pradesh, India
India currently holds a leadership position in the dairy world, with a production level of 78
million tonnes of milk and annual growth rate of a little over 4%. This is an appropriate
time to review successive policy interventions of the government over the years, assess their
impacts, both if only to draw lessons for policy makers within India and for those in the
developing world to understand and possibly replicate the Indian model.
The story has to start with the historical context of dairying in India. Over centuries,
dairying in India meant keeping a head or two of cattle in the house. The choice of livestock
made a clean distinction between the uses of the cow and the buffalo; one was draft animal
and the other was kept for milk. Indian livestock farming for centuries was caught in the
vicious loop of large numbers, shortage of feed and fodder, low productivity, and recurring
epidemics. Obviously before modern era of dairy development began, there was no system
at the village level for handling surpluses nor was there a mechanism for collection,
transportation, process and distribution. Surpluses could only be converted to ghee or milk
sweets.
Policy interventions during the colonial rule underscored the need to supply milk to
armed forces and city dwellers through the military farms. A regulatory colonial regime
established milk colonies (Mumbai, Kolkatta, Chennai), laid down quality standards for ghee
and butter, and ensured control over the movement of milk and milk products. A post of milk
commissioner was also created, a legacy that has outlasted all its critics, and survives in a
liberalised era (recalling) essentially as a monument of colonial arrangements supporting an
alien philosophy, and an anachronistic co-operative law.
One of the first policy initiatives immediately after independence was the
recommendation from the milk sub-committee of the policy committee on agriculture
(1950), which resulted in city milk scheme being set up in Delhi, which grew eventually to
cover nearly 100 towns and cities by 1960. These were essentially demand-driven, urban
(consumer) oriented initiatives run by governments, and could not compete with milk
vendors, as there was no supporting strategy to cover the milk producers in rural areas with
required price and other incentives in an integrated fashion. An incentive-less pricing
system benefiting only urban consumers with cheaply priced milk in fact resulted in what
South–South Workshop 271
1. The views expressed in this paper are the author’s own deriving from his previous experience in this sectorand do not reflect the views of the organisation in which he is currently working.
one may call an anti-dairy cycle whose ill effects were compounded by cheap imports to
reconstitute as milk and maintain urban supplies.
It would be worthwhile to look briefly at the overall situation in this sector in the country
during the early fifties. Dairies were then located in urban areas, owned by governments and
without an efficient procurement system, and many potential rural milk sheds were largely
untapped. Since the city dairies were unable to obtain sufficient milk through middlemen,
milk powder was imported for reconstitution. Private milk supplies were erratic, usually
adulterated and over priced. In most villages one middleman had the procurement
monopoly and producers were forced to sell their milk at prices fixed by him. Seasonal
fluctuations in production often had the producer at a double disadvantage—low prices in
winter due to flush production and no stocks in summer due to sustained demand. The low
prices paid to milk producers ensured that they did not invest in the expansion of their
production, which thus stagnated.
Throughout the 50s and 60s dairy development and animal husbandry remained
depressed, as the procurement prices were artificially kept low. This killed whatever
incentive the producer had to produce more. In fact, through the initial five year plans up to
the time the National Dairy Development Board (NDDB) was set up in 1965, the small rural
milk producer was at a discount; the importance of forging a viable marketing link between
the milk producer and consumers did not get woven into any policy effort, let alone being
recognised as the critical step in any viable system. Amul (Anand Milk Union) was the only
exception.
Amidst all these developments an event took place in 1946 in the remote district of
Kheda in today’s Gujarat. Led by Tribhuavan Das Patel and deriving inspiration from that
charismatic leader, Sardar Vallabhai Patel, a group of poor milk producers started a
movement to protest against the milk monopolist of the day, Polson Dairy, who had been
awarded the sole rights to supply milk to Bombay milk scheme. The movement tasted success
when its protagonists won the right to form a dairy co-operative and to supply milk to the
Bombay milk scheme. Operations were started with a modest 5-can procurement of 247 litres
of milk from two village societies. Eventually this would blossom into the legendary Amul of
today. The tiny seeds of a life-sustaining principle of producers’ co-operative was sown, which
would eventually lead the way and place the small producer right at the heart of all dairy
development activities in the future.
A major step forward, which would have far reaching implications for the future came in
1965 with the setting up of NDDB to oversee dairy development in the country. The
background to the formation of NDDB has been narrated often but is well worth
recapitulation. It so happened that in 1964 Lal Bahadur Shastri, the then Prime Minister of
India, visited Anand to inaugurate a cattle feed factory put up by Amul. He was so impressed
by what he saw on this visit that he wrote to all state governments and ministers personally
commending the programme for setting up co-operative dairies based on the Anand pattern
in other states. The following year the NDDB came into being, registered under the
Societies Registration Act and Public Trusts Act, as an expert technical body to guide and
co-ordinate the accelerated development of the dairy industry in India and to provide the
necessary technical, managerial and consultancy services. NDDB was expressly asked by the
272 South–South Workshop
Parthasarathy

Prime Minister to attempt to replicate the Anand pattern milk co-operatives movement
throughout the country.
During the interregnum between the third and fourth plans (1966–69) the government
of India, with the help and advice of the NDDB, made major policy changes in dairy
development. Milk production in rural milk sheds through milk producers’ co-operatives
and movement of processed milk to urban demand centres became the corner stone of
government policy for dairy development. This single policy initiative of the government
would give a boost to dairy development and initiate the process of establishing the much
needed linkages between the producer and the consumer through a pricing, procurement
and marketing system, that would result in a White Revolution. The policy package
included measures, which enabled the NDDB to regulate and streamline the chaotic dairy
set up that existed in the country at that point of time.
• the NDDB itself was structured as a fully autonomous technical body under the aegis of
the Ministry of Agriculture and as the adviser to the ministry for all matters related to
dairy development in the country
• the NDDB was made the canalising agency of the government for the import and export
of all milk products and was authorised to regulate the rampant milk solids imports, all
in order to save domestic dairy production from smothering discrimination by the
private and government dairy plants
• to fulfil its role as a single window consultancy body for dairy development, the NDDB
equipped itself with skills and infrastructure for assisting the fledgling Indian dairy
industry on all aspects of dairying, from farm production to processing, value addition,
marketing and turn key execution of major engineering and construction projects and
• cross breeding of the indigenous cattle with exotic breeds became official policy for milk
production enhancement and gained economic relevance as the co-operative network
under operation flood moved in to provide market stimulus and price support.
Many other policy linkages connected with breeding (frozen semen production
stations), cattle feed (large feed compounding mills), disease control (foot-and-mouth
disease (FMD) vaccine production plant), veterinary services and manufacture of dairy and
feed milling equipment, would be woven into the implementation processes through the
Operation Flood Programme as elements of an integrated strategy that are now taken for
granted in any dairy development process that is required to succeed. To balance the
seasonal and regional production imbalances, to ensure balanced supply of milk and milk
products to all regions of the country, the NDDB structured dynamic regional and national
milk grids, linking all major milk sheds and co-operative milk unions. And to ensure
continuing supply of managerial skills for the growing dairy industry, the NDDB promoted
the Institute of Rural Management in Anand (IRMA).
Operation FloodOperation Flood was the project conceived and proposed by the NDDB to restructure the
milk markets in India and to make the market the engine for milk production growth. Phase
I of the project was agreed upon between the Government of India and the World Food
South–South Workshop 273
National policies supporting smallholder dairy production and marketing: India case study
Programme (WFP) in March 1970. Operation Flood involved an imaginative but pragmatic
use of the funds generated by monetising the WFP gifts of milk powder (126 thousand
tonnes) and butter oil (42 thousand tonnes). The commodities were sold to the
metropolitan dairies at market prices (and so not adversely affecting indigenous milk
production), to help them capture a commanding share of the city’s milk market. The funds
thus generated were used to finance expansion of the metro dairies, build rural
feeder/balancing dairy plants and to replicate the Amul model co-operative milk producers’
unions in the hinterland milk sheds, through a judicious mix of loans and grants.
The overall goal of Operation Flood I was to lay the foundation of a modern dairy
industry in India which would adequately meet the country’s needs for milk and milk
products, and which would be capable of viable, self-sustaining growth. This was sought to
be done through the establishment of producer controlled dairy co-operatives in the major
milk sheds, modelled on Amul, which would evolve into viable business enterprises. In
effect, this would enable millions of small producers to market their daily surplus
production, through their co-operatives, and gain direct access to far-flung urban demand
centres, eliminating all middlemen.
Specifically, Operation Flood’s main marketing objective was to enable the metro
dairies to capture commanding shares of the liquid milk markets in Mumbai, Kolkatta,
Delhi, and Chennai. These four cities represented India’s largest metropolitan demand
centres. During the 1950s and 1960s city milk supplies were seriously threatened by
seasonal declines in production, often compounded by adverse climatic conditions.
Operation Flood arranged expansion of the metro dairies, increasing their outputs,
enabling them to capture the commanding shares of their respective milk markets, to
become the price and quality leaders in the market. They were to be sufficiently large to
oblige traditional milk traders to compete with the modern dairies in terms of quality,
thereby limiting their freedom to dilute milk, and in terms of price, preventing thereby the
manipulation of milk prices with adverse effects for producers.
NDDB, in implementing Operation Flood, started to change the existing situation by
organising co-operatives, initiating discussions with state governments, and by creating a
management structure which combined competence in rural development, animal
husbandry, dairy engineering, marketing and manpower development. The campaign to
establish co-operatives immediately met with strong and sustained opposition from those
whose interests was challenged including middlemen and contractors. NDDB often found
it difficult to persuade state governments to support the formation of the Anand Pattern
milk co-operatives in their states, because of the fundamental change of approach to dairy
development involved. NDDB’s approach threatened the prevailing vested interests and
the bureaucracy’s traditional fear of change. It was the ever watchful and dynamic
leadership of Dr Kurien that saw the NDDB through the shoals of bureaucratic opposition
and other no-changers, to a position of dominance in this sector. There were however some
helpful bureaucratic developments. The attention given to dairy development was increased
by the creation of the post of a Joint Secretary within the Ministry of Agriculture, who was
responsible for the administration of the ministry’s dairy wing and dairy development in
general. By and large, they lent NDDB policy support and implementation assistance over
the years.
274 South–South Workshop
Parthasarathy
The World Food Programme assistance to India’s dairy development programmes
known as Operation Flood I, was replaced by food aid direct from the European
Community and a World Bank/IDA loan under Operation Flood II, and Operation Flood
III. The objectives and methods were the same as Operation Flood I. By the time the third
phase of Operation Flood ended in 1996 the three phases of the programme had some
significant achievements to their credit. Individual targets for each phase of the programme
were consistently and substantially exceeded. Here is a summary of the gains out of an
integrated policy of dairy development that underlay the Operation Flood and how they
resulted in benefits to the smallholders:
• the enormous urban market stimulus led to sustained production increase raising per
capita availability of milk to nearly 210 grams per day
• dependence on commercial imports of milk powder ended with positive impacts on
indigenous producers
• modernisation and expansion of the dairy industry and its infrastructure activated a
national milk grid, which was a strong counterweight or deterrent to the market forces
governing milk
• marketing mechanism of milk expanded to about 800 urban centres, providing assured
outlets for rural producers
• more than Rs. 50 billion went back to the producer members in 1999–2000 as money
for their milk, which in turn was pumped into sustaining India’s rural economy
• a nationwide network of multi-tier producers’ co-operatives, democratic in structure and
managed professionally, came into existence resulting in millions of small producers
participating in an economic enterprise that helped improve the quality of their lives
• the manufacture of dairy equipment grew to meet most of the indigenous industry needs
• the quality of milch animals improved with their per lactation yields increasing and their
inter-calving periods coming down. This translated to more earnings for the producers
• a wide network of research institutions to work on various aspects of dairy development,
animal sciences and rural development were established and
• production grew at 4–5% per annum during 1970–99 as against less than 1% before.
Before the third phase of Operation Flood was launched, NDDB itself underwent
structural changes as a result of the LK Jha committee recommendations. The dairy board,
(a society), and the Indian Dairy Corporation, (a company), were merged by an Act of
Parliament in 1988. The new statutory corporate body retained the old name—National
Dairy Development Board (NDDB) and almost all of the autonomy that the Board has
enjoyed all along. The NDDB Act 1987 declared the board an institution of national
importance—a tribute to its outstanding stature and achievements over the decades.
One of the key initiatives on dairy development was the launching of technology
mission by the Government of India in the beginning of the 1990s with the objective of
establishing linkages between programmes launched under Operation Flood, NDDB, the
Central Department of Animal Husbandry and Dairying and the state governments. The
aim was to avoid overlap in activities and focus on necessary policy changes.
To give one example of an attempted establishing linkages, the focus throughout the
earlier plan periods had been on expanding the capabilities and coverage of the state
South–South Workshop 275
National policies supporting smallholder dairy production and marketing: India case study

departments of animal husbandry, the emphasis being on curative services delivered
through 50 thousand institutions and a mind-boggling number of professional staff (36
thousand) and para-veterinarians (70 thousand). This had resulted in a comparative neglect
of disease investigation and control. The synergistic exploitation of these services together
with those established under Operation Flood by NDDB did not materialise. The quality of
services delivered by governmental departments is a matter of serious concern, strapped as
they are by fiscal pressures to meet burgeoning establishment and staff salary costs.
A significant strategy change that was put through was the promulgation of the Milk and
Milk Products Order 1992 which made it mandatory for all plants handling more than 10
thousand litres of milk per day and 500 t of total solids to register themselves and renew
their registration every 3 years. The order also placed limits on the quantity of milk and
restrictions on the areas from which it was collected. Behind this order were genuine fears
expressed by dairy co-operatives that private dairies would live off the past investment made
by them in this sector without contributing to productivity enhancement or committing
capacities to liquid milk supplies. However, on sustained pressure from the private dairies
the order was amended in 1993 rendering it almost toothless. The amendment increased
the registration limit to 75 thousand liters and 3750 t per day.
Breeding policiesA broad national breeding policy was formally put through by the state and central
governments in 1962. The breeding policy covered (a) selective breeding of the pure India
dairy breeds of cattle for milk production, (b) selective breeding of pure Indian draught
breeds of cattle for better draft animals, (c) selective breeding of dual-purpose breeds for
improving both their milk and work outputs, and (d) grading up of the nondescript Indian
cattle with selected India donor breeds for improving their body size and milk/work output.
Crossbreeding was also introduced in nondescript cattle using select exotic breeds and
became the official policy of the government by 1969. It was decided to limit their exotic
inheritance to 50%.
In all these years the basic policy had hardly changed. In formulating the breeding policy
the need of the farmer was never taken into consideration. In spite of the detailed breeding
guidelines, the animals continue to breed as per the wishes of the farmer and the traditional
bull keeper. Another reason for this is the very limited reach of the state machinery.
Although policy guidelines were very clear on crossbreeding, in reality this tool was and
is being indiscriminately used and has led to the dilution of some good Indian breeds.
Another reason is the low improvement achieved through selective breeding of pure
indigenous breeds due to the unavailability of quality breeding bulls and the difficulty in
popularising artificial insemination.
The programme for production of superior quality bulls for breeding caught the
attention of the planners only in the eighth plan period. Adequate allocation was included
for bull production under the eighth plan. However, the State Departments of Animal
Husbandary did not initiate action.
276 South–South Workshop
Parthasarathy
India has perhaps the world’s largest artificial insemination (AI) network for the
breeding of cattle and buffalo—over 30 thousand AI outlets in the government departments
and 10.5 thousand in the milk co-operatives. The ones operated in the government sector
are stationary ones and the farmers have to reach up to them to service their animals. This
becomes a big limitation on their utilisation. The co-operative sector (AI centres) however
delivers services at their village society premises. In spite of the fairly large network, the
system as a whole covers less than 20% of adult female among cattle and less than 10% of
buffalo population. The quality of the services in the government sector is generally
perceived as poor. The government, alive to this fact, has recently instituted a restructuring
of the entire breeding infrastructure, institutions and breeding operations.
Co-operative lawNo study of co-operative dairy development in India is complete without reference to the
broad legal framework in which co-operatives function. The fate of dairying in India is
inextricably linked to the environment and the laws governing co-operatives. Another
peculiar aspect of co-operative dairying in India has been the dual influence it has had to
work under. It is expected to deliver market results as any business organisation should
while conforming to age-old co-operative laws.
One of the impediments affecting the functioning of co-operatives in general is the
restrictive co-operative legislation. Co-operative laws, both central and state, have remained
largely unchanged despite the need for an enabling legislative framework consistent with
the changed economic environment, and the challenges and competition that the
co-operatives are faced with. The present co-operative laws do not provide freedom to the
co-operatives for appointing and removing professionals—timely audit of accounts by hiring
duly qualified auditors and holding elections on their own. Besides, there are several other
restrictive provisions which necessitate co-operatives seeking the prior permission of the
registrar of co-operative societies or the government before taking decisions related to new
investments, use of surplus funds and other business decisions. The provisions contained in
the laws do not enable co-operatives to function in accordance with the principles of
co-operation as enunciated in the International Co-operative Alliance (ICA). On the
contrary, they provide ample opportunities for the politicisation and bureaucratisation of
the co-operatives. The laws in general have inhibited the emergence of true leadership,
professional management and democratic functioning of the co-operatives.
The Government of Andhra Pradesh (in southern India), however, has been a trendsetter
in providing an enabling legislation where genuine co-operatives can flourish. The AP
Mutually Aided Co-operative Societies (APMACS) Act is on the lines of Model Co-operative
Act drafted by a committee appointed by the Planning Commission of India. The APMACS
is a parallel co-operative legislation enacted by the state for the benefit of those co-operatives
which do not need state support in the form of government funds. Subsequent to the
enactment of this Act, NDDB has been encouraging the existing milk unions and their
constituent village dairy co-operatives to get registered under this MACS Act which
provides them freedom for operations at the same time ensuring accountability at all levels.
South–South Workshop 277
National policies supporting smallholder dairy production and marketing: India case study
Two milk unions, namely, Guntur and Visakha in Andhra Pradesh, have already registered
themselves under this Act, and others in AP are expected to follow them. Bihar, Jammu and
Kashmir and Madhya Pradesh are some states, which have followed the example of Andhra
Pradesh and have enacted similar parallel co-operative acts.
At the national level a bill has been tabled before Parliament, prepared on the lines of
Model Co-operative Act to replace the existing Multi-State Co-operative Societies Act 1984.
A few other states such as Mahrashtra and Orissa have also taken initiatives towards parallel
co-operative legislation on the lines of APMACS Act. However, the process involved in the
changes to the co-operative legislation has been found to be very slow and it could take
several years more before other states in the country enact such enabling co-operative
legislation. If co-operatives have to wait for the reforms to take place it is felt that they would
lose ground giving way for the competitors to flourish particularly in view of the prevailing
climate of privatisation, liberalisation and globalisation. Therefore, there should be more
options than are currently available, and co-operatives should choose those best suited to
them. An alternative has been proposed in the form of producer companies bill based on
the recommendation of the Alagh Committee, which recommended that a chapter be
introduced in the existing Companies Act 1956 so as to enable incorporation of
co-operatives as companies, and conversion of existing co-operatives into companies while
accommodating the unique elements of co-operative business within a regulatory
framework similar to that of private limited companies. Thus, the producer company would
be for all practical purpose a co-operative type of enterprise following the principles of
co-operation laid down by the ICA, named as Mutual Assistance Principles in the proposed
Bill. The challenge ahead for NDDB is to educate and encourage the dairy co-operative
unions in the country to come out of their existing legislative framework and get registered
under the new law(s) available.
Education and researchAs early as 1928, the Royal Commission on Agriculture aptly noted in no sphere has scientific
research conferred greater benefit on agriculture than by provision of means of controlling
livestock diseases. Based on its recommendation, the Indian Council of Agricultural Research
(ICAR) was set up in 1929 to undertake, promote and co-ordinate education, research and
extension education in agriculture, including Dairy Science and Animal Husbandry. ICAR
fulfils its responsibility through its own institutions and by supporting the activities in state
agricultural universities and in selected institutions through appropriate assistance and
guidance.
The ICAR system includes several premier national research institutes specifically
addressing problems of the livestock production systems sector-wise, industry-wise and
species-wise. In all, these institutes together employ some 831 scientists, 1025 supporting
staff, and spend annually some Rs. 3951.13 on research.
ICAR and universities of agricultural sciences have some notable and important
successes to their credit. Many would agree, however, that we have a long way to go in
relation to both the need and the investment. Sometimes our research has been unrelated to
278 South–South Workshop
Parthasarathy

the production constraints of farmers and the commercial requirements of the market.
There is a need for incorporating the farmers’ and societal values based on our traditions
into the research agenda, and also look at the reality of farmers’ problems, constraints and
opportunities from the farmers’ perspective rather than from their own.
In respect of research, the national agricultural policy should commit government to a
significant reorientation by accepting the recommendations of the GVK Rao Committee.
One immediate priority would be to refocus our research on the needs of farmers and
consumers through the mechanism of an empowered management committee in each
important area of research. These management committees—which with respect to budget,
planning and operations would function as a Board of Directors—would include a genuine
producer representative, one member each from a co-operative and privately held firm
engaged in the field, a distinguished scientist, a technologist and a chairperson widely
recognised for eminence in that field of agriculture, dairy, forestry, animal husbandry
production. The Department of Agriculture Research and Education in the Ministry of
Agriculture could then reorient its role to centralise administrative and policy concerns,
allowing scientists to return from Krishi Bhavan and other offices to their fields and
laboratories.
The globalisation of research, extension and training must address the global challenge
implied by the comparison of milk output per animal and per capita availability. A quarter
of the world’s dairy cattle produce two-thirds of the milk supply. For example, although
India produces more than 13% of the world’s milk supply, it has over 16% of the world’s
bovine population (1997). All reasons for the low average output per animal in India must
be examined.
Not much attention has been paid to developing linkages with the potential users of
research within the country. NDDB has been very effective in applying research and
development findings to practical situations. More active collaboration between institutions like
NDDB and NDRI would ensure that more of the nation’s scientific resources are harnessed to
tackle the enormous task of enhancing efficiency at all steps in the milk chain—from utilisation
of feed and animal resources to developing new dairy products.
What makes it more urgent in the case of India is the wide gap between the result
achieved in research trials, and the national average for many technical coefficients such as
milk output per animal, calving intervals and processing loss. While productivity
improvement in cereals were stimulated by the Green Revolution in the 1970s, significant
increase in the production of livestock food products in developing countries were only
achieved in the 1980s.
It is high time that government evolves a national research policy on animal science, and
draws up related strategies to rationalise research resources—both human and material—to
ensure accountability and reprioritisation, reducing the number of the research
institutions. It is also necessary to reorganise the management structure of these institutes
and to put them under powerful and apolitical boards, vested with full authority to govern
and control these institutes autonomously.
The need for so many institutions—almost one for each species of domestic animal and
their contributions to the livestock industry over the years—is a matter of concern and needs
very close scrutiny and review by the government.
South–South Workshop 279
National policies supporting smallholder dairy production and marketing: India case study
In the foregoing pages I have set out some of the important facets of national policies
supporting smallholders as they have evolved over the years. The narration is by no means
complete, as it has not looked at linkages in terms of shrinking common property resources
with its attendant freewheeling exploitation of such resources by vested interests in the
villages. That would merit a separate paper covering natural resource management area, a
subject by itself. Similarly, I have not looked at disease surveillance, disease prevention and
other such development tasks. That would involve a discussion of the role of government
and restructuring government services and delivery systems to limit itself to tasks that are
best characterised as ‘public good’ activities, and essentially performing its governance role.
Liberalisation of the Indian economy and the dairysectorMarginal and small farmers constitute the core dairy production group in India and they,
along with the landless, constitute over 75% of all milk producers in the country (as also
membership of milk co-operatives). The benefits of liberalisation of the Indian economy
unfortunately have completely bypassed them. For example, the single most critical
legislation dealing with their livelihoods, the Co-operative Societies Act, is yet to be
liberalised. The act in its present form is restrictive and continues to inhibit the potential
and growth of the co-operative movement.
The GATT Agreement and the WTO Regulations now expose them to global
competition, while the Indian Government has not been able to provide them the
minimum protection and support measures permissible under the WTO, under provisions
for poverty alleviation and livelihood protection. India’s inability to conform to the SPS
regulations (animal epidemic control) further compounds the misery of the Indian
smallholder, as Indian livestock products on this count are precluded from the world
markets. Even under the minimum access clause, India finds it difficult to export livestock
products, while under the same clause India is obliged to allow imports. In spite of these
consequences India is yet to put together legislations with pervasive, nation-wide
jurisdiction to prevent and control animal epidemics.
The codex standards for foods of livestock origin are far too stringent and are applied
differentially for the developed and developing countries, even though they are to be based
on science and hazard analysis. Unfortunately they are often not and member countries
(developed countries especially) are permitted to alter and enhance the standards according
to their individual threat perceptions. India’s bound tariffs for milk products are quite low
compared with those of most developed countries: 40% except for fresh milk which is
100%; yoghurt, buttermilk and whey products: 50% and milk powders 0%! Recent
negotiations have helped India to raise tariff for milk powders to 15% for import of up to 10
thousand tonnes and 60% for quantities over 10 thousand tonnes.
280 South–South Workshop
Parthasarathy
Marketing in the co-operative sectorA beginning for mutual co-operation for marketing of milk and products among the milk
unions in Gujarat started with the formation of the Gujarat Co-operative Milk Marketing
Federation (GCMMF) in the early seventies. This was carried forward to include the entire
co-operative network under Operation Flood when the National Co-operative Dairy
Federation of India was activated and relocated in Anand. The natural next step for the
co-operatives was to pool brand equity among the member federations and to initiate joint
marketing under the now famous Operation Flood logo. Joint programming of the product
mix and sharing the production responsibility among the NCDFI member federations/
unions have forged a formidable marketing block for the milk co-operatives in India.
The futureFlowing from the narration of the evolution of policies supporting small dairy holders, the
following would be the areas which need the attention of planners:
1. amendment in the co-operative laws and provision of alternative legal frameworks for
loosening the current restrictive control over the co-operatives
2. enacting laws for control of infectious diseases of animals, disease surveillance, drug and
vaccine quality enforcement
3. productivity enhancement to make milk production far more remunerative
4. quality of milk products to be improved to bring them in line with international
standards
5. streamline policies in the area of commodity import
6. monitor world trade scenario including tariff and non-tariff barriers, dumping, etc. to
protect our farmers
7. redefining the role of government in this sector including the service delivery system,
establishing autonomous livestock development boards to take charge of current
governmental infrastructure and
8. impact evaluation of Operation Flood on rural dairy sector.
South–South Workshop 281
National policies supporting smallholder dairy production and marketing: India case study

A case study on environmental impacts ofperi-urban dairy colonies in Thailand:Environmental impacts of old and newdairy farmsP. Skunmun and C. Chantalakhana
Buffalo and Beef Production Research and Development (R&D) CentreSuwanvajokkasikit Animal R&D Institute, Kasetsart University,P.O. Box 1014, Kasetsart PO, Chathuchak, Bangkok 10903, Thailand
IntroductionDuring recent years there has appeared to be more public concern in Thailand about the
impacts of animal production, especially pig and poultry farming, on human well being
and the environment. Moreover, due to the expansion of residential areas and
urbanisation, many animal farms that used to be located outside cities have found
themselves in community housing areas or peri-urban areas. Smallholder dairy farms
are generally centred around a milk collection centre or co-operative milk processing
facilities. In many cases, due to the limitation of land area and the increase in number of
family farms, the disposal of dairy wastes can become a potential threat to the
community environment. It is therefore important to study the long-term impact of
smallholder dairy farming on the environment, especially in situations where dairy
wastes have not been fully managed.
Nong Pho was once a rural dairy farming area (between 1960 and 1980) but due to
increasing urbanisation it has nowadays become peri-urban (Chantalakhana and Skunmun
2002). Farmlands have been fragmented because of population growth, while lack of waste
management and disposal systems on congested smallholder dairy farms have in the long
term appeared to cause degradation of farm environmental conditions. Nong Pho Dairy
Co-operative (NPDC) could serve as a good case to study possible impacts of smallholder
dairying on farm environments, illustrating what happens if animal wastes are not well
managed. Lessons learned from such a study could help identify ways and means of
conserving environmental quality. Therefore, this study aims to examine water, soil and air
quality on dairy, and to assess the possible impacts of dairying on farmers and their
neighbouring households.
282 South–South Workshop

Methodology
Site of investigation and farm samplesForty-seven smallholder dairy farms were used in this study, 43 farms from an older dairy
co-operative (NPDC) and 4 farms from a relatively new one (Kamphaengsaen Dairy
Co-operative, KSDC) located in Kamphaengsaen (KS) District, Nakhon Pathom Province.
The two groups of farms were located approximately 30 km apart; agro-ecological
conditions were similar for both groups.
Nong Pho (NP) dairy farms were purposely chosen from three areas: (A) an irrigated
area where irrigation canals were available and existing dairy farms tended to be more
congested; (B) a municipality area where certain public facilities, such as roads, telephones
and sewage systems were available; and (C) a factory area where some manufacturing
factories existed among dairy farms and could compete for certain resources, such as
labour supplies at certain times of the year (Skunmun et al. 1999). From each specified
area, three groups of sample dairy farms were chosen according to three different level of
farm crowdedness (density), i.e. (NP1) very crowded, (NP2) crowded and (NP3) not
crowded (see Table 1). Crowdedness of sample farms was based on physical proximity to
neighbouring farms, stocking rates, location of dairy barns (e.g. barn under the house,
barn attached to the house, barn separate but close to the house etc.) and surrounding
conditions. Classification of the degree of farm crowdedness was based on subjective
judgement of the co-operative dairy extension workers and the researchers. It was
anticipated that more crowded farms would have greater difficulty in disposing of animal
wastes and that this would be reflected by waste parameters measured by chemical analyses
of farm water, soil and air.
Table 1. Classification of investigated farms by area and level of crowdedness.
Level of crowdedness
Area NP1 NP2 NP3 KS
A 5 7 3
B 4 6 4
C 5 5 4
Total 43 4
KS = Kamphaengsaen; NP1 = Nong Pho: very crowded;NP2 = Nong Pho: crowded; NP3 = Nong Pho: not crowded;A = irrigated areas; B = municipality areas; C = factory areas.
Data collectionData concerning economic background of farm families and general farming practices
were recorded at the beginning of this study (November 1996) through farmer interviews
at farm sites using a prepared questionnaire, and direct observation or data collection by
project technicians.
South–South Workshop 283
A case study on environmental impacts of peri-urban dairy colonies in Thailand
Data concerning smallholder dairy production systems and management of resources
included animal stock, housing and management, feed and feeding, milk and milking and
manure and wastes.
Data were collected concerning the effects of dairy waste on the quality of water, soil
and air.
Water samplesWater samples consisted of water from three sources: wastewater from dairy barns, well
water and water from public waterways passing near to sample farms.
Wastewater
Wastewater samples were collected from liquid-waste disposal ditches behind cow barns;
these ditches had cement or earthen floors. One sample of wastewater from each farm was
collected every month during a 12-month period (May 1996 to April 1997) for
physicochemical analysis. The following wastewater parameters were measured: pH value,
electrical conductivity (EC), total solids (TS), chemical oxygen demand (COD), biological
oxygen demand (BOD), ammonia nitrogen (NH3-N) and nitrate nitrogen (NO3-N).
Well water
Most smallholder dairy farms (63–77%) at NP and all farms at KS obtained their water
supply from deep wells. Samples were collected from wells of NP farms at the depths of 6 m
(n = 1); 20–30 m (n = 5); and 32–50 m (n = 7); and from a KS farm at the depth of 32–50 m (n
= 1). A water sample from each well was taken three times/year (i.e. in May (summer), July
(rainy season) and January (cool season)) for physicochemical analysis. The following
properties were measured: pH value, hardness, EC, and levels of chloride, nitrate, total
coliforms and faecal coliforms.
Water from public waterways
Water samples from public waterways were collected at four locations (small canals) at NP.
For each location, 1 sample was collected every month for 12 months, so that
physicochemical analysis could be carried out to measure the same set of parameters as
examined for wastewater from the dairy barns.
Soil samplesOn 16 farms at NP and 1 farm at KS, soil samples from farm areas that farmers commonly
used for drying and storing manure were collected once every season (in May, August and
January) for chemical analysis. The following soil parameters were measured: pH value, EC
and levels of potassium (K), phosphate (P2O5), total nitrogen (N), NH3-N, and NO3-N.
284 South–South Workshop
Skunmun and Chantalakana
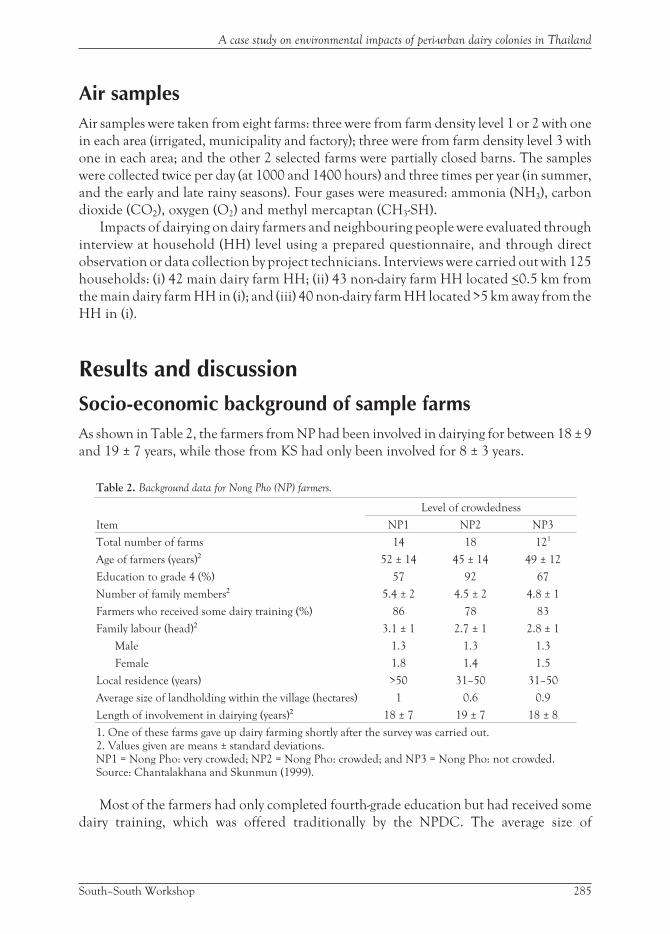
Air samplesAir samples were taken from eight farms: three were from farm density level 1 or 2 with one
in each area (irrigated, municipality and factory); three were from farm density level 3 with
one in each area; and the other 2 selected farms were partially closed barns. The samples
were collected twice per day (at 1000 and 1400 hours) and three times per year (in summer,
and the early and late rainy seasons). Four gases were measured: ammonia (NH3), carbon
dioxide (CO2), oxygen (O2) and methyl mercaptan (CH3-SH).
Impacts of dairying on dairy farmers and neighbouring people were evaluated through
interview at household (HH) level using a prepared questionnaire, and through direct
observation or data collection by project technicians. Interviews were carried out with 125
households: (i) 42 main dairy farm HH; (ii) 43 non-dairy farm HH located <0.5 km from
the main dairy farm HH in (i); and (iii) 40 non-dairy farm HH located >5 km away from the
HH in (i).
Results and discussion
Socio-economic background of sample farmsAs shown in Table 2, the farmers from NP had been involved in dairying for between 18 ± 9
and 19 ± 7 years, while those from KS had only been involved for 8 ± 3 years.
Table 2. Background data for Nong Pho (NP) farmers.
Level of crowdedness
Item NP1 NP2 NP3
Total number of farms 14 18 121
Age of farmers (years)2 52 ± 14 45 ± 14 49 ± 12
Education to grade 4 (%) 57 92 67
Number of family members2 5.4 ± 2 4.5 ± 2 4.8 ± 1
Farmers who received some dairy training (%) 86 78 83
Family labour (head)2 3.1 ± 1 2.7 ± 1 2.8 ± 1
Male 1.3 1.3 1.3
Female 1.8 1.4 1.5
Local residence (years) >50 31–50 31–50
Average size of landholding within the village (hectares) 1 0.6 0.9
Length of involvement in dairying (years)2 18 ± 7 19 ± 7 18 ± 8
1. One of these farms gave up dairy farming shortly after the survey was carried out.2. Values given are means ± standard deviations.NP1 = Nong Pho: very crowded; NP2 = Nong Pho: crowded; and NP3 = Nong Pho: not crowded.Source: Chantalakhana and Skunmun (1999).
Most of the farmers had only completed fourth-grade education but had received some
dairy training, which was offered traditionally by the NPDC. The average size of
South–South Workshop 285
A case study on environmental impacts of peri-urban dairy colonies in Thailand
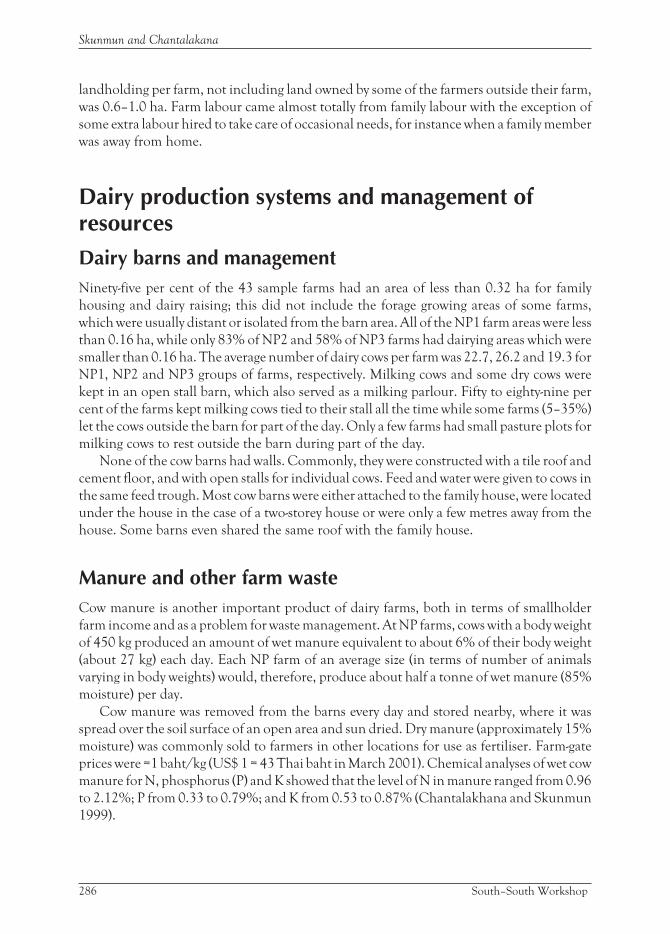
landholding per farm, not including land owned by some of the farmers outside their farm,
was 0.6–1.0 ha. Farm labour came almost totally from family labour with the exception of
some extra labour hired to take care of occasional needs, for instance when a family member
was away from home.
Dairy production systems and management ofresources
Dairy barns and managementNinety-five per cent of the 43 sample farms had an area of less than 0.32 ha for family
housing and dairy raising; this did not include the forage growing areas of some farms,
which were usually distant or isolated from the barn area. All of the NP1 farm areas were less
than 0.16 ha, while only 83% of NP2 and 58% of NP3 farms had dairying areas which were
smaller than 0.16 ha. The average number of dairy cows per farm was 22.7, 26.2 and 19.3 for
NP1, NP2 and NP3 groups of farms, respectively. Milking cows and some dry cows were
kept in an open stall barn, which also served as a milking parlour. Fifty to eighty-nine per
cent of the farms kept milking cows tied to their stall all the time while some farms (5–35%)
let the cows outside the barn for part of the day. Only a few farms had small pasture plots for
milking cows to rest outside the barn during part of the day.
None of the cow barns had walls. Commonly, they were constructed with a tile roof and
cement floor, and with open stalls for individual cows. Feed and water were given to cows in
the same feed trough. Most cow barns were either attached to the family house, were located
under the house in the case of a two-storey house or were only a few metres away from the
house. Some barns even shared the same roof with the family house.
Manure and other farm wasteCow manure is another important product of dairy farms, both in terms of smallholder
farm income and as a problem for waste management. At NP farms, cows with a body weight
of 450 kg produced an amount of wet manure equivalent to about 6% of their body weight
(about 27 kg) each day. Each NP farm of an average size (in terms of number of animals
varying in body weights) would, therefore, produce about half a tonne of wet manure (85%
moisture) per day.
Cow manure was removed from the barns every day and stored nearby, where it was
spread over the soil surface of an open area and sun dried. Dry manure (approximately 15%
moisture) was commonly sold to farmers in other locations for use as fertiliser. Farm-gate
prices were =1 baht/kg (US$ 1 = 43 Thai baht in March 2001). Chemical analyses of wet cow
manure for N, phosphorus (P) and K showed that the level of N in manure ranged from 0.96
to 2.12%; P from 0.33 to 0.79%; and K from 0.53 to 0.87% (Chantalakhana and Skunmun
1999).
286 South–South Workshop
Skunmun and Chantalakana

It was estimated that the total number of about 4000 smallholder NP farms produced 2
million kilogrammes or 2000 t of cow manure each day, plus an approximately equal
amount (by weight) of wastewater and other liquid wastes, such as animal urine. If not
properly managed and utilised these animal wastes could create pollution problems to farm
environments and surrounding areas (Tietjen 1987; Archer and Nicholson 1992; Wood
and Hattey 1995; Daliparthy et al. 1995; Paik et al. 1996). The status of cattle wastes
management and utilisation in smallholder NP farms is shown in Figure 1.
Effect of dairy wastes on water, soil and air
Water
Differences in wastewater parameters between old and new dairyfarms
Physicochemical properties of wastewater were studied during a 12-month period to
compare a group of smallholder dairy farms (43 farms) from older sites (NP) with another
group (4 farms) from new site (KS). Results indicated consistently that wastewater samples
from NP farms had higher levels of every parameter than samples from KS farms. Figures 2,
3 and 4 show monthly averages for TS, COD and BOD in the two groups of farms. For each
South–South Workshop 287
A case study on environmental impacts of peri-urban dairy colonies in Thailand
Dairy farm
Waste
(Manure, urine, liquid waste, waste water)
Solid manure Liquid wastes
Own
useDry for
sale
Excess
manureCollecting tank
Public canals
Public areas
Neighbouring
area
Pollution
Piling
Leaching in
neighbouring
area
Forage plots
Vegetables
Orchard trees
Dairy farmDairy farm
Waste
(Manure, urine, liquid waste, waste water)
Waste
(Manure, urine, liquid waste, waste water)
Solid manureSolid manure Liquid wastesLiquid wastes
Own
use
Own
useDry for
sale
Dry for
sale
Excess
manure
Excess
manureCollecting tankCollecting tank
Public canals
Public areas
Neighbouring
area
Public canals
Public areas
Neighbouring
area
PollutionPollution
Piling
Leaching in
neighbouring
area
Piling
Leaching in
neighbouring
area
Forage plots
Vegetables
Orchard trees
Forage plots
Vegetables
Orchard trees
Figure 1. Use of dairy wastes and management of their excess on smallholder farms.

month, analysis of variance was used to compare the water parameters of NP farms (NP1,
NP2 and NP3) and those of KS farms (see Chantalakhana et al. 1999 for more details). The
least significant difference (lsd) was used to test the difference among the sample means of
the four groups (Table 3).
288 South–South Workshop
Skunmun and Chantalakana
0
0.5
1
1.5
May-96 Jun Jul Aug Sep Oct Nov Dec Jan-97 Feb Mar Apr
0
100
200
300
400
NP1 NP2 NP3 KS Rainfall
0
0.5
1
1.5
May-96 Jun Jul Aug Sep Oct Nov Dec Jan-97 Feb Mar Apr
0
100
200
300
400
NP1 NP2 NP3 KS Rainfall
KS = Kamphaengsaen; NP1 = Nong Pho: very crowded; NP2 = Nong Pho: crowded; NP3 = Nong Pho: notcrowded.Figure 2. Monthly averages of TS (total solids) in wastewater from the dairy farms.
0
2000
4000
6000
8000
10,000
12,000
14,000
May-96 Jun Jul Aug Sep Oct Nov Dec Jan-97 Feb Mar Apr
0
100
200
300
400
NP1 NP2 NP3 KS Rainfall
0
2000
4000
6000
8000
10,000
12,000
14,000
May-96 Jun Jul Aug Sep Oct Nov Dec Jan-97 Feb Mar Apr
0
100
200
300
400
NP1 NP2 NP3 KS Rainfall
KS = Kamphaengsaen; NP1 = Nong Pho: very crowded; NP2 = Nong Pho: crowded; NP3 = Nong Pho: notcrowded.
Figure 3. Monthly averages of COD (chemical oxygen demand) in wastewater from the dairy farms.
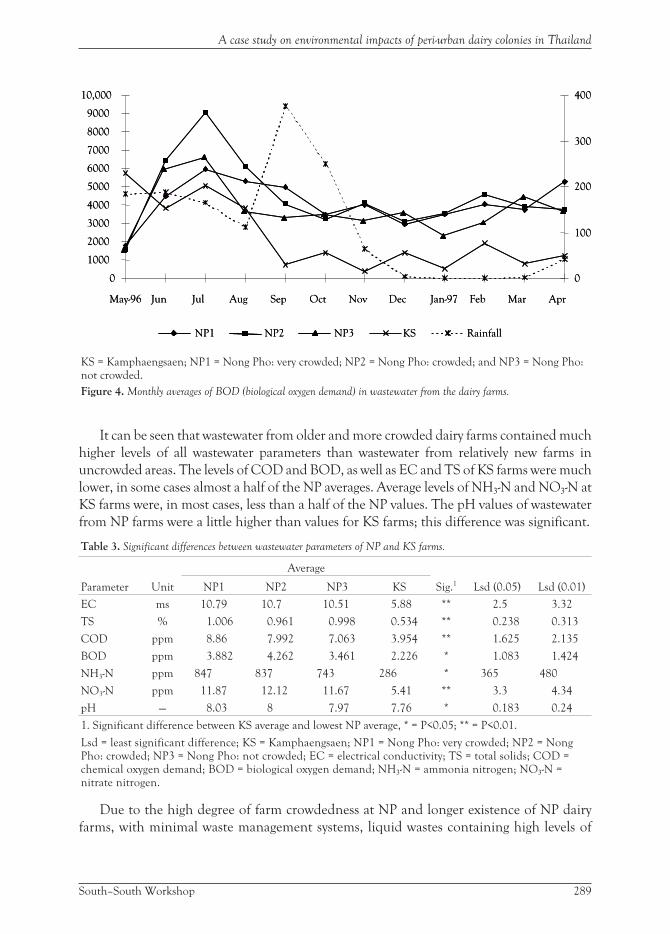
It can be seen that wastewater from older and more crowded dairy farms contained much
higher levels of all wastewater parameters than wastewater from relatively new farms in
uncrowded areas. The levels of COD and BOD, as well as EC and TS of KS farms were much
lower, in some cases almost a half of the NP averages. Average levels of NH3-N and NO3-N at
KS farms were, in most cases, less than a half of the NP values. The pH values of wastewater
from NP farms were a little higher than values for KS farms; this difference was significant.
Table 3. Significant differences between wastewater parameters of NP and KS farms.
Parameter Unit
Average
Sig.1 Lsd (0.05) Lsd (0.01)NP1 NP2 NP3 KS
EC ms 10.79 10.7 10.51 5.88 ** 2.5 3.32
TS % 1.006 0.961 0.998 0.534 ** 0.238 0.313
COD ppm 8.86 7.992 7.063 3.954 ** 1.625 2.135
BOD ppm 3.882 4.262 3.461 2.226 * 1.083 1.424
NH3-N ppm 847 837 743 286 * 365 480
NO3-N ppm 11.87 12.12 11.67 5.41 ** 3.3 4.34
pH — 8.03 8 7.97 7.76 * 0.183 0.24
1. Significant difference between KS average and lowest NP average, * = P<0.05; ** = P<0.01.
Lsd = least significant difference; KS = Kamphaengsaen; NP1 = Nong Pho: very crowded; NP2 = NongPho: crowded; NP3 = Nong Pho: not crowded; EC = electrical conductivity; TS = total solids; COD =chemical oxygen demand; BOD = biological oxygen demand; NH3-N = ammonia nitrogen; NO3-N =nitrate nitrogen.
Due to the high degree of farm crowdedness at NP and longer existence of NP dairy
farms, with minimal waste management systems, liquid wastes containing high levels of
South–South Workshop 289
A case study on environmental impacts of peri-urban dairy colonies in Thailand
0
1000
2000
3000
4000
5000
6000
7000
8000
9000
10,000
May-96 Jun Jul Aug Sep Oct Nov Dec Jan-97 Feb Mar Apr
0
100
200
300
400
NP1 NP2 NP3 KS Rainfall
0
1000
2000
3000
4000
5000
6000
7000
8000
9000
10,000
May-96 Jun Jul Aug Sep Oct Nov Dec Jan-97 Feb Mar Apr
0
100
200
300
400
NP1 NP2 NP3 KS Rainfall
KS = Kamphaengsaen; NP1 = Nong Pho: very crowded; NP2 = Nong Pho: crowded; and NP3 = Nong Pho:not crowded.
Figure 4. Monthly averages of BOD (biological oxygen demand) in wastewater from the dairy farms.

organic and inorganic substances were being released from dairy barns into the surrounding
areas. These substances could eventually cause serious environmental pollution. The KS
dairy farms were newer, were located in a more open and expanded area, and were releasing
wastewater, which appeared to contain less organic and inorganic substances than
wastewater from NP farms. In the long term, however, the situation of KS farms could
become similar to that of NP farms if dairy farming becomes more intensive without the
development of effective waste management facilities.
Differences in wastewater parameters due to other factors
For the NP farm data, analysis of variance for each parameter of the wastewater was
conducted using hierarchical classification with unequal subclass numbers (see
Chantalakhana et al. 1999 for more details).
Seasonal variation
The differences in wastewater parameters due to season (i.e. summer (March–June), rainy
season (July–October) and dry or cool season (November–February)) were not significant
except for NO3-N (P<0.05). The differences between months within season were highly
significant for BOD and TS but not significant for the other parameters.
Variation due to area and farm crowdedness
The differences in wastewater parameters between different farm areas (irrigated,
municipality and factory) were not significant except that for NO3-N (P<0.05). The
12-month average of NO3-N in wastewater from the farms in irrigated areas (13.4 ppm) was
slightly higher than the averages for the other two areas (10.1 and 10.5 ppm, respectively).
Degree of farm crowdedness had highly significant effects on the values for COD and BOD,
with very crowded farms in irrigated and municipality areas having the highest averages, but
the highest values being seen in some crowded farms in factory areas. The differences in EC
values due to farm crowdedness were also significant, while differences for the rest of the
parameters (pH, TS, NH3-N and NO3-N) were not.
Relationships between wastewater parametersSimple correlation coefficients between pairs of the wastewater parameters were calculated
for each month of the 12-month period. The correlation estimates, which were consistently
significant or highly significant, are shown in Table 4. Some wastewater parameters were
highly correlated, for example TS with COD, BOD and NH3-N, and COD with BOD. These
results indicated that when certain parameters were highly correlated, the level of one could be
used to predict the level of the other. This information can be particularly useful when
chemical analysis of a particular parameter in wastewater is not possible either due to high
costs or a lack of laboratory equipment. For example, EC was highly correlated with TS in this
290 South–South Workshop
Skunmun and Chantalakana
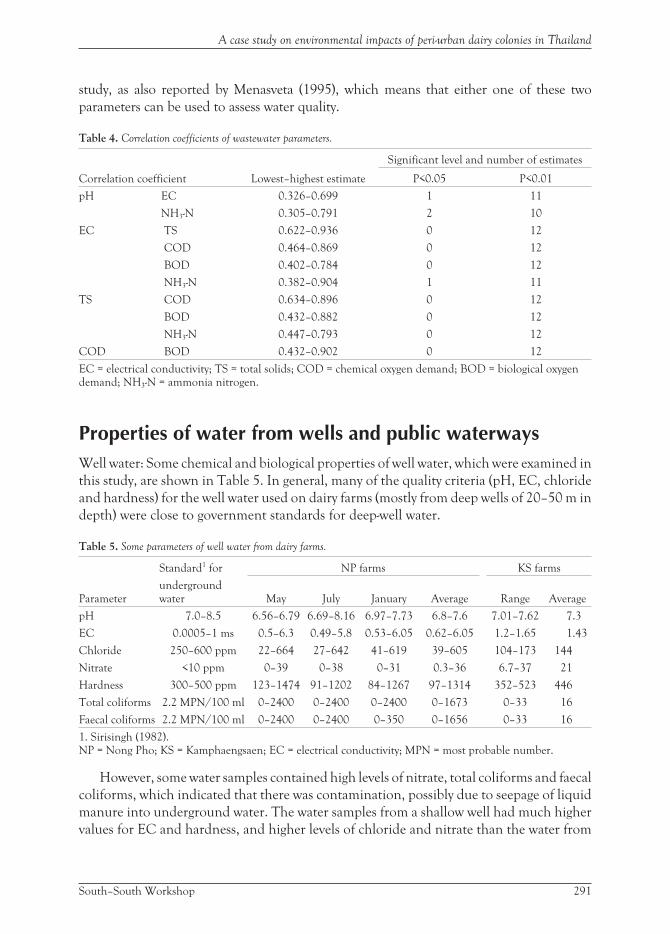
study, as also reported by Menasveta (1995), which means that either one of these two
parameters can be used to assess water quality.
Table 4. Correlation coefficients of wastewater parameters.
Correlation coefficient Lowest–highest estimate
Significant level and number of estimates
P<0.05 P<0.01
pH EC 0.326–0.699 1 11
NH3-N 0.305–0.791 2 10
EC TS 0.622–0.936 0 12
COD 0.464–0.869 0 12
BOD 0.402–0.784 0 12
NH3-N 0.382–0.904 1 11
TS COD 0.634–0.896 0 12
BOD 0.432–0.882 0 12
NH3-N 0.447–0.793 0 12
COD BOD 0.432–0.902 0 12
EC = electrical conductivity; TS = total solids; COD = chemical oxygen demand; BOD = biological oxygendemand; NH3-N = ammonia nitrogen.
Properties of water from wells and public waterwaysWell water: Some chemical and biological properties of well water, which were examined in
this study, are shown in Table 5. In general, many of the quality criteria (pH, EC, chloride
and hardness) for the well water used on dairy farms (mostly from deep wells of 20–50 m in
depth) were close to government standards for deep-well water.
Table 5. Some parameters of well water from dairy farms.
Standard1 for NP farms KS farms
Parameterundergroundwater May July January Average Range Average
pH 7.0–8.5 6.56–6.79 6.69–8.16 6.97–7.73 6.8–7.6 7.01–7.62 7.3
EC 0.0005–1 ms 0.5–6.3 0.49–5.8 0.53–6.05 0.62–6.05 1.2–1.65 1.43
Chloride 250–600 ppm 22–664 27–642 41–619 39–605 104–173 144
Nitrate <10 ppm 0–39 0–38 0–31 0.3–36 6.7–37 21
Hardness 300–500 ppm 123–1474 91–1202 84–1267 97–1314 352–523 446
Total coliforms 2.2 MPN/100 ml 0–2400 0–2400 0–2400 0–1673 0–33 16
Faecal coliforms 2.2 MPN/100 ml 0–2400 0–2400 0–350 0–1656 0–33 16
1. Sirisingh (1982).NP = Nong Pho; KS = Kamphaengsaen; EC = electrical conductivity; MPN = most probable number.
However, some water samples contained high levels of nitrate, total coliforms and faecal
coliforms, which indicated that there was contamination, possibly due to seepage of liquid
manure into underground water. The water samples from a shallow well had much higher
values for EC and hardness, and higher levels of chloride and nitrate than the water from
South–South Workshop 291
A case study on environmental impacts of peri-urban dairy colonies in Thailand
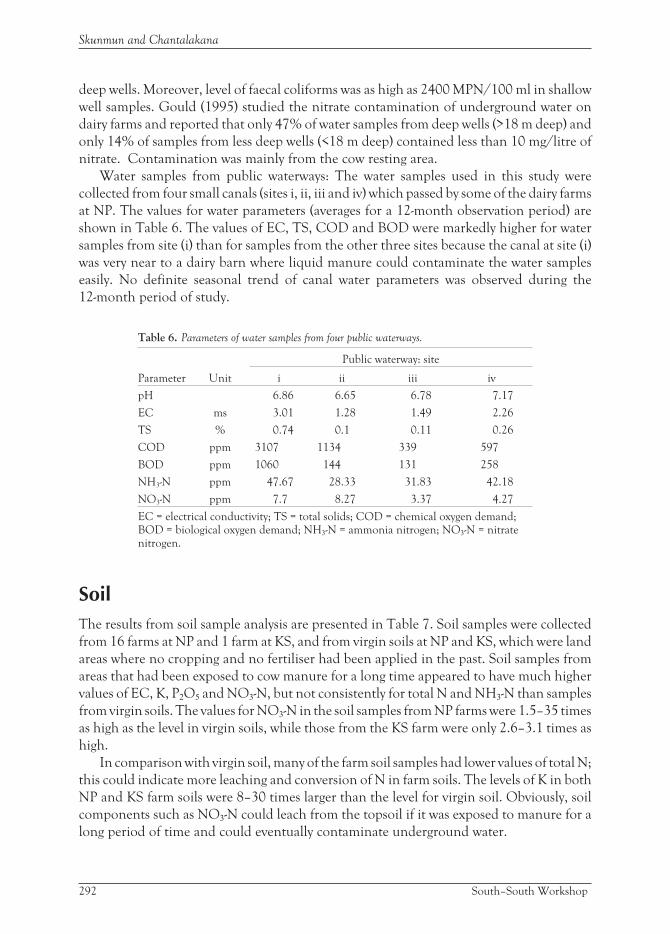
deep wells. Moreover, level of faecal coliforms was as high as 2400 MPN/100 ml in shallow
well samples. Gould (1995) studied the nitrate contamination of underground water on
dairy farms and reported that only 47% of water samples from deep wells (>18 m deep) and
only 14% of samples from less deep wells (<18 m deep) contained less than 10 mg/litre of
nitrate. Contamination was mainly from the cow resting area.
Water samples from public waterways: The water samples used in this study were
collected from four small canals (sites i, ii, iii and iv) which passed by some of the dairy farms
at NP. The values for water parameters (averages for a 12-month observation period) are
shown in Table 6. The values of EC, TS, COD and BOD were markedly higher for water
samples from site (i) than for samples from the other three sites because the canal at site (i)
was very near to a dairy barn where liquid manure could contaminate the water samples
easily. No definite seasonal trend of canal water parameters was observed during the
12-month period of study.
Table 6. Parameters of water samples from four public waterways.
Parameter Unit
Public waterway: site
i ii iii iv
pH 6.86 6.65 6.78 7.17
EC ms 3.01 1.28 1.49 2.26
TS % 0.74 0.1 0.11 0.26
COD ppm 3107 1134 339 597
BOD ppm 1060 144 131 258
NH3-N ppm 47.67 28.33 31.83 42.18
NO3-N ppm 7.7 8.27 3.37 4.27
EC = electrical conductivity; TS = total solids; COD = chemical oxygen demand;BOD = biological oxygen demand; NH3-N = ammonia nitrogen; NO3-N = nitratenitrogen.
SoilThe results from soil sample analysis are presented in Table 7. Soil samples were collected
from 16 farms at NP and 1 farm at KS, and from virgin soils at NP and KS, which were land
areas where no cropping and no fertiliser had been applied in the past. Soil samples from
areas that had been exposed to cow manure for a long time appeared to have much higher
values of EC, K, P2O5 and NO3-N, but not consistently for total N and NH3-N than samples
from virgin soils. The values for NO3-N in the soil samples from NP farms were 1.5–35 times
as high as the level in virgin soils, while those from the KS farm were only 2.6–3.1 times as
high.
In comparison with virgin soil, many of the farm soil samples had lower values of total N;
this could indicate more leaching and conversion of N in farm soils. The levels of K in both
NP and KS farm soils were 8–30 times larger than the level for virgin soil. Obviously, soil
components such as NO3-N could leach from the topsoil if it was exposed to manure for a
long period of time and could eventually contaminate underground water.
292 South–South Workshop
Skunmun and Chantalakana

Table 7. Physicochemical analysis of soil samples from dairy farms.
Parameter
NP virgin soil NP (16 farms)
1 2 May August January Average
pH 6.81 7.53 6.47–8.29 6.45–7.56 6.89–8.24 6.70–7.88
EC 0.05 0.54 0.30–1.85 0.23–1.50 0.23–1.20 0.31–1.45
K 100.4 90.1 1244–3851 387–3264 914–2884 848–3176
P2O5 7.9 7.88 7.1–169.3 26.5–369.1 6.5–194.7 14.4–224.3
Total N 0.06 0.09 0.003–0.064 0.006–0.670 0.084–0.300 0.046–0.120
NH3–N 1.05 0.52 0.10–1.22 0–1.75 0.52–1.40 0.44–0.96
NO3–N 0.91 0.84 3.36–31.92 1.40–13.16 1.40–8.57 3.10–13.77
Parameter KS virgin soil
KS (1 farm)
May August March Average
pH 7.58 8.55 8.22 8 8.26
EC 0.52 0.35 0.49 2.8 1.21
K 315 1904.9 1804 1604.5 1771.1
P2O5 13.75 13.49 56.31 97.94 55.91
Total N 0.015 0.02 0.02 0.09 0.04
NH3–N 0.98 1.22 0.35 0.28 0.62
NO3–N 1.75 5.35 4.55 6.16 5.37
NP = Nong Pho; KS = Kamphaengsaen; EC = electrical conductivity (ms); K = potassium (mg/kg); P2O5 =phosphate (mg/100g); total N = total nitrogen (g/100g); NH3-N = ammonia nitrogen (mg/100g); NO3-N =nitrate nitrogen (mg/100g).
AirConcentrations of four gases (O2, CO2, CH3-SH and NH3) were determined in the barns of
eight dairy farms at NP. Samples were collected from one NP1 or NP2 farm and one NP3
farm in each area (irrigated, municipality and factory) and from two partially closed barns.
There were no significant differences between the amounts of O2 and CO2 measured at
1000 and 1400 hours, or among the barns. The average levels of O2 in the barns were 20.19
and 20.62% in March–April and May–June, respectively (range 19 to 21%), while the
standard level of O2 in the atmosphere is 21%.
According to Thai regulations for working in partially enclosed places, the O2 level
should not be lower than 18%, while the USA Occupational Safety and Health Act of 1970
cites a level of 19.5%. The average levels of CO2 in the barns were 0.039 and 0.032% in
March–April and May–June, respectively (range 0.03–0.05%), which were close to the
normal level of CO2 in the atmosphere (0.03%) (Muller 1987). CH3-SH, which normally
has a bad smell, was undetectable in the barns. However, the instrument used could only
detect this gas when the concentration was higher than 5 ppm. The levels of NH3 varied
from 0.04 to 3.33 ppm ; the highest level was found in one of the partially enclosed barns at
1400 hours. Seasonal differences in levels of these gases in the dairy barns determined at
1000 and 1400 hours are shown in Table 8. In the case of NH3, an 8-hour air collection in
the dairy barns was also conducted to trap the amount of NH3 emitted from dairy wastes
South–South Workshop 293
A case study on environmental impacts of peri-urban dairy colonies in Thailand
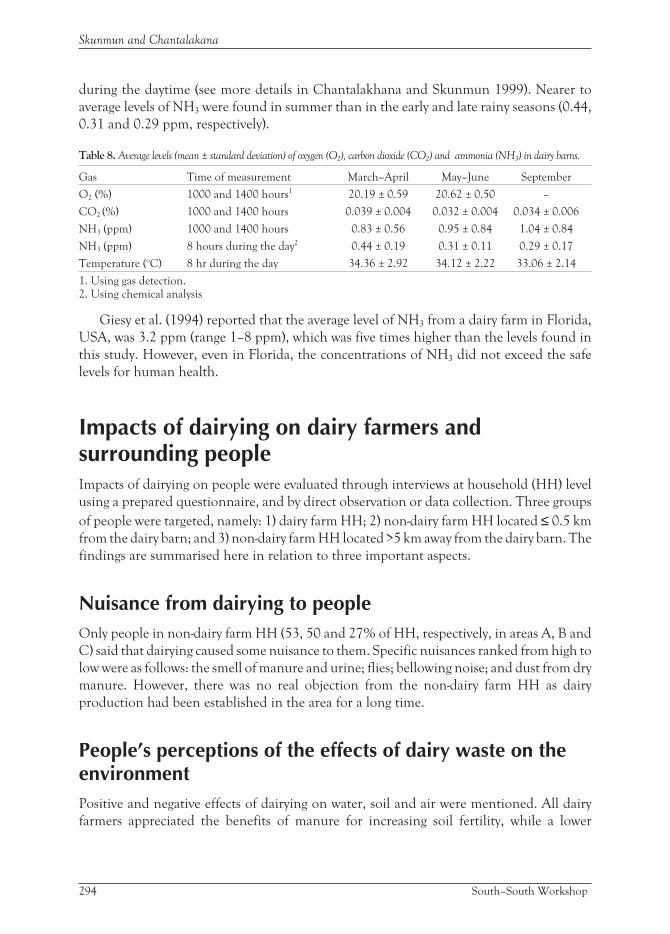
during the daytime (see more details in Chantalakhana and Skunmun 1999). Nearer to
average levels of NH3 were found in summer than in the early and late rainy seasons (0.44,
0.31 and 0.29 ppm, respectively).
Table 8. Average levels (mean ± standard deviation) of oxygen (O2), carbon dioxide (CO2) and ammonia (NH3) in dairy barns.
Gas Time of measurement March–April May–June September
O2 (%) 1000 and 1400 hours1 20.19 ± 0.59 20.62 ± 0.50 –
CO2 (%) 1000 and 1400 hours 0.039 ± 0.004 0.032 ± 0.004 0.034 ± 0.006
NH3 (ppm) 1000 and 1400 hours 0.83 ± 0.56 0.95 ± 0.84 1.04 ± 0.84
NH3 (ppm) 8 hours during the day2 0.44 ± 0.19 0.31 ± 0.11 0.29 ± 0.17
Temperature (oC) 8 hr during the day 34.36 ± 2.92 34.12 ± 2.22 33.06 ± 2.14
1. Using gas detection.2. Using chemical analysis
Giesy et al. (1994) reported that the average level of NH3 from a dairy farm in Florida,
USA, was 3.2 ppm (range 1–8 ppm), which was five times higher than the levels found in
this study. However, even in Florida, the concentrations of NH3 did not exceed the safe
levels for human health.
Impacts of dairying on dairy farmers andsurrounding peopleImpacts of dairying on people were evaluated through interviews at household (HH) level
using a prepared questionnaire, and by direct observation or data collection. Three groups
of people were targeted, namely: 1) dairy farm HH; 2) non-dairy farm HH located ≤ 0.5 km
from the dairy barn; and 3) non-dairy farm HH located >5 km away from the dairy barn. The
findings are summarised here in relation to three important aspects.
Nuisance from dairying to peopleOnly people in non-dairy farm HH (53, 50 and 27% of HH, respectively, in areas A, B and
C) said that dairying caused some nuisance to them. Specific nuisances ranked from high to
low were as follows: the smell of manure and urine; flies; bellowing noise; and dust from dry
manure. However, there was no real objection from the non-dairy farm HH as dairy
production had been established in the area for a long time.
People’s perceptions of the effects of dairy waste on theenvironmentPositive and negative effects of dairying on water, soil and air were mentioned. All dairy
farmers appreciated the benefits of manure for increasing soil fertility, while a lower
294 South–South Workshop
Skunmun and Chantalakana
percentage of those in group 2 (7–14%) indicated an adverse effect of manure on soil
salinisation. Most people in non-dairy farm groups agreed that dairying created undesirable
smells and water pollution to the community. All dairy farmers argued that dairy wastes
created water pollution at NP for only a short period of time in the rainy season, but that this
was much less than the pollution caused by wastewater from factories located around NP.
People’s healthResults showed no significant difference in the disease incidences in a year and similar
percentages of occurrences among the three groups of people. Important diseases, ranked in
decreasing order of occurrence, were respiratory diseases, skin diseases, diarrhoea and
allergy. Causes of these diseases could not be identified specifically due to the involvement
of many factors. Results of this study indicated no specific negative effect of dairying on
human health.
Conclusion and recommendationsThe results from this investigation clearly showed the need for implementing appropriate
waste management systems by smallholder dairy farms in Thailand and in other developing
countries. Although each farm may have only small numbers of dairy animals (in this case
approximately 20 animals), when a large number of farms exist in a small area, the bulk of
animal wastes produced each day can create long-term environmental problems for farmers
themselves, and for other people in neighbouring areas. Liquid wastes from dairy farms can
contaminate water resources and public waterways. Piling and drying of manure on land
surfaces that are bare of vegetation can result in leaching and seeping of inorganic and
organic matter into underground water. It is recommended that low-cost cement floors
should be constructed for drying manure on smallholder dairy farms. Moreover, cement
drainage ditches should be constructed for wastewater and liquid manure disposal, and
sewage tanks for holding liquid waste outside dairy barns. These low-cost facilities should be
viewed as a short-term solution, but should help to prevent much of the pollution from
dairy farms. Other long-term investment, such as central water treatment systems or biogas
digesters, may also be useful but requires careful planning with active farmer participation
in the decision making process.
Smallholder dairy development in tropical countries, especially in South-East Asia, has
many common features. Dairy operations have been mostly on a small scale, with a limited
land area and a location near to a milk collection centre or dairy co-operative; consequently,
there is a general problem of dairy waste management and disposal.
Future national dairy development programmes should incorporate activities
concerning environmental protection, for example:
• providing information to create awareness among all concerned about the possible
long-term effects of smallholder dairy colonies in peri-urban areas
South–South Workshop 295
A case study on environmental impacts of peri-urban dairy colonies in Thailand

• dairy training for smallholder farmers emphasising waste management practices to
minimise pollution due to dairy farming
• other preventive measures to prevent environmental pollution arising from dairy
practices
• monitoring of farm surroundings, such as analysis of water, soil and air, to observe any
change in environmental quality.
Dairy co-operatives or farmer groups should be provided with appropriate information
concerning:
• possible long-term environmental impacts of smallholder dairy colonies
• sanitary measures to safeguard against risks to human health
• zoonotic diseases and their prevention.
Research and education in animal waste management, as well as those aspects
mentioned above should be given high priority by national government agencies and
educational institutions.
Construction of appropriate animal waste management facilities should be encouraged
or supported by the national government with the co-operation of dairy co-operatives or
farmer groups, for example:
• construction of cement floors for manure drying and storage to prevent seepage of
manure liquid
• construction of central water treatment facilities for dairy colonies where many
smallholder dairy farms are located, with initial support from the government
• smallholder farmers should be encouraged to use biogas digesters to utilise animal
manure as an energy source, while promoting waste management and farm sanitation.
AcknowledgementsThis research project was financially supported by the Thailand Research Fund (TRF)
through the TRF Senior Research Fellow Project. The TRF is an autonomous research
funding agency of the Government of Thailand.
ReferencesArcher J.R. and Nicholson R.J. 1992. Liquid wastes from farm animal enterprises. In: Phillips C. and
Piggins D. (eds), Farm animals and the environment. CAB (Common wealth Agricultural Bureau)International, Wallingford, UK. pp. 325–344.
Chantalakhana C. and Skunmun P. (eds). 1999. Dairy farms and environment. Buffalo and BeefProduction R&D Centre, SARDI, Kasetsart University, Bangkok, Thailand. 402 pp. (In Thai).
Chantalakhana C. and Skunmun P. 2002. Dairy development in Thailand and a case study onenviromental impacts of peri-urban dairy colonies. Part I. Smallholder dairy development. In:Rangnekar D. and Thorpe W. (eds), Smallholder dairy production and marketing—Opportunities and
constraints. Proceedings of a South–South workshop held at NDDB, Anand, India, 13–16 March 2001.
NDDB (National Dairy Development Board), Anand, India and ILRI (International LivestockResearch Institute) Nairobi, Kenya.
296 South–South Workshop
Skunmun and Chantalakana

Chantalakhana C., Korpraditsakul R., Skunmun P. and Poondusit T. 1999. Environmentalconditions and resource management of some smallholder dairy farms in Thailand. II. Effects ofdairy wastes on water and soil. Asian–Australian Journal of Animal Science 12(2):220–225.
Daliparthy J., Herbert S.J. and Veneman P.L.M. 1995. Excess dairy manure management: Impacts onground water quality. In: Steedle K. (ed), Animal waste and the land–water interface. LewisPublishers, New York, New York, USA. pp. 355–362.
Giesy R.G., Giesy J.G., Harris B. (Jr)., Bray D.R., Bucklin R.A. and van Horn H.H. (Jr). 1994. Surveyof ammonia levels in large Florida dairy barns. In: Bucklin R. (ed), Proceedings of the third
international dairy housing conference held at Orlando, Florida, USA, 2–5 February 1994. AmericanSociety of Agricultural Engineers, St. Joseph, Michigan, USA. pp. 362–366.
Gould M.C. 1995. Nitrate–nitrogen levels in well water in the little River/Rooty Creek agriculturalnon-point source hydrological unit area. In: Steedle K. (ed), Animal waste and the land–water
interface. Lewis Publishers, New York, USA. pp. 251–255.
Menasveta P. 1995. Water resources and pollution problems. Chulalongkorn Publishing Office,Bangkok, Thailand. 318 pp. (In Thai).
Muller W. 1987. Effects of odours on man and animals. In: Strauch D. (ed), Animal production and
environmental health. Elsevier Science Publishers B.V., Amsterdam, The Netherlands. pp. 21–25.
Paik I.K., Blair R. and Jacob J. 1996. Strategies to reduce environmental pollution from animalmanure: Principles and nutritional management—A review. Asian–Australasian Journal of Animal
Sciences 9(6):615–635.
Sirisingh K. 1982. Chemical of water, wastewater and analysis. Mahidol University, Bangkok,Thailand. pp 38. (In Thai).
Skunmun P., Boonsom J., Kaewsuwan S. and Chantalakhana C. 1999. Environmental conditionsand resource management in smallholder dairy farms in Thailand. I. Production systems andmanagement of resources. Asian–Australasian Journal of Animal Sciences 2(2):215–219.
Tietjen C. 1987. Influence of faecal wastes on soil, plant, surface water and ground water. In: StrauchD. (ed), Animal production and environmental health. Elsevier Science Publishers B.V., Amsterdam,The Netherlands. pp. 203–216.
Wood C.W. and Hattey J.A. 1995. Impacts of long-term manure applications on soil chemical,microbiological and physical properties. In: Strauch D. (ed), Animal production and environmental
health. Elsevier Science Publishers B.V., Amsterdam, The Netherlands. pp. 419–426.
South–South Workshop 297
A case study on environmental impacts of peri-urban dairy colonies in Thailand

Evolution of dairy policies for smallholderproduction and marketing in TanzaniaL.R. Kurwijila
Department of Animal Science and Production, Sokoine University of AgricultureP.O. Box 3004, Morogoro, Tanzania
IntroductionDairying in Tanzania has progressed a long way. Efforts to develop the dairy industry in
Tanzania started as far back as the 1950s and early 1960s. These included selection work for
milk production potential among indigenous zebu stock (Getz 1974; Mpiri 1994),
cross-breeding and production of the synthetic dual-purpose Mpwapwa breed. These efforts
did not result in widespread adoption of dairying by smallholder farmers. A few commercial
settler farms thrived. Efforts to develop a parastatal commercial dairying sector were
initiated in 1975 under World Bank IDA (International Development Association) credit.
Private initiatives in commercial dairying were stifled by the Tanzania socialist policies of
the 1970s and early 1980s.
By the mid-1980s, it was realised that to transform the dairy sector, smallholder
production had to be encouraged and promoted not only as a means of achieving national
self-sufficiency in milk and milk products but also as a means of rural poverty alleviation
(MALD 1983).
Hence from the mid-1980s, a number of smallholder dairy development programmes
were initiated in various parts of the country. The overall policy objective has been
attainment of self-sufficiency in milk and milk products. Various strategies have been
adopted to achieve a rapid increase in dairy cattle numbers and their productivity. There
have been successes and failures. The net result of these efforts to date are summarised
below.
The livestock population is made up of about 15.6 million cattle, 10.7 million goats, 3.5
million sheep, 435 thousand pigs and 26 million poultry (Bureau of Statistics 1996). Of the
15.6 million cattle, only 2% (about 300 thousand) are crossbred or grade dairy animals,
which produce about 246 million litres of the estimated total of 889 million litres
(MoAC/SUA/ILRI 1998). With a population of about 29 million people, the per capita
consumption of milk has been estimated at about 30 litres/annum. Official figures give an
estimate of 22 litres/person per year. The paucity of data makes accurate projections
impossible. Nevertheless, both the cattle population and the milk supply and consumption
are unevenly distributed. There are 20 administrative regions in the country but two-thirds
of the improved dairy cattle are found in just two of the northern highland regions, Arusha
and Kilimanjaro. Traditional cattle are concentrated in five (Shinyanga, Mwanza, Singida,
298 South–South Workshop
Dodoma and Arusha) regions, which account for about 60% of all traditional cattle and a
similar proportion of milk offtake (Bureau of Statistics 1996).
The purpose of this case study is to examine the various approaches and policies that
have been pursued towards achieving dairy development and self-sufficiency in the supply of
milk and milk products in Tanzania. The paper will draw attention to the processes that
have been involved, the successes and failures and lessons, which can be learnt from the
experiences gained over the years. It starts with a general historical background of dairy
industry development before and after independence in 1961. Finally, the paper discusses
future strategies to address the identified constraints and exploit opportunities that exist in
Tanzania for further development of the dairy industry. Areas requiring further research are
also discussed.
MethodologyThe study is based on published scientific literature, unpublished project reports,
conference proceedings particularly those of the Tanzania Society of Animal Production
Conference Series (27 volumes 1973–2000), discussions with peers as well as the author’s
own experience with Tanzania dairy industry development since 1976. Factual data are used
to illustrate the trends in development of various strategies, which have been pursued to
achieve the stated objectives.
The issuesThe issues at stake in developing a dairy industry in Tanzania include:
a) Sources, types and quality of genetic material for milk production. Here the
fundamental issue is the need for quality and relevance of improved dairy cattle breeds
as compared with indigenous zebu cattle, both of which have advantages and
disadvantages.
b) Policy and institutional set up is another issue, which has evolved over time. Tanzania
has gone through various phase of dairy development in which the government, the
private commercial farmers, the traditional cattle herders and smallholder dairy farmers
have played different roles at specific periods depending on policy changes.
c) Structural changes in both the government and the private sectors, including fiscal
policies and market conditions, have also impacted on the development process.
d) The role of research in dairy development appears obscure to policy makers. What has
been the role of research in raising productivity, efficiency in milk production,
processing and marketing? Are there areas for future research?
e) Which aspects of Tanzania’s development effort can be regarded as a success or failure,
what lessons can be learnt from the Tanzania experience and what are the future
prospects and constraints to be overcome?
South–South Workshop 299
Evolution of dairy policies for smallholder production and marketing in Tanzania

Historical overview of dairy development policiesand strategies: 1930s to 2000
Dairy cattle improvement strategiesVarious strategies to improve and expand the dairy industry base in Tanzania have been
attempted with varying degrees of success or failure. These are briefly reviewed below.
Early selection workThe milk production potential of the Tanzania Shorthorn Zebu (TSZ) is generally low with
estimates ranging from 530–950 kg per lactation of 232–257 days long (Msechu et al. 1987;
Msechu 1988). Efforts to raise local cattle productivity in Zanzibar (Tidbury 1954) and
Uganda (Williams and Bunge 1952) achieved only a limited increase in yields to levels not
exceeding 920–950 kg per lactation (Mpiri 1994). Since most selection work was done on
station with improved management, it was not easy to isolate the effect of genetic
improvement due to selection on the apparent improvement in productivity.
In view of these limitations, further work on improvement of traditional zebu cattle for
milk production had focused on cross-breeding. Cross-breeding zebu cows with Bos taurus
cattle raises the productivity of the crossbred animals to 1500–1700 litres per lactation, i.e. a
doubling of the potential yield of the zebu in one generation. However, with cross-breeding
comes the dilution of genetic resistance to tropical diseases and the requirements for
improved feeding and management; moreover, cross-breeding may pose a threat to
long-term genetic conservation of local genetic resources.
Development of the Mpwapwa breedIn view of the limitations of cross-breeding and subsequent upgrading towards Bos taurus,
between 1932 and 1935 the Ministry of Agriculture under the colonial government initiated
work to crossbreed exotic dairy cattle with indigenous zebu at Mpwapwa livestock research
station. As a result, the Mpwapwa synthetic breed was developed with an average composition
of 35% Red Sindhi, 20% Sahiwal, 10% Boran, 20% TSZ, 5% Ankole and about 10% exotic
blood, mainly Ayrshire. The herd was closed in 1956 for selection work. The average milk
yield was reported to be about 1660 kg per lactation (Das et al. 1986). The unfortunate part of
the Mpwapwa cattle story is that most of the developmental work took place on station.
On-farm evaluation of the Mpwapwa cattle only started in 1986 (Kasonta and Mkonyi 1990).
The recorded performance was a lactation milk yield of 1626 kg in 300-day lactation. Calving
intervals averaged 498 days. Average daily milk yield was 5.5 kg (Rushalaza et al. 1993).
Unfortunately, no efforts were made to multiply the Mpwapwa breed for distribution to
smallholder farmers. To date the Mpwapwa breed remains under exploited and the herd
population has dwindled over the years. The Food and Agriculture Organization of the
United Nations (FAO) has already declared the Mpwapwa an endangered breed. Reliable
300 South–South Workshop
Kurwijila

information indicates that currently there are less than 100 breeding females in the various
research stations in the country. Further conservation work for the breed has been in the
pipeline for sometime now, but so far no support has been forthcoming.
Direct importation of Bos taurus dairy breedsTanzania has imported live heifers and bulls from various parts of the world. Massive
importation took place in the 1970s when heifers and bulls were air freighted from the
USA, New Zealand, Kenya and Zimbabwe. Between 1975 and 1993, 1039 heifers from New
Zealand and USA were imported into the country. A World Bank loan and grants from
Heifer Project International (HPI) were instrumental in effecting these importations. No
hard figures are available on national total importation. At Kitulo dairy farm, for example,
between October 1975 and October 1978, 890 HPI-donated heifers were received. The aim
was to stock large-scale farms where the animals would multiply and thereafter, surplus
heifers would be distributed to smallholder farmers. However, due to poor reproductive
performance and high mortality rates, no appreciable surplus heifers have been generated
from the parastatal farms.
Cross-breeding of zebu cattle with Bos taurus
Use of village bull centres
Under the 1975 Dairy Development Programme, about 50 village dairy farm units were
planned for establishment under village government (communal) ownership; this was
under the now defunct Ujamaa socialist policy. Farmers in the selected model villages were
provided with a few dairy cattle and a bull, which could be used to mate with the dairy cattle
and the indigenous stock. Management of the dairy herd was under the management of
village government with the designated managers having very little decision making power.
None of these village dairy farms ever prospered, largely because of poor management.
Government/project bull centres
Another strategy, which has been tested in Tanzania, was the provision of government or
project operated bull centres, which were supposed to serve farmers of one or several
villages. The management of the bull centre was carried out by the government/project
extension service. This was attempted in the early stages of the Swiss funded Southern
Highlands Development Project (Mchau and Mwakatumbula 1996). This approach was
never successful due to poor management of the bulls.
Cross-breeding using artificial insemination
Artificial insemination (AI) has not been used significantly as a way of producing F1
crossbreds within the farmers’ own traditional herds. The main limitation has been lack of
South–South Workshop 301
Evolution of dairy policies for smallholder production and marketing in Tanzania
necessary infrastructure for an extensive AI scheme. AI has been used with some measure of
success on parastatal ranches and in heifer breeding units (HBUs). The National Artificial
Insemination Centre (NAIC) at Usa River, Arusha, has been constrained by a number of
operational problems including shortage of liquid nitrogen for much of the 1980s and a
poor AI delivery system. Only about 2000–5000 inseminations are performed per year.
Field operations have now been privatised, but the operation of NAIC is still under
government control.
Heifer breeding units (HBUs)
To increase the supply of F1 dairy heifers, heifer breeding units (HBUs) or livestock
multiplication units (LMUs) were established. The plan was to have one HBU in each
region. HBUs were stocked with TSZ or Boran cows for cross-breeding with exotic sires,
mainly Friesian, Ayrshire and Brown Swiss. By the late 1980s, seventeen regions had already
established their HBUs through World Food Programme (WFP) and government funding.
About 2000 heifers were produced from these units annually against an estimated
national demand of 8000 heifers (Massae 1993) and a production target of 5000 heifers per
year (MALD 1989). The performance of HBUs has thus been rather low and action towards
privatisation of some HBUs is underway in accordance with the World Bank supported
Agricultural Sector Management Programme (ASMP).
Heifer-in-trust (HIT) schemes
The heifer-in-trust (HIT) scheme was introduced by HPI working with the Lutheran Church
in Arusha, northern Tanzania in 1978. It is a strategy considered appropriate for
resource-poor farmers, especially women. The HIT approach involves loaning a pregnant
heifer to a recipient who in turn is required to pay back to the scheme a pregnant heifer born
on his/her farm. They are required to meet certain conditions which usually include
preparing a zero grazing unit, planting at least one acre of fodder grass/legume, attending
training and the keeping of records. The initial prototype model introduced by HPI in
1978, beginning with 33 heifers in three villages, has since been adopted with modifications
by several dairy development programmes (Kinsey 1998). Dutch-funded projects in the
Tanga and Kagera regions have used this approach quite successfully. Later on, HIT was
used by the Southern Highlands Dairy Development Programme (SHDDP) and the WFP
(Tan 2247) project. For successful implementation, a lot of close follow-up, called
monitoring in the Kagera Livestock Development Project (KALIDEP), together with
appropriate extension services, has to be provided on a continuous basis. This means the
external costs to the farmer can be quite high, up to 40% of the producer price of milk
(Rutamu and Munster 1998). The recovery rate for pregnant heifers varies but with good
monitoring, a recovery/pass-on rate of 60–70% has been achieved (Houterman et al. 1993;
Nzunda 1998). Table 1 and the discussions on the individual smallholder dairy
development programmes show the success of HIT schemes in Tanzania.
The repayment (pass-on rate) has been highest in the Kagera project (KALIDEP)
because of very close monitoring and a strong farmer-training component in the project
302 South–South Workshop
Kurwijila
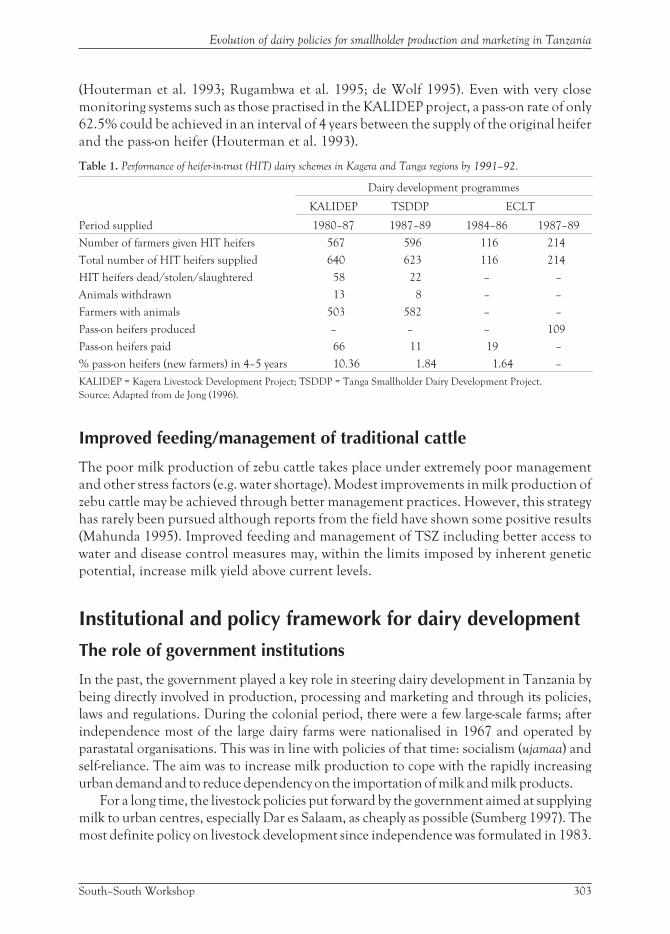
(Houterman et al. 1993; Rugambwa et al. 1995; de Wolf 1995). Even with very close
monitoring systems such as those practised in the KALIDEP project, a pass-on rate of only
62.5% could be achieved in an interval of 4 years between the supply of the original heifer
and the pass-on heifer (Houterman et al. 1993).
Table 1. Performance of heifer-in-trust (HIT) dairy schemes in Kagera and Tanga regions by 1991–92.
Period supplied
Dairy development programmes
KALIDEP TSDDP ECLT
1980–87 1987–89 1984–86 1987–89
Number of farmers given HIT heifers 567 596 116 214
Total number of HIT heifers supplied 640 623 116 214
HIT heifers dead/stolen/slaughtered 58 22 – –
Animals withdrawn 13 8 – –
Farmers with animals 503 582 – –
Pass-on heifers produced – – – 109
Pass-on heifers paid 66 11 19 –
% pass-on heifers (new farmers) in 4–5 years 10.36 1.84 1.64 –
KALIDEP = Kagera Livestock Development Project; TSDDP = Tanga Smallholder Dairy Development Project.
Source: Adapted from de Jong (1996).
Improved feeding/management of traditional cattle
The poor milk production of zebu cattle takes place under extremely poor management
and other stress factors (e.g. water shortage). Modest improvements in milk production of
zebu cattle may be achieved through better management practices. However, this strategy
has rarely been pursued although reports from the field have shown some positive results
(Mahunda 1995). Improved feeding and management of TSZ including better access to
water and disease control measures may, within the limits imposed by inherent genetic
potential, increase milk yield above current levels.
Institutional and policy framework for dairy development
The role of government institutions
In the past, the government played a key role in steering dairy development in Tanzania by
being directly involved in production, processing and marketing and through its policies,
laws and regulations. During the colonial period, there were a few large-scale farms; after
independence most of the large dairy farms were nationalised in 1967 and operated by
parastatal organisations. This was in line with policies of that time: socialism (ujamaa) and
self-reliance. The aim was to increase milk production to cope with the rapidly increasing
urban demand and to reduce dependency on the importation of milk and milk products.
For a long time, the livestock policies put forward by the government aimed at supplying
milk to urban centres, especially Dar es Salaam, as cheaply as possible (Sumberg 1997). The
most definite policy on livestock development since independence was formulated in 1983.
South–South Workshop 303
Evolution of dairy policies for smallholder production and marketing in Tanzania

However, a number of development efforts and strategies were in place before the livestock
development policy of 1983 to increase milk yields in Tanzania (MALD 1983).
Between 1961 and 1965, the operation of the dairy industry in Tanzania was governed
by the Dairy Industry Ordinance No. 61 of 1961, Cap 456 of the laws of the then
Tanganyika. Under this law, Zonal Dairy Boards (ZDBs) were established in ‘areas which
produced sufficient amounts of milk to warrant establishment of a dairy plant’ (Boki 1998).
The ZDBs’ functions were:
• to open and run dairy farms and milk processing plants
• to collect, cool and market milk and milk products from farmers
• to strengthen the link between farmers, milk processors and distributors
• to conduct market research and education relevant to specialised groups within the dairy
sector
• to provide essential services to dairy farmers and processors (registration, licensing,
veterinary services, livestock inputs, and testing and grading of milk).
ZDBs were allowed to charge fees for registration, licensing and other services and to
appoint inspectors etc. Farmers, mostly settler farmers, owned between 15 and 40% of the
share capital in the processing plants.
The first and second Five-Year Development Plans (1964–69 and 1969–74) observed
with concern the growing gap between domestic milk production and national milk
demand. This prompted the establishment, under the Dairy Industry Act No. 32 of 1965
Cap 590 of the laws of Tanzania, of a government-controlled, National Dairy Board (NDB)
in 1965. The NDB was charged with the following functions:
• to advise the government on all matters affecting the dairy sector
• to promote, organise and regulate, and to develop the production, processing,
marketing and distribution of milk and milk products
• to establish and run dairy farms and milk processing plants
• to register and license all dairy industry players (importers, distributors, processors,
retailers etc.)
• to fix milk prices
• to make bylaws for safeguarding the dairy sector
• to promote milk marketing development research in relation to milk and milk products
• to improve the quality of milk and milk products.
The period 1965–70 was marked by the nationalisation of large-scale dairy farms and
processing plants. Farmers, thus, lost the 15–40% shares they held in the milk processing
plants and the plants lost their partnership with the farmers. The NDB became moribund
in 1973 when the Minister of Agriculture did not appoint new board members upon expiry
of its tenure. Instead, a Livestock Development Authority (LIDA) was formed in 1974 to
oversee the functioning of two subsidiary companies: the Dairy Farming Company
(DAFCO) and Tanzania Dairies Ltd. (TDL).
The third Five-Year Development Plan (1975–80) was earmarked as the plan for
attaining self-sufficiency in dairy products and thus a long-term National Dairy Plan was
launched so as to achieve this goal. DAFCO and TDL were established with the aim of
ensuring smooth running of the dairy industry. Yet performance of all these dairy
304 South–South Workshop
Kurwijila

parastatals was disappointing due to management problems, foreign currency shortages
and non-availability of suitable dairy cattle to increase milk production. Table 2 shows
policy and institutional changes in dairy development since independence in 1961.
Table 2. Policy, regulation and institutional development of the Tanzania Dairy Industry (1961–98).
Year Policy/regulation Institutional structures Remarks/functions
1961–65 Dairy Industry Ordinance Zonal Dairy Boards Participants were farmers,milk transporters, milkprocessors, distributors,importers and consumers
1965 Dairy Industry Act No. 32of 1965 Cap. 590
National Dairy Board (NDB)established
-ditto-
1973 NDB not reconstituted bythe minister responsible foragriculture after expiry of itsterm in 1973
1974 Tanzania LivestockDevelopment Authority(LIDA) established byAct of Parliament
LIDA established as a holdingcompany for TLMC; TanzaniaFeeds Co. Ltd; and later TDLand DAFCO
LIDA and its subsidiariesundertook some of thefunctions of the NDB. DairyAct has, however, not beenrepealed to date
1975 TDL established by Act ofParliament
Operated as subsidiary of LIDAwith 7 dairy plants
DAFCO established byAct of Parliament
-ditto- with large-scale dairy farms
1978 Food Quality Control Actestablished by Act ofParliament
National Food ControlCommission established undersame act
1981 Food Quality Control Act1978 reviewed
1983 Tanzania Livestock Policyestablished
Smallholder dairy developmentprojects started in Kagera(KALIDEP); in Tanga TSDDP;SHDDP expanded; HBUs
Policy on raw milk sales toconsumers where dairy plantsexisted not followed up bylegislation
1988 Milk pricing decontrolled
1995 TDL liquidated
1996–98 TDL plants privatised; someDAFCO farms privatised
Royal Dairies took over theDar es Salaam plant; Tabora;Tanga; Musoma and Arushaplants have been bought
TLMC = Tanzania Livestock marketing Commission; TSDDP = Tanga Smallholder Dairy DevelopmentProject; SHDDP = Southern Highlands Dairy Development Programme; KALIDEP = Kagera LivestockDevelopment Project; TDL = Tanzania Dairies Ltd.; DAFCO = Dairy Farming Company.
Donor support in dairy developmentIn the area of dairy development, the largest single input was the IDA credit for Phase One
Dairy Development. This attracted a number of multilateral and bilateral programmes in
support of the dairy industry; support was mainly in the form of technical assistance. There
South–South Workshop 305
Evolution of dairy policies for smallholder production and marketing in Tanzania
were other significant multilateral and bilateral inputs, but these were directed more
towards the commercial or large-scale milk sector, which produces and supplies milk for the
urban population.
The most significant dairy development projects since 1975 were described below.
Phase One Dairy Development (IDA Credit 580 TA)
The first major long-term Dairy Development Programme in Tanzania was conceived and
prepared by the government in 1974 and submitted to the World Bank (IDA) for funding in
May 1975. The components of the programme included support for the rehabilitation and
expansion of commercial dairy production on parastatal farms, improvement of milk
collection and processing facilities, and provision of dairy heifers through the establishment
of livestock multiplication units (LMUs).
The total cost of the programme was estimated at US$ 15.3 million of which IDA
approved a credit ceiling of US$ 10 million; the balance was to be financed by the
Government of Tanzania and the beneficiaries of the credit.
The objective of the project was to increase milk production in government and
parastatal farms, many of which already existed and urgently required substantial
investment and improved management. The milk produced would help thus to fill the large
deficit of dairy products for the major urban markets and reduce imports of dairy products.
Food commodity projects
Dairy commodity projects were linked to dairy investment projects in the livestock sector.
Funds generated from the sale of recombining materials (skim milk powder and butter oil)
to TDL being allocated specifically to dairy projects. Specific attention was given to dairy
development by WFP and the EEC (European Economic Community).
WFP assistance (1975–95): The WFP Dairy Aid Project (TAN 2247) started in 1975 with a
pilot project to supply commodity aid (skim milk powder (SMP) and butter oil) to Tanzania
for the financing of development projects. The function of WFP food aid in dairy
development was to supply milk powder and butter oil to dairy plants for recombining
purposes to increase the availability of milk. However, the main objective of WFP assistance
was to generate funds from the sales of dairy commodities for further investment in dairy
projects aimed at improving milk production, collection and processing facilities.
The programme was not very successful with the exception of support to HBUs. Funds
generated in local currency were inadequate or misallocated to non-productive uses, such as
investments in real estate in urban centres. The shortage of foreign exchange and imported
dairy inputs continued to jeopardise the dairy development in Tanzania.
EU (European Union) assistance: The EU has been assisting Tanzania by providing milk
powder and butter oil for recombining purposes. Funds generated from the proceeds were
also supposed to be used for the development of livestock projects. Most of the funds
generated were used to finance other livestock projects, besides dairy projects. The objective
306 South–South Workshop
Kurwijila
of providing milk powder and butter oil to milk plants for recombining purposes to increase
the availability of milk in the country has been successful. However, in terms of local dairy
development achieved by investing the revenues of the programme in the industry, the
programme can be considered as a failure. Funds generated by the EU commodity aid were
handled together with WFP funds under Project TAN 2247.
Smallholder dairy development programmes
The poor performance of the large-scale parastatal dairy sector and ujamaa farms prompted
the government to change its dairy industry strategy towards small-scale farmers. This started
in 1978 with the Small-Scale Dairy Development Programme (SSDDP) implemented with
Swiss Government bilateral assistance.
The Small-Scale Dairy Development in Iringa and Mbeya regions: The project started in
1978, as the SSDDP. After an initial phase of animal multiplication at the Sao Hill–Iringa
livestock multiplication unit, support to bull centres and distribution of heifers to
farmers, the project has evolved through eight phases to become the SHDDP. Since 1993,
the project adopted the HIT scheme to distribute heifers to resource-poor farmers, as well
as supporting dairy extension services in the two regions. Over 2000 farmers in the two
regions have taken up dairy farming. By 1998, the population of dairy cattle managed in
this project was 5026 (including over 2800 cows) with the capacity to produce 5 million
litres of milk per year.
The Dutch funded projects Kagera Livestock Development Project (KALIDEP): Dutch
government’s support to the dairy industry in Kagera region started in 1976 and in 1982 the
project became known as the Kagera Smallholder Dairy Extension Project (KSHDEP).
Because of increased pressure for the supply of crossbred dairy animals, in 1988 a
crossbreeding programme aimed at transforming the indigenous cattle through
crossbreeding on farmers’ own farms by AI rather than at HBU only was initiated. It became
known as Kagera Indigenous Livestock Improvement Project (KILIP). KILIP sought to
improve veterinary, extension and input supply services not only on smallholder dairy farms
but to indigenous livestock keepers as well. This aimed to improve productivity of the
traditional cattle and to create an environment conducive to crossbreeding of indigenous
cattle with exotic dairy cattle, whose crossbred offspring would benefit a much larger
population of the Kagera farming community. The results of this novel approach have not
been analysed and/or published. However, under KALIDEP (1990–94, KALIDEP Phase I;
1995–99, KALIDEP Phase II) crossbreeding of indigenous cattle was pursued with
difficulty. For example, in 1996–97, only 255 inseminations were performed on indigenous
cattle (Silas et al. 1998). KALIDEP has three components, heifer breeding at Kikulula HBU,
a farmer-training centre at Kikulula and an extension package. By 1998, the project was
serving 4880 dairy farmers who kept a total of 11,134 dairy cattle (3893 cows). Total annual
milk production has increased from 160 thousand litres in 1983 to over 6 million litres in
1998 (Silas et al. 1998).
South–South Workshop 307
Evolution of dairy policies for smallholder production and marketing in Tanzania
The Tanga Smallholder Dairy Development Project (TSDDP): This is another project
funded by both the Dutch and Tanzanian Governments. It began in 1985 with five farmers
and seven cows. The project had three components, the Muruazi HBU, the Buhuri Farmer
Training Centre and extension services. By 1998, the total number of farmers in the project
was over 2471, owning 7768 dairy animals. A similar number of farmers and dairy cattle are
assumed to be operating outside the project monitoring system (Zylstra 1998). Annual milk
production increased from about 100 thousand litres in 1985 to about 4 million litres in
1998 for project farmers or 6 million litres overall. It is reported that the subsidy element in
services received by farmers amounted to about 75 Tanzania shillings (TSh) (US$ 1 = 680
Tsh in June 1998) per litre produced or 40% of the average producer price of milk (Rutamu
and Munster 1998).
The WFP TAN 2247: From 1992, the WFP TAN 2247, using funds for the last
consignment of food commodity aid, became directly involved in the promotion of
smallholder dairying in six districts of Tanzania (Rukwa, Ruvuma, Kwimba, Mtwara , Lindi
and Ukerewe (Nzunda 1998a)). The strategy adopted was the HIT scheme. A total of 2409
heifers was loaned to 1635 HIT farmers. Milk production improved from 2061 litres per
annum to 3,705,313 litres in five years. Average production was 5.8 litres/cow per day. The
repayment rate was 56.8% (Nzunda 1998b). The cost of the subsidy was, however, not given.
Other projects
Other donor countries and organisations have also supported development of the
Tanzanian dairy industry in the past. New Zealand supplied spare parts for the milk
processing plant in Tanga and the Livestock Training Institute in Tengeru, Arusha. Sweden
provided support to AI—the National Artificial Insemination Centre (NAIC), Arusha. The
centre produces semen, which is being used throughout the country. The Federal Republic
of Germany provided assistance to smallholder development in Lushoto and support to the
regional veterinary service at Tanga. Finland provided assistance to Elecster milk processing
plant in Mbeya (in 1976). Ireland has provided support to dairy farms and heifer breeding
units at Kilosa, Morogoro Region. Austria has provided support to small-scale dairy farmers
of the Dar es Salaam and coastal regions and to pastoralist producers around Dar es Salaam
since 1993 (Morungu and Mshana 1993; Mtumwa and Mwasha 1995). This has mainly
been marketing support through provision of technical assistance and soft loans. Recently
the Austroproject Association has extended its involvement into the revival of the once
vibrant traditional herds based dairy industry in Mara, around the shores of Lake Victoria.
The United Kingdom has provided support to the large-scale dairy farm and HBU at West
Kilimanjaro). The Heifer Project International works through the Lutheran Church. It
pioneered the HIT scheme when, in 1978, 33 heifers were distributed to farmers in three
villages around Arusha. Dairy stock is mostly imported for distribution to resource-poor
farmers. The HPI led HIT scheme had, by 1998, been able to reach 17 thousand farmers
distributed across every region of Tanzania (Kinsey 1998). The USA, through the United
States Agency for International Development, has made its contribution to the
development of small-scale producers with a strong emphasis on training in extension,
308 South–South Workshop
Kurwijila

particularly training carried out in Rural Development Centres throughout Tanzania. It has
provided buildings, equipment and transport facilities for small farmers. Japan through its
development agency JICA (Japan International Cooperation Agency) has provided support
to pasture seed production and funding for HIT schemes. The United Nations
Development Program and FAO have provided support to smallholder dairy development
in the Arusha and Kilimanjaro regions.
Developments in milk marketing policies
Domestic milk marketingA recent study by MoAC/SUA/ILRI (1998) showed that informal milk marketing
dominates the milk marketing chain whereby up to 60% of marketed milk passes directly
from producers to consumers. Milk vendors play a very significant role, supplying in some
cases (e.g. Shinyanga and Mwanza) nearly all the milk that is brought in from outside the
town boundaries (Sumberg 1996).
Milk producers prefer to sell directly to consumers where they can obtain a high price.
Milk processing plants pay farmers only about 50–60% of the price farmers get by selling
directly to consumers. Hence, milk-processing plants become selling points of last resort. As
a result, most milk processing plants even small- to medium-scale plants operate at less than
50% of installed capacity (Kurwijila 2002). The recent introduction of value added tax (at
20%) on dairy products other than liquid milk, means that dairy produce is out of the reach
of a large section of the population. Hence there is a scramble for the Dar es Salaam market
as a population of over 2.5 million people and high average incomes make it an attractive
market for processed dairy products. Milk processors complain of unfair competition from
informal milk marketing agents. Furthermore, adulteration of milk seems to be widespread
according to a recent study (Loth et al. 1998).
The regional markets are relatively undeveloped and quickly become saturated,
particularly as many urban dwellers have taken up dairying to produce milk within
intra-urban and/or peri-urban areas. Enforcement of milk processing is difficult,
impractical and perhaps unnecessary and counterproductive at the current level of market
forces (supply, demand and purchasing power and preferences of consumers—Kurwijila et
al. 1995).
One of the many constraints is the seasonal variation in milk supply and demand.
Supply of milk is generally high during the rainy season when dairy feeds are adequate
compared with the dry season when feeds are scarce. Demand for milk, especially sour milk,
varies between the cool and hot seasons (Kurwijila et al. 1995).
Urban and peri-urban dairyingUrban and peri-urban dairying is principally a response to market opportunities and
constraints. It can be traced back to the pre-independence years. In a recent study of the Dar
South–South Workshop 309
Evolution of dairy policies for smallholder production and marketing in Tanzania
es Salaam milk market, Sumberg (1996, 1997) found that the first dairying activity was the
establishment of government dairy farms within and around Dar es Salaam as early as 1921.
Today, government policy (MALD 1983) encourages peri-urban dairying and tolerates the
keeping of animals within the city boundaries (Mougeot 1994; Mlozi 1995; Malongo and
Mlozi 1997). The factors which have justified the keeping of dairy cattle within and around
cities in Tanzania have included the need for civil servants to ‘make ends meet’, the high
price of raw milk in urban centres relative to the price in remote rural areas and the poor
milk marketing infrastructure.
In view of the illegal nature of urban dairying (it is officially prohibited or limited to a few
zero grazed cows only), government policy in Tanzania has over the years encouraged the
development of peri-urban dairying (MALD 1983) and smallholder dairying (Melewas
1996). Peri-urban dairying in particular offers enormous potential for the supply of milk to
rapidly expanding cities in Tanzania due to the following reasons:
a) Proximity to urban centres provides easy access to milk markets, which offer a good
price.
b) Better access to land resources provides a cheaper source of animal feedstuffs.
c) It is more environmentally sustainable than urban dairy farming.
Dairy importsEven after cessation of dairy commodity aid, Tanzania still imports milk and milk products
to fill the demand–supply gap. The majority of milk processors complain bitterly against
competition from milk imports, which they see to be unfair in view of allegations of tax
evasion by importers and use of export subsidies in the countries of origin especially the EU
(Verwer 1999). Verwer (1999) showed that about 27 million litres of liquid milk equivalent
(LME) is being imported into Tanzania each year. The study by Verwer (1999) unfortunately
did not reveal how much of the 27 million litres LME was actually taxed and how much was
exempted from applicable taxes under the guise of religious/relief organisations.
Nevertheless it is important to examine the impact of imports on the local market: is it
significant enough to stifle development of the domestic dairy industry?
If one considers the estimated level of milk imports of 5–27 million litres LME/annum
against the estimated total production of 886 million litres/annum by the year 2000
(MoAC/SUA/ILRI 1998), the 0.6–3.0% share of imports may seem insignificant.
However, the real impact on the market should be compared with the volume of milk that is
marketed in Tanzania’s urban centres. It is estimated that only 10% and 67% of milk,
respectively, from traditional (67 million litres) and improved dairy cattle (143 million
litres) is marketed. The rest is consumed by the family or exchanged within the
neighbourhood (MoAC/SUA/ILRI 1998). This means that the 27 million litres of
imported milk is competing against approximately 209 million litres of locally produced
milk (total market = 236 million litres/annum). The real impact of imports is, therefore,
11% share of the total local urban milk market.
It is arguable as to how significant the impact of this level of imports is on the local dairy
industry. While the effect on milk producers depends largely on the relative cost (parity
310 South–South Workshop
Kurwijila

price) of imported milk, which has been shown to be no cheaper (if properly taxed) than
locally produced milk (NEI 1999). The impact on milk processors is significant as imported
products compete directly with locally processed milk (35–40 million litres/annum), which
has in turn still to compete with intra-urban produced milk, as well as informally marketed
raw milk from peri-urban and rural areas. Imports take up about 40% of the (67 million
litres/annum) processed milk market (40 million litres locally processed + 27 million litres
of imports), which significantly affect local processors. Other factors, such as low plant
capacity utilisation, high processing costs (e.g. electricity tariffs and VAT on processed
products) all have a bearing on the competitiveness of the local milk processing industry and
should be given due consideration. The government is under pressure from the processing
subsector to limit imports. However, the official government policy is to provide a level
playing field by ensuring that imports are properly taxed and to take measures against
dumping of substandard products. A review of the domestic tax regime is another avenue
under consideration.
Taxation policyThere are numerous taxes on the livestock subsector. Most taxes are known in the district
but the implementation of taxes varies widely between districts. There are districts that
charge a fee on livestock for education and there are districts which levy a yearly livestock
tax.
The Tanzania dairy subsector is protected by an import duty of 30% on dairy products as
well as the 20% VAT charged on milk powder. However, the sector is complaining about
illegal imports. Companies that reconstitute milk powder and fresh milk have an important
comparative advantage to those that collect and process local milk. Generally, the milk
processing industry faces the following taxes on inputs and outputs:
(a) stamp duty at 1.2%
(b) withholding tax at 2%
(c) industrial cess replaced by a cess of 0.25 TSh/litre
(d) sales tax at 30% on butter, cheese and yoghurt
(e) packaging materials—import duty at 30%
(f) electricity—sales tax at 5%.
Packaging materials and electricity are the major variable cost items for the dairy
industry. The import duty on packaging materials is considered as a major constraint by the
sector. The sales tax on cheese, butter and ghee hampers profitable production from fresh
milk in the formal sector. As such, the formal sector cannot compete with imports and with
informal sector production. However, butter and cheese production would allow the sector
to process milk during the rainy season when milk production reaches its seasonal
maximum and demand its seasonal minimum.
VAT has been introduced recently and is raised on processed products. Most
agricultural products are exempted, as long as they are unprocessed or have undergone only
South–South Workshop 311
Evolution of dairy policies for smallholder production and marketing in Tanzania
simple processing (pasteurising and packing). However, packaging materials for the dairy
industry are subject to VAT (20%).
New dairy development policyFollowing the 1998 dairy development conference involving dairy industry stakeholders,
there was a resolution to elaborate a new dairy industry policy within the context of the
Agriculture and Livestock Policy of 1997. The dairy industry will operate under the
following policy framework and objectives.
Within the context of the agricultural subsector, the overall goals will be the exploitation
of available resources for commercialisation and market orientation of cattle keeping to
raise incomes of smallholder farmers and improve living standards in rural areas through
dairying (Melewas 1996).
According to a draft dairy industry development policy currently under discussion by
stakeholders, the overall objectives of the dairy industry will be to:
• improve food security of the nation by increasing output, quality and availability of milk
and milk products
• keep pace with increasing demand, milk production will have to grow at the rate of >3%
per annum through the combined effect of dairy herd expansion and improved
productivity of both the zebu and dairy herd
• improve standard of living in rural areas through increased income generation from
milk production, processing and marketing
• contribute to foreign exchange earnings through savings on milk and chemical fertiliser
imports, and by producing surplus milk for export in the long term
• develop and introduce new technologies, which increase the productivity of labour and
land
• promote integrated and sustainable use and management of natural resources such as
land, soil, water, vegetation and the use of alternative energy sources (e.g. biogas to
conserve the environment)
• encourage equal opportunities for men and women in terms of access to and control
over land, animals and their products, as well as access to education and information
necessary for dairy development.
At the national level, the need for regulatory agencies to provide ‘a level playing ground’
and basis for standards and quality assurance for the dairy industry cannot be ignored.
Already in Tanzania, since 1998, a task force is working towards formation of an
autonomous, democratic National Dairy Board, independent from the government to be
funded and controlled by the industry/stakeholders. The specific roles of the proposed
dairy board will include the following:
• dairy industry quality assurance
• overall development of the dairy industry
• in collaboration with the MoAC (Ministry of Agriculture and Co-operatives), initiate
dairy industry reviews
• in collaboration with MoAC, manage dairy industry information systems
312 South–South Workshop
Kurwijila
• monitoring of import and export of milk and milk products
• support dairy industry development through positive interventions, such as offering
training when and if necessary
• ensure the observance of hygiene in the entire dairy industry chain
• in collaboration with TBS (Tanzania Bureau of Standards), set milk and milk products
standards, and in collaboration with NFCC (National Food Control Commission)
ensure, compliance with these standards
• initiate and co-ordinate dairy industry research
• contribute to milk consumption promotion, though generic advertisement etc.
• disseminate information
• lobby interest for the dairy industry
• support research, education and training
• administer dairy development funds.
Farmer organisationsThe official policy in Tanzania is to encourage farmer organisation through co-operatives,
associations and informal groups. However, given the past government’s interference in the
running of co-operatives in the country, the development of dairy co-operatives has been
very slow. There are very few successful dairy co-operative societies to date. To give the
co-operative movement a new impetus, a full Ministry for Co-operatives has been created,
but it will take time before the impact of this new initiative is realised. The new vision is to
have independent co-operatives controlled by stakeholders.
Lessons from the Tanzania experience and futureprospectsAlthough more than 40 years of the dairy development process have not brought the
spectacular achievements witnessed in Operation Flood in India, positive improvements
have been made, especially since the mid-1980s when emphasis changed from large-scale
government farms to smallholder dairy development.
Use of dairy commodity aidFunds generated from the sale of dairy commodity aid (WFP and EU) were put to various
uses, but the most evidently useful outputs have been support to HBUs/LMUs and to
farmer training. This has contributed to establishment of a genetic resource base and skills
for the future growth of the dairy industry. It is noteworthy that the availability of food
commodity aid did not encourage the local industries to put up infrastructure to procure
South–South Workshop 313
Evolution of dairy policies for smallholder production and marketing in Tanzania
local milk. This was because imported milk powder tended to be cheaper and of course
more convenient to handle (Kurwijila 2002).
Dairy herd growth and breedingIn smallholder farms, a herd growth of 6% per annum has been achieved. This is attributed
to close monitoring; farmer training and extension services which were subsidised by
donor-funded dairy development projects. Under the current move to privatise most
services, the challenging question is how to internalise some costs such as those for
extension services, training, control of epidemic diseases such as contagious bovine
pleuropneumonia (CBPP) and delivery of AI services, which seem to have elements of
public good but may cost more than the smallholder farmers can afford, at least in the short
term. A gradual and selective scaling down of donor/government subsidies is considered to
be the only logical approach if loss of advances already made is to be avoided.
Heifer-in-trust schemesThe HIT scheme, although requiring a lot of organisation, commitment, coherence and
discipline on part of the recipients, has proved to be a useful tool in reaching out to
resource-poor farmers in rural areas. The associated subsidy element can be quite high (40%
of the cost price of milk) and the challenge in the future is how to internalise a substantial
part of the costs. The Swiss funded Smallholder Dairy Development Project in the southern
highlands now in its 9th and final phase, has embraced an exit strategy that hopes to
empower farmer group networks (in terms of organisation capability) to run the HIT
schemes in the future.
Milk processing and marketingAs was the case with production activities, milk processing and marketing by government
agents did not work efficiently in Tanzania. The emerging private sector is struggling against
(unfair) competition from the informal sector. Quality assurance systems are weak or absent
and competition from imports is mainly on the basis of quality differences rather than price
differences. Improvements in processing, quality assurance and efficiency are necessary for
survival in an increasingly liberalised, global market. Self-regulation rather than control
from the government is required. This implies the industry will have to organise itself to
better face the challenges of today and tomorrow.
Institutional set-up and farmer organisationsThe experience in Tanzania has demonstrated that it is the private farmers who can make
good farmers. At the smallholder sector level, dairying clearly benefits women and is a
strong tool for poverty eradication. Parastatal dairy farming and processing proved to be a
314 South–South Workshop
Kurwijila

complete failure. The future lies with the private sector. However, with smallholder farmers
one cannot talk of them surviving on a private sector basis without using the co-operation
tool. Hence there is a need to establish stakeholder-based associations/co-operatives on the
principle of shared goals and objectives.
Issues of concern and researchable problemsA recent rapid appraisal study on the dairy subsector carried out by the International
Livestock Research Institute (ILRI) in collaboration with the MoAC and the Sokoine
University of Agriculture (MoAC/SUA/ILRI 1998) identifies a number of issues that need
to be addressed in relation to sustainable dairy production systems in Tanzania.
Seasonality of feed supplyIn both urban and peri-urban dairy production systems, scarcity of feed and its seasonal
fluctuations in both quality and quantity are major constraints. Technologies to alleviate
this constraint are required and should continue to attract researchers’ efforts and resources
in both the short- and long-term perspective.
Feed and manure markets in and around urban centresThe dependency of the urban dairy production system on feed supplies from outside the
farm holdings, coupled with environmental concerns regarding urban dairying and the
problem of nutrient cycling in the cut and carry system dominating the smallholder
subsector are issues which have to be addressed for sustainable productivity of peri-urban
dairy farming.
High milk price levels and fluctuationsThere are wide spatial and temporal variations in milk prices in Tanzania. Producer prices
have fallen recently and farmers are complaining. The mechanisms of price determination
are not well understood. The uncertainty about price movements in the dairy subsector
could undermine sustainability of smallholder dairying, which has shown itself to be
strongly supportive of livelihoods in many resource-poor households. Studies are required
to define more precisely price formations from production to marketing in order to
influence correct, economic, technical and policy decisions in the entire dairy subsector.
Public health concerns regarding informal milk marketingApart from the problem of adulteration, informal milk marketing dominating the dairy
industry in Tanzania is invariably associated with zoonotic risks. Indeed some location-
South–South Workshop 315
Evolution of dairy policies for smallholder production and marketing in Tanzania
specific research results have shown that bovine tuberculosis may be a potential risk if the
reported prevalence rates of 8–15% in herds which have been tested (Markham 1995;
Kazwala 1996; Darbon et al. 1997; Minja et al. 1998) are representative of the national
scenario. This danger is often dismissed when it is assumed that most consumers of liquid
milk boil it before consumption. However, a substantial proportion of milk marketed as raw
milk is consumed as spontaneously fermented milk without prior heat treatment. While
lactic acid fermentation has been reported to eliminate some pathogenic enterobacteria,
there is evidence that some strains of Mycobacterium spp. could survive prolonged
incubation in sour milk (Minja et al. 1998). In order to assess the significance or otherwise
of such a threat, it is important to assess first the prevalence rate and the extents to which
various traditional milk processing methods eliminate the various zoonotic risks. It is only
after the full facts are known that informed policy recommendations could be made on the
regulation of informal milk marketing systems in Tanzania and elsewhere in sub-Saharan
Africa.
ConclusionsThe case of Tanzania has demonstrated that:
• Government and donor-funded interventions have a catalytic effect on dairy industry
development.
• The private sector and smallholder farmers are the most efficient vehicles for dairy
development.
• Heifer-in-trust schemes are a good way of involving resource-poor farmers in dairying.
• Urban and peri-urban dairying is a response to market opportunities and constraints in
the dairy sector, particularly weak infrastructure and the high price differential between
the urban/peri-urban interface and remote rural areas.
• Research and development is required in addressing issues, which hamper efficiency in
production, processing and marketing of milk.
ReferencesBoki. 1998. The Tanzania National Dairy Board Discussion Paper. In: de Wolff et al. (eds),
Proceedings of the 2nd National Dairy Development Conference held at Arusha, Tanzania, 5–7 August
1998. Ministry of Agriculture and Co-operatives, Dar es Salaam, Tanzania. pp. 153–162.
Bureau of Statistics. 1996. National Sample Survey of Agriculture 1994/95. Tanzania Mainland Report.Volume II. Bureau of Statistics, Planning Commission, Dar es Salaam, Tanzania.
Darbon C.J., Kazwala R.R. and Kambarage D.M. 1997. Bovine tuberculosis research programme inTanzania: Interim results. In: Berrad J., Bouchriti N. and Bouslikhane M. (eds), Animal
tuberculosis in Africa and the Middle East. Actes Editions, Rabat, Morocco. pp. 191–198.
Das S.M., Mgheni M., Msechu J.K.K. and Mpiri D.B. 1986. Association between milk productionand reproductive efficiency traits in Mpwapwa cattle and their crosses. Proceedings of the Tanzania
Society of Animal Production 13:167–182.
316 South–South Workshop
Kurwijila
Getz W.R. 1974. Cattle breeding and selection work in Tanzania based on the Tanzania ShorthornZebu. A review. Proceedings of the Tanzania Society of Animal Production 1:62–73.
Houterman J.F., Dummer R.M., Lutalala E.M. and de Wolf J.T. 1993. Quantitative aspects ofheifer-in-trust schemes: The Kagera experience. Proceedings of the 20th scientific conference of the
Tanzania Society of Animal Production 20:168–188.
de Jong R. 1996. Dairy stock development and milk production with smallholders. PhD thesis, WageningenAgricultural University, Wageningen, The Netherlands.
Kasonta J.S. and Mkonyi J.I. 1990. The performance of Mpwapa breed cattle under smallholder dairyfarmer management in a rural area. Proceedings of the Tanzania Society of Animal Production 17:8–14.
Kazwala R.R. 1996. Molecular epidemiology of bovine tuberculosis in Tanzania. PhD thesis, University ofEdinburgh, Edinburgh, UK.
Kinsey E. 1998. Exit strategies for donors of heifer projects (HIT schemes) to ensure theircontinuation: In: de Wolff et al. (eds), Proceedings of the 2nd National Dairy Development Conference
held at Arusha, Tanzania, 5–7 August 1998. Ministry of Agriculture and Co-operatives, Dar esSalaam, Tanzania. pp. 38–43.
Kuriwijila L.R. 2002. An overview of dairy development in Tanzania. In: Rangneker D. and ThorpeW. (eds), Smollholder dairy production and marketing—Opportunities and constraints: Proceedings of a
South–South workshop held at NDDB, Anand, India, 13–16 March 2001. NDDB (National DairyDevelopment Board), Anand, India, and ILRI (International Livestock Research Institute),Nairobi, Kenya.
Kurwijila L.R., Mdoe N., Nyange D.N., Auerböck R.M. and Mallya H.N. 1995. Assessment of freshmilk and milk products consumption in Dar es Salaam. Report to the Austroproject Association.The Austro Project Association, Dar es Salaam, Tanzania. (Unpublished Report)
Loth S., Kurwijila L.R., Mdoe N.S.Y., Mchau K.W. and Auerbock R.M. 1998. Milk quality variationsin alternative milk production and marketing systems in the Morogoro and Dar es Salaam milkshed areas. Proceedings of the Tanzania Society of Animal Production 25:174–186.
MALD (Ministry of Agriculture and Livestock Development). 1983. The Tanzania Livestock Policy.Government Printer, Dar es Salaam, Tanzania.
MALD (Ministry of Agriculture and Livestock Development). 1989. Livestock DevelopmentProgramme 1989–2000. Main report: Subsector summaries. Ministry of Agriculture, Dar esSalaam, Tanzania.
Mahunda M. 1995. Strategies for increasing livestock production: Livestock production policies—Aview from field. Proceedings of the Tanzania Society of Animal Production 22:261–273.
Malongo R.S. and Mlozi M.R.S. 1997. Urban and peri-urban livestock farming and the environment.Proceedings of the Tanzania Society of Animal Production 24:43–62.
Markham A.E.G. 1995. Bovine tuberculosis in the Southern Highlands Province of the Tanganyika. PhDthesis, University of London, London, UK.
Massae E.E. 1993. Experiences with dairy development in Tanzania. In: Mann E.J. and Brookes B.(eds), Proceedings of a seminar on dairy development policy and implementation: Sharing experiences
between Africa and Asia, Harare, Zimbabwe, 12–16 July 1993. FAO (Food and AgricultureOrganization of the United Nations), Rome, Italy. pp. 56–63.
Mchau K.W. and Mwakatumbula I.D.A. 1996. Dairy cattle recording under smallholder conditionsin Iringa and Mbeya regions. In: Kifaro G.C., Petersen P.H. and Lock A. (eds), Dairy recording in
Tanzania. Proceedings of a workshop, Mkonge Hotel, Tanga, Tanzania, 9–11 August 1995. SokoineUniversity of Agriculture, Makerere University, ENRECA Project. pp. 37–44.
South–South Workshop 317
Evolution of dairy policies for smallholder production and marketing in Tanzania
Melewas J.N. 1996. Future function, policies and strategies of the livestock sector: Creating anenabling environment for private sector involvement in increasing livestock production.Proceedings of the Tanzania Society of Animal Production 23:116–130.
Minja M.G., Kurwijila L.R. and Kazwala R.R. 1998. Occurrence and survival of mycobacteria speciesin fermented milk from traditional cattle herds: A case study of Usangu Plains, SouthernHighlands, Tanzania. Proceedings of the Tanzania Society of Animal Production 25:199–202.
Mlozi M.R.S. 1995. Information and the problems of urban agriculture in Tanzania. Intentions and
realisations. PhD thesis, University of British Columbia, Vancouver, Canada.
MoAC (Ministry of Agriculture and Co-operatives)/SUA (Sokoine University of Agriculture)/ILRI(International Livestock Research Institute). 1998. Tanzania dairy subsector: A rapid appraisal.
Volume 3. Main Report. ILRI, Nairobi, Kenya.
Morungu L.S. and Mshana Y.A.K. 1993. Smallholder dairying in the southern highlands ofTanzania. Proceedings of the 20th scientific conference of the Tanzania Society of Animal Production
20:189–209.
Mougeout L.J.A. 1994. African city farming from a world perspective. In: Egziabher A.G., Lee-SmithD., Maxiwell D.G., Memon P.A., Mougeout L.J.A. and Sawio C.J. (eds), Cities feeding people: An
examination of urban agriculture in East Africa. IDRC (International Development ResearchCentre), Ottawa, Canada.
Mpiri D.B. 1994. Improving cattle productivity in Tanzania. Ministry of Agriculture, Dar es Salaam,Tanzania.
Msechu J.K.K. 1988. Contribution of milk from the traditional livestock sector in Tanzania.Proceedings of the Tanzania Society of Animal Production 15:199–215.
Msechu J.K.K., Das S.M. and Mpiri D.B. 1987. Improvement of zebu cattle productivity throughbreeding. Proceedings of the Tanzania Society of Animal Production 14:1–22.
Mtumwa A. and Mwasha P.S. 1995. The strategy for sustainable dairy development in Tanzania.Conference of the Tanzania Society of Animal Production 11:36–72.
NEI (Netherlands Economic Institute). 1999. Livestock sector review. Ministry of Agriculture andCo-operatives, Dar es Salaam, Tanzania. Mission Report. Netherlands Economic Institute,Rotterdam, The Netherlands.
Nzunda B. 1998a. The government privitisation policy of the dairy service and the services inperspective with the WFP TAN 2247 dairy Development Project. In: de Wolff et al. (eds),Proceedings of the 2nd national dairy development conference, AICC, Arusha, Tanzania, 5–7 August
1998. Ministry of Agriculture and Co-operatives, Dar es Salaam, Tanzania. pp. 44–49.
Nzunda B. 1998b. Socio-economic aspects of smallholder dairy farmers for project WFP TAN 2247dairy development. In: de Wolff et al. (eds), Proceedings of the 2nd national dairy development
conference, AICC, Arusha, Tanzania, 5–7 August 1998. Ministry of Agriculture and Co-operatives,Dar es Salaam, Tanzania. pp. 109–122.
Rugambwa V.K., de Wolf J., Stanslaus D. and Lutalala E.M. 1995. Credit facilities and heifer supplywithin the Kagera Livestock Development Programme—Tanzania. In: Kurwijila et al. (eds),Proceedings of the FAO workshop on market orientation of small scale milk producers and their organisations
held at Morogoro, Tanzania, 20–24 March 1995. FAO (Food and Agricuture Organization of theUnited Nations), Rome, Italy, and Sokoine University of Agriculture, Morogoro, Tanzania. pp.66–76.
Rushalaza V.G., Kasonta J.S., Nkungu D.R. and Jumbe B.H. 1993. On-farm performance evaluationof the dual purpose Mpwapwa breed cattle in semi-arid central Tanzania. Proceedings of the
Tanzania Society of Animal Production 20:62–70.
Rutamu I. and Munster B.V. 1998. Institutional options in Tanga dairy sector: Costs, subsidy andequity issues. In: de Wolff et al. (eds), Proceedings of the 2nd national dairy development conference held
318 South–South Workshop
Kurwijila
at Arusha, Tanzania, 5–7 August 1998. Ministry of Agriculture and Co-operatives, Dar es Salaam,Tanzania. pp. 30–37.
Silas O., Masuruli B. and Stanslaus D. 1998. Privatisation of the dairy sector services: Its effect to thesmallholder farmers in Kagera and the role of KALIDEP project. In: de Wolff et al. (eds),Proceedings of the 2nd national dairy development conference held at Arusha, Tanzania, 5–7 August 1998.Ministry of Agriculture and Co-operatives, Dar es Salaam, Tanzania. pp. 18–29.
Sumberg J. 1996. Livestock production in peri-urban areas of Africa: An analysis of Dar es Salaam, Mwanza
and Shinyanga in Tanzania. Research report submitted to the ODA Livestock Systems ResearchProgramme. Overseas Development Group, University of East Anglia, Norwich, UK.
Sumberg J.E. 1997. Policy, milk and the Dar es Salaam peri-urban zone: A new future or an olddevelopment theme? Land Policy 14(4):277–293.
Tidbury G.E. 1954. The selection and breeding of zebu cattle in Zanzibar. East African Agricultural
Journal 19:219.
Verwer S. 1999. Pulverising Pow(d)er: The impact of incoherent European policies on dairy farmers in
Tanzania and Jamaica. MSc thesis, Catholic University, Nijmegen, The Netherlands.
Williams E. and Bunge V.A. 1952. Development of the zebu herd of Bukedi cattle at Serere, Uganda.Emperial Journal of Experimental Agriculture 20:142.
de Wolff J. 1995. Privatisation and livestock owners organisations in Kagera. In: Kurwijila et al. (eds),Proceedings of the FAO workshop on market orientation of small scale milk producers and their organisations
held at Morogoro, Tanzania, 20–24 March 1995. FAO (Food and Agricuture Organization of theUnited Nations), Rome, Italy, and Sokoine University of Agriculture, Morogoro, Tanzania. pp.94–103.
Zylstra L. 1998. Milk marketing in Tanga region. In: de Wolf et al. (eds), Proceedings of the 2nd national
dairy development conference held at Arusha, Tanzania, 5–7 August 1998. Ministry of Agriculture andCo-operatives, Dar es Salaam, Tanzania. pp. 87–93.
South–South Workshop 319
Evolution of dairy policies for smallholder production and marketing in Tanzania

Theme 3: National dairy policies (includingpolicies for related research, extension,development and training) for smallholderproduction and marketingPlenary discussionAfter the presentation of the three papers on national dairy policies, the plenary discussion
addressed issues related to the role of governments in support of domestic dairy development.
The debate was continued during the theme 3 group discussion (see below).
The issues and concerns raised in the plenary were:
1. Corruption and governance have an impact on the dairy industry: this has adversely
affected the running of co-operatives in some countries.
2. The role of government in relation to policy issues has to be clearly defined. Policy
options are more likely to have an impact than technological options.
3. Government policies tend to address objectives related to raising taxes rather than
motivating the dairy sector per se.
4. High taxes on dairy products make them too expensive for many consumers. If tax revenues
were ploughed back into agriculture rather than being used to contribute to other
programmes like defence, the taxation would not be a problem.
5. Reducing taxes on imported milk products (e.g. in Tanzania under pressure from
processing plants) has a negative effect on local producers.
6. Trade issues are particularly important where milk consumption is traditionally low.
7. For South-East Asia there is a need to balance discussion towards biological rather than
policy issues. There is a need to address the issues of promotion of technology delivery,
how to incorporate dairy into traditional systems while ensuring sustainability and how
to use germplasm effectively.
These issues and the related topics that emerged from the presentations in themes 1 and 2
were subsequently discussed in small groups of the workshop participants. The outcomes for
theme 3 are given below.
Group discussionIn common with the other groups, a set of questions guided the theme 3 discussions. The
questions presented to the group addressed the role of governments in dairy development
and specific issues related to breeding and marketing policies.
320 South–South Workshop
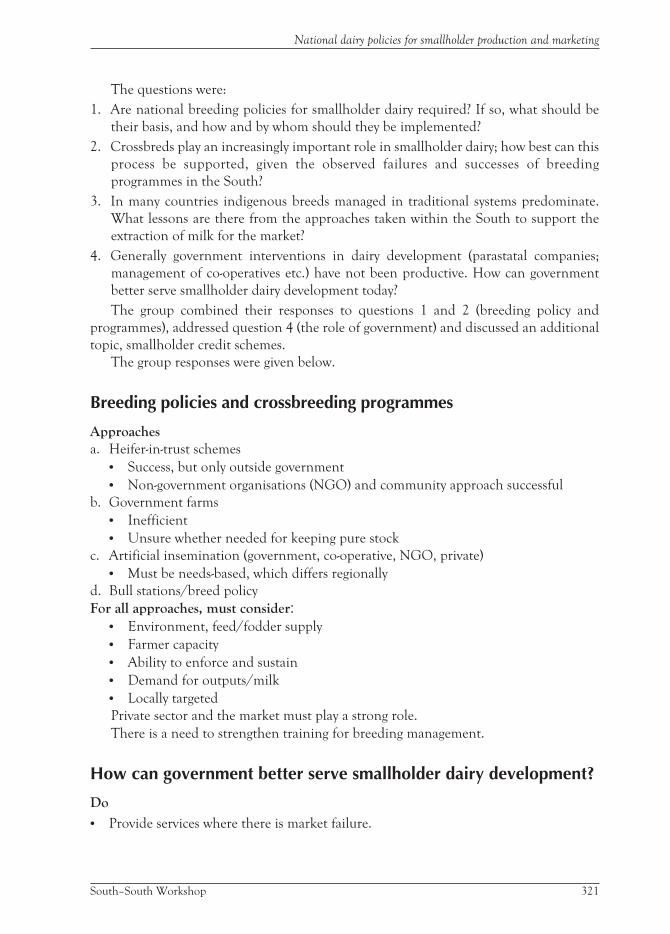
The questions were:
1. Are national breeding policies for smallholder dairy required? If so, what should be
their basis, and how and by whom should they be implemented?
2. Crossbreds play an increasingly important role in smallholder dairy; how best can this
process be supported, given the observed failures and successes of breeding
programmes in the South?
3. In many countries indigenous breeds managed in traditional systems predominate.
What lessons are there from the approaches taken within the South to support the
extraction of milk for the market?
4. Generally government interventions in dairy development (parastatal companies;
management of co-operatives etc.) have not been productive. How can government
better serve smallholder dairy development today?
The group combined their responses to questions 1 and 2 (breeding policy and
programmes), addressed question 4 (the role of government) and discussed an additional
topic, smallholder credit schemes.
The group responses were given below.
Breeding policies and crossbreeding programmes
Approaches
a. Heifer-in-trust schemes
• Success, but only outside government
• Non-government organisations (NGO) and community approach successful
b. Government farms
• Inefficient
• Unsure whether needed for keeping pure stock
c. Artificial insemination (government, co-operative, NGO, private)
• Must be needs-based, which differs regionally
d. Bull stations/breed policy
For all approaches, must consider:
• Environment, feed/fodder supply
• Farmer capacity
• Ability to enforce and sustain
• Demand for outputs/milk
• Locally targeted
Private sector and the market must play a strong role.
There is a need to strengthen training for breeding management.
How can government better serve smallholder dairy development?
Do
• Provide services where there is market failure.
South–South Workshop 321
National dairy policies for smallholder production and marketing
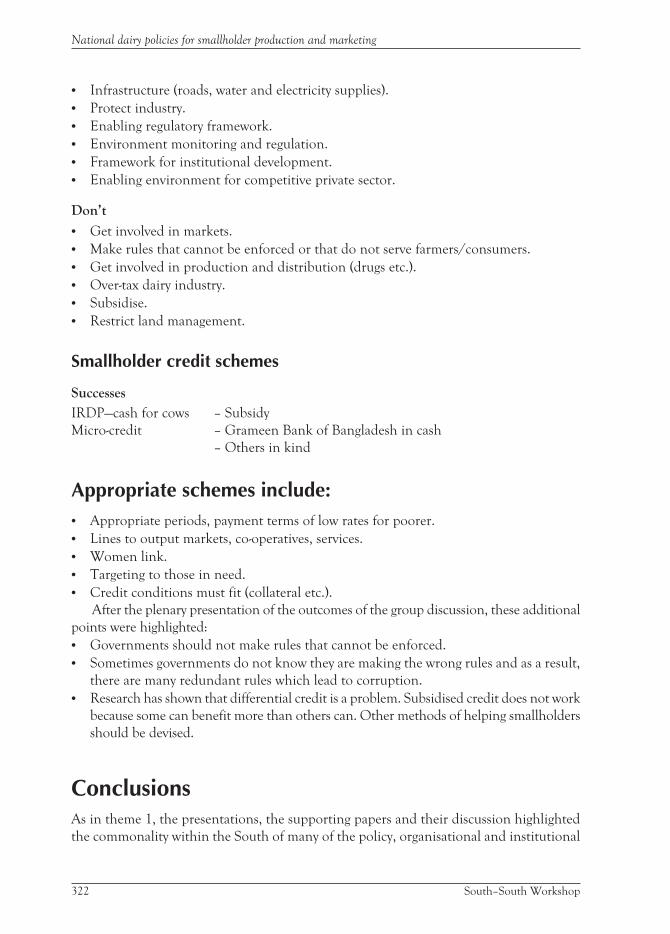
• Infrastructure (roads, water and electricity supplies).
• Protect industry.
• Enabling regulatory framework.
• Environment monitoring and regulation.
• Framework for institutional development.
• Enabling environment for competitive private sector.
Don’t
• Get involved in markets.
• Make rules that cannot be enforced or that do not serve farmers/consumers.
• Get involved in production and distribution (drugs etc.).
• Over-tax dairy industry.
• Subsidise.
• Restrict land management.
Smallholder credit schemes
Successes
IRDP—cash for cows – Subsidy
Micro-credit – Grameen Bank of Bangladesh in cash
– Others in kind
Appropriate schemes include:• Appropriate periods, payment terms of low rates for poorer.
• Lines to output markets, co-operatives, services.
• Women link.
• Targeting to those in need.
• Credit conditions must fit (collateral etc.).
After the plenary presentation of the outcomes of the group discussion, these additional
points were highlighted:
• Governments should not make rules that cannot be enforced.
• Sometimes governments do not know they are making the wrong rules and as a result,
there are many redundant rules which lead to corruption.
• Research has shown that differential credit is a problem. Subsidised credit does not work
because some can benefit more than others can. Other methods of helping smallholders
should be devised.
ConclusionsAs in theme 1, the presentations, the supporting papers and their discussion highlighted
the commonality within the South of many of the policy, organisational and institutional
322 South–South Workshop
National dairy policies for smallholder production and marketing
issues affecting the efficacy of dairy development’s contribution to the livelihoods of
producers and traders. Central to successful dairy development was the need to clearly
define the complementary roles of government and the private sector, and to ensure that
legislation and its interpretation were supportive of the efforts of poor dairy producers and
traders to meet the requirements of consumers. The actions agreed by participants to
achieve those aims are presented in the workshop recommendations.
South–South Workshop 323
National dairy policies for smallholder production and marketing

Theme 4: Institutional structures tosustain smallholder
dairy marketing

Small-scale processing and marketing inBangladesh including reference tomicro-credit facilities (good marketaccess)—Milk Vita: A case studyG.C. Saha and S.A.M.A. HaqueBangladesh Milk Producers’ Co-operative Union Ltd., Dugdha Bhaban, 139–140 Tejgaon I/A, Dhaka –1208, BangladeshTel. 00–880–2–882 6888 or 881–3614. Fax 00–880–2–882 6880E-mail:[email protected]
IntroductionIt might be amidst golden sunshine or in misty hazy fog, there might even be some silver
splashes of rain, whatever the weather, for the last few years the rural people of some selected
areas of Bangladesh have been experiencing a new scenario twice a day, at dawn and at dusk.
At the very start of the day and at the end, they see many men, women and children,
irrespective of age, caste and creed, passing down the road carrying buckets, pails or big drums,
all filled with milk. Their destination is the milk collection society, where they supply milk in a
systematically maintained procedure. In this way, they neither have to wait for a purchaser in a
market place, nor do they have to bargain for a price. The society offers them a year-round
guaranteed market with remunerative price on qualitative composition of the milk supplied.
Mr Abdus Samad, a 50-year-old milk producer from Reshombari Samity in
Baghabarighat, the largest milk producing area in the country, disclosed that he has been
supplying milk to the society for the last 20 years and through the society he has received a fair
price. ‘There is no scope to deceive farmers in relation to the price or weight of milk, which
usually happens when milk is sold to middlemen’, he opined. He stated further that ‘Milk Vita
has meticulously changed the socio-economic pattern of the area’. ‘For example’ he added ‘in
the past, people from the villages used to starve because of financial limitations. There was
hardly any means for agricultural production, but now there are electricity supplies, freezers
and television sets in many of the houses.’ Mrs Sandhya Rani Bala, a housewife and a member
of the Women Milk Producers’ Co-operative Society of Tekerhat area opined that ‘for the very
poor people in this area, the milk society has opened up a new avenue of earning’. She
explained that the cattle keeping practices are mostly maintained by women and as such,
current economic returns have energised the women to intensify their dairy activities.
Raihan, a young schoolboy from the Rangpur area, explained that he helps his family in
supplying milk to the society before going to school. He said that a few years previously, his
father had to go to the market to sell milk; this wasted much of his father’s valuable time
South–South Workshop 327

since in the very small township the market for milk was inadequate. He added that ‘the
society has initiated a guaranteed market, which has in turn allowed my father to go to his
work at the time he chooses’.
This is not just the story of Samad, Sandhya and Raihan, but of 60 thousand milk
producing co-operative farmers in Bangladesh, an agro-based country where the majority of
the population lives in rural areas. Ninety percent of the rural people are farmers and are
associated directly or indirectly with agricultural production and the distribution process.
Population growth, flood, drought and the gradual decrease in size of land holding due
to family division etc. have to some extent crippled the rural economy. As such, the majority
of the rural people live below the poverty level. With the limited resources available, the
poor, landless and marginal farmers of the country traditionally rely on agricultural
practices for their livelihoods.
By way of mechanisation, the modern world has adopted technologically advanced
methods in agricultural production. However, in Bangladesh, 90% of agro-activities are
performed with cattle draft power. Besides, cattle are also used for cartage, oil production
processes and crop harvesting, as well as their use as an excellent protein source in human
food. In Bangladesh, there are 23.4 million head of cattle, 0.82 million buffalo, 33.5 million
goats and 1.11 million sheep (Table 1).
Table 1. Number of livestock (millions) in Bangladesh by species, 1991–98.
Year Cattle Buffalo Goats Sheep
1991–92 22.83 0.73 25.40 0.95
1992–93 23.01 0.73 27.49 0.99
1993–94 23.12 0.78 29.74 1.04
1994–95 23.15 0.80 32.18 1.05
1995–96 23.19 0.80 33.02 1.07
1996–97 23.32 0.81 33.33 1.08
1997–98 23.40 0.82 33.50 1.11
Total incrementfrom base year (%)
2.50 12.33 31.89 16.84
Source: Livestock Directorate (1998).
Milking cows constitute 45% of the cattle population and on average, each cow
produces about 200–300 litres of milk in a lactation period of 180–240 days. Crossbred
cattle are used in some selected ‘milk-pocket’ areas of the country; these cattle produce
800–1000 litres of milk/cow in a 210- to a 240-day lactation period.
The objective of the Fifth Five-Year Plan for the country, was to increase the income and
thereby the purchasing power of poor people. The plan identified the landless and marginal
farmers, and women traditionally engaged in the management of milking cows as its target
beneficiaries for livestock development.
Currently, milk production is estimated at 1.62 million tonnes of which approximately
90% is from cows and the remaining 10% is from goats and buffalo. These figures do not
include the quantity of milk consumed in Bangladesh, about 1.77 millions tonnes/year,
which is received from domestic production and the liquid milk equivalent (LME) of
imported milk powder.
328 South–South Workshop
Saha and Haque
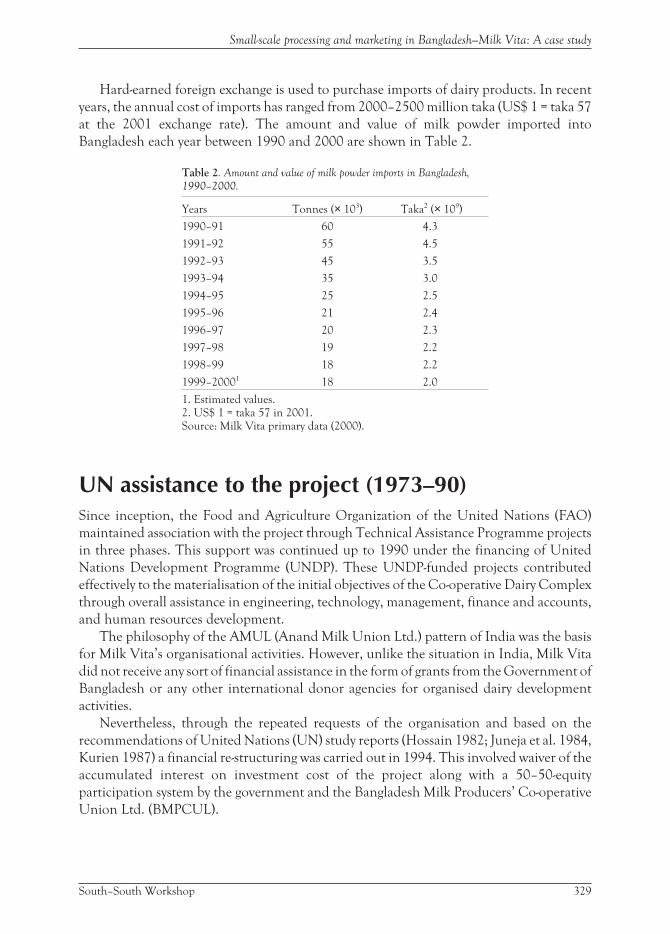
Hard-earned foreign exchange is used to purchase imports of dairy products. In recent
years, the annual cost of imports has ranged from 2000–2500 million taka (US$ 1 = taka 57
at the 2001 exchange rate). The amount and value of milk powder imported into
Bangladesh each year between 1990 and 2000 are shown in Table 2.
Table 2. Amount and value of milk powder imports in Bangladesh,
1990–2000.
Years Tonnes (× 103) Taka2 (× 109)
1990–91 60 4.3
1991–92 55 4.5
1992–93 45 3.5
1993–94 35 3.0
1994–95 25 2.5
1995–96 21 2.4
1996–97 20 2.3
1997–98 19 2.2
1998–99 18 2.2
1999–20001 18 2.0
1. Estimated values.2. US$ 1 = taka 57 in 2001.Source: Milk Vita primary data (2000).
UN assistance to the project (1973–90)Since inception, the Food and Agriculture Organization of the United Nations (FAO)
maintained association with the project through Technical Assistance Programme projects
in three phases. This support was continued up to 1990 under the financing of United
Nations Development Programme (UNDP). These UNDP-funded projects contributed
effectively to the materialisation of the initial objectives of the Co-operative Dairy Complex
through overall assistance in engineering, technology, management, finance and accounts,
and human resources development.
The philosophy of the AMUL (Anand Milk Union Ltd.) pattern of India was the basis
for Milk Vita’s organisational activities. However, unlike the situation in India, Milk Vita
did not receive any sort of financial assistance in the form of grants from the Government of
Bangladesh or any other international donor agencies for organised dairy development
activities.
Nevertheless, through the repeated requests of the organisation and based on the
recommendations of United Nations (UN) study reports (Hossain 1982; Juneja et al. 1984,
Kurien 1987) a financial re-structuring was carried out in 1994. This involved waiver of the
accumulated interest on investment cost of the project along with a 50–50-equity
participation system by the government and the Bangladesh Milk Producers’ Co-operative
Union Ltd. (BMPCUL).
South–South Workshop 329
Small-scale processing and marketing in Bangladesh—Milk Vita: A case study
Background to the existing projectThe story of dairying in Bangladesh starts long ago. In 1946, during the undivided
Indo-Pak-Bangla period, National Nutrients Co. Ltd. (at the time an all-Indian
organisation) planned to establish a small dairy plant with the capacity to handle 2000 litres
of milk/day at Lahiri Mohanpur, Pabna (presently the Sirajganj District). Though the
machinery for the plant was duly imported and the construction work also started, the plant
was not completed because of the partition of India and Pakistan in 1947.
Thereafter, in 1952 a young businessman, Mr Mokhlesur, exchanged his Calcutta
(India) property for all the assets of the original entrepreneur, which were at the time lying
idle in the plant area. Within a couple of years he completed the plant under the name of
Eastern Milk Products and managed to process and market milk, butter and ghee with a
brand name of Milk Vita. In spite of the vigorous efforts of the new entrepreneur the
business was not a financial success.
As a result, through government patronisation, a co-operative system was introduced in
the management and operation of the plant. In 1965, the first milk producers’ co-operative
society was formed in the area within the apex organisation of the Eastern Milk Producers’
Co-operative Union Ltd. Gradually about 100 village milk producers’ co-operative societies
were formed across the Lahiri Mohanpur plant area. However, the economic condition of
the Lahiri Mohanpur Dairy at Pabna did not improve and therefore the apex milk union
handed over its management to the Co-operative Marketing Society. At the same time,
another private dairy organisation was facing financial problems. This organisation, named
ASTO Dairy, was engaged in processing milk in bottles at Tejgaon, Dhaka. ASTO Dairy was
also handed over to the Co-operative Marketing Society by the government. However,
performance of the enterprises was never improved.
New ventureIn 1972, soon after independence, the Government of the People’s Republic of Bangladesh
initiated two major surveys ( 1972; Nielsen 1973) for the rehabilitation of the two existing
dairy plants, i.e. the Lahiri Mohanpur Dairy at Pabna and the ASTO Dairy at Dhaka. The
surveys received financial support from the UNDP and the Danish International
Development Agency (DANIDA). Based on the recommendations of the surveys, the
government started a new development project, the Co-operative Dairy Complex, based on
the AMUL Pattern, India (Latif 1973). New project areas were identified and the earlier two
dairies, along with their assets and liabilities, were amalgamated into the project. The
organisational name of the project, the Eastern Milk Producers’ Co-operative Union Ltd.,
was maintained until 1977 when it was changed to the Bangladesh Milk Producers’
Co-operative Union Ltd.
The government received taka 129.67 million in financial assistance (comprising local
currency = 84.77 million and foreign currency = 44.90 million) for the project as a grant
from the Danish Government. This money was loaned to the project implementing
330 South–South Workshop
Saha and Haque

organisation at an interest rate of 9% per annum for the local currency and at 3% per
annum for the foreign currency components.
Adopting the philosophy of the AMUL Pattern, the initial project in Bangladesh
envisaged, that under the fold of the primary milk producers’ co-operative societies, milk
would be purchased from individual poor, marginal and landless milk producing farmers at
a fair price, twice a day, i.e. in the morning and evening.
The project assured a regular and guaranteed market for sale of milk by the farmers,
transportation of collected milk to the rural plants for preliminary processing and further
transportation of milk to the production plants for final processing into market milk and
milk products. The previously used brand name, Milk Vita, was used for these products.
Basic infrastructureUnder the project, a co-operative infrastructure for the milk producer farmers was created
in four milk-shed areas, viz. Tangail, Tekerhat, Baghabarighat (Sirajganj) and Manikganj,
along with the construction of five new dairy plants at Dhaka, Tangail, Tekerhat,
Baghabarighat and Manikganj.
Thereafter, in recent years, with BMPCUL’s own resources six more chilling plants were
added to the infrastructure at Sreenagar, Rangpur, Bhangura, Lakshmipur, Lahiri
Mohanpur and Bhairab (Table 3).
Table 3. Plants of the Co-operative Dairy Complex.
Location
Distance from
Dhaka (km) Nature of plant
Handling capacity
(× 103 litres/day)
Date operation
commenced
Mirpur (Dhaka) 10 Milk and milkproducts processing
110 May 1976
Tangail (Tangail) 100 Milk chilling 10 June 1975
Manikgonj (Manikgonj) 90 Milk chilling 10 September 1975
Takerhat (Madaripur) 190 Milk pasteurisation 25 December 1977
Baghabarighat (Sirajganj) 125 Milk productsprocessing
162 November 1977
Srinagar (Munshigonj) 30 Milk chilling 5 October 1993
Rangpur (Rangpur) 300 Milk chilling 10 December 1995
Bhangura (Pabna) 155 Milk chilling 50 October 1999
Raipur (Luxmipur) 280 Milk chilling 10 Collection not yet started
Lahiri Mohanpur(Sirajganj)
155 Milk chilling 10 November 2000
Bhairab (Kishorgonj) 75 Milk chilling 5 Construction in process
The current trend of milk collection requires expansion of the plants, along with
establishment of new chilling centres to facilitate proper handling of milk.
South–South Workshop 331
Small-scale processing and marketing in Bangladesh—Milk Vita: A case study
BMRE project of the Co-operative Dairy ComplexSoon after the establishment of the Co-operative Dairy Complex, a project entitled
‘Consolidation of the Co-operative Dairy Complex’ was initiated. At a cost 25.93 million
taka, including 16.18 million taka in foreign exchange, the consolidation project was
implemented between 1979 and 1982 (Chowdhury 1979). Thereafter, a project entitled
‘Balancing, modernisation, rehabilitation and expansion of the Co-operative Dairy
Complex’ (BMRE) was implemented by the organisation at a total cost of 263.69 million
taka, including a foreign exchange component of 200.18 million taka (Haque 1994). Out of
the total cost of 263.69 million taka, the Government of Bangladesh’s contribution
amounted to 155.05 million taka and BMPCUL’s share to 108.64 million taka.
Furthermore, out of the total Government of Bangladesh (GoB) fund of 155.05 million
taka, 139.52 million taka was loaned at an interest rate of 7.5%. The balance 15.53 million
taka was offered as equity. The repayment schedule for the loan including interest will be
active from 2005–06 as per agreement with the Ministry of Finance.
Implementation of the project has, so far, made enormous impact on the overall
activities of the organisation. Through the replacement of old, torn and ineffective
machinery parts and equipment, the project’s factories have regained their full capacity,
which had previously fallen to about 50% and had threatened to financially ruin the plants.
Objectives and activitiesThe objectives of the Co-operative Dairy Complex project were outlined as:
• Raising subsidiary income of poor, landless and marginal farmers living in relatively
remote rural areas of the country by way of purchasing their produced milk at a
reasonable price through a guaranteed market under the co-operative fold and
• Ensuring the regular supply of safe, hygienic and nutritious milk and milk products to
city dwellers at a fair price.
Through its relentless activities in tune with the objectives, the organisation has
succeeded in bringing over 60 thousand farmer members into the fold of 400 village milk
producers’ co-operative societies, which deliver milk to the organisation.
Thus, around 400 thousand farmer-family members are benefiting from this
organisation. Moreover, the activities of Milk Vita have created about 4000 job
opportunities in the rural areas with a further 750 jobs in the processing plants. The
co-operative members receive a reasonable price, based on quality, for the milk produced by
their cattle and have a guaranteed market for their milk. Furthermore, the project
infrastructure could drive away the traditional ghoses, the middle men, who for centuries
have exploited farmers by paying low prices and cheating when weighing the produce. The
co-operative farmers are also given incentive bonuses/compensatory prices against their
milk supply. In addition to the benefits considered above, the organisation also extends the
following services to farmers:
• free of charge medicare (preventive and curative) for all cattle belonging to co-operative
society members, with emergency services for 24 hours/day
332 South–South Workshop
Saha and Haque
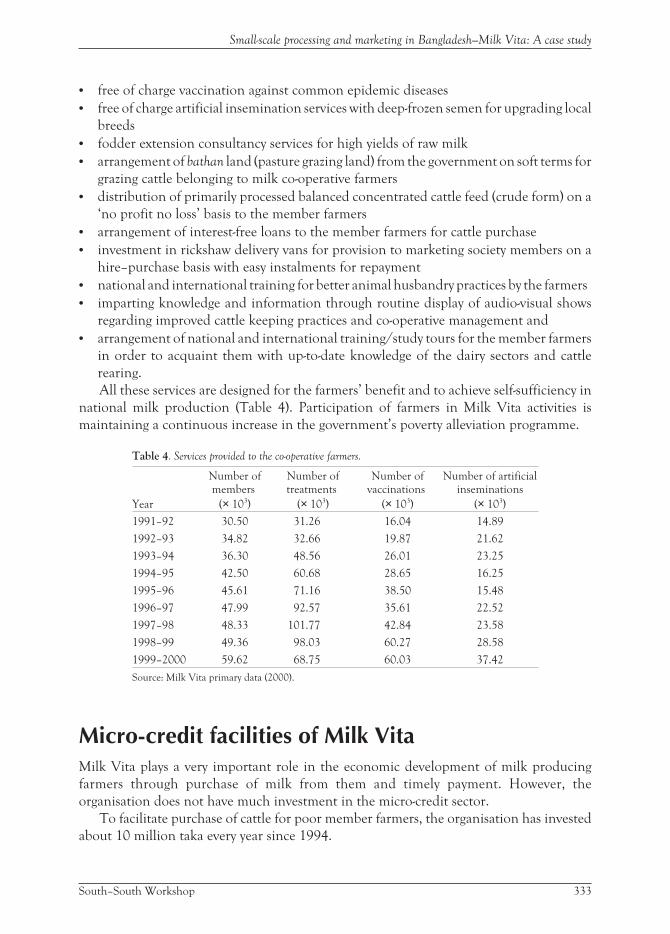
• free of charge vaccination against common epidemic diseases
• free of charge artificial insemination services with deep-frozen semen for upgrading local
breeds
• fodder extension consultancy services for high yields of raw milk
• arrangement of bathan land (pasture grazing land) from the government on soft terms for
grazing cattle belonging to milk co-operative farmers
• distribution of primarily processed balanced concentrated cattle feed (crude form) on a
‘no profit no loss’ basis to the member farmers
• arrangement of interest-free loans to the member farmers for cattle purchase
• investment in rickshaw delivery vans for provision to marketing society members on a
hire–purchase basis with easy instalments for repayment
• national and international training for better animal husbandry practices by the farmers
• imparting knowledge and information through routine display of audio-visual shows
regarding improved cattle keeping practices and co-operative management and
• arrangement of national and international training/study tours for the member farmers
in order to acquaint them with up-to-date knowledge of the dairy sectors and cattle
rearing.
All these services are designed for the farmers’ benefit and to achieve self-sufficiency in
national milk production (Table 4). Participation of farmers in Milk Vita activities is
maintaining a continuous increase in the government’s poverty alleviation programme.
Table 4. Services provided to the co-operative farmers.
Year
Number ofmembers
(× 103)
Number oftreatments
(× 103)
Number ofvaccinations
(× 103)
Number of artificialinseminations
(× 103)
1991–92 30.50 31.26 16.04 14.89
1992–93 34.82 32.66 19.87 21.62
1993–94 36.30 48.56 26.01 23.25
1994–95 42.50 60.68 28.65 16.25
1995–96 45.61 71.16 38.50 15.48
1996–97 47.99 92.57 35.61 22.52
1997–98 48.33 101.77 42.84 23.58
1998–99 49.36 98.03 60.27 28.58
1999–2000 59.62 68.75 60.03 37.42
Source: Milk Vita primary data (2000).
Micro-credit facilities of Milk VitaMilk Vita plays a very important role in the economic development of milk producing
farmers through purchase of milk from them and timely payment. However, the
organisation does not have much investment in the micro-credit sector.
To facilitate purchase of cattle for poor member farmers, the organisation has invested
about 10 million taka every year since 1994.
South–South Workshop 333
Small-scale processing and marketing in Bangladesh—Milk Vita: A case study

The loan is interest-free and through weekly deductions of repayment instalments from
the milk bill, 100% recovery of loans is occurring without hindrance. The recovered loan is
‘recycled’ along with new additions to the fund; this increases the number of recipients each
year. This credit facility has made a significant impact. The farmers are expecting a further
increase in the yearly loan amount.
Performance of the co-operatives
Product marketingThe major products of Milk Vita include: pasteurised liquid milk, butter, ghee, ice-cream
and ice lollies, full cream milk powder, skim milk powder, flavoured milk, sweet curd, cone
ice cream, cream and rasa malai (sweetmeats). With the gradual expansion of the
organisation, Milk Vita has been paying due attention to addition of new products to the
product range and to the maintenance of overall quality and hygienic conditions.
Milk Vita’s products are mainly marketed in major cities through established marketing
networks of rickshaw van co-operative societies in addition to the formal retail agencies and
wholesaling distributors. Milk Vita’s marketing operation through the Milk Distributors’
Rickshaw Van Co-operative Society is another unique example depicting success of
co-operative systems in the country. In this process, the common rickshaw-pullers have
formed societies, which have been supplied with locally fabricated insulated milk delivery
vans on a hire–purchase basis.
It has been observed that most of the pullers have become the owners of the rickshaw
vans paying off the dues through their income from the delivery of milk and milk products
to retail shops. Presently, there are five milk distributors’ rickshaw societies of which one
society is established in a 10-storeyed house.
Financial statusThe organisation emerged as a net profit earning enterprise after 18 years of operation
(Table 5). This was mainly achieved as a result of some appropriate activities initiated by the
government. One major activity was a reshuffle of the top management level of the
organisation in 1991. This was based on the recommendations of a study by Khan et al.
(1990), who was sponsored by the Co-operative Ministry of the Government. The reshuffle
included the assignment of qualified and experienced professionals to manage the
organisation, in place of the previous deputation of government officials.
Simultaneously, at the management committee level, democratically elected farmers’
representatives took control of the organisation, in place of the government-nominated
officials who previously comprised the majority of the committee. In the new pattern, out of
a total of nine members, six members are elected from the primary milk producers’
co-operative societies, including the chairperson and vice chairperson, and the other three
members are nominated by the government.
334 South–South Workshop
Saha and Haque

Table 5. Earnings from the marketing of the major dairy products.
Year
Milk
(× 106 taka)
Butter
(×106 taka)
Ghee
(×106 taka)
Ice cream
(× 106 taka)
1991–92 90.49 38.72 2.69 4.05
1992–93 139.51 43.70 6.93 7.29
1993–94 209.72 42.15 11.08 10.16
1994–95 293.44 49.39 15.66 12.38
1995–96 349.03 55.18 22.22 7.84
1996–97 381.46 46.08 24.18 11.34
1997–98 504.93 63.72 20.11 19.83
1998–99 594.69 64.96 37.52 26.50
1999–2000 678.69 68.98 29.82 26.06
Source: Milk Vita primary data (2000).
These two major changes were the basis for revolutionary progress in the operation of
the organisation and for the first time in the organisation’s history; a net profit was earned
in 1991–92. This achievement added tremendous momentum to the operation of the
organisation, both at the rural and urban levels. In the rural sector, milk production has
increased and at the urban level, marketing opportunities have expanded, effectively
contributing additional earnings to the organisation. Since then, the organisation has made
an annual net profit for the last nine consecutive years (Table 6).
Table 6. Milk Vita profit/loss account.
Years
Profit/loss (–)
(× 106 taka)
1990–91 –9.02
1991–92 8.05
1992–93 30.22
1993–94 43.50
1994–95 49.65
1995–96 31.14
1996–97 41.22
1997–98 47.73
1998–99 44.04
1999–2000 34.86
Source: Milk Vita primary data (2000).
With the achievement of a net profit, Milk Vita has started to pay off its Government of
Bangladesh investment loan along with disbursement of dividends. BMPCUL’s success in
making a net profit is a shining example to the country’s co-operative movement, following
which farmers have been encouraged to intensify their cattle keeping practices and to use
crossbred cattle to increase milk yields.
In recent years, milk producers have received a fair price for milk, as well as incentive
bonuses/compensatory prices. This has added tremendously to the income of the farmers,
South–South Workshop 335
Small-scale processing and marketing in Bangladesh—Milk Vita: A case study

raising their living standards. Moreover, this has also encouraged the farmers to construct
their own society office buildings along with making investments in social activities.
Number of societies is being increased every year with the coverage of a larger number of
villages in the milk-shed area, along with villages in new areas. Consequently, there has been
a continuous increase in milk collection as shown in Table 7.
Table 7. Milk collection and price paid to the rural producers.
Year
Milk
(× 106 litres)
Average
milk fat (%)
Average
price/litre (Taka)
Taka
(× 106)
1990–91 6.22 4.4 10.77 66.99
1991–92 6.48 4.6 11.68 75.69
1992–93 10.24 5.0 11.57 118.51
1993–94 12.05 5.1 11.77 141.94
1994–95 17.45 4.4 13.49 235.57
1995–96 18.33 5.2 14.33 262.77
1996–97 19.46 5.0 15.67 305.04
1997–98 26.52 4.7 15.87 420.96
1998–99 29.47 4.4 15.85 467.33
1999–2000 33.99 4.7 16.10 547.56
Source: Milk Vita primary data (2000).
Impact of the projectBMPCUL, dedicated to the rural socio-economic development of Bangladesh, has emerged
as a pioneering co-operative organisation in the country. Its area of operation in the rural
sector is spread over six milk-shed areas (viz. Tangail, Mainikganj, Tekerhat, Srinagar,
Rangpur and Baghabarighat) covering about 15 districts with 41 police stations and 925
villages.
Through planned activities for the last three decades, BMPCUL has made a significant
impact on the national economy and has especially benefited farmers in the milk
production sector. The direct beneficiaries of the project activities are:
• Sixty thousand poor, landless and marginal milk producing farmers, who were earlier
exploited by the traditional middlemen (ghoses), but are presently receiving a fair price for
their milk in a guaranteed market
• A large number of city dwellers receiving a continuous supply of pure, safe, hygienic and
nutritious milk and milk products at a reasonable price
• More than 500 rickshaw pullers’ co-operative members engaged in the distribution
process receiving a daily cash income, thus maintaining their livelihoods along with the
livelihoods of their dependent family members
• More than 4 thousand people who are employed in jobs, directly and indirectly created,
in milk production and transportation, both in rural and urban areas
336 South–South Workshop
Saha and Haque
• Nearly 750 people engaged in the different plants and head office of the organisation
who earn livelihoods for themselves and their families and
• 100 new co-operative farmers every year who receive interest-free credit for cattle purchase.
In fact, through the planned activities, Milk Vita is helping to fulfil the demands of the
poverty alleviation programme by way of socio-economic development of the poor,
marginal and landless milk producing co-operative farmers. Furthermore, it is also helping
to increase supply of quality milk and milk products to city dwellers, thereby helping to meet
the nutritional demand of the country.
As such, a recent case study by FAO (Dugdill and Bennett 2000) has rightfully
acknowledged that:
Some 25 years on, Milk Vita is a flourishing concern. This can be seen not only from its
encouraging financial performance and ambitious plans for growth, but from its recent
imitators who have set up similar enterprises to collect, process and market 50 million litres of
milk annually.
Future plans of BMPCULThe annual nutritional demand for milk in Bangladesh is 10.5 millions tonnes (based on 125
million people with a per capita requirement of 240 g/day), which differs by 83.14% from the
national consumption figure of 1.77 millions tonnes. Of the amount consumed, only 3.4% is
obtained from processing plants and the rest (96.6%) is obtained from indigenous sources.
There is, thus, enormous scope for Milk Vita to provide processed products to consumers.
However, meeting the nutritional demand is a huge national task. Moreover, it is dependent
on the purchasing capacity of the consumers. Therefore, any projection of milk and milk
product demands for Bangladesh needs to be made through a vivid study.
The success of Milk Vita with further scope for expansion in the processing sector has
encouraged the organisation to plan for the expansion of its activities with the addition of a
number of processing facilities to increase product diversity. These expansion programmes
include:
• Expansion of the current handling capacity of the existing plants
• Establishment of a number of chilling plants
• Acquisition of bathan land from the government for permanent use as grazing land by
the milk producer farmers
• Establishment of an ultra-high temperature milk plant
• Establishment of a cattle feed plant
• Expansion of the chocolate crunch making plant into a confectionery plant
• Establishment of a water treatment plant and
• Replication of the project in other areas of the country, especially in the divisional head
quarters, such as Chittagong, Khulna and Rajshahi.
These plans are expected to allow Milk Vita to contribute further to the development of
the dairy sector in Bangladesh. An increasing supply of milk and milk products under the
Milk Vita model will in turn result in further socio-economic progress.
South–South Workshop 337
Small-scale processing and marketing in Bangladesh—Milk Vita: A case study

Major constraints
Dairy policy mattersA dairy policy, including short- and long-term dairy development programmes along with
other pertinent issues, was perceived to be necessary from the very inception of dairy
development activities in Bangladesh. This matter was brought to the attention of the
concerned authority on several occasions with no result. Due to the lack of such a policy,
neither are the milk producers protected by way of having a fair price from the purchaser,
nor is the import of milk powder into the country being rationalised. A dairy policy is
required to promulgate specific taxation guidelines, standardisation of indigenous milk
production, and cattle keeping and milk production rules along with all the relevant issues.
In 1984, the study report of Juneja Mission of FAO, sponsored by the attached UN
project, included proposals for short- and long-term programmes of dairy development in
Bangladesh along with the framing of dairy policy and formation of the Bangladesh Dairy
Development Board. Unfortunately, there was no response to these proposals.
Again in 1987, in a study sponsored by the UNDP/FAO, Dr Verges Kurien
(Chairperson of the National Dairy Development Board of India) advocated for dairy policy
and for formation of a dairy board in due course, along with some other pragmatic and
important dairy development plans and programmes. The report did not bring about
significant development on the issue. However, in 1991–92, a one-page milk policy was
incorporated into the livestock policies of Bangladesh but this did not take into account the
need for dairy development in the country (Fisheries and Livestock Ministry 1992).
Financial limitationSince inception, Milk Vita has not received any grants in the form of cash or commodity
assistance from the government or from any national or international donor agency. This
has limited the organisation’s ability to carry out its development activities, since the size of
net profit has not been enough to cater for its development plans.
Competition in the marketIn addition to competition from imported milk powder, which is comparatively cheaper,
Milk Vita presently also faces competition from domestic processing sources (Table 8).
Table . Comparison between the price of local liquid milk and imported milk powder.
Items
Price/kg of milk
powder (taka)
Liquid milk
equivalent (litres)
Price of liquid milk
(taka/litre)
Price of liquid milk
(US$/litre)1
Imported milk powder 145.00 8.00 18.12 0.31
Local liquid milk – – 23.50 0.41
1. US$ 1 = 57 taka at 2001 exchange rate.
Source: Milk Vita primary data (2000).
338 South–South Workshop
Saha and Haque

This situation, however, is being improved. Nevertheless, in recent years several new
ventures in milk and milk product processing and marketing have been initiated in
Bangladesh. Although most of the organisations produce very small quantities of milk
(Table 9), the Bangladeshi market for processed milk is increasing thereby encouraging milk
producers to make further investments.
Table 9. Daily sales of processed liquid milk by manufacturer.
Name of enterprise
Average milk sales
(× 103 litres/day)
Market share
(%)
Milk Vita 110 62.16
Arong 38 21.48
Amomilk 4 2.26
Shelaida 4 2.26
Bikrampur 3 1.69
Savar Dairy 3 1.69
Aftab Dairy 5 2.82
Safa Dairy 3 1.69
Tulip Dairy 7 3.95
Total 177 100
Source: Milk Vita primary data (2000).
Constraints outlinedThrough analysing its overall activities, Milk Vita outlines the following major constraints:
• lack of an appropriate and detailed dairy policy issues like product standardisation,
taxation, infrastructure development, price, import rationalisation and product safety
measures to aid the Bangladeshi dairy development process
• competition from imported milk powder and milk products along with domestic
production
• non-congenial taxation policies and rate for its routine imported items
• shortage of quality cattle feed at a reasonable price
• lack of funds for the timely materialisation of its planned activities
• lack of support from the government, and national and international donor agencies in
the undertaking of a massive dairy development programme for the country, similar to
Operation Milk Flood I, II and III in India and
• absence of adequate training facilities and support to adopt new technologies.
Rapid removal of these constraints will aid the attainment of self-sufficiency by the
country’s milk production sector, within the shortest possible time.
ConclusionsMilk Vita has emerged as a successful co-operative endeavour in Bangladesh. It provides
poor, landless and marginal milk producer farmers and women in the associated
South–South Workshop 339
Small-scale processing and marketing in Bangladesh—Milk Vita: A case study
communities with regular supplementary incomes. It has shown itself capable of
strengthening its activities further to increase dairy production and thereby to contribute
effectively to the national economy through a strong and viable organisation of small
farmers. Therefore, Milk Vita recommends:
• framing, within a given period of time, of an appropriate dairy policy for the country
depicting all pertinent issues
• formation of the Dairy Development Board of Bangladesh with professionals of the
sector assuring adequate authority and autonomy (Rahman et al. 2000)
• acquisition of bathan land for farmers’ cattle grazing
• government, national and international assistance in the milk sector both for plant
establishment and infrastructural support
• replication of the Milk Vita model in other parts of Bangladesh through government
initiatives and funding for the benefit of both farmers and consumers and
• channelling the government’s poverty alleviation programmes through the
infrastructure of Milk Vita in all the milk-shed areas of the country.
Implementation of these major issues by the relevant quarters will contribute effectively
in increasing domestic agricultural production.
ReferencesChowdhury A.M. 1979. Consolidation of Co-operative Dairy Complex, (Official Project Document).
BMPCUL (Bangladesh Milk Producers’ Co-operative Union Ltd.), Dhaka, Bangladesh, 48 pp.
Dugdill B.T. and Bennett A. 2000. Milk Vita in Bangladesh—A Case Study. FAO (Food and AgricultureOrganization of the United Nations), Rome, Italy. 13 pp.
Fisheries and Livestock Ministry. 1992. Livestock Development Policy. Ministry of Livestock, Governmentof Bangladesh, Dhaka, Bangladesh. 12 pp.
Haque S.A.M.A. 1994. Balancing, modernisation, rehabilitation and expansion of the Co-operative Dairy
Complex. (Official Project Document). BMPCUL (Bangladesh Milk Producers’ Co-operativeUnion Ltd.), Dhaka, Bangladesh. 55 pp.
Hossain M. 1982. Conversion of government loans and investments in Co-operative Dairy Complex into grant.
(An official proposal to the Government of Bangladesh), Bangladesh Milk Producers’Co-operative Union Ltd. (BMPCUL), Dhaka, Bangladesh. 17 pp.
Juneja G.C., Gansey H.J.G. and Mertin R.G. 1984. National Co-operative Dairy Development Plan.FAO (Food and Agricultural Organization of the United Nations) AG: DP/BGD/79/033 FieldDocument–6, Co-operative Dairy Organization and Extension Programme (Phase-II), Dhaka,Bangladesh. 150 pp.
Kastrup D. 1972. Observation and recommendation regarding development of Lahirimohanpur Plant, Pabna
District, Bangladesh. DANIDA (Danish International Development Agency), Gulshan, Dhaka,Bangladesh. 18 pp.
Khan M.H., Patwary M.S., Hossain M.S. and Nath S.R. 1990. Milk for our people—A state of art study on
the supply of milk throughout Bangladesh by the Co-operative Societies of Milk Producers. (Official ProjectDocument). Co-operative Directorate, Motijheel, Dhaka, Bangladesh. 100 pp.
Kurien V. 1987. A strategy for dairy development in Bangladesh. NDDB (National Dairy DevelopmentBoard), Anand, India. 24 pp.
340 South–South Workshop
Saha and Haque

Latif S. 1973. Co-operative dairy complex project. (Official Project Document). BMPCUL (BangladeshMilk Producers’ Co-operative Union Ltd.), Dhaka, Bangladesh. 37 pp.
Livestock Directorate. 1998. Development and activities. Livestock Directorate, Dhaka, Bangladesh.136 pp.
Nielsen P. 1973. Survey report and recommendations—Lahirimohanpur and ASTO Dairies, Bangladesh.DANIDA (Danish International Development Agency), Gulshan, Dhaka, Bangladesh. 38 pp.
Rahman M., Ali M.M.I. and Haque S.A.M.A. 2000. A policy study on the dairy development in
Bangladesh. (Official Project Document). Bureau of Sociological and Economic Research andTraining. BAU (Bangladesh Agricultural University), Mymensingh, Bangladesh. 92 pp.
South–South Workshop 341
Small-scale processing and marketing in Bangladesh—Milk Vita: A case study

Institutional structure to sustain smallholderdairy marketing—The Amul modelB.M. VyasManaging Director, Gujarat Co-operative Milk Marketing Federation LimitedAnand 388001, India
The Amul storyIn the 1940s, in the district of Kaira in the State of Gujarat, India, a unique experiment was
conducted that became one of the most celebrated success stories of India. At that time, in
Gujarat, milk was obtained from farmers by private milk contractors and by a private
company, Polson’s Dairy in Anand, the headquarters of the district. The company had a
virtual stranglehold on the farmers, deciding the prices both of the procured as well as the
sold milk. The company arranged to collect, chill and supply milk to the Bombay Milk
Scheme, which supplied milk to the metropolis of Bombay, and to cities in Gujarat.
Polson’s Dairy also extracted dairy products such as cheese and butter. Polson’s Dairy
exploited its monopoly fully; the farmers were forced to accept very low prices for their
products, and the decisions of the company regarding the quality and even the quantity of
the milk supplied by the farmers were final.
In 1946, inspired by Sardar Vallabhbhai Patel, a local farmer, freedom fighter and social
worker, named Tribhuvandas Patel, organised the farmers into co-operatives, which would
procure milk from the farmers, process the milk and sell it in Bombay to customers
including the Bombay Milk Scheme. Purely by chance, in 1949, a mechanical engineer
named Verghese Kurien, who had just completed his studies in engineering in the USA,
came to India and was posted by the Government of India to a job at the Dairy Research
Institute at Anand. Settling down in Anand was hardly a part of his career plans; however, a
meeting with Tribhuvandas Patel changed his life and changed India’s dairy industry.
What Mr Patel requested of Dr Kurien was hardly to bring about such a revolution. All
he wanted was help in solving various problems with bringing into working order some of
the equipment just purchased by his co-operative, especially the chilling and pasteurising
equipment. These items of equipment malfunctioned, leading to the rejection of large
quantities of milk by the Bombay Milk Scheme.
Dr Kurien’s involvement with the Kaira District Co-operative Milk Producers’ Union
Limited (KDCMPUL; the registered name of the co-operative) grew rapidly. Initially he
merely provided technical assistance in repairing, maintaining and ordering new
equipment but subsequently he became involved with the larger sociological issues involved
in organising the farmers into co-operatives and running these co-operatives effectively. He
observed the exploitation of farmers by the private milk contractors and Polson’s Dairy, and
noted how the co-operatives could transform the lives of the members.
342 South–South Workshop
The most important feature of these co-operatives is that they are run purely as farmers’
co-operatives, with all the major decisions being taken by the farmers themselves. The
co-operatives are not ‘run’ by a separate bureaucracy with vested interests of its own; the
farmers are truly in charge of their own decisions. Any farmer can become a member by
committing to supply a certain quantity of milk for a certain number of days in a year and
shall continue to be a member only if he keeps up this commitment. Each day, the farmers
(or actually, in most cases, their wives and daughters) bring their milk to the village
collection centres where quantity of milk is checked in full view of all and quality (milk fat
content) is checked using a simple device, again in full view of all. The farmers are paid in the
evening for the milk they supplied in the morning, and in the morning for the evening’s
milk. This prompt settlement in cash is a great attraction to the farmers who are usually cash
starved. Thanks to the above system, there are no disputes regarding quantity or quality of
the milk supplied by each farmer.
It was soon realised that it was not enough to merely act as the collection and selling
agents for the farmers. A variety of support services were also required to enable the farmers
continue selling milk of adequate quality and to avoid disasters such as the death of their
cattle (for a family owning just one or two cattle and depending on its/their milk for their
income, death of a cow could indeed be a disaster). The farmers were progressively given
new services such as veterinary care for their cattle, supply of good quality cattle feed,
education on better feeding of cattle and facilities for artificial insemination of their cattle.
All these were strictly on payment basis; none of the services were free.
This experiment of organising farmers into co-operatives was one of the most successful
interventions in India. A very loyal clientele was built up who experienced prosperity on a
scale they could not have dreamt of 10 years earlier. With good prices paid for their milk,
raising milch cattle could become a good supplementary source of revenue to many
households. The co-operatives were expanded to cover more and more areas of Gujarat and
in each area, a network of local village level co-operatives and district level co-operatives were
formed on a pattern similar to that at Anand (the so called Anand Pattern). In 1955,
KDCMPUL changed its name to Anand Milk Union Limited, which lent itself to a catchy
abbreviation, Amul, which meant priceless in Sanskrit. The word was also easy to
pronounce, easy to remember and carried a wholly positive connotation. It became the
flagship brand name for the entire dairy products made by this union.
In 1954, Amul built a plant to convert surplus milk produced in the cold seasons into
milk powder and butter. In 1958, a plant to manufacture cheese and one to produce baby
food were added—for the first time in the world, these products were made from buffalo
milk. Subsequent years saw the addition of more plants to produce different products.
Starting from a daily procurement of 250 litres in 1946, Amul had become a milk giant with
a large procurement base and a product mix that had evolved by challenging the
conventional technology.
On his visit to Anand in 1965, the then Prime Minister of India, Lal Bahadur Shastri,
was impressed by what he saw—a system that procured, processed and delivered high quality
milk to distant markets cost efficiently. Shastri could also see the difference that the income
from milk had made to the standard of living of farmers in the area. What impressed him
the most was that Amul had done all this without government assistance, in marked
South–South Workshop 343
Institutional structure to sustain smallholder dairy marketing—The Amul model

contrast to a number of government sponsored dairy programmes that were doing poorly in
terms of procuring and marketing good quality milk and boosting farmers’ incomes. Shastri
asked Dr Kurien to replicate Anand’s success all over India.
A pattern similar to the Anand Pattern was to be built in other states of India. This was
carried out under a programme launched by the Government of India, entitled ‘Operation
Flood’. The operation was co-ordinated by the National Dairy Development Board
(NDDB), a body formed by the Government of India with this specific objective.
Backdrop to Operation FloodIndia has traditionally been known as the land of ‘milk and honey’. Dairying was an
important contributor to the village economy in ancient India. Much folklore has been
woven around the people involved in this profession. Gradually, however, dairying lost its
charm in the face of competition from many other professions that surfaced after the effects
of the industrial revolution started to show in India.
With increased industrialisation, urban centres started to appear in all corners of the
country. With their very high population densities, these cities made very good markets for
milk and milk products. These urban pockets, however, proved to be the biggest enemies to
the sacred and useful profession of dairying. Very few individuals practised dairying, since
keeping and maintaining cattle needed large spaces and these were not available in densely
populated cities.
The liquid milk schemes did not have the capacity to serve their cities’ entire needs.
Also, as modern dairies, they could not indulge in dilution of the milk. For some
time—when imported milk powder was cheap and the government had foreign exchange to
spare—they used imported milk powder to subsidise their operations and expand somewhat
their meagre supplies of milk. Few milk schemes, however, covered more than one-third of
their city’s needs. Moreover, when they depressed prices by the use of imported powder,
they discouraged local milk production. More recently, most liquid milk schemes have
increased their prices, only to have the private vendors match this price increase so that,
aided by dilution, they could continue to outbid the milk scheme for rural milk in the city’s
milk-shed areas.
The ultimate loser was the common man and his infants. In the city, he saw milk getting
more dilute and more expensive each year, whilst the city got filthier and unhealthier to live
in. In the countryside, the ordinary milk producer saw his best milch animals going to the
city for premature slaughter, while the milk produced by his remaining, lower-yielding
milch animals still brought him only a small share of the rupees which the city consumers
paid for that milk.
Operation FloodThis was the anti-dairy development cycle that Operation Flood sought to reverse by the use
of a glut of donated milk products from abroad. These surpluses were used in two ways to
344 South–South Workshop
Vyas
speed up Indian dairy development. First, the donated milk products were used to
reconstitute milk, and therefore provide the major cities’ liquid milk schemes with enough
milk to obtain a commanding share of their markets. Secondly, the funds realised from
reconstitution and sale of donated products were used to resettle city-kept milch animals
and permit their progeny to multiply, to increase organised milk production, procurement
and processing, and to stabilise the major liquid milk schemes’ position in their markets.
The objectives of Operation Flood can be summarised as follows:
1. To enable each city’s liquid milk scheme to restructure and capture a commanding share
of its market
2. To identify and satisfy the needs of milk consumers and producers, so that consumers’
preferences can be fulfilled economically and producers can obtain a larger share of the
rupees paid by consumers for their milk
3. To facilitate long-term productive investment in dairying and cattle development and
4. To ensure a sufficient supply of personnel to handle each facet of the project.
The three phases of Operation Flood succeeded in fulfilling a major part of their
objectives. Today, there are 22 state federations in India, with 170 district level unions,
more than 76 thousand village level co-operative societies and 11 million milk producer
members in the different states. These co-operatives collect an average of 15 million litres of
milk each day. Fresh liquid milk, packed and branded, is marketed in over 1000 cities and
towns in India by these co-operatives; annual sales turnover exceeds 80 billion Indian rupees
(Rs) (US$ 1 = Rs 45.5). The Anand Pattern has been tested out of Anand and out of Gujarat;
it has been found to be a robust structure, wherever it has not been tampered with.
The NDDB invested about Rs 20 billion in the Operation Flood programme over two
decades (1971–94). During this period, milk production in India increased by 40 million
tonnes from 20 million tonnes in 1970 to 60 million tonnes in the 1990s. No other
development project in the world has yielded such a huge incremental return, Rs 400 billion
against a total investment of Rs 20 billion. These concerted efforts in dairy development
have made India the largest producer of milk in the world.
Structure of the Anand PatternThe basic unit in the Anand Pattern is the village milk producers’ co-operative—a voluntary
association of milk producers in a village who wish to market their milk collectively. All of
the village milk producers’ co-operatives (primaries) in a district are members of their
district co-operative milk producers’ union.
Every milk producer can become a member of the co-operative society. At a general
meeting of members, representatives are selected to form a managing committee, which
frames the policies of the society to govern the day-to-day affairs relating to milk. Milk
collection, the testing for milk fat content, sale of cattle feed etc. is handled by paid
employees from the same village. Each society also provides artificial insemination (AI)
services and veterinary first aid (VFA). Thus, these primaries also generate local
employment in the rural community.
South–South Workshop 345
Institutional structure to sustain smallholder dairy marketing—The Amul model
Each producer’s milk is tested for fat percentage (many also measure solids-not-fat) and
is paid for, on the basis of the quality of the milk. Usually, the morning milk is paid for in the
evening and the evening milk is paid for the next morning.
The primary milk producers’ societies are affiliated to a district union, which owns and
operates a feeder/balancing dairy cattle feed plant and facilities for production of semen
and its distribution. The union also operates a network of veterinary services to provide
routine and emergency services for animal health care.
The chairpersons of village societies elect the board of directors of the union, which
frames the policies for the day-to-day management of the union’s centralised facilities for
milk collection, processing and marketing and also technical inputs. Each union is managed
professionally by a managing director, who reports to the elected chairman and a board of
directors. The dairy, owned by a union, usually has a milk processing plant to convert
seasonal surpluses of liquid milk into milk powder and other conserved products. With the
help of the dairy plant, the union is able to ensure that the milk producers get 80–90% of
the lean season price even in the flush season. The farmers are, therefore, able to get a good
price for the bulk of the milk that is produced in the flush season. This has enabled the
farmers to get 20–40% higher prices than they would have if they had not been a part of the
co-operative system. Before the co-operatives, the middlemen usually paid only 60–70% of
the lean season price in the flush season.
The bulk of out-of-pocket expenditure on milk production was for the purchase of cattle
feed ingredients, such as oilseed cakes, cottonseed etc. The cattle feed plant owned and
operated by the co-operative is able to provide nutritionally balanced cattle feed at prices
40% lower than the prices of traditional feeds. The village milk producers’ co-operative
societies (primaries) market this cattle feed.
Milk producers are able to substantially increase their returns from milk production
because of better returns for their milk and lower feeding costs. The milk collected from the
village is usually sent to the co-operative dairy using trucks hired by the co-operative union.
Each co-operative dairy tries to market the bulk of its milk as liquid milk and converts
surplus milk into products with a longer shelf life. Professional managers employed by the
co-operative ensure that they get the best returns for their produce. The profits made by the
dairy are redistributed to the milk producers as a subsidiary payment. Many societies are
able to pay substantial amounts as bonuses to their milk producers, based on the proportion
of business contributed to the co-operatives.
Management of dairy co-operativesIn Anand Pattern Co-operatives, while the producers themselves determine the policies, the
opportunity is provided to the professionals to implement the policies as well as to manage
the operations. Even at the village level (primaries), the nine-member management
committee determines how best they should function within the prescribed framework,
how best its members’ interests can be protected and how best the societies can function as
viable business units. However, at this stage, the managing committee of nine members does
the routine work of management itself. For carrying out day-to-day work, necessary
346 South–South Workshop
Vyas

manpower from the same village is trained and deployed. These persons are the employees
of the respective village co-operatives; the nine-member committee takes decisions about
their continuance of service or dismissal.
At the district union level, the board includes the chairpersons from only the affiliated
milk co-operative societies, which are qualified to send their representatives (of the 17
members on the board, 12 are chairpersons of the affiliated primaries). One of them is elected
as the chairperson of the board. While this board formulates policies at the district level, the
qualified professionals headed by a managing director carry out the day-to-day management.
The primary societies in a particular milk shed federate and form a dairy co-operative
milk producers union. As more district unions were organised in Gujarat State, it was felt
necessary to organise a federal body at the state level. This federal body exists to co-ordinate
the overall activities of the district unions, to provide a platform for sharing common
benefits, to avoid competition between the district unions and to ensure rigid quality
control for the production of top quality milk products. The state federation provides the
direct link between the district milk co-operatives and the National Milk Grid (NMG). The
NMG co-ordinates, at the national level, the supply of milk from the surplus-producing
areas to the potential urban consumer markets. It helps to moderate the seasonal and
regional imbalance between demand and supply of milk.
The National Co-operative Dairy Federation of India (NCDFI), a federal society, was
formally established in 1970 as a national level apex organisation. Now it has been
restructured through affiliation with its member apex co-operatives at the state levels. The
NCDFI, thus, provides the basic institutional framework for better co-ordination,
monitoring and guidance, and gives adequate direction to the state federations to ensure a
stronger co-operative milk marketing system in the country. The NCDFI is the apex body of
all the state dairy federations in the country, which have been entrusted with the
management of the NMG activities. To facilitate operations of the NMG, four regional
programming committees have been established by the NCDFI, which meet periodically in
their respective regions. These committees provide a platform for the participating
federations to transact business and share each other’s experiences in the management of
milk procurement, handling and marketing. The activities of the four programming
committees are co-ordinated by a central programming committee.
Even at the profit-sharing level, the distribution is made in proportion to the volume of
business contributed by each member; therefore, bonuses etc. are determined from the
value of the commodity supplied by the members. This in turn ensures that while the
co-operative does business, it also makes its members quality conscious.
The Anand Pattern co-operatives have also taken into consideration the capabilities of
each tier, vis-à-vis the systems they should own. These systems include the processing,
marketing, advertisement and input organisation etc. along with the large capital-based
operations that are owned either by the district union (the second tier) or the state
federation (third tier). The primary co-operatives, on the other hand, act as procurement
units for the individual members and as retail outlets for the union/federation to ensure
that inputs reach the individual members at the village level on time.
This two-way constant communication, between the primary unit at the village level and
the district/state level bodies, has guarded the Anand Pattern co-operatives against the
South–South Workshop 347
Institutional structure to sustain smallholder dairy marketing—The Amul model

dangers faced by large co-operatives which tend to drift away from individuals, as they grow
larger. Thus, the Anand Pattern co-operatives ensure that the services required, to market
the produce or to improve production, reach their members.
Today in Gujarat, under the Anand Pattern system, there are 11 thousand village level
co-operatives with a total membership of 2.1 million milk producers affiliated to 12 district
level unions . These unions federate into a state level apex marketing organisation known as
the Gujarat Co-operative Milk Marketing Federation (GCMMF). The GCMMF was
established in 1973 with the objective of providing the milk producers of Gujarat with their
own marketing and distribution network. This aimed to give them access to the most
important link in the system—the customer. The farmers had realised that marketing was the
key to the success of the Anand Pattern and to their success when they had control over the
marketing system. The results are evident. Today, GCMMF is India’s largest food products
marketing organisation with an annual sales turnover exceeding Rs 22 billion (about US$
483.5 million). The Amul brand is among the most popular brands in the country.
Objectives and business philosophy of GCMMFThe main stakeholder of GCMMF is the farmer member for whose welfare GCMMF exists.
GCMMF states that its main objective is the ‘carrying out of activities for the economic
development of agriculturists by efficiently organising marketing of milk and dairy produce,
veterinary medicines, vaccines and other animal health products, agricultural produce in
raw and/or processed form and other allied produce’.
GCMMF aims to market the dairy and agricultural products of co-operatives through:
• common branding
• centralised marketing
• centralised quality control
• centralised purchases and
• efficient pooling of milk.
GCMMF has declared that its business philosophy is as follows:
• to serve the interests of milk producers and
• to provide quality products that offer the best value to consumers for money spent.
The biggest strength of GCMMF is the trust that it has created in the minds of its
consumers regarding the quality of its products. Amul stands for guaranteed purity of
whatever products it produces. None of its products are adulterated. In India, where such
trust is hard to come by, this could provide a central anchor for GCMMF’s future business
plans.
Organisational structure of GCMMFGCMMF is a lean organisation, a strategy that is believed to provide it with a cost advantage.
At its headquarters in Anand, four general managers (GMs) and four assistant general
managers (AGMs) assist the managing director (MD). The four AGMs look after the
348 South–South Workshop
Vyas
functions of marketing, systems, co-operative services and technical projects, respectively.
The four GMs are in charge of marketing (dairy products), human resources development
and marketing (Dhara and new business), finance and quality assurance, respectively.
The whole country is divided into five zones, each headed by a zonal manager
responsible for the sales of all products within his zone. These managers report to the MD
but functionally each also reports to the various AGMs/GMs at the headquarters. There are
50 sales offices spread across the country (of which only two are in Gujarat); a sales manager
heads each office and is assisted by sales officers and field salespersons. The entire country
has been represented in this structure. GCMMF has one overseas office in Dubai.
GCMMF’s growth chartEven at the time of its formation, GCMMF had three major products in its portfolio: liquid
milk, butter and milk powder. Gradually, many new products were added to its range,
largely milk derivatives. In liquid milk alone, it sells full cream milk, semi-skim milk and
skim milk; these products are labelled and sold in readily identifiable pouches. By reducing
the fat content of milk, not only can GCMMF sell the fat derivatives (such as cream and
butter) but also the resultant skimmed milks can be made available at cheaper prices, so that
poorer people can also afford to drink milk. In the 1970s, Amul introduced its processed
cheddar cheese, a malt based beverage called Nutramul and chocolates. In 1983, cheese
spread was launched by GCMMF. In the same year, it also entered the sweet product market
(milk based) through the introduction of Amul shrikhand, a sweetish sour item produced
from milk and curd (a form of yoghurt). Amulya, a dairy whitener was introduced and it
soon became the market leader. In the 1990s, Amul introduced a variety of new products: a
condensed milk called Amul Mithaimate; Amul Lite, a low-fat, low cholesterol spread; and
Amul ice cream. After 1996, a still greater variety of products was introduced: pizza
(mozzarella) cheese, cheese slices, malai paneer (a form of cottage cheese) and gulab jamun (a
primer for processing by deep-frying to make a sweet called gulab jamun).
In 1996, Amul launched its Amul brand ice cream. India’s ice cream market was estimated
to be worth around Rs 8 billion in the year 2000 (about US$ 175.8 million). GCMMF
launched its ice creams in fourteen flavours in the city of Mumbai (Bombay) and Gujarat
State. At launch, prices were about 30% lower than the prevailing prices and GCMMF also
emphasised that the ice cream did not contain any gelatin. In less than a year, Amul ice cream
commanded a market share of about 55% in Gujarat and 30% in Mumbai; by the year 2000,
its share in India as a whole had reached 30%. In 1997, Amul achieved further success when it
managed to get various co-operatives in the country, trying to launch their own ice cream
brands, to sell all their ice creams under the Amul brand name. This enabled GCMMF to
benefit from the capacity of many of the more than 170 co-operative unions in the country,
with a milk procurement of more than 15 million litres/day, located close to the markets.
By the year 2000, its product range was truly expansive: three varieties of milk, flavoured
milk, buttermilk, four varieties of milk powder, two varieties of butter, five varieties of
cheese, two varieties of ghee (clarified butter), chocolates, chocolate drinks, sweets, ice
cream, edible oils and fruit and vegetable based products. The latest additions to the range
South–South Workshop 349
Institutional structure to sustain smallholder dairy marketing—The Amul model
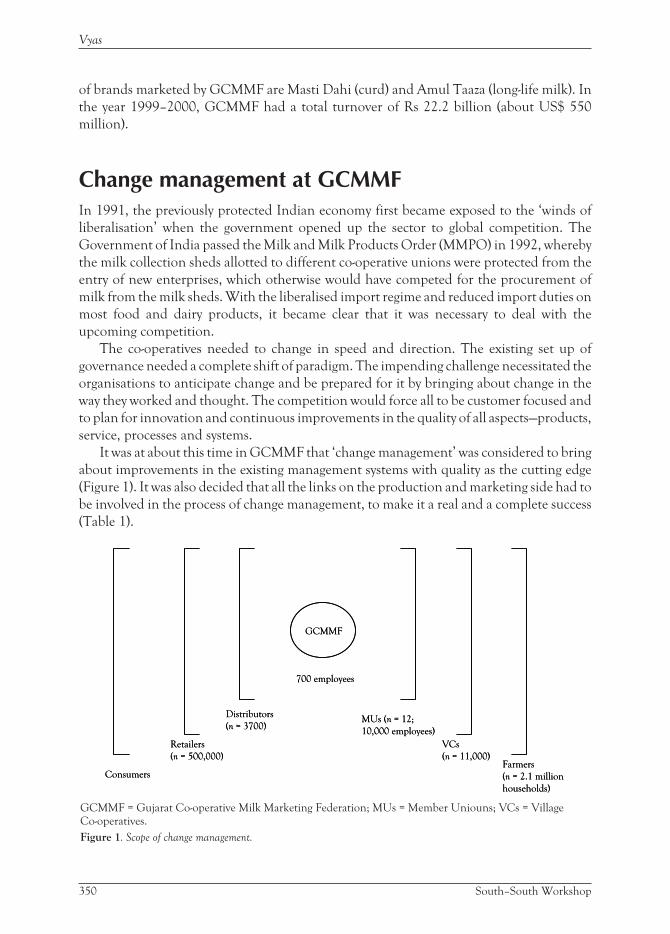
of brands marketed by GCMMF are Masti Dahi (curd) and Amul Taaza (long-life milk). In
the year 1999–2000, GCMMF had a total turnover of Rs 22.2 billion (about US$ 550
million).
Change management at GCMMFIn 1991, the previously protected Indian economy first became exposed to the ‘winds of
liberalisation’ when the government opened up the sector to global competition. The
Government of India passed the Milk and Milk Products Order (MMPO) in 1992, whereby
the milk collection sheds allotted to different co-operative unions were protected from the
entry of new enterprises, which otherwise would have competed for the procurement of
milk from the milk sheds. With the liberalised import regime and reduced import duties on
most food and dairy products, it became clear that it was necessary to deal with the
upcoming competition.
The co-operatives needed to change in speed and direction. The existing set up of
governance needed a complete shift of paradigm. The impending challenge necessitated the
organisations to anticipate change and be prepared for it by bringing about change in the
way they worked and thought. The competition would force all to be customer focused and
to plan for innovation and continuous improvements in the quality of all aspects—products,
service, processes and systems.
It was at about this time in GCMMF that ‘change management’ was considered to bring
about improvements in the existing management systems with quality as the cutting edge
(Figure 1). It was also decided that all the links on the production and marketing side had to
be involved in the process of change management, to make it a real and a complete success
(Table 1).
350 South–South Workshop
Vyas
GCMMF
700 employees
Distributors
(n = 3700)MUs (n = 12;
10,000 employees)
Retailers
(n = 500,000)
Consumers
VCs
(n = 11,000)Farmers
(n = 2.1 million
households)
GCMMF
700 employees
Distributors
(n = 3700)MUs (n = 12;
10,000 employees)
Retailers
(n = 500,000)
Consumers
VCs
(n = 11,000)Farmers
(n = 2.1 million
households)
GCMMF = Gujarat Co-operative Milk Marketing Federation; MUs = Member Uniouns; VCs = VillageCo-operatives.
Figure 1. Scope of change management.
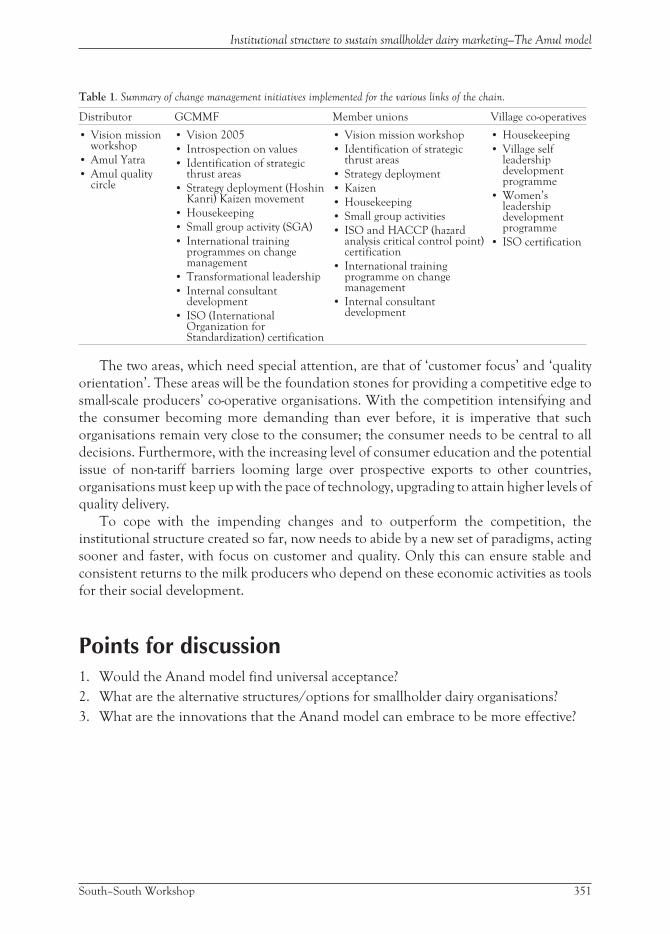
Table 1. Summary of change management initiatives implemented for the various links of the chain.
Distributor GCMMF Member unions Village co-operatives
• Vision missionworkshop
• Amul Yatra
• Amul qualitycircle
• Vision 2005
• Introspection on values
• Identification of strategicthrust areas
• Strategy deployment (HoshinKanri) Kaizen movement
• Housekeeping
• Small group activity (SGA)
• International trainingprogrammes on changemanagement
• Transformational leadership
• Internal consultantdevelopment
• ISO (InternationalOrganization forStandardization) certification
• Vision mission workshop
• Identification of strategicthrust areas
• Strategy deployment
• Kaizen
• Housekeeping
• Small group activities
• ISO and HACCP (hazardanalysis critical control point)certification
• International trainingprogramme on changemanagement
• Internal consultantdevelopment
• Housekeeping
• Village selfleadershipdevelopmentprogramme
• Women’sleadershipdevelopmentprogramme
• ISO certification
The two areas, which need special attention, are that of ‘customer focus’ and ‘quality
orientation’. These areas will be the foundation stones for providing a competitive edge to
small-scale producers’ co-operative organisations. With the competition intensifying and
the consumer becoming more demanding than ever before, it is imperative that such
organisations remain very close to the consumer; the consumer needs to be central to all
decisions. Furthermore, with the increasing level of consumer education and the potential
issue of non-tariff barriers looming large over prospective exports to other countries,
organisations must keep up with the pace of technology, upgrading to attain higher levels of
quality delivery.
To cope with the impending changes and to outperform the competition, the
institutional structure created so far, now needs to abide by a new set of paradigms, acting
sooner and faster, with focus on customer and quality. Only this can ensure stable and
consistent returns to the milk producers who depend on these economic activities as tools
for their social development.
Points for discussion1. Would the Anand model find universal acceptance?
2. What are the alternative structures/options for smallholder dairy organisations?
3. What are the innovations that the Anand model can embrace to be more effective?
South–South Workshop 351
Institutional structure to sustain smallholder dairy marketing—The Amul model
Small-scale milk marketing and processingin EthiopiaTsehay ReddaMinistry of Agriculture, P.O. Box 3431, Addis Ababa, Ethiopia
IntroductionAgriculture is the basis of Ethiopia’s economy and is the most important economic sector in
terms of generation of foreign currency. The current Ethiopian agricultural policy, which
advocates self-sufficiency in food, has led the Ministry of Agriculture to spearhead the
intensification of activities in support of agricultural development. One concern is the
overall improvement and development of the livestock sector.
The contribution of livestock and livestock products to the agricultural economy is
significant, accounting for 40% (Winrock International 1992) excluding the value of draft
power, fuel, manure and transportation. They are a source of income, which can be used by
rural populations to purchase basic needs and agricultural inputs. Livestock comes second
to coffee in foreign exchange earnings. Its contribution can equally well be expressed at
household level by its role in enhancing income, food security and social status.
Ethiopia has the largest livestock population in Africa estimated at about 35 million
tropical livestock units. However, milk production is very low and is estimated at about 1.2
million tonnes per annum, increasing at a rate of 1.2% for milk produced from indigenous
stock and 3.5% for milk produced from improved stock (Annex I). Conversely, the human
population of Ethiopia is estimated at about 62 million, increasing at a rate of 3% per
annum (CSA 1996; values projected for the year 2000). To this effect the per caput
consumption of milk is 19 kg/year (Annex I); this value is lower than African and world per
capita averages, which are 27 kg/year and 100 kg/year (Saxena et al. 1997), respectively.
Accordingly, about 495 thousand tonnes and 5 million tonnes of milk is required annually
to feed the Ethiopian population as per the African and world averages, respectively. This
indicates the probability of a wide gap between the current supply of and the demand for
milk in Ethiopia.
During the past two decades, to offset the shortfall in milk production, the import
dependency of Ethiopia for milk and milk products has increased. For example, between
1977 and 1989, level of dependency increased from 4.1 to 12.8% as a result of food aid, a
World Food Programme (WFP) milk powder, and a level of dairy production development
that has lagged behind the demand. These factors have eroded the contribution of milk
production to food security (Staal and Shapiro 1996). Furthermore, imported milk powder,
equivalent to about 11,213 litres of liquid milk per day, has a market share of 23%
(Belachew et al. 1994) in Addis Ababa. Since 1989, importation of WFP milk powder has
352 South–South Workshop
decreased and nowadays it is not imported; however, importation of other processed dairy
products, which are marketed in supermarkets, is increasing.
The highlands of Ethiopia, which are very well suited for dairying, represent almost 50%
(Winrock International 1992) of the total highland regions of sub-Saharan Africa. A
country endowed with such enormous livestock resources and climatic situations conducive
to livestock production should not be allowed to continue importation of dairy products.
Self-sufficiency in dairy products should be encouraged to optimise the use of available
resources to fill the gap between demand and supply.
To bridge this gap, it is necessary to design appropriate and sustainable dairy
development strategies based on ‘felt’ needs of smallholder farmers. Smallholder farmers
represent about 85% of the population and are responsible for 98% of total milk
production (MoA 1998). Milk is a cash crop and dairy farming is an investment option for
smallholder farmers.
Rapidly increasing population size with expanding rural population and growing urban
population will create even greater markets and growth of demand for dairy products. This
increase in demand for milk and dairy products affords greater opportunities and potentials
for milk producers and for development of the milk production and processing industry.
However, lack of awareness in the field of dairy technology, poor milk marketing and
inadequate processing structures/systems continue to be major constraints. Milk marketing
and processing is compulsory in dairy industry development and has been found to be a key
factor to success.
Cognisant of these facts, the Ministry of Agriculture has formulated a strategy to
improve milk marketing and processing in the villages. The strategy is to develop an
environment for smallholder dairy farmers, which enables farmers to immediately respond
to the market demand. That is, at village level, to develop the market for the existing sellable
surplus, regardless of the quantity, so that the producers will be stimulated gradually to
satisfy the market. It is believed that, development of a marketing structure will create the
incentive to improve production.
This report examines small-scale milk collection, processing and marketing operations
of an introduced output-oriented model for dairy development. Moreover, it outlines a
story, which helped the initiative to improve rural milk marketing and processing systems in
Ethiopia. The report is based entirely on field experiences gained during implementation of
the government’s dairy development strategy. The results are expected to furnish essential
information and experiences for future dairy development efforts under similar situations
in Ethiopia and in other East African countries.
Milk production system in EthiopiaThe milk production system in Ethiopia, in respect to marketing situations, can be broadly
categorised into the following three systems:
1. The urban milk production system (the city, Addis Ababa, and regional towns).
2. The peri-urban milk production system (proximity to Addis Ababa and regional towns).
South–South Workshop 353
Small-scale milk marketing and processing in Ethiopia
3. The rural milk production system (farmers in the villages).
In all the systems, the liquid milk and milk products markets are dominated by informal
marketing systems.
Urban milk productionOne of the largest sources of milk in Addis Ababa/regional towns is that from intra-urban
milk producers. A total of 5167 small- medium- and large-scale dairy farmers exist in and
around Addis Ababa (Region 14 Addis Ababa Agricultural Bureau survey report quoted by
Azage and Alemu 1998). Total milk production from these dairy farmers amounts to 34.649
million litres/annum. Of this total, 73% is sold, 10% is left for household consumption,
9.4% goes to calves and 7.6% is processed, mainly into butter and ayib (Azage and Alemu
1998). The producers deliver milk to consumers or consumers may collect it at the
producer’s gate. Studies indicate that in terms of volume 71% of intra-urban producers sell
milk directly to consumers (Belachew et al. 1994). Payment to producers is generally on a
monthly basis. This house-to-house milk marketing system is traditional, but it poses risks to
consumers. The milk being marketed under this system is of questionable quality, it is not
pasteurised and there is a possibility of adulteration. Although, some farmers produce good
quality milk, hygienic quality and composition of most milk marketed in such production
systems is poor. Moreover, price is high even when quality of milk is low. No standards,
quality control mechanisms or dairy policy exist to safeguard consumers. Regional towns
face the same situation and there are limited data relating to existing milk marketing systems
in regional towns.
Peri-urban milk productionThis includes smallholder and commercial dairy farmers working in the proximity of the city
of Addis Ababa and other regional towns. Most of the improved dairy stock in Ethiopia is used
for this type of production. Until recently, formalised milk marketing of standardised and
pasteurised milk to the city was monopolised by the Dairy Development Enterprise (DDE).
However, contribution to the total domestic milk supply for Addis Ababa remained at only
14% (Belachew et al. 1994). Currently, smallholder farmers’ milk marketing units, the DDE,
Mama agro-industry and private dairy farmers in and around Addis Ababa are supplying dairy
products to the city market. There is a lack of information to explain the milk-marketing
situation in other regions. Nowadays, many investors are interested in participating in the
development of the dairy industry through the peri-urban milk production system.
Rural milk productionThis subsistence type of production is the predominant milk production system accounting
for over 97% of total national milk production (Staal and Shapiro 1996). In this system,
there are pocket areas where crossbred dairy stock are distributed, but largely the system is
354 South–South Workshop
Tsehay

based on low producing indigenous breeds of zebu cattle. Livestock are kept under
traditional management conditions and generally obtain most of their feed from native
vegetation, aftermath grazing and crop residues.
In these areas, milk is processed on farm using traditional technologies to produce
products like butter, ghee, ayib and sour milk, which can be sold. Such techniques have long
been used for processing the supply of milk; they seem to provide the only option for
conversion of milk into stable marketable products. The bulk of butter and ayib in the
highlands is channelled through the informal market. Farmers, mainly women, take the
products on a weekly or monthly basis to market places or sell at the farm gate to brokers
who take the commodities to local or, more distant markets where there is a demand.
In pastoral areas, diet is based on fresh/sour milk and leftover milk is poorly utilised.
The herd size per household is large and hence there is a greater surplus of milk/person than
in the highlands. Market access in this production system is a critical factor.
Smallholder Dairy Development ProjectSmallholder farmers in Ethiopia represent 85% of the country’s population. Recognising
this indisputable fact and the role that smallholder farmers could play in the development
of the dairy industry in Ethiopia, the government is being assisted by bilateral donor
agencies. This is evidenced by the realisation of pilot projects that included the promotion
of village level small-scale dairy processing units in their programmes. The Food and
Agriculture Organization of the United Nations (FAO) and the World Food Programme
(WFP) assisted such projects that ran from 1990–94, and the Finland Government funded
the Smallholder Dairy Development Project (SDDP) implemented from 1995–2000.
During this time, village level milk marketing units were established (2 by FAO/TCP
(Technical Cooperation Programme) and WFP pilot projects and 30 by SDDP) that are
presently owned by farmers milk marketing groups/co-operatives; all are successful and are
operating profitably. Success of these units is founded on the strength of organisation of the
groups formed and leadership and management standards attained in the collection,
processing and marketing of dairy products. Each of these small and farmer-based
enterprises is operated strictly on business terms. The introduced technology or model
chosen by each project was of appropriate level for farmers to handle it with ease and
confidence.
In the original project document, SDDP planned to establish only five farmer-based
milk units on a pilot project basis. However, subsequently, 30 milk units were established
because of requests from farmers and Regional Agricultural bureaus. It is difficult to
overrule the interest of farmers.
The trend observed so far indicates, with a greater number of similar independent milk
marketing groups possibly mushrooming out, that there will be clusters of milk marketing
units spread across the country. In the future, some of these clusters of units may eventually
merge and consolidate to establish larger and more advanced milk-processing plants, and
more efficient distribution networks. This would take advantage of the economies of scale
and would increase the distances over which products could be marketed. Bigger
South–South Workshop 355
Small-scale milk marketing and processing in Ethiopia
co-operatives can generally afford the resources necessary for these developments, such as
capital, marketing, land and labour. In such a setting, the milk-marketing units would be
responsible for collection of raw milk from farmers and delivery of bulk milk to the
processing centre owned by the society of the clustered groups. Currently, this proposition
may seem far-fetched since it is difficult to visualise these developments whilst the dairy
sector is still in a rudimentary stage of development; however, it is a vision that should not be
ruled out. A clear and responsive, slow but sure, short- and long-term development
programme, supported by unwavering policy guidelines could bring the vision into reality.
The remainder of the paper will focus on the milk marketing and processing component
of the SDDP project. SDDP has the following six components, which have different
strategies of implementation:
1. Fodder production and animal feeding
2. Dairy cattle breeding and management
3. Animal health
4. Milk marketing and processing
5. Agro-forestry and water management
6. Appropriate technology.
The project is addressing and implementing the component activities integrally as a
package. The project is co-ordinated by the Ministry of Agriculture and implementation of
the field activities is being carried out through the regional agricultural extension network,
and the zonal and wereda agricultural offices.
Farmers’ milk marketing groupsThe market groups are conceptualised and framed to operate as profitable milk units where
smallholders organise themselves in collecting, processing and marketing of milk and
value-added milk products. This approach aims at maintaining and enhancing the groups so
that they become independent entities at the community level. In the context of SDDP, a
milk marketing group can be defined as a group of smallholder farmers who individually
produce at least one litre of saleable milk/day, and are willing to form a group in order to
collectively process and market their milk. The milk marketing groups are named following
their locality’s or peasant association’s name.
The idea of group work and formation of a group is not new to Ethiopia or, for that
matter, to Africa. Different traditional local groups can be identified. For example, women
organise themselves voluntarily into groups known as ‘milk equb’ and ‘butter equb’. Under
these arrangements, individuals gather either their milk or butter and contribute it to other
members in turn. When the turn of receiving comes, each member gets in a single bulk the
amount that she has contributed bit by bit to the others. In this way, instead of going daily to
market with her own small amount of produce, the individual will go once weekly or
fortnightly to market with a larger volume of produce to sell. The arrangement not only
saves members from going to market daily, but also provides them, when they go to sell, with
an amount of milk that brings them a more meaningful amount of money to take home.
356 South–South Workshop
Tsehay

Edir is another kind of grouping in rural and urban communities where individuals organise
themselves and build up common savings through periodic contribution. Moreover, there
is also debo where, seasonally, groups of farmers combine their labour for farm work support
and as a group focus on each member’s individual plot in turn. Such group formation is self
initiated and not imposed and the groups serve their purposes well in rural communities.
Understanding of the rural set-up in terms of social fabric and the farming system practised
are key factors to long lasting formation of farmers’ groups in the peasant sector.
The formation of milk marketing groups was based, in many respects, on the above
traditional background. Interested farmers were invited to be members of the group rather
than the entire peasant association membership. At the beginning, however, the
establishment of milk marketing groups took more time than originally anticipated. This
was because smallholder farmers showed reservation for any form of collective ownership
and co-operative work. The farmers remembered the unfortunate experience of
collectivisation under the socialist regime. Formation of a group could still face difficulties
in areas where producers’ co-operatives have been in operation, even though the word
‘group’ was coined to dissociate this work from past co-operative functions. Producers’
co-operative dairy farms established under the socialist regime have all failed. Dairy stocks
were sold mainly to urban dairy farmers and nearby smallholder farmers. The lesson learnt
was that farmers should produce milk privately but sell milk collectively, mainly because the
amount of sellable milk produced per household is too small to market it separately. To this
effect, Ethiopian co-operative law is in place, which again creates an environment conducive
to co-operative development.
The farmers’ milk marketing groups, though based on strict business terms, are
witnessed by the producers to be more development oriented, long lasting and reliable
market outlets. The element of sustainability is more firmly built into this group approach
than into the approach of the private milk traders’ rural collection scheme. In the latter
scheme, farmers are persuaded to sell milk to these traders but often the purchasing is not
reliable. Disappearance or undue delay of payments by these traders is not uncommon. The
major reasons that the milk groups are successful is that farmers need only to transport milk
over short distances to sell it and are marketing high-value and compacted products such as
butter.
Milk collectionA one-tier structure was adopted under this model (Figure 1). Each centre serves both as a
milk collection and processing site. Milk is collected from nearby farmers and processed at
the centre. Manually operated milk equipment and machines such as milk separators,
butter churns etc. are used in handling the milk. Products are marketed at the same place or
transported to outlets elsewhere. The advantages of these centres to producers include not
only the creation of market outlets and transformation of milk into items with a longer shelf
life, but also facilitation of the production of value-added products. This model requires no
electric power supply and cooling facilities. All that a milk collection and processing unit
South–South Workshop 357
Small-scale milk marketing and processing in Ethiopia
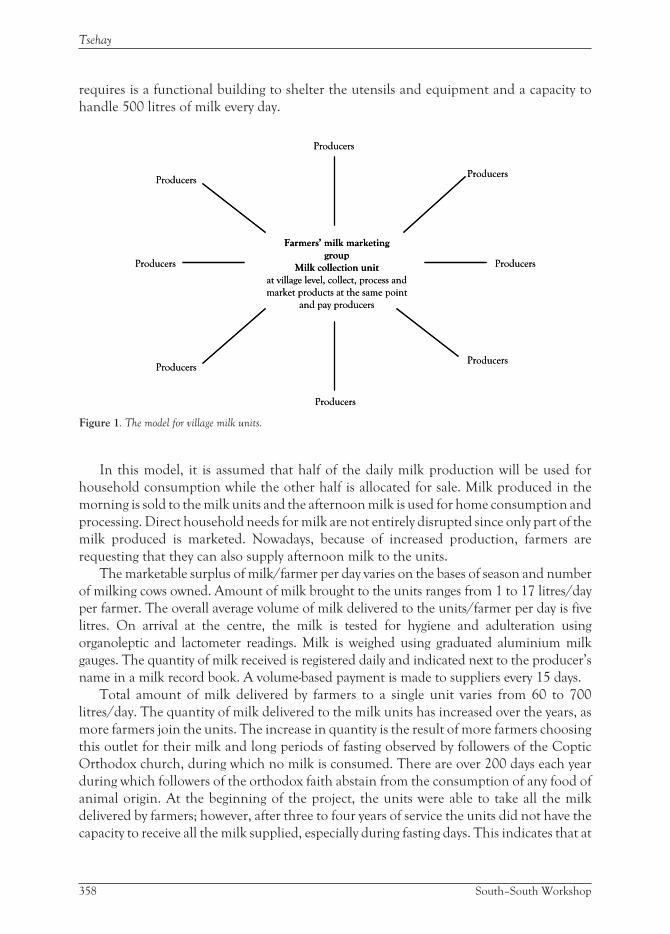
requires is a functional building to shelter the utensils and equipment and a capacity to
handle 500 litres of milk every day.
In this model, it is assumed that half of the daily milk production will be used for
household consumption while the other half is allocated for sale. Milk produced in the
morning is sold to the milk units and the afternoon milk is used for home consumption and
processing. Direct household needs for milk are not entirely disrupted since only part of the
milk produced is marketed. Nowadays, because of increased production, farmers are
requesting that they can also supply afternoon milk to the units.
The marketable surplus of milk/farmer per day varies on the bases of season and number
of milking cows owned. Amount of milk brought to the units ranges from 1 to 17 litres/day
per farmer. The overall average volume of milk delivered to the units/farmer per day is five
litres. On arrival at the centre, the milk is tested for hygiene and adulteration using
organoleptic and lactometer readings. Milk is weighed using graduated aluminium milk
gauges. The quantity of milk received is registered daily and indicated next to the producer’s
name in a milk record book. A volume-based payment is made to suppliers every 15 days.
Total amount of milk delivered by farmers to a single unit varies from 60 to 700
litres/day. The quantity of milk delivered to the milk units has increased over the years, as
more farmers join the units. The increase in quantity is the result of more farmers choosing
this outlet for their milk and long periods of fasting observed by followers of the Coptic
Orthodox church, during which no milk is consumed. There are over 200 days each year
during which followers of the orthodox faith abstain from the consumption of any food of
animal origin. At the beginning of the project, the units were able to take all the milk
delivered by farmers; however, after three to four years of service the units did not have the
capacity to receive all the milk supplied, especially during fasting days. This indicates that at
358 South–South Workshop
Tsehay
Producers
Producers
Producers
Producers
Producers
Producers
Producers
Farmers’ milk marketing
group
Milk collection unit
at village level, collect, process and
market products at the same point
and pay producers
Producers
Producers
Producers
Producers
Producers
Producers
Producers
Producers
Farmers’ milk marketing
group
Milk collection unit
at village level, collect, process and
market products at the same point
and pay producers
Producers
Figure 1. The model for village milk units.

some stage the model requires modification or changes to its approach. This problem arose
this year in the Oromia Region, Fitche area. Nevertheless, most of the units have developed
the capacity to secure market outlets for such overflow. In short, the units have the following
features:
• they are readily accessible to farmers due to their location in the community/villages
• they are a secured market outlet for milk
• they secure regular income to smallholder dairy farmers
• the system is simple and farmers can handle it easily
• electric power supply and cooling facilities are not required
• they reduce labour demand on women.
Milk processing and marketingMilk received by the unit is processed into various milk products (Figure 2), namely, cream,
skim milk, sour skim milk (ergo), butter and ayib (soft curd-type cottage cheese made in many
parts of Ethiopia). Butter is the major value-added product produced at the units.
Studies indicate that butter making is an ancient practice that goes back as far as 2000 BC
to the time of Egyptian civilisation. Butter making may have begun at a similar time in
Ethiopia. The traditional Ethiopian practice is to accumulate the milk for two to three days
South–South Workshop 359
Small-scale milk marketing and processing in Ethiopia
Fresh milk
Separation
Cream
Fermentation
Sour cream
Churning
Butter Butter milk
Skim milk
FermentationSale
Ergo
Sale Heating
Ayib Whey
Fresh milk
Separation
Cream
Fermentation
Sour cream
Churning
Butter Butter milk
Skim milk
FermentationSale
Ergo
Sale Heating
Ayib Whey
Figure 2. Flow diagram showing products from fresh milk.
until it is sour. A clay pot or calabash is then used to churn the sour milk. Butter is used for
cash generation, cooking Ethiopian dishes, and medicinal and cosmetic purposes (e.g.
application to the braided hair of women). In almost all societies of Ethiopia, women are
responsible for butter. In general, husbands or men do not decide what is done with butter
produced at home. The contribution of dairy products to the gross value of livestock
production is not known but in peri-urban areas about 20% of average income was derived
from dairy products (Winrock International 1992).
At the units, however, the cream obtained is used for butter making while the skim milk
is sold back to farmers or to any other customer for ergo or ayib making. Variation is observed
among the units in the extent of the marketing outlet for skim milk. In some units,
consumers readily take the skim milk but this is not always the case; nevertheless, it has now
become an accepted product for consumption. Skim milk is an affordable product to poor
farmers who do not own cows. It can be consumed directly or used to produce ayib if
required. There are some places in the countryside where it is not yet socially acceptable to
sell fluid milk directly to friends and relatives. The existence of the units is helping to free
both producers and consumers from this social barrier; it encourages free access to milk and
dairy products.
Overall day-to-day operation and management of the units is the responsibility of the
respective farmers’ milk marketing group members and trained milk technicians employed
by the group.
One season’s samples taken from Lemu milk marketing unit (Oromia Region) by the
International Livestock Research Institute (ILRI) dairy technology unit at Debre Zeit,
showed the average fat content of whole milk, cream and skim milk to be 4.7%, 59% and
0.18%, respectively.
The buying and selling prices of milk and milk products have seasonal variations and
have no fixed price as such. The change in prices is normally decided at a meeting held by the
group members.
It is clear that processing at the units transforms milk into items with a longer shelf life
and into value-added products. Nonetheless, the units can also be regarded as centres in a
cycle of smallholder dairy development because creating a market outlet for available milk
precipitates sales. The subsequent boost in sales stimulates farmers to be more responsive in
accepting advice given relating to cattle and milk management (improved feeding,
nutrition, breeding, health and hygiene). Improved management then brings about
increases in milk yield. Increased milk yields lead to increased incomes and more flow of
milk into the units. Increased flow increases the amount of milk available to consumers at a
competitive price. The resultant increase in consumption results in increases in demand
and consequently the development cycle continues.
Income generationEven though a farmer can supply as much as 17 litres/day or as little as 1 litre/day, as stated
earlier, the average volume of milk delivered/farmer per day is about 5 litres. The processing
unit gate price for one litre of milk varies from 1.25 to 1.50 Ethiopian birr (EB) (EB 1 = US$
360 South–South Workshop
Tsehay
8.4). If EB 1.25/litre is assumed as the price for calculation purposes, it can safely be said
that a farmer can earn about EB 188 or more each month from the sale of morning milk.
Most of the women farmer suppliers get an income above the quoted average figure.
The above explanation indicates the size of income obtained from sales of milk from the
individual farmer’s point of view. From the farmers’ milk marketing unit point of view,
income varies greatly depending on factors including location, unit’s management and
amount of milk received. In general, all farmers’ milk marketing units are profitably run and
the total revenue collected comes from sales of butter, fresh skim milk, and skim milk ergo
and ayib. Most revenue is collected from the sales of butter as it has a high market value.
Over half of the revenue is used to pay suppliers for raw milk purchased.
In general, with this type of project approach, a production level of 1600–2000 litres of
milk/cow per annum is easily obtained under smallholder conditions. Production of 1600
litres provides a gross margin of almost EB 2000 to the owner of a crossbred cow, whereas
production by a local cow gives a gross margin of EB 240–480. Farmers owning more than
two improved cows can earn an income up to EB 5000/year. For comparison the gross
domestic product (GDP) per capita in Ethiopia is about EB 770 (Ojala 1998). Dairying is an
investment option for farmers, which can provide a sustaining family income.
EmploymentThe units have created employment opportunities in rural areas. In addition to the labour
and time spent on managerial and marketing aspects by the milk marketing group members,
at initiation each unit employs four permanent workers. Of the four workers, two are milk
technicians who are responsible for running the milk unit’s daily operation and are trained
by the project in rural dairy technology, product marketing and equipment handling. The
other two are a cleaner and a guard. Their salaries are paid monthly from the profit of the
respective milk-marketing group. As the volume of milk handled increases, the units call for
more employees.
Conclusion and recommendationsMarket-oriented agricultural production would secure food supply to the rapidly growing
non-farming community; create employment and promote economic development in rural
societies. Marketing services are critical to rural as well as to urban food security. The
experience shared in this report shows that, at all levels, interventions have to be market-
oriented.
In the past, we have seen many interventions for increasing production, but much less
focus on marketing services. Government engagements have focused on input oriented
systems aimed at tackling problems that restricted milk production and not on output and
the issues of milk market and milk disposal. For increased milk production, development of
appropriate milk marketing and processing systems is now recognised as an overdue issue.
Unless firm and steady steps are taken immediately and on a wider scale, output will be
South–South Workshop 361
Small-scale milk marketing and processing in Ethiopia
frustrated further. In general, the introduction of improved marketing is pivotal to an
increase in production.
Recommendations are as follows:
• Farmers’ milk marketing groups are identified as being essential to dairy development
and are necessary to overcome the problems of collection, transportation, processing
and marketing of milk. The establishment of producers’ organisation should continue
to be promoted more vigorously by the relevant organisations and the producers’ groups
strengthened through accelerated training and extension education programmes.
• Dairying is a labour-demanding farm activity. The crossbred cow is more time and labour
demanding than the indigenous cow. The higher the level of exotic blood the greater the
time and labour inputs that are required for milking, processing, marketing, feeding and
manure disposal etc. Much of these burdens rest on the shoulders of women. Under the
SDDP, efforts were made to introduce locally produced improved wooden and stainless
steel churns to reduce labour required in back yard butter making. Churning normally
takes almost 3 hours using traditional churns while with improved, larger capacity
churns it takes only 15–20 minutes. The introduction of marketing units in the villages
also reduces the labour demand on women, as almost 50% of milk production is sold to
the units rather than processed at home. Nevertheless, more is required and the vital role
of women in the traditional livestock production system should be given due regard in
improvement and enrichment through extension education.
• The traditional cattle keepers in the pastoral areas have more surplus milk per capita
than their fellow highlanders. Due to the larger size of herds they are faced with a surplus
of milk during the rainy and peak lactation seasons. A significant amount of milk could
be obtained from this supply source if seasonally operating milk units were considered. It
would also create a source of income for the pastoralists. Hence, support must be given
to improve pastoral society milk production from the indigenous stock.
• In the past, research in Ethiopia has focused largely on biological problems. There has
been limited adaptive research undertaken. Importance of on-farm research, and studies
and adoption of technologies should be stressed by extension workers. Moreover, milk
marketing and processing is one of the major obstacles to dairy industry development,
hence it requires a thorough investigation and research should take the lead. Activities
requiring investigation include: productive management strategies for the units; milk
marketing systems research; preservation methods for dairy products; research in the
field of dairy co-operative development; small-scale dairy machinery; and traditional and
improved processing techniques.
A story/lesson learnedI would like to share with you the reasons why and how I developed an interest towards
developing small-scale milk processing and marketing as a path for dairy expansion.
Moreover, I wish to explain why I keep saying that there is a need for overall change of
approach which perhaps still runs contrary to the beliefs of most of my colleagues.
362 South–South Workshop
Tsehay
Let me take you to the southern part of Ethiopia (the coffee growing area) where I was
assigned as a junior livestock expert soon after completion of my undergraduate studies. In
particular, I would like to take you to the peasant association areas (45 km south of Awassa).
This was a place where at that time we had established a dairy farm, based on 10 in-calf
crossbred (Holstein × Boran) heifers that the government provided to start producers’
co-operative dairy farms. Before the heifers were taken to the area, farmers met the
preconditions for receipt of the heifers. Farmers had constructed a partitioned shed for
heifers, cows, calves and a breeding bull and they had allocated grazing areas and land to
grow improved pasture crops. At the time, at the country level, two livestock projects, the
Fourth Livestock Development Project (FLDP) and the Dairy Rehabilitation Development
Project (DRDP) were ongoing. Neither project covered the Southern Zone (the Debub
ketena under the previous structure). However, the DRDP tried to give a little assistance to
this zone towards the end of its life. Furthermore, although the FLDP was not functioning
fully in the area, they provided most of the forage seeds required by the southern region.
One of the forage seeds distributed was alfalfa seed. Wenenata dairy farm was one of the
dairy farms that received this seed for pasture establishment.
One day, as usual, I went to visit the farm and to see how the alfalfa was growing in that
area. It was the first experience farmers had had of growing alfalfa in that area. I visited the
cows, calves born, the shed etc. and it seemed that everything was in order. I then walked
into the grazing area, mainly to see the alfalfa field. The farmers accompanied me,
throughout this inspection process. When I reached the alfalfa field, which was initially well
established, I found it to be full of weeds; it was hardly possible to see the alfalfa plants. It was
all weeds. I was very disappointed, mainly because alfalfa seed is expensive; at that time the
price of one kg of alfalfa seed was about EB 37, that is about EB 3700 per quintal (US$ 1 =
EB 2.10). In addition, improved forage seeds were hard to obtain, as officially the area was
not a beneficiary member region of the FLDP. It required a lot of personal effort to bring the
seed on time to farmers so that they could sow and utilise it to improve production. As I saw
it then, it was a total failure. I tried to control my feelings and asked the farmers around me
to explain why they didn’t weed it on time and utilise it. All they said was they would weed it
immediately and promised that for my next visit, everything would be in order. Somehow I
sensed that their acceptance to weed was not from their hearts, but only to please me. I
realised more discussions with them were needed to find out all about it. Towards the end of
a half-day free discussion covering all the activities of the dairy farm, one old farmer came up
with the real reason for the neglect of the alfalfa pasture. He explained that they were
producing about 40 litres of milk/day and although they could easily sell half of it to nearby
consumers, they did not have a market for the remaining milk.
He asked why they were being pushed to feed the cows well and produce milk for which
there was no market. Additionally, he said ‘we know quite well that it will be to our
advantage to produce more and market more, but this is not the situation now’. He then
questioned me by asking ‘how would you help us to get a market for our extra milk’? With
the background and experience I had at that time, I was not prepared for his question and
was unable to provide a solution for their problem. However, for me it was the most
important and greatest lesson gained from that discussion, not the sort of experience one
South–South Workshop 363
Small-scale milk marketing and processing in Ethiopia

can get from a University. I concluded that, if promotion of improved dairying in the
villages is not linked with appropriate marketing arrangements, it is a futile exercise.
I brought this new outlook back from the field and I tried to sell it across to my
colleagues in office. But no one seemed to have an interest at the time except the farmers
and a handful of professionals. For Wenenata, I tried to link the milk marketing to a nearby
hospital and a cream separator was also introduced. But my efforts didn’t resolve the
problem very well, as my approach was not clearly conceptualised then. It was a dilemma to
me as it was difficult to abandon the interest of the farmers. They had clearly identified their
problem. There on, whenever I got the forum I began and continued to raise the farmers’
problem as an issue. Through the course of time I faced very many challenges and resistance
in many meetings and conferences. Whenever I tried to explain the crucial nature of the
marketing function in promoting dairying in the villages, the acceptance was poor and
listeners were very few. The conviction was that what is important for Ethiopia is to produce
milk not to sell milk. This statement sounded logical to officials but was not of any substantial
value to the farmers who were producing the milk unless there was a market for their
produce.
Time has gone by and here we are now ladies and gentleman. Even now, very many
experts in the field of extension and research tend to pay little attention to milk processing
and marketing. Milk is highly perishable, unless it is all consumed immediately or processed
soon after production, it is clear that it will be wasted. I don’t think we can afford to simply
waste the milk produced, particularly as Ethiopia is such a poor country. It is also wrong to
encourage poor farmers to run improved dairying schemes and make them invest their
money where they can’t recover their costs.
For future success in the field of dairying, there should emanate from dairy professionals
a determination to resolve the smallholders’ problems. So let us put our hands together and
direct our future dairy development to be output/market oriented so that smallholders can
optimise their benefits from dairying.
ReferencesAzage Tegegne and Alemu Gebre Wold. 1998. Prospects for peri-urban dairy development in
Ethiopia. In: ESAP (Ethiopian Society of Animal Producton), fifth national confernce of Ethiopian Society
of Animal Production, Addis Ababa, Ethiopia, 15–17 May 1997. ESAP, Addis Ababa, Ethiopia. pp.28–39.
Belachew Hurisa, Ahmed Mohammed, Haileleul Teferi and Abebe Lema. 1994. Dairy products
marketing survey in Addis Ababa and the surroundings. DDE (Dairy Development Enterprise), AddisAbaba, Ethiopia.
CSA (Central Statistics Authority). 1996. Report on human population. Volume II. Statistical Bulletin152. CSA, Addis Ababa, Ethiopia.
Debrah S. and Berhanu Anteneh. 1991. Dairy marketing in Ethiopia. ILCA Research Report 19. ILCA(International Livestock Centre for Africa), Addis Ababa, Ethiopia. 21 pp.
ILCA (International Livestock Centre for Africa). 1993. Handbook of African livestock statistics. ILCA,Addis Ababa, Ethiopia.
364 South–South Workshop
Tsehay

MoA (Ministry of Agriculture). 1998. The role of village dairy co-operatives in dairy development: Prospects
for improving dairy in Ethiopia. SDDP (Smallholder Dairy Development Project), Addis Ababa,Ethiopia.
Ojala R. 1998. SDDP milk marketing study on farmers’ milk processing units. SDDP (Smallholder DairyDevelopment Project), Addis Ababa, Ethiopia.
Saxena M.M., Katpatal B.G. and Pandey H.S. 1997. Study of milk constituents and their yield inHolstein–Friesian cows. Indian Journal of Animal Production and Management 13(3):127–130.
Staal S.J. and Shapiro B.I. 1996. The economic impact of public policy on smallholder peri-urban dairy
producers in and around Addis Ababa. ESAP Publication 2. ESAP (Ethiopian Society of AnimalProduction), Addis Ababa, Ethiopia. 57 pp.
Tsehay Redda. 1995. Smallholder dairy development pilot project termination report. FAO/TCP/WFP (Food
and Agriculture Organization of the United Nations/Technical Coopeartion Programme/World Food
Programme). FAO, Rome, Italy.
Tsehay Redda. 1998. Prospects for improving dairy in Ethiopia. SDDP proceedings. MoA, Addis Ababa,Ethiopia.
Tsehay Redda. 1998. Milk processing and marketing options for rural small-scale producers. In:ESAP (Ethiopian Society of Animal Producton), fifth national confernce of Ethiopian Society of Animal
Production, Addis Ababa, Ethiopia, 15–17 May 1997. ESAP, Addis Ababa, Ethiopia. pp. 61–71.
Winrock International. 1992. Assessment of animal agriculture in sub-Saharan Africa. WinrockInternational Institute for Animal Agriculture, Morilton, Arkansas, USA.
South–South Workshop 365
Small-scale milk marketing and processing in Ethiopia
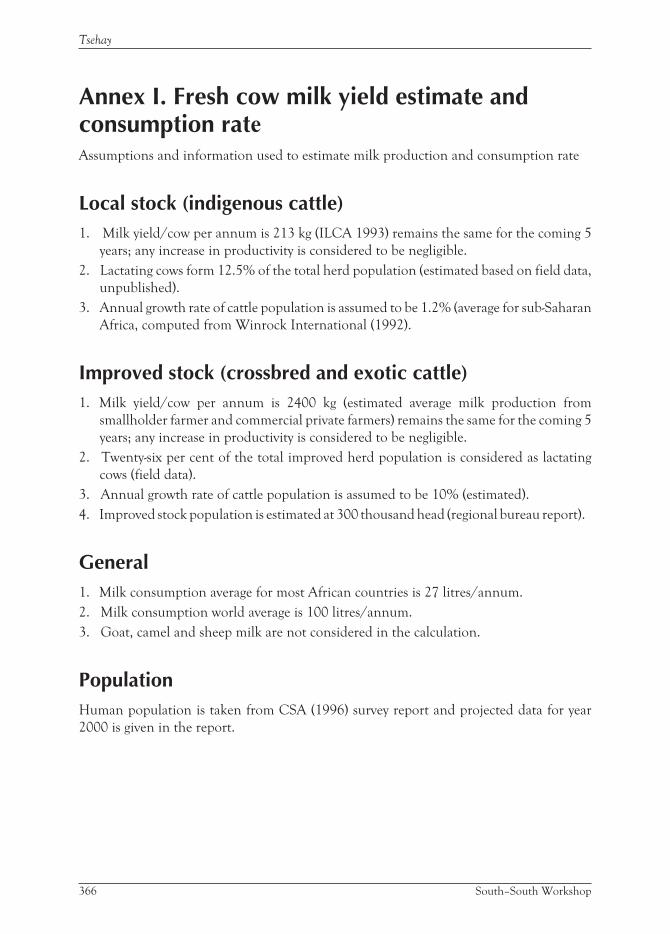
Annex I. Fresh cow milk yield estimate andconsumption rateAssumptions and information used to estimate milk production and consumption rate
Local stock (indigenous cattle)1. Milk yield/cow per annum is 213 kg (ILCA 1993) remains the same for the coming 5
years; any increase in productivity is considered to be negligible.
2. Lactating cows form 12.5% of the total herd population (estimated based on field data,
unpublished).
3. Annual growth rate of cattle population is assumed to be 1.2% (average for sub-Saharan
Africa, computed from Winrock International (1992).
Improved stock (crossbred and exotic cattle)1. Milk yield/cow per annum is 2400 kg (estimated average milk production from
smallholder farmer and commercial private farmers) remains the same for the coming 5
years; any increase in productivity is considered to be negligible.
2. Twenty-six per cent of the total improved herd population is considered as lactating
cows (field data).
3. Annual growth rate of cattle population is assumed to be 10% (estimated).
4. Improved stock population is estimated at 300 thousand head (regional bureau report).
General1. Milk consumption average for most African countries is 27 litres/annum.
2. Milk consumption world average is 100 litres/annum.
3. Goat, camel and sheep milk are not considered in the calculation.
PopulationHuman population is taken from CSA (1996) survey report and projected data for year
2000 is given in the report.
366 South–South Workshop
Tsehay

Estimated milk production and consumption rate ofEthiopia
Year
Cattle population Lactating cows Milk
production
(× 109)
Human
population
(× 106)
Per capita
consumption
(kg)
Ind.
(× 106)
Imp.
(× 103)
Ind.
(× 106)
Imp.
(× 103)
1997 33 – 4.125 – – 56.600 16
1998 33.399 300 4.174 78 1.076 58.298 18
1999 33.800 330 4.225 85.8 1.105 60.046 18
2000 34.206 363 4.275 94.38 1.137 61.848 19
2001 34.616 399.3 4.327 103.8 1.161 63.703 19
2002 35.032 439.2 4.379 114.2 1.206 65.614 19
2003 35.452 483.1 4.431 125.6 1.245 67.583 19
2004 35.878 531.4 4.484 138.18 1.286 69.610 19
2005 36.308 584.6 4.583 152 1.341 71.699 19
Ind. = Indigenous stock; Imp. = Improved stock.
South–South Workshop 367
Small-scale milk marketing and processing in Ethiopia
Impacts of liberalisation in Kenya’s dairy sectorJ. OmitiInstitute of Policy Analysis and Research (IPAR), P.O. Box 45843, Nairobi, KenyaE-mail: [email protected]
BackgroundThe dairy industry has experienced three periods of major shifts of pricing policy since
1965. In the first period lasting until 1971, a milk quota and contract pricing system guided
dairy production. Dairy marketing was undertaken by a number of independent factories,
processing and selling dairy produce in a relatively free market system. The pricing policy
aimed at increased production for domestic and export markets. Between 1971 and 1992, a
pan-territorial liberalised production and uniform pricing system guided dairy production
and marketing. During this period, producer and consumer prices were determined by the
Ministries of Agriculture and Finance, based on recommendations on milk procurement,
processing and distribution costs. In 1992, the government liberalised the dairy industry
(Omiti and Muma 2000).
A variety of reformsSince the early 1980s, the government of Kenya has instituted a number of economic and
institutional reforms aimed at improving economic performance and macro-economic
stability. In general, these reforms have aimed at reducing or removing government support
and its direct participation in various sectors of the economy. Such measures have included
withdrawal of subsidies, price deregulation, trade, non-participation in input markets etc.
This is expected to permit the forces of supply and demand to determine the production,
distribution and marketing of various goods and services in the economy and thus promote
efficiency, flexibility and economic growth.
In the dairy sector, some of the major reforms have included: (i) selling veterinary
drugs at full cost in 1988, (ii) price liberalisation for animal feeds in 1989, (iii) transfer of
the management of cattle dips to community groups in 1989, (iv) privatisation of artificial
insemination (AI) services in 1991, (v) decontrolling of milk prices and liberalisation of
the dairy sector in 1992, and (vi) privatisation of clinical (veterinary) services in 1994.
368 South–South Workshop

Slow pace of reformsBefore assessing the impacts of these reforms, it is worth noting some preliminary
impediments to adequate and acceptable implementation of these reforms. Many of these
reforms have not:
i. been accompanied by sufficient publicity to permit farmers and the business community
to organise alternative means of accessing various inputs and services
ii. adequately involved major stakeholders to avoid conflicts in implementation and policy
such as protection of vulnerable groups in their food security status (i.e. social
dimensions of structural adjustment programmes)
iii. been sufficiently co-ordinated within and across different sectors of the economy; or,
iv. provided adequate time to permit the private sector or farmers’ organisations to take
over responsibilities hitherto shouldered by government or quasi-public institutions.
Many of these reform programmes had generic difficulties in implementation including:
i. focusing on funding of the preparatory stages for adjustment (e.g. policy papers, desktop
studies etc.) rather than on implementation aspects
ii. setting too many conditionalities whose meaning was rather ambiguous and
iii. placing great confidence on a small number of key functionaries in government whose
replacement/removal could substantially affect the likelihood of success of the reform
programme(s).
A case study of impacts in a liberalising dairy sectorPrice liberalisation has borne mixed impacts along the dairy production–marketing–
consumption continuum in general. There are indications of differential impacts on input
supply especially on veterinary services, milk prices, and private-sector participation in milk
processing and marketing. The dairy sector is also experiencing serious problems due to
macro-economic difficulties, decreasing budgetary support, inefficiencies in pricing and
marketing, high input costs, institutional and governance problems, and low adoption of
dairy technologies. A major policy challenge is the slow evolution of an efficient
private-sector to provide farm inputs, financial and marketing services, technical support
including veterinary and breeding services in a liberalising market system to increase
sectoral employment, farm incomes and social welfare. This case study describes some of the
impacts of liberalisation of the dairy sector in Kenya.
Impacts on milk pricesFarm-level milk production is influenced by a number of important variables including
socio-economic factors, demographic variables, infrastructure, farming practices, factor
markets, disease and parasite control, institutions of collective action (co-operatives),
biotechnology and policy factors. Through time, smallholder farmers have gradually
South–South Workshop 369
Impacts of liberalisation in Kenya’s dairy sector

increased their participation in market-oriented milk production through upgrading of
their local dairy breeds. Smallholder farms average 2 ha and contribute to about 80% of
marketed milk production (MoA 1997). Milk production is based on grade cattle (e.g.
Friesians) and their crossbreeds, which numbered about 3.2 million in 1999. Over the
years, there has been increased milk production despite periodic fluctuations, often
associated with weather changes. Annual milk production is estimated at 2.5 million tonnes
serving an estimated demand for 2.3 million tonnes. However, demand is expected to
outpace supply as from the year 2005 onwards.
Production costs are nearly equal to producer prices in most milk-producing areas. With
increasing input costs, profit margins are not large for most operators. Although import and
export parity prices seem to have been achieved, there has been a debatable decline of 4% in
real producer milk prices, in some areas. However, it is believed that most dairy farmers
across the country generate good returns, especially from the milk they sell to
neighbours/other consumers, which regularly constitutes over 50% of all their marketed
milk. In many instances, reforms do not seem to have led to greater price competition
amongst milk processors as they are geographically scattered and tend to significantly
influence regional farm-gate prices following the collapse of Kenya Co-operative Creameries
(KCC). However, a major positive impact of price liberalisation is the reduction in delays of
farmer payments for their milk sold to now largely private factories.
Accessibility and cost of breeding servicesThe dairy breeding policy has focused on upgrading the local zebu through artificial
insemination (AI), use of elite bulls or imported germplasm to increase milk production
while controlling breeding diseases. AI has been privately operated in large-scale farms since
1935 and government provided to smallholders since 1966. Due to government financial
constraints and withdrawal of donor support, AI services were privatised in 1991.
Since privatisation of the service, there has been a gradual but significant decline in AI
coverage irrespective of whether it is offered by the public or private sector (Table 1).
Second, a number of private AI service providers have emerged but are concentrated in
areas with high densities of dairy cattle, which more or less justifies demand. Third, the
relative cost per insemination of AI from the privatised service is considered prohibitive to
the majority of farmers, especially smallholders, having escalated from about 10 Kenya
shillings (KSh) (US$ 1 = KSh 17.37 on 2nd June 1989) per insemination in the late 1980s to
about KSh 250–300 in the mid 1990s (US$ 1 = KSh 53.98 on 2nd June 1995).
Available evidence suggests that private veterinarians cannot profitably offer breeding
services at current prices and conditions. This has serious technical and policy implications.
First, most of the previous significant achievements in technology adoption (e.g. high milk
yields) will be reversed, especially amongst the smallholders. Second, an increasing number
of farmers are resorting to using inferior bulls. It is estimated that only about 20% of the
dairy herd used AI in the late 1990s. Third, there will be shortfalls in milk production in the
medium term (i.e. 5–10 years) that have critical policy implications on food security,
malnutrition and commercial dairy imports. Policy support is required to facilitate the entry
370 South–South Workshop
Omiti

and active participation of private investors to offer breeding services in the broad context of
sectoral development. It is necessary to have regulatory mechanisms to maintain the quality
of semen, and organise and monitor various breeding organisations so that they are
managed efficiently and sustainably.
Table 1. Number of artificial inseminations (AI) 1990–1997, by provinve.
Year/province AI by 1990 1991 1992 1993 1994 1995 1996 1997
Central Public 211,847 120,298 105,512 71,296 55,198 55,512 27,772 3737
Private – – 7479 19,269 32,720 51,793 69,908 73,165
Western Public 9197 5534 5922 4226 3523 4271 4341 1468
Private – – – – – 412 1042 1047
Rift Valley Public 84,451 52,852 42,237 30,201 23,515 24,343 16,439 –
Private – – – 192 810 3470 9677 8976
Nyanza Public 7908 3109 2136 2490 2318 3300 2405 812
Private – – – – 253 331 333 349
Eastern Public 74,134 55,363 35,400 24,276 18,887 9326 11,377 –
Private – – 360 397 298 3231 10,961 14,568
Coast Public 6824 4947 2943 2584 1006 983 840 –
Private – – – – – – 38 –
Nairobi Public – 2613 1104 714 638 579 95 –
Private – – – 6 217 371 622 539
National totals 394,361 244,716 203,093 155,651 139,383 157,927 155,850 104,661
Public – totals 394,361 244,716 195,254 135,787 105,085 98,319 63,269 6017
Private – totals – – 7839 19,864 34,298 59,608 92,581 98,644
Source: MoA (1999b). Data for periods after 1997 are not reliably available.
Availability and quality of manufactured feedsMilk production is mainly based on natural forages. In most cases, concentrate feeds are
given to animals during particular physiological phases such as lactation. Generally, there
has been low usage of manufactured feeds due to controls on distribution and marketing
prior to reforms in the animal feeds sector in 1989. With price, more feed manufacturers
and traders have entered the feeds market and there is an upward trend in feed supply.
Animal feedstuffs are now more accessible in most areas. The role of government is at
present confined to monitoring and regulating feed standards, trading practices, policy and
institutional support (FAO 1993; MoA 1999b).
There are, however, a number of issues regarding the animal feeds subsector. First, on
most farms, there is inadequate fodder production due to decreasing farm sizes and increasing
competition for land between enterprises. Second, there are seasonal fluctuations in feed
quality and quantity, especially on most smallholder farms (MoA 1997). Third, there is
inadequate technical and market information among millers, traders, extension agents and
farmers in the production, stocking, selling and utilisation of animal feeds. Fourth,
government agencies such as the Kenya Bureau of Standards have inadequate technical and
South–South Workshop 371
Impacts of liberalisation in Kenya’s dairy sector
human resources to enforce and monitor various requirements for feed standards (FAO
1993). Fifth, inputs (e.g. fertiliser) that would promote fodder production are expensive in
relative terms. This calls for policy to facilitate key stakeholders (e.g. government,
manufacturers, farmers’ organisations etc.) to set rules for feed standards, transactions and
their enforcement. Emphasis is required on on-farm research to facilitate greater production
and utilisation of fodder and farm by-products rather than on reliance on concentrates.
Impacts on dairy research and extensionImpacts on research and extension services have borne mixed results. With government
financial constraints and diminishing donor support in the 1990s, public expenditure in
dairy research has continued to decline. The dairy sector is experiencing major drawbacks in
realising higher returns to research investments. These include: (i) inadequate physical and
human resources, (ii) weak research–extension–farmer linkages, (iii) low extension to
farmer ratios, (iv) failure to effectively co-ordinate sectoral investments, and (v) lack of an
appropriate institutional and legal framework to provide stakeholders with key direction(s)
on sectoral development. These problems demonstrate the need for revitalising research
with the support and participation of international, national and non-government research
organisations. However, linkages must be streamlined to increase inputs in adaptive
research. Mechanisms must be worked out to increase and sustain funding to national
research institutions. Better co-ordination of various donor-supported programmes is also
required to enhance the chances of greater impact.
Individual farmer extension seems to have had limited impact due to high investment
requirements, non-availability of extension materials and narrower farmer coverage.
Subsequent revisions of extension approaches have faced government budgetary
constraints and so have not been effective or timely, especially with regard to transport
and operational costs. Cultural and gender barriers to extension have not been adequately
addressed to make extension more effective (MoA 1996). There are weak extension
linkages to research and policy-making bodies; consequently some extension messages are
irrelevant or misdirected. Moreover, extension materials for privatised extension, which
address various information gaps to stakeholders, are not available. In addition,
education and training programmes are also not sufficiently harmonised with research
and extension requirements. There is need for a more coherent national extension policy
to better serve dairy development goals such as organisational linkages, education and
training. Policy should encourage private institutions involved in different extension
services to satisfy emerging demands embedded in food security, privatisation and
sectoral development.
Impacts on milk processingBefore reforms, the KCC had a national monopoly in milk processing and marketing with its
network of 11 processing plants, 11 cooling centres and 26 sales depots which were spread
countrywide. This network was facilitated by a network of reasonably motorable trunk and
372 South–South Workshop
Omiti
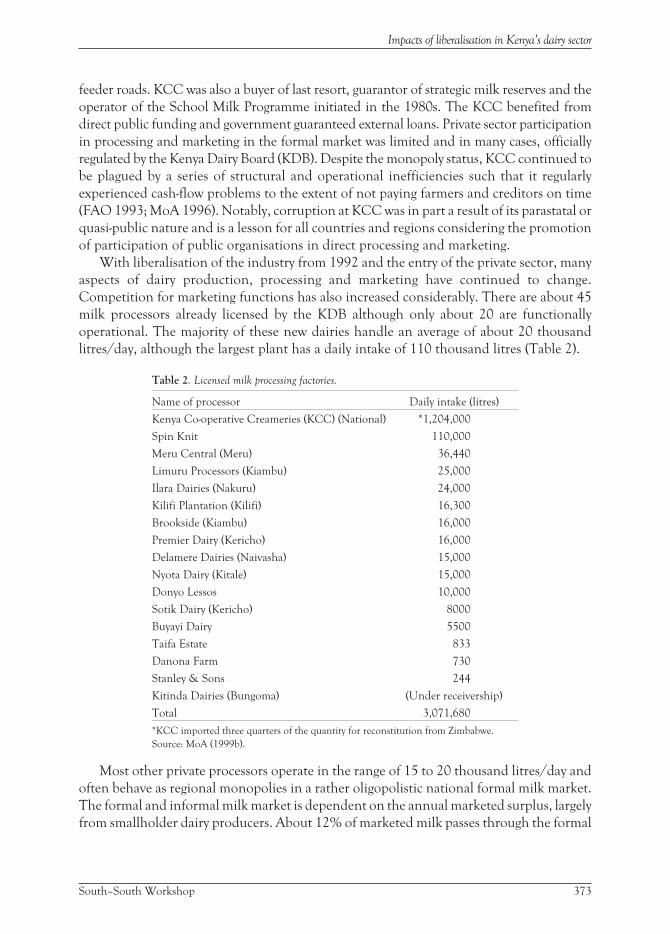
feeder roads. KCC was also a buyer of last resort, guarantor of strategic milk reserves and the
operator of the School Milk Programme initiated in the 1980s. The KCC benefited from
direct public funding and government guaranteed external loans. Private sector participation
in processing and marketing in the formal market was limited and in many cases, officially
regulated by the Kenya Dairy Board (KDB). Despite the monopoly status, KCC continued to
be plagued by a series of structural and operational inefficiencies such that it regularly
experienced cash-flow problems to the extent of not paying farmers and creditors on time
(FAO 1993; MoA 1996). Notably, corruption at KCC was in part a result of its parastatal or
quasi-public nature and is a lesson for all countries and regions considering the promotion
of participation of public organisations in direct processing and marketing.
With liberalisation of the industry from 1992 and the entry of the private sector, many
aspects of dairy production, processing and marketing have continued to change.
Competition for marketing functions has also increased considerably. There are about 45
milk processors already licensed by the KDB although only about 20 are functionally
operational. The majority of these new dairies handle an average of about 20 thousand
litres/day, although the largest plant has a daily intake of 110 thousand litres (Table 2).
Table 2. Licensed milk processing factories.
Name of processor Daily intake (litres)
Kenya Co-operative Creameries (KCC) (National) *1,204,000
Spin Knit 110,000
Meru Central (Meru) 36,440
Limuru Processors (Kiambu) 25,000
Ilara Dairies (Nakuru) 24,000
Kilifi Plantation (Kilifi) 16,300
Brookside (Kiambu) 16,000
Premier Dairy (Kericho) 16,000
Delamere Dairies (Naivasha) 15,000
Nyota Dairy (Kitale) 15,000
Donyo Lessos 10,000
Sotik Dairy (Kericho) 8000
Buyayi Dairy 5500
Taifa Estate 833
Danona Farm 730
Stanley & Sons 244
Kitinda Dairies (Bungoma) (Under receivership)
Total 3,071,680
*KCC imported three quarters of the quantity for reconstitution from Zimbabwe.
Source: MoA (1999b).
Most other private processors operate in the range of 15 to 20 thousand litres/day and
often behave as regional monopolies in a rather oligopolistic national formal milk market.
The formal and informal milk market is dependent on the annual marketed surplus, largely
from smallholder dairy producers. About 12% of marketed milk passes through the formal
South–South Workshop 373
Impacts of liberalisation in Kenya’s dairy sector

market composed of KCC and some 45 private milk processors1. The remainder is sold
through: (i) direct sales to consumers, either individuals or organisations, which accounts for
633 million litres (58%); and (ii) co-operatives, self-help groups and small traders (e.g. milk
bars, kiosks and mobile traders) who sell about 327 million litres (30%) to consumers (Omore
et al. 1999). These quantities and their proportions will vary somewhat from year to year.
Following liberalisation, market shares in the informal sector have not changed
radically. However, in the formal milk market, the greatest loser has been the former
national monopoly (KCC), whose market share has decreased significantly. The biggest
beneficiaries seem to be the smallholder farmers and itinerant traders, especially the
hawkers (Figure 1).
Despite liberalisation, old problems such as low producer prices, market malpractices and
anti-competitive practices such as dumping of dairy products have persisted (Omiti et al. 1993;
374 South–South Workshop
Omiti
BHawkers
15%
KCC
3%
Processors
5%
Farmers
54%
Co-operatives
+ SHGs
23%
A
Farmers
39%
KCC
34%
Hawkers
3%Co-operatives
+ SHGs
24%
BHawkers
15%
KCC
3%
Processors
5%
Farmers
54%
Co-operatives
+ SHGs
23%
A
Farmers
39%
KCC
34%
Hawkers
3%Co-operatives
+ SHGs
24%
KCC = Kenya Co-operative Creameries; SHGs = self-help groups.Source: MoA (1987, 1999b).
Figure 1. Market shares for: A. Smallholder marketed milk, pre-reforms 1987; and B. Smallholder marketed milk,
post-reforms 1997.
1. The 133 million litres is equivalent to 70% of the estimated total of 190 million litres from small- andlarge-scale farms that were processed in 1997 (44 million litres by KCC and 146 million litres by otherprivate processors). KCC alone processed slightly over 200 million litres in 1992–93 when milk marketingwas liberalised, indicating that the total volume of processed milk has remained about the same over theperiod (Omore et al. 1999; Omiti and Muma 2000).
MoA 1999a). Evaluating the structure, conduct and performance of various marketing
channels of inputs, commodities and services would be instrumental in identifying critical
constraints and realistic opportunities for institutional changes aimed at improving dairy
development. There is need to create and mobilise the necessary institutional capacity
capable of identifying and addressing problems in both the informal and formal milk
markets in order to expand the opportunity sets of different segments of the farming and
business community.
Impacts on milk tradersDairy reforms have contributed to increasing marketing margins for market agents,
especially in milk deficit areas. Increasing competition for marketing functions such as
collection, transportation, processing and distribution/retailing has increased income and
employment opportunities, especially to milk vendors (Omiti and Muma 2000). Many
small-scale market traders (often referred to as ‘hawkers’) generally each sell less than 120
litres of milk per day but this business activity enables them to earn a daily income equal to
approximately twice the national average (Omore et al. 1999), which is a significant
contribution to poverty reduction. Poverty reduction is a key national policy concern since
more than half of the population lives below the poverty line (US$ 1–2 per day).
Challenges and opportunitiesMilk has no close substitute. Dairy policy has been and is currently devoted to the
promotion, increase and sustainability of milk production to achieve self-sufficiency
through research, extension, training, veterinary services, input supply, pricing and
marketing. Like other sectors, dairying has experienced serious problems that have resulted
in economic and institutional reforms. Price liberalisation has had mixed effects on inputs
policy (especially for feeds), breeding services (especially AI), farm-level disease control
strategies, research and extension, feeding strategies, technology adoption, milk marketing,
institutional and legal frameworks, import–export parity prices and maintenance of
strategic dairy reserves. In this section, emerging challenges and opportunities are
highlighted to indicate potential areas of intervention for the facilitation of sectoral
development.
Strengthening farmers’ organisationsThere are more than 5600 registered co-operatives with a total membership of over 2.5
million. Dairy co-operatives account for 34% of all co-operatives (MoA 1999a). They have
contributed significantly to the development of smallholder dairying through milk
marketing and provision of other services at relatively low costs (Owango et al. 1998). The
share of milk supply produced by dairy co-operatives and/or unions reached its peak in
1987, accounting for 76% of KCC milk intake.
South–South Workshop 375
Impacts of liberalisation in Kenya’s dairy sector

In the 1990s, performance of many co-operatives declined considerably due to political
wrangles, management problems, stakeholder conflicts and greater competition from
private processors. Other major obstacles affecting dairy co-operatives relate to the illiteracy
of most farmers, the low level of educational or professional qualifications, and the lack of
group dynamic skills among managers (MoA 1999b). These and other related problems of
governance demonstrate the need to improve the management of co-operatives in the
collective interest of sectoral development. Policy should set minimum requirements for
educational or professional qualifications for co-operative leaders in order to
institutionalise good governance, corporate accounting and transparent leadership. The
recently revised Co-operatives Act provides the legal framework to deal with disputes (e.g.
tribunals), better annual auditing of accounts for members, stricter supervision of
co-operatives, unlinking of the government from the co-operative movement and easier
legal reform processes.
Access to agricultural creditWithin the context of of the dairy industry, there is a great need for credit for smallholder
dairy development in order to accelerate agricultural development. The demand for rural
credit has outstripped the supply over time. The current annual demand is estimated at 75
billion KSh while the supply stands at 18–22 billion KSh (MoA 1995; Kimuyu and Omiti
2000). The various intermediaries for finance and credit include commercial banks,
non-bank financial institutions, the Agricultural Finance Corporation, agricultural boards,
non-governmental organisations and rural–urban savings societies. The proportion of
credit for agriculture constitutes only 10–12% of the total loan advances from these
institutions. An analysis of the agricultural credit situation indicates: (i) an overall decline in
total advances to the agricultural sector since the 1980s; (ii) bias towards large-scale
enterprises, cash-oriented enterprises and short-term lending; (iii) bias towards urban
enterprises; and (iv) capital flight from the rural areas (MoA 1995; Kimuyu and Omiti
2000).
Furthermore, many smallholders lack adequate finances to invest in dairy development
because of constraints including:
i. high interest rates and difficult collateral requirements, such as land title deeds or
alternative tangible assets to cover for collateral
ii. lack of comprehensive loan policies including inability of the Central Bank to enforce
minimum lending requirements for agriculture (17% of deposits)
iii. the banking industry view that lending to smallholders is risky, expensive and
cumbersome to administer
iv. risks associated with crop failures and livestock deaths
v. inadequate agricultural lending expertise within financial institutions
vi. low productivity and profitability of smallholder farms and
vii. failure of co-ordination of policy on agriculture and rural credit issues and, therefore,
policy on capital formation for agriculture etc.
376 South–South Workshop
Omiti
Innovative and progressive institutional mechanisms are required to encourage
formation of rural savings and credit co-operative organisations to supplement the facilities
offered by other financial institutions, especially in rural areas. Benefits can also accrue from
the establishment of accessible credit and information institutions for investment in dairy
processing to encourage competition. Where cash is a serious constraint, designing
appropriate institutional mechanisms for availing credit, bearing in mind the specific
difficulties that subsistence-oriented farmers experience in repaying loans, would help to
solve the cash liquidity problem(s).
Technical assistance and financial flowsImpact of donor and technical assistance has been phenomenal in building the dairy sector.
Financial and technical aid has supported animal health services, adaptive research,
extension, dairy training centres, privatisation of breeding and veterinary services,
construction of milk processors and the strengthening of co-operative societies.
Lately, donor and technical aid has been withheld for a variety of reasons including
those related to democratisation of the country’s political system and governance of
public organisations. However, the government and its development partners should
articulate and implement various strategic exit, entry and maintenance plans for
restructuring, privatisation and commercialisation of agricultural services, gradually to
permit adequate monitoring and evaluation of outcomes, especially for institutional and
policy issues.
Investment in infrastructure developmentThe poor state of rural infrastructure (e.g. roads, water and communications) still plagues
the dairy industry. Infrastructure greatly facilitates marketing of high-value and perishable
agricultural products such as milk. Improvements in infrastructure have immediate
implications on marketing costs and farm incomes; farmers spend less time travelling to and
from markets, human drudgery in marketing farm produce is reduced, and leisure and
labour productivity is improved.
Better infrastructure has implications for profitability of time-sensitive enterprises
such as dairying. For vehicle operators, improvements in infrastructure lead to lower
vehicle operating costs, and thus higher incomes in the transportation and distribution
sectors. Reduced transportation costs for farmers also lead to direct income gains because
of lower transport expenses and reduced transportation losses, and may result in general
improvement in rural incomes and livelihoods. Greater policy support is required to
strengthen inter-sectoral linkages with the ministries in charge of infrastructure in order
to ensure rehabilitation and maintenance of rural access roads (especially feeder roads)
and thereby assist in the timely and efficient delivery of inputs and marketing of farm
produce.
South–South Workshop 377
Impacts of liberalisation in Kenya’s dairy sector
Differential impacts on gender, production costs and farmincomesIf efficiency is improved through reforms, then liberalisation reforms are expected to bear
differential effects on various segments of the farming and business community. It is
important, from a policy perspective, to understand the effects of reforms on incomes,
technological practices, access to inputs etc. Some of the relevant policy issues include
examination of the effects of reforms on incomes for different categories of farmers/
investors. This should include gender differentiation arising from, or exacerbated by, policy
reforms in farming or business occupations. Changes in prices and institutional
arrangements often create hardships or conflicts between investment and consumption,
producers and consumers, and the electorate and the elected. Policy research can advise on
the nature and magnitude of these trade-offs to minimise the required trade-offs, improve
negotiations and improve policy outcomes. It is necessary to evaluate the
emerging/changing roles of institutions, private sector initiatives, and the delivery of goods
and services by paying particular attention to the changing gender roles, and women’s and
self-help organisations in farming and associated activities.
Delivery of inputs and quality control programmesWith the relaxation of various movement and marketing restrictions, it is feared that
control of diseases, pests and other quality control measures may be ignored or not
routinely institutionalised at the farm or regional levels. It is therefore important to
understand:
i. What kinds of institutions have emerged since the economic and institutional reforms
came into place. For example, how many private traders have started providing farm
inputs and services since the policy reforms were adopted?
ii. How has the structure of marketing channels for these goods and services changed since
the liberalisation process begun? What are the important emerging marketing channels
for the delivery of farm inputs and produce?
iii. The merits and obstacles to enhanced competition in the delivery of goods and services
by different public and private sector organisations.
iv. The changes emerging in the quality and appropriateness of alternative means of
delivering such inputs and services, and the policy changes that may be required to
enhance emerging mechanisms for more efficient delivery.
Globalisation and domestic industryGlobalisation offers opportunities for expanding trade but presents tough policy, technical
and administrative issues for domestic industry to remain competitive. In recent years, there
have been media reports of commodities that have found their way into the domestic
market at questionable prices. Such low prices have an obvious depressing effect on
378 South–South Workshop
Omiti
domestic production and affect those engaged in the industry. Also some commodity aid for
sectoral development has not been used or targeted properly. Policy research can offer
useful insights into the costs of unfair competition, dumping and unfair business practices
for both the country and its citizenry.
ReferencesFAO (Food and Agriculture Organization of the United Nations). 1993. Kenya Dairy Development
Project, Preparation Report. Report 34/93 CP-KEN 33. FAO, Rome, Italy.
Kimuyu P. and Omiti J. 2000. Institutional impediments to micro and small enterprises (MSE) access to credit
in Kenya. Discussion Paper 26/2000. IPAR (Institute of Policy Analysis and Research), Nairobi,Kenya. 42 pp.
MoA (Ministry of Agriculture). 1987. Animal Production Annual Report 1987. MoA, Nairobi, Kenya.
MoA (Ministry of Agriculture). 1995. National dairy development desk study—Tick control.Consultancy Study Report. MoA, Nairobi, Kenya.
MoA (Ministry of Agriculture). 1996. ASIP preparation study: Alternative approaches to agriculturalextension. Consultancy Report by Agrisystems. MoA, Nairobi, Kenya.
MoA (Ministry of Agriculture). 1997. Animal Production Annual Report 1997. MoA, Nairobi, Kenya.
MoA (Ministry of Agriculture). 1999a. Kenya dairy development policy, toward the development of asustainable dairy industry. Technical Paper. MoA, Nairobi, Kenya.
MoA (Ministry of Agriculture). 1999b. Production and use of concentrates in smallholder dairysector in Kenya, study done for smallholder dairy project (research and development). Ministry ofAgriculture and Livestock Development, Nairobi, Kenya.
Omiti J. and Muma M. 2000. Policy and institutional strategies to commercialise the dairy sector in Kenya.Occasional Paper 6/2000. IPAR (Institute of Policy Analysis and Research), Nairobi, Kenya. 25pp.
Omiti J., Mbogoh S. and Odhiambo M. 1993. An economic analysis of marketed milk production inKenya over the 1957–85. East African Agricultural Forestry Journal 58(4):141–153.
Omore A., Muriuki H., Kenyanjui M., Owango M. and Staal S. 1999. The Kenya dairy subsector: A rapid
appraisal. MoA/KARI/ILRI Collaborative Research Report, Smallholder Dairy (R&D) Project,Nairobi, Kenya. 51 pp.
Owango M., Lukuyu B., Staal S.J., Kenyanjui M., Njubi D. and Thorpe W. 1998. Dairy co-operativesand policy reform in Kenya: Effects of livestock service and milk market liberalisation. Food Policy
Journal 23(2):173–185.
South–South Workshop 379
Impacts of liberalisation in Kenya’s dairy sector
Institutional structure to sustainsmallholder dairy production andmarketing in ChinaJ.X. Liu1 and Z.E. Zhou2
1. College of Animal Sciences, Zhejiang University, Hangzhou 310029, P.R. China2. Animal Production and Health Bureau, Zhejiang Provincial Department of Agriculture, 310020Hangzhou, P.R. China
IntroductionDairy is the most underdeveloped area in animal production in China. Annual per capita
milk production for Chinese citizens was only 6.6 kg in 1997, which was one-sixteenth of
world average (Jiang 1999). The government of China has paid much attention to the
adjustment of composition of animal agriculture (MOA 2000). Dairy production has been
most prioritised to develop recently. Based on Chinese Association of Dairy Cattle,
smallholder dairy production accounted for 76.8% of total dairy cattle in China (Li 2000).
When millions are involved in milk production, dairying becomes a very competitive
business. It is necessary to set up a harmonious relationship with millions of farmers
particularly on the pricing of raw milk and sharing of the business profit. Processing of milk
for rural producer and urban consumer is the key to the development of a dairy industry
anywhere. If the demand exceeds supply, milk producers could get away with unreasonable
prices, but, if they are to sustain growth, the pricing has to be reasonable.
Traditional milk trade usually failed to fully exploit the potential, charge unreasonably
high prices during the lean periods and pay unreasonably low prices to the farmers in the
flush season. Through the high-speed outspreading period from late 1990s, China dairy
industry has entered into the structural adjustment period since 1993. Institutional
structure to sustain smallholder dairy production and marketing is being formed. This
paper will introduce these structures and review the constraints and plans to overcome
them.
The discussions on institutional structures, service delivery systems, constraints etc. are
based on available published reports, interviews and surveys. Interviews were carried out
with dairy researchers, extension experts and farmers. Surveys were conducted in
Jinhua—the largest dairy county in Zhejiang Province—where typical smallholder dairy
systems exist.
380 South–South Workshop
Institutional structures for dairy production andmarketing
Institutions for milk collection, processing and marketingThe combination of enterprise and farmers is the main institutional structure for dairy
development programme in China (Tuo 1999). Milk is a perishable product. Absence of
chilling facilities, high ambient temperatures and lack of hygiene aggravate the problem of
marketing milk. Milk production based on smallholders can be sustained only if facilities
are provided to process and market milk. Processing of milk is therefore the most important
operation in dairy development programme.
Government and/or private entrepreneurs establish enterprises that collect, process
and market milk as fresh, milk powder and/or milk-contained drink. These enterprises not
only deal with milk processing and marketing as well as feed processing, but also are
involved in other activities. In China they are called ‘leading enterprises’.
The leading enterprise may be a food processing co-operation, industrial group or a large
business unit, which may be state-owned, collective or private ownership. They generally
hold milk processing plants or facilities. There is easier access to capital for commercial
enterprises, because their assets and lands title can be secured as collateral. The leading
enterprises coordinate with local administrative departments to obtain lands, usually in the
form of rent. In addition they serve as support organisation to help farmers with a series of
services (Jia 2000). Farmers may obtain dairy cattle from the enterprise in the form of lease
or at lower prices. Enterprises also supply farmers with technical advices on feeding,
management and health, technological training etc.
Depending on the ownership of land and animals, there are several types of institutional
structure for combination of enterprise and farmers in China.
Category I. Enterprises in this category don’t hold lands and farm. They have to collect
milk from individual farmers and then process and market milk. This is an original
organised structure. Usually the enterprise makes contracts in advance with individual
farmers, in which the price and quality of milk are contained. Depending on the size of the
farm, the enterprise may contract with several individual farmers. Farm size ranges from
several to hundreds of dairy cattle. In some cases enterprises collect from specialised villages
where lots of farmers exist.
Category II. Enterprises in this category possess their own lands or hold lands on lease.
They build animal houses by themselves and then lease to farmers or loan to farmers on the
cuff. Then milk-processing plant affiliated to the enterprise assures the purchase of milk
from the farmers at reasonable prices, which are dependent on the quality of milk.
Specialised villages and regions can be set up for dairy keeping.
Category III. These are leading enterprises in form of joint-stock company set up by
farmers and/or collectives. They are responsible for rent of lands, planning of production,
and processing and marketing of milk. Farmers are producers of milk and stockholder of the
enterprise as well. Therefore they can benefit from milk production and from profit sharing.
South–South Workshop 381
Institutional structure to sustain smallholder dairy production and marketing in China
Category IV. This category consists of the enterprises, which hold both their own
milk-processing plant and dairy farms. Within the enterprise there are different divisions,
some of which are responsible for cattle feeding, some for milk processing and marketing,
and some for feed processing and even trade. Strictly speaking, these enterprises may not be
classified into the category of smallholder. However, they can be considered to be an
advanced smallholder dairy production systems. When the enterprise has private
ownership, the enterprise per se is a combination of milk processing plant and dairy farm.
Institutions to provide breeding, health and advisory servicesIn addition to the enterprises, governmental stations of animal production and health
services are responsible for the breeding and health programmes and extension of advanced
technology for smallholder farmers. Artificial insemination is widely used in dairy
production. Animal production and health stations organise introduction of frozen semen
of excellent bulls from out regions. They provide advisory services on feeding, management
and prevention and treatment of diseases.
Other related support systemsThere are provincial, municipal and prefecture associations for dairy industry, which also
play an important role in development of smallholder dairy production. These associations
hold training course and extension demonstration to improve farmers’ knowledge of dairy
science and extend new technology. Even the most illiterate farmer is responsive to new
technology, provided its economic benefits are clearly demonstrated in the prevailing farm
situation. Associations also organise farmers to attend and participate in symposia or
workshops to exchange their experiences and lessons.
Constraints of smallholder dairy systemsWith speedy development of dairy production, Chinese dairy industry faces some
constraints (Liu et al. 2001). As a part of the whole industry, smallholder dairy systems have
some of the same constraints.
Unfavourable administrative systemsAdministrative departments are used to plan the system of the economy, which had been
executed for a long time since the founding of the People’s Republic of China. Each
department does things in its own way and lack close co-operation sometimes. There is little
capable, centralised and high efficiency organisation to co-ordinate dairy production and
marketing systems. Although they coordinate the relationships to some extent between
enterprises and between enterprise and farmer, dairy associations are not administrative
382 South–South Workshop
Liu and Zhou
organisations and have no powerful capacity to deal with the relationships well. As a result,
dairy production, supply and marketing are out of line with each other, which restricts
development of dairy production and decrease the efficiency of production.
Small scale and relatively weak leading enterpriseExcept for limited enterprises, most of milk-processing enterprises are of small scale with a
few technical staff and inferior processing facilities, especially those belonging to private
sectors. The dairy products are of low quality and the profits are low and even deficit. These
enterprises lack actual co-operation, but execute ceaselessly irregular and invalid
competition with each other. They contend for milk sources during the lean season when
there is no milk enough to be marketed, but in the flush season they demand a lower price,
lower the class of milk, and even refuse to purchase milk from farmers. Thus there exists
speculated contradiction between continuity of milk production and discontinuity of milk
purchasing by processing plants. This exerts to some extents an adverse effect on productive
enthusiasm of dairy farmers.
Limited lands and environmental aspectsWith the development of dairy production, malpractice that mankind and animals coexist
in the same places is getting severe. Spaces are limited and, on the other hand, there are
environmental pollutions from animal manures. There are strict regulations for land use, so
farmers cannot build animal house in their fields as they wish. Depending on our own
survey in this region, farm size is very small, a farmer holding 3–5 heads of dairy cattle on
average. While they are making great contributions to dairy industry, smallholder producers
are incapable of dealing with animal manures, which has been one of the most constrained
factors for dairy production in China.
On the other hand, land tenure for forage production was not a constraint, but the
tenure rights by farmers are not secure. Many farmers do not own their land or hold only
limited lands if any. They have use rights but have no guarantee that they will next year have
access to the same land they till this year. As a result farmers may be discouraged from
investing in land improvements. In general, it is thought that insecurity of tenure may
inhibit the adoption of certain technologies.
Poor knowledge of advanced dairy science and technologyAlthough administrative organisation and dairy association hold training courses for
farmers sometimes, most farmers had relatively poor knowledge of advanced dairy science
and technology. The animals are still offered feeds as they have. Some farmers don’t fully
understand the complex of ruminant nutrition and supply their cows with too much
concentrate mixture, resulting in high incidence of digestive abnormality symptoms and
high loss of profits.
South–South Workshop 383
Institutional structure to sustain smallholder dairy production and marketing in China

Problems in feeding and managements1. Insufficient supply of green forage and unreasonable diet formulation: With limited
lands, many smallholder farmers are insufficient in green forage and cultivated grass. In
some cases cereal straws and stovers are main roughages particularly in midsummer and
in severe winter. Hay and silage are seldom used in dairy diets, and a large proportion of
concentrate mixtures are fed to cows. As a result dairy productivity is not high, and,
furthermore, contents of dry matter and fat are relatively low. In Jinhua county for
example, milk yield for 305 days is only 4750 kg with 2.9% of milk fat (Zou 1999).
2. High incidence of foot and skin diseases: Due to limited lands, animals have to be kept
in-house all the day. In addition to little outhouse movement and lack of sunshine, they
are not timely hoof-mended and receive little body scrubbing. This has exerted an
adverse effect on milk production.
3. High bacterial accounts in fresh milk: Inadequate hygiene facilities, incomplete
environmental disinfection and unsanitary milking result in milk of poor quality.
Bacterial accounts in fresh milk are usually much higher than the criteria.
4. Imperfect breeding systems: Few specialised organisations are responsible for breeding
and improvement of dairy cattle for smallholders. With the exception that service
stations replace their bulls replacement heifers receive little selection. In addition, lack
of complete pedigree results in frequent occurrence of inbreeding. As a result entire
improvement of dairy cattle is slow.
Limited variety of dairy products and weak capability forcompetitionBesides the small scale, most of smallholder dairy enterprises produce limited variety of milk
products. Predominant product is milk powder, which accounts for 54% of milk-processing
products (Luo 1999). In some provinces, proportions of milk powder are as high as 90% of
dairy products. Condensed milk and malt milk account for 20% and 20% respectively.
There are very small amounts of yoghurt, fermented milk, cheese and butter.
Plans to overcome the constraints
Consummation of administrative systemsIt is necessary to set up capable, centralised and highly efficient organisations to coordinate
smallholder dairy production and marketing systems. Although some favourable policies
have been taken for examples on land use, governments should play a more important role
in these institutions. They should consider the totality of dairy industry and focus on
planning, monitoring the implementation of dairy development programmes and with
wider policy matters concerning the organisational issues, use of resources and the strategies
to meet local requirements for milk and milk products and external trade. These
384 South–South Workshop
Liu and Zhou

organisations will also be responsible for pricing of milk, which may change with milk
composition and productive seasons.
Support of leading enterprise and strengthening ofcompetitive capabilityLeading enterprises may control the development of dairy production, processing and
marketing. Dairy production and marketing structure need to be adjusted to promote
industrialisation and intensification. Current small and weak enterprises may be
amalgamated and/or reconstituted to form new stronger leading enterprise. Meanwhile
dairy products should be diversified and famous brands should be made to strengthen the
competitive capability. After China participates in the World Trade Organization, the
competition would be keener particularly with international products. Thirteen out of the
top 25 milk-producing countries have exported their dairy products to China and the
imported products amounted to 100 thousand tonnes in 1998, which accounted for 20 %
of total dairy products in China (Chen 2000)
Socialised service systemsThere is a need for innovative programmes that make greater resources (credit, lands, feeds,
research and technology) and extension-oriented support services (marketing, training, field
programmes and demonstration centers) available to small farmers. In addition to the
current systems, advisory services for finance, credit and laws are necessary for the farmers.
Diseases such as tuberculosis and brucellosis should be regularly supervised and inspected
to ensure animal health and safety for producers and consumers. Another function of
support services is to advocate nutrition of milk and milk consumption. A plan for pupils to
drink milk is one of these activities and should be promoted.
Scaling-up and extensive training of smallholder dairyfarmersModerate scale of dairy farms should be encouraged. Scale of 20 heads seems to be suitable
for smallholder farmers, as there is no need for employees in this scale. When the farm size is
too small it is difficult to ensure the safety for milk and producers. Many smallholder
farmers are less educated. Training, especially the type that has a practical orientation
towards the reality of small farm systems and involves task-oriented teaching and
demonstration units has considerable merit. Administrative stations and dairy associations
may hold regular lecturing course and symposium to train not only dairy farmers, but also
local extension workers and even administrators to improve their knowledge of advanced
dairy science and technology.
South–South Workshop 385
Institutional structure to sustain smallholder dairy production and marketing in China
Implications and lessons learnedDairy enterprise and farmers are like a commensal, and they supplement, condition and
accelerate each other. Combination of a leading enterprise and small farms is the best way to
sustain smallholder dairy production and marketing in China. It is necessary to scale-up the
leading enterprises to strengthen their competitive capability, especially for international
competition. Moderate scale of dairy farms should be encouraged, as it is difficult to ensure
the safety for milk and producers in small size farms. Government should pay more
important role in institutional infrastructure for smallholder dairy production particularly
for policy issues on land use, financing and feed trade.
Questions for discussion• What is the optimal size of smallholder farmers, which should sustain the development
of this system? What scale of land is suitable for the leading enterprise/co-operative,
farms and dairy cattle?
• Advanced technologies and smallholder farms – are they contradictory?
• What is the respective role of the state sponsored and co-operatively organised support
services in market-oriented smallholder dairy systems?
• What is the optimal way to co-ordinate the relationship and distribution of profits
between producers, processors and marketers as well as other sectors such as
stakeholders?
ReferencesChen X. 2000. Are we ready to join the WTO? Shanghai Dairy 23(1):8–9.
Jia Z. 2000. Investment in dairy industry to found production base and speedy development of dairyproduction with one action. China Dairy Cattle 2:6–7.
Jiang J. 1999. Way to speed up development of dairy production in China. In: Wang H. (ed),Five-decade development of dairy production in China. Ocean Publishing House, Beijing, China. pp.408–410.
Li Y. 2000. Grasping of opportunity to promote the development of dairy production in China.China Dairy Cattle 3:4–5.
Liu J.X., Wu Y.M. and Zhou Z.E. 2002. Current situation and prospect for dairy production inChina. In: Rangnekar D. and Thorpe W. (eds), Smallholder dairy production and marketing—
Opportunities and constraints. Proceedings of a South–South workshop held at NDDB, Anand, India,
13–16 March 2001. NDDB (National Dairy Development Board), Anand, India, and ILRI(International Livestock Research Institute), Nairobi, Kenya.
Luo C. 1999. Current situation and development prospect of dairy industry in China. In: Wang H.(ed), Five-decade development of dairy production in China. Ocean Publishing House, Beijing, China.pp. 421–429.
Ministry of Agriculture, P.R.C. 2000. Adjustment of composition of animal agricultures: Key pointin animal development in 2000. http://www.cav.net.cn/xmj/jyh/new032102.html
386 South–South Workshop
Liu and Zhou
Tuo G. 1999. Five-decade retrospection and vista of dairy production in China. In: Wang H. (ed),Five-decade development of dairy production in China. Ocean Publishing House, Beijing, China. pp.3–13.
Zhou Y. 1999. Jinhua County calls for rural dairy bases to be turned into market. China Dairy Cattle
3:9–11.
South–South Workshop 387
Institutional structure to sustain smallholder dairy production and marketing in China

Theme 4: Institutional structures to sustainsmallholder dairy marketingPlenary discussionAfter the presentation of the five case-study papers on marketing institutions and policies, the
points raised in the plenary discussion related to ensuring accountability to stakeholders and
the management and impacts of the liberalisation of markets. The debate on accountability,
on organisational structures and on policies supportive of responsive markets was continued
during the theme 3 group discussion (see below).
The issues and concerns raised in the plenary were:
1. One of the essential ingredients to the success of the Amul model is the integrity of the
management.
2. A democratic management structure is important to the success of co-operative/group
approaches to dairy marketing.
3. Liberalising the economy favours businesses and areas with comparative advantages (e.g.
in Australia where milk production is now concentrated in Victoria) and increased
competitiveness in the industry and in the economy. But these changes may not
necessarily be favourable to smallholders.
4. Liberalisation needs to be a gradual process because, given time, industry improves but
at a cost. One benefit of a managed transition is that there is time to plan for these costs.
These and the related issues from the plenary discussion of the presentations in themes
5 and 6 were subsequently discussed in small groups of workshop participants.
The outcomes for theme 4 are given below.
Group discussionAs with the other groups, the theme 4 discussions were guided by a set of questions. The
questions presented to the group addressed collective action and supply and demand issues.
The questions were:
1. Traditional (informal) milk marketing systems dominate in sub-Saharan Africa and South
Asia. How can these markets be better served to the benefit of consumers and smallholder
producers?
2. Matching milk supply to demand seasonally is a major challenge for smallholder dairying
particularly in rain-fed systems. What lessons are there from the experiences in the South
to address this challenge?
3. Under what conditions will the ‘Amul’ model be replicable? If those conditions cannot
be met, what alternative approaches should be supported?
388 South–South Workshop
4. What is required to make collective action groups effective?
The group responses were outlined in the following section.
How to serve better traditional markets for benefit of consumersand smallholder producers?
Why is there an informal (traditional) system?
• It has evolved itself historically and is in place, unless replaced by a western-style ‘organised’
sector.
• Price structure within the formal and informal systems.
• Lack of well structured marketing system.
• Scale of handling is too small.
• Scattered production of milk/agricultural commodities.
• Farmers can possibly add value to commodities.
• Strong marketing forces have been driving the system.
What benefits must reach the smallholder producer?
• Infrastructure for easier access to market.
• Remunerative prices.
• Education for reducing cost of production/marketing and improvement of quality.
• Encourage transition from informal to formal.
What benefit must reach the consumer?
• Quality.
• Price.
• Education of consumer for enhanced awareness.
Matching milk supplies to seasonal demand
• Ensure availability of green feeds uniformly all round the year through improved cropping
system.
• Technological interventions to convert seasonal excesses into intermediate products
with long shelf life for reconstitution during dry season/periods of high market demand.
• Specialised dairying in regions where milk production could be staggered.
• Networking of organised markets to meet seasonal variations in milk production.
Preconditions for replication of Amul model: What are thealternatives?
• Farmers’ will to organise themselves into a group effort.
• Market-driven production system.
• Leadership at farmers’ level.
• Freedom from external controls (political, bureaucratic).
• Empowerment of farmers.
South–South Workshop 389
Institutional structures to sustain smallholder dairy marketing
Alternatives—Key ingredients
• Transparency.
• Accountability/trust.
• Market-oriented.
• Prices and services.
• Quality and price for consumers.
Requirements to make collective action groups effective?
• Enabling regulatory framework.
• Well-structured organisational framework.
• Markets not distorted by taxes and controls.
• Market demand for products produced by the collective group of smallholders.
ConclusionsThe presentations, the supporting papers and the discussion relating to institutional structures
to sustain smallholder dairy marketing showed the key role that market orientation and an
enabling regulatory framework play in supporting smallholder dairy development and its
competitivenes
s. Allied to that is the accountability of the group’s managers to the group’s members as a
pre-requisite for effective collective-action groups. The importance of these issues was
highlighted in the workshop recommendations where ways of contributing to achieving the
objectives are presented.
Institutional structures to sustain smallholder dairy marketing
390 South–South Workshop
Theme 5: Effective and efficientlivestock services for smallholder
dairy production

Package of improved livestock servicesthrough co-operatives: A case study of theMehsana1 District Milk Producers’ UnionLtd., Gujarat, IndiaM.P.G. KurupNational Dairy Development Board (NDDB), IndiaE-mail: [email protected]/[email protected]
IntroductionGujarat is one of the most highly industrialised and progressive states in India, with high
rates of growth both for industry as well as for agriculture. Gujarat is also the leader and
trendsetter in India for organised dairy development in the co-operative sector. The Anand
Pattern of co-operative movement is made up of a three tier co-operative structure
comprising: (i) Dairy Co-operative Societies (DCSs) in villages; (ii) District Milk Producers’
Unions (DCMPUs) affiliating the DCSs in districts; and (iii) the apex Co-operative Milk
Marketing Federation affiliating the district unions at the state level. This model has now
become the most stunningly effective institutional model for rural milk production and
dairy development in India. These co-operatives, at all three levels, are fully owned by the
members, enjoy complete autonomy and are directly managed by them through the boards
of directors, elected by them from among themselves.
The Gujarat Co-operative Milk Marketing Federation (GCMMF), the apex body of the
Gujarat milk co-operatives (13 district milk unions), is today the single largest food company
in India and is the owner of the brand name ‘Amul’, famous all over the world for milk and
milk products. In 1999–2000, the federation handled some 1.6 million tonnes of milk
(daily average of some 4.4 thousand tonnes) collected by its member unions and had a
turnover of Rs. 22.20 billion (US$ 1 = Indian Rupees 46.7 on 1 January 2001). Milk and
milk products of Amul and its sister brand ‘Sagar’, are marketed all over India and in quite a
few countries overseas. The Mehsana Milk Union, affiliated to this federation, is one of its
founder members and a co-owner.
South–South Workshop 393
1. Districts in Gujarat state were reorganised recently. The total number of districts now is 25. However, thisdoes not affect the case study as Mehsana district lost only one of its 11 Talukas and the Mehsana MilkUnion’s jurisdiction continues to include all the 11 Talukas in undivided Mehsana.

The setting: Mehsana DistrictMehsana is one of the 19 districts in the state of Gujarat, eighth in the order of size, with
9027 km2 as its total area, located in North Gujarat between the Rann (Desert) of Kutch
tothe west and the districts of Sabarkantha to the east, Banaskantha to the north and
Ahmedabad forming the southern border. Mehsana was a part of the state of Baroda until
the reorganisation of States post independence and enjoys a somewhat higher social
development index compared to state averages. The literacy rate in the district for example is
55% as against the state average of 51% and it has a large basic educational infrastructure.
The human population in Mehsana District was 2.94 million in 1991 and some 80% of
them live in rural areas. The district had 11 Talukas (administrative divisions), 1093
inhabited villages and 15 urban agglomerations or towns, but only one out of them has a
population of more than 100 thousand. The projected population in the district for 2001,
based on the 1981–91 decennial growth rate, is 3.39 million.
About 0.94 million hectares are cropped in the district. Rainfall is medium (600–700
mm) and spread over 8 months, but most of it (90%) comes during the months of June to
September. Mehsana is one of the top four irrigated districts in Gujarat and the sources of
irrigation are deep bore wells (almost 70%), surface wells, tanks and canals. The gross
irrigated area is 0.50 million hectares, over 50% of the total cropped area. Major crops
grown in the district, in the order of area cultivated, are oil seeds, pearl millet, wheat,
sorghum, rice and pulses; the minor crops are cotton, castor and psillium.
Distribution of land holdings in Mehsana is highly inequitable; it is the same as in the
rest of the state and the country. Marginal and small farmers account for 61.45% of the total
holdings, but they own or operate less than 26% of the total farming land. The average land
holding is 0.55 ha in the case of marginal farmers and 1.45 ha for smallholders. Many of
these holdings are held jointly by several members of the family, mostly male siblings. The
distribution of the operational land holdings across the different categories and milch
animal holding within land holding categories are presented in Figures 1 and 2.
394 South–South Workshop
Kurup
0
50
100
150
200
250
300
Marginal Small Semi
medium
Medium Large
Holding categories
Number of land holdings Area of land holdings in
h
Numbers/hectares × 103
Figure 1. Land holding categories.
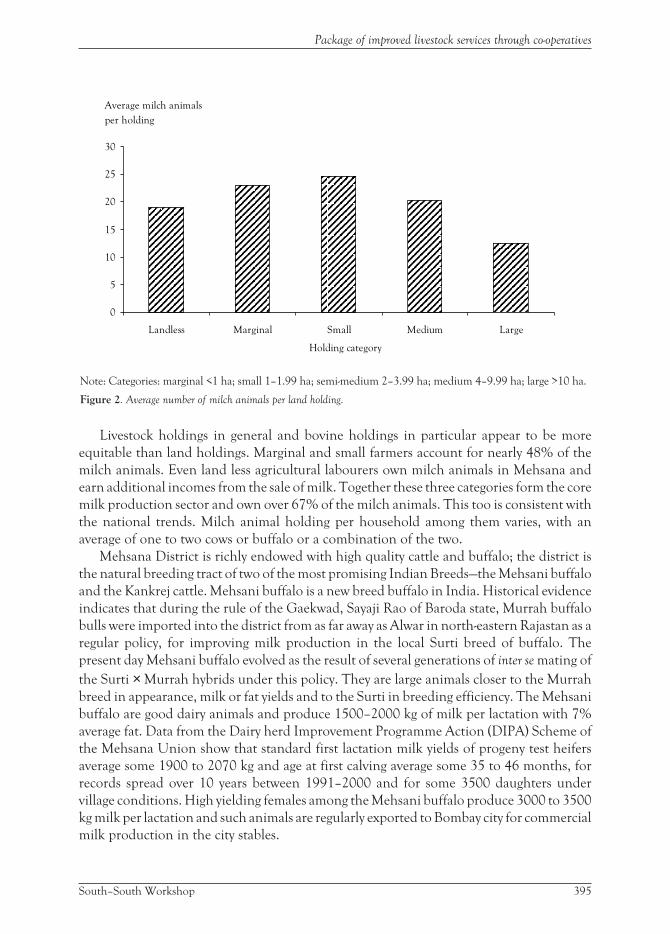
Livestock holdings in general and bovine holdings in particular appear to be more
equitable than land holdings. Marginal and small farmers account for nearly 48% of the
milch animals. Even land less agricultural labourers own milch animals in Mehsana and
earn additional incomes from the sale of milk. Together these three categories form the core
milk production sector and own over 67% of the milch animals. This too is consistent with
the national trends. Milch animal holding per household among them varies, with an
average of one to two cows or buffalo or a combination of the two.
Mehsana District is richly endowed with high quality cattle and buffalo; the district is
the natural breeding tract of two of the most promising Indian Breeds—the Mehsani buffalo
and the Kankrej cattle. Mehsani buffalo is a new breed buffalo in India. Historical evidence
indicates that during the rule of the Gaekwad, Sayaji Rao of Baroda state, Murrah buffalo
bulls were imported into the district from as far away as Alwar in north-eastern Rajastan as a
regular policy, for improving milk production in the local Surti breed of buffalo. The
present day Mehsani buffalo evolved as the result of several generations of inter se mating of
the Surti × Murrah hybrids under this policy. They are large animals closer to the Murrah
breed in appearance, milk or fat yields and to the Surti in breeding efficiency. The Mehsani
buffalo are good dairy animals and produce 1500–2000 kg of milk per lactation with 7%
average fat. Data from the Dairy herd Improvement Programme Action (DIPA) Scheme of
the Mehsana Union show that standard first lactation milk yields of progeny test heifers
average some 1900 to 2070 kg and age at first calving average some 35 to 46 months, for
records spread over 10 years between 1991–2000 and for some 3500 daughters under
village conditions. High yielding females among the Mehsani buffalo produce 3000 to 3500
kg milk per lactation and such animals are regularly exported to Bombay city for commercial
milk production in the city stables.
South–South Workshop 395
Package of improved livestock services through co-operatives
Holding category
0
5
10
15
20
25
30
Landless Marginal Small Medium Large
Average milch animals
per holding
Note: Categories: marginal <1 ha; small 1–1.99 ha; semi-medium 2–3.99 ha; medium 4–9.99 ha; large >10 ha.
Figure 2. Average number of milch animals per land holding.

Kankrej cattle are large, white and majestic with adult body weight averaging 500–600
kg and full-grown breeding bulls weigh some 800 kg. They are officially listed as a
dual-purpose breed, but are good milkers. Castrated Kankrej male (bullocks) are considered
to be the best draft animals among cattle in India and have a power rating of 0.7 horse
power. They can till some 0.3 ha of farm land in a 6 hour working day. Kankrej cows average
some 1200 kg of milk per lactation with 4% fat. They have wide selection differential for
production traits (a small percentage of the cows produce well over 3000 kg per lactation
and institutional herds of Kankrej cows are known to have the first calf by the age of 36
months) and are excellent candidates for development as a commercially viable dairy breed
through selective breeding.
The population of cattle and buffalo in Mehsana District in 1992 (results of the 1997
round of the quinqennial livestock census are not available as yet) is presented in Table 1.
Milk production estimates for the state and for Mehsana District for 1995–96 are 4.61 and
0.65 million tonnes, respectively, roughly 60% of it is contributed by buffalo. Mehsana is a
district with the highest milk production in Gujarat and accounts for some 14% of the
state’s total milk production.
Table 1. Cattle and buffalo population in Mehsana District.
No. State and District Cattle: Crossbred/indigenous Buffalo
1 Gujarat 231,323/6,572,151 5,267,785
2 Mehsana 44,054/254,006* 635,762**
3 Per cent to state total 17.34/3.86 12.07
* Mostly made up of Kankrej and Kankrej type of cattle. ** Mostly made up of Mehsani and
Mehsani type of buffalo.
The Mehsana District Milk Producers’ Union Ltd.The milk producers’ co-operative movement started in Anand, Kaira District of Gujarat in
the mid forties, set up by the milk producers and their enlightened leaders, as an alternative
to the highly exploitative and unfair milk trade foisted on them by middlemen and private
dairy companies in Anand and Bombay. The spectacular success of the Anand Milk Union
Ltd (Amul), its rapid growth and democratic management set up, made it an ideal model for
rural milk production and marketing for the rest of Gujarat. It enabled the milk producers
to gain direct access to far flung urban milk markets, earn a lion’s share of the consumer
rupee for their products, eliminating middlemen. Shri. Mansinhbhai P. Patel, the then Vice
President of the Mehsana District Development Board was inspired to copy the model in
Mehsana for the benefit of the milk producers in that district. The Mehsana District
Co-operative Milk Producers’ Union Ltd. came into being in November 1960 with the help
and sustained support of the Anand Milk Union. By 1965 the Mehsana Milk Union had its
own dairy plant for processing the milk produced by its members. The Mehsana Union then
proceeded to steadily build up an infrastructure for collection, processing, and marketing of
the growing volumes of milk supplied by its members and to provide the members with all
396 South–South Workshop
Kurup
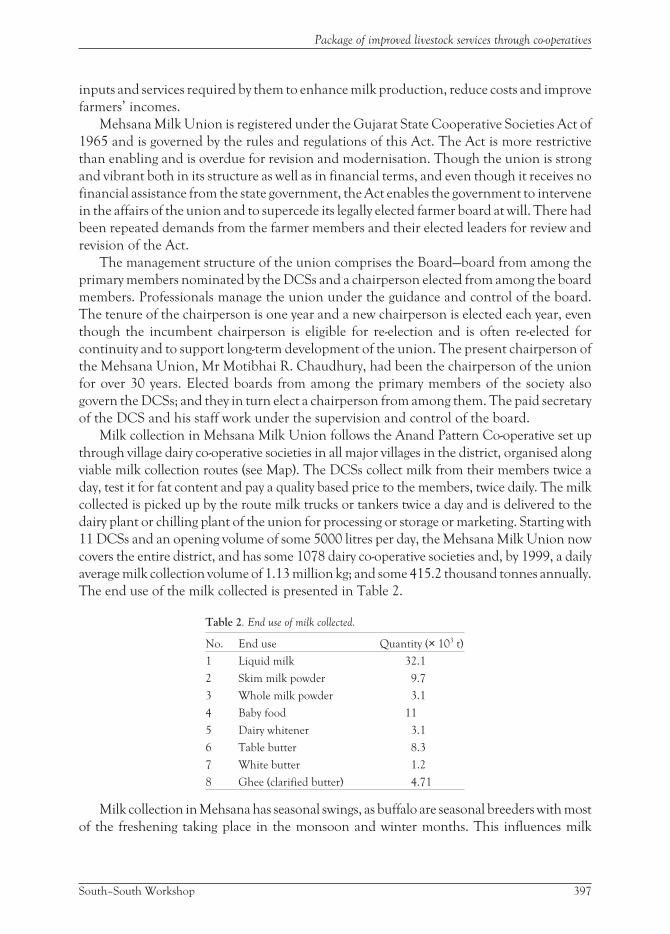
inputs and services required by them to enhance milk production, reduce costs and improve
farmers’ incomes.
Mehsana Milk Union is registered under the Gujarat State Cooperative Societies Act of
1965 and is governed by the rules and regulations of this Act. The Act is more restrictive
than enabling and is overdue for revision and modernisation. Though the union is strong
and vibrant both in its structure as well as in financial terms, and even though it receives no
financial assistance from the state government, the Act enables the government to intervene
in the affairs of the union and to supercede its legally elected farmer board at will. There had
been repeated demands from the farmer members and their elected leaders for review and
revision of the Act.
The management structure of the union comprises the Board—board from among the
primary members nominated by the DCSs and a chairperson elected from among the board
members. Professionals manage the union under the guidance and control of the board.
The tenure of the chairperson is one year and a new chairperson is elected each year, even
though the incumbent chairperson is eligible for re-election and is often re-elected for
continuity and to support long-term development of the union. The present chairperson of
the Mehsana Union, Mr Motibhai R. Chaudhury, had been the chairperson of the union
for over 30 years. Elected boards from among the primary members of the society also
govern the DCSs; and they in turn elect a chairperson from among them. The paid secretary
of the DCS and his staff work under the supervision and control of the board.
Milk collection in Mehsana Milk Union follows the Anand Pattern Co-operative set up
through village dairy co-operative societies in all major villages in the district, organised along
viable milk collection routes (see Map). The DCSs collect milk from their members twice a
day, test it for fat content and pay a quality based price to the members, twice daily. The milk
collected is picked up by the route milk trucks or tankers twice a day and is delivered to the
dairy plant or chilling plant of the union for processing or storage or marketing. Starting with
11 DCSs and an opening volume of some 5000 litres per day, the Mehsana Milk Union now
covers the entire district, and has some 1078 dairy co-operative societies and, by 1999, a daily
average milk collection volume of 1.13 million kg; and some 415.2 thousand tonnes annually.
The end use of the milk collected is presented in Table 2.
Table 2. End use of milk collected.
No. End use Quantity (× 103 t)
1 Liquid milk 32.1
2 Skim milk powder 9.7
3 Whole milk powder 3.1
4 Baby food 11
5 Dairy whitener 3.1
6 Table butter 8.3
7 White butter 1.2
8 Ghee (clarified butter) 4.71
Milk collection in Mehsana has seasonal swings, as buffalo are seasonal breeders with most
of the freshening taking place in the monsoon and winter months. This influences milk
South–South Workshop 397
Package of improved livestock services through co-operatives
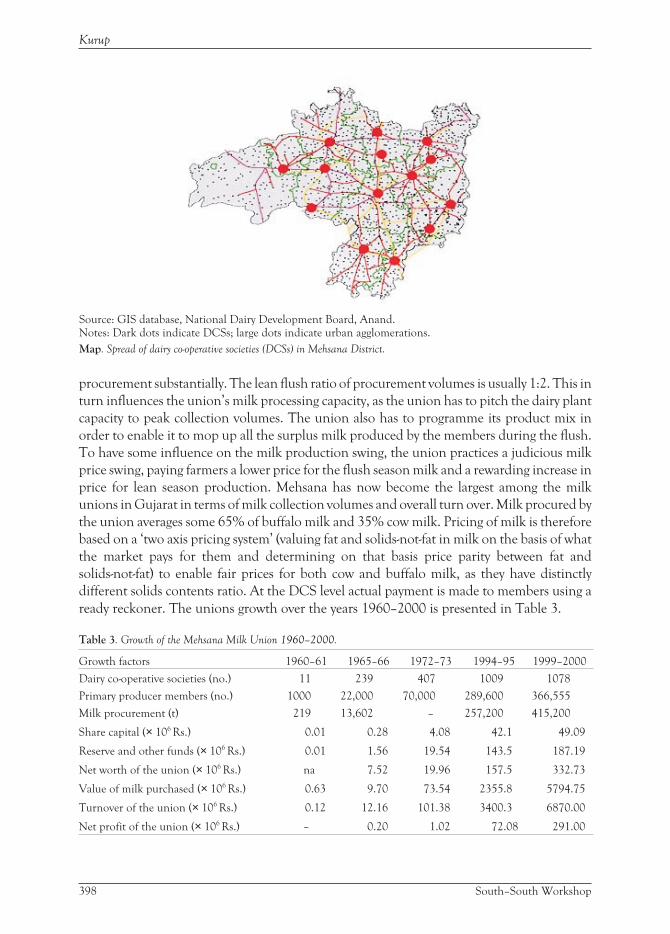
procurement substantially. The lean flush ratio of procurement volumes is usually 1:2. This in
turn influences the union’s milk processing capacity, as the union has to pitch the dairy plant
capacity to peak collection volumes. The union also has to programme its product mix in
order to enable it to mop up all the surplus milk produced by the members during the flush.
To have some influence on the milk production swing, the union practices a judicious milk
price swing, paying farmers a lower price for the flush season milk and a rewarding increase in
price for lean season production. Mehsana has now become the largest among the milk
unions in Gujarat in terms of milk collection volumes and overall turn over. Milk procured by
the union averages some 65% of buffalo milk and 35% cow milk. Pricing of milk is therefore
based on a ‘two axis pricing system’ (valuing fat and solids-not-fat in milk on the basis of what
the market pays for them and determining on that basis price parity between fat and
solids-not-fat) to enable fair prices for both cow and buffalo milk, as they have distinctly
different solids contents ratio. At the DCS level actual payment is made to members using a
ready reckoner. The unions growth over the years 1960–2000 is presented in Table 3.
Table 3. Growth of the Mehsana Milk Union 1960–2000.
Growth factors 1960–61 1965–66 1972–73 1994–95 1999–2000
Dairy co-operative societies (no.) 11 239 407 1009 1078
Primary producer members (no.) 1000 22,000 70,000 289,600 366,555
Milk procurement (t) 219 13,602 – 257,200 415,200
Share capital (× 106 Rs.) 0.01 0.28 4.08 42.1 49.09
Reserve and other funds (× 106 Rs.) 0.01 1.56 19.54 143.5 187.19
Net worth of the union (× 106 Rs.) na 7.52 19.96 157.5 332.73
Value of milk purchased (× 106 Rs.) 0.63 9.70 73.54 2355.8 5794.75
Turnover of the union (× 106 Rs.) 0.12 12.16 101.38 3400.3 6870.00
Net profit of the union (× 106 Rs.) – 0.20 1.02 72.08 291.00
398 South–South Workshop
Kurup
Source: GIS database, National Dairy Development Board, Anand.Notes: Dark dots indicate DCSs; large dots indicate urban agglomerations.
Map. Spread of dairy co-operative societies (DCSs) in Mehsana District.

Livestock services in Mehsana DistrictLivestock services in Mehsana District come from two sources: (i) the State Department of
Animal Husbandry (for all species and for all livestock owners); and (ii) the Mehsana Milk
Union, exclusively for cattle and buffalo, owned by the union’s members and by
non-members who supply milk to the DCSs.
Livestock services offered by the state governmentAs in all other districts in the state, Mehsana has livestock services offered by the state
government through the state department of animal husbandry and the institutions under
it. These are the veterinary polyclinic (1), veterinary dispensaries (28), first aid veterinary
centres (37) and mobile veterinary dispensary (1). A total of 67 veterinary institutions.
Qualified veterinarians operate the hospitals or dispensaries and para-veterinary staff
manage the other centres. In addition, the department operates an intensive cattle
development project (ICDP) in Mehsana with 1 frozen semen production station and 8
artificial insemination (AI) centres, covering 20 villages. In 1995–96 the ICDP carried out
some 14 thousand AI services in the district. The veterinary institutions deliver curative
veterinary care for all species of livestock and AI for cattle and buffalo. All services offered by
the department are delivered at the centre and the livestock owners have to take their
animals to the centre for treatment or for AI services. All services offered by the department
are free or are highly subsidised.
The quality of the service is poor and the institutions seldom have adequate drugs and
medicines in stock, as they receive only a token supply from the department. A farmer gets
only a prescription in these institutions and invariably he/she has to buy the drugs and
pharmaceuticals from the retail trade. Fiscal deficits and budget constraints have reduced
government support to these institutions to salaries of staff employed and establishment costs.
The department of animal husbandry spends nearly 95% of the annual budget allocations it
receives from the government (public funds) on salaries and establishment costs. Government
veterinarians in Gujarat treat some 75% of the cases that come to them as private practice,
delivered at the farmer’s residence and charge fees and expenses close to market prices.
Production inputs and livestock services in MehsanaUnionThe union, as a production support measure, purchases the milk production inputs and
livestock services needed by the members. These fall into two distinct categories: (i) those
that create a congenial environment for production and generate immediate responses
from the milch animals; and (ii) those that bring about progressive and permanent
improvements in productivity over the long term. Livestock in Mehsana villages are seldom
managed optimally by the farmers and they are perpetually under nutritional and health
South–South Workshop 399
Package of improved livestock services through co-operatives
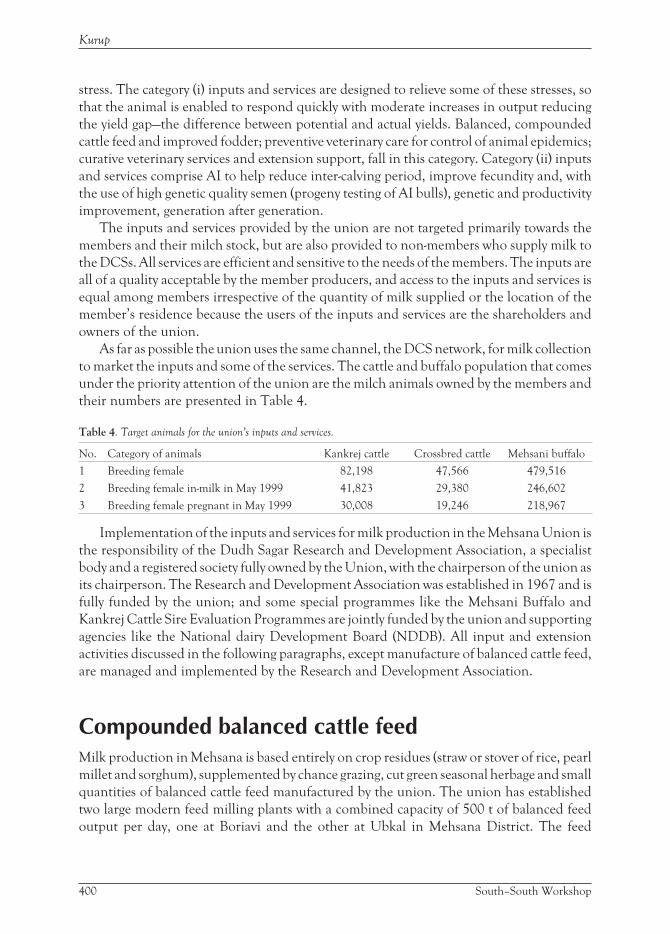
stress. The category (i) inputs and services are designed to relieve some of these stresses, so
that the animal is enabled to respond quickly with moderate increases in output reducing
the yield gap—the difference between potential and actual yields. Balanced, compounded
cattle feed and improved fodder; preventive veterinary care for control of animal epidemics;
curative veterinary services and extension support, fall in this category. Category (ii) inputs
and services comprise AI to help reduce inter-calving period, improve fecundity and, with
the use of high genetic quality semen (progeny testing of AI bulls), genetic and productivity
improvement, generation after generation.
The inputs and services provided by the union are not targeted primarily towards the
members and their milch stock, but are also provided to non-members who supply milk to
the DCSs. All services are efficient and sensitive to the needs of the members. The inputs are
all of a quality acceptable by the member producers, and access to the inputs and services is
equal among members irrespective of the quantity of milk supplied or the location of the
member’s residence because the users of the inputs and services are the shareholders and
owners of the union.
As far as possible the union uses the same channel, the DCS network, for milk collection
to market the inputs and some of the services. The cattle and buffalo population that comes
under the priority attention of the union are the milch animals owned by the members and
their numbers are presented in Table 4.
Table 4. Target animals for the union’s inputs and services.
No. Category of animals Kankrej cattle Crossbred cattle Mehsani buffalo
1 Breeding female 82,198 47,566 479,516
2 Breeding female in-milk in May 1999 41,823 29,380 246,602
3 Breeding female pregnant in May 1999 30,008 19,246 218,967
Implementation of the inputs and services for milk production in the Mehsana Union is
the responsibility of the Dudh Sagar Research and Development Association, a specialist
body and a registered society fully owned by the Union, with the chairperson of the union as
its chairperson. The Research and Development Association was established in 1967 and is
fully funded by the union; and some special programmes like the Mehsani Buffalo and
Kankrej Cattle Sire Evaluation Programmes are jointly funded by the union and supporting
agencies like the National dairy Development Board (NDDB). All input and extension
activities discussed in the following paragraphs, except manufacture of balanced cattle feed,
are managed and implemented by the Research and Development Association.
Compounded balanced cattle feedMilk production in Mehsana is based entirely on crop residues (straw or stover of rice, pearl
millet and sorghum), supplemented by chance grazing, cut green seasonal herbage and small
quantities of balanced cattle feed manufactured by the union. The union has established
two large modern feed milling plants with a combined capacity of 500 t of balanced feed
output per day, one at Boriavi and the other at Ubkal in Mehsana District. The feed
400 South–South Workshop
Kurup
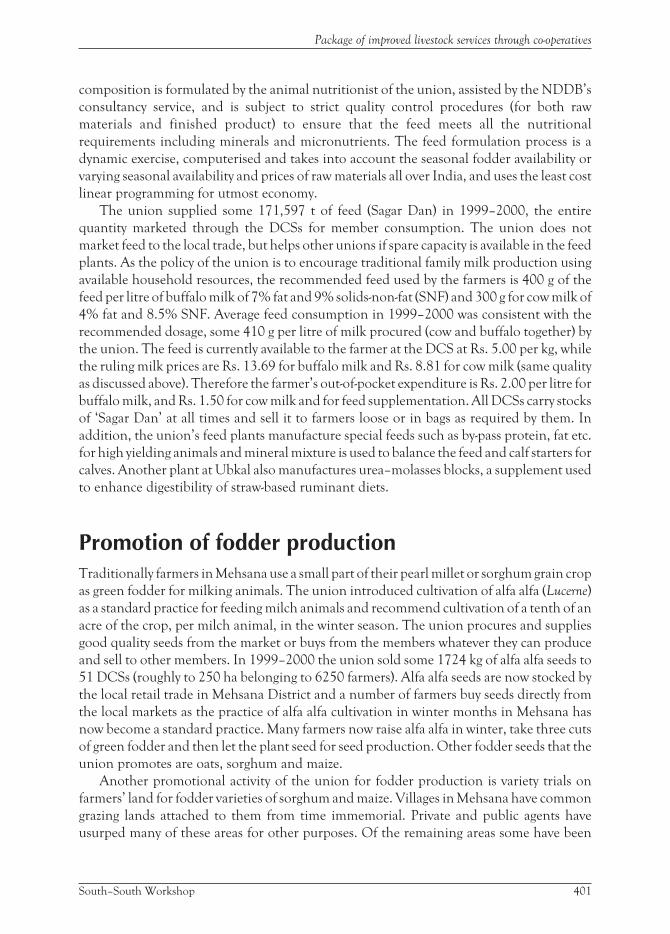
composition is formulated by the animal nutritionist of the union, assisted by the NDDB’s
consultancy service, and is subject to strict quality control procedures (for both raw
materials and finished product) to ensure that the feed meets all the nutritional
requirements including minerals and micronutrients. The feed formulation process is a
dynamic exercise, computerised and takes into account the seasonal fodder availability or
varying seasonal availability and prices of raw materials all over India, and uses the least cost
linear programming for utmost economy.
The union supplied some 171,597 t of feed (Sagar Dan) in 1999–2000, the entire
quantity marketed through the DCSs for member consumption. The union does not
market feed to the local trade, but helps other unions if spare capacity is available in the feed
plants. As the policy of the union is to encourage traditional family milk production using
available household resources, the recommended feed used by the farmers is 400 g of the
feed per litre of buffalo milk of 7% fat and 9% solids-non-fat (SNF) and 300 g for cow milk of
4% fat and 8.5% SNF. Average feed consumption in 1999–2000 was consistent with the
recommended dosage, some 410 g per litre of milk procured (cow and buffalo together) by
the union. The feed is currently available to the farmer at the DCS at Rs. 5.00 per kg, while
the ruling milk prices are Rs. 13.69 for buffalo milk and Rs. 8.81 for cow milk (same quality
as discussed above). Therefore the farmer’s out-of-pocket expenditure is Rs. 2.00 per litre for
buffalo milk, and Rs. 1.50 for cow milk and for feed supplementation. All DCSs carry stocks
of ‘Sagar Dan’ at all times and sell it to farmers loose or in bags as required by them. In
addition, the union’s feed plants manufacture special feeds such as by-pass protein, fat etc.
for high yielding animals and mineral mixture is used to balance the feed and calf starters for
calves. Another plant at Ubkal also manufactures urea–molasses blocks, a supplement used
to enhance digestibility of straw-based ruminant diets.
Promotion of fodder productionTraditionally farmers in Mehsana use a small part of their pearl millet or sorghum grain crop
as green fodder for milking animals. The union introduced cultivation of alfa alfa (Lucerne)
as a standard practice for feeding milch animals and recommend cultivation of a tenth of an
acre of the crop, per milch animal, in the winter season. The union procures and supplies
good quality seeds from the market or buys from the members whatever they can produce
and sell to other members. In 1999–2000 the union sold some 1724 kg of alfa alfa seeds to
51 DCSs (roughly to 250 ha belonging to 6250 farmers). Alfa alfa seeds are now stocked by
the local retail trade in Mehsana District and a number of farmers buy seeds directly from
the local markets as the practice of alfa alfa cultivation in winter months in Mehsana has
now become a standard practice. Many farmers now raise alfa alfa in winter, take three cuts
of green fodder and then let the plant seed for seed production. Other fodder seeds that the
union promotes are oats, sorghum and maize.
Another promotional activity of the union for fodder production is variety trials on
farmers’ land for fodder varieties of sorghum and maize. Villages in Mehsana have common
grazing lands attached to them from time immemorial. Private and public agents have
usurped many of these areas for other purposes. Of the remaining areas some have been
South–South Workshop 401
Package of improved livestock services through co-operatives

taken over from the government by the DCSs and are used for producing fodder crops both
as a demonstration, as well as a source of green fodder for the community. The extent varies
and the number of DCSs carrying out the activity varies from year to year (see Annex).
Animal health careThe union has a three prong approach to animal health care: (i) veterinary first aid at the
village level located in the DCSs (ii) mobile veterinary services operating from the union
head quarters and delivering services at the farm gate and (iii) special animal health care
camps for special ailments. In addition the union has a preventive veterinary health care
programme for control and containment of epidemics.
Veterinary first aidEvery DCSs affiliated to the Mehsana Milk union is equipped with a veterinary first aid kit,
which comes as a one-time gift from the union. The union also trains a nominee of the DCS
from the same village as a first aid and AI worker for a period of six weeks in the union’s
training centre. The trainee would then become a part of the DCS staff and provide the
members with veterinary first aid at all times since he resides in the DCS village.
Replenishment of drugs and reagents in the kit is taken care of by the DCS and the service is
provided free or at a token charge of Rs. 1 per visit. The first aid worker also acts as a sentinel
against epidemics and reports any untoward animal health happenings in the village to the
veterinary department of the union for immediate investigation. Mehsana Union has 1078
veterinary first aid units, one in each DCS. During 1999–2000 the first aid units treated a
total of some 23,892 cases.
Mobile veterinary servicesMembers of the union are assured of the services of a qualified veterinarian at their
doorstep. To fulfil this commitment the union operates 35 mobile veterinary clinics. Each
mobile veterinary unit is provided with a vehicle and a staff of one veterinary doctor, one
attendant and a driver. Invariably the vehicle is a hired one on long-term contract and the
driver comes with the vehicle. Each mobile units is equipped with a good supply of
medicines, drugs and all veterinary instruments for treatments and surgery, all consumables
for practice and a radio-telephone for communication with the control room. The union’s
veterinary department has a control room and they receive calls from the members or from
DCSs through the milk trucks’ wireless telephones on a 24-hour basis. Each mobile unit
operates along an established route and the vet in charge attends to calls falling on his route
as advised by the control room from time to time. The services are delivered at the owners’
doorstep and are charged at the rate of Rs. 40 for a fresh call and Rs. 20 for repeat calls. The
charges cover the cost of transport, cost of all drugs and consumables, and the vets’ fee. The
calls cost the union some Rs. 77 per case. The expenses of the union for veterinary services
402 South–South Workshop
Kurup
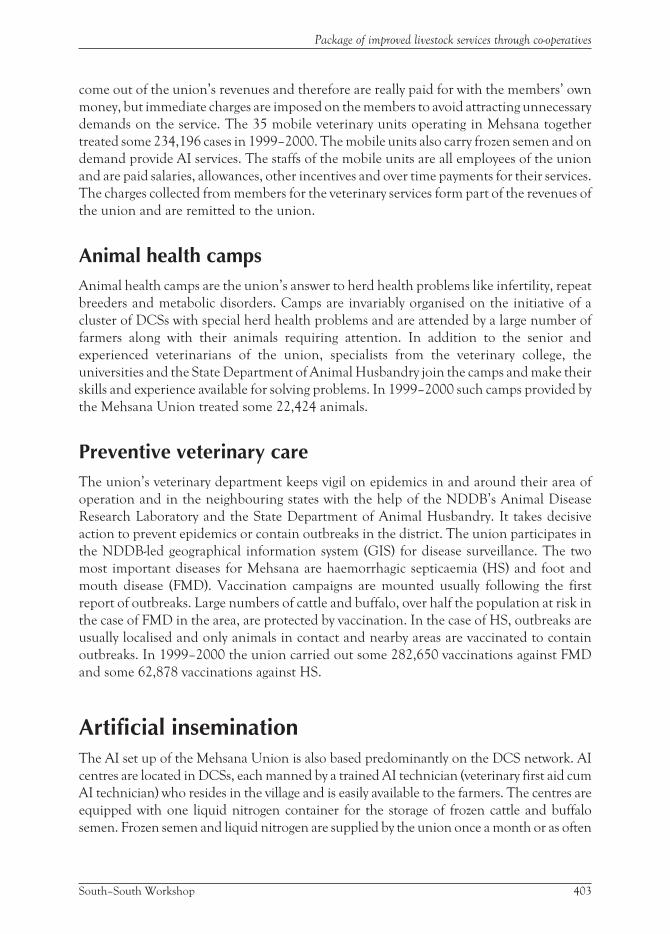
come out of the union’s revenues and therefore are really paid for with the members’ own
money, but immediate charges are imposed on the members to avoid attracting unnecessary
demands on the service. The 35 mobile veterinary units operating in Mehsana together
treated some 234,196 cases in 1999–2000. The mobile units also carry frozen semen and on
demand provide AI services. The staffs of the mobile units are all employees of the union
and are paid salaries, allowances, other incentives and over time payments for their services.
The charges collected from members for the veterinary services form part of the revenues of
the union and are remitted to the union.
Animal health campsAnimal health camps are the union’s answer to herd health problems like infertility, repeat
breeders and metabolic disorders. Camps are invariably organised on the initiative of a
cluster of DCSs with special herd health problems and are attended by a large number of
farmers along with their animals requiring attention. In addition to the senior and
experienced veterinarians of the union, specialists from the veterinary college, the
universities and the State Department of Animal Husbandry join the camps and make their
skills and experience available for solving problems. In 1999–2000 such camps provided by
the Mehsana Union treated some 22,424 animals.
Preventive veterinary careThe union’s veterinary department keeps vigil on epidemics in and around their area of
operation and in the neighbouring states with the help of the NDDB’s Animal Disease
Research Laboratory and the State Department of Animal Husbandry. It takes decisive
action to prevent epidemics or contain outbreaks in the district. The union participates in
the NDDB-led geographical information system (GIS) for disease surveillance. The two
most important diseases for Mehsana are haemorrhagic septicaemia (HS) and foot and
mouth disease (FMD). Vaccination campaigns are mounted usually following the first
report of outbreaks. Large numbers of cattle and buffalo, over half the population at risk in
the case of FMD in the area, are protected by vaccination. In the case of HS, outbreaks are
usually localised and only animals in contact and nearby areas are vaccinated to contain
outbreaks. In 1999–2000 the union carried out some 282,650 vaccinations against FMD
and some 62,878 vaccinations against HS.
Artificial inseminationThe AI set up of the Mehsana Union is also based predominantly on the DCS network. AI
centres are located in DCSs, each manned by a trained AI technician (veterinary first aid cum
AI technician) who resides in the village and is easily available to the farmers. The centres are
equipped with one liquid nitrogen container for the storage of frozen cattle and buffalo
semen. Frozen semen and liquid nitrogen are supplied by the union once a month or as often
South–South Workshop 403
Package of improved livestock services through co-operatives
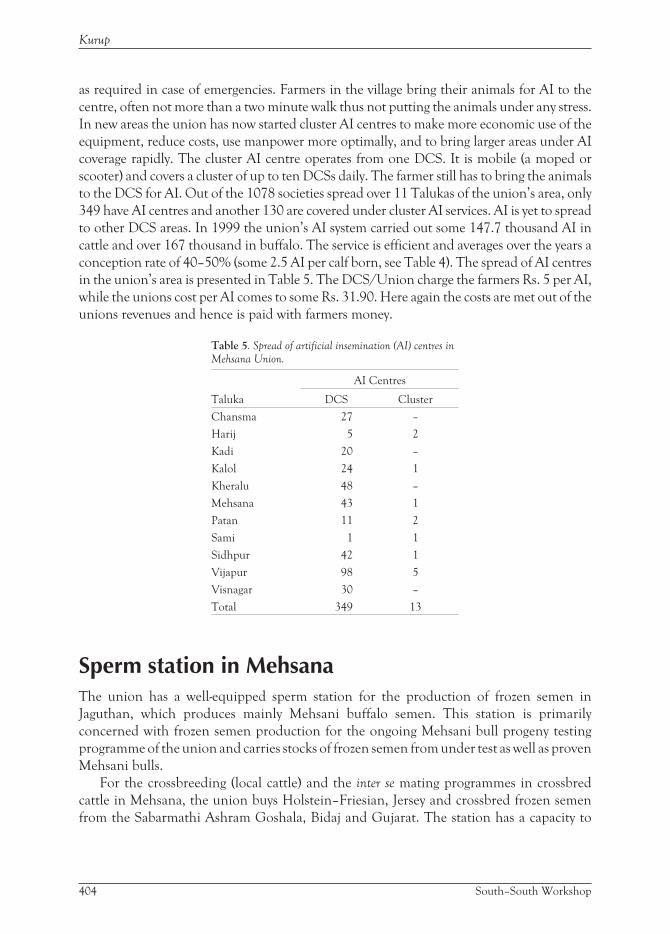
as required in case of emergencies. Farmers in the village bring their animals for AI to the
centre, often not more than a two minute walk thus not putting the animals under any stress.
In new areas the union has now started cluster AI centres to make more economic use of the
equipment, reduce costs, use manpower more optimally, and to bring larger areas under AI
coverage rapidly. The cluster AI centre operates from one DCS. It is mobile (a moped or
scooter) and covers a cluster of up to ten DCSs daily. The farmer still has to bring the animals
to the DCS for AI. Out of the 1078 societies spread over 11 Talukas of the union’s area, only
349 have AI centres and another 130 are covered under cluster AI services. AI is yet to spread
to other DCS areas. In 1999 the union’s AI system carried out some 147.7 thousand AI in
cattle and over 167 thousand in buffalo. The service is efficient and averages over the years a
conception rate of 40–50% (some 2.5 AI per calf born, see Table 4). The spread of AI centres
in the union’s area is presented in Table 5. The DCS/Union charge the farmers Rs. 5 per AI,
while the unions cost per AI comes to some Rs. 31.90. Here again the costs are met out of the
unions revenues and hence is paid with farmers money.
Table 5. Spread of artificial insemination (AI) centres in
Mehsana Union.
Taluka
AI Centres
DCS Cluster
Chansma 27 –
Harij 5 2
Kadi 20 –
Kalol 24 1
Kheralu 48 –
Mehsana 43 1
Patan 11 2
Sami 1 1
Sidhpur 42 1
Vijapur 98 5
Visnagar 30 –
Total 349 13
Sperm station in MehsanaThe union has a well-equipped sperm station for the production of frozen semen in
Jaguthan, which produces mainly Mehsani buffalo semen. This station is primarily
concerned with frozen semen production for the ongoing Mehsani bull progeny testing
programme of the union and carries stocks of frozen semen from under test as well as proven
Mehsani bulls.
For the crossbreeding (local cattle) and the inter se mating programmes in crossbred
cattle in Mehsana, the union buys Holstein–Friesian, Jersey and crossbred frozen semen
from the Sabarmathi Ashram Goshala, Bidaj and Gujarat. The station has a capacity to
404 South–South Workshop
Kurup
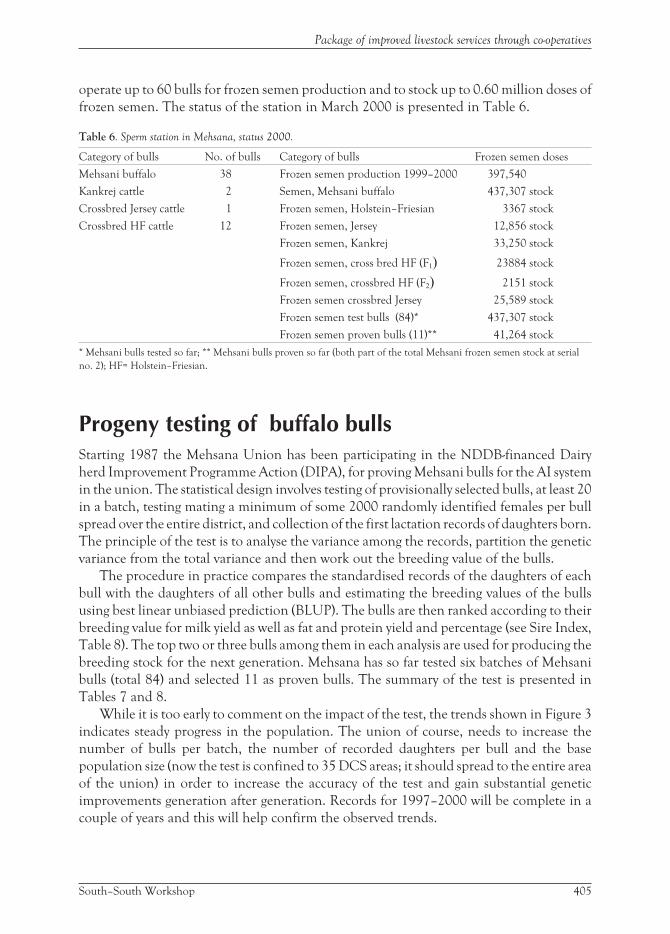
operate up to 60 bulls for frozen semen production and to stock up to 0.60 million doses of
frozen semen. The status of the station in March 2000 is presented in Table 6.
Table 6. Sperm station in Mehsana, status 2000.
Category of bulls No. of bulls Category of bulls Frozen semen doses
Mehsani buffalo 38 Frozen semen production 1999–2000 397,540
Kankrej cattle 2 Semen, Mehsani buffalo 437,307 stock
Crossbred Jersey cattle 1 Frozen semen, Holstein–Friesian 3367 stock
Crossbred HF cattle 12 Frozen semen, Jersey 12,856 stock
Frozen semen, Kankrej 33,250 stock
Frozen semen, cross bred HF (F1) 23884 stock
Frozen semen, crossbred HF (F2) 2151 stock
Frozen semen crossbred Jersey 25,589 stock
Frozen semen test bulls (84)* 437,307 stock
Frozen semen proven bulls (11)** 41,264 stock
* Mehsani bulls tested so far; ** Mehsani bulls proven so far (both part of the total Mehsani frozen semen stock at serial
no. 2); HF= Holstein–Friesian.
Progeny testing of buffalo bullsStarting 1987 the Mehsana Union has been participating in the NDDB-financed Dairy
herd Improvement Programme Action (DIPA), for proving Mehsani bulls for the AI system
in the union. The statistical design involves testing of provisionally selected bulls, at least 20
in a batch, testing mating a minimum of some 2000 randomly identified females per bull
spread over the entire district, and collection of the first lactation records of daughters born.
The principle of the test is to analyse the variance among the records, partition the genetic
variance from the total variance and then work out the breeding value of the bulls.
The procedure in practice compares the standardised records of the daughters of each
bull with the daughters of all other bulls and estimating the breeding values of the bulls
using best linear unbiased prediction (BLUP). The bulls are then ranked according to their
breeding value for milk yield as well as fat and protein yield and percentage (see Sire Index,
Table 8). The top two or three bulls among them in each analysis are used for producing the
breeding stock for the next generation. Mehsana has so far tested six batches of Mehsani
bulls (total 84) and selected 11 as proven bulls. The summary of the test is presented in
Tables 7 and 8.
While it is too early to comment on the impact of the test, the trends shown in Figure 3
indicates steady progress in the population. The union of course, needs to increase the
number of bulls per batch, the number of recorded daughters per bull and the base
population size (now the test is confined to 35 DCS areas; it should spread to the entire area
of the union) in order to increase the accuracy of the test and gain substantial genetic
improvements generation after generation. Records for 1997–2000 will be complete in a
couple of years and this will help confirm the observed trends.
South–South Workshop 405
Package of improved livestock services through co-operatives
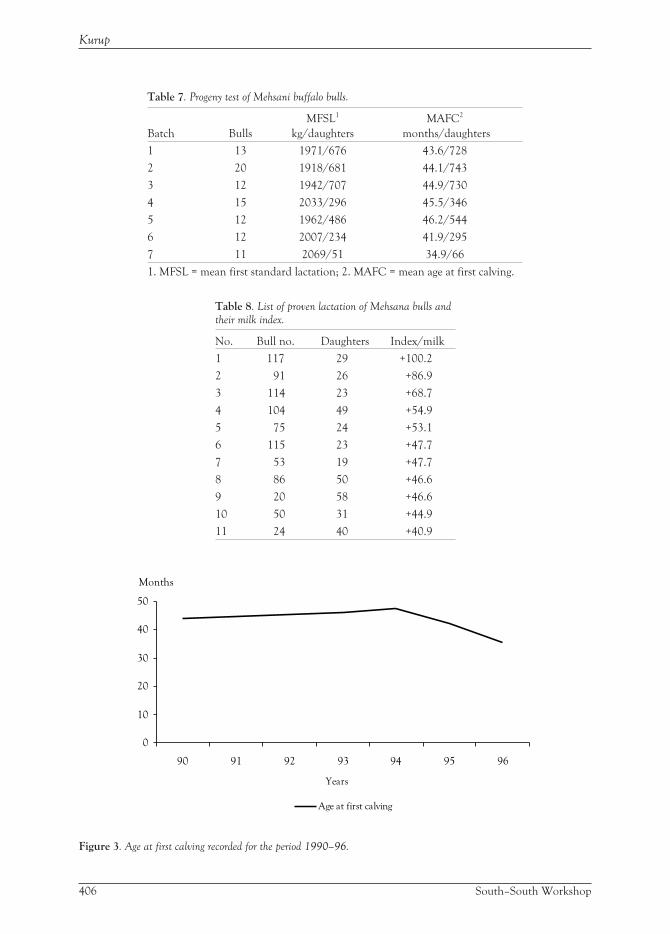
Table 7. Progeny test of Mehsani buffalo bulls.
Batch Bulls
MFSL1
kg/daughters
MAFC2
months/daughters
1 13 1971/676 43.6/728
2 20 1918/681 44.1/743
3 12 1942/707 44.9/730
4 15 2033/296 45.5/346
5 12 1962/486 46.2/544
6 12 2007/234 41.9/295
7 11 2069/51 34.9/66
1. MFSL = mean first standard lactation; 2. MAFC = mean age at first calving.
Table 8. List of proven lactation of Mehsana bulls and
their milk index.
No. Bull no. Daughters Index/milk
1 117 29 +100.2
2 91 26 +86.9
3 114 23 +68.7
4 104 49 +54.9
5 75 24 +53.1
6 115 23 +47.7
7 53 19 +47.7
8 86 50 +46.6
9 20 58 +46.6
10 50 31 +44.9
11 24 40 +40.9
406 South–South Workshop
Kurup
Years
0
10
20
30
40
50
90 91 92 93 94 95 96
Months
Age at first calving
Figure 3. Age at first calving recorded for the period 1990–96.
Field recording of the test of daughters is carried out by the DCSs as are the fat tests
of milk samples on the test dates. Supervision of the recording is excellent and the DCS
set up has emerged as a most reliable village data collection network. All costs incurred
by the DCSs are reimbursed by the union. The dairy improvement programme for
Mehsana needs review and mid course correction to make the test more accurate and
somewhat faster. The union has recently started a dairy improvement programme for
testing Kankrej bulls and to introduce selective breeding of the Kankrej population
using proven bulls.
Extension supportThe Mehsana Union has a well focused extension support programme acting on two
distinctly separate levels among the producer members: for co-operative development and
for production enhancement and technology transfer. Both are designed as member
education. Co-operative development activities get support and funds from the NDDB and
this is the programme that keeps the hundreds of thousands of members well knitted and
well informed of their responsibilities, rights and obligations to their co-operative
institutions. The programmes consist of group meetings in villages, workshops and training
of village opinion leaders, both men and women.
On the production front the programme comprises induction programmes of both
men and women from member families. Groups of men and women from DCS areas are
taken to the union head quarters regularly and are given well-focused exposure on the
set up and functions of the union and their business progress. They also visit the feed
plants, sperm station and the veterinary division and learn about feed formulations,
nutrition and diets for milch animals, about AI and about animal diseases and
vaccinations.
One bus load of men or women visit the union and the other institutions of the union
every working day throughout the year. As a result, over the years every DCS village has
several batches of men and women who have gone through the induction programmes and
can explain and ‘sell’ the union and its input programmes and services. This has helped the
union gain enormous credibility among the members by giving the members an
overwhelming sense of ownership and has helped immensely in technology introduction
and their rapid adoption by members.
Costs for inputs, services and extension supportThe union’s recurring costs together for all inputs and services for 1999–2000 add up to
some Rs. 37.43 million, just 0.6% of the current year’s turnover and less than Rs. 0.10 per
litre of milk procured by the union in 1999–2000. The costs in the case of the extension
support programme are even lower at 0.05% of the turnover and less than Rs. 0.01 per litre
of milk procured.
South–South Workshop 407
Package of improved livestock services through co-operatives
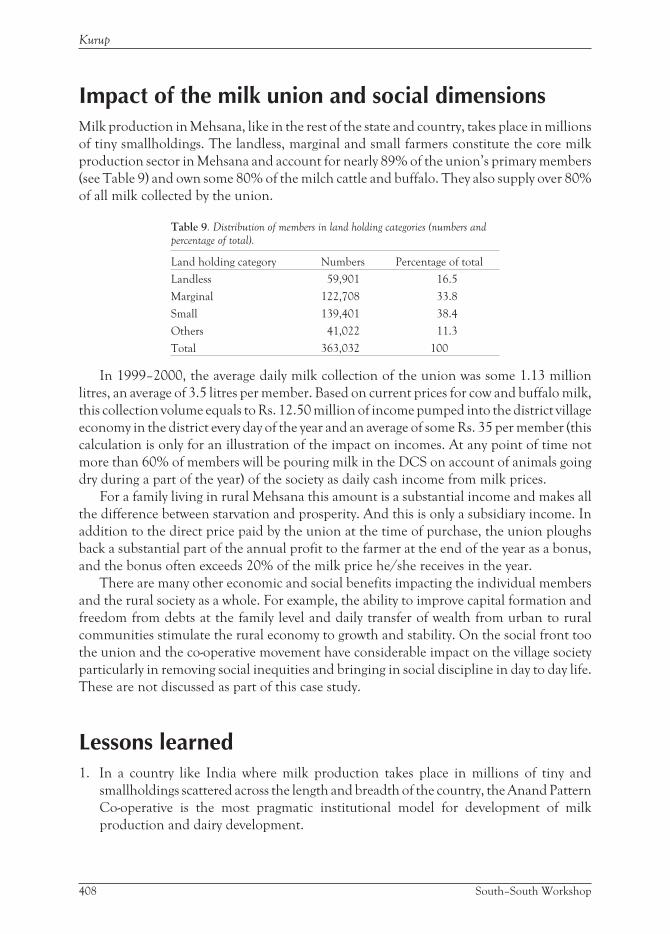
Impact of the milk union and social dimensionsMilk production in Mehsana, like in the rest of the state and country, takes place in millions
of tiny smallholdings. The landless, marginal and small farmers constitute the core milk
production sector in Mehsana and account for nearly 89% of the union’s primary members
(see Table 9) and own some 80% of the milch cattle and buffalo. They also supply over 80%
of all milk collected by the union.
Table 9. Distribution of members in land holding categories (numbers and
percentage of total).
Land holding category Numbers Percentage of total
Landless 59,901 16.5
Marginal 122,708 33.8
Small 139,401 38.4
Others 41,022 11.3
Total 363,032 100
In 1999–2000, the average daily milk collection of the union was some 1.13 million
litres, an average of 3.5 litres per member. Based on current prices for cow and buffalo milk,
this collection volume equals to Rs. 12.50 million of income pumped into the district village
economy in the district every day of the year and an average of some Rs. 35 per member (this
calculation is only for an illustration of the impact on incomes. At any point of time not
more than 60% of members will be pouring milk in the DCS on account of animals going
dry during a part of the year) of the society as daily cash income from milk prices.
For a family living in rural Mehsana this amount is a substantial income and makes all
the difference between starvation and prosperity. And this is only a subsidiary income. In
addition to the direct price paid by the union at the time of purchase, the union ploughs
back a substantial part of the annual profit to the farmer at the end of the year as a bonus,
and the bonus often exceeds 20% of the milk price he/she receives in the year.
There are many other economic and social benefits impacting the individual members
and the rural society as a whole. For example, the ability to improve capital formation and
freedom from debts at the family level and daily transfer of wealth from urban to rural
communities stimulate the rural economy to growth and stability. On the social front too
the union and the co-operative movement have considerable impact on the village society
particularly in removing social inequities and bringing in social discipline in day to day life.
These are not discussed as part of this case study.
Lessons learned1. In a country like India where milk production takes place in millions of tiny and
smallholdings scattered across the length and breadth of the country, the Anand Pattern
Co-operative is the most pragmatic institutional model for development of milk
production and dairy development.
408 South–South Workshop
Kurup
2. While farmer ownership and control are essential for rural enterprises to make them
responsive to the aspirations of farmers and sensitive to their needs, it is essential to
blend it with professional management for efficiency, economy, growth and prosperity.
3. Generation and supply of inputs and services for production enhancement are at their
best when promoted and operated by farmer organisations for quality, economy of scale,
efficiency and regularity.
4. The Indian farming communities have traditional wisdom and enormous farming skills;
they are open to change, can accept responsibility and have among them natural leaders
capable of rising to great heights.
Points for discussion1. Key issues in organising smallholders into credible economic institutions.
2. Cost effective models for livestock services delivery.
3. Quality assurance in AI systems for smallholders.
4. Organisation of sire evaluation procedures for smallholder dairy production.
5. Non-formal approaches to extension support in smallholder dairy production systems.
South–South Workshop 409
Package of improved livestock services through co-operatives
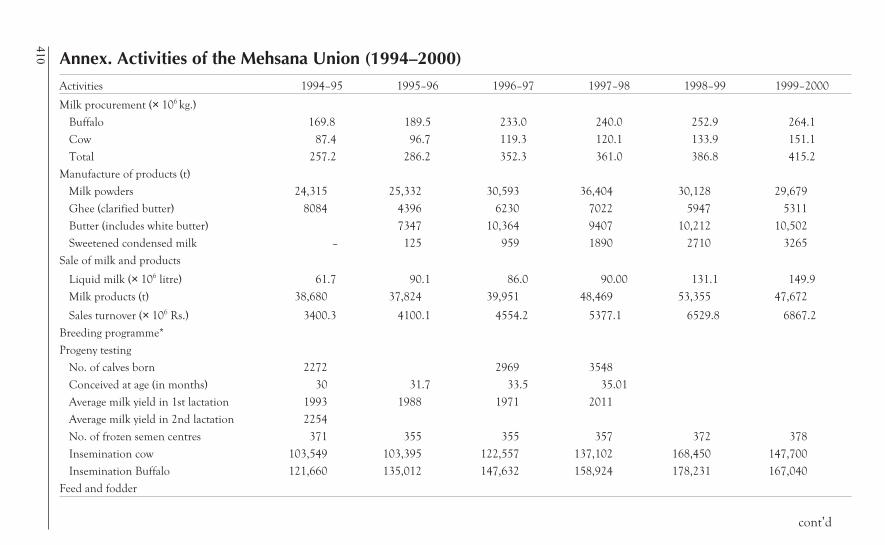
Annex. Activities of the Mehsana Union (1994–2000)Activities 1994–95 1995–96 1996–97 1997–98 1998–99 1999–2000
Milk procurement (× 106 kg.)
Buffalo 169.8 189.5 233.0 240.0 252.9 264.1
Cow 87.4 96.7 119.3 120.1 133.9 151.1
Total 257.2 286.2 352.3 361.0 386.8 415.2
Manufacture of products (t)
Milk powders 24,315 25,332 30,593 36,404 30,128 29,679
Ghee (clarified butter) 8084 4396 6230 7022 5947 5311
Butter (includes white butter) 7347 10,364 9407 10,212 10,502
Sweetened condensed milk – 125 959 1890 2710 3265
Sale of milk and products
Liquid milk (× 106 litre) 61.7 90.1 86.0 90.00 131.1 149.9
Milk products (t) 38,680 37,824 39,951 48,469 53,355 47,672
Sales turnover (× 106 Rs.) 3400.3 4100.1 4554.2 5377.1 6529.8 6867.2
Breeding programme*
Progeny testing
No. of calves born 2272 2969 3548
Conceived at age (in months) 30 31.7 33.5 35.01
Average milk yield in 1st lactation 1993 1988 1971 2011
Average milk yield in 2nd lactation 2254
No. of frozen semen centres 371 355 355 357 372 378
Insemination cow 103,549 103,395 122,557 137,102 168,450 147,700
Insemination Buffalo 121,660 135,012 147,632 158,924 178,231 167,040
Feed and fodder
410
cont’d

Activities 1994–95 1995–96 1996–97 1997–98 1998–99 1999–2000
Cattle feed, calf starter and urea–molassesblocks
86,338 92,997 113,475 128,779 143,154 171,556
Fodder farms (ha) 120 97 97 97 74
Production of green fodder (t) 2807 2213 3164 2156 1465 1871
Production of dry fodder (t) 38 53 44 37 19 4
No. of beneficiaries 2618 3615 3906 4398 2052 2245
Small 929 1197 1534 1673 606 647
Marginal 531 587 725 1075 498 553
Landless 952 1599 1415 1322 822 849
Others 204 232 232 319 126 196
Hand chaff cutters (no.) 4538 3864 3929 2678 4424 2761
Subsidy paid (Rs.) 385,730 349,145 368,490 261,105 487,638 323,027
Improved sickles (no.) 7730 9771 11,334 4725 10,286 6040
Subsidy (Rs.) 23,310 29,313 34,002 14,157 30,858 18,120
No. of fodder demonstration
Fodder farms in DCS 104 30
Supply of improved seeds (Qts.) 230.94 244.5 877.0 425.8 104.2 8.56
Subsidy provided (Rs.) 166,160 212,840 30,250 14,980
Co-operative development
Women participants (no.) 11,661 24,318 18,042 15,847 27,728 20,401
Men participants (no.) 7415 17,123 15,196 14,086 18,060 15,332
Management committee
members (no.) 665 1488 1467 1447 2053 2159
Farmer induction programme (no.) 19,741 42,929 34,705 31,380 41,841 37,892
411
Cont’d
cont’d
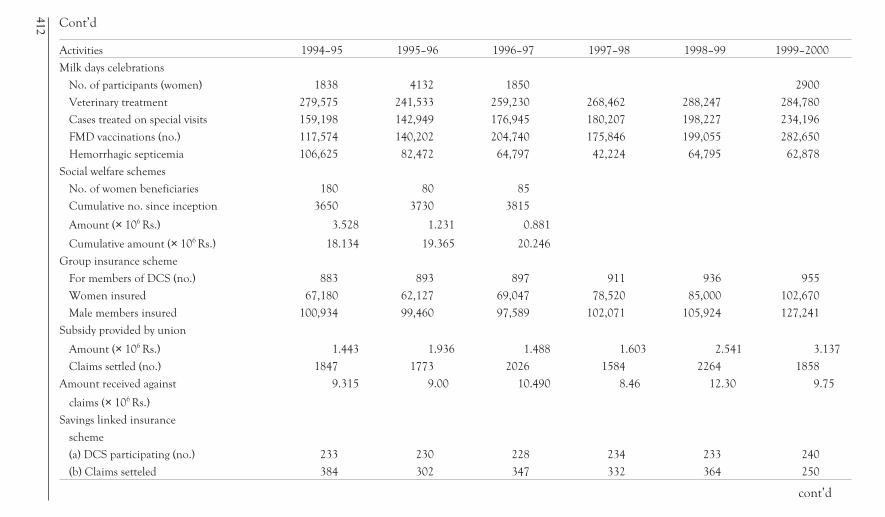
Activities 1994–95 1995–96 1996–97 1997–98 1998–99 1999–2000
Milk days celebrations
No. of participants (women) 1838 4132 1850 2900
Veterinary treatment 279,575 241,533 259,230 268,462 288,247 284,780
Cases treated on special visits 159,198 142,949 176,945 180,207 198,227 234,196
FMD vaccinations (no.) 117,574 140,202 204,740 175,846 199,055 282,650
Hemorrhagic septicemia 106,625 82,472 64,797 42,224 64,795 62,878
Social welfare schemes
No. of women beneficiaries 180 80 85
Cumulative no. since inception 3650 3730 3815
Amount (× 106 Rs.) 3.528 1.231 0.881
Cumulative amount (× 106 Rs.) 18.134 19.365 20.246
Group insurance scheme
For members of DCS (no.) 883 893 897 911 936 955
Women insured 67,180 62,127 69,047 78,520 85,000 102,670
Male members insured 100,934 99,460 97,589 102,071 105,924 127,241
Subsidy provided by union
Amount (× 106 Rs.) 1.443 1.936 1.488 1.603 2.541 3.137
Claims settled (no.) 1847 1773 2026 1584 2264 1858
Amount received against 9.315 9.00 10.490 8.46 12.30 9.75
claims (× 106 Rs.)
Savings linked insurance
scheme
(a) DCS participating (no.) 233 230 228 234 233 240
(b) Claims setteled 384 302 347 332 364 250
412 Cont’d
cont’d
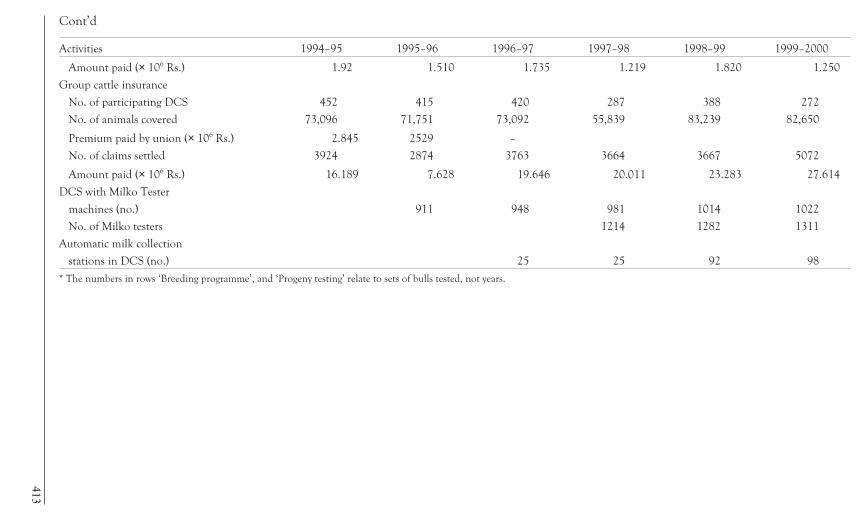
Activities 1994–95 1995–96 1996–97 1997–98 1998–99 1999–2000
Amount paid (× 106 Rs.) 1.92 1.510 1.735 1.219 1.820 1.250
Group cattle insurance
No. of participating DCS 452 415 420 287 388 272
No. of animals covered 73,096 71,751 73,092 55,839 83,239 82,650
Premium paid by union (× 106 Rs.) 2.845 2529 –
No. of claims settled 3924 2874 3763 3664 3667 5072
Amount paid (× 106 Rs.) 16.189 7.628 19.646 20.011 23.283 27.614
DCS with Milko Tester
machines (no.) 911 948 981 1014 1022
No. of Milko testers 1214 1282 1311
Automatic milk collection
stations in DCS (no.) 25 25 92 98
* The numbers in rows ‘Breeding programme’, and ‘Progeny testing’ relate to sets of bulls tested, not years.
413
Cont’d
Contributions of Heifer ProjectInternational (HPI) to small-scale dairydevelopment in CameroonR.M. Njwe1, L.N. Kwinji1, A.L. Gabche1 and E.N. Tambi2
1. Heifer Project International–Cameroon, P.O. Box 467, Bamenda, CameroonE-mail: [email protected]. Organization of African Unity/Inter African Bureau of Animal Resources (OAU/IBAR)P.O. Box 30786, Nairobi, KenyaE-mail: [email protected]
IntroductionIn the last three decades, several attempts have been made to develop the dairy sector in
Cameroon. These efforts have principally focused on genetic improvement through
cross-breeding local with exotic breeds of cattle; improving nutrition through pasture
improvement and supplementary feeding; better health, hygiene and sanitation; and better
access to markets for diary products (IRZV 1990). In spite of all these efforts, dairy
production is still on a small-scale, experimental and embryonic level compared to the dairy
industry in developed countries.
Heifer Project International (HPI) is an ecumenical, Christian and charitable
non-governmental organisation (NGO), supported by contributions from those who believe
in HPI’s basic commitment to helping resource-poor people help themselves and their
communities. An American called Dan West founded it in 1944. The mission of HPI is to
work in partnership with others, to alleviate hunger, poverty and environmental degradation
by: a) responding to requests for development assistance, including animals, training and
technical assistance, which enables families to seek self-reliance in food production and
income generation on a sustainable basis; b) enabling people to share ‘pass on the gift’ in a way
that enhances dignity and offers everyone the opportunity to make a difference in the struggle
to alleviate hunger and poverty; c) educating people about the root causes of hunger and
poverty based on HPI’s experiences and insight gained from working with animals in
development since 1944; d) supporting people in sustainable development and the
stewardship of the environment through responsible management of animal resources.
HPI combats hunger, alleviates rural poverty and restores the environment by providing
appropriate livestock, training and related services to small-scale farmers worldwide. The
organisation helps farmers utilise livestock as an integral component of sustainable
agriculture and holistic development.
Animals in all projects must have access to adequate feed, water and shelter and be
humanely treated. Project participants are given training and on-site technical advice to
414 South–South Workshop
improve their skills and knowledge in animal care, planning and management. The type of
animals used in projects varies according to local needs and requests. Former experience,
natural resources and marketability of surplus production are also taken into account.
Projects are selected on the basis of meeting HPI’s twelve ‘Cornerstones for Just and
Sustainable Development’. The 12 factors form the acronym PASSING on the GIFTS.
The factors or cornerstones are: Passing on the Gift, Accountability, Sharing and
caring, Sustainability and Self-reliance, Improved Animal Management, Nutrition and
Income, Gender and Family Focus, on the Genuine Need and Justice, Improving the
Environment, Full Participation, Training and Education and Spirituality.
HPI’s key concept is that each recipient must pass on offspring of the farm animals they
receive to others. This principle, called ‘passing on the gift’, assures that each participant in the
program becomes a donor to others, enhancing dignity and participation in each project.
‘Passing on the gift’ also helps communities to become self-sustaining. Many project holder’s
work out agreements to return several offspring, one to be donated to another family, and
another for support of the local organisation’s ongoing training and follow up needs.
HPI projects strengthen rural families and communities through improved nourishment,
increased production and the dissemination of skills and knowledge for self-reliance. Care for
the earth’s natural resources are emphasised through training in livestock management,
pasture improvement, soil conservation, forestation and water harvesting.
During the last 5.6 decades, more than a million families in 110 countries who once
faced starvation have become self-reliant as a result of the work of Heifer for Relief—now .
Presently, HPI has small-scale rural livestock projects in 45 countries around the world in
four geographical zones: Africa (Burkina Faso, Ghana, Cameroon, Rwanda, Uganda,
Kenya, Tanzania, Zambia, Zimbabwe, South Africa and Mozambique); South East Asia
(Afghanistan, Bangladesh, India, Nepal, Thailand, Laos, Cambodia, Vietnam, Indonesia,
Philippines, Mongolia, Myanmar, Democratic People’s Republic of Korea, Pakistan and
China); Central and Eastern Europe (Albania, Slovakia, Georgia, Lithuania, Russia,
Armenia, Poland, Romania and Ukraine); North America (Canada, USA and Mexico); and
Latin America and the Caribbean (Guatemala, Dominican Republic, Haiti, Nicaragua, El
Salvador, Honduras, Ecuador, Peru and Bolivia). These small-scale projects involve the
following animal species in various ecological regions of the world: guinea pig, pig, chicken,
duck, rabbit, sheep, goat, cow, water buffalo, camel, donkey, earthworm, fish, geese, guinea
fowl, horse, mule, alpaca, llama, silkworm, turkey and yak.
The Heifer Project International (HPI) has been involved in dairy development in
Cameroon since 1974. Prior to this period, Cameroon was a typical tropical developing
country with relatively little or no dairy tradition apart from milking of cattle under an
extensive traditional system of management. HPI’s first attempt to ensure the development
of dairy industry in Cameroon began in 1974 with the introduction of 22 Holstein–Friesian
and Jersey cattle imported from the United States. The aim of this importation was to
improve the genetic make up of the local Gudali, Red Mbororo and White Fulani cattle
through crossbreeding for improved milk production. Additional imports of 22 and 79
Holstein and Jersey cattle were undertaken in 1976 and 1981, respectively. Working jointly
with the Institute of Animal Research (IAR), HPI began distributing crossbred dairy cows to
smallholder farmers in 1978. By 1981, a semi-intensive dairy production system based on
South–South Workshop 415
Contributions of HPI to small-scale dairy development in Cameroon
crossbred cattle was underway in the North West Province of Cameroon. In 1994 more
emphasis was placed on a zero-grazing dairy production using purebred Holstein and
Friesian cattle, the aim being to achieve milk production levels comparable to those of the
developed countries. The North West province has an altitude ranging from 900 to 3003
metres above sea level and the climate is generally cool throughout the year.
This report examines the role that HPI has played in dairy development in Cameroon,
the impact it has had on the target population and its socio-economic environment and the
lessons that can be learnt from the HPI dairy development strategy. The report begins with a
brief review of dairy production in Cameroon, followed by the dairy development strategy
adopted by HPI. Next is summary of the results obtained under the HPI strategy and then
the impact of these results on target farmers. The constraints that the dairy sector still faces
in Cameroon are presented followed finally by the implications and lessons drawn from the
HPI intervention in Cameroon.
Dairy production in CameroonA number of studies have presented a critical review of dairy development in Cameroon
(Atekwana and Maximuangu 1981; Njwe 1984; Tambi 1991). Overall, the studies suggest
that dairy production in Cameroon is relatively recent, beginning only in the early part of
the 20th Century. Records on the German, English and French colonial periods in
Cameroon indicate that in 1914 the English Army that defeated the Germans in the
Littoral region of the country found a well developed dairy farm stocked with Swiss
Highland cattle in Buea (Spencer 1915). In Djutittsa and Kuti in the West Province of
Cameroon dairy farms were also available (Crawford 1916).
Reports from the Buea Farms indicate that during the period 1954–56 Friesian–
Montbeliard crossbred were producing an average daily milk yield of 1.25 gallons (CDC
Report 1954–1956). Recently at the IAR Bambui, Kamga et al. (1987) reported and average
daily milk yield obtained from local pastures of 6.67 litres compared to 9.49 litres per day
obtained from improved and well-managed pastures. Goldman et al. (1985) reported daily
milk yield from Gudali and local zebu cattle grazed on native pastures and fed concentrate
supplements of 2.34 and 2.97 litres per animal during the dry and rainy seasons, respectively.
From studies conducted at IAR Wakwa, Tambi (1991) showed that apart from high mortality
rates (39.9%) Holstein–Friesians performed relatively better under tropical conditions than
local Gudalis. Their milk production averaged 3431 litres for a lactation period of 283 days
(12.1 litres/day (and their calving interval of 383 days and average age at first calving of 940
days were relatively shorter than the local Gudalis. The cross-breeds (Holestein × Gudali) had
a relatively lower mortality rate (11.8%) and their milk production averaged 1524 litres for a
lactation period of 256 days (5.9 litres/day) while the local Gudalis had a low mortality rate of
4.3% and an average milk production of 483 litres for a lactation period of 168 days (2.9
litres/day). Raising cattle on local pastures without adequate supplementation tends to limit
milk production from both the local and crossbred cattle.
In Cameroon most of the local breeds of livestock are raised under the extensive system.
This system is popular in the Adamawa, Far North, North, North-West and West Provinces
416 South–South Workshop
Njwe et al.

of the country. The system is based on indigenous breeds of zebu cattle notably the Gudali,
Red Mbororo and White Fulani. The animals are grazed extensively on natural pastures year
round. Improved pastures are lacking and supplementary feeding with concentrates and
minerals are totally absent. During the wet season the cattle are grazed on hilltops and slopes
and during the dry season they are taken on transhumance to river valleys after crops have
been harvested. Meat is the major product of this system while milk production is
secondary. Animals are milked once a day and the average daily milk yield is 2–3 litres per
lactating cow. A larger portion of the milk is consumed by the family. Dams and calves are
not separated until weaning.
Achieving increased and sustainable dairy production requires a radical departure from
the extensive system of dairy production clearly evident in Cameroon. Kenya’s experience
in smallholder dairy development has shown that semi-intensive and zero-grazing dairy
units are viable alternative strategies for meeting increased demand for dairy products. HPI
has been the pioneering organisation involved in the introduction of semi-intensive and
zero-grazing dairy production strategies in Cameroon.
HPI/Cameroon small-scale dairy developmentstrategyHPI works with limited resources families within sub-urban and peri-urban areas with the aim
of alleviating poverty and malnutrition. In Cameroon, HPI staff contact existing farming
groups in needy communities and sensitise them on the benefits of zero-grazing small-scale
dairy farming. Those farming groups that are interested in small-scale dairy farming then make
a request to the HPI screening committee. They are required to submit the internal rules and
regulations governing the group together with other relevant documents to substantiate their
existence and credibility as a Common Initiative Group (CIG).
Selected groups are given basic village-based training on the different aspects of
zero-grazing dairy production. The choice of zero-grazing arose from the need to reduce the
incidence of ticks on animals, especially when they are allowed to graze on infested pastures.
The first batches of purebred Holstein cattle introduced at the National Research Stations at
Bambui and Wakwa were eliminated by ticks, as a result of inadequate preventive measures.
This led to a recommendation of cross bred animals with local cattle which produce lower
yields of milk but better resistance to tick borne diseases by the Livestock Research Institute in
Cameroon. The zero-grazing system had been tested in Uganda and Tanzania and had
resulted in rapid increases in milk production by small-scale rural farmers. The adoption in
Cameroon was therefore an extension of the successful experience in East Africa. Recently,
researchers of the Livestock Research Institute have approached HPI to collaborate in a joint
research program that will quantify the performance of these animals under on-farm
conditions, since the results available were under on-station conditions. HPI has welcomed
this collaboration. The government does not provide grants to HPI but readily grants import
permits for cattle from East Africa and exonerates all taxes related to importation.
South–South Workshop 417
Contributions of HPI to small-scale dairy development in Cameroon

The training involves site selection, pasture improvement, agro-forestry, on-farm-feed
production, routine cattle management, cattle breeding and reproduction, milk production
and handling, animal housing, health, marketing and book keeping and co-operative
development. They are also educated on the HPI philosophy and the concept of ‘passing on
the gift’ (POG).
Heifer Project International has developed a set of essential principles called the HPI
Cornerstones for Just and Sustainable Development. All organisations and farmer groups
are screened, monitored and evaluated according to these principles, and project plans
made by groups take these factors into consideration.
After this initial training, refresher courses are organised to fill up any gaps from the
basic training. Regular extension follow-up is also provided to the farmers during the entire
duration of HPI’s assistance. During the follow-up, HPI staff collaborates with experienced
farmers as well as other technical collaborators from the Ministries of Agriculture, Livestock
and scientific Research and other NGOs.
After the initial training, farmers are required to have a minimum of 0.5 ha of improved
pastures (Guatemala, Elephant grass and Brachiaria spp, mixed with legumes such as
Stylosanthes, Lablab and Desmodium spp) and 500 to 1000 established leguminous fodder trees
(Calliandra, Leuceana, Acacia etc). A completed Kenyan model zero-grazing stable (consisting
of feeders, drinkers, sleeping cubicles, walk yard, calf pen, milking parlour etc.) has to be
constructed before qualifying to receive a zero-grazing purebred Holstein–Friesian cattle from
HPI on the POG basis. As part of the contribution to the project, farmers provide land, family
labour and local materials during the lifetime of the project. HPI provides training, extension
follow-up services, agricultural inputs [initial supply of pasture seeds, cement for floors,
veterinary drugs] dairy cattle quarantine and placements, technical services and financial
support [including farmer exchange visits]. Although the financial and technical assistance
lasted for 3 years, the technical follow-up has continued for another 2 years. Micro credit
financing to help boost production and milk marketing is offered to groups after 3 years of
assistance provided they submit an application for short-term loans for a viable project. The
application is recommended by HPI to the Cameroon Credit Union League (CAMCUL).
Before and after animal placement, there is a joint follow-up by farmers and HPI in the
areas of agro forestry, pasture establishment, pasture seed and hay production, artificial
insemination, vaccination and TB screening. Farmers also submit quarterly progress
monitoring information on indicators such as milk production, consumption, marketing,
manure production, utilisation and sales, calving, gender and group leadership issues which
are analysed and sent to donors and farmers periodically.
Description of project areaThe HPI smallholder dairy development project operates in the North West Province (NWP),
one of Cameroon’s ten provinces. It is situated between latitudes 5.30° and 7.20° north of the
Equator and between longitudes 7.7° and 11.5° east of the Greenwich Meridian. The
topography is mountainous and the altitude ranges from 800 to 2200 m with an average of 1200
418 South–South Workshop
Njwe et al.
metres above sea level. Temperature ranges from 15–24°c. The average annual rainfall is 1500
mm. It is unimodal and the peak occurs in September. The annual relative humidity varies from
50% in the dry season to 70% in the wet season. There are two distinct seasons: the dry season,
which occurs between mid-November to mid-March and the rainy season from mid-March to
mid-November. Sunshine hours range from 8 hours to 17 hours in the dry seasons and 09 hours
to 13 hours in the rainy season. Generally, the highlands have a cool climate all year round
which is less stressful to dairy animals of temperate origin than that the hot lowlands.
The soils of the NWP are not uniform. In Bamenda, the provincial capital, the soils are
ferralitic with outcrops of recent volcanic soils. Overgrazing and poor cultural practices have
resulted in a decline of the fertility of soils. The vegetation is predominantly savannah with
Sporobolus africanus as the predominant natural pasture. This grass has a low nutritive value. The
forage species found in the zero-grazed pastures in the farms where the study was carried out
were: grasses (Tripsacum laxum, Pennistum purpureum, Brachiaria ruziziensis), legumes (Desmodium
intortum, Desmodium uncinatum and Stylosanthes guyanensis) and browse plants (Calliandra
calothyrsus, Leucaena leucocephala and Erithina poeppigiana). The population density of the NWP is
about 80 persons/km2. With increasing population, the pressure on the limited land has
increased due to intensification of agriculture. The size of household land has been decreasing.
Establishment of small-scale zero-grazing dairy unitsThe two breeds of cattle currently being used for small-scale dairy development in Cameroon are
Holstein and Friesians, imported into Cameroon from Ireland in 1995 and from Kenya in
1997. The dairy cows from Ireland were previously raised by various Irish farmers who then gave
them as a donation for the pilot zero-grazing small-scale dairy development in Cameroon. The
original batch of animals that arrived in Cameroon consisted of 20 pregnant heifers. These
animals have reproduced during the last three years. The dairy animals imported from Kenya are
purchased from commercial farms with funds provided by Wild Geese (Holland) and Heifer
Project International in the United States. The animals were brought in by air to Yaounde in
June 1997 and then moved by truck to Bamenda. Both batches of animals were quarantined for
one month before being distributed to farmers. All of them were at the end of the first lactation.
The method of breeding was artificial insemination (AI) using Holstein–Friesian semen from
Ireland and American Breeder Service.
Animals were maintained in stables (3 m high, 8–10 m long and 6.5 m wide) made of 2
cubicles, a raised floor calf pen, a milk parlour, corridor, store and feeders. The roof of the stable
was either made of grass thatch, raffia thatch or aluminium sheets. The floor was designed to
slope into a gutter on one side to ease evacuation of urine and faeces, which ultimately were
utilised as farmyard manure. Close to the stable was an open-air enclosure for exercise.
Dairy cows were maintained under zero grazing. Fresh forage was cut, chopped and fed
to animals three times a day at 8 am, 12 noon and 5 pm. About 30–50 kg of chopped forage
was served during 24 hours. Legumes such as Desmodium, Laucaena and Calliandra were
given to animals once every fortnight. Concentrate was served at the time of milking. The
amount given was proportional to milk yield (1 kg for every kg of milk produced after 10
litres of milk). Concentrate supplements were prepared on-farm based on a formula
South–South Workshop 419
Contributions of HPI to small-scale dairy development in Cameroon

recommended by HPI. The main ingredients used for composing rations were wheat or rice
bran (20%), cotton seed cake or soya bean meal (20%), corn flour (50%), bone meal (0.5%)
and salt (2.5%). Water was served ad libitum. In addition, crop residues such as fresh corn
stalks, bean stems and leaves and plantain leaves were given to animals whenever they were
available. Lactating animals were hand milked twice a day at 6:00 a.m. and 5:00 p.m. Calves
were bucket-fed with milk until the age of 4 months, when they were weaned. Animals were
dewormed every three months and sprayed against ticks every month.
Information was obtained from farmers about the management system through
interviews, special information recording forms left with farmers in which milk yield,
concentrate fed, breeding and calving dates, body weight measurement, birth and weaning
weight, age at first calving, calving interval and gestation duration were estimated. A graduated
tape (39–900 kg) was used to estimate body weight of animals through an indirect method of
measuring heart girth. Mean values from the data collected were compared using a t-test.
Performance of smallholder zero-grazing dairy unitsTable 1 presents a summary of some reproduction and production parameters of purebred
Holstein–Friesian cattle introduced in the peri-urban area of Bamenda, Cameroon. Average
milk yield during the first lactation was 3208 kg while the range was 1920 to 4700 kg. During
the second lactation, average milk yield was 4284 kg. This was an increase of 20% over the first
lactation milk yield. The milk yield obtained during the first lactation is higher than 2318 kg
obtained in Ethiopia (Kiwuwa et al. 1983), 2889 kg in Hariana, India (Duc and Taneja 1984)
and 2495 kg in Kenya (Meyn and Wikins 1974). This figure is also similar to 3392 kg obtained
on-station at Bambui (IRZ 1984) and 3286 kg obtained in Nigeria by Sohael (1984).
It should be pointed out that during the first lactations a number of farmers were still
having their first experience in handling dairy cattle under zero grazing. Most of them had
not mastered the skills required for managing dairy cattle. Thus, errors were often made in
rationing feed to animals, budgeting feed to last throughout the dry season, treatment
against worms according to the schedule provided by HPI during training sessions, milking
animals efficiently and feeding calves adequately. There were a lot of variations in lactation
period even though the average during the first and second lactations was 315 and 270 days,
respectively. Poor ability of new farmers to detect heat, differences in rations and
management practices could have been responsible for the differences. It was observed that
some animals were still in high milk production after 10 months of lactation and the
farmers allowed milking to continue even though they were supposed to dry-off such
animals. The average lactation period of 315 days observed during the first lactation is
similar to 329 days obtained at IRZ Bambui Station (1984), 322 days reported in Kenya
(Meyn and Wilkins 1974), but higher than 283 reported in Nigeria (Sohael 1984).
Birth weight of calves ranged from 29–50 kg with an average of 43 kg for female calves
and 38.5 kg for male calves. At weaning calves weighed an average of 83 kg whereas male
calves weighed 67 kg. Bull calves generally had higher average daily weight gains (0.475 kg)
than female calves (0.425 kg).
420 South–South Workshop
Njwe et al.

Table 1. Reproduction and production parameters of Holstein–Friesian dairy cattle under
smallholder management in peri-urban areas of Bamenda, Cameroon.
ParameterNumber of animals
(n) AverageStandarddeviation
Birth weight (kg)
Male calves 13 38.5 4.1
Female calves 17 42.7 5.8
Weaning weight (kg)
Male calves 13 67.3 8.1
Female calves 17 83.0 21.0
Daily weight gain (kg)
Male calves 13 0.475 0.191
Female 17 0.425 0.153
Mortality rate (%) 49 18.4 –
Calving rate (%) 18 95.5 –
Age at first calving 40 32.5 3.5
Calving interval (months) 16 15 2.0
Milk Production
First lactation (kg) 24 3208 808
Second lactation (kg) 12 4284 1626
Lactation duration (days)
First lactation 24 315 29
Second lactation 12 270 36
Source: HPI/ Cameroon (1999).
Age at first calving was 32.5 months. This value is higher than 28 months observed in the
USA (Branton et al. 1966) and 30 months in Nigeria (Sohael 1984). The 32.5 months
obtained on-farm is similar to 32 months reported at the Bambui Research Station (IRZ
1984), and 32 months in Hariana, India (Duc and Taneja 1984), but lower than 36 months
reported in Ethiopia (Kiwuwa et al. 1983) for the same breed.
The mean calving interval was 15 months (12 to 18 months range), which is similar to 14
months at Bambui Research Station in the same location. Meanwhile, Meyn and Wilkins
(1974) reported calving intervals of Holstein–Friesian of 14 months, while Sohael (1984)
obtained 13 months in Nigeria. The problem of animals not being bred on time on-farm has
often increased the calving intervals.
Costs and benefits of smallholder zero-grazingdairy productionTo determine whether the introduction of a zero-grazing dairy production unit in the
smallholder mixed farming system is profitable, a partial budget analysis was conducted for
farms in two different locations—Mezam and Donga/Mantung Divisions of the NWP. The
partial budget analysis does not examine the profit or loss situation of the whole smallholder
South–South Workshop 421
Contributions of HPI to small-scale dairy development in Cameroon

mixed farming system but the net increase or decrease in farm income resulting from the
introduction of a zero-grazing unit. The analysis compares the cost of the additional
investment (including the opportunity cost) required for introducing the zero-grazing units
with the marginal or additional increase in benefits that the new activity will bring. The
introduced new activities involve the purchase of heifers (valued at 1.2 million FCFA (US$
1846.00)), the construction of a fenced stable and crush, establishment of improved
pastures and the provision of veterinary services. Benefit items generally involve the value of
the animal (obtained on a POG basis), sales of milk, pasture seeds and cow dung, the value
of milk consumed at home and cost saved.
Tables 2 and 3 present the benefits derived from introducing a zero-grazing dairy
production unit in Mezam and Donga/Mantung Divisions, respectively. The additional
cost of the intervention is estimated at 1.8 million FCFA (US$ 2804.00) in Mezam Division
and 1.9 million FCFA (US$ 2883.00) in Donga/Mantung Division. The cost of a heifer
accounts for about two-thirds of the total operation cost. Given that the opportunity cost of
422 South–South Workshop
Njwe et al.
Table 2. Partial budget for a zero-grazing dairy production unit in Mezam Division.
Cost/benefit item
Amount
FCFA (× 103) US$
Costs
Animals 1200 1846
Infrastructure
Crush 112.86 174
Fence 67.1 103
Stable 96.3 148
Pasture improvement
Fertiliser 17.67 27
Operating costs
Hired labour 75.2 116
Veterinary services –
Repairs
9.117 14
Revenue forgone 244.3 376
Total cost 1822.7 2804
Benefits
POG heifers 1200 1846
Culled cattle 268.75 413
Milk sales 321.8 495
Home milk consumption 256.3 394
Cow dung 19 29
Pasture seed sales 6.8 11
Costs saved 47.56 73
Total benefits 2120.2 3261
Net benefits 297.56 457
Source: HPI/Cameroon (1999).
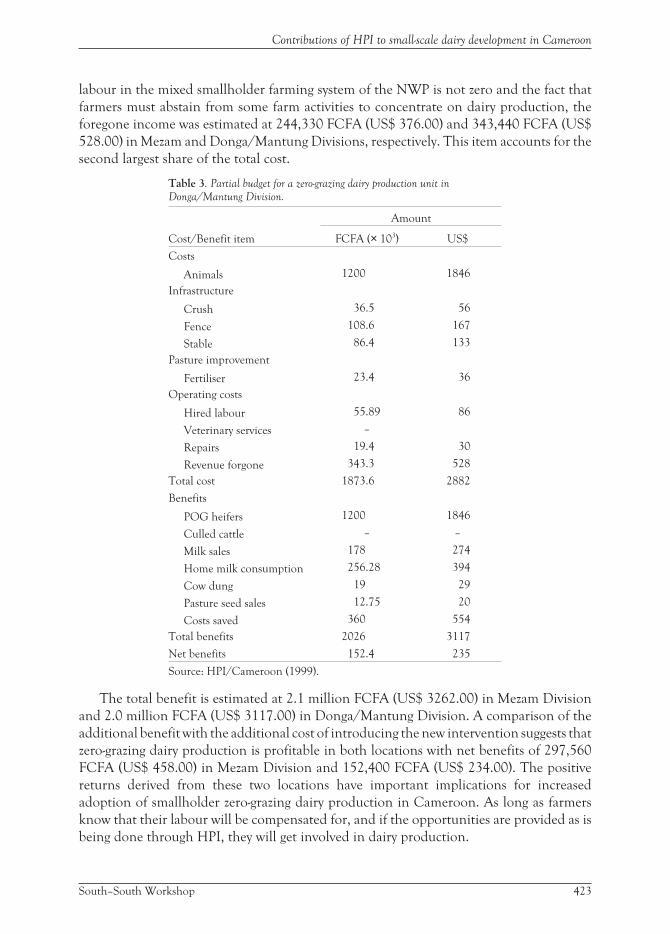
labour in the mixed smallholder farming system of the NWP is not zero and the fact that
farmers must abstain from some farm activities to concentrate on dairy production, the
foregone income was estimated at 244,330 FCFA (US$ 376.00) and 343,440 FCFA (US$
528.00) in Mezam and Donga/Mantung Divisions, respectively. This item accounts for the
second largest share of the total cost.
Table 3. Partial budget for a zero-grazing dairy production unit in
Donga/Mantung Division.
Cost/Benefit item
Amount
FCFA (× 103) US$
Costs
Animals 1200 1846
Infrastructure
Crush 36.5 56
Fence 108.6 167
Stable 86.4 133
Pasture improvement
Fertiliser 23.4 36
Operating costs
Hired labour 55.89 86
Veterinary services –
Repairs 19.4 30
Revenue forgone 343.3 528
Total cost 1873.6 2882
Benefits
POG heifers 1200 1846
Culled cattle – –
Milk sales 178 274
Home milk consumption 256.28 394
Cow dung 19 29
Pasture seed sales 12.75 20
Costs saved 360 554
Total benefits 2026 3117
Net benefits 152.4 235
Source: HPI/Cameroon (1999).
The total benefit is estimated at 2.1 million FCFA (US$ 3262.00) in Mezam Division
and 2.0 million FCFA (US$ 3117.00) in Donga/Mantung Division. A comparison of the
additional benefit with the additional cost of introducing the new intervention suggests that
zero-grazing dairy production is profitable in both locations with net benefits of 297,560
FCFA (US$ 458.00) in Mezam Division and 152,400 FCFA (US$ 234.00). The positive
returns derived from these two locations have important implications for increased
adoption of smallholder zero-grazing dairy production in Cameroon. As long as farmers
know that their labour will be compensated for, and if the opportunities are provided as is
being done through HPI, they will get involved in dairy production.
South–South Workshop 423
Contributions of HPI to small-scale dairy development in Cameroon

Impact of HPI dairy development project on thetarget population and its socio-economicenvironmentAn evaluation of the HPI small-scale dairy development project in Cameroon was carried
out in 1999. From this evaluation several issues concerning impact and problems
confronting farmers were raised for discussions.
The general framework for impact evaluation required information at the beginning,
during and after the project had ended. In order to measure the degree of achievements of
planned goals, it was necessary to identify both the anticipated and unanticipated
consequences of the project and to examine the long-term sustainability of the benefits. In
the case of HPI/Cameroon, no baseline study was carried out to identify the level or degree
of development of the dairy enterprise in the project area before the introduction of this
activity. However, since for the target population of HPI, the dairy enterprise was
completely a new activity; all direct and indirect consequences such as dairy production and
revenues thereby generated, increased productivity of other farm crops due to the use of cow
dung manure, diversification to other animal production enterprises, family consumption
of fresh milk and the degree of participation of the target population etc. could be
considered as impact measures likely to be attributed to the project. This part of the analysis,
which was highly qualitative, was based on the personal observations of the evaluation team
and oral interviews with the beneficiaries.
Other socio-economic impacts of the project include: change in people’s social value
about livestock raising (now considered as wealth rather than an element of social status);
change in consumption patterns or habits to include milk and other dairy products;
intensification of exchange and relations with other economic agents in their
environments; diversifications of economic activities (farm and off-farm); change in farming
systems and structure to include livestock production in general and dairy production and
marketing in particular.
In terms of sustainability of project benefits, the process of POG financial autonomy,
level of technical knowledge, number of weaned farmers still in business, level of
profitability and periodic follow-up by HPI etc. were considered as key progress indicators.
Assessment of technical and institutionalsustainability of dairyWhen farmer groups are screened by HPI for assistance, they usually benefit from a
technical package that supports them in pasture development, shed construction,
protection of animal health and a training they receive in husbandry techniques, feeding
and milk hygiene. After the first year farmers are gradually informed to paying for services.
This reduces the dependency syndrome by the time the financial assistance ends in three
years. Farmers join the milk farmers association, which brings them in contact with the milk
424 South–South Workshop
Njwe et al.
factory. Thus they have a direct linkage with the milk marketing system. In fact, HPI plays no
role in their day-to-day milk sale mechanism. At the beginning of the project a single
pregnant heifer is given to each family. Normally, they would obtain a calf a year, and where
such calves are females they are able to fulfil the POG contract within the first 2 years and
any subsequent calves become the property of the family. Depending on family size, 2 or 3
females would be maintained for milk production, while other subsequent calves are sold.
With 2 or 3 lactating cows, the family is assured of 40–80 litres of milk a day, which is an
encouraging income in rural areas when the milk is delivered to the factory. Although there
are some marketing problems for farmers far from urban centres, it is our strong conviction
that the problem is temporal. Efforts being made by HPI to improve milk marketing will
eventually improve the situation. At the moment we have hundreds of farmers that are
ready to receive animals, but our main constraint is the source of Holstein or Jersey cows.
NutritionOne of the basic objectives of HPI is to improve the nutritional status of its target
population through the introduction of dairy farming. Field observations and discussions
with the beneficiaries of the dairy programme have showed that the dairy enterprise has
totally been embraced by the target population and their consumption of dairy products
(milk) had increased; thus improving their nutritional status. All households involved in
dairy farming have reported that their consumption of milk has increased and this was
evident from the food health of their children. For example, before the introduction of
dairy farming to the target population, about 36% of the surveyed households confirmed
that they were not consuming milk but all diary producers have become milk consumers.
The income generated from the sales of fresh milk has also gone a long way to increase the
basket of food consumed by the household in the rural area. The request for more dairy
animals by the target population is a clear indication that the dairy enterprise is worthwhile
in the rural environment.
Impact on crop productionApart from direct milk production that has increased, the introduction of dairy production
has an important effect on the overall farming system. Particularly, the use of cow dung in
the farming system had greatly improved productivity (especially for maize and vegetables)
as reported by all the surveyed households. In addition, the use of cow dung has reduced the
use of fertiliser; thus by saving costs or expenditures, the farmers have gained from the
project. In the majority of cases (about 80% of the households surveyed) cow dung has
replaced the use of inorganic fertiliser completely.
The availability of cow dung has enabled farmers to intensify food crop production and
in some cases they have introduced new crops such as huckleberry, garden eggs, cabbage,
carrots and other vegetables, which grow faster with the application of cow dung manure. In
terms of environmental protection, the use of cow dung is more environmentally friendly
South–South Workshop 425
Contributions of HPI to small-scale dairy development in Cameroon
and has a long lasting effect on soil fertility than chemical fertilisers that easily leach. By and
large, the introduction of livestock production in general and of the dairy production in
particular has broadened the structure of the farming system, and has diversified the sources
of farm income for dairy farmers.
Diversification into other livestock speciesIn order to reduce or diversify risks in livestock production, HPI, in addition to introducing
the dairy programme, has encouraged the production of other small livestock by the farm
family. These additional livestock species include among others: pigs, poultry, rabbits, guinea
pigs etc. Farmers themselves have also intensified the production of goats or sheep (80% of the
surveyed households), which was formerly done on a limited scale. Livestock and food crop
production are complementary enterprises. The management practices of the farm family as
observed on the field show that their complementarities are well understood. Beans or maize
haulms and corn stalks are fed to livestock, while animals wastes are used as inputs for food
crop production. This is an efficient allocation of limited resources within the farming system
and results in an increase of productivity of both crop and livestock.
Impact on farm incomeIn the project area, the various sources of revenue were identified in the farming system.
These include sales of surplus foodstuffs, small ruminants, chickens or poultry products,
fresh milk from dairy farming etc. Off-farm sources of additional income include ‘petty’
trading between urban and rural areas, artisan and craftsmanship. All these activities were
important to generate income in rural areas but made the framework of the evaluation
difficult (time constraint and lack of information) to quantify the contribution of each
source. For the dairy enterprise, which was one main focus in this evaluation, an attempt
was made to evaluate its contributions to income generation through partial budgeting
technique. The results showed a positive net benefit for the zero-grazing system. Generally,
the dairy enterprise contributed positively to income generation by the farm family. To be
more precise on its contribution, there is a need for in depth study of all the income-
generating sources within the farm family.
Constraints to dairy productionSurveyed farmers were asked to rank in order of importance five major constraints faced in
their diary activities. The analysis of the results indicates that marketing is the major
constraint for more than 90% of the farmers. This marketing problems could be broken
down into poor road network coupled with lack of transport facilities; lack of processing
and storage or conservation equipment for fresh milk; inadequate demand in the
immediate environment of the farmers and low milk prices etc.
426 South–South Workshop
Njwe et al.

The second constraint is that of finance. Here, the problem is associated largely to
insufficient savings to finance investments, limited access to credit as a result of land title
requirements as collateral especially by credit union (CamCUL). Although access to
‘Njangis’ (informal credit) is relatively easier, about 80% of the farmers have reported that
this source is inadequate in satisfying both social and productive needs.
The next most important constraint as mentioned by the farmers is animal health. Lack
of drugs and the presence of ticks are the main problems cited by farmers (about 65%).
The fourth constraint is that of running costs for the dairy enterprise. More than 80% of
the surveyed farmers have reported the lack of funds to purchase concentrates and also the
fact that in some local markets concentrates are not available. The farmers (95%) consider
that this problem is very crucial because poor feeding would result in poor health and low
milk yield.
Farmers are not very satisfied with the practice of artificial insemination (AI) as about 60%
of the farmers have reported to have successful insemination only after two to three trials.
Because of this, the request for bulls for natural crossing has been on the increase. Besides, the
high cost of liquid nitrogen is a serious drawback in operating an efficient AI system.
The scarcity of local supplies of heifers of exotic breeds like Holstein, Friesians and
Jerseys is an important obstacle to the rapid expansion of small-scale dairy development
based on zero grazing. Farmers ready to receive animals have to wait for up to 18 months to
receive pregnant heifers.
Feed scarcity during the dry season is an important constraint to adequate feeding of
animals and often results in lower milk yields and lower income. In fact, some farmers have
to go a considerable distance from their homes to procure adequate forage for their animals.
Also stall-feeding of animals is labour-intensive most of the labour burden is particularly
heavy during school time and during the dry season. It is not possible at this stage to provide
figures on economic benefits or demonstrate whether these benefits outweigh the burden
on the family. However, from the partial budget analysis realised, introduction of the dairy
animal results in direct and indirect increase in family income.
The farmers’ personal efforts to resolve most of these problems are fairly limited and
leave much to be desired. In some cases such as marketing problems, farmers (about 80%)
had not attempted any solution.
Implications and lessons learnedIn general, the dairy enterprise is a viable enterprise in the project area. It has been totally
embraced and fully integrated in the farming system by the target population. Dairy cattle
have become part and parcel of the farm family as the animals are catered for just like a
member of the household. Furthermore, the contribution of dairy cow to the farming
system is highly commendable and widely acknowledged by the farm family in the project
area. The constant supply of farmyard manure stimulates crop yields, especially in an era
that fertilisers are scarce and expensive. The contribution of milk to the nutritional status of
the farm family and its income generating capacity is viewed with a lot of satisfaction and
optimism for the future by the beneficiaries.
South–South Workshop 427
Contributions of HPI to small-scale dairy development in Cameroon

Marketing among other constraints (finance, health etc.) is the most important factor
determining the level of performance of the dairy enterprise. In the project area, the
marketing system is poorly organised and this keeps the production potential below
optimum despite the potential high demand for milk. The poor road infrastructure to some
of the production areas is a serious obstacle that cannot be remedied by HPI nor the farmers.
By the intervention of the government, paving such roads is under way so that they are more
suitable for milk collection for the ultimate solution. It is only at such a time that
SOTRAMILK milk processing enterprise can access all small-scale producers. The
marketing system should be restructured by clearly defining the role of SOTRAMILK and
by organising farmers in groups or co-operatives to integrate marketing aspects, especially
ensuring adequate volume of milk to be collected at each collection point.
The demand for milk and milk products under the current project executed by HPI far
exceeds production. Milk sales by small-scale dairy farmers (500 litres/day) and estimated daily
fresh milk consumption in Bamenda municipality alone not exceeds 2500 litres/day. At this
level of production, a small fraction of milk production is met by HPI small-scale farmers. The
imported dairy products available are very expensive. This has made the demand for fresh
milk even higher. To meet this high demand for milk by the rapidly growing population, and
still maximise the use of land for other development activities, a zero-grazing scheme with
properly trained and guided farmers can substantially solve this problem.
HPI is taking advantage of the existence of other institutions [Livestock Research
Institute, KOSSAM company, CAMLAIT and Ministry of Livestock] already involved in
milk production and marketing as an asset for the development of the dairy sector. Effective
and cohesive linkage amongst these institutions will go a long way in improving dairy
production and marketing both at national and regional levels. Such linkages would be
realised through the establishment of a consultative committee involving all stakeholders to
look into the problem of marketing. Cameroon has a large market in Nigeria [150 million
kg] that can absorb milk and milk products even when the needs of the country are satisfied.
Farmer groups through which HPI intervenes would be well organised to integrate both
the production and marketing of dairy products in their activities. Efforts by HPI in the past
to promote marketing of milk and milk products through the Bamenda Co-operative Dairy
Society (BCDS) failed as a result of mismanagement of funds by the executive. In fact, HPI
purchased and installed a mechanical milking and pasteurising unit with the collaboration
of the Livestock Research Institute, but it is not functional due to poor management. Five
years ago, the dairy farmers co-operatives were provided minor shares in SOTRAMILK by a
Dutch NGO called WILD GEESE, but the farmers co-operative have not been able to have
an influence in decision making. HPI is presently seeking ways of increasing the shares of
farmers to a level that will enable them influence decisions in SOTRAMILK. Recently, HPI
has started some efforts in Kenya aimed at improving the marketing of milk by smallholder
farmer co-operatives. Farmers’ co-operatives are involved in managing the milk collection
centres. Money has been invested in cooling tanks at collection points. A relatively small
effort has been started in Cameroon with funding from Rabobank Foundation in Holland.
We hope this will improve milk marketing significantly when all the cooling centres are
completely established.
428 South–South Workshop
Njwe et al.
From the observations made during the evaluation, demand for milk and milk products
is still very high and the supply is largely unsatisfactory in the project area and its immediate
environment. Only 5% of SOTRAMILK’s daily processing requirement of 20 thousand
litres per day is satisfied at the moment. SOTRAMILK has therefore no choice but to
reconstitute imported powder milk to meet current processing needs. Increase in milk
production by smallholder farmers in the region should gradually reduce the use of powder
milk.
Moreover, HPI milk programme is still the only organised and assisted sector of the fresh
milk production and distribution in the North-West Province and its immediate environ.
In order to facilitate access to smallholder farmers to financial services especially credit,
the following points should be taken into consideration:
• Smallholder dairy farmers’ savings can only finance on the average 19% of their
investment needs. This is a clear indication that they need external financing and the
necessity to intensify the existing micro-credit scheme.
• To improve on the existing micro-credit scheme, the philosophy behind group credit i.e.
moral guarantee would be exploited rather than the present focus on land title and other
assets that a group as an entity cannot present and thus limited access to credit.
The potential for savings mobilisation among farmers is not well targeted and fully
exploited. For a viable micro credit program, HPI would target farmer groups that have a
long history of existence and showing proof savings mobilisation and credit services,
internal cohesion and good governance.
Questions for discussionA. How can we organise the link between national and international research and
development organisations to stimulate sustainable market oriented small-scale dairy
development in third world countries?
B. How can we involve governments in dairy development in developing countries so that
they formulate favourable policies to support small-scale market oriented dairy
development?
C. How then can we best integrate small-scale dairying into existing production systems
without distorting traditional agricultural production patterns?
D. How can we cope with small-scale dairy development under a situation where human
population is rapidly growing; land holding per household is shrinking; and soil fertility
is declining?
E. How can we accelerate dairy development without the use of exotic parent stock that
required higher management and inputs?
F. How then can we develop a viable breeding scheme to serve scattered small-scale dairy
farms, and to improve conception rate and decrease the high male to female offspring
ratios produced from AI today?
South–South Workshop 429
Contributions of HPI to small-scale dairy development in Cameroon
ReferencesAtekwana J.A. and Maximuangu J.C. 1981. The performance of imported dairy cattle breeds in
Cameroon. Paper presented at the Sixth Meeting of the African Scientific Council, Libreville,Gabon.
Branton C., McDowell R.E. and Brown M.A. 1966. Zebu–European crossbreeding as basis of dairycattle improvement in the USA. Southern Co-operative series Bulletin 114. LouisianaAgricultural Experimental Station, Baton Rouge, USA. 39 pp.
CDC (Cameroon Development Co-operation) Report. Annual Reports 1954–56.
Crawford Capt. 1916. Report on Djutittsa, Dschang, farms. Unpublished report.
Duc N.V. and Taneja V.K. 1984. Comparative performance of purebred and crossbred grades inIndia. Journal of Animal Science 54(11):1023–1028.
Goldman M. and Pingpoh D. 1985. The cost of producing fresh pasteurised milk sold in Bamenda.North-West Province. Institute of Animal Research, Science and Technology Review. AnimalScience Series.
HPI (Heifer Project International)/Cameroon. 1999. Dairy evaluation report 1999. (unpublished).
IRZ (Institut de Recherche Zootechnique). 1984. Institut de Recherche Zootechnique. AnnualReport.
IRZV (Institute of Animal and Veterinary Research). 1990. Determining the research needs of theInstitute of Animal and Veterinary Research, Yaounde, Cameroon.
Kamga P., Tambi E. and Kamga P. 1987. Effect of elephant grass (Pennisetum purpureum) silage, fodderand Brachiaria pasture on milk production and composition: Income over feed cost in dairycattle. Annual synthetic report. Institute of Animal Research, Bambui, Cameroon.
Kiwuwa G.H., Trail J.C.M., Yousef M.K., Worku G., Anderson F.M. and Durkin J.W. 1983.Crossbred dairy cattle productivity in Arsi Region, Ethiopia. ILCA Research Report 11. ILCA(International Livestock Centre for Africa), Addis Ababa, Ethiopia. 29 pp.
Meyn K. and Wilkins J.V. 1974. Breeding for milk in Kenya with particular reference to the SahiwalStud. World Animal Review 11:24–30.
Njwe R.M. 1984. Provision of adequate animal protein to the Cameroon population by the year2000 AD: Problems and prospects. University Center of Dschang, Cameroon.
Sohael A.S. 1984. Milk production potential of cattle on the Jos Plateau. Nigerian Livestock Farmers
4(3):13–14.
Spencer Capt. 1915. Report on Buea farms. (unpublished report).
Tambi E.N. 1991. Dairy production in Cameroon: Growth, development, problems and solutions.World Animal Review 67(2):38–48.
430 South–South Workshop
Njwe et al.

Impact of integrated dairy and cropproduction technologies on smallholderdairy production in Haryana, IndiaB.N. Mathur and R.V. SinghNational Dairy Research Institute (NDRI), Indian Council of Agricultural Research (ICAR)Karnal 132001, India
The Indian rural economy is characterised by complex farming systems and by a diverse
environment and small resource base and by being risk prone. During the last four decades
biological researchers have made significant contributions to research and development of
transferable technologies in different farming systems. But most of these technologies are
capital intensive in nature and the benefit of agricultural research and development
activities has not reached all types of farming systems and all groups of the farmers
uniformly due to socio-economic and cultural differences. Moreover, adoption of any
technology depends upon its feasibility and suitability. A technology suitable for a particular
environment, biophysical and socio-economic setting, often referred to as a micro situation,
may not be an appropriate technology for other micro situations. So these technologies have
mainly benefited the resource rich farmers who have access to capital, inputs and output
markets. The smallholders (risk prone farmers) have lagged behind due to their poor
resource base, low availability of capital and other resources. Further, for the development
of appropriate technologies in agriculture and their successful adoption, knowledge of
present farming situations and of the problem is a pre-requisite. In other words, a
comprehensive farming systems approach is necessary for solving the problems of
smallholders.
Researchers often do not have a proper understanding of their problems and of the
environment of the smallholder, and there are weak linkages between the farmer and
extension functionaries. It was, therefore, considered necessary to evolve, develop and
transfer new technologies suitable to resource poor smallholders so that the benefits of
development could be evenly distributed. For rural transformation social aspects are as
important as technological aspects, and so the technologies evolved by different research
institutions should be simultaneously tackled from social, economic, administrative,
organisational and technical angles. With this in view, initiation of the Operational
Research Project was recommended by the Working Group, which formulated the Fifth
Five Year Plan of the Indian Council of Agricultural Research (ICAR). The project was
expected to introduce science based land, animal and water management plans so that
farming communities and smallholders could derive the maximum economic benefits with
minimum risk and instability.
South–South Workshop 431

Project programme of National Dairy ResearchInstitute (NDRI), KarnalThe National Dairy Research Institute (NDRI), Karnal embarked upon an Operational
Research Project in June 1975 on ‘Integrated milk and crop production for increased
productivity, employment and farm income in the villages around Karnal’. The project,
based on an integrated area development approach, collaborated with nationalised banks,
livestock insurance companies, dairy plants, agricultural universities and research
institutes, extension agencies, local administration, village punchayats (village councils) and
the farmers of the area.
The project aimed at increasing employment and income levels of the farmers in general
and weaker sections in particular through the transfer of new technology pertaining to dairy
and crop enterprises in the mixed farming systems. Commensurate with the objectives of
the project and felt needs of the people, two major action programmes were formulated on
the basis of the findings of the informal and formal benchmark surveys conducted at the
start of the project. These were the Dairy Development Programme and Crop Productivity
Improvement Programme.
In the sphere of Dairy Development Programme, the project established a network of
Dairy Vikas Kendras (DVKs) in the adopted villages with the co-operation of the village
punchayats. The (DVKs) served as the nerve centre for all the development activities of the
project like artificial insemination, pregnancy diagnosis, examination and treatment of
animals for various reproductive disorders and other ailments, vaccinations against
contagious diseases such as Foot-and-Mouth Disease, Haemorrhagic Septicaemia,
Rinderpest and Black Quarter (Black leg). The farmers were also educated about various
improved management practices on rearing of calves, balanced feeding, tick control
measures and rational use of fertilisers and various plant protection chemicals. In addition,
on-farm animal research trials were conducted to test and evaluate dairy production
technologies.
The objective of Crop Productivity Improvement Programme was to increase per
hectare yields of various cereals, fodder crops, pulses, oil-seeds and cash crops through the
introduction of high yielding varieties (HYVs) and to recommend package of practices in
the project area. This was achieved through conducting crop demonstrations and on-farm
crop research trials mostly on small dairy holdings and making available various critical
inputs like HYV seeds, fertilisers and plant protection chemicals.
A method of systematic record keeping was introduced to facilitate continuous
monitoring of the progress of various dairy and crop production activities. Primary village
surveys of all the households and socio-economic surveys of sample households were
conducted in the project villages at suitable intervals for objective evaluation of the
technology transfer programmes. Besides, exploratory and focussed rapid rural appraisals
(RRAs) were also conducted to deal with various issues pertaining to dairy and crop
production.
432 South–South Workshop
Mathur and Singh

ObjectivesIntegration of activities and co-ordination of resources and research organisations form the
important ingredients of the project. In view of the fact that a large proportion of milch
animals are owned by the farmers with a weaker resource base, efforts to bring about
improvement in dairy and crop production could bring about socio-economic change in the
project area. Therefore, the objectives of the project were as below:
• to demonstrate and test the applicability of the improved packages of dairy farming
practices on different size of farm holdings,
• to demonstrate the multiple cropping system of raising three or more crops in a year,
• to provide an insight to the scientists of the problems involved in the application of new
technologies under field conditions, and
• to estimate the magnitude of additional income and employment generated in the study
area.
Organisation and approachIt was considered that the best way for the project to succeed was to have a compact area of
operation and organisation so that various programmes could be effectively implemented
and at the same time the cost of administration and operation of the project would not
become heavy.
Area of operationBased on the needs of the farmers and their attitude and response towards the project
programmes, a modest beginning was made with the adoption of nine villages in Karnal
district in 1975. The programme evoked a positive response from the villages, which
eventually led to subsequent adoption into the project of 40 villages within a radius of 35
km. These 40 villages formed a contiguous area and were divided into 4 clusters falling in
three development blocks of Karnal district. Each cluster had a headquarter village for
directing and controlling the programme.
Criteria for selection of villagesVarious criteria were laid down and fixed for the selection of villages. For instance, the
proximity of a village to NDRI, Karnal was considered an essential criterion for increasing
the operational efficiency of the scientists. The villages, which were not covered by any other
extension agency and offered virgin field for work, were selected so that duplication of
services and facilities could be avoided. Villages which had more co-operative and
responsive farmers willing to provide working space for the staff and to store various
equipments and critical inputs were given preference in the selection.
South–South Workshop 433
Impact of integrated dairy and crop production technologies on smallholder dairy, India

Staffing patternA principal scientist (Agricultural Economist) headed the project team, which consisted of
scientists, technicians and administrative and supporting staff. The positions originally
provided by the Indian Council of Agricultural Research (ICAR) comprised a project officer
and four subject matter specialists representing four different disciplines such as agronomy,
animal health, farm management and extension education. Two senior research assistants
were provided to undertake the collection, tabulation and analysis of data for monitoring the
progress and evaluation of the programme. Besides, four stockmen and four field-men were
provided to look after cattle development and crop improvement work, respectively, at the
village level. Other ancillary staff provided in the project included a driver and administrative
personnel. However, the staff positions underwent changes from time to time and were
strengthened, particularly in the technical cadre, due to the expansion of the area of operation
so that the benefits of the project’s programme could be uniformly distributed.
LinkagesThe Operational Research Project of , Karnal was an integrated development project. It
integrated various dairy and crop enterprises on the one hand in the mixed farming systems,
and with different institutions and agencies on the other. It was realised that integration and
co-ordination are extremely important ingredients of project management for the desired
success of the programme. Therefore, the project had close linkages with various institutions
and organisations at village, district, state, national and international levels.
Technology transferredThe project aimed at increasing employment and income levels of farmers in general, and
from the weaker section in particular, through the transfer of new technologies pertaining
to dairy and crop enterprises in mixed farming systems. Various new technologies on
dairying and crop production were identified and transferred in different farming systems
through on-farm trials. The list of technologies transferred in the project are given below.
Technologies transferred through the dairy developmentprogramme• genetic improvement through crossbreeding/upgrading of nondescript cows and buffalo
• prevention and control of contagious diseases
• efficacy of degcure mixture (a mineral mixture rich in sulphate used as a feed
supplement) for the control and treatment of dagnella disease (selenium toxicity found
mostly in buffaloes in northern parts of India).
• improved feeding of high yielding milch animals
• enrichment of crude forages through urea treatment and
• scientific management of reproductive disorders in dairy animals.
434 South–South Workshop
Mathur and Singh
Technologies transferred through the crop improvementprogramme• introduction of new fodder varieties and rotations to meet green fodder supply round
the year
• introduction of new cropping systems
• improvement of productivity of fodder, cereal, pulse and oil seed crops
• diversification of farm production on smallholder farms
• optimum use of fertilisers and plant protection chemicals in different crops and
• testing and multiplication of new and high yielding varieties of different crops.
MethodologyIn order to study the existing farming systems faced by the farmers, informal surveys in the
form of group discussions with punchayat’s members and farmers were conducted at the
time of the adoption of a village. In-depth formal surveys, such as benchmark and
socio-economic surveys, were also conducted.
Benchmark surveysWith a view to examining the existing situation of the farms and farmers for planning
various development programmes in the project villages and evaluating the impact of the
project programmes after suitable intervals, benchmark surveys were conducted in the
selected villages. Data on parameters pertaining to dairy and crop enterprises were collected
for the period 1974–75. In all, 653 small dairy holders were interviewed under the
benchmark survey.
Socio-economic surveyThe socio-economic and repeat surveys were conducted in the adopted villages of the
project in order to assess the impact of the programme on farm economies. Before and after
(BA) and with and without (W&W) approaches were followed to evaluate the impact of the
programme on various parameters. The reference year for these surveys was 1995–96.
Methodology for impact evaluationIn order to evaluate the project and examine the impact of technology transfer programmes
on various parameters, a multi-stage stratified random sampling technique was followed for
selecting the sample households from extension and control areas. For the selection of
extension villages, one village from each of the four clusters of the project villages, falling in
the three blocks was randomly selected. A complete list of all the households of the selected
South–South Workshop 435
Impact of integrated dairy and crop production technologies on smallholder dairy, India
villages along with relevant details like size of land and cattle holdings was prepared. The
number of dairy animals owned by smallholders varied from 1 to 10 milch animals. These
small households were then classified into five groups viz. group I = landless; group II = land
up to 1 ha; group III = land from 1 to 2 ha; group IV = land from 2 to 4 ha and group V = land
above 4 ha.
Production traits of milch animalsProduction traits of milch animals play a crucial role and have a profound influence on the
cost and returns of any dairy enterprise. Important traits like age at first calving, days in milk,
dry days, inter-calving period, proportion of milking and dry animals and the milk yield of
the animals have been considered.
Age at first calvingLate maturity of dairy animals, resulting in the high cost of rearing the animals to the age of
first calving, is one of the major causes for the uneconomic nature of dairying in India. The
age at first calving is governed by biological factors like age at maturity and conception rate,
which are again influenced by breeding, feeding, management and environmental factors.
The average age at first calving was highest for local cattle followed by buffalo and lowest for
crossbred cattle. In general, for the study area as a whole, the average age at first calving for
the buffalo, crossbred cattle and local cattle was found to be 48, 37 and 49 months,
respectively. In general, the age at first calving of buffalo and crossbred cows increased with
the increase in the size group of farms.
Lactation length, dry days and inter-calving periodThe lactation length affects the total milk production and consequently the returns from
the dairy animals. The longer and prolonged dry period puts the dairy farmer in a
disadvantageous position since the animals are to be fed and taken care of during this period
too, increasing the cost of maintenance. The inter-calving period is the sum of days in milk
and dry days or the period between two successive calvings. Short inter-calving periods leads
to higher numbers of lactations in the production life of animals, which results in higher
income from the sale of milk and animals.
During the inter-calving period of 446 days, buffalo remained in milk for about 309 days
and were dry for about 137 days. The lactation length reported in the study area was 336
days in 1974–75. The dry days in the respective period were observed to be 210 days. The
inter-calving period during the period was 546 days. This showed that over a period of time,
there was a marked decrease in dry period and the inter-calving period, which could be
attributed to the technological changes introduced.
In the case of crossbred cattle during the inter-calving period of 415 days, the animals
were in milk for 300 days and dry for another 115 days. The results of the study conducted
earlier in the same area revealed that the animals yielded milk for 357 days and were dry for
436 South–South Workshop
Mathur and Singh
113 days, the inter-calving period being 470 days. The present study showed that the
inter-calving period has decreased due to the impact of advanced new technologies.
Local cattle yielded milk for 327 days and were dry for 179 days, the inter-calving period
being 506 days. The inter-calving period reported in the same area during 1974–75 was 495
days, which is in close proximity to the results obtained in the present study. The average dry
period in the same period too was found to be 199 days, which is higher than the present
investigation.
This all showed that the technological changes have resulted in lowering the dry period
and the inter-calving period of buffalo and crossbred cattle, but with little effect on local cattle.
Proportion of animals in milk and dryThe quantity of milk production on a dairy farm does not depend upon the total number of
animals present in the herd, but on the animals in milk. The economics of milk production
is based upon the fact that the higher the proportion of animals in milk, the lower the cost of
milk production. The proportion of animals in milk and dry among buffalo, crossbred
cattle and local cattle showed that during the year, 64% buffalo, 70% crossbred cattle and
52% of local cattle were in milk, whereas the remaining 36, 30 and 48% were dry.
Impact of technology transfer programmeThe examination of impact of evaluation of dairy and crop production technologies
transferred in the adopted villages on parameters like animal and crop productivity along
with gap and human labour absorption in dairy and crop farming systems are discussed in
this section.
Productivity of milch animalsProductivity of milch animals is of vital importance to cattle keepers because it has direct
influence on the costs and returns from dairy farming systems. Therefore, average milk yield
of lactating and milch animals of different species was worked out for the project area and
compared with that of animals in the control area, as well as with the benchmark period
(Table 1).
The average milk yield per day of lactating and milch animals of different species in the
project area were higher than those of control area and the benchmark period. The average
annual change in milk yield of local milch cows, buffalo and crossbred cows of the project
area was 7.97, 2.77 and 1.74%, respectively, over the benchmark period. Interestingly, the
average milk yields of milch animals in the project area were also higher than those of
control area. This could be mainly attributed to their poor feeding and management along
with non-adoption of improved technologies for milk production in the control area. Thus,
it can be concluded that transfer of new technologies had a positive impact on the
productivity of milch animals.
South–South Workshop 437
Impact of integrated dairy and crop production technologies on smallholder dairy, India
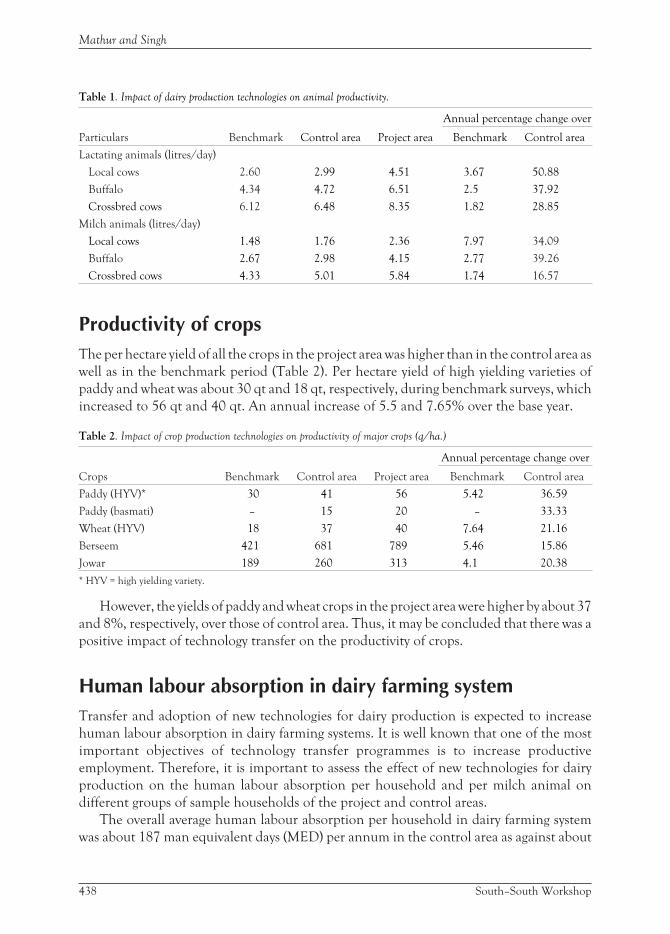
Table 1. Impact of dairy production technologies on animal productivity.
Particulars Benchmark Control area Project area
Annual percentage change over
Benchmark Control area
Lactating animals (litres/day)
Local cows 2.60 2.99 4.51 3.67 50.88
Buffalo 4.34 4.72 6.51 2.5 37.92
Crossbred cows 6.12 6.48 8.35 1.82 28.85
Milch animals (litres/day)
Local cows 1.48 1.76 2.36 7.97 34.09
Buffalo 2.67 2.98 4.15 2.77 39.26
Crossbred cows 4.33 5.01 5.84 1.74 16.57
Productivity of cropsThe per hectare yield of all the crops in the project area was higher than in the control area as
well as in the benchmark period (Table 2). Per hectare yield of high yielding varieties of
paddy and wheat was about 30 qt and 18 qt, respectively, during benchmark surveys, which
increased to 56 qt and 40 qt. An annual increase of 5.5 and 7.65% over the base year.
Table 2. Impact of crop production technologies on productivity of major crops (q/ha.)
Crops Benchmark Control area Project area
Annual percentage change over
Benchmark Control area
Paddy (HYV)* 30 41 56 5.42 36.59
Paddy (basmati) – 15 20 – 33.33
Wheat (HYV) 18 37 40 7.64 21.16
Berseem 421 681 789 5.46 15.86
Jowar 189 260 313 4.1 20.38
* HYV = high yielding variety.
However, the yields of paddy and wheat crops in the project area were higher by about 37
and 8%, respectively, over those of control area. Thus, it may be concluded that there was a
positive impact of technology transfer on the productivity of crops.
Human labour absorption in dairy farming systemTransfer and adoption of new technologies for dairy production is expected to increase
human labour absorption in dairy farming systems. It is well known that one of the most
important objectives of technology transfer programmes is to increase productive
employment. Therefore, it is important to assess the effect of new technologies for dairy
production on the human labour absorption per household and per milch animal on
different groups of sample households of the project and control areas.
The overall average human labour absorption per household in dairy farming system
was about 187 man equivalent days (MED) per annum in the control area as against about
438 South–South Workshop
Mathur and Singh
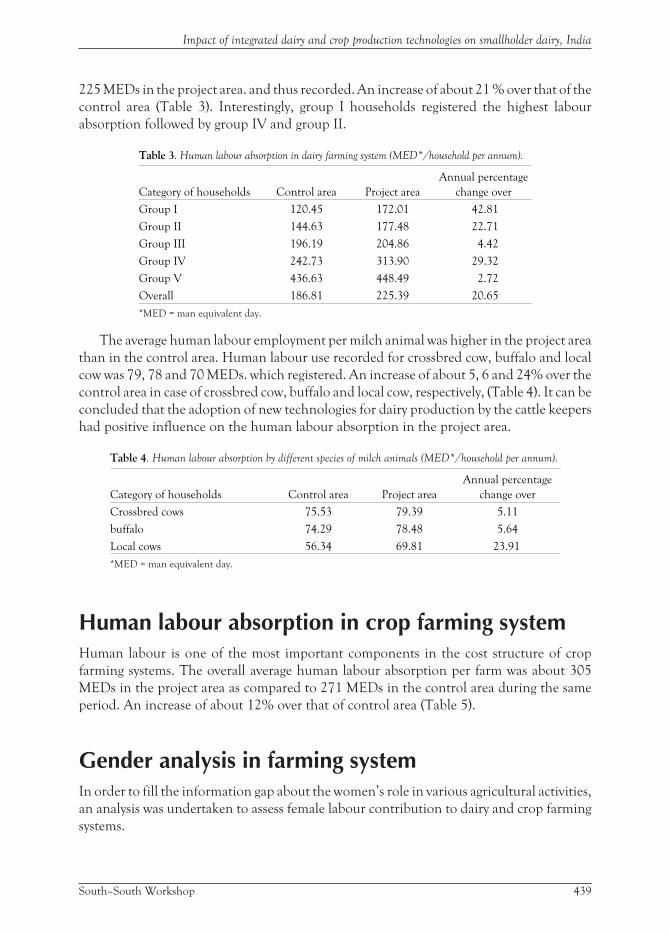
225 MEDs in the project area. and thus recorded. An increase of about 21 % over that of the
control area (Table 3). Interestingly, group I households registered the highest labour
absorption followed by group IV and group II.
Table 3. Human labour absorption in dairy farming system (MED*/household per annum).
Category of households Control area Project area
Annual percentage
change over
Group I 120.45 172.01 42.81
Group II 144.63 177.48 22.71
Group III 196.19 204.86 4.42
Group IV 242.73 313.90 29.32
Group V 436.63 448.49 2.72
Overall 186.81 225.39 20.65
*MED = man equivalent day.
The average human labour employment per milch animal was higher in the project area
than in the control area. Human labour use recorded for crossbred cow, buffalo and local
cow was 79, 78 and 70 MEDs. which registered. An increase of about 5, 6 and 24% over the
control area in case of crossbred cow, buffalo and local cow, respectively, (Table 4). It can be
concluded that the adoption of new technologies for dairy production by the cattle keepers
had positive influence on the human labour absorption in the project area.
Table 4. Human labour absorption by different species of milch animals (MED*/household per annum).
Category of households Control area Project area
Annual percentage
change over
Crossbred cows 75.53 79.39 5.11
buffalo 74.29 78.48 5.64
Local cows 56.34 69.81 23.91
*MED = man equivalent day.
Human labour absorption in crop farming systemHuman labour is one of the most important components in the cost structure of crop
farming systems. The overall average human labour absorption per farm was about 305
MEDs in the project area as compared to 271 MEDs in the control area during the same
period. An increase of about 12% over that of control area (Table 5).
Gender analysis in farming systemIn order to fill the information gap about the women’s role in various agricultural activities,
an analysis was undertaken to assess female labour contribution to dairy and crop farming
systems.
South–South Workshop 439
Impact of integrated dairy and crop production technologies on smallholder dairy, India
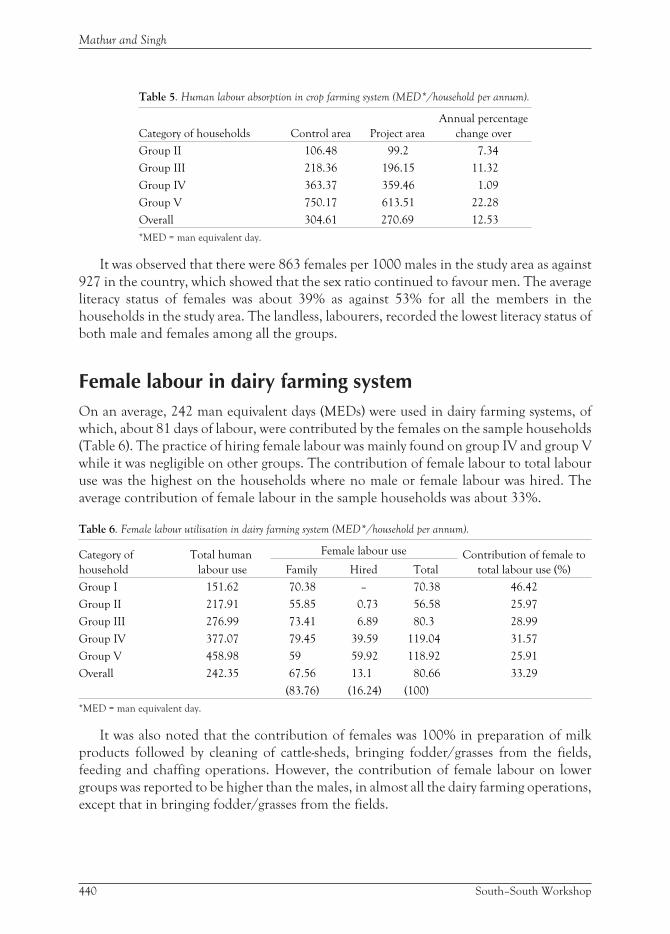
Table 5. Human labour absorption in crop farming system (MED*/household per annum).
Category of households Control area Project area
Annual percentage
change over
Group II 106.48 99.2 7.34
Group III 218.36 196.15 11.32
Group IV 363.37 359.46 1.09
Group V 750.17 613.51 22.28
Overall 304.61 270.69 12.53
*MED = man equivalent day.
It was observed that there were 863 females per 1000 males in the study area as against
927 in the country, which showed that the sex ratio continued to favour men. The average
literacy status of females was about 39% as against 53% for all the members in the
households in the study area. The landless, labourers, recorded the lowest literacy status of
both male and females among all the groups.
Female labour in dairy farming systemOn an average, 242 man equivalent days (MEDs) were used in dairy farming systems, of
which, about 81 days of labour, were contributed by the females on the sample households
(Table 6). The practice of hiring female labour was mainly found on group IV and group V
while it was negligible on other groups. The contribution of female labour to total labour
use was the highest on the households where no male or female labour was hired. The
average contribution of female labour in the sample households was about 33%.
Table 6. Female labour utilisation in dairy farming system (MED*/household per annum).
Category of
household
Total human
labour use
Female labour use Contribution of female to
total labour use (%)Family Hired Total
Group I 151.62 70.38 – 70.38 46.42
Group II 217.91 55.85 0.73 56.58 25.97
Group III 276.99 73.41 6.89 80.3 28.99
Group IV 377.07 79.45 39.59 119.04 31.57
Group V 458.98 59 59.92 118.92 25.91
Overall 242.35 67.56 13.1 80.66 33.29
(83.76) (16.24) (100)
*MED = man equivalent day.
It was also noted that the contribution of females was 100% in preparation of milk
products followed by cleaning of cattle-sheds, bringing fodder/grasses from the fields,
feeding and chaffing operations. However, the contribution of female labour on lower
groups was reported to be higher than the males, in almost all the dairy farming operations,
except that in bringing fodder/grasses from the fields.
440 South–South Workshop
Mathur and Singh
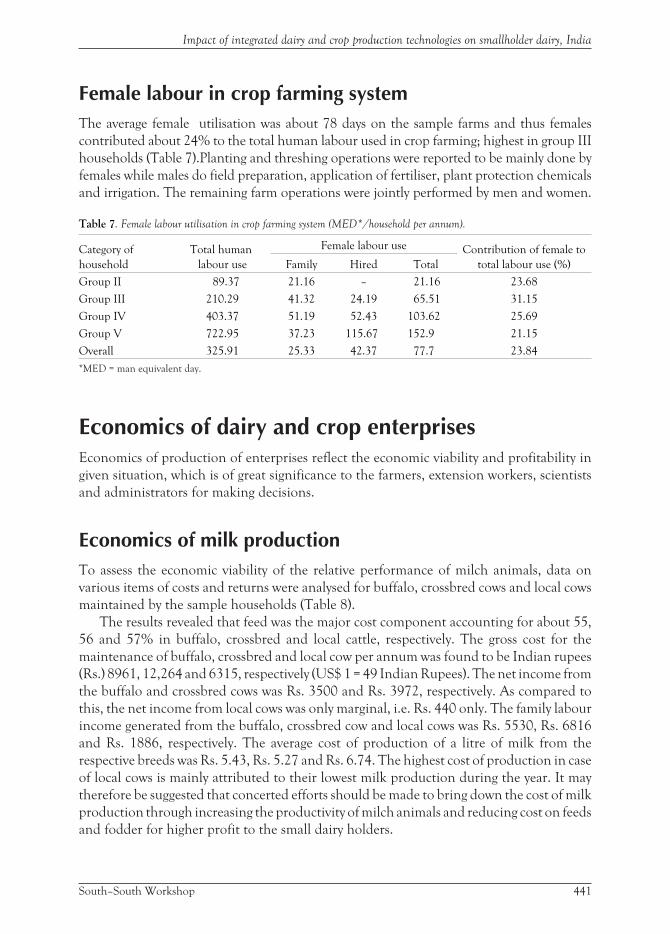
Female labour in crop farming systemThe average female utilisation was about 78 days on the sample farms and thus females
contributed about 24% to the total human labour used in crop farming; highest in group III
households (Table 7).Planting and threshing operations were reported to be mainly done by
females while males do field preparation, application of fertiliser, plant protection chemicals
and irrigation. The remaining farm operations were jointly performed by men and women.
Table 7. Female labour utilisation in crop farming system (MED*/household per annum).
Category of
household
Total human
labour use
Female labour use Contribution of female to
total labour use (%)Family Hired Total
Group II 89.37 21.16 – 21.16 23.68
Group III 210.29 41.32 24.19 65.51 31.15
Group IV 403.37 51.19 52.43 103.62 25.69
Group V 722.95 37.23 115.67 152.9 21.15
Overall 325.91 25.33 42.37 77.7 23.84
*MED = man equivalent day.
Economics of dairy and crop enterprisesEconomics of production of enterprises reflect the economic viability and profitability in
given situation, which is of great significance to the farmers, extension workers, scientists
and administrators for making decisions.
Economics of milk productionTo assess the economic viability of the relative performance of milch animals, data on
various items of costs and returns were analysed for buffalo, crossbred cows and local cows
maintained by the sample households (Table 8).
The results revealed that feed was the major cost component accounting for about 55,
56 and 57% in buffalo, crossbred and local cattle, respectively. The gross cost for the
maintenance of buffalo, crossbred and local cow per annum was found to be Indian rupees
(Rs.) 8961, 12,264 and 6315, respectively (US$ 1 = 49 Indian Rupees). The net income from
the buffalo and crossbred cows was Rs. 3500 and Rs. 3972, respectively. As compared to
this, the net income from local cows was only marginal, i.e. Rs. 440 only. The family labour
income generated from the buffalo, crossbred cow and local cows was Rs. 5530, Rs. 6816
and Rs. 1886, respectively. The average cost of production of a litre of milk from the
respective breeds was Rs. 5.43, Rs. 5.27 and Rs. 6.74. The highest cost of production in case
of local cows is mainly attributed to their lowest milk production during the year. It may
therefore be suggested that concerted efforts should be made to bring down the cost of milk
production through increasing the productivity of milch animals and reducing cost on feeds
and fodder for higher profit to the small dairy holders.
South–South Workshop 441
Impact of integrated dairy and crop production technologies on smallholder dairy, India
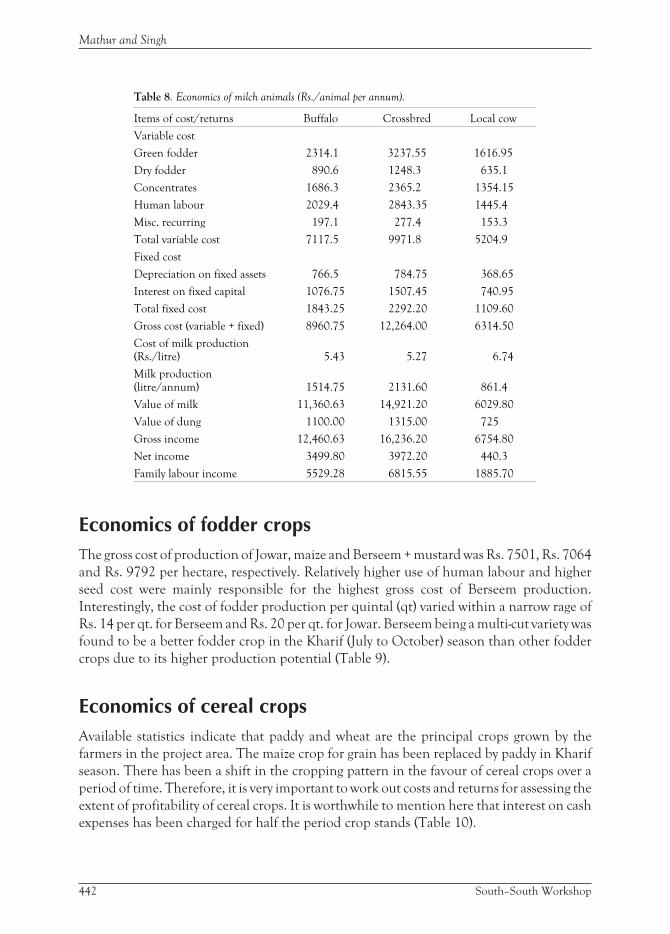
Table 8. Economics of milch animals (Rs./animal per annum).
Items of cost/returns Buffalo Crossbred Local cow
Variable cost
Green fodder 2314.1 3237.55 1616.95
Dry fodder 890.6 1248.3 635.1
Concentrates 1686.3 2365.2 1354.15
Human labour 2029.4 2843.35 1445.4
Misc. recurring 197.1 277.4 153.3
Total variable cost 7117.5 9971.8 5204.9
Fixed cost
Depreciation on fixed assets 766.5 784.75 368.65
Interest on fixed capital 1076.75 1507.45 740.95
Total fixed cost 1843.25 2292.20 1109.60
Gross cost (variable + fixed) 8960.75 12,264.00 6314.50
Cost of milk production(Rs./litre) 5.43 5.27 6.74
Milk production(litre/annum) 1514.75 2131.60 861.4
Value of milk 11,360.63 14,921.20 6029.80
Value of dung 1100.00 1315.00 725
Gross income 12,460.63 16,236.20 6754.80
Net income 3499.80 3972.20 440.3
Family labour income 5529.28 6815.55 1885.70
Economics of fodder cropsThe gross cost of production of Jowar, maize and Berseem + mustard was Rs. 7501, Rs. 7064
and Rs. 9792 per hectare, respectively. Relatively higher use of human labour and higher
seed cost were mainly responsible for the highest gross cost of Berseem production.
Interestingly, the cost of fodder production per quintal (qt) varied within a narrow rage of
Rs. 14 per qt. for Berseem and Rs. 20 per qt. for Jowar. Berseem being a multi-cut variety was
found to be a better fodder crop in the Kharif (July to October) season than other fodder
crops due to its higher production potential (Table 9).
Economics of cereal cropsAvailable statistics indicate that paddy and wheat are the principal crops grown by the
farmers in the project area. The maize crop for grain has been replaced by paddy in Kharif
season. There has been a shift in the cropping pattern in the favour of cereal crops over a
period of time. Therefore, it is very important to work out costs and returns for assessing the
extent of profitability of cereal crops. It is worthwhile to mention here that interest on cash
expenses has been charged for half the period crop stands (Table 10).
442 South–South Workshop
Mathur and Singh
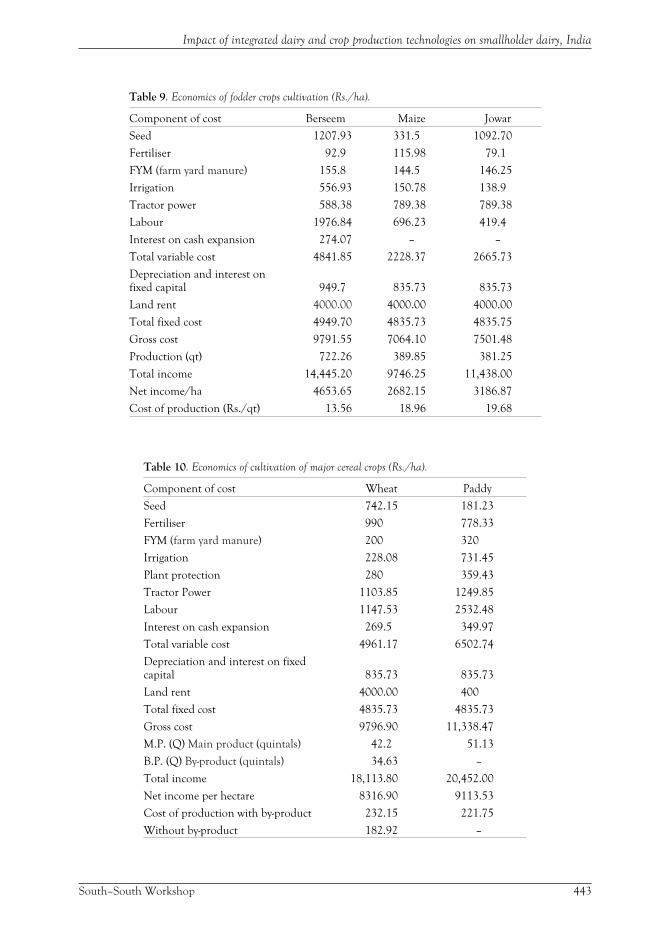
Table 9. Economics of fodder crops cultivation (Rs./ha).
Component of cost Berseem Maize Jowar
Seed 1207.93 331.5 1092.70
Fertiliser 92.9 115.98 79.1
FYM (farm yard manure) 155.8 144.5 146.25
Irrigation 556.93 150.78 138.9
Tractor power 588.38 789.38 789.38
Labour 1976.84 696.23 419.4
Interest on cash expansion 274.07 – –
Total variable cost 4841.85 2228.37 2665.73
Depreciation and interest onfixed capital 949.7 835.73 835.73
Land rent 4000.00 4000.00 4000.00
Total fixed cost 4949.70 4835.73 4835.75
Gross cost 9791.55 7064.10 7501.48
Production (qt) 722.26 389.85 381.25
Total income 14,445.20 9746.25 11,438.00
Net income/ha 4653.65 2682.15 3186.87
Cost of production (Rs./qt) 13.56 18.96 19.68
Table 10. Economics of cultivation of major cereal crops (Rs./ha).
Component of cost Wheat Paddy
Seed 742.15 181.23
Fertiliser 990 778.33
FYM (farm yard manure) 200 320
Irrigation 228.08 731.45
Plant protection 280 359.43
Tractor Power 1103.85 1249.85
Labour 1147.53 2532.48
Interest on cash expansion 269.5 349.97
Total variable cost 4961.17 6502.74
Depreciation and interest on fixedcapital 835.73 835.73
Land rent 4000.00 400
Total fixed cost 4835.73 4835.73
Gross cost 9796.90 11,338.47
M.P. (Q) Main product (quintals) 42.2 51.13
B.P. (Q) By-product (quintals) 34.63 –
Total income 18,113.80 20,452.00
Net income per hectare 8316.90 9113.53
Cost of production with by-product 232.15 221.75
Without by-product 182.92 –
South–South Workshop 443
Impact of integrated dairy and crop production technologies on smallholder dairy, India
The total cost of production of HYVs of paddy and wheat crops was Rs. 11,338 and Rs.
9797 per hectare, respectively. The land rent was the major item of cost followed by human
labour, tractor power, fertilisers, depreciation, interest and manure in case of HYVs of
paddy and wheat crop. The net income per hectare from paddy crop was Rs. 9114 as
compared to Rs. 2317 per hectare of wheat. The cost of production of paddy was Rs. 222 per
quintal while it was Rs. 232 for wheat.
ConclusionThe two major planks of the project programme were the improvement in cattle
development and crop productivity. The project had great impact on development of dairy
and crop production systems, particularly for smallholders. It is interesting to note that
44,377 crossbred calves were born during 20 years of operation in the project area. Annual
percentage increase in the productivity of buffalo and crossbred animals was prominent
factor to provide income to smallholders. Animals worth of Rs. 278 lakhs were sold, 66
percent by smallholder farmers, the weaker group of farmers. The milk production of local
cows, buffalo and crossbred cows increased markedly in the project areas as compared to
control areas. Productivity of wheat and paddy improved in project area as compared to
control area by 36 and 33%, in Berseem and Jowar by 17 and 20%, respectively. Similarly
the transfer and adoption of improved technologies for dairy and crop production
increased the human labour employment on all the groups of households. It may be
concluded that the transfer and adoption of new technologies in dairy and crop production
system had a positive and significant influence on the productivity of milch animals and
crops, human labour employment and farm income on smallholders.
Based on the experiences gained in the project, it is suggested that the working model for
all round development of smallholders dairy production should be developed and
multiplied in different agro-climatic zones of the country. As was practised in the
Operational Research Project of NDRI the model should provide regular artificial
insemination services and health care facilities at the doorsteps of the farmers and dairy and
crop production advisory services under one roof for the rapid increase in income and
productivity of smallholder dairy farmers.
Further, it is suggested that for increasing productivity and income for small dairy
holders, the following policy interventions should be considered:
• the cow milk prices, especially of crossbreeds, being offered by public and private sector
dairy plants and milk vendors are very low. This is an impediment in the implementation
of crossbreeding programmes. Therefore, there is a need to evolve and implement a
rational milk pricing policy. A minimum support price of cow milk should be fixed
• there is need to formulate a suitable policy regarding crop and livestock insurance to
safeguard against the natural calamities as well as mortality due to contagious diseases
• for strengthening the crop–livestock production system, it would be expedient to
facilitate easiest access to availability of finances and
• seed production and multiplication should be taken up more vigorously in different
agro-climatic zones to meet an increasing demand for seed of different fodder crops.
444 South–South Workshop
Mathur and Singh
Decentralisation of services in Uganda: Theformation of National Agricultural AdvisoryServices (NAADS)1
S.M. NahdyKawanda Agricultural Research InstituteP.O. Box 7065, Kampala, Uganda
Introduction
Background to the National Agricultural Advisory Servicesprogramme designSince 1987, Uganda has made several advances in macro-economic and development
reforms which have brought annual inflation down from 240% in 1985 to a stable single
digit average of 6%, national economic growth of about 5% per annum and a growth of the
monetary sector of 9% in the last decade (PEAP 1997). The country is now acknowledged as
one of the few in sub-Saharan Africa making real progress towards economic development
and assurance of social equity. Indeed, Uganda is the first country to receive Naples terms in
a final settlement with the Paris Club Creditors involving a reduction in the stock of debt
rather than restructuring of debt service due.
In spite of these remarkable advances, Uganda’s population remains largely poor, with
gross domestic product per capita averaging only about US$ 330 and at least 40% of the
people living in absolute poverty (PEAP 1997). The economy remains largely dependent on
donor assistance and on agriculture for both food self-sufficiency and foreign exchange
earnings. The economic gains have also generally not been matched by social or welfare
advances. Thus, although the absolute poverty rate in Uganda has declined substantially
from 56% in 1992 to 44% in 1997, not everyone has benefited, especially the rural poor
who have remained outside the monetary economy, mainly producing for subsistence
(PMA 2000). Food crops production still accounts for at least 65% of agricultural GDP of
which livestock accounts for 16%, yet agriculture continues to be characterised by low
productivity. The challenges of rural economic transformation and poverty eradication are
thus linked to progress in the agricultural sector (PMA 2000).
In response to the above poverty and rural development challenges, the government
designed a comprehensive medium term economic development action plan called the
Poverty Eradication Action Plan (PEAP) in 1997. The major objective of PEAP is
eradicating mass poverty, raising smallholder farmer household incomes and improving the
South–South Workshop 445
1. Paper presented at workshop by Mr Joseph Nsereko.

quality of life of the majority of the population. The primary strategy is to increase earnings
from productive employment, including self-employment, with active participation by all in
economic decision-making. Strong emphasis was placed on liberalisation and privatisation
of supply of goods and services delivery and on the progressive commercialisation of public
service provision. PEAP is being supported by the donor community, through the Highly
Indebted Countries Initiative (HIPC) for debt forgiveness, among others. These resources
are being channelled to the social sector, with focus on primary health care, primary
education, rural feeder roads, water and sanitation and agricultural extension all of which
manifest a poverty focus. The agricultural transformation process is being guided by the
Plan for the Modernisation of Agriculture (PMA), designed to drive agriculture away from
predominantly subsistence to commercial farming. The plan aims to overcome the key
factors undermining agricultural productivity, namely: poor husbandry, low use of
improved inputs, limited access to technical advice, poor access to credit, poor transport,
communication and marketing infrastructures and insecure land tenure rights. Based on
these needs, five programmes were identified for development and implementation,
principal amongst which is the National Agricultural Advisory Services (NAADS)
programme.
The rationale for the NAADS programme is the failure of the traditional extension
approach to bring about greater productivity and expansion of agriculture, despite costly
government interventions. The fundamental aim of the programme is to develop a
decentralised, demand-driven, client-oriented and farmer-led agricultural service delivery
system particularly targeting the poor and the women. The NAADS programme was
prepared by a government task force, which consulted very widely with local governments,
NGOs and other key stakeholders. It also worked in concert with, and got support from the
Joint Donor Agriculture Sector Support Group in Uganda. Thus, wide consensus on
strategy and implementation arrangement was achieved.
Source of material used in the studyCore materials used in the study include the following;
• The Poverty Eradication Action Plan (PEAP 1997), which provides the strategic
framework for poverty eradication in Uganda
• The Plan for the Modernisation of Agriculture (PMA 2000), which provides strategies
and principles for agricultural transformation
• The Strategic Framework on Agricultural Extension 1999, which lays down the strategic
framework under which the agricultural extension in Uganda will operate, within the
context of both the PEAP and the PMA and
• The National Agricultural Advisory Services (NAADS 2000) programme document,
which provides implementation plan and guidelines for a demand driven, client-
oriented and farmer-led agricultural advisory services.
446 South–South Workshop
Nahdy

Designing the strategic framework andimplementation arrangement for NAADS
The agricultural sector overview from PMA perspectiveAgriculture in Uganda has grown steadily (over 4% per annum) over the past ten years.
According to the PMA (2000), this growth has accompanied a profound re-orientation of the
public sector’s role in the agricultural economy. This included significant liberalisation of the
agricultural economy and complementary institutional reforms that downsized, privatised,
and decentralised public agricultural institutions. The main sources of agricultural growth
over the past ten years—expansion of area under cultivation and the gains from the
government policy of liberalisation of the economy, which resulted in substantial
improvements of incentives for farmers to produce—have largely been exhausted as sources of
sustained growth. While area expansion will continue for some time, land is becoming
increasingly scarce and continued expansion will not be able to keep pace with population
growth. Even if it were possible, the growth impact of area expansion, by its very nature, would
diminish over time because, among other things, it is primarily marginal and remote lands
that are available for exploitation. Consequently, area expansion by itself will not be sufficient
to maintain rural per capita incomes even at their present levels. Uganda has therefore to look
to other sources of growth for the agricultural sector if rural development is to continue.
According to the PMA (2000), the two possible sources of growth for consideration are:
a) increases in land and labour productivity; and, b) a shift in production patterns from
low-value staples to higher-value commodities. Growth in the last two decades has occurred
without substantial contribution from either of the two. Since the sixties, productivity of
both land and labour suffered precipitous declines while production patterns have
exhibited a structural shift towards relatively low-valued food crops. There is, therefore,
great scope for improvement on both counts. The analysis underlying the PMA suggests that
the low productivity observed in Ugandan agriculture today is not the consequence of a lack
of research or extension activity, but attributed to poorly functioning farmer–extension–
research linkages and the consequent failure of the research and extension systems to
effectively respond to the real needs of the farmers.
On the basis of the above, the government formulated a Plan for the Modernisation of
Agriculture (PMA), which assigns first priority on achieving greater relevance and
effectiveness in both the research and extension programmes. Emphasis is placed not only
on enhancing extension and research efforts but doing so under institutional arrangements
that have been transformed to ensure effectiveness and increased responsiveness to farmers’
needs. The PMA stipulates that ‘increasing agricultural productivity and profitability and
shifting from low-value staples to higher-valued commodities’ shall be the key elements of
agricultural development efforts. The means to achieve these are stated as:
• transformation of Uganda’s low-input–low-output agriculture into a modern science-
based market-oriented agriculture capable of sustaining growth and raising incomes of
farm families and
South–South Workshop 447
Decentralisation of services in Uganda: The formation of NAADS
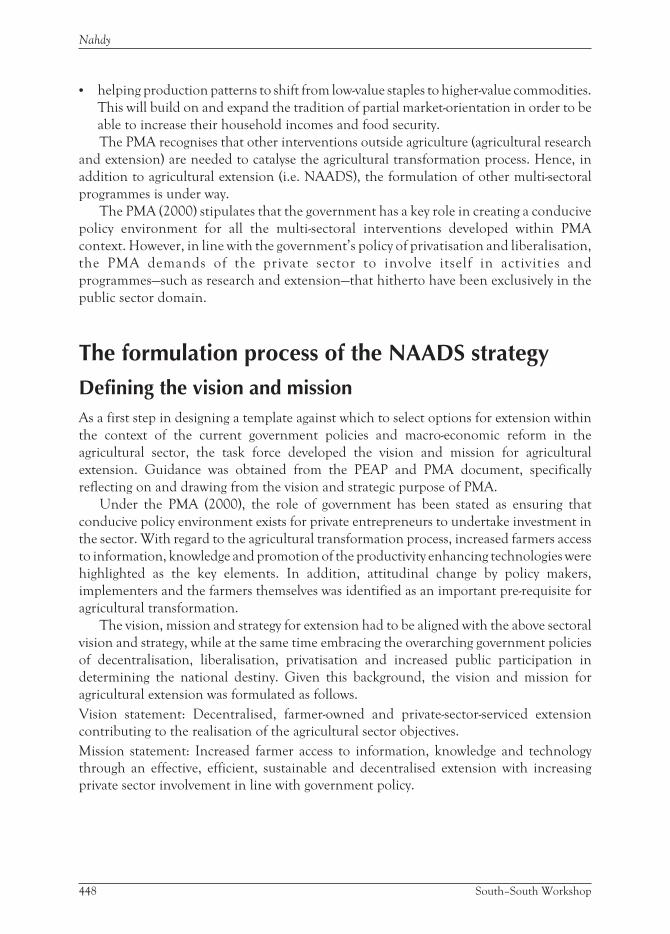
• helping production patterns to shift from low-value staples to higher-value commodities.
This will build on and expand the tradition of partial market-orientation in order to be
able to increase their household incomes and food security.
The PMA recognises that other interventions outside agriculture (agricultural research
and extension) are needed to catalyse the agricultural transformation process. Hence, in
addition to agricultural extension (i.e. NAADS), the formulation of other multi-sectoral
programmes is under way.
The PMA (2000) stipulates that the government has a key role in creating a conducive
policy environment for all the multi-sectoral interventions developed within PMA
context. However, in line with the government’s policy of privatisation and liberalisation,
the PMA demands of the private sector to involve itself in activities and
programmes—such as research and extension—that hitherto have been exclusively in the
public sector domain.
The formulation process of the NAADS strategy
Defining the vision and missionAs a first step in designing a template against which to select options for extension within
the context of the current government policies and macro-economic reform in the
agricultural sector, the task force developed the vision and mission for agricultural
extension. Guidance was obtained from the PEAP and PMA document, specifically
reflecting on and drawing from the vision and strategic purpose of PMA.
Under the PMA (2000), the role of government has been stated as ensuring that
conducive policy environment exists for private entrepreneurs to undertake investment in
the sector. With regard to the agricultural transformation process, increased farmers access
to information, knowledge and promotion of the productivity enhancing technologies were
highlighted as the key elements. In addition, attitudinal change by policy makers,
implementers and the farmers themselves was identified as an important pre-requisite for
agricultural transformation.
The vision, mission and strategy for extension had to be aligned with the above sectoral
vision and strategy, while at the same time embracing the overarching government policies
of decentralisation, liberalisation, privatisation and increased public participation in
determining the national destiny. Given this background, the vision and mission for
agricultural extension was formulated as follows.
Vision statement: Decentralised, farmer-owned and private-sector-serviced extension
contributing to the realisation of the agricultural sector objectives.
Mission statement: Increased farmer access to information, knowledge and technology
through an effective, efficient, sustainable and decentralised extension with increasing
private sector involvement in line with government policy.
448 South–South Workshop
Nahdy
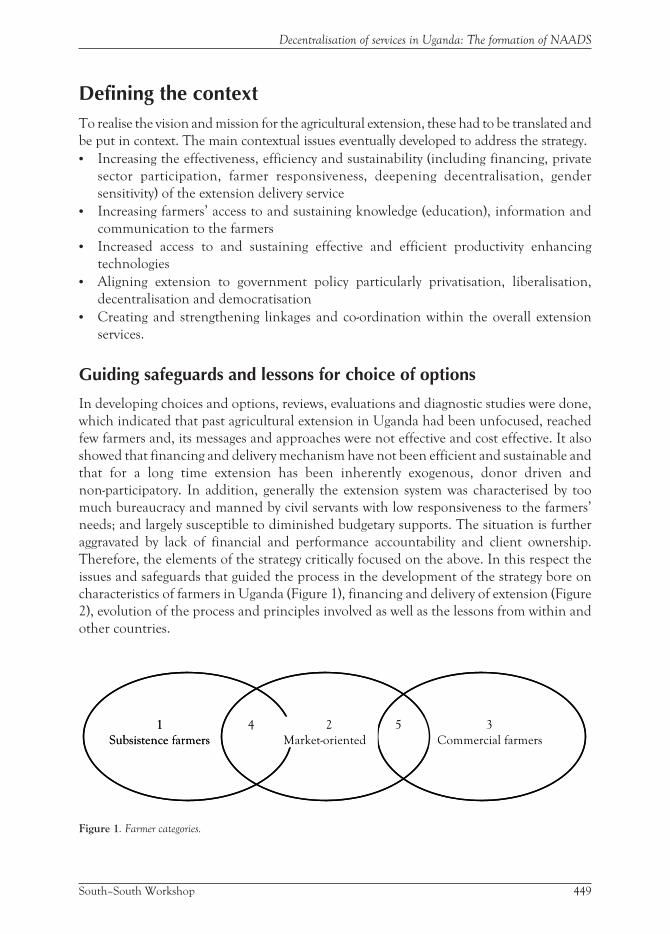
Defining the contextTo realise the vision and mission for the agricultural extension, these had to be translated and
be put in context. The main contextual issues eventually developed to address the strategy.
• Increasing the effectiveness, efficiency and sustainability (including financing, private
sector participation, farmer responsiveness, deepening decentralisation, gender
sensitivity) of the extension delivery service
• Increasing farmers’ access to and sustaining knowledge (education), information and
communication to the farmers
• Increased access to and sustaining effective and efficient productivity enhancing
technologies
• Aligning extension to government policy particularly privatisation, liberalisation,
decentralisation and democratisation
• Creating and strengthening linkages and co-ordination within the overall extension
services.
Guiding safeguards and lessons for choice of options
In developing choices and options, reviews, evaluations and diagnostic studies were done,
which indicated that past agricultural extension in Uganda had been unfocused, reached
few farmers and, its messages and approaches were not effective and cost effective. It also
showed that financing and delivery mechanism have not been efficient and sustainable and
that for a long time extension has been inherently exogenous, donor driven and
non-participatory. In addition, generally the extension system was characterised by too
much bureaucracy and manned by civil servants with low responsiveness to the farmers’
needs; and largely susceptible to diminished budgetary supports. The situation is further
aggravated by lack of financial and performance accountability and client ownership.
Therefore, the elements of the strategy critically focused on the above. In this respect the
issues and safeguards that guided the process in the development of the strategy bore on
characteristics of farmers in Uganda (Figure 1), financing and delivery of extension (Figure
2), evolution of the process and principles involved as well as the lessons from within and
other countries.
South–South Workshop 449
Decentralisation of services in Uganda: The formation of NAADS
1
Subsistence farmers
4 2
Market-oriented
5 3
Commercial farmers
1
Subsistence farmers
4 2
Market-oriented
5 3
Commercial farmers
Figure 1. Farmer categories.
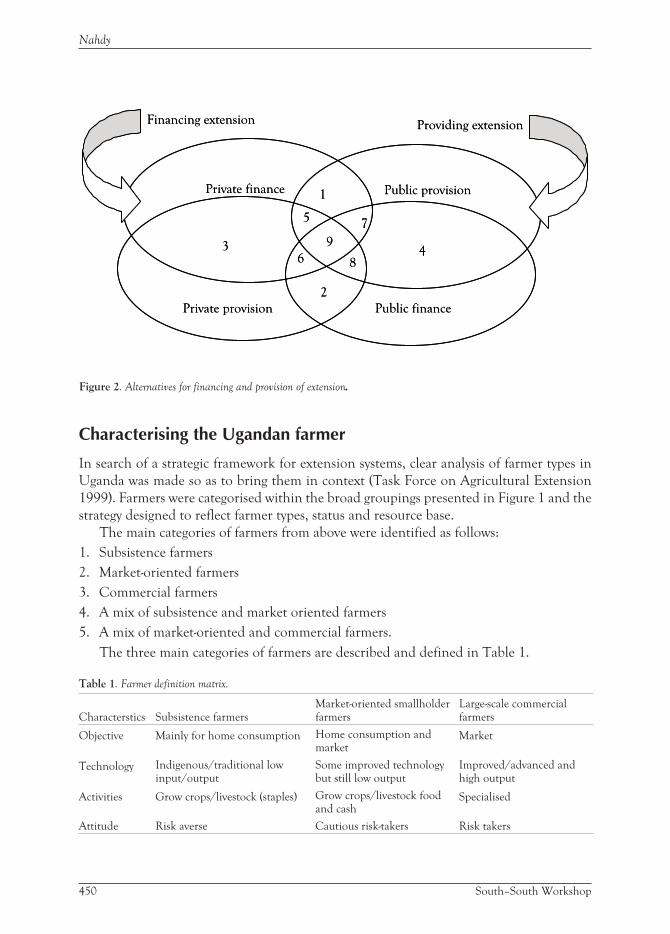
Characterising the Ugandan farmer
In search of a strategic framework for extension systems, clear analysis of farmer types in
Uganda was made so as to bring them in context (Task Force on Agricultural Extension
1999). Farmers were categorised within the broad groupings presented in Figure 1 and the
strategy designed to reflect farmer types, status and resource base.
The main categories of farmers from above were identified as follows:
1. Subsistence farmers
2. Market-oriented farmers
3. Commercial farmers
4. A mix of subsistence and market oriented farmers
5. A mix of market-oriented and commercial farmers.
The three main categories of farmers are described and defined in Table 1.
Table 1. Farmer definition matrix.
Characterstics Subsistence farmersMarket-oriented smallholderfarmers
Large-scale commercialfarmers
Objective Mainly for home consumption Home consumption andmarket
Market
Technology Indigenous/traditional lowinput/output
Some improved technologybut still low output
Improved/advanced andhigh output
Activities Grow crops/livestock (staples) Grow crops/livestock foodand cash
Specialised
Attitude Risk averse Cautious risk-takers Risk takers
450 South–South Workshop
Nahdy
1
5 7
9
6 8
2
3 4
Private finance Public provision
Public financePrivate provision
Financing extension Providing extension
1
5 7
9
6 8
2
3 4
Private finance Public provision
Public financePrivate provision
Financing extension Providing extension
Figure 2. Alternatives for financing and provision of extension.
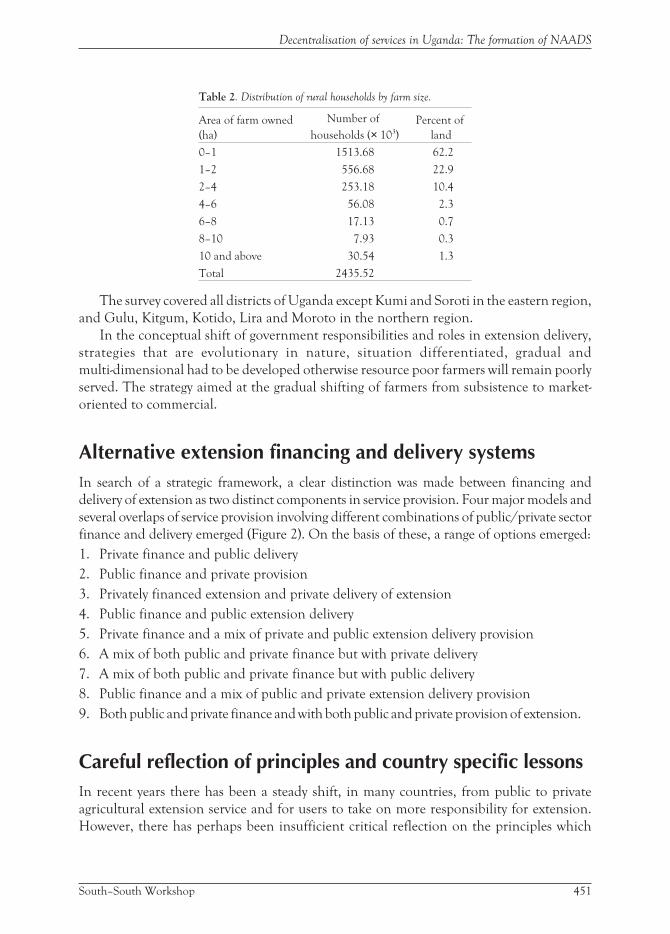
Table 2. Distribution of rural households by farm size.
Area of farm owned
(ha)
Number of
households (× 103)
Percent of
land
0–1 1513.68 62.2
1–2 556.68 22.9
2–4 253.18 10.4
4–6 56.08 2.3
6–8 17.13 0.7
8–10 7.93 0.3
10 and above 30.54 1.3
Total 2435.52
The survey covered all districts of Uganda except Kumi and Soroti in the eastern region,
and Gulu, Kitgum, Kotido, Lira and Moroto in the northern region.
In the conceptual shift of government responsibilities and roles in extension delivery,
strategies that are evolutionary in nature, situation differentiated, gradual and
multi-dimensional had to be developed otherwise resource poor farmers will remain poorly
served. The strategy aimed at the gradual shifting of farmers from subsistence to market-
oriented to commercial.
Alternative extension financing and delivery systemsIn search of a strategic framework, a clear distinction was made between financing and
delivery of extension as two distinct components in service provision. Four major models and
several overlaps of service provision involving different combinations of public/private sector
finance and delivery emerged (Figure 2). On the basis of these, a range of options emerged:
1. Private finance and public delivery
2. Public finance and private provision
3. Privately financed extension and private delivery of extension
4. Public finance and public extension delivery
5. Private finance and a mix of private and public extension delivery provision
6. A mix of both public and private finance but with private delivery
7. A mix of both public and private finance but with public delivery
8. Public finance and a mix of public and private extension delivery provision
9. Both public and private finance and with both public and private provision of extension.
Careful reflection of principles and country specific lessonsIn recent years there has been a steady shift, in many countries, from public to private
agricultural extension service and for users to take on more responsibility for extension.
However, there has perhaps been insufficient critical reflection on the principles which
South–South Workshop 451
Decentralisation of services in Uganda: The formation of NAADS
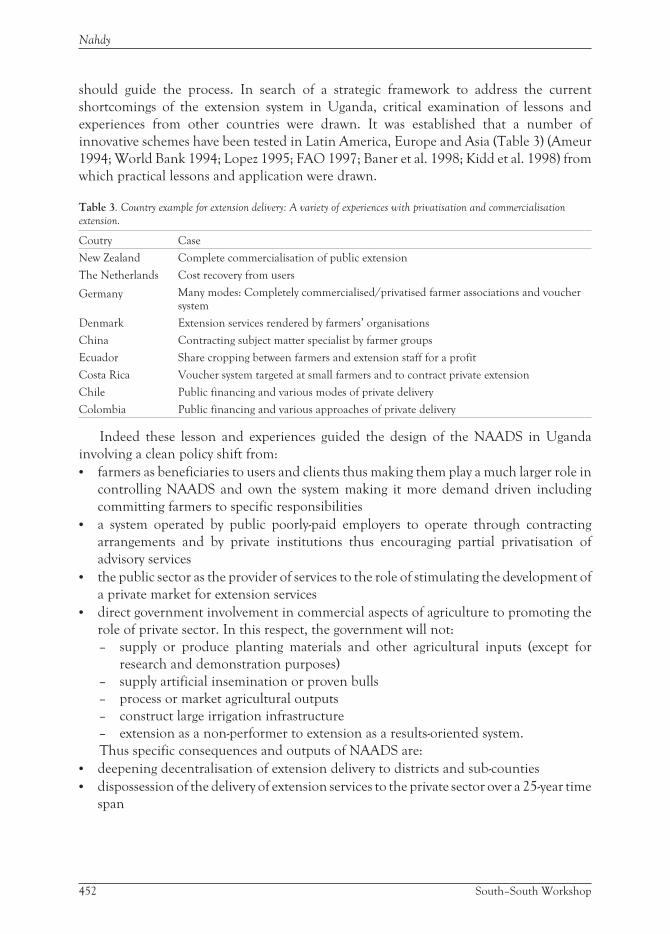
should guide the process. In search of a strategic framework to address the current
shortcomings of the extension system in Uganda, critical examination of lessons and
experiences from other countries were drawn. It was established that a number of
innovative schemes have been tested in Latin America, Europe and Asia (Table 3) (Ameur
1994; World Bank 1994; Lopez 1995; FAO 1997; Baner et al. 1998; Kidd et al. 1998) from
which practical lessons and application were drawn.
Table 3. Country example for extension delivery: A variety of experiences with privatisation and commercialisation
extension.
Coutry Case
New Zealand Complete commercialisation of public extension
The Netherlands Cost recovery from users
Germany Many modes: Completely commercialised/privatised farmer associations and vouchersystem
Denmark Extension services rendered by farmers’ organisations
China Contracting subject matter specialist by farmer groups
Ecuador Share cropping between farmers and extension staff for a profit
Costa Rica Voucher system targeted at small farmers and to contract private extension
Chile Public financing and various modes of private delivery
Colombia Public financing and various approaches of private delivery
Indeed these lesson and experiences guided the design of the NAADS in Uganda
involving a clean policy shift from:
• farmers as beneficiaries to users and clients thus making them play a much larger role in
controlling NAADS and own the system making it more demand driven including
committing farmers to specific responsibilities
• a system operated by public poorly-paid employers to operate through contracting
arrangements and by private institutions thus encouraging partial privatisation of
advisory services
• the public sector as the provider of services to the role of stimulating the development of
a private market for extension services
• direct government involvement in commercial aspects of agriculture to promoting the
role of private sector. In this respect, the government will not:
– supply or produce planting materials and other agricultural inputs (except for
research and demonstration purposes)
– supply artificial insemination or proven bulls
– process or market agricultural outputs
– construct large irrigation infrastructure
– extension as a non-performer to extension as a results-oriented system.
Thus specific consequences and outputs of NAADS are:
• deepening decentralisation of extension delivery to districts and sub-counties
• dispossession of the delivery of extension services to the private sector over a 25-year time
span
452 South–South Workshop
Nahdy
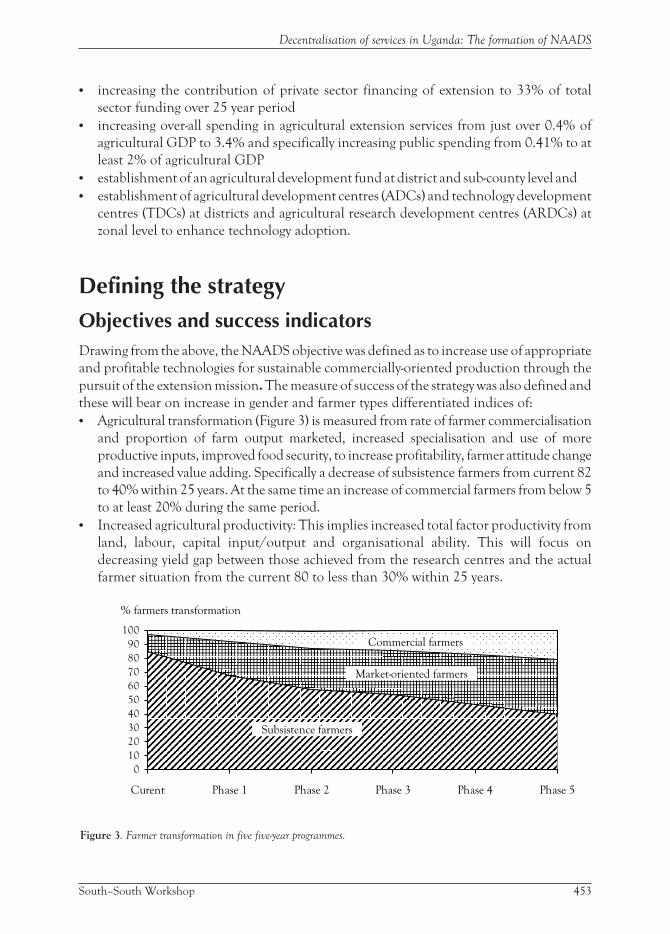
• increasing the contribution of private sector financing of extension to 33% of total
sector funding over 25 year period
• increasing over-all spending in agricultural extension services from just over 0.4% of
agricultural GDP to 3.4% and specifically increasing public spending from 0.41% to at
least 2% of agricultural GDP
• establishment of an agricultural development fund at district and sub-county level and
• establishment of agricultural development centres (ADCs) and technology development
centres (TDCs) at districts and agricultural research development centres (ARDCs) at
zonal level to enhance technology adoption.
Defining the strategy
Objectives and success indicatorsDrawing from the above, the NAADS objective was defined as to increase use of appropriate
and profitable technologies for sustainable commercially-oriented production through the
pursuit of the extension mission. The measure of success of the strategy was also defined and
these will bear on increase in gender and farmer types differentiated indices of:
• Agricultural transformation (Figure 3) is measured from rate of farmer commercialisation
and proportion of farm output marketed, increased specialisation and use of more
productive inputs, improved food security, to increase profitability, farmer attitude change
and increased value adding. Specifically a decrease of subsistence farmers from current 82
to 40% within 25 years. At the same time an increase of commercial farmers from below 5
to at least 20% during the same period.
• Increased agricultural productivity: This implies increased total factor productivity from
land, labour, capital input/output and organisational ability. This will focus on
decreasing yield gap between those achieved from the research centres and the actual
farmer situation from the current 80 to less than 30% within 25 years.
South–South Workshop 453
Decentralisation of services in Uganda: The formation of NAADS
0
10
20
30
40
50
60
70
80
90
100
Curent Phase 1 Phase 2 Phase 3 Phase 4 Phase 5
Market-oriented farmers
Commercial farmers
Subsistence farmers
% farmers transformation
0
10
20
30
40
50
60
70
80
90
100
Curent Phase 1 Phase 2 Phase 3 Phase 4 Phase 5
Market-oriented farmers
Commercial farmers
Subsistence farmers
% farmers transformation
Figure 3. Farmer transformation in five five-year programmes.
• Sustainable natural resource productivity and institutional sustainability: This implies
sustainable agricultural resource use and maintenance or improvement of the natural
resource base despite increased productivity and farmer transformation. It will include
institutional sustainability as reflected in increased participation and financing and
improved standards.
• Increased agro-industrialisation: This implies export and domestic requirements for
tradable commodities and products met.
Components of the strategyFrom the above, areas which components of the extension strategy will bear on were
identified as follows:
i. Development of sub-county and district agricultural advisory strategic plan: A covert
objective is to build consensus and ownership of the agricultural development process.
Therefore all the activities in the process must involve all categories of stakeholders—
particularly the women.
ii. Development/improvement of operational capacity: This will centre on functional
capacity as it relates to personnel, equipment, transport, supplies and operational funds.
Whereas the Local Government Act (1997) transferred the mandate and responsibility
of extension service implementation function to districts and sub-counties, their
capacity is very limited and a considerable capacity building will be needed.
iii. Improvement/development of management systems: This will focus on results oriented
management (ROM) targeting value for money. At district and sub-county level,
important areas of concern for improvement relate to programme development and
management; financial management and accountability; administration and physical
resources management; and human resource management.
iv. Developing extension delivery and financing mechanisms: In developing the strategy,
five financing/delivery (Figure 2) options are provided within the context of a
continuum of farmer types (Figure 1) ranging from subsistence through market-oriented
to commercial, as shown in Table 4.
Mechanisms for implementing the strategy embody the following principles:
– Empowering subsistence farmers to access private extension services.
– Developing private sector delivery capacity and systems.
– Developing sustainable financing institutions and mechanism.
The strategy developed will be in five phases each for five years with the following
objectives:
Phase I: To shift from public to private delivery with mostly direct public financing while
building the foundation for greater private sector financing. To achieve these, the following
should be put in place:
– mechanisms for direct flow of funds to sub-counties and farmer groups
– mechanisms for sub-counties and farmer groups to source services.
454 South–South Workshop
Nahdy
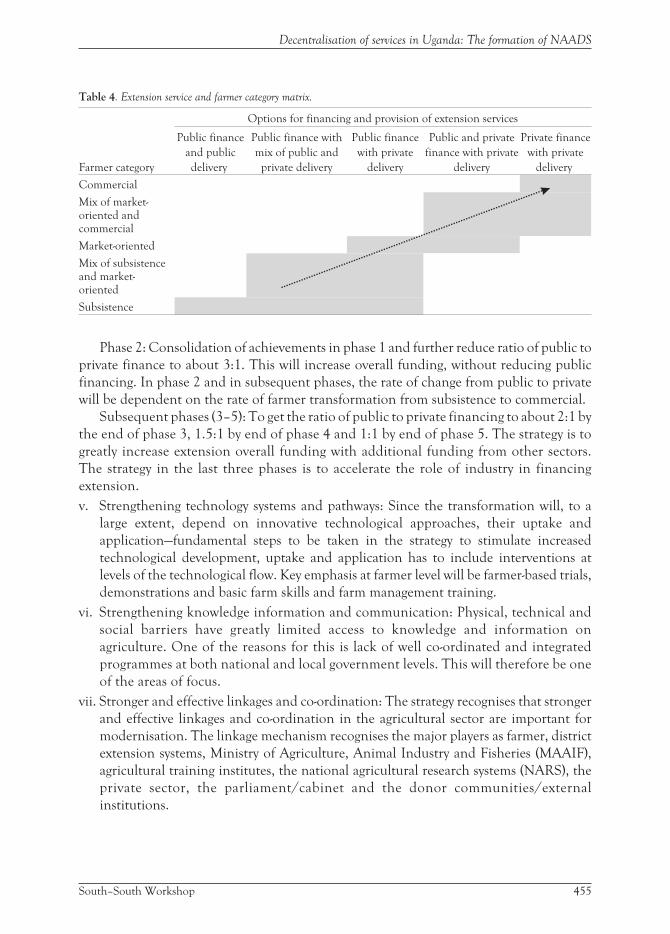
Table 4. Extension service and farmer category matrix.
Farmer category
Options for financing and provision of extension services
Public finance
and public
delivery
Public finance with
mix of public and
private delivery
Public finance
with private
delivery
Public and private
finance with private
delivery
Private finance
with private
delivery
Commercial
Mix of market-oriented andcommercial
Market-oriented
Mix of subsistenceand market-oriented
Subsistence
Phase 2: Consolidation of achievements in phase 1 and further reduce ratio of public to
private finance to about 3:1. This will increase overall funding, without reducing public
financing. In phase 2 and in subsequent phases, the rate of change from public to private
will be dependent on the rate of farmer transformation from subsistence to commercial.
Subsequent phases (3–5): To get the ratio of public to private financing to about 2:1 by
the end of phase 3, 1.5:1 by end of phase 4 and 1:1 by end of phase 5. The strategy is to
greatly increase extension overall funding with additional funding from other sectors.
The strategy in the last three phases is to accelerate the role of industry in financing
extension.
v. Strengthening technology systems and pathways: Since the transformation will, to a
large extent, depend on innovative technological approaches, their uptake and
application—fundamental steps to be taken in the strategy to stimulate increased
technological development, uptake and application has to include interventions at
levels of the technological flow. Key emphasis at farmer level will be farmer-based trials,
demonstrations and basic farm skills and farm management training.
vi. Strengthening knowledge information and communication: Physical, technical and
social barriers have greatly limited access to knowledge and information on
agriculture. One of the reasons for this is lack of well co-ordinated and integrated
programmes at both national and local government levels. This will therefore be one
of the areas of focus.
vii. Stronger and effective linkages and co-ordination: The strategy recognises that stronger
and effective linkages and co-ordination in the agricultural sector are important for
modernisation. The linkage mechanism recognises the major players as farmer, district
extension systems, Ministry of Agriculture, Animal Industry and Fisheries (MAAIF),
agricultural training institutes, the national agricultural research systems (NARS), the
private sector, the parliament/cabinet and the donor communities/external
institutions.
South–South Workshop 455
Decentralisation of services in Uganda: The formation of NAADS

The NAADS programme design
Principles of the NAADsBefore the development of the programme implementation arrangements, the principles
through which the NAADS is anchored into the PMA were defined and stated as follows:
• empowering the farmers and building demand for both research and agricultural
advisory services
• targeting agricultural services to the poor farmers who constitute the majority
• mainstreaming gender issues
• deepening decentralisation to bring the control of the services nearer to the farmers
• commercialisation—including intensification of productivity and specialisation
• participatory processes in planning, contracting, monitoring and evaluation
• managing natural resource productivity
• increasing institutional efficiency through contracting out services and better linkages and
• harmonisation of donor supported projects with PMA principles.
The NAADS programme componentsFrom the above principles and taking into account the current shortcomings in the
extension system, five NAADS components developed within which its anticipated outputs
were defined. The philosophy underlying each component and the mechanisms that will be
used to ensure that the basic principles outlined in are embedded within the approach used
to generate the outputs, are described below.
Component 1: Advisory and information services tofarmersHere NAADS will support initiatives by farmers, working together in groups with their
sub-county government, to contract agricultural advisors to deliver identified priority
services. Matching grants would be made available from the district and national levels of
government to help the farmers finance such contracts. Specific activities to be funded
include orientation and group mobilisation, participatory planning, technical advisory
service and information and communications.
Component 2: Technology development and linkages withmarketsSupport the multiplication of technologies at sub-county and district levels. Creation of
linkages among farmers, advisers and researchers will be promoted. Farmers will be availed
456 South–South Workshop
Nahdy

funds to contract researchers to work with them on technology development and
adaptation and also to link with markets.
Component 3: Quality assuranceRegulations and technical auditing of service providers. Support will be provided for the
establishment of a regulatory framework for service providers by setting and enforcing
standards for qualification and performance.
Component 4: Private sector institutional developmentTo accelerate the process of service provider transformation, a programme will be
established and supported to assist private service providers to retrain and up-grade their
skills. Leaders of farmers’ organisations will be trained in managerial and leadership. Funds
will be provided to facilitate the restructuring of the local government human resource
structure consequent to the privatisation of the services.
Component 5: Programme management and monitoringThis component will establish and support public institutions at both the national and local
government levels to play their statutory roles with respect to the NAADS. This will include
monitoring and evaluation of programme activities and establishment of information
management systems.
NAADS programme scope, target group andphasingAfter the components were developed the programme scope, targets and phasing were set. It
was determined that, to participate in NAADS, each district and sub-county will have to
satisfy already laid down criteria and a few specific to NAADS.
The services to be provided would be solicited by and based on contracts arranged at the
behest of the eligible beneficiary (farmers, farmers’ groups, forums, local governments on
behalf of farmer forums or groups, and the NAADS Board and Executive, for national or
agreed thematic interventions). Potential service providers will need to meet a set of criteria
of professional competence standards.
The two main ways in which individual farmers can participate in NAADS are:
• as members of a farmer’s institution (group or fora) that can be a named party to a service
contract
• as residents of a village, parish or sub-county where a service provider has a contract with
the sub-county to provide advisory services
South–South Workshop 457
Decentralisation of services in Uganda: The formation of NAADS

For a farmer’s forum to be recognised as a representative body of farmers for NAADS
purposes within the sub-county, it should be:
• made up of representatives of farmer’s groups or institutions and
• have at least 30% of the groups represented being women’s groups, 20% youth groups
and 5% disabled groups.
NAADS resource allocation and targetingNAADS central government programme funds will be allocated to districts, based on the
consolidated farmer groups’ plan and budget, submitted by each sub-county farmer
forum. To participate in the programme, districts and sub-counties have to meet the
NAADS minimum conditions, of which counterpart contributions of funds will follow
the process established for government/PAF projects. Sharing of NAADS funding
between the national, district and sub-county levels will utilise similar criteria of
population and land area to those of other projects, but with an element of bias to the
poorer areas.
Organisation and implementationThe Ministry of Agriculture, Animal Industry and Fisheries (MAAIF) will have overall
national responsibility for the programme, with oversight by MFPED, while sub-county and
district local councils and administrations will be responsible for support and supervision at
their levels. Primary responsibility at grassroots level will be vested in the farmer groups that
will be the prime clients of the advisory services—and their elected farmer forums at
sub-county, district and national levels. The overall institutional structure of NAADS is
illustrated in Figure 1. There was recognition of the Ministry of Local Government
(MOLG), which is responsible for administration of the Local Governments Act 1997,
under which NAADS district, sub-county and parish and village level activities will take
place.
It was determined that the NAADS Board will be constituted and charged with the role
of advising and giving guidance on programme policy and strategy issues and facilitating,
supervising and supporting the NAADS Executive. The NAADS Secretariat will form the
programme management. Since the majority of decisions and functions in routine
management will be the remit of the appropriate farmer forum, sub-county and district
personnel, the major task of the secretariat will be in overall planning, technical guiding and
oversight of operations; and performing a catalytic and promotional function in advancing
programme coverage and impact.
Local governments will cover most of the local administrative and regulatory aspects and
support requirements for NAADS. Parish, sub-county and district councils will, at their
respective levels, be responsible for policy, assessment of effectiveness and general oversight
of the NAADS, and voting of counterpart financial contributions.
458 South–South Workshop
Nahdy
Farmer institutions will be the cardinal element of the programme and their effectiveness
will be the principal determinant of NAADS and PMA success. The purpose of the
formation of farmers groups is to create institutions for farmer empowerment.
Service providers may be individuals, small groups of advisers, consultancy and professional
companies, parastatal agencies, academic institutions and commercial companies. It will be a
major pre-occupation of NAADS to foster development of the service provider sector. The
main role of these agencies will be to arrange and perform the advisory, research and
development services in response to the demands of farmers, sub-counties, districts and the
NAADS executive.
Legal frameworkTo implement NAADS three legal and regulatory issues need to be resolved:
Establishment of the NAADS Board and Executive as a statutory parastatal organisation;
recognition and registration of farmer institutions as a key step for farmers to be
empowered; tendering and contracting in which under NAADS it is envisaged that
contracting of service providers would be undertaken mainly at sub-county level with
decisive involvement of farmer representatives. Rather than attempt piecemeal
amendments of various existing laws and regulations, which would have implications for
other sectors, a NAADS Organisation Bill has been drafted. Its enactment would resolve
all three legal issues above.
Implementation mechanismsThe planning and operations structure (Figure 2) encompasses three main categories of
activities, namely: the principal planning process from the grassroots up to national level; a
liaison channel for consultation and dialogue between the different levels; and the
co-ordination, oversight and service contract deployment channel. The programme
intervention phases have been developed as follows; establishment of interim institutional
arrangements; mobilisation, sensitisation and inventory taking; and tribalising in selected
districts.
To support the overall NAADS programme, donors will pool all new resources
coming on stream through ‘NAADS earmarked’ budget support. Under this
arrangement, donors’ funds will be merged with the government’s own resources.
Matching contributions from district and sub-county levels will be mandatory. NAADS
programme funding will be used under government procedures, legislation and
regulations. NAADS planning and budgeting process is founded on the government’s
annual budgeting cycle. NAADS planning will build on the government’s planning and
budgeting process.
Given the hard budget constraints, the main principle guiding expansion will be to
ensure that resources are spent in a cost-efficient and cost-effective manner. This will be
South–South Workshop 459
Decentralisation of services in Uganda: The formation of NAADS
guaranteed by a system of conditionality for participation of districts and sub-counties in
NAADS programme.
Programme costs and financing; financialmanagement and procurementProgramme fund disbursements will be predominantly to sub-county governments, which
will account for approximately 77%, with district and national level disbursement
accounting for 11 and 12%, respectively. The programme cost will be financed by the
government through national, district and sub-county funding as well as donor support and
farmer contributions.
NAADS financial management will follow the relevant government and local
government legislation and regulations. NAADS funding will be channelled under
conditional modalities. Procurement of goods and services will be in accordance with
government guidelines, subject to donor group satisfaction with any amendments agreed
that are necessary to meet NAADS requirements. The principal instruments for the
provision of services and for most of eligible expenditures will be formal and legally
binding, performance determined and time and value bound contracts. The entities that
will be mandated to award contracts will be farmers forums in conjunction with
sub-county or district administrations; sub-counties and districts themselves; and the
NAADS executive.
Donor co-ordination and government/donorspartnershipThe channelling of donors’ funds through the budget has implications in terms of donors
co-ordination and joint government/donors monitoring of NAADS. Donors will have to
plan, budget and mobilise their support in line with the government’s planning and
budgeting cycle.
Monitoring and evaluationMonitoring will record the delivery of NAADS inputs and the achievement of outputs. A
logical framework has been developed, and this, sets out the inputs, the expected outputs
and the main monitoring and evaluation (ME) indicators that will be used; and it also
summarises the monitoring and evaluation process. Monitoring will be concerned with
programme performance in delivery of individual services and supplies; timing and
co-ordination of activities; and impact, as set out in the logical framework and cost tables.
Monitoring will take place at four levels: in the field, in community, village and farmer
group activities; at sub-county; at the district; at the NAADS office.
460 South–South Workshop
Nahdy

Programme implementation manualAn operations manual will govern implementation of the programme. This manual will
define administrative procedures; sanction requirements; delegation of authority;
procurement procedures; fund flow systems; accounting and auditing requirements;
disbursement procedures; operation of the special accounts; formats, terms, conditions and
standards for contracts and memoranda of agreement between various participating
agencies; and monitoring and evaluation arrangements.
Financial and economic cost–benefit analysisThe economic analyses undertaken using a sector programme approach and farm enterprise
based analysis indicate that the NAADS programme is economically viable. The analysis is
based on advisory services contact (direct and indirect) with 40% of farm households in
target sub-county, and an adoption rate by these contacted households of 50%. This would
result in over 15% of farm households in target sub-county adopting improved practices and
increasing productivity and returns. By year 7 of phase 1 this will involve approximately 420
thousand farm households in 40 districts, with the vast majority of these beneficiaries being
smallholder farmers. NAADS will generate a range of other benefits that have not been
assessed quantitatively. Benefits will include the improved human resource skills developed
with the programme training and the strengthening of the local institutional capacity.
Implications and lessons learntThe formulation process of the NAADS programme was by the government’s own
appointed task force. The criteria used for the selection of the task force members reflected
the width and depth of stakeholder interest and covered all key representation from these
interest groups. Because of these the NAADS has had very wide acceptance at home at all
levels. The task force received support from and worked very closely with over thirteen
development partners. This helped in drawing expertise and experience from a wider
international arena and reaching consensus in wide ranging and complex issues very quickly
during the whole design process. The team consulted very widely, both internally and
externally during every design stage, which greatly helped in reaching a common goal and
consensus on objectives, outputs, implementation arrangements etc. Those consulted
included policy makers, decentralised governments, NGOs, farmers, service providers,
private sector, the developmental partners and several other relevant institutions.
The design process was guided by the right government policy environment and legal
framework, as well as from wider government strategies and plans directed at poverty
eradication and modernisation of agriculture. This allowed for a programme which is within
the context of government strategy and plan and thus within a readily acceptable framework.
In the design of the programme, it drew lessons from past experiences in Uganda and
international best practice on extension systems operations and delivery. This helped in
South–South Workshop 461
Decentralisation of services in Uganda: The formation of NAADS
combining best options suited to our own situation. The programme also had the right
timeframe (18 months) to complete the task and sufficient budget support, which allowed
for intensive and extensive consultation and consensus building.
All the above are lessons to draw from the formulation process of a radical programme of
this magnitude.
The NAADS programme has major implications on the current institutional
arrangements, which will have to be transformed to reflect decentralisation and farmer
empowerment concepts. It has implications on the service providers who will no longer be
public servants, but will work on contract based on farmer-identified needs and priorities.
The proposed financial flow mechanism to, and implementation arrangements at
sub-counties, combined with acceptability of programme evolution, is also a departure from
past arrangements, which will allow multiple evolution of the programme and refinement
of lessons. In this respect process monitoring is very important.
The programme, in its empowerment mechanism, has drastically changed the roles of
the farmers and advisers and this has implications not only in attitudinal aspects but also in
skill base and capacity building programmes.
Questions for discussionsSome areas that may be included for discussions are as follows:
• Expected challenges and opportunities to the programme
• How will farmers and private service providers rise to the challenges in the programme?
• Because the programme is designed to evolve from lessons learnt, what tools, skills and
experiences can we draw from process monitoring?
• Is there a wide forum to share experiences in this sector?
• What implications does the programme have on the diary sector?
ReferencesAmeur C. 1994. Agricultural extension: A step beyond the next step. World Bank Technical Paper 247.
The World Bank, Washington, DC, USA. 15 pp.
Baner E., Hoffmann V. and Keller P. 1998. Agricultural extension down the ages. Agriculture and
Rural Development 1/98:3–23.
FAO (Food and Agriculture Organization of the United Nations). 1997. Strategic extension campaign:
An FAO agricultural extension approach. FAO, Rome, Italy.
Kidd A., Lamers J. and Hoffmann V. 1998. Towards pluralism in agricultural extension: A growingchallenge to the public and private sector. Agriculture and Rural Development 1/98:7–10.
Lopez R. 1995. Determinants of rural poverty: A qualitative analysis for Chile. Technical dependent, rural
poverty and national resources, Latin America region. The World Bank, Washington, DC, USA. 33pp.
NAADS (National Agricultural Advisory Services). 2000. Master document of the NAADS TaskForce and Joint Donor Group—Ministry of Agriculture, Animal Industry and Fisheries, Entebbe,Uganda.
462 South–South Workshop
Nahdy
PEAP (Poverty Eradication Action Plan). 1997. Available at http://www.worldbank.org/participation/tn2.htm
PMA (Plan for the Modernisation of Agriculture). 2000. Government of the Republic of Uganda.
Task Group on Agricultural Extension. 1999. Strategic Framework Final Report. Government of theRepublic of Uganda.
The Local Government Act. 1997. Republic of Uganda. Uganda Printing and PublishingCorporation, Kampala.
World Bank. 1994. Chile, strategy for rural areas, enhancing agricultural competitiveness and alleviating rural
poverty, Report No. 12776-CH of the National Resources and Rural Poverty Division. The World Bank,Washington, DC, USA. 54 pp.
South–South Workshop 463
Decentralisation of services in Uganda: The formation of NAADS
Theme 5: Effective and efficient livestockservices for smallholder dairy productionPlenary discussionAfter the presentation of the four case-study papers on livestock services, the points raised in
the plenary discussion related to the scarcity of resources that define smallholder systems,
and the difficulty of ensuring responsive and demand-led research and extension services
for those systems. The debate on how to organise responsive services was continued during
the theme 5 group discussion (see below).
In the plenary discussion, the issues and concerns raised were:
1. A common problem in developing countries is land scarcity, with a significant proportion
of land being owned by a wealthy minority.
2. A major constraint in many systems is lack of (financial) capital.
3. Extension should be problem-based and driven by farmers.
4. On-farm research is needed to develop technology.
5. Replication of the Amul model
• The major problem with replication resulting from cultural, ecological and social
differences was reported as resistance to change by bureaucrats who had vested
interests in the status quo.
• Labour costs in India are very low and therefore the cost of services (veterinary and
artificial insemination; AI) could be maintained at their current low levels.
Participants queried the possibility of maintaining these low service costs in areas
where wages were higher.
6. There is the need to decentralise services and to deliver to the farmers’ doorstep.
These issues and the related topics that emerged from the presentations in themes 4 and
6 were subsequently discussed in small groups of workshop participants.
The outcomes for theme 5 are given below.
Group discussionAs for the other groups, the theme 5 discussions were guided by a set of questions. The
questions presented to the group addressed alternatives to the government supply of
livestock services and sought information about important lessons from countries in the
South.
The questions were:
1. What are the lessons from countries in the South for improving the coverage, accessibility
and effectiveness of services to smallholder dairy farmers?
464 South–South Workshop
2. The governments of many developing countries have stopped or are considering
withdrawing from, providing input (production extension; clinical and AI) services to
smallholder farmers. Which are the key steps required to manage the transition from
delivery by public organisations to delivery by other providers?
3. What alternative mechanisms for the delivery of livestock services have proven successful
in the South and what conditions were required?
4. Many smallholder farmers depend upon traditional systems for accessing livestock services
(e.g. animal treatments) and technical advice (e.g. farmer-to-farmer advice). How can these
systems be better served to the benefit of smallholders?
The group’s responses to these questions were outlined as follows.
Lessons from countries in the South for improving the coverage,accessibility and effectiveness of services
• Government’s role should be to provide public goods.
• The delivery of services by governments has failed.
• For commodities that pay like tea and pyrethrum in Kenya, the private sector has taken
up extension and service provision. Difficult for non-cash crops, especially in subsistence
farming systems.
• Subsidies result in false adoption and do not serve the poor.
• In some cases government might be involved in the delivery of private goods.
Which are the key steps required to manage the transition fromdelivery by public organisations to delivery by other providers?
• Government must be committed to the change.
• The transition must be managed.
• The stakeholders must be informed of the decision in advance (publicity).
• Unfair competition with other service providers must be removed in order that the
private sector can take root.
• Mechanisms must be put in place to ensure that even remote areas will be reached by the
private service providers.
• Training not only of vets and para-vets, but of local people so that they can provide some
of the services.
• Some form of supervision should be provided (government).
What alternative mechanisms for the delivery of livestock serviceshave proven successful in the South and what conditions wererequired?
• Co-operatives.
• Government should use policy instruments to encourage co-operative development.
South–South Workshop 465
Effective and efficient livestock services for smallholder dairy production
• For co-operatives to be successful, local leadership is vital.
• Government can help through: empowering the people; training.
• The co-operatives should address the technical, social and credit issues.
• Public-funded, private-sector delivered services, i.e. CBOs, NGOs.
• Services can be decentralised to local organisations and the staff should be answerable to
the people he/she is serving.
• The local institution should be democratic.
How can traditional systems for accessing livestock services bebetter served to the benefit of smallholders?
• Work should be set up to help understand local delivery systems.
• Identify the points of entry or intervention.
• Train the local people in particular skills.
• Validate the practices.
• Learn from the human medical field where they have combined/linked the traditional
birth attendants with the modern medical services.
ConclusionsThe presentations, the supporting papers and the discussion relating to the delivery of
livestock services emphasised the importance of decentralising public-funded services to local
organisations so that the staff are answerable to the people they are serving. There was also the
call for innovative thinking to build upon the examples from India and elsewhere of
public-funded, private sector delivered services. The importance of these issues are reflected in
the workshop recommendations where actions towards achieving the objectives were agreed
and are presented.
466 South–South Workshop
Effective and efficient livestock services for smallholder dairy production
Theme 6: Making the research andextension paradigm responsive to
farmer needs
Forage legume technologies: Participatoryexperiences with farmers and community-based organisations in Central KenyaD.M. Mwangi
1and C. Wambugu
2
1. Corresponding author, Kenya Agricultural Research Institute (KARI)P.O. Box 30148, Nairobi, Kenya2. International Centre for Research in Agroforestry (ICRAF)P.O. Box 27, Embu, Kenya
IntroductionCentral Kenya constitutes 18% of the land area of the country; it holds about 64% of the
human population. The population density range is wide, ranging from about 100
persons/km2 in the dry lowlands to over 1000 persons/km2 in areas with high agricultural
potential (CBS 1994). Agriculture is the main economic activity with coffee (medium to low
altitude) and tea (high altitude) as the major cash crops. The farming system is
predominately mixed with livestock, especially dairy production being important. In a
recent farm survey (Staal et al. 1998), farmers ranked dairy production second only to cash
crops in economic importance.
In Kenya, it is estimated that 80% of the marketed milk comes from smallholder mixed
farms (DANIDA/MoLD 1991; Mbogoh 1984) which are mainly family farms with less than
ten hectares (ha) of land (Gitau 1994; Mwangi 1994) and less than ten dairy animals (Anon
1985; Anon 1987). Due to the high human population pressure, farms are small with average
holdings of 0.9–2.0 ha per household (Gitau et al. 1994; Mwangi 1994) and are rapidly
decreasing in size due to subdivision. Animals are therefore confined in stalls and fed on
Napier grass (Pennisetum purpureum) in a zero-grazing production system. Approximately 80%
of the dairy animals in Central Kenya are kept in this system (Mwangi 1994; Staal et al. 1998).
The importance of the dairy enterprise in smallholder farms has increased in recent years, due
to liberalisation in the dairy subsector, which has resulted in the redistribution and increase of
the overall social and economic benefits of market-oriented smallholder dairying (Omore et
al. 1999). This coupled with low cash crop prices has made smallholder dairy production an
important income earner in smallholder farms in Kenya.
Sources of livestock feeds in Central KenyaPlanted forages, the maize crop, cereal residues, natural pasture and grass harvested from
public utilities (i.e. road reserves, school compounds etc.) are the major sources of livestock
South–South Workshop 469

feeds in Central Kenya. As the size of land holdings declined due to subdivision, the
contribution of pasture to livestock production has declined. Therefore, most livestock
feeds come from planted forages and the cropped land. Apart from the maize crop, which is
discussed below, bean haulms, weeds and fodder crops planted on soil conservation terraces
are a major source of livestock feeds on many farms. Even on farms where animals are
grazed, fodder including crop residues gathered from the farm is usually the main source of
feed rather than pasture (Staal et al. 1998).
Napier grass is the main fodder crop in Central Kenya and is grown by over 70% of
smallholder farmers in the area (Stotz 1983; Potter 1987; Bayer 1990; Mwangi 1994; Staal et
al. 1998). Stotz (1983) estimated that 240 thousand hectares or 4% of the total arable land
on smallholder farms in Kenya was under Napier grass. A recent survey in Kiambu district in
Central Kenya showed that on average 0.2 ha were planted with Napier grass in households
keeping cattle (Staal et al. 1998). This represents approximately 15% of all arable land on
these smallholdings. Data from longitudinal recording of 21 farms in Kiambu indicate that
over 40% of the dry matter available to dairy cows in the area comes from Napier grass
(Table 1).
Table 1. Sources of livestock feeds in Central Kenya.
Source of feedProportion of overall drymatter (DM) available (%)
Napier grass 40.9
Dry maize stover 17.1
Concentrate feeds 12.2
Grass 7.6
Weeds from cropped land 6.0
Maize thinnings 3.3
Green maize stover 3.0
Banana pseudostems 2.6
Poultry litter 1.7
Banana leaves 0.8
Banana thinnings 0.6
Source: Smallholder Dairy Project (longitudinal recording in
Kiambu district) unpublished data.
Maize is a staple food crop in Central Kenya and has become increasingly important as
source of fodder in smallholder farms. The maize crop supplies approximately 23% of the
dry matter (DM) available to dairy animals in Central Kenya (Table 1). The fodder is in the
form of dry maize stover, thinnings and green stover. Methu et al. (1996) estimated that
farmers grow an average of 0.36 ha of maize per season, from which they harvest 0.9 t of
maize stover. Therefore, with two growing seasons/year, approximately 1.8 t of maize
stover is harvested. In Central Kenya, farmers keep on average two animals (Methu et al.
1996; Staal et al. 1998). Therefore, the maize stover produced can be fed for between three
and six months but intake and utilisation is limited by the inherent characteristics of
470 South–South Workshop
Mwangi and Wambugu
maize stover. Currently, maize stover provides approximately 17% of the DM available to
cows (Table 1).
Maize thinnings and green maize stover form about 6% of the DM available to cows.
While green maize stover (harvested after the maize cob reaches physiological maturity) is
feed when available, farmers go out of their way to plant seeds closely with the aim of
thinning the extra plants for livestock feed. On-farm work on smallholder farms has shown
that this practice could increase the DM yield by between 1.1 and 2.4 t DM/ha per season
(Lukuyu, personal communication). As the crude protein (CP) content of the thinnings is
higher than that of dry maize stover (Onim et al. 1991), high-density planting increases the
quantity and quality of forage available.
Limitations to dairy production in Central KenyaGood quality Napier grass can support the production of between 7 and 10 kg of milk/
animal per day (Anindo and Potter 1986; NDDP 1990) but actual production on farms
is only about 5 kg/cow per day (Gitau et al. 1994). The poor performance is attributed to
an inadequate year round supply of feed. Napier grass is grown with little or no chemical
or organic fertiliser and the DM yield is low. The digestibility and the nitrogen (N)
content of Napier grass declines rapidly as the grass matures, especially during the dry
season, curtailing milk production. The utilisation of maize stover, which is the main
roughage during the dry season (Said and Wanyoike 1987; Mwangi 1994), is
constrained by the low CP content (Nicholson 1984; Little and Said 1987; Methu
1998). This system seems to offer itself for the integration of both herbaceous and
shrubby legumes. It is apparent, therefore, that milk production in Central Kenya is
limited by both the quantity and quality of feed available. Therefore, any strategies
aiming at increasing milk production must address both the quantity and quality issues.
In this regard herbaceous and multipurpose/shrubby legumes can contribute and are
discussed below.
Potential benefits of integrating forage legumes intosmallholder fodder systems in Central KenyaThe benefits of integrating legumes into fodder systems have been demonstrated. A
review by Saka et al. (1994) looks at the benefits in different farming systems in
sub-Saharan Africa (SSA). This case study will, therefore, not attempt to review the
benefits of forage legumes in animal production systems but will highlight some recent
work in Kenya with forage legumes and their contribution to DM yield of fodder crops
and animal performance. Experience with the participatory introduction of herbaceous
and shrubby legumes into the farming systems will be discussed in detail.
South–South Workshop 471
Forage legume technologies: Participatory experiences with farmers and CBOs

Effect of herbaceous legumes on total (grass andlegume) DM productionThe DM yield achieved will depend on the production system and the legume species used. In
cases where nitrogen does not limit grass growth, tropical grasses will always out-yield legumes
grown in pure stands and the yield gap may be as high as 10 t. Therefore, in a situation where
population pressure is high, as in Central Kenya, pure legume plots are not envisaged.
Many workers have reported higher grass DM yields when grass is grown in a mixture
with legumes (Ibrahim 1994; et al. 1995; Shehu and Akinola 1995). Napier grass/legume
work in Central Kenya did not give a higher grass DM yield (Mwangi 1999); however, when
forage legumes were integrated into the forage system, the total (grass + legume) DM yield
was higher than the sole Napier grass yield by between 20 and 38% (Table 2). Mureithi
(1992) reported similar findings when Napier grass was grown together with Clitoria ternatea
at the Kenyan coast. The higher DM yield was therefore the additive effect of the legume
DM rather than its effect on grass performance. This would imply that the Napier
grass/legume mixture was possibly utilising resources (soil, space etc.) more efficiently,
resulting in a higher forage DM yield.
Table 2. The effect of growing Napier grass together with Desmodium intortum or Macrotyloma axillare on heifer
carrying capacity of land and live weight gain by dairy heifers.
Napier grass alone
Napier grass/
D. intortum
Napier grass/
M. axillare
DM yield (kg/ha per year)a 20,040 27,780 24,480
Intake (kg DM/day)b 6 7 7
Live weight gain (LWG) (actual) (kg/day)c 0.39 0.42 0.42
LWG (estimated) (kg/day)d 0.50 0.56 0.51
Carrying capacity (heifers/ha per year)e 9.1 9.8 8.6
Live weight gain (kg/ha per year)f 1295 1690 1530
Advantage (kg live weight/ha per year)g – 395 235
a. Yield in work at Muguga.
b, c and e. Calculations based on a Napier grass/D. intortum mixture (85:15%) (Kariuki et al. 1998b).
d. Estimated live weight gain (LWG) made using the allocation of nitrogen in organic resources for animals and crops
(ANORAC) model (Thorne and Cadisch 1998).
g. Advantage of mixture over Napier grass alone.
Effect of herbaceous legumes on animal performanceThe potential effect of integrating forage legumes into a Napier grass mixture on animal
performance is shown in Table 2. Kariuki (1998a) supplemented dairy heifers on Napier
grass with Desmodium intortum and reported a higher live weight gain than with the Napier
grass alone treatment. As the dairy enterprise in Central Kenya is characterised by low live
weight gain in young stock, these results indicate the potential of legumes in the system.
Calculations based on these results (Kariuki et al. 1998a) and on agronomic data collected
472 South–South Workshop
Mwangi and Wambugu
in Muguga (Mwangi 1999) indicate that integrating legumes into the Napier grass fodder
system, would increase the carrying capacity from 8.2 to 9.8 heifers/ha per year and total live
weight gain from 1280 to 1690 kg/ha per year (Table 2).
The above-cited cases demonstrate the potential role that forage legumes (herbaceous
and shrubby) can play in the livestock system, not only in Kenya but also in SSA.
Unfortunately, this potential has not been translated into tangible benefits in smallholder
farms mainly because of poor adoption of forage legume technologies by smallholder
farmers.
Several attempts have been made to introduce herbaceous legumes on smallholder
farms in Central Kenya. Desmodium intortum and D. uncinatum were introduced to
smallholder farms in Central Kenya by the National Dairy Development Project (NDDP) a
decade ago. The project recommendation was that the legumes should be grown and
harvested together with Napier grass with an aim of improving the N supply to dairy cattle.
More recently, the Kenya Agricultural Research Institute (KARI) introduced both
herbaceous and shrubby legumes into the same area. The legumes were to be intercropped
with food crops and planted grasses (Wandera 1995). The Legume Research Network
Project (LRNP) also introduced herbaceous legumes mainly as a green manure crop in areas
of Embu in Central Kenya.
Despite these and many other attempts to introduce shrubby and herbaceous legumes
on smallholder farms, adoption has been low (Paterson et al. 1996a). In 1994, the NDDP
reported that out of 222 farms with a total of 536 ha surveyed in Eastern Kenya, only 42
farms were growing herbaceous legumes on approximately 7.2 ha of land. However, the
report did not indicate the proportion of the legume in the DM and, therefore, the
importance of the legume in the system could not be determined.
This case study will, therefore, deal with the recent activities to introduce D. intortum cv.
Greenleaf through the National Agricultural Research Project phase II (NARP II) and
Calliandra callothyrsus through the System-wide Livestock Project (SLP). Factors that affect
the adoption of the legumes and methods used in attempts to overcome constraints are
discussed.
Experience with Desmodium intortum cv.GreenleafAs indicated earlier, Napier grass is the main planted forage in Central Kenya. Therefore, all
attempts to integrate D. intortum into the farming system have focused on its role as a
companion crop to Napier grass. In this work a participatory approach was used. A survey
was conducted in Kandara division of Maragua District, one of the areas where the NDDP
introduced D. intortum in Central Kenya with the objective of identifying constraints to
adoption and documenting farmers’ experiences with the legume. A total of 33 farmers and
a total of 13 key informants (farmers involved with NDDP work) were interviewed. After the
survey, on-farm studies involving 15 smallholder farmers in the area were established. The
on-farm studies were looking at the effect of growing Napier grass with or without legumes
South–South Workshop 473
Forage legume technologies: Participatory experiences with farmers and CBOs
on DM yield. During these studies (a period of approximately 18 months) dialogue with the
farmers was maintained. The experiences highlighted below were mainly from this period of
constant interaction with the farmers.
The farmers identified the major constraints to adoption (Mwangi 1999) as:
• availability and cost of D. intortum seeds
• slow growth during the seedling stage
• failure to demonstrate clearly the benefits of herbaceous legumes, especially at the farm
level
• poor persistence of the legumes when grown together with Napier grass.
Availability, cost and ease of handling of seedsThe main source of legume seeds so far in Kenya has been the small quantities supplied by
researchers conducting on-farm experiments. The introduction of forage legumes has not
been matched by the supply of seeds by commercial seed companies, as is the case for other
crops like maize. When available, most of the seeds are imported and are expensive. D.
intortum seed will cost approximately 2000 Kenya shillings (KSh) per kg (US$ 1 = KSh 80 at
March 2001). Farmers grow on average 0.2 ha of Napier grass (Staal et al. 1998) and;
therefore, to grow D. intortum together with Napier grass they would require 500 g of seed at
a seed rate of 2 kg/ha. This amount would cost KSh 1000 (US$ 12.50). In an area where the
monthly income is estimated at KSh 6664 (US$ 83.3) (Staal et al. 1998) the seed cost would
take approximately 15% of the total monthly farm income. This high cost of seed and the
fact that the seeds are not readily available make the otherwise good technology unattractive
to farmers.
The legume seeds are small; therefore, sowing requires extra care and extra labour is
required at a time (planting season) when the demand for labour for planting food crops is
high. The tiny seedlings that emerge make weeding difficult. Many farmers that we worked
with indicated that this weeding problem would be a major issue if they had to adopt the
legume. In several instances the farmers unintentionally uprooted the legumes together
with weeds. The incidences of uprooting the legume were higher where labour was hired
(personal observation).
The conclusions from the study were that if the issues of availability, cost and difficulty
of handling the seed and seedling were not addressed then the technology was unlikely to be
adopted. An alternative method of establishing the legume through stem cuttings (vines)
was envisaged. Establishment from stem cuttings was successful and the survival rate was
over 90% (Mwangi 1999). The farmers could easily relate to the planting of stem cuttings, as
this was similar to planting sweet potato vines, which they do all the time.
When the farmers learnt that they could establish D. intortum from stem cuttings but
that the number of stems that the research team could provide was limited they started small
nurseries, mainly near shallow wells on the farm or under banana plants where water and
shade was available. These nurseries have now become sources of planting material, thus
ending the dependency on the research team. Farmers used the materials from the nurseries
to experiment with the legume. When the experiments started the only niche for the legume
474 South–South Workshop
Mwangi and Wambugu
that was discussed with the farmers was the Napier grass stands. Farmers later planted the
legume under coffee, banana and avocado trees and on soil conservation structures. This
planting and experimentation by farmers would not have been possible if the legume had to
be established from seed. Planting stem cuttings made weeding of the stands easier.
Therefore, solving the propagation issue and putting the solution into farmers’ hands
increased the potential for adoption of the D. intortum technology. It must be emphasised
that difficulties with propagation are a critical constraint to fodder adoption. The wide
spread adoption of Napier grass is mainly attributed to the ease with which it can be
propagated (Mwangi et al. 1995).
Anecdotal information indicates that farmers not involved in the study have received
planting material from farmers with nurseries and in turn have started their own nurseries.
The effectiveness of the nurseries as a source of D. intortum planting material will be assessed
through a planned adoption study.
Initial slow growthAs stated previously, the main constraint to animal performance in Central Kenya is the
inadequate year round supply of good quality forage. Therefore, any forage introduced to
the area must be fast growing and high yielding. This explains the adoption of Napier grass
by the majority of smallholder dairy farmers (Mwangi 1994; Mwangi et al. 1995; Staal et al.
1998), which is likely to be used as a model to assess other forage crops.
The initial growth of D. intortum is slow especially when established from seed and
cannot be compared with that of Napier grass even when stem cuttings are used. When
Napier grass is established from rooted splits, the farmers can take the first cut three to five
months after planting depending on rainfall but D. intortum takes between eight and nine
months before a cut can be taken. During this period, Napier grass will have produced 7.7 t
of DM/ha compared with only 3.7 t from the legume (Mwangi 1999).
As the legume was relatively new to the farmers, the initial low growth rate made them
decide that the potential was low and that the legume was a waste of time and resources.
The main question asked by the farmers at this stage was ‘will the legume ever get to a stage
where we can harvest and have substantial amounts to feed the cow’? At this point the
cause would have been lost if farmers were not given something to hold on to. Therefore, a
decision was made to take the farmers to the research centre where they could see an
already established Napier grass/D. intortum mixture. The farmers initially could not
relate the established legume to the struggling seedlings on their farms and the visit had a
major impact on farmer perception of the technology. As trips to the research centre
might be costly and do not always reflect conditions on smallholder farms, the research
team has emphasised farmer-to-farmer visits to enhance adoption of the legume
technology. During these visits the farmers see the potential of the legume and always
carry planting material back to their farms. Plans are underway to conduct an adoption
study to determine how effective this approach has been, but anecdotal information
indicates that it has been successful.
South–South Workshop 475
Forage legume technologies: Participatory experiences with farmers and CBOs

Failure to demonstrate clearly the benefits of herbaceouslegumes, especially at the farm levelIf farmers have to adopt a technology, they must be able to clearly see the benefits. Sometimes
beneficial technologies are not adopted because the benefits cannot be clearly demonstrated
or are long term. The major benefits of forage legumes include higher DM yields (Keya et al.
1971; Keya and Kalangi 1973; Reategui et al. 1995; Shehu and Akinola 1995; Mwangi 1999),
biological nitrogen fixation (BNF) (Cadisch et al. 1989; Thomas and Sumberg 1995; Mwangi
1999), improved soil fertility and better animal performance due to the improved N supply in
the diet (Kariuki et al. 1998a, b and c). Some of these benefits are difficult to demonstrate
on-farm and others like soil fertility improvements are long term.
When the research team introduced D. intortum to farmers in Central Kenya, higher DM
yields, higher N content yields and improved BNF were the benefits emphasised. These
were the same benefits observed in on-station work (Mwangi 1999). A benefit that was
observed on-station, but not emphasised by the research team when it discussed the benefits
of the legume with farmers, was weed suppression by the legume when grown together with
Napier grass. This turned out to be the most important benefit to the farmers, as they could
easily observe and quantify it.
Napier grass is usually cut after 4–6 weeks of regrowth. After each cut the plot should be
weeded. Therefore, with a minimum of four cuts per year the plot has to be weeded four
times. It takes eight man-days to weed one hectare of Napier grass. At the current rate of
KSh 150 (US$ 1 = Ksh 78.9) per day, it would cost at least KSh 4800 (US$ 60) per year to
weed a hectare of Napier grass. The saving incurred due to weed suppression by the legume
is attractive to farmers and is the main benefit they see in the legume technology. Therefore,
although the farmers have not realised the effect of the technology on livestock
performance, which the research team emphasised, they are ready to adopt the technology
because of other benefits, such as weed control.
Poor persistency of the legumes when grown togetherwith Napier grassPoor persistency of D. intortum when grown together with Napier grass was cited by the
farmers as a major constraint in this technology. One farm had a substantial amount of D.
intortum growing in a pure stand, but apart from this there was no trace of the legume in the
Napier grass plots. It was suspected that Napier grass, which is a very competitive grass, had
‘edged out’ the legume through competition. This apparent lack of persistency could have
been caused by one of several factors: (i) The management (i.e. spacing, harvesting
frequency, manure application etc.) of Napier grass was not adjusted to accommodate the
legume in the intercrop; (ii) The legume was planted in the same row with Napier grass,
tending to maximise between species competition; (iii) The legume seed was drilled into an
established stand of Napier grass, therefore, giving the young seedlings little chance to
survive.
476 South–South Workshop
Mwangi and Wambugu
Experience with lain Calliandra calothyrsus inCentral KenyaSince the 1980s, C. calothyrsus has been seen as a potentially important N rich supplement
for increased milk production. The focus has been on integrating calliandra into the
existing cropping system on smallholder farms. In this regard, several niches have been
identified into which calliandra can be cultivated (Paterson et al. 1996b) including:
• hedges around the farm compound
• along contours and soil conservation terraces
• intercropped with Napier grass
• between upper storey trees (mainly under Grevillea robusta).
As with the herbaceous legumes, the benefits of growing C. calothyrsus in different niches
have been clearly demonstrated in research experiments. Napier grass DM yield in the rainy
season was not affected by intercropping it with C. calothyrsus (NARP 1993) but dry season DM
yield was reported to increase (Nyaata 1998). Feeding trials have considered C. calothyrsus as a
supplement to the basal diet of Napier grass and as a substitute to dairy meal (Paterson et al.
1996a). Supplementing milking animals with one kg of fresh C. calothyrsus increased milk yield
from 10 to 10.75 kg/cow perday (Paterson et al. 1996b). Despite these benefits, adoption of C.
calothyrsus by smallholder farmers has been poor. Farm survey reports attribute poor adoption of
C. calothyrsus to lack of seed/seedlings but personal observation and discussion with farmers
indicate that objectives of introducing the trees were not discussed sufficiently with farmers.
Lack of planting materialAlthough fodder trees are currently gaining popularity in smallholder farming systems,
most of the seeds come from international research centres, such as International Centre
for Research in Agroforestry (ICRAF), non-governmental organisations (NGOs) and
localised harvests in Western Kenya and Embu (Franzel et al. 1999; Wambugu 2000). This
short supply of seeds has constrained the adoption of calliandra by smallholders (Gerrits
2000; Personal observation). Farmers rarely collect or use seeds from their own farms or
from their neighbours, as they still expect the tree seedlings or seeds from projects, NGOs
and international centres (Franzel et al. 1999). Currently, efforts are underway to overcome
this constraint by training and encouraging farmers and farmer groups to produce and use
their own seeds (Gerrits 2000; Wambugu, unpublished information). Unlike the case of D.
intortum, vegetative propagation of calliandra is not an option. Therefore, the way forward is
for the farmers, either in groups or as individuals, to produce seeds by having seed orchards
or by not coppicing a number of trees so that they can produce seeds.
Lack of clear objectivesA farmer needs 500 calliandra trees to feed a cow throughout the year at a rate of two kg
DM/day (Paterson et al. 1996b, c), whereas often farmers have less than a hundred trees. In
South–South Workshop 477
Forage legume technologies: Participatory experiences with farmers and CBOs
the Embu area, which is considered to have the highest adoption in the country, only one
farmer out of 45 sampled, claimed to have enough calliandra trees to feed his cows through
out the year. It is currently not uncommon to find a farmer with less than 10 calliandra trees.
Therefore, the amount available to feed to livestock is small.
The major introduction of multipurpose trees was spearheaded by the NDDP in many
of the dairy areas in the country. It appears that the number of trees required to effectively
feed a cow and the management of the trees to maximise biomass production was not
discussed (personal observation). On farms where the NDDP operated, it is common to
find two or three tall trees with no efforts having been made to increase the number planted
or to manage the trees to form a hedge. In the case of dairy farmers in Central Kenya, there is
need to expand the number of calliandra trees to reach the recommended 500 trees/cow or
to recommend appropriate feeding practices to farmers which make best use of the limited
quantity available.
Current approach for the introduction of forage legumesin Central KenyaAfter evaluating forage legumes and validating the results on-farm, the main challenge is the
scaling up and scaling out of the technology. If a technology is to have impact in an area,
then many more farmers than those involved in the pilot/testing group must adopt the
technology. In the past, introduction of both herbaceous and shrubby legumes has been
through individual farmers. This approach has its limitations, especially where nurseries
have to be established.
In the scaling up and scaling out stage, the group approach was adopted. The group
approach means that the farmers can share the cost in terms of labour or inputs required for
the nursery. The presence of many organised farmer groups (i.e. self-help groups, farmer
co-operatives etc.) provides a favourable environment for awareness creation, training and
distribution of planting materials. Participatory approaches are being used in training and
working with farmers and partners from public extension services, community-based
organisations and NGOs. This is aimed at developing and enhancing strategic partnerships
with farmers, researchers, extension agents (both public and private) and farmers. In this
approach, SLP is working with 150 farmer groups, 4 local NGOs, 1 international NGO and
10 community-based organisations (Wambugu 2000) to disseminate C. Calothyrsus.
D. intortum integration with Napier grass was a success story in a small area and with a few
farmers. The challenge now is that of scaling up. The Smallholder Dairy Project (SDP) is a
collaborative effort between the Ministry of Agriculture and Rural Development (MoARD),
KARI and the International Livestock Research Institute (ILRI) with funds from the
Department for International Development (DfID). The project goal is to improve access by
poor dairy farmers to goods, services and favourable market conditions and of other farmers
to knowledge services. The D. intortum technology has the potential to contribute to the
project goal by improving the feed supply to dairy cattle and, therefore, SDP is involved in
the scaling up and scaling out process.
478 South–South Workshop
Mwangi and Wambugu

Geographic information system (GIS) tools were used to determine areas in the country
where the legume would grow based on biophysical conditions. Furthermore, areas where
adoption of the technology was most likely were identified using market accessibility,
production systems and levels of intensification. After the areas were identified, the group
approach was adopted. In areas where SLP was working to promote C. calothyrsus a decision
was made to link into the same farmer groups. This reduced costs in terms of the time and
resources required to mobilise farmer groups and to characterise them. Moreover, it also
gave the farmers a choice in terms of the forage legume they could plant.
Implications and lessons learntOne of the lessons learnt from this work is that availability and cost can curtail the adoption
of an otherwise excellent technology. In both cases presented here, availability of planting
material and the ease of propagation have been shown to be critical issues that must be
addressed if the technologies are to be adopted by farmers. Giving farmers free seedlings or
seeds from international research centres, research projects or NGOs reduce the farmers’
abilities to use other resources available at farm level, as they will expect more free planting
material. This was and might still be the case with C. calothyrsus in Central Kenya. On the other
hand, it will be futile to introduce the technology without making some planting material
available. Therefore, the aim should be to move the farmers from the point where they are
dependent on international centres and NGOs to a point where they can handle the
technology with little or no intervention from outside their systems. Consequently, it would
be wise to address the problems of germplasm availability and propagation early in the phase
of forage technology development, otherwise adoption will be poor.
Adoption of any technology is enhanced when farmers can easily see the benefits.
Therefore, short-term benefits should be emphasised although the long-term ones should
also be mentioned. Visits to research centres or to other farmers will help farmers to
visualise the potential the technology has. In situations where ‘mother–baby’ trials can be
set up, they should be encouraged as the mother trials help the farmer to see the potential of
the technology in their own environment rather than in research centres where the
situation might be very different. In mother–baby trials an on-station type trial (mother
trial) is established in the target area. Biological data are collected from this trial but farmers
are encouraged to observe what is happening and to pick a few of the species/cultivars of
forage planted in order to experiment with them further on their farms in the baby trials.
Working with farmer groups might enhance adoption of technologies, as the farmers
share experiences, labour and other inputs required for the technology to succeed. It may
enhance wider adoption even if the most proactive farmers are upset since they feel they are
making effort for the weaker farmers who gain benefits they feel should remain with them. It
is necessary to tell the farmers the minimum they would have to do to see any effects/
benefits of the technology.
Germplasm evaluation should be carried out in the system where the forage will be
grown. Currently, forage legumes are evaluated in small plots and in pure stands while may
be the eventual aim is to grow them together with companion grass. In the current method
South–South Workshop 479
Forage legume technologies: Participatory experiences with farmers and CBOs

of evaluation, DM yield is the main factor considered while the ability to fit into a system
(i.e. intercropping) might be a better issue to consider.
The participatory approach is expensive and time consuming but the benefits might
outweigh the cost.
Questions1. Germplasm availability was identified as a major constraint to farmers adopting forage
legume technology. Two potential solutions were identified in this case study. What
other options can be used to get forage legume germplasm into farmer’s fields?
2. Should agronomist change the way they screen forage legumes and start screening them
in the production systems that the legume will be grown in? What would be the
implications of the approach on costs?
3. Participatory approaches and forging of partnerships are expensive and time
consuming. How can the costs be reduced and what is the experience with this approach
in other areas?
4. If farmers have to adopt a technology the benefits must be demonstrated. This is even
more complicated when the benefits are long term, i.e. improving soil fertility or in the
case of forage legumes where they have to be utilised through the animal. The
mother–baby trial is an approach aimed at demonstrating the benefits of new
technologies. What is the experience with mother–baby trials and what other
approaches can be used? Would farmer field schools be a suitable alternative?
ReferencesAnindo D.O. and Potter H.L. 1986. Milk production from Napier grass (Pennisetum purpureum) in a
zero-grazing feeding system. East African Agricultural and Forestry Journal 52:106–111.
Anon. 1985. Ministry of Livestock Development. Annual Report. Ministry of Livestock Development,Nairobi, Kenya.
Anon. 1987. Fertiliser use recommendation project: Description of the first priority sites in the various districts
(Murang’a District). Report 21. Ministry of Agriculture. National Agricultural Laboratories,Kenya.
Bayer W. 1990. Napier grass—a promising fodder for smallholder livestock production in the tropics.Plant Research and Development 31:103–111.
Cadisch G., Sylvester-Bradley R. and Nosberger J. 1989. 15N-based estimation of nitrogen fixation byeight tropical forage-legumes at two levels of P:K supply. Field Crops Research 22:181–194.
CBS (Central Bureau of Statistics). 1994. Kenya population census 1989. Volume 1. Office of theVice-President and Ministry of Planning and National Development, Nairobi, Kenya.
DANIDA (Danish International Development Agency)/MoLD (Ministry of Livestock Development).1991. Kenya dairy master plan. Study report. DANIDA and MoLD, Nairobi, Kenya.
480 South–South Workshop
Mwangi and Wambugu
Franzel S., Arimi H., Murithi F. and Karanja J. 1999. Calliandra calothyrsus: Assessing the early stages of
adoption of a fodder tree in the highlands of Central Kenya. AFRENA Report 127. ICRAF(International Centre for Research in Agro-forestry), Nairobi, Kenya. 19 pp.
Gerrits A. 2000. Dissemination of fodder materials in the Central Highlands of Kenya. In:Calliandra calothyrusus and other fodder trees: Moving forward in research and development. OxfordForestry Institute, Oxford, UK, and ICRAF (International Centre for Research in Agro-forestry),Nairobi, Kenya. pp. 12–14.
Gitau G.K., O’Callaghan C.J., McDermott J., Omore A., Odima P.A., Mulei C.M. and Kilungo J.K.1994. Description of smallholder dairy farms in Kiambu district, Kenya. Preventative Veterinary
Medicine 21:155–166.
Ibrahim M.A. 1994. Compatibility, persistence and productivity of grass-legume mixtures for sustainable
animal production in the Atlantic zone of Costa Rica. PhD thesis, Wageningen AgriculturalUniversity, Wageningen, The Netherlands.
Kariuki J.N., Boer H., Tamminga S., Gitau G.K., Gachuiri C.K. and Muia J.M. 1998a. Rumendegradation and intestinal digestion of protein in Napier grass and other Kenyan forages. Animal
Feed Science and Technology (in press).
Kariuki J.N., Gitau G.K., Gachuiri C.K., Tamminga S. and Muia J.M.K. 1998b. Effect ofsupplementing Napier grass with desmodium and lucerne on intake and weight gains in dairyheifers. Livestock Production Science 60(1):81–88.
Kariuki J.N., Tamminga S., Gachuiri C.K., Gitau G.K. and Muia J.M.K. 1998c. Intake, DMdegradation and rumen fermentation as affected by varying levels of desmodium and sweetpotato vines in Napier grass fed to cattle. Animal Feed Science and Technology (in press).
Keya N.C.O. and Kalangi D.W. 1973. The seeding and superphosphate rates for the establishmentof Desmodium uncinatum (Jacq) DC by oversowing in uncultivated grasslands of Western Kenya.Tropical Grasslands 7:319–325.
Keya N.C.O., Olsen F.J. and Holliday R. 1971. The role of superphosphate in the establishment ofoversown tropical legumes in natural grasslands of Western Kenya. Tropical Grasslands
5:109–116.
Little D.A. and Said A.N. (eds). 1987. Utilization of agricultural by-products as livestock feeds in Africa.
Proceedings of a workshop held at Ryall’s Hotel, Blantyre, Malawi, September 1986. ILCA (InternationalLivestock Centre for Africa), Addis Ababa, Ethiopia. 179 pp.
Mbogoh S.G. 1984. Dairy development and internal marketing in sub-Saharan Africa: Some preliminary
indicators of policy impacts. ILCA (International Livestock Centre for Africa), Addis Ababa,Ethiopia.
Methu J.N. 1998. Strategies for utilisation of maize stover and thinnings as dry season feed for dairy cows in
Kenya. PhD thesis, University of Reading, Reading, UK.
Methu J.N., Owen E., Abate A., Mwangi D.M. and Tanner J. 1996. Smallholder dairying in CentralKenya Highlands: Practices in the utilization of maize stover as a feed resource. In: Fungoh P.O.and Mbadi G.C.O. (eds), Focus on agricultural research for sustainable development in a changing
economic environment. KARI (Kenya Agricultrual Research Institute), Nairobi, Kenya. pp.243–251.
Mureithi J.G. 1992. Alley cropping with leucaena for food and fodder production in smallholder farms in
lowland Coastal Kenya. PhD thesis, University of Reading, Reading, UK.
Mureithi J.G., Tayler R.S. and Thorpe W. 1995. Productivity of alley farming with leucaena(Leucaena leucecaphala Lam. de Wit) and Napier grass (Pennisetum purpureum K. Schum) in coastallowland Kenya. Agroforestry Systems 31:59–78.
South–South Workshop 481
Forage legume technologies: Participatory experiences with farmers and CBOs

Mwangi D.M. 1994. Survey on feeds, feeding and livestock management in Central Kenya. In:Proceedings of the 2nd KARI scientific conference. KARI (Kenya Agricultural Research Institute),Nairobi, Kenya.
Mwangi D.M. 1999. Integration of herbaceous legumes into Napier grass fodder systems in Central Kenya:
Constraints and potential. PhD thesis, University of London, London, UK.
Mwangi D.M., Thorpe W., Methu J.N., G., M., Chui J.N., Musembi F.K., Lukuyu M., Chege L.,Mutuota J. and Odongo N.E. 1995. Factors affecting the adoption of planted forages in theNairobi milk shed: Report on participatory rural appraisals conducted in Kiambu, Kenya. KenyaAgricultural Research Institute (KARI), National Agricultural Research Centre, Muguga, Kenya.
NARP (National Agro-forestry Research Project). 1993. National Agro-forestry Research Project.Kenya Agricultural Research Institute (KARI) Regional Research Centre—Embu. AFRENA.Report 69. Nairobi, Kenya.
NDDP (National Dairy Development Project). 1990. Dairy Report: National Dairy DevelopmentProject. NDDP, Naivasha, Kenya.
Nicholson J.W.G. 1984. Digestibility, nutritive value and feed intake. In: Sundtol F. and Owen E.(eds), Straw and fibrous by-products as feed. Elsevier, Amsterdam, The Netherlands. pp. 340–372.
Nyaata O.Z. 1998. Management of Calliandra calothyrsus in association with Pennisetum purpureumfor increased dry season forage production on smallholder dairy farms in Central Kenya. PhD thesis,University of Reading, Reading, UK.
Omore A., Muriuki H., Kenyanjui M., Owango M. and Staal S. 1999. The Kenya dairy subsector. A rapid
appraisal. MoA (Ministry of Agriculture)/KARI (Kenya Agricultural Research Institute)/ILRI(International Livestock Research Institute), Nairobi, Kenya.
Onim J.F.M., Otieno K. and Getz W. 1991. Development of Maseno double cobber maize cultivarfor high forage and grain yield. In: Proceedings of the nineth Small Ruminant CRSP scientific workshop
held at Ketri-Mugaga, 27–28 February 1991. KARI SR-CRSP (Kenya Agricultural Research Istitute,Small Ruminant–Collaborative Research Support Programme), Nairobi, Kenya. pp. 108–116.
Paterson R.T., Kiruiro E. and Arimi H.K. 1996a. The use of Calliandra calothyrsus for milk production.
NARP (National Agro-forestry Research Project), Embu, Kenya.
Paterson R.T., Roothaert R. and Kariuki I.W. 1996b. Fodder trees in agro-forestry: The Kenyaapproach.
Paterson R.T., Roothaert R., Nyaata O.Z., Akyeampong E. and Hove L. 1996c. Experience withCalliandra calothyrsus as a feed for livestock in Africa. In: Evans D.O. (ed), The genus Calliandra.
Proceedings of an international workshop. Winrock International Institute for Animal Agriculture, Bogor,
Indonesia.
Potter H.L. 1987. Inventory of feed resources for the smallholder farmer in Kenya. In: Proceedings of
the 2nd PANESA Workshop. IDRC (International Development Reseach Centre), Nairobi, Kenya.pp. 2–22.
Reategui K., Vera R.R., Loker W.L. and Vasquez M. 1995. On farm grass-legume pastureperformance in the Peruvian rainforest. Experimental Agriculture 31:227–239.
Said A.N. and Wanyoike M.M. 1987. The prospect of utilizing urea-treated maize stover bysmallholders in Kenya. In: Little D.A. and Said A.N. (eds), Utilization of agricultural by-products as
livestock feeds in Africa. Proceedings of a workshop held at Ryall’s Hotel, Blantyre, Malawi, September
1986. ILCA (International Livestock Centre for Africa), Addis Ababa, Ethiopia. pp. 15–26.
Saka A.R., Haque I., Said A.N., Lupwayi N.Z. and El-Wakeel A. 1994. Forage legumes in crop–livestock
systems of sub-Saharan Africa. Environmental Sciences Working Document 24. ILCA(International Livestock Centre for Africa), Addis Ababa, Ethiopia. 82 pp.
482 South–South Workshop
Mwangi and Wambugu
Shehu Y. and Akinola J.O. 1995. The productivity of pure and mixed grass-legume pastures in thenorthern Guinea savanna zone of Nigeria. Tropical Grasslands 29:115–121.
Staal S., Chege L., Kenyanjui M., Kimari A., Lukuyu B., Njubi D., Owango M., Tanner J., Thorpe W.and Wambugu M. 1998. A cross-sectional survey of Kiambu District for the identification oftarget groups of smallholder dairy producers. KARI/ILRI collaborative project research report,Nairobi, Kenya.
Stotz D. 1983. Production techniques and economics of smallholder livestock production systems in Kenya.
Farm management handbook of Kenya. Ministry of Livestock Development, Nairobi, Kenya.
Thomas D. and Sumberg J.E. 1995. A review of the evaluation and use of tropical forage legumes insub-Saharan Africa. Agriculture, Ecosystems and Environment 54:151–163.
Thorne P.J. and Cadisch G. 1998. ANORAC. Allocation of nitrogen in organic resources for animals and
crops. NRI (Natural Resources Institute), Chatham, UK.
Wambugu C. 2000. Dissemination of fodder materials in the Central Highlands of Kenya. In:Calliandra calothyrsus and other fodder trees: Moving forward in research and development. OxfordForestry Institute, Oxford, UK, and ICRAF (International Centre for Research in Agroforestry) ,Nairobi, Kenya. 9 pp.
Wandera J.L. 1995. Pasture/Fodder Research Program. National Agricultural Research Centre, KARI(Kenya Agricultural Research Institute), Kitale, Kenya.
South–South Workshop 483
Forage legume technologies: Participatory experiences with farmers and CBOs
A case study on adoption of urea molassesmineral blocksI. Patel
Professor, Institute of Rural Management, Anand 388001, India
IntroductionIndia is the largest milk producing country in the world. In 1997, total milk production in
the country was 72 million tonnes, accounting for 13% of the world’s total milk production.
India also has 16% (960.18 million head) of the world’s total bovine population (MoA
1999). During the last three decades, the progress made by the country in increasing milk
production is remarkable. Annual milk production in India has made a quantum jump
from 22 million tonnes in 1970 to 74 million tonnes in 1998–99. The Indian dairy sector
consists predominantly of small-scale milk producers who generally keep on an average two
milch animals. The households of marginal and small farmers, and landless labourers
constitute about 76% of the total milch animal owning households and include
approximately 65% of the total number of milch animals. They contribute about 65% of
the total milk production of the country (NCAER 1999). In India, the co-operative dairy
sector, based on the famous Anand Pattern with a three-tier structure (village, district and
state levels), has played an important role in bringing the benefits of dairying to the
small-scale milk producers.
Despite India’s large volume of milk production, the average productivity of milch
animals is quite low. This is attributed to low genetic potential for milk production, poor
nutrition and poor management and care of the milch animals (Jain et al. 1996). Proper
feeding of the animals is essential for improving their productive potential. Most of the
small-scale dairy farmers’ animals, however, survive on crop residues and natural herbage
(grass, tree leaves etc.) which do not provide adequate nutrients to the animals for
improving their growth and exploiting their productive potential. In general, low quality
crop residues are deficient in fermentable nitrogen, carbohydrates and important
minerals.
For supplementing the crop residue-based diet of large and small ruminants, the use
of urea–molasses mineral block (UMMB) licks has been recommended by many
livestock researchers. In India, the National Dairy Development Board (NDDB) and a
few other research institutes have engaged in research for development of new types of
low-cost urea molasses products. Such products include urea treated straw, UMMBs
and molasses-urea enriched straw, all of which aim to improve the nutritive value of the
traditional straw-based diet thus promoting healthy growth and milk productivity of
dairy animals.
484 South–South Workshop

Benefits of using UMMB are well documented by researchers in developed and
developing countries (Garg et al. 1998). However, research on adoption of UMMB licks
among milk producers, particularly among dairy farmers in developing countries is very
limited. Even in India, where UMMB production technology and the product were
introduced in the co-operative dairy sector in 1984, systematic research on the adoption of
UMMB technology by co-operative milk unions and milk producers is very limited. A few
studies have focused on understanding the marketing of UMMBs (Sethi 1990; Singh and
Mukherjee 1996). However, seldom are efforts made to examine the diffusion and adoption
of UMMB among small-scale dairy farmers. In light of the limited research on the adoption
of UMMB by milk producers in India, a systematic and large-scale study in this area could be
very useful.
This case study focuses on understanding salient issues in the diffusion and
adoption of UMMB among dairy farmers. The scope of the study is limited to Gujarat, a
state with a successful co-operative movement, based on the Anand Pattern.
Specifically, an attempt is made to understand the differential adoption of UMMB by
different categories of farmers in order to find out whether there is a need to
change/modify the technology, extension and popularisation methods and also the
approach to developing such technologies.
MethodologyAs a result of time constraints, the case study was focused on two leading milk unions of
Gujarat, namely the Kaira District Co-operative Milk Producers’ Union (known as Amul)
and the Mehsana District Co-operative Milk Producers’ Union Limited. The NDDB
worked closely with these unions in the initial stages of demonstrating and popularising the
use of UMMB among dairy farmers.
Discussion is based on primary and secondary sources of information. To understand
the diffusion and adoption of UMMB, focus group discussions and structured interviews
were conducted with key informants (such as research scientists, NDDB officers, extension
staff and officers of the selected unions and dairy farmers) in the selected villages, namely
Haijarabad and Chikhodara in Amul’s milk shed and Parsa, Bhesana, Indrapura and
Bhimapura in the Mehsana milk shed. These villages were selected, in consultation with the
staff of the co-operative unions, because some efforts had been made in these villages to
demonstrate and popularise UMMB licks. In addition, secondary sources of information,
such as annual reports of the milk unions and annual reports of village milk co-operative
societies etc. were also reviewed. Given the time constraints, the case study is based on
limited field research; hence, the findings of the case study indicate trends, which need to be
examined in detail with systematic and large-scale research.
Discussion is organised in three major sections. First, development of the technological
innovation and its diffusion among the selected co-operative milk unions is reviewed.
Secondly, adoption of UMMB among smallholders in the Amul and Mehsana milk sheds is
examined on the basis of the limited field research. Finally, the trends emerging from the
case study are discussed.
South–South Workshop 485
A case study on adoption of urea molasses mineral blocks
Development and diffusion of UMMB technologyIn the 1970s, when Operation Flood was launched by the NDDB in India, overall milk
production was far below the national requirements. To enhance the nutrition and
productivity of animals, and bring widespread economic benefits to milk producers, the
NDDB under the Operation Flood Programme established cattle feed plants throughout
the country to make reasonably priced compounded cattle feed and bypass protein feed
available to farmers.
Research and developmentFor efficient digestion of crop residues in the rumen, it is essential that a certain
concentration of ammonia-nitrogen be maintained in the rumen. This level is difficult to
achieve on a crop residues-based basal diet. Several researchers have shown that this level
can be achieved by supplementing UMMB in the ration of animals. In this regard, the
technological innovation of the UMMB has been an important breakthrough for
enhancing the productivity and nutrition of dairy animals. The UMMB is essentially a feed
supplement that provides soluble nitrogen, fermentable energy and minerals to
micro-organisms in the rumen. It consists of urea, molasses, some proteins, minerals and
gelling agents.
On the basis of a series of experiments and trials at the laboratory, farm and village levels,
the NDDB developed UMMB licks in the early 1980s and standardised the formulation for
commercial production. Laboratory trials were carried out with nearly 200 formulations.
For production of UMMB, the NDDB experimented with a hot process (Kunju 1986).
Furthermore, the NDDB also designed and fabricated the first UMMB manufacturing
plant for commercial production and, in 1984, commissioned it at the Amul cattle feed
plant. This was followed in 1985 by the commissioning of a second plant at the Boriavi
cattle feed plant of Mehsana Milk Union.
The ‘hot process’ of manufacturing UMMB was found to be labour and energy
intensive. There was also a serious problem of melting and de-shaping blocks from the
‘hot process’. Therefore, between 1984 and 1993, NDDB made earnest research efforts
and succeeded in producing UMMB by a ‘cold process’ (Garg et al. 1998). In
collaboration with an equipment fabricator, the NDDB also developed a device for
manufacturing rectangular UMMB licks weighing 3 kg each, through the ‘cold process’.
Thus, technological innovation of UMMB licks consisted of the formulation
(ingredients), the process of mixing the ingredients and the cost-effective device for
manufacturing UMMBs.
Research and field trials of UMMB in the villages have shown encouraging results (Box
1). However, it is important to emphasise here that after adoption of UMMB licks, the
benefits are not visible immediately. It takes at least two weeks and is dependent upon
regular licking of the blocks by the animals and on livestock feeding patterns.
486 South–South Workshop
Patel
Diffusion of UMMB technology by NDDBFirst, the NDDB conducted a demonstration-cum-popularisation programme in Gujarat to
demonstrate the benefits of UMMB; this was then revised and expanded to other states,
such as Rajasthan, Orissa and Kerala. In the initial stage, the NDDB focused on feeding
trials and a popularisation programme in selected villages of the Kheda and Mehsana milk
sheds. During the trial phase, NDDB conducted a series of meetings, seminars, workshops
and training programmes. Moreover, they carried out extension activities with all the
concerned persons from the village level upward to the union level (i.e. farmers, promoters,
union officials and extension staff etc.) in order to demonstrate the benefits of UMMB and
popularise it among the milk producers. NDDB also developed extension materials on
UMMB for the demonstration-cum-popularisation programme, such as a video film,
folders, posters, flip charts and slides, and an artwork for wall paintings in public places.
Based on the encouraging response of the field trials in Gujarat, in 1989, NDDB set up
eight UMMB plants (hot process) across the country under Operation Flood. Subsequently,
based on experiences in the Mehsana milk shed, a trial demonstration-cum-popularisation
programme was conducted in seven milk sheds of Rajasthan, namely Ajmer, Jaipur,
Jodhpur, Bhilwara, Bikaner, Pali and Ganganagar. The trial programme was pursued in
phases between November 1992 and March 1993. It was also introduced in one milk shed
in Orissa (Keonjhar) in April 1993 and two milk sheds (Eranakulam and Trivendrum) in
Kerala during September 1993. UMMB trials and popularisation programmes in the
selected milk sheds were conducted by NDDB and met all the requirements for training,
extension, feeding, recording, supervision, monitoring and review of progress etc. The
South–South Workshop 487
A case study on adoption of urea molasses mineral blocks
Box 1. Benefits of using urea molasses mineral blocks
The major advantage of using UMMB is improvement in the digestive efficiency of ruminants,
which brings many direct and indirect benefits:
• improvement in the utilisation of dry fodder and low wastage of fodder by the animals
• improvement in milk production and milk fat content
• better physical growth
• improvement in reproductive efficiency etc.
In the past, a series of on-station and field trials by NDDB have been conducted on the
animal response and economic benefits of using UMMB. Results summarised in the technical
bulletins on animal licks indicate improvement in straw utilisation, savings in the use of
concentrates and improvements in growth rate and milk production. Leng et al. (1991) reported
results of a study on Surati buffalo that examined milk production response and level of income.
Conventionally fed animals were compared with those fed UMMB and bypass protein along with
decreasing quantities of concentrate. Results showed that after reducing the amount of
concentrates by 40%, introduction of UMMB and bypass protein maintained milk yield and
increased income over feed cost by 2.50 Indian rupees (Rs)/day per animal (US$ 1 = Rs 45.5).
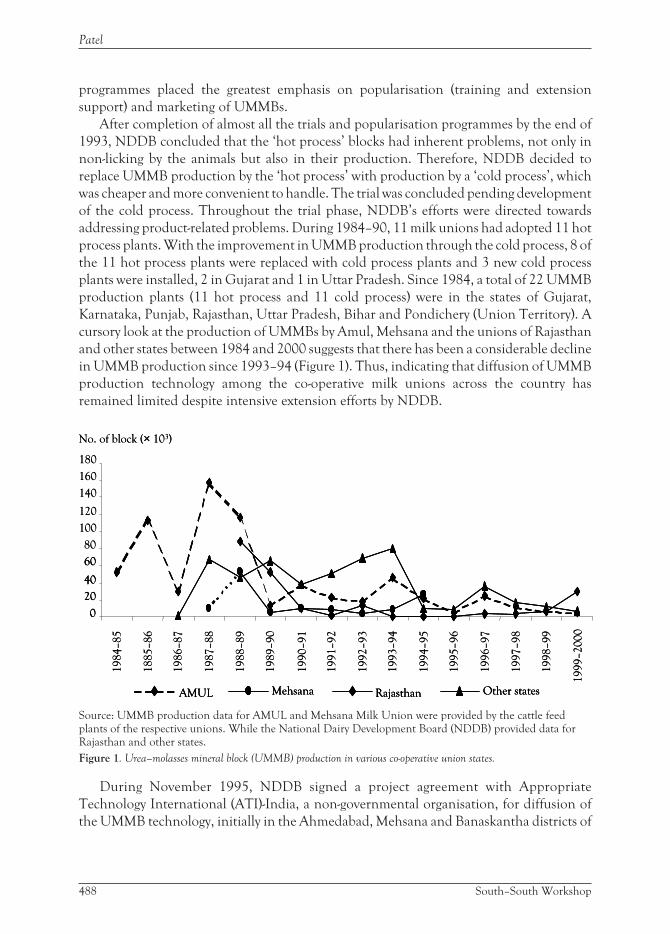
programmes placed the greatest emphasis on popularisation (training and extension
support) and marketing of UMMBs.
After completion of almost all the trials and popularisation programmes by the end of
1993, NDDB concluded that the ‘hot process’ blocks had inherent problems, not only in
non-licking by the animals but also in their production. Therefore, NDDB decided to
replace UMMB production by the ‘hot process’ with production by a ‘cold process’, which
was cheaper and more convenient to handle. The trial was concluded pending development
of the cold process. Throughout the trial phase, NDDB’s efforts were directed towards
addressing product-related problems. During 1984–90, 11 milk unions had adopted 11 hot
process plants. With the improvement in UMMB production through the cold process, 8 of
the 11 hot process plants were replaced with cold process plants and 3 new cold process
plants were installed, 2 in Gujarat and 1 in Uttar Pradesh. Since 1984, a total of 22 UMMB
production plants (11 hot process and 11 cold process) were in the states of Gujarat,
Karnataka, Punjab, Rajasthan, Uttar Pradesh, Bihar and Pondichery (Union Territory). A
cursory look at the production of UMMBs by Amul, Mehsana and the unions of Rajasthan
and other states between 1984 and 2000 suggests that there has been a considerable decline
in UMMB production since 1993–94 (Figure 1). Thus, indicating that diffusion of UMMB
production technology among the co-operative milk unions across the country has
remained limited despite intensive extension efforts by NDDB.
During November 1995, NDDB signed a project agreement with Appropriate
Technology International (ATI)-India, a non-governmental organisation, for diffusion of
the UMMB technology, initially in the Ahmedabad, Mehsana and Banaskantha districts of
488 South–South Workshop
Patel
0
20
40
60
80
100
120
140
160
180
1984–85
1885–86
1986–87
1987–88
1988–89
1989–90
1990–91
1991–92
1992–93
1993–94
1994–95
1995–96
1996–97
1997–98
1998–99
1999–2000
No. of block (× 103)
AMUL Mehsana Rajasthan Other states
0
20
40
60
0
20
40
60
80
100
120
140
160
180
1984–85
1885–86
1986–87
1987–88
1988–89
1989–90
1990–91
1991–92
1992–93
1993–94
1994–95
1995–96
1996–97
1997–98
1998–99
1999–2000
No. of block (× 103)
AMUL Mehsana Rajasthan Other statesAMUL Mehsana Rajasthan Other states
Source: UMMB production data for AMUL and Mehsana Milk Union were provided by the cattle feedplants of the respective unions. While the National Dairy Development Board (NDDB) provided data forRajasthan and other states.
Figure 1. Urea–molasses mineral block (UMMB) production in various co-operative union states.
Gujarat. Initially, the project was for five years. ATI promoted UMMB licks in the selected
districts with intensive extension and marketing efforts. During this period, ATI faced
several problems with the blocks including non-licking by the animals, melting and
de-shaping etc. Similar problems had been seen previously by the NDDB. ATI changed the
shape of the blocks from rectangular to hemispherical. However, the problem related to
licking persisted. The farmers often reported that animals were biting the blocks rather than
licking them. Use of inappropriate dispensers was another problem faced by ATI. Due to
product-related problems and rejection of UMMB by the dairy farmers, in 1998, ATI
switched over from UMMB to urea molasses granules (UMG) in the Mehsana milk shed.
Experiences with UMMB production technologyTo develop the UMMB production process (hot and cold) and production plant
technology, the NDDB worked closely with Amul and the Mehsana Milk Union. However,
the cattle feed factory at Boriavi could not maintain the quality of UMMBs, even through
the cold process, because of inconsistencies in the quality of locally available raw materials
and unskilled contractual labour. Hence, there was no substantial improvement in the
adoption of UMMBs by the dairy farmers after introduction of the cold process in the
Mehsana milk shed. Amul started production of UMMBs (cold process) by involving the
professional staff and ensuring the quality of ingredients (raw materials). Nonetheless, even
with quality assured, UMMB production did not increase because demand remained low
(Figure 1). The experiences of Amul and the Mehsana Milk Union with UMMB production
suggest that, in practice, the process of UMMB production is complex and requires
professional inputs. Unless proper attention is paid to operating the plant, UMMB quality
cannot be maintained.
The extension approach of Amul and Mehsana Milk UnionAmul and the Mehsana Milk Union promoted UMMB among dairy co-operative society
(DCS) staff and dairy farmers through concerted extension efforts. Focus group discussions
were carried out with the concerned officials and field staff of Amul and structured
interviews with the officials engaged in UMMB promotion in Mehsana milk shed. These
revealed that both unions used multi-pronged extension strategies to diffuse information
about UMMB at the village level and to encourage dairy farmers to use UMMB licks for
their animals. However, the extension approach differed between the unions.
Amul introduced UMMB to the dairy farmers for the first time in the mid-1980s
through the extension staff of the Department of Animal Husbandry, and the Department
of Procurement and Inputs. The selected individuals were released from their routine work
so that they could concentrate exclusively on diffusion of UMMB in the villages. Promotion
of UMMB was undertaken in the form of a campaign, known as chatan dan zumbesh. The key
extension strategy used for generation of awareness about UMMB was an intensive contact
programme in each village with the DCS staff, management committee members, members
of the village co-operative societies and other villagers. In general, efforts were made to first
South–South Workshop 489
A case study on adoption of urea molasses mineral blocks
convince the DCS Chairman and some of the influential and educated members of the
management committee, who were interested in increasing milk production of their dairy.
The extension staff also demonstrated the use of UMMB licks. The Amul patrika, a
fortnightly newsletter written in simple language and containing short articles, small posters
and stripson UMMB, posters and flyers were used for disseminating information among the
DCS members.
The extension approach of the Mehsana Milk Union for popularisation of UMMB was
somewhat different. Unlike Amul, extension work was taken up primarily by small teams of
extension staff, who were provided with all their prerequisites for field trials and extension
activities, including vehicles for mobility, salaries for the union staff/supervisors, extension
materials etc. Initially, the focus of extension efforts was on five to six experimental villages.
However, later on, two to three extension teams visited more than 400 DCSs to popularise
the UMMB. Extension was undertaken primarily through intensive contact programmes at
the village level. Discussions and meetings were held with milk producers, DCS staff and
management committee members, women dairy farmers and the villagers. Posters, film
shows and other educational materials, developed by NDDB, were also used to generate
awareness about UMMB licks and motivate dairy farmers to use them. During the annual
audit of DCS accounts, efforts were also made to persuade DCS staff to purchase UMMB
on a trial basis.
Given the high credibility of both unions, DCS staff and dairy farmers were receptive to
the use of UMMB to improve productivity of their animals. Extensive extension efforts
during the field trails in Amul and the Mehsana milk sheds succeeded in generating
awareness about UMMB among DCS staff and milk producers. On the basis of negative
feedback from the users of UMMB licks, several changes were made in the UMMB
production process and product. These included the shift from the hot to the cold process,
modification of the shape of blocks (from rectangular to round) and improvement in the
palatability of the blocks (by reducing the highly alkaline pH) etc. However, the intensive
extension efforts of both unions failed to persuade the dairy farmers to use UMMB licks on
a regular basis beyond the trial stage.
Adoption of UMMB among small dairy farmersWho were the adopters of UMMB in the Amul and Mehsana milk sheds? What were their
experiences in using UMMB licks? Discussions with the concerned extension staff of both
unions, DCS staff and milk producers in the selected villages threw light on the limited
adoption of UMMBs among the milk producers.
The early adopters of UMMBsIn Mehsana Milk Union, UMMB licks were first promoted free of charge in a few
experimental villages and then introduced for sale in additional villages through the
village dairy co-operatives. The officials of Mehsana Milk Union consider UMMB a very
490 South–South Workshop
Patel
useful product for milk producers in dry areas where animals’ diets are deficient in
nitrogen due to shortages of green fodder. Despite concerted extension efforts in
Mehsana milk shed, only a few large-scale milk producers from the dry areas adopted
UMMBs. Most of the early adopters of UMMB licks in Mehsana milk shed were primarily
concentrated in the green areas. Many of them had more than four animals. However,
most of them discontinued the use of UMMB after the trail phase. As a result, the demand
for UMMB declined.
Although Amul tried to popularise UMMB among all milk producers (including
smallholders), the early adopters of UMMB were primarily those who had taken up dairying
as an important income generating activity. They were educated and belonged to the upper
castes of the patels, brahmins and banias. They, particularly the patels, were ready to adopt
anything that would increase their income from dairying. They were progressive farmers
who were receptive to new ideas and strove to improve milk productivity. In the words of the
extension staff ‘their mindset was very different. Therefore, they adopted UMMB licks and
used them. Similar receptivity to new ideas is not found among other communities who are
in the dairy business now’.
For effective use of UMMB, it is essential that the block be put in a place that is accessible
to the animals so that they could easily lick the block as and when necessary. In the reality of
the field, however, this was not easy to achieve. Only a few large-scale milk producers had a
properly constructed and spacious cattle shed in which the UMMBs could be properly
placed. The availability of cattle sheds differed from place to place. In the villages of Kheda
District, the land available for cattle sheds was very limited. Generally, the animals were kept
in the courtyard in front of the house in a limited area. Often the animals were tied to a
pole/batten by a rope so that they could move around. In the green belt of the Mehsana milk
shed, cattle were kept in agricultural fields or tied to the trees in front of the vada (courtyard)
near the house. Some farmers kept their animals in fields during the day and brought them
home only in the evening for milking. Other milk producers took their animals to graze
instead of keeping them in one place for stall-feeding. In such situations, it was difficult for
the farmers to find an appropriate place for UMMBs.
Considerable efforts were made by NDDB to find an appropriate dispenser for holding
the UMMBs. However, none of the options offered an acceptable solution. For example,
initially the farmers used tagaras (small round metal vessels) for UMMB. As tagaras were
lightweight, the animals used to tip them over and the blocks became soiled. To solve this
problem, heavy cement blocks were introduced in the Mehsana milk shed for holding the
UMMBs. However, neither tagaras nor cement blocks offered the right solution; as these
dispensers were placed on the ground in front of the animals, cow dung, urine, dust, water,
straw etc. spoiled the UMMBs. Once the blocks were spoiled, the animals would not eat
them. NDDB further designed plastic dispensers for holding UMMBs. These plastic
dispensers could be hung where they were accessible to the animals; however, the animals
easily broke them, even when they were hung or placed above ground level. Similarly, metal
boxes were designed in such a way that the animals could not chew the UMMB, but could
easily lick them. Nevertheless, their use was also limited, as most farmers did not have a
proper place in their cattle shed to hang them.
South–South Workshop 491
A case study on adoption of urea molasses mineral blocks

Irrespective of the type of dispenser used, a common problem reported by the early
adopters was melting of the blocks. The blocks prepared through the hot process were
sensitive to humidity and temperature, and melted easily. This made the blocks very messy
and unhygienic. The blocks also attracted flies and other insects due to their molasses
content. Instead of licking the blocks over a period of time, some of the animals chewed
them. Unlike hot process blocks, the cold process blocks did not melt easily. However, some
of the animals did not lick the blocks, presumably because of problems in palatability. The
farmers sometimes used to sprinkle flour on the blocks to induce licking. Unused hard
blocks were wasted, dissolved in water or cut into small pieces and mixed with cattle feed.
The benefits of using UMMBs were not easily visible to the farmers when the animals did
not consume an adequate quantity of the blocks. Inability to maintain quality of the UMMB
was one of the major factors that adversely affected its use.
In summary, beyond the trial phase only a few small-scale milk producers used UMMB
licks on a continuous basis. In Mehsana Milk Union, from about 1998, some of the users of
UMMB from the green areas switched over from UMMB licks to urea molasses granules.
Unfortunately, the use of granules does not have adequate scientific support. Due to
once-a-day feeding practices, the granules release a short-lived high concentration of
ammonia in the rumen, much of which is wasted. In a few villages (Chikodara, Gopalpura,
Sarsa, Narsanda etc.) in Amul’s milk shed, however, some large-scale dairy farmers, who
have undertaken animal husbandry as a primary occupation, have continued to use
UMMBs.
Adoption of UMMB in Haijarabad villageHaijarabad, a small village with 400 households, and with a total area of 507 ha, is in Matar
Taluka of Kheda District. It is a multi-caste village inhabited by patels, pandya, brahmins,
baraiyas, ravals, harijans and Muslims. Agriculture is the main occupation and source of
income for most of the households of Haijarabad while animal production is a secondary
occupation for some of the villagers. Irrigation is available through canal and boreholes and
most farmers produce crops twice a year.
Haijarabad Dairy Co-operative Society (HDCS)
The Haijarabad DCS was established in 1959 and in the last two decades, membership and
milk procurement of the HDCS has increased substantially. Membership of HDCS more
than doubled between 1981 and 2000, from 295 to 610 members, whilst milk procurement
increased at the compound rate of about 3%. Of the 610 members of HDCS in 1999–2000,
about 600 members were smallholders, who owned one or two milch animals. Thus,
small-scale dairy farmers supply most of the milk for the HDCS.
Livestock censuses conducted by HDCS in 1990–91 and 1997–98 revealed that the
animal population of Haijarabad had declined by about 9% within this seven-year period.
The major reductions were in the populations of bullocks and buffalo.
492 South–South Workshop
Patel
Adoption study of UMMB among milk producers
UMMB, known locally as chatan dan or kala int, was first introduced in Haijarabad in
1984–85 by Amul. Haijarabad was selected by Amul as an experimental village to promote
UMMBs among small-scale milk producers. UMMBs were supplied free to DCS members
for trial. A quick review of UMMBs supplied to its members during 1984–91 shows that
adoption of UMMBs in Haijarabad was very limited. It was difficult to examine the level
of adoption among HDCS members as several years had passed since UMMB licks were
introduced in Haijarabad. However, 15 users of UMMB (14 men and 1 woman) were
identified with the help of DCS secretary and were interviewed with the help of a short
structured questionnaire. As it was a long time since people had used UMMB licks, they
could not provide precise and detailed information. Nonetheless, their responses shed
some light on the adoption of UMMB in Haijarabad.
Socio-economic background of the users of UMMB
The selected 15 respondents were from diverse social backgrounds; the 12 belonged to
the subcastes of patel, pandya, sisodiya and raval, and three of them were pathans
(Muslims). Educational level of the respondents was low; four were illiterate, six had
some primary education (up to 3–7 grades) and five had secondary education (up to
10th grade). The average family size of the respondents was 6.6. Except for three landless
labourers, agriculture was the main occupation of the respondents. Only two
respondents were engaged in service as a secondary occupation. Only one of the
respondents, a woman from the family of a small-scale farmer, mentioned animal
husbandry as a secondary income-generation activity. Most of the respondents (10 of
15) were marginal farmers with less than 1 ha of land; only two respondents owned more
than 2 ha of land.
All the respondents owned livestock, consisting of cattle and buffalo. There were
seven dairy farmers with 1–2 milch animals each and eight milk producers with 3–4 milch
animals each. Except for one respondent who had a pucca (properly constructed) cattle
shed with a proper roof and flooring, all other respondents kept their animals in thatched
cattle sheds near their houses. In general, the space for keeping the animals was very
limited. None of the respondents had undertaken dairy as an important
income-generation activity. For most of them, dairy was a source of supplementary
income. All the respondents used paddy straw as the main dry fodder; a few respondents
also used bajra (pearl millet) and jowar (sorghum) straws. Alfalfa was used as green fodder
by 12 of 15 respondents. Only one-third of respondents used grass, while use of maize and
bajra as green fodder was very limited. Amul dan was the most popular concentrate. While
cottonseed cake was used by one-third of the respondents, only a few respondents used
rice bran, wheat grain or maize cake.
It is against this socio-economic background of the responders that we will examine their
adoption behaviour.
South–South Workshop 493
A case study on adoption of urea molasses mineral blocks
Awareness about UMMB
How much information about UMMB had reached the villagers in Haijarabad? The users
received information about UMMB from various sources. Amul extension staff members
were the most important sources of information for the respondents. During their visit to
the HDCS, they had discussed the new product and its benefits with the DCS staff and
members of the management committee. All the respondents reported that members of the
HDCS management committee informed them about UMMB. Thus, the management
committee had played an important role in disseminating information about UMMB
among the members. Nine of 15 respondents came to know about UMMB through a
veterinary staff, who visited the village for pregnancy diagnosis or artificial insemination
and advised them to use UMMBs for pregnancy-related problems. Though HDCS received
material (posters, brochures, Amul patrika etc.), only two respondents learned about
UMMB from Amul patrika. In summary, Amul’s extension approach appeared to have
succeeded in disseminating information about UMMB among milk producers in
Haijarabad.
Except for one individual, all respondent were aware of UMMB as a feed supplement
with essential nutrients and were aware of its key benefits, such as an increase in milk
production, and improvement in the health and reproductive efficiency of the animals. The
respondents also knew about the procedure for using UMMBs. Most respondents used to
put the UMMB in a tagara (a metal utensil) in front of the animals. Initially, they used to
sprinkle wheat or bajra (pearl millet) flour on to the UMMB to induce the licking habit
among the animals. Except for three respondents, who used UMMBs for in-milk, dry and
pregnant animals, the rest used UMMBs for all their animals. It was not clear whether such
practice was followed because of free availability of UMMBs or because of perceived
benefits.
Experiences in using UMMBs
In general, any product for animals launched by Amul was viewed favourably by the
members, because of Amul’s high credibility among the members. The respondents used
the UMMBs during the trial stage; six of them used UMMBs during 1987–88 and the
remaining nine respondents tried them during 1988–89. It was difficult to assess the
quantity of UMMBs used per month per animal. The experiences of the farmers are
summarised below:
1. Seven of 15 respondents mentioned that UMMBs were good for the animals, but they
could not explain why.
2. One landless labourer reported that UMMBs were useful for improving reproductive
efficiency of the animals.
3. One marginal farmer thought that UMMBs were good for crossbred cows.
4. Common problems in using the UMMBs included melting of the blocks and spoiling of
the blocks by houseflies, ants, dust, dung, urine etc.
5. A few respondents reported shortages of utensils (tagara) for dispensing UMMBs.
494 South–South Workshop
Patel

In practice, benefits of UMMB were not visible to the respondents, as their animals
did not lick an adequate quantity of the blocks. The milk producers were not greatly
concerned about the long-term benefits of using UMMBs, for example the maintenance
of a constant level of milk production, reduction in inter-calving period, maturity of
calves, increase in food intake and improvement in animal health etc. As most of the milk
producers were not engaged in systematic livestock care, they did not notice some of these
benefits. Hence, most of them primarily used UMMBs while the blocks were provided
free of charge.
Adoption of UMMB: The perspective of women dairy farmers
As women dairy farmers are primarily responsible for animal husbandry, we tried to
question one successful woman dairy farmer and a few resource-poor women smallholders
about their perspective on the use of UMMB and the constraints to using them on a regular
basis.
The perspective of resource-poor woman dairy farmers
Focused group discussion was held with four poor Muslim women who had one to two
milch animals. Agricultural wage labour was their primary source of income. However,
full-time wage labour was available to them for only 120 days in a year. For them, animal
husbandry was a supplementary income generation activity. Most of the smallholders,
however, kept their milch animals in a subsistence manner. Rice and bajra (pearl millet)
straws were the major dry fodders and were usually available at affordable prices in the
village; however, due to drought this year, the smallholders had to buy dry fodder from the
market at a higher price. In the monsoon season, grass was usually available free of charge,
from agricultural fields where the smallholders worked. At times, they had to buy alfalfa
from other farmers for the lactating animals. All of the smallholders regularly used Amul
dan, the concentrate that they purchased from HDCS to maintain milk fat content.
According to them ‘without fat in the milk, there is no return for the money spent on the
animal’. Other concentrates, such as wheat grains, barley, maize etc. were given to the milch
animals only if money was available.
Thus, the resource-poor smallholders spent judiciously on fodder and feed. One in-milk
cow/buffalo normally gave two litres of milk/day for which the smallholders were paid 20
Indian rupees (Rs)/day (US$ 1 = Rs 45.5). About Rs 15/day was spent on Amul dan and
fodder. The net income of Rs 5/day from dairy was used for meeting household expenses.
Thus, they hardly had any surplus income to spend on a new feed supplement, such as
UMMB. Some of the resource-poor women dairy farmers had used UMMBs for a few days
when they were available free of charge from the HDCS, but they used each block
judiciously, only giving it to the animal at the time of feeding in the morning and evening.
Two women discontinued the use of UMMBs, as the animals that licked UMMBs were
eating more fodder, but not giving more milk and milk fat to compensate for the increased
expenses on fodder. Others found it inconvenient to use the blocks.
South–South Workshop 495
A case study on adoption of urea molasses mineral blocks
The perspective of a successful woman dairy farmer
Sumitraben Amratbhai Patel is a 33-year old marginal farmer with 0.46 ha of irrigated land.
She belongs to a nuclear family, consisting of her husband and two school-going children (a
son and a daughter). She is educated up to 10th grade. Sumitraben has taken up animal
husbandry as a primary occupation. Her husband also helps her to take care of their
animals. Her family grows three crops a year, such as tobacco, wheat, bajra (pearl millet),
jowar (sorghum) and rachaco (alfalfa). The gross annual family income is about 19 thousand
Indian rupees of which about 58% are from animal husbandry. According to Sumitraben,
50% of the dairy income goes towards maintenance of the animals.
After her marriage in 1984, Sumitraben started with two buffalo and later purchased
one cow with a loan from the bank. She used the income from cow milk to repay her loan
and to maintain her animals (for fodder, purchase of concentrates etc). She regularly saves
from her dairy income and has used the money to improve her assets (renovating her house,
purchasing land for building a new house and improving farmland). Sumitraben keeps only
two to three milch animals and maintains only those, which are regular milkers. She finds
that cows are more profitable than buffalo because they are less expensive and give milk for a
long duration.
She feeds all her animals on dry fodder, such as crop residues of rice, bajra (pearl millet)
and jowar (sorghum) that are available from her farm. Only in-milk animals are fed on green
alfalfa fodder, also grown in her fields. Concentrates are purchased from the market and
only given to the in-milk animals. Amul dan is used regularly and only when it is not
available does Sumitraben use cottonseed cake or sometimes rice bran and wheat. Recently,
she has started giving a mineral mixture to the milch animals and calves.
Sumitraben came to know about UMMBs in a village meeting and used them several
years ago, after purchasing blocks from the DCS. She was aware of UMMBs as a feed
supplement with nutrients. In her opinion, the benefits of UMMBs are (1) to increase feed
intake and (2) to improve health and reproductivity of the animals. However, she
discontinued the use of UMMB after a period of time because of inconvenience in using
UMMBs, wastage due to spoilage and the nuisance of flies and insects.
In summary, adoption of UMMBs in Haijarabad was limited. Most of the milk
producers did not use the blocks beyond the trial stage due to inconvenience in using the
blocks or due to invisibility of immediate and direct benefits in terms of increased milk
production and milk fat content. As there was very low demand for UMMBs in the village,
HDCS also did not purchase them.
Thus, the case study of UMMB diffusion and adoption among small-scale dairy farmers
shows that even an intensive extension approach is unlikely to be effective unless the
innovation that it promotes is perceived as relevant by the potential adopters and meets
their needs or solves their problems. Benefits of UMMB were not visible to the milk
producers, as for various reasons the animals did not lick adequate quantities of blocks. The
milk producers were not greatly concerned about the long-term benefits of using UMMBs,
as most of them were not engaged in systematic livestock care and consequently they did not
notice these benefits.
496 South–South Workshop
Patel

Lessons learnedThe NDDB has developed the UMMB technology to improve the milk productivity of dairy
farmers, particularly smallholders. This descriptive case study highlights the limited nature
of diffusion and adoption of UMMB technology among small-scale dairy farmers of Amul
and the Mehsana Milk Union in Gujarat. What are the lessons that can be learnt from this
case study?
Research and development of UMMBa. Before even developing UMMB or any such product there is a need to understand
livestock feeding patterns, changing farming systems and livestock practices of milk
producers in general and of smallholders in particular.
b. Field trials should be based on the ‘on-farm participatory approach’ that takes into
consideration the farmers’ evaluation of the product for development and modification
of the form of the product.
Thus, the key issue is as follows:
What should be the appropriate approach for developing innovations for small-scale
dairy farmers? Should it be from laboratory to farm, from farm to laboratory or a
combination of approaches?
Diffusion of UMMB through extensiona. The extension support or lack of it, for any innovation, can speed up or retard its rate of
adoption.
b. Institutional aspects of transferring research results are very important for
commercialisation and diffusion of new products.
What kind of extension approach is required for the persuasion and trial stages of the
adoption process?
Adoption of UMMB by small-scale dairy farmersa. Livestock feeding patterns of smallholders, including the use of UMMBs, are shaped by
the existing farming systems and livestock care practices.
b. Adoption of UMMBs by milk producers is influenced by the perceived direct benefits of
UMMB.
In summary, the major emphasis of development and diffusion of UMMB has been to
try to fit the innovative product within the existing system. Improving milk production of
the animals of small-scale dairy farmers from divergent livestock and farming systems needs
to move away from such a top–down approach for ‘transfer of technology’ to a
farmer-centred approach that is based on people’s felt needs and problems?
South–South Workshop 497
A case study on adoption of urea molasses mineral blocks

The case study is based on limited field research, however, the findings and the trends
discussed need to be examined further through in-depth and rigorous research, for a clearer
understanding of adoption processes and in order to develop an appropriate approach.
ReferencesGarg M.R., Mehta A.K. and Singh D.K. 1998. Advances in the production and use of urea molasses
mineral blocks in India. World Animal Review 90(1):22–27.
Jain D.K., Sharma K.N.S., Walli T.K. and Rai S.N. 1996. Estimates of nutrient requirement and
availability for bovine population across major states in India. Dairy Economics, Statistics andManagement Division, National Dairy Research Institute (ICAR), Karnal, India. 50 pp.
Kunju G.P.J. 1986. Urea molasses block: A feed supplement for ruminants. A paper presented at theinternational workshop on rice straw and related feeds in ruminant rations held at Anand,
Kandy, Sri Lanka, 24–28 March 1986. National Dairy Development Board, Anand, India. 17 pp.(mimeo).
Leng R.A., Preston T.R., Sansoucy R. and Kunju P.J.G. 1991. Multinutrient block as a strategicsupplement for ruminants. World Animal Review 67(1):11–19.
MoA (Ministry of Agriculture). 1999. Basis animal husbandry statistics 1999. Department of AnimalHusbandry and Dairying, MoA, New Delhi, India. 148 pp.
NCAER (National Council of Applied Economic Research). 1999. Impact evaluation of Operation
Flood on rural dairy sector. NCAER, New Delhi, India. 167 pp.
Sethi S. 1990. Study of the present sale profile of balanced cattle feed, urea molasses lick blocks,by-pass protein feeds and a strategy to market these products effectively (an NDDB New DelhiProject). Report of the Management Traineeship Segment–I, No. MTS-646, PRM 1989–91.Institute of Rural Management, Anand, India.
Singh A.K. and Mukherjee S. 1996. Monitor and analyse the findings of focus group trials aimed at test
marketing molasses urea block in the district of Ahmedabad. Report of the Management TraineeshipSegment–I, submitted to Appropriate Technology India (Ahmedabad), MTS-1149. Institute ofRural Management, Anand, India.
498 South–South Workshop
Patel
Farmers’ perceptions of service deliveryand policy support from smallholder dairyin Nepal: Nepal case studyD.D. Joshi
Director, National Zoonoses and Food Hygiene Research Centre (NZFHRC)Chairperson, Nepal Veterinary Council (NVC)
IntroductionIn a land area of 54.4 thousand square miles, Nepal has a population of 23 million people.
The total number of livestock is 9.71 million cattle and buffalo, 4.3 million sheep and goats,
4.9 million poultry, a small number of pigs, horses, mules, yak and chauries. The number of
people engaged in the agricultural sector is about 9.7 million, whereas the total number of
cattle and buffalo population is 9.71 million head. This shows that each farm household in
Nepal with 5.8 persons on the average keeps 5.8 livestock. Nepal ranks as one of the highest
amongst the developed countries in terms of population density of cattle and buffalo (CBS
1998).
FarmerThis is a case study of a 45 years old smallholder dairy farmer Mr Ram Prasad Bastola, from
Fical village of Ilam District, Mechi zone, Eastern Development region of Nepal. This case
study represents over 75 thousand such farmers of Nepal who are currently producing and
selling milk to the formal and informal dairy market channel of the country (DDC 1999).
Farmer’s selection was done on the basis of his involvement in dairy farming and milk
selling to the Milk Producing Co-operative Society (MPCS), member of this MPCS,
member of local farmers organisation and participation in different training programmes
organised locally by Fical Milk Chilling Centre (MCC), Department of Livestock Services
(DLS) and credit agencies. The interview was based on the structured questionnaire and
personal observation.
Mr Bastola has a small two story Pakka house made from stone with 1.5 ha of cultivated
land. He lives with his 60 years old mother, his 40 years old wife, one 15 years old son named
Shyam, two daughters Rita and Gita of 10 and 13 years old, respectively. He has secondary
education and can read and write Nepali very well. His son is in the 8th grade and goes to
school in Fical. His wife and two daughters are literate although never have been to high
school. His mother is illiterate.
South–South Workshop 499

Milk production in Nepal is an integrated part of the traditional production system with
small non-commercial holdings. Many of these small farmers market milk directly to urban areas
and the surplus through the DDC or private dairies. Milk and milk products provide an
important contribution to the nutrition of the many people living in rural areas as well as urban
Nepalese families. Farmers own about 40% of Nepal’s dairy livestock with less than 0.5 ha per
family (Ministry of Finance 1998). These farmers have few sources of generating cash income.
Their small plots of land are insufficient to feed their livestock so they have to depend on
communal pastures and forests that are over-utilised. It will require major efforts and
investments to introduce and motivate the large groups of small farmers to apply productive
technologies that are environmentally sustainable. However it seems the only option available.
MethodologyIn this case study I have used participatory rural appraisal (PRA) approach method to interview
an individual smallholder, Mr Ram Prasad Bastola, from Fical village of Ilam District with cow
milk pockets. This case study has used both the primary and secondary level information. The
case study is based on a review related documents, supplementary primary field survey,
discussion and interview with specialists and interactive meetings with observations.
In this PRA approach method I asked the farmer some questions and discussed with his
family members on the following topics:
• agricultural farming practices
• farming responsibilities by family members
• milk production and marketing
• milk consumption at home
• milk price
• animal feed, pasture and management
• livestock extension and research
• Milk Producers Co-operative Society and linkages with DDC Co-operative in milk
marketing
• farmers training on dairying by the Department of Livestock Services (DLS) or DDC or
National Dairy Development Board (NDDB) inside and outside country
• bank loan for animal purchase
• animal insurance
• world trade information
• government livestock development policy and
• dairy development issues and constraints.
ResultsMr and Mrs Bastola produce crops, livestock and mixed farming as an integrated approach.
They grow mostly paddy maize, beans, millets and little potatoes with green vegetables for
500 South–South Workshop
Joshi

their own home consumption. Mr Bastola has two milking cows, one local breed called ‘Siri’
and other Jercy crossbred, with one calf and one heifer along with two goats and one dog.
Mrs Bastola has a major responsibility to look after cow feeding, milking and cleaning
the cowshed. Sometimes she also goes to sell milk to the MPCS. In Nepal wife and husband
have equal share of work at the farms but cash income goes to the husband. Husband and
wife share benefit.
He was asked how much milk his cows produce and he replied that he gets 6.5 litres of
milk from Jercy crossbred and 3.5 litres from Siri cow in one milking period. He sells 10 litres
of milk to the MPCS. He said that he is a member of this society. He cannot sell evening milk
because there is no provision for selling milk in the evening markets. He consumes the rest of
the unsold milk at home in the form of curd, whey, butter ghee and hard cheese. Milk price is
paid by MPCS to him every 15 days on the basis of the quality of milk. Fats and solids not fat
(SNF) are not allowed in the content of the milk. He said the price of one litre of milk that is
Rs. 15 is not enough because the production cost is higher than that. He also said the price is
controlled by His Majesty’s Government (HMG) of Nepal. At present cost of production in
Nepal is Rs. 19.75 per litre. He further explained that the MPCS has no control on pricing
system. He further stated that this pricing system established by HMG/Nepal is based on fat,
solids-not-fat (SNF) and total solids (TS) in the milk (NDDB/DSP Report 1999). Regarding
the question of animal feed, he said he has to buy concentrate feed from a local market. He
also mentioned that he feeds his milking cows at the rate of 1 kg/day per cow along with crop
residues, salt, fodder grass called Amaliso, and some time khole (locally home made ration). He
also mentioned that about 90% farmers in Ilam have crossbred cows for milking purposes and
they feed their cows just like him.
He further said that DDC, the only public sector institution of the country was
established. He said that there are about 1000 MPCs in the country and they have union at
districts, regional, and central level and have not done well to the farmers. Mr Bastola is also
a member of the farmers’ organisation, where he discusses about the different aspects of
livestock development, research, credit insurance of animals, veterinary services, extension
and marketing system in the district.
Asked whether he has been to any farmers training organised by Department of
Livestock Services and farmers visit programme, Mr Bastola replied that he had been to
Biratnagar to participate in farmer’s group training for 15 days and visited the Biratnagar,
Hetauda and Kathmandu milk supply schemes of DDC. During the training he learned that
the HMG/Nepal had approved ten years dairy development plan, livestock master plan and
Agriculture Perspective Plan (APP) and ninth five-year plan. He was also taught that in the
livestock sector, HMG/Nepal had implemented Livestock Sector Master Plan (LSMP) since
1993. The plan had the coverage for 10 years. In the mean time, a twenty-year Agriculture
Perspective Plan (APP) was designed in 1995 with the strategy of agriculture led growth for
the rapid economic growth and poverty alleviation in the country. He was also told that the
livestock sector strategy under APP emphasised meat and milk production, animal
nutrition (specifically nutritional fodder supply), health and marketing (APP 1998).
He was asked about the future potentiality of more milk supply from farmers to the
market. He replied that the future of milk production level depends on the potential from
producing additional milk through modern technology, better extension efforts and, open
South–South Workshop 501
Farmers’ perceptions of service delivery and policy support from smallholder dairy in Nepal

policy for milk price paid to the farmers to convert the potential to the reality. He also
pointed out that it would depend on two aspects: production increase in already collected
area, and the effect of additional road network in the milk shed areas.
Regarding the role of DLS and National Agriculture Research Council (NARC) in
development of technology, animal health, livestock research and extension services, he
commented that on the production side, DLS is involved in the development of technology,
animal health and extension services. NARC is involved in agricultural research and has
almost no involvement in livestock research. At present extension services at the rural level
are carried out by DLS through JT/JTA and some village animal health workers who are
good and effective. He further explained that recently private sectors have also started
playing a significant role, basically in animal health. He did not like the private veterinary
services because it is not good for the poor farmers like him to pay the additional fees. There
is no artificial insemination (AI) service in the district so the farmers have to depend on
natural cross breeding with local bulls.
Regarding the question of live animals purchasing and selling at bazaars/markets, he
replied that the marketing system for live animals particularly dairy cattle and buffalo is
fragmented. There is no orderly system that exists in the distribution of improved dairy
livestock and the volume of trade is also not known but seems to be growing. There are no
nucleus dairy animal breeder farms in the country so far developed either in the government
or in the private level. He said he had difficulties last year buying his Jersey cow from
Darjeeling India.
With regard to the question of cow milk cheese making in Ilam, he said that there are
eight cheese factories located in Ilam out of which four factories are run by DDC and the
rest four by private sectors. He pointed out that these plants are going to close soon because
of bad location, poor quality of milk, high temperature and cow milk mixed with buffalo
milk that created problems in the quality of Kanchan Cheese manufacturing. He said he
tried selling milk during the holiday but none of them agreed.
With regard to the question on whether co-operative movement in dairy is successful or
not he answered that, since he is also a member of MPCS, the co-operative movement is
successful only when the members know the details of the co-operative functions. He said that
many farmers of his society are not aware on co-operative principles, so appropriate
mechanisms should be developed for creating awareness and to make the movement
successful.
Last year, Mr Bastola and his neighbour went to the Ilam District Agriculture
Development Bank for credit to buy a Jercy crossbred milking cow along with a calf. Mr
Bastola took a loan of Rs. 20 thousand and also animal insurance, which he has been paying
the premium of 6% and 15% interest rate to the DAB/N. His neighbour’s cow died six
months ago and he has not had insurance compensation yet. This is a big economic burden
to this farmer.
On the question of World Trade Organization (WTO) impact on the Nepal dairy
industry, he said that the importance of the WTO for Nepal will not affect trade with other
countries because Nepal is a small country with no impact on the world market and has low
barriers to entry. He also emphasised that WTO will have the effect of potentially opening
markets in the South Asia region. Nepal will have to aggressively compete with prices in the
502 South–South Workshop
Joshi

region. He further pointed out that as far as Nepal’s market is concerned, the HMG/Nepal
has already opened border policy with India (World Bank 1998). He further said that DDC
is presently exporting milk to India but on subsidised prices, which is not good for the
farmers in the long run to sell at the present price paid to the farmers in Nepal.
Asked about the role of private sector dairy companies emerging in Nepal, he replied
that their levels of management, technical knowledge, and marketing expertise are weak and
are only beginning to develop. He pointed that the country has to focus on the market
segments that they can supply to meet the needs of consumers. The range of potential
products is increasing, and Nepal diaries need to focus on product development and
diversification. He also stressed that Nepal’s borders are open to imports that places
pressure on producers and processors to be efficient and competitive.
Regarding the milk holiday question, he replied that he had been facing this problem
since 1991/92. He further said that all these created a mismatch between milk offer, milk
collection, and serious market search by the producers for selling additional milk and milk
products. The result is that there has been a milk holiday since 1991/92. He also criticised
the HMG/Nepal policy for the rapid expansion of roads and liberalising the market in the
last decade. Sufficient adjustment has not yet been made between road expansions and
there is no additional milk processing operation at the public and private sector. Road
expansion doubled in 1990’s compared to 1980 leading to faster increase in milk offered by
farmers. He also expressed that HMG/Nepal did not go for parallel increase in the capacity
in DDC, although some capacity were increased through rehabilitation of old DDC plants
between 1988–89. A milk powder plant with the milk consumption capacity of 35 thousand
litres/day was established in 1991. These capacities got occupied quickly. In the mean time,
HMG/Nepal laid additional emphasis on economic liberalisation with the start of 8th plan
(1992–97) and up to 9th plan period. No processing capacity has been added to the public
sector to date (National Planning Commission 1992, 1998).
Furthermore, he suggested that introducing new varieties are other options for
increasing milk demand. There is very high scope for introducing school milk by targeting at
least the boarding school. Similarly, condensed milk option also exists, if we want to tap the
potential supply to the military. Whole and skim milk powder, flavoured milk and yoghurt
(stirred), ice cream and other various products also have prospects in view of growing
exposure to the urban people with the modern life style. He further suggested that milk
supply in the office complex is also a possibility to reduce the milk holiday.
ConclusionAt the end of the interview with Mr Bastola I asked him what sort of implications, issues,
lack of process in livestock development and future strategy and lessons learned can be told
in this case study from his side on priority basis. He concluded by ranking the issues and
problems below:
South–South Workshop 503
Farmers’ perceptions of service delivery and policy support from smallholder dairy in Nepal

Detriment milk pricing policy of the governmentThe government policy on fixing the producer and retail prices is a major detriment to the
development of the dairy industry because prices are set under a climate of political
influence with no relevance to general market conditions inside Nepal or to border prices.
The policy has set both the producer and retail price effectively constraining the dairy
processing industry with margins that do not reflect general business cycles and the impact
of rising costs, wages, utilities, taxes etc. The classified pricing system that is based on
differentiation of markets and the demand characteristics of the products will provide a
better return, a larger market, or both rather than a single price for milk for all uses. The
National Dairy Development Board (NDDB) should look into this pricing system to
account for quality of the milk being delivered to the collection and processors.
Livestock breedsHe indicated that they had poor indigenous breed of livestock and lack of exotic livestock
breed stock in the country. As a result every year farmers have to spend lots of money in
India to buy animals. Most of the time they do not get true breeds of dairy animals from
Indian markets.
Inadequate delivery of animal health servicesLivestock extension and animal health services in dairy sector are subsidised to the farmers
but are inadequate and not available at the time when needed. Mr Bastola pays for the
medicine and veterinary service fee arranged privately. It does not mean that he does not
like to pay fee to private practitioners.
Dairy animal marketingThere are poor marketing facilities for live animals and animal products within the country.
Animals hat-bazaar system should be organised and developed in all five developing region
of the country.
Milk co-operativesRegarding the milk co-operative movements he said that there are critical issues and lots of
confusion in operating the co-operatives at grassroots levels because many farmers or the
members of the co-operatives are not well informed on the principles and functions of the
co-operatives. The co-operative movement has been more or less a forced phenomenon.
MCC are established with political colours and cannot fulfil their actual co-operative based
objectives. There is lack of co-ordination between Department of Co-operatives (DOC) that
504 South–South Workshop
Joshi

has regulatory functions and the National Co-operative Development Board (NCDB) that
has promotional functions.
Mass education programmesThere is a great need to educate consumers on how to launch new dairy products, otherwise
the new market penetration would be tough.
Milk marketingThere is lack of infrastructure for collecting, processing and marketing milk and milk
products at village levels. Village road development programmes should be started as early as
possible.
Poor livestock farm managementThere is poor livestock farm management system at farming levels as can be seen in Mr
Bastola’s farm. There is no research attention given to this aspect either from DLS or from
NARC.
Lack of long-term appropriate livestock policyA livestock policy concentrating on pocket developments for specific products such as milk
pockets with identified potentials is important for optimising the use of investment,
extension staff and other support resources. This will also help to develop markets through
the commercialisation of the products. The present policy where the government does
everything is not effective. The system has to be decentralised and liberty and legal rights
should be given to the MPCS.
Livestock supporting servicesThere is lack of supporting services like research activities on farmer’s problems. These
problems in livestock sector are related basically to inadequate extension, lack of research
facilities, less focus on market orientation and commercialisation.
Questions raised in the case studyThere are a number of questions raised in this case study and some of the most important
questions are mentioned here.
1. What should be the organisational–administrative system of DDC?
South–South Workshop 505
Farmers’ perceptions of service delivery and policy support from smallholder dairy in Nepal

Options:
• remain as it is in the government hands
• be co-operated in the hand of MPCs
• be privatised in the hand of business people.
2. Should government veterinary services be privatised?
3. Is it economical for farmers to go to India every time for animal purchase?
What should be the solution for this?
4. Who and how can we solve the livestock credit facility and insurance compensation?
5. Who should regulate milk and milk product pricing policy in the country?
Options are:
• government
• market (open)
• dairy industry union
• DDC
6. How can we re-organise the livestock research and development approach method for
the up-lifting of smallholder dairy farmers?
Options are:
• participatory rural appraisal (PRA) approach method
• bottom up approach under decentralisation system
• conventional development approach.
AcknowledgmentsI am most grateful to National Dairy Development Board (NDDB), India, and to
International Livestock Research Institute (ILRI). My gratitude goes particularly to Dr
Amrita Patel, Chairman, NDDB, and Dr Hank Fitzhugh, Director General, ILRI, for their
kind invitation and support to me to participate in this workshop. I must thank my staff of
NZFHRC particularly Ms Meena Dahal for the computer support.
ReferencesAgriculture Perspective Plan. 1997/98. Ministry of Agriculture, His Majesty’s Government,
Kathmandu, Nepal.
CBS (Central Bureau of Statistics). 1998. Statistical Pocket Book 1998. CBS/NPC Kathmandu,Nepal.
DDC (Dairy Development Co-operation). 1999. Annual Report 1999. Lainchaur, Kathmandu,Nepal.
Ministry of Finance. 1998. Economic survey fiscal year 1997–98, His Majesty’s Government,Kathmandu, Nepal.
NDDB (National Dairy Development Board)/DSP Report. 1999. Hariharbhavan, Lalitpur, Nepal.
506 South–South Workshop
Joshi
NPC (National Planning Commission). 1992. Eighth five-year plan (1992–1997), NPC, HisMajesty’s Government, Kathmandu, Nepal.
NPC (National Planning Commission). 1998. Ninth five-year plan (19980–2003), (1992–1997),NPC, His Majesty’s Government, Kathmandu, Nepal.
World Bank. 1998. World Bank Development Report 1998. Knowledge for development. World Bank,Washington, DC, USA.
South–South Workshop 507
Farmers’ perceptions of service delivery and policy support from smallholder dairy in Nepal

Participatory research and extension fordairy technology development and transferin Vietnam: A case studyD.D. Vu and D.V. Cai
Dairy Research and Training Centre, Institute of Agricultural Science of South Vietnam121 Nguyen Binh Khiem, District I, Ho Chi Minh City, Vietnam
Vietnam is a tropical country with a hot and humid climate. The total area of the country is
332 thousand square kilo metre. It is densely populated by about 76 million inhabitants.
Around 80% of the population lives in rural areas; among this group, approximately 70%
rely almost exclusively on agriculture for their livelihoods. Agriculture is based mainly on
rice production, supported by other crops such as maize, potato, sweet potato, cassava,
groundnut, sugar cane and perennial commercial trees, such as coffee, rubber, tea and
coconut. Vietnamese agriculture has been divided into the following seven agro-ecological
zones according to ecological and economic conditions.
1. Northern Mountainous and Middle Highlands
2. Red River Delta
3. Northern Central Coast
4. Southern Central Coast
5. Central Highlands
6. North-East of Southland and
7. Mekong River Delta.
Dairy development: Advantages and constraintsAfter the success of the rice production programme, development of domestic milk
production to meet the demand is a priority strategy of the National Food Programme in
Vietnam. Before 1980, dairy cattle production in Vietnam was concentrated mainly in
some state farms in southern highland and north-western areas, where the climate is
reasonable for dairy cows (ambient temperature is around 18–23°C). However, the lack of
management experience in big state farms has not encouraged dairy production to develop
in either quantity or quality. Therefore, the size of the dairy cattle population and level of
domestic milk production in Vietnam were low.
From 1980, some smallholder farms in Ho Chi Minh City started to raise dairy cows in
small numbers (2–3 cows/farm). After several years, this dairy production model has
provided a high and stable economic efficiency for the farmers. Therefore, smallholder
508 South–South Workshop

dairy production developed rapidly in the Ho Chi Minh City area and subsequently in other
surrounding provinces.
According to statistical data, the dairy cattle population has increased in size since 1980;
increases were especially rapid in the period between 1990 and 2000. In 1990, the dairy
cattle population of the Ho Chi Minh City area was only 5000 head but it had increased to
about 14 thousand by 1995. At present, the dairy cattle population of the whole country is
about 35 thousand head, out of which about 23 thousand are in suburban areas of Ho Chi
Minh City. In these areas, level of milk production is around 110–120 t/day; this level can
meet only 10% of the raw material demands of the processing factories of VINAMILK and
FOREMOST, the only two factories in this area.
Dairy production could be developed in suburban areas of Ho Chi Minh City and
surrounding provinces because:
(i) Fresh milk could be sold easily to the processing factories, which are located in Ho Chi
Minh City and Binh Duong Province (40 km away from Ho Chi Minh City)
(ii) There are abundant industrial by-products (such as brewery wastes, cassava wastes,
soybean residues and molasses) which can be used for feeding dairy cows and
(iii) There are research and extension organisations in each district, which could train and
transfer the new technologies to the dairy farmers.
South–South Workshop 509
Research and extension for dairy technology development and transfer in Vietnam
Map 1. Map showing the seven agro-ecological zones of Vietnam.

However, the most important constraint for smallholder farmers in practising and
enhancing their economic efficiency is the feeding system. As mentioned above, dairy
production has developed around the cities; consequently, most of the dairy farmers use a
housed feeding system in which dairy cows are kept in their cattle sheds at all times. Cut
grasses and agro-industrial by-products plus concentrates are given twice or three times per
day after bathing and milking. Green forage has been supplied from two major sources:
planted and natural grasses. Due to the limited area of cultivated land, only about 10% of
farmer households plant grasses for dairy cows. The most popular improved grass variety is
Pennisetum purpurium with a green matter yield from 200–250 t/year. Cut natural grass is the
main green forage source for dairy cattle, in both grass planting and non-planting
households. The natural grasses can withstand long periods of hot and poor nutrient
conditions during the dry season. In the dairy cattle raising areas, new employment
opportunities have arisen in the cutting and selling of natural grass to the farmers at a price
of 150–200 Dong per kg (US$ 1 = 14,030 Dong on 1st January 2000).
Because of the shortage of grasses, the farmers use many agro-industrial by-products as
feeds. Rice straw is used as a source of roughage for dairy cows in the dry and even the rainy
seasons. This straw is supplied from adjacent rice growing areas in various forms: green or
dry form and whole rice plant or only the top part. The farmers use untreated rice straw,
which has a low nutritive value. Industrial by-products from processing factories are popular
as major ingredients in dairy cattle rations. These important by-products include: beverage
residues, soybean grain waste, cassava root waste and molasses. Nutritionally, these
feedstuffs are imbalanced, especially in terms of their energy and protein contents.
Therefore, dairy cattle rations are usually inadequate nutritionally, especially for cows with
high milk yields (>15 kg of milk/cow per day). Use of these rations results in poor body
condition, short lactation periods, low reproductive performances, early culling and
eventually low economic efficiency.
In the last few years, implementation of participatory research and extension
programmes for improvement of dairy cattle feeding has been considered. These included
on-farm trials on cultivation and use of improved grasses, utilisation of agro-industrial
by-products and improvement of dairy cattle rations based on locally available feedstuffs.
This paper provides an overview of participatory research and extension on the
utilisation of urea treated rice straw as the main roughage component of dairy cattle rations
in the Ho Chi Minh City area.
Participatory research and extension on improvedutilisation of rice straw for dairy cowsAnnual rice production increased from 11.8 million tonnes in 1976 (after country
reunification) to 16 million tonnes in 1986 (agricultural reform) to 26.3 million tonnes in
1996 and to even higher levels in recent years. Since 1990, Vietnam has become one of the
biggest rice exporters in the world.
In Vietnam, the dominant integrated buffalo/cattle–rice production system has existed
for a long time. Buffalo and cattle contribute significantly to crop production by providing
510 South–South Workshop
Vu and Cai
draft power and manure whilst, in turn, they rely greatly on crop production, which
provides residues for their feeds. Generally, it is estimated that about 1 kg of straw is
produced for each kilogram of grain harvested. Thus, at the current level of rice production
in Vietnam, about 25–30 million tonnes of straw could be produced each year.
Nevertheless, as yet, rice straw has not been utilised maximally as a feed for ruminants
because of low daily feed intakes by animals and the poor nutritional value of straw,
especially in dairy cattle diets. The key to improving the use of rice straw by ruminants is to
overcome the barriers to rumen microbial fermentation of lignocelluloses. The two
well-known characteristics of rice straw that limit bacterial digestion in the rumen are its
high level of lignification and low contents of nitrogen, vitamins and minerals. Therefore,
in principle, two approaches should be combined, namely, straw delignification treatment
and nutrient supplementation.
Many methods for treatment of straw have been developed and recommended. Among
these, treatment of rice straw with urea was introduced as a suitable method for use in
developing countries like Vietnam. However, extension of this technique to a wide number
of farmers was limited. The reasons for the poor uptake of this technique may be:
• First, in addition to their poor understanding of ruminant nutrition and feeding,
especially relating to dairy cows, farmers have not been well informed or trained in use of
the technique. This is because there are poor linkages between agricultural educators,
researchers, extension workers and target farmers.
• Second, priority is generally given to crop production in terms of labour use and cash
investment.
• Third, the methods for development of new technologies are not technically and
socio-economically suited to the local conditions under which smallholder poor farmers
are dominant.
• Fourth, the farmers have no available cash to pay for the necessary inputs.
From 1990, some organisations such as the Centre for Agricultural Research Gembloux
(Belgium), the International Development Research Centre (Canada), and the International
Atomic Energy Agency (IAEA) have supported the Institute of Agricultural Science (IAS) of
South Vietnam in implementing a programme on improvement of feeding conditions for dairy
cows, especially improved utilisation of rice straw as the main roughage component of the diets.
Research and development
SurveyAn initial survey carried out in 1990 determined that most dairy farmers (about 80%) have
used rice straw for feeding dairy cows in both the dry and rainy seasons. Results of the survey
also showed that because of its poor nutritional value, the dairy cows could intake only 3–4
kg of dry matter/day from rice straw. This low feed intake led to low productivity and poor
reproductive performance of the dairy cows. Results of the survey also indicated that the
farmers were willing to apply new technologies to improve utilisation of rice straw, especially
if methods were highly practical.
South–South Workshop 511
Research and extension for dairy technology development and transfer in Vietnam

Trials at laboratory levelFollowing the survey, some small laboratory trials were carried out in order to determine the
appropriate level of urea application needed for treatment of rice straw. Although various
levels of urea application have been recommended in the literature (ranging from 3 to 8%)
the level of 4% was chosen for field application.
On-station trialsBefore conducting on-farm trials, on-station trials were carried out in order to assess the
effects of this technology on the productivity of dairy cows. This step was implemented to
ensure that there would be no risk associated with application of this technology.
On-farm trialsAfter the on-station trials, on-farm trials were carried out with farmer participation. Initially, a
part of the cost of building the treatment pools and purchase of plastic and urea were
supported by the project. The farmers’ animals were used for testing and the farmers
monitored and assessed the effects of urea treated rice straw on the productivity of their cows.
Diffusion of technologySeveral pilot farms were established in order to disseminate the technology to a wider
number of farmers. Every two to three months, small training workshops were organised at
these farms for training of the farmers and discussion and development of the technology.
These training courses used farmer to farmer transfer of information. With this method,
the farmers completely understood and believed the new technology because: (i) farmer’s
language is usually suited to the level of farmer’s knowledge; (ii) the farmers usually believe
what other farmers say more than what extension workers or researchers say; and (iii) they
observe directly the characteristics and efficiency of the technology.
Lessons learned
Research and development1. Before application of a new technology, it is necessary to conduct a survey in order to
determine the practical conditions, farming systems, and farmers’ willingness and
ability to develop the technology under the field conditions.
2. The study should be based on the ‘on-farm participatory approach’ that takes into
consideration the farmers’ evaluation of the technology.
512 South–South Workshop
Vu and Cai
3. To be sustainable, an acceptable feeding system for the improved utilisation of rice straw
should be simple and machinery-independent; it should also use cheap and freely
available inputs, and fit easily into the farmers’ normal routines.
Diffusion of the technique1. For dissemination of new technology, it is necessary to establish demonstration units
(farms). These farms will be used for farmer visits and training, and development of the
technology.
2. Training of the farmers in application of a new technology should be carried out using the
‘farmer to farmer’ principle; thereby, making it is easier for the farmers to understand,
believe and apply the technology.
Questions for discussion1. The dairy cattle population is concentrated mainly around cities. Is it possible to develop
dairy production to more distant areas where there is sufficient land for planting grasses
and grazing, especially to rice production areas? What are the existing experiences of
such attempts?
2. What is the role of the government and private organisations in the development of new
technologies, such as the improved utilisation of rice straw in dairy production?
3. What are the functions and activities of dairy farming associations in the application of
new technologies?
4. What is the best way to carry out training activities to increase farmers knowledge
relating to the application of new technologies?
South–South Workshop 513
Research and extension for dairy technology development and transfer in Vietnam
Theme 6: Making the research andextension paradigm responsive to farmers’needsPlenary discussionUnder this theme, the four case-study papers presented contrasting organisational structures
and technological foci drawing on experiences from sub-Saharan Africa, South and
South-East Asia. During the plenary discussion the points raised related to technicians’
perceptions of farmers, their needs and the approaches to meeting those needs, as well as the
role of public-funded organisations. The debate was continued during the theme 6 group
discussion (see below).
In the plenary discussion, the issues and concerns raised were:
1. Government’s role is important in policy-making at the macro-level and needs input
from research and development (R&D); however, its role at the micro-level, e.g.
marketing, is questionable.
2. Involve farmers at all stages of the research process to determine their needs. Classic
examples of R&D not involving farmers were presented.
3. Scientists look at smallholders as a homogenous group with similar ideas and therefore
do not assess the appropriateness of a technology across a group (and from farmers’
perspectives). Even within one village there is variability amongst farmers.
4. Adoption is a behavioural issue and the apparent physical parameters (education, human
resources on farm, size of land holding) often used to determine whether adoption will
take place or not, tend to end up being relatively irrelevant.
These issues and the related topics that emerged from the presentations in themes 4 and
5 were subsequently discussed in small groups of workshop participants.
The outcomes for theme 6 are given below.
Group discussionIn common with the other group discussions, a set of questions guided the theme 6
discussions. The questions presented to the group asked about the need for an information
exchange network for R&D specialists, and how to ensure accessible, demand-led services
for smallholders.
The questions were:
1. Should there be a collaborative South–South network on smallholder dairy R&E
(amongst national research and extension services (NARES), IARCs, NGOs and farmer
514 South–South Workshop
organisations)? If so, what are the preferred options for implementing a network (an
electronic network; regular international workshops and conferences etc), and how
could they be resourced?
2. What processes need to be put in place by NARES in the South to ensure that their
services are demand-driven by their major clients: the smallholders and their market
agents? If possible, give examples of R&E programmes that are responsive to the needs
of smallholders and their market agents
3. In many developing countries public funding is declining for livestock research and
extension. Based on experiences in developing countries, what options are worth
exploring (or should be avoided) to give smallholders better access to R&E services?
The group’s responses were as follows.
Should there be a collaborative South–South network?
It was agreed that an electronic network should be established. Networks that focus only on
meetings were considered not valuable because transaction costs were high, especially when
carried out at a national level.
FAO is already discussing a dairy research–extension network. This may be one vehicle
for South–South linkages, although it is intended to focus on eastern and southern Africa.
It was suggested that a co-ordinator institution would be required and that ILRI may be a
candidate. It was recommended that the person recruited to establish and run the network
should be carefully selected. Strict moderation and editing of posted material should be
exercised to avoid network members being swamped with irrelevant material as often
happens in electronic conferences. It was also suggested that a research scientist may not be
the most appropriate person and that somebody without a research or other bias should be
contracted who could bridge the gap between research and extension.
It was considered that an electronic network between South–South countries would be
of value to share experiences of methodologies and successful case studies. Although many
scientists were now prepared to talk about participatory techniques, the perception of what
is participatory is often not clear. Working on-farm and using farmers’ land, animals and
labour should not, by itself, be considered participatory.
The network would allow contact between parties to facilitate capacity building in the
countries of the South.
What processes need to be put in place by NARES in the South toensure that their services are demand-driven by clients?
It was felt that there were few instances where NGOs, often with good farmer links, worked
directly with research, although BAIF in India was one example.
It was made clear that not only was it important to adopt a more demand-led approach,
but also to work in an inter-disciplinary manner, taking a farming systems approach. The
farming system has also to be considered in its context of infrastructure, access to markets
etc.
South–South Workshop 515
Making the research and extension paradigm responsive to farmers’ needs
To ensure success it was suggested that capacity building start early in professional
careers, before more traditional and ineffective approaches became engrained. The farming
systems approach, participatory methodologies etc. should be taught at university level; for
example the Institute of Rural Management, Anand (IRMA) is developing a course on
gender analysis. It was felt that often courses on participatory research are a token gesture
and not taken seriously. For example, in research institutions, current reward systems tend
to focus on the products of on-station and top– down research, i.e. papers and articles in
scientific journals, and should be changed to an outcome focus.
Examples of client responsive R&E
Some examples of R&E programmes that are responsive to client needs included:
• R–E network Ethiopia: Extension workers sit on annual EARO (Ethiopian Agricultural
Research Organization) research reviews and have the opportunity to evaluate and
suggest modifications for completed and proposed research and to propose research
issues themselves.
• Dairy project Thailand: A dairy project in Thailand was described in which there were
direct linkages between farmers and research scientists via extension workers.
• Amul co-operative India widely discussed during the meeting.
• NAADS as described in the presentation from Uganda.
• ATIRI Kenya where farmer groups request research scientists to work on issues in which
they are interested.
• Schemes (listed by the participant from Uganda) in Costa Rica, Chile, Bolivia etc. which
were taking new approaches to ensure that extension delivery was client-led.
• Bangladesh University is working with 2–3 NGOs which interact with university staff to
feed back information from the field and who are involved in applied research at the
field level.
Options to improve smallholder access to service
In the example of Amul, the Union instigates farmer study visits. Development of information
centres may be an option.
Information delivery through co-operatives was one measure discussed and good examples
were Amul, and co-operatives of coffee and sugar growers.
Most of the farmers outside co-operatives are fragmented and not unified making
effective delivery more difficult. However, it was considered that there may be potential to
work with existing social groups—for example religious or community based groups,
women’s groups etc. which, although established for different purposes, already are a
cohesive and motivated group.
It was suggested that there should be more focus at the (output) market level rather than
the input level, which has occurred in the past. Technologies being presented through
extension services almost always involve increased inputs and it is important that the farmer
516 South–South Workshop
Making the research and extension paradigm responsive to farmers’ needs
can recoup this expenditure. The only way this can occur is through marketing of the
product.
ConclusionsAs in the related themes, the presentations, the supporting papers and the discussion on the
research and extension paradigm highlighted the importance of participatory approaches to
ensure that research and extension technicians are answerable to the people they are
serving. The decentralisation of public-funded services to community-based groups within
organisational structures, which facilitate access to technical information and expertise yet
assure accountability to the landless, the marginalised and smallholders and their market
agents, were required. The actions agreed by participants to contribute towards achieving
those aims are presented in the workshop recommendations.
South–South Workshop 517
Making the research and extension paradigm responsive to farmers’ needs

Recommendations of the workshopBased upon the issues raised by the workshop papers and during the discussions in the
group and plenary sessions, five major areas of importance to ensuring the development of
smallholder dairying and its competitiveness were identified and specific actions were
recommended.
South–South information exchange and networkingThe major recommendation of the workshop was the need for continued co-operation on
the sharing of information, experiences and research findings related to smallholder dairy
development with emphasis on networking among the countries of the South.
It was agreed that the beginnings made in establishing the electronic linkages among the
participants and their organisations while organising the workshop, should be strengthened
to facilitate the exchange of information. ILRI (www.cgiar.org/ilri) offered to assist in
establishing a network through exploring opportunities with, for example, FAO (www.
fao.org).
Participants agreed that the need for information exchange and networking was
particularly relevant for issues related to:
• Collective-action groups: The collective action of smallholders (such as that practised in
the Anand model in India) was seen by workshop participants as an important mechanism
for successful dairy development.
Information exchange on the strengths and weaknesses of the approach was needed with
emphasis on identifying the principles and best practices that determine the successful
adoption and adaptation of the approach (see below).
• Participatory research and extension: The lessons from participatory research and
extension approaches and methodologies presented to the workshop particularly
interested the participants. They wanted more information about and contact with
programmes in developing countries practicing participatory approaches to the
development, testing and transfer of productivity-enhancing technologies. The
workshop participants were particularly interested in testing the approaches, methods
and tools to crop–dairy systems and to improving integrated nutrient management.
It was suggested that a link be established with the Consultative Group on International
Agricultural Reseach (CGIAR’s) System-wide Programme on Participatory Research
and Gender Analysis (PRGA) led by Centro Internacional de Agricultura Tropical
(CIAT). The PRGA website (www.prgaprogram.org/prga/) provides access to
information on participatory research and extension approaches, methodologies and
tools, and to current examples of their application to livestock-related constraints and
opportunities.
518 South–South Workshop
• Milk marketing research: The over-riding importance to smallholder dairy development
of effective milk collection and marketing strategies was highlighted in the workshop
presentations and in the discussion sessions. Information exchange and networking on
the lessons learnt on appropriate marketing strategies was therefore a key topic to be
addressed through the continuing interactions amongst the countries of the South.
• Policy research: In the same way, the workshop participants agreed on the importance of
sharing the lessons learnt from policy studies as related to dairy development, role of
governments etc. Participants stressed the need for exchanging information on
approaches and methods for carrying out policy research, for the presentation of the
research outcomes to policy makers and their advisers and for advocating policy reforms
related to smallholder dairy production and marketing.
Championing the collective action (co-operative)approachAn important conclusion of the workshop was that the time-tested Anand model of dairy
co-operatives, with changes as may be necessary to suit local environments, was a good model
for smallholder dairy development among the countries of the South.
The National Dairy Development Board (NDDB) (www.nddb.org) agreed to play the lead
role in information dissemination and supporting the development of farmer organisations.
It would use its bilateral linkages already established with Ethiopia, Nepal and Uganda, as a
springboard to develop farmer-led programmes.
Enhancing the understanding of WTO regulations andtheir implications for smallholder dairy developmentThe representatives from most of the participating countries wanted to be kept well informed
and updated on the implications for smallholder dairy production and marketing of the
World Trade Organization (WTO) regulations. This should be done on a continuing basis by
establishing a small group of countries in the South to help draw up plans of action.
The Institute of Rural Management (IRMA; www.irm.ernet.in), Anand, and NDDB
offered to facilitate the process and to provide a forum for articulating the issues affecting
smallholder dairy development in countries of the South.
Improving research and extension (R&E) systems toserve smallholder dairyingA major issue highlighted by the workshop participants was the need for more effective
R&E systems, including the delivery of livestock services (e.g. veterinary and artificial
South–South Workshop 519
Recommendations of the workshop

insemination; AI), to support smallholder dairy development. It was proposed that one way
forward was to study and understand the successes and failures of the different approaches
tried in various countries and to share those lessons through the proposed South–South
information exchange and networking (see above).
It was agreed that NDDB and IRMA would collate information from South Asian
countries, while ILRI (subject to identifying funding), would mount a parallel effort
elsewhere, e.g. in the sub-regions of sub-Saharan Africa.
The workshop consensus was that organisational and institutional reforms (see, e.g. the
Uganda case study), and particularly the efforts to privatise services and to form
public–private partnerships were important. Therefore it was essential that efforts related to
dairy were linked to national initiatives on the reform of agricultural services generally and
to their re-organisation.
ConclusionsIn conclusion, therefore, the workshop demonstrated:
• the commonality of many of the issues related to smallholder dairy production and
marketing in the countries of the South
• the richness of the experiences in the South applicable to addressing dairy development
for the improvement of the livelihoods of the landless, the marginalised and smallholders
• the key role that market-orientation and participatory approaches play in fostering
effective efforts in support of dairy development
• the large benefits, actual and potential, of exchanging experiences amongst the countries
of the South
• the importance of taking advantage of the new generation of information technologies
to ensure more effective exchange of information within the South and
• the willingness and enthusiasm of the participants to work together to plan the agreed
actions and to mobilise the resources required for their implementation.
Recommendations of the workshop
520 South–South Workshop

List of participantsM.S. AshokCatalyst Management Services Pvt. Ltd.
179 VI Main KEB Layout, Geddalahally
Bangalore 560 094, India
Tel: 91–080–341 9616
91–080–341 7714
E-mail: ashokms/vsn1.net; [email protected]
B.H.W.M.U.S. Bandara (Dr)*Director, Animal Breeding (Development)
Division
Department of Animal Production and Health
P.O. Box 13
Peradeniya, Sri Lanka
Tel: 94–0–8 388031
Fax: 94–0–8 388031
E-mail: [email protected]
C. Chantalakhana (Prof)Kasetsart University
Bangkok 10903, Thailand
P.O. Box 1014, Kasetsart P.O.
Tel: 66–2–579–4214
Fax: 66–2–579–8555/66–2–552–8171
E-mail: [email protected]
C. Devendra (Dr)ILRI-Philippines
130A Jalan awna Jawa
58200 Kuala Lumpur, Malaysia
Tel: 603–783 9307
Fax: 603–783 7935
E-mail: [email protected]
A.K. Joseph (Dr)National Dairy Development Board (NDDB)
Anand–388 001, India
Tel: 091–269–2–40148/40149 or 40146
Fax: 091–269–2–40156 or 091–269–2–47102
E-mail: [email protected]
Durga Dutt Joshi (Dr)Director, National Zoonoses and Food Hygiene
Research Centre
Tahachal, GPO Box 1885
Kathmandu, Nepal
Tel: 0977–1–270667
Fax:0977–1–272694
E-mail: [email protected]
M.P.G. Kurup (Dr)16/2A, Borsad Road, Jitodia, 388 345,
Gujarat, India
Tel: 91–2692 36610/35549
E-mail: [email protected]
Lusato Revocatus Kurwijila (Dr)Sokoine University of Agriculture
Department of Animal Science and Production
P.O. Box 3004, Morogoro, Tanzania
Tel: 007–23–2604617
Fax: 007–23–2604562
E-mail: [email protected]
Jian-Xin Liu (Dr)*Professor, College of Animal Sciences,
Zhejiang University Huajiachi Campus,
Hangzhou 310029
P.R. China
E-mail: [email protected]
Lucy M. MaarseHead of Natural Resource Management Sphere
(Swiss Agency for Development and Cooperation)
and Delegate of Inter-cooperation (/IC) in India
E-mail: [email protected]
Bhupendra Nath Mathur (Dr)Director, National Dairy Research Institute,
Karnal–132001 Haryana, India
E-mail: [email protected]
South–South Workshop 521
* Invited but unable to attend. Papers are included in the proceedings.
H.G. Muriuki (Dr)Assistant Director, Livestock Production
Ministry of Agriculture and Rural Development
P.O. Box 30028
Nairobi, Kenya
Tel: 254–2–718528
Fax: 254–2–721983
E-mail: [email protected]
David Miano Mwangi (Dr)Head, Regional Research Programme
Kenya Agricultural Research Institute (KARI)
P.O. Box 30148
Nairobi, Kenya
Tel: 254–154–32404
Fax: 254–154–33091
E-mail: [email protected]
Reuben Njwe (Dr)*Country Director
Heifer Project International
B.P. 633
Bouake 01, Cameroon
Tel: 237–36–3822
Fax: 237–26–3921
E-mail: [email protected]
Joseph NserekoP.O. Box 21472, Kampala (Private) or
Mpigi District Administration
P.O. Box 172, Mpigi, Uganda
Tel:/Fax: 256–41–345440
E-mail: [email protected]
A.M. NyamuHead of Publications
ILRI-Ethiopia
P.O. Box 5689
Addis Ababa, Ethiopia
Tel: 251–1–463215
Fax: 251–1–461252 or 464645
E-mail: [email protected]
J.M. Omiti (Dr)Agricultural Economist
Institute of Policy Analysis and Research (IPAR)
P.O. Box 45843
Nairobi, Kenya
Tel: 254–2–251179
Fax: 254–2–251162
E-mail: [email protected]
E.O. Otchere (Prof)Director, Animal Research Institute
P.O. Box AH20, Achimota, Ghana
E-mail: [email protected]
S. ParthasarathyAssistant Director General
International Crops Research Institute for the
Semi-Arid Tropics (ICRISAT)
Patancheru 502 324
Andhra Pradesh, India
Tel: 040–3296161
Fax: 040–3296182
E-mail: [email protected]
A. Patel (Dr)Chairman and Chief Executive
National Dairy Development Board (NDDB)
Anand 388 001, India
Tel: 091–269–2–40148/40149 or 40146
Fax: 091–269–2–40156 or 091–269–2– 47102
E-mail: [email protected]
I. Patel (Prof)Institute of Rural Management
P.O. Box 60, Anand 388 001
Gujarat, India
Tel: 02692–60177, 60181, 60391
Fax: 02692–60188
E-mail: [email protected]
R. Rafaqat*Animal Husbandry Commissioner
Government of Pakistan, Islamabad
Tel: 92–42–92–5092
Fax: 92–42–9221357
522 South–South Workshop
List of participants
* Invited but unable to attend. Papers are included in the proceedings.

Datta V. Ranganekar (Dr)National Dairy Development Board ()
Anand 388 001, India
Tel: 091–269–2–40148/40149 or 40146
Fax:091–269–2–40156 or 47102
E-mail: [email protected]
Dannie L. Romney (Dr)ILRI-Nairobi
P.O. Box 30709
Nairobi, Kenya
Tel: +254–2–630743
Fax: +254–2–631499
Telex: 22040 ILRI/Nairobi/Kenya
Cable: ILRI/Nairobi/Kenya
E-mail: [email protected]
M. Saadullah (Prof)Department of Animal Science
Bangladesh Agricultural University
Mymensingh 2202, Bangladesh
Tel: 880–91–55816
880–17–336 510
Fax:880–91–55810
E-mail: [email protected]
Gobinda Chandra SahaGeneral Manager, Bangladesh Milk Producers’
Cooperative Union Ltd. (Milk Vita)
Dugdha Bhaban
139–140, Tejgaon Industrial Area
Dhaka–1208, Bangladesh
Tel: 00–880–2–882 6888
Fax: 00–880–2–882 68800
E-mail: [email protected]
Rakesh Saxena (Prof)Professor, Institute of Rural Management
P.O. Box 60
Anand 388 001, India
Tel: 0091–2692–60391, 60177, 60181, 60186
Fax: 0091–2692–60188
E-mail: [email protected]
Vijay Paul Sharma (Prof)Centre for Management in Agriculture
India Institute of Management
Vastrapur, Ahmedabad, India 380 015
Tel: 079–6307241
Fax. 079–6306896
E-mail: [email protected]
K. Singh (Singh)Director, Institute of Rural Management
Anand 388001, India
Tel: 02692–61230
Fax: 02692–60188
E-mail: [email protected]
P. SkunmunBuffalo and Beef Production R&D Center
(BPRADEC)
Suwanvajokkasikit Animal R&D Institute,
Kasetsart University
P.O. Box 1014, Kasetsart P.O.
Bangkok 10903, Thailand
Tel: 662–5794214
Fax: 662–5798555
E-mail: [email protected]
M. Smalley (Dr)Programme Co-ordinator
Strengthening Partnerships for Livestock
Research (SPAN)
ILRI-Ethiopia
P.O. Box 5689
Addis Ababa, Ethiopia
Tel: 251–1–46 32 15
Fax: 251–1–46 12 52 or 46 46 45
E-mail: [email protected]
S. Staal (Dr)Agricultural Economist
ILRI-Kenya
P.O. Box 30709
Nairobi, Kenya
Tel: 254–2–630743
Fax: 254–2–631499/632013
E-mail: [email protected]
South–South Workshop 523
List of participants

Nguyen Quang Suc (Dr)National Institute of Animal Husbandry
Hanoi, Vietnam
Tel: 084–4–8387236
Fax: 084–4–8389775
E-mail: [email protected]
D. Taylor (Dr)Deputy Director General
ILRI-Kenya
P.O. Box 30709
Nairobi, Kenya
Tel: 254–2–630743
Fax:254–2–631499
E-mail: [email protected]
W. Thorpe (Dr)ILRI-Kenya
P.O. Box 30709
Nairobi, Kenya
Tel: +254–2–630743
Telex: 22040 ILRI/Nairobi/Kenya/
Cable: ILRI/Nairobi/Kenya
E-mail: [email protected]
Deepak TikkuManaging Director
National Dairy Development Board (NDDB)
Anand 388 001, India
Tel: 091–269–2–40148/40149 or 40146
Fax: 091–269–2–40156 or 47102
Tsehay ReddaAnimal and Fisheries Resources Development
and Regulatory Department
Ministry of Agriculture
P.O. Box 62347
Addis Ababa, Ethiopia
Tel: 251–1–155871
E-mail: [email protected]
Doan Duc Vu (Dr)Deputy, Ruminant Research Department
Institute of Agricultural Science of South
Vietnam
121 Nguyen Binh Khiem, District I, Ho Chi
Minh City, Vietnam
E-mail: [email protected]
B.M. Vyas*Managing Director
Gujarat Cooperative Milk
Marketing Federation Ltd.
Anand 388 001, India
Tel: 02692–40180
Fax: 02692–40208
E-mail: [email protected]
William H. Winter (Dr)Research Programme Manager
Australian Centre for International Agricultural
Research (ACIAR)
GPO Box 1571, Canberra ACT 2601
Australia
Tel: 61–2–6217 0545
Fax: 61–2–6217 0501
E-mail: [email protected]
M.L. Yahuza (Dr)Project Manager
National Livestock Projects Division (NLPD)
PMB 2222
Kaduna, Nigeria
Fax: 234–62 244421
E-mail: [email protected]
524 South–South Workshop
List of participants
* Invited but unable to attend. Papers are included in the proceedings.
Copyright © 2022 FDOKUMEN