7 Dairy and dairy products - OECD iLibrary
13
178 OECD-FAO AGRICULTURAL OUTLOOK 2021-2030 © OECD/FAO 2021 This chapter describes recent market developments and highlights the medium-term projections for world dairy markets for the period 2021-30. Price, production, consumption and trade developments for milk, fresh dairy products, butter, cheese, skim milk powder and whole milk powder are discussed. The chapter concludes with a discussion of important risks and uncertainties that might affect world dairy markets over the next ten marketing years. 7 Dairy and dairy products
-
Upload
khangminh22 -
Category
Documents
-
view
1 -
download
0
Transcript of 7 Dairy and dairy products - OECD iLibrary

178
OECD-FAO AGRICULTURAL OUTLOOK 2021-2030 © OECD/FAO 2021
This chapter describes recent market developments and highlights the
medium-term projections for world dairy markets for the period 2021-30.
Price, production, consumption and trade developments for milk, fresh dairy
products, butter, cheese, skim milk powder and whole milk powder are
discussed. The chapter concludes with a discussion of important risks and
uncertainties that might affect world dairy markets over the next ten
marketing years.
7 Dairy and dairy products

179
OECD-FAO AGRICULTURAL OUTLOOK 2021-2030 © OECD/FAO 2021
7.1. Projection highlights
The dairy sector has proved notably resilient during the COVID-19 pandemic. The perishable nature of
fresh liquid milk and fresh dairy products made them particularly vulnerable to supply chain disruptions;
however, the dairy sector was not as significantly impacted as other sectors from a global perspective. The
effects of the pandemic varied regionally, with negative effects ranging from shipping container shortages
to disposing of surplus products. At the same time, other countries adjusted quickly and successfully to
production and labour issues, and experienced minimal disruptions to their regular trade environment.
Many countries adopted confinement measures that affected away-from-home consumption, which often
includes a large share of dairy products; at-home consumption (retail sales) offset some of these losses.
Overall, quick production and packaging adjustments resulted in no major shortages or surpluses globally.
The pandemic had the largest effect on butter prices compared to other dairy prices due to the loss in
demand for milk fat from the hospitality sector. The world price of butter is projected to remain at post-
pandemic levels, but will be considerably higher than the SMP (skim milk powder) price, as it has been
since 2015 due to stronger demand for milk fat compared to other milk solids, and the European Union’s
SMP intervention (from first purchases in 2015 to final disposal in 2019). Although the gap between the
price of butter and SMP is assumed to remain a defining feature over the coming decade, it is expected to
narrow over the projection period. Demand for SMP, particularly in developing countries, will outpace
demand for milk fat on the international market, narrowing the price gap between the two commodities.
World milk production (roughly 81% cow milk, 15% buffalo milk, and 4% for goat, sheep and camel milk
combined) is projected to grow at 1.7% p.a. over the projection period (to 1 020 Mt by 2030, faster than
most other main agricultural commodities). The projected growth in the number of milk-producing animals
(1.1% p.a.) is higher than the projected average yield growth (0.7%) as herds are expected to grow faster
in countries with lower yields, and with herds comprised of lower yielding animals (i.e. goats and sheep).
It is expected that India and Pakistan, important milk producers, will contribute more than half of the growth
in world milk production over the next ten years, and will account for more than 30% of world production
in 2030. Production in the second largest global milk producer, the European Union, is expected to grow
more slowly than the world average due to policies on sustainable production and slower domestic demand
growth.
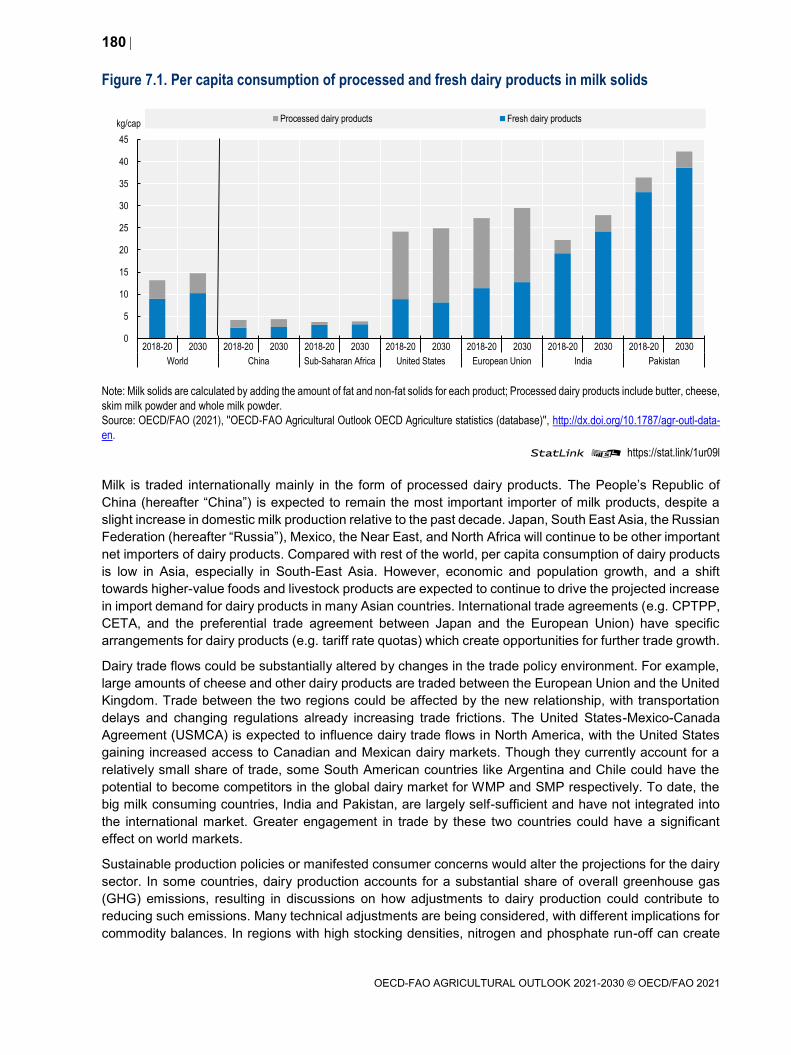
Most dairy production is consumed in the form of fresh dairy products1, which are unprocessed or only
slightly processed (i.e. pasteurised or fermented). The share of fresh dairy products in world consumption
is expected to increase over the coming decade due to strong demand growth in India, Pakistan and Africa,
driven by increases in income and population. In developed countries, per capita consumption is projected
to grow modestly from 23.6 kg in 2018-20 to 25.2 kg (milk solids) in 2030, compared to an increase from
10.7 kg to 12.6 kg in developing countries. The consumption preferences of developed countries tend
towards processed products, while in developing countries fresh dairy products comprise over 75% of
average per capita dairy consumption in milk solids (Figure 7.1). Regional disparities are significant in
developing nations, where the fresh dairy product share of per capita consumption can range from 99% in
Ethiopia to 5.8% in the Philippines.
Consumption of processed dairy products ranges substantially by region. The second most important dairy
product consumed in terms of milk solids (after fresh dairy products) is cheese. Consumption of cheese
primarily occurs in Europe and North America, and is growing in both regions. In Asia, butter is the most
consumed processed dairy product, accounting for almost half of all processed dairy consumption in terms
of milk solids. Butter also has the strongest projected growth in consumption, although starting from a low
base relative to Europe and North America. In Africa, cheese and WMP (whole milk powder) account for
the majority of processed dairy consumption in milk solids. Over the coming ten years, however, SMP is
expected to have the highest growth, although again from a lower consumption base.
180
OECD-FAO AGRICULTURAL OUTLOOK 2021-2030 © OECD/FAO 2021
Figure 7.1. Per capita consumption of processed and fresh dairy products in milk solids
Note: Milk solids are calculated by adding the amount of fat and non-fat solids for each product; Processed dairy products include butter, cheese,
skim milk powder and whole milk powder.
Source: OECD/FAO (2021), ''OECD-FAO Agricultural Outlook OECD Agriculture statistics (database)'', http://dx.doi.org/10.1787/agr-outl-data-
en.
StatLink 2 https://stat.link/1ur09l
Milk is traded internationally mainly in the form of processed dairy products. The People’s Republic of
China (hereafter “China”) is expected to remain the most important importer of milk products, despite a
slight increase in domestic milk production relative to the past decade. Japan, South East Asia, the Russian
Federation (hereafter “Russia”), Mexico, the Near East, and North Africa will continue to be other important
net importers of dairy products. Compared with rest of the world, per capita consumption of dairy products
is low in Asia, especially in South-East Asia. However, economic and population growth, and a shift
towards higher-value foods and livestock products are expected to continue to drive the projected increase
in import demand for dairy products in many Asian countries. International trade agreements (e.g. CPTPP,
CETA, and the preferential trade agreement between Japan and the European Union) have specific
arrangements for dairy products (e.g. tariff rate quotas) which create opportunities for further trade growth.
Dairy trade flows could be substantially altered by changes in the trade policy environment. For example,
large amounts of cheese and other dairy products are traded between the European Union and the United
Kingdom. Trade between the two regions could be affected by the new relationship, with transportation
delays and changing regulations already increasing trade frictions. The United States-Mexico-Canada
Agreement (USMCA) is expected to influence dairy trade flows in North America, with the United States
gaining increased access to Canadian and Mexican dairy markets. Though they currently account for a
relatively small share of trade, some South American countries like Argentina and Chile could have the
potential to become competitors in the global dairy market for WMP and SMP respectively. To date, the
big milk consuming countries, India and Pakistan, are largely self-sufficient and have not integrated into
the international market. Greater engagement in trade by these two countries could have a significant
effect on world markets.
Sustainable production policies or manifested consumer concerns would alter the projections for the dairy
sector. In some countries, dairy production accounts for a substantial share of overall greenhouse gas
(GHG) emissions, resulting in discussions on how adjustments to dairy production could contribute to
reducing such emissions. Many technical adjustments are being considered, with different implications for
commodity balances. In regions with high stocking densities, nitrogen and phosphate run-off can create
0
5
10
15
20
25
30
35
40
45
2018-20 2030 2018-20 2030 2018-20 2030 2018-20 2030 2018-20 2030 2018-20 2030 2018-20 2030
World China Sub-Saharan Africa United States European Union India Pakistan
kg/capProcessed dairy products Fresh dairy products

181
OECD-FAO AGRICULTURAL OUTLOOK 2021-2030 © OECD/FAO 2021
environmental problems if not managed properly. The planned or implemented regulations to address
pollution could have a significant effect on dairy farming, notably in the Netherlands, Denmark, and
Germany. On the other hand, these pressures could lead to innovative solutions improving long-term
competitiveness.
Consumer interest in vegan diets and concerns about the environmental effects of dairy production are
expected to continue to bolster the consumption of plant-based replacements for dairy in the liquid market.
Plant-based offerings continue to diversify year after year, expanding beyond the traditional substitutes of
soy, almond, and coconut- based beverages. New offerings are proving popular with consumers, and
include oat, rice, and hemp-based drinks. A range of nut drinks (cashew, hazelnut, macadamia) has also
become popular, although they have not proven to be more environmentally sustainable, specifically with
respect to water usage. Strong growth is expected in East Asia, Europe and North America, albeit from
low volumes. Offerings are likely to continue to expand as consumers in these regions look for lactose-
free, vegan or sustainable alternatives to dairy products.
7.2. Recent market developments
The effect of the COVID-19 pandemic on the dairy sector was relatively modest, contrasting with initial
concerns that the sector was particularly vulnerable. The pandemic had the largest effect on world butter
prices compared to other dairy prices due to the loss of demand for milk fat from the hospitality sector.
Butter prices fell the most sharply in 2020, compared to the WMP price which decreased by a smaller
margin, and SMP and cheese prices which increased. World exports and imports had been steadily
growing in previous years, but in 2020 growth remained flat. Transportation slowdowns, disruptions in the
value chain, and decreased demand all contributed to the change in export and import growth. Overall,
however, the sector adapted quickly and mitigated many of the initially drastic effects seen in the earlier
months of the pandemic.
World milk production grew by 1.4% in 2020 to about 861 Mt. In India, the world’s largest milk producer,
production increased by 2.1% to 195 Mt. India, however, has little impact on the world dairy market as they
trade only marginal quantities of milk and dairy products. Indian production was relatively unaffected by
the pandemic, with any excess milk being processed into milk powder.
The three major dairy exporters are New Zealand, the European Union, and the United States. In 2020,
milk production increased in the European Union and the United States respectively, while it decreased
slightly in New Zealand due to a drought near the end of the season. As domestic consumption of dairy
products in these three countries is stable, the availability of fresh dairy products and processed products
for export was not significantly affected. In China, the world’s largest importer of dairy products, milk
production increased by 6.6%, and dairy imports remained strong in 2020.
7.3. Prices
International dairy prices refer to the prices of processed products of the main exporters in Oceania and
Europe. It does not include unprocessed milk as this is not generally traded. The two main reference prices
for dairy are butter and SMP, where butter is the reference for milk fat and SMP for other milk solids. Milk
fat and other milk solids together account for about 13% of the weight of milk, with the remainder being
water.
The strong volatility of international dairy prices stems from its small trade share (approximately 7% of
world milk production), the dominance of a few exporters and importers, and a restrictive trade policy
environment. Most domestic markets are only loosely connected to those prices as fresh dairy products

182
OECD-FAO AGRICULTURAL OUTLOOK 2021-2030 © OECD/FAO 2021
dominate consumption, and only a small share of milk is processed as compared to that which is fermented
or pasteurised.
Since 2015, the price of butter has increased considerably more than SMP. Increased demand for milk fat,
coupled with the European Union’s SMP intervention (from first purchases in 2015 to final disposal in
2019), resulted in a price gap emerging between the two products. While the butter price will continue to
be supported by stronger demand for milk fat compared to other milk solids on the international market,
world demand for SMP will outpace demand for milk fat, narrowing the price gap between the two
commodities over the projection period (Figure 7.2).
Following the complete disposal of intervention stocks in the European Union, SMP prices recovered in
2019 and were not significantly affected by the pandemic in 2020. SMP prices will remain stable in real
terms throughout the projection period. Annual butter prices peaked historically in 2017 due to changing
dietary preferences which resulted in increased demand, but have been declining since. Butter prices are
expected to continue to decline moderately in real terms after recovering slightly from a sharp decline in
2020. World prices for WMP and cheese are expected to be affected by butter and SMP price
developments, in line with the respective content of fat and non-fat solids.
Figure 7.2. Dairy product prices, 2000-2030
Note: Butter, FOB export price, 82% butterfat, Oceania; Skim Milk Powder, FOB export price, non-fat dry milk, 1.25% butterfat, Oceania; Whole
Milk Powder, FOB export price, 26% butterfat, Oceania; Cheese, FOB export price, cheddar cheese, 39% moisture, Oceania. Real prices are
nominal world prices deflated by the US GDP deflator (2020=1).
Source: OECD/FAO (2021), ''OECD-FAO Agricultural Outlook OECD Agriculture statistics (database)'', http://dx.doi.org/10.1787/agr-outl-data-
en.
StatLink 2 https://stat.link/gq74ba
7.4. Production
World milk production is projected to grow at 1.7% p.a. (to 1020 Mt by 2030) over the next decade, faster
than most other main agricultural commodities. While the world average growth of herds (1.1% p.a.) is
greater than the world average yield growth (0.7% p.a.), the changing averages are the result of herds
growing faster in countries that have relatively low yields and that have herds composed of lower yielding
animals. In almost all regions of the world, yield growth is expected to contribute more to production
0
1000
2000
3000
4000
5000
6000
2000
2005
2010
2015
2020
2025
2030
2000
2005
2010
2015
2020
2025
2030
Nominal Price Real Price
USD/t Butter Cheese Skim milk powder Whole milk powder

183
OECD-FAO AGRICULTURAL OUTLOOK 2021-2030 © OECD/FAO 2021
increases than herd growth (Figure 7.3). The drivers of yield growth include the optimisation of milk
production systems, improved animal health, improved efficiencies in feeding, and better genetics.
India and Pakistan are expected to contribute to more than half of the growth in world milk production over
the next ten years. They are also expected to account for more than 30% of world production in 2030.
Production will occur mostly in small herds of a few cows or buffaloes. It is expected that yields will continue
to grow fast and will contribute more to production growth. Nevertheless, the growing herd sizes and limited
growth in pasture area require an intensification of pasture use. In both countries, the vast majority of
production will be consumed domestically as few fresh products and processed dairy products are traded
internationally.
Production in the European Union is projected to grow more slowly than the world average. Dairy herds
are projected to decline (-0.5% p.a.), but milk yields are projected to grow at 1.0% p.a. over the next
decade. The European Union production originates from a mix of grass- and feed-based production
systems. In addition, a growing share of milk produced is expected to be organic or in other non-
conventional production systems. At present, more than 10% of dairy cows are within, but not limited to,
organic systems located in Austria, Sweden, Latvia, Greece, and Denmark. Countries like Germany and
France have also seen an increase in organic dairy production. These organic farms have about a quarter
lower yields than conventional production and high production costs, but they constitute more than 3% of
European Union milk production, suggesting a considerable price premium on European milk. In general,
domestic demand (cheese, butter, cream, and other products) is expected to grow only slightly, with most
additional production destined for export.
Figure 7.3. Annual changes in inventories of dairy herd and yields between 2020 and 2030
Note: The size of the bubbles refer to the total milk production in the base period 2018-20.
Source: OECD/FAO (2021), ''OECD-FAO Agricultural Outlook OECD Agriculture statistics (database)'', http://dx.doi.org/10.1787/agr-outl-data-
en.
StatLink 2 https://stat.link/ug218d
North America has some of the highest average yields per cow, as the share of grass-based production is
low and feeding is focused on high yields from specialised dairy herds (Figure 7.4). Dairy cowherds in the
United States and Canada are expected to remain largely unchanged and production growth is expected
to originate from further yield increases. As domestic demand is projected to remain stronger for milk fats,
the United States will mostly export SMP, while Canadian exports of SMP are capped under the USMCA.
The United States will also export a sizable amount of cheese, whey, and lactose.
European Union
United States
Australia
New Zealand
Russia
China
India
Pakistan
Latin America
Africa
0.0
0.2
0.4
0.6
0.8
1.0
1.2
1.4
1.6
1.8
- 1.0 - 0.5 0.0 0.5 1.0 1.5 2.0 2.5
% Change in yield
% Change in Inventory

184
OECD-FAO AGRICULTURAL OUTLOOK 2021-2030 © OECD/FAO 2021
Figure 7.4. Milk production and yield in selected countries and regions
Note: The yield is calculated per milking animal (mainly cows but also buffaloes, camels, sheep and goats)
Source: OECD/FAO (2021), ''OECD-FAO Agricultural Outlook OECD Agriculture statistics (database)'', http://dx.doi.org/10.1787/agr-outl-data-
en.
StatLink 2 https://stat.link/7zem9c
New Zealand is the most export-orientated producer, but growth in milk production has been very modest
in recent years. Milk production is mainly grass-based and yields are considerably lower than in North
America and Europe. The efficiency of grass management, however, allows New Zealand to be
competitive. The main constraining factors for growth are land availability and increasing environmental
restrictions. A change to a more feed-based production is not expected.
Strong production growth is expected in Africa, mostly due to larger herds. These will usually have low
yields, and a considerable share of milk production will come from goats and sheep. Most cows, goats and
sheep graze and are used for other purposes such as meat production, traction, and savings. Additional
grazing is expected to occur on the same pasture area, leading to a more intensive use which may lead to
local over-grazing. Over the projection period, about a third of the world-wide herd population is projected
to be located in Africa and to account for a little over 5% of world milk production.
It is projected that less than 40% of milk will be further processed into products such as butter, cheese,
SMP, WMP, or whey powder. There is considerable direct food demand for butter and cheese, especially
the latter, and they presently account for a large share of consumption of milk solids in Europe and North
America. SMP and WMP are highly traded and largely produced for trade only. Both are used in the food
processing sector, notably in confectionary, infant formula, and bakery products.
Butter production is projected to grow at a similar rate relative to overall milk production, at 1.9% p.a.,
reflecting strong demand for butter in developed countries and China. All other dairy products are projected
to grow at slower rates, with SMP and cheese at 1.2% p.a., WMP at 1.4% p.a. The slower growth rate of
WMP reflects the decreased growth in demand in China, Thailand, and the Philippines. The slower growth
rate for cheese is due to the importance of slow-growing food markets in Europe and North America.
7.5. Consumption
Most dairy production is consumed in the form of fresh dairy products, including pasteurised and fermented
products. The share of fresh dairy products in world global consumption is expected to increase over the
0
2
4
6
8
10
12
0
50
100
150
200
250
300
Africa Pakistan India Latin America China Russia New Zealand Australia European Union Canada United States
t/animalMt 2018-20 2030 Yield 2018-20 (right)

185
OECD-FAO AGRICULTURAL OUTLOOK 2021-2030 © OECD/FAO 2021
coming decade due to stronger demand growth in India and Pakistan, which in turn is driven by income
and population growth. World per capita consumption of fresh dairy products is projected to increase by
1.2% p.a. over the coming decade, slightly faster than over the past ten years, and driven by higher per-
capita income growth.
The level of milk consumption in terms of milk solids per capita will vary largely worldwide (Figure 7.1).
Country income per capita and the impact of regional preferences will be important factors driving this
consumption variation. For example, the per capita intake is expected to be high in India and Pakistan, but
low in China. The share of processed dairy products (especially cheese) in the overall consumption of milk
solids is expected to be closely related to income development, with variations due to local preferences,
dietary constraints, and level of urbanisation.
In Europe and North America, overall per capita demand for fresh dairy products is stable to declining, but
the composition of demand has been shifting over the last several years towards dairy fat, e.g. full-fat
drinking milk and cream. Consumers may be influenced by recent studies that have shed a more positive
light on the health benefits of dairy fat consumption, contrary to the messaging of the 1990s and 2000s. In
addition, this shift may reflect increasing consumer preference for foods that are less processed or
healthier, and potentially increased interest in at-home baking.
The largest percentage of total cheese consumption occurs in Europe and North America, where per capita
consumption is expected to continue to increase. Consumption of cheese will also increase where it was
not traditionally part of the national diet. In South East Asian countries, urbanisation and income increases
have resulted in more away-from-home eating, including fast food such as burgers and pizzas. It is worth
noting that the pandemic has not only increased usage of e-groceries and take-away foods in these
regions, but also consumer focus on foods they consider to be healthier or more wholesome. The
aforementioned changes in consumer consumption behaviour have benefitted the dairy sector.
While some regions are self-sufficient, e.g. India and Pakistan, total dairy consumption in Africa, South
East Asian countries, and the Near East and North Africa is expected to grow faster than production,
leading to an increase in dairy imports. As liquid milk is more expensive to trade, this additional demand
growth is expected to be met with milk powders, where water is added for final consumption or further
processing.
The dominant use of SMP and WMP will continue to be in the manufacturing sector, notably in
confectionary, infant formula, and bakery products. A small share of dairy products, especially SMP and
whey powder, are used in animal feed. China imports both products for feeding, but the African Swine
Fever (ASF) outbreak reduced its demand. With the expected recovery (see Chapter 6 on meat), the feed
demand for SMP and whey powder is expected to grow over the coming decade.
7.6. Trade
Approximately 7% of world milk production is traded internationally. This is primarily due to the perishability
of milk and its high water content (more than 85%). The notable exceptions are the small amounts of
fermented milk products traded between neighbouring dairy producing nations (i.e. Canada and the United
States, the European Union and Switzerland) and imports of liquid milk by China. Chinese imports of liquid
milk are primarily supplied by the European Union and New Zealand, and have increased considerably in
recent years. Trade of liquid milk is made possible primarily by the ability of Ultra-High Temperature milk
and cream products to be shipped long distances, but also favourable Chinese freight rates in some cases.
China’s net imports of fresh dairy products over the base period were about 0.9 Mt, and this is projected
to increase over the projection period by 1.5% p.a. The trade share of WMP and SMP is high at over 50%
of world production, since these products are often produced only as a means to store and trade milk over
a longer period or distance.

186
OECD-FAO AGRICULTURAL OUTLOOK 2021-2030 © OECD/FAO 2021
The three major exporters of dairy products in the base period are the European Union, New Zealand, and
the United States. These three countries are projected to jointly account for around 62% of cheese, 70%
of WMP, 76% of butter, and 83% of SMP exports in 2030 (Figure 7.5). Australia, another exporter, has lost
market shares although it remains a notable exporter of cheese and SMP. In the case of WMP, Argentina
is also an important exporter and is projected to account for 5% of world exports by 2030. In recent years,
Belarus has become an important exporter, orienting its exports primarily to the Russian market due to the
Russian embargo on several major dairy exporters.
Figure 7.5. Exports of dairy products by region
Source: OECD/FAO (2021), ''OECD-FAO Agricultural Outlook OECD Agriculture statistics (database)'', http://dx.doi.org/10.1787/agr-outl-data-
en.
StatLink 2 https://stat.link/v3bjlg
The European Union will continue to be the main world cheese exporter, followed by the United States and
New Zealand. It is projected that the European Union’s share in world cheese exports will be around 46%
by 2030, sustained by increased cheese exports to Canada via the CETA agreement and to Japan
following the ratification of the bilateral trade agreement in 2019. The United Kingdom, Russia, Japan, the
European Union, and Saudi Arabia are projected to be the top five cheese importers in 2030. These
countries are often also exporters of cheese and international trade is expected to increase the choice of
cheeses for consumers.
New Zealand remains the primary source for butter and WMP on the international market, and its market
shares are projected to be around 40% and 53%, respectively, by 2030. China is the principle importer of
WMP from New Zealand, but trade between the two countries is projected to be considerably less dynamic
over the projection period. The expected growth in domestic milk production in China will limit the growth
in WMP imports. It is expected that New Zealand will diversify and slightly increase its production of cheese
over the outlook period.
Imports are spread more widely across countries, with the dominant destinations for all dairy products
being the Near East and North Africa (NENA), developed countries, South East Asia, and China
(Figure 7.6). China is expected to continue to be the world’s major dairy importer, particularly for WMP.
Per capita consumption of dairy products in China is relatively low, but there has been significant increases
in demand over the past decade, with growth in demand projected to continue. Most of its dairy imports
come from Oceania, although in recent years the European Union has increased its exports of butter and
SMP to China. Imports by the Near East and North Africa are expected to originate primarily from the
0
0.5
1
1.5
2
2.5
3
3.5
4
4.5
2018-20 2030 2018-20 2030 2018-20 2030 2018-20 2030
Butter Cheese Skim milk powder Whole milk powder
Mt Rest of the World Argentina Australia European Union New Zealand United States

187
OECD-FAO AGRICULTURAL OUTLOOK 2021-2030 © OECD/FAO 2021
European Union, while United States and Oceania are expected to be the main suppliers of milk powders
to South East Asia. Developed countries import a high level of cheese and butter, around 55% and 42%
respectively of world imports in 2018-20. These percentages are expected to decline slightly by 2030.
While the effects of the pandemic will subside, it will have a lasting effect on GDP in many non-OECD
nations, with per capita income growth being lower than pre-pandemic projected growth. It is likely that the
income shock will disproportionately affect poorer households and lower their consumption, especially in
Central Asia, Indonesia, and the least developed African countries. Since dairy product demand,
specifically processed dairy products like butter and cheese, is closely tied to rising incomes, it is projected
there will be less import demand for butter from these nations.
Figure 7.6. Imports of dairy products by region
Note: NENA stands for Near East and North Africa, and is defined as in Chapter 2. South East Asia contains Indonesia, Malaysia, Philippines,
Thailand and Viet Nam.
Source: OECD/FAO (2021), ''OECD-FAO Agricultural Outlook OECD Agriculture statistics (database)'', http://dx.doi.org/10.1787/agr-outl-data-
en.
StatLink 2 https://stat.link/xeogpt
7.7. Main issues and uncertainties
The COVID-19 pandemic has affected daily life worldwide. While the dairy sector was relatively stable in
the wake of the pandemic, there may be structural changes that will have long-term effects. Vaccination
rates, which are tied to the reduction of restrictions and economic recovery, vary substantially across
regions. This will have an effect on dairy products like cheese, which are often consumed away from home
(e.g. in burgers and pizzas). At the same time, there may be a shift to more at-home cooking and baking,
and an increased focus on foods that consumers view as wholesome or healthy. The pandemic has also
lowered the projected overall GDP level in many countries. This has implications for the dairy sector, as
increased dairy consumption is tied to per capita income growth in many regions. The effects of a
staggered global recovery are also unclear, as there may be longer lasting implications for supply chains
that span diverse regions.
Changes to or the creation of trade agreements would affect dairy demand and trade flows. USMCA is
expected to influence dairy trade flows in North America, with members gaining increased access to
domestic dairy markets. The new trade relationship between the United Kingdom and the European Union
is also in its infant stages. Historically, large amounts of cheese and other dairy products have been traded
0
0.5
1
1.5
2
2.5
3
3.5
4
4.5
2018-20 2030 2018-20 2030 2018-20 2030 2018-20 2030
Butter Whole milk powder Skim milk powder Cheese
MtRest of the World NENA South East Asia China Developed

188
OECD-FAO AGRICULTURAL OUTLOOK 2021-2030 © OECD/FAO 2021
between the two regions, but there have been increased trade frictions as importers and exporters navigate
the new and changing trade environment. Russia embargo on several dairy products from major exporting
countries was partially lifted in 2020 to shore up domestic dairy supplies during the pandemic. The embargo
was temporarily lifted specifically for whey powder used in infant formula and specialized dairy products.
Dairy trade flows could be substantially altered by changes in the trade environment. To date, India and
Pakistan, the big dairy consuming countries, have not integrated the international dairy market as domestic
production is projected to expand fast to respond to growing internal demand. Future investment in cold
chain infrastructure in these regions will increase their self-sufficiency in this sector. Countries such as
Poland, Ukraine and notably Belarus could also emerge as players on the global market, as they have
favourable agricultural inputs (flat land, ideal climate, competitive labour and feed costs) and are close to
traditional dairy markets.
Changes in domestic polices remain an uncertainty. Under USMCA, Canada has capped SMP exports,
allowed increased market access, and eliminated their Class 7 designation, which was initially introduced
to comply with the World Trade Organization Nairobi Decision on the removal of export subsidies. In the
European Union, under certain circumstances, intervention buying of SMP and butter at fixed prices
remains possible and this has had a considerable market impact in recent years.
The role of plant-based replacements for dairy (e.g. soya, almond, rice and oat drinks) in the fluid milk
sector has increased in many regions, e.g. North America, Europe and East Asia. Available replacements
have continued to expand past the more traditional options, branching into various nuts, legumes and other
crops. Causes include lactose intolerance, health concerns, and consumer concerns regarding the
environmental impact of dairy production. The growth rates of plant-based replacements for dairy products
are strong, albeit from a low base, although conflicting views exist regarding their environmental impact
and relative health benefits. Popular substitutes such as almond and soya beverage have been questioned
on the environmental sustainability front as more consumers consider other environmental issues in
addition to GHG emissions, such as water usage and deforestation. Flexitarian, vegetarian, and vegan
diets are on the rise, but given the range of preferences of these consumers, the effect on dairy
consumption is not clear. Similarly, lactose intolerance is a concern for some consumers, but a range of
lactose-free dairy products are becoming widely available for those who do not prefer plant-based
replacements. Overall, there is uncertainty on the long-term impact of plant-based replacements on dairy
demand.
Environmental legislation could have a strong impact on the future development of dairy production. GHG
emissions from dairy activities make up a high share of total emissions in some countries (e.g. New
Zealand, Ireland) and any changes in related policies could affect dairy production. The increasing trend
towards sustainable practices such as water access and manure management are additional areas where
policy changes could have an impact. Nevertheless, stricter environmental legislation could lead to
innovative solutions that improve the long-term competitiveness of the sector.
World milk production could be constrained due to unforeseen weather events, especially as this concerns
grazing-based milk production, the dominant production method worldwide. Climate change increases the
chances of drought, floods, and disease threats, all of which can affect the dairy sector in several ways
(e.g. price volatility, milk yields, cow inventory adjustments).
Animal diseases and their spread could impact milk production. Mastitis is the most common infectious
disease in dairy cattle worldwide and across all types of farm sizes. It is also the most damaging from an
economic point of view, with a significant impact on milk yield and milk quality. Future developments in
awareness, identification, and treatment of this disease could lead to significant increases in milk
production through smaller losses. In order to control many diseases, including mastitis, treatments based
on antimicrobials are commonly used. This has raised concerns on the overuse of antimicrobials and the
development of antimicrobial resistance, which would reduce the effectiveness of existing treatments and

189
OECD-FAO AGRICULTURAL OUTLOOK 2021-2030 © OECD/FAO 2021
require the development of new ones. The evolution of this process remains an uncertainty for the next
decade.
Note
1 Fresh dairy products contain all dairy products and milk which are not included in processed products
(butter, cheese skim milk powder, whole milk powder, whey powder and, for few cases casein). The
quantities are in cow milk equivalent.

From:OECD-FAO Agricultural Outlook 2021-2030
Access the complete publication at:https://doi.org/10.1787/19428846-en
Please cite this chapter as:
OECD/Food and Agriculture Organization of the United Nations (2021), “Dairy and dairy products”, in OECD-FAO Agricultural Outlook 2021-2030, OECD Publishing, Paris.
DOI: https://doi.org/10.1787/160889c8-en
This work is published under the responsibility of the Secretary-General of the OECD. The opinions expressed and argumentsemployed herein do not necessarily reflect the official views of OECD member countries.
This document, as well as any data and map included herein, are without prejudice to the status of or sovereignty over anyterritory, to the delimitation of international frontiers and boundaries and to the name of any territory, city or area. Extracts frompublications may be subject to additional disclaimers, which are set out in the complete version of the publication, available atthe link provided.
The use of this work, whether digital or print, is governed by the Terms and Conditions to be found athttp://www.oecd.org/termsandconditions.