Who are the top 1% earners in Europe? | OECD iLibrary
58
OECD Economics Department Working Papers No. 1274 Who are the top 1% earners in Europe? Oliver Denk https://dx.doi.org/10.1787/5jrp1g39gkzw-en
-
Upload
khangminh22 -
Category
Documents
-
view
0 -
download
0
Transcript of Who are the top 1% earners in Europe? | OECD iLibrary

OECD Economics Department Working Papers No. 1274
Who are the top 1% earnersin Europe?
Oliver Denk
https://dx.doi.org/10.1787/5jrp1g39gkzw-en

Unclassified ECO/WKP(2015)92 Organisation de Coopération et de Développement Économiques Organisation for Economic Co-operation and Development 10-Dec-2015
___________________________________________________________________________________________
_____________ English - Or. English ECONOMICS DEPARTMENT
WHO ARE THE TOP 1% EARNERS IN EUROPE?
ECONOMICS DEPARTMENT WORKING PAPERS NO. 1274
By Oliver Denk
OECD Working Papers should not be reported as representing the official views of the OECD or of its member
countries. The opinions expressed and arguments employed are those of the author(s).
Authorised for publication by Jean-Luc Schneider, Deputy Director, Policy Studies Branch, Economics
Department.
All Economics Department Working Papers are available at www.oecd.org/eco/workingpapers
JT03388126
Complete document available on OLIS in its original format
This document and any map included herein are without prejudice to the status of or sovereignty over any territory, to the delimitation of
international frontiers and boundaries and to the name of any territory, city or area.
EC
O/W
KP
(20
15)9
2
Un
classified
En
glish
- Or. E
ng
lish

ECO/WKP(2015)92
2
OECD Working Papers should not be reported as representing the official views of the OECD or of its member countries. The opinions expressed and arguments employed are those of the author(s). Working Papers describe preliminary results or research in progress by the author(s) and are published to stimulate discussion on a broad range of issues on which the OECD works. Comments on Working Papers are welcome, and may be sent to OECD Economics Department, 2 rue André Pascal, 75775 Paris Cedex 16, France, or by e-mail to [email protected].
All Economics Department Working Papers are available at www.oecd.org/eco/workingpapers.
© OECD (2015)
You can copy, download or print OECD content for your own use, and you can include excerpts from OECD publications, databases and multimedia products in your own documents, presentations, blogs, websites and teaching materials, provided that suitable acknowledgment of OECD as source and copyright owner is given. All requests for commercial use and translation rights should be submitted to [email protected]

ECO/WKP(2015)92
3
ABSTRACT/RÉSUMÉ
Who are the top 1% earners in Europe?
Top earners have become the subject of intense public and scholarly debate. This is the first paper that
comprehensively documents the profiles of the 1% highest paid employees across 18 European countries.
The data come from the largest harmonised source available, an employer-based survey that covers the
labour income of 10 million employees, excluding the self-employed. The patterns that emerge are broadly
common across countries. Workers in the top 1% tend to be 40 to 60 years old, be men, have tertiary
education, work in finance or manufacturing, and be senior managers. The analysis also uncovers several
cross-country differences. For example, top earners are younger in Eastern Europe, and they include more
women in countries with higher overall female employment. The new estimates in this paper are similar to
related ones based on administrative records in the few countries for which such studies exist, indicating
that the sample is broadly representative of the characteristics of top earners.
JEL classification: D31; D63; J21; J31.
Keywords: Income inequality, high earners, top 1%, bottom 99%, earnings distribution, Europe.
*****
Qui sont les 1 % des salariés les mieux payés en Europe ?
Les très hauts revenus sont aujourd’hui au cœur du débat public et des travaux universitaires. Ce document
est le premier qui procède à une analyse complète du profil des 1 % des salariés les mieux payés dans
18 pays européens. Les données proviennent de la plus grande source harmonisée qui existe, une enquête
auprès des employeurs qui porte sur le revenu du travail de 10 millions de salariés, hors travailleurs
indépendants. Les caractéristiques mises en évidence sont globalement similaires d’un pays à l’autre. Les
employés qui font partie des 1 % les mieux rémunérés se trouvent principalement parmi les personnes
âgées de 40 à 60 ans, de sexe masculin, ayant fait des études supérieures, travaillant dans la finance ou
l’industrie, et occupant un poste de haut dirigeant. L’analyse révèle également plusieurs différences entre
pays. Par exemple, les employés à très hauts revenus sont plus jeunes en Europe de l’Est, et les femmes
sont davantage représentées dans cette catégorie dans les pays où le taux d’emploi des femmes est plus
élevé. Les nouvelles estimations que cette étude fournit recoupent celles basées sur des registres
administratifs dans les quelques pays où de telles études existent, ce qui révèle que l’échantillon est
globalement représentatif des caractéristiques des bénéficiaires de hauts revenus.
Classification JEL : D31 ; D63 ; J21 ; J31.
Mots-clés : Inégalités de revenu, bénéficiaires de hauts revenus, 1 % les plus riches, 99 % restants,
distribution des revenus, Europe.

ECO/WKP(2015)92
4
TABLE OF CONTENTS
WHO ARE THE TOP 1% EARNERS IN EUROPE? .................................................................................... 6
1. The data .................................................................................................................................................... 8 2. Descriptive statistics .............................................................................................................................. 11 3. Cross-country differences in the composition of top earners................................................................. 20 4. Regression analysis ................................................................................................................................ 28 5. Conclusion ............................................................................................................................................. 32
APPENDIX A1. CROSS-COUNTRY COMPARISONS ............................................................................. 33
APPENDIX A2. INDIVIDUAL COUNTRY PROFILES ............................................................................ 37
BIBLIOGRAPHY ......................................................................................................................................... 56
Tables
1. Sample size ............................................................................................................................................ 10 2. The determinants of the probability of a top 1% labour income ............................................................ 29 3. The determinants of the probability of a top 1% labour income: Western and Eastern Europe ............ 31
Figures
1. Labour income inequality at the very top .............................................................................................. 12 2. Collective wage bargaining and the labour income share of the top 1% ............................................... 13 3. Average share of age groups .................................................................................................................. 14 4. Average share of men and women ......................................................................................................... 15 5. Average share of highest education degree ............................................................................................ 16 6. Average share of years of firm tenure ranges ........................................................................................ 17 7. Average share of industries .................................................................................................................... 18 8. Average share of occupations ................................................................................................................ 19 9. Employees’ age in Eastern Europe and Western Europe ....................................................................... 21 10. Women among the bottom 99% and the top 1% ................................................................................. 22 11. Employees’ length of firm tenure in Southern Europe and other countries ......................................... 24 12. Employees in the ICT industry among the bottom 99% and the top 1% ............................................. 25 13. Health professionals and life expectancy ............................................................................................. 27 A1.1. Share of 40-49-year-olds .................................................................................................................. 34 A1.2. Share of men .................................................................................................................................... 34 A1.3. Share of tertiary graduates ............................................................................................................... 35 A1.4. Average number of years in the firm ............................................................................................... 35 A1.5. Share of employees in information & communication and finance & insurance ............................ 36 A1.6. Share of employees who are top executives or business/finance professionals ............................... 36 A2.1. Belgium: The top 1% and the bottom 99% ...................................................................................... 38 A2.2. Czech Republic: The top 1% and the bottom 99% .......................................................................... 39 A2.3. Estonia: The top 1% and the bottom 99% ........................................................................................ 40

ECO/WKP(2015)92
5
A2.4. Finland: The top 1% and the bottom 99% ....................................................................................... 41 A2.5. France: The top 1% and the bottom 99% ......................................................................................... 42 A2.6. Germany: The top 1% and the bottom 99% ..................................................................................... 43 A2.7. Greece: The top 1% and the bottom 99% ........................................................................................ 44 A2.8. Hungary: The top 1% and the bottom 99% ...................................................................................... 45 A2.9. Italy: The top 1% and the bottom 99% ............................................................................................ 46 A2.10. Luxembourg: The top 1% and the bottom 99% ............................................................................. 47 A2.11. Netherlands: The top 1% and the bottom 99% .............................................................................. 48 A2.12. Norway: The top 1% and the bottom 99% ..................................................................................... 49 A2.13. Poland: The top 1% and the bottom 99% ....................................................................................... 50 A2.14. Portugal: The top 1% and the bottom 99% .................................................................................... 51 A2.15. Slovak Republic: The top 1% and the bottom 99% ....................................................................... 52 A2.16. Spain: The top 1% and the bottom 99% ......................................................................................... 53 A2.17. Sweden: The top 1% and the bottom 99% ..................................................................................... 54 A2.18. United Kingdom: The top 1% and the bottom 99% ....................................................................... 55

ECO/WKP(2015)92
6
WHO ARE THE TOP 1% EARNERS IN EUROPE?
Oliver Denk1
1. Top earners have increasingly come under the spotlight in both policy and scholarly circles over
recent years, as evidence has mounted that their earnings are an important driver of high income inequality
(Atkinson et al., 2011; OECD, 2011; Alvaredo et al., 2013; Förster et al., 2014). The issue of top earners
has been particularly prominent in Anglo-Saxon countries, where their income share has risen the most.
But it is also being hotly debated in Continental Europe which has seen more muted increases in the
income share of top earners over past decades. This is, for example, reflected in the slogan “we are the
99%”, i.e. the bottom 99% of the income distribution, coined by the Occupy movement. Originating from
New York, Occupy protests subsequently spread to Germany, Spain, the United Kingdom and other
European countries.
2. While the literature to date has been mainly concerned with the estimation of top income shares,
knowledge on who these top earners actually are is scarce. Studies on top incomes often rely on tabulated
statistics from administrative data on tax returns (beginning with Piketty, 2003; Piketty and Saez, 2003),
not the individual observations themselves. Even when individual observations are available from income
tax or social security data, they frequently contain little information on personal characteristics, such as
education, occupation or industry of the worker. This problem is accentuated by tax units being defined by
the family in many countries, whereas variables of interest often relate to one person. The drawback of
most individual-level surveys is their much smaller sample size and insufficient coverage of top earners.
The result is that few studies on the attributes of top earners exist and those that do focus on either a single
country or a particular attribute.
3. This paper is the first study to fill these gaps by providing a comprehensive analysis of the
profiles of the employees with the top 1% labour incomes across 18 European countries. It uses the
Eurostat Structure of Earnings Survey (SES) from 2010. With a total of 10 million observations, the SES is
the largest available dataset harmonising earnings across Europe. Employers report information to the SES.
This has the advantage of ensuring high data accuracy and avoiding low response rates by top earners. The
sample covers, however, only the population of employees, not self-employed. The focus is on labour
income the data for which include salaries and bonuses and are not censored above a particular threshold.
Labour income is the largest source of income heterogeneity and, as the observed characteristics analysed,
related most closely with a single individual; capital income would have the difficulty of attributing it to
any one person, especially in the context of joint savings by several household members.
1. Economics Department, OECD. Email: [email protected]. I am grateful to Felix Arnold, Boris
Cournède, Michael Förster, Paula Garda, Antoine Goujard, Mikkel Hermansen, Peter Hoeller, Namhi Kim,
Catherine L. Mann, Jean-Baptiste Michau, Rory O’Farrell, Monika Queisser, Nicolas Ruiz, Jean-Luc
Schneider, Cyrille Schwellnus, Matteo Sostero and seminar participants at the OECD for useful comments
and suggestions.

ECO/WKP(2015)92
7
4. The SES provides labour income for 6% of the population of employees. To what extent are the
characteristics of the top 1% in the sample representative of those of the top 1% in the population? Several
papers relying on administrative records, in principle covering the universe of taxpayers, have documented
selected features of the top 1% in a small subset of countries of this dataset. They can therefore be used for
external benchmarking. Estimates in these studies are similar to the ones in this paper, for instance for
France (Amar, 2010) and the United Kingdom (Brewer et al., 2007). This indicates that the SES sample is
broadly representative of the characteristics of the employees with the 1% highest labour incomes.
Moreover, these related studies usually also cover the self-employed and include capital income in the
definition of income rank. Hence, a further implication of the similarity of the findings is that the absence
of the self-employed and of capital income from the dataset in this paper is unlikely to have a systematic
influence on the analysis.
5. The main contribution of this paper is to present descriptive statistics on the socio-demographic
and job characteristics of the top 1% earners and contrast them with the characteristics of the bottom 99%
earners. Personal attributes it focuses on are the employee’s age, gender and highest attained level of
education. In addition, evidence is provided on the number of years the employee has been with her firm,
industry and occupation. The appendices to the paper contain extensive sets of cross-country comparative
data and individual country profiles. The descriptive statistics focus on the distribution of characteristics
among the top earners and compare it with the rest of the population. The paper then employs regression
analysis to determine the characteristics that, conditional on the characteristic, make it more likely for an
employee to be a top earner, irrespective of the absolute frequency of characteristics in the population. For
example, workers aged above 60 are not many among the top 1% and the bottom 99%, even if much more
common among the top 1%. The regressions, however, show that workers above 60 are unusually often
represented in the top 1%, as conditional on being above 60 their probability of being in the top 1% is
higher than for other ages.
6. Several patterns emerge that are common across countries. The top 1% tend to: be in the 40s and
50s; be men; have a tertiary education degree; work in finance, manufacturing, or wholesale and retail; and
be employed as chief executives or in other senior management positions. 70% among the top 1% are
between 40 and 59 years old, while workers in this age group make up half of all other employees. 80-85%
among the top 1% are men versus 50-55% among the bottom 99%. The share of men among the top 1%
exceeds 90% in two countries: Germany and Luxembourg. 80-85% among the top 1% completed tertiary
education, compared with 30-35% among the bottom 99%. Half of the top 1% are employed in finance,
manufacturing, or wholesale and retail. 15% of them are chief executives or senior officials and another
45% corporate managers.
7. Besides these patterns which are broadly similar across Europe, the analysis uncovers important
differences between countries.
8. First, top earners are disproportionately younger, often in their 30s, in Eastern European countries
(the Czech Republic, Estonia, Hungary, Poland and the Slovak Republic). The much younger age of top
earners in Eastern Europe is likely related to the economic transformation of these countries after the fall of
the Iron Curtain. Workers already in the labour market during the 1980s, the latter years of communism in
Eastern Europe, have a smaller chance than in Western Europe of having moved up to the top 25 years
later. The analysis shows that the differences in the age composition of top earners between Eastern and
Western Europe are not explained by a generally younger workforce in Eastern Europe.
9. Second, in countries with higher overall female employment more of the top 1% are women. The
paper makes no attempt to establish causality from higher female employment to more women at the top.
Nevertheless, one way to interpret this finding is that general measures to broaden female participation in
the labour market might have the benefit of facilitating high-paying careers for women.

ECO/WKP(2015)92
8
10. Third, the information and communication industry is unusual in that in countries with a high
share of the bottom 99% working in this industry the share of the top 1% working in information and
communication is low. While this result, too, is obtained from a simple cross-country correlation, it is
consistent with the hypothesis that such technologies are complementary with high-skilled tasks in other
industries.
11. Fourth, health professionals are a large group of top earners in several countries. Life expectancy
has a positive correlation with the share of the top 1% who are health professionals. The correlation
suggests the possibility of life expectancy gains from high-paid, high-skilled health professionals. The
analysis shows that the same statistical relationship does not hold for the share of the bottom 99% who are
health professionals.
12. Fifth, the top 1% have on average stayed three years longer with their current firm than other
workers. Many of the top 1% are either new recruits or have had a career with their employer for more than
20 years. New recruits are less frequent among the top 1% in Southern European countries (Greece, Italy,
Portugal and Spain). This could be a sign of lower labour market flexibility at the top in these economies.
13. The paper proceeds with regressions to determine the characteristics which significantly raise the
probability of earning a top 1% labour income, conditional on the characteristic. People who are older, who
are male, with a tertiary education degree, who work in the financial, the professional services or the
information and communication industries, and who are employed as chief executives or in other senior
management positions are the most likely to be in the top 1%, given their profile. By contrast, firm-specific
skills (when captured by the length of firm tenure) as opposed to general skills influence the likelihood of
being a top earner little, when other observable characteristics are controlled for.
14. A small literature on the profiles of high earners has emerged, but the few studies available to
date examine either a single country or a single characteristic of interest. For the United States, different
authors have analysed the composition of top-income households by their age (Auten et al., 2013), gender
(Guvenen et al., 2014), industry (Kaplan and Rauh, 2010) and occupation (Bakija et al., 2012). Brewer et
al. (2007) provide a comprehensive account of the characteristics of high earners in the United Kingdom.
Several papers have conducted similar investigations for other countries; among them are Fortin et al.
(2012) and Statistics Canada (2013) for Canada, Amar (2010) and Godechot (2012) for France, and Budría
and Díaz-Giménez (2007) for Spain. Atkinson et al. (2015) describe the gender composition of top
incomes in five countries applying individual income taxation: Australia, Denmark, Norway, Spain and the
United Kingdom. The 2002 wave of the SES was used by Simón (2010) and Du Caju et al. (2010) to study
the determinants of wage inequality and the size of inter-industry wage differentials in up to 9 European
countries, but they did not focus on top earners. Denk (2015) used the same data source as in this paper to
analyse pay levels, in particular of high earners, in the financial industry.
15. The remainder of the paper is organised as follows. The next section describes the data. Section 2
presents the average statistics across Europe and benchmarks them with what is known, if anything, from
tax records and other data sources. Section 3 documents several systematic differences between countries.
Section 4 proceeds with the regression analysis. The last section concludes. Appendix A1 provides cross-
country comparisons and Appendix A2 individual country profiles.
1. The data
16. The data analysis uses the Eurostat Structure of Earnings Survey (SES) from 2010. The SES has
individual-level data on the characteristics of employees, including earnings, their employers and jobs in
18 countries of the European Economic Area: 17 from the European Union and Norway. The data for
Germany are from the 2006 edition of the SES, the most recent version available. The SES covers a

ECO/WKP(2015)92
9
repeated cross-section of employees and was conducted in 2002 (for a smaller set of countries), 2006 and
2010. Results for this paper are qualitatively and quantitatively similar for 2006, before the global financial
crisis, and 2010, during the global financial crisis. The nature of the findings presented, which are based on
the 2010 wave, is thus not predicated on the state of the economy and the labour market at the time of the
crisis.
17. The SES is an employers’ survey. The information reported is therefore likely to be more reliable
than that from household surveys.2 The data are obtained from a sample of employees drawn from a
stratified sample of local units of enterprises, or the enterprises themselves where the enterprise has no
decentralised activities. The coverage of enterprises with at least 10 employees is mandatory, that of
enterprises with fewer than 10 employees optional. The sampling procedure contains usually two stages. In
the first stage, a stratified random sample of local units is drawn. Stratification criteria may include the
industry, the number of employees in the enterprise which the local unit belongs to and the region. For the
second stage, a simple random sample of employees is usually taken within each of the selected local units.
Some countries use only a one-stage sample and cover all employees within the reporting local units.
18. The income variable this paper uses is gross annual labour earnings, or annual labour earnings
before tax deductions and social security contributions payable by the employee. Besides salaries, the data
comprise “any periodic, irregular, ad-hoc and exceptional bonuses and other payments that do not feature
every pay period” (European Commission, 2010). This is of particular importance for high-income
employees, especially in certain industries such as finance. The labour income of employees who have
worked for less than one year for their current employer is adjusted to an annual basis, so that the sample
consists of full-year equivalent employees.3 In the statistics presented, observations from the same country
are weighted to make the sample better aligned with the actual population. The survey data systematically
cover all industries, with the exception of “public administration, defense and compulsory social security”
in Belgium, Germany, Italy, Luxembourg, Norway and Portugal.
19. The incomplete coverage of enterprises with fewer than 10 employees and of employees in the
public administration should not be an important constraint on the analytical findings, as very few of them
are likely to be top 1% earners. For example, excluding workers in the public administration for all
countries does not materially affect any of the results. Nevertheless, the SES also has potential drawbacks
which must be kept in mind when interpreting the results. The most important caveat is the absence of self-
employed persons from the sample. For example, Brewer et al. (2007) find that the top 1% in the United
Kingdom receive more of their income, about 22%, from self-employment than the average taxpayer. A
final consideration is the frequently used practice of “top-coding”, which censors data by reporting a
smaller value for incomes above a threshold to ensure anonymity. The SES data are not top-coded.4
2. For example, the Eurostat household survey European Union Statistics on Income and Living Conditions
(EU SILC) is available annually, while the SES is conducted every four years. However, besides the higher
reliability of information, the SES also has the advantage of a significantly larger sample size. The higher
frequency of the EU SILC allows timely tracking of overall income inequality (OECD, 2015), even if top
incomes are not well covered (Ruiz and Woloszko, 2015).
3. The paper follows Eurostat practice (European Commission, 2010) and adjusts the earnings of employees
working for less than one year but more than 30 weeks to their full-year equivalent. This effectively
assumes that these employees earned the same labour income with their previous employer and were not
outside employment between the two jobs. Employees working for less than 30 weeks are excluded from
the analysis.
4. The exception is Germany for which labour income is top-coded when it exceeds EUR 1 million. However,
the bottom 99%-top 1% labour income cut-off is well below this level, so that top-coding for Germany has
no limitations for the main parts of the analysis.

ECO/WKP(2015)92
10
20. The total number of observations for the 18 countries in the sample is 10.2 million (Table 1).
They represent 6% of all employees in the sampled countries when the OECD Economic Outlook database
is used. The sample size varies considerably across countries; it exceeds 1 million in the Czech Republic,
Germany and Norway and is less than 50 000 in Greece and Luxembourg. The survey covers more than
20% of the population of employees in the Czech Republic, Estonia, Hungary, Norway and the Slovak
Republic. Using the sample weights to calculate the top 1% and the bottom 99% shows that the 1% highest
earners in the survey are sampled in an approximately representative manner; they make up 0.95% of all
observations.
Table 1. Sample size
Top 1% Bottom 99% Share of total
employees, per cent
Belgium 1 351 125 615 3.4
Czech Republic 22 470 1 651 426 39.4
Estonia 1 913 105 330 21.2
Finland 3 201 286 400 13.2
France 3 199 201 211 0.8
Germany 18 471 3 032 045 8.3
Greece 416 36 068 1.2
Hungary 4 039 831 168 23.4
Italy 3 039 250 184 1.4
Luxembourg 178 17 106 5.1
Netherlands 1 766 156 015 2.1
Norway 13 900 1 398 690 58.1
Poland 6 332 638 079 5.4
Portugal 1 279 108 107 2.6
Slovak Republic 6 707 676 914 37.8
Spain 4 655 194 713 1.2
Sweden 2 592 257 848 6.1
United Kingdom 1 457 165 514 0.7
European Union* 96 965 10 132 433 6.0
Note: The table provides the breakdown of the sample by country. The second column gives the number of observations for the top 1% in the survey, the third column the number of observations for the bottom 99% in the survey and the last column the share of all employees in the country covered in the survey. Categorisation into top 1% and bottom 99% is calculated using sample weights, which is why the number of observations for the top 1% is not exactly 1% of the total number of observations. European Union* lists the aggregate statistics for the European countries in the sample.
Source: Author calculations using Eurostat Structure of Earnings Survey; OECD Economic Outlook database.

ECO/WKP(2015)92
11
2. Descriptive statistics
21. This section first measures labour income shares of the top 1% and then presents descriptive
statistics by age, gender, education, length of firm tenure, industry and occupation. It ends with a
quantitative comparison of the results with those in the literature in the few cases where papers previously
studied similar issues for selected countries.
2.1. Labour income inequality at the very top
22. The labour income share of the top 1% earning employees is 5-6% on average across European
countries (Panel A of Figure 1). It is largest in the United Kingdom, and tends to be high in Eastern Europe
(Hungary, the Slovak Republic, Poland) and low in Northern Europe (Finland, Norway, Sweden). EU* is
the unweighted average across countries. Portugal is another country where the income share of the top 1%
is high, while at the other end countries in Northern Europe are joined by Belgium and Spain. Bonuses
make up one-fifth of the labour income of top earners on average and are a particularly common method of
pay in the United Kingdom and Luxembourg. Top income inequality is correlated with broader indicators
of inequality. Countries with higher overall earnings inequality, as measured by the Gini coefficient for
labour income, have higher earnings inequality at the top, as measured by the labour income share of the
top 1% (Panel B of Figure 1).
23. These shares for top incomes are smaller than in related work (Alvaredo et al., 2015), which uses
tax return data on total income of the entire population, not labour income of employees. Differences are
likely related to this paper’s exclusion of capital income, non-employed and self-employed and incomplete
coverage of enterprises with fewer than 10 employees and employees in the public administration. Capital
income is more concentrated than labour income and expanding coverage to the non-employed raises the
bottom 99%-top 1% cut-off, so that both channels reduce the top income shares in this paper. Alvaredo et
al. (2015) report data for ten countries around the year 2010 according to which, consistent with the present
findings, the income share of the top 1% is much greater in the United Kingdom than in other countries.
Subsection 2.3 shows that despite the smaller size of top income shares in this paper the characteristics of
top earners are similar to those in other papers where such studies exist. Characterising the profiles of the
top 1% earners requires less income precision than the correct calculation of top income shares, since what
matters is whether a person belongs to the top 1%, not what her exact income is.

ECO/WKP(2015)92
12
Figure 1. Labour income inequality at the very top
A. Labour income of the top 1% divided by aggregate labour income
B. Labour income inequality overall and at the top
Note: The figure shows the heterogeneity in top labour income shares across countries and the cross-country correlation between overall labour income inequality and labour income inequality at the top. EU* is the unweighted average across the European countries in the sample.
Source: Author calculations using Eurostat Structure of Earnings Survey.
0
2
4
6
8
10
FIN
BEL
NO
R
ESP
SWE
GR
C
ITA
DEU
NLD
EU*
FRA
EST
CZE
LUX
PO
L
SVK
PR
T
HU
N
GB
R
Salaries BonusesPer cent
FIN BELNOR
ESP
SWE
GRC ITA DEUNLD
EU*FRAEST
CZELUX
POL
SVK PRT
HUN
GBR
3
4
5
6
7
8
9
10
20 25 30 35 40 45
Lab
ou
r in
com
e sh
are
of
the
top
1%
, per
cen
t
Gini coefficient, Gini points

ECO/WKP(2015)92
13
24. The cross-country variation in the labour income share of the top 1% is related with indicators of
labour market institutions. Top earners obtain a smaller share of the economy’s aggregate labour income in
countries where more workers are covered by collective wage bargaining (Figure 2). The indicator for
collective wage bargaining is taken from the database on Institutional Characteristics of Trade Unions,
Wage Setting, State Intervention and Social Pacts (ICTWSS). The relationship is statistically significant at
the 1% level, even though a few countries show a somewhat different pattern.5 One way to interpret this
cross-country bivariate correlation is that collective wage bargaining systems may support “middle-class”
workers in receiving a larger share of the wage pie. This argument concentrates on the influence of the
non-executive side of worker bargaining on top income inequality, unlike Piketty et al. (2014) who study
the executive side. It is in line with evidence in Jaumotte and Osorio Buitron (2015) who analyse the
relationship between the total income share of the top 10% and union density with a particular focus on
capital income.
Figure 2. Collective wage bargaining and the labour income share of the top 1%
Note: The figure shows a negative, statistically significant at the 1% level, cross-country correlation between the coverage of collective wage bargaining and the labour income share of the top 1%. EU* is the unweighted average across the European countries in the sample.
Source: Author calculations using Eurostat Structure of Earnings Survey; ICTWSS.
25. Looking at the profiles of the 1% highest paid employees shows that nearly all work full-time and
have a permanent contract in each of the 18 countries. A slim majority of top earners is employed in firms
that have more than 250 employees. The proportion of employees who work in these large firms is greater
among the top 1% than the bottom 99%, except in Northern European countries (Finland, Norway and
5. Regressing the labour income share of the top 1% on the coverage of collective wage bargaining yields a
coefficient estimate of -0.038 and a p-value of 0.003. The R-squared is 0.438 and the number of
observations 18.
FIN BELNOR
ESP SWE
GRCITADEU
NLDEU* FRAEST
CZE LUXPOL
SVK PRT
HUN
GBR
2
3
4
5
6
7
8
9
10
0 20 40 60 80 100
Lab
ou
r in
com
e sh
are
of
the
top
1%
, per
cen
t
Coverage of collective wage bargaining, per cent

ECO/WKP(2015)92
14
Sweden). The remainder of the section studies in detail how other characteristics are related with the
position in the earnings distribution.
2.2. Average composition of the top 1% earners
26. The descriptive statistics below depict the unweighted average across the 18 European countries
in the sample.
Age
27. The top 1% tend to be in the 40s and 50s (Figure 3; Figure A1.1 in Appendix A1; Panels A in
Appendix A2).6 Overall, 9 out of 10 top 1% earners are between 30 and 59 years old.
Figure 3. Average share of age groups
Note: The figure shows that employees in the top 1% are often in their 40s and 50s, whereas employees who are less than 40 years old are a relatively large group of the bottom 99%.
Source: Author calculations using Eurostat Structure of Earnings Survey.
6. A few hundred observations of people aged between 10 and 19 years have been removed from the sample.
0
5
10
15
20
25
30
35
40
45
20-29 30-39 40-49 50-59 60+
Top 1% Bottom 99%Per cent

ECO/WKP(2015)92
15
Gender
28. Most of the top earners are men and disproportionately so: 80-85% among the top 1% are men
versus 50-55% among the bottom 99% (Figure 4; Figure A1.2 in Appendix A1; Panels B in Appendix A2).
The share of men among the top 1% exceeds 75% in all countries and 90% in two: Germany and
Luxembourg. Women are represented less among high-earning individuals relative to the European
average in some countries which introduced, or are in the process of introducing, regulatory quotas for
female directors on corporate boards, including Belgium, France, Germany and Norway.
Figure 4. Average share of men and women
Note: The figure shows that employees in the top 1% are very often men, whereas employees as a whole are about half men and half women.
Source: Author calculations using Eurostat Structure of Earnings Survey.
0
10
20
30
40
50
60
70
80
90
Men Women
Top 1% Bottom 99%Per cent

ECO/WKP(2015)92
16
Education
29. A higher educational attainment strongly raises the likelihood of earning a top 1% labour income
(Figure 5; Figure A1.3 in Appendix A1; Panels C in Appendix A2). Among the top 1% 80-85% completed
tertiary education, compared with 30-35% for the bottom 99%. Top 1% earners with only primary
education or lower secondary education are rare. This pattern is very similar across countries.
Figure 5. Average share of highest education degree
Note: The figure shows that most employees in the top 1% have a tertiary education degree, whereas the majority of employees in the bottom 99% have at most a secondary education degree.
Source: Author calculations using Eurostat Structure of Earnings Survey.
0
10
20
30
40
50
60
70
80
Primaryeducation
Lowersecondaryeducation
Uppersecondaryeducation
First stagetertiary
education(practical)
First stagetertiary
education(theoretical)
Second stagetertiary
education
Top 1% Bottom 99%Per cent

ECO/WKP(2015)92
17
Length of firm tenure
30. The top 1% have on average stayed three years longer with their current firm than other workers
(Figure 6; Figure A1.4 in Appendix A1; Panels D in Appendix A2). The top 1% tend to be either relatively
new recruits or have stayed with their employer for more than 20 years.
Figure 6. Average share of years of firm tenure ranges
Note: The figure shows the distribution of the top 1% and the bottom 99% by the number of years a person has worked for her current employer.
Source: Author calculations using Eurostat Structure of Earnings Survey.
0
5
10
15
20
25
30
35
40
45
50
0-4 5-9 10-14 15-19 20+
Top 1% Bottom 99%Per cent

ECO/WKP(2015)92
18
Industry
31. Industries are available based on NACE Rev. 2. The three industries in which most of the top 1%
work are finance and insurance, manufacturing, and wholesale and retail trade (Figure 7; Figure A1.5 in
Appendix A1; Panels E in Appendix A2).7 When compared with the bottom 99%, top earners are much
more represented in the finance and insurance, professional services, and information and communication
(ICT) industries. The fraction of workers in finance and insurance increases from 20% in the top 1% to
27% in the top 0.1%.
Figure 7. Average share of industries
Note: The figure shows the distribution of the top 1% and the bottom 99% by industry. Some 1-digit industry codes in NACE Rev. 2 have been pooled to ensure readability (see footnote to the main text). Employees in the public administration are not available for all countries and are therefore removed from the sample for cross-country comparison. Germany is excluded from the average since its industry classification is defined according to NACE Rev. 1.1.
Source: Author calculations using Eurostat Structure of Earnings Survey.
7. In these statistics: Manufacturing includes mining and quarrying; energy is waste management and the
supply of electricity, gas, steam and water; finance and insurance includes real estate activities;
administrative and support services includes other service activities; and leisure activities is
accommodation, food services activities, arts, entertainment and recreation.
0 5 10 15 20
Leisure activities
Health & social care
Education
Public administration
Admin. & support
Professional services
Finance & insurance
ICT
Transportation
Wholesale & retail
Construction
Energy
Manufacturing
Top 1% Bottom 99%
Per cent

ECO/WKP(2015)92
19
Occupation
32. Occupations are available based on ISCO-08. Top executives and business and finance
professionals receive much attention in the public debate, but their proportion among the top 1% is only
about a quarter (Figure 8; Figure A1.6 in Appendix A1; Panels F in Appendix A2).8 Non-executive
managers make up 45%. The share of the top 0.1% who are top executives or business and finance
professionals is almost 40% and therefore higher than the equivalent share for the top 1%.
Figure 8. Average share of occupations
Note: The figure shows the distribution of the top 1% and the bottom 99% by occupation. Several 2-digit occupation codes in ISCO-08 have been pooled to ensure readability (see footnote to the main text). Germany is excluded from the average since its occupation classification is defined according to ISCO-88.
Source: Author calculations using Eurostat Structure of Earnings Survey.
2.3. Comparison with existing results
33. To what extent are the characteristics of the top 1% in the sample representative of those of the
top 1% in the population? Several papers using administrative records, in principle covering the universe
of taxpayers, have documented selected features of the top 1% in a small subset of countries. They can
therefore be used for external benchmarking, although contrary to this paper they often include the self-
employed and capital income. The main insight of this subsection is that the present estimates are close to
previous ones in the few cases where such estimates are available. The similarity of results in this and other
8. In these statistics: Administrative/sales workers is clerical support workers and service and sales workers;
production workers is plant and machine operators and assemblers, craft and related trades workers, and
skilled agricultural, forestry and fishery workers; and elementary workers is elementary occupations and
armed forces occupations.
0 5 10 15 20 25 30
Elementary workers
Production workers
Admin./sales workers
Associate professionals
Legal/cultural professionals
ICT professionals
Business/finance professionals
Teaching professionals
Health professionals
Science professionals
Production managers
Admin./sales managers
CEOs & senior officials
Top 1% Bottom 99%
Per cent

ECO/WKP(2015)92
20
papers indicates that the SES sample is broadly representative of the characteristics of the employees with
the 1% highest labour incomes. Furthermore, it also suggests that external validity of the phenomena
described in this paper goes beyond the specific focus on the labour income of employees, given the more
comprehensive income definition and population coverage in these papers.
34. Several studies quantify the number of women among top earners for individual countries.
Atkinson et al. (2015) use tax returns to describe the gender distribution of top earners in three countries
that are also in this paper: Norway, Spain and the United Kingdom. Even though their data are based on all
taxpayers (including the self-employed) and total income (including capital income), the results in this
paper are similar to theirs. Atkinson et al. (2015) find that the proportion of women among the top 1% is
about 9% in Norway, 23% in Spain and 17% in the United Kingdom, compared with 11% for Norway,
24% for Spain and 13% for the United Kingdom in this paper. Similarly, Brewer et al. (2007) estimate that
in 2005 approximately 15% of the top 1% in the United Kingdom were women. According to Amar
(2010), in 2007 13% among the top 1% earners in France’s private sector were women, only a tad less than
the 14% this paper finds. Outside Europe, Guvenen et al. (2014) and Fortin et al. (2012) show that women
make up 18% in the United States and 17% in Canada among the top 1%.
35. With respect to age, according to Brewer et al. (2007) in 2005 about 65% of the top 1% in the
United Kingdom were between 35 and 54 years old, the same number the analysis in this paper yields for
30-49-year-olds. For France, Amar (2010) estimates that in 2007 72% among the 1% highest earners were
in the 40s and 50s, which is nearly identical to the 71% in this paper. Of the top 1%, approximately 50%
are 35-54-year-olds in the United States (Auten et al., 2013) and 80% 35-64-year-olds in Canada (Fortin et
al., 2012).
36. Fewer systematic results are available for industry and occupation. Denk (2015) relies on the
same data source as the one in this paper to estimate the proportion of top earners working in finance and
insurance. Kaplan and Rauh (2010) document that many top earners in the United States work in finance,
consistent with the evidence for Europe in Denk (2015) and this paper. For France, this paper finds that
20% of the top 1% earning employees work in finance and insurance, compared with 18% for 2007 in
Amar (2010). In Ireland, which the present sample does not cover, 31% of the 1% highest earning tax units
are in finance and insurance (Kennedy et al., 2015), a similar order of magnitude as the 35% in this paper
for the United Kingdom. Bakija et al. (2012) use a different classification system to determine high-income
occupations in the United States. Similarly to the results in this paper, they document the importance of
executives, managers and financial professionals.
3. Cross-country differences in the composition of top earners
37. This section sheds light on several cross-country differences in the composition of top earners.
3.1. Age in Eastern and Western Europe
38. Comparing Eastern European countries (the Czech Republic, Estonia, Hungary, Poland and the
Slovak Republic) with Western European countries shows that the top 1% are disproportionately younger,
often in their 30s, in Eastern Europe (Panel A of Figure 9). This is even though the age structure as a whole
does not differ between these two groups of countries (Panel B of Figure 9). The much younger age of top
earners in Eastern Europe is likely related to the economic transformation of these countries after the fall of
the Iron Curtain. Workers already in the labour market during the 1980s, the latter years of communism in
Eastern Europe, have a smaller chance than in Western Europe of having moved up to the top 25 years
later.

ECO/WKP(2015)92
21
Figure 9. Employees’ age in Eastern and Western Europe
A. Average share of age groups among the top 1%
B. Average share of age groups among the bottom 99%
Note: The figure shows that top 1% earners tend to be much younger in Eastern than Western Europe, even though employees are not generally younger in Eastern than Western Europe. Eastern Europe includes the Czech Republic, Estonia, Hungary, Poland and the Slovak Republic. The statistics are the unweighted average across the countries in the sample.
Source: Author calculations using Eurostat Structure of Earnings Survey.
0
5
10
15
20
25
30
35
40
45
20-29 30-39 40-49 50-59 60+
Eastern Europe Western EuropePer cent
0
5
10
15
20
25
30
35
40
45
20-29 30-39 40-49 50-59 60+
Eastern Europe Western EuropePer cent

ECO/WKP(2015)92
22
3.2. Women among the bottom 99% and the top 1%
39. In countries with more female employment among the bottom 99% earners the share of women
among the top 1% is higher, statistically significant at the 5% level (Figure 10).9 The share of women
among the bottom 99% is virtually identical to the overall female employment share which includes the top
1%. One way to interpret this positive cross-country correlation between the female employment share and
the fraction of women at the top is that general measures raising female labour force participation may feed
through to the higher ranks of the corporate hierarchy. This feedthrough is, however, incomplete.
According to the empirical results, if the fraction of women among the bottom 99% increases by three
percentage points, the fraction of women among the top 1% rises by two percentage points.
Figure 10. Women among the bottom 99% and the top 1%
Note: The figure shows a positive, statistically significant at the 5% level, cross-country correlation between the share of women among the bottom 99% and the share of women among the top 1%. EU* is the unweighted average across the European countries in the sample.
Source: Author calculations using Eurostat Structure of Earnings Survey.
40. The established relationship is nearly unchanged when Eastern European countries are removed
from the sample and so appears to be quite general. The combination of higher female employment overall
and reduced gender gaps at the top is an interesting counterpart to Olivetti and Petrongolo (2008). They
find that more female employees increase average gender wage gaps, as this pulls more women with
below-average skills into employment. The two results together suggest that higher female employment
could have two opposing effects on man-woman-comparisons. It may widen gender wage gaps but
promote female representation at the top.
9. Regressing the share of women among the top 1% on the share of women among the bottom 99% yields a
coefficient estimate of 0.655 and a p-value of 0.019. The R-squared is 0.298 and the number of
observations 18.
HUNPOL
ESP
PRTSVK
GRCEST
FINSWEEU*CZE
ITA FRA
GBRBEL
NLD NOR
LUX DEU
0
5
10
15
20
25
30
30 35 40 45 50 55 60
Shar
e o
f w
om
en a
mo
ng
the
top
1%
, per
cen
t
Share of women among the bottom 99%, per cent

ECO/WKP(2015)92
23
3.3. Length of firm tenure in Southern Europe and other countries
41. In Southern European countries (Greece, Italy, Portugal and Spain), one-third of the top 1% have
worked for the same firm for more than 20 years, more than in the other European countries (Panel A of
Figure 11). This is despite the similarities in firm tenure between Southern Europe and other countries for
the bottom 99% (Panel B of Figure 11). These cross-country differences in firm tenure for high earners
could be a sign of weaker labour market flexibility at the top in Southern European countries.

ECO/WKP(2015)92
24
Figure 11. Employees’ length of firm tenure in Southern Europe and other countries
A. Average share of years of firm tenure ranges among the top 1%
B. Average share of years of firm tenure ranges among the bottom 99%
Note: The figure shows that top 1% earners tend to have been employed with their current firm for much longer in Southern Europe than other countries, even though years of firm tenure are not generally different in Southern Europe than elsewhere. Southern Europe includes Greece, Italy, Portugal and Spain. The statistics are the unweighted average across the countries in the sample.
Source: Author calculations using Eurostat Structure of Earnings Survey.
0
5
10
15
20
25
30
35
40
45
0-4 5-9 10-14 15-19 20+
Southern Europe Other countriesPer cent
0
5
10
15
20
25
30
35
40
45
0-4 5-9 10-14 15-19 20+
Southern Europe Other countriesPer cent

ECO/WKP(2015)92
25
3.4. Employees in the ICT industry among the bottom 99% and the top 1%
42. Information and communication is the only industry for which the share of employees among the
top 1% falls with the share of employees among the bottom 99% in a statistically significant fashion
(Figure 12).10
Related studies have argued that information and communication technologies (ICT) are
complementary with non-routine tasks performed by high-skilled workers in other industries (Autor et al.,
2003; Michaels et al., 2014). If more ICT helps create high-value jobs elsewhere, a larger share of
employees working in ICT may squeeze out ICT employees from the top of the earnings distribution. The
negative correlation across countries in the figure is consistent with this view. Eastern European countries,
where relatively many of the top 1% but few of the bottom 99% work in ICT, are critical for identifying
the relationship.
Figure 12. Employees in the ICT industry among the bottom 99% and the top 1%
Note: The figure shows a negative, statistically significant at the 5% level, cross-country correlation between the share of employees among the bottom 99% working in the ICT industry and the share of employees among the top 1% working in the ICT industry. Employees in the public administration are not available for all countries and are therefore removed from the sample for cross-country comparison. Germany is not included since its industry classification is defined according to NACE Rev. 1.1, not NACE Rev. 2 as for the other countries. EU* is the unweighted average across the European countries in the sample.
Source: Author calculations using Eurostat Structure of Earnings Survey.
10. Regressing the share of ICT employees among the top 1% on the share of ICT employees among the
bottom 99% yields a coefficient estimate of -1.955 and a p-value of 0.030. The R-squared is 0.277 and the
number of observations 17.
BEL
CZE
ESP
EST
FIN
FRA
GBR
GRC
HUN
ITA
LUX
NLD
NOR
POL
PRT
SVK
SWEEU*
2
4
6
8
10
12
14
16
18
20
1 2 3 4 5 6
Shar
e o
f IC
T in
du
stry
am
on
g th
e to
p 1
%, p
er c
ent
Share of ICT industry among the bottom 99%, per cent

ECO/WKP(2015)92
26
3.5. Health professionals and life expectancy
43. Health professionals are another large group of top-income earners and exceed the number of
business and finance professionals among the top 1% in Finland, France, Italy, Portugal, Sweden and the
United Kingdom. The proportion of health professionals among the top 1% is positively correlated with
life expectancy at birth (Panel A of Figure 13). A one percentage point increase in the share of health
professionals among the top 1% is associated with a 3½ months longer life, statistically significant at the
1% level.11
The same relationship does not hold for the proportion of health professionals among the
bottom 99% (Panel B of Figure 13). The values for life expectancy are taken from the OECD Health
Statistics database.
44. Countries in Eastern Europe are an important driver of the underlying statistical relationship, and
excluding them reduces the slope coefficient and raises the p-value for the share of the top 1% who are
health professionals to slightly above 10%, although the number of observations is now only 12. Another
consideration is that in several countries many doctors are self-employed and hence missing from the data,
although it is not clear how this would impact the present finding which highlights differences between the
top 1% and the bottom 99%. As with the other cross-country comparisons in this paper, the relationship
does not establish causality from one health variable to the other. Nevertheless, the correlation suggests the
possibility of life expectancy gains from being treated by high-paid, high-skilled health professionals.
11. Regressing life expectancy at birth on the share of health professionals among the top 1% yields a
coefficient estimate of 0.289 and a p-value of 0.006. The R-squared is 0.407 and the number of
observations 17.

ECO/WKP(2015)92
27
Figure 13. Health professionals and life expectancy
A. Health professionals among the top 1%
B. Health professionals among the bottom 99%
Note: The figure shows a positive, statistically significant at the 1% level, cross-country correlation between the share of health professionals among the top 1% and life expectancy. The same relationship does not hold for the bottom 99%. Germany is not included since its occupation classification is defined according to ISCO-88, not ISCO-08 as for the other countries. EU* is the unweighted average across the European countries in the sample.
Source: Author calculations using Eurostat Structure of Earnings Survey; OECD Health Statistics database.
BEL
CZE
ESP
EST
FIN
FRA
GBRGRC
HUN
ITA
LUXNLDNOR
POL
PRT
SVK
SWE
EU*
74
76
78
80
82
84
0 5 10 15 20
Life
exp
ecta
ncy
at
bir
th, y
ears
Share of health professionals among the top 1%, per cent
BEL
CZE
ESP
EST
FIN
FRA
GBRGRC
HUN
ITA
LUXNLD
NOR
POL
PRT
SVK
SWE
EU*
74
76
78
80
82
84
0 1 2 3 4 5 6
Life
exp
ecta
ncy
at
bir
th, y
ears
Share of health professionals among the bottom 99%, per cent

ECO/WKP(2015)92
28
4. Regression analysis
45. The previous section documented the unconditional distribution of the top 1% earners by socio-
demographic and job characteristics. It also showed the unconditional distribution of all other earners by
the same characteristics. However, the analysis so far made no explicit link in the estimation between the
relative frequency of top earners and all others among individuals with the same characteristic, such as age,
gender or industry. The objective of this section is to study how unusual it is that a person is a top 1%
earner, conditional on him having a particular characteristic, for example being 40-49 years old, being a
man or working in finance. Standard regression design is used.
46. An indicator variable taking on unity when the worker is in the top 1% is regressed on all the
observable characteristics of the previous section (Table 2). The regression relies on a linear probability
model; results are very similar for logit and probit specifications. The standard errors are clustered by
country; heteroskedasticity-robust standard errors (not clustered by country) are somewhat smaller than
those reported here. For each characteristic the category in the middle, when measuring the proportion
among the top 1% earners, is chosen as the reference. Observations are weighted to make the sample better
aligned with the actual population.
47. Several features of the data merit consideration. First, information for employees in the public
administration is not available for all countries. They are retained in the sample, but results are very similar
when these observations are removed for all countries. Second, the regression includes a country dummy
for Germany and industry and occupation are coded as 0 for Germany, since their classification is defined
somewhat differently. The results are again very similar when Germany is removed from the dataset.
Finally, the specification does not have dummy variables for the other countries, which has no discernible
influence, in particular as the dependent variable (being in the top 1%) has the same frequency for all
countries.
48. The regressions identify as the main determinants for the probability of a top 1% labour income:
being older; being male; having a more advanced education degree; working in finance and insurance,
information and communication, or the professional services; and being employed as a chief executive or
in another managerial position. The probability to be a top 1% earner is about: 1 percentage point higher
for people aged 40 years and more relative to 30-39-year-olds, 1¼ percentage points higher for men
relative to women, and 2 percentage points higher for holders of a theoretical tertiary education degree
relative to others.
49. Conditional and unconditional probabilities of being in the top 1% are in many cases similar, but
some differences stand out. The conditional probabilities rise monotonically in age and education, contrary
to the unconditional probabilities, reflecting the increasingly higher likelihood of being in the top 1% given
a higher age or degree. Being a chief executive or senior official is by a large margin the best predictor of
earning a top 1% labour income, even though this group makes up only 15% of the top 1%, much less than
some groups defined by age, gender or other characteristics. Firm-specific (captured by the length of firm
tenure) as opposed to general skills influence the likelihood of being a top earner in a hump-shaped form.
The likelihood is lowest for new recruits and employees who have had a long career with their current
firm. However, the economic significance of the estimates is small when other observable characteristics
are controlled for.

ECO/WKP(2015)92
29
Table 2. The determinants of the probability of a top 1% labour income
Dependent variable: Indicator for the top 1% Coefficient estimate Standard error
Age in years: reference 30-39
20-29 -0.204* 0.100
40-49 0.815*** 0.083
50-59 0.923*** 0.145
60+ 1.146** 0.454
Gender: reference Woman
Man 1.268*** 0.080
Education: reference Upper secondary
Primary -0.008 0.087
Lower secondary -0.067 0.086
First tertiary (practice) 0.563 0.414
First tertiary (theory) 1.745** 0.611
Second tertiary 2.654** 0.958
Years of firm tenure: reference 10-14
0-4 -0.219*** 0.043
5-9 -0.129** 0.054
15-19 -0.094* 0.054
20+ -0.215* 0.123
Industry: reference Transport
Manufacturing 0.359*** 0.066
Energy 0.190 0.212
Construction -0.155 0.107
Wholesale & retail 0.118 0.075
Information & communication 0.948** 0.333
Finance & insurance 2.603*** 0.729
Professional services 0.844*** 0.205
Admin. & Support -0.220 0.159
Public administration -1.080*** 0.249
Education -0.921*** 0.319
Health & social care -0.117 0.126
Leisure activities -0.301** 0.112
Occupation: reference Science professionals
CEOs & senior officials 17.659*** 2.067
Admin./sales managers 8.431*** 1.276
Production managers 3.696*** 1.043
Health professionals 2.352*** 0.408
Teaching professionals -0.106 0.276
Business/finance professionals 0.872*** 0.149
ICT professionals -0.473 0.365
Legal/cultural professionals 0.778** 0.340
Associate professionals 0.015 0.292
Admin./sales workers 0.167 0.337
Production workers -0.510 0.358
Elementary workers 0.184 0.398
R-squared 0.060
Observations 9 984 921
Note: The regression is OLS. It shows the change in the probability that a person is a top 1% earner when she falls in this instead of the reference category. Standard errors are clustered at the country level. *** indicates significance at the 1% level, ** at the 5% level and * at the 10% level. Observations are weighted to make the sample better aligned with the actual population. A country dummy for Germany is included and industry and occupation are coded as 0 for observations from Germany, since their classification is defined somewhat differently.
Source: Author calculations using Eurostat Structure of Earnings Survey.

ECO/WKP(2015)92
30
50. The regression coefficients are average estimates across the 18 European countries in the sample.
To gauge the degree to which countries are heterogeneous in the determinants for the probability of a top
1% labour income, two regressions are run: one for Western and the other for Eastern European countries
(Table 3). Three differences are particularly noteworthy. First, in Eastern Europe employees who are 40 to
49 years old are the most likely to be in the top 1%, while in Western Europe this is the case for employees
who are 60 years or older. This pattern is in line with the descriptive finding in Subsection 3.1 that top
earners are younger in Eastern compared with Western Europe. Second, the gender gap at the top, or the
extent to which the gender of the individual explains top 1% labour earnings, is somewhat less pronounced
in Eastern Europe. Third, among industries finance and insurance maximises the likelihood of being in the
top 1% in Western Europe, information and communication in Eastern Europe. This result resonates well
with Subsection 3.4 which showed that in Eastern European countries relatively many of the top 1% but
few of the bottom 99% work in information and communication.

ECO/WKP(2015)92
31
Table 3. The determinants of the probability of a top 1% labour income: Western and Eastern Europe
Western Europe Eastern Europe
Dependent variable: Indicator for the top 1% Coefficient estimate
Standard error Coefficient estimate
Standard error
Age in years: reference 30-39
20-29 -0.124 0.110 -0.714*** 0.061
40-49 0.901*** 0.084 0.357** 0.085
50-59 1.090*** 0.143 0.004 0.087
60+ 1.301** 0.518 0.039 0.237
Gender: reference Woman
Man 1.305*** 0.090 0.968*** 0.022
Education: reference Upper secondary
Primary -0.029 0.115 0.023 0.035
Lower secondary -0.101 0.083 0.246*** 0.027
First tertiary (practice) 0.536 0.456 0.754** 0.214
First tertiary (theory) 1.634** 0.675 2.511*** 0.233
Second tertiary 2.468** 1.022 4.066*** 0.352
Years of firm tenure: reference 10-14
0-4 -0.207*** 0.048 -0.298*** 0.063
5-9 -0.099 0.064 -0.260* 0.110
15-19 -0.082 0.063 -0.185 0.104
20+ -0.207 0.137 -0.366* 0.138
Industry: reference Transport
Manufacturing 0.395*** 0.078 0.115** 0.033
Energy 0.271 0.233 -0.042 0.288
Construction -0.070 0.110 -0.505** 0.121
Wholesale & retail 0.125 0.093 0.045 0.113
Information & communication 0.653* 0.345 3.305** 0.728
Finance & insurance 2.719*** 0.844 1.836*** 0.280
Professional services 0.842*** 0.238 0.913 0.518
Admin. & Support -0.169 0.178 -0.433** 0.154
Public administration -1.020*** 0.268 -1.599*** 0.213
Education -0.859** 0.362 -1.353*** 0.249
Health & social care -0.075 0.141 -0.398* 0.150
Leisure activities -0.227* 0.120 -0.710*** 0.104
Occupation: reference Science professionals
CEOs & senior officials 19.368*** 2.423 15.670** 4.302
Admin./sales managers 8.385*** 1.472 8.654** 1.976
Production managers 3.569** 1.204 4.358** 0.972
Health professionals 2.568*** 0.409 1.007** 0.290
Teaching professionals -0.160 0.336 0.066 0.081
Business/finance professionals 0.761*** 0.180 1.420*** 0.202
ICT professionals -0.697* 0.385 1.239 0.635
Legal/cultural professionals 0.738* 0.398 0.936 0.468
Associate professionals -0.112 0.332 0.779*** 0.071
Admin./sales workers 0.045 0.374 0.937*** 0.089
Production workers -0.663 0.385 0.462** 0.115
Elementary workers 0.011 0.430 1.294*** 0.181
R-squared 0.057 0.089
Observations 6 054 216 3 930 705
Note: The regressions are OLS. They show the change in the probability that a person is a top 1% earner when she falls in this instead of the reference category. Standard errors are clustered at the country level. *** indicates significance at the 1% level, ** at the 5% level and * at the 10% level. Observations are weighted to make the sample better aligned with the actual population. In the regression for Western Europe, a country dummy for Germany is included and industry and occupation are coded as 0 for observations from Germany, since their classification is defined somewhat differently.
Source: Author calculations using Eurostat Structure of Earnings Survey.

ECO/WKP(2015)92
32
5. Conclusion
51. This paper is the first to undertake a full characterisation of the top 1% earners in 18 European
countries. It uses the largest harmonised dataset available, an employer-based survey with a sample of 10
million employees. This survey overcomes main weaknesses associated with alternative data sources
which have been more widely used for income inequality analysis to date. Tax records tend to have
insufficient information on the profiles of individual earners, and household surveys usually have a small
sample size. In addition, the inclusion of a large set of European countries allows analysing differences in
the characteristics of top earners between countries, an important issue that practically no paper has
attempted.
52. Common patterns are found across countries. The top 1% tend to: be in the 40s and 50s; be men;
have a tertiary education degree; work in finance, manufacturing, or wholesale and retail; and be employed
as chief executives or in other senior management positions. These results are broadly in line with the few
ones that are already known in the literature, either for a particular country or for a particular characteristic.
The consistency of results has two important implications; it suggests, first, that the characteristics of the
top 1% in the survey are representative and, second, that the exclusion of the self-employed and of capital
income may not affect the findings. Some of the results might not come as a surprise. Yet, this is the first
time that the composition of top earners has been rigorously quantified with one consistent dataset and
such a large number of countries along several important dimensions.
53. The paper proceeded with regressions to identify the categories of characteristics for which the
fraction of top earners is particularly high. These are individuals who: are 40 years or older; are male; have
a more advanced tertiary education degree; work in finance and insurance; and are employed as chief
executives or in other senior management positions. Besides these broadly similar patterns across Europe,
the study has uncovered several important cross-country differences. For example, top earners are younger
in Eastern Europe, they include more women in countries with higher overall female employment, and they
have worked with their current employer for longer in Southern Europe.
54. The analysis opens the scope for further research along several directions. One of these could be
to explore causality in some of the simple cross-country correlations the paper documents. Another avenue
that could be pursued is to combine the data on the top 1% in this paper with sector-specific measures of
regulation. This would allow empirical testing of the market-based view (Kaplan and Rauh, 2013) versus
the rent-extraction view (Bivens and Mishel, 2013) to explain high labour incomes at the top. The
hypothesis of the rent-extraction view would be that sectors which are more strongly regulated relative to
other sectors and other countries attract more top 1% incomes. Finally, the paper has treated European
countries as individual economies. An extension could also look at the characteristics of the top earners in
Europe as a whole.

ECO/WKP(2015)92
33
APPENDIX A1. CROSS-COUNTRY COMPARISONS
55. This appendix contains cross-country comparisons on the characteristics of the top 1% earners
and the bottom 99% earners. The source underlying the figures is author calculations using the Eurostat
Structure of Earnings Survey. EU* is the unweighted average of the sample countries. Employees in the
public administration are not available for all countries and are therefore removed from the sample
underlying Figure A1.5. The data define industry and occupation classifications somewhat differently for
Germany, which does not allow matching the categories for the other countries in Figures A1.5 and A1.6.

ECO/WKP(2015)92
34
Figure A1.1. Share of 40-49-year-olds
Figure A1.2. Share of men
0
10
20
30
40
50
60
70
80
90
100
POL EST HUN SVK ITA CZE FRA BEL ESP EU* FIN NOR GRC GBR SWE PRT DEU NLD LUX
Top 1% Bottom 99%Per cent
0
10
20
30
40
50
60
70
80
90
100
HUN POL ESP PRT SVK GRC EST FIN SWE EU* CZE ITA FRA GBR BEL NLD NOR LUX DEU
Top 1% Bottom 99%Per cent

ECO/WKP(2015)92
35
Figure A1.3. Share of tertiary graduates
Figure A1.4. Average number of years in the firm
0
10
20
30
40
50
60
70
80
90
100
ITA DEU NOR GBR CZE FRA PRT GRC EU* SWE ESP NLD FIN LUX SVK POL EST HUN
Top 1% Bottom 99%Per cent
0
2
4
6
8
10
12
14
16
18
20
SWE HUN SVK NOR EST GBR CZE POL EU* FIN LUX DEU BEL PRT GRC FRA ITA ESP
Top 1% Bottom 99%Years

ECO/WKP(2015)92
36
Figure A1.5. Share of employees in information & communication and finance & insurance
Figure A1.6. Share of employees who are top executives or business/finance professionals
0
10
20
30
40
50
60
70
80
90
100
ITA BEL ESP NLD NOR FIN EST SWE POL FRA PRT EU* SVK HUN CZE GRC GBR LUX
Top 1% Bottom 99%Per cent
0
10
20
30
40
50
60
70
80
90
100
ITA ESP SVK FRA EST GBR NOR PRT FIN EU* CZE SWE GRC BEL NLD HUN LUX POL
Top 1% Bottom 99%Per cent

ECO/WKP(2015)92
37
APPENDIX A2. INDIVIDUAL COUNTRY PROFILES
56. This appendix contains individual country profiles on the characteristics of the top 1% earners
and the bottom 99% earners. The source underlying the figures is author calculations using the Eurostat
Structure of Earnings Survey. All statistics are expressed in per cent. The data define industry and
occupation classifications somewhat differently for Germany, which does not allow matching the
categories as for the other countries in Panels E and F of Figure A2.6.

ECO/WKP(2015)92
38
Figure A2.1. Belgium: The top 1% and the bottom 99%
A. Share of age groups
C. Share of highest education degree
E. Share of industries
B. Share of men and women
D. Share of years of firm tenure ranges
F. Share of occupations
0
10
20
30
40
50
60
70
80
90
100
ITA ESP SVK FRA EST GBR NOR PRT FIN EU* CZE SWE GRC BEL NLD HUN LUX POL
Top 1% Bottom 99%Per cent
0
10
20
30
40
20-29 30-39 40-49 50-59 60+
0 25 50 75
Second tertiary
First tertiary(theory)
First tertiary(practice)
Upper secondary
Lower secondary
Primary
0 10 20 30
Leisure activities
Health & social care
Education
Public administration
Admin. & support
Professional services
Finance & insurance
ICT
Transportation
Wholesale & retail
Construction
Energy
Manufacturing
0
20
40
60
80
Men Women
0
10
20
30
40
50
0-4 5-9 10-14 15-19 20+
0 10 20 30 40
Elementary workers
Production workers
Admin./sales workers
Associate profs.
Legal/cultural profs.
ICT profs.
Business/finance profs.
Teaching profs.
Health profs.
Science profs.
Production managers
Admin./sales managers
CEOs & senior officials

ECO/WKP(2015)92
39
Figure A2.2. Czech Republic: The top 1% and the bottom 99%
A. Share of age groups
C. Share of highest education degree
E. Share of industries
B. Share of men and women
D. Share of years of firm tenure ranges
F. Share of occupations
0
10
20
30
40
50
60
70
80
90
100
ITA ESP SVK FRA EST GBR NOR PRT FIN EU* CZE SWE GRC BEL NLD HUN LUX POL
Top 1% Bottom 99%Per cent
0
10
20
30
40
20-29 30-39 40-49 50-59 60+
0 25 50 75
Second tertiary
First tertiary(theory)
First tertiary(practice)
Upper secondary
Lower secondary
Primary
0 10 20 30
Leisure activities
Health & social care
Education
Public administration
Admin. & support
Professional services
Finance & insurance
ICT
Transportation
Wholesale & retail
Construction
Energy
Manufacturing
0
20
40
60
80
Men Women
0
10
20
30
40
50
0-4 5-9 10-14 15-19 20+
0 10 20 30 40
Elementary workers
Production workers
Admin./sales workers
Associate profs.
Legal/cultural profs.
ICT profs.
Business/finance profs.
Teaching profs.
Health profs.
Science profs.
Production managers
Admin./sales managers
CEOs & senior officials

ECO/WKP(2015)92
40
Figure A2.3. Estonia: The top 1% and the bottom 99%
A. Share of age groups
C. Share of highest education degree
E. Share of industries
B. Share of men and women
D. Share of years of firm tenure ranges
F. Share of occupations
0
10
20
30
40
50
60
70
80
90
100
ITA ESP SVK FRA EST GBR NOR PRT FIN EU* CZE SWE GRC BEL NLD HUN LUX POL
Top 1% Bottom 99%Per cent
0
10
20
30
40
20-29 30-39 40-49 50-59 60+
0 25 50 75
Second tertiary
First tertiary(theory)
First tertiary(practice)
Upper secondary
Lower secondary
Primary
0 10 20 30
Leisure activities
Health & social care
Education
Public administration
Admin. & support
Professional services
Finance & insurance
ICT
Transportation
Wholesale & retail
Construction
Energy
Manufacturing
0
20
40
60
80
Men Women
0
10
20
30
40
50
0-4 5-9 10-14 15-19 20+
0 10 20 30 40
Elementary workers
Production workers
Admin./sales workers
Associate profs.
Legal/cultural profs.
ICT profs.
Business/finance profs.
Teaching profs.
Health profs.
Science profs.
Production managers
Admin./sales managers
CEOs & senior officials

ECO/WKP(2015)92
41
Figure A2.4. Finland: The top 1% and the bottom 99%
A. Share of age groups
C. Share of highest education degree
E. Share of industries
B. Share of men and women
D. Share of years of firm tenure ranges
F. Share of occupations
0
10
20
30
40
50
60
70
80
90
100
ITA ESP SVK FRA EST GBR NOR PRT FIN EU* CZE SWE GRC BEL NLD HUN LUX POL
Top 1% Bottom 99%Per cent
0
10
20
30
40
20-29 30-39 40-49 50-59 60+
0 25 50 75
Second tertiary
First tertiary(theory)
First tertiary(practice)
Upper secondary
Lower secondary
Primary
0 10 20 30
Leisure activities
Health & social care
Education
Public administration
Admin. & support
Professional services
Finance & insurance
ICT
Transportation
Wholesale & retail
Construction
Energy
Manufacturing
0
20
40
60
80
Men Women
0
10
20
30
40
50
0-4 5-9 10-14 15-19 20+
0 10 20 30 40
Elementary workers
Production workers
Admin./sales workers
Associate profs.
Legal/cultural profs.
ICT profs.
Business/finance profs.
Teaching profs.
Health profs.
Science profs.
Production managers
Admin./sales managers
CEOs & senior officials

ECO/WKP(2015)92
42
Figure A2.5. France: The top 1% and the bottom 99%
A. Share of age groups
C. Share of highest education degree
E. Share of industries
B. Share of men and women
D. Share of years of firm tenure ranges
F. Share of occupations
0
10
20
30
40
50
60
70
80
90
100
ITA ESP SVK FRA EST GBR NOR PRT FIN EU* CZE SWE GRC BEL NLD HUN LUX POL
Top 1% Bottom 99%Per cent
0
10
20
30
40
20-29 30-39 40-49 50-59 60+
0 25 50 75
Second tertiary
First tertiary(theory)
First tertiary(practice)
Upper secondary
Lower secondary
Primary
0 10 20 30
Leisure activities
Health & social care
Education
Public administration
Admin. & support
Professional services
Finance & insurance
ICT
Transportation
Wholesale & retail
Construction
Energy
Manufacturing
0
20
40
60
80
Men Women
0
10
20
30
40
50
0-4 5-9 10-14 15-19 20+
0 10 20 30 40
Elementary workers
Production workers
Admin./sales workers
Associate profs.
Legal/cultural profs.
ICT profs.
Business/finance profs.
Teaching profs.
Health profs.
Science profs.
Production managers
Admin./sales managers
CEOs & senior officials

ECO/WKP(2015)92
43
Figure A2.6. Germany: The top 1% and the bottom 99%
A. Share of age groups
C. Share of highest education degree
E. Share of industries
B. Share of men and women
D. Share of years of firm tenure ranges
F. Share of occupations
0
10
20
30
40
50
60
70
80
90
100
ITA ESP SVK FRA EST GBR NOR PRT FIN EU* CZE SWE GRC BEL NLD HUN LUX POL
Top 1% Bottom 99%Per cent
0
10
20
30
40
20-29 30-39 40-49 50-59 60+
0 25 50 75
Second tertiary
First tertiary(theory)
First tertiary(practice)
Upper secondary
Lower secondary
Primary
0 10 20 30
Other services
Hotels & restaurants
Health & social care
Education
Public administration
Business activities
Finance & insurance
ICT
Transportation
Wholesale & retail
Construction
Energy
Manufacturing
0
20
40
60
80
Men Women
0
10
20
30
40
50
0-4 5-9 10-14 15-19 20+
0 10 20 30 40
Elementary workers
Production workers
Admin./sales workers
Associate professionals
Other professionals
Teaching professionals
Health professionals
Science professionals
Corporate managers
CEOs & senior officials

ECO/WKP(2015)92
44
Figure A2.7. Greece: The top 1% and the bottom 99%
A. Share of age groups
C. Share of highest education degree
E. Share of industries
B. Share of men and women
D. Share of years of firm tenure ranges
F. Share of occupations
0
10
20
30
40
50
60
70
80
90
100
ITA ESP SVK FRA EST GBR NOR PRT FIN EU* CZE SWE GRC BEL NLD HUN LUX POL
Top 1% Bottom 99%Per cent
0
10
20
30
40
20-29 30-39 40-49 50-59 60+
0 25 50 75
Second tertiary
First tertiary(theory)
First tertiary(practice)
Upper secondary
Lower secondary
Primary
0 10 20 30
Leisure activities
Health & social care
Education
Public administration
Admin. & support
Professional services
Finance & insurance
ICT
Transportation
Wholesale & retail
Construction
Energy
Manufacturing
0
20
40
60
80
Men Women
0
10
20
30
40
50
0-4 5-9 10-14 15-19 20+
0 10 20 30 40
Elementary workers
Production workers
Admin./sales workers
Associate profs.
Legal/cultural profs.
ICT profs.
Business/finance profs.
Teaching profs.
Health profs.
Science profs.
Production managers
Admin./sales managers
CEOs & senior officials

ECO/WKP(2015)92
45
Figure A2.8. Hungary: The top 1% and the bottom 99%
A. Share of age groups
C. Share of highest education degree
E. Share of industries
B. Share of men and women
D. Share of years of firm tenure ranges
F. Share of occupations
0
10
20
30
40
50
60
70
80
90
100
ITA ESP SVK FRA EST GBR NOR PRT FIN EU* CZE SWE GRC BEL NLD HUN LUX POL
Top 1% Bottom 99%Per cent
0
10
20
30
40
20-29 30-39 40-49 50-59 60+
0 25 50 75
Second tertiary
First tertiary(theory)
First tertiary(practice)
Upper secondary
Lower secondary
Primary
0 10 20 30
Leisure activities
Health & social care
Education
Public administration
Admin. & support
Professional services
Finance & insurance
ICT
Transportation
Wholesale & retail
Construction
Energy
Manufacturing
0
20
40
60
80
Men Women
0
10
20
30
40
50
0-4 5-9 10-14 15-19 20+
0 10 20 30 40
Elementary workers
Production workers
Admin./sales workers
Associate profs.
Legal/cultural profs.
ICT profs.
Business/finance profs.
Teaching profs.
Health profs.
Science profs.
Production managers
Admin./sales managers
CEOs & senior officials

ECO/WKP(2015)92
46
Figure A2.9. Italy: The top 1% and the bottom 99%
A. Share of age groups
C. Share of highest education degree
E. Share of industries
B. Share of men and women
D. Share of years of firm tenure ranges
F. Share of occupations
0
10
20
30
40
50
60
70
80
90
100
ITA ESP SVK FRA EST GBR NOR PRT FIN EU* CZE SWE GRC BEL NLD HUN LUX POL
Top 1% Bottom 99%Per cent
0
10
20
30
40
20-29 30-39 40-49 50-59 60+
0 25 50 75
Second tertiary
First tertiary(theory)
First tertiary(practice)
Upper secondary
Lower secondary
Primary
0 10 20 30
Leisure activities
Health & social care
Education
Public administration
Admin. & support
Professional services
Finance & insurance
ICT
Transportation
Wholesale & retail
Construction
Energy
Manufacturing
0
20
40
60
80
Men Women
0
10
20
30
40
50
0-4 5-9 10-14 15-19 20+
0 10 20 30 40
Elementary workers
Production workers
Admin./sales workers
Associate profs.
Legal/cultural profs.
ICT profs.
Business/finance profs.
Teaching profs.
Health profs.
Science profs.
Production managers
Admin./sales managers
CEOs & senior officials

ECO/WKP(2015)92
47
Figure A2.10. Luxembourg: The top 1% and the bottom 99%
A. Share of age groups (different scale)
C. Share of highest education degree
E. Share of industries (different scale)
B. Share of men and women
D. Share of years of firm tenure ranges
F. Share of occupations
0
10
20
30
40
50
60
70
80
90
100
ITA ESP SVK FRA EST GBR NOR PRT FIN EU* CZE SWE GRC BEL NLD HUN LUX POL
Top 1% Bottom 99%Per cent
0
10
20
30
40
50
20-29 30-39 40-49 50-59 60+
0 25 50 75
Second tertiary
First tertiary(theory)
First tertiary(practice)
Upper secondary
Lower secondary
Primary
0 10 20 30 40 50
Leisure activities
Health & social care
Education
Public administration
Admin. & support
Professional services
Finance & insurance
ICT
Transportation
Wholesale & retail
Construction
Energy
Manufacturing
0
20
40
60
80
Men Women
0
10
20
30
40
50
0-4 5-9 10-14 15-19 20+
0 10 20 30 40
Elementary workers
Production workers
Admin./sales workers
Associate profs.
Legal/cultural profs.
ICT profs.
Business/finance profs.
Teaching profs.
Health profs.
Science profs.
Production managers
Admin./sales managers
CEOs & senior officials

ECO/WKP(2015)92
48
Figure A2.11. Netherlands: The top 1% and the bottom 99%
A. Share of age groups
C. Share of highest education degree
E. Share of industries
B. Share of men and women
D. Share of years of firm tenure ranges
No data available
F. Share of occupations
0
10
20
30
40
50
60
70
80
90
100
ITA ESP SVK FRA EST GBR NOR PRT FIN EU* CZE SWE GRC BEL NLD HUN LUX POL
Top 1% Bottom 99%Per cent
0
10
20
30
40
20-29 30-39 40-49 50-59 60+
0 25 50 75
Second tertiary
First tertiary(theory)
First tertiary(practice)
Upper secondary
Lower secondary
Primary
0 10 20 30
Leisure activities
Health & social care
Education
Public administration
Admin. & support
Professional services
Finance & insurance
ICT
Transportation
Wholesale & retail
Construction
Energy
Manufacturing
0
20
40
60
80
Men Women
0 10 20 30 40
Elementary workers
Production workers
Admin./sales workers
Associate profs.
Legal/cultural profs.
ICT profs.
Business/finance profs.
Teaching profs.
Health profs.
Science profs.
Production managers
Admin./sales managers
CEOs & senior officials

ECO/WKP(2015)92
49
Figure A2.12. Norway: The top 1% and the bottom 99%
A. Share of age groups
C. Share of highest education degree
E. Share of industries
B. Share of men and women
D. Share of years of firm tenure ranges
F. Share of occupations
0
10
20
30
40
50
60
70
80
90
100
ITA ESP SVK FRA EST GBR NOR PRT FIN EU* CZE SWE GRC BEL NLD HUN LUX POL
Top 1% Bottom 99%Per cent
0
10
20
30
40
20-29 30-39 40-49 50-59 60+
0 25 50 75
Second tertiary
First tertiary(theory)
First tertiary(practice)
Upper secondary
Lower secondary
Primary
0 10 20 30
Leisure activities
Health & social care
Education
Public administration
Admin. & support
Professional services
Finance & insurance
ICT
Transportation
Wholesale & retail
Construction
Energy
Manufacturing
0
20
40
60
80
Men Women
0
10
20
30
40
50
0-4 5-9 10-14 15-19 20+
0 10 20 30 40
Elementary workers
Production workers
Admin./sales workers
Associate profs.
Legal/cultural profs.
ICT profs.
Business/finance profs.
Teaching profs.
Health profs.
Science profs.
Production managers
Admin./sales managers
CEOs & senior officials

ECO/WKP(2015)92
50
Figure A2.13. Poland: The top 1% and the bottom 99%
A. Share of age groups
C. Share of highest education degree
E. Share of industries
B. Share of men and women
D. Share of years of firm tenure ranges
F. Share of occupations
0
10
20
30
40
50
60
70
80
90
100
ITA ESP SVK FRA EST GBR NOR PRT FIN EU* CZE SWE GRC BEL NLD HUN LUX POL
Top 1% Bottom 99%Per cent
0
10
20
30
40
20-29 30-39 40-49 50-59 60+
0 25 50 75
Second tertiary
First tertiary(theory)
First tertiary(practice)
Upper secondary
Lower secondary
Primary
0 10 20 30
Leisure activities
Health & social care
Education
Public administration
Admin. & support
Professional services
Finance & insurance
ICT
Transportation
Wholesale & retail
Construction
Energy
Manufacturing
0
20
40
60
80
Men Women
0
10
20
30
40
50
0-4 5-9 10-14 15-19 20+
0 10 20 30 40
Elementary workers
Production workers
Admin./sales workers
Associate profs.
Legal/cultural profs.
ICT profs.
Business/finance profs.
Teaching profs.
Health profs.
Science profs.
Production managers
Admin./sales managers
CEOs & senior officials

ECO/WKP(2015)92
51
Figure A2.14. Portugal: The top 1% and the bottom 99%
A. Share of age groups
C. Share of highest education degree
E. Share of industries
B. Share of men and women
D. Share of years of firm tenure ranges
F. Share of occupations
0
10
20
30
40
50
60
70
80
90
100
ITA ESP SVK FRA EST GBR NOR PRT FIN EU* CZE SWE GRC BEL NLD HUN LUX POL
Top 1% Bottom 99%Per cent
0
10
20
30
40
20-29 30-39 40-49 50-59 60+
0 25 50 75
Second tertiary
First tertiary(theory)
First tertiary(practice)
Upper secondary
Lower secondary
Primary
0 10 20 30
Leisure activities
Health & social care
Education
Public administration
Admin. & support
Professional services
Finance & insurance
ICT
Transportation
Wholesale & retail
Construction
Energy
Manufacturing
0
20
40
60
80
Men Women
0
10
20
30
40
50
0-4 5-9 10-14 15-19 20+
0 10 20 30 40
Elementary workers
Production workers
Admin./sales workers
Associate profs.
Legal/cultural profs.
ICT profs.
Business/finance profs.
Teaching profs.
Health profs.
Science profs.
Production managers
Admin./sales managers
CEOs & senior officials

ECO/WKP(2015)92
52
Figure A2.15. Slovak Republic: The top 1% and the bottom 99%
A. Share of age groups
C. Share of highest education degree
E. Share of industries
B. Share of men and women
D. Share of years of firm tenure ranges
F. Share of occupations
0
10
20
30
40
50
60
70
80
90
100
ITA ESP SVK FRA EST GBR NOR PRT FIN EU* CZE SWE GRC BEL NLD HUN LUX POL
Top 1% Bottom 99%Per cent
0
10
20
30
40
20-29 30-39 40-49 50-59 60+
0 25 50 75
Second tertiary
First tertiary(theory)
First tertiary(practice)
Upper secondary
Lower secondary
Primary
0 10 20 30
Leisure activities
Health & social care
Education
Public administration
Admin. & support
Professional services
Finance & insurance
ICT
Transportation
Wholesale & retail
Construction
Energy
Manufacturing
0
20
40
60
80
Men Women
0
10
20
30
40
50
0-4 5-9 10-14 15-19 20+
0 10 20 30 40
Elementary workers
Production workers
Admin./sales workers
Associate profs.
Legal/cultural profs.
ICT profs.
Business/finance profs.
Teaching profs.
Health profs.
Science profs.
Production managers
Admin./sales managers
CEOs & senior officials

ECO/WKP(2015)92
53
Figure A2.16. Spain: The top 1% and the bottom 99%
A. Share of age groups
C. Share of highest education degree
E. Share of industries
B. Share of men and women
D. Share of years of firm tenure ranges
F. Share of occupations
0
10
20
30
40
50
60
70
80
90
100
ITA ESP SVK FRA EST GBR NOR PRT FIN EU* CZE SWE GRC BEL NLD HUN LUX POL
Top 1% Bottom 99%Per cent
0
10
20
30
40
20-29 30-39 40-49 50-59 60+
0 25 50 75
Second tertiary
First tertiary(theory)
First tertiary(practice)
Upper secondary
Lower secondary
Primary
0 10 20 30
Leisure activities
Health & social care
Education
Public administration
Admin. & support
Professional services
Finance & insurance
ICT
Transportation
Wholesale & retail
Construction
Energy
Manufacturing
0
20
40
60
80
Men Women
0
10
20
30
40
50
0-4 5-9 10-14 15-19 20+
0 10 20 30 40
Elementary workers
Production workers
Admin./sales workers
Associate profs.
Legal/cultural profs.
ICT profs.
Business/finance profs.
Teaching profs.
Health profs.
Science profs.
Production managers
Admin./sales managers
CEOs & senior officials

ECO/WKP(2015)92
54
Figure A2.17. Sweden: The top 1% and the bottom 99%
A. Share of age groups
C. Share of highest education degree
E. Share of industries
B. Share of men and women
D. Share of years of firm tenure ranges
F. Share of occupations
0
10
20
30
40
50
60
70
80
90
100
ITA ESP SVK FRA EST GBR NOR PRT FIN EU* CZE SWE GRC BEL NLD HUN LUX POL
Top 1% Bottom 99%Per cent
0
10
20
30
40
20-29 30-39 40-49 50-59 60+
0 25 50 75
Second tertiary
First tertiary(theory)
First tertiary(practice)
Upper secondary
Lower secondary
Primary
0 10 20 30
Leisure activities
Health & social care
Education
Public administration
Admin. & support
Professional services
Finance & insurance
ICT
Transportation
Wholesale & retail
Construction
Energy
Manufacturing
0
20
40
60
80
Men Women
0
10
20
30
40
50
0-4 5-9 10-14 15-19 20+
0 10 20 30 40
Elementary workers
Production workers
Admin./sales workers
Associate profs.
Legal/cultural profs.
ICT profs.
Business/finance profs.
Teaching profs.
Health profs.
Science profs.
Production managers
Admin./sales managers
CEOs & senior officials
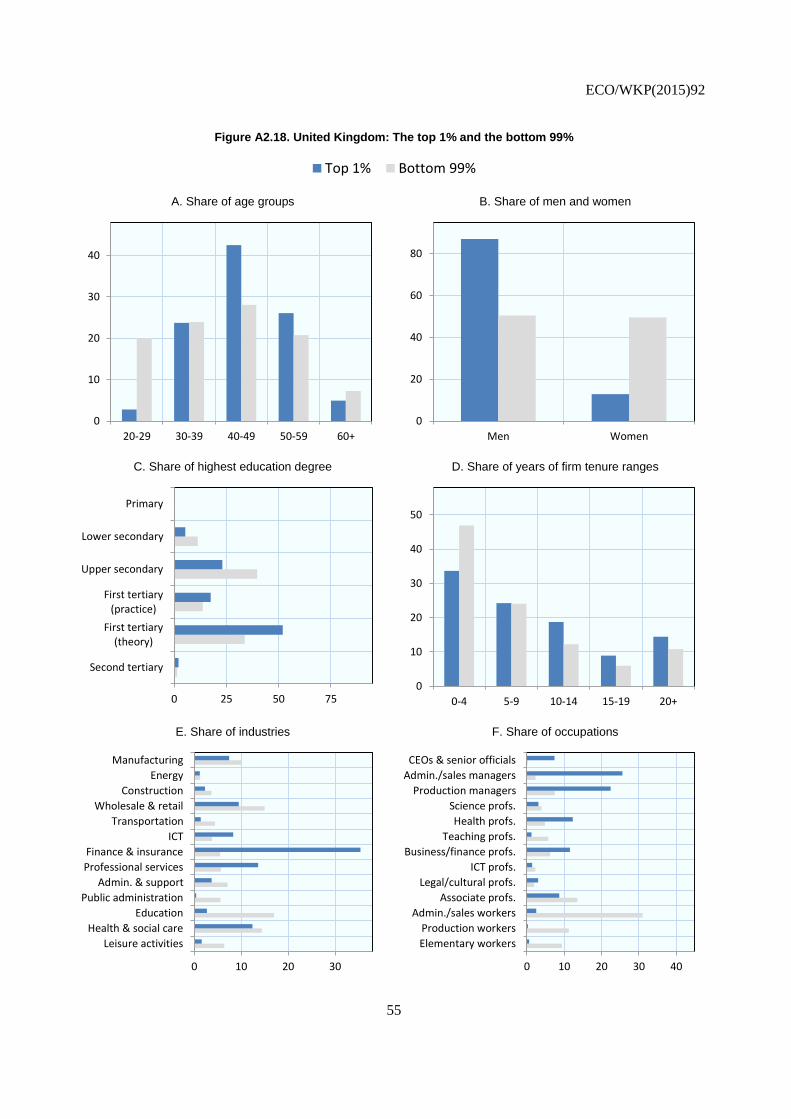
ECO/WKP(2015)92
55
Figure A2.18. United Kingdom: The top 1% and the bottom 99%
A. Share of age groups
C. Share of highest education degree
E. Share of industries
B. Share of men and women
D. Share of years of firm tenure ranges
F. Share of occupations
0
10
20
30
40
50
60
70
80
90
100
ITA ESP SVK FRA EST GBR NOR PRT FIN EU* CZE SWE GRC BEL NLD HUN LUX POL
Top 1% Bottom 99%Per cent
0
10
20
30
40
20-29 30-39 40-49 50-59 60+
0 25 50 75
Second tertiary
First tertiary(theory)
First tertiary(practice)
Upper secondary
Lower secondary
Primary
0 10 20 30
Leisure activities
Health & social care
Education
Public administration
Admin. & support
Professional services
Finance & insurance
ICT
Transportation
Wholesale & retail
Construction
Energy
Manufacturing
0
20
40
60
80
Men Women
0
10
20
30
40
50
0-4 5-9 10-14 15-19 20+
0 10 20 30 40
Elementary workers
Production workers
Admin./sales workers
Associate profs.
Legal/cultural profs.
ICT profs.
Business/finance profs.
Teaching profs.
Health profs.
Science profs.
Production managers
Admin./sales managers
CEOs & senior officials

ECO/WKP(2015)92
56
BIBLIOGRAPHY
Alvaredo, F., A. B. Atkinson, T. Piketty and E. Saez (2013), “The Top 1 Percent in International and
Historical Perspective”, Journal of Economic Perspectives, 27(3), pp. 3-20.
Alvaredo, F., A. B. Atkinson, T. Piketty, E. Saez and G. Zucman (2015), “The World Wealth and Income
Database”, http://www.wid.world (accessed 3 December 2015).
Amar, M. (2010), “Les Très Hauts Salaires du Secteur Privé”, Insee Première, No. 1288.
Atkinson, A. B., A. Casarico, S. Voitchovsky, F. Alvaredo, J. Modalsli and J. Søgaard (2015), “Top
Incomes and the Glass Ceiling”, Working paper.
Atkinson, A. B., T. Piketty and E. Saez (2011), “Top Incomes in the Long Run of History”, Journal of
Economic Literature, 49(1), pp. 3-71.
Auten, G., G. Gee and N. Turner (2013), “Income Inequality, Mobility, and Turnover at the Top in the US,
1987-2010”, American Economic Review: Papers & Proceedings, 103(3), pp. 168-172.
Autor, D. H., F. Levy and R. J. Murnane (2003), “The Skill Content of Recent Technological Change: An
Empirical Exploration”, Quarterly Journal of Economics, 118(4), pp. 1279-1333.
Bakija, J., A. Cole and B. T. Heim (2012), “Jobs and Income Growth of Top Earners and the Causes of
Changing Income Inequality: Evidence from US Tax Return Data”, Working paper.
Bivens, J. and L. Mishel (2013), “The Pay of Corporate Executives and Financial Professionals as
Evidence of Rents in Top 1 Percent Incomes”, Journal of Economic Perspectives, 27(3), pp. 57-78.
Brewer, M., L. Sibieta and L. Wren-Lewis (2007), “Racing Away? Income Inequality and the Evolution of
High Incomes”, Institute for Fiscal Studies Briefing Notes, No. 76.
Budría, S. and J. Díaz-Giménez (2007), “Economic Inequality in Spain: The European Community
Household Panel Dataset”, Spanish Economic Review, 9(1), pp. 1-38.
Denk, O. (2015), “Financial Sector Pay and Labour Income Inequality: Evidence from Europe”, OECD
Economics Department Working Papers, No. 1225, OECD Publishing, Paris.
Du Caju, P., G. Kátay, A. Lamo, D. Nicolitsas and S. Poelhekke (2010), “Inter-Industry Wage Differentials
in EU Countries: What Do Cross-Country Time Varying Data Add to the Picture?”, Journal of the
European Economic Association, 8(2-3), pp. 478-486.
European Commission (2010), “Structure of Earnings Survey 2010”, Eurostat, Brussels.
Förster, M., A. Llena-Nozal and V. Nafilyan (2014), “Trends in Top Incomes and their Taxation in OECD
Countries”, OECD Social, Employment and Migration Working Papers, No. 159, OECD Publishing,
Paris.

ECO/WKP(2015)92
57
Fortin, N., D. A. Green, T. Lemieux, K. Milligan and W. C. Riddell (2012), “Canadian Inequality: Recent
Developments and Policy Options”, Canadian Public Policy, 38(2), pp. 121-145.
Godechot, O. (2012), “Is Finance Responsible for the Rise in Wage Inequality in France?”, Socio-
Economic Review, 10(3), pp. 447-470.
Guvenen, F., G. Kaplan and J. Song (2014), “The Glass Ceiling and the Paper Floor: Gender Differences
among Top Earners, 1981-2012”, Working paper.
Jaumotte, F. and C. Osorio Buitron (2015), “Inequality and Labor Market Institutions”, IMF Staff
Discussion Notes, No. 15/14.
Kaplan, S. N. and J. Rauh (2010), “Wall Street and Main Street: What Contributes to the Rise in the
Highest Incomes?”, Review of Financial Studies, 23(3), pp. 1004-1050.
Kaplan, S. N. and J. Rauh (2013), “It’s the Market: The Broad-Based Rise in the Return to Top Talent”,
Journal of Economic Perspectives, 27(3), pp. 35-56.
Kennedy, S., Y. Jin, D. Haugh and P. Lenain (2015), “Taxes, Income and Economic Mobility in Ireland:
New Evidence from Tax Records Data”, OECD Economics Department Working Papers, No. 1269,
OECD Publishing, Paris.
Michaels, G., A. Natraj and J. Van Reenen (2014), “Has ICT Polarized Skill Demand? Evidence from
Eleven Countries over Twenty-Five Years”, Review of Economics and Statistics, 96(1), pp. 60-77.
OECD (2011), Divided We Stand: Why Inequality Keeps Rising, OECD Publishing, Paris.
OECD (2015), In It Together: Why Less Inequality Benefits All, OECD Publishing, Paris.
Olivetti, C. and B. Petrongolo (2008), “Unequal Pay or Unequal Employment? A Cross-Country Analysis
of Gender Gaps”, Journal of Labor Economics, 26(4), pp. 621-654.
Piketty, T. (2003), “Income Inequality in France, 1901-1998”, Journal of Political Economy, 111(5), pp.
1004-1042.
Piketty, T. and E. Saez (2003), “Income Inequality in the United States, 1913-1998”, Quarterly Journal of
Economics, 118(1), pp. 1-41.
Piketty, T., E. Saez and S. Stantcheva (2014), “Optimal Taxation of Top Labor Incomes: A Tale of Three
Elasticities”, American Economic Journal: Economic Policy, 6(1), pp. 230-271.
Ruiz, N. and N. Woloszko (2015), “What Do Household Surveys Suggest About the Top 1% Incomes and
Inequality in OECD Countries?”, OECD Economics Department Working Papers, forthcoming,
OECD Publishing, Paris.
Simón, H. (2010), “International Differences in Wage Inequality: A New Glance with European Matched
Employer-Employee Data”, British Journal of Industrial Relations, 48(2), pp. 310-346.
Statistics Canada (2013), “Education and Occupation of High-Income Canadians”, National Household
Survey in Brief, No. 99-014-X2011003.