PISA 2009 Technical Report - OECD iLibrary
390
PISA 2009 Technical Report P rogramme for I nternational S tudent A ssessment
-
Upload
khangminh22 -
Category
Documents
-
view
4 -
download
0
Transcript of PISA 2009 Technical Report - OECD iLibrary

Please cite this publication as:
OECD (2012), PISA 2009 Technical Report, PISA, OECD Publishing.http://dx.doi.org/10.1787/9789264167872-en
This work is published on the OECD iLibrary, which gathers all OECD books, periodicals and statistical databases. Visit www.oecd-ilibrary.org, and do not hesitate to contact us for more information.
PISA 2009 Technical ReportThe PISA 2009 Technical Report describes the methodology underlying the PISA 2009 survey. It examines additional features related to the implementation of the project at a level of detail that allows researchers to understand and replicate its analyses. The reader will fi nd a wealth of information on the test and sample design, methodologies used to analyse the data, technical features of the project and quality control mechanisms.
Contents
Chapter 1. Programme for International Student Assessment: An overview
Chapter 2. Test design and test development
Chapter 3. The development of the PISA context questionnaires
Chapter 4. Sample design
Chapter 5. Translation and verifi cation of the test and survey material
Chapter 6. Field operations
Chapter 7. Quality assurance
Chapter 8. Survey weighting and the calculation of sampling variance
Chapter 9. Scaling PISA cognitive data
Chapter 10. Data management procedures
Chapter 11. Sampling outcomes
Chapter 12. Scaling outcomes
Chapter 13. Coding reliability studies
Chapter 14. Data adjudication
Chapter 15. Profi ciency scale construction
Chapter 16. Scaling procedures and construct validation of context questionnaire data
Chapter 17. Digital reading assessment
Chapter 18. International database
THE OECD PROGRAMME FOR INTERNATIONAL STUDENT ASSESSMENT (PISA)PISA focuses on young people’s ability to use their knowledge and skills to meet real-life challenges. This orientation refl ects a change in the goals and objectives of curricula themselves, which are increasingly concerned with what students can do with what they learn at school and not merely with whether they have mastered specifi c curricular content. PISA’s unique features include its:
– Policy orientation, which highlights differences in performance patterns and identifi es features common to high-performing students, schools and education systems by linking data on learning outcomes with data on student characteristics and other key factors that shape learning in and outside of school.
– Innovative concept of “literacy”, which refers both to students’ capacity to apply knowledge and skills in key subject areas and to their ability to analyse, reason and communicate effectively as they pose, interpret and solve problems in a variety of situations.
– Relevance to lifelong learning, which goes beyond assessing students’ competencies in school subjects by asking them to report on their motivation to learn, their beliefs about themselves and their learning strategies.
– Regularity, which enables countries to monitor their progress in meeting key learning objectives.
– Breadth of geographical coverage and collaborative nature, which, in PISA 2009, encompasses the 34 OECD member countries and 41 partner countries and economies.
ISBN 978-92-64-04018-298 2012 01 1 P -:HSTCQE=UYUV]W:
PIS
A 2009 Tech
nical R
epo
rt
PISA 2009 Technical Report
P r o g r a m m e f o r I n t e r n a t i o n a l S t u d e n t A s s e s s m e n t
982012011.indd 1 21-Mar-2012 10:20:32 AM


PISA 2009Technical Report
This work is published on the responsibility of the Secretary-General of the OECD. The
opinions expressed and arguments employed herein do not necessarily reflect the official
views of the Organisation or of the governments of its member countries.
This document and any map included herein are without prejudice to the status of or
sovereignty over any territory, to the delimitation of international frontiers and boundaries
and to the name of any territory, city or area.
ISBN 978-92-64-04018-2 (print)ISBN 978-92-64-16787-2 (PDF)
Series: PISAISSN 1990-8539 (print)ISSN 1996-3777 (online)
The statistical data for Israel are supplied by and under the responsibility of the relevant Israeli authorities. The use of such data by the OECD is without prejudice to the status of the Golan Heights, East Jerusalem and Israeli settlements in the West Bank under the terms of international law.
Photo credits: Cover © .
Corrigenda to OECD publications may be found on line at: www.oecd.org/publishing/corrigenda.
© OECD 2012
You can copy, download or print OECD content for your own use, and you can include excerpts from OECD publications, databases and
multimedia products in your own documents, presentations, blogs, websites and teaching materials, provided that suitable
acknowledgement of OECD as source and copyright owner is given. All requests for public or commercial use and translation rights should
be submitted to [email protected]. Requests for permission to photocopy portions of this material for public or commercial use shall be
addressed directly to the Copyright Clearance Center (CCC) at [email protected] or the Centre français d’exploitation du droit de copie (CFC)
Please cite this publication as:OECD (2012), PISA 2009 Technical Report, PISA, OECD Publishing.http://dx.doi.org/10.1787/9789264167872-en

PISA 2009 TECHNICAL REPORT – © OECD 2012 3
Foreword
The OECD’s Programme for International Student Assessment (PISA) surveys, which take place every three years, have been designed to collect information about 15-year-old students in participating countries. PISA examines how well students are prepared to meet the challenges of the future, rather than how well they master particular curricula. The data collected during each PISA cycle are an extremely valuable source of information for researchers, policy makers, educators, parents and students. It is now recognised that the future economic and social well-being of countries is closely linked to the knowledge and skills of their populations. The internationally comparable information provided by PISA allows countries to assess how well their 15-year-old students are prepared for life in a larger context and to compare their relative strengths and weaknesses.
PISA is methodologically highly complex, requiring intensive collaboration among many stakeholders. The successful implementation of PISA depends on the use, and sometimes further development, of state-of-the-art methodologies and technologies. The PISA 2009 Technical Report describes those methodologies, along with other features that have enabled PISA to provide high quality data to support policy formation and review. The descriptions are provided at a level that will enable review and, potentially, replication of the implemented procedures and technical solutions to problems.
This report contains a description of the theoretical underpinning of the complex techniques used to create the PISA 2009 Database, which includes information on 470 000 students in 65 countries.1 The database includes not only information on student performance in the three main areas of assessment – reading, mathematics and science – but also their responses to the Student Questionnaire that they completed as part of the assessment. Data from the principals of participating schools are also included. The PISA 2009 Database was used to generate information and to be the basis for analysis for the PISA 2009 initial report.
The information in this report complements the PISA Data Analysis Manuals (OECD, 2009), which give detailed accounts of how to carry out the analyses of the information in the database.
The PISA surveys are guided by the governments of the participating countries on the basis of shared policy-driven interests. The PISA Governing Board, which decides on the assessment and reporting of results, is composed of representatives from each participating country.
The OECD recognises the creative work of Raymond Adams, of the Australian Council for Educational Research (ACER), who is project director of the PISA Consortium and John Cresswell who acted as editor for this report. The team supporting them comprised Alla Berezner, Wei Buttress, Steve Dept, Andrea Ferrari, Cees Glas, Béatrice Halleux, Khurrem Jehangir, Nora Kovarcikova, Sheila Krawchuk, Greg Macaskill, Barry McCrae, Juliette Mendelovits, Alla Routitsky, Keith Rust, Ross Turner and Maurice Walker. A full list of the contributors to the PISA project is included in Annex H of this report. The editorial work at the OECD Secretariat was carried out by Marika Boiron, Elizabeth Del Bourgo, Miyako Ikeda, Maciej Jakubowski, Sophie Vayssettes and Elisabeth Villoutreix.
Lorna BertrandChair of the PISA Governing Board
Barbara IschingerDirector for Education, OECD

foreword
4 © OECD 2012 – PISA 2009 TECHNICAL REPORT
Note
1. The implementation and data for PISA 2009 plus countries are not discussed in this report, however, the procedures, technical standards and statistical methods used in the PISA 2009 plus study were identical to those discussed here.

PISA 2009 TECHNICAL REPORT – © OECD 2012 5
Table of Contents
Foreword .................................................................................................................................................................................................................................................3
CHAPTER 1 Programme For InternatIonaL Student aSSeSSment: an overvIew .....................................................21
Participation .............................................................................................................................................................................................................................................23
Features of PISA ...................................................................................................................................................................................................................................24
Managing and implementing PISA ........................................................................................................................................................................................24
Organisation of this report ..........................................................................................................................................................................................................26
CHAPTER 2 teSt deSIgn and teSt deveLoPment .............................................................................................................................................27
Test scope and format ......................................................................................................................................................................................................................28
•Paper and pencil assessment .................................................................................................................................................................................................28
•Digital Reading Assessment (DRA) ...................................................................................................................................................................................28
Test design .................................................................................................................................................................................................................................................29
•Paper-based assessment ............................................................................................................................................................................................................29
•Digital Reading Assessment .................................................................................................................................................................................................31
Test development centres .............................................................................................................................................................................................................31
Development timeline .....................................................................................................................................................................................................................31
The PISA 2009 reading literacy framework.......................................................................................................................................................................32
Item development process ...........................................................................................................................................................................................................33
•First phase of development ....................................................................................................................................................................................................33
•Second phase of development.............................................................................................................................................................................................34
•National item submissions .....................................................................................................................................................................................................34
•National review of items .........................................................................................................................................................................................................35
•International item review ........................................................................................................................................................................................................36
•Reading for School questionnaire .....................................................................................................................................................................................36
•Preparation of dual (English and French) source versions .................................................................................................................................36
Field trial ......................................................................................................................................................................................................................................................37
•Field trial selection .....................................................................................................................................................................................................................37
•Field trial design ............................................................................................................................................................................................................................38
•Despatch of field trial instruments ....................................................................................................................................................................................39
•Field trial coder training ...........................................................................................................................................................................................................39
•Field trial coder queries ............................................................................................................................................................................................................39
•Field trial outcomes .....................................................................................................................................................................................................................40
•National review of field trial items ...................................................................................................................................................................................40
Main study .................................................................................................................................................................................................................................................40
•Main survey reading item selection ................................................................................................................................................................................40
•Main survey mathematics items .........................................................................................................................................................................................43
•Main survey science items ....................................................................................................................................................................................................44
•Released items ................................................................................................................................................................................................................................44
•Despatch of main survey instruments .............................................................................................................................................................................44

table of contents
6 © OECD 2012 – PISA 2009 TECHNICAL REPORT
•Main survey coder training ....................................................................................................................................................................................................45
•Main survey coder query service .......................................................................................................................................................................................45
•Review of main survey item analyses .............................................................................................................................................................................45
CHAPTER 3 the deveLoPment oF the PISa Context QueStIonnaIreS .....................................................................................47
Introduction .............................................................................................................................................................................................................................................48
The development of the PISA 2009 Questionnaire Framework ......................................................................................................................48
Research areas in PISA 2009 .........................................................................................................................................................................................................49
The development of the PISA 2009 context questionnaires ..............................................................................................................................52
The field-trial of the PISA 2009 context questionnaires ........................................................................................................................................52
The coverage of the questionnaire material ...................................................................................................................................................................53
•Student and School Questionnaires .................................................................................................................................................................................53
•Educational Career Questionnaire ....................................................................................................................................................................................54
•ICT Familiarity Questionnaire ..............................................................................................................................................................................................54
•Parent Questionnaire ..................................................................................................................................................................................................................54
The implementation of the context questionnaires ................................................................................................................................................54
CHAPTER 4 SamPLe deSIgn ......................................................................................................................................................................................................57
Target population and overview of the sampling design .....................................................................................................................................58
Population coverage, and school and student participation rate standards .......................................................................................58
•Coverage of the PISA international target population ..........................................................................................................................................59
•Accuracy and precision ............................................................................................................................................................................................................60
•School response rates ................................................................................................................................................................................................................60
•Student response rates ...............................................................................................................................................................................................................61
Main study school sample ............................................................................................................................................................................................................62
•Definition of the national target population ...............................................................................................................................................................62
•The sampling frame .....................................................................................................................................................................................................................62
•Stratification .....................................................................................................................................................................................................................................63
•Assigning a measure of size to each school ...............................................................................................................................................................66
•School sample selection ..........................................................................................................................................................................................................66
•Special school sampling situations ...................................................................................................................................................................................68
•Monitoring school sampling .................................................................................................................................................................................................71
•Student samples .............................................................................................................................................................................................................................75
•Definition of school ....................................................................................................................................................................................................................76
CHAPTER 5 tranSLatIon and verIFICatIon oF the teSt and Survey materIaL ............................................................81
Introduction .............................................................................................................................................................................................................................................82
Development of source versions ............................................................................................................................................................................................82
Double translation from two source languages ..........................................................................................................................................................83
PISA Translation and Adaptation Guidelines .................................................................................................................................................................84
Translation Training Session ........................................................................................................................................................................................................84
Testing languages and translation/adaptation procedures .................................................................................................................................84
International verification of the national versions ....................................................................................................................................................86
•Verification of test units ............................................................................................................................................................................................................87
•Main survey verification ..........................................................................................................................................................................................................88

table of contents
PISA 2009 TECHNICAL REPORT – © OECD 2012 7
•Verification of the booklet shell ..........................................................................................................................................................................................91
•Verification of link units ...........................................................................................................................................................................................................91
•Verification of questionnaires .............................................................................................................................................................................................91
•Final optical check of test booklets, questionnaire booklets and coding guides ...............................................................................93
•Verification of operational manuals .................................................................................................................................................................................95
•Verification of Digital Reading Assessment (DRA) units ....................................................................................................................................95
•Quantitative analyses of verification outcomes .......................................................................................................................................................96
Summary of items deleted at the national level, due to translation, printing or layout errors.............................................96
CHAPTER 6 FIeLd oPeratIonS ...............................................................................................................................................................................................97
Overview of roles and responsibilities ...............................................................................................................................................................................98
•National Project Managers .....................................................................................................................................................................................................98
•School Co-ordinators .................................................................................................................................................................................................................98
•Test Administrators .......................................................................................................................................................................................................................99
•School Associates .........................................................................................................................................................................................................................99
The selection of the school sample.......................................................................................................................................................................................99
Preparation of test booklets, questionnaires and manuals ............................................................................................................................100
Selection of the student sample ...........................................................................................................................................................................................101
Packaging and shipping materials .......................................................................................................................................................................................101
Receipt of materials at the national centre after testing ....................................................................................................................................102
Coding of the tests and questionnaires ..........................................................................................................................................................................102
•Preparing for coding ................................................................................................................................................................................................................102
•Logistics prior to coding ........................................................................................................................................................................................................104
•Single coding design ...............................................................................................................................................................................................................106
•Multiple coding ..........................................................................................................................................................................................................................109
•Managing the coding process ...........................................................................................................................................................................................111
•Cross-national coding .............................................................................................................................................................................................................112
•Questionnaire coding .............................................................................................................................................................................................................112
Data entry, data checking and file submission .........................................................................................................................................................113
•Data entry .......................................................................................................................................................................................................................................113
•Data checking ..............................................................................................................................................................................................................................113
•Data submission .........................................................................................................................................................................................................................113
•After data were submitted ....................................................................................................................................................................................................113
The main survey review ...............................................................................................................................................................................................................113
CHAPTER 7 QuaLIty aSSuranCe ......................................................................................................................................................................................115
PISA quality control ........................................................................................................................................................................................................................116
•Comprehensive operational manuals ..........................................................................................................................................................................116
•National level implementation planning document ..........................................................................................................................................116
PISA quality monitoring ..............................................................................................................................................................................................................116
•Field trial and main survey review .................................................................................................................................................................................116
•Final optical check ....................................................................................................................................................................................................................117
•National Centre Quality Monitor (NCQM) visits .................................................................................................................................................117
•PISA Quality Monitor (PQM) visits ................................................................................................................................................................................118
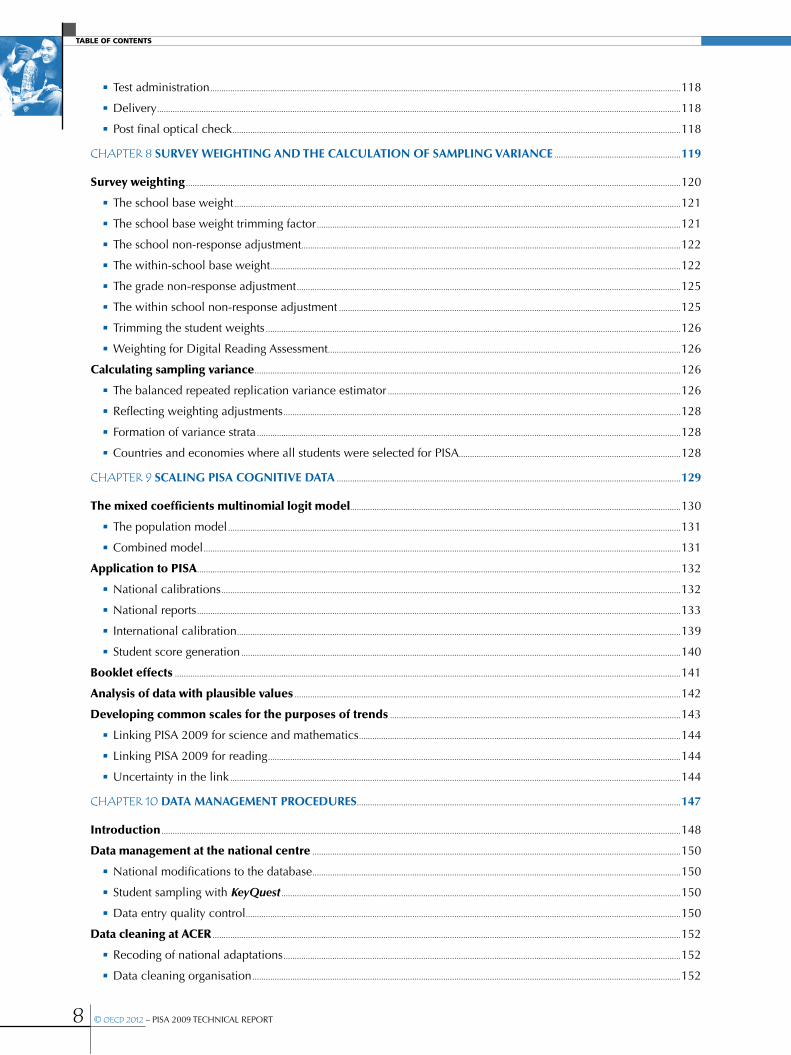
table of contents
8 © OECD 2012 – PISA 2009 TECHNICAL REPORT
•Test administration ....................................................................................................................................................................................................................118
•Delivery ............................................................................................................................................................................................................................................118
•Post final optical check ..........................................................................................................................................................................................................118
CHAPTER 8 Survey weIghtIng and the CaLCuLatIon oF SamPLIng varIanCe .........................................................119
Survey weighting ...............................................................................................................................................................................................................................120
•The school base weight .........................................................................................................................................................................................................121
•The school base weight trimming factor ....................................................................................................................................................................121
•The school non-response adjustment...........................................................................................................................................................................122
•The within-school base weight .........................................................................................................................................................................................122
•The grade non-response adjustment .............................................................................................................................................................................125
•The within school non-response adjustment ..........................................................................................................................................................125
•Trimming the student weights ...........................................................................................................................................................................................126
•Weighting for Digital Reading Assessment ...............................................................................................................................................................126
Calculating sampling variance ................................................................................................................................................................................................126
•The balanced repeated replication variance estimator ....................................................................................................................................126
•Reflecting weighting adjustments ...................................................................................................................................................................................128
•Formation of variance strata ...............................................................................................................................................................................................128
•Countries and economies where all students were selected for PISA....................................................................................................128
CHAPTER 9 SCaLIng PISa CognItIve data ...........................................................................................................................................................129
The mixed coefficients multinomial logit model.....................................................................................................................................................130
•The population model ............................................................................................................................................................................................................131
•Combined model .......................................................................................................................................................................................................................131
Application to PISA ..........................................................................................................................................................................................................................132
•National calibrations ...............................................................................................................................................................................................................132
•National reports ..........................................................................................................................................................................................................................133
•International calibration ........................................................................................................................................................................................................139
•Student score generation ......................................................................................................................................................................................................140
Booklet effects ....................................................................................................................................................................................................................................141
Analysis of data with plausible values ..............................................................................................................................................................................142
Developing common scales for the purposes of trends ...................................................................................................................................143
•Linking PISA 2009 for science and mathematics .................................................................................................................................................144
•Linking PISA 2009 for reading ..........................................................................................................................................................................................144
•Uncertainty in the link ...........................................................................................................................................................................................................144
CHAPTER 10 data management ProCedureS ..................................................................................................................................................147
Introduction ..........................................................................................................................................................................................................................................148
Data management at the national centre ......................................................................................................................................................................150
•National modifications to the database ......................................................................................................................................................................150
•Student sampling with KeyQuest ....................................................................................................................................................................................150
•Data entry quality control ....................................................................................................................................................................................................150
Data cleaning at ACER ...................................................................................................................................................................................................................152
•Recoding of national adaptations ...................................................................................................................................................................................152
•Data cleaning organisation .................................................................................................................................................................................................152

table of contents
PISA 2009 TECHNICAL REPORT – © OECD 2012 9
•DRA data .......................................................................................................................................................................................................................................152
•Cleaning reports .........................................................................................................................................................................................................................153
•General recodings .....................................................................................................................................................................................................................153
Final review of the data ................................................................................................................................................................................................................153
•Review of the test and questionnaire data ................................................................................................................................................................153
•Review of the sampling data ..............................................................................................................................................................................................154
Next steps in preparing the international database ..............................................................................................................................................154
CHAPTER 11 SamPLIng outComeS .................................................................................................................................................................................155
Design effects and effective sample sizes .....................................................................................................................................................................168
•Variability of the design effect ..........................................................................................................................................................................................171
•Design effects in PISA for performance variables ................................................................................................................................................171
Summary analyses of the design effect ...........................................................................................................................................................................183
•Sampling for the Digital Reading Assessment (DRA) component .............................................................................................................185
CHAPTER 12 SCaLIng outComeS ....................................................................................................................................................................................187
International characteristics of the item pool ............................................................................................................................................................188
•Test targeting .................................................................................................................................................................................................................................189
•Test reliability and measurement error design effect .........................................................................................................................................194
•Domain inter-correlations ....................................................................................................................................................................................................194
•Reading scales .............................................................................................................................................................................................................................195
Scaling outcomes ..............................................................................................................................................................................................................................195
•National item deletions .........................................................................................................................................................................................................195
•International scaling ................................................................................................................................................................................................................197
•Generating student scale scores and reliability of the PISA scales ..........................................................................................................198
Test length analysis ..........................................................................................................................................................................................................................199
Booklet effects ....................................................................................................................................................................................................................................203
•Overview of the PISA cognitive reporting scales .................................................................................................................................................211
•PISA literacy scales ...................................................................................................................................................................................................................212
•PISA literacy subscales ...........................................................................................................................................................................................................212
•Special purpose scales ...........................................................................................................................................................................................................213
Observations concerning the construction of the PISA overall literacy scales ..............................................................................213
•Framework development ......................................................................................................................................................................................................214
•Testing time and item characteristics............................................................................................................................................................................215
Transforming the plausible values to PISA scales ...................................................................................................................................................229
•Mathematics ..................................................................................................................................................................................................................................229
•Reading ............................................................................................................................................................................................................................................229
•Science .............................................................................................................................................................................................................................................230
•DRA ....................................................................................................................................................................................................................................................230
Link error .................................................................................................................................................................................................................................................230
CHAPTER 13 CodIng reLIaBILIty StudIeS ..............................................................................................................................................................233
Consistency analyses .....................................................................................................................................................................................................................234
International coder review ........................................................................................................................................................................................................239
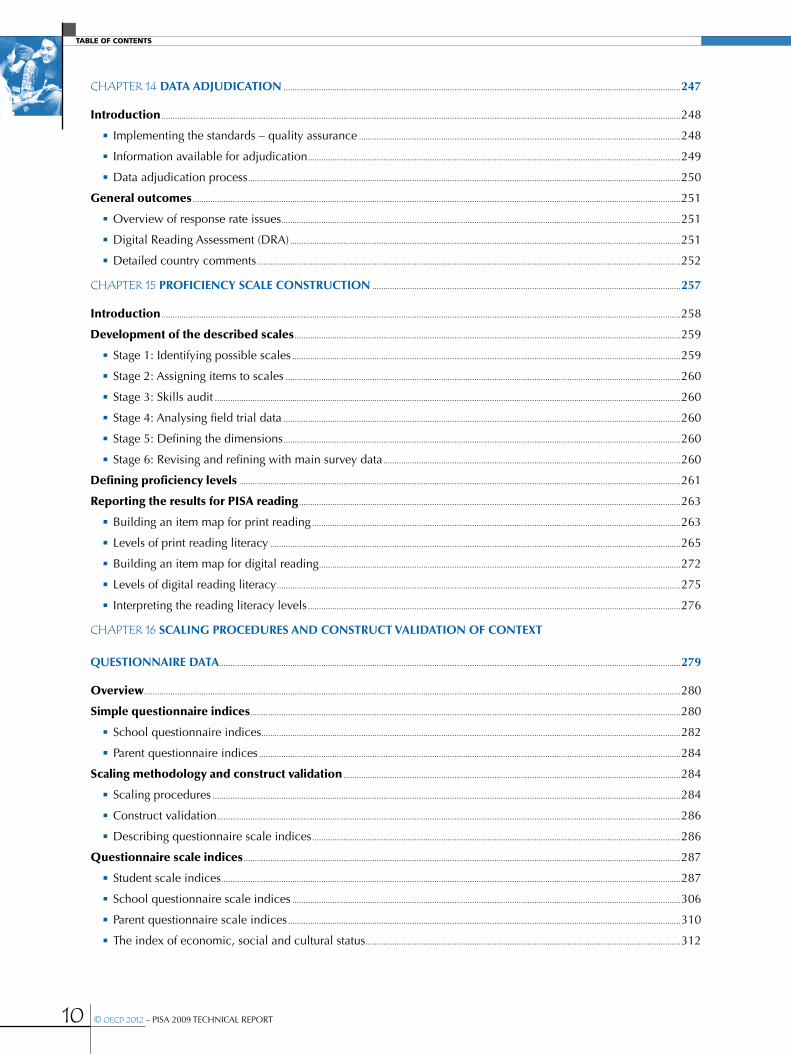
table of contents
10 © OECD 2012 – PISA 2009 TECHNICAL REPORT
CHAPTER 14 data adjudICatIon ...................................................................................................................................................................................247
Introduction ..........................................................................................................................................................................................................................................248
•Implementing the standards – quality assurance .................................................................................................................................................248
•Information available for adjudication ........................................................................................................................................................................249
•Data adjudication process ...................................................................................................................................................................................................250
General outcomes ............................................................................................................................................................................................................................251
•Overview of response rate issues ....................................................................................................................................................................................251
•Digital Reading Assessment (DRA) ................................................................................................................................................................................251
•Detailed country comments ...............................................................................................................................................................................................252
CHAPTER 15 ProFICIenCy SCaLe ConStruCtIon ...........................................................................................................................................257
Introduction ..........................................................................................................................................................................................................................................258
Development of the described scales ..............................................................................................................................................................................259
•Stage 1: Identifying possible scales ...............................................................................................................................................................................259
•Stage 2: Assigning items to scales ..................................................................................................................................................................................260
•Stage 3: Skills audit ..................................................................................................................................................................................................................260
•Stage 4: Analysing field trial data ...................................................................................................................................................................................260
•Stage 5: Defining the dimensions ...................................................................................................................................................................................260
•Stage 6: Revising and refining with main survey data ......................................................................................................................................260
Defining proficiency levels .......................................................................................................................................................................................................261
Reporting the results for PISA reading ............................................................................................................................................................................263
•Building an item map for print reading ......................................................................................................................................................................263
•Levels of print reading literacy .........................................................................................................................................................................................265
•Building an item map for digital reading ...................................................................................................................................................................272
•Levels of digital reading literacy ......................................................................................................................................................................................275
•Interpreting the reading literacy levels ........................................................................................................................................................................276
CHAPTER 16 SCaLIng ProCedureS and ConStruCt vaLIdatIon oF Context
QueStIonnaIre data................................................................................................................................................................................................................279
Overview..................................................................................................................................................................................................................................................280
Simple questionnaire indices ..................................................................................................................................................................................................280
•School questionnaire indices .............................................................................................................................................................................................282
•Parent questionnaire indices ..............................................................................................................................................................................................284
Scaling methodology and construct validation ........................................................................................................................................................284
•Scaling procedures ...................................................................................................................................................................................................................284
•Construct validation .................................................................................................................................................................................................................286
•Describing questionnaire scale indices ......................................................................................................................................................................286
Questionnaire scale indices .....................................................................................................................................................................................................287
•Student scale indices ...............................................................................................................................................................................................................287
•School questionnaire scale indices ...............................................................................................................................................................................306
•Parent questionnaire scale indices .................................................................................................................................................................................310
•The index of economic, social and cultural status ..............................................................................................................................................312

table of contents
PISA 2009 TECHNICAL REPORT – © OECD 2012 11
CHAPTER 17 dIgItaL readIng aSSeSSment ...........................................................................................................................................................317
Item authoring tool .........................................................................................................................................................................................................................318
Online item review ..........................................................................................................................................................................................................................318
Translation ..............................................................................................................................................................................................................................................318
School hardware requirements .............................................................................................................................................................................................319
•School computer resources survey ................................................................................................................................................................................319
•Technical problems in the Field Trial ...........................................................................................................................................................................320
•Hardware diagnostic ...............................................................................................................................................................................................................320
Test delivery system ........................................................................................................................................................................................................................320
Data capture and submission ..................................................................................................................................................................................................321
Scoring student responses ........................................................................................................................................................................................................321
Online Coding System ..................................................................................................................................................................................................................321
CHAPTER 18 InternatIonaL dataBaSe .....................................................................................................................................................................325
Files in the database........................................................................................................................................................................................................................326
•Student files ...................................................................................................................................................................................................................................326
•School file .......................................................................................................................................................................................................................................327
•Parent file ........................................................................................................................................................................................................................................328
Records in the database ..............................................................................................................................................................................................................328
•Records included in the database ..................................................................................................................................................................................328
•Records excluded from the database ...........................................................................................................................................................................329
Representing missing data ........................................................................................................................................................................................................329
How are students and schools identified? ....................................................................................................................................................................329
DRA database .......................................................................................................................................................................................................................................330
•Student files ...................................................................................................................................................................................................................................330
•School file .......................................................................................................................................................................................................................................330
Further information ........................................................................................................................................................................................................................330
reFerenCeS ...........................................................................................................................................................................................................................................333
annexeS ..............................................................................................................................................................................................................................................335
Annex A Main study item pool classification .........................................................................................................................................................336
Annex B Contrast coding used in conditioning .....................................................................................................................................................344
Annex C Design effect tables ............................................................................................................................................................................................353
Annex D Changes to core questionnaire items .....................................................................................................................................................359
Annex E Mapping of ISCED to years ...........................................................................................................................................................................364
Annex F National household possession items ....................................................................................................................................................365
Annex G PISA 2009 technical standards ...................................................................................................................................................................367
Annex H PISA Consortium, staff and consultants ................................................................................................................................................381
Annex I Selection of OECD PISA publications ...................................................................................................................................................384
Annex J OECD countries included in standardisation of major PISA scales ..................................................................................385

table of contents
12 © OECD 2012 – PISA 2009 TECHNICAL REPORT
BOXES
Box 1.1 Key features of PISA 2009 .........................................................................................................................................................................................25
Box 4.1 Illustration of probability proportional to size (PPS) sampling ..................................................................................................................67
FIGURES
Figure 2.1 Screen layout for the Digital Reading Assessment ..........................................................................................................................................29
Figure 3.1 Summary of the Questionnaire Framework for PISA 2009 .........................................................................................................................50
Figure 3.2 Themes and constructs/variables in PISA 2009 ...............................................................................................................................................51
Figure 4.1 School response rate standards ...............................................................................................................................................................................61
Figure 5.1 Sample Field Trial Test Adaptation Spreadsheet (TAS) for a new PISA 2009 reading unit .............................................................89
Figure 5.2 Sample Main Survey Test Adaptation Spreadsheet (TAS) for a new PISA 2009 reading unit .......................................................90
Figure 5.3 QAS section for an item that needs to be partially revised in the main survey .................................................................................92
Figure 5.4 QAS section for an item that is new in the main survey ..............................................................................................................................93
Figure 5.5 PISA 2009 main survey Booklet FOC report with drop-down menus ...................................................................................................94
Figure 6.1 PISA 2009 Main Survey Coding Design...........................................................................................................................................................105
Figure 6.2 Design for the single coding of reading stage 1 ............................................................................................................................................107
Figure 6.3 Design for the single coding of reading stage 2 ............................................................................................................................................107
Figure 6.4 Design for the single coding of mathematics, stage 1 ..............................................................................................................................108
Figure 6.5 Design for the single coding of mathematics, stage 2 ..............................................................................................................................109
Figure 6.6 Design for the single coding of science, stage 1 .........................................................................................................................................109
Figure 6.7 Design for the single coding of science, stage 2 ..........................................................................................................................................109
Figure 6.8 Design for the multiple coding of reading, stages 3 and 4 ......................................................................................................................110
Figure 6.9 Design for the multiple coding of mathematics, stages 3 and 4 ...........................................................................................................111
Figure 6.10 Design for the multiple coding of science, stages 3 and 4 ......................................................................................................................111
Figure 9.1 Main screen ..................................................................................................................................................................................................................133
Figure 9.2 Example of scatter plot ............................................................................................................................................................................................134
Figure 9.3 Example of item statistics in tabular form ........................................................................................................................................................135
Figure 9.4 Example of graphical summary by item report .............................................................................................................................................137
Figure 9.5 Example of an international list of dodgy items ............................................................................................................................................139
Figure 10.1 Data management in relation to other parts of PISA ................................................................................................................................148
Figure 10.2 Major data management stages in PISA...........................................................................................................................................................149
Figure 10.3 Validity reports – general hierarchy ...................................................................................................................................................................152
Figure 12.1 Item plot for mathematics items ..........................................................................................................................................................................190
Figure 12.2 Item plot for reading items ....................................................................................................................................................................................191
Figure 12.3 Item plot for science items ....................................................................................................................................................................................192
Figure 12.4 Item plot for DRA items ..........................................................................................................................................................................................193
Figure 12.5 Scatter plot of percentage correct for reading link items in PISA 2000 and PISA 2003 .............................................................217
Figure 12.6 Scatter plot of percentage correct for reading link items in PISA 2003 and PISA 2006 .............................................................218

table of contents
PISA 2009 TECHNICAL REPORT – © OECD 2012 13
Figure 12.7 Scatter plot of percentage correct for reading link items in PISA 2000 and PISA 2009 .............................................................219
Figure 12.8 Scatter plot of percentage correct for mathematics space and shape and change
and relationships link items in PISA 2000 and PISA 2003 .....................................................................................................................221
Figure 12.9 Scatter plot of percentage correct for mathematics link items in PISA 2003 and PISA 2006 .................................................223
Figure 12.10 Scatter plot of percentage correct for mathematics link items in PISA 2006 and PISA 2009 .................................................224
Figure 12.11 Scatter plot of percentage correct for science link items in PISA 2000 and PISA 2003 ............................................................226
Figure 12.12 Scatter plot of percentage correct for science link items in PISA 2003 and PISA 2006 ............................................................227
Figure 12.13 Scatter plot of percentage correct for science link items in PISA 2006 and PISA 2009 ............................................................229
Figure 14.1 Attained school response rates ...........................................................................................................................................................................251
Figure 15.1 The relationship between items and students on a proficiency scale ...............................................................................................259
Figure 15.2 What it means to be at a level ...........................................................................................................................................................................262
Figure 15.3 A map for selected print reading items ...........................................................................................................................................................264
Figure 15.4 Summary descriptions of the seven proficiency levels on the print reading scale ......................................................................267
Figure 15.5 Summary descriptions of the seven proficiency levels on the print reading aspect subscale access and retrieve ...................268
Figure 15.6 Summary descriptions of the seven proficiency levels on the print reading aspect subscale integrate and interpret .............269
Figure 15.7 Summary descriptions of the seven proficiency levels on the print reading aspect subscale reflect and evaluate ............270
Figure 15.8 Summary descriptions of the seven proficiency levels on the print reading text format subscale continuous texts .........271
Figure 15.9 Summary descriptions of the seven proficiency levels on the print reading text format subscale non-continuous texts ......272
Figure 15.10 A map for selected digital reading items ........................................................................................................................................................273
Figure 15.11 Summary descriptions of the four proficiency levels on the digital reading scale .......................................................................276
Figure 16.1 Summed category probabilities for fictitious item ......................................................................................................................................286
Figure 16.2 Fictitious example of item map ..........................................................................................................................................................................287
Figure 17.1 Editing an XLIFF file ................................................................................................................................................................................................318
Figure 17.2 DRA coding roles .....................................................................................................................................................................................................322
TABLES
Table 1.1 PISA 2009 participants .............................................................................................................................................. 23
Table 2.1 Cluster rotation design used to form standard test booklets for PISA 2009 .................................................................. 30
Table 2.2 Cluster rotation design used to form all test booklets for PISA 2009 ........................................................................... 30
Table 2.3 Digital reading assessment test design ....................................................................................................................... 31
Table 2.4 Test development timeline for PISA 2009 ................................................................................................................... 32
Table 2.5 Print reading field trial cognitive items ....................................................................................................................... 37
Table 2.6 Average ratings for DRA tasks from national centres .................................................................................................. 38
Table 2.7 Allocation of item clusters to test booklets for field trial ............................................................................................. 39
Table 2.8 Print reading main survey cognitive items .................................................................................................................. 41
Table 2.9 Print reading main survey items (item format by aspect) ............................................................................................ 41
Table 2.10 Print reading main survey items (item format by text format) ...................................................................................... 41
Table 2.11 Print reading main survey items (text type by aspect) ................................................................................................. 41
Table 2.12 Print reading main survey items in standard and easy tests (aspect %)........................................................................ 42

table of contents
14 © OECD 2012 – PISA 2009 TECHNICAL REPORT
Table 2.13 Print reading main survey items in standard and easy tests (text format %) .................................................................42
Table 2.14 Print reading main survey items in standard and easy tests (text type %) ....................................................................42
Table 2.15 Print reading main survey items in standard and easy tests (situation %) ....................................................................42
Table 2.16 Digital reading main survey items (item format by aspect) .........................................................................................42
Table 2.17 Digital reading main survey items (environment by text format) .................................................................................43
Table 2.18 Digital reading main survey items (text type by aspect) ..............................................................................................43
Table 2.19 Mathematics main survey items (item format by competency cluster) ........................................................................43
Table 2.20 Mathematics main survey items (item format by content category) .............................................................................43
Table 2.21 Mathematics main survey items (content category by competency cluster) ................................................................43
Table 2.22 Science main study items (item format by competency) .............................................................................................44
Table 2.23 Science main study items (item format by knowledge type) .......................................................................................44
Table 2.24 Science main study items (knowledge category by competency) ................................................................................44
Table 4.1 Stratification variables used in PISA 2009 ..................................................................................................................64
Table 4.2 Schedule of school sampling activities .......................................................................................................................72
Table 4.3 Sampling frame unit ..................................................................................................................................................77
Table 5.1 Countries sharing a common version with national adaptations .................................................................................85
Table 5.2 PISA 2009 translation/adaptation procedures .............................................................................................................85
Table 8.1 Non-response classes ..............................................................................................................................................123
Table 11.1 Sampling and coverage rates ...................................................................................................................................158
Table 11.2 School response rates before replacement ...............................................................................................................163
Table 11.3 School response rates after replacement ..................................................................................................................165
Table 11.4 Student response rates after replacement .................................................................................................................166
Table 11.5 Standard errors for the PISA 2009 reading scale .......................................................................................................169
Table 11.6 Design effect 1 by country, by domain and cycle .....................................................................................................173
Table 11.7 Effective sample size 1 by country, by domain and cycle .........................................................................................174
Table 11.8 Design effect 2 by country, by domain and cycle .....................................................................................................175
Table 11.9 Effective sample size 2 by country, by domain and cycle .........................................................................................176
Table 11.10 Design effect 3 by country, by domain and cycle .....................................................................................................177
Table 11.11 Effective sample size 3 by country, by domain and cycle .........................................................................................178
Table 11.12 Design effect 4 by country, by domain and cycle .....................................................................................................179
Table 11.13 Effective sample size 4 by country, by domain and cycle .........................................................................................180
Table 11.14 Design effect 5 by country, by domain and cycle .....................................................................................................181
Table 11.15 Effective sample size 5 by country, by domain and cycle .........................................................................................182
Table 11.16 Median of the design effect 3 per cycle and per domain across the 35 countries that participated in every cycle .....183
Table 11.17 Median of the standard errors of the student performance mean estimate for each domain and PISA cycle
for the 35 countries that participated in every cycle .................................................................................................183
Table 11.18 Median of the number of participating schools for each domain and PISA cycle
for the 35 countries that participated in every cycle .................................................................................................184
Table 11.19 Median of the school variance estimate for each domain and PISA cycle for the 35 countries
that participated in every cycle ................................................................................................................................184

table of contents
PISA 2009 TECHNICAL REPORT – © OECD 2012 15
Table 11.20 Median of the intraclass correlation for each domain and PISA cycle for the 35 countries
that participated in every cycle ................................................................................................................................ 184
Table 11.21 Median of the within explicit strata intraclass correlation for each domain and PISA cycle for the 35 countries
that participated in every cycle ................................................................................................................................ 184
Table 11.22 Median of the percentages of school variances explained by explicit stratification variables, for each domain
and PISA cycle for the 35 countries that participated in every cycle ......................................................................... 185
Table 11.23 DRA student sampling outcomes ............................................................................................................................. 186
Table 11.24 DRA school sampling outcomes .............................................................................................................................. 186
Table 12.1 Number of sampled students by country and booklet .............................................................................................. 188
Table 12.2 Number of sampled students by country and DRA test form code............................................................................ 189
Table 12.3 Reliabilities and Measurement Error Design Effect of each of the three overall scales when scaled separately .......... 194
Table 12.4 Latent correlation between the three domains ......................................................................................................... 194
Table 12.5 Latent correlation between the four domains ........................................................................................................... 194
Table 12.6 Latent correlation between the aspect reading scales ............................................................................................... 195
Table 12.7 Latent correlation between text format reading scales .............................................................................................. 195
Table 12.8 Items deleted at the national level ........................................................................................................................... 196
Table 12.9 Final reliabilities of the PISA scales .......................................................................................................................... 198
Table 12.10 National reliabilities of the PISA scales .................................................................................................................... 198
Table 12.11 Average number of not-reached items and missing items by booklet ....................................................................... 200
Table 12.12 Average number of not-reached items and missing items by DRA TestID.................................................................. 200
Table 12.13 Average number of not-reached items and missing items by country ...................................................................... 201
Table 12.14 Average number of DRA not-reached items and missing items by country .............................................................. 202
Table 12.15 Distribution of not-reached items by booklet ........................................................................................................... 202
Table 12.16 Distribution of not-reached items by DRA TestID ..................................................................................................... 203
Table 12.17 Estimated booklet effects in logits ............................................................................................................................ 203
Table 12.18 Estimated booklet effects on the PISA scale .............................................................................................................. 204
Table 12.19 Variance in mathematics booklet means .................................................................................................................. 205
Table 12.20 Variance in reading booklet means .......................................................................................................................... 207
Table 12.21 Variance in science booklet means .......................................................................................................................... 209
Table 12.22 Variance in DRA booklet means .............................................................................................................................. 211
Table 12.23 Summary of PISA cognitive reporting scales ............................................................................................................. 212
Table 12.24 Linkage types among PISA domains 2000-09 .......................................................................................................... 213
Table 12.25 Number of unique item minutes for each domain for each PISA assessments ........................................................... 215
Table 12.26 Numbers of link items between successive PISA assessments* .................................................................................. 215
Table 12.27 International percent correct for reading link items in PISA 2000 and PISA 2003 ..................................................... 216
Table 12.28 International percent correct for reading link items in PISA 2003 and PISA 2006 ..................................................... 218
Table 12.29 International percent correct for reading link items in PISA 2000 and PISA 2009 ..................................................... 219
Table 12.30 International percent correct for mathematics link items in PISA 2000 and PISA 2003 ............................................. 220
Table 12.31 International percent correct for mathematics link items in PISA 2003 and PISA 2006 ............................................. 222
Table 12.32 International percent correct for mathematics link items in PISA 2006 and PISA 2009 ............................................. 223
Table 12.33 International percent correct for science link items in PISA 2000 and PISA 2003 ..................................................... 225
Table 12.34 International percent correct for science link items in PISA 2003 and PISA 2006 ..................................................... 227

table of contents
16 © OECD 2012 – PISA 2009 TECHNICAL REPORT
Table 12.35 International percent correct for science link items in PISA 2006 and PISA 2009 ..................................................... 228
Table 12.36 Link error estimates ................................................................................................................................................. 230
Table 13.1 Examples of various indices calculated on country-by-language level ...................................................................... 235
Table 13.2 International item reliability indices (Ti) ................................................................................................................... 236
Table 13.3 National domain reliability indices .......................................................................................................................... 238
Table 13.4 Examples of an initially lenient result and a neutral result ........................................................................................ 239
Table 13.5 Examples of flagged cases ........................................................................................................................................ 239
Table 13.6 Percentage of flagged records for Booklet 8 ICR items ............................................................................................. 240
Table 13.7 Percentage of flagged records for Booklet 12 ICR items ........................................................................................... 242
Table 13.8 Leniency/Harshness analysis .................................................................................................................................... 244
Table 15.1 Reading literacy performance band definitions on the PISA scale ............................................................................ 266
Table 15.2 Digital and print reading literacy performance band definitions on the PISA scale ................................................... 275
Table 16.1 ISCO major group white-collar/blue-collar classification ......................................................................................... 282
Table 16.2 OECD means and standard deviations of WLEs ....................................................................................................... 285
Table 16.3 Household possessions and home background indices ............................................................................................ 288
Table 16.4 Scale reliabilities for home possession indices in OECD countries ........................................................................... 289
Table 16.5 Scale reliabilities for home possession indices in partner countries .......................................................................... 290
Table 16.6 Item parameters for enjoyment of reading (JOYREAD) .............................................................................................. 290
Table 16.7 Item parameters for reading diversity (DIVREAD) ..................................................................................................... 291
Table 16.8 Scale reliabilities for enjoyment of reading and diversity of reading and latent correlations in OECD countries ........... 291
Table 16.9 Scale reliabilities for enjoyment of reading and diversity of reading and latent correlations in partner countries ...........292
Table 16.10 Item parameters for online reading (ONLNREAD) .................................................................................................... 292
Table 16.11 Scale reliabilities for online reading ......................................................................................................................... 293
Table 16.12 Item parameters for memorisation strategies (MEMOR) ............................................................................................ 293
Table 16.13 Item parameters for elaboration strategies (ELAB) ..................................................................................................... 293
Table 16.14 Item parameters for control strategies (CSTRAT) ....................................................................................................... 293
Table 16.15 Scale reliabilities for learning strategies in OECD countries ..................................................................................... 294
Table 16.16 Scale reliabilities for learning strategies in partner countries .................................................................................... 294
Table 16.17 Item parameters for attitude towards school (ATSCHL) ............................................................................................. 295
Table 16.18 Scale reliabilities for attitude towards school ........................................................................................................... 295
Table 16.19 Item parameters for teacher student relations (STUDREL) ......................................................................................... 296
Table 16.20 Item parameters for disciplinary climate (DISCLIMA) ............................................................................................... 296
Table 16.21 Scale reliabilities for disciplinary climate and teacher student relations and latent correlations in OECD countries .......296
Table 16.22 Scale reliabilities for disciplinary climate and teacher student relations and latent correlations in partner countries ..... 297
Table 16.23 Item parameters for teachers’ stimulation of reading engagement (STIMREAD) ........................................................ 297
Table 16.24 Item parameters for teachers’ use of structuring and scaffolding strategies (STRSTRAT)............................................. 298
Table 16.25 Scale reliabilities for teachers’ stimulation of reading and teaching strategies and latent correlations in OECD countries ....... 298
Table 16.26 Scale reliabilities for teachers’ stimulation of reading and teaching strategies and latent correlations in partner countries ...... 299
Table 16.27 Item parameters for library use (LIBUSE) .................................................................................................................. 299
Table 16.28 Scale reliabilities for LIBUSE .................................................................................................................................... 300

table of contents
PISA 2009 TECHNICAL REPORT – © OECD 2012 17
Table 16.29 Item parameters for ICT availability at home (ICTHOME) ......................................................................................... 300
Table 16.30 Item parameters for ICT availability at school (ICTSCH) ........................................................................................... 301
Table 16.31 Scale reliabilities for ICT availability at home and ICT availability at school in OECD countries .............................. 301
Table 16.32 Scale reliabilities for ICT availability at home and ICT availability at school in partner countries ............................. 301
Table 16.33 Item parameters for ICT entertainment use (ENTUSE) ............................................................................................... 302
Table 16.34 Scale reliabilities for ICT entertainment use ............................................................................................................. 302
Table 16.35 Item parameters for ICT use at home for school related tasks (HOMSCH) ................................................................ 302
Table 16.36 Item parameters for use of ICT at school (USESCH) .................................................................................................. 303
Table 16.37 Scale reliabilities for ICT use at home for school related tasks and for use of ICT at school in OECD countries ........ 303
Table 16.38 Scale reliabilities for ICT use at home for school related tasks and for use of ICT at school in partner countries ....... 304
Table 16.39 Item parameters for ICT self-confidence in high-level ICT tasks (HIGHCONF) ......................................................... 304
Table 16.40 Scale reliabilities for confidence in high level ICT tasks ........................................................................................... 305
Table 16.41 Item parameters for attitude towards computers (ATTCOMP) ................................................................................... 305
Table 16.42 Scale reliabilities for attitude towards computers ..................................................................................................... 306
Table 16.43 Item parameters for teacher shortage (TCSHORT) .................................................................................................... 306
Table 16.44 Item parameters for quality of educational resources (SCMATEDU) ......................................................................... 306
Table 16.45 Item parameters for teacher participation (EXCURACT) ............................................................................................ 307
Table 16.46 Item parameters for school principal leadership (LDRSHP) ...................................................................................... 307
Table 16.47 Item parameters for teacher participation (TCHPARTI) ............................................................................................. 308
Table 16.48 Item parameters for teacher-related factors affecting school climate (TEACBEHA) .................................................... 308
Table 16.49 Item parameters for student-related aspects of school climate (STUDBEHA) ............................................................ 308
Table 16.50 Scale reliabilities for school-level scales in OECD countries .................................................................................... 309
Table 16.51 Scale reliabilities for school-level scales in partner countries ................................................................................... 309
Table 16.52 Item parameters for parents’ perception of school quality (PQSCHOOL) ................................................................. 310
Table 16.53 Item parameters for parental involvement (PARINVOL) ............................................................................................ 310
Table 16.54 Item parameters for students’ reading resources at home (READRES) ....................................................................... 310
Table 16.55 Item parameters for parents’ current support of child’s reading literacy (CURSUPP) ................................................. 311
Table 16.56 Item parameters for parental support of child’s reading literacy at beginning of ISCED 1 (PRESUPP) ........................ 311
Table 16.57 Item parameters for motivational attributes of parents’ own reading engagement (MOTREAD) ................................. 311
Table 16.58 Scale reliabilities for parent questionnaire scales ..................................................................................................... 312
Table 16.59 Factor loadings and internal consistency of ESCS 2009 in OECD countries .............................................................. 313
Table 16.60 Factor loadings and internal consistency of ESCS 2009 in partner countries ............................................................. 314
Table 16.61 ESCS component weights in 2000, 2003, 2006 and 2009 ........................................................................................ 315
Table A.1 2009 Main study mathematics item classification .................................................................................................... 336
Table A.2 2009 Main study reading item classification ............................................................................................................ 337
Table A.3 2009 Main study science item classification ............................................................................................................ 341
Table A.4 2009 Main study DRA item classification ................................................................................................................ 343
Table B.1 2009 Main study contrast coding used in conditioning for the student questionnaire variables ................................ 344
Table B.2 2009 Main study contrast coding used in conditioning for the reading for school questionnaire variables ............... 348
Table B.3 2009 Main study contrast coding used in conditioning for the ICT questionnaire variables ...................................... 349
Table B.4 2009 Main study contrast coding used in conditioning for the educational career questionnaire variables .............. 350
table of contents
18 © OECD 2012 – PISA 2009 TECHNICAL REPORT
Table B.5 2009 Main study contrast coding used in conditioning for the parent questionnaire variables ................................. 351
Table B.6 2009 Main study contrast coding used in conditioning for other variables ............................................................... 352
Table C.1 Standard errors of the student performance mean estimate by country, by domain and cycle ................................... 353
Table C.2 Sample sizes by country and cycle .......................................................................................................................... 354
Table C.3 School variance estimate by country, by domain and cycle ...................................................................................... 355
Table C.4 Intraclass correlation by country, by domain and cycle ............................................................................................ 356
Table C.5 Within explicit strata intraclass correlation by country, by domain and cycle ........................................................... 357
Table C.6 Percentage of school variance explained by explicit stratification variables by country, by domain and cycle .......... 358
Table D.1 ST 09 to 06 Link ...................................................................................................................................................... 359
Table D.2 IC06 to 03 Link ........................................................................................................................................................ 360
Table D.3 SC06 to 03 Link ....................................................................................................................................................... 361
Table E.1 Mapping of ISCED to years ...................................................................................................................................... 364
Table F.1 National household possession items ...................................................................................................................... 365
Table J.1 OECD countries included in standardisation of major PISA scales ........................................................................... 385

PISA 2009 TECHNICAL REPORT – © OECD 2012 19
Reader’s Guide
ACER: Australian Council for Educational Research
aSPe: University of Liege, Belgium
BAS: Booklet Adaptation Spreadsheet
BRR: Balanced Repeated Replication
CBAS: Computer Based Assessment of Science
CITO: National Institute for Educational Measurement, the Netherlands
DIF: Differential Item Functioning
DIPF: The German Institute for International Educational Research
DRA: Digital Reading Assessment
DTCS: DRA Target Cluster Size
EAW: DRA Adaptation Workbook
ENR: Enrolment of 15-year-olds
ESCS: PISA Index of Educational, Social and Cultural Status
ETS: Educational Testing Service
FOC: Final Optical Check
I: Sampling Interval
IALS: International Adult Literacy Survey
ICR: Inter-Country Coder Reliability Study
ICT: Information Communication Technology
IEA: International Association for the Evaluation of Educational Achievement
ILS: University of Oslo, Norway
INES: OECD Indicators of Education Systems
INT: International
IPN: Leibniz Institute for Science and Mathematics Education, Germany
IRT: Item Response Theory
ISCED: International Standard Classification of Education
ISCO: International Standard Classification of Occupations
ISEI: International Socio-Economic Index
MAS: Manuals Adaptation Spreadsheets
MENR: Enrolment for moderately small school
MNSQ: Mean square
MOS: Measure of size
NCQM: National Centre Quality Monitor
NEP: National Enrolled Population
NIER: National Institute for Educational Research, Japan
NPM: National Project Manager
OECD: Organisation for Economic Co-operation and Development
OLT: Open Language Tool
PCA: Principal Component Analysis
PISA: Programme for International Student Assessment
PPS: Probability Proportional to Size
PGB: PISA Governing Board
PQM: PISA Quality Monitor
PV: Plausible Values
QAS: Questionnaire Adaptations Spreadsheet
RN: Random Number
RP: Response Probability
SC: School Co-ordinator
SE: Standard Error
SEN: Special Education Needs
SD: Standard Deviation
SPT: Study Programme Table
TA: Test Administrator
TAG: Technical Advisory Group
TAS: Test Adaptation Spreadsheet
TCS: Target Cluster Size
TIMSS: Third International Mathematics and Science Study
TMS: Translation Management System
UH: Une Heure booklet
VENR: Enrolment for very small schools
WLE: Weighted Likelihood Estimates
List of abbreviations – the following abbreviations are used in this report:


1
PISA 2009 TECHNICAL REPORT – © OECD 2012 21
Programmefor International
Student Assessment:an Overview
Participation ..................................................................................................................................................................... 23
Features of PISA ............................................................................................................................................................ 24
Managing and implementing PISA ................................................................................................................ 24
Organisation of this report .................................................................................................................................. 26
1Programme for InternatIonal Student aSSeSSment: an overvIew
22 © OECD 2012 – PISA 2009 TECHNICAL REPORT
The OECD Programme for International Student Assessment (PISA) is a collaborative effort among OECD member countries to measure how well 15-year-old students approaching the end of compulsory schooling are prepared to meet the challenges of today’s knowledge societies. The assessment is forward-looking: rather than focusing on the extent to which these students have mastered a specific school curriculum, it looks at their ability to use their knowledge and skills to meet real-life challenges. This orientation reflects a change in curricular goals and objectives, which are increasingly concerned with what students can do with what they learn at school.
PISA surveys take place every three years. The first survey took place in 2000 (followed by a further 11 countries in 2002), the second in 2003, the third in 2006, and the fourth in 2009; the results of these surveys have been published in a series of reports (OECD, 2001, 2003, 2004, 2007, 2010 - see Annex I) and a wide range of thematic and technical reports. The next survey will occur in 2012. For each assessment, one of science, reading and mathematics is chosen as the major domain and given greater emphasis. The remaining two areas, the minor domains, are assessed less thoroughly. In 2000 the major domain was reading; in 2003 it was mathematics; in 2006 it was science and in 2009 it was reading.
PISA is an age-based survey, assessing 15-year-old students in school in grade 7 or higher. These students are approaching the end of compulsory schooling in most participating countries, and school enrolment at this level is close to universal in almost all OECD countries.
The PISA assessments take a literacy perspective, which focuses on the extent to which students can apply the knowledge and skills they have learned and practised at school when confronted with situations and challenges for which that knowledge may be relevant. That is, PISA assesses: the extent to which students can use their reading skills to understand and interpret the various kinds of written material that they are likely to meet as they negotiate their daily lives; the extent to which students can use their mathematical knowledge and skills to solve various kinds of numerical and spatial challenges and problems; and the extent to which students can use their scientific knowledge and skills to understand, interpret and resolve various kinds of scientific situations and challenges. The PISA 2009 domain definitions are fully articulated in PISA 2009 Assessment Framework – Key Competencies in Reading, Mathematics and Science (OECD, 2010a).
PISA also allows for the assessment of additional cross-curricular competencies from time to time as participating countries see fit. For example, in PISA 2003, an assessment of general problem-solving competencies was included. A major addition for PISA 2009 was the inclusion of a computer-delivered assessment of digital reading which is also known as the digital reading assessment.
PISA also uses student questionnaires to collect information from students on various aspects of their home, family and school background, and school questionnaires to collect information from schools about various aspects of organisation and educational provision in schools. In PISA 2009, 14 countries1 also administered a parent questionnaire to the parents of the students participating in PISA.
Using the data from student, parent and school questionnaires, analyses linking contextual information with student achievement could address:
•differences between countries in the relationships between student-level factors (such as gender and socio-economic background) and achievement;
•differences in the relationships between school-level factors and achievement across countries;
•differences in the proportion of variation in achievement between (rather than within) schools, and differences in this value across countries;
•differences between countries in the extent to which schools moderate or increase the effects of individual-level student factors and student achievement;
•differences in education systems and national context that are related to differences in student achievement across countries; and
•through links to PISA 2000, PISA 2003 and PISA 2006, changes in any or all of these relationships over time.
Through the collection of such information at the student and school level on a cross-nationally comparable basis, PISA adds significantly to the knowledge base that was previously available from national official statistics, such as aggregate national statistics on the educational programmes completed and the qualifications obtained by individuals. The framework for the PISA 2009 questionnaires is included in PISA 2009 Assessment Framework – Key Competencies in Reading, Mathematics and Science (OECD, 2010a).

1Programme for InternatIonal Student aSSeSSment: an overvIew
PISA 2009 TECHNICAL REPORT – © OECD 2012 23
ParticiPationThe first PISA survey was conducted in 2000 in 32 countries (including 28 OECD member countries) using written tasks answered in schools under independently supervised test conditions. Another 11 countries completed the same assessment in 2002. PISA 2000 surveyed reading, mathematical and scientific literacy, with a primary focus on reading.
The second PISA survey, conducted in 2003 in 41 countries, assessed reading, mathematical and scientific literacy, and problem solving with a primary focus on mathematical literacy. The third survey covered reading, mathematical and scientific literacy, with a primary focus on scientific literacy, and was conducted in 2006 in 57 countries. For a number of participants detailed analysis was also undertaken for sub-national regions. In all there were 24 sub-national regions for which sufficient data was collected and quality control mechanisms implemented to permit OECD endorsement of their results.
PISA 2009, the fourth PISA survey covered reading, mathematical and scientific literacy, with a primary focus on reading literacy, and was conducted in 65 countries. The participants in PISA 2009 are listed in Table 1.1. As with PISA 2006, detailed results were also presented for 17 sub-national regions for which sufficient data was collected and quality control mechanisms implemented to permit OECD endorsement of their results. Table 1.1 also indicates the 19 countries that participated in the computer-delivered assessment of digital reading.
This report is concerned with the technical aspects of PISA 2009.
table 1.1 PiSa 2009 participants
oeCd countries Partner countries/economies
australia* albania
austria* argentina
Belgium* azerbaijan
Canada Brazil
Chile* Bulgaria
Czech republic Colombia*
denmark* Croatia
estonia dubai (uae)
Finland hong Kong-China*
France* Indonesia
germany jordan
greece Kazakhstan
hungary* Kyrgyzstan
Iceland* Latvia
Ireland* Liechtenstein
Israel Lithuania
Italy macao-China*
japan* montenegro
Korea* Panama
Luxembourg Peru
mexico Qatar
netherlands romania
new Zealand* russian Federation
norway* Serbia
Poland* Shanghai-China
Portugal Singapore
Slovak republic Chinese taipei
Slovenia thailand
Spain* trinidad and tobago
Sweden* tunisia
Switzerland uruguay
turkey
united Kingdom
united States
*These countries participated in the computer-delivered assessment of digital reading.

1Programme for InternatIonal Student aSSeSSment: an overvIew
24 © OECD 2012 – PISA 2009 TECHNICAL REPORT
FeatureS oF PiSa The technical characteristics of the PISA survey involve a number of different challenges:
•the design of the test and the features incorporated into the test developed for PISA are critical;
•the sampling design, including both the school sampling and the student sampling requirements and procedures;
•the multilingual nature of the test, which involves rules and procedures designed to guarantee the equivalence of the different language versions used within and between participating countries, and taking into account the diverse cultural contexts of those countries;
•various operational procedures, including test administration arrangements, data capture and processing and quality assurance mechanisms designed to ensure the generation of comparable data from all countries; and
•scaling and analysis of the data and their subsequent reporting: PISA employs scaling models based on item response theory (IRT) methodologies. The described proficiency scales, which are the basic tool in reporting PISA outcomes, are derived using IRT analysis.
This report describes the above-mentioned methodologies as they have been implemented in PISA 2009. It also describes the quality assurance procedures that have enabled PISA to provide high quality data to support policy formation and review. Box 1.1 provides an overview of the central design elements of PISA 2009.
The ambitious goals of PISA come at a cost: PISA is both resource intensive and methodologically complex, requiring intensive collaboration among many stakeholders. The successful implementation of PISA depends on the use, and sometimes further development, of state-of-the-art methodologies.
Quality within each of these areas is defined, monitored and assured through the use of a set of technical standards. These standards have been endorsed by the PISA Governing Board, and they form the backbone of implementation in each participating country and of quality assurance across the project (see Annex G for the PISA 2009 Technical Standards).
Managing and iMPleMenting PiSaThe design and implementation of PISA for the 2000, 2003 and 2006 data collections was the responsibility of an international consortium led by the Australian Council for Educational Research (ACER) with Ray Adams as International Project Director. The other partners in this Consortium were the National Institute for Educational Measurement (Cito) in the Netherlands, the Unité d’analyse des systèmes et pratiques d’enseignement (aSPe) and cApStAn Linguistic Quality Control in Belgium, the Deutches Institut für Internationale Pädagogische Forschung (DIPF) in Germany, Westat and the Educational Testing Service (ETS) in the United States, and the National Institute for Educational Policy Research (NIER) in Japan.
The responsibility for the implementation of PISA in 2009 was the shared responsibility of two consortia. One Consortium led by Cito was responsible for design, development and scaling of the contextual questionnaires – this Consortium included the University of Twente – Faculty of Behavioural Science in the Netherlands, the University of Jyväskylä – Institute for Educational Research in Finland and the Direction de l’Évaluation et de la Prospective, Ministère de l’Éducation Nationale in France. A second Consortium led by ACER was responsible for all remaining aspects of the 2009 data collection. Annex H lists the consortia staff and consultants who have made significant contributions to the development and implementation of the project.
PISA is implemented within a framework established by the PISA Governing Board (PGB) which includes representation from all participating countries at senior policy levels. The PGB established policy priorities and standards for developing indicators, for establishing assessment instruments, and for reporting results. Experts from participating countries served on working groups linking the programme policy objectives with the best internationally available technical expertise in the three assessment areas.
These expert groups were referred to as Subject Matter Expert Groups (SMEGs) (see Annex H for members). By participating in these expert groups and regularly reviewing outcomes of the groups’ meetings, countries ensured that the instruments were internationally valid, that they took the cultural and educational contexts of the different OECD member countries into account, that the assessment materials had strong measurement potential, and that the instruments emphasised authenticity and educational validity.

1Programme for InternatIonal Student aSSeSSment: an overvIew
PISA 2009 TECHNICAL REPORT – © OECD 2012 25
Box 1.1 Key features of PiSa 2009
Content•The main focus of PISA 2009 was reading. The survey also updated performance assessments in mathematics and
science. PISA considers students’ knowledge in these areas not in isolation, but in relation to their ability to reflect on their knowledge and experience, and to apply them to real-world issues. The emphasis is on mastering processes, understanding concepts and functioning in various situations within each assessment area.
•For the first time, the PISA 2009 survey also assessed 15-year-old students’ ability to read, understand and apply digital texts.
Methods•Around 470 000 students completed the assessment in 2009, representing about 26 million 15-year-olds in the schools
of the 65 participating countries and economies. Some 50 000 students took part in a second round of this assessment in 2010, representing about 2 million 15 year-olds from 9 additional partner countries and economies.
•Each participating student spent two hours carrying out pencil-and-paper tasks in reading, mathematics and science. In 19 countries, students were given additional questions via computer to assess their capacity to read digital texts.
•The assessment included tasks requiring students to construct their own answers as well as multiple-choice questions. The latter were typically organised in units based on a written passage or graphic, much like the kind of texts or figures that students might encounter in real life.
•Students also answered a questionnaire that took about 30 minutes to complete. This questionnaire focused on their personal background, their learning habits, their attitudes towards reading, and their engagement and motivation.
•School principals completed a questionnaire about their school that included demographic characteristics and an assessment of the quality of the learning environment at school.
OutcomesPISA 2009 results provide:
•A profile of knowledge and skills among 15-year-olds in 2009, consisting of a detailed profile for reading, including digital literacy, and an update for mathematics and science.
•Contextual indicators relating performance results to student and school characteristics.
•An assessment of students’ engagement in reading activities, and their knowledge and use of different learning strategies.
•A knowledge base for policy research and analysis.
•Trend data on changes in student knowledge and skills in reading, mathematics and science, on change in student attitudes and in socio-economic indicators, and also on the impact of some indicators on the performance results.
Future assessments•The PISA 2012 survey will return to mathematics as the major assessment area; PISA 2015 will focus on science.
Thereafter, PISA will turn to another cycle, beginning with reading again.
•Future tests will place greater emphasis on assessing students’ capacity to read and understand digital texts and solve problems given in a digital format, reflecting the importance of information and computer technologies in modern societies.
Each of the participating countries appointed a National Project Manager (NPM), to implement PISA nationally. The NPMs ensured that internationally agreed common technical and administrative procedures were employed. These managers played a vital role in developing and validating the international assessment instruments and ensured that PISA implementation was of high quality. The NPMs also contributed to the verification and evaluation of the survey results, analyses and reports.
The OECD Secretariat was responsible for the overall management of the programme. It monitored its implementation on a day-to-day basis, served as the secretariat for the PGB, fostered consensus building between the countries involved, and served as the interlocutor between the PGB and the international consortia.

1Programme for InternatIonal Student aSSeSSment: an overvIew
26 © OECD 2012 – PISA 2009 TECHNICAL REPORT
organiSation oF thiS rePortThis technical report is designed to describe the technical aspects of the project at a sufficient level of detail to enable review and, potentially, replication of the implemented procedures and technical solutions to problems. It, therefore, does not report the results of PISA 2009 which have been published in PISA 2009 Results (OECD, 2010b). A bibliography of other PISA related reports is included in Annex I.
There are five sections in this report:
•Section One – Instrument design: describes the design and development of both the questionnaires and achievement tests.
•Section Two – Operations: gives details of the operational procedures for the sampling and population definitions, test administration procedures, quality monitoring and assurance procedures for test administration and national centre operations, and instrument translation.
•Section Three – Data processing: covers the methods used in data cleaning and preparation, including the methods for weighting and variance estimation, scaling methods, methods for examining inter-rater variation and the data cleaning steps.
•Section Four – Quality indicators and outcomes: covers the results of the scaling and weighting, report response rates and related sampling outcomes and gives the outcomes of the inter-rater reliability studies. The last chapter in this section summarises the outcomes of the PISA 2009 data adjudication; that is, the overall analysis of data quality for each country.
•Section Five – Scale construction and data products: describes the construction of the PISA 2009 described levels of proficiency and the construction and validation of questionnaire-related indices. The final chapter briefly describes the contents of the PISA 2009 Database.
Detailed annexes of results pertaining to the chapters of the report are also provided.
Note
1. The PISA 2009 Parent Questionnaire was administered in eight OECD countries – Chile, Denmark, Germany, Hungary, Italy, Korea, New Zealand and Portugal, and in six partner countries and economies – Croatia, Hong Kong-China, Lithuania, Macao-China, Panama and Qatar.

2
PISA 2009 TECHNICAL REPORT – © OECD 2012 27
Test Designand Test Development
Test scope and format .............................................................................................................................................. 28
Test design ......................................................................................................................................................................... 29
Test development centres ..................................................................................................................................... 31
Development timeline ............................................................................................................................................. 31
The PISA 2009 reading literacy framework............................................................................................... 32
Item development process ................................................................................................................................... 33
Field trial .............................................................................................................................................................................. 37
Main study ......................................................................................................................................................................... 40

28 © OECD 2012 – PISA 2009 TECHNICAL REPORT
2TesT design and TesT developmenT
This chapter describes the test design for PISA 2009 and the processes by which the PISA Consortium, led by ACER, developed the PISA 2009 paper-and-pencil tests for reading, mathematics and science. It also describes the design and development of the computer-based assessment of reading, the digital reading assessment, an innovation in PISA 2009. In the following discussion, the term “reading” generally refers to the core, paper-based reading assessment. The computer-based assessment is referred to as the “digital reading assessment”.
teSt ScoPe and ForMat
Paper and pencil assessmentIn PISA 2009 three subject domains were tested, with reading as the major domain for the second time in a PISA administration and mathematics and science as minor domains.
PISA items are arranged in units based around a common stimulus. Many different types of stimulus are used including passages of text, tables, graphs and diagrams, often in combination. Each unit contains up to five items assessing students’ competencies and knowledge.
For the paper-and-pencil assessment there were 37 reading units, comprising a total of 1311 cognitive items, representing approximately 270 minutes of testing time for reading in PISA 2009. The mathematics assessment consisted of 342 items (18 units), a subset of the 48 items used in 2006, representing 90 minutes of testing time. The science assessment consisted of 53 items (18 units), also representing 90 minutes of testing time. The science items were selected from the 108 cognitive items used in 2006.
The 131 cognitive reading items used in the main survey included 26 items from the 2000 test that had been used for linking in 2003 and 2006. A further 11 items from PISA 2000, not used since that administration, were also included. The remaining 94 items were newly developed for PISA 2009. The 11 items retrieved from PISA 2000 and the 94 new items were selected, respectively, from a pool of 24 items retrieved from PISA 2000 and 188 newly-developed items that were tested in a field trial conducted in all countries in 2008, one year prior to the main survey. There was no new item development for mathematics or science.
Item formats employed with reading cognitive items were either selected response multiple choice or constructed response. Multiple-choice items were either standard multiple-choice with four (or in a small number of cases, five) responses from which students were required to select the best answer, or complex multiple-choice presenting several statements for each of which students were required to choose one of several possible responses (yes/no, true/false, correct/incorrect, etc.). Constructed response items were of three broad types. Closed-constructed response items required students to construct a numeric response within very limited constraints, or only required a word or short phrase as the answer. Short response items required a response generated by the student, with a limited range of possible full-credit answers. Open-constructed response items required more extensive writing and frequently required some explanation or justification.
Pencils, erasers, rulers, and in some cases calculators, were provided. It was recommended that calculators be provided in countries where they were routinely used in the classroom. National centres decided whether calculators should be provided for their students on the basis of standard national practice. No test items required a calculator, but some mathematics items involved solution steps for which the use of a calculator could be of assistance to some students.
Digital Reading Assessment (DRA)For PISA 2009, countries were offered an assessment of reading in a digital environment (DRA), as an international option.
As with the paper-and-pencil assessment of reading, digital reading items are arranged in units based around a common stimulus, but the stimulus used in the digital reading assessment comprises digital texts with the structures and features of websites, e-mails, blogs and so on. Each unit contains up to four items assessing students’ competencies and knowledge.
The digital reading assessment comprised nine units, with a total of 29 items, representing approximately 60 minutes of testing time. These items were selected from a pool of 72 newly-developed digital reading items that were tested in a field trial conducted in all countries participating in the international option in 2008, one year prior to the main survey.
In the digital reading assessment, the screen has two areas: a browser area, in which the stimulus is displayed, and a task area, in which the questions are provided. Figure 2.1 shows the screen layout.

PISA 2009 TECHNICAL REPORT – © OECD 2012 29
2TesT design and TesT developmenT
For most items, students provided their responses in the task area. Item formats employed were selected response or constructed response. Most of the selected-response items were in multiple-choice format of the standard type, in which students are required to select the best answer from a set of four options in the task area. A variation on multiple-choice, exploiting the interactive possibilities of the medium, involves students selecting an option from a dropdown menu in the browser area. Open-constructed response items require more extensive writing and frequently require some explanation or justification. Responses were given either in a text box in the task area, or, where appropriate, in the browser area in the form of an e-mail message.
teSt deSign
Paper-based assessmentThe standard main survey items were allocated to thirteen item clusters (seven reading clusters, three mathematics clusters and three science clusters) with each cluster representing 30 minutes of test time. The items were presented to students in thirteen standard test booklets, with each booklet being composed of four clusters. R1 to R7 denote the reading clusters, M1 to M3 denote the mathematics clusters, and S1 to S3 denote the science clusters. R1 and R2 were the same two reading clusters as those administered in 2003 and 2006. The mathematics clusters were three of the four intact clusters used in 2006 (M1 from 2006 was omitted). The three science clusters were not intact clusters from PISA 2006; items were selected from across the 2006 main survey pool to represent that pool as closely as possible in terms of competency and knowledge classifications, item format types, range of difficulty, layout and cluster position.
In addition to the thirteen two-hour booklets, a special one-hour booklet, referred to as the UH Booklet (Une Heure booklet), was prepared for use in schools catering for students with special needs. The UH Booklet contained about half as many items as the other booklets, with about 50% of the items being reading items, 25% mathematics and 25% science. The items were selected from the main survey items taking into account their suitability for students with special educational needs.
• Figure 2.1 •Screen layout for the digital reading assessment
Browser area
task area

30 © OECD 2012 – PISA 2009 TECHNICAL REPORT
2TesT design and TesT developmenT
table 2.1 cluster rotation design used to form standard test booklets for PiSa 2009
Booklet Id Cluster
1 M1 R1 R3A M32 R1 S1 R4A R73 S1 R3A M2 S34 R3A R4A S2 R25 R4A M2 R5 M16 R5 R6 R7 R3A7 R6 M3 S3 R4A8 R2 M1 S1 R69 M2 S2 R6 R110 S2 R5 M3 S111 M3 R7 R2 M212 R7 S3 M1 S213 S3 R2 R1 R5
uh readingmathematics
Science
The fully-linked design is a balanced incomplete block design. Each cluster appears in each of the four possible positions within a booklet once and so each test item appears in four of the test booklets. Another feature of the design is that each pair of clusters appears in one (and only one) booklet.
Each sampled student was randomly assigned one of the thirteen booklets administered in each country, which meant each student undertook two hours of testing. Students were allowed a short break after one hour.
In PISA 2009 some countries were offered the option of administering an easier set of booklets. The offer was made to countries that had achieved a mean scale score in reading of 450 or less in PISA 2006, and to new countries that were expected – judging by their results on the PISA 2009 field trial conducted in 2008 – to gain a mean result at a similar level. The purpose of this strategy was to obtain better descriptive information about what students at the lower end of the ability spectrum know, understand and can do as readers. A further reason for including easier items was to make the experience of the test more satisfying for individual students with very low levels of reading proficiency. For countries that selected the easier set of booklets two of the standard reading clusters (R3A and R4A) were substituted with two easier reading clusters (R3B and R4B). Apart from level of difficulty, the sets of items in the standard and easier clusters were matched, in terms of the distribution of text format, aspect and item format. The other eleven clusters (five clusters of reading items, three clusters of mathematics items and three clusters of science items) were administered in all countries.
Table 2.2 shows the full test design used in the 2009 main survey.
table 2.2 cluster rotation design used to form all test booklets for PiSa 2009
Booklet Id ClusterStandard
booklet seteasier
booklet set
1 M1 R1 R3A M3 Y2 R1 S1 R4A R7 Y3 S1 R3A M2 S3 Y4 R3A R4A S2 R2 Y5 R4A M2 R5 M1 Y6 R5 R6 R7 R3A Y7 R6 M3 S3 R4A Y8 R2 M1 S1 R6 Y Y9 M2 S2 R6 R1 Y Y
10 S2 R5 M3 S1 Y Y11 M3 R7 R2 M2 Y Y12 R7 S3 M1 S2 Y Y13 S3 R2 R1 R5 Y Y21 M1 R1 R3B M3 Y22 R1 S1 R4B R7 Y23 S1 R3B M2 S3 Y24 R3B R4B S2 R2 Y25 R4B M2 R5 M1 Y26 R5 R6 R7 R3B Y27 R6 M3 S3 R4B Y
uh readingmathematics
Science
The cluster rotation design for the standard main survey is shown in Table 2.1.

PISA 2009 TECHNICAL REPORT – © OECD 2012 31
2TesT design and TesT developmenT
Although only two of the clusters differed for standard and easier administration, the cluster rotation in the booklets (where each cluster appears four times) means that more than half of the booklets are affected by the alternatives. Countries administering the standard set of booklets implemented Booklets 1 to 13. Countries administering the easier set of booklets implemented Booklets 8 to 13 and Booklets 21 to 27.
Digital Reading Assessment The main survey items for the digital reading assessment were allocated to three item clusters with each cluster representing 20 minutes of test time. The items were presented to students in six test forms, with each form being composed of two clusters according to the rotation design shown in Table 2.3.
table 2.3 digital reading assessment test design
Cluster 1 Cluster 2
Test 1 A B
Test 2 B A
Test 3 B C
Test 4 C B
Test 5 C A
Test 6 A C
Each cluster is paired with each of the other clusters in two forms, once in the first position and once in the second position. Each sampled student was randomly assigned one of the six forms, which meant each student undertook 40 minutes of testing.
Each unit consisted of several items referring to a common stimulus, comprising multiple linked browser pages. Following the advice of the DRA Advisory Group, units and items within units were delivered in a fixed order, or lockstep fashion. This meant that students were not able to return to an item or unit once they had moved to the next item/unit. Each time a student clicked the ‘Next’ test navigation button, a dialog box displayed a warning that the student was about to move on to the next item and that it would not be possible to return to previous items. At this point students could either confirm that they wanted to move on or cancel the action and return to the item they had been viewing.
Lockstep delivery enabled test developers to specify the starting browser page for each item. This meant that all students began in the same place within the stimulus and, if they had previously navigated through a series of less relevant pages, did not have to spend time finding their way to an appropriate page to begin the item task.
teSt develoPMent centreSExperience gained in the three previous PISA assessments showed the importance of using the development expertise of a diverse range of test centres to help achieve conceptually rigorous material that has the highest possible levels of cross-cultural and cross-national diversity. Accordingly, to prepare new reading items for PISA 2009 the Consortium drew on the resources of five test development centres in culturally-diverse and well-known institutions, namely ACER (Australia), aSPe (University of Liege, Belgium), ILS (University of Oslo, Norway), DIPF (Germany) and NIER (Japan) (see Annex H).
In addition, for PISA 2009 the test development teams were encouraged to conduct initial development of items, including cognitive laboratory activities, in their local language. Translation to the OECD source languages (English and French; English only for the digital reading assessment) took place only after items had reached a well-formed state. The work of the test development teams was coordinated and monitored overall at ACER by the Consortium’s manager of test and framework development for reading.
develoPMent tiMelineThe PISA 2009 project started formally in August 2006, and concluded in December 2010. Planning for item development began in June 2006, with preparation of material for a two-day meeting of test developers from each test development centre, which was held in Frankfurt on 30-31 August, 2006. The meeting had the following purposes:
•to become familiar with the PISA 2000 reading literacy framework, especially its implications for test development;
•to discuss the requirements for item development, including item presentation and formats, use of templates and styles and cognitive laboratory procedures and timelines;

32 © OECD 2012 – PISA 2009 TECHNICAL REPORT
2TesT design and TesT developmenT
•to discuss factors that influence item difficulty, particularly in light of the intention to develop items at the extremes of the scale (a contractual requirement);
•to be briefed on detailed guidelines, based on experience from the first three PISA administrations, for avoiding potential translation and cultural problems when developing items; and
•to review sample items prepared for the meeting by each of the test development centres.
Test development began in earnest after the first PISA 2009 Reading Expert Group (REG) meeting which was held in Lyon on 5–7 October 2006. The main phase of test development finished when the items were distributed for the field trial in December 2007. During this 15-month period, intensive work was carried out writing and reviewing items, and on various cognitive laboratory activities. The field trial for most countries took place between March and August 2008, after which items were selected for the main survey and distributed to countries in December 2008.
Table 2.4 shows the major milestones and activities of the PISA 2009 test development timeline.
table 2.4 test development timeline for PiSa 2009
activity Period
Review of 2000 reading framework and development of 2009 reading framework October 2006 – February 2009
First phase item development in English (paper-based and computer-based) and French (paper-based) June 2006 – October 2007
Item development workshop for participating countries March 2007
Item submissions from countries February – June 2007
Distribution of field trial material November – December 2007
Translation into national languages November 2007 – April 2008
Field trial coder training February 2008
Field trial in participating countries March – September 2008
Selection of items for main survey August – October 2008Preparation of final source versions of all main survey materials, in English(paper-based and computer-based) and French (paper-based) October – December 2008
Distribution of main survey material November – December 2008
Main survey coder training February 2009
Main survey in participating countries March – September 2009
the PiSa 2009 reading literacy FraMeworKFor each PISA subject domain, an assessment framework is produced to guide the PISA assessments in accordance with the policy requirements of the OECD’s PISA Governing Board (PGB). The framework defines the domain, describes the scope of the assessment, specifies the structure of the test – including item format and the preferred distribution of items according to important framework variables – and outlines the possibilities for reporting results.
The PISA domain frameworks are conceived as evolving documents that will be adapted over time to integrate developments in theory and practice. Since a framework for PISA reading had been developed for the first PISA administration in 2000, the PISA 2009 work began with a review of the existing framework at the initial REG meeting in October 2006. It was agreed that much of the substance of the PISA 2000 framework should be retained for PISA 2009, but new elements were to be added or given additional emphasis: notably, the incorporation of digital reading, and the elaboration of engagement and metacognition in reading (subsequently called “reading strategies”). Re-drafting of the framework commenced in the ensuing months, guided by the REG under the leadership of its Chair, Irwin Kirsch.
The OECD invited national experts to a reading forum held in February 2007, to review the first draft of a revised and expanded reading framework for PISA 2009. A further draft was then produced, and considered by the PGB at its meeting in Oslo in March 2007. After the PGB meeting further revisions were made, culminating in the submission of a new draft to the PGB in July 2007. This version substantially remained unchanged and guided test development and selection for both print reading and DRA for the field trial and the main survey.
In early 2009 the framework was prepared for publication along with an extensive set of example items. All three PISA 2009 cognitive frameworks (as well as the questionnaire framework) were published in PISA 2009 Assessment Framework: Key Competencies in Reading, Mathematics and Science (OECD, 2010a). The mathematics and science frameworks were unchanged from 2006.
PISA 2009 TECHNICAL REPORT – © OECD 2012 33
2TesT design and TesT developmenT
iteM develoPMent ProceSSThe item development process commenced with preparations for the meeting of test developers held in Frankfurt in August 2006. This included the preparation of documentation to guide all parts of the process for the development of cognitive items. The process continued with the calling of submissions from participating countries, writing and reviewing items, carrying out pilot tests of items and conducting an extensive field trial, producing final source versions of all items in both English and French (for digital reading, in English only), preparing coding guides and coder training material, and selecting and preparing items for the main survey.
Since a similar process was followed for the development of print and digital reading items, it should be assumed that the following description applies to both, except where a variation is explicitly stated.
Cognitive item development was guided by a set of documents prepared iteratively over preceding administrations of PISA, augmented by discussion at the test development meeting. The orientation included an overview of the development process and timelines, a specification of item requirements, including the importance of framework fit, and a discussion of issues affecting item difficulty. These principles were expected to be followed by item developers at each of the five test development centres. They were later incorporated into the document Item Submission Guidelines for Reading – PISA 2009.3
A complete PISA unit consists of some stimulus material, one or more items (questions), and a guide to the coding of responses to each question. Each coding guide comprises a list of response categories (full, partial and no credit), each with its own scoring code, descriptions of the kinds of responses to be assigned each code, and sample responses for each response category.
First phase of developmentTypically, the following steps were taken in the first phase of the development of reading items originating at a test development centre. The steps are described in a linear fashion, but in reality they were often negotiated in a cyclical fashion, with items going through the various steps more than once.
Initial preparationSelection of stimulus is a key component of reading test development. In the case of print reading material, test developers in each of the five Consortium test development centres found potential stimulus and exchanged it with other centres (in English translation if necessary) to ascertain whether colleagues agreed that it was worth developing further. The stimulus was formatted even at this early stage in a manner similar to that planned for the final presentation. In the case of digital reading, three of the Consortium test development centres – ACER, aSPe and DIPF – developed digital stimulus: screen-shot mock-ups of stimulus pages were created, with accompanying descriptions of the navigation features envisaged for each page.
For those pieces of stimulus that were judged worth pursuing, test developers prepared units in both English and their native language in a standard format, including stimulus, several items (questions), and a proposed coding guide for each item. Items were then subjected to a series of cognitive laboratory activities: item panelling (also known as item shredding or cognitive walkthrough), cognitive interviews, and pilot or pre-trial testing (also known as cognitive comparison studies).
Local item panellingEach unit first underwent extensive scrutiny at a meeting of members of the originating test development team. This stage of the cognitive laboratory process typically involved item writers in a vigorous analysis of all aspects of the items from the point of view of a student, and from the point of view of a coder.
Items were revised, often extensively, following item panelling. When substantial revisions were required, items went back to the panelling stage for further consideration.
Cognitive interviewsMany units were then prepared for individual students or small groups of students to attempt. For print reading material a combination of think-aloud methods, individual interviews and group interviews was used with students to ascertain the thought processes typically employed as students attempted the items. For digital reading items, all cognitive interviews were conducted individually, using either audio-recording of responses and screen capture, or dual administration, with one researcher interacting with the student and another researcher observing and recording navigation behaviour.

34 © OECD 2012 – PISA 2009 TECHNICAL REPORT
2TesT design and TesT developmenT
Items were revised, often extensively, following their use with individuals and small groups of students. This stage was particularly useful in clarifying the wording of questions, and gave information on likely student responses that was used in refining the response coding guides.
Local pilot testingAs the final step in the first phase of print item development, sets of units were piloted with several classes of 15-year-olds. As well as providing statistical data on item functioning, including the relative difficulty of items, this enabled real student responses derived under formal test conditions to be obtained, thereby enabling more detailed development of coding guides.
Pilot test data were used to inform further revision of items where necessary or sometimes to discard items altogether. Units that survived relatively unscathed were then formally submitted to the test development manager to undergo their second phase of development.
Second phase of developmentThe second phase of item development began with the review of each unit by at least one test development team that was not responsible for its initial development. Each unit was then included in at least one of a series of pilot studies with a substantial number of students of the appropriate age.
International item panellingThe feedback provided following the scrutiny of items by international colleagues often resulted in further improvements to the items. Of particular importance was feedback relating to the operation of items in different cultures and national contexts, which sometimes led to items or even units being discarded. Surviving units were considered ready for further pilot testing and for circulation to national centres for review.
International pilot testingFor each pilot study, test booklets were formed from a number of units developed at different test development centres. These booklets were trial tested with several whole classes of students in several different schools. Field-testing of this kind mainly took place in schools in Australia because of translation and timeline constraints. Sometimes, multiple versions of items were trialled and the results were compared to ensure that the best alternative form was identified. Data from the pilot studies were analysed using standard item response techniques. For digital reading items, international pilot testing was not possible due to technical constraints at this stage of development. However some cognitive interviews with individual students were conducted in school settings.
Many items were revised, usually in a minor fashion, following review of the results of pilot testing. If extensive revision was considered necessary, the item was either discarded or the revised version was again subject to panelling and piloting. One of the most important outputs of this pilot testing was the generation of many student responses to each constructed-response item. A selection of these responses was added to the coding guide for the item to further illustrate each response category and provide more guidance for coders.
National item submissionsAn international comparative study should ideally draw items from as many participating countries as possible to ensure wide cultural and contextual diversity. A comprehensive set of guidelines, was developed to encourage and assist national submission of reading items. The document Item Submission Guidelines for Reading – PISA 2009 was distributed to PISA 2009 National Project Managers (NPMs) in February 2007.
The guidelines described the scope of the item development task for PISA 2009, the arrangements for national submissions of items and the item development timeline. In addition, the guidelines contained a detailed discussion of item requirements and an overview of the full item development process for PISA 2009.
To assist countries in submitting high quality and appropriate material, ACER conducted a one-day reading item development workshop for interested national centres at the end of the first NPM meeting for PISA 2009, in March 2007. It was attended by 30 individuals from 22 national centres.
The due date for national submission of items was 29 June 2007, as late as possible given field trial preparation deadlines. Items could be submitted in English, French, German, Spanish, Japanese or Italian. Countries were urged to submit items as they were developed, rather than waiting until close to the submission deadline. It was emphasised that before items

PISA 2009 TECHNICAL REPORT – © OECD 2012 35
2TesT design and TesT developmenT
were submitted they should have been subject to some cognitive laboratory activities involving students, and revised accordingly. An item submission form was provided with the guidelines and a copy had to be completed for each unit, indicating the source of the material, any copyright issues, and the framework classifications of each item.
For print reading, a total of 162 units were processed from 30 countries. Countries submitting units were: Argentina, Belgium, Brazil, Canada, Chile, Colombia, the Czech Republic, Denmark, Finland, France, Greece, Hungary, Ireland, Korea, Lithuania, Macao-China, Mexico, the Netherlands, New Zealand, Norway, Portugal, Qatar, Serbia, the Slovak Republic, Spain, Sweden, Switzerland, the United Kingdom, the United States and Uruguay. Most countries chose to submit their material in English, but submissions were also received in French, German and Spanish.
For the digital reading assessment, seven units were submitted by Canada. Five of these units were submitted in English and two in French. In addition, one unit submitted by Lithuania as a print reading unit was judged by the REG to be more suitable as a digital reading unit.
Some submitted units had already undergone significant development work, including pilot testing, prior to submission. Others were in a less developed state.
For print reading, all of the units submitted were reviewed by at least two of the test development centres, apart from a small number (about 10%) where ACER judged that the material too closely duplicated something that had already been developed for the 2009 pool, or was part of the trend or previously released material. Less than 30% of the units were deemed unsuitable for the PISA 2009 reading assessment in the review by two test development centres. Reasons for assessing units as unsuitable included inappropriate content (e.g. material that might be considered offensive in some countries), cultural bias and ephemerality.
The remaining units, in excess of 60% of those submitted, were considered suitable, though not all were able to be used. Various criteria were used to select those that were actually used, including overall quality of the unit, amount of revision required, and framework coverage. Consistent with the advice provided to countries, early submissions had a greater chance of selection than those received towards the end of the submission period. Nevertheless, high importance was placed on including units from as wide a range of countries as possible and, as a result, only six of the submitting countries “missed out”. Some quite good units were not included solely because their content overlapped too much with at least one existing unit.
Since only one national centre submitted material for DRA, the review process was informal, with the unit selected for development discussed in detail with the submitting country (Canada).
For print reading, units requiring further initial development were distributed among the test development centres. Typically, after local panelling and revision, they were fast-tracked into the second phase of item development as there was rarely time for cognitive interviews or pilot testing to be conducted locally. However, all these units underwent international pilot testing (as described above), along with the units that originated at test development centres.
A total of 31 print reading units and two digital reading units from national submissions were included in the bundles of items (four print reading, and four digital reading) circulated to national centres for review. Feedback was provided to countries on any submitted units that were not used. This practice, together with the provision of an item development workshop for national centre representatives early in a cycle, should contribute to improvements in the quality of national submissions in the future.
National review of itemsIn February 2007, NPMs were given a set of item review guidelines to assist them in reviewing cognitive items and providing feedback. At the same time, NPMs were given a schedule for the distribution and review of bundles of draft items during the remainder of 2007. A central feature of those reviews was the requirement for national experts to rate items according to various aspects of their relevance to 15-year-olds, including whether they related to material included in the country’s curriculum, their relevance in preparing students for life, how interesting they would appear to students and their authenticity as real applications of reading. NPMs were also asked to identify any cultural concerns or other problems with the items, such as likely translation or coding difficulties, and to give each item an overall rating for retention in the item pool.

36 © OECD 2012 – PISA 2009 TECHNICAL REPORT
2TesT design and TesT developmenT
As items were developed to a sufficiently complete stage, they were despatched to national centres for review. Four bundles of print reading items were distributed. The first bundle, including 8 units (52 items) was despatched on 14 February 2007. National centres were provided with an Excel® worksheet, already populated with unit names and item identification codes, in which to enter their ratings and other comments. Subsequent bundles were despatched on 16 April (17 units, 133 items), 16 July (18 units, 117 items) and 9 August (19 units, 124 items). In general, except for the last bundle, about four weeks was allowed for feedback.
For DRA, four bundles of items were distributed. The first bundle, including 5 units (35 items) was released on 30 April 2007. Subsequent bundles were despatched on 3 September (8 units, 58 items), 12 October (4 units, 35 items) and 19 October (4 units, 35 items). For digital reading, an online item review system was established, allowing countries to view the stimulus and items in digital format and to enter their ratings and comments on the material in a computer-based questionnaire format. The criteria for rating the material were similar in substance to those called for in the print reading review, with the addition of a question about the technological demands of the assessment items.
For each bundle, a series of reports was generated summarising the feedback from NPMs. The feedback frequently resulted in further revision of the items. In particular, cultural issues related to the potential operation of items in different national contexts were highlighted and sometimes, as a result of this, items had to be discarded. Summaries of the ratings assigned to each item by the NPMs were used extensively in the selection of items for the field trial.
International item reviewAs well as the formal, structured process for national review of items, cognitive items were also considered in detail, as they were developed, at meetings of the REG that took place in October 2006 and February, June and September 2007. The REG members were also invited to submit comments and ratings of the items as they were released in bundles.
Reading for School questionnaireIt was proposed to include a short questionnaire, Reading for School, at the end of the cognitive booklets. The focus of the questionnaire was to be on school-based reading, whether done in the classroom or for homework, with the purpose of collecting information about reading curriculum and pedagogy as experienced by 15-year-olds. The questions were developed from surveys administered in previous international studies (Grisay, 2008; Purves, 1973), which had investigated school-aged students’ opportunities to read different materials, and the ways in which reading was taught. For the PISA Reading for School questionnaire, items were designed to align with the PISA reading framework, so that links could potentially be made between reading practices at school and the proficiency of students in various parts of the PISA reading assessment. Consequently, questions were developed that asked about the kinds of texts (based on the text formats and text types defined in the framework) and the kinds of reading tasks (aligned with the aspects of reading) that 15-year-olds encountered in school-based reading.
The items underwent an extensive series of reviews by researchers and test developers, and were submitted to cognitive laboratory procedures (item panelling and cognitive interviews) in Australia, Finland, Japan, the Netherlands and Norway. Three sets of Reading for School items (Forms A, B and C), each designed to take about five minutes to complete, were assembled for the field trial.
Preparation of dual (English and French) source versionsBoth English and French source versions of all paper-based test instruments were developed and distributed to countries as a basis for local adaptation and translation into national versions. An item-tracking database, with web interface, was used by both test developers and Consortium translators to access items. This ensured accurate tracking of the English language versions and the parallel tracking of French translation versions.
Part of the translation process involved a technical review by French subject experts, who were able to identify issues with the English source version related to content and expression that needed to be addressed immediately, and that might be of significance later when items would be translated into other languages. Many revisions were made to items as a result of the translation and technical review process, affecting both the English and French source versions. This parallel development of the two source versions assisted in ensuring that items were as culturally neutral as possible, identified instances of wording that could be modified to simplify translation into other languages, and indicated where additional translation notes were needed to ensure the required accuracy in translating items to other languages.
For DRA, only an English source version was developed.

PISA 2009 TECHNICAL REPORT – © OECD 2012 37
2TesT design and TesT developmenT
Field trialThe PISA field trial was carried out in most countries in the first half of 2008. An average of over 200 student responses to each item was collected in each country. During the field trial, the Consortium set up a coder query service. Countries were encouraged to send queries to the service so that a common adjudication process was consistently applied to all coders’ questions about constructed-response items. Between July and November 2008, the test development centres, the REG and national centres reviewed the field trial data to recommend a selection of field trial items for the main survey.
Field trial selection
Print readingA total of 62 reading units (425 cognitive items) were circulated to national centres for review from February to August 2007. After consideration of country feedback, 53 units (348 cognitive items) were retained as the pool of units to be considered by the REG for inclusion in the field trial. Twenty-seven of these units (51% of the items) originated in national submissions.
The cognitive items to be used in the 2008 field trial were selected from the item pool at the meeting of the REG held in Dubrovnik in mid-September 2007. The selection process took two days to complete.
At the beginning of the process, REG members were provided with a report on the final pool of reading items available for selection for the field trial. The report included a summary of the item development process for PISA 2009 and detailed item reports, including the classification of all items according to their Framework characteristics, estimates of difficulty and average ratings given by NPMs.
For the purposes of item selection, the units were divided into three groups: non-continuous and mixed texts, continuous texts and easy units. For each of these three groups of units, REG members worked, first in small groups, then in plenary, to nominate a set of units for inclusion in the field trial. The discussion was based on the selection criteria outlined for the field trial items, as well as the report on the final pool of items. REG members were not aware of the origin of any of the material.
Having made the selection of units for inclusion in the field trial, the REG then selected individual items from within the chosen units. In order to inform the discussion on item choice, a report on factors influencing item difficulty was presented. The REG members then made their item selection in the same way as their unit selection, working first in groups, then in plenary to select items from non-continuous and mixed texts, then continuous texts and, finally, easy units.
The characteristics of the selected items, including framework classifications and estimated difficulties, were then examined. Minor adjustments were made to match framework requirements. This revised selection was approved by the REG (allowing for further minor adjustments to be made by test developers), and subject to NPM and PGB endorsement.
The REG recommended selection for print reading was presented to a meeting of NPMs in the week after the REG meeting. The NPMs endorsed the REG’s recommended selection.
Subsequently a small number of items had to be dropped because of space and layout constraints when the Consortium test developers assembled the units into clusters and booklets. The final field trial item pool for print reading included a total of 240 reading items, comprising 24 items retrieved from PISA 2000, 28 link items (items that had been administered in every cycle since 2000 to collect trend data) and 188 new items.
table 2.5 Print reading field trial cognitive items
New items 188
PISA 2000 retrieved items 24
Link items 28
total 240

38 © OECD 2012 – PISA 2009 TECHNICAL REPORT
2TesT design and TesT developmenT
Digital readingFor digital reading, from April to October four bundles of items were released for online review. While national centres were invited to review 21 units (163 items) during this phase, all items reviewed in the first bundle were revised and then re-released in subsequent bundles, so that only 16 units (128 individual items) in total were in the pool for field trial selection. The later development cycle of digital reading items meant that REG and NPM meetings in September 2007 did not have the full set of items available for selection. Consequently, REG and NPM feedback, via the online review system, was used by the Consortium to inform the selection of digital reading items for the field trial. Eighteen participants provided feedback and this was generally very favourable. Table 2.6 summarises quantitative responses on a scale from 1 (lowest) to 5 (highest) and gives comparative information for the print assessment items.
table 2.6 average ratings for dra tasks from national centres
relevance to school relevance to life beyond school Interest level Priority for inclusion
DRA tasks 3.95 4.25 3.93 3.95
After consideration of country feedback, 13 units, comprising a total of 72 tasks, were selected for inclusion in the field trial. In addition, a practice test comprising two units (10 tasks) and an effort thermometer task were produced.
The practice test was designed to familiarise students with the DRA interface. It described the layout of the screen, the methods of navigation that were possible, explained how to keep track of the time left for their testing session and how their progress throughout the test was displayed, and provided exercises on how to use the stimulus elements (such as links, tabs, drop-down menus) and respond to questions in the computer based environment (e.g. through text input or selection of radio-buttons).
The effort thermometer task was administered at the end of the digital reading assessment. The purpose of the task, which was modelled on the an effort thermometer instrument administered at the end of the paper-based cognitive booklets in PISA 2003 and PISA 2006, was to collect information about students’ motivation when completing the digital reading assessment. Students were asked to indicate the amount of effort they put into doing the digital reading assessment compared with a school test, and compared with the paper-based PISA assessment that they had recently completed. However, after examining the results it became clear that many students did not interpret “effort” in a motivational sense when comparing the digital and paper-based assessments (the digital reading assessment was much shorter and therefore required less effort). So the effort thermometer was not carried forward into the main survey of the digital reading assessment.
Field trial design
Paper-based assessmentThe field trial design for the paper-based assessment comprised 16 clusters of reading items (R1 to R16), 3 clusters of mathematics items (M1 to M3) and 3 clusters of science items (S1 to S3).
Clusters R1 and R2 were intact clusters that had been used in PISA 2003 and 2006, comprising 8 link units (28 items). The 35 new reading units and 6 units retrieved from PISA 2000 were allocated to 14 clusters, R3 to R16.
M1, M2 and M3 were 3 intact mathematics clusters from PISA 2006 comprising 35 items (18 units). S1, S2 and S3 were 3 science clusters comprising 53 items (18 units) selected from the 108 cognitive items used in 2006.
Nine regular two-hour booklets, each comprising four clusters, were administered in the field trial. Each cluster was designed to take up 30 minutes of testing time, thus making up booklets with two hours’ worth of testing time. New reading clusters appeared once in the first half of a booklet and once in the second half, in booklets 1 to 7, and were administered in all participating countries. The reading, mathematics and science link material appeared in booklets 8 and 9; these booklets were administered only in countries participating in PISA for the first time in 2009. All nine regular booklets included one of three sets of Reading for School items (Form A, B or C). This short questionnaire was administered immediately following the cognitive assessment and was designed to take about five minutes to complete.
In addition, the field trial design included a one-hour test booklet of two of the new reading clusters, R3 and R4, for special educational needs students. Items in these clusters were selected taking into account their suitability for students with special educational needs.
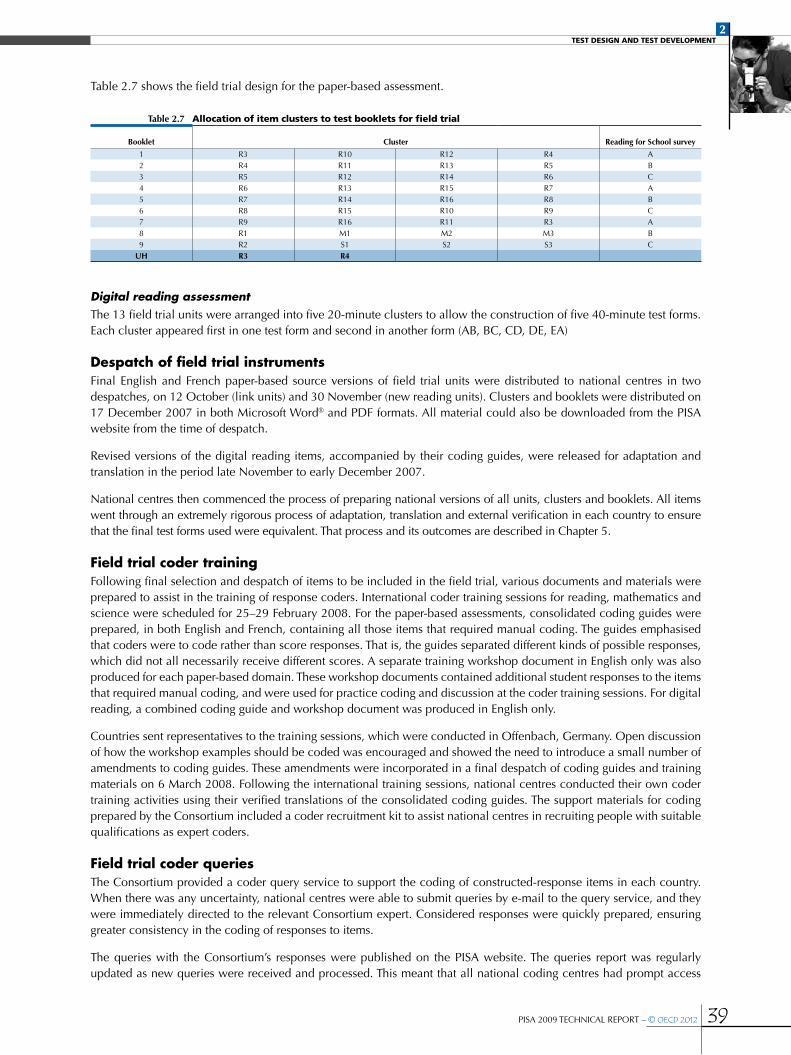
PISA 2009 TECHNICAL REPORT – © OECD 2012 39
2TesT design and TesT developmenT
Table 2.7 shows the field trial design for the paper-based assessment.
table 2.7 allocation of item clusters to test booklets for field trial
Booklet Cluster reading for School survey
1 R3 R10 R12 R4 A2 R4 R11 R13 R5 B3 R5 R12 R14 R6 C4 R6 R13 R15 R7 A5 R7 R14 R16 R8 B6 R8 R15 R10 R9 C7 R9 R16 R11 R3 A8 R1 M1 M2 M3 B9 R2 S1 S2 S3 C
uh r3 r4
Digital reading assessmentThe 13 field trial units were arranged into five 20-minute clusters to allow the construction of five 40-minute test forms. Each cluster appeared first in one test form and second in another form (AB, BC, CD, DE, EA)
Despatch of field trial instrumentsFinal English and French paper-based source versions of field trial units were distributed to national centres in two despatches, on 12 October (link units) and 30 November (new reading units). Clusters and booklets were distributed on 17 December 2007 in both Microsoft Word® and PDF formats. All material could also be downloaded from the PISA website from the time of despatch.
Revised versions of the digital reading items, accompanied by their coding guides, were released for adaptation and translation in the period late November to early December 2007.
National centres then commenced the process of preparing national versions of all units, clusters and booklets. All items went through an extremely rigorous process of adaptation, translation and external verification in each country to ensure that the final test forms used were equivalent. That process and its outcomes are described in Chapter 5.
Field trial coder trainingFollowing final selection and despatch of items to be included in the field trial, various documents and materials were prepared to assist in the training of response coders. International coder training sessions for reading, mathematics and science were scheduled for 25–29 February 2008. For the paper-based assessments, consolidated coding guides were prepared, in both English and French, containing all those items that required manual coding. The guides emphasised that coders were to code rather than score responses. That is, the guides separated different kinds of possible responses, which did not all necessarily receive different scores. A separate training workshop document in English only was also produced for each paper-based domain. These workshop documents contained additional student responses to the items that required manual coding, and were used for practice coding and discussion at the coder training sessions. For digital reading, a combined coding guide and workshop document was produced in English only.
Countries sent representatives to the training sessions, which were conducted in Offenbach, Germany. Open discussion of how the workshop examples should be coded was encouraged and showed the need to introduce a small number of amendments to coding guides. These amendments were incorporated in a final despatch of coding guides and training materials on 6 March 2008. Following the international training sessions, national centres conducted their own coder training activities using their verified translations of the consolidated coding guides. The support materials for coding prepared by the Consortium included a coder recruitment kit to assist national centres in recruiting people with suitable qualifications as expert coders.
Field trial coder queriesThe Consortium provided a coder query service to support the coding of constructed-response items in each country. When there was any uncertainty, national centres were able to submit queries by e-mail to the query service, and they were immediately directed to the relevant Consortium expert. Considered responses were quickly prepared, ensuring greater consistency in the coding of responses to items.
The queries with the Consortium’s responses were published on the PISA website. The queries report was regularly updated as new queries were received and processed. This meant that all national coding centres had prompt access
40 © OECD 2012 – PISA 2009 TECHNICAL REPORT
2TesT design and TesT developmenT
to an additional source of advice about responses that had been found problematic in some sense. Coding supervisors in all countries found this to be a particularly useful resource though there was considerable variation in the number of queries that they submitted.
Field trial outcomesExtensive analyses were conducted on the field trial cognitive item response data. These analyses have been reported elsewhere, but included the standard ACER ConQuest® item analysis (item fit, item discrimination, item difficulty, distractor analysis, mean ability and point-biserial correlations by coding category, item omission rates, and so on), as well as analyses of gender-by-item interactions and item-by-country interactions. On the basis of these critical measurement statistics, it was recommended that seven new items be removed from consideration for the main survey. In addition, the coding of partial credit items was reviewed. In some cases, the collapsing of categories was recommended. Consortium members also examined the items showing language DIF and considered whether issues in translating the item might be the source of the language DIF. Minor modifications were made to a small number of items (in either English or French source versions) if translation issues were thought to have contributed to an item showing language DIF. The parts of each complex multiple-choice item were also analysed separately and this led to some parts being dropped though the item itself was retained.
National review of field trial itemsA further round of national item review was carried out, this time informed by the experience at national centres of how the items worked in the field trial in each country. A document, Item Review Guidelines, was produced to assist national experts to focus on the most important features of possible concern. In addition, NPMs were asked to assign a rating from 1 (low) to 5 (high) to each item to indicate its priority for inclusion in the main survey. About half of the countries completed this review of the field trial items. For digital reading, 14 of the 23 participating countries provided feedback on the field trial digital reading items – again via the online review system.
A comprehensive field trial review report also was prepared by all NPMs, for both the paper-based and computer-based assessments. These reports included a further opportunity to comment on particular strengths and weaknesses of individual items identified during the translation and verification process and during the coding of student responses.
Main Study
Main survey reading item selection The Reading Expert Group (REG) met on 22-25 September 2008 in Melbourne to review all available material and recommend which reading items should be included in the main survey.
The REG members considered the pool of 205 print reading items (new items and items retrieved from the 2000 administration) that had been field trialled and had performed adequately in terms of psychometric quality, at initial review (seven items had previously been rejected by the Consortium as technically inadequate, on the basis of analysis of the field trial data). The 205 items were evaluated by the REG in terms of their substantive quality, fit to framework, range of difficulty, national centre feedback, and durability. Similarly, of the digital reading pool of 72 field trial items, 11 items were judged of insufficient technical quality to be considered for the main survey. The remaining 61 items were reviewed by the REG using a similar set of criteria to that used for the print item selection.
The selections in both cases had to satisfy the following conditions:
•the psychometric properties of all selected items had to be satisfactory;
•items that generated coding problems had to be avoided unless those problems could be properly addressed through modifications to the coding guides; and
•items given high priority ratings by national centres were to be preferred, and items with lower ratings were to be avoided.
In addition, the item set (in the case of print reading, the combined set of new and link items) had to satisfy these conditions as much as possible:
•the major framework categories had to be populated as specified in the reading literacy framework; and
•there had to be an appropriate distribution of item difficulties.

PISA 2009 TECHNICAL REPORT – © OECD 2012 41
2TesT design and TesT developmenT
The REG made a preliminary selection of print reading units (including eight “easy” units), and then selected items from the agreed units. After the test developers had provided a summary of the preliminary selections, the REG made final adjustments to the recommended sets. The REG recommended that the print reading main survey pool be selected from a set comprising 28 trend items, 16 PISA 2000 link items, and 129 new items. The selection came from 20 sources (14 national centres and 5 Consortium groups) and was originally in 12 source languages. The selected material received an average rating from national centres on “priority for inclusion” of 3.81.
For digital reading, the REG recommended that the main survey items be selected from a set of 11 units comprising 46 items. As noted earlier, the majority of material in the digital reading pool was generated by the test development centres, but two nationally submitted units were recommended for the main survey. The selected material received an average rating from national centres on “priority for inclusion” of 4.01.
The main survey item pools were presented during a meeting of NPMs in Sydney, Australia in September/October 2008.
Subsequently, for print reading, one new unit was dropped from the item pool as a result of NPM concerns about the appropriateness of its context in some cultures, and another unit that had not been included in the REG selection was reinstated, when a large number of NPMs expressed their disappointment at its exclusion. One other new unit was included to adjust for framework balance, and one further new unit, one unit retrieved from PISA 2000, and 29 single items from field trialled units recommended by the REG were omitted because of space considerations.
The numbers of new items, items retrieved from PISA 2000 and link items in the final selection for the main survey is shown in Table 2.8.
table 2.8 Print reading main survey cognitive itemsnew items 94PISa 2000 retrieved items 11Link items 281
total 131
1. Two items in the link set were omitted from the analysis of the main survey items because of poor reliability.
For digital reading, the NPMs endorsed the REG’s recommended selection pool at their September meeting. Subsequently, two full units and 11 individual items from selected units were omitted from the main survey item pool because of space limitations. In total 29 digital reading items were included in the main survey.
Distributions of the print reading items, with respect to the major framework variables, are summarised in Table 2.9, Table 2.10 and Table 2.11.
table 2.9 Print reading main survey items (item format by aspect)
access and retrieve Integrate and interpret reflect and evaluate total
multiple choice 6 38 8 52 (40%)Complex multiple choice 3 6 1 10 (8%)
Closed constructed response 9 4 0 13 (10%)Short response 10 1 0 11 (8%)
open constructed response 3 18 24 45 (34%)total 31 (24%) 67 (51%) 33 (25%) 131 (100%)
table 2.11 Print reading main survey items (text type by aspect)
access and retrieve Integrate and interpret reflect and evaluate total
argumentation 5 16 9 30 (23%)description 10 11 9 30 (23%)
exposition 8 23 9 40 (31%)Instruction 6 1 4 11 (8%)narration 2 16 2 20 (15%)
total 31 (24%) 67 (51%) 33 (25%) 131 (100%)
table 2.10 Print reading main survey items (item format by text format)
Continuous mixed multiple non-continuous total
multiple choice 36 4 2 10 52 (40%)Complex multiple choice 6 1 0 3 10 (8%)
Closed constructed response 4 0 2 7 13 (10%)Short response 4 1 0 6 11 (8%)
open constructed response 31 1 1 12 45 (34%)total 81 (62%) 7 (5%) 5 (4%) 38 (29%) 131 (100%)

42 © OECD 2012 – PISA 2009 TECHNICAL REPORT
2TesT design and TesT developmenT
It was considered important that, other than differing in difficulty, the standard and easy booklets represented a similar alignment with the major framework variables in terms of distribution of items across categories. Percentage distributions of the print reading items across the standard and easy booklets, with respect to the major framework variables, are summarised in Table 2.12 to Table 2.15. The Full pool column shows the percentages of items in each category across the nine clusters used in the main survey for reading. The Standard test column shows the percentage per category for the seven clusters used in the standard booklets (Clusters R1, R2, R3a, R4a, R5, R6 and R7) and the Easy test column shows the parallel percentages for the clusters used in the easy booklets (Clusters R1, R2, R3b, R4b, R5, R6 and R7). The Target column shows the percentages aimed for in the framework.
Table 2.12 shows the distribution by percentage of items in the three categories of the aspect variable.
table 2.12 Print reading main survey items in standard and easy tests (aspect %)
Full pool Standard test easy test target
access and retrieve 24 23 24 25Integrate and interpret 51 51 53 50
reflect and evaluate 25 26 23 25total 100 100 100 100
Table 2.13 shows the distribution by percentage of items in the four categories of the text format variable.
table 2.13 Print reading main survey items in standard and easy tests (text format %)
Full pool Standard test easy test target
Continuous 62 61 63 60mixed 5 7 6 5
multiple 4 5 1 5non-continuous 29 27 30 30
total 100 100 100 100
For the text format variable, efforts to reach the targets were concentrated on continuous and non-continuous, on which it was anticipated that reporting subscales might be built.
Table 2.14 shows the distribution by percentage of items in the five categories of the text type variable that were used in the print reading pool (no items were categorised as transaction by text type).
For the text type variable, some sampling across the categories was sought, with a target percentage set only for narration.
Table 2.15 shows the distribution by percentage of items in each of the four categories of the situation variable.
Distributions of the digital reading items, with respect to the major framework variables, are summarised in Table 2.16 to Table 2.18. Table 2.16 shows the distribution of items by aspect and item format.
table 2.14 Print reading main survey items in standard and easy tests (text type %)
Full pool Standard test easy test target
argumentation 23 19 20 (no target)description 23 19 25 (no target)
exposition 31 36 32 (no target)Instruction 8 11 7 (no target)narration 15 16 16 15
total 100 100 100
table 2.15 Print reading main survey items in standard and easy tests (situation %)
Full pool Standard test easy test target
educational 27 27 27 28occupational 17 18 19 16
Personal 27 31 24 28Public 29 24 30 28
total 100 100 100 100
table 2.16 digital reading main survey items (item format by aspect)
access and retrieve Integrate and interpret reflect and evaluate Complex total
multiple choice 7 9 2 0 18 (62%)Complex multiple choice 0 1 0 2 3 (10%)
open constructed response 0 0 4 4 8 (28%)total 7 (24%) 10 (34%) 6 (21%) 6 (21%) 29 (100%)

PISA 2009 TECHNICAL REPORT – © OECD 2012 43
2TesT design and TesT developmenT
Digital reading introduces a unique variable for text, environment, which has two main categories: authored and message-based. A few items are based on texts representing both types of environment. These are categorised as mixed.
Table 2.17 shows the distribution of items by environment and text format.
table 2.17 digital reading main survey items (environment by text format)
authored message-based mixed total
Continuous 1 1 0 2 (7%)mixed 2 0 0 2 (7%)
multiple 13 7 2 22 (76%)non-continuous 3 0 0 3 (10%)
total 19 (66%) 8 (28%) 2 (7%) 29 (100%)
Table 2.18 shows the distribution of items by aspect and text type.
table 2.18 digital reading main survey items (text type by aspect)
access and retrieve Integrate and interpret reflect and evaluate Complex total
argumentation 2 2 1 1 6 (21%)description 4 2 3 0 9 (31%)
exposition 1 5 2 1 9 (31%)mixed 0 0 0 1 1 (3%)
transaction 0 1 0 3 4 (14%)total 7 (24%) 10 (34%) 6 (21%) 6 (21%) 29 (100%)
The framework calls for sampling across text types, but no percentage targets were set.
Main survey mathematics itemsThree clusters comprising a total of 24 units (35 items) were selected from the PISA 2003 main survey item pool. These were three intact clusters of the four clusters that had been administered in the main survey in PISA 2006. (The number of clusters for mathematics was reduced from PISA 2006 to PISA 2009 because, of the six cluster “slots” available for minor domains in both cycles, the REG had decided that in 2006 reading should administer exactly the same two clusters as it had administered in 2003 – thus allowing mathematics to fill the remaining four slots. However, in 2009, science and mathematics shared the six available slots equally.) The three clusters were selected to best represent the balance across framework variables.
Distributions of the mathematics items, with respect to the major framework variables, are summarised in Table 2.19, Table 2.20 and Table 2.21.
table 2.21 Mathematics main survey items (content category by competency cluster)
reproduction Connections reflection total
Space and shape 2 5 1 8 (23%)Quantity 4 5 2 11 (31%)
Change and relationships 2 4 3 9 (26%)uncertainty 1 4 2 7 (20%)
total 9 (26%) 18 (51%) 8 (23%) 35 (100%)
table 2.20 Mathematics main survey items (item format by content category)
Space and shape Quantity Change and relationships uncertainty total
multiple choice 2 3 1 3 9 (26%)Complex multiple choice 1 2 2 2 7 (20%)
Closed constructed response 1 2 0 0 3 (9%)Short response 1 4 1 2 8 (23%)
open constructed response 3 0 5 0 8 (23%)total 8 (23%) 11 (31%) 9 (26%) 7 (20%) 35 (100%)
table 2.19 Mathematics main survey items (item format by competency cluster)
reproduction Connections reflection total
multiple choice 5 1 3 9 (26%)Complex multiple choice 0 6 1 7 (20%)
Closed constructed response 1 1 1 3 (9%)Short response 2 6 0 8 (23%)
open constructed response 1 4 3 8 (23%)total 9 (26%) 18 (51%) 8 (23%) 35 (100%)

44 © OECD 2012 – PISA 2009 TECHNICAL REPORT
2TesT design and TesT developmenT
Main survey science items Three clusters comprising a total of 18 units (53 items) were selected from the PISA 2006 main survey item pool, when science had been the major domain. These were not intact clusters, but they were intact units: no items or items parts that had been administered in PISA 2006 were omitted from the units selected for 2009. However, attitude items, which had been administered alongside cognitive units in PISA 2006, were not included.
Across the three clusters, units were selected that matched as closely as possible the 2006 distribution of competency classifications, knowledge classifications, item formats, range and distribution of item difficulties, difficulty by gender, and layout and cluster position.
Distributions of the science items, with respect to the major framework variables, are summarised in Table 2.22, Table 2.23 and Table 2.24.
Released itemsThe REG identified nine print reading units not included in the main survey that would be suitable for release as sample PISA reading units. One other unit was added to this set as a result of the NPM recommendations. In addition, four units of digital reading material from the field trial that were not included in the main survey were released. All of these units were included as an annex in the publication PISA 2009 Assessment Framework: Key Competencies in Reading, Mathematics and Science (OECD, 2010a).
No mathematics or science material was released after the 2009 field trial.
Despatch of main survey instrumentsAfter finalising the main survey item selection, final forms of all selected items were prepared. This involved minor revisions to items and coding guides based on detailed information from the field trial, and the addition of further sample student responses to the coding guides.
For print reading, French translations of all selected items were then updated. Clusters of items were formatted as described previously, and booklets for were formatted in accordance with the main survey rotation design shown previously in Table 2.2. English and French versions of all items, item clusters and test booklets for the paper-based assessment were made available to national centres in three despatches, on 14 August (link clusters), 28 November (new reading units) and 19 December 2008 (new clusters and all booklets).
table 2.22 Science main study items (item format by competency)
Identifying scientific issues explaining scientific phenomena using scientific evidence total
multiple choice 4 8 6 18 (34%)Complex multiple choice 6 7 4 17 (32%)
Closed constructed response 0 1 0 1 (2%)open constructed response 3 6 8 17 (32%)
total 13 (25%) 22 (42%) 18 (34%) 53 (100%)
table 2.23 Science main study items (item format by knowledge type)
Knowledge of science Knowledge about science total
multiple choice 9 9 18 (34%)Complex multiple choice 9 8 17 (32%)
Closed constructed response 1 0 1 (2%)open constructed response 7 10 17 (32%)
total 26 (49%) 27 (51%) 53 (100%)
table 2.24 Science main study items (knowledge category by competency)
Identifying scientific issues explaining scientific phenomena using scientific evidence total
Physical systems 0 6 0 6 (11%)Living systems 0 9 0 9 (17%)
earth & space systems 0 7 0 7 (13%)technology systems 0 0 4 4 (8%)
Scientific enquiry 13 0 1 14 (26%)Scientific explanations 0 0 13 13 (25%)
total 13 (25%) 21 (42%) 18 (34%) 53 (100%)

PISA 2009 TECHNICAL REPORT – © OECD 2012 45
2TesT design and TesT developmenT
For digital reading, the English source version of the authored units was released for countries to make any necessary translation and adaptation changes on 21 November 2008. This release included both digital versions of the units and paper-based coding guides. The items were then arranged in clusters and test forms according to the main survey design shown in Table 2.3. The English source versions of the clusters and test forms were released on 16 December 2008.
Main survey coder trainingConsolidated coding guides were prepared, in both English and (for the paper-based assessments) French, containing all the items that required manual coding. These were despatched to national centres on 23 January 2009. In addition, the training materials prepared for field trial coder training were revised with the addition of student responses selected from the field trial coder query service.
International coder training sessions for reading, mathematics and science were conducted in Brussels, Belgium in February 2009. All but four countries had representatives at the training meetings. As for the field trial, it was apparent at the training meeting that a small number of clarifications were needed to make the coding guides and training materials as clear as possible. Revised coding guides and coder training material for both paper-based assessments and the digital reading assessment were prepared and despatched early in March 2009.
Main survey coder query serviceThe coder query service operated for the main survey across the three test domains. Any student responses that were found to be difficult to code by coders in national centres could be referred to the Consortium for advice. The Consortium was thereby able to provide consistent coding advice across countries. Reports of queries and the Consortium responses were made available to all national centres via the Consortium website, and were regularly updated as new queries were received.
Review of main survey item analysesUpon reception of data from the main survey testing, extensive analysis of item responses was carried out to identify any items that were not capable of generating useful student achievement data. Such items were removed from the international data set, or in some cases from particular national datasets where an isolated problem occurred. Two reading items and one mathematics item were removed from the international data set.
Notes
1. This does not include the two items R219Q1E and R219Q1T that were deleted from the international analysis. These two items are not included in any of the succeeding discussion.
2. This does not include the mathematics item M305Q01 that was deleted from the international analysis.
3. Available at www.pisa.oecd.org > what PISA produces > PISA 2009 > PISA 2009 manuals and guidelines.

3
PISA 2009 TECHNICAL REPORT – © OECD 2012 47
The Development of the PISA Context Questionnaires
Introduction ..................................................................................................................................................................... 48
The development of the PISA 2009 Questionnaire Framework .............................................. 48
Research areas in PISA 2009 ................................................................................................................................. 49
The development of the PISA 2009 context questionnaires ...................................................... 52
The field-trial of the PISA 2009 context questionnaires ................................................................ 52
The coverage of the questionnaire material ........................................................................................... 53
The implementation of the context questionnaires ........................................................................ 54

48 © OECD 2012 – PISA 2009 TECHNICAL REPORT
3The developmenT of The pISA conTexT queSTIonnAIreS
introductionIn its Call for Tender for PISA 2009, the PISA Governing Board (PGB) established the main policy issues it sought to address in the fourth cycle of PISA. In particular, the PGB required PISA 2009 to collect a set of basic demographic data as a core component that replicated key questions from the previous cycles. In addition, PISA 2009 needed to address issues related to important aspects of the affective domain, information about students’ experience with reading in and out of school (e.g. experience of different approaches to the teaching of reading, preferred ways of learning), motivation, interest in reading and engagement in reading. At the school level, PISA 2009 needed to explore curriculum, teaching and learning in the area of reading, including aspects of the teachers’ careers and qualifications concerning the test language. Since the impact of out-of-school factors was considered of particular interest in a PISA survey where reading literacy was the major domain, the PGB recommended the inclusion of a parent questionnaire as an optional instrument.
The Core B Consortium undertook the operationalisation of these goals with the assistance of a variety of experts. In particular, a Questionnaire Expert Group (QEG) was established, consisting of experts from various research backgrounds and countries (see Annex H). The Core B Consortium and the QEG worked together to develop the Questionnaire Framework for PISA 2009 which was included in the publication, PISA 2009 Assessment Framework: Key Competencies in Reading, Mathematics and Science (OECD, 2010a) and the related contextual instruments. Other experts were consulted where appropriate, especially some members of the Reading Expert Group (REG).
the develoPMent oF the PiSa 2009 QueStionnaire FraMeworKThe first step in the process was the development of a questionnaire framework which allowed the mapping of the PGB’s priority policy issues to the design of PISA 2009. To aid this, a set of criteria established by the INES (International Indicators of Educational Systems) Network A was used:
•First, the research area must be of enduring policy relevance and interest. That is, a research area should have policy relevance, capture policy makers’ attention, address their needs for data about the performance of their educational systems, be timely, and focus on what improves or explains the outcomes of education. A research area should also be of interest to the public, since it is this public to which educators and policy makers are accountable.
•Second, research areas must provide an internationally comparative perspective and promise significant added value to what can be accomplished through national evaluation and analysis. This implies that research areas need to be both relevant (i.e. of importance) and valid (i.e. of similar meaning) across countries.
•Third, there must be some consistency in the approach of each research area with PISA 2000, PISA 2003 and PISA 2006.
•Fourth, it must be technically feasible and appropriate to address the issues within the context of the PISA design. That is, the collection of data about a subject must be technically feasible in terms of methodological rigour and the time and costs (including opportunity costs) associated with data collection.
In developing the questionnaire framework, the following aspects were considered, both in terms of restrictions and of potential outcomes related to the study design:
•PISA measures knowledge and skills for life and so it does not have a strong curricular focus. This limits the extent to which the study is able to explore relationships between differences in achievement and differences in the implemented curricula. On the other hand, consideration was given to the out-of-school factors with a potential of enhancing cognitive and affective learning outcomes.
•PISA students are randomly sampled within schools, not from the same classrooms or courses and therefore come from different learning environments with different teachers and, possibly, different levels of instruction. Consequently, classroom-level information could only be collected either at the individual student level or at the school level.
•PISA uses an age-based definition of the target population. This is particularly appropriate for a yield-oriented study, and provides a basis for in-depth exploration of important policy issues, such as the effects of a number of structural characteristics of educational systems (e.g. the use of comprehensive vs. tracked study programmes, or the use of grade repetition). On the other hand, the inclusion in the study of an increasing number of partner countries (where the enrolment rate for the 15-year-old age group is maybe less than 100%) requires that retention be taken into account in the analysis of between-countries differences.
•The cross-sectional design used in PISA does not allow any direct analysis of school effects over time. However, the cyclic nature of the study will permit not only the investigation of change in the criterion measures, but also in the effects of rates of change in the predictor variables.

PISA 2009 TECHNICAL REPORT – © OECD 2012 49
3The developmenT of The pISA conTexT queSTIonnAIreS
The questionnaire framework that is at the basis of the development of the context questionnaires is fully described in the PISA 2009 Assessment Framework: Key Competencies in Reading, Mathematics and Science (OECD, 2010a). It describes the content of the questionnaires for students, schools and parents. In addition, it puts forward ideas for analysing the policy-relevance of the data collected, such as investigating effective learning environments in reading, ensuring school effectiveness and management, promoting educational equity and cost effectiveness, and developing system-level indicators. The PISA 2009 Questionnaire Framework presents a description of the types and purposes of the information collected at each of four educational levels. The types of the information collected at these levels can be described as following:
•At the system-level, the macroeconomic, social, cultural and political context sets constraints for the educational policies in a country. Outcomes at the system-level are not only aggregated learning outcomes but also equity-related outcomes.
•At the level of the educational institution, characteristics of the educational provider and its community context are antecedents for the policies and practices at the institutional level as well as the school climate for learning. Outcomes at this level are aggregates of individual learning outcomes and also differences in learning outcomes between sub-groups of students, for example whether the gap between the average performances of boys and girls differs from school to school.
•At the level of the instructional units, characteristics of teachers and the classrooms/courses are antecedents for the instructional settings and the learning environment; learning outcomes are aggregated individual outcomes.
•At the student level, characteristics (like gender, age, grade) and background (like social status, parental involvement, language spoken at home) are antecedents for the individual learning process and learning outcomes (both cognitive and affective).
The questionnaire framework is based on a multilevel model of antecedent conditions, policy amenable process factors and outcomes. The choice of variables within this model is theory-driven and evidence-based, using the research literature on educational effectiveness and related research areas (e.g. Creemers, 1994; Good & Brophy, 1986; Purkey & Smith, 1983; Sammons, Hillman & Mortimore, 1995; Scheerens, 1992; Scheerens & Bosker, 1997; Teddlie & Reynolds, 2000). An exemplary mapping of potential contextual variables against the categories of the Questionnaire Framework for PISA 2009 is outlined in Figure 3.1.
The PISA 2009 Questionnaire Framework is especially designed to study four core policy issues in education:
•Educational productivity can be highlighted by focusing on output variables at different aggregation levels, and to make the well-known comparisons between mean performance levels between countries, so that countries can serve as benchmarks for one another.
•Educational effectiveness seeks to determine the net effect of amenable educational conditions on outputs, while controlling for relevant antecedent conditions at the level of individual participants.
•Educational equity is captured by examining disparities between resources and processes as well as the variation between students and schools in educational outputs; and the degree to which achievement levels and disparities hang together with specific antecedents of students, schools and school contexts; e.g. the reading performance of girls from cultural minority backgrounds, the average achievement levels of schools in rural areas.
•Educational efficiency addresses questions of input provision and effectiveness at the lowest possible costs.
reSearch areaS in PiSa 2009One important objective of the questionnaire framework was to facilitate the development and choice of research areas that combine policy relevance effectively with the strengths of the PISA design. PISA’s contributions to policy makers’ and educators’ needs were maximised by identifying possible policy-relevant research areas and choosing carefully from among the many possibilities so that the strengths of the PISA design were capitalised on. The following research areas were developed following recommendations from the QEG – see PISA 2009 Assessment Framework: Key Competencies in Reading, Mathematics and Science (OECD, 2010a).

50 © OECD 2012 – PISA 2009 TECHNICAL REPORT
3The developmenT of The pISA conTexT queSTIonnAIreS
Level antecedents amenable processes outcomes
Educational system as a whole
General affluence of the country/region Functional decentralisationSystem level aggregates of reading, reading engagement and meta-cognition
Status of teachersEvaluation, examination and accountability arrangements
Equity and efficiency related outcomes
Community involvement in schoolingStructural differentiation of secondary education
Societal (in)equality of country or region Investment in education
Income distribution (e.g., Gini index)Degree of centralisation in curriculum and assessment
Investment in education
Degree of centralisation in curriculum and assessment
Equity oriented policies
School levelSchool managerial overhead
School policies, including implemented national policies, e.g., school autonomy
Institution level aggregates of reading literacy, reading engagement and meta-cognition, differences in outcomes for students of various backgrounds
Student body composition in terms of socio-economic background and percentage of immigrant students
Educational leadership
Affluence of the school neighbourhood Disciplinary climate
Parental involvementCurricular emphasis on reading (opportunity-to-learn)
Extra-curricular activities
Aspects of a supportive teaching/learning environment
Instructional settings
Class size Opportunity to learn in reading literacySimilar as those with respect to school level issues
Classroom composition Orderly classroom climate
Institution level aggregates of reading literacy, reading engagement and meta-cognition, differences in outcomes for students of various backgrounds
Teacher characteristics
Supportive teaching/learning conditions with respect to:
• reading literacy tasks
• reading engagement
• metacognition
Monitoring and feedback
Student level Socio-economic status Learning strategiesReading literacy performance of 15-year- old students
GenderMeta-cognition with respect to reading literacy
Immigration status Reading engagement
Parental educational level
• Figure 3.1 •Summary of the Questionnaire Framework for PiSa 2009
educational effectiveness
•System level indicators: Characteristics of school systems and performance in reading•School effectiveness: Amenable school characteristics and compositional effects•Effective learning environments in reading•Educational leadership
efficiency
•Cost effectiveness
equity
•Equality and equity in education
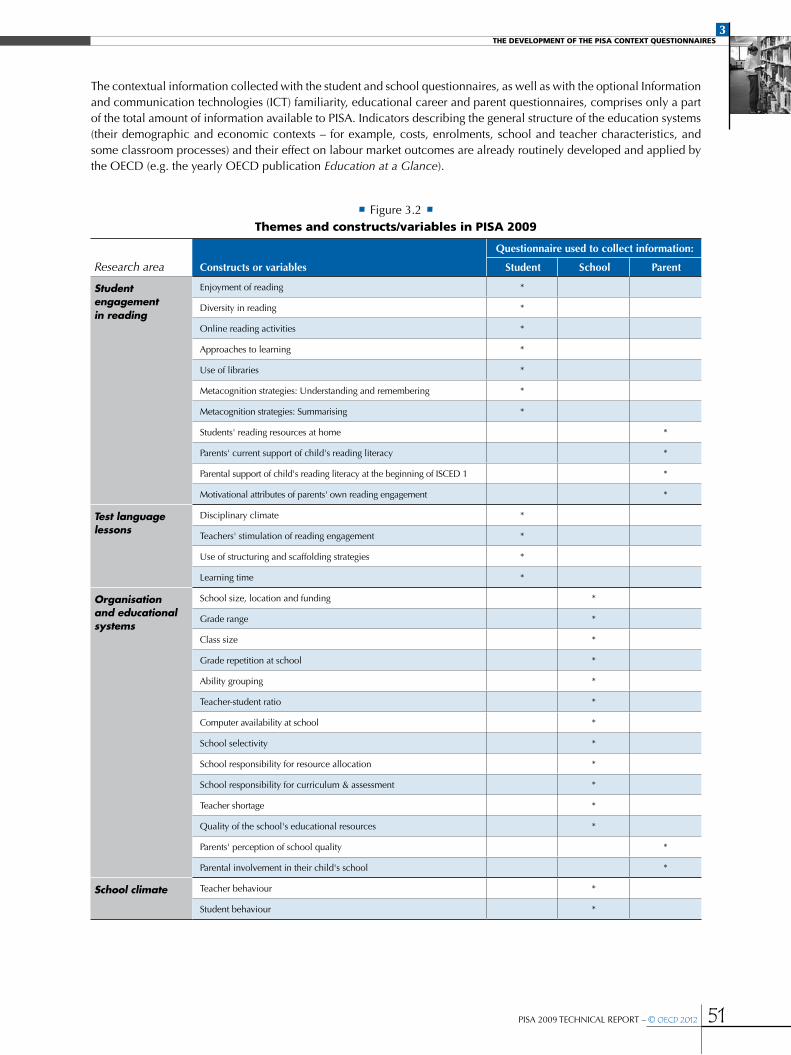
PISA 2009 TECHNICAL REPORT – © OECD 2012 51
3The developmenT of The pISA conTexT queSTIonnAIreS
Research area Constructs or variables
Questionnaire used to collect information:
Student School Parent
Student engagementin reading
Enjoyment of reading *
Diversity in reading *
Online reading activities *
Approaches to learning *
Use of libraries *
Metacognition strategies: Understanding and remembering *
Metacognition strategies: Summarising *
Students' reading resources at home *
Parents' current support of child's reading literacy *
Parental support of child's reading literacy at the beginning of ISCED 1 *
Motivational attributes of parents' own reading engagement *
Test language lessons
Disciplinary climate *
Teachers' stimulation of reading engagement *
Use of structuring and scaffolding strategies *
Learning time *
Organisation and educational systems
School size, location and funding *
Grade range *
Class size *
Grade repetition at school *
Ability grouping *
Teacher-student ratio *
Computer availability at school *
School selectivity *
School responsibility for resource allocation *
School responsibility for curriculum & assessment *
Teacher shortage *
Quality of the school's educational resources *
Parents' perception of school quality *
Parental involvement in their child's school *
School climate Teacher behaviour *
Student behaviour *
• Figure 3.2 •themes and constructs/variables in PiSa 2009
The contextual information collected with the student and school questionnaires, as well as with the optional Information and communication technologies (ICT) familiarity, educational career and parent questionnaires, comprises only a part of the total amount of information available to PISA. Indicators describing the general structure of the education systems (their demographic and economic contexts – for example, costs, enrolments, school and teacher characteristics, and some classroom processes) and their effect on labour market outcomes are already routinely developed and applied by the OECD (e.g. the yearly OECD publication Education at a Glance).

52 © OECD 2012 – PISA 2009 TECHNICAL REPORT
3The developmenT of The pISA conTexT queSTIonnAIreS
the develoPMent oF the PiSa 2009 context QueStionnaireSThe PISA 2009 Questionnaire Framework provided the foundation for the development of the following questionnaires:
•Student Questionnaire
•School Questionnaire
•ICT Familiarity Questionnaire (international option)
•Parent Questionnaire (international option)
•Educational Career Questionnaire (international option)
•Teacher Questionnaire (this was not implemented as not enough countries expressed interest in participating in this international option)
The questions proposed for inclusion in PISA 2009 were developed through a process which is outlined below:
•After the QEG had recommended the broad research areas, a range of constructs were identified from the elaborations of these areas.
•The PGB prioritised the constructs and established framework weights. The PGB evaluated the relevance, feasibility and time value of the proposed constructs, taking into account relevant background information. In general, all constructs achieved high ratings of relevance, and no low ratings of feasibility. The Core B Consortium took both the ratings and the variation of the ratings across countries into account in developing the questions for the student, school and parent questionnaires.
•The Core B Consortium worked with members of the QEG to prioritise these constructs and operationalise draft questions.
•The REG drafted additional instruments for measuring supportive classroom and school conditions and metacognition.
•For all adapted and newly developed questions of all questionnaires prior cognitive interviews were held in order to obtain a first indication of their efficiency, reliability and validity, as well as their international comparability (Kuhlemeier, Smits & Van den Bergh, 2007). It involved a think-aloud process where respondents were asked to complete the questionnaire while verbalising their thought processes. The pre-pilot provided qualitative feedback on the understanding and appropriateness of the items. The pre-pilot not only included the draft materials initiated by the Questionnaire Expert Group, but also the additional draft questions that were recommended by the REG. Qualitative feedback was obtained on the extent to which the respondents interpreted the questions as intended by the authors. If necessary, questions were revised and pre-piloted again.
•After refining the items in light of the pre-pilot results, a series of similar pre-pilots was undertaken in Mexico and Finland (Ceneval, 2007; Sulkunen & Reinikainen, 2007).
•The feedback obtained from the pre-pilots, coupled with continued collaboration with members of the QEG and REG, other internationally recognised experts, and National Project Managers (NPMs), resulted in pilot questionnaires for students, schools and parents.
•The draft constructs and questions were discussed with the NPMs during their September 2007 meeting in Dubrovnik, Croatia. The Core B team has taken into account the NPMs’ comments, together with the outcomes of the additional cognitive interviews and expert reviews, to prepare an improved proposal for the field trial.
the Field-trial oF the PiSa 2009 context QueStionnaireSData concerning the reliability, validity and usability of the student, school and parent questionnaires were gathered from a full scale field trial in each of the participating countries. The field trial was able to facilitate the investigation of a large number of questionnaire items through the use of a rotational design with five questionnaire forms that were randomly allocated to students and two questionnaire forms that were randomly allocated to parents. Empirical analyses included the examination of:
•the frequency of missing values by country;
•the magnitude and consistency of item-total score correlations for each scale, by country;
•the magnitude and the consistency of scale reliability (Cronbach’s alpha), by country;
•the magnitude and consistency of correlations with each scale and reading literary achievement as determined in the PISA field trial reading literacy test, by country;
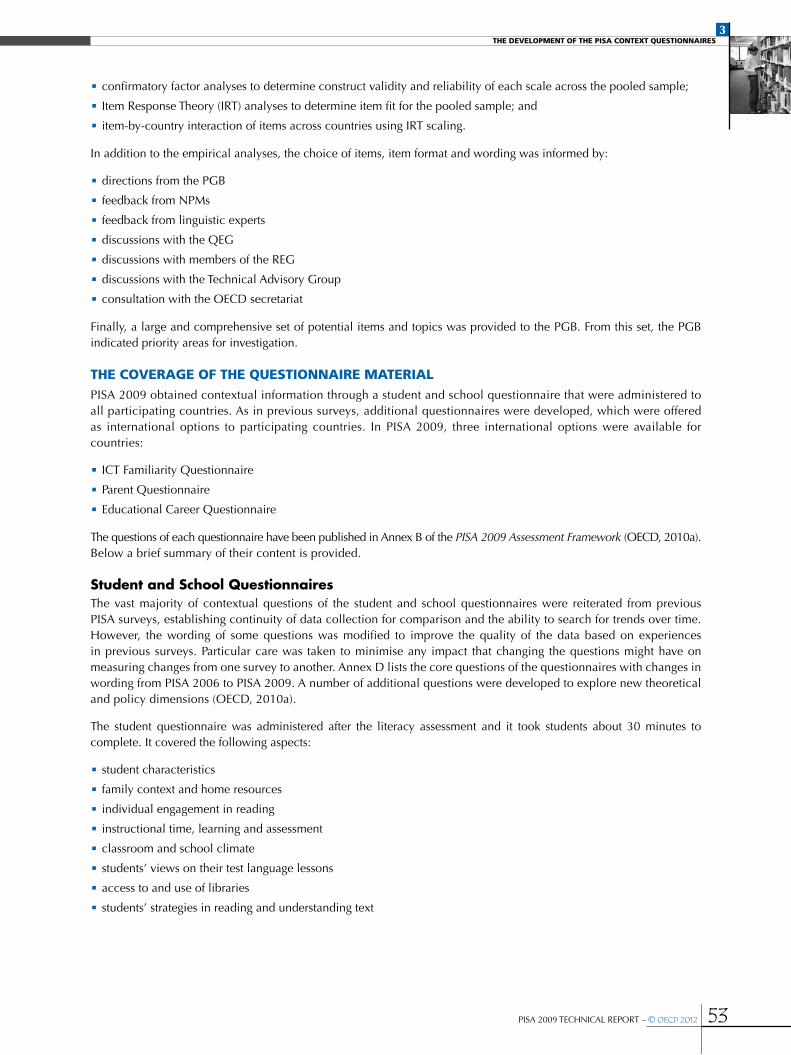
PISA 2009 TECHNICAL REPORT – © OECD 2012 53
3The developmenT of The pISA conTexT queSTIonnAIreS
•confirmatory factor analyses to determine construct validity and reliability of each scale across the pooled sample;
•Item Response Theory (IRT) analyses to determine item fit for the pooled sample; and
•item-by-country interaction of items across countries using IRT scaling.
In addition to the empirical analyses, the choice of items, item format and wording was informed by:
•directions from the PGB
•feedback from NPMs
•feedback from linguistic experts
•discussions with the QEG
•discussions with members of the REG
•discussions with the Technical Advisory Group
•consultation with the OECD secretariat
Finally, a large and comprehensive set of potential items and topics was provided to the PGB. From this set, the PGB indicated priority areas for investigation.
the coverage oF the QueStionnaire MaterialPISA 2009 obtained contextual information through a student and school questionnaire that were administered to all participating countries. As in previous surveys, additional questionnaires were developed, which were offered as international options to participating countries. In PISA 2009, three international options were available for countries:
•ICT Familiarity Questionnaire
•Parent Questionnaire
•Educational Career Questionnaire
The questions of each questionnaire have been published in Annex B of the PISA 2009 Assessment Framework (OECD, 2010a). Below a brief summary of their content is provided.
Student and School QuestionnairesThe vast majority of contextual questions of the student and school questionnaires were reiterated from previous PISA surveys, establishing continuity of data collection for comparison and the ability to search for trends over time. However, the wording of some questions was modified to improve the quality of the data based on experiences in previous surveys. Particular care was taken to minimise any impact that changing the questions might have on measuring changes from one survey to another. Annex D lists the core questions of the questionnaires with changes in wording from PISA 2006 to PISA 2009. A number of additional questions were developed to explore new theoretical and policy dimensions (OECD, 2010a).
The student questionnaire was administered after the literacy assessment and it took students about 30 minutes to complete. It covered the following aspects:
•student characteristics
•family context and home resources
•individual engagement in reading
•instructional time, learning and assessment
•classroom and school climate
•students’ views on their test language lessons
•access to and use of libraries
•students’ strategies in reading and understanding text

54 © OECD 2012 – PISA 2009 TECHNICAL REPORT
3The developmenT of The pISA conTexT queSTIonnAIreS
The school questionnaire was administered to the school principal and took about 30 minutes to complete. National project managers followed up with the principal and school co-ordinator to ensure a high response rate. It covered the following school-related aspects:
•the structure and organisation of the school
•the student and teacher body
•the school’s resources
•the school’s instruction, curriculum and assessment
•the school climate
•the school policies and practices
•the characteristics of the principal or designate
Educational Career QuestionnaireThe educational career questionnaire consisted of seven questions on the student’s interruptions of schooling or change of schools, educational aspirations and grade marks, as well as lessons taken out of school.
ICT Familiarity QuestionnaireBased on a request of the PGB, the ICT Familiarity Questionnaire was fully redesigned. The revision served three general objectives: a) to address a broader range of digital devices, services and applications, b) to emphasize how availability and use of ICT at school and at home are different and c) to address new digital learning environments in schools. The adaptation also reflects the growing interest in collaborative, online games as opposed to stand-alone games for the individual player, the increased use of synchronous as opposed to asynchronous electronic communication and the differences between computer use at school during lessons versus outside lessons. The new ICT Familiarity Questionnaire was administered to students after the international student questionnaire (sometimes combined within the same booklet) and it took about five minutes to complete. It covered the following ICT-related aspects:
•availability of ICT at home and at school
•general use of computers
•use of ICT at home
•use of ICT at school, in classroom lessons and outside classroom lessons
•attitude toward computers
Parent QuestionnaireThe impact of out-of-school factors is considered of particular interest in a cycle where reading literacy is the major domain. The Parent Questionnaire had to be newly designed to provide efficient, reliable and valid data about home, school, and community factors influencing reading literacy against limited (international) costs and efforts. The questionnaire took about 20 minutes to complete. One questionnaire was administered per student. The Parent Questionnaire covers parental reports related to following aspects:
•basic parent and family characteristics (father’s education, mother’s education, and number of children in the household);
•child’s past reading engagement (e.g. the child’s participation in pre-primary education and reading engagement at the beginning of primary education);
•home reading resources and support (home language, current home reading literacy support);
•parents’ own reading engagement (time spent on reading for enjoyment and attitudes to reading);
•annual household income and annual spending on children’s education;
•parents’ perception of and involvement in school; and
•school choice (i.e. options and reasons).
the iMPleMentation oF the context QueStionnaireSIn order to make questions easier to understand by 15-year-old students and their parents, and by school principals in participating countries, it was necessary to adapt parts of the questionnaire material from the international source version to the national context without jeopardising the comparability of the collected data. This is particularly important
PISA 2009 TECHNICAL REPORT – © OECD 2012 55
3The developmenT of The pISA conTexT queSTIonnAIreS
for questions that relate to specific aspects of educational systems like educational levels, study programmes or certain school characteristics which differ in terminology across countries.
To achieve a maximum of comparability, a process was implemented during which each adaptation was reviewed and discussed by the Core B Consortium and national centres. To facilitate this process, national centres were asked to complete a questionnaire adaptation spreadsheet (QAS), where adaptations to the questionnaire material were documented. Each adaptation had to be reviewed and agreed upon before the questionnaire material could be submitted for linguistic verification and the final optical check (see Chapter 5). The QAS also contained information about additional national questionnaire material and any deviation from the international questionnaire format.
Prior to the review of questionnaire adaptations, national centres were asked to complete three different tables describing necessary adaptations:
•Study programme tables: These document the range of different study programmes that are available for 15-year-old students across participating countries. This information was not only used as a codebook to collect these data from school records but also assisted the review of questionnaire adaptations.
•Language tables: These document the language categories included in the questions about language use at home.
•Country tables: These document the country categories in the questions about the country of birth for students and parents.
Information on parental occupation was collected through open-ended questions in Student Questionnaire. The responses were then coded according to the International Standard Classification of Occupations (ISCO) (International Labour Organisation, 1990). Once occupations had been coded into ISCO, the codes were re-coded into the International Socio-Economic Index of Occupational Status (ISEI) (Ganzeboom, de Graaf & Treiman, 1992), which provides a measure of the socio-economic status of occupations comparable across the countries participating in PISA.
The International Standard Classification of Education (ISCED) (OECD, 1999) was used as a typology to classify educational qualifications and study programmes. The ISCED classification was used to get comparable data across countries. Whereas this information was readily available for OECD member countries, for partner countries and economies extensive reviews of their educational systems in co-operation with national centres were necessary to map educational levels to the ISCED framework.


4
PISA 2009 TECHNICAL REPORT – © OECD 2012 57
Sample Design
Target population and overview of the sampling design ............................................................. 58
Population coverage, and school and student participation rate standards ............... 58
Main study school sample .................................................................................................................................... 62
4Sample deSign
58 © OECD 2012 – PISA 2009 TECHNICAL REPORT
target PoPulation and overview oF the SaMPling deSign
The desired base PISA target population in each country consisted of 15-year-old students attending educational institutions in grades 7 and higher. This meant that countries were to include:
•15-year-olds enrolled full-time in educational institutions;
•15-year-olds enrolled in educational institutions who attended only on a part-time basis;
•students in vocational training programmes, or any other related type of educational programmes; and
•students attending foreign schools within the country (as well as students from other countries attending any of the programmes in the first three categories).
It was recognised that no testing of 15-year-olds schooled in the home, workplace or out of the country would occur and therefore these 15-year-olds were not included in the international target population.
The operational definition of an age population directly depends on the testing dates. The international requirement was that the assessment had to be conducted during a 42-day period, referred to as the testing period, between 1 March 2009 and 31 August 2009, unless otherwise agreed.
Further, testing was not permitted during the first six weeks of the school year because of a concern that student performance levels may have been lower at the beginning of the academic year than at the end of the previous academic year, even after controlling for age.
The 15-year-old international target population was slightly adapted to better fit the age structure of most of the Northern Hemisphere countries. As the majority of the testing was planned to occur in April, the international target population was consequently defined as all students aged from 15 years and 3 completed months to 16 years and 2 completed months at the beginning of the assessment period. This meant that in all countries testing in April 2009, the target population could have been defined as all students born in 1993 who were attending an educational institution as defined above.
A variation of up to one month in this age definition was permitted. This allowed a country testing in March or in May to still define the national target population as all students born in 1993. If the testing was to take place at another time until the end of August, the birth date definition had to be adjusted so that in all countries the target population was always students aged 15 years and 3 completed months to 16 years and 2 completed months at the time of testing, or a one month variation of this.
In all but one country, the Russian Federation, the sampling design used for the PISA assessment was a two-stage stratified sample design. The first-stage sampling units consisted of individual schools having 15-year-old students. Schools were sampled systematically from a comprehensive national list of all PISA-eligible schools, known as the school sampling frame, with probabilities that were proportional to a measure of size. The measure of size was a function of the estimated number of PISA-eligible 15-year-old students enrolled in the school. This is referred to as systematic Probability Proportional to Size (PPS) sampling. Prior to sampling, schools in the sampling frame were assigned to mutually exclusive groups based on school characteristics called explicit strata, formed to improve the precision of sample-based estimates.
The second-stage sampling units in countries using the two-stage design were students within sampled schools. Once schools were selected to be in the sample, a complete list of each sampled school’s 15-year-old students was prepared. For each country a Target Cluster Size (TCS) was set, this value was typically 35 students although with agreement countries could use alternative values. From each list of students that contained more than the TCS, a sample of typically 35 students were selected with equal probability and for lists of fewer than the TCS, all students on the list were selected.
In the Russian Federation, a three-stage design was used. In this case, geographical areas were sampled first (first-stage units) using probability proportional to size sampling, and then schools (second-stage units) were selected within these sampled geographical areas. Students were the third-stage sampling units in this three-stage design and were sampled from the selected schools.
PoPulation coverage, and School and Student ParticiPation rate StandardS
To provide valid estimates of student achievement, the sample of students had to be selected using established and professionally recognised principles of scientific sampling, in a way that ensured representation of the full target population of 15-year-old students in the participating countries.
4Sample deSign
PISA 2009 TECHNICAL REPORT – © OECD 2012 59
Furthermore, quality standards had to be maintained with respect to (i) the coverage of the PISA international target population, (ii) accuracy and precision, and (iii) the school and student response rates.
Coverage of the PISA international target populationNational Project Managers (NPMs) might have found it necessary to reduce their coverage of the target population by excluding, for instance, a small, remote geographical region due to inaccessibility, or a language group, possibly due to political, organisational or operational reasons, or special education needs students. In an international survey in education, the types of exclusion must be defined consistently for all participating countries and the exclusion rates have to be limited. Indeed, if a significant proportion of students were excluded, this would mean that survey results would not be deemed representative of the entire national school system. Thus, efforts were made to ensure that exclusions, if they were necessary, were minimised according to the PISA 2009 Technical Standards (see Annex G).
Exclusion can take place at the school level (exclusion of entire schools) or at the within-school level (exclusion of individual students.) Areas deemed by the PGB to be part of a country (for the purpose of PISA), but which were not included for sampling, although this occurred infrequently, were designated as non-covered areas. Care was taken in this regard because, when such situations did occur, the national desired target population differed from the international desired target population.
International within-school exclusion rules for students were specified as follows:
•Intellectually disabled students are students who have a mental or emotional disability and who, in the professional opinion of qualified staff, are cognitively delayed such that they cannot be validly assessed in the PISA testing setting. This category includes students who are emotionally or mentally unable to follow even the general instructions of the test. Students were not to be excluded solely because of poor academic performance or normal discipline problems.
•Functionally disabled students are students who are permanently physically disabled in such a way that they cannot be validly assessed in the PISA testing setting. Functionally disabled students who could provide responses were to be included in the testing.
•Students with insufficient assessment language experience are students who need to meet all of the following criteria: i) are not native speakers of the assessment language(s), ii) have limited proficiency in the assessment language(s), and iii) have received less than one year of instruction in the assessment language(s). Students with insufficient assessment language experience could be excluded.
•Students not assessable for other reasons as agreed upon. A nationally-defined within-school exclusion category was permitted if agreed upon by the PISA Consortium. A specific subgroup of students (for example, students with dyslexia, dysgraphy, or dyscalculy) could be identified for whom exclusion was necessary but for whom the previous three within-school exclusion categories did not explicitly apply, so that a more specific within-school exclusion definition was needed.
•Students taught in a language of instruction for the main domain for which no materials were available. Standard 2.1 notes that the PISA test is administered to a student in a language of instruction provided by the sampled school to that sampled student in the major domain of the test. Thus if no test materials were available in the language in which the sampled student is taught, the student was excluded.
A school attended only by students who would be excluded for intellectual, functional or linguistic reasons was considered a school-level exclusion.
It was required that the overall exclusion rate within a country (i.e. school-level and within-school exclusions combined) be kept below 5% of the PISA Desired Target Population. Guidelines for restrictions on the level of exclusions of various types were as follows:
•School-level exclusions for inaccessibility, feasibility or other reasons were to cover fewer than 0.5% of the total number of students in the international target population for participating countries. Schools on the school sampling frame which had only one or two PISA-eligible students were not allowed to be excluded from the frame. However, if, based on the frame, it was clear that the percentage of students in these small schools would not cause a breach of the 0.5% allowable limit, then such schools could be excluded in the field at that time of the assessment, if they still only had one or two PISA-eligible students.
•School-level exclusions for intellectually or functionally disabled students, or students with insufficient assessment language experience, were to cover fewer than 2% of students.
4Sample deSign
60 © OECD 2012 – PISA 2009 TECHNICAL REPORT
•Because definitions of within-school exclusions could vary from country to country, NPMs were asked to adapt the international definitions to make them workable in their country but still to code them according to the PISA international coding scheme. Within-school exclusions for intellectually disabled or functionally disabled students, or students with insufficient assessment language experience, or students nationally-defined and agreed upon for exclusion were expected to cover fewer than 2.5% of students. Initially, this could only be an estimate. If the actual percentage was ultimately greater than 2.5%, the percentage was re-calculated without considering students excluded because of insufficient assessment language experience since this is known to be a largely unpredictable part of each country’s PISA-eligible population, not under the control of the education system. If the resulting percentage was below 2.5%, the exclusions were regarded as acceptable.
Accuracy and precisionA minimum of 150 schools had to be selected in each country, if a participating country had fewer than 150 schools, then all schools were selected. Within each participating school, a predetermined number of students, denoted as TCS (usually 35 students), were randomly selected with equal probability, or in schools with fewer than TCS eligible students, all students were selected. In total, a minimum sample size of 4 500 assessed students was to be achieved, or the full population if it was less than this size. It was possible to negotiate a TCS that differed from 35 students, but if it was reduced then the sample size of schools was increased beyond 150, so as to ensure that at least 4 500 students would be assessed. The TCS selected per school had to be at least 20 students, so as to ensure adequate accuracy in estimating variance components within and between schools – a major analytical objective of PISA.
NPMs were strongly encouraged to identify available variables to use for defining the explicit and implicit strata for schools to reduce the sampling variance. See later section on stratification for other benefits.
For countries that had participated in PISA 2006 that had larger than anticipated sampling variances associated with their estimates, recommendations were made about sample design changes that would possibly help to reduce the sampling variances for PISA 2009. These included modifications to stratification variables, and increases in the required sample size.
School response ratesA response rate of 85% was required for initially selected schools. If the initial school response rate fell between 65% and 85%, an acceptable school response rate could still be achieved through the use of replacement schools. Figure 4.1 provides a summary of the international requirements for school response rates. To compensate for a sampled school that did not participate, where possible, two potential replacement schools were identified. Furthermore, a school with a student participation rate between 25% and 50% was not considered as a participating school for the purposes of calculating and documenting response rates.1 However, data from such schools were included in the database and contributed to the estimates included in the initial PISA international report. Data from schools with a student participation rate of less than 25% were not included in the database, and such schools were regarded as non-respondents.
The rationale for this approach was as follows. There was concern that, in an effort to meet the requirements for school response rates, a national centre might accept participation from schools that would not make a concerted effort to have students attend the assessment sessions. To avoid this, a standard for student participation was required for each individual school in order that the school be regarded as a participant. This standard was set at a minimum of 50% student participation. However, there were a few schools in many countries that conducted the assessment without meeting that standard. Thus a judgement was needed to decide if the data from students in such schools should be used in the analyses, given that the students had already been assessed. If the students from such schools were retained, non-response bias would possibly be introduced to the extent that the students who were absent could have been different in achievement from those who attended the testing session, and such a bias is magnified by the relative sizes of these two groups. If one chose to delete all assessment data from such schools, then non-response bias would be introduced to the extent that the school was different from others in the sample, and sampling variance would be increased because of sample size attrition.
The judgement was made that, for a school with between 25% and 50% student response, the latter source of bias and variance was likely to introduce more error into the study estimates than the former, but with the converse judgement for those schools with a student response rate below 25%. Clearly the cut-off of 25% is arbitrary as one would need extensive studies to try to establish this cut-off empirically. However, it is clear that, as the student response rate decreases within a school, the possibility of bias from using the assessed students in that school will increase, while the loss in sample size from dropping all of the students in the school will be small.

4Sample deSign
PISA 2009 TECHNICAL REPORT – © OECD 2012 61
• Figure 4.1 •School response rate standards
These PISA standards applied to weighted school response rates. The procedures for calculating weighted response rates are presented in Chapter 8. Weighted response rates weight each school by the number of students in the population that are represented by the students sampled from within that school. The weight consists primarily of the enrolment size of 15-year-old students in the school, divided by the selection probability of the school. Because the school samples were selected with probability proportional to size, in most countries most schools contributed approximately equal weights, as a consequence the weighted and unweighted school response rates were similar. Exceptions could occur in countries that had explicit strata that were sampled at very different rates. Details as to how the PISA participants performed relative to these school response rate standards are included in Chapters 11 and 14.
Student response ratesAn overall response rate of 80% of selected students in participating schools was required. A student who had participated in the original or follow-up cognitive sessions was considered to be a participant. A minimum student response rate of 50% within each school was required for a school to be regarded as participating: the overall student response rate was computed using only students from schools with at least a 50% student response rate. Again, weighted student response rates were used for assessing this standard. Each student was weighted by the reciprocal of his/her sample selection probability.
1009590858075706560Before replacement (%)
100
95
90
85
80
75
70
65
60
0
Afte
r re
plac
emen
t (%
)
0
Acceptable Intermediate Not acceptable
School response rates

4Sample deSign
62 © OECD 2012 – PISA 2009 TECHNICAL REPORT
Main Study School SaMPle
Definition of the national target populationNPMs were first required to confirm their dates of testing and age definition with the PISA Consortium. Once these were approved, NPMs were alerted to avoid having the possible drift in the assessment period lead to an unapproved definition of the national target population.
Every NPM was required to define and describe their country’s target population and explain how and why it might deviate from the international target population. Any hardships in accomplishing complete coverage were specified, discussed and approved or not, in advance. Where the national target population deviated from full coverage of all PISA-eligible students, the deviations were described and enrolment data provided to measure how much coverage was reduced. The population, after all exclusions, corresponded to the population of students recorded on each country’s school sampling frame. Exclusions were often proposed for practical reasons such as increased survey costs or complexity in the sample design and/or difficult test conditions. These difficulties were mainly addressed by modifying the sample design to reduce the number of such schools selected rather than to exclude them. Schools with students that would all be excluded through the within-school exclusion categories could be excluded up to a maximum of 2% as previously noted. Otherwise, countries were instructed to include the schools but to administer the PISA UH booklet, consisting of a subset of the PISA assessment items, deemed more suitable for students with special education needs.
Within participating schools, all PISA-eligible students (i.e. born within the defined time period and in grades 7 or higher) were to be listed. From this, either a sample of TCS students was randomly selected or all students were selected if there were fewer than TCS students. The lists had to include students deemed to meet any of the categories for exclusion, and a variable maintained to briefly describe the reason for exclusion. This made it possible to estimate the size of the within-school exclusions from the sample data.
It was understood that the exact extent of within-school exclusions would not be known until the within-school sampling data were returned from participating schools, and sampling weights computed. Participating country projections for within-school exclusions provided before school sampling were known to be estimates.
NPMs were made aware of the distinction between within-school exclusions and nonresponse. Students who could not take the PISA achievement tests because of a permanent condition were to be excluded and those with a temporary impairment at the time of testing, such as a broken arm, were treated as non-respondents along with other absent sampled students.
Exclusions by country are documented in Chapter 11.
The sampling frameAll NPMs were required to construct a school sampling frame to correspond to their national defined target population. The school sampling frame was defined by the School Sampling Preparation Manual 2 as a frame that would provide complete coverage of the national defined target population without being contaminated by incorrect or duplicate entries or entries referring to elements that were not part of the defined target population. It was expected that the school sampling frame would include any school that could have 15-year-old students, even those schools which might later be excluded, or deemed ineligible because they had no PISA-eligible students at the time of data collection. The quality of the sampling frame directly affects the survey results through the schools’ probabilities of selection and therefore their weights and the final survey estimates. NPMs were therefore advised to be diligent and thorough in constructing their school sampling frames.
All but one country used school-level sampling frames as their first stage of sample selection. The School Sampling Preparation Manual indicated that the quality of sampling frames for both two and three-stage designs would largely depend on the accuracy of the approximate enrolment of 15-year-olds available (ENR) for each first-stage sampling unit. A suitable ENR value was a critical component of the sampling frames since selection probabilities were based on it for both two and three-stage designs. The best ENR for PISA was the number of currently enrolled 15-year-old students. Current enrolment data, however, were rarely available at the time of school sampling, which meant using alternatives. Most countries used the first-listed available option from the following list of alternatives:
•student enrolment in the target age category (15-year-olds) from the most recent year of data available;
•if 15-year-olds tend to be enrolled in two or more grades, and the proportions of students who are aged 15 in each grade are approximately known, the 15-year-old enrolment can be estimated by applying these proportions to the corresponding grade-level enrolments;

4Sample deSign
PISA 2009 TECHNICAL REPORT – © OECD 2012 63
•the grade enrolment of the modal grade for 15-year-olds; and
•total student enrolment, divided by the number of grades in the school.
The School Sampling Preparation Manual noted that if reasonable estimates of ENR did not exist or if the available enrolment data were out of date, schools might have to be selected with equal probabilities which might require an increased school sample size. However, no countries needed to use this option.
Besides ENR values, NPMs were instructed that each school entry on the frame should include at minimum:
•school identification information, such as a unique numerical national identification, and contact information such as name, address and phone number; and
•coded information about the school, such as region of country, school type and extent of urbanisation, which could possibly be used as stratification variables.
As noted, a three-stage design and an area-level (geographic) sampling frame could be used where a comprehensive national list of schools was not available and could not be constructed without undue burden, or where the procedures for administering the test required that the schools be selected in geographic clusters. As a consequence, the area-level sampling frame introduced an additional stage of frame creation and sampling (first stage) before actually sampling schools (second stage with the third stage being students). Although generalities about three-stage sampling and using an area-level sampling frame were outlined in the School Sampling Preparation Manual (for example that there should be at least 80 first-stage units and at least 40 needed to be sampled), NPMs were also informed that the more detailed procedures outlined there for the general two-stage design could easily be adapted to the three-stage design. The NPM using a three-stage design was also asked to notify the PISA Consortium and received additional support in constructing and using an area-level sampling frame. The only country that used a three-stage design was the Russian Federation, where a national list of schools was not available. The use of the three-stage design allowed for school lists to be obtained only for those areas selected in stage one rather than for the entire country.
StratificationPrior to sampling, schools were to be ordered, or stratified, in the sampling frame. Stratification consists of classifying schools into like groups according to selected variables referred to as stratification variables. Stratification in PISA was used to:
•improve the efficiency of the sample design, thereby making the survey estimates more reliable;
•apply different sample designs, such as disproportionate sample allocations, to specific groups of schools, such as those in states, provinces, or other regions;
•ensure all parts of a population were included in the sample; and
•ensure adequate representation of specific groups of the target population in the sample.
There were two types of stratification utilised: explicit and implicit. Explicit stratification consists of grouping schools into strata that will be treated independently from one another or as if they were separate school sampling frames. Examples of explicit stratification variables could be states or regions of a country. Implicit stratification consists essentially of sorting the schools uniquely within each explicit stratum by a set of designated implicit stratification variables. Examples of implicit stratification variables could be type of school, urbanicity, or minority composition. This type of stratification is a way of ensuring a strictly proportional sample allocation of schools across all implicit strata. It can also lead to improved reliability of survey estimates, provided that the implicit stratification variables being considered are correlated with PISA achievement at the school level (Jaeger, 1984). Guidelines were provided in the School Sampling Preparation Manual on choosing stratification variables that would possibly improve the sampling.
Table 4.1 provides the explicit stratification variables used by each country, as well as the number of explicit strata found within each country. For example, Australia had eight explicit strata using states/territories which were then further delineated by three sectors and also had one explicit stratum for certain selections, so that there were 25 explicit strata in total. Variables used for implicit stratification and the respective number of levels can also be found in Table 4.1.
As countries were requested to sort the sampling frame by school size, school size was also an implicit stratification variable, though it is not listed in Table 4.1. The use of school size as an implicit stratification variable provides a degree of control over the student sample size so as to possibly avoid the sampling of too many relatively large schools or too many relatively small schools. A variable used for stratification purposes is not necessarily included in the PISA data files.

4Sample deSign
64 © OECD 2012 – PISA 2009 TECHNICAL REPORT
[Part 1/2]table 4.1 Stratification variables used in PiSa 2009
Explicit stratification variablesNumber of
explicit strata Implicit stratification variables
Albania Region (3); Urban/Rural (2); School Type (2);Certainty Selections
11 Public/Private (2); ISCED2/Mixed (2)
Argentina Area (5) 5 Public/Private (2); School Type (35); Location (3); Orientation (3)
Australia State/Territory (8); Sector (3); Certainty Selections 25 Geographic Zone (3); School Gender Composition (3); SEIFA (10)
Austria Region (3); School Type (17); Certainty Selections 32 Province (7); School Type (17); Percentage of Girls (5)
Azerbaijan School Type (4); Ministry Type (2); Public/Private (2); Language (2); Certainty Selections
14 Urbanicity (4); Education Department or Private (5); Region/District/City (77)
Belgium Region (3); Form of Education - Flanders (5),French Community (3), German Community (2);Public/Private for Flanders (2)and French Community (4)
23 Flanders - ISCED (4); Retention Rate (5); Vocational/Special Education (2); Percentage of Girls (4); French Community - National/International School (2); Retention Rate (5); Vocational-Special Education/Other (2); German Community - Public/Private (2)
Brazil State (27); Grade 9 status (3); Certainty Selections 82 Maintenance (3); Urban/Rural (2); HDI Level (3)
Bulgaria Broad school type (3); Region (11) 32 Type of School (5); Size of Settlement(5); Funding (3)
Canada Province (10); Language (3); School Size (6); Certainty Selections
45 Public/Private (2); Urban/Rural/Unknown (3)
Chile Funding type (3); School level (3); School track (4) 18 % Girls (5); Urbanicity(2); Region (4)
Colombia Region (11); Certainty Selections 12 Urbanicity (2); Funding (2); Weekend school or not (2)
Croatia Dominant Programme Type (6); Certainty Selections 7 Urbanicity (3); County (21)
Czech Republic Programmes (6); Region for Programmes 1 and 2 (14); School Size (4)
78 Region for Programmes 3, 4, 5, 6 (14); School Gender Composition for Programmes 4 and 5 (3)
Denmark Minority Enrollment (4); Certainty Selections 5 School Type (5); Region (5)
Dubai (UAE) Curriculum (7); Funding (2); Language (2) 9 School Level (3); School Gender (3)
Estonia Language (3); Certainty Selections 4 School Type (3); Urbanicity (2); County (15)
Finland Region (5); Urban/Rural (2); Language (3);School Types (5)
12 School Type (5)
France School Type (4); School Size (3) 6 None
Germany School Type (3); State (16) 18 Schulart/School Type (7)
Greece Region (14); Public/Private (2); Evening Schools (1) 17 School Type (3); Public/Private (2) for Evening Schools Stratum
Hong Kong-China Funding (4) 4 Student Academic Intake (4)
Hungary School Type (4) 4 Region (7); Reading Performance (5)
Iceland Region (9) 9 School Size (4)
Indonesia Indonesia (1) 1 Province (28); Funding (2); School Type and Level (5); Criteria (3)
Ireland School Type (3); School Size (3) 9 Socio-Economic Status Category (4); School Gender Composition Category (4)
Israel School Type (2); Language (2); School Orientation (3); Subsectors for Arabic (3); Gender (3)
11 Group Size (2); SES (3); District (6)
Italy Region (21); Study Programme (5); Certainty Selections 99 Public/Private (2)
Japan Public/Private (2); School Type (2) 4 Levels of proportion of students taking University/College Entrance Exams (4)
Jordan School Type / Funding (4) 4 Location (2); Gender (3); Level (2); Shift (2)
Kazakhastan Region (16); Language (3) 48 Location (2); Level (3); Programme (2); Funding (2)
Korea School Level (2); School Type for Upper Secondary (2) 3 Urbanicity Level (3); School Gender Composition (3)
Kyrgyzstan Region (9); Urbanicity (3) 17 Language (7); Type and Level of School (5)

4Sample deSign
PISA 2009 TECHNICAL REPORT – © OECD 2012 65
[Part 2/2]table 4.1 Stratification variables used in PiSa 2009
Explicit stratification variablesNumber of
explicit strata Implicit stratification variables
Latvia Urbanicity (4); Certainty Selections 5 School Type and Level (6)
Liechtenstein Liechtenstein (1) 1 Funding (2)
Lithuania Location (4); School Type (4) 16 Funding (2)
Luxembourg School Type (6) 6 School Gender Composition (2)
Macao-China School Type (3); Programme (2); Language (5) 10 School Orientation (2); Gender (3)
Mexico State (32); School Size (3); Certainty Selections 97 School Level (2); School Programme (7); Public/Private (2); Urban/Rural (2)
Montenegro School Type (4); Region (3) 11 None
Netherlands Limburg/Rest of Netherlands (2); Netherlands School Track (2)
4 Programme Category (6)
New Zealand Certainty/Non-Certainty (2) 2 Socio-Economic Status Category (3); Public/Private (2); School Gender Composition (3); Urban/Rural (2)
Norway School Level (3) 3 None
Panama Urbanicity (2); Funding (2); Certainty Selections 4 Region (12); Orientation (2)
Peru Funding (2); Urbanicity (2) 4 Region (26); Gender (3); School Type (4)
Poland School Type (3); Public/Private (2) for Gymnasia 4 School Subtype (5); Public/Private (3) for Lycea and Vocational Schools; Locality (4)
Portugal Geographic Region (30); Certainty Selections 31 Island (10); ISCED (3); Public/Private (2); Urbanicity (3)
Qatar School Type (8) 8 Gender (3); Level (5); Funding (2)
Romania Programme (3) 3 Language (3); Urbanicity (2)
Russian Federation Region (45) 45 Location (9); School Type (8); School Sub-type (5);
Serbia Region (8); School Type (8);Certainty Selections 58 None
Shanghai-China School Level (3); Programme (2); Selectivity (2); Certainty Selections
7 Track (2); Funding (2); Location (2)
Singapore Funding (2); Level (2); Certainty Selections 4 Gender (3)
Slovak Republic Region (8); School Type (3) 24 Programme (9); Language (3); Grade Repetition Level (112)
Slovenia Programme and Level (7) 7 Location (5)
Spain Region (18); Public/Private (2); Teaching Modality for Basque (3); Certainty Selections
41 Postal Code for all
Sweden Public/Private (2); School Level (2); Urbanicity (5) for Lower Secondary Schools
12 Geographic LAN (21) for Upper Secondary schools; School Type (3)for Upper Secondary schools; Income Quartiles (4) for Lower Secondary schools
Switzerland School has Grade 9 or not (2); Language (3); Canton for adjudicated regions with Grade 9 oversample/Rest of Switzerland (13); Public/Private (3); School Type (4) within Upper Secondary schools; Certainty Selections
30 School Type (29)
Chinese Taipei School type (7); Funding (2); Location (2); Certainty Selections
29 County/City area (25); School Gender (3)
Thailand Administration (6); School Type (3); Certainty Selections 15 Local area (9)
Trinidad and Tobago Districts (8); Management (3) 23 Gender (3); Programme (2); Level (2); Location (2)
Tunisia Geographical Area (4); Level (3); Funding (2) 16 % Repeaters (3)
Turkey Region (12); Programme (3) 36 Turkey School Type (17); Urban/Rural (2); Public/Private (2)
United Kingdom Country (4); School Type (3) for England, Northern Ireland, and Wales; Region -- England (4), Northern Ireland (5), Wales (3); Certainty Selections;Scotland -- School Attainment Level (6)
36 England -- School Attainment Level (6); School Gender Composition (3); Local Authority; Northern Ireland -- School Gender Composition (3); Wales -- School Gender Composition (3); Local Authority;Scotland -- Area Type (6)
United States Public/Private (2); Region (4) 8 Grade Span (5); Urbanicity (4); Minority Status (2); 3-digit Postal Code
Uruguay Funding (2); School Type (3); Region (7); Certainty Selections
22 Level (3); Evening Shift/Not (2)

4Sample deSign
66 © OECD 2012 – PISA 2009 TECHNICAL REPORT
Assigning a measure of size to each schoolFor the probability proportional to size sampling method used for PISA, a Measure of Size (MOS) derived from ENR was established for each school on the sampling frame. MOS was constructed as: MOS = max(ENR, TCS).
Thus, the measure of size was equal to the enrolment estimate (ENR), unless enrolment was less than the TCS, in which case the measure of size was set equal to the target cluster size. In most countries, the MOS was equal to ENR or 35 students, whichever was larger.
As schools were sampled with probability proportional to size, setting the measure of size of small schools to 35 students was equivalent to drawing a simple random sample of small schools. That is, small schools had an equally likely chance of being selected to participate.
School sample selection
School sample allocation over explicit strataThe total number of schools to be sampled in each country needed to be allocated among the explicit strata so that the expected proportion of students in the sample from each explicit stratum was approximately the same as the population proportions of PISA-eligible students in each corresponding explicit stratum. There were two exceptions. If very small schools required under-sampling, students in them had smaller percentages in the sample than in the population. To compensate for the resulting loss of sample, the large schools had slightly higher percentages in the sample than the corresponding population percentages. The other exception occurred if only one school was allocated to any explicit stratum. In this case, two schools were allocated for selection in the stratum to aid with variance estimation.
Sorting the sampling frameThe School Sampling Preparation Manual indicated that, prior to selecting schools, schools in each explicit stratum were to be sorted by variables chosen for implicit stratification and finally by the ENR value within each implicit stratum. The schools were first to be sorted by the first implicit stratification variable, then by the second implicit stratification variable within the levels of the first implicit stratification variable, and so on, until all implicit stratification variables were used. This gave a cross-classification structure of cells, where each cell represented one implicit stratum on the school sampling frame. The sort order was alternated between implicit strata, from high to low and then low to high, etc., through all implicit strata within an explicit stratum.
Determining which schools to sampleThe PPS-systematic sampling method used in PISA first required the computation of a sampling interval for each explicit stratum. This calculation involved the following steps:
•recording the total measure of size, S, for all schools in the sampling frame for each specified explicit stratum;
•recording the number of schools, D, to be sampled from the specified explicit stratum, which was the number allocated to the explicit stratum;
•calculating the sampling interval, I, as follows: I = S/D; and
•recording the sampling interval, I, to four decimal places.
Next, a random number had to be generated for each explicit stratum. The generated random number (RN) was from a uniform distribution between zero and one and was to be recorded to four decimal places.
The next step in the PPS selection method in each explicit stratum was to calculate selection numbers – one for each of the D schools to be selected in the explicit stratum. Selection numbers were obtained using the following method:
•Obtaining the first selection number by multiplying the sampling interval, I, by the random number, RN. This first selection number was used to identify the first sampled school in the specified explicit stratum.
•Obtaining the second selection number by adding the sampling interval, I, to the first selection number. The second selection number was used to identify the second sampled school.
•Continuing to add the sampling interval, I, to the previous selection number to obtain the next selection number. This was done until all specified line numbers (1 through D) had been assigned a selection number.
Thus, the first selection number in an explicit stratum was RN x I, the second selection number was (RN x I) + I, the third selection number was (RN x I) + I + I, and so on.
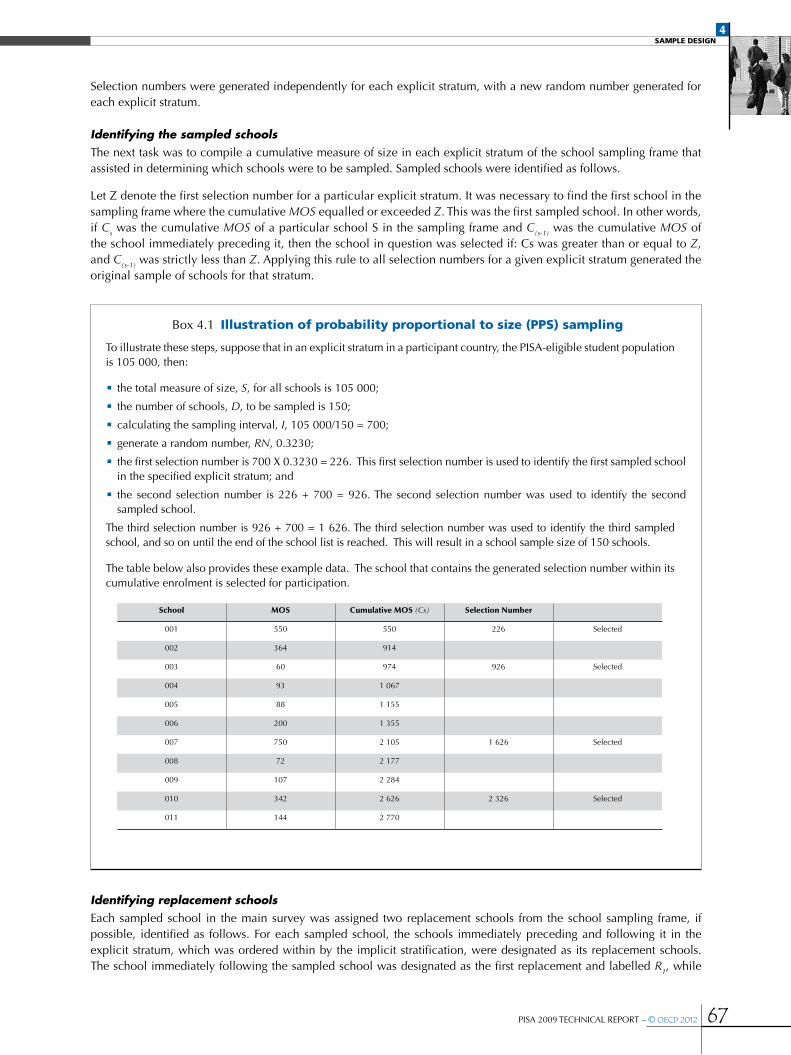
4Sample deSign
PISA 2009 TECHNICAL REPORT – © OECD 2012 67
Selection numbers were generated independently for each explicit stratum, with a new random number generated for each explicit stratum.
Identifying the sampled schoolsThe next task was to compile a cumulative measure of size in each explicit stratum of the school sampling frame that assisted in determining which schools were to be sampled. Sampled schools were identified as follows.
Let Z denote the first selection number for a particular explicit stratum. It was necessary to find the first school in the sampling frame where the cumulative MOS equalled or exceeded Z. This was the first sampled school. In other words, if Cs was the cumulative MOS of a particular school S in the sampling frame and C(s-1) was the cumulative MOS of the school immediately preceding it, then the school in question was selected if: Cs was greater than or equal to Z, and C(s-1) was strictly less than Z. Applying this rule to all selection numbers for a given explicit stratum generated the original sample of schools for that stratum.
Box 4.1 illustration of probability proportional to size (PPS) sampling
To illustrate these steps, suppose that in an explicit stratum in a participant country, the PISA-eligible student population is 105 000, then:
•the total measure of size, S, for all schools is 105 000;
•the number of schools, D, to be sampled is 150;
•calculating the sampling interval, I, 105 000/150 = 700;
•generate a random number, RN, 0.3230;
•the first selection number is 700 X 0.3230 = 226. This first selection number is used to identify the first sampled school in the specified explicit stratum; and
•the second selection number is 226 + 700 = 926. The second selection number was used to identify the second sampled school.
The third selection number is 926 + 700 = 1 626. The third selection number was used to identify the third sampled school, and so on until the end of the school list is reached. This will result in a school sample size of 150 schools.
The table below also provides these example data. The school that contains the generated selection number within its cumulative enrolment is selected for participation.
School MOS Cumulative MOS (Cs) Selection Number
001 550 550 226 Selected
002 364 914
003 60 974 926 Selected
004 93 1 067
005 88 1 155
006 200 1 355
007 750 2 105 1 626 Selected
008 72 2 177
009 107 2 284
010 342 2 626 2 326 Selected
011 144 2 770
Identifying replacement schoolsEach sampled school in the main survey was assigned two replacement schools from the school sampling frame, if possible, identified as follows. For each sampled school, the schools immediately preceding and following it in the explicit stratum, which was ordered within by the implicit stratification, were designated as its replacement schools. The school immediately following the sampled school was designated as the first replacement and labelled R1, while

4Sample deSign
68 © OECD 2012 – PISA 2009 TECHNICAL REPORT
the school immediately preceding the sampled school was designated as the second replacement and labelled R2. The School Sampling Preparation Manual noted that in small countries, there could be problems when trying to identify two replacement schools for each sampled school. In such cases, a replacement school was allowed to be the potential replacement for two sampled schools (a first replacement for the preceding school, and a second replacement for the following school), but an actual replacement for only one school. Additionally, it may have been difficult to assign replacement schools for some very large sampled schools because the sampled schools appeared close to each other in the sampling frame. There were times when it was only possible to assign a single replacement school, or even none, when two consecutive schools in the sampling frame were sampled. That is, no unsampled schools existed between sampled schools.
Exceptions were allowed if a sampled school happened to be the last school listed in an explicit stratum. In this case the two schools immediately preceding it were designated as replacement schools. Similarly, for the first school listed in an explicit stratum, in which case the two schools immediately following it were designated as replacement schools.
Assigning school identifiersTo keep track of sampled and replacement schools in the PISA database, each was assigned a unique, three-digit school code and two-digit stratum code (corresponding to the explicit strata) sequentially numbered starting with one within each explicit stratum. For example, if 150 schools are sampled from a single explicit stratum, they are assigned identifiers from 001 to 150. First replacement schools in the main survey are assigned the school identifier of their corresponding sampled schools, incremented by 300. For example, the first replacement school for sampled school 023 is assigned school identifier 323. Second replacement schools in the main survey are assigned the school identifier of their corresponding sampled schools, but incremented by 600. For example, the second replacement school for sampled school 136 took the school identifier 736.
Tracking sampled schoolsNPMs were encouraged to make every effort to confirm the participation of as many sampled schools as possible to minimise the potential for non-response biases. They contacted replacement schools after all contacts with sampled schools were made. Each sampled school that did not participate was replaced if possible. If both an original school and a replacement participated, only the data from the original school were included in the weighted data provided that at least 50% of the PISA-eligible, non-excluded students had participated. If this was not the case, it was permissible for the original school to be labelled as a nonrespondent and the replacement school as the respondent, provided that the replacement school had at least 50% of the PISA-eligible, non-excluded students as participants.
Special school sampling situations
Treatment of small schools In PISA, schools were classified as very small, moderately small or large. A school was classified as large if it had an ENR above the TCS (35 students in most countries). A moderately small school had an ENR in the range of one-half the TCS to TCS (18 to 35 students in most countries). A very small school had an ENR less than one-half the TCS (17 students or fewer in most countries). Unless they received special treatment in the sampling, the occurrence of small schools in the sample will reduce the sample size of students for the national sample to below the desired target because the within-school sample size would fall short of expectations. A sample with many small schools could also be an administrative burden with many testing sessions with few students. To minimise these problems, procedures were devised for managing small schools in the sampling frame.
To balance the two objectives of selecting an adequate sample of small schools but not too many small schools so as to hurt student yield, a procedure was recommended that assumed the underlying idea of under-sampling the very small schools by a factor of two and to proportionally increasing the number of large schools to sample. Rather than create a stratum for very small schools and/or a stratum for moderately small schools for PISA 2009, the number of very small schools was controlled in the sample by assigning a measure of size to these schools equal to the . In effect, they were under-sampled by a factor of two (school probability of selection reduced by half), without explicitly stratifying them. This was accomplished as follows.
The sample had to be proportional to the number of students in the participating country and not to the number of schools. Suppose that 10% of students attend moderately small schools, 10% very small schools and the remaining 80% attend large schools. In the sample of 5 250, 4 200 students would be expected to come from large schools (i.e. 120 schools with 35 students), 525 students from moderately small schools and 525 students from very small schools.

4Sample deSign
PISA 2009 TECHNICAL REPORT – © OECD 2012 69
If moderately small schools had an average of 25 students, then it would be necessary to include 21 moderately small schools in the sample. If the average size of very small schools was 10 students, then 52 very small schools would be needed in the sample and the school sample size would be equal to 193 schools rather than 150.
The formulae below assume a target school sample size of 150 and a target student sample size of 5 250.
•Step 1: From the complete sampling frame, find the proportions of total ENR that come from very small schools (P), moderately small schools (Q), and large schools (R). Thus,
•Step 2: Calculate the value L, where L= 1.0 + (P/2). Thus L is a positive number slightly more than 1.0.
•Step 3: The minimum sample size for large schools is equal to 150 × R × L, rounded to the nearest integer. It may need to be enlarged because of national considerations, such as the need to achieve minimum sample sizes for geographic regions or certain school types.
•Step 4: Calculate the mean value of ENR for moderately small schools (MENR), and for very small schools (VENR). MENR is a number in the range of TCS/2 to TCS, and VENR is a number no greater than TCS/2.
•Step 5: The number of schools that must be sampled from the moderately small schools is given by: (5 250 × Q × L)/(MENR).
•Step 6: The number of schools that must be sampled from the very small schools is given by: (2 625 × P × L)/(VENR).
To illustrate the steps, suppose that in a participant country, the TCS is equal to 35 students, with 10% of the total enrolment of 15-year-olds each in moderately small schools and in very small schools. Suppose that the average enrolment in moderately small schools is 25 students, and in very small schools it is 10 students.
•Step 1: The proportions of total ENR from very small schools is P = 0.1, moderately small schools is Q = 0.1, and large schools is R = 0.8. It can be shown that 0.1 + 0.1 + 0.8 = 1.0.
•Step 2: Calculate the value L. L = 1.0 + (0.1/2). Thus L = 1.05.
•Step 3: The minimum sample size for large schools is equal to 150 × 0.8 × 1.05 = 126. That is, at least 126 of the large schools must be sampled.
•Step 4: The mean value of ENR for moderately small schools (MENR) is given in this example as 25, and for very small schools (VENR) as 10.
•Step 5: The number of schools that must be sampled from the moderately small schools is given by (5 250 × 0.1 × 1.05)/25 = 22.1. At least 22 (rounded to the nearest integer) moderately small schools must be sampled.
•Step 6: The number of schools that must be sampled from the very small schools is given by (2 625 × 0.1 × 1.05)/10 = 27.6. At least 28 (rounded to the nearest integer) very small schools must be sampled.
Combining these different sized school samples gives a total sample size of 126 + 22 + 28 = 176 schools, rather than just 150, or 193 as calculated above. Before considering school and student non-response, the larger schools will yield an initial sample of approximately 126 x 35 = 4 410 students. The moderately small schools will give an initial sample of approximately 22 x 25 = 550 students, and very small schools will give an initial sample size of approximately 28 x 10 = 280 students. The total initial sample size of students is therefore 4 410 + 550 + 280 = 5 240.
This procedure, called small school analysis, was done not just for the entire school sampling frame, but new for 2009 for each individual explicit stratum. An initial allocation of schools to explicit strata provided the starting number of schools and students to project for sampling in each explicit stratum. The small school analysis for a single unique explicit stratum indicated how many very small schools (assuming under-sampling by 2, if needed), moderately small schools and large schools would be sampled in that stratum. Together, these provided the final sample size, n, of schools to select in the stratum. Based on the stratum sampling interval and random start, large, moderately small, and very small schools were sampled in the stratum, to a total of n sampled schools. Because of the random start, it was possible to have more or less than expected of the very small schools, of the moderately small schools, and of the large schools. The total number of sampled schools however was fixed at n, and the number of expected students to be sampled was always approximate to what had been projected from the unique stratum small school analysis.
Sampling for the Digital Reading Assessment (DRA) component
Nineteen countries and economies participated in the Digital Reading Assessment (DRA): Australia, Austria, Belgium,
Chile, Colombia, Denmark, France, Hong Kong-China, Hungary, Iceland, Ireland, Japan, Korea, Macao-China, New Zealand, Norway, Poland, Spain and Sweden. When a country participated in DRA, it was expected that DRA student sampling would occur in every PISA sampled and participating school.

4Sample deSign
70 © OECD 2012 – PISA 2009 TECHNICAL REPORT
The overall sample size requirement was 1 200 assessed DRA students. The recommended DRA Target Cluster Size (DTCS) was 14 students per sampled school. While 14 students for each of the 150 schools (the typical number of PISA schools per participating country) would potentially yield 2 100 students, the large DTCS was chosen to account for the fact that some schools would not have adequate computer resources. The DTCS of 14 students also accounted for the loss in the DRA sample that would accrue from prior losses in the PISA sample. It was a requirement that all DRA students also participate in the main paper-based PISA assessment. The DRA student sample was selected at the same time that the PISA student sample was selected in each school by the student sampling software, KeyQuest. Therefore, any PISA student also sampled for DRA who did not participate in paper-based PISA assessment was an automatic loss for the DRA student sample. There would also be additional loss for DRA due to refusals, or other absences. Setting the DTCS at 14 students guarded against these losses. It was possible to vary the DTCS if more than the usual number of schools were sampled for PISA.
The actual DRA student sample size at each school was calculated with KeyQuest, as the minimum of the DTCS, and the number of sampled PISA students. Arrangements had to be made at the school level to either bring in laptops, or to have extra sessions to alleviate any computer resource problems.
If a country had a large PISA school sample and wished to subsample the PISA sampled schools where DRA student sampling would be done, this became an additional national option. Only two DRA countries, Colombia and Spain, chose to have schools subsampled for DRA from their large national school sample.
The schools for DRA were subsampled with equal probability from sampled schools in each explicit stratum. The number to subsample for DRA in each stratum was based on how many schools would have been needed from each explicit stratum for a school sample of 150 schools. Any schools selected with certainty for the large national school sample and placed in their own stratum, were added back to their original strata for the subsampling of DRA schools.
PISA and ICCS overlap controlThe main studies for PISA 2009 and the 2009 International Civic and Citizenship Education Study (ICCS) were to occur at approximately the same time in some participating countries. Because of the potential for increased burden, an overlap control procedure was used for twelve countries (Belgium [Flemish], England and Northern Ireland from the United Kingdom, Finland, Ireland, Latvia, the Netherlands, New Zealand, Norway, the Slovak Republic, Sweden and Chinese Taipei) who requested for there to be a minimum incidence of the same schools being sampled for both PISA and ICCS. This overlap control procedure required that the same school identifiers be used on the PISA and ICCS school frames for the schools in common across the two assessments.
The ICCS samples were usually selected before the PISA samples. Thus, for countries requesting overlap control, the ICCS International Study Centre supplied the PISA Consortium with their school frames, school IDs, each school’s probability of selection, and an indicator showing which schools had been sampled for the ICCS study.
Sample selections for PISA and ICCS could totally avoid overlap of schools if schools which would have been selected with high probability for either study had their selection probabilities capped at 0.5. Such an action would make each study’s sample slightly less than optimal, but this might be deemed acceptable when weighed against the possibility of low response rates due to the burden of participating in two assessments. This was requested only by Ireland. In the other countries, if any schools had probabilities of selection greater than 0.5 on either study frame, these schools had the possibility to be selected to be in both studies.
To control overlap of schools between PISA and ICCS, the sample selection of schools for PISA adopted a modification of an approach due to Keyfitz (1951), based on Bayes Theorem. To use PISA and ICCS in an example of the overlap control approach, suppose that PROBP is the PISA probability of selection and PROBI is the ICCS probability of selection. Then a conditional probability of a school’s selection into PISA (CPROB) is determined as follows:
max PROBI + PROBP – 1
PROBP
PROBI0, if the school was an ICCS school
min if the school was not an ICCS school (1)CPROB =
PROBP if the school was not an ICCS eligible school
( 1 – PROBI )1,
4.1

4Sample deSign
PISA 2009 TECHNICAL REPORT – © OECD 2012 71
Then a conditional CMOS variable was created to coincide with these conditional probabilities as follows:
CMOS = CPROB x stratum sampling interval
The PISA school sample was then selected using the line numbers created as usual (see earlier section), but applied to the cumulated CMOS values (as opposed to the cumulated MOS values). Note that it was possible that the resulting PISA sample size could be slightly lower or higher than the originally assigned PISA sample size, but this was deemed acceptable.
Luxembourg also requested to have minimal overlap with ICCS but since a census of PISA students is usually taken, this presented a unique challenge. It was agreed that although ICCS usually sampled grade 8 classes, grade 8 students of PISA age would be listed and ICCS would take half of the students for their study while PISA would take the other half of students for their study.
Monitoring school samplingFor PISA 2009, as in the previous two cycles, it was a strong recommendation that the PISA Consortium select the school samples rather than the participating countries. This was incorporated into the 2009 procedures to alleviate the weighting difficulties caused by receiving school sampling frame files in many different formats. Japan was the only participant that selected their own school sample, doing so for reasons of confidentiality.
Sample selection for Japan was replicated by the PISA Consortium to ensure quality in this case. All other participating countries school samples were selected by and checked in detail by the PISA Consortium. To enable this, all countries were required to submit sampling information on forms associated with the following various sampling tasks:
•time of testing and age definition for both the field trial and main study were captured on Sampling Task 1 at the time of the field trial, with updates being possible before the main study;
•information about stratification for the field trial and for the main study was recorded on Sampling Task 2;
•forms or data associated with Sampling Tasks 3, 4, 5 and 6 were all for the field trial;
•the national desired target population information for the main study was captured on the form associated with Sampling Task 7a;
•information about the defined national target population was recorded on the form associated with Sampling Task 7b;
•the description of the sampling frame was noted on the form associated with Sampling Task 8a; and
•the school sampling frame was created in one spreadsheet and the list of any excluded schools in a second spreadsheet associated with Sampling Task 8b.
The PISA Consortium completed and returned other information (small school analyses, school allocation, and sample selection) along with a spreadsheet that countries could use for tracking school participation. In some cases, countries also submitted other sets of information for approval. Table 4.2 provides a summary of the information required for each sampling task and the timetables (which depended on national assessment periods).
Once received from each participating country, each set of information was reviewed and feedback was provided to the country. Forms were only approved after all criteria were met. Approval of deviations was only given after discussion and agreement by the PISA Consortium. In cases where approval could not be granted, countries were asked to make revisions to their sample design and sampling forms and resubmit.
Checks that were performed in the monitoring of each set of information follow. All entries were observed in their own right but those below were additional matters explicitly examined.
As part of the initial pre-form checks, all special situations known about the participating country were verified with the country. Such special situations included, TCS values different from 35 students, whether or not the Digital Reading Assessment was being conducted, whether or not overlap control procedures with ICCS were required, whether or not there was any regional or other type of oversampling, whether or not the UH booklet would be used, and whether or not any grade or other type of student sampling would be used. Additionally, any countries with fewer than 4 500 or just over 4 500 assessed students in either PISA 2003 or 2006 had increased school sample sizes discussed and agreed upon. Finally, any countries with effective student sample sizes less than 400 in PISA 2006 also had increased school sample sizes discussed and agreed upon.
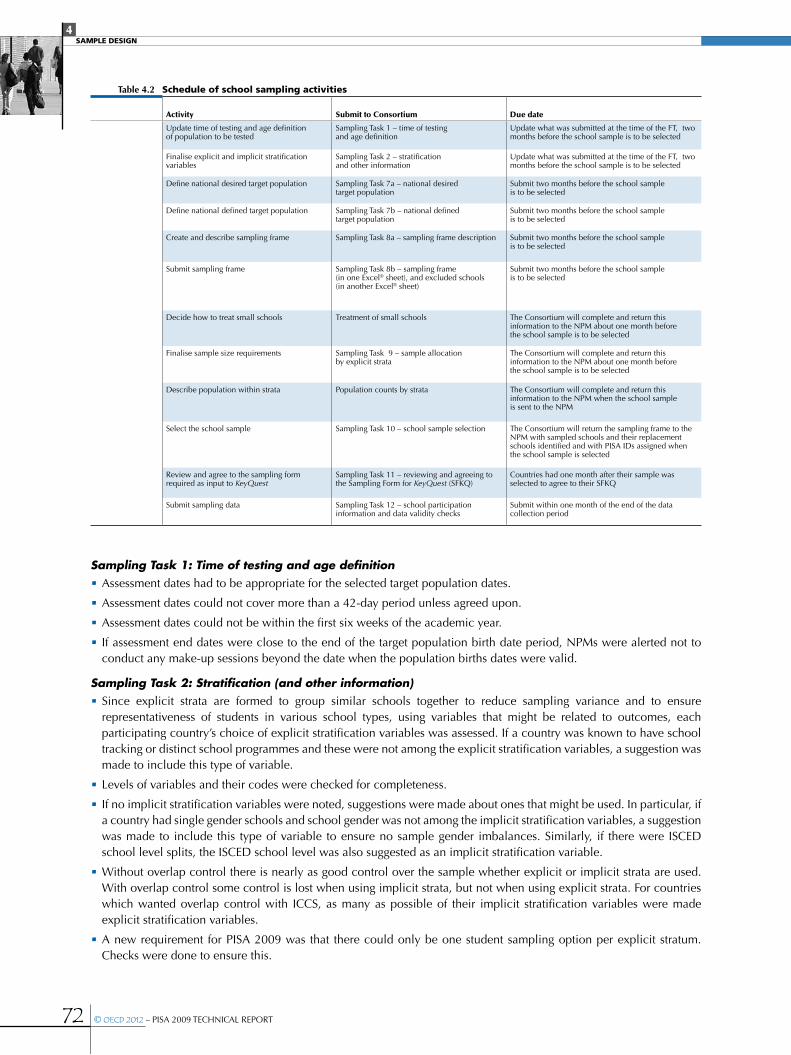
4Sample deSign
72 © OECD 2012 – PISA 2009 TECHNICAL REPORT
table 4.2 Schedule of school sampling activities
Activity Submit to Consortium Due date
Update time of testing and age definitionof population to be tested
Sampling Task 1 – time of testingand age definition
Update what was submitted at the time of the FT, two months before the school sample is to be selected
Finalise explicit and implicit stratification variables
Sampling Task 2 – stratificationand other information
Update what was submitted at the time of the FT, two months before the school sample is to be selected
Define national desired target population Sampling Task 7a – national desiredtarget population
Submit two months before the school sampleis to be selected
Define national defined target population Sampling Task 7b – national definedtarget population
Submit two months before the school sampleis to be selected
Create and describe sampling frame Sampling Task 8a – sampling frame description Submit two months before the school sampleis to be selected
Submit sampling frame Sampling Task 8b – sampling frame(in one Excel® sheet), and excluded schools(in another Excel® sheet)
Submit two months before the school sampleis to be selected
Decide how to treat small schools Treatment of small schools The Consortium will complete and return this information to the NPM about one month beforethe school sample is to be selected
Finalise sample size requirements Sampling Task 9 – sample allocationby explicit strata
The Consortium will complete and return this information to the NPM about one month beforethe school sample is to be selected
Describe population within strata Population counts by strata The Consortium will complete and return this information to the NPM when the school sampleis sent to the NPM
Select the school sample Sampling Task 10 – school sample selection The Consortium will return the sampling frame to the NPM with sampled schools and their replacement schools identified and with PISA IDs assigned when the school sample is selected
Review and agree to the sampling form required as input to KeyQuest
Sampling Task 11 – reviewing and agreeing to the Sampling Form for KeyQuest (SFKQ)
Countries had one month after their sample was selected to agree to their SFKQ
Submit sampling data Sampling Task 12 – school participation information and data validity checks
Submit within one month of the end of the data collection period
Sampling Task 1: Time of testing and age definition•Assessment dates had to be appropriate for the selected target population dates.
•Assessment dates could not cover more than a 42-day period unless agreed upon.
•Assessment dates could not be within the first six weeks of the academic year.
•If assessment end dates were close to the end of the target population birth date period, NPMs were alerted not to conduct any make-up sessions beyond the date when the population births dates were valid.
Sampling Task 2: Stratification (and other information)•Since explicit strata are formed to group similar schools together to reduce sampling variance and to ensure
representativeness of students in various school types, using variables that might be related to outcomes, each participating country’s choice of explicit stratification variables was assessed. If a country was known to have school tracking or distinct school programmes and these were not among the explicit stratification variables, a suggestion was made to include this type of variable.
•Levels of variables and their codes were checked for completeness.
•If no implicit stratification variables were noted, suggestions were made about ones that might be used. In particular, if a country had single gender schools and school gender was not among the implicit stratification variables, a suggestion was made to include this type of variable to ensure no sample gender imbalances. Similarly, if there were ISCED school level splits, the ISCED school level was also suggested as an implicit stratification variable.
•Without overlap control there is nearly as good control over the sample whether explicit or implicit strata are used. With overlap control some control is lost when using implicit strata, but not when using explicit strata. For countries which wanted overlap control with ICCS, as many as possible of their implicit stratification variables were made explicit stratification variables.
•A new requirement for PISA 2009 was that there could only be one student sampling option per explicit stratum. Checks were done to ensure this.
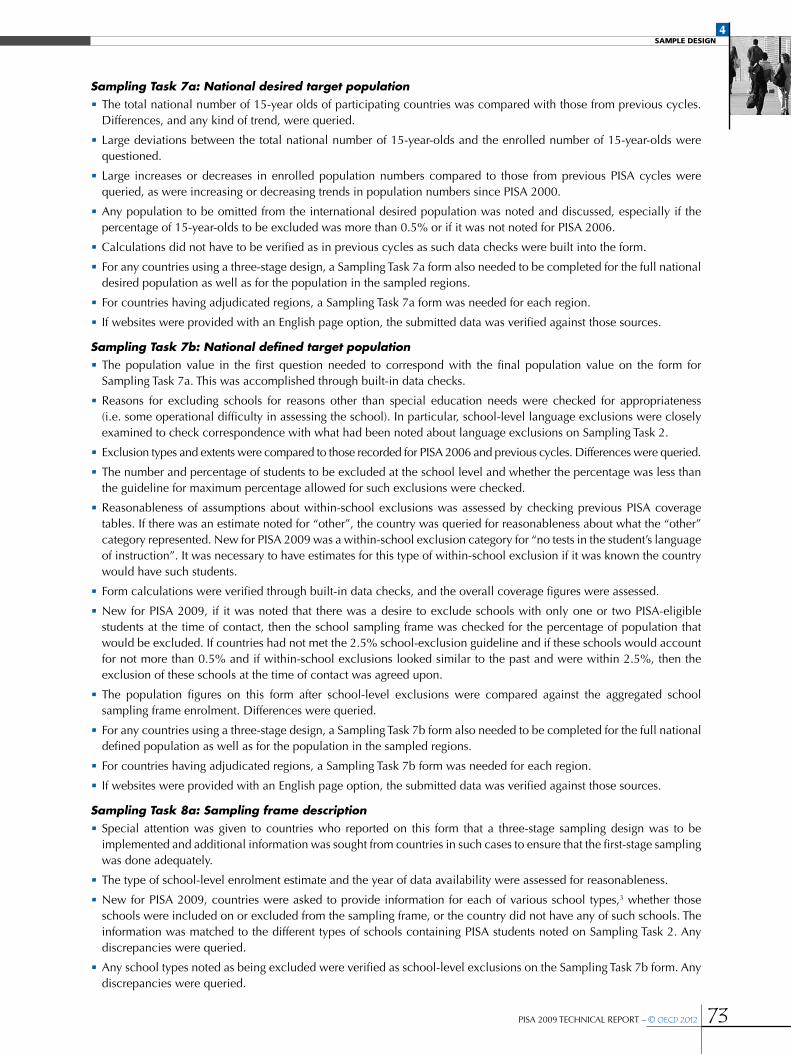
4Sample deSign
PISA 2009 TECHNICAL REPORT – © OECD 2012 73
Sampling Task 7a: National desired target population•The total national number of 15-year olds of participating countries was compared with those from previous cycles.
Differences, and any kind of trend, were queried.
•Large deviations between the total national number of 15-year-olds and the enrolled number of 15-year-olds were questioned.
•Large increases or decreases in enrolled population numbers compared to those from previous PISA cycles were queried, as were increasing or decreasing trends in population numbers since PISA 2000.
•Any population to be omitted from the international desired population was noted and discussed, especially if the percentage of 15-year-olds to be excluded was more than 0.5% or if it was not noted for PISA 2006.
•Calculations did not have to be verified as in previous cycles as such data checks were built into the form.
•For any countries using a three-stage design, a Sampling Task 7a form also needed to be completed for the full national desired population as well as for the population in the sampled regions.
•For countries having adjudicated regions, a Sampling Task 7a form was needed for each region.
•If websites were provided with an English page option, the submitted data was verified against those sources.
Sampling Task 7b: National defined target population•The population value in the first question needed to correspond with the final population value on the form for
Sampling Task 7a. This was accomplished through built-in data checks.
•Reasons for excluding schools for reasons other than special education needs were checked for appropriateness (i.e. some operational difficulty in assessing the school). In particular, school-level language exclusions were closely examined to check correspondence with what had been noted about language exclusions on Sampling Task 2.
•Exclusion types and extents were compared to those recorded for PISA 2006 and previous cycles. Differences were queried.
•The number and percentage of students to be excluded at the school level and whether the percentage was less than the guideline for maximum percentage allowed for such exclusions were checked.
•Reasonableness of assumptions about within-school exclusions was assessed by checking previous PISA coverage tables. If there was an estimate noted for “other”, the country was queried for reasonableness about what the “other” category represented. New for PISA 2009 was a within-school exclusion category for “no tests in the student’s language of instruction”. It was necessary to have estimates for this type of within-school exclusion if it was known the country would have such students.
•Form calculations were verified through built-in data checks, and the overall coverage figures were assessed.
•New for PISA 2009, if it was noted that there was a desire to exclude schools with only one or two PISA-eligible students at the time of contact, then the school sampling frame was checked for the percentage of population that would be excluded. If countries had not met the 2.5% school-exclusion guideline and if these schools would account for not more than 0.5% and if within-school exclusions looked similar to the past and were within 2.5%, then the exclusion of these schools at the time of contact was agreed upon.
•The population figures on this form after school-level exclusions were compared against the aggregated school sampling frame enrolment. Differences were queried.
•For any countries using a three-stage design, a Sampling Task 7b form also needed to be completed for the full national defined population as well as for the population in the sampled regions.
•For countries having adjudicated regions, a Sampling Task 7b form was needed for each region.
•If websites were provided with an English page option, the submitted data was verified against those sources.
Sampling Task 8a: Sampling frame description•Special attention was given to countries who reported on this form that a three-stage sampling design was to be
implemented and additional information was sought from countries in such cases to ensure that the first-stage sampling was done adequately.
•The type of school-level enrolment estimate and the year of data availability were assessed for reasonableness.
•New for PISA 2009, countries were asked to provide information for each of various school types,3 whether those schools were included on or excluded from the sampling frame, or the country did not have any of such schools. The information was matched to the different types of schools containing PISA students noted on Sampling Task 2. Any discrepancies were queried.
•Any school types noted as being excluded were verified as school-level exclusions on the Sampling Task 7b form. Any discrepancies were queried.

4Sample deSign
74 © OECD 2012 – PISA 2009 TECHNICAL REPORT
Sampling Task 8b: Sampling frame•On the spreadsheet for school-level exclusions, the number of schools and the total enrolment figures, as well as the
reasons for exclusion, were checked to ensure correspondence with values reported on the Sampling Task 7b form detailing school-level exclusions. It was verified that this list of excluded schools did not have any schools which only had one or two PISA-eligible students, as these schools were not to be excluded from the school sampling frame. Checks were done to ensure that excluded schools did not still appear on the other spreadsheet containing the school sampling frame.
•All units on the school sampling frame were confirmed to be those reported on the Sampling Task 2 as sampling frame units. The sampling unit frame number was compared to the corresponding frame for PISA 2006 as well as previous cycles. Differences were queried.
•NPMs were queried about whether or not they had included schools with grades 7 or 8, or in some cases those with grades 10 or higher, that could potentially have PISA-eligible students at the time of assessment even if the school currently did not have any.
•NPMs were queried about whether they had included vocational or apprenticeship schools, schools with only part-time students, international or foreign schools or schools not under the control of the Ministry of Education or any other irregular schools that could contain PISA-eligible students at the time of the assessment, even if such schools were not usually included in other national surveys.
•The frame was checked for all required variables: a national school identifier with no duplicated values, a variable containing the school enrolment of PISA-eligible students, and all the explicit and implicit stratification variables and all related levels as noted on Sampling Task 2, and that none had missing values.
•Any additional school sampling frame variables were assessed for usefulness. In some instances other variables were noted on the school frame that might also have been useful for stratification.
•The frame was checked for schools with only one or two PISA-eligible students. If no schools were found with extremely low counts, but the country’s previous sampling frames had some, this was queried.
•The frame was checked for schools with zero enrolment. If there were none, this was assessed for reasonableness. If some existed, it was verified with the NPM that these schools could possibly have PISA-eligible students at the time of the assessment.
Treatment of small schools•All calculations were verified.
•It was verified that separate small school analyses were done for adjudicated or non-adjudicated oversampled regions (if these were different from explicit strata).
Sampling Task 9: Sample allocation by explicit strata•All explicit strata had to be accounted for on the form for Sampling Task 9.
•All explicit strata population entries were compared to those determined from the sampling frame.
•The calculations for school allocation were checked to ensure that schools were allocated to explicit strata based on explicit stratum student percentages and not explicit stratum school percentages, that all explicit strata had at least two allocated schools, and that no explicit stratum had only one remaining non-sampled school.
• It was verified that the allocation matched the results of the explicit strata small school analyses, with allowances for random deviations in the numbers of very small, moderately small, and large schools to be sampled in each explicit stratum.
•The percentage of students in the sample for each explicit stratum had to be approximate to the percentage in the population for each stratum (except in the case of oversampling).
•The overall number of schools to be sampled was checked to ensure that at least 150 schools would be sampled.
•The overall number of students to be sampled was checked to ensure that at least 5 250 students would be sampled.
•Previous PISA response rates were reviewed and if deemed necessary, sample size increases were suggested.
Population counts by strata•Population counts by strata were compared to counts arising from the frame.
Sampling Task 10: School sample selection•All calculations were verified, including those needed for ICCS overlap control.
•Particular attention was paid to the required four decimal places for the sampling interval and the generated random number.

4Sample deSign
PISA 2009 TECHNICAL REPORT – © OECD 2012 75
•The frame was checked for proper sorting according to the implicit stratification scheme, for enrolment values, and the proper assignment of the measure of size value, especially for very small and moderately small schools. The assignment of replacement schools and PISA identification numbers were checked to ensure that all rules established in the Sampling Preparation Manual were adhered to.
Sampling Task 11: Reviewing and agreeing to the Sampling Form •The form for Sampling Task 11 was prepared as part of the sample selection process. After the PISA Consortium verified
that all entries were correct, NPMs had one month to perform the same checks and to agree to the content in this form.
Sampling Task 12: School participation and data validity checks•Extensive checks were completed on Sampling Task 12 data since it would inform the weighting process. Checks were
done to ensure that school participation statuses were valid, that student participation statuses had been correctly assigned, and that all student sampling data required for weighting were available and correct for all student sampling options. Quality checks also highlighted schools having only one grade with PISA-eligible students, only one gender of PISA-eligible students, or schools which had noticeable differences in enrolled student counts than expected based on sampling frame enrolment information. Such situations were queried.
•Large differences in overall grade and gender distributions compared to unweighted 2006 data were queried.
•These data also provided initial unweighted school and student response rates. Any potential response rate issues were discussed with NPMs if it seemed likely that a non-response bias report might be needed.
•Large differences in response rates compared to PISA 2006 were queried.
•Participating countries doing DRA were expected to have data for DRA related variables. Any expected DRA data entries were queried.
Student samplesStudent selection procedures in the main study were the same as those used in the field trial. Student sampling was generally undertaken using the PISA Consortium software, KeyQuest, at the national centres from lists of all PISA-eligible students in each school that had agreed to participate. These lists could have been prepared at national, regional, or local levels as data files, computer-generated listings, or by hand, depending on who had the most accurate information. Since it was important that the student sample be selected from accurate, complete lists, the lists needed to be prepared slightly in advance of the testing period and had to list all PISA-eligible students. It was suggested that the lists be received one to two months before the testing period so that the NPM would have adequate time to select the student samples.
Eight countries (Brazil, Chile, Germany, Iceland, Japan, Liechtenstein, Slovenia and Switzerland) chose student samples that included students aged 15 and/or enrolled in a specific grade (e.g. grade 10). Thus, a larger overall sample, including 15-year-old students and students in the designated grade (who may or may not have been aged 15) was selected. The necessary steps in selecting larger samples are noted where appropriate in the following details:
•Brazil, Iceland, Liechtenstein, Slovenia and Switzerland used the standard method of direct student sampling described here.
•For Iceland and Japan, the sample constituted a de facto grade sample because nearly all of the students in the grade to be sampled were PISA-eligible 15-year-olds.
•In the case of Iceland, the few additional grade 10 students in the country were added to the sample, so that there was a census of both PISA-eligible students and grade 10 students.
•Germany supplemented the standard sampling method with an additional sample of grade-eligible students which was selected by first selecting grade 9 classes within PISA sampled schools that had this grade.
•In Chile, the standard method was supplemented with additional grade-eligible students from a sample of grade 10 classes within PISA sampled schools that had this grade; Mexico also selected a grade 12 sample but accomplished this by having a completely separate sample of schools containing grade 12 students.
Preparing a list of age-eligible studentsEach school drawing an additional grade sample was to prepare a list of age and grade-eligible students that included all PISA-eligible students in the designated grade (e.g. grade 10); and all other 15-year-old students (using the appropriate 12-month age span agreed upon for each participating country) currently enrolled in other grades. This form was referred to as a student listing form. The following were considered important:
•Age-eligible students were all students born in 1993 (or the appropriate 12-month age span agreed upon for the participating country).

4Sample deSign
76 © OECD 2012 – PISA 2009 TECHNICAL REPORT
•The list was to include students who might not be tested due to a disability or limited language proficiency.
•Students who could not be tested were to be excluded from the assessment after the student sample was selected. It was stressed that students were to be excluded after the students sample was drawn, not prior.
•It was suggested that schools retain a copy of the student list in case the NPM had to contact the school with questions.
•Student lists were to be up-to-date at the time of sampling rather than a list prepared at the beginning of the school year. Students were identified by their unique student identification numbers.
Selecting the student sampleOnce NPMs received the list of PISA-eligible students from a school, the student sample was to be selected and the list of selected students (i.e. the student tracking form) returned to the school. NPMs were required to use KeyQuest, the PISA Consortium sampling software, to select the student samples unless otherwise agreed upon. Only Germany did not use the PISA Consortium software for selecting the student sample for reasons including extra student demographic data that could not fit in the available columns on the student tracking form produced by KeyQuest.
Preparing instructions for excluding studentsPISA was a timed assessment administered in the instructional language(s) of each participating country and designed to be as inclusive as possible. For students with limited assessment language(s) experience or with physical, mental, or emotional disabilities who could not participate, PISA developed instructions in cases of doubt about whether a selected student should be assessed. NPMs used the guidelines to develop any additional instructions; school co-ordinators and test administrators needed precise instructions for exclusions. The national operational definitions for within-school exclusions were to be clearly documented and submitted to the PISA Consortium for review before testing.
Sending the student tracking form to the school co-ordinator and test administratorThe school co-ordinator needed to know which students were sampled in order to notify students, parents and teachers to update information and to identify students to be excluded. The student tracking form was therefore sent approximately two weeks before the testing period. It was recommended that a copy of the tracking form be kept at the national centre and the NPM send a copy of the form to the test administrator in case the school copy was misplaced before the assessment day. The test administrator and school co-ordinator manuals (see Chapter 6) both assumed that each would have a copy.
In the interest of ensuring PISA was as inclusive as possible, student participation and reasons for exclusion were separately coded in the student tracking form. This allowed for students with Special Education Needs (SEN) to be included when their SEN was not severe enough to be a barrier to their participation. The participation status could therefore detail, for example, that a student participated and was not excluded for SEN reasons even though the student was noted with a special education need. Any student whose participation status indicated they were excluded for SEN reasons had to have an SEN code that explained the reason for exclusion. It was important that these criteria be followed strictly for the study to be comparable within and across participating countries. When in doubt, the student was included. The instructions for excluding students are provided in the PISA Technical Standards.
Definition of schoolAlthough the definition of a “school” is difficult, PISA generally aims to sample whole schools as the first stage units of selection, rather than programmes or tracks or shifts within schools, so that the meaning of “between school variance” is more comparable across countries.
There are exceptions to this, such as when school shifts are actually more like separate schools than part of the same overall school. However, in some countries with school shifts this is not the case and therefore whole schools are used as the primary sampling unit. Similarly, many countries have schools with different tracks/programs but generally it is recommended again that the school as a whole should be used as the primary sampling unit. There are some exceptions, such as the schools being split for sampling in previous PISA cycles (trends would be affected if the same practice was not continued), or if there is a good reason for doing so (such as to improve previously poor response rates, differential sampling of certain tracks or programs is desired, etc).
Sampling units to be used on school-level frames have been discussed with each country before the field trial. Table 4.3 presents the comments from NPMs, in cases where “school” was not the unit of sampling. Where the Sampling Unit column indicates SFRUNITS, this means that the school was the sampling unit. Where it shows SFRUNITO then something else was used, as described in the comments. Table 4.3 shows the extent to which countries do not select schools in PISA, but rather something else.
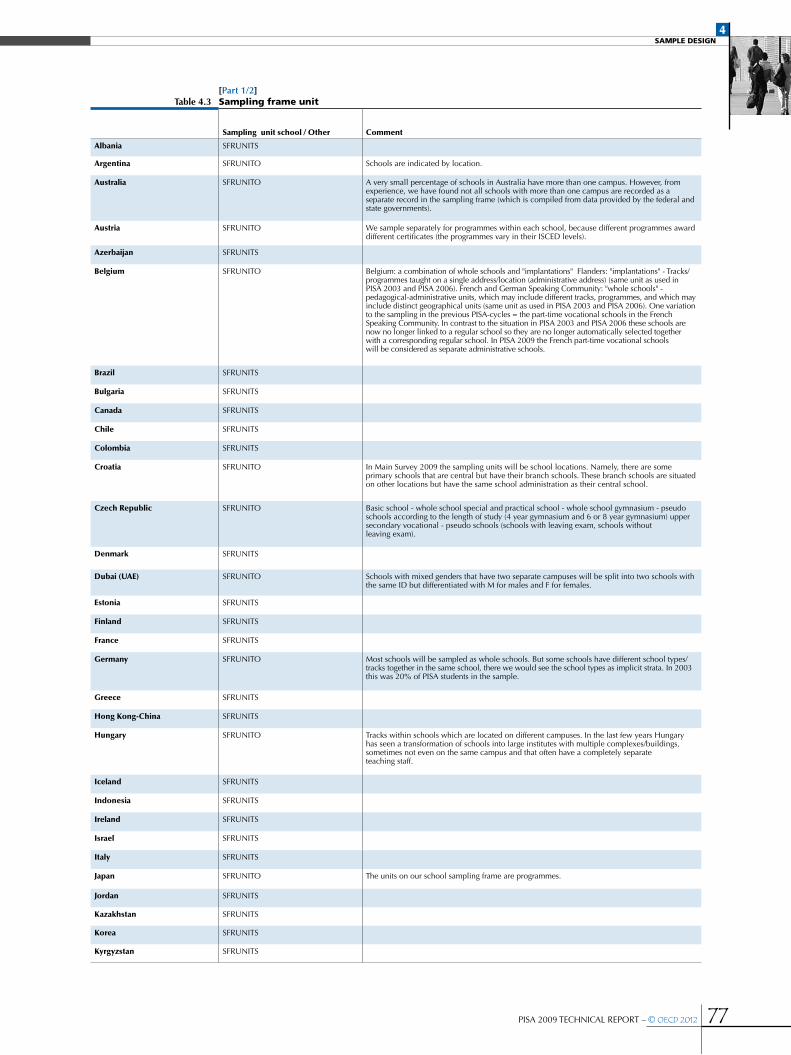
4Sample deSign
PISA 2009 TECHNICAL REPORT – © OECD 2012 77
[Part 1/2]table 4.3 Sampling frame unit
Sampling unit school / Other Comment
Albania SFRUNITS
Argentina SFRUNITO Schools are indicated by location.
Australia SFRUNITO A very small percentage of schools in Australia have more than one campus. However, from experience, we have found not all schools with more than one campus are recorded as a separate record in the sampling frame (which is compiled from data provided by the federal and state governments).
Austria SFRUNITO We sample separately for programmes within each school, because different programmes award different certificates (the programmes vary in their ISCED levels).
Azerbaijan SFRUNITS
Belgium SFRUNITO Belgium: a combination of whole schools and "implantations" Flanders: "implantations" - Tracks/programmes taught on a single address/location (administrative address) (same unit as used inPISA 2003 and PISA 2006). French and German Speaking Community: "whole schools" - pedagogical-administrative units, which may include different tracks, programmes, and which may include distinct geographical units (same unit as used in PISA 2003 and PISA 2006). One variation to the sampling in the previous PISA-cycles = the part-time vocational schools in the French Speaking Community. In contrast to the situation in PISA 2003 and PISA 2006 these schools are now no longer linked to a regular school so they are no longer automatically selected together with a corresponding regular school. In PISA 2009 the French part-time vocational schoolswill be considered as separate administrative schools.
Brazil SFRUNITS
Bulgaria SFRUNITS
Canada SFRUNITS
Chile SFRUNITS
Colombia SFRUNITS
Croatia SFRUNITO In Main Survey 2009 the sampling units will be school locations. Namely, there are some primary schools that are central but have their branch schools. These branch schools are situated on other locations but have the same school administration as their central school.
Czech Republic SFRUNITO Basic school - whole school special and practical school - whole school gymnasium - pseudo schools according to the length of study (4 year gymnasium and 6 or 8 year gymnasium) upper secondary vocational - pseudo schools (schools with leaving exam, schools withoutleaving exam).
Denmark SFRUNITS
Dubai (UAE) SFRUNITO Schools with mixed genders that have two separate campuses will be split into two schools with the same ID but differentiated with M for males and F for females.
Estonia SFRUNITS
Finland SFRUNITS
France SFRUNITS
Germany SFRUNITO Most schools will be sampled as whole schools. But some schools have different school types/tracks together in the same school, there we would see the school types as implicit strata. In 2003 this was 20% of PISA students in the sample.
Greece SFRUNITS
Hong Kong-China SFRUNITS
Hungary SFRUNITO Tracks within schools which are located on different campuses. In the last few years Hungary has seen a transformation of schools into large institutes with multiple complexes/buildings, sometimes not even on the same campus and that often have a completely separateteaching staff.
Iceland SFRUNITS
Indonesia SFRUNITS
Ireland SFRUNITS
Israel SFRUNITS
Italy SFRUNITS
Japan SFRUNITO The units on our school sampling frame are programmes.
Jordan SFRUNITS
Kazakhstan SFRUNITS
Korea SFRUNITS
Kyrgyzstan SFRUNITS
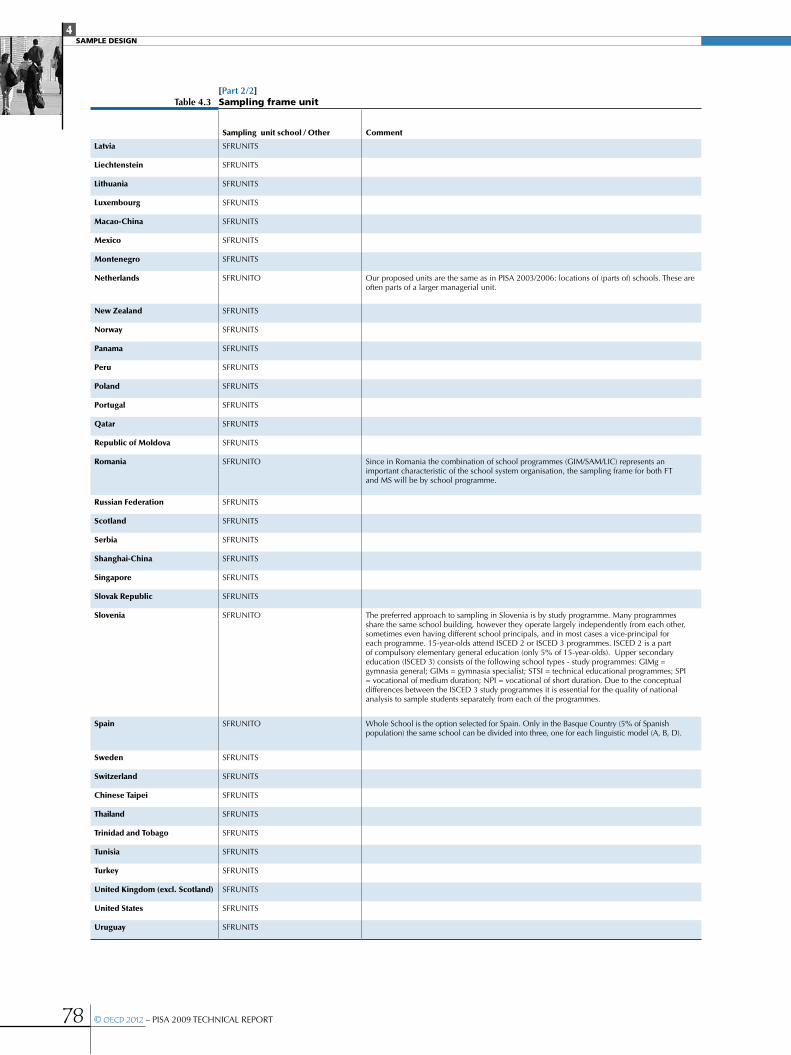
4Sample deSign
78 © OECD 2012 – PISA 2009 TECHNICAL REPORT
[Part 2/2]table 4.3 Sampling frame unit
Sampling unit school / Other Comment
Latvia SFRUNITS
Liechtenstein SFRUNITS
Lithuania SFRUNITS
Luxembourg SFRUNITS
Macao-China SFRUNITS
Mexico SFRUNITS
Montenegro SFRUNITS
Netherlands SFRUNITO Our proposed units are the same as in PISA 2003/2006: locations of (parts of) schools. These are often parts of a larger managerial unit.
New Zealand SFRUNITS
Norway SFRUNITS
Panama SFRUNITS
Peru SFRUNITS
Poland SFRUNITS
Portugal SFRUNITS
Qatar SFRUNITS
Republic of Moldova SFRUNITS
Romania SFRUNITO Since in Romania the combination of school programmes (GIM/SAM/LIC) represents an important characteristic of the school system organisation, the sampling frame for both FTand MS will be by school programme.
Russian Federation SFRUNITS
Scotland SFRUNITS
Serbia SFRUNITS
Shanghai-China SFRUNITS
Singapore SFRUNITS
Slovak Republic SFRUNITS
Slovenia SFRUNITO The preferred approach to sampling in Slovenia is by study programme. Many programmes share the same school building, however they operate largely independently from each other, sometimes even having different school principals, and in most cases a vice-principal for each programme. 15-year-olds attend ISCED 2 or ISCED 3 programmes. ISCED 2 is a part of compulsory elementary general education (only 5% of 15-year-olds). Upper secondary education (ISCED 3) consists of the following school types - study programmes: GIMg = gymnasia general; GIMs = gymnasia specialist; STSI = technical educational programmes; SPI = vocational of medium duration; NPI = vocational of short duration. Due to the conceptual differences between the ISCED 3 study programmes it is essential for the quality of national analysis to sample students separately from each of the programmes.
Spain SFRUNITO Whole School is the option selected for Spain. Only in the Basque Country (5% of Spanish population) the same school can be divided into three, one for each linguistic model (A, B, D).
Sweden SFRUNITS
Switzerland SFRUNITS
Chinese Taipei SFRUNITS
Thailand SFRUNITS
Trinidad and Tobago SFRUNITS
Tunisia SFRUNITS
Turkey SFRUNITS
United Kingdom (excl. Scotland) SFRUNITS
United States SFRUNITS
Uruguay SFRUNITS
4Sample deSign
PISA 2009 TECHNICAL REPORT – © OECD 2012 79
Notes
1. Students were deemed participants if they gave at least one response to the cognitive assessment, or they responded to at least one student questionnaire item and either they or their parents provided the occupation of a parent or guardian (see Annex G).
2. Available at www.pisa.oecd.org > what PISA produces > PISA 2009 > PISA 2009 manuals and guidelines.
3. These include schools with multiple languages of reading instruction, vocational schools, technical schools, agriculture schools, and schools with only part-time students, schools with multiple shifts and so on.

5
PISA 2009 TECHNICAL REPORT – © OECD 2012 81
Translation and Verificationof the Test and Survey Material
Introduction ..................................................................................................................................................................... 82
Development of source versions .................................................................................................................... 82
Double translation from two source languages .................................................................................. 83
PISA Translation and Adaptation Guidelines ......................................................................................... 84
Translation Training Session ................................................................................................................................ 84
Testing languages and translation/adaptation procedures ......................................................... 84
International verification of the national versions ............................................................................ 86
Summary of items deleted at the national level, due to translation,
printing or layout errors ......................................................................................................................................... 96

5TranslaTion and VerificaTion of The TesT and surVey maTerial
82 © OECD 2012 – PISA 2009 TECHNICAL REPORT
introduction
One of the important responsibilities of PISA is to ensure that the instruments used in all participating countries to assess students’ performance provide reliable and fully comparable information. In order to achieve this, PISA implemented strict verification procedures for translation/adaptation and verification procedures.
These procedures included:
•development of two source versions of the instruments (in English and French) except for the DRA (Digital Reading Assessment) option, which was offered only in English;
•double translation design;
•preparation of detailed instructions for the translation of the instruments for the field trial and for their review for the main survey;
•preparation of translation/adaptation guidelines;
•training of national staff in charge of the translation/adaptation of the instruments; and
•verification of the national versions by international verifiers.
develoPMent oF Source verSionS
Part of the new test materials used in PISA 2009 was prepared by the Consortium test development teams on the basis of submissions received from the participating countries. Items were submitted by 30 different countries, either in their national language or in English. The other part of the material was prepared by the test development teams at ACER (Australia), aSPe (University of Liege, Belgium), ILS (University of Oslo, Norway), DIPF (Germany) and NIER (Japan). Then, all materials were circulated (in English) for comments and feedbacks to the Expert Groups and the National Project Managers (NPMs).1
The item development teams received specific information/training about how to anticipate potential translation and cultural issues. The document prepared for that purpose was mainly based on experience gained during previous PISA cycles. The items developers used it as a reference when developing and reviewing the items.
The French version was developed at this early stage through double translation and reconciliation of the English materials into French, so that any comments from the translation team could, along with the comments received from the Expert Groups and the NPMs, be used in the finalisation of both source versions.
Experience has shown that some translation issues do not become apparent until there is an attempt to translate the instruments. As in previous PISA cycles, the English to French translation process proved to be very effective in detecting residual errors overlooked by the test developers, and in anticipating potential translation problems. In particular, a number of ambiguities or pitfall expressions could be spotted and avoided from the beginning by slightly modifying both the English and French source versions; the list of aspects requiring national adaptations could be refined; and further translation notes could be added as needed. In this respect, the development of the French source version served as a pilot translation, and contributed to providing NPMs with source material that was somewhat easier to translate and contained fewer potential translation problems than would have been the case if only one source had been developed.
The final French source version was reviewed by a French domain expert, for appropriateness of the terminology, and by a native professional French proof-reader for linguistic correctness. In addition, an independent verification of the equivalence between the final English and French versions was performed by a senior staff member of cApStAn who is bilingual (English/French) and has expertise in the international verification of the PISA materials, and used the same procedures and verification checklists as for the verification of all other national versions.
Finally, analyses of possible systematic translation errors in all or most of the national versions adapted from the French source version were conducted, using the field trial item statistics from the five French-speaking countries participating in PISA 2009. The results were used during the revision of the French and English source versions for the main survey. After the main survey, particular attention was also given in the differential item functioning of items in French testing countries. This resulted in a wording change in one of the French source reading units that will be part of the PISA 2012 item pool, so that new countries will translate from a corrected version.

5TranslaTion and VerificaTion of The TesT and surVey maTerial
PISA 2009 TECHNICAL REPORT – © OECD 2012 83
double tranSlation FroM two Source languageSBack translation has long been the most frequently used way to ensure linguistic equivalence of test instruments in international surveys. It requires translating the source version of the test (generally English language) into the national languages, then translating them back to English and comparing them with the source language to identify possible discrepancies.
A double translation design (i.e. two independent translations from the source language(s), and reconciliation by a third person) offers two significant advantages in comparison with the back translation design:
•Equivalence of the source and target versions is obtained by using three different people (two translators and a reconciler) who all work on both the source and the target versions. In a back translation design, by contrast, the first translator is the only one to simultaneously use the source and target versions.
•Discrepancies are recorded directly in the target language instead of in the source language, as would be the case in a back translation design.
PISA uses double translation from two different languages because both back translation and double translation designs fall short in that the equivalence of the various national versions depends exclusively on their consistency with a single source version (in general, English). In particular, one would wish the highest possible semantic equivalence (since the principle is to measure access that students from different countries would have to a same meaning, through written material presented in different languages). However, using a single reference language is likely to give undue importance to the formal characteristics of that language. If a single source language is used, its lexical and syntactic features, stylistic conventions and the typical patterns it uses to organise ideas within the sentence will have a greater impact on the target language versions than desirable (Grisay, 2003).
Some interesting findings in this respect were reported in the IEA/reading comprehension survey (Thorndike, 1973), which showed a better item coherence (factorial structure of the tests, distribution of the discrimination coefficients) between English-speaking countries than across other participating countries.
Resorting to two different languages may, to a certain extent, reduce problems linked to the impact of cultural characteristics of a single source language. Admittedly, both languages used in PISA share an Indo-European origin, which may be regrettable in this particular case. However, they do represent relatively different sets of cultural traditions, and are both spoken in several countries with different geographic locations, traditions, social structures and cultures.
The use of two source languages in PISA resulted in other anticipated advantages such as the following:
•Many translation problems are due to idiosyncrasies: words, idioms, or syntactic structures in one language appear untranslatable into a target language. In many cases, the opportunity to consult the other source version may provide hints at solutions.
•The desirable or acceptable degree of translation freedom is very difficult to determine. A translation that is too faithful may appear awkward; if it is too free or too literary it is very likely to jeopardise equivalence. Having two source versions in different languages (for which the translation fidelity/freedom has been carefully calibrated and approved by Consortium experts) provides national reconcilers with accurate benchmarks in this respect, and that neither back translation nor double translation from a single language could provide.
Empirical data from the PISA 2006 analyses were collected to assess the translation equivalence across PISA countries (Grisay, de Jong, Gebhardt, Berezner, Halleux-Monseur, 2007). The outcomes of the analyses on the data showed that “…there was no evidence in these data that the English and French national versions directly derived from the source versions had significantly less bias than those developed through translation and adaptation from the two source versions into other Western or European languages. However, a significant group of national versions, mainly used in Middle East and Asian countries, showed quite high values of the ‘uniqueness’ indicator”. The data thus contained some evidence that the translation of PISA instruments in non Indo-European languages (particularly in Middle Eastern and Asian countries) seemed to result in a quite significant larger number of item-by-country interactions than in any Indo-European language.
Some of the verifiers recommended developing a special version of the translation and adaptation guidelines for use by countries testing in non Indo European languages. In order to achieve this, a small empirical study was conducted on translation issues in Chinese and Arabic languages.
5TranslaTion and VerificaTion of The TesT and surVey maTerial
84 © OECD 2012 – PISA 2009 TECHNICAL REPORT
Due to these results, a double translation and reconciliation procedure using both source languages was still recommended in PISA 2009 as in previous cycles and countries testing in non Indo-European languages received additional translation guidelines.
PiSa tranSlation and adaPtation guidelineSThe PISA Translation and Adaptation Guidelines were revised to include more detailed advice on the translation and adaptation of reading materials, and additional warnings about common translation errors identified during the verification of PISA 2006 materials and the development of the French source version.2 These guidelines were revised with a view to obtaining a document that would be relevant to any PISA cycle. The guidelines included:
•Instructions for national version(s): According to PISA Technical Standards 2.1, students should be tested in the language of instruction used in their school (see Annex G). Therefore, the NPMs of multilingual countries were requested to develop as many versions of the test instruments as there were languages of instruction used in the schools included in their national sample. Cases of minority languages used in only a very limited number of schools could be discussed with the sampling referee to decide whether such schools could be excluded from the target population without affecting the overall quality of the data collection.
•Instructions on double or single translation: Double-translation was required for the tests, questionnaires and for the optional questionnaires, but not for the manuals and other logistic material. For the Digital Reading Assessment, double translation was required for the stimuli and items but not for the coding guides.
•Instructions on recruitment and training.
•Description of the PISA translation procedures: It was required that national version(s) be developed through double translation and reconciliation with the source material. It was recommended that one independent translator would use the English source version and that the second would use the French version. In countries where the NPM had difficulty appointing competent translators from French/English, double translation from English/French only was considered acceptable according the PISA Technical Standards 5.1 and 5.2.
Other sections of the PISA Translation and Adaptations Guidelines were intended for use by the national translators and reconciler(s):
•recommendations to avoid common translation traps;
•instructions on how to adapt the test material to the national context;
•instructions on how to translate and adapt the questionnaires and manuals to the national context; and
•the check list used for the verification of PISA material.
As explained in the previous section, a separate document containing additional guidelines for translation into non Indo-European languages was also provided to countries.
tranSlation training SeSSionNPMs received sample materials to use when recruiting national translators and training them at the national level. The NPM meeting held in September 2007 included a session on the field trial translation/adaptation activities in which recommended translation procedures, PISA Translation and Adaptation Guidelines, and the verification process were presented in detail.
At this meeting, countries were offered the opportunity to participate in a half day translation and verification training workshop. Translators and NPMs attending the workshop received detailed information about the new PISA translation training module designed to help national centres implement PISA translation requirements in a more systematic way. They were also provided with hand-out exercises.
teSting languageS and tranSlation/adaPtation ProcedureSNPMs had to identify the testing languages according to instructions given in the School Sampling Preparation Manual (www.pisa.oecd.org) and to record them in a sampling form for agreement.
Prior to the field trial, NPMs had to fill in a Translation Plan (describing the procedures used to develop their national versions and the different processes used for translator/reconciler recruitment and training). Information about a possible national expert committee was also sought. This translation plan was reviewed by the Consortium for agreement and in December 2007 the NPMs were asked to either confirm that the information given was accurate or to notify which changes had been made.

5TranslaTion and VerificaTion of The TesT and surVey maTerial
PISA 2009 TECHNICAL REPORT – © OECD 2012 85
Countries sharing a testing language were strongly encouraged to develop a common version in which national adaptations would be inserted or, in the case of minority languages, to borrow an existing verified version. There is evidence from all previous cycles (PISA 2000, PISA 2003 and PISA 2006) that high quality translations and high levels of equivalence in the functioning of items was best achieved in the three groups of countries that shared a common language of instruction (English, French and German) and could develop their national versions by introducing a limited number of national adaptations in the common version. Additionally, having a common version for different countries sharing the same testing language implies that all students instructed in a given language receive booklets that are as similar as possible, which reduces cross-country differences due to translation effects.
Table 5.1 lists countries that shared a common version of test items with national adaptations.
table 5.1 countries sharing a common version with national adaptations
Language Countries Collaboration
Albanian Albania, Montenegro, Serbia Montenegro and Serbia introduced national adaptations in the verified Albanian versionfor the main survey
Arabic Dubai (UAE), Qatar Qatar developed a version in which Dubai introduced adaptations
Dutch Belgium, Netherlands Belgium (Flemish Community) introduced adaptations in the verified Dutch version
English Australia, Canada, Dubai, Hong Kong-China, Ireland, Macao-China, New Zealand, Qatar, Scotland, Singapore, Sweden, Trinidad and Tobago, United Kingdom, United States
Adaptations introduced in the English source version
French Belgium, Canada, France, Luxembourg, Switzerland
Adaptations introduced in the French source version
German Austria, Belgium, Germany, Italy, Luxembourg, Switzerland
Adaptations introduced in a commonly developed German version
Hungarian Hungary, Romania, Serbia, Slovak Republic
For their Hungarian versions, Romania, Serbia, and the Slovak Republic introduced adaptations in the verified version from Hungary
Italian Italy, Slovenia, Switzerland Slovenia and Switzerland (Canton Ticino) introduced adaptations in the verified version from Italy
Polish Lithuania, Poland For its Polish version, Lithuania introduced adaptations in the verified version from Poland
Portuguese Macao-China, Portugal Macao introduced adaptations to verified version from Portugal
Russian Azerbaijan, Estonia, Kazakhstan, Kyrgyzstan, Latvia, Lithuania,the Russian Federation
Adaptations introduced in the verified version from the Russian Federation.
Slovene Italy, Slovenia Use of Slovene version in Italy
Spanish Argentina, Colombia, Peru Argentina and Peru introduced adaptations in the verified version from Colombia
Swedish Finland, Sweden For its Swedish version, Finland introduced adaptations in the verified versionfrom Sweden
Additionally, the Chinese and Spanish testing countries, with the exception of Peru and Argentina, shared the translation workload but each country reconciled and finalised its own version separately.
Table 5.2 summarises the translation procedures as described in the confirmed country Translation Plans.
table 5.2 PiSa 2009 translation/adaptation procedures
Procedures Number of national versions
Use one of the source versions with national adaptations 19
Use of a commonly developed version with national adaptations 6
Use of a borrowed verified version with or without national adaptations 19
Double translation from both source versions 27
Double translation from English or French source with cross-checks against the other source version 11
Double translation from English or French source only 16
Alternative procedures 3

5TranslaTion and VerificaTion of The TesT and surVey maTerial
86 © OECD 2012 – PISA 2009 TECHNICAL REPORT
A total of 101 national versions of the materials were used in the PISA 2009 main survey, in 45 languages, The languages were: Albanian, Arabic, Azeri, Bahasa Indonesia, Basque, Bulgarian, Cantonese, Catalan, Croatian, Czech, Danish, Dutch, English, Estonian, Finnish, French, Galician, German, Greek, Hebrew, Hungarian, Icelandic, Irish, Italian, Japanese, Korean, Kyrgyz, Latvian, Lithuanian, Mandarin, Norwegian (Bokmål and Nynorsk), Polish, Portuguese, Romanian, Russian, Serb Ekavian variant, Serb Yekavian variant, Slovak, Slovene, Spanish, Swedish, Thai, Turkish, Uzbek and Valencian.
International verification (described in section below) occurred for 83 national versions out of the 101 used in the main survey.
International verification was not implemented when a testing language was used for minorities that make less than 10% of the target population or when countries borrowed a version that had been verified at the national level without making any adaptations. This concerned 18 versions across the following countries: Azerbaijan (Russian), Belgium (German), Finland (Swedish), Hong Kong-China (English), Ireland (Irish), Italy (Slovene and German), Lithuania (Polish and Russian), Macao-China (Portuguese), Montenegro (Albanian), Romania (Hungarian), Serbia (Hungarian and Albanian), the Slovak Republic (Hungarian), Slovenia (Italian), Spain (Valencian) and Sweden (English).
Note that among these 18 versions, only two (Irish and Valencian) were only verified at the national level. All other versions were prepared using internationally verified versions.
international veriFication oF the national verSionSAs in previous PISA cycles, one of the most important quality control procedures implemented to ensure high quality standards in the translated assessment materials for PISA 2009 was to have an independent team of expert verifiers, appointed and trained by the Consortium, verify each national version against the English and French source versions.
Two verification co-ordination centres were established. One was at ACER (for national adaptations to test materials used in the English-speaking countries). The second one was at cApStAn, which has been involved in preparing the French source versions of the PISA materials and verifying non-English national versions since PISA 2000. In PISA 2009, cApStAn also took charge of linguistic verification of English-language questionnaires, liaising with CITO (Core B Consortium) which took charge of checking national adaptations in questionnaires.
The Consortium undertook international verifications of all national versions in languages used in schools attended by more than 10% of the country’s target population. For a few minority languages, national versions were only developed (and verified) in the main survey phase. English or French-speaking countries or communities were allowed to only submit national adaptation forms for verification.
The main criteria used to recruit verifiers of the various national versions were that they had:
•native command of the target language;
•professional experience as translators from English or French or from both English and French into their target language;
•sufficient command of the second source language (either English or French) to be able to use it for cross-checks in the verification of the material;
•familiarity with the main domain assessed (in this case, reading);
•a good level of computer literacy; and
•as far as possible, experience as teachers and/or higher education degrees in psychology, sociology or education.
Verifier training sessions were held prior to the verification of both the field trial and the main survey materials. Attendees received copies of the PISA information brochure, Translation Guidelines, the English and French source versions of the material and a Verification Checklist developed by the Consortium. The training sessions focused on:
•presenting verifiers with PISA objectives and structure;
•familiarising them with the material to be verified, the verification procedures, and the software tools to be used (for the DRA option verified at the main survey);
•reviewing and extensively discussing the Translation Guidelines and the Verification Checklist;
•conducting hands-on exercises on specially adapted target versions;
•arranging schedules and despatch logistics; and
•security requirements.

5TranslaTion and VerificaTion of The TesT and surVey maTerial
PISA 2009 TECHNICAL REPORT – © OECD 2012 87
The verification procedures were improved and strengthened in a number of respects in PISA 2009 compared to previous rounds, and included a number of innovations. The following subsections present “state of the art” procedures for the different components subject to verification. These include: Verification of new test units, verification of booklet shell, verification of link units, verification of questionnaires, final optical check of test booklets, questionnaire booklets, coding guides, verification of operational manuals, verification of DRA units.
Verification of test unitsSince the PISA 2000 main survey, verifiers enter their suggested edits in Microsoft Word® files (item pool format, including coding sections) using the track changes mode, to facilitate the revision of verified materials by the national centre (NC) – who can directly “accept” or “refuse” the edits proposed.
Since the PISA 2003 main survey, the mainstay of the verification procedure for test units has been the test adaptation spreadsheet (TAS). Figure 5.1 shows a sample test adaptation spreadsheet from the PISA 2009 field trial. The aim of this form is to function: as an aid to translators, reconcilers, and verifiers (through the increasing use of item-specific translation/adaptation guidelines); as a centralised record of national adaptations; of verifier corrections and suggestions; as a way of initiating discussions between the national centre and the Consortium referee; as way of recording the implementation status of “key corrections” in test booklets; and as a tool permitting quantitative analysis of verification outcomes.
Figure 5.1 shows a sample test adaptation spreadsheet from the PISA 2009 field trial.
Some points of note are:
•Since PISA 2003, but increasingly through PISA 2006 and in PISA 2009, the column “Consortium recommendation or national centre justification” has been used to list item-specific translation/adaptation guidelines. These complement the general translation/adaptation guidelines and the translation notes embedded in Word® source unit files with additional advice covering recommended/allowed/proscribed adaptations, literal or synonymous matches to be maintained, other psychometric characteristics to be considered (e.g. relative length or other patterns in multiple choice responses), desirable register of terms to be maintained, emphasis to be echoed, tips for the translation of difficult or idiomatic terms, etc. The verification co-ordinators consider that the generalised use of item-specific guidelines (used by both translators and verifiers) is a significant breakthrough for translation quality assurance and quality control.
•Since PISA 2006, verifiers are instructed to document their “significant” verification interventions in the test adaptation spreadsheet, with a view to formalising the process by which: a) the Consortium verification referee is informed of important issues and can liaise as needed with the test developers; b) if there is disagreement with the national centre, a back-and-forth discussion ensues until the issue is resolved; c) key corrections in test materials are pinpointed so that their implementation can be double-checked at the final optical check (FOC) phase. In the PISA 2000 and PISA 2003 verification rounds, this process took place in a less structured way.
•Following the PISA 2009 field trial, a conceptual change was introduced with regards to defining “significant” verification interventions tracked in the test adaptation spreadsheet. It was deemed desirable to reduce variability in the choice that verifiers make whether to report an intervention in the test adaptation spreadsheet or only correct in track changes in the unit, and to ensure that all potentially serious corrections (including those at purely linguistic level) are included in the test adaptation spreadsheet. This so that they may acquire “key correction” status and be double-checked during the final optical check (FOC). The criterion was thus revised from “distinguish between purely linguistic issues and those that may potentially threaten equivalence” (used formerly) to “distinguish between minor errors or suggestions for improvement (that would not really affect the instruments if not corrected) and serious or potentially serious errors that require action”.
•Since the PISA 2006 main survey, an innovation in the test adaptation spreadsheet – retained in PISA 2009 – is that verifiers use a scroll-down menu to categorise issues in one of eight standardised verification intervention categories. As before, an additional comments field allows verifiers to explain their intervention with a back-translation or description of the problem. The purpose of the categorisation is: to reduce variability in the way verifiers document their verification; to make it easier for the Consortium referee to judge the nature of an issue and take action as needed; and to provide an instrument to help assess both the initial quality of national versions and the quality of verifiers’ output.
•In training verifiers, special attention was given in PISA 2009 to harmonising comment-writing practices. The life cycle of a comment makes it necessary to express it in such a way that it will be useful for both the national centre and for the Consortium referee. Furthermore, the final optical check (FOC) reviewer, who is not always the same person as the verifier, must be able to verify at final check whether a correction has been implemented or not.
5TranslaTion and VerificaTion of The TesT and surVey maTerial
88 © OECD 2012 – PISA 2009 TECHNICAL REPORT
•The following guidelines were set for verifier comments:
- comments should be understandable to the Consortium referee who does not always understand the target language and only looks at the test adaptation spreadsheet and the source version when reviewing comments;
- specify in what way the target deviates from the source (rather than giving instructions on how to fix it, quoting the source, or explaining how the text has been corrected);
- mention whether the verifier has made the correction or not for and why (e.g. because the verifier is unable to do it, or is not sure how to go about it);
- comments should be factual and written in a clear and unemotional way and opinion statements should be kept to a minimum; and
- each comment should relate to the category label selected.
Main survey verificationMain survey verification is, in essence, a second verification of materials already verified once before the field trial. In these materials, based on analysis of overall field trial results, test developers introduce a number of edits in the units that are retained for the main survey. Likewise, national centres propose changes or adaptations to the units based on their own (country-specific) field trial analysis. Therefore, main survey verification of test units has a threefold purpose:
•to check whether national centres have correctly echoed all changes made to the materials by the test developers (Consortium changes);
•to examine edits, improvements and adaptations proposed by the national centres (national changes) and determine whether these comply with PISA translation and adaptation guidelines; and
• to (re-)check the final target versions for accuracy, linguistic quality and equivalence against the international source versions.
For the PISA 2009 main survey, additional steps were taken to further align verification procedure on the aims listed above, and an experimental innovation was made as regards the verification of coding guides.
Figure 5.2 shows a sample test adaptation spreadsheet from the PISA 2009 main survey.
Some points worth noting:
•All of the Consortium’s field trial to main survey revisions are listed in the main survey test adaptation spreadsheet. For each revision, the drop-down menu in the verifier intervention column is dichotomous: “OK” (implemented) or “NOT OK” (overlooked). If a change is defectively implemented, the verifier selects OK and comments on the issue. This procedure ensures that the verifier checks the correct implementation of every single Consortium change.
•National centres are asked to document and justify each change they make (in addition to echoing Consortium changes). Such changes are supposed to be relatively rare, since the instructions given to the national centres are to “refrain from over-revisions just aimed at finding more ‘elegant’, ‘literary’ or ‘efficient’ words and syntactical structures. Such modifications might affect the item difficulty in unexpected ways, perhaps introducing flaws in items that had no problem in the field trial.” Verifiers are instructed to gauge national changes in light also of the above consideration.
•An experimental innovation in the PISA 2009 main survey was the separate verification of coding guides. The rationale is based on the late despatch of final source versions of coding following the coder training meeting. While in the field trial verification it is essential to translate and verify the scoring rubrics at the same time as the stimulus and items, at main survey stage the material has already been verified once, and it makes little operational sense to verify correct implementation of a first wave of Consortium change, because some of the changes of the second wave (after the coder meeting) invalidate changes from the first wave.
•The aforementioned procedural change involved a number of issues. When units were verified in early 2009, the scoring rubric verification was postponed: the coding-related sections of the test adaptation spreadsheet were shaded in grey and ignored during the first stage of verification. After the coder training meeting, an updated version of the test adaptation spreadsheet, in which changes to the final source version of the coding guides were introduced, was prepared and sent to national centres to document additional national changes. For countries that had gone through the process of stimulus + item verification, the annotated final check test adaptation spreadsheet was used; for countries testing late, the verification of coding rubrics was integrated in the mainstream verification process. There were a number of overlaps, e.g. countries for which the final check of booklets took place at the same time as the verification of coding guides; information from both versions of the test adaptation spreadsheet then needed to be collated after the fact.

5TranslaTion and VerificaTion of The TesT and surVey maTerial
PISA 2009 TECHNICAL REPORT – © OECD 2012 89
oeCd/PISa 4th cycle
Field trial PISa 2009Country:
test adaptation Spreadsheet (taS)new readIng unItS - BatCh 1target language:
Please insert new lines, if needed, to document additional adaptations
english version national version
Consortium recommendation or
nC justificationverifier
intervention verifier commentConsortium
referee"Key
Correction"Final
Check
r432 abtBk
Stimulus illustration
See translation note (choose back cover graphic that matches your writing system)
oK
Stimulus "Fly by Night" "Тундаги парвоз"
Even if a published version of this book exists in your language, translate “Fly by Night” as something meaning “Flying at night”. Do not use the translation in your language of the title of “Vol de nuit” by Antoine de St Exupéry
oK
Stimulus Mosca, Clent, Frances Hardinge
Моска, Клент, Фрэнсис Гардинг Do not adapt oK
Stimulus Sam, Stephanie Сэм, Стэфани Adapt to common names in your language
not adapted. unchanged by ver oK no
Stimulus (review 2)
loose ends “tied up” воқеалар «якунига етганида»
Use an idiom that connotes resolving details that were previously unresolved / unexplained.
oK
review 2 register/wording
"… lost sight of where book was going.." was translated as "… lost sight of where the book was taking place." Corrected by ver
Please accept the verifier correction
yeS yeS, corrected
r432Q01 blurb аннотация
Definition of "blurb": a short piece of writing that praises and promotes something, especially a paragraph on the cover of a book
oK
r432Q01 Scoring
Some words in the code descriptor are underlined.
Make sure the underlining is retained in your version.
oK
r432Q02
A It is stirring and intriguing.
B It is suitable for younger readers.
C It is frustrating and unsatisfying.
D It is spoilt by a boring plot.
A У тўлқинлантирадиган ва жозибали.B У ёш китобхонларга мос.C У кўнгилни қолдирадиган ва қаноатлантирмайдиган.D У зерикарли мазмун туфайли бузилган.
Insofar as possible, respect the pattern in the response options. The translation of stirring, intriguing, frustrating, unsatisfying, spoilt and boring plot requires special attention.
oK
r432Q03
r432Q03 Scoring
Some words in the code descriptors are underlined.
Make sure the underlining is retained in your version.
oK
no Credit added info
"they both own a goose" was translated as "they both thought they owned their own goose." Corrected by ver
even if this answer would also deserve no credit, it would be better to have an answer equivalent to the source
no
Reserved for verifier: any other corrections in unit, entered in track changes but not listed above? yeS, LeSS than 5
• Figure 5.1 •Sample Field trial test adaptation Spreadsheet (taS) for a new PiSa 2009 reading unit
yes
no
yes, corrected
no, not corrected
added information
missing information
Layout / visual issues
grammar / Syntax
Consistency
register / wording
adaptation
mistranslation
no
yes, less than 5
yes, 5 or more

5TranslaTion and VerificaTion of The TesT and surVey maTerial
90 © OECD 2012 – PISA 2009 TECHNICAL REPORT
•The verifier’s brief was also complex, involving the following goals:
- to fully verify the introduction to the reading coding guide;
- to verify the correct implementation of all Consortium field trial to main survey changes. These edits had been pre-entered into the post-final optical check (FOC) test adaptation spreadsheet of countries for which the verification was over and in the standard test adaptation spreadsheet of other countries;
- to go back to the field trial test adaptation spreadsheet and check whether any of the pending key corrections from the field trial were still applicable (there was no final check of key corrections in field trial scoring sections), and if so to check whether they were taken into consideration; and
- to perform a sentence by sentence comparison of the source and target versions with a view to verifying linguistic equivalence of the scoring rules and sample student responses.
•From the national centre feedback in the main survey reviews, it may be concluded that separate verification of coding guides was not unanimously well received. While this process does ensure that all Consortium changes are echoed in the final national versions of coding guides, it was perceived by some national centres as a tedious addition to an already heavy workload. Conversely, some countries welcomed this process, which eased the time pressure under which national reviewers had to work (coding guides need to go to press later than test booklets). Should this process be retained for the next cycle (not for the field trial verification, only for the main survey verification), the operational aspect needs to be rethought and a separate test adaptation spreadsheet should be designed for the coding guide verification.
oeCd/PISa 4th cycle
main Survey PISa 2009Country:
test adaptation Spreadsheet (taS)PISa2009 new reading units [+ r083-r101-r245]target language:
Consortium changes vs 2009FT version are pre-filled and must be echoed in your national 2009MS versionNATIONAL changes vs FT version: please use relevant row and fill in columns B, C, D, E. If necessary add new rows
unit/Locationin unit
Ft > mS Changes
verifier intervention
verifier comment
Consortium referee
"Key Correction"
Final CheckSource version nat. Ft version nat. mS version
justificationfor change
r442 galileo
Unit included in the STANDARD SET (to be translated/verified ONLY by countries administering the STANDARD set)
Stimulus Paragraph 6
Galileo would have laughed uproariously at the proposal from a research team that has investigated substances responsible for bad foot odour and has declared itself proud of having been able to reproduce this same odour in their laboratory.
Galileo would have laughed uproariously upon learning that a research team has investigated substances responsible for bad foot odour and has declared itself proud of having been able to reproduce this same odour in its laboratory.
Consortium change Change overlooked OK now.
Please consider carefully the verifier correction when finalising your version
NO
r442Q02
r442Q02 Scoring
OK
r442Q03
r442Q03 Scoring
OK
r442Q05
r442Q05 Scoring
Question intent, first sentence
Integrate and interpret: Develop an interpretation
Reflect and evaluate: Reflect on and evaluate the form of a text
Consortium change Change overlooked
Change partly overlooked: "Refelct and evaluate" was "Integrate and interpret"; OK now.
Please accept the verifier correction
YES YES, corrected
r442Q05 Scoring
Code 0 Part 2 3 sample responses 4 sample responses (1added) Consortium change Change OK
r442Q06
• Figure 5.2 •Sample Main Survey test adaptation Spreadsheet (taS) for a new PiSa 2009 reading unit

5TranslaTion and VerificaTion of The TesT and surVey maTerial
PISA 2009 TECHNICAL REPORT – © OECD 2012 91
Verification of the booklet shellSince PISA 2006, the booklet shell has been handled as a separate component subject to verification. In PISA 2009, the booklet shell included the booklet cover, the formula sheet, the general directions, the source acknowledgement and the Reading for School survey. It was dispatched together with a booklet adaptation spreadsheet (BAS) which has the same structure as the test adaptation spreadsheet, and is verified following the same procedure as the test units.
Verification of link unitsFor the PISA 2009 field trial, units which also occurred in PISA 2006 (known as link units) were verified as new material for ten new participants in PISA and for Turkey, which decided to rework earlier versions of the materials. Separate test adaptation spreadsheets were prepared for these link units, but the verification procedure of all link units was identical to that of new reading units.
In addition, six reading link units from PISA 2000 were included as additional link material for all countries: these six reading link units were verified as new materials for those countries that did not participate in the PISA 2000 main survey data collection and were checked that they were the same as the PISA 2000 version for other countries.
For this check, PISA 2000 participants were requested to:
•Send hard copies of the original PISA 2000 main survey test booklets 6 and 7 (together, these two booklets contained the six reading link units) and of the original PISA 2000 Reading Marking Guide to the Consortium by courier.
•Assemble electronic versions of the same six units, using the most final electronic versions available, and to submit them for verification.
•Document any intentional changes they wish to make to that material. Three notable examples of necessary changes were: countries in which there has been a spelling reform after 2000, countries in which gender neutrality has become a requirement when addressing students, countries in which the currency changed in the meantime.
•Later, in the form of errata, countries were also asked to reflect some changes that the Consortium had made to the source versions. The stimulus and items from the electronic version submitted were then compared to the content of the original booklets used in 2000 and the coding rubric from the reassembled unit was compared to the PISA 2000 Reading Marking Guide. Every discrepancy, even a change in punctuation or a typographical error that was fixed in the meantime, was noted in a report and this report was sent back to countries as well as to the test developers and the Consortium referee. The test developers and the Consortium referee decided jointly whether proposed changes were acceptable (in general, very few changes were accepted), and they asked countries to confirm that discrepancies between the actual items used in 2000 and the reassembled units for use in PISA 2009 would be eliminated. Compliance with the decisions on accepted and rejected revisions to link units was later checked at the final optical check.
For the PISA 2009 main survey, countries having participated in the previous cycle were asked to use versions of link units that were identical to the versions they used in the PISA 2006 main survey. Convergence between the PISA 2006 and PISA 2009 national versions was not checked in a systematic way. Any change these countries wished to introduce in link units had to be submitted to the Consortium for approval, and the correct implementation of each of the agreed changes was verified. For new countries, the link items were treated the same way as new materials.
Verification of questionnaires Questionnaires are submitted for verification together with an agreed questionnaire adaptation spreadsheet (QAS). The purpose of the QAS is to document all content-related deviations from the international reference versions. Such national adaptations are subject to clearance by the questionnaire team before the material is submitted for verification.
The verifiers’ brief (successively refined throughout PISA cycles) is now defined as checking whether target questionnaires are linguistically correct and faithful to either the source version (when no adaptation is made) or the approved English translation of the national version (when an adaptation is made). With a view to this, verifiers are instructed:
•to check whether the back translation of the agreed adaptation is faithful;
•to check whether the agreed adaptation is correctly reflected in the questionnaire;
•to check the questionnaires for undocumented adaptations (deviations from the source not listed in the QAS) and report them; and
•to check linguistic correctness (grammar, spelling, etc.) of the entire target version.
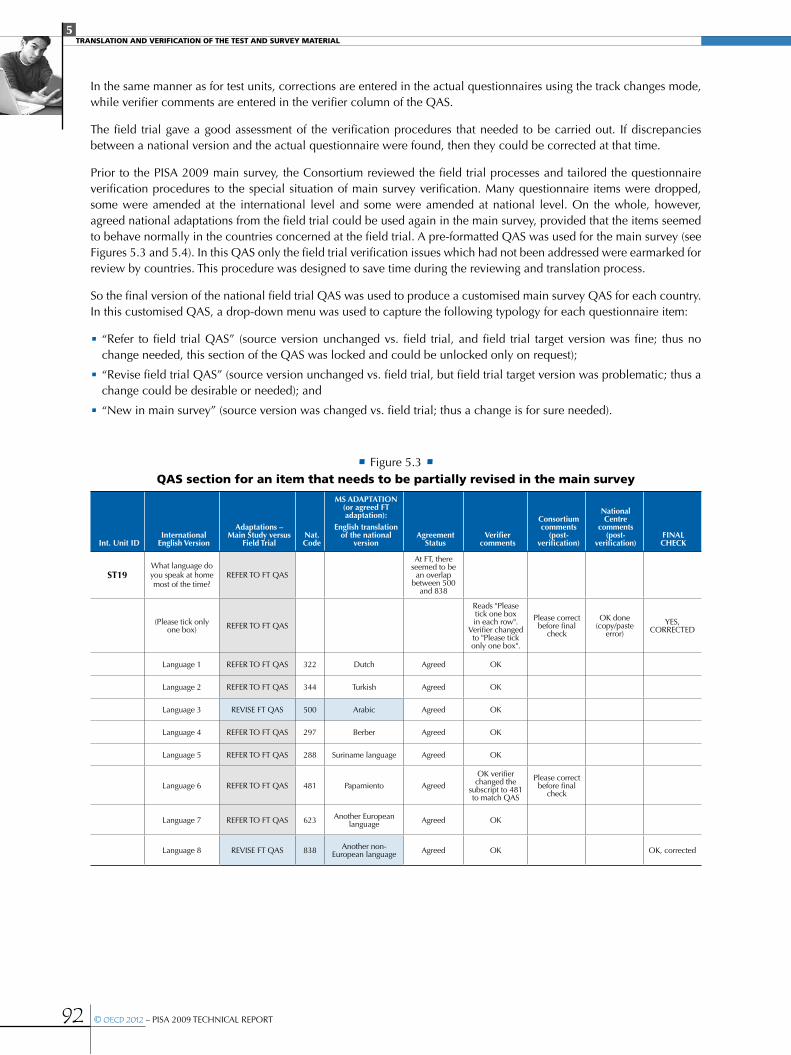
5TranslaTion and VerificaTion of The TesT and surVey maTerial
92 © OECD 2012 – PISA 2009 TECHNICAL REPORT
In the same manner as for test units, corrections are entered in the actual questionnaires using the track changes mode, while verifier comments are entered in the verifier column of the QAS.
The field trial gave a good assessment of the verification procedures that needed to be carried out. If discrepancies between a national version and the actual questionnaire were found, then they could be corrected at that time.
Prior to the PISA 2009 main survey, the Consortium reviewed the field trial processes and tailored the questionnaire verification procedures to the special situation of main survey verification. Many questionnaire items were dropped, some were amended at the international level and some were amended at national level. On the whole, however, agreed national adaptations from the field trial could be used again in the main survey, provided that the items seemed to behave normally in the countries concerned at the field trial. A pre-formatted QAS was used for the main survey (see Figures 5.3 and 5.4). In this QAS only the field trial verification issues which had not been addressed were earmarked for review by countries. This procedure was designed to save time during the reviewing and translation process.
So the final version of the national field trial QAS was used to produce a customised main survey QAS for each country. In this customised QAS, a drop-down menu was used to capture the following typology for each questionnaire item:
•“Refer to field trial QAS” (source version unchanged vs. field trial, and field trial target version was fine; thus no change needed, this section of the QAS was locked and could be unlocked only on request);
•“Revise field trial QAS” (source version unchanged vs. field trial, but field trial target version was problematic; thus a change could be desirable or needed); and
•“New in main survey” (source version was changed vs. field trial; thus a change is for sure needed).
Int. unit IdInternational
english version
adaptations – main Study versus
Field trialnat. Code
mS adaPtatIon (or agreed Ft adaptation):
english translation of the national
versionagreement
Statusverifier
comments
Consortium comments
(post-verification)
national Centre
comments (post-
verification)FInaL CheCK
St19What language do you speak at home most of the time?
REFER TO FT QAS
At FT, there seemed to be
an overlap between 500
and 838
(Please tick only one box) REFER TO FT QAS
Reads "Please tick one box in each row".
Verifier changed to "Please tick only one box".
Please correct before final
check
OK done (copy/paste
error)
YES, CORRECTED
Language 1 REFER TO FT QAS 322 Dutch Agreed OK
Language 2 REFER TO FT QAS 344 Turkish Agreed OK
Language 3 REVISE FT QAS 500 Arabic Agreed OK
Language 4 REFER TO FT QAS 297 Berber Agreed OK
Language 5 REFER TO FT QAS 288 Suriname language Agreed OK
Language 6 REFER TO FT QAS 481 Papamiento Agreed
OK verifier changed the
subscript to 481 to match QAS
Please correct before final
check
Language 7 REFER TO FT QAS 623 Another European language Agreed OK
Language 8 REVISE FT QAS 838 Another non-European language Agreed OK OK, corrected
• Figure 5.3 •QaS section for an item that needs to be partially revised in the main survey

5TranslaTion and VerificaTion of The TesT and surVey maTerial
PISA 2009 TECHNICAL REPORT – © OECD 2012 93
1 2 4 5 6 10 11 12 13 14
Int. unit IdInternational
english version
adaptations – main Study versus
Field trial
Int. variable
IdInt.
Code
mS adaPtatIon (or agreed Ft adaptation):
national version
mS adaPtatIon (or agreed Ft
adaptation): eng translation of the national version
justification for proposed
mS adaptation: national Centre
commentsConsortium Comments
agreement Status
St04a what is your hair colour? NEW IN MS
Brown NEW IN MS 1
Blond NEW IN MS 2
Red NEW IN MS 3
Not applicable (e.g. bald) NEW IN MS 4
• Figure 5.4 •QaS section for an item that is new in the main survey
After verification, the QAS was reviewed regarding the verifier interventions, prompting the national centres for action by indicating interventions to be regarded as crucial. These “key corrections” were double-checked at the final optical check stage and, if one was found to have been overlooked or disregarded by the country, a comment was included in the final optical check report (see next section).
The PISA 2009 main survey verification procedure for questionnaires proved to be effective. The instructions to the verifiers were straightforward and the instruments submitted to their scrutiny had already been discussed extensively with Consortium staff by the time they had to verify them. Verifiers were instructed to refrain from discussing an agreed adaptation unless the back translation inadequately conveyed its meaning, in which case the Consortium might unknowingly have approved an inappropriate adaptation.
Final optical check of test booklets, questionnaire booklets and coding guidesAs in previous surveys, test booklets and questionnaire forms are checked page-by-page for correct item allocation, layout, page numbering, item numbering, graphic elements, item codes and footers. This phase continues to prove essential in locating residual flaws, some of which could not have been located during item pool verification.
One of the innovations for PISA 2009 was the systematic verification of whether key corrections resulting from the first verification phase were duly implemented. All Test Adaptation Spreadsheets (TAS) and booklet adaptation spreadsheets (BAS) containing key corrections were thus also returned to each country with recommendations to intervene on any residual key correction that was overlooked or incorrectly implemented. A similarly annotated QAS was also returned in cases where corrections had been flagged by the Consortium staff in charge of reviewing questionnaires, thus requesting follow-up at final optical check (FOC) stage. Note that in PISA 2000 and PISA 2003, national centres were given the final responsibility for all proposed corrections and edits. Although the final optical check (FOC) brief previously included performing random checks to verify whether crucial corrections proposed during item pool verification were duly implemented, in practice this was made difficult by the uncertainty on whether the national centre had accepted, rejected or overlooked corrections made by the verifier.
Another innovation was to organise a separate final optical check (FOC) training session for the final optical check (FOC) reviewers team, at which printed source booklets and questionnaires were distributed and every aspect of the final check was illustrated with examples. The final optical check (FOC) reviewers were taught to perform a two-step final optical check and to use the drop-down menus in the new final optical check (FOC) reports in Excel® format to report all residual problems (see below). An exercise involving a mock-up version of an assessment booklets planted with errors was performed.
Following the recommendations of the January 2008 Technical Advisory Group meeting (TAG), a new final optical check (FOC) report form was introduced with a view to improve legibility and user-friendliness of final optical check (FOC) feedback and to document the countries’ follow-up on issues spotted at final optical check (FOC). The Excel® format final optical check (FOC) report was well received by national centres, who recognised the instrument as one of the important milestones in the process of producing assessment booklets. The new form in Excel® format (see Figure 5.5) has a separate worksheet for each booklet and features a column describing the type of problem spotted, with categories that

5TranslaTion and VerificaTion of The TesT and surVey maTerial
94 © OECD 2012 – PISA 2009 TECHNICAL REPORT
can be mapped to the final optical check (FOC) checklists. A “recommended correction” column allows the reviewer to describe the problem and/or the corrective action that is needed to resolve it. For each entry, national centres were asked to indicate compliance (or justify non-compliance). As described earlier, the test adaptation spreadsheet, BAS and QAS were used to document the status of key corrections.
Additionally, the PISA 2009 main survey final optical check included a new entry (“residual issue at content-level”) in final optical check (FOC) reports for each non-implemented key correction from the test adaptation spreadsheet, booklet adaptation spreadsheet or questionnaire adaptation spreadsheet. This step increases traceability of follow-up given to key corrections pinpointed during verification, since national centres had to indicate whether such issues were addressed (or justify why they weren’t addressed) in the final optical check (FOC) report, as shown in Figure 5.5. It also simplified procedures: for the PISA 2009 main survey verification, the only deliverable to countries was the final optical check (FOC) report, listing all residual issues to be addressed before printing – including key corrections that had not been addressed.
oeCd/PISa 4th cyclemain main Survey PISa 2009Country: Zedland
FInaL oPtICaL CheCK (FoC)
Language: Zedish
PageLoCatIon
In Page tyPe oF ProBLem reCommended CorreCtIonCountry
FoLLow-uPexPLanatIon For "not CorreCted"
PoSt-FoC CheCK
page 8 S465 stimulus Extraneous content
Please put just 3 letters of each month (ex: change January to Jan ). However, this is a link unit so the layout issue may not need to be addressed, if the same deviation was present in the final version of PISA2006.
NOT CORRECTED the same as in the final version of PISA2006
page 36 m447Q01 Missing content
Please don't abbreviate term "Diagram" under diagram 1. However, this is a link unit so the layout issue may not need to be addressed, if the same deviation was present in the final version of PISA2006.
NOT CORRECTED the same as in the final version of PISA2006
page 42 m155 stimulus Graphics: rendering
The years under the 2nd graph are not fully visible, please correct. However, this is a link unit so the layout issue may not need to be addressed, if the same deviation was present in the final version of PISA2006.
CORRECTED
page 46 S326 Layout (disposition of text & graphics)
Please center the word "Substance" in first column. However, this is a link unit so the layout issue may not need to be addressed, if the same deviation was present in the final version of PISA2006.
NOT CORRECTED the same as in the final version of PISA2006
page 59 S425Q04 Item Code Please put item code in italics. CORRECTED
• Figure 5.5 •PiSa 2009 main survey booklet Foc report with drop-down menus
yes, corrected
no, not corrected
Pagination / content allocation
Layout (disposition of text and graphics)
text Formatting (bold, italics, underline, caps)
number formatting (decimal dote/commas etc.)
residual issue at content level
extraneous content
untranslated content
missing content
graphics: rendering
graphics: position and legibility of captions
Question number
Item code
reference to line numbers
Labels of multiple choice responses
answering lines (number, type, prompts)
answering table (layout and formatting)
wrong footer
other
The format of the questionnaire final optical check (FOC) report was similar to that of the assessment booklets’ final optical check (FOC) report, but the typology of issues was adapted to issues specific to questionnaires.
Similar to analyses of the test adaptation spreadsheet, cApStAn conducted quantitative analyses of final optical check (FOC) reports both at field trial and main survey phases, which gave good estimates of the number and types of residual errors found in assessment booklets.
ACER also conducted an analysis of residual errors found in post-final optical check (FOC) versions of assessment booklets, differentiating between issues present at final optical check (FOC) and issues introduced subsequently. In turn, cApStAn has carried out an analysis of these findings, with a view to further fine-tuning final optical check (FOC) procedures and minimising the probability of errors escaping through the net. ACER and cApStAn’s findings, analysis and conclusions are the subject of separate documents presented to the PISA Technical Advisory Group.

5TranslaTion and VerificaTion of The TesT and surVey maTerial
PISA 2009 TECHNICAL REPORT – © OECD 2012 95
From PISA 2006 onwards, a verification step was added at the main survey phase for the coding guides, consisting of checking the correct implementation of late changes in the scoring instructions introduced by the Consortium after the coding seminar. Verifiers check the correct implementation of such edits.
In the PISA 2009 main survey, these edits had been integrated into the post-final optical check (FOC) test adaptation spreadsheet of countries for which the verification was over and in the standard test adaptation spreadsheet of other countries. In line with the innovation as of PISA 2006 concerning key corrections, the final check of coding guides included a check on the correct implementation of key corrections located in scoring rubrics, which were pending from the field trial.
Verification of operational manualsFor the PISA 2009 field trial, the verification of operational manuals (the school co-ordinator manual and the test administrator manual or the combined school associate manual) was limited to a number of “specified parts” in these materials.
Manuals are submitted for verification together with the Manuals Adaptation Spreadsheets (MAS). The purpose of the MAS is to document all content-related deviations from the international reference versions, and to indicate the location in the national materials of the specified parts subject to verification. Similarly to questionnaires, the national adaptations are subject to clearance by ACER before the material is submitted for verification. The verifiers’ brief is to check whether the specified parts in manuals are faithful to the source version, taking into account approved adaptations.
The verification process was significantly modified for the PISA 2009 field trial from the PISA 2006 main survey. Verifiers were provided with a specially customised MAS based on the agreed MAS provided by ACER. Only three columns of the MAS remained visible for the verifiers: location of the specified part in the national version (checked and completed where necessary by the cApStAn co-ordinator), the approved English translation of the national version (completed by the cApStAn co-ordinator based on the source version and the agreed adaptations), and a column for reporting possible deviations and/or for adding comments. The verifiers did not receive the source manuals. The intention was to make the verification process simpler for the verifiers.
The verifiers were asked to verify the specified parts in the target manuals for equivalence (and linguistic correctness) against the approved back-translation available in the MAS, and to report mismatches. Purely linguistic corrections could be introduced directly in the manuals without further comments in the MAS.
For the verifiers the procedure was clearer and less time-consuming than the one used previously. Significant progress was achieved by dropping the test administrator script3 (which can be heavily adapted) from the specified parts. Limiting the verification of the script to just timing information reduced the time for reporting country-specific peculiarities of test session administration.
The approach adopted for the PISA 2009 main survey was to carry out a verification limited to key components (as in the field trial), but only for those countries for which significant manuals-related issues were identified in the field trial.
The verification process had already been significantly facilitated for verifiers for the field trial and this continued for the main survey. In practice the bulk of the verification work on manuals is carried out by cApStAn, with verifiers then consulted as needed. Extensive explanations have been provided in previous verification reports on the reasons for involving verifiers the least possible in manual verifications.
Verification of Digital Reading Assessment (DRA) unitsThe materials submitted by countries for the main survey verification had been translated and verified by national centres in the field trial, and their national adaptations (intentional deviations from the source versions to conform to local usage or to avoid respondents from that country being put at a disadvantage or an advantage arising from a straightforward translation) had been discussed with the Consortium referee at field trial.
The adaptation approval process and the verification process were documented in a DRA Adaptation Workbook (EAW, in Excel® format), which supplemented the assessment units in XLIFF (tagged xml localisation file format) files. The EAW contained separate entries for the Consortium’s changes versus the field trial version and for the Consortium’s recommendations. Coding guides were excluded from international verification.
All DRA verifiers attended a one-day training session. The first part of the training seminar consisted of i) a brief description of the materials to be verified; ii) a presentation introducing the new procedures, with special focus on the
5TranslaTion and VerificaTion of The TesT and surVey maTerial
96 © OECD 2012 – PISA 2009 TECHNICAL REPORT
Notes
1. For a description of the development of the English source version of the digital reading assessment please see Chapter 2.
2. Available at www.pisa.oecd.org > what PISA produces > PISA 2009 > PISA 2009 manuals and guidelines.
3. The text read out to the students before the test.
new taxonomy for verifiers’ interventions, and on how to document verification more accurately; and (iii) a hands-on presentation of the DRA Translation Management System (TMS). The second part of the training seminar was a hands-on exercise using the EAW, the TMS as well as the Open Language Tool Translation Editor (OLT).
The verification procedure included the same steps as for paper-and-pencil units: corrections implemented by verifiers in the units, documentation of significant corrections in the monitoring instrument (named EAW in the case of DRA but similar design to the test adaptation spreadsheet), review by the Consortium referee and key corrections process, and Final Optical Check (FOC) including check of compliance with key corrections.
Quantitative analyses of verification outcomesIn PISA 2000 and PISA 2003, verification reports contained qualitative information about the national versions and illustrative examples of typical errors encountered by the verifiers. As of the PISA 2006 main survey, the instruments used to document the verification were designed to generate statistics, and some quantitative data is available. The verification statistics by item and by unit yielded information on translation and adaptation difficulties encountered for specific items in specific languages or groups of languages. This type of information, when gathered during the field trial, could be instrumental in revising items for the main survey but would also give valuable information on how to avoid such problems in further cycles. The verification report includes all data and country names and is a confidential document reviewed by the Technical Advisory Group. Each country received its own report and data.
This information also makes it possible to detect whether there are items that elicited many verifier interventions in almost all language groups. When this occurs, item developers would be prompted to re-examine the item’s reliability or relevance. Similarly, observing the number of adaptations that the countries proposed for some items may give the item developers additional insight into how difficult it is for some countries to make the item suitable for their students. While such adaptations may be discussed with the Consortium, it remains likely that extensively adapted items will eventually differ from the source version (e.g. in terms of reading difficulty).
The verification reports for the PISA 2009 field trial and PISA 2009 main survey include sections with quantitative analyses conducted on verification and assessment booklet final optical check (FOC) outcomes. They also contain pointers and directions for further work that could be carried out in this direction, as of the PISA 2009 field trial. NPMs have shown a keen interest in this type of analysis.
SuMMary oF iteMS deleted at the national level, due to tranSlation, Printing or layout errorSIn all cases when large DIF or other serious flaws were identified in specific items, the NPMs were asked to review their translation of the item and to provide the Consortium with possible explanations.
No obvious translation error was found in a majority of cases. However, some residual errors could be identified, that had been overlooked by the NPMs, the verifier and the Consortium. Out of the 221 reading, mathematics and science items, 63 items were omitted out of a total of 117 occurrences for the computation of national scores for the following reasons:
•mistranslations or confusing translations: 31 items
•poor printing: 13 items
•layout issues: 62 items
6
PISA 2009 TECHNICAL REPORT – © OECD 2012 97
Field Operations
Overview of roles and responsibilities ....................................................................................................... 98
The selection of the school sample............................................................................................................... 99
Preparation of test booklets, questionnaires and manuals .................................................... 100
Selection of the student sample ................................................................................................................... 101
Packaging and shipping materials ............................................................................................................... 101
Receipt of materials at the national centre after testing ............................................................ 102
Coding of the tests and questionnaires .................................................................................................. 102
Data entry, data checking and file submission ................................................................................. 113
The main survey review ....................................................................................................................................... 113

98 © OECD 2012 – PISA 2009 TECHNICAL REPORT
6Field operations
overview oF roleS and reSPonSibilitieSPISA was co-ordinated in each country by a National Project Manager (NPM) who implemented the procedures prepared by the Consortium. Each NPM typically had several assistants, working from a base location that is referred to throughout this report as a national centre. For the school level operations the NPM coordinated activities with school level staff, referred to in PISA as School Co-ordinators (SCs). Trained Test Administrators (TAs) administered the PISA assessment in schools.
National Project ManagersNPMs were responsible for implementing the project within their own country. They:
•attended NPM meetings and received training in all aspects of PISA operational procedures;
•negotiated nationally specific aspects of the implementation of PISA with the Consortium, such as national and international options, oversampling for regional comparisons, additional analyses and reporting, e.g. by language group;
•established procedures for the security and protection of the confidentiality of materials during all phases of the implementation;
•prepared a series of sampling forms documenting sampling related aspects of the national educational structure;
•prepared the school sampling frame and submitted this to the Consortium for the selection of the school sample;
•organised for the preparation of national versions of the test instruments, questionnaires, manuals and coding guides;
•identified school co-ordinators from each of the sampled schools (nominated by the school principal or a volunteer from the school staff) and worked with them on school preparation activities;
•selected the student sample from a list of eligible students provided by the school co-ordinators;
•recruited and trained test administrators according to the Technical Standards for PISA 2009, Standards 6.1, 6.2, and 6.3 to administer the tests within schools;
•nominated suitable persons to work on behalf of the Consortium as external quality monitors to observe the test administration in a selection of schools;
•recruited and trained coders to code the open-ended items;
•arranged for the data entry of the test and questionnaire responses, and submitted the national database of responses to the Consortium; and
•submitted a written review of PISA implementation activities following the assessment.
A National Project Manager’s Manual provided detailed information about the duties and responsibilities of the NPM. Supplementary manuals, with detailed information about particular aspects of the project, were also provided. These included:
•A School Sampling Preparation Manual, which provided instructions to the NPM for documenting school sampling related issues such as the definition of the target population, school level exclusions, the proportion of small schools in the sample and so on. Instructions for the preparation of the sampling frame, i.e. the list of all schools containing PISA eligible students, were detailed in this manual.
•A Data Management Manual, which described all aspects of the use of KeyQuest, the data entry software prepared by the Consortium for the data entry of responses from the tracking instruments, test booklets and questionnaires.
School Co-ordinatorsSchool Co-ordinators (SCs) co-ordinated school-related activities with the national centre and the test administrators.
The SCs:
•established the testing date and time in consultation with the NPM;
•prepared the student listing form with the names of all eligible students in the school and sent it to the NPM so that the NPM could select the student sample;
•received the list of sampled students on the student tracking form from the NPM and updated it if necessary, including identifying students with disabilities or limited test language proficiency who could not take the test according to criteria established by the Consortium;
•received, distributed and collected the school questionnaire;
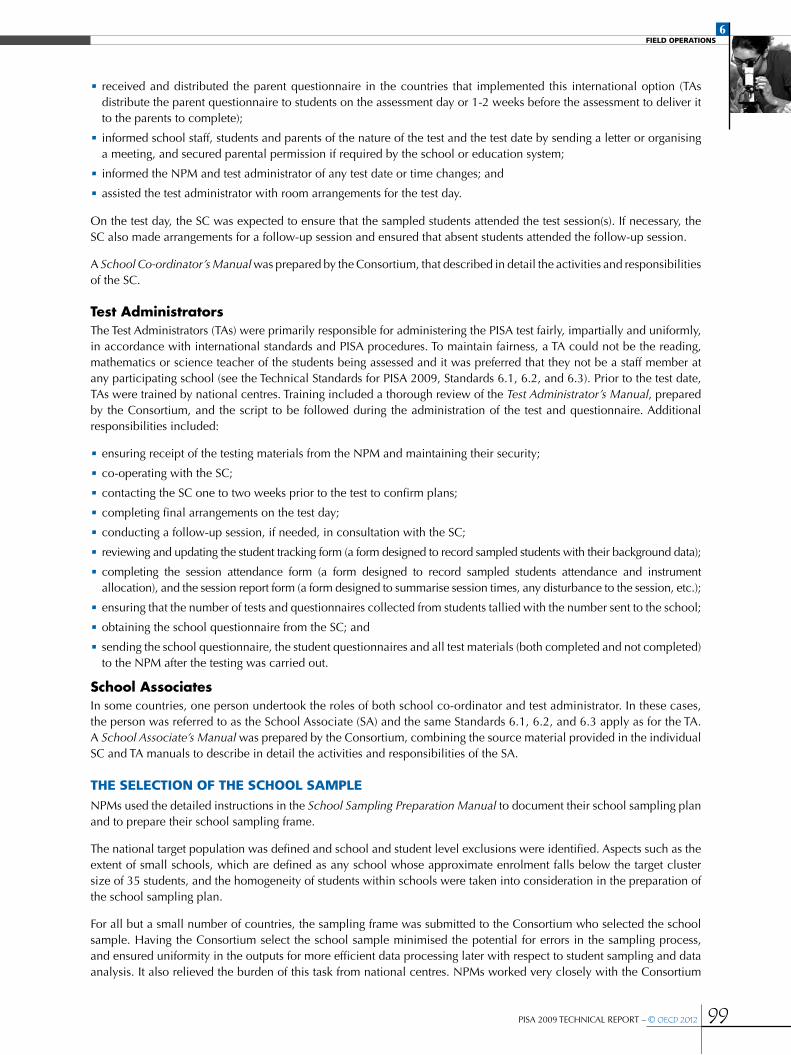
PISA 2009 TECHNICAL REPORT – © OECD 2012 99
6Field operations
•received and distributed the parent questionnaire in the countries that implemented this international option (TAs distribute the parent questionnaire to students on the assessment day or 1-2 weeks before the assessment to deliver it to the parents to complete);
•informed school staff, students and parents of the nature of the test and the test date by sending a letter or organising a meeting, and secured parental permission if required by the school or education system;
•informed the NPM and test administrator of any test date or time changes; and
•assisted the test administrator with room arrangements for the test day.
On the test day, the SC was expected to ensure that the sampled students attended the test session(s). If necessary, the SC also made arrangements for a follow-up session and ensured that absent students attended the follow-up session.
A School Co-ordinator’s Manual was prepared by the Consortium, that described in detail the activities and responsibilities of the SC.
Test AdministratorsThe Test Administrators (TAs) were primarily responsible for administering the PISA test fairly, impartially and uniformly, in accordance with international standards and PISA procedures. To maintain fairness, a TA could not be the reading, mathematics or science teacher of the students being assessed and it was preferred that they not be a staff member at any participating school (see the Technical Standards for PISA 2009, Standards 6.1, 6.2, and 6.3). Prior to the test date, TAs were trained by national centres. Training included a thorough review of the Test Administrator’s Manual, prepared by the Consortium, and the script to be followed during the administration of the test and questionnaire. Additional responsibilities included:
•ensuring receipt of the testing materials from the NPM and maintaining their security;
•co-operating with the SC;
•contacting the SC one to two weeks prior to the test to confirm plans;
•completing final arrangements on the test day;
•conducting a follow-up session, if needed, in consultation with the SC;
•reviewing and updating the student tracking form (a form designed to record sampled students with their background data);
•completing the session attendance form (a form designed to record sampled students attendance and instrument allocation), and the session report form (a form designed to summarise session times, any disturbance to the session, etc.);
•ensuring that the number of tests and questionnaires collected from students tallied with the number sent to the school;
•obtaining the school questionnaire from the SC; and
•sending the school questionnaire, the student questionnaires and all test materials (both completed and not completed) to the NPM after the testing was carried out.
School AssociatesIn some countries, one person undertook the roles of both school co-ordinator and test administrator. In these cases, the person was referred to as the School Associate (SA) and the same Standards 6.1, 6.2, and 6.3 apply as for the TA. A School Associate’s Manual was prepared by the Consortium, combining the source material provided in the individual SC and TA manuals to describe in detail the activities and responsibilities of the SA.
the Selection oF the School SaMPleNPMs used the detailed instructions in the School Sampling Preparation Manual to document their school sampling plan and to prepare their school sampling frame.
The national target population was defined and school and student level exclusions were identified. Aspects such as the extent of small schools, which are defined as any school whose approximate enrolment falls below the target cluster size of 35 students, and the homogeneity of students within schools were taken into consideration in the preparation of the school sampling plan.
For all but a small number of countries, the sampling frame was submitted to the Consortium who selected the school sample. Having the Consortium select the school sample minimised the potential for errors in the sampling process, and ensured uniformity in the outputs for more efficient data processing later with respect to student sampling and data analysis. It also relieved the burden of this task from national centres. NPMs worked very closely with the Consortium

100 © OECD 2012 – PISA 2009 TECHNICAL REPORT
6Field operations
throughout the process of preparing the sampling documentation, ensuring that all nationally specific considerations related to sampling were thoroughly documented and incorporated into the school sampling plan.
All countries were required to thoroughly document their school sampling plan. If there was any deviation noted, the national centre was required to explain the sampling methods used in detail, to ensure that they were consistent with those used by the Consortium. In these cases, the standard procedure the Consortium used to check that the national school sampling had been implemented correctly was to draw a parallel sample using its international procedures and compare the two samples. Further details about sampling for the main study are provided in Chapter 4.
PreParation oF teSt booKletS, QueStionnaireS and ManualSAs described in Chapter 2, thirteen different test booklets had to be assembled with clusters of test items arranged according to the test booklet design specified by the Consortium. Test items were presented in units (stimulus material and items relating to the stimulus) and each cluster contained several units. Test units and questionnaire items were initially sent to NPMs several months before the testing dates, allowing adequate time for items to be translated. Units allocated to clusters and clusters allocated to booklets were provided a few weeks later, together with detailed instructions to NPMs about how to assemble their translated or adapted clusters into booklets.
For reference, source versions of all booklets were provided to NPMs in both English and French and were also available through a secure website. NPMs were encouraged to use the cover design provided by the OECD. In formatting translated or adapted test booklets, they had to follow the layout in the source versions as much as possible, including allocation of items to pages.
NPMs were required to submit their cognitive material in units, along with a form documenting any proposed national adaptations for verification by the Consortium. NPMs incorporated feedback from the verifier into their material and assembled the test booklets. These were submitted once more to the Consortium, which performed a final optical check of the materials. This was a verification of the layout, instructions to the student, the rendering of graphic material, etc. Once feedback from the final optical check had been received and incorporated into the test booklets, the NPM was ready to send the materials to print.
The student questionnaire contained one or two modules, according to whether the information communication technology (ICT) familiarity questionnaire component was being added to the core component. Forty-five countries administered the ICT familiarity questionnaire. The core component had to be presented first in the questionnaire booklet.
Fourteen countries also administered the optional parent questionnaire, and twenty countries administered the questionnaire on educational career.
As with the test material, source versions of the questionnaire instruments in both French and English were provided to NPMs for translation into the test languages.
NPMs were permitted to add questions of national interest as national options to the questionnaires. Proposals and text for these were submitted to the Consortium for approval as part of the process of reviewing adaptations to the questionnaires. It was recommended that the additional material should be placed at the end of the international modules. The student questionnaire was modified more often than the school questionnaire.
NPMs were required to submit a form documenting all proposed national adaptations to questionnaire items to the Consortium for approval. Following approval of adaptations, the material was verified by the Consortium. NPMs implemented feedback from verification in the assembly of their questionnaires, which were submitted once more in order to conduct a final optical check of the layout, etc. Following feedback from the final optical check, NPMs made final changes to their questionnaires prior to printing.
The School Co-ordinator’s Manual and Test Administrator’s Manual (or the School Associate Manual for those countries that combined the roles of the SC and TA) were also required to be translated into the language of instruction. French and English source versions of each manual were provided by the Consortium. NPMs were required to submit a form documenting all proposed national adaptations to the manuals to the Consortium for approval. Following approval of the adaptations, the manuals were prepared and submitted to the Consortium. A verification of key elements called “specified parts” of the manuals – those related to the coding of the tracking instruments and the administration of the test – was conducted. NPMs implemented feedback from the verifier into their manuals prior to printing. A final optical check was not required for the manuals.
PISA 2009 TECHNICAL REPORT – © OECD 2012 101
6Field operations
In countries with multiple languages, the test instruments and manuals needed to be translated into each test language. For a small number of countries, where test administrators were bilingual in the test language and the national language, it was not required for the whole of the manuals to be translated into both languages. However in these cases it was a requirement that the test script, included within the TA manual, was translated into the language of the test.
Selection oF the Student SaMPleFollowing the selection of the school sample by the Consortium, the list of sampled schools was returned to national centres. NPMs then contacted these schools and requested a list of all PISA-eligible students from each school. This was provided on the List of Students, and was used by NPMs to select the student sample.
NPMs were required in most cases to select the student sample using KeyQuest, the PISA student sampling and data entry software prepared by the Consortium. KeyQuest generated the list of sampled students for each school, known as the Student Tracking Form and the Session Attendance Form that served as the central administration documents for the study and linked students, test booklets and student questionnaires.
Only in exceptional circumstances were NPMs permitted to select their student sample without using KeyQuest (approximately 3% of total cases). Alternative sampling procedures required the approval of the Consortium prior to implementation.
PacKaging and ShiPPing MaterialSRegardless of how materials were packaged and shipped, the following needed to be sent either to the TA or to the school:
•test booklets and student questionnaires for the number of students sampled
•student tracking form
•session attendance form
•two copies of the session report form
•materials reception form
•materials return form
•additional materials, e.g. rulers and calculators, as per local circumstances
•additional school and student questionnaires and a bundle of extra test booklets
Of the thirteen separate test booklets, one was pre-allocated to each student by the KeyQuest software from a random starting point in each school. KeyQuest was then used to generate the school’s session attendance form, which contained the number of the allocated booklet alongside each sampled student’s name.
It was recommended that labels be printed, each with a student identification number and test booklet number allocated to that identification, as well as the student’s name if this was an acceptable procedure within the country. Two or three copies of each student’s label could be printed, and used to identify the test booklet, the questionnaire, and a packing envelope if used.
NPMs were allowed some flexibility in how the materials were packaged and distributed, depending on national circumstances. It was specified however that the test booklets for a school be packaged so that they remained secure, possibly by wrapping them in clear plastic and then heat-sealing the package, or by sealing each booklet in a labelled envelope. Three scenarios, summarised here, were described as illustrative of acceptable approaches to packaging and shipping the assessment materials:
•Country A: All assessment materials shipped directly to the schools; school staff (not teachers of the students in the assessment) to conduct the testing sessions; materials assigned to students before packaging; materials labelled and then sealed in envelopes also labelled with the students’ names and identification numbers.
•Country B: Materials shipped directly to the schools; external test administrators employed by the national centre to administer the tests; the order of the booklets in each bundle matches the order on the session attendance form; after the assessment has been completed, booklets are inserted into envelopes labelled with the students’ names and identification numbers and sealed.
•Country C: Materials shipped to test administrators employed by the national centre; bundles of 35 booklets sealed in plastic, so that the number of booklets can be checked without opening the packages; TAs open the bundle immediately prior to the session and label the booklets with the students’ names and ID numbers from the student tracking form.

102 © OECD 2012 – PISA 2009 TECHNICAL REPORT
6Field operations
receiPt oF MaterialS at the national centre aFter teStingIt was recommended that the national centre establish a database of schools before testing began in order to record the shipment of materials to and from schools, keep tallies of materials sent and returned, and monitor the progress of the materials throughout the various steps in processing booklets after the testing.
It was also recommended that upon receipt of materials back from schools, the counts of completed and unused booklets be checked against the participation status information recorded on the student tracking form by the TA.
coding oF the teStS and QueStionnaireSThis section describes PISA’s coding procedures, including multiple coding, and makes brief reference to pre-coding of responses to a few items in the student questionnaire. Overall, 38% of the cognitive items across reading, mathematics, and science domains required manual coding by trained coders.
This was a complex operation, as booklets had to be randomly assigned to coders and, for the minimum recommended sample size per country of 4 500 students, more than 99 000 responses had to be evaluated. An average of 22 items from each of the 13 booklets required evaluation.
It is crucial for comparability of results in a study such as PISA that students’ responses are scored uniformly from coder to coder and from country to country. Comprehensive criteria for coding, including many examples of acceptable and unacceptable responses, were prepared by the Consortium and provided to NPMs in coding guides for each of the three domains: reading, mathematics, and science.
Preparing for codingIn setting up the coding of students’ responses to open-ended items, NPMs had to carry out or oversee several steps:
•adapt or translate the coding guides as needed and submit these to the Consortium for verification;
•recruit and train coders;
•locate suitable local examples of responses to use in training and practice;
•organise booklets as they were returned from schools;
•select booklets for multiple coding;
•do the single coding of booklets according to the international design (see Figures 6.2 - 6.7);
•do the multiple coding of a selected sub-sample of booklets for the reliability study according to the international design (see Figures 6.8, 6.9 and 6.10) once the single coding was completed; and
•submit a sub-sample of booklets for the International Coding Review (see Chapter 13).
Detailed instructions for each step were provided in the Procedures for Coding Constructed-Response Items MS09. Key aspects of the process are included here.
International coder trainingRepresentatives from each national centre were required to attend two international coder training sessions – one immediately prior to the field trial and one immediately prior to the main survey. At the training sessions Consortium staff familiarised national centre staff with the coding guides and their interpretation.
StaffingNPMs were responsible for recruiting appropriately qualified people to carry out the single and multiple coding of the test booklets. In some countries, pools of experienced coders from other projects could be called upon. It was not necessary for coders to have high-level academic qualifications, but they needed to have a good understanding of either mid-secondary level mathematics and science or the language of the test, and to be familiar with ways in which secondary-level students express themselves. Teachers on leave, recently retired teachers and senior teacher trainees were all considered to be potentially suitable coders. An important factor in recruiting coders was that they could commit their time to the project for the duration of the coding, which was expected to take up to one month.
The Consortium provided a coder recruitment kit to assist NPMs in screening applicants. These materials were similar in nature to the coding guides, but were much more brief. They were designed so that applicants who were considered to be potentially suitable could be given a brief training session, after which they coded some student responses. Guidelines for assessing the results of this exercise were supplied. The materials also provided applicants with the

PISA 2009 TECHNICAL REPORT – © OECD 2012 103
6Field operations
opportunity to assess their own suitability for the task. The number of coders required was governed by the design for multiple coding (described in a later section). For the main survey, it was recommended to have 16 coders to code reading, 8 coders to code mathematics, and an additional 8 coders to code science. Other possible coding designs were 16 reading and 8 mathematics and science coders or 16 reading, 4 mathematics and 4 science coders. All three coding designs were prepared for both standard and easier set of booklets and acceptable variations to the designs were detailed in a document Coding design options_MS09.xls. These numbers of coders were considered to be adequate for countries testing between 4 500 (the minimum number required) and 6 000 students to meet the timeline of submitting their data within 3 months of testing.
For larger numbers of students or in cases where coders would code across different combinations of domains, NPMs could prepare their own design and submit it to the Consortium for approval. A minimum of four coders were required in each domain to satisfy the requirements of the multiple coding design. Given that several weeks were required to complete the coding, it was recommended that at least two back-up coders of reading and one back-up coder of mathematics and science be trained and included in at least some of the coding sessions.
The coding process was complex enough to require a full-time overall supervisor of activities who was familiar with the logistical aspects of the coding design, the procedures for checking coder reliability, the coding schedules and the content of the tests and coding guides.
NPMs were also required to designate persons with subject-matter expertise, familiarity with the PISA tests and, if possible, experience in coding student responses to open-ended items to act as table leaders during the coding. Table leaders were expected to participate in the actual coding and spend extra time monitoring consistency. Good table leaders were essential to the quality of the coding, as their main role was to monitor coders’ consistency in applying the coding criteria. They also assisted with the flow of booklets, and fielded and resolved queries about the coding guide and about particular student responses in relation to the guide, consulting the supervisor as necessary when queries could not be resolved. The supervisor was then responsible for checking such queries with the Consortium.
People were also needed to unpack, check and assemble booklets into labelled bundles so that coders could respect the specified design for randomly allocating sets of booklets to coders.
Consortium coding query serviceA coding query service was provided by the Consortium in case questions arose about particular items that could not be resolved at the national centre. Responses to coding queries were placed on the website, accessible to the NPMs from all participating countries.
Confidentiality formsBefore seeing or receiving any copies of PISA test materials, prospective coders were required to sign a confidentiality form, obligating them not to disclose the content of the PISA tests beyond the groups of coders and trainers with whom they would be working.
National trainingAnyone who coded the PISA main survey test booklets had to participate in specific training sessions, regardless of whether they had had related experience or had been involved in the PISA field trial coding. To assist NPMs in carrying out the training, the Consortium prepared training materials in addition to the detailed coding guides. Training within a country could be carried out by the NPM or by one or more knowledgeable persons appointed by the NPM. Subject matter knowledge was important for the trainer as was an understanding of the procedures, which usually meant that more than one person was involved in leading the training.
The recommended allocation of booklets to coders assumed coding by cluster. This involved completing the coding of each item separately within a cluster within all of the booklets allocated to the coder before moving to the next item, and completing one cluster before moving to the next.
Coders were trained by cluster for the seven reading clusters, the three mathematics clusters and the three science clusters. During a training session, the trainer reviewed the coding guide for a cluster of units with the coders, and then had the coders assign codes to some sample items for which the appropriate codes had been supplied by the Consortium. The trainer reviewed the results with the group, allowing time for discussion, querying and clarification of reasons for the pre-assigned codes. Trainees then proceeded to independently code some local examples that had

104 © OECD 2012 – PISA 2009 TECHNICAL REPORT
6Field operations
been carefully selected by the coding supervisor in conjunction with national centre staff. It was recommended that prospective coders be informed at the beginning of training that they would be expected to apply the coding guides with a high level of consistency, and that reliability checks would be made frequently by table leaders and the overall supervisor as part of the coding process.
Ideally, table leaders were trained before the larger groups of coders since they needed to be thoroughly familiar with both the test items and the coding guides. The coding supervisor explained these to the point where the table leaders could code and reach a consensus on the selected local examples to be used later with the larger group of trainees. They also participated in the training sessions with the rest of the coders, partly to strengthen their own knowledge of the coding guides and partly to assist the supervisor in discussions with the trainees of their pre-agreed codes to the sample items. Table leaders received additional training in the procedures for monitoring the consistency with which coders applied the criteria.
Length of coding sessionsCoding responses to open-ended items is mentally demanding, requiring a level of concentration that cannot be maintained for long periods of time. It was therefore recommended that coders work for no more than six hours per day on actual coding, and take two or three breaks for coffee and lunch. Table leaders needed to work longer on most days so that they had adequate time for their monitoring activities.
Logistics prior to coding
Sorting bookletsWhen booklets arrived back at the national centre, they were first tallied and checked against the session participation codes on the session attendance form. Unused and used booklets were separated; used booklets were sorted by student identification number if they had not been sent back in that order and then were separated by booklet number; and school bundles were kept in school identification order, filling in sequence gaps as packages arrived. Session attendance forms were copied, and the copies filed in school identification order. If the school identification number order did not correspond with the alphabetical order of school names, it was recommended that an index of school names against school identification numbers be prepared and kept with the binders.
Because of the time frame within which countries had to have all their coding done and data submitted to the Consortium, it was usually impossible to wait for all materials to reach the national centre before beginning to code. In order to manage the design for allocating booklets to coders, however, it was recommended to start coding only when at least half of the booklets had been returned.
Selection of booklets for multiple codingEach country was required to set aside 100 of each booklet from a standard set of booklets (1-13) or from an easier set of booklets (8-13 and 21-27) for multiple coding. For the 2009 PISA main survey only items from the first cluster in each booklet were multiple coded. This meant that there were three clusters left over from these multiple coded booklets that needed to be single coded. Because of the complexity of the single coding operation, the yellow and blue batches were introduced:
•The batches of booklets selected for the single coding operation were called “The Yellow Batches” and they were labelled with numbers 1 to 16.
•The batches of booklets selected for the multiple coding operation were called “The Blue Batches” and they were labelled with letters A, B, C and D.
The main objective in setting aside the booklets for multiple coding was to ensure that the selection contained a wide spread of schools and students across the whole sample and that it was as random as possible. The simplest method for carrying out the selection was to use a ratio approach based on the expected total number of completed booklets.
In most countries, approximately 400 of each booklet were expected to be completed, so the selection of booklets to be set aside for multiple coding required that approximately one in every four booklets was selected. Depending on the actual numbers of completed booklets received, the selection ratios needed to be adjusted so that the correct numbers of each booklet were selected from the full range of participating schools.

PISA 2009 TECHNICAL REPORT – © OECD 2012 105
6Field operations
In a country where booklets were provided in more than one language, if the language represented 20% or more of the target population, the 650 booklets to be set aside for multiple coding were allocated in proportion to the language group. Multiple coding was not required for languages representing less than 20% of the target population.
Booklets for single codingSingle coding was required for all clusters within booklets in the yellow batches (single coding stage 1) and for the second, third and fourth clusters within booklets in the blue batches selected for multiple coding (single coding at stage 2). Some items requiring coding did not need to be included in the multiple coding. These were closed constructed response items that required a coder to assign a right or wrong code, but did not require any coder judgement. The coders in the single-coding process at stage 2 coded these items in the booklets set aside for multiple coding, as well as the items requiring single coding from the remaining second, third, and fourth clusters. Other items such as multiple-choice response items required no coding and were directly data-entered.
How codes were shownA string of small code numbers corresponding to the possible codes for the item as delineated in the relevant coding guide appeared in the upper right-hand side of each item in the test booklets. For booklets being processed by a single coder, the code assigned was indicated directly in the booklet by circling the appropriate code number alongside the item. Tailored coding record sheets were prepared for each booklet for the multiple coding and used by all but the last coder so that each coder undertaking multiple coding did not know which codes other coders had assigned.
For the reading clusters, item codes were often just 0, 1 and 9, indicating incorrect, correct and missing, respectively. Provision was made for some of the open-ended items to be coded as partially correct, usually with “2” as fully correct and “1” as partially correct.
For the mathematics and science clusters, a two-digit coding scheme was adopted for the items requiring constructed responses. The first digit represented the degree of correctness code, as in reading; the second indicated the content of the response or the type of solution method used by the student.
Coder identification numbersCoder identification numbers were assigned according to a standard three-digit format specified by the Consortium. The first digit showed the combination of domains that the coder would be working across, and the second and third digits had to uniquely identify the coders within their set. For example, 16 coders coding across the domains of reading and science were given identification numbers 601 to 616. Eight coders who coded just mathematics were given identification numbers 101 to 108. Coder identification numbers were used for two purposes: implementing the design for allocating booklets to coders and monitoring coder consistency in the multiple-coding exercises.
Coding operationThe whole coding operation had four stages (see Figure 6.1).
PISA 2009 MAIN STUDY CODING DESIGN
Single Coding multiple Coding
Stage 1 Stage 2 Stage 3 Stage 4
Reading, mathematics and science clusters in yellow
batches 1-16
Reading, mathematics and science clusters in blue
batches A,B,C,D
Reading, mathematics and science clusters in blue
batches A,B,C,D
Reading, mathematics and science clusters in blue
batches A,B,C,D
Booklets selected forsingle coding
Booklets selected for multiple coding
Booklets selected for multiple coding
Booklets selected for multiple coding
Groups of 4 coders Groups of 4 coders
First three rounds of coding into multiple coding
record sheetsFourth round of coding
directly into test booklets
• Figure 6.1 •PiSa 2009 Main Survey coding design

106 © OECD 2012 – PISA 2009 TECHNICAL REPORT
6Field operations
The single coding consisted of the two stages. In stage 1 coders worked only with the yellow batches from 1 to 16 and they coded all reading, mathematics, and science clusters from booklets selected only for single coding. In stage 2 coders worked only with the blue batches A, B, C and D. They single coded all second, third, and fourth reading, mathematics, and science clusters from booklets selected only for multiple coding.
The multiple coding also consisted of two stages. In stage 3 coders worked only with the blue batches A, B, C and D and they coded first reading, mathematics and science clusters from booklets selected only for multiple coding. Groups of four coders recorded the first three rounds of coding into multiple coding record sheets. In stage 4 coders worked only with the blue batches and again they coded first reading, mathematics and science clusters from booklets selected only for multiple coding. Groups of four coders recorded the fourth round of coding directly into the test booklets.
Single coding designThe design was organised so that all appearances of each cluster type involved in the single coding were coded together. This arrangement entailed coders working with several booklet types at the same time, and at times required space for partly coded booklets to be stored while other booklets were being worked on. However organising the coding this way had the substantial benefits of:
•more accurate and consistent coding (because training and coding are more closely linked); and
•minimising effects of coder leniency or harshness (more than one coder codes each booklet and coders code across the range of schools sampled).
Coding operation could be conducted in two waves. The first wave begins, when, say, 60% of the booklets are returned to the centre. After receiving all the remaining 40% of booklets from schools, the second wave begins.
Step 1 in Figure 6.2, for example, represents the training and coding sequence. Coding of all items in the cluster identified in one row should be completed before proceeding to training of the cluster identified in the following row. Each cluster from booklets 1-13 occurs in four booklets, and so several booklets are sometimes required for a coding step (i.e. a row in a table). Four booklets are included in the coding of cluster R1 in this step. At stage 1 the blue batches are not used.
Once wave 1 is completed, and the remaining 40% booklets are back, wave 2 of the single coding operation begins. At stage 1 each of the yellow batches is specifically allocated to a particular coder. At stage 2 the blue batches are needed. The familiar coding steps shown at each row of the table involve the single coding of clusters from the blue batches.
If wave 1 begins when 60% of the booklets have been returned to the centre, with a typical sample size of around 5 000 students, there will be 3 000 booklets coded during wave 1. Therefore, there will be about 3 000/13 = 230 of each booklet type. Sixty of each booklet type will have been selected for the multiple coding (i.e. 60% of the 100 of each booklet type required). For the moment these are just set aside. (At the start of wave 2, when all 100 of each booklet type are available, these booklets are allocated into the blue batches.) The remaining 170 booklets will be allocated to the yellow batches. There are 16 single coding batches, so there should be around 10 books in each batch. Each coder is allocated 4 of these batches. For example coder 201 is allocated batch 1 of booklets 1, 2, 9 and 13. So each coder will have around 40 booklets.
Once the wave 1 single coding has been completed, i.e. all of the clusters from 170 x 13 booklet types in the yellow batches have been single coded, wave 2 begins.
In wave 2, there should be around 2 000 booklets, around 160 of each booklet. Forty more of each booklet will be selected for multiple coding to make up the 100 booklets required. Each of the 100 books for each booklet type selected for multiple coding are allocated into 4 blue batches of 25 books each. The remaining 120 booklets from wave 2 are allocated into 16 yellow batches (an average of 7.5 per batch).
At stage 1 of wave 2 the coders get 4 yellow batches, so around 30 booklets to code. At stage 2, each blue batch has around 25 booklets, so the coding for this stage should be a little quicker than for the first stage.
Single coding of readingIn order to code by cluster, each coder needed to handle 4 of the 13 booklet types at a time. For example, reading cluster 1 (R1) occurred in booklets 1, 2, 9, and 13. Each of these appearances had to be coded before another cluster was started. Moreover, since coding was done item by item, the item was coded across these different booklet types before the next item was coded.
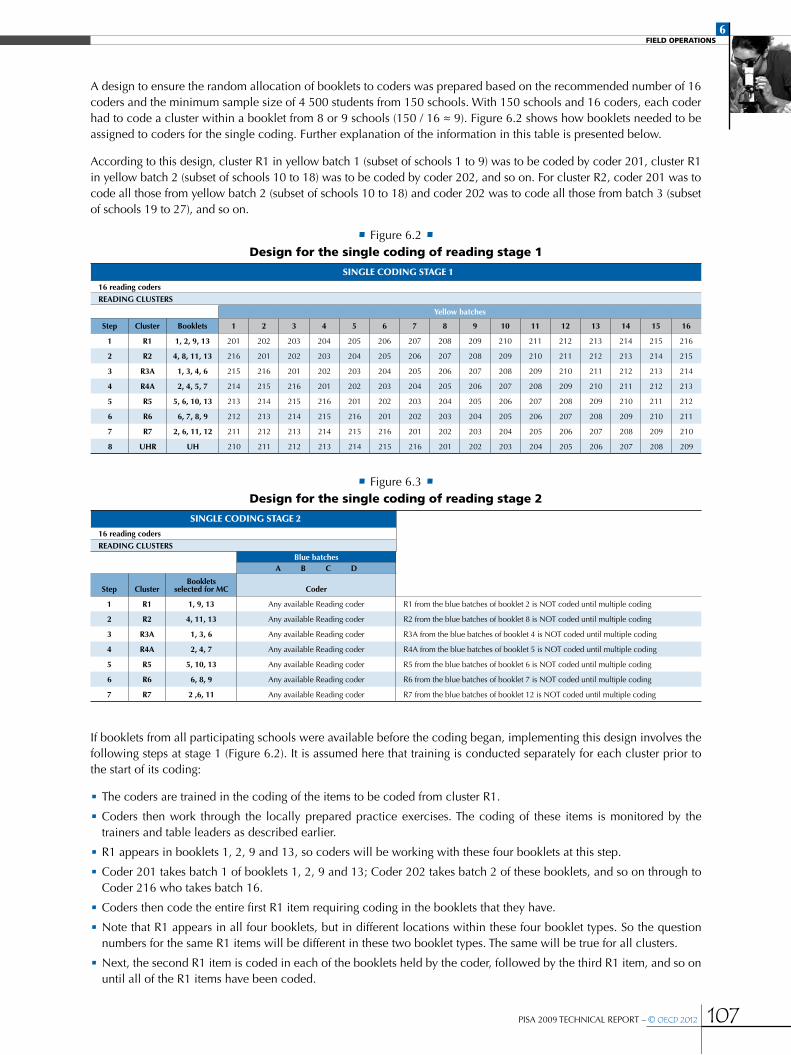
PISA 2009 TECHNICAL REPORT – © OECD 2012 107
6Field operations
A design to ensure the random allocation of booklets to coders was prepared based on the recommended number of 16 coders and the minimum sample size of 4 500 students from 150 schools. With 150 schools and 16 coders, each coder had to code a cluster within a booklet from 8 or 9 schools (150 / 16 ≈ 9). Figure 6.2 shows how booklets needed to be assigned to coders for the single coding. Further explanation of the information in this table is presented below.
According to this design, cluster R1 in yellow batch 1 (subset of schools 1 to 9) was to be coded by coder 201, cluster R1 in yellow batch 2 (subset of schools 10 to 18) was to be coded by coder 202, and so on. For cluster R2, coder 201 was to code all those from yellow batch 2 (subset of schools 10 to 18) and coder 202 was to code all those from batch 3 (subset of schools 19 to 27), and so on.
SINGLE CODING STAGE 1
16 reading coders
readIng CLuSterS
yellow batches
Step Cluster Booklets 1 2 3 4 5 6 7 8 9 10 11 12 13 14 15 16
1 r1 1, 2, 9, 13 201 202 203 204 205 206 207 208 209 210 211 212 213 214 215 216
2 r2 4, 8, 11, 13 216 201 202 203 204 205 206 207 208 209 210 211 212 213 214 215
3 r3a 1, 3, 4, 6 215 216 201 202 203 204 205 206 207 208 209 210 211 212 213 214
4 r4a 2, 4, 5, 7 214 215 216 201 202 203 204 205 206 207 208 209 210 211 212 213
5 r5 5, 6, 10, 13 213 214 215 216 201 202 203 204 205 206 207 208 209 210 211 212
6 r6 6, 7, 8, 9 212 213 214 215 216 201 202 203 204 205 206 207 208 209 210 211
7 r7 2, 6, 11, 12 211 212 213 214 215 216 201 202 203 204 205 206 207 208 209 210
8 uhr uh 210 211 212 213 214 215 216 201 202 203 204 205 206 207 208 209
• Figure 6.2 •design for the single coding of reading stage 1
SINGLE CODING STAGE 2
16 reading coders
readIng CLuSterS
• Figure 6.3 •design for the single coding of reading stage 2
Blue batchesa B C d
Step ClusterBooklets
selected for mC Coder
1 r1 1, 9, 13 Any available Reading coder R1 from the blue batches of booklet 2 is NOT coded until multiple coding
2 r2 4, 11, 13 Any available Reading coder R2 from the blue batches of booklet 8 is NOT coded until multiple coding
3 r3a 1, 3, 6 Any available Reading coder R3A from the blue batches of booklet 4 is NOT coded until multiple coding
4 r4a 2, 4, 7 Any available Reading coder R4A from the blue batches of booklet 5 is NOT coded until multiple coding
5 r5 5, 10, 13 Any available Reading coder R5 from the blue batches of booklet 6 is NOT coded until multiple coding
6 r6 6, 8, 9 Any available Reading coder R6 from the blue batches of booklet 7 is NOT coded until multiple coding
7 r7 2 ,6, 11 Any available Reading coder R7 from the blue batches of booklet 12 is NOT coded until multiple coding
If booklets from all participating schools were available before the coding began, implementing this design involves the following steps at stage 1 (Figure 6.2). It is assumed here that training is conducted separately for each cluster prior to the start of its coding:
•The coders are trained in the coding of the items to be coded from cluster R1.
•Coders then work through the locally prepared practice exercises. The coding of these items is monitored by the trainers and table leaders as described earlier.
•R1 appears in booklets 1, 2, 9 and 13, so coders will be working with these four booklets at this step.
•Coder 201 takes batch 1 of booklets 1, 2, 9 and 13; Coder 202 takes batch 2 of these booklets, and so on through to Coder 216 who takes batch 16.
•Coders then code the entire first R1 item requiring coding in the booklets that they have.
•Note that R1 appears in all four booklets, but in different locations within these four booklet types. So the question numbers for the same R1 items will be different in these two booklet types. The same will be true for all clusters.
•Next, the second R1 item is coded in each of the booklets held by the coder, followed by the third R1 item, and so on until all of the R1 items have been coded.
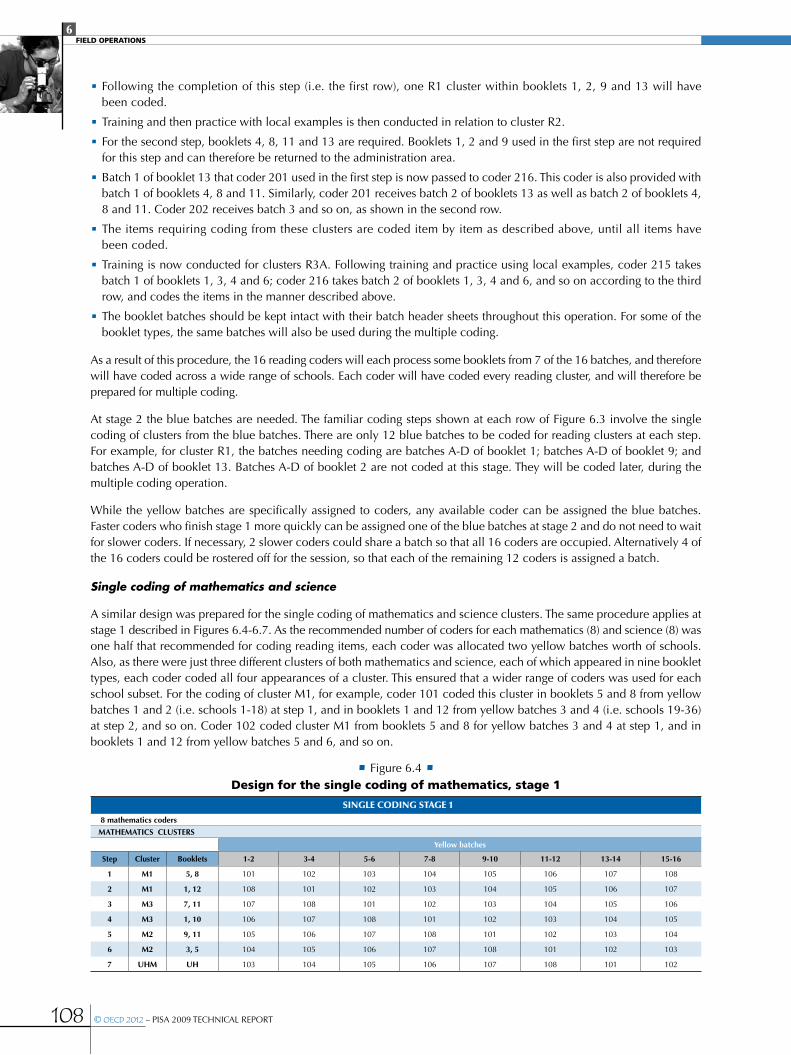
108 © OECD 2012 – PISA 2009 TECHNICAL REPORT
6Field operations
•Following the completion of this step (i.e. the first row), one R1 cluster within booklets 1, 2, 9 and 13 will have been coded.
•Training and then practice with local examples is then conducted in relation to cluster R2.
•For the second step, booklets 4, 8, 11 and 13 are required. Booklets 1, 2 and 9 used in the first step are not required for this step and can therefore be returned to the administration area.
•Batch 1 of booklet 13 that coder 201 used in the first step is now passed to coder 216. This coder is also provided with batch 1 of booklets 4, 8 and 11. Similarly, coder 201 receives batch 2 of booklets 13 as well as batch 2 of booklets 4, 8 and 11. Coder 202 receives batch 3 and so on, as shown in the second row.
•The items requiring coding from these clusters are coded item by item as described above, until all items have been coded.
•Training is now conducted for clusters R3A. Following training and practice using local examples, coder 215 takes batch 1 of booklets 1, 3, 4 and 6; coder 216 takes batch 2 of booklets 1, 3, 4 and 6, and so on according to the third row, and codes the items in the manner described above.
•The booklet batches should be kept intact with their batch header sheets throughout this operation. For some of the booklet types, the same batches will also be used during the multiple coding.
As a result of this procedure, the 16 reading coders will each process some booklets from 7 of the 16 batches, and therefore will have coded across a wide range of schools. Each coder will have coded every reading cluster, and will therefore be prepared for multiple coding.
At stage 2 the blue batches are needed. The familiar coding steps shown at each row of Figure 6.3 involve the single coding of clusters from the blue batches. There are only 12 blue batches to be coded for reading clusters at each step. For example, for cluster R1, the batches needing coding are batches A-D of booklet 1; batches A-D of booklet 9; and batches A-D of booklet 13. Batches A-D of booklet 2 are not coded at this stage. They will be coded later, during the multiple coding operation.
While the yellow batches are specifically assigned to coders, any available coder can be assigned the blue batches. Faster coders who finish stage 1 more quickly can be assigned one of the blue batches at stage 2 and do not need to wait for slower coders. If necessary, 2 slower coders could share a batch so that all 16 coders are occupied. Alternatively 4 of the 16 coders could be rostered off for the session, so that each of the remaining 12 coders is assigned a batch.
Single coding of mathematics and science
A similar design was prepared for the single coding of mathematics and science clusters. The same procedure applies at stage 1 described in Figures 6.4-6.7. As the recommended number of coders for each mathematics (8) and science (8) was one half that recommended for coding reading items, each coder was allocated two yellow batches worth of schools. Also, as there were just three different clusters of both mathematics and science, each of which appeared in nine booklet types, each coder coded all four appearances of a cluster. This ensured that a wider range of coders was used for each school subset. For the coding of cluster M1, for example, coder 101 coded this cluster in booklets 5 and 8 from yellow batches 1 and 2 (i.e. schools 1-18) at step 1, and in booklets 1 and 12 from yellow batches 3 and 4 (i.e. schools 19-36) at step 2, and so on. Coder 102 coded cluster M1 from booklets 5 and 8 for yellow batches 3 and 4 at step 1, and in booklets 1 and 12 from yellow batches 5 and 6, and so on.
SINGLE CODING STAGE 1
8 mathematics coders
mathematICS CLuSterS
yellow batches
Step Cluster Booklets 1-2 3-4 5-6 7-8 9-10 11-12 13-14 15-16
1 m1 5, 8 101 102 103 104 105 106 107 108
2 m1 1, 12 108 101 102 103 104 105 106 107
3 m3 7, 11 107 108 101 102 103 104 105 106
4 m3 1, 10 106 107 108 101 102 103 104 105
5 m2 9, 11 105 106 107 108 101 102 103 104
6 m2 3, 5 104 105 106 107 108 101 102 103
7 uhm uh 103 104 105 106 107 108 101 102
• Figure 6.4 •design for the single coding of mathematics, stage 1

PISA 2009 TECHNICAL REPORT – © OECD 2012 109
6Field operations
SINGLE CODING STAGE 1
8 science coders
SCIenCe CLuSterS
yellow batches
Step Cluster Booklets 1-2 3-4 5-6 7-8 9-10 11-12 13-14 15-16
1 S2 4, 12 301 302 303 304 305 306 307 308
2 S2 9, 10 308 301 302 303 304 305 306 307
3 S1 2, 10 307 308 301 302 303 304 305 306
4 S1 3, 8 306 307 308 301 302 303 304 305
5 S3 3, 7 305 306 307 308 301 302 303 304
6 S3 12, 13 304 305 306 307 308 301 302 303
7 uhS uh 303 304 305 306 307 308 301 302
SINGLE CODING STAGE 2
8 mathematics coders
mathematICS CLuSterS
SINGLE CODING STAGE 2
8 science coders
SCIenCe CLuSterS
• Figure 6.6 •design for the single coding of science, stage 1
• Figure 6.5 •design for the single coding of mathematics, stage 2
• Figure 6.7 •design for the single coding of science, stage 2
Blue batchesa B C d
Step ClusterBooklets
selected for mC Coder
1 m1 5, 8 Any available Mathematics coder
2 m1 12 Any available Mathematics coder M1 from the blue batches of booklet 1 is NOT coded until multiple coding
3 m3 7 Any available Mathematics coder M3 from the blue batches of booklet 11 is NOT coded until multiple coding
4 m3 1, 10 Any available Mathematics coder
5 m2 11 Any available Mathematics coder M2 from the blue batches of booklet 9 is NOT coded until multiple coding
6 m2 3, 5 Any available Mathematics coder
Blue batchesa B C d
Step ClusterBooklets
selected for mC Coder
1 S2 4, 12 Any available Science coder
2 S2 9 Any available Science coder S2 from the blue batches of booklet 10 is NOT coded until multiple coding
3 S1 2, 10 Any available Science coder
4 S1 8 Any available Science coder S1 from the blue batches of booklet 3 is NOT coded until multiple coding
5 S3 3, 7 Any available Science coder
6 S3 12 Any available Science coder S3 from the blue batches of booklet 13 is NOT coded until multiple coding
Countries implementing the optional UH bookletCountries using the shorter, special purpose booklet UH were advised to process this separately from the remaining booklets. Small numbers of students used this booklet, only a few items required coding, and they were not arranged in clusters. NPMs were cautioned that booklets needed to be allocated to several coders to ensure uniform application of the coding criteria for booklet UH, as for the main coding.
Multiple codingFor PISA 2009, all booklets types (test booklets 1-13 for the standard set and test booklets 8-13 and 21-27 for the easier set) were involved in the multiple coding exercise. The first of the four clusters from all booklets were each independently coded by four separate coders according to the recommended design. The other three clusters from these booklets were already coded as part of the single coding design at stage 2 discussed above.

110 © OECD 2012 – PISA 2009 TECHNICAL REPORT
6Field operations
Multiple coding was done at or towards the end of the coding period, after coders had familiarised themselves with and were experienced in using the coding guides. As noted earlier, the first three coders of the selected booklets circled codes on separate record sheets, tailored to booklet type and domain (reading, mathematics or science), using one page per student. The coding supervisor checked that coders correctly entered student identification numbers and their own identification number on the sheets, which was crucial to data quality. The UH booklet was not included in the multiple coding.
While coders would have been thoroughly familiar with the coding guides by the time of multiple coding, they may have most recently coded a different booklet from those allocated to them for multiple coding. For this reason, they needed to have time to re-read the relevant coding guide before beginning the coding. It was recommended that time be allocated for coders to refresh their familiarity with the guides and to look again at the additional practice material before proceeding with the multiple coding. As in the single coding, coding was to be done item by item. For manageability, items from the first clusters within a booklet type were coded before moving to another booklet type, rather than coding by cluster across several booklet types. It was considered that by this time coders would be experienced enough in applying the coding criteria that coding by booklet would be unlikely to detract from the quality of the data.
Multiple coding of readingThe specified multiple coding design for reading, shown in Figure 6.8 assumed 16 coders with identification numbers 201 to 216. The importance of following the design exactly as specified was stressed, as it provided for links between clusters and coders. Figure 6.8 shows 16 coders grouped into 4 groups of 4, with Group 1 comprising the first 4 coders (201-204), Group 2 the next 4 coders (205-208), etc. The four codings were to be carried out by rotating the booklets to the four coders assigned to each group.
MULTIPLE CODING STAGES 3, 4
16 reading codersreadIng CLuSterS
• Figure 6.8 •design for the multiple coding of reading, stages 3 and 4
Blue batchesa B C d
Step
Booklets selected for mC
Clusters for multiple coding Coder Ids
1 2 r1 201, 202, 203, 204
4 r3a
5 r4a 205, 206, 207, 208
6 r5
7 r6 209, 210, 211, 212
8 r2
12 r7 213, 214, 215, 216
In this scenario, with all 16 coders working, booklets 2, 5, 7 and 12 were to be coded at the same time in the first step. The 100 of booklet 2, for example, were to be divided into 4 bundles of 25 and rotated among coders 201, 202, 203 and 204, so that each coder eventually would have coded clusters R1 from all of the 100 booklets. As described earlier, the first three coders recorded their codes on the separate multiple coding record sheets, while the fourth coder recorded his or her codes in the booklets themselves. The fourth coder had to also record his or her coder ID on the front cover of the booklet. After booklets 2, 5, 7 and 12 had been put through the multiple-coding process, Group 1 continued with coding of the R3A cluster in booklets 4, Group 2 with R5 in booklets 6, and Group 3 with R2 in booklets 8. Allocating booklets to coders for multiple coding was quite complex and the coding supervisor had to monitor the flow of booklets throughout the process.
Multiple coding of mathematics and scienceThe multiple-coding design for mathematics shown in Figure 6.9 assumed 8 coders with identification numbers 101 to 108, and for science shown in Figure 6.10 assumed also 8 coders with identification numbers 301 to 308.

PISA 2009 TECHNICAL REPORT – © OECD 2012 111
6Field operations
MULTIPLE CODING STAGES 3, 4
8 mathematics codersmathematICS CLuSterS
MULTIPLE CODING STAGES 3, 4
8 science codersSCIenCe CLuSterS
• Figure 6.9 •design for the multiple coding of mathematics, stages 3 and 4
• Figure 6.10 •design for the multiple coding of science, stages 3 and 4
Blue batchesa B C d
Step
Booklets selected for mC
Clusters for multiple coding Coder Ids
1 1 m1 101, 102, 103, 104
9 m2
11 m3 105, 106, 107, 108
Blue batchesa B C d
Step
Booklets selected for mC
Clusters for multiple coding Coder Ids
1 3 S1 301, 302, 303, 304
13 S3
10 S2 305, 306, 307, 308
If different coders were used for science or mathematics, a different multiple-coding design was necessary. The NPM would negotiate a suitable proposal with the Consortium. The minimum allowable number of coders coding a domain was four; in this case each booklet had to be coded by each coder.
Managing the coding process
Booklet flowTo facilitate the flow of booklets, it was important to have ample table surfaces on which to place and arrange them by type and school subset. The bundles needed to be clearly labelled. For this purpose, it was recommended that each bundle of booklets be identified by a batch header for each booklet type (standard set of booklets 1-13, easier set of booklets 8-13 and 21-27), with spaces for the number of booklets and school identification numbers in the bundle to be written in. In addition, each header sheet was to be pre-printed with a list of the clusters in the booklet, with columns alongside where the date and time, coder’s name and identification number, and table leader’s initials could be entered as the bundle was coded and checked.
Separating the coding of science, mathematics and readingEven though the possibility was factored into the design that coders from different domains would require the same booklets at the same time of the single coding scheme, there was still the potential for this clash to occur. To minimise the risk of different coders requiring the same booklets, so that an efficient flow of booklets through the coding process could be maintained, it was recommended that the coding of reading and the coding of science and mathematics be done at least partly at different times (for example, reading coding could start a week or two ahead).
Familiarising coders with the coding designThe relevant design for allocating booklets to coders was explained either during the coder training session or at the beginning of the first coding session (or both). The coding supervisor was responsible for ensuring that coders adhered to the design and used clerical assistants if needed. Coders could better understand the process if each was provided with a card indicating the bundles of booklets to be taken and in which order.

112 © OECD 2012 – PISA 2009 TECHNICAL REPORT
6Field operations
Consulting table leadersDuring the initial training, practice and review, it was expected that coding issues would be discussed openly until coders understood the rationale for the coding criteria (or reached consensus where the coding guide was incomplete). Coders were not permitted to consult other coders or table leaders during the additional practice exercises (see next subsection) undertaken following the training to gauge whether all or some coders needed more training and practice
Following the training, coders were advised to work quietly, referring queries to their table leader rather than to their neighbours. If a particular query arose often, the table leader was advised to discuss it with the rest of the group.
For the multiple coding, coders were required to work independently without consulting other coders.
Monitoring single codingThe steps described here represented the minimum level of monitoring activities required. Countries wishing to implement more extensive monitoring procedures during single coding were encouraged to do so.
The supervisor, assisted by table leaders, was advised to collect coders’ practice papers after each cluster practice session and to tabulate the codes assigned. These were then to be compared with the pre-agreed codes: each matching code was considered a hit and each discrepant code was considered a miss. To reflect an adequate standard of reliability, the ratio of hits to the total of hits plus misses needed to be 0.85 or more. In science and mathematics, this reliability was to be assessed on the first digit of the two-digit codes. A ratio of less than 0.85, especially if lower than 0.80, was to be taken as indicating that more practice was needed, and possibly more training.
Table leaders played a key role during each coding session and at the end of each day by spot-checking a sample of booklets or items that had already been coded in order to identify problems for discussion with individual coders or with the wider group, as appropriate. All booklets that had not been set aside for multiple coding were candidates for this spot-checking. It was recommended that, if there were indications from the practice sessions that one or more particular coders might be consistently experiencing problems in using the coding guide, then more of those coders’ booklets should be included in the checking. Table leaders were advised to review the results of the spot-checking with the coders at the beginning of the next day’s coding. This was regarded primarily as a mentoring activity, but NPMs were advised to keep in contact with table leaders and the coding supervisor if there were individual coders who did not meet criteria of adequate reliability and would need to be removed from the pool.
Table leaders were to initial and date the header sheet of each batch of booklets for which they had carried out spot-checking. Some items/booklets from each batch and each coder had to be checked.
Cross-national codingCross-national comparability in assigning codes was explored through an inter-country coder reliability study (see Chapter 10 and Chapter 14).
Questionnaire codingThe main coding required internationally for the student questionnaire was the mother’s and father’s occupation and student’s occupational expectation. Four-digit International Standard Classification of Occupations (ISCO88) codes (International Labour Organisation, 1990) were assigned to these three variables. In several countries, this could be done in a number of ways. NPMs could use a national coding scheme with more than 100 occupational title categories, provided that this national classification could be recoded to ISCO. A national classification was preferred because relationships between occupational status and achievement could then be compared within a country using both international and national measures of occupational status.
The PISA website gave a clear summary of ISCO codes and occupational titles for countries to translate if they had neither a national occupational classification scheme nor access to a full translation of ISCO.
In their national options, countries may also have needed to pre-code responses to some items before data from the questionnaire were entered into the software.
PISA 2009 TECHNICAL REPORT – © OECD 2012 113
6Field operations
data entry, data checKing and File SubMiSSion
Data entryThe Consortium provided participating countries with data entry software (KeyQuest). KeyQuest contained the database structures for all of the booklets, questionnaires and tracking forms used in the main survey. Variables could be added or deleted as needed for national options. Approved adaptations to response categories could also be accommodated. Student response data were entered directly from the test booklets and questionnaires. Information regarding the participation of students, recorded by the SC and TA on the session attendance form, was entered directly into KeyQuest. Several questions from the session report form, such as the timing of the session, were also entered into KeyQuest.
KeyQuest performed validation checks as data were entered. Importing facilities were also available if data had already been entered into text files, but it was strongly recommended that data be entered directly into KeyQuest to take advantage of its PISA-specific features. A KeyQuest Manual provided generic technical details of the functionality of the KeyQuest software. A separate Data Entry Manual provided complete instructions specific to the main survey regarding data entry, data management and validity checks.
Data checkingNPMs were responsible for ensuring that many checks of the quality of their country’s data were made before the data files were submitted to the Consortium. These checks were explained in detail in the Data Entry Manual, and could be simply applied using the KeyQuest software. The checking procedures required that the list of sampled schools and the session attendance form for each school were already accurately completed and entered into KeyQuest. Any errors had to be corrected before the data were submitted. Copies of the cleaning reports were to be submitted together with the data files. More details on the cleaning steps are provided in Chapter 10.
Data submissionFiles to be submitted included:
•data for the test booklets and context questionnaires
•data for the international option instrument(s), if used
•data for the multiple-coding study
•session report form data
•data cleaning reports
•the list of sampled schools
•student tracking form
•session attendance form
Hard or electronic copies of the last two items were also required.
After data were submittedNPMs were required to designate a data manager who would work actively with the Consortium’s data processing centre at ACER during the international data cleaning process. Responses to requests for information by the processing centre were required within three working days of the request.
the Main Survey reviewNPMs were required to complete a structured review of their main survey operations. The review was an opportunity to provide feedback to the Consortium on the various aspects of the implementation of PISA, and to provide suggestions for areas that could be improved. It also provided an opportunity for the NPM to formally document aspects such as the operational structure of the national centre, the security measures that were implemented, and the use of contractors for particular activities and so on.
The main survey review was submitted to the Consortium four weeks after the submission of the national database.


7
PISA 2009 TECHNICAL REPORT – © OECD 2012 115
Quality Assurance
PISA quality control ......................................................................................................116
PISA quality monitoring ............................................................................................116
116 © OECD 2012 – PISA 2009 TECHNICAL REPORT
7Quality assurance
PISA data collection activities are undertaken in accordance with strict quality assurance procedures. The quality assurance that ensures the PISA 2009 data are fit for use consists of two components. The first is to develop and document procedures for data collection and the second is to monitor and record the implementation of those procedures.
PiSa Quality controlPISA quality standards are established through comprehensive operational manuals and agreed national level implementation planning documents. These materials state the project goals, and how to achieve those goals according to clearly defined procedures on an agreed timeline. Each stage of the process is then monitored to ensure that implementation of the programme has proceeded as planned.
Comprehensive operational manualsPISA field operational manuals describe the project implementation procedures in great detail and clearly identify connections to the PISA 2009 Technical Standards (see Annex G) at various stages. They were first developed for the PISA 2000 survey in co-ordination with the participating countries and have been developed further for each implementation of the survey. The manuals ensure consistent application of the standards across the participants.
For the PISA 2009 field trial and main study, the PISA National Project Manager’s Manual, the PISA Test Administrator’s Manual, the PISA School Co-ordinator’s Manual, the PISA School Sampling Preparation Manual, and the PISA Data Management Manual were produced. All the key operational manuals are available to the general public on the OECD PISA website www.pisa.oecd.org under the PISA 2009 manuals and guidelines section. In addition, similar manuals were produced for the Digital Reading Assessment (DRA).
National level implementation planning documentNational level planning documents are developed from the operational manuals and allow participants to record their specific project information and any approved variations to standard procedures.
Through a negotiation process, the consortium and each NPM reach an agreement on all the planning documents submitted by the national centre. For PISA 2009 these documents included sampling forms, the translation plan, the preferred verification schedule, the print quality agreement, an online-form covering participation in international and national options, and adaptation forms related to each of the manuals, the questionnaires and the cognitive test instruments.
The whole negotiation process is designed to be as transparent and direct as possible. All planning documents are submitted on line by the national centre, and stored on the MyPISA website permanently for future references. Each planning document will associate with a file status, such as “submitted”, “requires review” or “agreed”. Each national centre’s key project information is also displayed on the profile page of the MyPISA website.
PiSa Quality MonitoringWhile the aim of quality control is to establish effective and efficient procedures and guide implementation process, quality monitoring activities are set to observe and record any deviations from those agreed procedures during the implementation of the survey. They include:
•field trial and main survey review
•final optical check
•national centre quality monitor (NCQM) visits
•PISA quality monitor (PQM) visits
•delivery
•post final optical check
Field trial and main survey reviewAfter the implementation of the field trial and the main survey, NPMs were given the opportunity to review and provide feedback to the consortium on all aspects of the field operations.
The field trial and main survey reviews were organised around all aspects outlined in the NPM manual:
•use of key documents and processes: use a rating system to review NPMs’ level of satisfaction with the clarity of key documents and manuals;
•communication with the consortium;

PISA 2009 TECHNICAL REPORT – © OECD 2012 117
7Quality assurance
•review the usefulness of the newly developed MyPISA website as well as using a rating system to review the communication by activity;
•implementation of national and international options: confirm if national centre had executed any national and international options as agreed;
•review the national feedback process;
•security arrangements: review security arrangements to confirm if they had been implemented;
•sampling plan: confirm if the PISA field trial test was implemented as agreed in the sampling plan;
•translation/adaptation/verification: review the translation, adaptation and verification processes to see if they were implemented in accordance with PISA technical standards and to a satisfactory level;
•archiving of materials: confirm if the national centre had archived the test materials in accordance with the technical standards;
•printing: review the print quality agreement process;
•test administration: review TA training processes and test administration procedures;
•quality assurance: review the field trial PISA quality monitoring activity at national level, as well as the PQM activity during main survey at international level;
•coding: review coder training procedures, coding procedures, coding designs and the time required for coding; and
•data management: review the data management processes, including student sampling, database adaptation, data entry, coding of occupational categories, validity reports and data submission.
Final optical checkBefore printing assessment materials in each participating country, NPMs electronically submit their final version of the test booklets to the consortium for a final optical check (FOC). The FOC is undertaken by the consortium’s verifiers and involves a page-by-page inspection of test booklets and questionnaire forms with regard to correct item allocation, layout, page numbering, item numbering, graphic elements, item codes, footers and so on (see Chapter 5).
Any errors found during the FOC are recorded and forwarded to National Centres for correction.
National Centre Quality Monitor (NCQM) visitsA number of participating national centres were visited by PISA international consortium representatives – the National Centre Quality Monitors (NCQMs). Some of them were new national centres for PISA 2009, and some were reported to have experienced difficulties in various aspects of the project implementation. Most of the visits were carried out during the field trial period so that preventive and corrective action could be taken if any potential problems were detected.
During the visits, the NCQM conducts a face-to-face interview with the NPM or a representative from the national centre. Any potential problems identified by the NCQM were forwarded to the relevant consortium expert for appropriate action. A collated response to all problems identified was sent back to the visited national centre after the visit.
The NCQMs have comprehensive knowledge and extensive experience regarding PISA operations. Each NCQM was trained and provided with the national centre’s project implementation data in great detail. Prior to each visit, NCQMs studied the national materials in order to be familiar with country-specific information during the interview with NPMs.
The purpose of this interview is twofold. Firstly, it allows members of the consortium to become familiar with the operations of PISA in national context, as well as any specific challenges ‘new countries’ may be facing in national contexts. Secondly, it provides National Centre staff with the opportunity to ask questions or receive clarification about any aspect of the survey.
The NCQM interview schedule is a list of areas that was prepared for the consortium representatives to lead the interview in a structured way, so that the outcomes of the NCQM site visit could be recorded systematically and consistently across countries. This interview schedule covers the following areas:
•general organisation of PISA in each country
•sampling
•adaptation, translation and printing of tests, questionnaires and operational materials
•despatch of materials and test administration
•security and checking back of materials
•cognitive item coding
•data management and submission
118 © OECD 2012 – PISA 2009 TECHNICAL REPORT
7Quality assurance
PISA Quality Monitor (PQM) visitsPQMs are individuals employed by the consortium and located in participating countries. They visit a sample of schools to record the implementation of the documented field operations procedures in the main survey. Typically, one PQM were engaged for each country and they visit 7 or 8 schools in each country.
All PQMs are nominated by the NPMs through a formal process of submission of nominations to the Core A consortium. Based upon the NPM nominations, which are accompanied by candidate resumes, the consortium selects PQMs who are totally independent from the national centre, knowledgeable in testing procedures or with a background in education and research, and able to communicate in English fluently. Where the resume does not match the selection criteria, further information or an alternate nomination is sought.
Each PQM visited seven or eight schools. The PQM Manual, PQM self-training package, other operational manuals and copies of data collection sheets were made available to all PQMs upon receipt of their signed confidentiality agreement via emails and post. The PQMs were also given access to a designated PQM web page on the MyPisa website (https://mypisa.acer.edu.au) from which they could download materials and information. All PQMs were self-trained using the PQM training PowerPoint, which has an embedded soundtrack. At the same time, the PQM co-ordinator provided support and addressed any issues or concerns via email. The PQMs and the PQM co-ordinator collaborated to develop a schedule of school visits to ensure that a range of schools was covered and that the schedule of visits was both economically and practically feasible. The Core A consortium paid the expenses and fees of each PQM.
The majority of school visits were unannounced to the test administrator. However, in some countries it is not possible to do so when the school associate model was used, where the test administrator and the school co-ordinator are the same person.
A PQM data collection form was developed for PQMs to systematically record their observations during each school visit. The data collection form covers the following areas:
•preparation for the assessment
•conducting the assessment
•general questions concerning the assessment
•interview with the school co-ordinator
Test administrationTest administrators record all key test session information using a test session report. This report provides detailed data on test administration, including:
•session date and timing
•the position of the test administrator
•conduct of the students
•testing environment
DeliveryAll quality assurance data collected throughout the cycle are entered and collated in a central data adjudication database. Comprehensive reports are then generated for the Technical Advisory Group (TAG) for consideration during the data adjudication process (see Chapter 14).
The TAG experts use the consolidated quality-monitoring reports from the central data adjudication database to make country-by-country evaluations on the quality of field operations, printing, translation, school and student sampling, and coding. The final reports by TAG experts are then used for the purpose of data adjudication.
Post final optical checkAfter both the field trial and main survey, Core A consortium staff carried out a thorough checking procedure on all the hard copies of the national centre test booklets that were submitted to the Core A consortium for archiving purpose. The checking was carried out by comparing the National centres’ submitted booklets and the source version of the test booklets that were released by the Core A consortium, as well as checking issues that were identified during the FOC process to see how well the suggested changes were implemented and to what extent.
Findings were recorded and made available for countries on the MyPISA website.

8
PISA 2009 TECHNICAL REPORT – © OECD 2012 119
Survey Weightingand the Calculation
of Sampling Variance
Survey weighting ....................................................................................................................................................... 120
Calculating sampling variance ........................................................................................................................ 126

8Survey Weighting and the CalCulation of Sampling varianCe
120 © OECD 2012 – PISA 2009 TECHNICAL REPORT
Survey weights are required to analyse PISA data, to calculate appropriate estimates of sampling error and to make valid estimates and inferences of the population. The PISA Consortium calculated survey weights for all assessed, ineligible and excluded students, and provided variables in the data that permit users to make approximately unbiased estimates of standard errors, conduct significance tests and create confidence intervals appropriately, given the complex sample design for PISA in each individual participating country.
Survey weightingThe sample design undertaken for PISA was intended to give all students from within the same explicit stratum an equal probability of selection and therefore equal weight, in the absence of school and student non-response. While the students included in the final PISA sample for a given country were chosen randomly, the selection probabilities of the students vary. Survey weights must therefore be incorporated into the analysis to ensure that each sampled student appropriately represents the correct number of students in the full PISA population.
There are several reasons why the survey weights are not the same for all students in a given country:
•A school sample design may intentionally over or under-sample certain sectors of the school population: in the former case, so that they could be effectively analysed separately for national purposes, such as a relatively small but politically important province or region, or a sub-population using a particular language of instruction; and in the latter case, for reasons of cost, or other practical considerations, such as very small or geographically remote schools.1
•Information about school size available at the time of sampling may not have been completely accurate. If a school was expected to be large, the selection probability was based on the assumption that only a sample of students would be selected from the school for participation in PISA. But if the school turned out to be small, all students would have to be included. In this scenario, the students would have a higher probability of selection in the sample than planned, making their inclusion probabilities higher than those of most other students in the sample. Conversely, if a school assumed to be small actually was large, the students included in the sample would have smaller selection probabilities than others.
•School non-response, where no replacement school participated, may have occurred, leading to the under-representation of students from that kind of school, unless weighting adjustments were made. It is also possible that only part of the PISA-eligible population in a school (such as those 15-year-old students in a particular grade) were represented by its student sample, which also requires weighting to compensate for the missing data from the omitted grades.
•Student non-response, within participating schools, occurred to varying extents. Sampled students who were PISA-eligible and not excluded, but did not participate in the assessment for reasons such as absences or refusals, will be under-represented in the data unless weighting adjustments were made.
•Trimming the survey weights to prevent undue influence of a relatively small subset of the school or student sample might have been necessary if a small group of students would otherwise have much larger weights than the remaining students in the country. Such large survey weights can lead to estimates with large sampling errors and inappropriate representations in the national estimates. Trimming survey weights introduces a small bias into estimates but greatly reduces standard errors (Kish, 1992).
The procedures used to derive the survey weights for PISA reflect the standards of best practice for analysing complex survey data, and the procedures used by the world’s major statistical agencies. The same procedures were used in other international studies of educational achievement such as the Trends in International Mathematics and Science Study (TIMSS) and the Progress in International Reading Literacy Studies (PIRLS), which were all implemented by the International Association for the Evaluation of Educational Achievement (IEA). The underlying statistical theory for the analysis of survey data can be found in Cochran (1977), Lohr (1999) and Särndal, Swensson and Wretman (1992).
Weights are applied to student-level data for analysis. The weight, Wij , for student j in school i consists of two base weights, the school base weight and the within-school base weight, and five adjustment factors, and can be expressed as:
8.1
Wij = t2ij f1i f2ij f1ij t1i w2ij w1iA
8Survey Weighting and the CalCulation of Sampling varianCe
PISA 2009 TECHNICAL REPORT – © OECD 2012 121
8.2
Where:
W1i , the school base weight, is given as the reciprocal of the probability of inclusion of school i into the sample;
W2ij , the within-school base weight, is given as the reciprocal of the probability of selection of student j from within the selected school i;
f1i is an adjustment factor to compensate for non-participation by other schools that are somewhat similar in nature to school i (not already compensated for by the participation of replacement schools);
is an adjustment factor to compensate for schools in some participating countries where only 15-year-old students who were enrolled in the modal grade for 15-year-old students were included in the assessment;
f2i j is an adjustment factor to compensate for non-participation by students within the same school non-response cell and explicit stratum, and, where permitted by the sample size, within the same high/low grade and gender categories;
t1i is a school base weight trimming factor, used to reduce unexpectedly large values of W1i ; and
t2i j is a final student weight trimming factor, used to reduce the weights of students with exceptionally large values for the product of all the preceding weight components.
The school base weightThe term W1i is referred to as the school base weight. For the systematic sampling with probability proportional-to-size method used in sampling schools for PISA, this weight is given as:
Af1ij
w1i =if < MOS < I
otherwiseMOSi
iIg g
1
The term MOSi denotes the measure of size given to each school on the sampling frame.
Despite country variations, MOSi was usually equal to the estimated number of 15-year-old students in the school, if it was greater than the predetermined target cluster size (TCS), which in most countries was 35 students. If the enrolment of 15-year-old students was less than the TCS, then MOSi =TCS.
The term Ig denotes the sampling interval used within the explicit sampling stratum g that contains school i and is calculated as the total of the MOSi values for all schools in stratum g, divided by the school sample size for that stratum.
Thus, if school i was estimated to have one hundred 15-year-old students at the time of sample selection, MOSi = 100. If the country had a single explicit stratum (g=1) and the total of the MOSi values over all schools was 150 000 students, with a school sample size of 150, then the sampling interval, I1 = 150 000/150 = 1 000, for school i (and others in the sample), giving a school base weight of W1i = 1 000/100 = 10.0. Thus, the school can be thought of as representing about ten schools in the population. In this example, any school with 1 000 or more 15-year-old students would be included in the sample with certainty, with a base weight of W1i =1 as the MOSi is larger than the sampling interval.
The school base weight trimming factorOnce school base weights were established for each sampled school in the country, verifications were made separately within each explicit sampling stratum to determine if the school base weights required trimming. The school trimming factor t1i , is the ratio of the trimmed to the untrimmed school base weight, and for most schools is equal to 1.0000 and therefore most students, and never exceeds this value.
The school-level trimming adjustment was applied to schools that turned out to be much larger than was assumed at the time of school sampling. Schools were flagged where the 15-year-old student enrolment exceeded 3 ×(TCS, MOSi). For example, if the TCS was 35 students, then a school flagged for trimming had more than 105 (=3 x 35) PISA-eligible students, and more than three times as many students as was indicated on the school sampling frame. Because the student sample size was set at TCS regardless of the actual enrolment, the student sampling rate was much lower than anticipated during the school sampling. This meant that the weights for the sampled students in these schools would have been more than three times greater than anticipated when the school sample was selected. These schools had their school base weights trimmed by having MOSi replaced by 3 ×(TCS, MOSi) in the school base weight formula.

8Survey Weighting and the CalCulation of Sampling varianCe
122 © OECD 2012 – PISA 2009 TECHNICAL REPORT
The within-school base weightThe term W2ij is referred to as the within-school base weight. With the PISA procedure for sampling students, W2ij did not vary across students (j) within a particular school i. That is, all of the students within the same school had the same probability of selection for participation in PISA. This weight is given as:
8.3
8.4
w2ij = sami
enri
where enri is the actual enrolment of 15-year-old students in the school on the day of the assessment (and so, in general, is somewhat different from the MOSi), and sami is the sample size within school i. It follows that if all PISA-eligible students from the school were selected, then W2ij = 1 for all eligible students in the school. For all other cases W2ij > 1 as the selected student represents other students in the school besides themselves.
In the case of the grade sampling option, for direct sampled grade students, the sampling interval for the extra grade students was the same as that for the PISA students. Therefore, countries with extra direct sampled grade students (Brazil, Iceland, Liechtenstein, Slovenia, and certain explicit strata in Switzerland) have the same within school student weights for the extra grade students as those for PISA-eligible students from the same school.
Additional weight components were needed for the grade students in Chile and Germany. For these two countries, the extra weight component consisted of the class weight for the selected class(es) (all students were selected into the grade sample in the selected class(es)). In these two countries, the extra weight component resulted in the necessity of a second weighting stream for the extra grade students.
The school non-response adjustmentIn order to adjust for the fact that those schools that declined to participate, and were not replaced by a replacement school, were not in general typical of the schools in the sample as a whole, school-level non-response adjustments were made. Several groups of somewhat similar schools were formed within a country, and within each group the weights of the responding schools were adjusted to compensate for the missing schools and their students.
The compositions of the non-response groups varied from country to country, but were based on cross-classifying the explicit and implicit stratification variables used at the time of school sample selection. Usually, about 10 to 15 such groups were formed within a given country depending upon school distribution with respect to stratification variables. If a country provided no implicit stratification variables, schools were divided into three roughly equal groups, within each explicit stratum, based on their enrolment size. It was desirable to ensure that each group had at least six participating schools, as small groups could lead to unstable weight adjustments, which in turn would inflate the sampling variances. However, it was not necessary to collapse cells where all schools participated, as the school non-response adjustment factor was 1.0 regardless of whether cells were collapsed or not. Adjustments greater than 2.0 were flagged for review, as they could have caused increased variability in the weights and would have led to an increase in sampling variances. In either of these situations, cells were generally collapsed over the last implicit stratification variable(s) until the violations no longer existed. In participating countries with very high overall levels of school non-response after school replacement, the requirement for school non-response adjustment factors to all be below 2.0 was waived.
Within the school non-response adjustment group containing school i, the non-response adjustment factor was calculated as:
f1i =
Σk Ω(i)
w1kenr (k)
Σk Γ(i)
w1kenr (k)
where the sum in the denominator is over G(i), which are the schools within the group (originals and replacements) that participated, while the sum in the numerator is over W(i), which are those same schools, plus the original sample schools that refused and were not replaced. The numerator estimates the population of 15-year-old students in the group, while the denominator gives the size of the population of 15-year-old students directly represented by participating schools. The school non-response adjustment factor ensures that participating schools are weighted to represent all students in the group. If a school did not participate because it had no PISA-eligible students enrolled, no adjustment was necessary since this was considered neither non-response nor under-coverage.
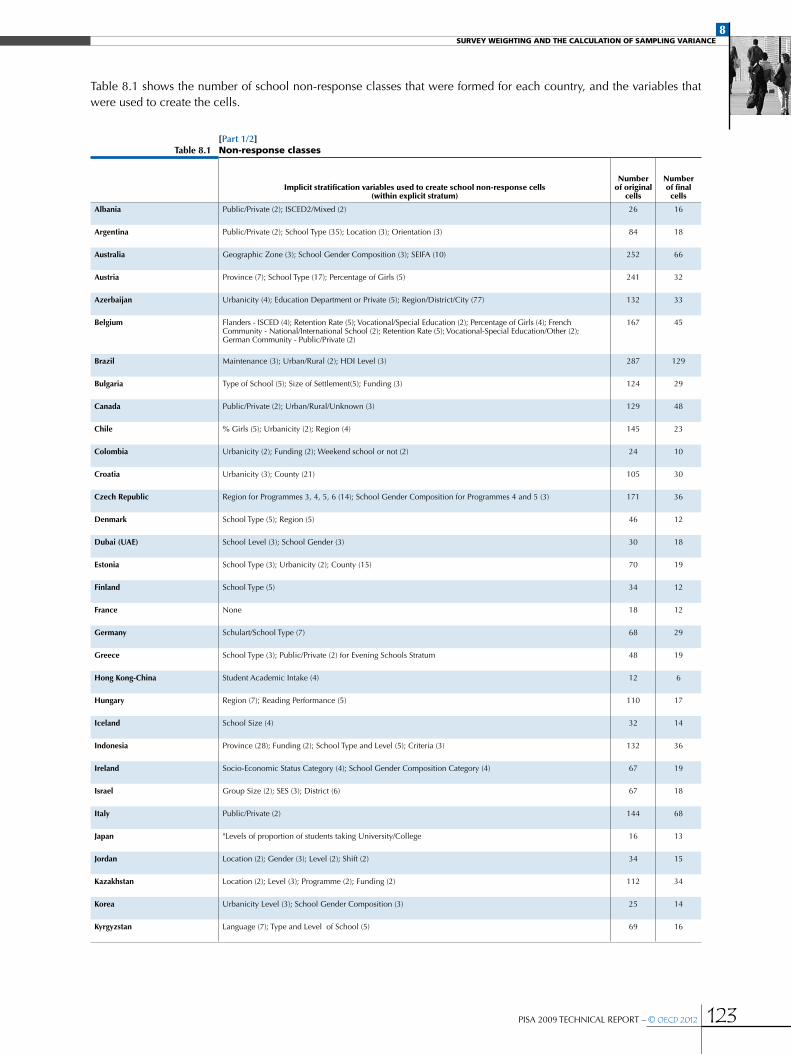
8Survey Weighting and the CalCulation of Sampling varianCe
PISA 2009 TECHNICAL REPORT – © OECD 2012 123
Table 8.1 shows the number of school non-response classes that were formed for each country, and the variables that were used to create the cells.
[Part 1/2]table 8.1 non-response classes
Implicit stratification variables used to create school non-response cells(within explicit stratum)
Numberof original
cells
Numberof final
cells
albania Public/Private (2); ISCED2/Mixed (2) 26 16
argentina Public/Private (2); School Type (35); Location (3); Orientation (3) 84 18
australia Geographic Zone (3); School Gender Composition (3); SEIFA (10) 252 66
austria Province (7); School Type (17); Percentage of Girls (5) 241 32
azerbaijan Urbanicity (4); Education Department or Private (5); Region/District/City (77) 132 33
Belgium Flanders - ISCED (4); Retention Rate (5); Vocational/Special Education (2); Percentage of Girls (4); French Community - National/International School (2); Retention Rate (5); Vocational-Special Education/Other (2); German Community - Public/Private (2)
167 45
Brazil Maintenance (3); Urban/Rural (2); HDI Level (3) 287 129
Bulgaria Type of School (5); Size of Settlement(5); Funding (3) 124 29
Canada Public/Private (2); Urban/Rural/Unknown (3) 129 48
Chile % Girls (5); Urbanicity (2); Region (4) 145 23
Colombia Urbanicity (2); Funding (2); Weekend school or not (2) 24 10
Croatia Urbanicity (3); County (21) 105 30
Czech republic Region for Programmes 3, 4, 5, 6 (14); School Gender Composition for Programmes 4 and 5 (3) 171 36
denmark School Type (5); Region (5) 46 12
dubai (uae) School Level (3); School Gender (3) 30 18
estonia School Type (3); Urbanicity (2); County (15) 70 19
Finland School Type (5) 34 12
France None 18 12
germany Schulart/School Type (7) 68 29
greece School Type (3); Public/Private (2) for Evening Schools Stratum 48 19
hong Kong-China Student Academic Intake (4) 12 6
hungary Region (7); Reading Performance (5) 110 17
Iceland School Size (4) 32 14
Indonesia Province (28); Funding (2); School Type and Level (5); Criteria (3) 132 36
Ireland Socio-Economic Status Category (4); School Gender Composition Category (4) 67 19
Israel Group Size (2); SES (3); District (6) 67 18
Italy Public/Private (2) 144 68
japan "Levels of proportion of students taking University/College 16 13
jordan Location (2); Gender (3); Level (2); Shift (2) 34 15
Kazakhstan Location (2); Level (3); Programme (2); Funding (2) 112 34
Korea Urbanicity Level (3); School Gender Composition (3) 25 14
Kyrgyzstan Language (7); Type and Level of School (5) 69 16

8Survey Weighting and the CalCulation of Sampling varianCe
124 © OECD 2012 – PISA 2009 TECHNICAL REPORT
[Part 2/2]table 8.1 non-response classes
Implicit stratification variables used to create school non-response cells(within explicit stratum)
Numberof original
cells
Numberof final
cells
Latvia School Type and Level (6) 17 10
Liechtenstein Funding (2) 2 2
Lithuania Funding (2) 19 10
Luxembourg School Gender Composition (2) 8 6
macao-China School Orientation (2); Gender (3) 18 13
mexico School Level (2); School Programme (7); Public/Private (2); Urban/Rural (2) 573 177
montenegro None 33 21
netherlands Programme Category (6) 14 9
new Zealand Socio-Economic Status Category (3); Public/Private (2); School Gender Composition (3); Urban/Rural (2) 21 11
norway None 9 4
Panama Region (12); Orientation (2) 36 17
Peru Region (26); Gender (3); School Type (4) 105 28
Poland School Subtype (5); Public/Private (3) for Lycea and Vocational Schools; Locality (4) 21 7
Portugal Island (10); ISCED (3); Public/Private (2); Urbanicity (3) 109 32
Qatar Gender (3); Level (5); Funding (2) 38 19
romania Language (3); Urbanicity (2) 9 7
russian Federation Location (9); School Type (8); School Sub-type (5); 192 46
Serbia None 64 32
Shanghai-China Track (2); Funding (2); Location (2) 20 15
Singapore Gender (3) 5 3
Slovak republic Programme (9); Language (3); Grade Repetition Level (112) 71 23
Slovenia Location (5) 30 17
Spain 3 digits of Postal Code 280 104
Sweden Geographic LAN (21) for Upper Secondary schools; School Type (3) for Upper Secondary schools; Income Quartiles (4) for Lower Secondary schools
57 20
Switzerland School Type (29) 138 64
Chinese taipei County/City area (25); School Gender (3) 134 29
thailand Local area (9) 67 22
trinidad and tobago Gender (3); Programme (2); Level (2); Location (2) 59 20
tunisia % Repeaters (3) 37 21
turkey School Type (17); Urban/Rural (2); Public/Private (2) 103 21
united Kingdom England - School Attainment Level (6); School Gender Composition (3); Local Authority; Northern Ireland - School Gender Composition (3); Wales - School Gender Composition (3); Local Authority; Scotland - Area Type (6)
275 64
united States Grade Span (5); Urbanicity (4); Minority Status (2); 3-digit Postal Code 236 21
uruguay Level (3); Evening Shift/Not (2) 48 20
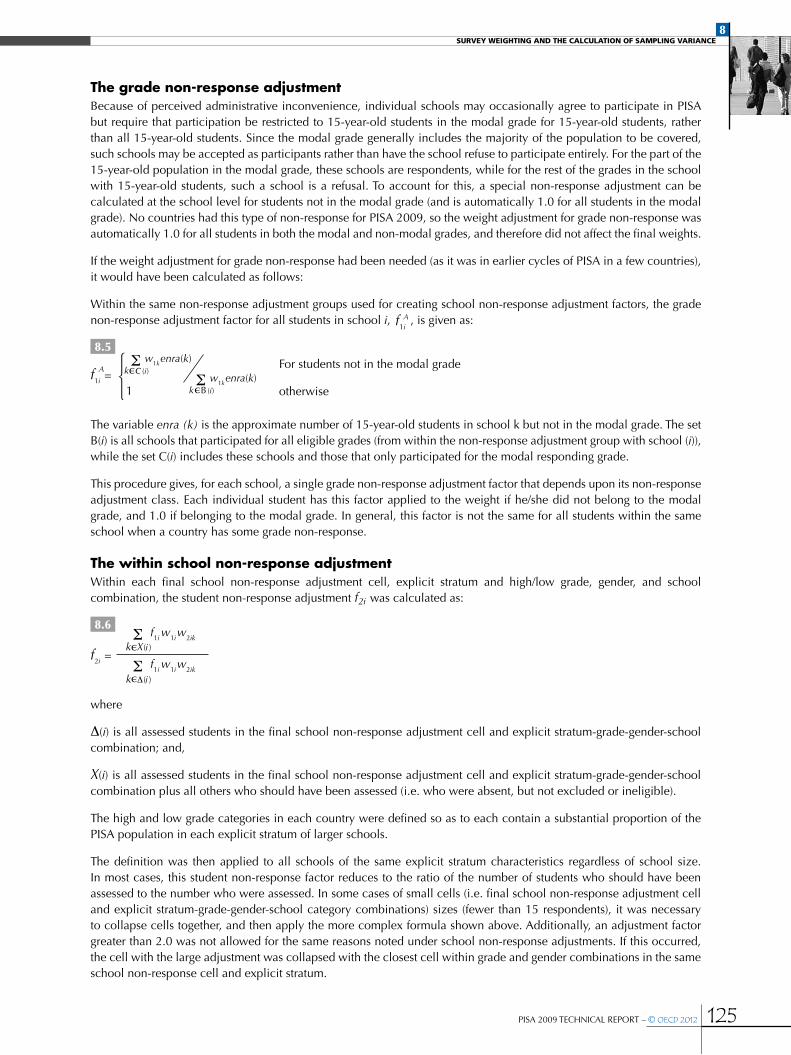
8Survey Weighting and the CalCulation of Sampling varianCe
PISA 2009 TECHNICAL REPORT – © OECD 2012 125
The grade non-response adjustmentBecause of perceived administrative inconvenience, individual schools may occasionally agree to participate in PISA but require that participation be restricted to 15-year-old students in the modal grade for 15-year-old students, rather than all 15-year-old students. Since the modal grade generally includes the majority of the population to be covered, such schools may be accepted as participants rather than have the school refuse to participate entirely. For the part of the 15-year-old population in the modal grade, these schools are respondents, while for the rest of the grades in the school with 15-year-old students, such a school is a refusal. To account for this, a special non-response adjustment can be calculated at the school level for students not in the modal grade (and is automatically 1.0 for all students in the modal grade). No countries had this type of non-response for PISA 2009, so the weight adjustment for grade non-response was automatically 1.0 for all students in both the modal and non-modal grades, and therefore did not affect the final weights.
If the weight adjustment for grade non-response had been needed (as it was in earlier cycles of PISA in a few countries), it would have been calculated as follows:
Within the same non-response adjustment groups used for creating school non-response adjustment factors, the grade non-response adjustment factor for all students in school i, , is given as: Af1i
f1i =1
AΣ
k c (i)w1kenra(k)
Σk B (i)
w1kenra(k)
8.5
8.6
For students not in the modal grade
otherwise
The variable enra (k) is the approximate number of 15-year-old students in school k but not in the modal grade. The set B(i) is all schools that participated for all eligible grades (from within the non-response adjustment group with school (i)), while the set C(i) includes these schools and those that only participated for the modal responding grade.
This procedure gives, for each school, a single grade non-response adjustment factor that depends upon its non-response adjustment class. Each individual student has this factor applied to the weight if he/she did not belong to the modal grade, and 1.0 if belonging to the modal grade. In general, this factor is not the same for all students within the same school when a country has some grade non-response.
The within school non-response adjustmentWithin each final school non-response adjustment cell, explicit stratum and high/low grade, gender, and school combination, the student non-response adjustment f2i was calculated as:
f2i =
Σk X(i )
f1i w1iw2ik
Σk Δ(i )
f1i w1iw2ik
where
D(i) is all assessed students in the final school non-response adjustment cell and explicit stratum-grade-gender-school combination; and,
X(i) is all assessed students in the final school non-response adjustment cell and explicit stratum-grade-gender-school combination plus all others who should have been assessed (i.e. who were absent, but not excluded or ineligible).
The high and low grade categories in each country were defined so as to each contain a substantial proportion of the PISA population in each explicit stratum of larger schools.
The definition was then applied to all schools of the same explicit stratum characteristics regardless of school size. In most cases, this student non-response factor reduces to the ratio of the number of students who should have been assessed to the number who were assessed. In some cases of small cells (i.e. final school non-response adjustment cell and explicit stratum-grade-gender-school category combinations) sizes (fewer than 15 respondents), it was necessary to collapse cells together, and then apply the more complex formula shown above. Additionally, an adjustment factor greater than 2.0 was not allowed for the same reasons noted under school non-response adjustments. If this occurred, the cell with the large adjustment was collapsed with the closest cell within grade and gender combinations in the same school non-response cell and explicit stratum.
8Survey Weighting and the CalCulation of Sampling varianCe
126 © OECD 2012 – PISA 2009 TECHNICAL REPORT
Some schools in some countries had extremely low student response levels. In these cases it was determined that the small sample of assessed students within the school was potentially too biased as a representation of the school to be included in the final PISA dataset. For any school where the student response rate was below 25%, the school was treated as a non-respondent, and its student data were removed. In schools with between 25% and 50% student response, the student non-response adjustment described above would have resulted in an adjustment factor of between 2.0 and 4.0, and so the grade-gender cells of these schools were collapsed with others to create student non-response adjustments. 2
For countries with extra direct grade sampled students (Brazil, Iceland, Liechtenstein, Slovenia, and certain explicit strata in Switzerland), care was taken to ensure that student non-response cells were formed separately for PISA students and the extra non-PISA grade students. No procedural changes were needed for Chile and Germany since a separate weighting stream was needed for the grade students.
Trimming the student weightsThis final trimming check was used to detect individual student weights that were unusually large compared to those of other students within the same explicit stratum. The sample design was intended to give all students from within the same explicit stratum an equal probability of selection and therefore equal weight, in the absence of school and student non-response. As already noted, poor prior information about the number of eligible students in each school could lead to substantial violations of this equal weighting principle. Moreover, school, grade, and student non-response adjustments, and, occasionally, inappropriate student sampling could, in a few cases, accumulate to give a few students in the data relatively large weights, which adds considerably to the sampling variance. The weights of individual students were therefore reviewed, and where the weight was more than four times the median weight of students from the same explicit sampling stratum, it was trimmed to be equal to four times the median weight for that explicit stratum.
The student trimming factor, t2i j , is equal to the ratio of the final student weight to the student weight adjusted for student non-response, and therefore equal to 1.0 for the great majority of students. The final weight variable on the data file is the final student weight that incorporates any student-level trimming. As in PISA 2000, PISA 2003 and PISA 2006, minimal trimming was required at either the school or the student levels.
Weighting for Digital Reading AssessmentNo non-response adjustments were made for schools or students sampled for DRA which did not participate. Since DRA was being treated as a minor domain like mathematics and science, absent DRA students were treated in the same manner as a student not assigned a booklet containing items in the mathematics or science domain. Plausible values were generated for these DRA students, as well as for all other students who had not been subsampled for DRA.
The second level of sampling for DRA for Spain and Colombia needed to be accounted for in weighting through an additional weight component. Thus, schools subsampled for DRA for Spain and Colombia had their own weighting stream, separate from the weighting stream for the large national samples in these countries. Once in their own weighting stream, weighting procedures for these DRA subsampled schools and students were the same as the weighting procedures used for all countries.
calculating SaMPling varianceA replication methodology was employed to estimate the sampling variances of PISA parameter estimates. This methodology accounted for the variance in estimates due to the sampling of schools and students. Additional variance due to the use of plausible values from the posterior distributions of scaled scores was captured separately as measurement error. Computationally the calculation of these two components could be carried out in a single programme, such as WesVar 5.1 (Westat, 2007). The SPSS and SAS macros were also developed. For further detail, see PISA Data Analysis Manual (OECD, 2009).
The balanced repeated replication variance estimatorThe approach used for calculating sampling variances for PISA estimates is known as balanced repeated replication (BRR), or balanced half-samples; the particular variant known as Fay’s method was used. This method is similar in nature to the jackknife method used in other international studies of educational achievement, such as TIMSS, and it is well documented in the survey sampling literature (see Rust, 1985; Rust and Rao, 1996; Shao, 1996; Wolter, 2007). The major advantage of the BRR method over the jackknife method is that the jackknife is not fully appropriate for use with non-differentiable functions of the survey data, most noticeably quantiles, for which it does not provide a statistically consistent estimator of variance. This means that, depending upon the sample design, the variance estimator can be unstable, and despite empirical evidence that it can behave well in a PISA-like design, theory is lacking. In contrast,

8Survey Weighting and the CalCulation of Sampling varianCe
PISA 2009 TECHNICAL REPORT – © OECD 2012 127
the BRR method does not have this theoretical flaw. The standard BRR procedure can become unstable when used to analyse sparse population subgroups, but Fay’s method overcomes this difficulty, and is well justified in the literature (Judkins, 1990).
The BRR method was implemented for a country where the student sample was selected from a sample of schools, rather than all schools, as follows:
•Schools were paired on the basis of the explicit and implicit stratification and frame ordering used in sampling. The pairs were originally sampled schools, except for participating replacement schools that took the place of an original school. For an odd number of schools within a stratum, a triple was formed consisting of the last three schools on the sorted list.
•Pairs were numbered sequentially, 1 to H, with pair number denoted by the subscript h. Other studies and the literature refer to such pairs as variance strata or zones, or pseudo-strata.
•Within each variance stratum, one school was randomly numbered as 1, the other as 2 (and the third as 3, in a triple), which defined the variance unit of the school. Subscript j refers to this numbering.
•These variance strata and variance units (1, 2, 3) assigned at school level were attached to the data for the sampled students within the corresponding school.
•Let the estimate of a given statistic from the full student sample be denoted as X*. This was calculated using the full sample weights.
•A set of 80 replicate estimates, Xt* (where t runs from 1 to 80), was created. Each of these replicate estimates was formed by multiplying the survey weights from one of the two schools in each stratum by 1.5, and the weights from the remaining schools by 0.5. The determination as to which schools received inflated weights, and which received deflated weights, was carried out in a systematic fashion, based on the entries in a Hadamard matrix of order 80. A Hadamard matrix contains entries that are +1 and –1 in value, and has the property that the matrix, multiplied by its transpose, gives the identity matrix of order 80, multiplied by a factor of 80. Details concerning Hadamard matrices are given in Wolter (2007).
•In cases where there were three units in a triple, either one of the schools (designated at random) received a factor of 1.7071 for a given replicate, with the other two schools receiving factors of 0.6464, or else the one school received a factor of 0.2929 and the other two schools received factors of 1.3536. The explanation of how these particular factors came to be used is explained in Appendix 12 of the PISA 2000 Technical Report (Adams and Wu, 2002).
•To use a Hadamard matrix of order 80 requires that there be no more than 80 variance strata within a country, or else that some combining of variance strata be carried out prior to assigning the replication factors via the Hadamard matrix. The combining of variance strata does not cause bias in variance estimation, provided that it is carried out in such a way that the assignment of variance units is independent from one stratum to another within strata that are combined. That is, the assignment of variance units must be completed before the combining of variance strata takes place, and this approach was used for PISA.
•The reliability of variance estimates for important population subgroups is enhanced if any combining of variance strata that is required is conducted by combining variance strata from different subgroups. Thus in PISA, variance strata that were combined were selected from different explicit sampling strata and also, to the extent possible, from different implicit sampling strata.
•In some countries, it was not the case that the entire sample was a two-stage design, of first sampling schools and then sampling students within schools. In some countries for part of the sample (and for the entire samples for Dubai [UAE], Iceland, Liechtenstein, Luxembourg, Macao-China, Qatar, and Trinidad and Tobago), schools were included with certainty into the sampling, so that only a single stage of student sampling was carried out for this part of the sample. In these cases instead of pairing schools, pairs of individual students were formed from within the same school (and if the school had an odd number of sampled students, a triple of students was formed). The procedure of assigning variance units and replicate weight factors was then conducted at the student level, rather than at the school level.
•In contrast, in one country, the Russian Federation, there was a stage of sampling that preceded the selection of schools. Then the procedure for assigning variance strata, variance units and replicate factors was applied at this higher level of sampling. The schools and students then inherited the assignment from the higher-level unit in which they were located.
•Procedural changes were in general not needed in the formation of variance strata for countries with extra direct grade sampled students (Brazil, Iceland, Liechtenstein, Slovenia, and certain explicit strata in Switzerland) since the extra grade sample came from the same schools as the PISA students. However, if there were certainty schools in these

8Survey Weighting and the CalCulation of Sampling varianCe
128 © OECD 2012 – PISA 2009 TECHNICAL REPORT
Notes
1. Note that this is not the same as excluding certain portions of the school population. This also happened in some cases, but cannot be addressed adequately through the use of survey weights.
2. Chapter 11 describes these schools as being treated as non-respondents for the purpose of response rate calculation, even though their student data were used in the analyses.
countries, students within the certainty schools were paired so that PISA non-grade students were together, PISA grade students were together and non-PISA grade students were together. No procedural changes were required for the grade students for Chile and Germany, since a separate weighting stream was needed in these cases.
•The variance estimator is then:
8.7
VBRR (X*)= 0.05 Σ (X*t – X*)280
t=1
The properties of BRR method have been established by demonstrating that it is unbiased and consistent for simple linear estimators (i.e. means from straightforward sample designs), and that it has desirable asymptotic consistency for a wide variety of estimators under complex designs, and through empirical simulation studies.
Reflecting weighting adjustmentsThis description does not detail one aspect of the implementation of the BRR method. Weights for a given replicate are obtained by applying the adjustment to the weight components that reflect selection probabilities (the school base weight in most cases), and then re-computing the non-response adjustment replicate by replicate.
Implementing this approach required that the PISA Consortium produce a set of replicate weights in addition to the full sample weight. Eighty such replicate weights were needed for each student in the data file. The school and student non-response adjustments had to be repeated for each set of replicate weights.
To estimate sampling errors correctly, the analyst must use the variance estimation formula above, by deriving estimates using the t-th set of replicate weights. Because of the weight adjustments (and the presence of occasional triples), this does not mean merely increasing the final full sample weights for half the schools by a factor of 1.5 and decreasing the weights from the remaining schools by a factor of 0.5. Many replicate weights will also be slightly disturbed, beyond these adjustments, as a result of repeating the non-response adjustments separately by replicate.
Formation of variance strataWith the approach described above, all original sampled schools were sorted in stratum order (including refusals, excluded and ineligible schools) and paired. An alternative would have been to pair participating schools only. However, the approach used permits the variance estimator to reflect the impact of non-response adjustments on sampling variance, which the alternative does not. This is unlikely to be a large component of variance in any PISA country, but the procedure gives a more accurate estimate of sampling variance.
Countries and economies where all students were selected for PISAIn Iceland, Liechtenstein, Macao-China and Qatar, all PISA-eligible students were selected for participation in PISA. It might be unexpected that the PISA data should reflect any sampling variance in these countries, but students have been assigned to variance strata and variance units, and the BRR method does provide a positive estimate of sampling variance for two reasons. First, in each country there was some student non-response, and, in the case of Iceland and Qatar, some school non-response. Not all PISA-eligible students were assessed, giving sampling variance. Second, the intent is to make inference about educational systems and not particular groups of individual students, so it is appropriate that a part of the sampling variance reflect random variation between student populations, even if they were to be subjected to identical educational experiences. This is consistent with the approach that is generally used whenever survey data are used to try to make direct or indirect inference about some underlying system.

9
PISA 2009 TECHNICAL REPORT – © OECD 2012 129
Scaling PISA Cognitive Data
The mixed coefficients multinomial logit model............................................................................. 130
Application to PISA .................................................................................................................................................. 132
Booklet effects ............................................................................................................................................................ 141
Analysis of data with plausible values ...................................................................................................... 142
Developing common scales for the purposes of trends ........................................................... 143

9Scaling PiSa cognitive Data
130 © OECD 2012 – PISA 2009 TECHNICAL REPORT
The mixed coefficients multinomial logit model as described by Adams, Wilson and Wang (1997) was used to scale the PISA data, and implemented by ConQuest® software (Wu, Adams and Wilson, 1997).
the Mixed coeFFicientS MultinoMial logit ModelThe model applied to PISA is a generalised form of the Rasch model. The model is a mixed coefficients model where items are described by a fixed set of unknown parameters, , while the student outcome levels (the latent variable), , is a random effect.
Assume that I items are indexed i = 1,...,I with each item admitting Ki + 1 response categories indexed k = 0,1,..., Ki . Use the vector valued random variable xi = (Xi1, Xi2,...,XiKi
)T where
9.1
9.2
9.3
9.4
if response to item i is in category j
otherwiseXij =
1
0
to indicate the Ki + 1 possible responses to item i.
A vector of zeroes denotes a response in category zero, making the zero category a reference category, which is necessary for model identification. Using this as the reference category is arbitrary, and does not affect the generality of the model. The xi can also be collected together into the single vector , called the response vector (or pattern). Particular instances of each of these random variables are indicated by their lower case equivalents: x, xi and xik.
Items are described through a vector xT = (x1,x2,...,xp), of p parameters. Linear combinations of these are used in the response probability model to describe the empirical characteristics of the response categories of each item. A set of design vectors aij , (i = 1,…, I ; j = 1,…Ki) , each of length p, which can be collected to form a design matrix aT = (a11, a12,…, a1K1
, a21, …, a2K2,…, aIKI
), define these linear combinations.
The multi-dimensional form of the model assumes that a set of D traits underlies the individuals’ responses. The D latent traits define a D-dimensional latent space. The vector = (q
1, q
2,…, qD)’, represents an individual’s position in the
D-dimensional latent space.
The model also introduces a scoring function that allows specifying the score or performance level assigned to each possible response category to each item. To do so, the notion of a response score bijd is introduced, which gives the performance level of an observed response in category j, item i, dimension d. The scores across D dimensions can be collected into a column vector bik = (bik1, bik2,…, bikD)T and again collected into the scoring sub-matrix for item i Bi = (bi1, bi2,…, biD)T, and then into a scoring matrix for the entire test. (The score for a response in the zero category is zero, but, under certain scoring schemes, other responses may also be scored zero.) The scoring matrix, B, represents the relationships between items and dimensions, and the design matrix, a, represents the relationships between items and the model parameters.
The probability of a response in category j of item i is modelled as
XT = (XT, XT,…, XT)1 2 I
B = (BT, BT,…, BT)T1 2 I
Pr (Xij = 1; A, B, ξ θ ) =exp (bij θ + a’ij ξ )
K i
Σk=1
exp (bik θ + a’ikξ )
There is a response vector,
ψ (θ, ξ) = Σ exp[zT (Bθ + Aξ)]-1
zεΩ
f (x; x I q) = ψ (q, x) exp [x’ (Bq + Ax)]
with
where W is the set of all possible response vectors.

9Scaling PiSa cognitive Data
PISA 2009 TECHNICAL REPORT – © OECD 2012 131
9.5
The population modelThe item response model is a conditional model, in the sense that it describes the process of generating item responses conditional on the latent variable, . The complete definition of the model, therefore, requires the specification of a density, f
q ( , ) for the latent variable, . Let symbolise a set of parameters that characterise the distribution of . The
most common practice, when specifying uni-dimensional marginal item response models, is to assume that students have been sampled from a normal population with mean m and variance σ 2. That is:
fθ ( ; ) fθ (θ; μ,σ 2) = (2πσ)-1/2 exp –( θ – μ)2
2σ 2
or equivalently
q = m + E
where E ~ N (0, σ 2).
Adams, Wilson and Wu (1997) discuss how a natural extension of [9.6] is to replace the mean, µ, with the regression model,
YT
n , where yn is a vector of u fixed and known values for student n, and is the corresponding vector of regression coefficients. For example, yn could be constituted of student variables such as gender or socio-economic status. Then the population model for student n becomes
9.7
θn
T +Enn
where it is assumed that the En are independently and identically normally distributed with mean zero and variance σ 2 so that [9.7] is equivalent to:
9.8
fθ (θn ; Yn , b,σ 2) = (2πσ 2)-1/2
exp – 1 (θn – YT
n )T (θn – YT
n )2σ 2
a normal distribution with mean YT
n and variance σ2. If [9.8] is used as the population model then the parameters to be estimated are , σ2 and .
The generalisation needs to be taken one step further to apply it to the vector-valued rather than the scalar-valued q. The extension results in the multivariate population model:
9.9
fθ (θn; Wn, γ,Σ ) = (2π)-d/2
Σ-1/2
exp – 1 (θn – γ Wn)TΣ
-1(θn – γ Wn)2
where is a u×D matrix of regression coefficients, Σ is a D ×D variance-covariance matrix, and wn is a u ×1 vector of fixed variables.
In PISA, the wn variables are referred to as conditioning variables.
Combined modelIn [9.10], the conditional item response model [9.3] and the population model [9.9] are combined to obtain the unconditional, or marginal, item response model:
9.10
fx (x; ξ, γ,Σ ) = fx (x; ξ θ) fθ (θ; γ,Σ)dθ θ
It is important to recognise that under this model the locations of individuals on the latent variables are not estimated. The parameters of the model are , and .
The procedures used to estimate model parameters are described in Adams, Wilson and Wu (1997), Adams, Wilson and Wang (1997), and Wu, Adams and Wilson (1997).
9.6

9Scaling PiSa cognitive Data
132 © OECD 2012 – PISA 2009 TECHNICAL REPORT
For each individual it is possible, however, to specify a posterior distribution for the latent variable, given by:
9.11
hθ (θn; Wn, ξ, γ,Σ xn ) =fx (xn; ξ θn) fθ
(θn; Wn, γ,Σ)fx (xn; Wn, ξ, γ,Σ)
= fx (xn; ξ θn) fθ
(θn; Wn, γ,Σ)fx (xn; ξ θn) fθ
(θn; Wn, γ,Σ)θn
aPPlication to PiSa
In PISA, this model was used in three steps: national calibrations, international scaling and student score generation.
For both the national calibrations and the international scaling, the conditional item response model [9.3] is used in conjunction with the population model [9.9], but conditioning variables are not used. That is, it is assumed that students have been sampled from a multivariate normal distribution.
Four multi-dimensional scaling models were used in the PISA 2009 main study. The first model, made up of one reading, one science and one mathematics dimension, was used for reporting overall scores for reading, science and mathematics. A second model, made up of one science, one mathematics and three reading aspects scales, was used to generate scores for the three reading subscales access and retrieve, integrate and interpret, and reflect and evaluate. A third model, made up of one science, one mathematics and two reading text format dimensions was used to generate scores for the two reading subscales: continuous text and non-continuous text. Fourth model, made up of one reading, one science, one mathematics and one digital reading dimension, was used for reporting overall scores for reading, science, mathematics and DRA scales for countries that implemented the DRA option in the PISA 2009 Main Study.
The design matrix was chosen so that the partial credit model (Masters, 1982) was used for items with multiple score categories and the simple logistic model was fit to the dichotomously scored items.
National calibrationsNational calibrations were performed separately, country by country, using unweighted data. Country means were constrained to zero during the estimation process. For the countries that administered booklet sets that included the core and standard items a linear transformation was applied to the national items difficulties so that the core and standard items have a mean of zero. For the countries that have used booklets that included core and easy items a linear transformation was applied to the national items difficulties so that the core items have the same mean as the mean of the core items for the OECD calibration sample. The results of these analyses, which were used to monitor the quality of the data and to make decisions regarding national item treatment, are given in Chapter 12.
The outcomes of the national calibrations were used to make a decision about how to treat each item in each country. This means that an item may be deleted from PISA altogether if it has poor psychometric characteristics in more than ten countries, referred to as a ‘dodgy item’; it may deleted from the scaling in particular countries if it has poor psychometric characteristics in those particular countries but functions well in the vast majority of others. When reviewing the national calibrations, particular attention was paid to the fit of the items to the scaling model, item discrimination and item-by-country interactions.
Item response model fit (weighted mean square MNSQ)
For each item parameter, the ConQuest® fit mean square index (Wu, 1997) was used to provide an indication of the compatibility of the model and the data. For each student, the model describes the probability of obtaining the different item scores. It is therefore possible to compare the model prediction and what has been observed for one item across students. Accumulating comparisons across students gives an item-fit statistic. As the fit statistics compare an observed value with a predicted value, the fit is an analysis of residuals. In the case of the item infit mean square, values near one are desirable. A weighted MNSQ greater than one is associated with a low discrimination index, meaning the data exhibits more variability than expected by the model, and an infit mean square less than one is associated with a high discrimination index, meaning the data exhibits less variability than expected by the model.
Discrimination coefficients
For each item, the correlation between the students’ score and aggregate score on the set for the same domain and booklet as the item of interest was used as an index of discrimination. If pij (calculated as xij/mi) is the proportion of score levels that student i achieved on item j, and pi = Σ pij
j(where the summation is of the items from the same booklet and

9Scaling PiSa cognitive Data
PISA 2009 TECHNICAL REPORT – © OECD 2012 133
domain as item j) is the sum of the proportions of the maximum score achieved by student i, then the discrimination is calculated as the product-moment correlation between pij and pi for all students. For multiple-choice and short-answer items, this index will be the usual point-biserial index of discrimination.
The point-biserial index of discrimination for a particular category of an item is a comparison of the aggregate score between students selecting that category and all other students. If the category is the correct answer, the point-biserial index of discrimination should be higher than 0.20 (Ebel and Frisbie, 1986). They set out the following recommendations regarding the index of discrimination:
magnitude Comment recommended action for item
> 0.39 Excellent Retain
0.30 – 0.39 Good Possibilities for improvement
0.20 – 0.29 Mediocre Need to check/review
0.00 – 0.20 Poor Discard or review in depth
< -0.01 Worst Definitely discard
Non-key categories should have a negative point-biserial index of discrimination. The point-biserial index of discrimination for a partial credit item should be ordered, i.e. categories scored 0 should have a lower point-biserial correlation than the categories scored 1, and so on.
Item-by-country interaction
The national scaling provides nationally specific item parameter estimates. The consistency of item parameter estimates across countries was of particular interest. If the test measured the same latent trait per domain in all countries, then items should have the same relative difficulty or, more precisely, would fall within the interval defined by the standard error on the item parameter estimate (i.e. the confidence interval).
National reportsAfter national scaling was completed, all the available national item statistics were imported in the international item database. International level item statistics described next in this section were also included in this database. This allowed summarising national level statistics and performing the comparison to the international and aggregated item statistics. Database with national items statistics was returned to each participating country to assist in reviewing their data with the Consortium.
Figure 9.1 illustrates an interface of the national database. The main screen represents the interactive list of items by domain that are flagged as dodgy items in a country. Each column indicates a specific problem.
• Figure 9.1 •Main screen

9Scaling PiSa cognitive Data
134 © OECD 2012 – PISA 2009 TECHNICAL REPORT
Countries were asked to check the following statistics:
•Item by country interaction:
The consistency of item parameters across countries is of particular importance in the international study. If the test measures the same underlying construct (or latent trait) the item should have similar relative difficulty in each country.
•Adjusted correlation:
For multiple-choice items this is equivalent to the point-biserial correlation (PB) of the correct response (key) and it should be 0.20 or higher. Otherwise it is marked as Low Adj. Correlation. If the item category is the key, the PB index should be positive (the same as for the item). Non-key categories (incorrect responses or distractors) should have negative PB index.
•Ability not ordered:
For partial credit items the student mean abilities should increase with increasing raw score; students that received score 0 should be have lower mean abilities than those that had score 1 and those with score 2 should have higher mean abilities than those with 1.
•Fit:
Infit Mean Square index is used to compare predicted value and observed value by analysis of residuals. Good fit should have values near one. An Infit Mean Square greater than one is associated with a low discrimination index while an Infit Mean Square lower than one is associated with a high discrimination index.
Four item reports could be generated using this database.
Report 1: Scatter plot An example of a scatter plot report is given in Figure 9.2. This report shows the scatter plot of national and OECD/International item difficulties. Both sets of difficulties are centred on zero and are therefore referred to as relative difficulties. The vertical axis represents the national relative item difficulties and the horizontal axis the OECD or International relative item difficulties. Each dot is an item.
The scatter plot gives an overview of the behaviour of all items in a domain in one country compared to the pooled OECD set (500 students from each OECD country available at the time of analysis pooled together) or International set (500 students from each country available at the time of analysis pooled together)
• Figure 9.2 •example of scatter plot
5
4
3
2
1
0YYY
OECD / INT
-1
-2
-3
-4
-5-5 -4 -3 -2 -1 0 1 2 3 4 5
Harder for YYY
Easier for YYY
Correlation (OECD avg: 0.902): 0.906
Items with an absolute difference > 0.65
Item ID
OECD / INTparameter
Nationalparameter
Difference(YYY - OECD / INT)
M447Q01M462Q01 DM800Q01
-0.778 0.858-3.168
-1.611 2.285-2.278
-0.833 1.427 0.890
SD Ratio (Nat / OECD or INT): 1.05
PISA 2009 Main Study - Country, National Item Statistics for MathematicsScatterplot with National and OECD / International Mathematics Item Difficulties

9Scaling PiSa cognitive Data
PISA 2009 TECHNICAL REPORT – © OECD 2012 135
Figure 9.2 provides an illustration of the overall level of agreement and it assists in identifying outliers. Items that lie exactly on the identity line (the diagonal line) have equal national and international relative item difficulties. An outlier occurs when the relative national item difficulty is very different from the OECD/International relative item difficulty. In Figure 9.2 there are a couple of obvious outliers. This suggests that something could be wrong with these items.
The table next to the scatter plot lists all items with an absolute difference of more than 0.65. The national centres were asked to check these items carefully for any translation or printing errors.
There are two types of summary statistics displayed in the blue box:
•SD ratio compares the spread of national item difficulties to the spread of the OECD/International item difficulties. It should be close to 1.
•Correlation should be similar to the OECD average correlation.
For this particular country both figures are satisfactory: the SD ratio is sufficiently close to one and the correlation is sufficiently similar to the OECD average correlation.
Report 2: Descriptive statistics on individual items in tabular formA detailed item-by-item report was provided in tabular form showing the basic item analysis statistics at the national level. This report provides classical item statistics for each item used in the national calibration. Summaries of item statistics are presented in a tabular form in item ID order. If for any reason, an item is excluded from the national calibration, the item ID will be listed at the end of the report. An example of item statistics for the fictitious item with ID R001Q03 is shown in Figure 9.3.
• Figure 9.3 •example of item statistics in tabular form
Two hundred and forty seven students have responded to this item in this country.
The national threshold and delta (difficulty) are -0.116 (for dichotomous items these two values are always the same).
The item adjusted correlation is 0.18. This is lower than 0.2 and would be reported on the interactive list of dodgy items and in the graphical summary report that is described in the next section.
The weighted mean square (MNSQ) fit statistic is 1.29. Small variations around one are expected, however, values larger than 1.2 indicate that the item discrimination is lower than assumed by the model, and values below 0.8 show that the item discrimination is higher than assumed. In this particular case the item would have a tick on the interactive screen in the Large Fit column and in the graphical summary report that is described in the next section.
The first column gives the original responses. This is a multiple-choice item and therefore, the responses are: 1=A, 2=B, 3=C, 4=D, 8=‘invalid’, 9=‘missing’ and R=‘not reached’. Please note that there are no statistics for code 8. This is because there were no students in this country who gave invalid responses to this item.
The second column shows the score assigned to each response category. The correct response to this item is 3 (C).
The third and fourth columns in the table list the number and percentage of students in each category. In this country, 124 students (50.2%) gave the correct response.

9Scaling PiSa cognitive Data
136 © OECD 2012 – PISA 2009 TECHNICAL REPORT
The point-biserial (PB) correlations are presented in column five. This is the correlation between a response category coded as a dummy variable (a score of 1 for students that responded with the current code and a score of 0 for students in other response categories) and the total domain score. For dichotomous items the point-biserial is equal to the adjusted correlation (0.18 in Figure 9.3). Correct responses should have positive correlations with the total score, incorrect responses negative correlations. In this case one of the incorrect responses (4) has positive point-biserial (0.10). However the item would not have a tick on the interactive screen in the corresponding column for positive PB in non-key category, because there were less than 15 students who responded to distractor 4. Rather, this item would be flagged for low adjusted correlation (< 0.20).
The two last columns show the average ability of students responding in each category and the associated standard deviation (SD). The average ability is calculated by domain. If an item is functioning well the group of students that gave the correct response should have a higher mean ability than the groups of students that provided incorrect responses. This is true for categories 1 and 2. For category 4 this does not hold, but since the number of students is less that fifteen, this is not flagged.
Report 3: Graphical summary of descriptive statistics by itemThis report provides comparisons between national and international item statistics in graphical form, one page per item.
An example of a full page for one item is given in Figure 9.4. More detailed information about each part of this report labelled A to D follows.
Part AThe top table in Figure 9.4 starts with the item code followed by the item name and item number in unit (R001Q05: Graph Example Q5).1 For reading items, there is also a group identifier on the right hand side of the table. In PISA 2009 Main Survey, the majority of reading items (common items) were administered in all participating countries. Twenty countries used booklets that included set of easier items. This was done to better cover the range of abilities in every country.
Item identifiers are followed by the overall item statistics, the same as in the national item statistics report described in the previous section: number of cases, adjusted correlation, weighted (infit) mean square (MNSQ), item thresholds and item difficulty (delta). In addition, item type (e.g. multiple choice) is presented. For multiple-choice items a key (correct choice) is also shown. Graph Example Q5 in Figure 9.4 is a partial credit item and therefore the key is not shown.
The next section of part A contains national, international and OECD statistics by response category. The first row contains the score for each category, the second and third rows contain number of students and percentage of students in each category in the country. OECD% is the percentage of students in each category in the pooled OECD data. INT % is the percentage of students in the category in the pooled data of all countries that administered the item. Note that OECD % is not available for the easy items, labelled as Group 2 reading items in this chapter.
Ability average, ability SD, and point-biserial are the same national statistics as in the national item statistics report. These statistics were described in the previous section.
Part BThe displayed graphs in part B facilitate the process for identifying the possible national anomalies related to item statistics by response category.
The first graph is important for partial credit items. It helps to check whether the average ability increases with the score points, as shown in Figure 9.4. Note that categories “9” and “R” are not identified as score points.
The second graph is important for multiple-choice items. It helps to check whether:
•a non-key category has a positive point-biserial;
•a non-key category has a point-biserial higher than the key category; and
•the key category has a negative point-biserial.

9Scaling PiSa cognitive Data
PISA 2009 TECHNICAL REPORT – © OECD 2012 137
PISa mS09: graphical presentation of item statistics for Country - R001Q05R001Q05: Graph Example Q5
Number of Cases: 2025 Adjusted Correlation: 0.54 Item Threshold(s): -0.38 0.003
Item Type: Partial Credit Item Weighted MNSQ: 1.29 Item Delta(s): 0.764 -1.141
response 0 1 2 9 rScore 0 1 2 0 0Students 381 212 1104 313 15Percentage of tot 18.81 10.47 54.52 15.46 0.74oeCd % 15.73 13.75 59.27 9.4 1.84Int % 17.87 13.38 54.25 11.87 2.63ability avg -0.62 0.33 0.8 -1.17 -2.41ability Sd 1.13 1.03 1.06 1.23 1.09Pt Bis -0.25 0.06 0.48 -0.41 -0.15
average ability by category2
1
0
-1
-2
Point biserial by category0.6
0.3
0
-0.3
-0.6
delta infit mean square adjusted correlation0.70 1.00 1.30 (value) 0.00 0.25 0.50 (value)
International Value: x 1.29 x 0.47Aggregated Statistics (Mean +/- 1 Std.dev): National Value: x 1.29 x 0.54
Item by country interaction adjusted correlation Fitno of valid responses /Countries
easier than expected
harder than expected
non-key PB is Positive
Key PB is negative
Low adjusted Correlation
ability not ordered
Small (high discrimination
Item)
Large (Low discrimination
Item)
r001Q05 2010 q q q q q q q
Countries: 48 12 9 0 0 0 0 23
oeCd countries: 22 4 7 0 0 0 0 15
other countries: 26 8 2 0 0 0 0 8
delta (item difficulty) Item-category threshold-2.0 0.0 2.0 (value) -2.0 0.0 2.0 (value)
International Value: trh 1 x -0.227 x -0.487Aggregated Statistics (Mean +/- 1 Std.dev): National Value: x -0.188 x -0.38
International Value: trh 2 x 0.033Aggregated Statistics (Mean +/- 1 Std.dev): National Value: x 0.003
• Figure 9.4 •example of graphical summary by item report

9Scaling PiSa cognitive Data
138 © OECD 2012 – PISA 2009 TECHNICAL REPORT
Part CThis part presents the graphical comparisons of overall item statistics at the national and OECD level.
National scaling provides for each country and item, the weighted MNSQ, adjusted correlation, delta item parameter estimate (or difficulty estimate) and threshold estimates. For each item these national values will be compared with the pooled OECD value and average value for all OECD countries in the database at the time of comparison.
The black crosses at the top of each of the pictures represent the value of the coefficients computed from the pooled OECD data. The coloured boxes show the distribution of values obtained from each of available OECD country (all students). To obtain this distribution each OECD country is calibrated separately. Then the mean and standard deviation of the national estimates are computed. The boxes are located so that their mid-point (indicated with a vertical bar) is at the mean and the left and right boundaries are located at the mean plus and minus one standard deviation respectively.
The orange crosses at the bottom of the pictures indicate the values computed only for your national dataset.
Any substantial differences between the national value and the OECD value, or the average OECD value, indicate that the item is behaving differently in that country in comparison to the other countries. This might reflect a mistranslation or printing problem. On the other hand, if the item is misbehaving in many countries, it might reflect a specific problem in the source item and not with one or more national versions of this item.
OECD statistics are not available for easier reading items (Group 2 reading items). Hence, the statistics for these items are calculated based on the pooled data from 20 countries.
Part DAt the bottom of the page a table with check boxes shows whether any substantial problems were found as a result of the national calibration for the particular item. The table indicates if an item was flagged for one of the following reasons:
•the relative national item difficulty is significantly higher or lower than OECD/International relative item difficulties;
•for multiple-choice items one of the non-key categories has a point-biserial correlation higher than 0.05 (only reported if the category was chosen by at least 15 students);
•for multiple-choice items the key category for has a point-biserial lower than -0.05 (only reported if the category was chosen by at least 15 students);
•the adjusted correlation of the item is lower than 0.2;
•for partial credit items the category abilities are not ordered (only reported if both score categories in comparison have at least 15 students each); and
•the fit statistics are higher than 1.2 or lower than 0.8
In the example in Figure 9.4, the box is ticked indicating large fit index. This is also shown in Part A (weighted MNSQ=1.26).
The next row below the tick boxes shows how many countries in total have a similar problem for the same item. The last two rows are the numbers of OECD countries and partner countries that have the same problem. The large fit problem, which is identified in Parts A and D, does not look problematic on the graph in part C for this particular country. It is because out of 48 available countries, 23 countries (or 15 out of 22 available OECD countries) have the same problem (the figures are fictitious). This indicates a specific problem in the source item instead of possible mistranslation or misprint problems in the national versions.
However, if an item has at least one tick, and the number of countries below this tick is less than 10, the national centres were strongly recommended to review the translation and printing of the item in all booklets and its appropriateness for the national context.
All flagged items are considered to be dodgy items either nationally if a problem occurs only in a particular country, or internationally if the same problem occurs in many countries (in more than 50% of cases).
Report 4: International list of dodgy itemsThe last report gives a summary of dodgy items for all countries included in the analysis at the time of reporting. A part of this table is given in Figure 9.5. The table includes all items for completeness.

9Scaling PiSa cognitive Data
PISA 2009 TECHNICAL REPORT – © OECD 2012 139
• Figure 9.5 •example of an international list of dodgy items
If an item has poor psychometric properties in a large number of countries then it most likely should be explained by reasons other than mistranslation and misprint.
International calibrationIn PISA 2009 countries with an expected mean reading score less than 450 were given the option to choose an easier set of booklets for the main survey (see Chapter 2 for more details). In total, 20 countries opted for the easier booklets, of which two, Mexico and Chile, were OECD member countries.
As in the previous cycles, mathematics and science international item parameters were set by applying the conditional item response model (9.3) in conjunction with the multivariate population model (9.9), without using conditioning variables, to a sub-sample of students. This subsample of students referred to as an OECD calibration sample consisted of 15 500 students comprising 500 students drawn at random from each of the 31 participating OECD countries. Countries that joined the OECD recently, Chile, Estonia and Israel, were not included in the calibration sample. Not-reached items were excluded from the calibration. For model identification the average difficulty of all items in each domain was set to zero.
Reading items required a two-step calibration process in PISA 2009. A second calibration sample was formed by adding subsamples of 500 students from each of the 20 countries that used easy booklets to the international OECD calibration sample (Group 2 reading items). This second calibration sample is referred to as the easy booklets calibration sample. Two-step calibration of the Group 2 reading items was performed as following:
•Step 1: The core and standard items were calibrated using OECD calibration sample (standard items were coded as not administered in Mexico and Chile).
•Step 2: The easier items that were not included in the regular booklets were calibrated using the easy booklets calibration sample, while anchoring the core and standard items to the estimates obtained from step 1.
For DRA item calibration it was decided to create a calibration sample with a similar number of responses per item as for the pencil and paper test. For the pencil and paper test sampling 500 students yields 154 responses per item, since each student responds to approximately 4/13 of all items. For DRA, sampling 230 students results in 154 responses per item since each students responds to approximately 2/3 of all items.
The international scaling for DRA items was performed using a calibration sample of 4 370 students (230 randomly selected students from each of the 19 participating countries).
The allocation of each PISA item to one of the four PISA 2009 scales is given in Annex A.

9Scaling PiSa cognitive Data
140 © OECD 2012 – PISA 2009 TECHNICAL REPORT
Student score generationAs with all item response scaling models, student proficiencies (or measures) are not observed; they are missing data that must be inferred from the observed item responses. There are several possible alternative approaches for making this inference. PISA uses the imputation methodology usually referred to as plausible values (PVs). PVs are a selection of likely proficiencies for students that attained each score.
Plausible valuesUsing item parameters anchored at their estimated values from the international calibration, the plausible values are random draws from the marginal posterior of the latent distribution [9.11] for each student. For details on the uses of plausible values, see Mislevy (1991) and Mislevy et al. (1992).
In PISA, the random draws from the marginal posterior distribution are taken as follows.
Draw M vector-valued random deviates, M
m=1mn , from the multivariate normal distribution, f ( n; wn, , ), for each case n, these vectors are used to approximate the integral in the denominator of [9.11], using the Monte-Carlo integration: 2
9.12
fx (x; )fθ ( , )d ≈ 1M
Σm=1
fx (x; mn)= M
At the same time, the values
9.13
pmn = fx (xn; x I mn) fq ( mn ; wn, , )
are calculated, so that we obtain the set of pairs ,mnMPm=1( mn ) , which can be used as an approximation of the
posterior density [9.11]; and the probability that nj could be drawn from this density is given by
9.14
qnj =pmn
M
Σm=1
pmn
At this point, L uniformly distributed random numbers {ηi}Li = 1 are generated; and for each random draw, the vector,
ni0 , that satisfies the condition
9.15
i0 – 1
Σs=1
qsn < ηi ≤i0
Σs=1
qsn
is selected as a plausible vector.
Constructing conditioning variablesThe PISA conditioning variables are prepared using procedures based on those used in the United States National Assessment of Educational Progress (Beaton, 1987) and in TIMSS (Macaskill, Adams and Wu, 1998). All available student-level information, other than their responses to the items in the booklets, is used either as direct or indirect regressors in the conditioning model. The preparation of the variables for the conditioning proceeds as follows.
Variables for booklet ID were represented by deviation contrast codes and were used as direct regressors. Each booklet was represented by one variable, except for reference booklet 9. Booklet 9 was chosen as reference booklet because it included items from all domains. The difference between simple contrast codes that were used in PISA 2000 and 2003 is that with deviation contrast coding the sum of each column is zero (except for the UH booklet), whereas for simple contrast coding the sum is one. The contrast coding scheme is given in Annex B. In addition to the deviation contrast codes, regression coefficients between reading or mathematics and the booklet contrasts that represent booklets without mathematics or reading were fixed to zero. The combination of deviation contrast codes and fixing coefficients to zero resulted in an intercept in the conditioning model that is the grand mean of all students that responded to items in a

9Scaling PiSa cognitive Data
PISA 2009 TECHNICAL REPORT – © OECD 2012 141
domain if only the booklet is used as independent variable. This way, the imputation of abilities for students that did not respond to any mathematics or reading items is based on information from all booklets that have items in a domain and not only from the reference booklet as in simple contrast coding.
Other direct variables in the regression are gender (and missing gender if there are any) and deviation contrast codes for schools with the largest school as reference school, grade, mother and father ISEI and interaction between gender, grade, and ISEI. All other categorical variables from the student, ICT, educational career and parent questionnaires were dummy coded. These dummy variables and all numeric variables (the questionnaire indices) were analysed in a principle component analysis. The details of recoding the variables before the principle component analysis are listed in Annex B. The number of component scores that were extracted and used in the scaling model as indirect regressors was country specific and explained 95% of the total variance in all the original variables.
The item-response model was fitted to each national data set and the national population parameters were estimated using item parameters anchored at their international location, the direct and indirect conditioning variables described above and fixed regression coefficients between booklet codes and the minor domains that were not included in the corresponding booklet.
Given that the DRA reporting scale cannot influence the PISA paper and pencil assessment, it was suggested that the plausible values for DRA countries are drawn in two steps. The first model is a three-dimensional model with reading, mathematics and science. This model was used to estimate covariances between the pencil and paper domains and the regression coefficients between the background variables and three main domains. Subsequently final plausible values for all domains have been drawn from a four-dimensional model including DRA, anchoring covariances and regression coefficients to the parameters from the three-dimensional paper and pencil model.
All students from schools that are sampled for DRA and received plausible values for pencil and paper PISA received plausible values for DRA.
Four multi-dimensional scaling models described above were estimated.
booKlet eFFectSAs with PISA 2003 and PISA 2006, the PISA 2009 test design was balanced, so that the item parameter estimates that are obtained from scaling are not influenced by a booklet effect, as was the case in PISA 2000. However, due to the different location of domains within each of the booklets it was expected that there would still be booklet influences on the estimated proficiency distributions.
Modelling the order effect in terms of item positions in a booklet or at least in terms of cluster positions in a booklet would result in a very complex model. For the sake of simplicity in the international scaling, the effect was modelled separately for each domain at the booklet level, as in previous cycles.
When estimating the item parameters, booklet effects were included in the measurement model to prevent confounding item difficulties and booklet effects. For the ConQuest model statement, the calibration model was:
item + item*step + booklet.
The booklet parameter, formally defined in the same way as item parameters, reflects booklet difficulty.
The calibration model given above was used to estimate the international item parameters for mathematics, reading and science. As the DRA test was balanced and included only one dimension it was unnecessary to add a set of booklet parameters to the model and estimate a booklet effect. The booklet parameters obtained from this analysis were not used to correct for the booklet effect. Instead, a set of booklet parameters for the standard booklets was obtained by scaling the entire data set of equally weighted OECD countries using booklet as a conditioning variable. The students who responded to the UH booklet were excluded from the estimation. A set booklet parameter for the easy booklets was obtained by scaling the entire set of equally weighted countries that opted to use an easy booklet set, using booklet as a conditioning variable.
The booklet parameter estimates obtained are reported in Chapter 12. The booklet effects are the amount that must be added to or subtracted from the proficiencies of students who responded to each booklet.

9Scaling PiSa cognitive Data
142 © OECD 2012 – PISA 2009 TECHNICAL REPORT
To correct the student mathematics, reading and science scores for the booklet effects, two alternatives were considered:
•correcting all students’ scores using one set of the internationally estimated booklet parameters; or
•correcting the students’ scores using nationally estimated booklet parameters for each country.
When choosing between these two alternatives a number of issues were considered. First, it is important to recognise that the sum of the booklet correction values is zero for each domain, so the application of either of the above corrections does not change the country means or rankings. Second, if a national correction was applied then the booklet means will be the same for each domain within countries. As such, this approach would incorrectly remove a component of expected sampling and measurement error variation. Third, the booklet corrections are essentially an additional set of item parameters that capture the effect of the item locations in the booklets. In PISA all item parameters are treated as international values so that all countries are therefore treated in exactly the same way. Perhaps the following scenario best illustrates the justification for this. Suppose students in a particular country found the reading items on a particular booklet surprisingly difficult, even though those items have been deemed as central to the PISA definition of PISA literacy and have no technical flaws, such as a translation or coding error. If a national correction were used then an adjustment would be made to compensate for the greater difficulty of these items in that particular country. The outcome would be that two students from different countries who responded in the same way to these items would be given different proficiency estimates. This differential treatment of students based upon their country has not been deemed as suitable in PISA. Moreover this form of adjustment would have the effect of masking real underlying differences in literacy between students in those two countries, as indicated by those items.
Applying an international correction was therefore deemed the most desirable option from the perspective of cross-national consistency.
analySiS oF data with PlauSible valueSIt is very important to recognise that plausible values are not test scores and should not be treated as such. They are random numbers drawn from the distribution of scores that could be reasonably assigned to each individual – that is, the marginal posterior distribution [9.11]. As such, plausible values contain random error variance components and are not as optimal as scores for individuals. Plausible values as a set are better suited to describing the performance of the population. This approach, developed by Mislevy and Sheehan (1987, 1989) and based on the imputation theory of Rubin (1987), produces consistent estimators of population parameters. Plausible values are intermediate values provided to obtain consistent estimates of population parameters using standard statistical analysis software such as SPSS® and SAS®. As an alternative, analyses can be completed using ConQuest® (Wu, Adams and Wilson, 1997).
The PISA student file contains 45 plausible values, 5 for each of the 9 PISA 2009 scales. PV1MATH to PV5MATH are for mathematical literacy; PV1SCIE to PV5SCIE for scientific literacy, PV1READ to PV5READ for reading literacy, and PV1ERA to PV5ERA for digital reading assessment. For the three reading aspects literacy subscales, access and retrieve, integrate and interpret, reflect and evaluate, the plausible values variables are PV1READ1 to PV5 READ 1, PV1 READ 2 to PV5 READ 2, and PV1 READ 3 to PV5 READ 3, respectively. For the two reading text format subscales, the plausible values variables are PV1READ4 to PV5READ4, PV1READ5 to PV5READ5.
If an analysis were to be undertaken with one of these nine scales, then it would ideally be undertaken five times, once with each relevant plausible values variable. The results would be averaged, and then significance tests adjusting for variation between the five sets of results computed.
More formally, suppose that r ( , y) is a statistic that depends upon the latent variable and some other observed characteristic of each student. That is: ( , y) = (q1, y1, q2, y2,…, qN , yN) where (qn , yn ) are the values of the latent variable and the other observed characteristic for student n. Unfortunately qn is not observed, although we do observe the item responses, xn from which we can construct for each student n, the marginal posterior h
q (qn ; yn, x, g, ∑ I xn).
If hq (q ; y, x, g, ∑ I x) is the joint marginal posterior for n = 1,…N then we can compute:
9.16
r*(X , Y) = E [r*(θ, Y) X, Y]
= r (θ, Y)hθ (θ; Y, ξ, γ,Σ X)dθ
θ
9Scaling PiSa cognitive Data
PISA 2009 TECHNICAL REPORT – © OECD 2012 143
The integral in [9.16] can be computed using the Monte-Carlo method. If M random vectors ( 1, 2, …, M) are drawn from
hq (q ; y, x, g, ∑ I x) is approximated by:
9.17
r* (X, Y) ≈ 1M
Σm=1
r ( m, Y)M
= 1M
Σm=1
rmM
where r̂ m is the estimate of r computed using the m-th set of plausible values.
From [9.16] we can see that the final estimate of r is the average of the estimates computed using each randomly drawn vector in turn. If Um is the sampling variance for r̂ m then the sampling variance of r* is:
9.18
V = U* + (1+M -1)BM ,
where U* = 1 M
Σm=1
U andmM BM = 1 M
Σm=1
(rm – r *)2M–1.
An α-% confidence interval for r* is r* ± tυ
(1– α)2
v1/2 where tu (s) is the s- percentile of the t-distribution with ν degrees
of freedom. υ = f 2 + (1– fM)2-1
M
M–1 d , fM = (1 + M-1)BM / V and d is the degree of freedom that would have applied had qn
been observed. In PISA, d will vary by country and have a maximum possible value of 80.
develoPing coMMon ScaleS For the PurPoSeS oF trendSThe reporting scales that were developed for each of reading, mathematics and science in PISA 2000 were linear transformations of the natural logit metrics that result from the scaling as described above. The transformations were chosen so that the mean and standard deviation of the PISA 2000 scores was 500 and 100 respectively, for the equally weighted 27 OECD countries that participated in PISA 2000 that had acceptable response rates (Wu and Adams, 2002).
For PISA 2003 the decision was made to report the reading and science scores on these previously developed scales. That is, the reading and science reporting scales used for PISA 2000 and PISA 2003 are directly comparable. The value of 500, for example, has the same meaning as it did in PISA 2000.
For mathematics this was not the case, however. Mathematics, as the major domain, was the subject of major development work for PISA 2003, and the PISA 2003 mathematics assessment was much more comprehensive than the PISA 2000 mathematics assessment – the PISA 2000 assessment covered just two (space and shape, and change and relationships) of the four areas that are covered in PISA 2003. Because of this broadening in the assessment it was deemed inappropriate to report the PISA 2003 mathematics scores on the same scale as the PISA 2000 mathematics scores. For mathematics the linear transformation of the logit metric was chosen such that the mean was 500 and standard deviation 100 for the 30 OECD countries that participated in PISA 2003. For PISA 2006 the decision was made to report the reading on these previously developed scales. That is the reading reporting scales used for PISA 2000, PISA 2003 and PISA 2006 are directly comparable. Mathematics reporting scales are directly comparable for PISA 2003 and PISA 2006. For science a new scale was established in 2006. The metric for that scale was set so that the mean was 500 and standard deviation 100 for the 30 OECD countries that participated in PISA 2006.
To permit a comparison of the PISA 2006 science results with the science results in previous data collections a science link scale was prepared. The science link scale provides results for 2003 and 2006 using only those items that were common to the two PISA studies. These results are provided in a separate database.
For PISA 2009 the decision was made to report the reading, mathematics and science scores on these previously developed scales. That is the reading scales used for PISA 2000, PISA 2003. PISA 2006 and PISA 2009 are directly comparable. PISA 2009 mathematics reporting scale is directly comparable to PISA 2003 and PISA 2006 and the science reporting scale is directly comparable to PISA 2006 scale.
Further details on the various PISA reporting scales are given in Chapter 12.
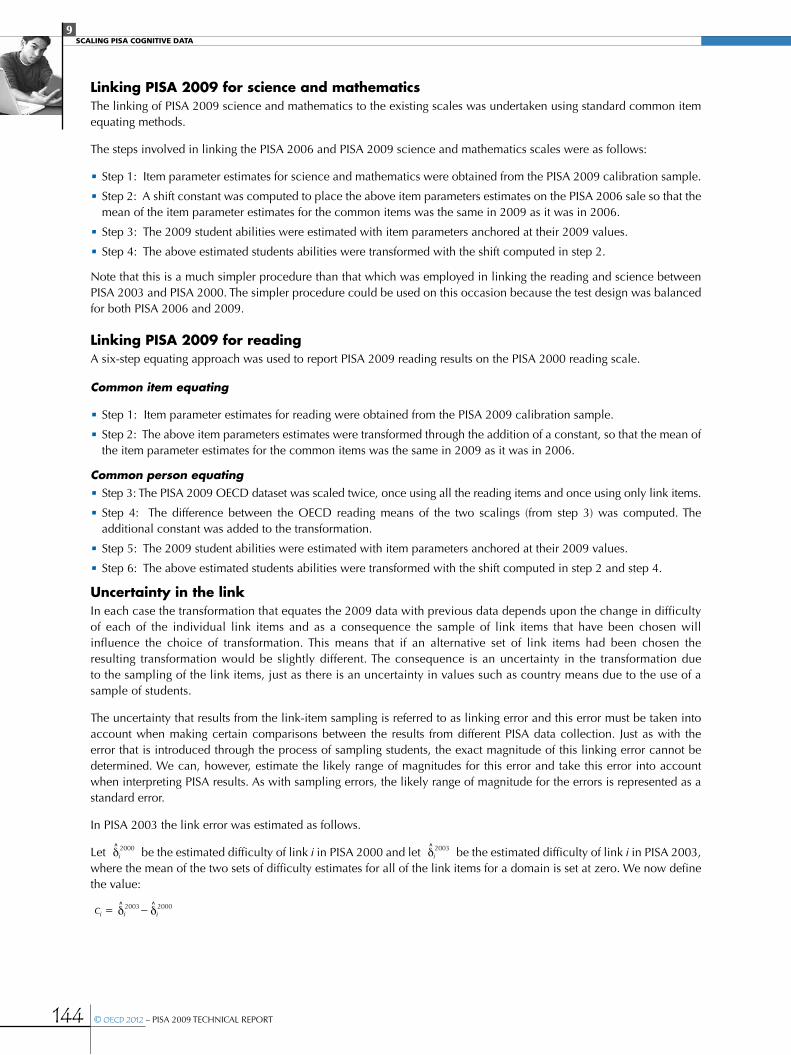
9Scaling PiSa cognitive Data
144 © OECD 2012 – PISA 2009 TECHNICAL REPORT
Linking PISA 2009 for science and mathematicsThe linking of PISA 2009 science and mathematics to the existing scales was undertaken using standard common item equating methods.
The steps involved in linking the PISA 2006 and PISA 2009 science and mathematics scales were as follows:
•Step 1: Item parameter estimates for science and mathematics were obtained from the PISA 2009 calibration sample.
•Step 2: A shift constant was computed to place the above item parameters estimates on the PISA 2006 sale so that the mean of the item parameter estimates for the common items was the same in 2009 as it was in 2006.
•Step 3: The 2009 student abilities were estimated with item parameters anchored at their 2009 values.
•Step 4: The above estimated students abilities were transformed with the shift computed in step 2.
Note that this is a much simpler procedure than that which was employed in linking the reading and science between PISA 2003 and PISA 2000. The simpler procedure could be used on this occasion because the test design was balanced for both PISA 2006 and 2009.
Linking PISA 2009 for readingA six-step equating approach was used to report PISA 2009 reading results on the PISA 2000 reading scale.
Common item equating
•Step 1: Item parameter estimates for reading were obtained from the PISA 2009 calibration sample.
•Step 2: The above item parameters estimates were transformed through the addition of a constant, so that the mean of the item parameter estimates for the common items was the same in 2009 as it was in 2006.
Common person equating •Step 3: The PISA 2009 OECD dataset was scaled twice, once using all the reading items and once using only link items.
•Step 4: The difference between the OECD reading means of the two scalings (from step 3) was computed. The additional constant was added to the transformation.
•Step 5: The 2009 student abilities were estimated with item parameters anchored at their 2009 values.
•Step 6: The above estimated students abilities were transformed with the shift computed in step 2 and step 4.
Uncertainty in the linkIn each case the transformation that equates the 2009 data with previous data depends upon the change in difficulty of each of the individual link items and as a consequence the sample of link items that have been chosen will influence the choice of transformation. This means that if an alternative set of link items had been chosen the resulting transformation would be slightly different. The consequence is an uncertainty in the transformation due to the sampling of the link items, just as there is an uncertainty in values such as country means due to the use of a sample of students.
The uncertainty that results from the link-item sampling is referred to as linking error and this error must be taken into account when making certain comparisons between the results from different PISA data collection. Just as with the error that is introduced through the process of sampling students, the exact magnitude of this linking error cannot be determined. We can, however, estimate the likely range of magnitudes for this error and take this error into account when interpreting PISA results. As with sampling errors, the likely range of magnitude for the errors is represented as a standard error.
In PISA 2003 the link error was estimated as follows.
Let δ^ 2000
i be the estimated difficulty of link i in PISA 2000 and let δ^ 2003
i be the estimated difficulty of link i in PISA 2003, where the mean of the two sets of difficulty estimates for all of the link items for a domain is set at zero. We now define the value:
δ^ 2003
ii δ^ 2000
ic = –

9Scaling PiSa cognitive Data
PISA 2009 TECHNICAL REPORT – © OECD 2012 145
The value ci is the amount by which item i deviates from the average of all link items in terms of the transformation that is required to align the two scales. If the link items are assumed to be a random sample of all possible link items and each of the items is counted equally then the link error can be estimated as follows:
22000,2003
1i
error cL
= Σ
Where the summation is over the link items for the domain and L is the number of link items.
Monseur and Berezner (2007) have shown that this approach to the link error estimation is inadequate in two regards. First, it ignores the fact that the items are sampled as units and therefore a cluster sample rather than a simple random sample of items should be assumed. Secondly, it ignores the fact that partial credit items have a greater influence on students’ scores than dichotomously scored items. As such, items should be weighted by their maximum possible score when estimating the equating error.
To improve the estimation of the link error the following improved approach has been used in PISA 2006 and PISA 2009. Suppose we have L link items in K units. Use i to index items in a unit and j to index units so that δ
^ yij is the estimated
difficulty of item i in unit j for year y, and let
δ^ 2006
iji δ^ 2003
ijc j = –
The size (total number of score points) of unit j is mj so that:
1
K
jj
m L=
= and 1
1 K
jj
m mK
=
=Σ Σ
Further let:
1
1 jm
j ijjj
c cm•
=
= and1 1
1 jmK
ijj i
c cN = =
=Σ ΣΣ
and then the link error, taking into account the clustering is as follows:
( )2m c c
( )1
2006,2003 2
K
j jjerror
•==
2ΣK mK – 1
The PISA 2006 approach for estimating the link errors was used again in PISA 2009. The link standard errors are reported in Chapter 12.
In PISA a common transformation has been estimated, from the link items, and this transformation is applied to all participating countries. It follows that any uncertainty that is introduced through the linking is common to all students and all countries. Thus, for example, suppose the unknown linking error (between PISA 2006 and PISA 2009) in reading resulted in an over-estimation of student scores by two points on the PISA 2006 scale. It follows that every student’s score will be over-estimated by two score points. This over-estimation will have effects on certain, but not all, summary statistics computed from the PISA 2009 data. For example, consider the following:
•Each country’s mean will be over-estimated by an amount equal to the link error, in our example this is two score points.
•The mean performance of any subgroup will be over-estimated by an amount equal to the link error, in our example this is two score points.
•The standard deviation of student scores will not be effected because the over-estimation of each student by a common error does not change the standard deviation.
•The difference between the mean scores of two countries in PISA 2009 will not be influenced because the over-estimation of each student by a common error will have distorted each country’s mean by the same amount.
•The difference between the mean scores of two groups (e.g. males and females) in PISA 2009 will not be influenced, because the over-estimation of each student by a common error will have distorted each group’s mean by the same amount.

9Scaling PiSa cognitive Data
146 © OECD 2012 – PISA 2009 TECHNICAL REPORT
•The difference between the performance of a group of students (e.g. a country) between PISA 2006 and PISA 2009 will be influenced because each student’s score in PISA 2006 will be influenced by the error.
•A change in the difference in performance between two groups from PISA 2006 to PISA 2009 will not be influenced. This is because neither of the components of this comparison, which are differences in scores in 2009 and 2006 respectively, is influenced by a common error that is added to all student scores in PISA 2009.
In general terms, the linking error need only be considered when comparisons are being made between results from different PISA data collections, and then usually only when group means are being compared.
The most obvious example of a situation where there is a need to use linking error is in the comparison of the mean performance for a country between two PISA data collections. For example, let us consider a comparison between 2003 and 2009 of the performance of Norway in mathematics. The mean performance of Norway in 2003 was 495 with a standard error of 2.38, while in 2009 the mean was 498 with a standard error of 2.40.
The standard error on this difference, as mentioned above, is influenced by the linking error. The standard error is therefore equal to:
2003SE σ2
μ 2009 linking errorσ2
μ= + σ2+
SE 2.382 2.402+ 1.992 3.92+= =
The standardised difference in the Norwegian mean is 0.71, which is computed as follows:
0.71 =498 – 495
3.92
and is not statistically significant (values <1.96 are not statistically significant on the 95% level of confidence).
Notes
1. The samples used were simple random samples stratified by the explicit strata used in each country. Students who responded to the UH booklet were not included in this process.
2. The value M should be large. For PISA we have used 2000.
10
PISA 2009 TECHNICAL REPORT – © OECD 2012 147
Data ManagementProcedures
Introduction .................................................................................................................................................................. 148
Data management at the national centre .............................................................................................. 150
Data cleaning at ACER ........................................................................................................................................... 152
Final review of the data ........................................................................................................................................ 153
Next steps in preparing the international database ...................................................................... 154

148 © OECD 2012 – PISA 2009 TECHNICAL REPORT
10DATA MANAGEMENT PROCEDURES
introductionThe PISA assessment establishes standard data collection requirements that are common to all PISA participants. Test instruments include the same test items in all participating countries, and data collection procedures are applied in a common and consistent way amongst all participants to help ensure data quality. Test development is described in Chapter 2, and the data collection procedures are described in this chapter.
As well as the common test elements and data management procedures, the opportunity also exists for participants to adapt certain questions or procedures to suit local circumstances, and to add optional components that are unique to a particular national context. To accommodate the need for such national customisation, PISA procedures need to ensure that national adaptations are approved by the Consortium, are accurately recorded, and where necessary the mechanisms for re-coding data from national versions to a common international format are clearly established. The procedures for adapting the international test materials to national contexts are described in Chapter 2 and the procedures for adapting the questionnaires are described in Chapter 3. The mechanisms for re-coding data from national versions to a common international format are described in this chapter.
As well as planned variations in the data collected at the national level, the possibility exists for unplanned and unintended variations finding their way into the instruments. Data prepared by national data teams can be corrupted or inaccurate as a result of a number of unintended sources of error. PISA data management procedures are designed to minimise the likelihood of errors occurring, to identify instances where errors may have occurred, and to correct such errors wherever it is possible to do so before the data are finalised. The easiest way to deal with ambiguous or incorrect data would be to delete the whole data record containing values that may be incorrect. However, this should be avoided where possible since the deleted data records results in a decrease in the country’s response rate. This chapter will therefore also describe those aspects of data management that are directed at identifying and correcting errors. These procedures applied for both the pencil and paper and computer-delivered components of PISA 2009.
The complex relationship between data management and other parts of the project such as development of source materials, instrument adaptation and verification, as well as school sampling are illustrated in Figure 10.1. Some of these functions are located within national centres, some are located within the international Consortium, and some are negotiated between the two.
Data management procedures must be shaped to suit the particular cognitive test instruments and background questionnaire instruments used in each participating country. Hence the source materials provided by the Consortium, the national adaptation of those instruments, and the international verification of national versions of all instruments must all be reflected in the data management procedures. Data management procedures must also be informed by the outcomes of PISA sampling procedures. The procedures must reliably link data to the students from whom they came. Finally, the test operational procedures that are implemented by each national centre, and in each test administration session, must be directly related to the data management procedures.
• Figure 10.1 •data management in relation to other parts of PiSa
School Sampling Source materials
Field operations
data management
verificationnational adaptations
Consortium responsibility
National Centre responsibility
Consortium responsibility in consultation with National Centres

PISA 2009 TECHNICAL REPORT – © OECD 2012 149
10DATA MANAGEMENT PROCEDURES
Figure 10.2 illustrates the sequence of major data management tasks in PISA, and shows something of the division of responsibilities between national centres, the Consortium, and those tasks that involve negotiation between the two. This section briefly introduces each of the tasks. More details are provided in the following sections.
First, ACER provides the data management software KeyQuest to all national centres. KeyQuest is generic software that can be configured to meet a variety of data entry requirements. In addition to its generic features, the latest version of KeyQuest was pre-configured specifically for PISA 2009.
KeyQuest was preconfigured with all the PISA 2009 standard instruments: cognitive test booklets, background and contextual questionnaires, and student tracking instruments that are derived following implementation of the school sampling procedures. However, it also allows for instrument modifications such as addition of national questions, deletion of some questions and modification of some questions. A prerequisite for national modification of KeyQuest is Consortium approval of proposed national adaptations.
After the national centres receive KeyQuest, they carry out student sampling and they implement KeyQuest modifications as a part of preparation for testing. By that time the variations from the core PISA sampling procedures such as national and international options (see Chapter 6) and the proposed national adaptations of the international source instruments (see Chapters 3 and 6) were agreed with Consortium and all national versions of instruments have been verified.
data CLeanIng at aCer
FInaL revIew oF the data
data management at natIonaL CentreS
SoFtware PreParatIon at aCer
Consortium responsibility
National Centre responsibility
Consortium responsibility in consultation with National Centres
KeyQuest
KeyQuest modifications Student Sampling
data entry and data Quality Control
recoding of national adaptations
Cleaning reports
general recoding
File Preparation
review of Initial analysis reports
review ofSampling data
• Figure 10.2 •Major data management stages in PiSa

150 © OECD 2012 – PISA 2009 TECHNICAL REPORT
10DATA MANAGEMENT PROCEDURES
Following test administration and coding of student responses, national centres are required to enter the data into KeyQuest, to perform validity reports to verify data entry, and to submit the data to ACER.
As soon as data are submitted to ACER, additional checks are applied. During the process of data cleaning, ACER sends cleaning reports containing the results of the checking procedures to national centres, and asks national centres to clarify any inconsistencies in their database. In the questionnaires for example such inconsistencies might include the number of qualified teachers in a school exceeding the total number of teachers or unlikely (though not impossible) situations such as parents with higher degrees but no secondary education. The national data sets are then continuously updated according to the information provided by the national centres. The cleaning reports are described in more detail below.
Once ACER has received all cleaning reports from the national centres and has introduced into the database all corrections recommended in these reports, a number of general rules are applied to the small number of unresolved inconsistencies in the PISA database.
At the final data cleaning stage national centres are sent the initial analysis reports containing cognitive test item information and frequency reports for the contextual questionnaires. The national centres are required to review these reports and inform ACER of any inconsistencies remaining in the data. Further recodings are made after the requests from the national centres are reviewed. At the same time sampling and tracking data is sent to Westat, analysed and when required further recodings are requested by Westat and implemented at ACER. At that stage the database is regarded as final, and is ready for submission to the OECD.
data ManageMent at the national centre
National modifications to the databasePISA’s aim is to generate comparable international data from all participating countries, based on a common set of test instruments. However, it is an international study that includes countries with widely differing educational systems and cultural particularities. Due to this diversity, some instrument adaptation is required. Hence verification by the Consortium of national adaptations is crucial (see Chapter 3). After adaptations to the international PISA instruments are agreed upon, the corresponding modifications in KeyQuest are made by national centres.
Student sampling with KeyQuestParallel to the adaptation process national centres sample students using KeyQuest. The student sampling functionality of KeyQuest was especially developed for the PISA project. It uses a systematic sampling procedure by computing a sampling interval. KeyQuest samples students from the information in the list of schools. It automatically generates the student tracking form (STF) and assigns one of the rotated forms of test booklets to each sampled student. In the process of sampling, KeyQuest uses the study programme table (see Chapter 3), and the sampling form designed for KeyQuest (SFKQ, see Chapter 4) which were agreed with the National Centres via MyPISA and imported into KeyQuest.
The student tracking form and the list of schools are central instruments, because they contain the information used in computing weights, exclusion rates, and participation rates. Other tracking instruments used in KeyQuest included the session report form which is used to identify the language of test for each student. The date of the testing session that the student attended obtained from the session report is used in conjunction with the date of birth of the student from the tracking form to calculate the age of the student at the time of testing.
Data entry quality controlThe national adaptation and student sampling tasks are performed by staff at each national centre before testing. After testing the data entry and the validity reports are carried out by the national centres.
Validation rulesDuring data entry KeyQuest captures some data entry errors through the use of validation rules that restrict the range and type of values that can be entered for certain fields. For example, for a standard multiple-choice item with four choices, one of the values of 1-4 each corresponding to one of the choices (A-D) that is circled by the student can be entered. In addition, code 9 was used if none of the choices was circled and code 8 if two or more choices were circled. Finally code 7 was reserved for the cases when due to poor printing an item presented to a student was illegible, and therefore the student did not have access to the item. No other codes could be entered.

PISA 2009 TECHNICAL REPORT – © OECD 2012 151
10DATA MANAGEMENT PROCEDURES
Key violationsFurther, KeyQuest was programmed to prevent key violations. That is, KeyQuest was programmed to prevent the duplication of so called keys, which are usually the combination of identifier codes. For example, a data record with the same combination of stratum and school identifiers could not be entered twice in the school questionnaire instrument.
KeyQuest also allows double entry of the test and questionnaire data and monitoring of the data entry operators. These procedures are described below.
Monitoring of the data entry operators The data entry efficiency report was designed specifically for PISA 2009 to keep the count of records entered by each data entry operator and the time required to enter them. The Consortium recommended to all countries to use some part of these procedures to assure quality of the data entry.
Double coding of occupational dataAnother optional procedure for PISA 2009 was the double coding of occupational data. The double coding allowed national centres a check of the validity of the data and it allowed identification of the areas where supplementary coding tools could be improved. The main coding tool was the ISCO Manual (ILO, 1990) with the small number of additional codes described in the PISA 2009 Data Management Manual.1 The supplementary coding tools would typically include coding instructions, a coding index, and training materials developed at the national centre.
Under this procedure the occupational data from the student questionnaires and parent questionnaires (if applicable) were coded twice by different coders and entered into two KeyQuest tables specifically designed for this purpose. Then the double entry discrepancies report was generated. The records for which there were differences between ISCO Codes entered into the two tables were printed on the report, analysed by the data manager and acted upon. The possible actions would be improvement of the instructions if the same error was systematically produced by different coders, and/or further training of coders that were making more errors than others. Finally, the Consortium expected all discrepancies printed on the report to be resolved before the data were submitted to ACER.
The national centres that participated in this option commented on the usefulness of the procedures for training of the coding staff. The possibilities for analysis by the Consortium of the data from this option were limited due to the language constraints. One of the results was that those countries that required their coders to enter a word description as well as a four-digit code had fewer discrepancies than those that required only a four-digit code. This led to a reinforcement of the ILO recommendation that procedures should involve entering occupation descriptions first and then coding them, rather than coding directly from the questionnaires.
Validity reportsAfter the data entry was completed the national centres were required to generate validity reports from KeyQuest and to resolve discrepancies listed on these reports before submitting data to ACER.
The structure of the validity reports is illustrated by Figure 10.3. They include:
•comparison between tracking instruments and sampling verification (tracking instruments, sampling verification);
•data verification within tracking instruments (tracking instruments specific checks);
•comparison of the questionnaire and tracking data (student questionnaire-student tracking form specific checks, identity checks questionnaires, identity checks occupation);
•comparison of the identification variables in the test data (identity checks booklets, identity checks DRA); and
•verification of the reliability data (reliability checks).
Some validity reports listed only incorrect records (e.g. students whose data were entered in more than one booklet instrument), whilst others listed both incorrect and suspicious records, which were records that could have been either correct or incorrect, but were deemed to be in need of confirmation. The resolution of discrepancies involved the following steps:
•correction of all incorrect records: e.g. students entered as “non participant”, “transferred out of school” but who were also indicated on the student tracking form as having been tested; and
•an explanation for ACER as to how records on the report that were listed as suspicious, but were actually correct, occurred (e.g. students with special education needs were not excluded because it is the policy of the school).

152 © OECD 2012 – PISA 2009 TECHNICAL REPORT
10DATA MANAGEMENT PROCEDURES
Due to the complexity and significant number of the validity reports, a validity report checklist was designed. More details about the validity reports can be found in the PISA 2009 Data Management Manual.2
• Figure 10.3 •validity reports – general hierarchy
tracking Instruments Sampling verification
Reports C, D, E
tracking Instruments Specific checks Reports A & B
StQ – StF Specific ChecksReports H – J
Id ChecksOccupationReports V
reliability ChecksReports R
Resolve discrepanciesResolve discrepanciesResolve discrepancies
Id ChecksQuestionnaires
Reports F
Id ChecksBooklets
Reports N & O
Resolve discrepancies
Id ChecksCBaS test (if required)
Reports Y
Resolve discrepanciesResolve discrepancies
Resolve discrepanciesResolve discrepancies
data cleaning at acer
Recoding of national adaptationsWhen data submitted by national centres arrived at ACER, the first step was to check the consistency of the database structure with the international database structure. An automated procedure was developed for this purpose. For each instrument the procedure identified deleted variables, added variables and variables for which the validation rules had been changed. This report was then compared with the information provided by the NPM in the various adaptation spreadsheets such as the questionnaire adaptation sheet (see Chapter 3). For example, if a variable had been added to a questionnaire, the questionnaire adaptation sheet was checked by Core B to find out whether this national variable required recoding into the corresponding international one, or had to be set aside as being for purely national use and returned to the country. Once all deviations were checked, Core B sent necessary recodes for the submitted data to ACER to fit the international structure. All additional or modified variables were set aside and returned to the national centres in a separate file so that countries could use these data for their own purposes, but they were not included in the international database.
Data cleaning organisationThe data files submitted by national centres often needed specific data cleaning or recoding procedures, or at least adaptation of standard data cleaning procedures. To reach the high quality requirements, the Consortium implemented dual independent processing; that is, two equivalent processing tools were developed – one in SPSS and one in SAS – and then used by two independent data cleaners for each dataset.
For each national centre’s data two analysts independently cleaned all submitted data files, one analyst using the SAS® procedures, the other analyst using the SPSS® procedures. The results were compared at each data cleaning step for each national centre. The cleaning step was considered complete for a national centre if the recoded datasets were identical.
DRA data For countries which participated in the Digital Reading Assessment, the data file constructed from the DRA test delivery and online coding systems was introduced into the cleaning at the stage of processing with SAS and SPSS. A check on

PISA 2009 TECHNICAL REPORT – © OECD 2012 153
10DATA MANAGEMENT PROCEDURES
student IDs was made with the cognitive data from KeyQuest and the DRA data was retained only for those students who had participated in the paper-based PISA assessment.
Cleaning reportsDuring the process of data cleaning, ACER progressively sent cleaning reports containing the results of the checking procedures to national centres, and asked national centres to clarify any inconsistencies in their database. The national data sets were then continuously updated according to the information provided by the national centre.
Many of the cleaning reports were designed to double check the validity reports, and if the data had been cleaned properly at the national centre, the cleaning reports would either not contain any records or would have only records that had been already explained on the validity reports. These cleaning reports were sent only to those countries whose data required additional cleaning.
However there were checks that could not be applied automatically at the national centre. For example, inconsistencies within the questionnaires could be checked only after the questionnaire data had been recoded back into the international format at ACER. These cleaning reports were sent to all national centres.
General recodingsAfter ACER received all cleaning reports from the national centres and introduced into the database all corrections recommended in these reports, the Consortium applied the following general rules to the unresolved inconsistencies in the PISA database (this was usually a very small number of cases and/or variables per country, if any):
•Unresolved inconsistencies regarding student and school identification led to the deletion of the record in the database.
•The data of an unresolved systematic error for a particular cognitive item was replaced by the not applicable code. For instance, if a country informed ACER about a mistranslation or misprint for an item in the national version of a cognitive booklet then the data for this item were recoded as Not Applicable and were not used in the subsequent analyses.
•If the country deleted a variable in the questionnaire, it was replaced by the not applicable code.
•If the country changed a variable in the questionnaire in such a way that it could not be recoded into the international format, the international variable was replaced by the not applicable code.
•All added or modified questionnaire variables were set aside in a separate file and returned to countries so that countries would be able to use these data for their own purposes.
Final review oF the dataAs an outcome of the initial data cleaning at ACER, cognitive, questionnaire, and tracking data files were prepared for delivery to the OECD and for use in the subsequent analysis by national centres and internationally.
Review of the test and questionnaire dataThe final data cleaning stage of the test and questionnaire data was based on the data analyses between and within countries. After implementation of the corrections made on the cleaning reports and general recodings, ACER sends initial analysis reports to every country, containing information about their test and questionnaire items, with an explanation of how to review these reports. For test items the results of this initial analysis are summarised in six reports that are described in Chapter 9. For the questionnaires the reports contained descriptive statistics on every item in the questionnaire.
After review of these initial analysis reports, the NPM should provide information to ACER about test items that appear to have behaved in an unacceptable way (these are often referred to as dodgy items) and any ambiguous data remaining in the questionnaires. Further recoding of ambiguous data followed. For example, if an ambiguity was due to printing errors or translation errors a not applicable code was applied to the item.
Recoding required as a result of the initial analysis of international test and questionnaire data were introduced into international data files by ACER.

154 © OECD 2012 – PISA 2009 TECHNICAL REPORT
10DATA MANAGEMENT PROCEDURES
Review of the sampling dataThe final data cleaning step of the sampling and tracking data was based on the analyses of tracking files. The tracking files were sent routinely country by country to Westat, the Consortium partner responsible for all matters related to sampling. Westat analysed the sampling and tracking data, checked it and if required requested further recodings, which were implemented at ACER. For example, when a school was regarded as a non-participant because fewer than 25% of students from this school participated in the test, then all students from this school were deleted from the international database. Another example would be a school that was tested outside the permitted test window. All data for students from such a school would also be deleted.
next StePS in PreParing the international databaSeWhen all data management procedures described in this chapter were complete, the database was ready for the next steps in preparing the public international database. Student weights and replicated weights were created as described in Chapter 8. Questionnaire indices were computed or scaled as described in Chapter 16. Cognitive item responses were scaled to obtain international item parameters that were used to draw plausible values as student ability estimates (see Chapters 9 and 12).
Notes
1. For example, codes suggested by Ganzeboom & Treiman (1996) for very broad categories that sometimes appear in respondents’ self-descriptions as well as in the cruder national classifications were used in PISA in addition to the standard ILO codes. These are: (1240) “Office managers”, (7510) “Non-farm manual foremen and supervisors”, (7520) “Skilled workers/artisans”, (7530) “Apprentices”, and (8400) “Semi-skilled workers”. Another example is additional auxiliary codes that were later recoded as missing. These codes were: 9501 for home duties, 9502 for student, 9503 for social beneficiary (e.g. unemployed, retired, etc.), 9504 for “I don’t know” and similar responses, and 9505 for vague responses.
2. Available at www.pisa.oecd.org > what PISA produces > PISA 2009 > PISA 2009 manuals and guidelines.

11
PISA 2009 TECHNICAL REPORT – © OECD 2012 155
Sampling Outcomes
Design effects and effective sample sizes ............................................................................................. 168
Summary analyses of the design effect ................................................................................................... 183

156 © OECD 2012 – PISA 2009 TECHNICAL REPORT
11Sampling OutcOmeS
This chapter reports on PISA sampling outcomes. Details of the sample design are provided in Chapter 4.
Table 11.1 shows the quality indicators for population coverage and the various pieces of information used to derive them. The following notes explain the meaning of each coverage index and how the data in each column of the table were used.
Coverage Indices 1, 2 and 3 are intended to measure PISA population coverage. Coverage Indices 4 and 5 are intended to be diagnostic in cases where indices 1, 2 or 3 had unexpected values. Many references are made in this chapter to the various sampling tasks on which NPMs documented statistics and other information needed in undertaking the sampling of schools and students. Note that although no comparison is made between the total population of 15-year-olds and the enrolled population of 15-year-old students, generally the enrolled population was expected to be less than or equal to the total population. Occasionally this was not the case due to differing data sources for these two values.
Coverage Index 1: Coverage of the national population, calculated by P/(P+E) × (ST7b_3/ST7b_1):
•The national population (NP) value, defined by Sampling Task 7b response box [1] and denoted here as ST7b_1 (and in Table 11.1 as the target population) is the population that includes all enrolled 15-year-old students in grades 7 and above in each participating country (with the possibility of small levels of exclusions), based on national statistics. However, the final NP value reflected for each country’s school sampling frame might have had some school-level exclusions. The value that represents the population of enrolled 15-year-old students minus those in excluded schools is represented initially by response box [3] on Sampling Task 7b. It is denoted here as ST7b_3. As in PISA 2006, the procedure for PISA 2009 was that very small schools having only one or two PISA-eligible students could not be excluded from the school frame but could be excluded in the field if the school still had only one or two PISA-eligible students at the time of data collection. Therefore, what is noted in Coverage Index 1 as ST7b_3 (and in Table 11.1 as target minus school level exclusions) was a number after accounting for all school level exclusions, which means a number that excludes schools excluded from the sampling frame in addition to those schools excluded in the field. Thus, the term (ST7b_3/ST7b_1) provides the proportion of the NP covered in each country based on national statistics.
•The value (P+E) provides the weighted estimate from the student sample of all PISA-eligible 15-year-olds in each participating country, where P is the weighted estimate of PISA-eligible non-excluded 15-year-old students and E is the weighted estimate of PISA-eligible 15-year-old students that were excluded within schools. Therefore, the term P/(P+E) provides an estimate, based on the student sample, of the proportion of the PISA-eligible 15-year-old population represented by the non-excluded PISA-eligible 15-year-old students.
•The result of multiplying these two proportions together (P/(P+E) and (ST7b_3/ST7b_1)) indicates the overall proportion of the NP covered by the non-excluded portion of the student sample.
Coverage Index 2: Coverage of the national enrolled population, calculated by P/(P+E)×(ST7b_3/ST7a_2.1):
•The national enrolled population (NEP), defined by Sampling Task 7a response box [2.1] and denoted here as ST7a_2.1 (and as enrolled 15-year-old students in Table 11.1), is the population that includes all enrolled 15-year-old students in grades 7 and above in each participating country, based on national statistics. The final NP, denoted here as ST7b_3 as described above for Coverage Index 1, reflects the 15- year-old population after school-level and other small exclusions. This value represents the population of enrolled 15-year-old students less those in excluded schools.
•The value (P+E) provides the weighted estimate from the student sample of all eligible 15-year-olds in each country, where P is the weighted estimate of PISA-eligible non-excluded 15-year-old students and E is the weighted estimate of PISA-eligible 15-year-old students that were excluded within schools. Therefore, the term P/(P+E) provides an estimate based on the student sample of the proportion of the PISA-eligible 15-year-old population that is represented by the non-excluded PISA-eligible 15-year-old students.
•Multiplying these two proportions together (P/(P+E) and (ST7b_3/ST7a_2.1)) gives the overall proportion of the NEP that was covered by the non-excluded portion of the student sample.

PISA 2009 TECHNICAL REPORT – © OECD 2012 157
11Sampling OutcOmeS
Coverage Index 1 shows the extent to which the weighted participants covered the final target population after all school exclusions.
Coverage Index 2 shows the extent to which the weighted participants covered the target population of all enrolled students in grades 7 and above.
Coverage Index 1 and Coverage Index 2 will differ when countries have excluded geographical areas or language groups apart from other school level exclusions.
Coverage Index 3: Coverage of the national 15-year-old population, calculated by P/ST7a_1:
•The national population of 15-year-olds, defined by Sampling Task 7a response box [1] and denoted here as ST7a_1 (and called all 15-year-olds in Table 11.1), is the entire population of 15-year-olds in each country (enrolled and not enrolled), based on national statistics. The value P is the weighted estimate of PISA-eligible non-excluded 15-year-old students from the student sample. Thus (P/ST7a_1) indicates the proportion of the national population of 15-year-olds covered by the non-excluded portion of the student sample.
Coverage Index 4: Coverage of the estimated school population, calculated by (P+E)/S:
•The value (P+E) provides the weighted estimate from the student sample of all PISA-eligible 15-year-old students in each country, where P is the weighted estimate of PISA-eligible non-excluded 15-year-old students and E is the weighted estimate of PISA-eligible 15-year-old students who were excluded within schools.
•The value S is an estimate of the 15-year-old school population in each participating country (called estimate of enrolled students from frame in Table 11.1). This is based on the actual or (more often) approximate number of 15-year-old students enrolled in each school in the sample, prior to contacting the school to conduct the assessment. The S value is calculated as the sum over all sampled schools of the product of each school’s sampling weight and its number of 15-year-old students (ENR) as recorded on the school sampling frame.
•Thus, (P+E)/S is the proportion of the estimated school 15-year-old population that is represented by the weighted estimate from the student sample of all PISA-eligible 15-year-old students. Its purpose is to check whether the student sampling has been carried out correctly, and to assess whether the value of S is a reliable measure of the number of enrolled 15-year-olds. This is important for interpreting Coverage Index 5.
Coverage Index 5: Coverage of the school sampling frame population, calculated by S/ST7b_3:
•The value (S/ST7b_3) is the ratio of the enrolled 15-year-old population, as estimated from data on the school sampling frame, to the size of the enrolled student population, as reported on Sampling Task 7b and adjusted by removing any additional excluded schools in the field. In some cases, this provided a check as to whether the data on the sampling frame gave a reliable estimate of the number of 15-year-old students in each school. In other cases, however, it was evident that ST7b_3 had been derived using data from the sampling frame by the NPM, so that this ratio may have been close to 1.0 even if enrolment data on the school sampling frame were poor. Under such circumstances, Coverage Index 4 would differ noticeably from 1.0, and the figure for ST7b_3 would also be inaccurate.
Tables 11.2, 11.3 and 11.4 present school and student-level response rates:
•Table 11.2 indicates the rates calculated by using only original schools and no replacement schools.
•Table 11.3 indicates the improved response rates when first and second replacement schools were accounted for in the rates.
•Table 11.4 indicates the student response rates among the full set of participating schools.
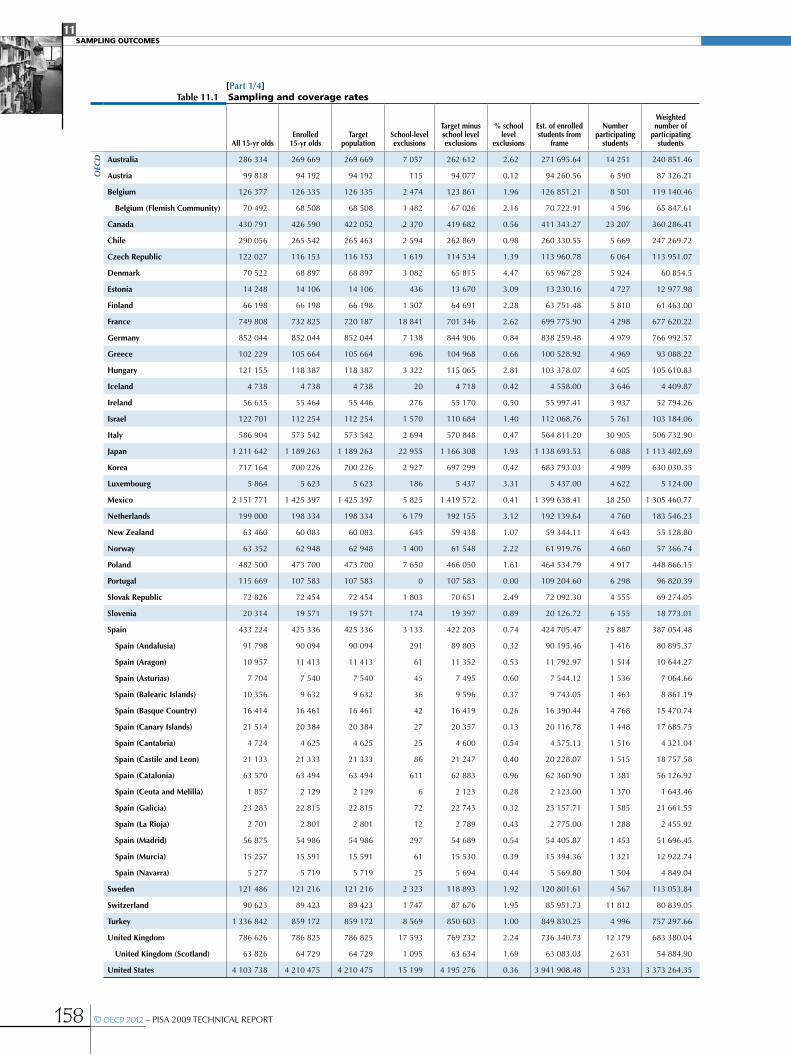
158 © OECD 2012 – PISA 2009 TECHNICAL REPORT
11Sampling OutcOmeS
[Part 1/4]table 11.1 Sampling and coverage rates
all 15-yr oldsenrolled
15-yr oldstarget
populationSchool-level exclusions
target minus school level exclusions
% school level
exclusions
est. of enrolled students from
frame
number participating
students
weighted number of
participating students
OEC
D australia 286 334 269 669 269 669 7 057 262 612 2.62 271 695.64 14 251 240 851.46
austria 99 818 94 192 94 192 115 94 077 0.12 94 260.56 6 590 87 326.21
Belgium 126 377 126 335 126 335 2 474 123 861 1.96 126 851.21 8 501 119 140.46
Belgium (Flemish Community) 70 492 68 508 68 508 1 482 67 026 2.16 70 722.91 4 596 65 847.61
Canada 430 791 426 590 422 052 2 370 419 682 0.56 411 343.27 23 207 360 286.41
Chile 290 056 265 542 265 463 2 594 262 869 0.98 260 330.55 5 669 247 269.72
Czech republic 122 027 116 153 116 153 1 619 114 534 1.39 113 960.78 6 064 113 951.07
denmark 70 522 68 897 68 897 3 082 65 815 4.47 65 967.28 5 924 60 854.5
estonia 14 248 14 106 14 106 436 13 670 3.09 13 230.16 4 727 12 977.98
Finland 66 198 66 198 66 198 1 507 64 691 2.28 63 751.48 5 810 61 463.00
France 749 808 732 825 720 187 18 841 701 346 2.62 699 775.90 4 298 677 620.22
germany 852 044 852 044 852 044 7 138 844 906 0.84 838 259.48 4 979 766 992.57
greece 102 229 105 664 105 664 696 104 968 0.66 100 528.92 4 969 93 088.22
hungary 121 155 118 387 118 387 3 322 115 065 2.81 103 378.07 4 605 105 610.83
Iceland 4 738 4 738 4 738 20 4 718 0.42 4 558.00 3 646 4 409.87
Ireland 56 635 55 464 55 446 276 55 170 0.50 55 997.41 3 937 52 794.26
Israel 122 701 112 254 112 254 1 570 110 684 1.40 112 068.76 5 761 103 184.06
Italy 586 904 573 542 573 542 2 694 570 848 0.47 564 811.20 30 905 506 732.90
japan 1 211 642 1 189 263 1 189 263 22 955 1 166 308 1.93 1 138 693.53 6 088 1 113 402.69
Korea 717 164 700 226 700 226 2 927 697 299 0.42 683 793.03 4 989 630 030.35
Luxembourg 5 864 5 623 5 623 186 5 437 3.31 5 437.00 4 622 5 124.00
mexico 2 151 771 1 425 397 1 425 397 5 825 1 419 572 0.41 1 399 638.41 38 250 1 305 460.77
netherlands 199 000 198 334 198 334 6 179 192 155 3.12 192 139.64 4 760 183 546.23
new Zealand 63 460 60 083 60 083 645 59 438 1.07 59 344.11 4 643 55 128.80
norway 63 352 62 948 62 948 1 400 61 548 2.22 61 919.76 4 660 57 366.74
Poland 482 500 473 700 473 700 7 650 466 050 1.61 464 534.79 4 917 448 866.15
Portugal 115 669 107 583 107 583 0 107 583 0.00 109 204.60 6 298 96 820.39
Slovak republic 72 826 72 454 72 454 1 803 70 651 2.49 72 092.30 4 555 69 274.05
Slovenia 20 314 19 571 19 571 174 19 397 0.89 20 126.72 6 155 18 773.01
Spain 433 224 425 336 425 336 3 133 422 203 0.74 424 705.47 25 887 387 054.48
Spain (andalusia) 91 798 90 094 90 094 291 89 803 0.32 90 195.46 1 416 80 895.37
Spain (aragon) 10 957 11 413 11 413 61 11 352 0.53 11 792.97 1 514 10 644.27
Spain (asturias) 7 704 7 540 7 540 45 7 495 0.60 7 544.12 1 536 7 064.66
Spain (Balearic Islands) 10 356 9 632 9 632 36 9 596 0.37 9 743.05 1 463 8 861.19
Spain (Basque Country) 16 414 16 461 16 461 42 16 419 0.26 16 390.44 4 768 15 470.74
Spain (Canary Islands) 21 514 20 384 20 384 27 20 357 0.13 20 116.78 1 448 17 685.75
Spain (Cantabria) 4 724 4 625 4 625 25 4 600 0.54 4 575.13 1 516 4 321.04
Spain (Castile and Leon) 21 133 21 333 21 333 86 21 247 0.40 20 228.07 1 515 18 757.58
Spain (Catalonia) 63 570 63 494 63 494 611 62 883 0.96 62 360.90 1 381 56 126.92
Spain (Ceuta and melilla) 1 857 2 129 2 129 6 2 123 0.28 2 123.00 1 370 1 643.46
Spain (galicia) 23 283 22 815 22 815 72 22 743 0.32 23 157.71 1 585 21 661.55
Spain (La rioja) 2 701 2 801 2 801 12 2 789 0.43 2 775.00 1 288 2 455.92
Spain (madrid) 56 875 54 986 54 986 297 54 689 0.54 54 405.87 1 453 51 696.45
Spain (murcia) 15 257 15 591 15 591 61 15 530 0.39 15 394.36 1 321 12 922.74
Spain (navarra) 5 277 5 719 5 719 25 5 694 0.44 5 569.80 1 504 4 849.04
Sweden 121 486 121 216 121 216 2 323 118 893 1.92 120 801.61 4 567 113 053.84
Switzerland 90 623 89 423 89 423 1 747 87 676 1.95 85 951.73 11 812 80 839.05
turkey 1 336 842 859 172 859 172 8 569 850 603 1.00 849 830.25 4 996 757 297.66
united Kingdom 786 626 786 825 786 825 17 593 769 232 2.24 736 340.73 12 179 683 380.04
united Kingdom (Scotland) 63 826 64 729 64 729 1 095 63 634 1.69 63 083.03 2 631 54 884.90
united States 4 103 738 4 210 475 4 210 475 15 199 4 195 276 0.36 3 941 908.48 5 233 3 373 264.35
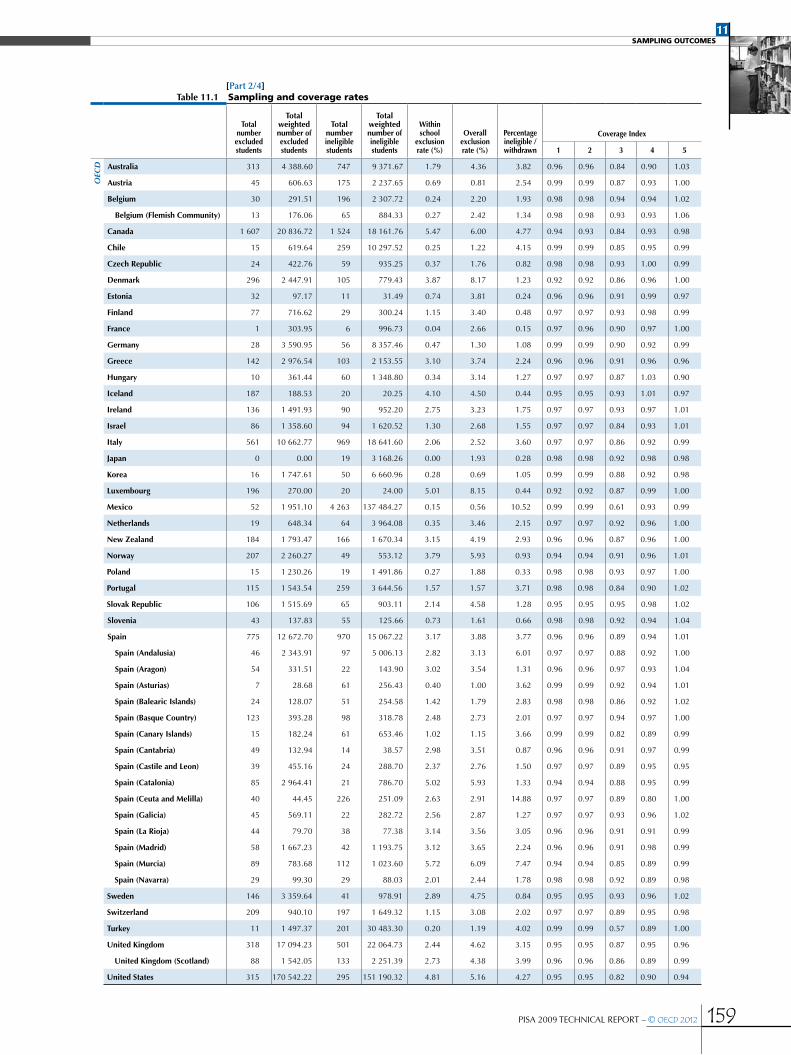
PISA 2009 TECHNICAL REPORT – © OECD 2012 159
11Sampling OutcOmeS
[Part 2/4]table 11.1 Sampling and coverage rates
total number excluded students
total weighted number of excluded students
total number ineligible students
totalweighted number of ineligible students
within school
exclusion rate (%)
overall exclusionrate (%)
Percentage ineligible /withdrawn
Coverage Index
1 2 3 4 5
OEC
D australia 313 4 388.60 747 9 371.67 1.79 4.36 3.82 0.96 0.96 0.84 0.90 1.03
austria 45 606.63 175 2 237.65 0.69 0.81 2.54 0.99 0.99 0.87 0.93 1.00
Belgium 30 291.51 196 2 307.72 0.24 2.20 1.93 0.98 0.98 0.94 0.94 1.02
Belgium (Flemish Community) 13 176.06 65 884.33 0.27 2.42 1.34 0.98 0.98 0.93 0.93 1.06
Canada 1 607 20 836.72 1 524 18 161.76 5.47 6.00 4.77 0.94 0.93 0.84 0.93 0.98
Chile 15 619.64 259 10 297.52 0.25 1.22 4.15 0.99 0.99 0.85 0.95 0.99
Czech republic 24 422.76 59 935.25 0.37 1.76 0.82 0.98 0.98 0.93 1.00 0.99
denmark 296 2 447.91 105 779.43 3.87 8.17 1.23 0.92 0.92 0.86 0.96 1.00
estonia 32 97.17 11 31.49 0.74 3.81 0.24 0.96 0.96 0.91 0.99 0.97
Finland 77 716.62 29 300.24 1.15 3.40 0.48 0.97 0.97 0.93 0.98 0.99
France 1 303.95 6 996.73 0.04 2.66 0.15 0.97 0.96 0.90 0.97 1.00
germany 28 3 590.95 56 8 357.46 0.47 1.30 1.08 0.99 0.99 0.90 0.92 0.99
greece 142 2 976.54 103 2 153.55 3.10 3.74 2.24 0.96 0.96 0.91 0.96 0.96
hungary 10 361.44 60 1 348.80 0.34 3.14 1.27 0.97 0.97 0.87 1.03 0.90
Iceland 187 188.53 20 20.25 4.10 4.50 0.44 0.95 0.95 0.93 1.01 0.97
Ireland 136 1 491.93 90 952.20 2.75 3.23 1.75 0.97 0.97 0.93 0.97 1.01
Israel 86 1 358.60 94 1 620.52 1.30 2.68 1.55 0.97 0.97 0.84 0.93 1.01
Italy 561 10 662.77 969 18 641.60 2.06 2.52 3.60 0.97 0.97 0.86 0.92 0.99
japan 0 0.00 19 3 168.26 0.00 1.93 0.28 0.98 0.98 0.92 0.98 0.98
Korea 16 1 747.61 50 6 660.96 0.28 0.69 1.05 0.99 0.99 0.88 0.92 0.98
Luxembourg 196 270.00 20 24.00 5.01 8.15 0.44 0.92 0.92 0.87 0.99 1.00
mexico 52 1 951.10 4 263 137 484.27 0.15 0.56 10.52 0.99 0.99 0.61 0.93 0.99
netherlands 19 648.34 64 3 964.08 0.35 3.46 2.15 0.97 0.97 0.92 0.96 1.00
new Zealand 184 1 793.47 166 1 670.34 3.15 4.19 2.93 0.96 0.96 0.87 0.96 1.00
norway 207 2 260.27 49 553.12 3.79 5.93 0.93 0.94 0.94 0.91 0.96 1.01
Poland 15 1 230.26 19 1 491.86 0.27 1.88 0.33 0.98 0.98 0.93 0.97 1.00
Portugal 115 1 543.54 259 3 644.56 1.57 1.57 3.71 0.98 0.98 0.84 0.90 1.02
Slovak republic 106 1 515.69 65 903.11 2.14 4.58 1.28 0.95 0.95 0.95 0.98 1.02
Slovenia 43 137.83 55 125.66 0.73 1.61 0.66 0.98 0.98 0.92 0.94 1.04
Spain 775 12 672.70 970 15 067.22 3.17 3.88 3.77 0.96 0.96 0.89 0.94 1.01
Spain (andalusia) 46 2 343.91 97 5 006.13 2.82 3.13 6.01 0.97 0.97 0.88 0.92 1.00
Spain (aragon) 54 331.51 22 143.90 3.02 3.54 1.31 0.96 0.96 0.97 0.93 1.04
Spain (asturias) 7 28.68 61 256.43 0.40 1.00 3.62 0.99 0.99 0.92 0.94 1.01
Spain (Balearic Islands) 24 128.07 51 254.58 1.42 1.79 2.83 0.98 0.98 0.86 0.92 1.02
Spain (Basque Country) 123 393.28 98 318.78 2.48 2.73 2.01 0.97 0.97 0.94 0.97 1.00
Spain (Canary Islands) 15 182.24 61 653.46 1.02 1.15 3.66 0.99 0.99 0.82 0.89 0.99
Spain (Cantabria) 49 132.94 14 38.57 2.98 3.51 0.87 0.96 0.96 0.91 0.97 0.99
Spain (Castile and Leon) 39 455.16 24 288.70 2.37 2.76 1.50 0.97 0.97 0.89 0.95 0.95
Spain (Catalonia) 85 2 964.41 21 786.70 5.02 5.93 1.33 0.94 0.94 0.88 0.95 0.99
Spain (Ceuta and melilla) 40 44.45 226 251.09 2.63 2.91 14.88 0.97 0.97 0.89 0.80 1.00
Spain (galicia) 45 569.11 22 282.72 2.56 2.87 1.27 0.97 0.97 0.93 0.96 1.02
Spain (La rioja) 44 79.70 38 77.38 3.14 3.56 3.05 0.96 0.96 0.91 0.91 0.99
Spain (madrid) 58 1 667.23 42 1 193.75 3.12 3.65 2.24 0.96 0.96 0.91 0.98 0.99
Spain (murcia) 89 783.68 112 1 023.60 5.72 6.09 7.47 0.94 0.94 0.85 0.89 0.99
Spain (navarra) 29 99.30 29 88.03 2.01 2.44 1.78 0.98 0.98 0.92 0.89 0.98
Sweden 146 3 359.64 41 978.91 2.89 4.75 0.84 0.95 0.95 0.93 0.96 1.02
Switzerland 209 940.10 197 1 649.32 1.15 3.08 2.02 0.97 0.97 0.89 0.95 0.98
turkey 11 1 497.37 201 30 483.30 0.20 1.19 4.02 0.99 0.99 0.57 0.89 1.00
united Kingdom 318 17 094.23 501 22 064.73 2.44 4.62 3.15 0.95 0.95 0.87 0.95 0.96
united Kingdom (Scotland) 88 1 542.05 133 2 251.39 2.73 4.38 3.99 0.96 0.96 0.86 0.89 0.99
united States 315 170 542.22 295 151 190.32 4.81 5.16 4.27 0.95 0.95 0.82 0.90 0.94
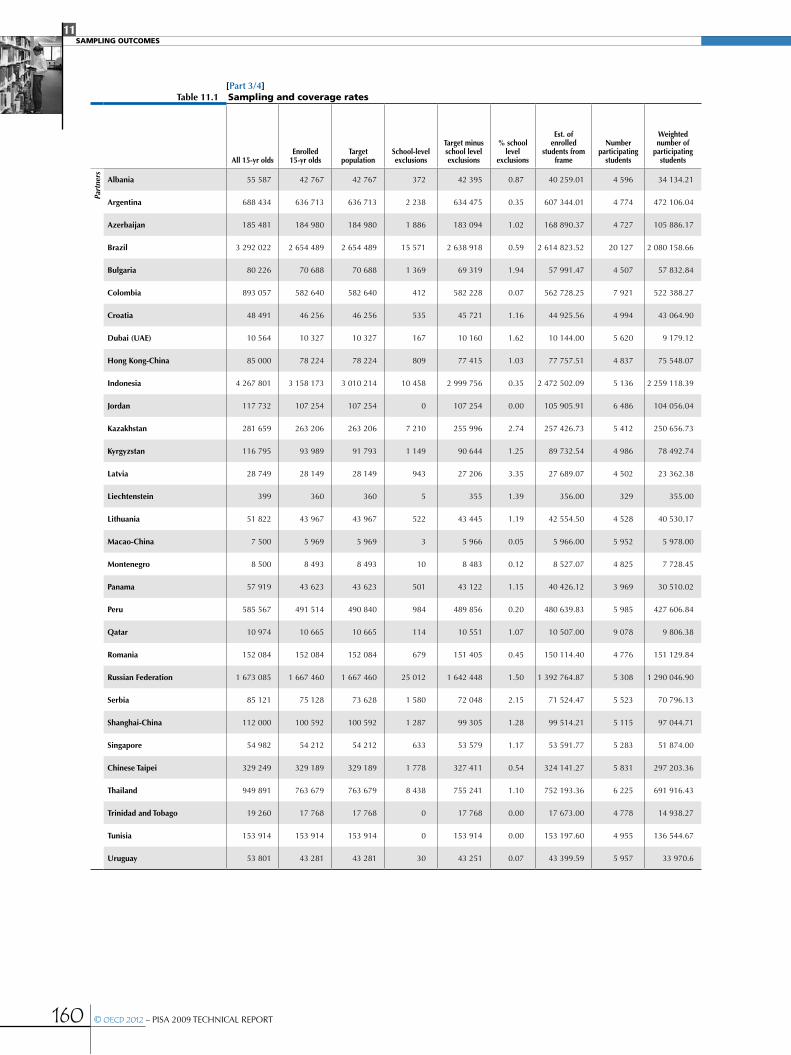
160 © OECD 2012 – PISA 2009 TECHNICAL REPORT
11Sampling OutcOmeS
[Part 3/4]table 11.1 Sampling and coverage rates
all 15-yr oldsenrolled
15-yr oldstarget
populationSchool-level exclusions
target minus school level exclusions
% school level
exclusions
est. of enrolled
students from frame
number participating
students
weighted number of
participating students
Part
ners
albania 55 587 42 767 42 767 372 42 395 0.87 40 259.01 4 596 34 134.21
argentina 688 434 636 713 636 713 2 238 634 475 0.35 607 344.01 4 774 472 106.04
azerbaijan 185 481 184 980 184 980 1 886 183 094 1.02 168 890.37 4 727 105 886.17
Brazil 3 292 022 2 654 489 2 654 489 15 571 2 638 918 0.59 2 614 823.52 20 127 2 080 158.66
Bulgaria 80 226 70 688 70 688 1 369 69 319 1.94 57 991.47 4 507 57 832.84
Colombia 893 057 582 640 582 640 412 582 228 0.07 562 728.25 7 921 522 388.27
Croatia 48 491 46 256 46 256 535 45 721 1.16 44 925.56 4 994 43 064.90
dubai (uae) 10 564 10 327 10 327 167 10 160 1.62 10 144.00 5 620 9 179.12
hong Kong-China 85 000 78 224 78 224 809 77 415 1.03 77 757.51 4 837 75 548.07
Indonesia 4 267 801 3 158 173 3 010 214 10 458 2 999 756 0.35 2 472 502.09 5 136 2 259 118.39
jordan 117 732 107 254 107 254 0 107 254 0.00 105 905.91 6 486 104 056.04
Kazakhstan 281 659 263 206 263 206 7 210 255 996 2.74 257 426.73 5 412 250 656.73
Kyrgyzstan 116 795 93 989 91 793 1 149 90 644 1.25 89 732.54 4 986 78 492.74
Latvia 28 749 28 149 28 149 943 27 206 3.35 27 689.07 4 502 23 362.38
Liechtenstein 399 360 360 5 355 1.39 356.00 329 355.00
Lithuania 51 822 43 967 43 967 522 43 445 1.19 42 554.50 4 528 40 530.17
macao-China 7 500 5 969 5 969 3 5 966 0.05 5 966.00 5 952 5 978.00
montenegro 8 500 8 493 8 493 10 8 483 0.12 8 527.07 4 825 7 728.45
Panama 57 919 43 623 43 623 501 43 122 1.15 40 426.12 3 969 30 510.02
Peru 585 567 491 514 490 840 984 489 856 0.20 480 639.83 5 985 427 606.84
Qatar 10 974 10 665 10 665 114 10 551 1.07 10 507.00 9 078 9 806.38
romania 152 084 152 084 152 084 679 151 405 0.45 150 114.40 4 776 151 129.84
russian Federation 1 673 085 1 667 460 1 667 460 25 012 1 642 448 1.50 1 392 764.87 5 308 1 290 046.90
Serbia 85 121 75 128 73 628 1 580 72 048 2.15 71 524.47 5 523 70 796.13
Shanghai-China 112 000 100 592 100 592 1 287 99 305 1.28 99 514.21 5 115 97 044.71
Singapore 54 982 54 212 54 212 633 53 579 1.17 53 591.77 5 283 51 874.00
Chinese taipei 329 249 329 189 329 189 1 778 327 411 0.54 324 141.27 5 831 297 203.36
thailand 949 891 763 679 763 679 8 438 755 241 1.10 752 193.36 6 225 691 916.43
trinidad and tobago 19 260 17 768 17 768 0 17 768 0.00 17 673.00 4 778 14 938.27
tunisia 153 914 153 914 153 914 0 153 914 0.00 153 197.60 4 955 136 544.67
uruguay 53 801 43 281 43 281 30 43 251 0.07 43 399.59 5 957 33 970.6

PISA 2009 TECHNICAL REPORT – © OECD 2012 161
11Sampling OutcOmeS
[Part 4/4]table 11.1 Sampling and coverage rates
total number excluded students
total weighted number of excluded students
total number ineligible students
totalweighted number of ineligible students
within school
exclusion rate (%)
overall exclusionrate (%)
Percentage ineligible /withdrawn
Coverage Index
1 2 3 4 5
Part
ners
albania 0 0.00 104 779.05 0.00 0.87 2.28 0.99 0.99 0.61 0.85 0.95
argentina 14 1 225.37 261 24 494.30 0.26 0.61 5.17 0.99 0.99 0.69 0.78 0.96
azerbaijan 0 0.00 0 0.00 0.00 1.02 0.00 0.99 0.99 0.57 0.63 0.92
Brazil 24 2 692.15 1 392 107 614.54 0.13 0.72 5.17 0.99 0.99 0.63 0.80 0.99
Bulgaria 0 0.00 12 118.70 0.00 1.94 0.21 0.98 0.98 0.72 1.00 0.84
Colombia 11 490.49 397 24 674.09 0.09 0.16 4.72 1.00 1.00 0.58 0.93 0.97
Croatia 34 273.09 72 564.28 0.63 1.78 1.30 0.98 0.98 0.89 0.96 0.98
dubai (uae) 5 6.68 125 208.20 0.07 1.69 2.27 0.98 0.98 0.87 0.91 1.00
hong Kong-China 9 118.74 80 1 319.15 0.16 1.19 1.74 0.99 0.99 0.89 0.97 1.00
Indonesia 0 0.00 0 0.00 0.00 0.35 0.00 1.00 0.95 0.53 0.91 0.82
jordan 24 442.88 313 4 968.71 0.42 0.42 4.75 1.00 1.00 0.88 0.99 0.99
Kazakhstan 82 3 843.62 76 3 445.90 1.51 4.21 1.35 0.96 0.96 0.89 0.99 1.01
Kyrgyzstan 86 1 384.09 97 1 462.88 1.73 2.96 1.83 0.97 0.95 0.67 0.89 0.99
Latvia 19 101.54 32 138.53 0.43 3.77 0.59 0.96 0.96 0.81 0.85 1.02
Liechtenstein 0 0.00 1 1.00 0.00 1.39 0.28 0.99 0.99 0.89 1.00 1.00
Lithuania 74 631.68 54 430.59 1.53 2.70 1.05 0.97 0.97 0.78 0.97 0.98
macao-China 0 0.00 18 18.00 0.00 0.05 0.30 1.00 1.00 0.80 1.00 1.00
montenegro 0 0.00 62 89.71 0.00 0.12 1.16 1.00 1.00 0.91 0.91 1.01
Panama 0 0.00 242 2 252.46 0.00 1.15 7.38 0.99 0.99 0.53 0.75 0.94
Peru 9 557.97 377 27 057.13 0.13 0.33 6.32 1.00 1.00 0.73 0.89 0.98
Qatar 28 28.00 405 405.90 0.28 1.35 4.13 0.99 0.99 0.89 0.94 1.00
romania 0 0.00 23 647.92 0.00 0.45 0.43 1.00 1.00 0.99 1.01 0.99
russian Federation 59 15 247.03 72 15 699.23 1.17 2.65 1.20 0.97 0.97 0.77 0.94 0.85
Serbia 10 132.53 96 1 097.78 0.19 2.33 1.55 0.98 0.96 0.83 0.99 0.99
Shanghai-China 7 130.18 44 848.43 0.13 1.41 0.87 0.99 0.99 0.87 0.98 1.00
Singapore 48 416.70 128 1 056.20 0.80 1.96 2.02 0.98 0.98 0.94 0.98 1.00
Chinese taipei 32 1 661.54 111 5 319.78 0.56 1.09 1.78 0.99 0.99 0.90 0.92 0.99
thailand 6 457.91 210 23 150.04 0.07 1.17 3.34 0.99 0.99 0.73 0.92 1.00
trinidad and tobago 11 35.88 311 875.51 0.24 0.24 5.85 1.00 1.00 0.78 0.85 0.99
tunisia 7 183.81 148 3 836.52 0.13 0.13 2.81 1.00 1.00 0.89 0.89 1.00
uruguay 14 66.58 849 3 983.10 0.20 0.26 11.70 1.00 1.00 0.63 0.78 1.00
Notes:Germany (3 states only) used modal grade 9 data to estimate school-level PISA enrolment.Finland used modal grade 9 data to estimate school-level PISA enrolment.Iceland used modal grade 10 data to estimate school-level PISA enrolment.Italy (just some schools) used modal grade 10 data to estimate school-level PISA enrolment.Jordan used modal grade 10 data to estimate school-level PISA enrolment.Sweden used modal grade 9 data to estimate school-level PISA enrolment.Uruguay (private schools only) used modal grade 10 data to estimate school-level PISA enrolment.Azerbaijan, Norway, Singapore (private schools only), Thailand, and the United States applied known proportions of 15-year-oldsto corresponding grades to estimate school-level PISA enrolment.Indonesia PISA enrolment data was estimated as total enrolment/grades using data from 2004/2005 school year.Greece and the United States had PISA enrolment data based on the 2005/2006 school year.Panama and Switzerland had PISA enrolment data based on the 2006/2007 school year.Peru had estimated PISA enrolment data for some schools only.Iceland excluded 3 students for unknown reasons (no SEN code).

162 © OECD 2012 – PISA 2009 TECHNICAL REPORT
11Sampling OutcOmeS
For calculating school response rates before replacement, the numerator consisted of all original sample schools with enrolled age-eligible students who participated (i.e. assessed a sample of PISA-eligible students, and obtained a student response rate of at least 50%). The denominator consisted of all the schools in the numerator, plus those original sample schools with enrolled age-eligible students that either did not participate or failed to assess at least 50% of PISA-eligible sample students. Schools that were included in the sampling frame, but were found to have no age-eligible students, or which were excluded in the field were omitted from the calculation of response rates. Replacement schools do not figure in these calculations.
For calculating school response rates after replacement, the numerator consisted of all sampled schools (original plus replacement) with enrolled age-eligible students that participated (i.e. assessed a sample of PISA-eligible students and obtained a student response rate of at least 50%). The denominator consisted of all the schools in the numerator, plus those original sample schools that had age-eligible students enrolled, but that failed to assess at least 50% of PISA-eligible sample students and for which no replacement school participated. Schools that were included in the sampling frame, but were found to contain no age-eligible students, were omitted from the calculation of response rates. Replacement schools were included in rates only when they participated, and were replacing a refusing school that had age-eligible students.
In calculating weighted school response rates, each school received a weight equal to the product of its base weight (the reciprocal of its selection probability) and the number of age-eligible students enrolled in the school, as indicated on the sampling frame.
With the use of probability proportional to size sampling, in participating countries with few certainty school selections and no over-sampling or under-sampling of any explicit strata, weighted and unweighted rates are very similar. The weighted school response rate before replacement is given by the formula:
11.1
( )
i i
i Y
i i
i Y N
W Eweighted school response ratebefore replacement W E
=ΣΣ
where Y denotes the set of responding original sample schools with age-eligible students, N denotes the set of eligible non-responding original sample schools, Wi denotes the base weight for school i, Wi = 1/Pi where Pi denotes the school selection probability for school i, and Ei denotes the enrolment size of age-eligible students, as indicated on the sampling frame.
The weighted school response rate, after replacement, is given by the formula:
11.2
( )
( )
i i
i Y R
i ii Y R N
W Eweighted school response rateafter replacement W E
=ΣΣ
where Y denotes the set of responding original sample schools, R denotes the set of responding replacement schools, for which the corresponding original sample school was eligible but was non-responding, N denotes the set of eligible refusing original sample schools, Wi denotes the base weight for school i, Wi = 1/Pi , where Pi denotes the school selection probability for school i, and for weighted rates, Ei denotes the enrolment size of age-eligible students, as indicated on the sampling frame.
For unweighted student response rates, the numerator is the number of students for whom assessment data were included in the results less those in schools with between 25% and 50% student participation. The denominator is the number of sampled students who were age-eligible, and not explicitly excluded as student exclusions. The exception is cases where participating countries applied different sampling rates across explicit strata. In these cases, unweighted rates were calculated in each stratum, and then weighted together according to the relative population size of 15-year-old students in each stratum.
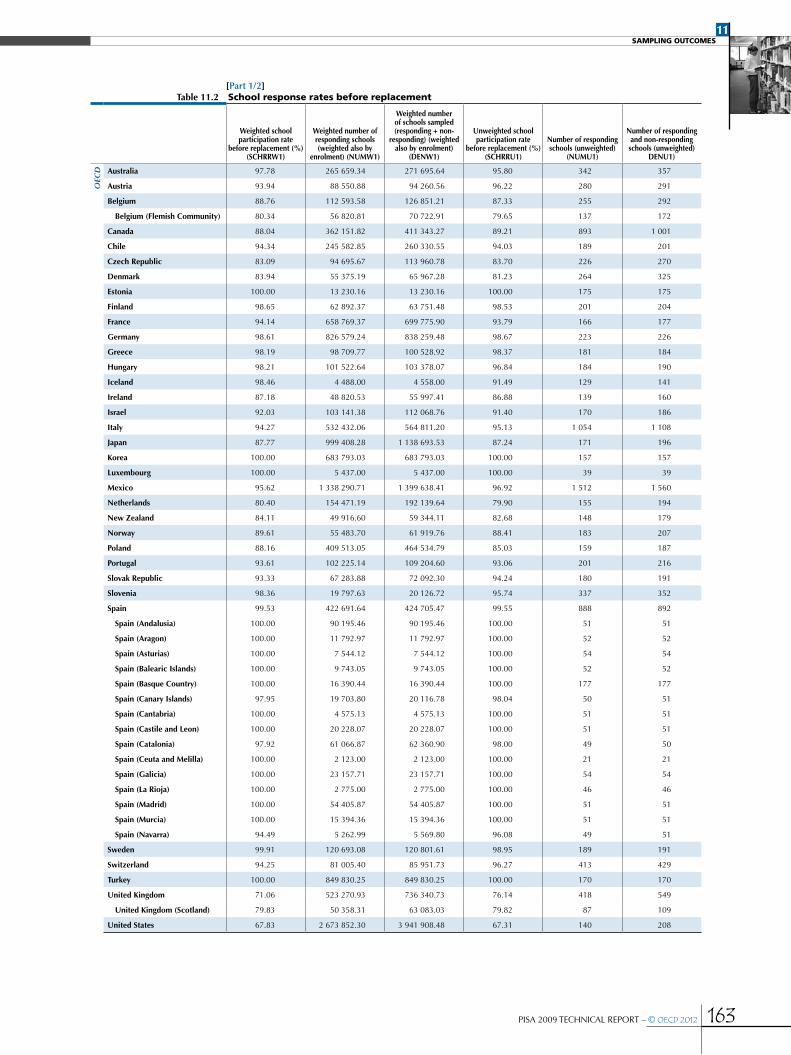
PISA 2009 TECHNICAL REPORT – © OECD 2012 163
11Sampling OutcOmeS
[Part 1/2]table 11.2 School response rates before replacement
weighted school participation rate
before replacement (%) (SChrrw1)
weighted number of responding schools (weighted also by
enrolment) (numw1)
weighted number of schools sampled (responding + non-
responding) (weighted also by enrolment)
(denw1)
unweighted school participation rate
before replacement (%) (SChrru1)
number of responding schools (unweighted)
(numu1)
number of responding and non-responding schools (unweighted)
denu1)
OEC
D australia 97.78 265 659.34 271 695.64 95.80 342 357
austria 93.94 88 550.88 94 260.56 96.22 280 291
Belgium 88.76 112 593.58 126 851.21 87.33 255 292
Belgium (Flemish Community) 80.34 56 820.81 70 722.91 79.65 137 172
Canada 88.04 362 151.82 411 343.27 89.21 893 1 001
Chile 94.34 245 582.85 260 330.55 94.03 189 201
Czech republic 83.09 94 695.67 113 960.78 83.70 226 270
denmark 83.94 55 375.19 65 967.28 81.23 264 325
estonia 100.00 13 230.16 13 230.16 100.00 175 175
Finland 98.65 62 892.37 63 751.48 98.53 201 204
France 94.14 658 769.37 699 775.90 93.79 166 177
germany 98.61 826 579.24 838 259.48 98.67 223 226
greece 98.19 98 709.77 100 528.92 98.37 181 184
hungary 98.21 101 522.64 103 378.07 96.84 184 190
Iceland 98.46 4 488.00 4 558.00 91.49 129 141
Ireland 87.18 48 820.53 55 997.41 86.88 139 160
Israel 92.03 103 141.38 112 068.76 91.40 170 186
Italy 94.27 532 432.06 564 811.20 95.13 1 054 1 108
japan 87.77 999 408.28 1 138 693.53 87.24 171 196
Korea 100.00 683 793.03 683 793.03 100.00 157 157
Luxembourg 100.00 5 437.00 5 437.00 100.00 39 39
mexico 95.62 1 338 290.71 1 399 638.41 96.92 1 512 1 560
netherlands 80.40 154 471.19 192 139.64 79.90 155 194
new Zealand 84.11 49 916.60 59 344.11 82.68 148 179
norway 89.61 55 483.70 61 919.76 88.41 183 207
Poland 88.16 409 513.05 464 534.79 85.03 159 187
Portugal 93.61 102 225.14 109 204.60 93.06 201 216
Slovak republic 93.33 67 283.88 72 092.30 94.24 180 191
Slovenia 98.36 19 797.63 20 126.72 95.74 337 352
Spain 99.53 422 691.64 424 705.47 99.55 888 892
Spain (andalusia) 100.00 90 195.46 90 195.46 100.00 51 51
Spain (aragon) 100.00 11 792.97 11 792.97 100.00 52 52
Spain (asturias) 100.00 7 544.12 7 544.12 100.00 54 54
Spain (Balearic Islands) 100.00 9 743.05 9 743.05 100.00 52 52
Spain (Basque Country) 100.00 16 390.44 16 390.44 100.00 177 177
Spain (Canary Islands) 97.95 19 703.80 20 116.78 98.04 50 51
Spain (Cantabria) 100.00 4 575.13 4 575.13 100.00 51 51
Spain (Castile and Leon) 100.00 20 228.07 20 228.07 100.00 51 51
Spain (Catalonia) 97.92 61 066.87 62 360.90 98.00 49 50
Spain (Ceuta and melilla) 100.00 2 123.00 2 123.00 100.00 21 21
Spain (galicia) 100.00 23 157.71 23 157.71 100.00 54 54
Spain (La rioja) 100.00 2 775.00 2 775.00 100.00 46 46
Spain (madrid) 100.00 54 405.87 54 405.87 100.00 51 51
Spain (murcia) 100.00 15 394.36 15 394.36 100.00 51 51
Spain (navarra) 94.49 5 262.99 5 569.80 96.08 49 51
Sweden 99.91 120 693.08 120 801.61 98.95 189 191
Switzerland 94.25 81 005.40 85 951.73 96.27 413 429
turkey 100.00 849 830.25 849 830.25 100.00 170 170
united Kingdom 71.06 523 270.93 736 340.73 76.14 418 549
united Kingdom (Scotland) 79.83 50 358.31 63 083.03 79.82 87 109
united States 67.83 2 673 852.30 3 941 908.48 67.31 140 208

164 © OECD 2012 – PISA 2009 TECHNICAL REPORT
11Sampling OutcOmeS
[Part 2/2]table 11.2 School response rates before replacement
weighted school participation rate
before replacement (%) (SChrrw1)
weighted number of responding schools (weighted also by
enrolment) (numw1)
weighted number of schools sampled (responding + non-
responding) (weighted also by enrolment)
(denw1)
unweighted school participation rate
before replacement (%) (SChrru1)
number of responding schools (unweighted)
(numu1)
number of responding and non-responding schools (unweighted)
denu1)
Part
ners
albania 97.29 39 168.33 40 259.01 97.25 177 182
argentina 97.18 590 214.69 607 344.01 97.49 194 199
azerbaijan 99.86 168 645.87 168 890.37 99.38 161 162
Brazil 93.13 2 435 250.12 2 614 823.52 92.11 899 976
Bulgaria 98.16 56 922.34 57 991.47 97.19 173 178
Colombia 90.21 507 649.30 562 728.25 91.23 260 285
Croatia 99.19 44 560.98 44 925.56 98.74 157 159
dubai (uae) 100.00 10 144.00 10 144.00 100.00 190 190
hong Kong-China 69.19 53 799.82 77 757.51 69.23 108 156
Indonesia 94.54 2 337 438.46 2 472 502.09 93.99 172 183
jordan 100.00 105 905.91 105 905.91 100.00 210 210
Kazakhstan 100.00 257 426.73 257 426.73 100.00 199 199
Kyrgyzstan 98.53 88 412.13 89 732.54 98.28 171 174
Latvia 97.46 26 986.21 27 689.07 97.30 180 185
Liechtenstein 100.00 356.00 356.00 100.00 12 12
Lithuania 98.13 41 759.13 42 554.50 97.46 192 197
macao-China 100.00 5 966.00 5 966.00 100.00 45 45
montenegro 100.00 8 527.07 8 527.07 100.00 52 52
Panama 82.58 33 384.08 40 426.12 81.82 180 220
Peru 100.00 480 639.83 480 639.83 100.00 240 240
Qatar 97.30 10 223.00 10 507.00 96.75 149 154
romania 100.00 150 114.40 150 114.40 100.00 159 159
russian Federation 100.00 1 392 764.87 1 392 764.87 100.00 213 213
Serbia 99.21 70 960.22 71 524.47 98.95 189 191
Shanghai-China 99.32 98 840.73 99 514.21 99.34 151 152
Singapore 96.19 51 552.46 53 591.77 96.00 168 175
Chinese taipei 99.34 322 004.60 324 141.27 99.37 157 158
thailand 98.01 737 224.68 752 193.36 97.83 225 230
trinidad and tobago 97.21 17 180.00 17 673.00 96.88 155 160
tunisia 100.00 153 197.60 153 197.60 100.00 165 165
uruguay 98.66 42 819.65 43 399.59 98.28 229 233
For weighted student response rates, the same number of students appears in the numerator and denominator as for unweighted rates, but each student was weighted by its student base weight. This is given as the product of the school base weight - for the school in which the student was enrolled - and the reciprocal of the student selection probability within the school.
In countries with no over-sampling of any explicit strata, weighted and unweighted student participation rates are very similar.
Overall response rates are calculated as the product of school and student response rates. Although overall weighted and unweighted rates can be calculated, there is little value in presenting overall unweighted rates. The weighted rates indicate the proportion of the student population represented by the sample prior to making the school and student non-response adjustments.

PISA 2009 TECHNICAL REPORT – © OECD 2012 165
11Sampling OutcOmeS
[Part 1/2]table 11.3 School response rates after replacement
"weighted school participation rate after
all replacement (%) (SChrrw3)"
weighted number of responding schools (weighted also by
enrolment) (numw3)
"weighted number of schools sampled
(responding + non-responding)
(weighted also by enrolment) (denw3)"
"unweighted school participation rate after
all replacement (%) (SChrru3)"
number of responding schools (unweighted)
(numu3)
number of responding and non-responding schools (unweighted)
(denu3)
OEC
D australia 98.85 268 780.10 271 917.51 96.64 345 357
austria 93.94 88 550.88 94 260.56 96.22 280 291
azerbaijan 100.00 168 890.37 168 890.37 100.00 162 162
Belgium 95.58 121 290.83 126 898.69 94.18 275 292
Belgium (Flemish Community) 92.25 65 241.05 70 722.91 90.70 156 172
Canada 89.64 368 708.48 411 343.27 90.71 908 1 001
Chile 99.04 257 594.19 260 098.68 99.00 199 201
Czech republic 97.40 111 091.29 114 061.61 96.30 260 270
denmark 90.75 59 860.38 65 964.33 87.69 285 325
estonia 100.00 13 230.16 13 230.16 100.00 175 175
Finland 100.00 63 748.48 63 751.48 99.51 203 204
France 94.14 658 769.37 699 775.90 93.79 166 177
germany 100.00 838 259.48 838 259.48 100.00 226 226
greece 99.40 99 925.22 100 528.92 99.46 183 184
Iceland 98.46 4 488.00 4 558.00 91.49 129 141
Ireland 88.44 49 525.81 55 997.41 88.13 141 160
Israel 95.40 106 917.54 112 068.76 94.62 176 186
Italy 99.08 559 546.08 564 768.10 98.83 1 095 1 108
japan 94.99 1 081 662.02 1 138 693.53 94.39 185 196
Korea 100.00 683 793.03 683 793.03 100.00 157 157
Luxembourg 100.00 5 437.00 5 437.00 100.00 39 39
mexico 97.71 1 367 668.22 1 399 729.69 98.14 1 531 1 560
netherlands 95.54 183 555.39 192 118.15 95.36 185 194
new Zealand 91.00 54 130.38 59 484.57 89.94 161 179
norway 96.53 59 759.07 61 909.04 95.17 197 207
Poland 97.70 453 855.21 464 534.79 95.72 179 187
Portugal 98.43 107 534.84 109 250.81 98.15 212 216
Slovak republic 99.01 71 387.78 72 104.57 98.95 189 191
Slovenia 98.36 19 797.63 20 126.72 95.74 337 352
Spain 99.53 422 691.64 424 705.47 99.55 888 892
Spain (andalusia) 100.00 90 195.46 90 195.46 100.00 51 51
Spain (aragon) 100.00 11 792.97 11 792.97 100.00 52 52
Spain (asturias) 100.00 7 544.12 7 544.12 100.00 54 54
Spain (Balearic Islands) 100.00 9 743.05 9 743.05 100.00 52 52
Spain (Basque Country) 100.00 16 390.44 16 390.44 100.00 177 177
Spain (Canary Islands) 97.95 19 703.80 20 116.78 98.04 50 51
Spain (Cantabria) 100.00 4 575.13 4 575.13 100.00 51 51
Spain (Castile and Leon) 100.00 20 228.07 20 228.07 100.00 51 51
Spain (Catalonia) 97.92 61 066.87 62 360.90 98.00 49 50
Spain (Ceuta and melilla) 100.00 2 123.00 2 123.00 100.00 21 21
Spain (galicia) 100.00 23 157.71 23 157.71 100.00 54 54
Spain (La rioja) 100.00 2 775.00 2 775.00 100.00 46 46
Spain (madrid) 100.00 54 405.87 54 405.87 100.00 51 51
Spain (murcia) 100.00 15 394.36 15 394.36 100.00 51 51
Spain (navarra) 94.49 5 262.99 5 569.80 96.08 49 51
Sweden 99.91 120 693.08 120 801.61 98.95 189 191
Switzerland 98.71 84 896.21 86 006.21 99.07 425 429
turkey 100.00 849 830.25 849 830.25 100.00 170 170
united Kingdom 87.35 643 026.62 736 178.40 87.61 481 549
united Kingdom (Scotland) 89.00 56 142.79 63 083.03 88.99 97 109
united States 77.50 3 065 650.60 3 955 606.40 76.92 160 208

166 © OECD 2012 – PISA 2009 TECHNICAL REPORT
11Sampling OutcOmeS
[Part 2/2]table 11.3 School response rates after replacement
"weighted school participation rate after
all replacement (%) (SChrrw3)"
weighted number of responding schools (weighted also by
enrolment) (numw3)
"weighted number of schools sampled
(responding + non-responding)
(weighted also by enrolment) (denw3)"
"unweighted school participation rate after
all replacement (%) (SChrru3)"
number of responding schools (unweighted)
(numu3)
number of responding and non-responding schools (unweighted)
(denu3)
Part
ners
albania 99.37 39 998.90 40 252.52 99.45 181 182
argentina 99.42 603 817.38 607 344.01 99.50 198 199
Brazil 94.75 2 477 518.43 2 614 805.58 94.88 926 976
Bulgaria 99.10 57 823.36 58 345.89 98.88 176 178
Colombia 94.90 533 899.44 562 586.86 96.14 274 158
Croatia 99.86 44 861.56 44 925.56 99.37 158 285
dubai (uae) 100.00 10 144.00 10 144.00 100.00 190 190
hong Kong-China 96.75 75 231.56 77 757.51 96.79 151 159
hungary 99.47 103 066.87 103 617.75 98.42 187 156
Indonesia 100.00 2 473 527.93 2 473 527.93 100.00 183 190
jordan 100.00 105 905.91 105 905.91 100.00 210 183
Kazakhstan 100.00 257 426.73 257 426.73 100.00 199 210
Kyrgyzstan 99.47 89 259.77 89 732.54 99.43 173 199
Latvia 99.39 27 543.66 27 713.30 99.46 184 174
Liechtenstein 100.00 356.00 356.00 100.00 12 185
Lithuania 99.91 42 525.97 42 564.17 99.49 196 12
macao-China 100.00 5 966.00 5 966.00 100.00 45 197
montenegro 100.00 8 527.07 8 527.07 100.00 52 45
Panama 83.76 33 778.97 40 328.55 83.18 183 52
Peru 100.00 480 639.83 480 639.83 100.00 240 220
Qatar 97.30 10 223.00 10 507.00 96.75 149 240
romania 100.00 150 114.40 150 114.40 100.00 159 154
russian Federation 100.00 1 392 764.87 1 392 764.87 100.00 213 159
Serbia 99.97 71 504.47 71 524.47 99.48 190 213
Shanghai-China 100.00 99 514.21 99 514.21 100.00 152 191
Singapore 97.88 52 453.83 53 591.77 97.71 171 152
Chinese taipei 100.00 324 141.27 324 141.27 100.00 158 175
thailand 100.00 752 391.58 752 391.58 100.00 230 230
trinidad and tobago 97.21 17 180.00 17 673.00 96.88 155 160
tunisia 100.00 153 197.60 153 197.60 100.00 165 165
uruguay 98.66 42 819.65 43 399.59 98.28 229 233
[Part 1/2]table 11.4 Student response rates after replacement
"weighted student participation rate after
second replacement (%)(Sturrw3)"
"number of students assessed
(weighted)(numStw3)"
"number of students sampled
(assessed + absent) (weighted)
(denStw3)"
unweighted student participation rate after
second replacement (%) (Sturru3)
"number of students assessed
(unweighted) (numStu3)"
"number of students sampled
(assessed + absent) (unweighted) (denStu3)"
OEC
D australia 86.05 205 234.15 238 498.29 83.18 14 060 16 903
austria 88.63 72 792.60 82 135.17 86.57 6 568 7 587
azerbaijan 99.14 105 094.66 106 007.50 99.24 4 691 4 727
Belgium 91.38 104 262.95 114 096.74 91.69 8 477 9 245
Belgium (Flemish Community) 92.44 56 274.15 60 873.27 92.54 4 577 4 946
Canada 79.52 257 905.04 324 342.38 81.09 22 383 27 603
Chile 92.88 227 540.78 244 995.46 92.88 5 663 6 097
Czech republic 90.75 100 684.69 110 952.60 90.88 6 049 6 656
denmark 89.29 49 235.89 55 139.41 86.77 5 924 6 827
estonia 94.06 12 207.69 12 977.98 94.11 4 727 5 023
Finland 92.27 56 709.20 61 460.12 92.09 5 810 6 309
France 87.12 556 054.05 638 284.32 87.18 4 272 4 900
germany 93.93 720 447.33 766 992.57 93.78 4 979 5 309
greece 95.95 88 875.18 92 631.22 95.97 4 957 5 165
Iceland 83.91 3 635.00 4 332.00 83.91 3 635 4 332
Ireland 83.81 39 247.61 46 830.33 83.71 3 896 4 654
Israel 89.45 88 480.15 98 918.40 89.46 5 761 6 440
Italy 92.13 462 655.23 502 190.00 92.47 30 876 33 390
japan 95.32 1 010 801.31 1 060 381.66 95.30 6 077 6 377
Korea 98.76 622 186.80 630 030.35 98.66 4 989 5 057
Luxembourg 95.57 4 897.00 5 124.00 95.63 4 622 4 833
mexico 95.13 1 214 826.92 1 276 981.82 95.23 38 213 40 125
netherlands 89.78 157 912.04 175 896.96 89.80 4 747 5 286
new Zealand 84.65 42 451.62 50 149.05 84.11 4 606 5 476

PISA 2009 TECHNICAL REPORT – © OECD 2012 167
11Sampling OutcOmeS
[Part 2/2]table 11.4 Student response rates after replacement
"weighted student participation rate after
second replacement (%)(Sturrw3)"
"number of students assessed
(weighted)(numStw3)"
"number of students sampled
(assessed + absent) (weighted)
(denStw3)"
unweighted student participation rate after second replacement (%)
(Sturru3)
"number of students assessed
(unweighted) (numStu3)"
"number of students sampled
(assessed + absent) (unweighted) (denStu3)"
OEC
D norway 89.92 49 785.30 55 365.51 89.72 4 660 5 194
Poland 85.87 376 766.79 438 739.13 85.57 4 855 5 674
Portugal 87.11 83 093.83 95 386.14 87.36 6 263 7 169
Slovak republic 93.03 63 853.62 68 634.33 93.00 4 555 4 898
Slovenia 90.92 16 776.72 18 452.74 91.09 6 135 6 735
Spain 89.60 345 122.11 385 164.28 91.48 25 871 28 280
Spain (andalusia) 88.74 71 785.12 80 895.37 88.72 1 416 1 596
Spain (aragon) 89.53 9 529.74 10 644.27 89.64 1 514 1 689
Spain (asturias) 91.83 6 487.75 7 064.66 91.81 1 536 1 673
Spain (Balearic Islands) 87.90 7 788.58 8 861.19 88.03 1 463 1 662
Spain (Basque Country) 95.89 14 835.39 15 470.74 95.82 4 768 4 976
Spain (Canary Islands) 88.56 15 364.56 17 348.50 88.83 1 448 1 630
Spain (Cantabria) 93.14 4 024.57 4 321.04 93.06 1 516 1 629
Spain (Castile and Leon) 94.01 17 633.22 18 757.58 94.10 1 515 1 610
Spain (Catalonia) 87.44 47 957.34 54 845.85 87.39 1 365 1 562
Spain (Ceuta and melilla) 92.45 1 519.42 1 643.46 92.38 1 370 1 483
Spain (galicia) 92.24 19 979.76 21 661.55 92.31 1 585 1 717
Spain (La rioja) 89.64 2 201.53 2 455.92 90.26 1 288 1 427
Spain (madrid) 88.56 45 784.75 51 696.45 88.60 1 453 1 640
Spain (murcia) 88.77 11 471.36 12 922.74 88.66 1 321 1 490
Spain (navarra) 93.38 4 273.99 4 577.16 94.06 1 504 1 599
Sweden 92.97 105 025.54 112 972.14 92.98 4 567 4 912
Switzerland 93.58 74 711.62 79 836.07 94.10 11 810 12 551
turkey 97.85 741 028.64 757 297.66 97.81 4 996 5 108
united Kingdom 86.96 520 120.67 598 109.68 86.63 12 168 14 046
united Kingdom (Scotland) 83.61 40 832.44 48 833.93 83.60 2 620 3 134
united States 86.99 2 298 889.40 2 642 597.98 86.79 5 165 5 951
Part
ners
albania 95.39 32 347.17 33 911.29 95.14 4 596 4 831
argentina 88.25 414 166.32 469 284.74 87.81 4 762 5 423
Brazil 89.04 1 767 871.92 1 985 479.43 87.61 19 901 22 715
Bulgaria 97.34 56 095.50 57 629.92 97.44 4 499 4 617
Colombia 92.83 462 601.93 498 330.60 93.25 7 910 8 483
Croatia 93.76 40 320.63 43 006.12 93.77 4 994 5 326
dubai (uae) 90.39 8 297.15 9 179.12 90.38 5 620 6 218
hong Kong-China 93.19 68 141.94 73 125.24 93.11 4 837 5 195
hungary 93.25 97 922.94 105 015.21 92.92 4 605 4 956
Indonesia 96.91 2 189 287.41 2 259 118.39 96.67 5 136 5 313
jordan 95.85 99 734.18 104 056.04 95.71 6 486 6 777
Kazakhstan 98.49 246 871.69 250 656.73 98.60 5 412 5 489
Kyrgyzstan 98.04 76 523.26 78 054.25 98.03 4 986 5 086
Latvia 91.27 21 241.28 23 272.68 91.32 4 502 4 930
Liechtenstein 92.68 329.00 355.00 92.68 329 355
Lithuania 93.36 37 807.98 40 495.06 93.28 4 528 4 854
macao-China 99.57 5 952.00 5 978.00 99.57 5 952 5 978
montenegro 95.43 7 375.42 7 728.45 95.32 4 825 5 062
Panama 88.67 22 666.48 25 562.20 87.95 3 913 4 449
Peru 96.35 412 010.97 427 606.84 96.28 5 985 6 216
Qatar 93.63 8 990.00 9 602.00 93.63 8 990 9 602
romania 99.47 150 330.73 151 129.84 99.44 4 776 4 803
russian Federation 96.77 1 248 353.40 1 290 046.90 96.47 5 308 5 502
Serbia 95.37 67 495.75 70 775.28 95.14 5 522 5 804
Shanghai-China 98.89 95 966.24 97 044.71 98.84 5 115 5 175
Singapore 91.04 46 224.01 50 774.70 90.95 5 283 5 809
Chinese taipei 95.30 283 239.28 297 203.36 95.46 5 831 6 108
thailand 97.37 673 688.15 691 916.43 97.33 6 225 6 396
trinidad and tobago 85.92 12 275.35 14 287.08 85.74 4 731 5 518
tunisia 96.93 132 354.41 136 544.67 96.91 4 955 5 113
uruguay 87.03 29 192.55 33 541.33 86.93 5 924 6 815
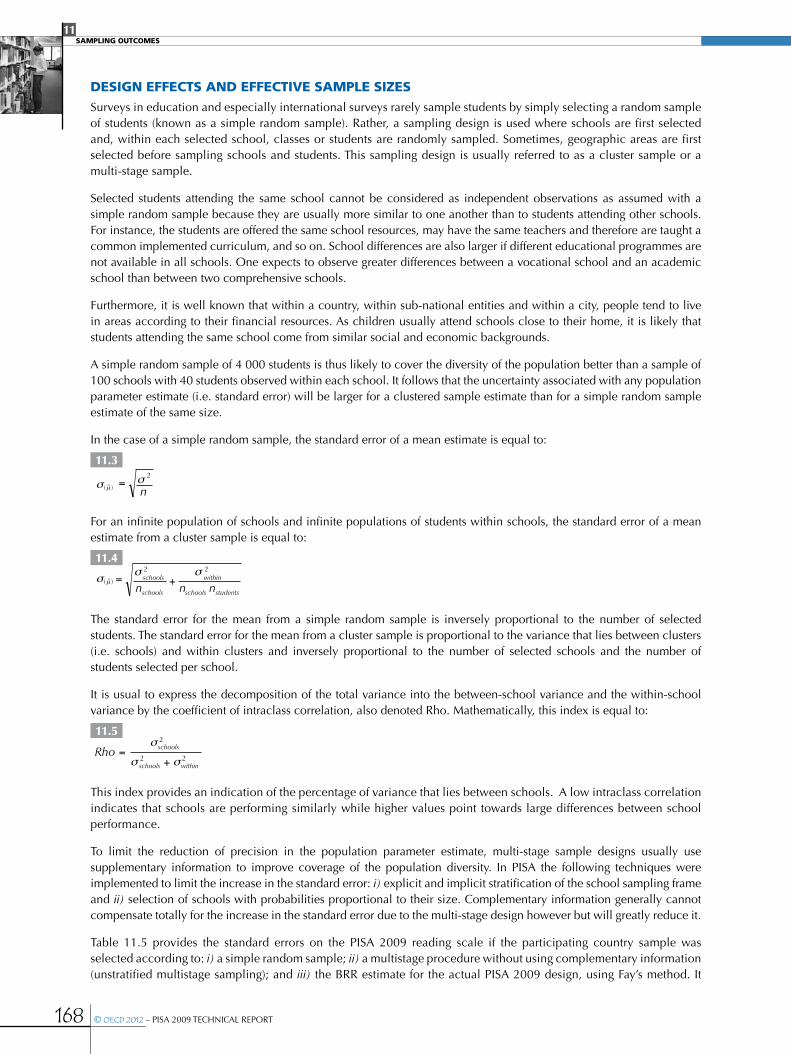
168 © OECD 2012 – PISA 2009 TECHNICAL REPORT
11Sampling OutcOmeS
deSign eFFectS and eFFective SaMPle SizeSSurveys in education and especially international surveys rarely sample students by simply selecting a random sample of students (known as a simple random sample). Rather, a sampling design is used where schools are first selected and, within each selected school, classes or students are randomly sampled. Sometimes, geographic areas are first selected before sampling schools and students. This sampling design is usually referred to as a cluster sample or a multi-stage sample.
Selected students attending the same school cannot be considered as independent observations as assumed with a simple random sample because they are usually more similar to one another than to students attending other schools. For instance, the students are offered the same school resources, may have the same teachers and therefore are taught a common implemented curriculum, and so on. School differences are also larger if different educational programmes are not available in all schools. One expects to observe greater differences between a vocational school and an academic school than between two comprehensive schools.
Furthermore, it is well known that within a country, within sub-national entities and within a city, people tend to live in areas according to their financial resources. As children usually attend schools close to their home, it is likely that students attending the same school come from similar social and economic backgrounds.
A simple random sample of 4 000 students is thus likely to cover the diversity of the population better than a sample of 100 schools with 40 students observed within each school. It follows that the uncertainty associated with any population parameter estimate (i.e. standard error) will be larger for a clustered sample estimate than for a simple random sample estimate of the same size.
In the case of a simple random sample, the standard error of a mean estimate is equal to:
11.3
n)ˆ(
2
μ =σ σ
For an infinite population of schools and infinite populations of students within schools, the standard error of a mean estimate from a cluster sample is equal to:
11.4
studentsschools
within
schools
schools
nnn
22
+=σ σ
)ˆ(μσ
The standard error for the mean from a simple random sample is inversely proportional to the number of selected students. The standard error for the mean from a cluster sample is proportional to the variance that lies between clusters (i.e. schools) and within clusters and inversely proportional to the number of selected schools and the number of students selected per school.
It is usual to express the decomposition of the total variance into the between-school variance and the within-school variance by the coefficient of intraclass correlation, also denoted Rho. Mathematically, this index is equal to:
11.5
22
2
withinschools
schoolsRho+
=σ
σ
σ
This index provides an indication of the percentage of variance that lies between schools. A low intraclass correlation indicates that schools are performing similarly while higher values point towards large differences between school performance.
To limit the reduction of precision in the population parameter estimate, multi-stage sample designs usually use supplementary information to improve coverage of the population diversity. In PISA the following techniques were implemented to limit the increase in the standard error: i) explicit and implicit stratification of the school sampling frame and ii) selection of schools with probabilities proportional to their size. Complementary information generally cannot compensate totally for the increase in the standard error due to the multi-stage design however but will greatly reduce it.
Table 11.5 provides the standard errors on the PISA 2009 reading scale if the participating country sample was selected according to: i) a simple random sample; ii) a multistage procedure without using complementary information (unstratified multistage sampling); and iii) the BRR estimate for the actual PISA 2009 design, using Fay’s method. It

PISA 2009 TECHNICAL REPORT – © OECD 2012 169
11Sampling OutcOmeS
should be mentioned that the plausible value imputation variance was not included in these computations and thus only reflects sampling error.
Note that the values in Table 11.5 for the standard errors for the unstratified multistage design are overestimates for countries that had a school census (Iceland, Liechtenstein, Luxembourg, Macao-China, Qatar, Trinidad and Tobago, and Dubai [UAE]) since these standard error estimates assume a sample of schools was collected.
Also note that in some of the countries where the unbiased values in Table 11.5 are greater than the values for the unstratified multistage sample, this is because of regional or other oversampling (Brazil, Colombia [two regions], Mexico and Spain).
The unbiased values in Table 11.5 are also greater than the values for the unstratified multistage sample for Finland, Indonesia, the Netherlands, Norway and Panama. As described in the sampling design chapter, some countries have a substantial proportion of students attending schools with fewer than the TCS. Very small schools were undersampled while schools in all large school strata were slightly oversampled. For Panama, they were undersampled by 4.
For the other instances of countries in Table 11.5 that have unbiased estimates that are somewhat greater than estimates based on an unstratified multistage design there is no ready explanation except perhaps the fact that these estimates are based on samples and are therefore subject to random variation. However, this suggests that the stratification undertaken possibly did not explain enough between-school variance in these countries.
[Part 1/2]table 11.5 Standard errors for the PiSa 2009 reading scale
Simple random sample unstratified multi-stage sample Brr estimate for PISa sample
OEC
D australia 0.829 2.609 2.337
austria 1.234 4.826 2.948
Belgium 1.104 4.876 2.350
Canada 0.593 1.499 1.483
Chile 1.098 4.593 3.125
Czech republic 1.185 4.603 2.892
denmark 1.086 2.317 2.074
estonia 1.211 3.185 2.635
Finland 1.134 2.113 2.254
France 1.610 6.296 3.442
germany 1.343 5.176 2.656
greece 1.350 4.704 4.322
hungary 1.329 5.900 3.175
Iceland 1.589 3.813 1.409
Ireland 1.517 4.187 2.972
Israel 1.469 6.003 3.634
Italy 0.545 2.243 1.572
japan 1.286 5.316 3.466
Korea 1.121 3.789 3.461
Luxembourg 1.526 9.765 1.253
mexico 0.433 1.470 1.953
netherlands 1.285 5.115 5.150
new Zealand 1.509 3.932 2.353
norway 1.336 2.487 2.581
Poland 1.272 2.972 2.605
Portugal 1.094 3.546 3.067
Slovak republic 1.337 4.480 2.544
Slovenia 1.158 4.114 1.032
Spain 0.544 1.495 2.020
Sweden 1.460 3.200 2.880
Switzerland 0.860 2.741 2.444
turkey 1.159 5.014 3.521
united Kingdom 0.864 2.286 2.280
united States 1.335 3.888 3.654
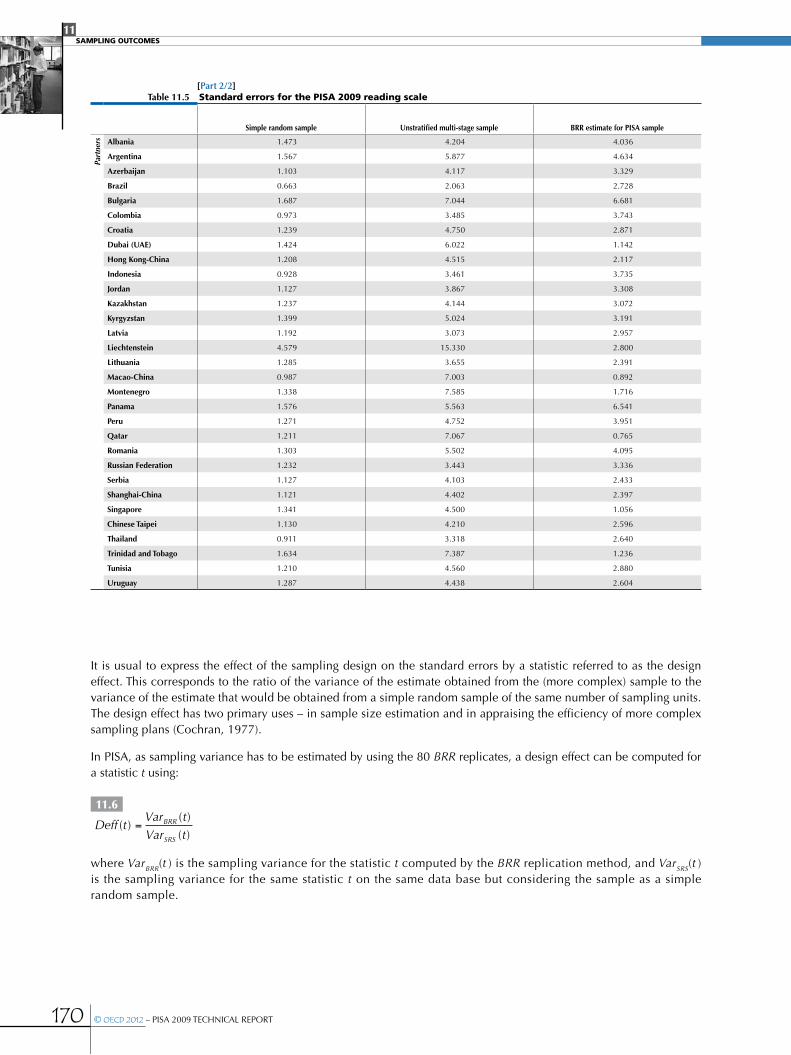
170 © OECD 2012 – PISA 2009 TECHNICAL REPORT
11Sampling OutcOmeS
[Part 2/2]table 11.5 Standard errors for the PiSa 2009 reading scale
Simple random sample unstratified multi-stage sample Brr estimate for PISa sample
Part
ners
albania 1.473 4.204 4.036
argentina 1.567 5.877 4.634
azerbaijan 1.103 4.117 3.329
Brazil 0.663 2.063 2.728
Bulgaria 1.687 7.044 6.681
Colombia 0.973 3.485 3.743
Croatia 1.239 4.750 2.871
dubai (uae) 1.424 6.022 1.142
hong Kong-China 1.208 4.515 2.117
Indonesia 0.928 3.461 3.735
jordan 1.127 3.867 3.308
Kazakhstan 1.237 4.144 3.072
Kyrgyzstan 1.399 5.024 3.191
Latvia 1.192 3.073 2.957
Liechtenstein 4.579 15.330 2.800
Lithuania 1.285 3.655 2.391
macao-China 0.987 7.003 0.892
montenegro 1.338 7.585 1.716
Panama 1.576 5.563 6.541
Peru 1.271 4.752 3.951
Qatar 1.211 7.067 0.765
romania 1.303 5.502 4.095
russian Federation 1.232 3.443 3.336
Serbia 1.127 4.103 2.433
Shanghai-China 1.121 4.402 2.397
Singapore 1.341 4.500 1.056
Chinese taipei 1.130 4.210 2.596
thailand 0.911 3.318 2.640
trinidad and tobago 1.634 7.387 1.236
tunisia 1.210 4.560 2.880
uruguay 1.287 4.438 2.604
It is usual to express the effect of the sampling design on the standard errors by a statistic referred to as the design effect. This corresponds to the ratio of the variance of the estimate obtained from the (more complex) sample to the variance of the estimate that would be obtained from a simple random sample of the same number of sampling units. The design effect has two primary uses – in sample size estimation and in appraising the efficiency of more complex sampling plans (Cochran, 1977).
In PISA, as sampling variance has to be estimated by using the 80 BRR replicates, a design effect can be computed for a statistic t using:
11.6
)()(
)(tVartVar
tDeffSRS
BRR=
where VarBRR(t ) is the sampling variance for the statistic t computed by the BRR replication method, and VarSRS(t ) is the sampling variance for the same statistic t on the same data base but considering the sample as a simple random sample.

PISA 2009 TECHNICAL REPORT – © OECD 2012 171
11Sampling OutcOmeS
Based on Table 11.5, the standard error on the mean estimate in reading in Australia is equal to 2.34 (rounded from 2.337). As the standard deviation of the reading performance is equal to 98.91, the design effect in Australia for the mean estimate in reading is therefore equal to:
11.7
[ ]98.7
14251/91)98.(
)34.2(
)(
)()(
2
2===
tVar
tVartDeff
SRS
BRR
The sampling variance on the reading performance mean in Australia is about eight times larger than it would have been with a simple random sample of the same sample size.
Another way to express the reduction of precision due to the complex sampling design is through the effective sample size, which expresses the simple random sample size that would give the same sampling variance as the one obtained from the actual complex sample design. The effective sample size for a statistic t is equal to:
11.8( )
( )( ) ( )
SRS
Brr
n Var tn xEffn t
Deff t Var t= =
where n is equal to the actual number of units in the sample. The effective sample size in Australia for the reading performance mean is equal to:
11.9
Deff t Var t= = = =
( ) (98.91)1786.7)(
( ) ( ) (2.34)SRS
Brr2
n Var tnEffn t
x 2
In other words, a simple random sample of 1 787 students in Australia would have been as precise as the actual PISA 2009 sample for the estimation of the reading performance, for the national estimate of mean reading proficiency.
Variability of the design effectNeither the design effect nor the effective sample size is a definitive characteristic of a sample. Both the design effect and the effective sample size vary with the variable and statistic of interest.
As previously stated, the sampling variance for estimates of the mean from a cluster sample is proportional to the intraclass correlation. In some countries, student performance varies between schools. Students in academic schools usually tend to perform well while on average student performance in vocational schools is lower. Let us now suppose that the height of the students was also measured. There are no reasons why students in academic schools should be taller than students in vocational schools, at least if there is no interaction between tracks and gender. For this particular variable, the expected value of the school variance should be equal to zero and therefore, the design effect should tend to one. As the segregation effect differs according to the variable, the design effect will also differ according to the variable.
The second factor that influences the size of the design effect is the choice of requested statistics. It tends to be large for means, proportions, and sums but substantially smaller for bivariate or multivariate statistics such as correlation and regression coefficients.
Design effects in PISA for performance variablesThe notion of design effect as given earlier is extended and gives rise to five different design effect formulae to describe the influence of the sampling and test designs on the standard errors for statistics.
The total errors computed for the international PISA initial report, PISA 2009 Results (OECD, 2010b) that involves performance variables (plausible values) consist of two components: sampling variance and measurement variance. The standard error of proficiency estimates in PISA is inflated because the students were not sampled according to a simple random sample and also because the estimation of student proficiency includes some amount of measurement error.
For any statistic t, the population estimate and the sampling variance are computed for each plausible value and then combined as described in Chapter 9.
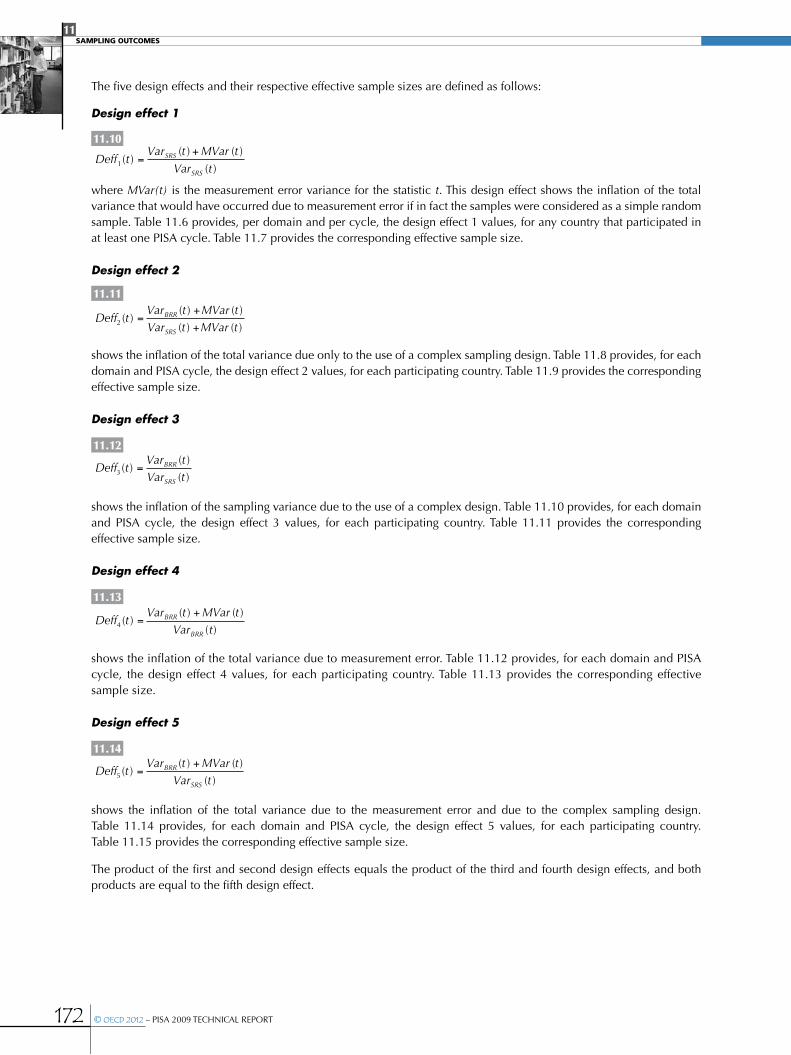
172 © OECD 2012 – PISA 2009 TECHNICAL REPORT
11Sampling OutcOmeS
The five design effects and their respective effective sample sizes are defined as follows:
Design effect 1
11.10
)()()(
)(1 tVartMVartVar
tDeffSRS
SRS +=
where MVar(t) is the measurement error variance for the statistic t. This design effect shows the inflation of the total variance that would have occurred due to measurement error if in fact the samples were considered as a simple random sample. Table 11.6 provides, per domain and per cycle, the design effect 1 values, for any country that participated in at least one PISA cycle. Table 11.7 provides the corresponding effective sample size.
Design effect 2
11.11
)()()()(
)(2 tMVartVartMVartVar
tDeffSRS
BRR
+
+=
shows the inflation of the total variance due only to the use of a complex sampling design. Table 11.8 provides, for each domain and PISA cycle, the design effect 2 values, for each participating country. Table 11.9 provides the corresponding effective sample size.
Design effect 3
11.12
)()(
)(3 tVartVar
tDeffSRS
BRR=
shows the inflation of the sampling variance due to the use of a complex design. Table 11.10 provides, for each domain and PISA cycle, the design effect 3 values, for each participating country. Table 11.11 provides the corresponding effective sample size.
Design effect 4
11.13
)()()(
)(4 tVartMVartVar
tDeffBRR
BRR +=
shows the inflation of the total variance due to measurement error. Table 11.12 provides, for each domain and PISA cycle, the design effect 4 values, for each participating country. Table 11.13 provides the corresponding effective sample size.
Design effect 5
11.14
)()()(
)(5 tVartMVartVar
tDeffSRS
BRR +=
shows the inflation of the total variance due to the measurement error and due to the complex sampling design. Table 11.14 provides, for each domain and PISA cycle, the design effect 5 values, for each participating country. Table 11.15 provides the corresponding effective sample size.
The product of the first and second design effects equals the product of the third and fourth design effects, and both products are equal to the fifth design effect.
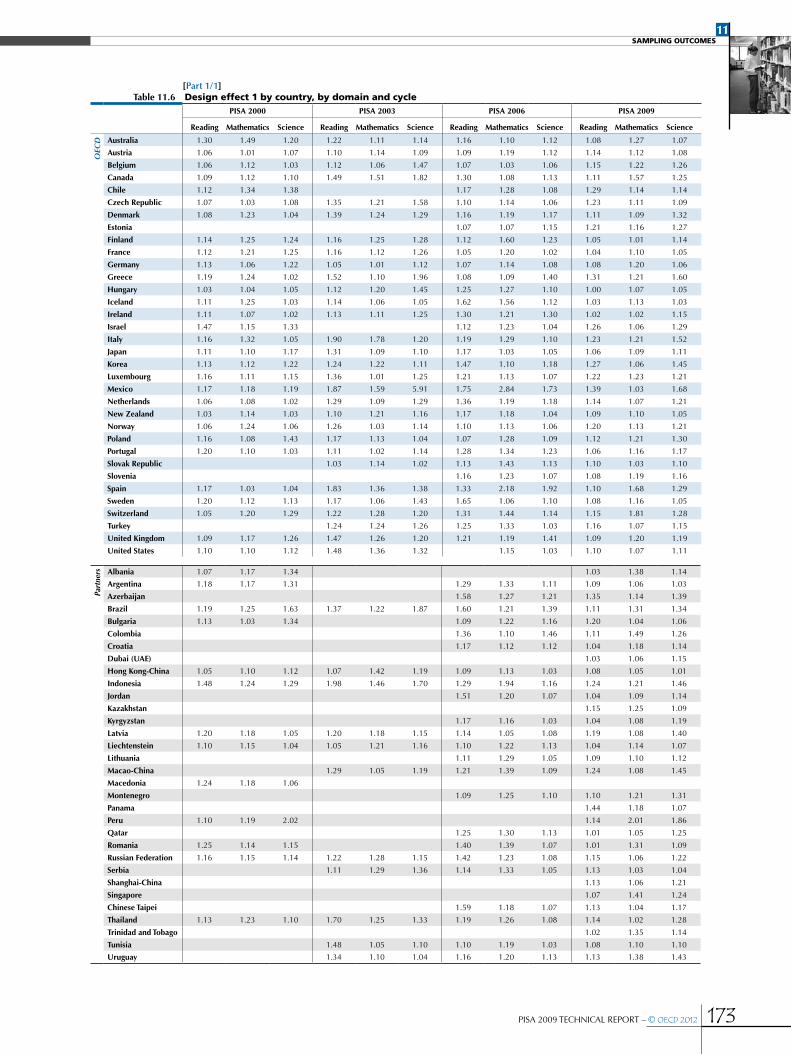
PISA 2009 TECHNICAL REPORT – © OECD 2012 173
11Sampling OutcOmeS
[Part 1/1]table 11.6 design effect 1 by country, by domain and cycle
PISa 2000 PISa 2003 PISa 2006 PISa 2009
reading mathematics Science reading mathematics Science reading mathematics Science reading mathematics Science
OEC
D australia 1.30 1.49 1.20 1.22 1.11 1.14 1.16 1.10 1.12 1.08 1.27 1.07
austria 1.06 1.01 1.07 1.10 1.14 1.09 1.09 1.19 1.12 1.14 1.12 1.08
Belgium 1.06 1.12 1.03 1.12 1.06 1.47 1.07 1.03 1.06 1.15 1.22 1.26
Canada 1.09 1.12 1.10 1.49 1.51 1.82 1.30 1.08 1.13 1.11 1.57 1.25
Chile 1.12 1.34 1.38 1.17 1.28 1.08 1.29 1.14 1.14
Czech republic 1.07 1.03 1.08 1.35 1.21 1.58 1.10 1.14 1.06 1.23 1.11 1.09
denmark 1.08 1.23 1.04 1.39 1.24 1.29 1.16 1.19 1.17 1.11 1.09 1.32
estonia 1.07 1.07 1.15 1.21 1.16 1.27
Finland 1.14 1.25 1.24 1.16 1.25 1.28 1.12 1.60 1.23 1.05 1.01 1.14
France 1.12 1.21 1.25 1.16 1.12 1.26 1.05 1.20 1.02 1.04 1.10 1.05
germany 1.13 1.06 1.22 1.05 1.01 1.12 1.07 1.14 1.08 1.08 1.20 1.06
greece 1.19 1.24 1.02 1.52 1.10 1.96 1.08 1.09 1.40 1.31 1.21 1.60
hungary 1.03 1.04 1.05 1.12 1.20 1.45 1.25 1.27 1.10 1.00 1.07 1.05
Iceland 1.11 1.25 1.03 1.14 1.06 1.05 1.62 1.56 1.12 1.03 1.13 1.03
Ireland 1.11 1.07 1.02 1.13 1.11 1.25 1.30 1.21 1.30 1.02 1.02 1.15
Israel 1.47 1.15 1.33 1.12 1.23 1.04 1.26 1.06 1.29
Italy 1.16 1.32 1.05 1.90 1.78 1.20 1.19 1.29 1.10 1.23 1.21 1.52
japan 1.11 1.10 1.17 1.31 1.09 1.10 1.17 1.03 1.05 1.06 1.09 1.11
Korea 1.13 1.12 1.22 1.24 1.22 1.11 1.47 1.10 1.18 1.27 1.06 1.45
Luxembourg 1.16 1.11 1.15 1.36 1.01 1.25 1.21 1.13 1.07 1.22 1.23 1.21
mexico 1.17 1.18 1.19 1.87 1.59 5.91 1.75 2.84 1.73 1.39 1.03 1.68
netherlands 1.06 1.08 1.02 1.29 1.09 1.29 1.36 1.19 1.18 1.14 1.07 1.21
new Zealand 1.03 1.14 1.03 1.10 1.21 1.16 1.17 1.18 1.04 1.09 1.10 1.05
norway 1.06 1.24 1.06 1.26 1.03 1.14 1.10 1.13 1.06 1.20 1.13 1.21
Poland 1.16 1.08 1.43 1.17 1.13 1.04 1.07 1.28 1.09 1.12 1.21 1.30
Portugal 1.20 1.10 1.03 1.11 1.02 1.14 1.28 1.34 1.23 1.06 1.16 1.17
Slovak republic 1.03 1.14 1.02 1.13 1.43 1.13 1.10 1.03 1.10
Slovenia 1.16 1.23 1.07 1.08 1.19 1.16
Spain 1.17 1.03 1.04 1.83 1.36 1.38 1.33 2.18 1.92 1.10 1.68 1.29
Sweden 1.20 1.12 1.13 1.17 1.06 1.43 1.65 1.06 1.10 1.08 1.16 1.05
Switzerland 1.05 1.20 1.29 1.22 1.28 1.20 1.31 1.44 1.14 1.15 1.81 1.28
turkey 1.24 1.24 1.26 1.25 1.33 1.03 1.16 1.07 1.15
united Kingdom 1.09 1.17 1.26 1.47 1.26 1.20 1.21 1.19 1.41 1.09 1.20 1.19
united States 1.10 1.10 1.12 1.48 1.36 1.32 1.15 1.03 1.10 1.07 1.11
Part
ners
albania 1.07 1.17 1.34 1.03 1.38 1.14
argentina 1.18 1.17 1.31 1.29 1.33 1.11 1.09 1.06 1.03
azerbaijan 1.58 1.27 1.21 1.35 1.14 1.39
Brazil 1.19 1.25 1.63 1.37 1.22 1.87 1.60 1.21 1.39 1.11 1.31 1.34
Bulgaria 1.13 1.03 1.34 1.09 1.22 1.16 1.20 1.04 1.06
Colombia 1.36 1.10 1.46 1.11 1.49 1.26
Croatia 1.17 1.12 1.12 1.04 1.18 1.14
dubai (uae) 1.03 1.06 1.15
hong Kong-China 1.05 1.10 1.12 1.07 1.42 1.19 1.09 1.13 1.03 1.08 1.05 1.01
Indonesia 1.48 1.24 1.29 1.98 1.46 1.70 1.29 1.94 1.16 1.24 1.21 1.46
jordan 1.51 1.20 1.07 1.04 1.09 1.14
Kazakhstan 1.15 1.25 1.09
Kyrgyzstan 1.17 1.16 1.03 1.04 1.08 1.19
Latvia 1.20 1.18 1.05 1.20 1.18 1.15 1.14 1.05 1.08 1.19 1.08 1.40
Liechtenstein 1.10 1.15 1.04 1.05 1.21 1.16 1.10 1.22 1.13 1.04 1.14 1.07
Lithuania 1.11 1.29 1.05 1.09 1.10 1.12
macao-China 1.29 1.05 1.19 1.21 1.39 1.09 1.24 1.08 1.45
macedonia 1.24 1.18 1.06
montenegro 1.09 1.25 1.10 1.10 1.21 1.31
Panama 1.44 1.18 1.07
Peru 1.10 1.19 2.02 1.14 2.01 1.86
Qatar 1.25 1.30 1.13 1.01 1.05 1.25
romania 1.25 1.14 1.15 1.40 1.39 1.07 1.01 1.31 1.09
russian Federation 1.16 1.15 1.14 1.22 1.28 1.15 1.42 1.23 1.08 1.15 1.06 1.22
Serbia 1.11 1.29 1.36 1.14 1.33 1.05 1.13 1.03 1.04
Shanghai-China 1.13 1.06 1.21
Singapore 1.07 1.41 1.24
Chinese taipei 1.59 1.18 1.07 1.13 1.04 1.17
thailand 1.13 1.23 1.10 1.70 1.25 1.33 1.19 1.26 1.08 1.14 1.02 1.28
trinidad and tobago 1.02 1.35 1.14
tunisia 1.48 1.05 1.10 1.10 1.19 1.03 1.08 1.10 1.10
uruguay 1.34 1.10 1.04 1.16 1.20 1.13 1.13 1.38 1.43

174 © OECD 2012 – PISA 2009 TECHNICAL REPORT
11Sampling OutcOmeS
[Part 1/1]table 11.7 effective sample size 1 by country, by domain and cycle
PISa 2000 PISa 2003 PISa 2006 PISa 2009
reading mathematics Science reading mathematics Science reading mathematics Science reading mathematics Science
OEC
D australia 3 983 1 923 2 374 10 328 11 335 11 055 12 176 12 841 12 654 13 248 11 263 13 351
austria 4 483 2 620 2 500 4 195 4 040 4 211 4 508 4 141 4 399 5 781 5 865 6 106
Belgium 6 302 3 366 3 613 7 861 8 291 5 987 8 256 8 614 8 364 7 369 6 950 6 763
Canada 27 294 14 682 15 047 18 723 18 559 15 320 17 465 21 011 20 048 20 823 14 747 18 579
Chile 4 372 2 027 1 959 4 490 4 086 4 855 4 396 4 972 4 966
Czech republic 5 019 2 964 2 841 4 681 5 221 4 006 5 377 5 195 5 604 4 927 5 464 5 539
denmark 3 924 1 936 2 256 3 032 3 402 3 259 3 892 3 810 3 877 5 318 5 430 4 499
estonia 4 528 4 554 4 248 3 897 4 063 3 718
Finland 4 270 2 163 2 180 5 009 4 627 4 537 4 203 2 941 3 836 5 531 5 748 5 107
France 4 189 2 153 2 080 3 707 3 851 3 404 4 470 3 923 4 617 4 145 3 924 4 078
germany 4 473 2 682 2 341 4 454 4 603 4 156 4 566 4 290 4 515 4 624 4 141 4 681
greece 3 930 2 108 2 553 3 054 4 192 2 366 4 497 4 459 3 485 3 786 4 115 3 104
hungary 4 743 2 701 2 678 4 272 3 978 3 278 3 603 3 543 4 089 4 589 4 303 4 386
Iceland 3 045 1 505 1 804 2 940 3 164 3 179 2 341 2 421 3 387 3 528 3 226 3 555
Ireland 3 474 1 984 2 097 3 434 3 483 3 096 3 528 3 804 3 530 3 860 3 842 3 411
Israel 3 063 2 161 1 884 4 077 3 739 4 390 4 578 5 422 4 475
Italy 4 280 2 101 2 629 6 123 6 555 9 668 18 288 16 892 19 776 25 080 25 573 20 376
japan 4 753 2 655 2 489 3 595 4 308 4 296 5 086 5 774 5 680 5 744 5 607 5 484
Korea 4 413 2 470 2 264 4 379 4 457 4 898 3 519 4 706 4 388 3 938 4 727 3 449
Luxembourg 3 043 1 761 1 698 2 890 3 872 3 135 3 783 4 032 4 283 3 783 3 768 3 830
mexico 3 945 2 181 2 149 15 998 18 839 5 074 17 696 10 894 17 861 27 507 37 285 22 717
netherlands 2 369 1 280 1 364 3 103 3 676 3 093 3 583 4 106 4 142 4 164 4 439 3 936
new Zealand 3 549 1 793 1 974 4 102 3 742 3 892 4 122 4 073 4 629 4 276 4 207 4 408
norway 3 895 1 857 2 181 3 215 3 946 3 570 4 253 4 153 4 439 3 868 4 142 3 850
Poland 3 158 1 823 1 425 3 748 3 894 4 222 5 167 4 344 5 105 4 394 4 067 3 795
Portugal 3 836 2 323 2 471 4 166 4 534 4 052 4 005 3 803 4 153 5 931 5 446 5 395
Slovak republic 7 111 6 466 7 183 4 183 3 306 4 194 4 158 4 416 4 130
Slovenia 5 693 5 373 6 146 5 717 5 164 5 300
Spain 5 323 3 330 3 339 5 899 7 918 7 806 14 768 9 005 10 226 23 562 15 372 20 138
Sweden 3 669 2 207 2 163 3 960 4 362 3 240 2 690 4 180 4 044 4 247 3 939 4 335
Switzerland 5 798 2 841 2 626 6 883 6 596 7 033 9 335 8 456 10 732 10 273 6 536 9 251
turkey 3 901 3 905 3 864 3 959 3 729 4 789 4 315 4 680 4 351
united Kingdom 8 552 4 450 4 099 6 489 7 588 7 964 10 845 11 047 9 297 11 179 10 187 10 241
united States 3 500 1 950 1 894 3 682 4 015 4 139 4 899 5 426 4 765 4 902 4 696
Part
ners
albania 4 653 2 379 2 063 4 453 3 336 4 043
argentina 3 363 1 901 1 686 3 355 3 258 3 896 4 368 4 505 4 636
azerbaijan 3 278 4 075 4 288 3 483 4 109 3 378
Brazil 4 112 2 175 1 660 3 244 3 639 2 381 5 804 7 668 6 672 18 197 15 308 14 970
Bulgaria 4 128 2 533 1 897 4 114 3 688 3 873 3 761 4 344 4 269
Colombia 3 305 4 054 3 074 7 142 5 334 6 309
Croatia 4 438 4 659 4 666 4 807 4 228 4 387
dubai (uae) 5 442 5 283 4 894
hong Kong-China 4 199 2 223 2 181 4 171 3 162 3 777 4 281 4 108 4 488 4 474 4 598 4 779
Indonesia 4 980 3 304 3 153 5 436 7 375 6 340 8 244 5 500 9 191 4 135 4 249 3 518
jordan 4 319 5 434 6 066 6 261 5 951 5 666
Kazakhstan 4 702 4 314 4 970
Kyrgyzstan 5 031 5 095 5 706 4 791 4 613 4 195
Latvia 3 240 1 826 2 059 3 851 3 920 4 026 4 136 4 481 4 368 3 770 4 172 3 205
Liechtenstein 286 153 170 316 274 285 309 278 300 315 289 307
Lithuania 4 255 3 675 4 535 4 151 4 127 4 041
macao-China 970 1 189 1 053 3 944 3 424 4 377 4 804 5 506 4 099
macedonia 3 629 2 149 2 387
montenegro 4 102 3 570 4 039 4 399 3 986 3 680
Panama 2 748 3 370 3 698
Peru 4 020 2 067 1 218 5 263 2 972 3 223
Qatar 5 030 4 814 5 548 9 033 8 612 7 285
romania 3 863 2 351 2 349 3 668 3 681 4 805 4 722 3 642 4 388
russian Federation 5 771 3 232 3 252 4 888 4 667 5 178 4 091 4 711 5 354 4 629 4 997 4 356
Serbia 3 977 3 424 3 247 4 216 3 617 4 578 4 871 5 373 5 317
Shanghai-China 4 525 4 845 4 234
Singapore 4 924 3 749 4 277
Chinese taipei 5 535 7 448 8 270 5 157 5 581 4 971
thailand 4 726 2 406 2 698 3 073 4 177 3 934 5 193 4 898 5 721 5 446 6 098 4 881
trinidad and tobago 4 688 3 548 4 199
tunisia 3 181 4 497 4 284 4 225 3 890 4 526 4 573 4 494 4 499
uruguay 4 344 5 308 5 608 4 175 4 049 4 293 5 271 4 326 4 160

PISA 2009 TECHNICAL REPORT – © OECD 2012 175
11Sampling OutcOmeS
[Part 1/1]table 11.8 design effect 2 by country, by domain and cycle
PISa 2000 PISa 2003 PISa 2006 PISa 2009
reading mathematics Science reading mathematics Science reading mathematics Science reading mathematics Science
OEC
D australia 4.77 2.89 3.22 4.92 5.75 4.69 5.89 8.32 6.44 7.40 8.15 8.30
austria 2.98 1.93 1.95 5.58 4.97 5.29 6.41 6.01 7.08 5.01 4.49 6.19
Belgium 6.96 4.54 5.39 4.33 3.59 3.18 6.31 6.68 5.20 3.93 3.26 3.90
Canada 7.41 4.05 4.70 7.29 8.08 6.34 11.21 11.04 9.33 5.61 5.01 6.05
Chile 6.96 3.13 2.59 10.50 11.22 10.77 6.28 7.25 6.39
Czech republic 3.04 2.46 1.90 6.15 7.13 4.51 7.59 6.15 6.99 4.84 5.04 5.17
denmark 2.26 1.53 1.67 3.09 3.07 2.78 4.93 3.63 4.32 3.27 4.86 3.28
estonia 5.37 5.31 3.86 3.90 4.07 3.73
Finland 3.55 1.54 1.80 2.06 2.30 2.04 2.94 2.37 2.13 3.76 3.97 3.50
France 3.70 1.99 2.01 2.83 2.87 2.48 6.83 4.32 5.05 4.41 3.69 5.02
germany 2.20 1.62 1.33 4.29 4.81 4.42 7.09 6.54 6.51 3.63 3.51 3.62
greece 10.29 5.60 6.51 4.70 7.24 3.41 6.98 4.61 4.28 7.81 7.74 6.04
hungary 8.41 4.53 4.42 3.08 3.66 2.66 4.36 3.56 3.77 5.69 6.04 5.79
Iceland 0.75 1.06 1.10 0.74 0.78 0.75 0.94 1.02 0.97 0.76 0.75 0.78
Ireland 4.16 2.09 2.52 3.16 2.87 2.59 5.16 4.38 4.02 3.77 3.39 3.86
Israel 18.44 10.96 9.86 6.00 6.12 4.85 4.86 5.38 3.81
Italy 4.35 2.21 2.54 5.59 6.77 8.14 9.10 9.59 8.83 6.74 10.17 6.86
japan 17.53 10.60 9.12 4.97 6.87 6.16 6.46 7.78 6.45 6.85 7.01 6.42
Korea 5.33 2.65 2.52 6.14 5.47 6.07 6.56 7.77 6.10 7.52 9.57 6.03
Luxembourg 0.77 0.81 0.98 0.64 0.43 0.67 0.62 0.53 0.51 0.55 0.55 0.53
mexico 5.88 3.60 3.66 29.59 34.24 8.22 18.09 12.83 20.21 14.66 19.95 12.17
netherlands 3.39 2.17 2.32 3.51 4.21 3.15 3.28 3.50 3.40 14.05 12.60 12.50
new Zealand 2.35 1.82 1.12 2.27 1.97 2.00 3.33 2.67 2.92 2.24 2.43 2.54
norway 2.85 1.70 1.81 2.36 2.63 2.74 3.89 3.45 4.65 3.10 3.27 3.24
Poland 6.29 5.20 3.99 3.37 3.00 3.30 4.02 3.46 3.47 3.75 4.20 2.93
Portugal 8.30 4.63 4.98 6.75 6.84 5.56 5.20 4.35 4.84 7.40 5.54 6.51
Slovak republic 8.09 8.32 9.47 3.54 2.95 3.23 3.31 4.54 4.04
Slovenia 0.71 0.73 0.79 0.74 0.85 0.79
Spain 5.44 3.96 3.19 4.38 5.87 5.31 9.34 6.21 8.21 12.56 8.32 11.09
Sweden 2.10 1.53 1.57 2.54 3.18 2.11 3.29 3.01 2.57 3.62 3.76 3.22
Switzerland 10.04 5.49 5.18 8.23 7.80 8.26 9.88 8.86 10.88 7.02 7.22 7.97
turkey 14.39 16.15 14.55 8.11 10.30 10.19 7.97 10.58 8.64
united Kingdom 5.55 3.31 3.07 4.46 5.25 4.81 5.31 6.41 4.27 6.39 7.85 6.65
united States 15.82 11.77 9.91 3.73 3.85 3.80 9.83 8.61 6.81 7.59 6.54
Part
ners albania 5.10 1.97 1.94 7.28 6.41 7.95
argentina 27.72 11.50 10.32 11.18 12.41 14.05 8.00 8.63 9.32
azerbaijan 6.48 9.03 10.49 6.77 7.66 5.75
Brazil 5.32 3.14 2.16 5.49 8.54 4.65 7.75 7.79 6.50 15.32 13.24 12.55
Bulgaria 9.54 6.78 4.35 14.20 13.56 12.70 13.09 15.22 13.15
Colombia 7.34 7.48 4.87 13.34 9.85 12.60
Croatia 4.43 3.75 3.79 5.16 5.19 4.90
dubai (uae) 0.62 0.62 0.65
hong Kong-China 5.10 2.69 2.73 7.88 6.48 7.74 3.75 3.36 3.27 2.84 3.77 4.74
Indonesia 15.08 9.47 8.71 10.69 17.38 14.12 51.68 27.19 61.43 13.06 11.90 10.64
jordan 5.21 8.47 6.05 8.31 11.99 8.93
Kazakhstan 5.36 5.72 6.50
Kyrgyzstan 5.83 7.83 6.98 5.00 5.83 4.36
Latvia 8.62 3.40 6.80 6.34 6.90 7.08 6.99 5.99 5.42 5.15 6.26 4.95
Liechtenstein 0.52 0.81 0.95 0.50 0.47 0.50 0.52 0.57 0.54 0.36 0.62 0.47
Lithuania 4.15 3.90 4.25 3.18 3.64 4.79
macao-China 1.01 1.31 1.25 0.81 0.82 0.80 0.66 0.63 0.75
macedonia 1.55 1.60 1.53
montenegro 0.75 0.92 0.72 1.50 2.28 1.99
Panama 11.92 14.28 15.02
Peru 8.47 3.46 2.41 8.50 5.87 4.93
Qatar 0.61 0.61 0.58 0.40 0.44 0.54
romania 4.45 3.20 2.98 9.57 9.25 12.87 9.76 6.74 7.97
russian Federation 11.79 8.90 7.42 8.70 9.66 8.92 8.80 8.79 8.97 6.40 7.51 5.84
Serbia 7.59 6.73 5.80 6.00 5.30 5.82 4.11 5.58 4.21
Shanghai-China 4.04 3.63 3.37
Singapore 0.58 0.71 0.73
Chinese taipei 8.86 11.79 11.80 4.67 5.84 4.59
thailand 8.44 4.57 4.27 3.97 5.59 4.34 5.21 4.03 4.41 7.35 10.16 6.83
trinidad and tobago 0.56 0.59 0.55
tunisia 2.74 4.30 3.68 7.21 7.21 5.83 5.23 6.66 4.90
uruguay 3.47 5.76 3.95 3.35 2.79 3.64 3.63 3.47 2.96

176 © OECD 2012 – PISA 2009 TECHNICAL REPORT
11Sampling OutcOmeS
[Part 1/1]table 11.9 effective sample size 2 by country, by domain and cycle
PISa 2000 PISa 2003 PISa 2006 PISa 2009
reading mathematics Science reading mathematics Science reading mathematics Science reading mathematics Science
OEC
D australia 1 085 991 889 2 549 2 184 2 675 2 406 1 703 2 201 1 926 1 748 1 716
austria 1 590 1 370 1 370 824 925 868 769 820 696 1 315 1 468 1 064
Belgium 958 834 690 2 031 2 452 2 767 1 404 1 326 1 705 2 165 2 611 2 179
Canada 4 009 4 072 3 506 3 834 3 458 4 407 2 020 2 052 2 428 4 136 4 631 3 836
Chile 702 870 1 047 498 467 486 902 782 887
Czech republic 1 766 1 246 1 611 1 027 887 1 400 781 964 848 1 253 1 204 1 173
denmark 1 875 1 556 1 405 1 367 1 374 1 520 919 1 249 1 049 1 810 1 220 1 806
estonia 907 917 1 259 1 211 1 162 1 266
Finland 1 370 1 751 1 510 2 820 2 519 2 844 1 606 1 991 2 213 1 544 1 465 1 661
France 1 262 1 305 1 290 1 522 1 498 1 733 690 1 093 934 975 1 164 856
germany 2 309 1 747 2 142 1 087 969 1 053 690 748 752 1 371 1 419 1 374
greece 454 466 398 985 639 1 356 698 1 058 1 138 636 642 823
hungary 581 618 633 1 549 1 301 1 791 1 031 1 261 1 192 810 762 796
Iceland 4 470 1 768 1 684 4 538 4 268 4 470 4 028 3 717 3 917 4 792 4 846 4 690
Ireland 927 1 016 847 1 228 1 352 1 498 888 1 046 1 140 1 046 1 162 1 019
Israel 244 227 255 764 749 944 1 185 1 072 1 513
Italy 1 147 1 250 1 087 2 082 1 720 1 430 2 394 2 271 2 465 4 584 3 038 4 502
japan 300 276 320 947 685 764 921 765 923 889 868 948
Korea 935 1 047 1 095 887 994 897 789 666 849 664 521 827
Luxembourg 4 603 2 415 1 983 6 122 9 061 5 890 7 380 8 698 8 992 8 368 8 390 8 694
mexico 783 714 696 1 013 876 3 650 1 712 2 415 1 533 2 609 1 917 3 142
netherlands 739 636 601 1 137 949 1 267 1 484 1 393 1 431 339 378 381
new Zealand 1 560 1 128 1 811 1 991 2 287 2 260 1 447 1 805 1 654 2 074 1 912 1 825
norway 1 457 1 357 1 279 1 723 1 545 1 486 1 205 1 359 1 008 1 503 1 427 1 437
Poland 581 380 513 1 302 1 462 1 328 1 381 1 603 1 600 1 311 1 172 1 680
Portugal 553 550 513 683 673 829 982 1 173 1 056 851 1 137 968
Slovak republic 908 883 776 1 338 1 605 1 465 1 378 1 003 1 127
Slovenia 9 244 9 015 8 373 8 351 7 215 7 799
Spain 1 143 866 1 083 2 463 1 838 2 031 2 100 3 158 2 388 2 062 3 111 2 335
Sweden 2 106 1 609 1 558 1 821 1 454 2 191 1 350 1 475 1 730 1 262 1 215 1 419
Switzerland 607 618 656 1 023 1 080 1 020 1 234 1 376 1 121 1 682 1 636 1 481
turkey 337 301 334 609 480 485 627 472 578
united Kingdom 1 682 1 570 1 687 2 138 1 817 1 984 2 476 2 050 3 079 1 906 1 551 1 831
united States 243 181 215 1 462 1 418 1 437 571 652 768 689 800
Part
ners
albania 977 1 410 1 427 632 717 578
argentina 144 194 214 388 350 309 596 554 512
azerbaijan 800 574 494 693 612 816
Brazil 920 864 1 253 810 521 956 1 200 1 193 1 431 1 314 1 520 1 604
Bulgaria 488 386 586 317 332 354 344 296 343
Colombia 610 598 920 594 804 628
Croatia 1 177 1 389 1 374 967 962 1 019
dubai (uae) 9 023 9 005 8 610
hong Kong-China 863 907 893 568 691 578 1 237 1 384 1 422 1 703 1 284 1 021
Indonesia 489 432 468 1 007 619 762 206 392 173 393 432 482
jordan 1 249 769 1 076 781 541 726
Kazakhstan 1 010 946 833
Kyrgyzstan 1 012 754 846 997 855 1 145
Latvia 451 632 317 730 671 654 675 787 870 873 719 910
Liechtenstein 600 216 185 664 700 666 649 593 630 920 532 697
Lithuania 1 144 1 217 1 115 1 426 1 243 946
macao-China 1 239 956 1 002 5 857 5 820 5 947 9 031 9 394 7 906
macedonia 2 909 1 588 1 650
montenegro 5 938 4 837 6 226 3 213 2 112 2 422
Panama 333 278 264
Peru 523 711 1 022 704 1 020 1 214
Qatar 10 254 10 257 10 791 22 892 20 465 16 870
romania 1 086 839 904 535 553 398 489 709 599
russian Federation 568 418 501 687 618 670 659 660 647 829 707 909
Serbia 580 654 759 800 906 824 1 344 989 1 312
Shanghai-China 1 265 1 408 1 519
Singapore 9 141 7 409 7 199
Chinese taipei 995 748 747 1 249 998 1 269
thailand 633 648 694 1 320 937 1 205 1 189 1 537 1 403 847 613 912
trinidad and tobago 8 515 8 121 8 694
tunisia 1 725 1 097 1 282 643 643 795 948 745 1 011
uruguay 1 683 1 012 1 478 1 444 1 734 1 329 1 643 1 719 2 014

PISA 2009 TECHNICAL REPORT – © OECD 2012 177
11Sampling OutcOmeS
[Part 1/1]table 11.10 design effect 3 by country, by domain and cycle
PISa 2000 PISa 2003 PISa 2006 PISa 2009
reading mathematics Science reading mathematics Science reading mathematics Science reading mathematics Science
OEC
D australia 5.90 3.81 3.67 5.77 6.25 5.19 6.69 9.08 7.09 7.88 10.05 8.80
austria 3.10 1.93 2.01 6.02 5.52 5.69 6.91 6.96 7.81 5.57 4.92 6.61
Belgium 7.31 4.98 5.53 4.73 3.75 4.20 6.70 6.84 5.44 4.38 3.76 4.65
Canada 7.97 4.42 5.06 10.39 11.67 10.75 14.24 11.82 10.40 6.14 7.31 7.31
Chile 7.66 3.86 3.20 12.08 14.09 11.53 7.81 8.12 7.16
Czech republic 3.18 2.51 1.97 7.96 8.42 6.54 8.27 6.88 7.34 5.72 5.48 5.56
denmark 2.36 1.65 1.70 3.90 3.57 3.30 5.58 4.12 4.88 3.53 5.21 4.00
estonia 5.69 5.60 4.28 4.52 4.57 4.48
Finland 3.90 1.68 1.99 2.22 2.63 2.33 3.17 3.19 2.39 3.90 4.00 3.84
France 4.02 2.19 2.26 3.12 3.09 2.87 7.15 4.99 5.14 4.53 3.95 5.24
germany 2.36 1.65 1.41 4.44 4.86 4.84 7.52 7.31 6.96 3.83 4.02 3.79
greece 12.04 6.68 6.60 6.60 7.89 5.72 7.48 4.94 5.59 9.94 9.14 9.07
hungary 8.64 4.66 4.58 3.32 4.19 3.41 5.18 4.24 4.04 5.70 6.40 6.02
Iceland 0.73 1.08 1.11 0.70 0.77 0.74 0.90 1.03 0.96 0.75 0.72 0.77
Ireland 4.50 2.17 2.55 3.44 3.08 2.99 6.41 5.08 4.92 3.82 3.45 4.30
Israel 26.61 12.44 12.82 6.63 7.28 5.02 5.86 5.65 4.62
Italy 4.90 2.59 2.62 9.72 11.24 9.59 10.64 12.07 9.62 8.07 12.09 9.89
japan 19.28 11.57 10.50 6.20 7.42 6.66 7.39 7.99 6.71 7.20 7.53 7.02
Korea 5.89 2.84 2.85 7.39 6.47 6.63 9.18 8.44 7.01 9.26 10.05 8.28
Luxembourg 0.73 0.79 0.98 0.51 0.43 0.58 0.54 0.46 0.48 0.45 0.45 0.43
mexico 6.69 4.06 4.15 54.56 53.89 43.63 30.91 34.61 34.30 19.99 20.44 19.81
netherlands 3.52 2.27 2.35 4.23 4.48 3.78 4.10 3.96 3.83 15.91 13.44 14.91
new Zealand 2.40 1.93 1.12 2.39 2.17 2.15 3.73 2.98 3.00 2.34 2.58 2.63
norway 2.97 1.87 1.85 2.72 2.68 2.98 4.19 3.77 4.86 3.53 3.55 3.72
Poland 7.12 5.56 5.28 3.77 3.25 3.39 4.24 4.14 3.68 4.08 4.86 3.50
Portugal 9.72 4.98 5.11 7.36 6.94 6.19 6.36 5.51 5.72 7.80 6.25 7.43
Slovak republic 8.33 9.31 9.66 3.87 3.79 3.52 3.53 4.65 4.36
Slovenia 0.67 0.67 0.77 0.72 0.82 0.76
Spain 6.18 4.04 3.27 7.19 7.64 6.96 12.06 12.34 14.82 13.70 13.33 13.97
Sweden 2.32 1.59 1.64 2.80 3.31 2.59 4.79 3.14 2.72 3.82 4.20 3.34
Switzerland 10.52 6.37 6.40 9.85 9.68 9.69 12.60 12.33 12.22 7.92 12.24 9.90
turkey 17.67 19.84 18.03 9.88 13.33 10.49 9.06 11.23 9.77
united Kingdom 5.97 3.70 3.61 6.08 6.34 5.56 6.23 7.45 5.63 6.87 9.19 7.72
united States 17.29 12.79 11.01 5.05 4.87 4.69 11.11 8.87 7.39 8.03 7.18
Part
ners
albania 5.38 2.14 2.27 7.48 8.45 8.90
argentina 32.64 13.32 13.21 14.17 16.20 15.54 8.65 9.08 9.57
azerbaijan 9.66 11.22 12.47 8.77 8.61 7.60
Brazil 6.14 3.68 2.90 7.17 10.23 7.83 11.80 9.23 8.66 16.84 17.10 16.53
Bulgaria 10.63 6.97 5.49 15.44 16.32 14.58 15.49 15.75 13.83
Colombia 9.60 8.16 6.63 14.69 14.14 15.57
Croatia 5.03 4.08 4.12 5.33 5.95 5.44
dubai (uae) 0.61 0.60 0.60
hong Kong-China 5.31 2.85 2.93 8.39 8.76 8.99 3.99 3.66 3.35 2.99 3.91 4.78
Indonesia 21.83 11.49 10.96 20.17 24.89 23.28 66.45 51.69 71.00 15.97 14.17 15.08
jordan 7.35 9.94 6.42 8.57 12.97 10.08
Kazakhstan 6.01 6.92 6.99
Kyrgyzstan 6.67 8.91 7.19 5.16 6.22 4.99
Latvia 10.16 3.83 7.08 7.42 7.96 7.98 7.84 6.26 5.78 5.96 6.68 6.54
Liechtenstein 0.48 0.78 0.95 0.47 0.36 0.42 0.48 0.48 0.48 0.33 0.56 0.43
Lithuania 4.51 4.74 4.40 3.37 3.90 5.24
macao-China 1.01 1.32 1.29 0.77 0.75 0.78 0.58 0.60 0.64
macedonia 1.68 1.71 1.56
montenegro 0.73 0.90 0.69 1.55 2.55 2.30
Panama 16.78 16.64 16.04
Peru 9.24 3.93 3.84 9.53 10.81 8.30
Qatar 0.52 0.49 0.53 0.39 0.41 0.42
romania 5.31 3.51 3.27 12.96 12.47 13.65 9.87 8.53 8.58
russian Federation 13.53 10.09 8.34 10.41 12.09 10.14 12.06 10.59 9.63 7.19 7.92 6.90
Serbia 8.30 8.38 7.52 6.69 6.70 6.06 4.53 5.71 4.33
Shanghai-China 4.44 3.78 3.86
Singapore 0.55 0.60 0.67
Chinese taipei 13.51 13.77 12.52 5.15 6.06 5.22
thailand 9.40 5.39 4.60 6.06 6.75 5.45 6.02 4.83 4.69 8.26 10.35 8.43
trinidad and tobago 0.55 0.45 0.49
tunisia 3.58 4.47 3.96 7.82 8.41 5.96 5.58 7.24 5.30
uruguay 4.31 6.24 4.07 3.73 3.14 3.98 3.97 4.40 3.80

178 © OECD 2012 – PISA 2009 TECHNICAL REPORT
11Sampling OutcOmeS
[Part 1/1]table 11.11 effective sample size 3 by country, by domain and cycle
PISa 2000 PISa 2003 PISa 2006 PISa 2009
reading mathematics Science reading mathematics Science reading mathematics Science reading mathematics Science
OEC
D australia 877 751 779 2 176 2 007 2 417 2 118 1 560 1 999 1 808 1 418 1 620
austria 1 531 1 365 1 327 764 833 808 713 708 631 1 183 1 339 998
Belgium 912 761 674 1 861 2 349 2 093 1 323 1 295 1 627 1 942 2 261 1 830
Canada 3 726 3 726 3 260 2 690 2 396 2 601 1 591 1 916 2 176 3 780 3 174 3 175
Chile 638 706 847 433 372 454 726 698 792
Czech republic 1 688 1 221 1 554 794 751 966 717 862 808 1 060 1 106 1 090
denmark 1 796 1 440 1 383 1 081 1 182 1 279 812 1 099 929 1 677 1 138 1 480
estonia 855 869 1 137 1 045 1 035 1 056
Finland 1 246 1 610 1 363 2 609 2 204 2 492 1 486 1 477 1 973 1 489 1 453 1 512
France 1 164 1 184 1 148 1 380 1 393 1 498 659 946 918 948 1 089 820
germany 2 152 1 711 2 031 1 050 959 963 651 669 702 1 299 1 239 1 314
greece 388 390 393 701 586 810 652 986 872 500 544 548
hungary 566 601 612 1 437 1 138 1 395 866 1 058 1 112 808 720 764
Iceland 4 633 1 741 1 679 4 774 4 338 4 552 4 191 3 677 3 933 4 843 5 063 4 724
Ireland 856 979 838 1 128 1 258 1 296 715 903 931 1 031 1 142 915
Israel 169 200 196 692 630 912 984 1 020 1 248
Italy 1 018 1 066 1 054 1 197 1 035 1 213 2 046 1 804 2 263 3 828 2 557 3 124
japan 273 253 277 759 635 707 805 745 887 846 809 867
Korea 846 974 968 737 842 821 564 613 738 539 496 603
Luxembourg 4 838 2 480 1 988 7 655 9 220 6 739 8 461 9 884 9 610 10 201 10 290 10 632
mexico 688 633 613 549 556 687 1 002 895 903 1 913 1 871 1 931
netherlands 711 610 593 944 891 1 057 1 187 1 229 1 273 299 354 319
new Zealand 1 531 1 060 1 805 1 886 2 077 2 094 1 293 1 619 1 609 1 980 1 802 1 768
norway 1 398 1 234 1 246 1 495 1 517 1 366 1 119 1 244 965 1 320 1 313 1 254
Poland 513 356 387 1 164 1 349 1 293 1 309 1 339 1 507 1 206 1 011 1 406
Portugal 472 511 499 626 664 745 803 928 893 808 1 008 848
Slovak republic 882 789 761 1 223 1 249 1 346 1 292 979 1 046
Slovenia 9 872 9 837 8 541 8 585 7 461 8 150
Spain 1 005 848 1 057 1 502 1 413 1 550 1 625 1 589 1 323 1 890 1 942 1 853
Sweden 1 903 1 546 1 488 1 653 1 396 1 788 929 1 415 1 631 1 197 1 087 1 369
Switzerland 580 533 531 855 870 869 968 989 997 1 491 965 1 193
turkey 275 245 269 500 371 471 551 445 511
united Kingdom 1 564 1 406 1 433 1 567 1 504 1 716 2 112 1 766 2 337 1 772 1 325 1 577
united States 222 167 193 1 081 1 120 1 164 505 633 709 651 729
Part
ners
albania 925 1 301 1 224 615 544 517
argentina 122 167 167 306 268 279 552 526 499
azerbaijan 537 462 416 535 545 617
Brazil 797 739 935 621 435 569 788 1 007 1 074 1 195 1 177 1 218
Bulgaria 438 375 464 291 276 308 291 286 326
Colombia 467 549 675 539 560 509
Croatia 1 037 1 278 1 265 938 839 918
dubai (uae) 9 205 9 365 9 347
hong Kong-China 830 855 831 534 511 498 1 164 1 268 1 389 1 618 1 237 1 011
Indonesia 337 356 372 533 432 462 160 206 150 322 362 341
jordan 886 655 1 014 757 500 644
Kazakhstan 900 782 775
Kyrgyzstan 885 662 821 966 801 999
Latvia 383 562 305 624 581 580 602 754 817 755 674 688
Liechtenstein 658 224 185 699 911 798 713 710 709 999 582 758
Lithuania 1 052 1 001 1 077 1 342 1 161 863
macao-China 1 236 945 967 6 151 6 374 6 079 10 305 9 857 9 284
macedonia 2 679 1 485 1 617
montenegro 6 114 4 943 6 492 3 112 1 890 2 098
Panama 237 239 247
Peru 480 626 640 628 554 721
Qatar 12 151 12 697 11 900 23 068 21 955 21 389
romania 910 765 824 395 410 375 484 560 556
russian Federation 495 369 446 574 494 589 481 547 602 738 671 770
Serbia 530 526 586 718 716 792 1 220 967 1 275
Shanghai-China 1 152 1 354 1 325
Singapore 9 656 8 867 7 870
Chinese taipei 653 640 704 1 133 963 1 118
thailand 568 549 645 865 775 961 1 029 1 282 1 319 754 601 738
trinidad and tobago 8 644 10 722 9 800
tunisia 1 320 1 057 1 193 593 552 779 888 685 935
uruguay 1 353 935 1 435 1 299 1 541 1 217 1 502 1 355 1 566

PISA 2009 TECHNICAL REPORT – © OECD 2012 179
11Sampling OutcOmeS
[Part 1/1]table 11.12 design effect 4 by country, by domain and cycle
PISa 2000 PISa 2003 PISa 2006 PISa 2009
reading mathematics Science reading mathematics Science reading mathematics Science reading mathematics Science
OEC
D australia 1.05 1.13 1.06 1.04 1.02 1.03 1.02 1.01 1.02 1.01 1.03 1.01
austria 1.02 1.00 1.03 1.02 1.03 1.02 1.01 1.03 1.02 1.03 1.03 1.01
Belgium 1.01 1.03 1.01 1.03 1.02 1.11 1.01 1.00 1.01 1.04 1.06 1.06
Canada 1.01 1.03 1.02 1.05 1.04 1.08 1.02 1.01 1.01 1.02 1.08 1.03
Chile 1.02 1.09 1.12 1.01 1.02 1.01 1.04 1.02 1.02
Czech republic 1.02 1.01 1.04 1.04 1.03 1.09 1.01 1.02 1.01 1.04 1.02 1.02
denmark 1.03 1.14 1.02 1.10 1.07 1.09 1.03 1.05 1.03 1.03 1.02 1.08
estonia 1.01 1.01 1.03 1.05 1.04 1.06
Finland 1.04 1.15 1.12 1.07 1.10 1.12 1.04 1.19 1.10 1.01 1.00 1.04
France 1.03 1.09 1.11 1.05 1.04 1.09 1.01 1.04 1.00 1.01 1.02 1.01
germany 1.06 1.03 1.16 1.01 1.00 1.03 1.01 1.02 1.01 1.02 1.05 1.02
greece 1.02 1.04 1.00 1.08 1.01 1.17 1.01 1.02 1.07 1.03 1.02 1.07
hungary 1.00 1.01 1.01 1.03 1.05 1.13 1.05 1.06 1.02 1.00 1.01 1.01
Iceland 1.15 1.23 1.03 1.20 1.08 1.07 1.69 1.55 1.12 1.04 1.18 1.03
Ireland 1.02 1.03 1.01 1.04 1.04 1.08 1.05 1.04 1.06 1.01 1.01 1.04
Israel 1.02 1.01 1.03 1.02 1.03 1.01 1.04 1.01 1.06
Italy 1.03 1.12 1.02 1.09 1.07 1.02 1.02 1.02 1.01 1.03 1.02 1.05
japan 1.01 1.01 1.02 1.05 1.01 1.01 1.02 1.00 1.01 1.01 1.01 1.02
Korea 1.02 1.04 1.08 1.03 1.03 1.02 1.05 1.01 1.03 1.03 1.01 1.05
Luxembourg 1.22 1.14 1.15 1.71 1.03 1.44 1.39 1.29 1.14 1.49 1.51 1.48
mexico 1.02 1.04 1.04 1.02 1.01 1.11 1.02 1.05 1.02 1.02 1.00 1.03
netherlands 1.02 1.04 1.01 1.07 1.02 1.08 1.09 1.05 1.05 1.01 1.01 1.01
new Zealand 1.01 1.07 1.02 1.04 1.09 1.07 1.05 1.06 1.01 1.04 1.04 1.02
norway 1.02 1.13 1.03 1.10 1.01 1.05 1.02 1.03 1.01 1.06 1.04 1.06
Poland 1.02 1.02 1.08 1.05 1.04 1.01 1.02 1.07 1.02 1.03 1.04 1.08
Portugal 1.02 1.02 1.01 1.01 1.00 1.02 1.04 1.06 1.04 1.01 1.03 1.02
Slovak republic 1.00 1.01 1.00 1.03 1.11 1.04 1.03 1.01 1.02
Slovenia 1.24 1.34 1.10 1.11 1.23 1.22
Spain 1.03 1.01 1.01 1.12 1.05 1.06 1.03 1.10 1.06 1.01 1.05 1.02
Sweden 1.09 1.07 1.08 1.06 1.02 1.17 1.14 1.02 1.04 1.02 1.04 1.02
Switzerland 1.00 1.03 1.05 1.02 1.03 1.02 1.02 1.04 1.01 1.02 1.07 1.03
turkey 1.01 1.01 1.01 1.03 1.02 1.00 1.02 1.01 1.02
united Kingdom 1.02 1.05 1.07 1.08 1.04 1.04 1.03 1.03 1.07 1.01 1.02 1.02
united States 1.01 1.01 1.01 1.10 1.07 1.07 1.01 1.00 1.01 1.01 1.02
Part
ners
albania 1.01 1.08 1.15 1.00 1.04 1.02
argentina 1.01 1.01 1.02 1.02 1.02 1.01 1.01 1.01 1.00
azerbaijan 1.06 1.02 1.02 1.04 1.02 1.05
Brazil 1.03 1.07 1.22 1.05 1.02 1.11 1.05 1.02 1.05 1.01 1.02 1.02
Bulgaria 1.01 1.00 1.06 1.01 1.01 1.01 1.01 1.00 1.00
Colombia 1.04 1.01 1.07 1.01 1.03 1.02
Croatia 1.03 1.03 1.03 1.01 1.03 1.03
dubai (uae) 1.05 1.11 1.25
hong Kong-China 1.01 1.03 1.04 1.01 1.05 1.02 1.02 1.04 1.01 1.03 1.01 1.00
Indonesia 1.02 1.02 1.03 1.05 1.02 1.03 1.00 1.02 1.00 1.02 1.01 1.03
jordan 1.07 1.02 1.01 1.00 1.01 1.01
Kazakhstan 1.03 1.04 1.01
Kyrgyzstan 1.03 1.02 1.00 1.01 1.01 1.04
Latvia 1.02 1.05 1.01 1.03 1.02 1.02 1.02 1.01 1.01 1.03 1.01 1.06
Liechtenstein 1.20 1.19 1.04 1.11 1.58 1.40 1.21 1.47 1.28 1.14 1.25 1.17
Lithuania 1.03 1.06 1.01 1.03 1.02 1.02
macao-China 1.29 1.04 1.15 1.27 1.53 1.11 1.42 1.14 1.71
macedonia 1.15 1.11 1.04
montenegro 1.12 1.28 1.15 1.07 1.09 1.14
Panama 1.03 1.01 1.00
Peru 1.01 1.05 1.27 1.01 1.09 1.10
Qatar 1.48 1.62 1.25 1.01 1.13 1.58
romania 1.05 1.04 1.05 1.03 1.03 1.00 1.00 1.04 1.01
russian Federation 1.01 1.01 1.02 1.02 1.02 1.02 1.03 1.02 1.01 1.02 1.01 1.03
Serbia 1.01 1.03 1.05 1.02 1.05 1.01 1.03 1.00 1.01
Shanghai-China 1.03 1.01 1.05
Singapore 1.14 1.69 1.35
Chinese taipei 1.04 1.01 1.01 1.03 1.01 1.03
thailand 1.01 1.04 1.02 1.12 1.04 1.06 1.03 1.05 1.02 1.02 1.00 1.03
trinidad and tobago 1.03 1.78 1.28
tunisia 1.14 1.01 1.03 1.01 1.02 1.00 1.02 1.01 1.02
uruguay 1.08 1.02 1.01 1.04 1.06 1.03 1.03 1.09 1.11

180 © OECD 2012 – PISA 2009 TECHNICAL REPORT
11Sampling OutcOmeS
[Part 1/1]table 11.13 effective sample size 4 by country, by domain and cycle
PISa 2000 PISa 2003 PISa 2006 PISa 2009
reading mathematics Science reading mathematics Science reading mathematics Science reading mathematics Science
OEC
D australia 4 926 2 534 2 709 12 098 12 339 12 231 13 831 14 010 13 934 14 115 13 884 14 143
austria 4 657 2 630 2 582 4 525 4 485 4 524 4 862 4 796 4 852 6 429 6 428 6 512
Belgium 6 617 3 692 3 702 8 579 8 655 7 911 8 762 8 821 8 762 8 212 8 024 8 055
Canada 29 364 16 041 16 181 26 687 26 790 25 958 22 183 22 498 22 367 22 782 21 517 22 441
Chile 4 815 2 499 2 420 5 162 5 131 5 198 5 466 5 573 5 559
Czech republic 5 251 3 025 2 946 6 053 6 166 5 806 5 859 5 812 5 885 5 829 5 944 5 962
denmark 4 097 2 090 2 292 3 833 3 952 3 872 4 402 4 333 4 380 5 739 5 822 5 489
estonia 4 802 4 806 4 705 4 514 4 564 4 456
Finland 4 697 2 352 2 414 5 412 5 287 5 177 4 540 3 964 4 301 5 736 5 794 5 609
France 4 542 2 373 2 337 4 090 4 143 3 938 4 680 4 532 4 696 4 263 4 197 4 254
germany 4 800 2 738 2 466 4 612 4 648 4 546 4 845 4 799 4 833 4 881 4 740 4 897
greece 4 600 2 516 2 587 4 292 4 567 3 962 4 819 4 783 4 549 4 817 4 858 4 660
hungary 4 870 2 777 2 772 4 604 4 550 4 205 4 286 4 224 4 383 4 602 4 555 4 567
Iceland 2 936 1 527 1 809 2 793 3 113 3 121 2 246 2 444 3 372 3 491 3 086 3 529
Ireland 3 762 2 059 2 119 3 739 3 741 3 577 4 380 4 406 4 323 3 917 3 909 3 801
Israel 4 420 2 454 2 450 4 499 4 446 4 544 5 517 5 698 5 423
Italy 4 822 2 464 2 712 10 650 10 887 11 397 21 390 21 264 21 547 30 037 30 381 29 369
japan 5 227 2 899 2 867 4 483 4 649 4 640 5 818 5 929 5 910 6 038 6 019 5 994
Korea 4 875 2 656 2 561 5 270 5 264 5 354 4 923 5 116 5 047 4 849 4 962 4 734
Luxembourg 2 893 1 713 1 691 2 301 3 804 2 730 3 291 3 542 3 999 3 099 3 070 3 126
mexico 4 489 2 460 2 439 29 508 29 656 26 950 30 236 29 401 30 322 37 516 38 202 36 973
netherlands 2 463 1 334 1 382 3 738 3 917 3 706 4 478 4 652 4 657 4 718 4 735 4 694
new Zealand 3 617 1 908 1 980 4 330 4 120 4 200 4 613 4 542 4 756 4 479 4 463 4 551
norway 4 058 2 042 2 237 3 703 4 019 3 883 4 579 4 535 4 638 4 404 4 501 4 410
Poland 3 575 1 947 1 888 4 194 4 220 4 334 5 452 5 199 5 419 4 778 4 714 4 533
Portugal 4 495 2 497 2 536 4 542 4 597 4 508 4 897 4 809 4 911 6 248 6 144 6 159
Slovak republic 7 317 7 240 7 329 4 576 4 247 4 565 4 435 4 524 4 450
Slovenia 5 322 4 915 6 022 5 557 4 993 5 052
Spain 6 050 3 403 3 420 9 673 10 301 10 228 19 085 17 896 18 461 25 702 24 623 25 368
Sweden 4 059 2 295 2 265 4 362 4 541 3 966 3 906 4 355 4 287 4 478 4 400 4 495
Switzerland 6 070 3 295 3 248 8 230 8 186 8 251 11 903 11 770 12 058 11 593 11 081 11 491
turkey 4 789 4 796 4 787 4 821 4 824 4 927 4 910 4 966 4 921
united Kingdom 9 198 4 968 4 826 8 852 9 164 9 208 12 717 12 823 12 248 12 023 11 925 11 887
united States 3 824 2 119 2 105 4 980 5 081 5 109 5 539 5 590 5 164 5 189 5 151
Part
ners
albania 4 916 2 577 2 403 4 576 4 399 4 526
argentina 3 961 2 201 2 160 4 251 4 252 4 307 4 723 4 743 4 759
azerbaijan 4 890 5 061 5 099 4 512 4 615 4 462
Brazil 4 746 2 544 2 220 4 232 4 357 4 005 8 844 9 086 8 891 20 001 19 763 19 715
Bulgaria 4 601 2 603 2 397 4 471 4 438 4 449 4 450 4 496 4 489
Colombia 4 318 4 421 4 189 7 863 7 658 7 793
Croatia 5 038 5 065 5 069 4 958 4 846 4 870
dubai (uae) 5 334 5 077 4 505
hong Kong-China 4 365 2 358 2 343 4 439 4 275 4 387 4 548 4 485 4 597 4 709 4 773 4 825
Indonesia 7 210 4 006 3 970 10 262 10 566 10 447 10 600 10 457 10 623 5 059 5 061 4 984
jordan 6 088 6 382 6 436 6 459 6 441 6 394
Kazakhstan 5 279 5 220 5 344
Kyrgyzstan 5 754 5 801 5 876 4 947 4 922 4 804
Latvia 3 817 2 054 2 142 4 504 4 524 4 542 4 635 4 679 4 654 4 360 4 449 4 240
Liechtenstein 261 147 169 300 210 238 281 231 266 290 263 282
Lithuania 4 626 4 469 4 695 4 409 4 418 4 426
macao-China 969 1 203 1 089 3 741 3 104 4 276 4 202 5 237 3 483
macedonia 3 939 2 298 2 435
montenegro 3 983 3 478 3 872 4 530 4 442 4 222
Panama 3 866 3 927 3 951
Peru 4 381 2 346 1 944 5 900 5 471 5 424
Qatar 4 236 3 875 5 025 8 963 8 023 5 729
romania 4 611 2 577 2 577 4 966 4 962 5 093 4 770 4 607 4 727
russian Federation 6 622 3 664 3 656 5 849 5 839 5 885 5 604 5 675 5 749 5 202 5 267 5 144
Serbia 4 349 4 259 4 205 4 701 4 575 4 760 5 364 5 496 5 474
Shanghai-China 4 969 5 041 4 853
Singapore 4 652 3 128 3 908
Chinese taipei 8 444 8 699 8 769 5 686 5 788 5 644
thailand 5 267 2 838 2 903 4 690 5 047 4 936 6 000 5 870 6 085 6 119 6 213 6 028
trinidad and tobago 4 617 2 682 3 723
tunisia 4 154 4 669 4 602 4 582 4 536 4 620 4 882 4 886 4 862
uruguay 5 403 5 743 5 777 4 640 4 556 4 689 5 767 5 486 5 348
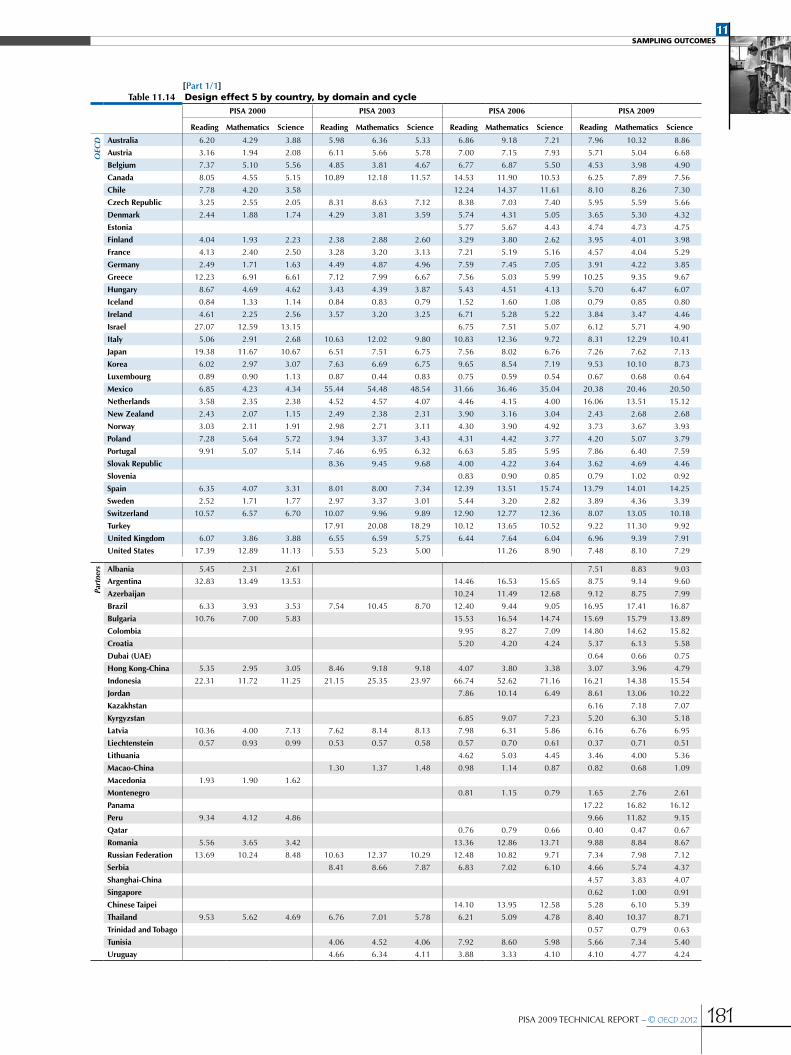
PISA 2009 TECHNICAL REPORT – © OECD 2012 181
11Sampling OutcOmeS
[Part 1/1]table 11.14 design effect 5 by country, by domain and cycle
PISa 2000 PISa 2003 PISa 2006 PISa 2009
reading mathematics Science reading mathematics Science reading mathematics Science reading mathematics Science
OEC
D australia 6.20 4.29 3.88 5.98 6.36 5.33 6.86 9.18 7.21 7.96 10.32 8.86
austria 3.16 1.94 2.08 6.11 5.66 5.78 7.00 7.15 7.93 5.71 5.04 6.68
Belgium 7.37 5.10 5.56 4.85 3.81 4.67 6.77 6.87 5.50 4.53 3.98 4.90
Canada 8.05 4.55 5.15 10.89 12.18 11.57 14.53 11.90 10.53 6.25 7.89 7.56
Chile 7.78 4.20 3.58 12.24 14.37 11.61 8.10 8.26 7.30
Czech republic 3.25 2.55 2.05 8.31 8.63 7.12 8.38 7.03 7.40 5.95 5.59 5.66
denmark 2.44 1.88 1.74 4.29 3.81 3.59 5.74 4.31 5.05 3.65 5.30 4.32
estonia 5.77 5.67 4.43 4.74 4.73 4.75
Finland 4.04 1.93 2.23 2.38 2.88 2.60 3.29 3.80 2.62 3.95 4.01 3.98
France 4.13 2.40 2.50 3.28 3.20 3.13 7.21 5.19 5.16 4.57 4.04 5.29
germany 2.49 1.71 1.63 4.49 4.87 4.96 7.59 7.45 7.05 3.91 4.22 3.85
greece 12.23 6.91 6.61 7.12 7.99 6.67 7.56 5.03 5.99 10.25 9.35 9.67
hungary 8.67 4.69 4.62 3.43 4.39 3.87 5.43 4.51 4.13 5.70 6.47 6.07
Iceland 0.84 1.33 1.14 0.84 0.83 0.79 1.52 1.60 1.08 0.79 0.85 0.80
Ireland 4.61 2.25 2.56 3.57 3.20 3.25 6.71 5.28 5.22 3.84 3.47 4.46
Israel 27.07 12.59 13.15 6.75 7.51 5.07 6.12 5.71 4.90
Italy 5.06 2.91 2.68 10.63 12.02 9.80 10.83 12.36 9.72 8.31 12.29 10.41
japan 19.38 11.67 10.67 6.51 7.51 6.75 7.56 8.02 6.76 7.26 7.62 7.13
Korea 6.02 2.97 3.07 7.63 6.69 6.75 9.65 8.54 7.19 9.53 10.10 8.73
Luxembourg 0.89 0.90 1.13 0.87 0.44 0.83 0.75 0.59 0.54 0.67 0.68 0.64
mexico 6.85 4.23 4.34 55.44 54.48 48.54 31.66 36.46 35.04 20.38 20.46 20.50
netherlands 3.58 2.35 2.38 4.52 4.57 4.07 4.46 4.15 4.00 16.06 13.51 15.12
new Zealand 2.43 2.07 1.15 2.49 2.38 2.31 3.90 3.16 3.04 2.43 2.68 2.68
norway 3.03 2.11 1.91 2.98 2.71 3.11 4.30 3.90 4.92 3.73 3.67 3.93
Poland 7.28 5.64 5.72 3.94 3.37 3.43 4.31 4.42 3.77 4.20 5.07 3.79
Portugal 9.91 5.07 5.14 7.46 6.95 6.32 6.63 5.85 5.95 7.86 6.40 7.59
Slovak republic 8.36 9.45 9.68 4.00 4.22 3.64 3.62 4.69 4.46
Slovenia 0.83 0.90 0.85 0.79 1.02 0.92
Spain 6.35 4.07 3.31 8.01 8.00 7.34 12.39 13.51 15.74 13.79 14.01 14.25
Sweden 2.52 1.71 1.77 2.97 3.37 3.01 5.44 3.20 2.82 3.89 4.36 3.39
Switzerland 10.57 6.57 6.70 10.07 9.96 9.89 12.90 12.77 12.36 8.07 13.05 10.18
turkey 17.91 20.08 18.29 10.12 13.65 10.52 9.22 11.30 9.92
united Kingdom 6.07 3.86 3.88 6.55 6.59 5.75 6.44 7.64 6.04 6.96 9.39 7.91
united States 17.39 12.89 11.13 5.53 5.23 5.00 11.26 8.90 7.48 8.10 7.29
Part
ners
albania 5.45 2.31 2.61 7.51 8.83 9.03
argentina 32.83 13.49 13.53 14.46 16.53 15.65 8.75 9.14 9.60
azerbaijan 10.24 11.49 12.68 9.12 8.75 7.99
Brazil 6.33 3.93 3.53 7.54 10.45 8.70 12.40 9.44 9.05 16.95 17.41 16.87
Bulgaria 10.76 7.00 5.83 15.53 16.54 14.74 15.69 15.79 13.89
Colombia 9.95 8.27 7.09 14.80 14.62 15.82
Croatia 5.20 4.20 4.24 5.37 6.13 5.58
dubai (uae) 0.64 0.66 0.75
hong Kong-China 5.35 2.95 3.05 8.46 9.18 9.18 4.07 3.80 3.38 3.07 3.96 4.79
Indonesia 22.31 11.72 11.25 21.15 25.35 23.97 66.74 52.62 71.16 16.21 14.38 15.54
jordan 7.86 10.14 6.49 8.61 13.06 10.22
Kazakhstan 6.16 7.18 7.07
Kyrgyzstan 6.85 9.07 7.23 5.20 6.30 5.18
Latvia 10.36 4.00 7.13 7.62 8.14 8.13 7.98 6.31 5.86 6.16 6.76 6.95
Liechtenstein 0.57 0.93 0.99 0.53 0.57 0.58 0.57 0.70 0.61 0.37 0.71 0.51
Lithuania 4.62 5.03 4.45 3.46 4.00 5.36
macao-China 1.30 1.37 1.48 0.98 1.14 0.87 0.82 0.68 1.09
macedonia 1.93 1.90 1.62
montenegro 0.81 1.15 0.79 1.65 2.76 2.61
Panama 17.22 16.82 16.12
Peru 9.34 4.12 4.86 9.66 11.82 9.15
Qatar 0.76 0.79 0.66 0.40 0.47 0.67
romania 5.56 3.65 3.42 13.36 12.86 13.71 9.88 8.84 8.67
russian Federation 13.69 10.24 8.48 10.63 12.37 10.29 12.48 10.82 9.71 7.34 7.98 7.12
Serbia 8.41 8.66 7.87 6.83 7.02 6.10 4.66 5.74 4.37
Shanghai-China 4.57 3.83 4.07
Singapore 0.62 1.00 0.91
Chinese taipei 14.10 13.95 12.58 5.28 6.10 5.39
thailand 9.53 5.62 4.69 6.76 7.01 5.78 6.21 5.09 4.78 8.40 10.37 8.71
trinidad and tobago 0.57 0.79 0.63
tunisia 4.06 4.52 4.06 7.92 8.60 5.98 5.66 7.34 5.40
uruguay 4.66 6.34 4.11 3.88 3.33 4.10 4.10 4.77 4.24
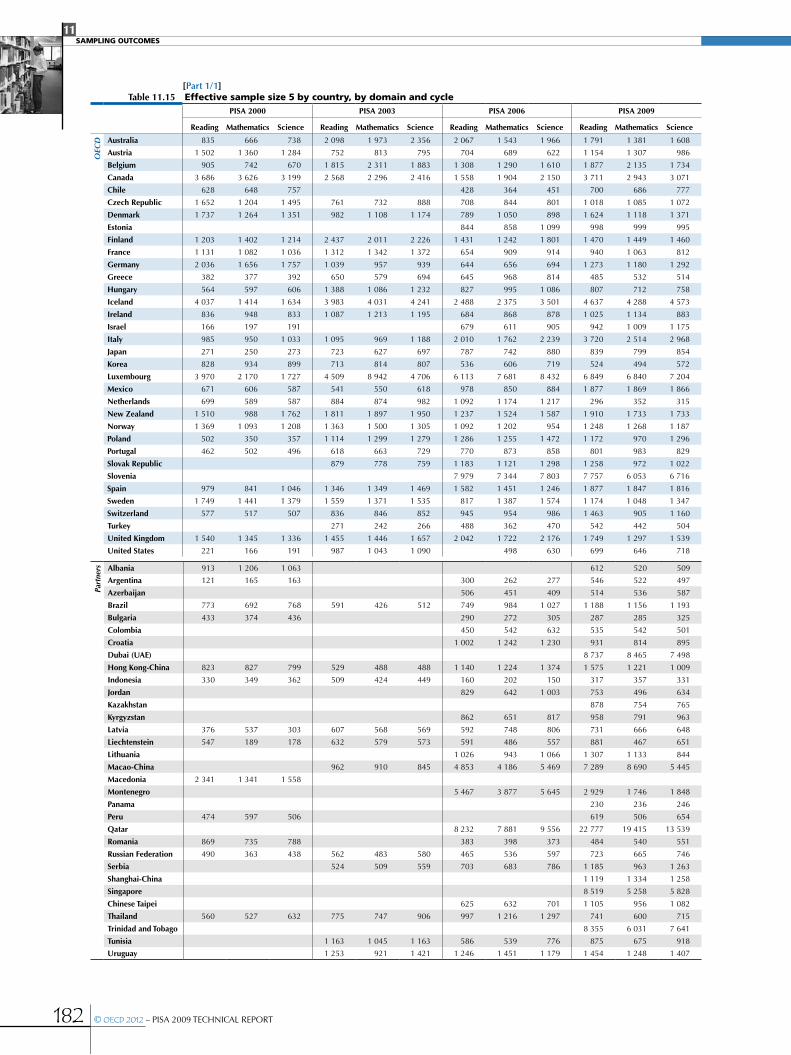
182 © OECD 2012 – PISA 2009 TECHNICAL REPORT
11Sampling OutcOmeS
[Part 1/1]table 11.15 effective sample size 5 by country, by domain and cycle
PISa 2000 PISa 2003 PISa 2006 PISa 2009
reading mathematics Science reading mathematics Science reading mathematics Science reading mathematics Science
OEC
D australia 835 666 738 2 098 1 973 2 356 2 067 1 543 1 966 1 791 1 381 1 608
austria 1 502 1 360 1 284 752 813 795 704 689 622 1 154 1 307 986
Belgium 905 742 670 1 815 2 311 1 883 1 308 1 290 1 610 1 877 2 135 1 734
Canada 3 686 3 626 3 199 2 568 2 296 2 416 1 558 1 904 2 150 3 711 2 943 3 071
Chile 628 648 757 428 364 451 700 686 777
Czech republic 1 652 1 204 1 495 761 732 888 708 844 801 1 018 1 085 1 072
denmark 1 737 1 264 1 351 982 1 108 1 174 789 1 050 898 1 624 1 118 1 371
estonia 844 858 1 099 998 999 995
Finland 1 203 1 402 1 214 2 437 2 011 2 226 1 431 1 242 1 801 1 470 1 449 1 460
France 1 131 1 082 1 036 1 312 1 342 1 372 654 909 914 940 1 063 812
germany 2 036 1 656 1 757 1 039 957 939 644 656 694 1 273 1 180 1 292
greece 382 377 392 650 579 694 645 968 814 485 532 514
hungary 564 597 606 1 388 1 086 1 232 827 995 1 086 807 712 758
Iceland 4 037 1 414 1 634 3 983 4 031 4 241 2 488 2 375 3 501 4 637 4 288 4 573
Ireland 836 948 833 1 087 1 213 1 195 684 868 878 1 025 1 134 883
Israel 166 197 191 679 611 905 942 1 009 1 175
Italy 985 950 1 033 1 095 969 1 188 2 010 1 762 2 239 3 720 2 514 2 968
japan 271 250 273 723 627 697 787 742 880 839 799 854
Korea 828 934 899 713 814 807 536 606 719 524 494 572
Luxembourg 3 970 2 170 1 727 4 509 8 942 4 706 6 113 7 681 8 432 6 849 6 840 7 204
mexico 671 606 587 541 550 618 978 850 884 1 877 1 869 1 866
netherlands 699 589 587 884 874 982 1 092 1 174 1 217 296 352 315
new Zealand 1 510 988 1 762 1 811 1 897 1 950 1 237 1 524 1 587 1 910 1 733 1 733
norway 1 369 1 093 1 208 1 363 1 500 1 305 1 092 1 202 954 1 248 1 268 1 187
Poland 502 350 357 1 114 1 299 1 279 1 286 1 255 1 472 1 172 970 1 296
Portugal 462 502 496 618 663 729 770 873 858 801 983 829
Slovak republic 879 778 759 1 183 1 121 1 298 1 258 972 1 022
Slovenia 7 979 7 344 7 803 7 757 6 053 6 716
Spain 979 841 1 046 1 346 1 349 1 469 1 582 1 451 1 246 1 877 1 847 1 816
Sweden 1 749 1 441 1 379 1 559 1 371 1 535 817 1 387 1 574 1 174 1 048 1 347
Switzerland 577 517 507 836 846 852 945 954 986 1 463 905 1 160
turkey 271 242 266 488 362 470 542 442 504
united Kingdom 1 540 1 345 1 336 1 455 1 446 1 657 2 042 1 722 2 176 1 749 1 297 1 539
united States 221 166 191 987 1 043 1 090 498 630 699 646 718
Part
ners
albania 913 1 206 1 063 612 520 509
argentina 121 165 163 300 262 277 546 522 497
azerbaijan 506 451 409 514 536 587
Brazil 773 692 768 591 426 512 749 984 1 027 1 188 1 156 1 193
Bulgaria 433 374 436 290 272 305 287 285 325
Colombia 450 542 632 535 542 501
Croatia 1 002 1 242 1 230 931 814 895
dubai (uae) 8 737 8 465 7 498
hong Kong-China 823 827 799 529 488 488 1 140 1 224 1 374 1 575 1 221 1 009
Indonesia 330 349 362 509 424 449 160 202 150 317 357 331
jordan 829 642 1 003 753 496 634
Kazakhstan 878 754 765
Kyrgyzstan 862 651 817 958 791 963
Latvia 376 537 303 607 568 569 592 748 806 731 666 648
Liechtenstein 547 189 178 632 579 573 591 486 557 881 467 651
Lithuania 1 026 943 1 066 1 307 1 133 844
macao-China 962 910 845 4 853 4 186 5 469 7 289 8 690 5 445
macedonia 2 341 1 341 1 558
montenegro 5 467 3 877 5 645 2 929 1 746 1 848
Panama 230 236 246
Peru 474 597 506 619 506 654
Qatar 8 232 7 881 9 556 22 777 19 415 13 539
romania 869 735 788 383 398 373 484 540 551
russian Federation 490 363 438 562 483 580 465 536 597 723 665 746
Serbia 524 509 559 703 683 786 1 185 963 1 263
Shanghai-China 1 119 1 334 1 258
Singapore 8 519 5 258 5 828
Chinese taipei 625 632 701 1 105 956 1 082
thailand 560 527 632 775 747 906 997 1 216 1 297 741 600 715
trinidad and tobago 8 355 6 031 7 641
tunisia 1 163 1 045 1 163 586 539 776 875 675 918
uruguay 1 253 921 1 421 1 246 1 451 1 179 1 454 1 248 1 407

PISA 2009 TECHNICAL REPORT – © OECD 2012 183
11Sampling OutcOmeS
SuMMary analySeS oF the deSign eFFectTo better understand the evolution of the design effect for a particular country across the PISA cycles, some information related to the design effects and their respective effective sample sizes are presented in Annex C. In particular, the design effect and the effective sample size depend on:
•the sample size, the number of participating schools, the number of participating students and the average school sample size, which are provided in Table A3.2;
•the school variance, school variance estimates and the intraclass correlation, which are provided respectively in Table A3.3 and Table A3.4; and
•the stratification variables, the intraclass correlation coefficient within explicit strata and the percentage of school variance explained by explicit stratification variables, which are provided respectively in Table A3.5 and Table A3.6.
Finally, the standard errors on the mean performance estimates are provided in Table A3.1.
Table 11.16 to Table 11.21 present the median of the indices presented in Table 11.10 and in Table A3.1 to Table A3.6 by cycle and per domain.
table 11.16 Median of the design effect 3 per cycle and per domain across the 35 countries that participated in every cycle
reading mathematics Science
PISa 2000 5.90 3.68 2.93
PISa 2003 6.02 6.25 5.45
PISa 2006 6.69 6.26 5.63
PISa 2009 5.96 6.40 6.61
In PISA 2000, student performance estimates for a particular domain were only provided for students who responded to testing material from that domain, while for PISA 2003 onwards student proficiency estimates were provided for all domains. For PISA 2000 about five-ninths of the students were assessed in the minor domains (Adams and Wu, 2002). This difference explains why the design effects in mathematics and science for PISA 2000 are so low in comparison with all other design effects.
Table 11.17 presents summary information about the standard errors of national mean achievement across PISA cycles.
table 11.17Median of the standard errors of the student performance mean estimate for each domain and PiSa cyclefor the 35 countries that participated in every cycle
reading mathematics Science
PISa 2000 3.10 3.26 3.18
PISa 2003 2.88 3.00 3.08
PISa 2006 3.18 2.89 2.79
PISa 2009 2.66 2.83 2.80
With the exception of reading literacy in PISA 2006, the standard errors, on average, have decreased between the PISA 2000 and PISA 2009 data collection. This decrease is associated with the continuously increasing school sample size. Note that, generally speaking, the sample size increase in a given country, in PISA 2009 compared with earlier cycles, was intended to provide adequate data for regional or other subgroup estimates. Consequently the reduction in standard error for the national mean achievement was often not particularly great for countries with a noticeable increase in sample size. In other words, the sample size increased, but so did the design effects for the participating countries mean achievement estimates.
This reduction of the standard errors might also be explained by a better efficiency of the explicit stratification variables. Although as can be found in Table 11.22 the median percentage of school variance explained by explicit stratification variables has not consistently risen or fallen over the four cycles.
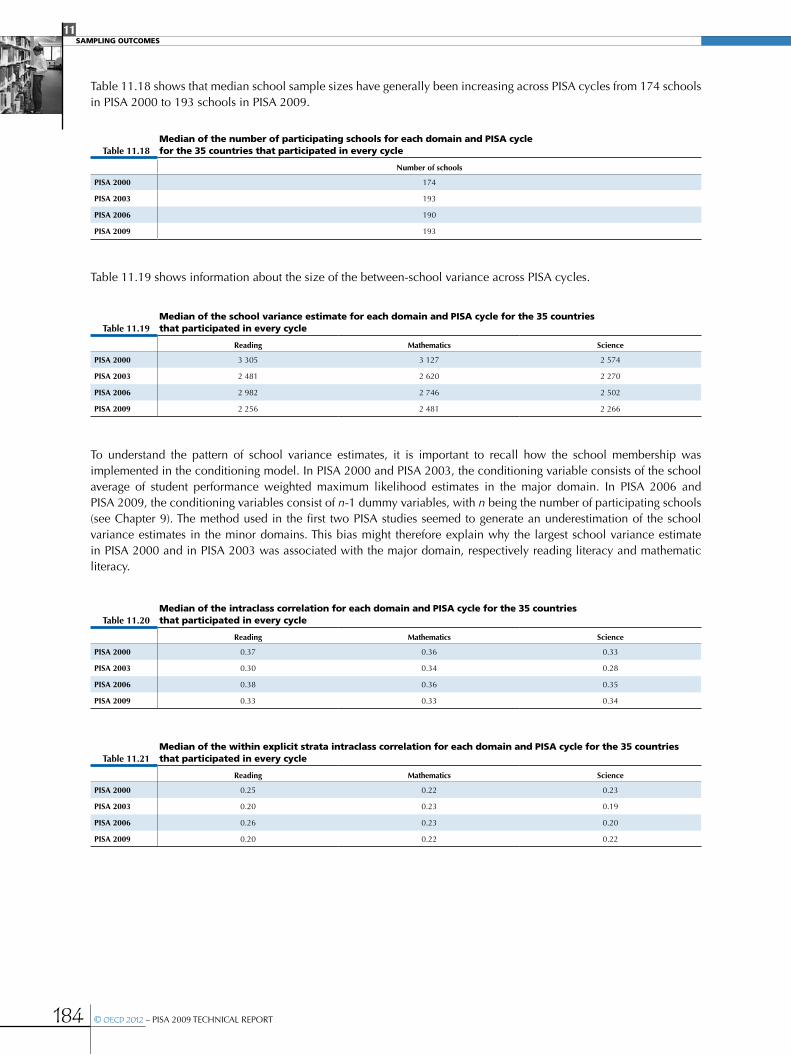
184 © OECD 2012 – PISA 2009 TECHNICAL REPORT
11Sampling OutcOmeS
Table 11.18 shows that median school sample sizes have generally been increasing across PISA cycles from 174 schools in PISA 2000 to 193 schools in PISA 2009.
table 11.18Median of the number of participating schools for each domain and PiSa cyclefor the 35 countries that participated in every cycle
number of schools
PISa 2000 174
PISa 2003 193
PISa 2006 190
PISa 2009 193
Table 11.19 shows information about the size of the between-school variance across PISA cycles.
table 11.19Median of the school variance estimate for each domain and PiSa cycle for the 35 countries that participated in every cycle
reading mathematics Science
PISa 2000 3 305 3 127 2 574
PISa 2003 2 481 2 620 2 270
PISa 2006 2 982 2 746 2 502
PISa 2009 2 256 2 481 2 266
To understand the pattern of school variance estimates, it is important to recall how the school membership was implemented in the conditioning model. In PISA 2000 and PISA 2003, the conditioning variable consists of the school average of student performance weighted maximum likelihood estimates in the major domain. In PISA 2006 and PISA 2009, the conditioning variables consist of n-1 dummy variables, with n being the number of participating schools (see Chapter 9). The method used in the first two PISA studies seemed to generate an underestimation of the school variance estimates in the minor domains. This bias might therefore explain why the largest school variance estimate in PISA 2000 and in PISA 2003 was associated with the major domain, respectively reading literacy and mathematic literacy.
table 11.20Median of the intraclass correlation for each domain and PiSa cycle for the 35 countries that participated in every cycle
reading mathematics Science
PISa 2000 0.37 0.36 0.33
PISa 2003 0.30 0.34 0.28
PISa 2006 0.38 0.36 0.35
PISa 2009 0.33 0.33 0.34
table 11.21Median of the within explicit strata intraclass correlation for each domain and PiSa cycle for the 35 countries that participated in every cycle
reading mathematics Science
PISa 2000 0.25 0.22 0.23
PISa 2003 0.20 0.23 0.19
PISa 2006 0.26 0.23 0.20
PISa 2009 0.20 0.22 0.22

PISA 2009 TECHNICAL REPORT – © OECD 2012 185
11Sampling OutcOmeS
table 11.22Median of the percentages of school variances explained by explicit stratification variables, for each domain and PiSa cycle for the 35 countries that participated in every cycle
reading mathematics Science
PISa 2000 20.1 17.9 18.8
PISa 2003 22.5 21.6 20.5
PISa 2006 33.7 25.6 29.9
PISa 2009 31.2 27.6 30.8
Sampling for the Digital Reading Assessment (DRA) componentNineteen countries and economies participated in DRA: Australia, Austria, Belgium, Chile, Colombia, Denmark, France, Hong Kong-China, Hungary, Iceland, Ireland, Japan, Korea, Macao-China, New Zealand, Norway, Poland, Spain, and Sweden. When a country participated in the DRA option, it was expected that DRA student sampling would occur in every PISA sampled and participating school.
The overall sample size requirement was 1 200 assessed DRA students. The recommended DRA Target Cluster Size (DTCS) was 14 students per sampled school. While 14 students for each of 150 (the typical number of PISA schools) would potentially yield 2 100 students, the large DTCS was chosen to account for the fact that some schools would not have adequate computer resources. The DTCS sample size of 14 also accounted for the loss in the DRA sample that would accrue from prior losses in the PISA sample. It was a requirement that all DRA students also participate in a paper and pencil PISA assessment. The DRA student sample was selected at the same time the PISA student sample was selected in each school by the PISA Consortium sampling software. Therefore, any PISA student also sampled for DRA who did not provide a paper-based PISA assessment was an automatic loss for DRA. In addition, there would be additional loss of students for DRA due to refusals or other absences. It was possible to vary this DRA target cluster size if more than the usual number of schools was sampled for PISA.
The actual DRA student sample size at each school was calculated with KeyQuest, as the minimum of the DTCS, and the number of sampled PISA students. Arrangements had to be made with participating schools to either bring in laptops, or to have extra sessions to alleviate any computer resource problems.
If a participating country had a large PISA school sample and wished to subsample the PISA sampled schools where DRA student sampling would be done, this became an additional national option. Only two DRA countries, Colombia and Spain, chose to have schools subsampled for DRA from their large national school sample.
The schools in Colombia and Spain for DRA were subsampled with equal probability from sampled schools in each explicit stratum. The number to subsample for DRA in each stratum was based on how many schools would have been needed from each explicit stratum for a school sample of 150 schools. Any schools selected with certainty for the large national school sample and placed in their own stratum, were added back to their original strata for the subsampling of DRA schools.
Weighting for DRANo non-response adjustments were made for schools or students sampled for DRA which did not participate. Since DRA was being treated as a domain like mathematics and science, absent DRA students were treated in the same manner as a student not assigned a booklet containing items in the mathematics or science domain. Plausible values were generated for these DRA students, as well as for all other students who had not been subsampled for DRA.
The second level of sampling for DRA for Spain and Colombia needed to be accounted for in weighting, via an additional weight component. Thus, schools subsampled for DRA for Spain and Colombia had their own weighting stream, separate from the weighting stream for the large national samples in these countries. Once in their own weighting stream, weighting procedures for these DRA subsampled schools and students were the same as the weighting procedures used for all countries.

186 © OECD 2012 – PISA 2009 TECHNICAL REPORT
11Sampling OutcOmeS
table 11.23 dra student sampling outcomes
n of students included in dra
database
weighted n of students included in
dra databasen of students
sampled for dra
weighted n of student
sampled for dran of students
participated in dra
weighted n of students
participated in dra
dra student response rate (unweighted)
OEC
D australia 14 251 240 851 3 673 59 464 2 990 49 779 81
austria 6 590 87 326 3 187 43 001 2 622 34 754 82
Belgium 8 501 119 140 3 161 47 254 2 796 41 556 88
Chile 5 669 247 270 2 131 94 433 1 699 75 482 80
Colombia 4 572 515 130 1 957 223 457 1 478 163 491 76
denmark* 5 924 60 854 1 830 19 564 1 270 13 753 69
Spain 4 748 385 725 1 989 165 230 1 681 140 449 85
France 4 298 677 620 1 730 276 591 1 301 207 231 75
hong Kong-China 4 837 75 548 1 661 25 914 1 450 22 682 87
hungary 4 605 105 611 2 022 49 903 1 792 44 398 89
Ireland 3 937 52 794 1 710 22 874 1 407 18 851 82
Israel 3 646 4 410 1 273 1 532 960 1 155 75
japan* 6 088 1 113 403 6 088 1 113 403 3 429 622 985 56
Korea 4 989 630 030 1 508 189 368 1 477 185 078 98
macao-China 5 952 5 978 2 540 2 555 2 519 2 534 99
norway 4 660 57 367 2 268 28 309 1 972 24 268 87
new Zealand 4 643 55 129 2 180 25 953 1 752 21 137 80
Poland 4 917 448 866 2 072 185 403 1 986 177 008 96
Sweden 4 567 113 054 2 249 55 563 1 921 47 350 85
* These countries had lower response rates because of schools that were unable to participate because of technical difficulties.
table 11.24 dra school sampling outcomes
n of schools included in dra
database
weighted n of schools included in
dra databasen of schools
sampled for dra
weighted n of schools
sampled for dran of schools
participated in dra
weighted n of schools
participated in dra
dra school response rate (unweighted)
OEC
D australia 353 2 284 353 2 284 334 2 132 95
austria 282 2 758 273 2 535 256 2 231 94
Belgium 278 1 687 262 1 531 247 1 378 94
Chile 200 4 872 200 4 872 198 4 812 99
Colombia 159 9 411 158 9 393 136 7 942 86
denmark* 285 1 686 285 1 686 220 1 236 77
Spain 168 7 109 168 7 109 163 6 959 97
France 168 11 380 168 11 380 140 8 959 83
hong Kong-China 151 489 151 489 149 483 99
hungary 187 3 496 187 3 496 183 3 371 98
Ireland 144 681 144 681 141 664 98
Israel 131 135 131 135 118 121 90
japan* 186 6 740 186 6 740 109 3 717 59
Korea 157 4 265 157 4 265 156 4 254 99
macao-China 45 45 44 44 44 44 100
norway 197 1 120 197 1 120 180 916 91
new Zealand 163 429 163 429 145 355 89
Poland 185 7 326 179 6 274 179 6 274 100
Sweden 189 1 989 189 1 989 179 1 842 95
* These countries had lower response rates because schools that were unable to participate because of technical difficulties.

12
PISA 2009 TECHNICAL REPORT – © OECD 2012 187
Scaling Outcomes
International characteristics of the item pool .................................................................................... 188
Scaling outcomes ...................................................................................................................................................... 195
Test length analysis .................................................................................................................................................. 199
Booklet effects ............................................................................................................................................................ 203
Observations concerning the construction of the PISA overall literacy scales .............. 213
Transforming the plausible values to PISA scales ........................................................................... 229
Link error ......................................................................................................................................................................... 230
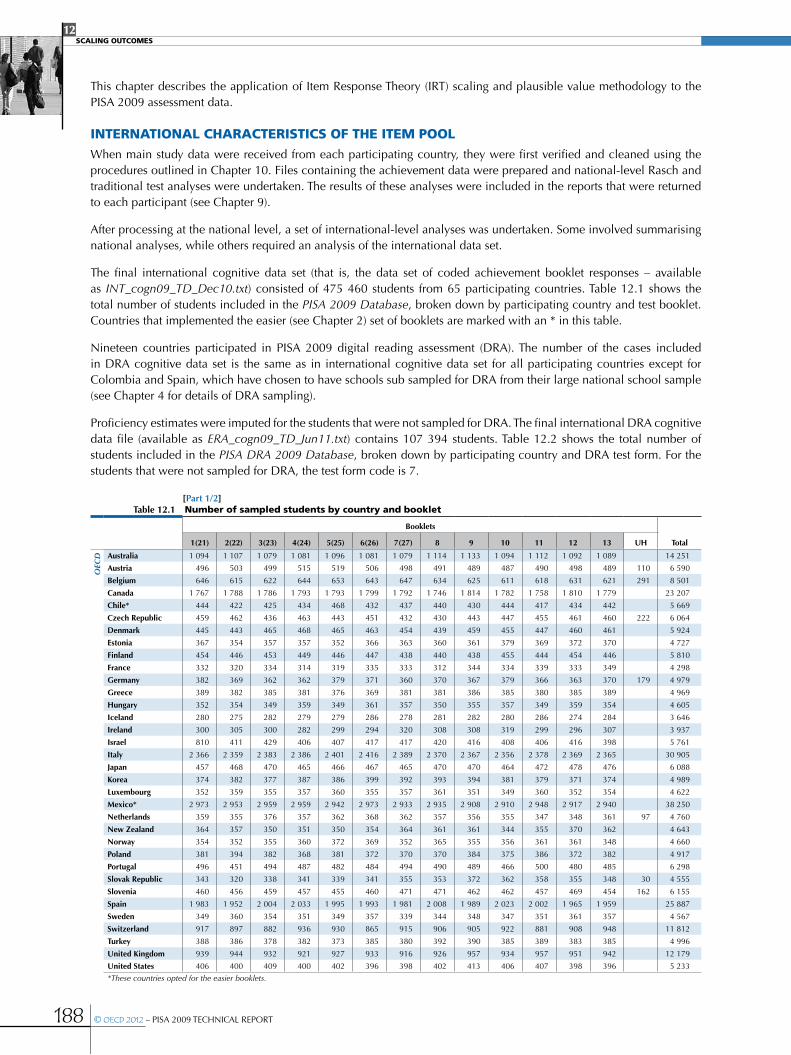
12Scaling OutcOmeS
188 © OECD 2012 – PISA 2009 TECHNICAL REPORT
This chapter describes the application of Item Response Theory (IRT) scaling and plausible value methodology to the PISA 2009 assessment data.
international characteriSticS oF the iteM PoolWhen main study data were received from each participating country, they were first verified and cleaned using the procedures outlined in Chapter 10. Files containing the achievement data were prepared and national-level Rasch and traditional test analyses were undertaken. The results of these analyses were included in the reports that were returned to each participant (see Chapter 9).
After processing at the national level, a set of international-level analyses was undertaken. Some involved summarising national analyses, while others required an analysis of the international data set.
The final international cognitive data set (that is, the data set of coded achievement booklet responses – available as INT_cogn09_TD_Dec10.txt) consisted of 475 460 students from 65 participating countries. Table 12.1 shows the total number of students included in the PISA 2009 Database, broken down by participating country and test booklet. Countries that implemented the easier (see Chapter 2) set of booklets are marked with an * in this table.
Nineteen countries participated in PISA 2009 digital reading assessment (DRA). The number of the cases included in DRA cognitive data set is the same as in international cognitive data set for all participating countries except for Colombia and Spain, which have chosen to have schools sub sampled for DRA from their large national school sample (see Chapter 4 for details of DRA sampling).
Proficiency estimates were imputed for the students that were not sampled for DRA. The final international DRA cognitive data file (available as ERA_cogn09_TD_Jun11.txt) contains 107 394 students. Table 12.2 shows the total number of students included in the PISA DRA 2009 Database, broken down by participating country and DRA test form. For the students that were not sampled for DRA, the test form code is 7.
[Part 1/2]table 12.1 number of sampled students by country and booklet
Booklets
total1(21) 2(22) 3(23) 4(24) 5(25) 6(26) 7(27) 8 9 10 11 12 13 uh
OEC
D australia 1 094 1 107 1 079 1 081 1 096 1 081 1 079 1 114 1 133 1 094 1 112 1 092 1 089 14 251
austria 496 503 499 515 519 506 498 491 489 487 490 498 489 110 6 590
Belgium 646 615 622 644 653 643 647 634 625 611 618 631 621 291 8 501
Canada 1 767 1 788 1 786 1 793 1 793 1 799 1 792 1 746 1 814 1 782 1 758 1 810 1 779 23 207
Chile* 444 422 425 434 468 432 437 440 430 444 417 434 442 5 669
Czech republic 459 462 436 463 443 451 432 430 443 447 455 461 460 222 6 064
denmark 445 443 465 468 465 463 454 439 459 455 447 460 461 5 924
estonia 367 354 357 357 352 366 363 360 361 379 369 372 370 4 727
Finland 454 446 453 449 446 447 438 440 438 455 444 454 446 5 810
France 332 320 334 314 319 335 333 312 344 334 339 333 349 4 298
germany 382 369 362 362 379 371 360 370 367 379 366 363 370 179 4 979
greece 389 382 385 381 376 369 381 381 386 385 380 385 389 4 969
hungary 352 354 349 359 349 361 357 350 355 357 349 359 354 4 605
Iceland 280 275 282 279 279 286 278 281 282 280 286 274 284 3 646
Ireland 300 305 300 282 299 294 320 308 308 319 299 296 307 3 937
Israel 810 411 429 406 407 417 417 420 416 408 406 416 398 5 761
Italy 2 366 2 359 2 383 2 386 2 401 2 416 2 389 2 370 2 367 2 356 2 378 2 369 2 365 30 905
japan 457 468 470 465 466 467 465 470 470 464 472 478 476 6 088
Korea 374 382 377 387 386 399 392 393 394 381 379 371 374 4 989
Luxembourg 352 359 355 357 360 355 357 361 351 349 360 352 354 4 622
mexico* 2 973 2 953 2 959 2 959 2 942 2 973 2 933 2 935 2 908 2 910 2 948 2 917 2 940 38 250
netherlands 359 355 376 357 362 368 362 357 356 355 347 348 361 97 4 760
new Zealand 364 357 350 351 350 354 364 361 361 344 355 370 362 4 643
norway 354 352 355 360 372 369 352 365 355 356 361 361 348 4 660
Poland 381 394 382 368 381 372 370 370 384 375 386 372 382 4 917
Portugal 496 451 494 487 482 484 494 490 489 466 500 480 485 6 298
Slovak republic 343 320 338 341 339 341 355 353 372 362 358 355 348 30 4 555
Slovenia 460 456 459 457 455 460 471 471 462 462 457 469 454 162 6 155
Spain 1 983 1 952 2 004 2 033 1 995 1 993 1 981 2 008 1 989 2 023 2 002 1 965 1 959 25 887
Sweden 349 360 354 351 349 357 339 344 348 347 351 361 357 4 567
Switzerland 917 897 882 936 930 865 915 906 905 922 881 908 948 11 812
turkey 388 386 378 382 373 385 380 392 390 385 389 383 385 4 996
united Kingdom 939 944 932 921 927 933 916 926 957 934 957 951 942 12 179
united States 406 400 409 400 402 396 398 402 413 406 407 398 396 5 233
*These countries opted for the easier booklets.

12Scaling OutcOmeS
PISA 2009 TECHNICAL REPORT – © OECD 2012 189
[Part 2/2]table 12.1 number of sampled students by country and booklet
Booklets
total1(21) 2(22) 3(23) 4(24) 5(25) 6(26) 7(27) 8 9 10 11 12 13 uh
Part
ners
albania* 352 348 352 340 351 358 374 367 362 353 345 343 351 4 596
argentina* 368 374 367 361 344 370 369 362 369 386 358 366 380 4 774
azerbaijan* 354 359 362 367 368 370 375 368 364 359 346 354 345 4 691
Brazil* 1 547 1 576 1 561 1 614 1 523 1 538 1 548 1 537 1 535 1 527 1 536 1 529 1 556 20 127
Bulgaria* 350 350 354 357 349 344 351 347 339 338 337 340 351 4 507
Colombia* 613 611 602 625 604 600 597 592 612 608 627 625 605 7 921
Croatia 374 368 377 383 386 389 388 387 385 400 397 382 378 4 994
dubai (uae)* 411 443 441 444 431 429 438 441 436 432 430 423 421 5 620
hong Kong-China 369 374 376 379 380 372 373 363 364 374 367 373 373 4 837
Indonesia 390 387 382 393 394 391 396 401 398 403 399 402 400 5 136
jordan* 505 512 498 493 503 490 491 491 495 491 496 509 512 6 486
Kazakhstan* 413 409 418 419 415 421 419 427 417 419 406 406 423 5 412
Kyrgyzstan* 397 390 390 381 377 373 379 382 386 377 386 386 382 4 986
Latvia 355 351 354 343 358 342 340 351 340 342 350 333 343 4 502
Liechtenstein 23 24 23 33 25 14 28 23 27 23 27 28 31 329
Lithuania 363 345 356 338 354 336 352 338 343 344 351 350 358 4 528
macao-China 457 460 456 459 457 459 457 457 459 457 455 457 462 5 952
montenegro 367 369 372 360 373 383 375 376 376 368 371 379 356 4 825
Panama* 299 308 312 297 307 303 312 312 302 306 302 302 307 3 969
Peru* 465 472 458 474 459 456 443 449 459 454 465 470 461 5 985
Qatar* 696 681 699 706 713 707 701 696 697 699 702 688 693 9 078
romania* 368 359 359 355 358 372 374 378 373 374 372 364 370 4 776
russian Federation 406 414 415 409 409 410 409 402 398 403 412 413 408 5 308
Serbia* 417 426 434 434 439 426 429 430 416 422 417 415 418 5 523
Shanghai-China 400 398 397 388 386 392 387 391 385 394 398 404 395 5 115
Singapore 412 405 402 408 408 416 413 410 404 401 394 406 404 5 283
Chinese taipei 445 445 447 452 451 438 452 452 448 441 450 449 461 5 831
thailand 489 486 475 478 476 476 480 483 473 471 473 478 487 6 225
trinidad and tobago* 369 351 355 364 359 368 358 366 380 377 379 384 368 4 778
tunisia* 381 377 394 370 382 368 376 382 384 384 389 382 386 4 955
uruguay* 464 455 452 454 456 460 467 449 458 453 467 466 456 5 957
table 12.2 number of sampled students by country and dra test form codeBooklets
total sampled students total not-sampled students1 2 3 4 5 6
OEC
D australia 496 520 505 495 483 494 2 993 11 258
austria 454 450 437 417 426 447 2 631 3 959
Belgium 485 474 448 457 475 469 2 808 5 693
Chile 297 288 278 274 280 287 1 704 3 965
denmark 220 208 198 210 208 226 1 270 4 654
France 216 203 221 213 228 224 1 305 2 993
hungary 311 298 286 302 298 298 1 793 2 812
Ireland 249 233 239 219 236 233 1 409 2 528
Israel 155 159 163 165 164 156 962 2 684
japan 582 575 570 577 575 550 3 429 2 659
Korea 255 247 249 239 237 250 1 477 3 512
new Zealand 296 292 301 286 286 294 1 755 2 888
norway 338 329 310 326 340 331 1 974 2 686
Poland 350 347 321 326 314 330 1 988 2 929
Spain 283 277 269 291 285 284 1 689 3 059
Sweden 336 308 313 323 328 313 1 921 2 646
Part
ners Colombia 496 520 505 495 483 494 2 993 11 258
hong Kong-China 454 450 437 417 426 447 2 631 3 959
macao-China 485 474 448 457 475 469 2 808 5 693
Test targetingEach of the domains was separately scaled to examine the targeting of the tests. Figures 12.1 to 12.4 show the match between the international (OECD countries only) item difficulty distribution and the distribution of OECD’s student achievement for each of reading, mathematics, science and DRA respectively. The figures consist of two panels. The first panel (students) shows the distribution of students’ Rasch-scaled achievement estimates. Students at the top end of this distribution have higher proficiency estimates than the students at the lower end of the distribution. The second panel (item difficulties) shows the distribution of Rasch-estimated item difficulties.
A corrigendum has been issued for this page. See http://www.oecd.org/about/publishing/Corrigendum_PISA-2009-Technical-Report.pdf

12Scaling OutcOmeS
190 © OECD 2012 – PISA 2009 TECHNICAL REPORT
Students Item difficulties----------------------------------------- | 3 | |19 | X| | XX| XX| 2 X|11 21 XX| XXX| XXXX|5 XXXX|22 XXXXX|10 33 1 XXXXXX|36 XXXXX|34 XXXXXX|31 XXXXXX|17 XXXXXXX|2 7 12 XXXXXXXX|14 30 0 XXXXXXXXXX|13 27 28 29 XXXXXXXX|15 XXXXXXXXX|6 8 24 XXXXXXXX|35 XXXXXXXX|4 XXXXXXXX|26 -1 XXXXXXXXX|3 20 25 XXXXXX|18 XXXXXXX| XXXX|23 XXXX|1 XXXXX|16 -2 XXX| XXX| XX| XX| X|32 X| -3 X| X| | | | | -4 | ==========================================Each “X” represents 1807.6 cases
• Figure 12.1 •item plot for mathematics items
Test is well targeted if the average of item difficulties is about the same as the average of the students’ abilities and the item difficulties are evenly spread across the ability distribution.
In each of the Figures 12.1 to 12.4, the student proficiency distribution shown by Xs1 is well matched to the item difficulty distribution. The figures are constructed so that when a student and an item are located at the same location on the scale then the student has a 50% chance of responding correctly to the item.

12Scaling OutcOmeS
PISA 2009 TECHNICAL REPORT – © OECD 2012 191
Students Item difficulties------------------------------------------ 4 | | | | | X| 3 X| X|76 103 X|132 XX| XXX|22 87 XX| XXXX| 2 XXXXX|91 114 XXXXXX| XXXXXX| XXXXXXX|17 46 50 XXXXXXXX|21 59 90 111 XXXXXXXXX|24 48 54 55 92 1 XXXXXXXXX|29 47 68 XXXXXXXXX|16 25 56 65 79 106 131 XXXXXXXXXX|18 45 102 105 129 XXXXXXXXXX|2 12 60 118 126 XXXXXXXXXX|57 61 85 86 100 120 124 XXXXXXXXXX|6 8 34 35 36 53 119 128 0 XXXXXXXX|3 14 31 58 123 XXXXXXXXX|30 99 104 108 109 113 XXXXXXXX|7 11 23 38 39 49 67 69 84 XXXXX|33 78 88 121 130 XXXXXX|71 75 89 96 110 XXXXX|4 37 44 51 83 -1 XXXXXX|10 15 62 66 70 81 93 98 101 XXXXX|43 73 112 125 133 XXX|9 20 32 107 116 117 122 XXX|1 13 19 28 63 72 77 XX|40 41 52 64 74 XX| -2 XX|95 X|5 94 X|80 X|97 |42 127 |82 -3 | X| | |115 | | | -4 | ==========================================Each “X” represents 1636.8 cases
• Figure 12.2 •item plot for reading items

12Scaling OutcOmeS
192 © OECD 2012 – PISA 2009 TECHNICAL REPORT
Students Item difficulties-----------------------------------------
|
3 |
|
|
X|
|
X|
XX|
2 X|51
XX|
XXX|
XXXX|10
XXXX|2 23
XXXXX|48
XXXXXX|12
1 XXXXX|6
XXXXXXX|30 33 41
XXXXXXX|17
XXXXXXX|5 15 22 37 40 46
XXXXXXXX|14 21 27
XXXXXXXXXX|1 31 44
XXXXXXXX|
0 XXXXXXXXX|13 35 38 47 53
XXXXXXXX|4 45 49
XXXXXXXX|7 9 11 20 25 32 42 52
XXXXXXXX|
XXXXXXXXX|8 29
XXXXXX|16 24 39
XXXXXXX|
-1 XXXX|19 26 36
XXXX|34
XXXXX|18
XXX|
XXX|
XX|28
XX|
-2 X|43
X|3
X|50
X|
X|
|
|
-3 |
|
==========================================
Each “X” represents 1834.8 cases
• Figure 12.3 •item plot for science items

12Scaling OutcOmeS
PISA 2009 TECHNICAL REPORT – © OECD 2012 193
Students Item difficulties-----------------------------------------
|
|
X|
3 X|
X|
XX|
X|
XX|29
XX|
XXXX|
2 XXXX|
XXXXX|9
XXXXXXX|
XXXXXX|
XXXXXX|
XXXXXXX|
1 XXXXXXXX|22
XXXXXXXXX|8
XXXXXXXXXX|15 19 20 25
XXXXXXXX|3 7 18
XXXXXXXXX|14 23
XXXXXXXX|
XXXXXXXXX|26
0 XXXXXXXXX|
XXXXXXXX|10 17 21 28
XXXXXXX|12
XXXXXXX|6 13 16
XXXX|27
XXXX|
XXXXX|5 11
-1 XXX|
XX|
XX|2
XX|4
X|
X|24
X|
-2 X|
|
X|
|
|1
|
-3 |
|
|
==========================================
Each “X” represents 636.4 cases
• Figure 12.4 •item plot for dra items
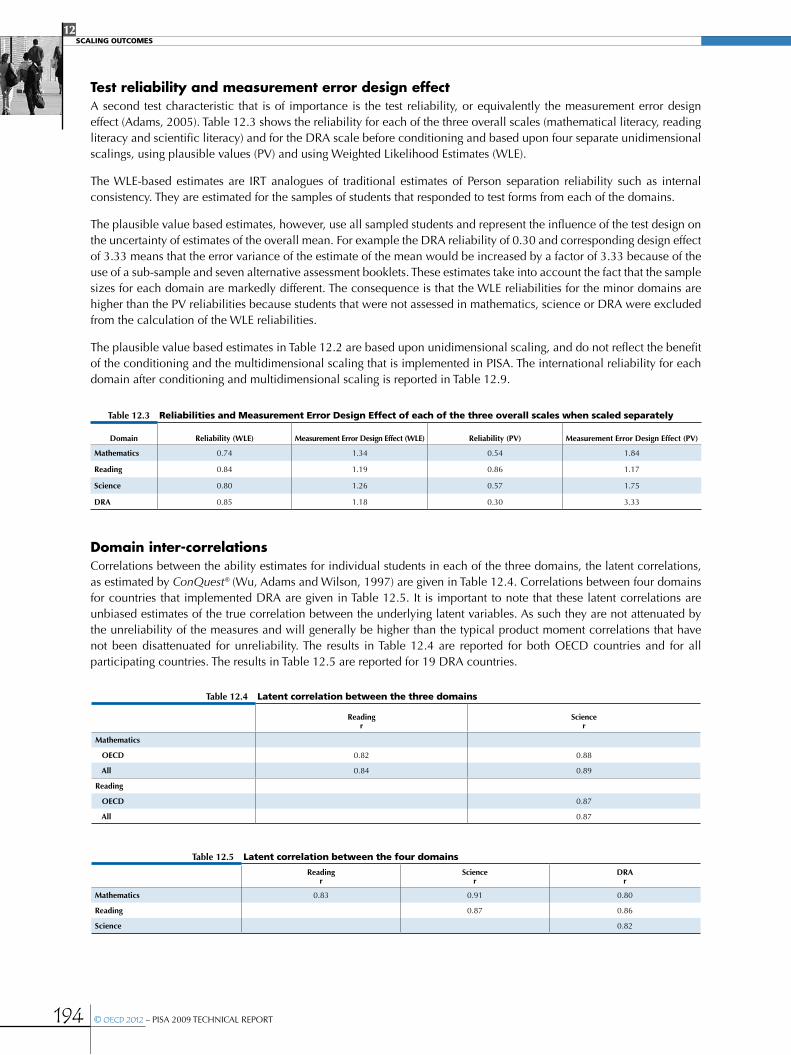
12Scaling OutcOmeS
194 © OECD 2012 – PISA 2009 TECHNICAL REPORT
Test reliability and measurement error design effectA second test characteristic that is of importance is the test reliability, or equivalently the measurement error design effect (Adams, 2005). Table 12.3 shows the reliability for each of the three overall scales (mathematical literacy, reading literacy and scientific literacy) and for the DRA scale before conditioning and based upon four separate unidimensional scalings, using plausible values (PV) and using Weighted Likelihood Estimates (WLE).
The WLE-based estimates are IRT analogues of traditional estimates of Person separation reliability such as internal consistency. They are estimated for the samples of students that responded to test forms from each of the domains.
The plausible value based estimates, however, use all sampled students and represent the influence of the test design on the uncertainty of estimates of the overall mean. For example the DRA reliability of 0.30 and corresponding design effect of 3.33 means that the error variance of the estimate of the mean would be increased by a factor of 3.33 because of the use of a sub-sample and seven alternative assessment booklets. These estimates take into account the fact that the sample sizes for each domain are markedly different. The consequence is that the WLE reliabilities for the minor domains are higher than the PV reliabilities because students that were not assessed in mathematics, science or DRA were excluded from the calculation of the WLE reliabilities.
The plausible value based estimates in Table 12.2 are based upon unidimensional scaling, and do not reflect the benefit of the conditioning and the multidimensional scaling that is implemented in PISA. The international reliability for each domain after conditioning and multidimensional scaling is reported in Table 12.9.
table 12.3 reliabilities and Measurement error design effect of each of the three overall scales when scaled separately
domain reliability (wLe) measurement error design effect (wLe) reliability (Pv) measurement error design effect (Pv)
mathematics 0.74 1.34 0.54 1.84
reading 0.84 1.19 0.86 1.17
Science 0.80 1.26 0.57 1.75
dra 0.85 1.18 0.30 3.33
Domain inter-correlationsCorrelations between the ability estimates for individual students in each of the three domains, the latent correlations, as estimated by ConQuest® (Wu, Adams and Wilson, 1997) are given in Table 12.4. Correlations between four domains for countries that implemented DRA are given in Table 12.5. It is important to note that these latent correlations are unbiased estimates of the true correlation between the underlying latent variables. As such they are not attenuated by the unreliability of the measures and will generally be higher than the typical product moment correlations that have not been disattenuated for unreliability. The results in Table 12.4 are reported for both OECD countries and for all participating countries. The results in Table 12.5 are reported for 19 DRA countries.
table 12.4 latent correlation between the three domains
readingr
Sciencer
mathematics
oeCd 0.82 0.88
all 0.84 0.89
reading
oeCd 0.87
all 0.87
table 12.5 latent correlation between the four domains
readingr
Sciencer
drar
mathematics 0.83 0.91 0.80
reading 0.87 0.86
Science 0.82

12Scaling OutcOmeS
PISA 2009 TECHNICAL REPORT – © OECD 2012 195
Reading scalesAs described in Chapter 9, a five-dimensional model consisting of mathematics, science, and the three reading aspect scales: access and retrieve, integrate and interpret, reflect and evaluate was used, Then a four-dimensional model was estimated consisting of mathematics, science, and the two reading text format scales: continuous text and non-continuous text. Responses from the mathematics and science domains were included in the scaling model to improve the estimation of posterior distributions of the reading scales. The plausible values for mathematics and science generated using these two models were not included in the international database. The correlations between reading subscales as estimated from these two models are given in Table 12.6 and Table 12.7.
table 12.6 latent correlation between the aspect reading scales
Integrate and interpretr
reflect and evaluater
access and retrieve
oeCd 0.93 0.90
all 0.96 0.93
Integrate and interpret
oeCd 0.94
all 0.95
table 12.7 latent correlation between text format reading scales
non-continuous text r
Continuous text
oeCd 0.93
all 0.95
Scaling outcoMeSThe procedures for the national and international scaling are outlined in Chapter 9 and are not reiterated here.
National item deletionsThe items were first scaled by country and their fit was considered at the national level, as was the consistency of the item parameter estimates across countries. Consortium staff then adjudicated items, considering the items’ functioning both within and across countries in detail. Those items considered to be dodgy (see Chapter 9) were then reviewed in consultation with National Project Managers (NPMs). The consultations resulted in the deletion of a number of items at the national level.
At the international level, two reading items (R219Q01E and R219Q01T) and one mathematics item (M305Q01) were deleted from scaling. R219Q01E and R219Q01T were deleted because of data entry errors and M305Q01was deleted because instruction to have a rule was not included in the booklets. The nationally deleted items are listed in Table 12.8. All deleted items were recoded as not applicable and were excluded from both international scaling and generating plausible values.

12Scaling OutcOmeS
196 © OECD 2012 – PISA 2009 TECHNICAL REPORT
[Part 1/2]table 12.8 items deleted at the national level
Item Country
M033Q01 Hungary (booklet 8), Serbia
M155Q01 Peru, Dubai (UAE) (Arabic-language version)
M305Q01 International Deletion
M406Q01 Israel (booklet 7 of Arabic-language version)
M408Q01T Denmark
M442Q02 Belgium (booklet 5 of Dutch-language version), Spain (Euskara-language version), Poland (booklet 1), Dubai (UAE) (Arabic-language version),Qatar (Arabic-language version)
M474Q01 Hong Kong-China (Cantonese-language version)
M571Q01 Greece (booklet 10)
M603Q01T Belgium (Dutch-language version)
M828Q01 Israel (Hebrew-language version), Dubai (UAE) (Arabic-language version)
M828Q03 Indonesia
R055Q01 Hungary, Serbia (Serbian-language version)
R067Q01 Switzerland (booklet 2 of Italian-language version)
R067Q04 Switzerland (booklet 2 of Italian-language version)
R067Q05 Switzerland (booklet 2 of Italian-language version), Chile
R083Q01 Hungary
R101Q05 Iceland (booklet 5)
R102Q04A Argentina
R102Q05 Argentina, Hong Kong-China (Cantonese-language version), Macao-China (Cantonese-language version), Mexico (booklet 13),Montenegro (Serbian/variant of Montenegrin-language version), Shanghai-China, Serbia (Serbian-language version), Chinese Taipei
R104Q01 Ireland (booklet 11 of English-language version)
R104Q02 Lithuania (Lithuanian-language version), Montenegro (Serbian/variant of Montenegrin, All)
R111Q02B Qatar (booklet 8 of Arabic-language version)
R111Q06B Peru (booklet 24)
R219Q01E International Deletion
R219Q01T International Deletion
R220Q02B Brazil, Switzerland (booklet 9 Italian-language version ), Indonesia (booklet 9), Japan, Peru
R220Q04 Hungary, Indonesia (booklets 1 and 9)
R220Q05 Bulgaria (booklet 13), Spain (Catalan-language version), Portugal (booklets 2 and 13 of Portuguese-language version)
R220Q06 Estonia (Russian-language version)
R227Q01 Montenegro (Serbian/variant of Montenegrin-language version)
R227Q02 Azerbaijan (booklet 11 of Azerbaijani), Finland, Israel (Arabic-language version), Montenegro (Serbian/variant of Montenegrin-language version)
R227Q03 Israel (Arabic-language version), Montenegro (Serbian/variant of Montenegrin-language version)
R227Q06 Kazakhstan (Russian-language version), Dubai (UAE) (Arabic-language version)
R245Q01 Greece, Israel (booklet 5 of Arabic-language version), Slovak Republic (Hungarian-language version)
R245Q02 Iceland, Israel (booklet 5 of Arabic-language version)
R412Q05 Dubai (UAE) (Arabic-language version)
R412Q06T Chile
R414Q02 Poland
R414Q09 Switzerland (booklets 4 and 6 of French-language version)
R420Q09 Estonia (Estonian-language version)
R420Q10 Japan (booklet 6)
R424Q02T Argentina, Montenegro (Serbian/variant of Montenegrin-language version)
R432Q05 Turkey (booklet 2)
R432Q06T Ireland, Kazakhstan (booklet 12 of Russian-language version), Lithuania, Singapore
R433Q02 Chile

12Scaling OutcOmeS
PISA 2009 TECHNICAL REPORT – © OECD 2012 197
[Part 2/2]table 12.8 items deleted at the national level
Item Country
R437Q01 Brazil
R437Q06 Hungary
R437Q07 Chile
R442Q06 Israel (booklet 7 of Arabic-language version)
R442Q07 Hungary (booklet 5)
R445Q03 Romania (all booklets of Hungarian-language version)
R452Q06 Austria
R453Q01 Argentina, Qatar
R453Q04 Argentina
R453Q05T Argentina
R453Q06 Argentina, Iceland
R455Q03 Greece
R455Q05T Austria (German-language version), Belgium (German-language version), Switzerland (German-language version),Germany, Italy (German-language version), Luxembourg (German-language version)
R462Q02 Serbia (booklets 22 and 24 of Serbian-language version)
R462Q04 Serbia (booklet 24 of Serbian-language version)
R462Q05 Serbia (booklet 24 of Serbian-language version)
R466Q03T Albania, Poland, Serbia (booklet 26 of Serbian-language version), Trinidad and Tobago (booklet 22), Tunisia
R466Q06 Argentina (booklets 11 and 12), Qatar (booklet 26 of English-language version), Serbia (Hungarian-language version), Trinidad and Tobago (booklet 22)
S326Q03 Croatia
S413Q04T Colombia
S425Q02 Tunisia (booklet 23 of Arabic-language version)
S425Q05 Croatia
S438Q03D Israel (Arabic-language version)
S465Q01 Spain (Euskara-language version)
S466Q05 Peru (booklet 24)
S478Q01 Dubai (UAE) (Arabic-language version)
S478Q02T Dubai (UAE) (Arabic-language version), Uruguay (booklet 12)
S498Q04 Peru (booklet 13)
S519Q01 Peru
S519Q03 Israel (Hebrew-language version)
S527Q04T Macao-China (Cantonese-language version)
E002Q01 Sweden
E017Q01 Norway
E017Q07 Iceland
E021Q05 Sweden
E021Q08 Iceland
International scalingThe international scaling for mathematics, science and paper-based reading items were performed using a calibration data set of 15 500 students (500 randomly selected students from each of the 31 OECD countries). For the estimation of non-standard reading international item parameters a calibration sample of 24 500 students was used. This calibration sample included 500 students from all OECD countries and 500 students from 20 countries that administered the non-standard test.
The item parameter estimates from this scaling are reported in Annex A. The item parameters were estimated using three separate one-dimensional models. As in previous cycles, not-reached items were treated as not administered and a booklet facet was used in the item response model.

12Scaling OutcOmeS
198 © OECD 2012 – PISA 2009 TECHNICAL REPORT
[Part 1/2]table 12.10 national reliabilities of the PiSa scales
mathematics reading Scienceaccess and
retrieveIntegrate and
interpretreflect and
evaluateContinuous
text non-continuous
text dra
OEC
D australia 0.88 0.93 0.91 0.91 0.93 0.92 0.92 0.90 0.91
austria 0.89 0.93 0.92 0.91 0.92 0.93 0.92 0.91 0.93
Belgium 0.92 0.94 0.93 0.92 0.93 0.92 0.93 0.93 0.93
Canada 0.87 0.91 0.89 0.90 0.91 0.90 0.90 0.89 0.89
Chile 0.87 0.90 0.86 0.87 0.89 0.88 0.88 0.88
Czech republic 0.89 0.92 0.89 0.91 0.92 0.91 0.91 0.92
denmark 0.86 0.91 0.90 0.90 0.91 0.91 0.90 0.88 0.93
estonia 0.86 0.91 0.87 0.89 0.90 0.90 0.90 0.89
Finland 0.83 0.90 0.87 0.88 0.89 0.89 0.89 0.88
France 0.89 0.94 0.91 0.92 0.93 0.92 0.93 0.91 0.94
germany 0.91 0.92 0.92 0.92 0.92 0.93 0.91 0.91
greece 0.84 0.91 0.86 0.89 0.89 0.89 0.90 0.89
hungary 0.91 0.93 0.92 0.91 0.92 0.91 0.92 0.92 0.92
Iceland 0.87 0.92 0.90 0.90 0.91 0.91 0.91 0.90 0.90
Ireland 0.90 0.93 0.91 0.93 0.93 0.92 0.92 0.91 0.89
Israel 0.89 0.93 0.89 0.94 0.92 0.93 0.92 0.91
Italy 0.89 0.93 0.90 0.91 0.92 0.92 0.92 0.91
japan 0.89 0.92 0.91 0.91 0.91 0.89 0.91 0.90 0.84
Korea 0.87 0.91 0.90 0.91 0.90 0.89 0.89 0.90 0.87
Luxembourg 0.87 0.93 0.90 0.90 0.92 0.91 0.92 0.92
mexico 0.88 0.91 0.87 0.90 0.90 0.90 0.90 0.90
netherlands 0.91 0.93 0.92 0.92 0.93 0.93 0.92 0.92
new Zealand 0.89 0.94 0.92 0.92 0.93 0.92 0.93 0.92 0.90
norway 0.86 0.92 0.88 0.90 0.90 0.90 0.91 0.89 0.86
Poland 0.88 0.92 0.88 0.89 0.91 0.90 0.90 0.89 0.90
Portugal 0.88 0.91 0.87 0.89 0.90 0.90 0.90 0.88
Slovak republic 0.89 0.93 0.89 0.92 0.91 0.92 0.91 0.92
Slovenia 0.89 0.93 0.90 0.93 0.93 0.92 0.92 0.92
Spain 0.89 0.92 0.90 0.90 0.92 0.91 0.91 0.91 0.89
Sweden 0.87 0.92 0.89 0.91 0.91 0.92 0.91 0.90 0.90
Switzerland 0.88 0.92 0.89 0.90 0.91 0.91 0.91 0.90
turkey 0.90 0.91 0.87 0.90 0.90 0.88 0.90 0.89
united Kingdom 0.88 0.92 0.91 0.91 0.92 0.90 0.92 0.89
united States 0.88 0.92 0.91 0.91 0.92 0.91 0.91 0.91
The international scaling for DRA items was performed using calibration data set of 4 370 students (230 randomly selected students from each of the 19 participating countries). The item parameter estimates from this scaling are reported in Annex A.
Generating student scale scores and reliability of the PISA scalesApplying the conditioning approach described in Chapter 9 and anchoring all of the item parameters at the values obtained from the international scaling, plausible values were generated for all sampled students. Table 12.9 gives the reliabilities at the international level for the generated scale scores. The increase in reliability of the results reported in Table 12.9 over those presented in Table 12.3 is due to the use of multidimensional scaling and conditioning.
Table 12.10 gives the reliabilities at the national level for the generated scale scores.
table 12.9 Final reliabilities of the PiSa scalesdomain reliability
mathematics 0.882
reading 0.921
Science 0.896
access and retrieve 0.907
Integrate and interpret 0.913
reflect and evaluate 0.909
Continuous text 0.911
non-continuous text 0.903
dra 0.900

12Scaling OutcOmeS
PISA 2009 TECHNICAL REPORT – © OECD 2012 199
[Part 2/2]table 12.10 national reliabilities of the PiSa scales
mathematics reading Scienceaccess and
retrieveIntegrate and
interpretreflect and
evaluateContinuous
text non-continuous
text dra
Part
ners albania 0.84 0.92 0.87 0.91 0.90 0.90 0.91 0.90
argentina 0.88 0.92 0.89 0.91 0.92 0.91 0.91 0.91
azerbaijan 0.77 0.86 0.79 0.87 0.84 0.84 0.86 0.84
Brazil 0.90 0.91 0.89 0.91 0.91 0.91 0.91 0.92
Bulgaria 0.88 0.94 0.89 0.92 0.93 0.91 0.93 0.93
Colombia 0.86 0.90 0.85 0.89 0.89 0.89 0.89 0.90 0.90
Croatia 0.89 0.92 0.89 0.91 0.92 0.91 0.91 0.91
dubai (uae) 0.88 0.93 0.90 0.93 0.92 0.92 0.92 0.92
hong Kong-China 0.88 0.91 0.89 0.91 0.90 0.90 0.90 0.90 0.87
Indonesia 0.80 0.86 0.81 0.88 0.84 0.81 0.85 0.82
jordan 0.88 0.91 0.86 0.91 0.91 0.90 0.88 0.87
Kazakhstan 0.85 0.91 0.85 0.90 0.90 0.90 0.87 0.87
Kyrgyzstan 0.82 0.90 0.82 0.89 0.88 0.88 0.89 0.88
Latvia 0.86 0.91 0.87 0.91 0.89 0.89 0.89 0.91
Liechtenstein 0.91 0.93 0.92 0.93 0.92 0.93 0.92 0.92
Lithuania 0.89 0.92 0.89 0.92 0.91 0.92 0.91 0.90
macao-China 0.82 0.89 0.83 0.87 0.87 0.86 0.87 0.84 0.79
montenegro 0.85 0.91 0.84 0.89 0.90 0.88 0.89 0.88
Panama 0.89 0.92 0.87 0.91 0.91 0.90 0.91 0.91
Peru 0.86 0.91 0.83 0.89 0.90 0.90 0.90 0.90
Qatar 0.87 0.93 0.89 0.93 0.92 0.91 0.92 0.92
romania 0.86 0.92 0.87 0.92 0.91 0.91 0.90 0.91
russian Federation 0.86 0.91 0.85 0.90 0.90 0.90 0.90 0.89
Serbia 0.86 0.91 0.87 0.90 0.90 0.89 0.89 0.90
Shanghai-China 0.86 0.89 0.86 0.88 0.89 0.89 0.89 0.87
Singapore 0.89 0.93 0.91 0.89 0.92 0.91 0.93 0.91
Chinese taipei 0.88 0.91 0.89 0.90 0.91 0.90 0.91 0.89
thailand 0.84 0.89 0.84 0.87 0.88 0.88 0.89 0.88
trinidad and tobago 0.89 0.93 0.89 0.92 0.92 0.93 0.92 0.92
tunisia 0.82 0.89 0.83 0.89 0.87 0.88 0.88 0.87
uruguay 0.86 0.91 0.85 0.89 0.91 0.89 0.90 0.89
teSt length analySiS
Numbers of missing and non reached responses are discussed in this section. A response is coded as missing if the student was expected to answer a question, but no response was actually provided. All consecutive missing values clustered at the end of a test session were replaced by the non-reached code, except for the first value of the missing series, which is coded as missing (see Chapter 18). All the tables included in the section include weighted and unweighted numbers of the missing and not-reached responses. Final student weight (see Chapter 8) was used to provide weighted numbers and percents.
Table 12.11 shows the number of missing responses and the number of missing responses recoded as not reached, by booklet. Table 12.12 shows the number of missing and not-reached responses by DRA test form.

12Scaling OutcOmeS
200 © OECD 2012 – PISA 2009 TECHNICAL REPORT
table 12.11 average number of not-reached items and missing items by booklet
Bookletmissing not reached
weighted unweighted weighted unweighted
1 5.05 5.26 0.76 0.69
2 3.91 3.98 1.39 1.09
3 4.56 4.98 1.26 1.10
4 4.27 4.65 1.81 1.36
5 4.57 4.79 0.82 0.64
6 3.38 3.55 1.21 0.85
7 4.48 4.72 1.38 1.24
8 5.61 6.17 2.73 2.54
9 4.23 4.79 1.45 1.53
10 5.02 5.56 2.21 2.02
11 4.84 5.38 1.47 1.36
12 4.50 4.88 2.34 2.20
13 4.82 5.33 2.64 2.55
21 5.97 6.52 2.01 1.89
22 4.42 5.12 3.51 3.20
23 5.52 6.07 3.30 3.09
24 3.39 3.93 2.38 2.34
25 5.50 5.89 1.73 1.61
26 4.08 4.82 4.07 3.46
27 5.35 6.00 4.22 3.76
uh 3.99 3.78 0.93 1.20
total 4.64 5.09 1.91 1.79
Average number of missing and not-reached items could be compared between standard booklets 1 to 7 and non-standard booklets 21 to 27. Standard booklets have on average less not-reached items and less missing data.
table 12.12 average number of not-reached items and missing items by dra testid
testId
missing not reached
weighted unweighted weighted unweighted
1 1.64 1.52 0.48 0.41
2 1.87 1.72 0.45 0.41
3 1.55 1.39 0.36 0.28
4 1.36 1.18 0.36 0.32
5 1.17 0.96 0.37 0.30
6 1.22 1.09 0.30 0.24
total 1.47 1.31 0.39 0.33
Table 12.13 shows the number of not-reached items for the paper and pencil assessment, by country. Table 12.14 shows this information by country over all booklets and DRA test form. The average number of not-reached items differs from one country to another. Generally, countries with higher averages of not-reached items also have higher averages of missing data. Tables 12.15 and 12.16 provide the percentage distribution of not-reached items per booklet and DRA test form. The percentage of students who reached the last item (i.e. the percentages of students with zero not-reached items) for paper and pencil assessment ranges from 67% to 91% when using weighted data and 68% to 91% when using unweighted data. The percentage of students who reached the last item for DRA assessment ranges from 89% to 91% when using weighted data and 90% to 93% when using unweighted data.

12Scaling OutcOmeS
PISA 2009 TECHNICAL REPORT – © OECD 2012 201
Part
ners albania 12.58 12.68 2.79 2.68
argentina 9.33 9.29 5.87 5.50
azerbaijan 13.66 13.41 1.43 1.35
Brazil 4.69 4.92 2.66 3.01
Bulgaria 8.97 8.96 1.92 2.11
Colombia 4.58 4.42 6.21 5.36
Croatia 5.52 5.56 0.43 0.43
dubai (uae) 4.16 4.60 1.29 1.40
hong Kong-China 2.48 2.44 0.40 0.39
Indonesia 6.44 6.42 2.98 3.00
jordan 5.46 5.02 2.13 1.98
Kazakhstan 7.40 7.23 3.77 3.61
Kyrgyzstan 12.44 12.23 8.89 8.74
Latvia 3.70 3.55 0.93 0.87
Liechtenstein 4.32 4.37 0.83 0.82
Lithuania 4.73 4.71 0.63 0.61
macao-China 3.30 3.29 1.20 1.20
montenegro 11.48 11.63 1.50 1.48
Panama 7.36 7.03 4.18 4.50
Peru 7.84 7.67 6.28 6.26
Qatar 7.57 7.52 2.00 1.95
romania 4.36 4.44 0.76 0.78
russian Federation 6.09 6.11 2.62 2.56
Serbia 7.96 7.94 1.00 1.05
Shanghai-China 1.29 1.30 0.10 0.11
Singapore 2.49 2.55 0.67 0.69
Chinese taipei 3.34 3.27 0.45 0.46
thailand 3.86 3.75 1.22 1.19
trinidad and tobago 7.47 7.53 4.90 4.73
tunisia 7.61 7.86 3.48 3.51
uruguay 8.09 8.17 4.56 4.63
table 12.13 average number of not-reached items and missing items by country missing not reached
weighted unweighted weighted unweighted
OEC
D australia 3.23 3.58 0.90 1.11
austria 6.69 6.43 0.54 0.56
Belgium 4.08 4.03 0.93 0.90
Canada 2.68 2.99 0.85 0.85
Chile 5.44 5.28 2.08 2.07
Czech republic 6.20 5.34 0.70 0.60
denmark 4.71 5.35 0.88 1.03
estonia 4.08 4.05 0.61 0.61
Finland 2.83 2.88 0.43 0.49
France 6.58 6.48 1.77 1.72
germany 5.36 5.44 0.67 0.69
greece 6.42 6.14 1.56 1.56
hungary 4.95 4.70 0.50 0.45
Iceland 3.80 3.81 1.19 1.18
Ireland 4.09 4.01 1.07 1.04
Israel 6.84 6.78 2.33 2.24
Italy 5.84 5.58 1.53 1.28
japan 5.01 4.94 0.71 0.68
Korea 2.42 2.32 0.19 0.16
Luxembourg 6.55 6.33 1.41 1.31
mexico 3.00 2.92 3.46 3.38
netherlands 1.44 1.31 0.19 0.18
new Zealand 3.27 3.21 1.03 1.01
norway 4.79 4.79 1.09 1.10
Poland 4.35 4.15 0.54 0.55
Portugal 4.52 4.63 1.39 1.41
Slovak republic 5.66 5.62 0.62 0.61
Slovenia 5.49 6.62 0.32 0.48
Spain 5.22 5.00 1.58 1.45
Sweden 5.04 5.00 1.51 1.49
Switzerland 4.66 4.68 0.59 0.66
turkey 4.61 4.57 0.95 0.89
united Kingdom 3.98 4.24 0.70 0.63
united States 1.68 1.71 0.56 0.57

12Scaling OutcOmeS
202 © OECD 2012 – PISA 2009 TECHNICAL REPORT
table 12.14 average number of dra not-reached items and missing items by country missing not reached
weighted unweighted weighted unweighted
OEC
D australia 0.77 0.86 0.11 0.14
austria 1.87 1.89 0.16 0.23
Belgium 1.11 1.08 0.13 0.14
Chile 2.38 2.29 1.19 1.16
denmark 0.97 1.19 0.13 0.15
France 1.29 1.24 0.43 0.43
hungary 1.89 1.65 0.16 0.15
Iceland 0.85 0.84 0.14 0.14
Ireland 1.08 1.06 0.19 0.17
japan 1.32 1.31 0.27 0.28
Korea 0.53 0.50 0.08 0.08
new Zealand 0.85 0.83 0.22 0.23
norway 1.01 1.02 0.19 0.18
Poland 2.05 1.93 0.11 0.11
Spain 1.47 1.45 0.18 0.17
Sweden 1.07 1.07 0.19 0.19
Part
ners Colombia 2.87 2.74 1.62 1.64
hong Kong-China 1.00 1.01 0.34 0.35
macao-China 1.01 1.01 0.60 0.60
table 12.15 distribution of not-reached items by bookletnumber of non-reached items
Booklet 0 1 2 3 4 5 6 7 8 >8
weighted percentages
1 91.20 0.28 1.03 1.54 0.21 0.73 0.90 0.67 0.13 3.44
2 86.86 0.85 1.79 1.07 0.83 0.84 0.33 0.48 1.09 6.94
3 86.94 1.08 1.42 1.64 1.01 0.60 0.65 0.71 0.17 5.95
4 79.48 1.28 3.62 1.19 0.84 3.69 0.81 0.92 0.59 8.18
5 86.87 2.06 2.83 2.21 0.64 1.41 0.10 0.27 0.15 3.60
6 88.76 0.81 0.73 1.06 0.23 0.67 0.38 1.87 0.30 5.50
7 87.90 0.27 0.82 0.21 1.48 0.38 1.35 0.14 0.42 7.44
8 78.70 1.22 3.09 0.33 1.11 0.63 0.94 1.36 0.40 12.62
9 85.40 0.42 0.57 1.04 2.40 0.40 0.79 1.41 0.89 7.58
10 81.83 1.29 0.68 0.94 1.91 0.71 0.91 0.76 0.75 10.97
11 87.26 0.57 0.52 0.55 1.28 0.30 0.67 1.03 0.56 7.82
12 82.72 0.76 1.27 0.58 0.68 0.61 1.01 0.46 1.49 11.90
13 80.58 0.64 0.63 0.88 1.03 0.90 1.13 0.29 1.53 13.92
21 79.82 1.21 1.18 2.77 0.65 0.95 2.32 1.94 0.47 9.15
22 72.58 1.52 2.71 2.11 1.10 1.78 0.67 0.82 1.92 16.71
23 72.43 1.11 1.90 4.03 1.73 1.29 1.09 1.20 0.86 15.21
24 72.43 1.83 3.75 1.72 1.34 4.51 1.51 1.19 1.36 11.74
25 76.52 2.58 4.01 2.67 1.27 2.33 0.21 0.95 1.03 9.46
26 74.86 0.87 0.88 0.90 0.39 0.48 0.63 1.42 0.36 19.58
27 67.64 2.92 1.99 3.40 1.35 1.67 0.42 1.76 0.55 18.86
uh 85.42 2.80 0.31 1.74 0.68 2.67 0.33 0.50 1.38 5.55
unweighted percentages
1 91.05 0.41 1.24 1.71 0.39 0.66 1.11 0.73 0.22 2.49
2 88.79 0.79 1.98 1.10 0.69 0.94 0.25 0.36 0.68 4.42
3 87.53 1.06 1.58 2.09 0.82 0.54 0.64 0.62 0.27 4.85
4 82.26 1.71 3.12 1.43 0.76 3.39 0.76 0.69 0.55 5.33
5 88.50 2.38 2.35 1.93 0.67 1.01 0.13 0.32 0.18 2.53
6 91.01 0.95 0.72 1.01 0.18 0.58 0.30 1.52 0.16 3.57
7 88.61 0.35 0.80 0.20 1.64 0.53 1.36 0.14 0.36 6.01
8 79.62 1.44 2.89 0.32 1.33 0.60 0.97 1.26 0.32 11.24
9 84.38 0.53 0.35 0.87 3.54 0.19 0.60 1.66 0.89 7.00
10 82.84 1.31 0.56 0.76 1.99 0.61 0.86 0.70 0.75 9.62
11 88.15 0.44 0.57 0.46 1.30 0.37 0.54 1.13 0.56 6.49
12 83.45 0.77 1.16 0.58 0.64 0.84 1.04 0.49 1.38 9.64
13 81.15 0.63 0.63 0.98 0.99 0.71 1.24 0.32 1.90 11.45
21 80.94 0.97 1.38 2.94 0.53 1.03 2.19 1.57 0.52 7.94
22 74.32 1.54 2.79 2.19 1.22 1.52 0.68 0.73 1.71 13.29
23 73.55 1.20 2.07 3.50 1.57 1.29 1.14 1.22 0.63 13.83
24 72.67 1.53 3.99 1.76 1.00 4.89 1.40 1.33 1.18 10.25
25 77.25 2.99 4.20 2.90 1.15 1.97 0.18 0.83 0.80 7.73
26 77.15 1.05 0.82 0.95 0.36 0.41 0.77 1.54 0.45 16.49
27 68.22 3.17 2.46 4.65 1.51 1.39 0.31 1.82 0.43 16.04
uh 83.39 2.02 0.83 2.20 1.47 2.57 0.46 0.28 0.83 5.96
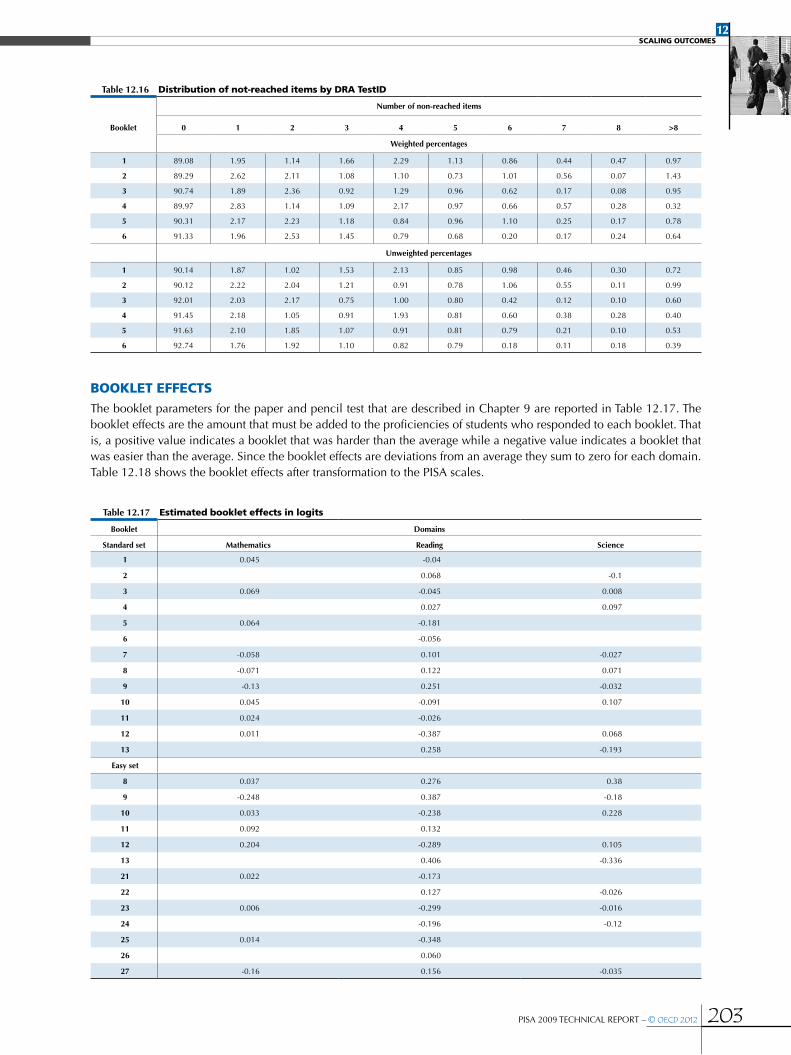
12Scaling OutcOmeS
PISA 2009 TECHNICAL REPORT – © OECD 2012 203
table 12.16 distribution of not-reached items by dra testid
number of non-reached items
Booklet 0 1 2 3 4 5 6 7 8 >8
weighted percentages
1 89.08 1.95 1.14 1.66 2.29 1.13 0.86 0.44 0.47 0.97
2 89.29 2.62 2.11 1.08 1.10 0.73 1.01 0.56 0.07 1.43
3 90.74 1.89 2.36 0.92 1.29 0.96 0.62 0.17 0.08 0.95
4 89.97 2.83 1.14 1.09 2.17 0.97 0.66 0.57 0.28 0.32
5 90.31 2.17 2.23 1.18 0.84 0.96 1.10 0.25 0.17 0.78
6 91.33 1.96 2.53 1.45 0.79 0.68 0.20 0.17 0.24 0.64
unweighted percentages
1 90.14 1.87 1.02 1.53 2.13 0.85 0.98 0.46 0.30 0.72
2 90.12 2.22 2.04 1.21 0.91 0.78 1.06 0.55 0.11 0.99
3 92.01 2.03 2.17 0.75 1.00 0.80 0.42 0.12 0.10 0.60
4 91.45 2.18 1.05 0.91 1.93 0.81 0.60 0.38 0.28 0.40
5 91.63 2.10 1.85 1.07 0.91 0.81 0.79 0.21 0.10 0.53
6 92.74 1.76 1.92 1.10 0.82 0.79 0.18 0.11 0.18 0.39
booKlet eFFectSThe booklet parameters for the paper and pencil test that are described in Chapter 9 are reported in Table 12.17. The booklet effects are the amount that must be added to the proficiencies of students who responded to each booklet. That is, a positive value indicates a booklet that was harder than the average while a negative value indicates a booklet that was easier than the average. Since the booklet effects are deviations from an average they sum to zero for each domain. Table 12.18 shows the booklet effects after transformation to the PISA scales.
table 12.17 estimated booklet effects in logits
Booklet domains
Standard set mathematics reading Science
1 0.045 -0.04
2 0.068 -0.1
3 0.069 -0.045 0.008
4 0.027 0.097
5 0.064 -0.181
6 -0.056
7 -0.058 0.101 -0.027
8 -0.071 0.122 0.071
9 -0.13 0.251 -0.032
10 0.045 -0.091 0.107
11 0.024 -0.026
12 0.011 -0.387 0.068
13 0.258 -0.193
easy set
8 0.037 0.276 0.38
9 -0.248 0.387 -0.18
10 0.033 -0.238 0.228
11 0.092 0.132
12 0.204 -0.289 0.105
13 0.406 -0.336
21 0.022 -0.173
22 0.127 -0.026
23 0.006 -0.299 -0.016
24 -0.196 -0.12
25 0.014 -0.348
26 0.060
27 -0.16 0.156 -0.035

12Scaling OutcOmeS
204 © OECD 2012 – PISA 2009 TECHNICAL REPORT
table 12.18 estimated booklet effects on the PiSa scale
Booklet domains
Standard set mathematics reading Science
1 3.5 -3.2
2 5.5 -9.3
3 5.4 -3.6 0.7
4 2.2 9.0
5 5.0 -14.5
6 -4.5
7 -4.5 8.1 -2.5
8 -5.5 9.8 6.6
9 -10.1 20.1 -3.0
10 3.5 -7.3 10.0
11 1.9 -2.1
12 0.9 -31.1 6.3
13 20.7 -18.0
easy set
8 2.9 22.1 35.4
9 -19.3 31.1 -16.8
10 2.6 -19.1 21.3
11 7.2 10.6
12 15.9 -23.2 9.8
13 32.6 -31.3
21 1.7 -13.9
22 10.2 -2.4
23 0.5 -24.0 -1.5
24 -15.7 -11.2
25 1.1 -27.9
26 4.8
27 -12.5 12.5 -3.3
Booklets that include a single domain cluster at the beginning of the booklet (mathematics in booklet 9, reading in booklet 12 and science in booklet 13) have the largest negative parameters. Booklets with the domain at the end of the booklet have the highest positive parameters. The reading booklet effects for the non-standard easier set of booklets are bigger than for the standard set of booklets.
After scaling the PISA 2009 data for each country separately, the booklet parameters were added to the students’ achievement scores for mathematics, reading and science. The mean performance scores could be compared across countries and across booklets. Tables 12.19 to 12.21 present the results of testing the variance in booklet means by country (UH booklet excluded), in each domain. The table rows represent countries and the columns booklets, the cells contain the mean performance by booklet and the square root of the squared difference between the observed and expected mean, divided by the error variance by booklet (a z-score). The expected mean is the average of the booklet means, each weighted by the reciprocal of their error variance. The sum of the squared differences divided by their error variance is chi-square distributed with 13–1=12 degrees of freedom (where 13 represent the number of booklets). Significant values are in bold.
A z-score is an indication of the magnitude of the difference between the observed booklet mean and the expected booklet mean. Significantly easier or harder than expected booklets are those with z-score >1.96. Booklets numbers shaded in grey are booklets without items in the domain.

12Scaling OutcOmeS
PISA 2009 TECHNICAL REPORT – © OECD 2012 205
[Part 1/2]
table 12.19 variance in mathematics booklet means
expected mean
Booklet 1(21) Booklet 2(22) Booklet 3(23) Booklet 4(24) Booklet 5(25) Booklet 6(26) Booklet 7(27)
mean Z-Score mean Z-Score mean Z-Score mean Z-Score mean Z-Score mean Z-Score mean Z-Score
OEC
D australia 514 516 0.43 516 0.47 525 2.40 514 0.16 514 0.03 512 0.56 512 0.54austria 499 499 0.01 495 0.87 497 0.50 502 0.46 495 0.93 503 0.83 504 0.86Belgium 521 524 0.91 524 0.71 514 1.81 521 0.01 527 1.51 525 1.23 526 1.35Canada 527 524 0.68 529 0.49 528 0.46 527 0.03 529 0.60 527 0.18 530 0.88Chile* 421 422 0.28 419 0.39 428 1.31 418 0.68 422 0.21 421 0.02 404 3.83Czech republic 496 496 0.07 492 0.69 500 0.81 495 0.18 501 1.16 492 0.87 497 0.15denmark 503 495 1.40 505 0.51 517 2.38 507 0.73 507 0.84 504 0.22 493 1.95estonia 512 521 1.83 509 0.45 512 0.02 511 0.26 510 0.51 509 0.63 513 0.09Finland 540 531 2.03 537 0.56 547 1.47 539 0.17 544 0.76 547 1.27 540 0.05France 497 505 1.61 498 0.18 498 0.14 496 0.13 491 1.05 492 0.78 491 1.04germany 518 522 0.98 517 0.10 516 0.36 520 0.49 522 1.02 518 0.09 527 1.83greece 466 475 1.53 463 0.48 475 1.38 468 0.28 456 1.96 463 0.47 468 0.24hungary 491 486 0.71 479 1.83 492 0.23 487 0.59 489 0.32 493 0.40 488 0.52Iceland 507 509 0.35 506 0.13 503 0.65 506 0.13 508 0.22 505 0.25 491 2.57Ireland 487 493 1.19 480 1.24 486 0.15 482 0.81 494 1.35 487 0.11 479 1.54Israel 447 444 0.43 444 0.53 450 0.52 448 0.17 447 0.09 449 0.25 457 1.74Italy 483 482 0.32 480 0.79 479 1.47 482 0.21 481 0.47 484 0.20 494 3.69japan 529 540 2.47 531 0.34 520 2.16 524 1.09 522 1.47 530 0.21 532 0.62Korea 547 557 2.08 545 0.28 538 1.56 543 0.63 548 0.19 547 0.09 546 0.03Luxembourg 489 492 0.47 485 0.61 473 2.73 484 0.86 483 0.94 492 0.48 510 3.59mexico* 418 410 3.08 419 0.33 420 0.65 420 0.52 417 0.67 418 0.01 422 1.25netherlands 529 535 1.28 534 0.85 520 1.54 524 0.85 524 0.97 533 0.77 524 0.80new Zealand 519 517 0.45 516 0.63 532 2.34 512 1.25 524 0.83 528 1.76 512 1.41norway 499 493 1.20 500 0.18 496 0.53 500 0.29 503 0.83 497 0.32 487 2.18Poland 495 490 0.95 495 0.07 506 2.31 496 0.18 501 1.51 494 0.19 483 2.40Portugal 487 484 0.78 487 0.00 493 1.25 487 0.00 482 1.02 489 0.33 494 1.61Slovak republic 498 500 0.41 504 0.92 492 1.01 496 0.29 500 0.38 504 1.12 502 0.88Slovenia 502 499 0.50 503 0.03 503 0.02 507 0.62 496 1.31 501 0.17 512 1.87Spain 484 477 1.74 481 0.58 486 0.70 484 0.06 487 0.99 485 0.36 487 0.83Sweden 494 492 0.46 493 0.23 486 1.26 495 0.24 499 0.91 495 0.10 507 2.19Switzerland 534 540 1.11 532 0.32 531 0.59 531 0.52 527 1.35 531 0.43 544 1.84turkey 446 438 1.31 440 0.86 456 1.70 446 0.07 448 0.37 446 0.12 447 0.22united Kingdom 493 492 0.12 487 1.07 497 0.99 496 0.74 495 0.38 497 0.94 488 0.91united States 487 484 0.63 487 0.07 488 0.08 489 0.31 492 0.89 492 0.68 476 2.06
Part
ners albania* 378 381 0.42 383 0.76 383 0.71 376 0.38 380 0.31 377 0.15 370 1.34
argentina* 388 386 0.22 396 1.19 378 1.56 386 0.30 396 1.33 387 0.18 393 0.84
azerbaijan* 432 461 7.73 431 0.35 422 2.36 436 0.85 428 1.07 436 1.01 394 8.82
Brazil* 386 390 0.88 384 0.66 374 3.56 389 0.65 376 3.21 387 0.23 405 6.56
Bulgaria* 428 435 1.16 429 0.16 425 0.53 423 0.59 429 0.17 436 0.83 420 1.22
Colombia* 381 380 0.32 383 0.27 373 1.37 386 0.86 366 3.10 381 0.08 399 4.30
Croatia 460 475 3.01 459 0.17 456 0.79 455 1.04 459 0.35 456 0.76 473 2.59
dubai (uae)* 453 447 0.96 449 0.61 457 0.55 453 0.06 464 2.43 455 0.38 442 1.99
hong Kong-China 554 557 0.72 553 0.22 566 2.59 552 0.49 551 0.61 555 0.24 546 1.66
Indonesia 371 368 0.65 371 0.13 369 0.45 371 0.07 372 0.20 371 0.09 369 0.37
jordan* 387 388 0.23 379 1.34 388 0.21 386 0.21 391 0.92 390 0.54 376 2.15
Kazakhstan* 405 410 1.04 404 0.17 401 0.74 402 0.67 405 0.00 403 0.31 406 0.21
Kyrgyzstan* 330 323 1.44 331 0.05 337 1.30 330 0.02 335 1.04 331 0.21 334 0.81
Latvia 482 484 0.43 480 0.28 485 0.53 484 0.29 488 1.19 487 0.92 482 0.07
Liechtenstein 536 549 0.73 538 0.15 546 0.56 530 0.35 541 0.30 541 0.19 526 0.66
Lithuania 477 480 0.86 479 0.53 481 0.94 476 0.18 477 0.11 479 0.33 474 0.55
macao-China 525 525 0.08 526 0.19 533 1.71 526 0.09 529 0.87 525 0.02 524 0.27
montenegro 403 401 0.29 405 0.49 407 0.62 404 0.28 394 1.72 402 0.15 415 2.61
Panama* 361 338 2.75 350 1.25 363 0.31 359 0.30 353 1.22 367 0.89 372 1.81
Peru* 365 364 0.22 360 0.92 363 0.28 364 0.09 360 0.90 372 1.20 382 3.18
Qatar* 368 367 0.24 369 0.30 364 0.88 370 0.46 374 1.48 369 0.23 356 3.13
romania* 427 414 2.49 427 0.06 433 1.02 427 0.03 429 0.30 425 0.33 428 0.25
russian Federation 468 462 1.05 470 0.51 466 0.23 472 1.02 467 0.17 470 0.50 468 0.16
Serbia* 442 444 0.19 439 0.65 437 1.21 439 0.59 438 0.95 442 0.04 448 0.96
Shanghai-China 600 601 0.37 600 0.04 599 0.07 598 0.30 601 0.23 598 0.42 607 1.14
Singapore 562 565 0.55 560 0.24 556 0.95 562 0.11 567 0.96 559 0.54 570 1.49
Chinese taipei 544 536 1.63 547 0.49 553 1.47 540 0.69 543 0.18 545 0.09 543 0.16
thailand 419 411 1.88 420 0.26 436 3.31 416 0.57 419 0.03 421 0.41 407 2.33
trinidad and tobago* 413 413 0.00 414 0.10 428 2.00 415 0.26 414 0.08 414 0.14 411 0.44
tunisia* 371 371 0.01 374 0.57 373 0.34 374 0.55 368 0.73 371 0.01 384 2.57
uruguay* 427 428 0.34 428 0.21 422 0.92 429 0.49 432 1.09 426 0.15 429 0.56
Note: Values that are statistically significant are indicated in bold.* These countries opted for the easier booklets.

12Scaling OutcOmeS
206 © OECD 2012 – PISA 2009 TECHNICAL REPORT
[Part 2/2]
table 12.19 variance in mathematics booklet meansBooklet 8 Booklet 9 Booklet 10 Booklet 11 Booklet 12 Booklet 13 Chi-sq
mean Z-Score mean Z-Score mean Z-Score mean Z-Score mean Z-Score mean Z-Score (df=12)
OEC
D australia 509 1.17 521 1.79 507 2.01 516 0.45 515 0.19 509 1.33 11.5austria 495 1.02 486 2.70 512 3.05 505 1.07 499 0.14 494 0.88 13.3Belgium 516 1.19 508 3.06 526 1.30 521 0.11 519 0.31 519 0.46 14.0Canada 526 0.31 522 1.60 526 0.05 524 0.67 530 0.97 527 0.04 6.9Chile* 427 1.47 413 1.92 426 1.28 424 0.55 427 1.49 422 0.23 13.7Czech republic 498 0.42 500 0.80 496 0.00 498 0.47 487 1.82 494 0.29 7.7denmark 506 0.62 514 1.89 493 1.98 507 0.79 498 1.01 498 0.80 15.1estonia 516 0.83 504 1.57 512 0.18 518 1.11 511 0.30 511 0.22 8.0Finland 534 1.34 544 0.72 530 2.20 545 1.06 546 1.22 543 0.55 13.4France 508 2.08 489 1.65 492 0.92 495 0.33 505 1.33 499 0.52 11.8germany 515 0.52 500 3.62 529 2.34 513 0.92 515 0.59 516 0.47 13.3greece 470 0.50 480 2.29 461 0.90 462 0.53 455 1.70 464 0.33 12.6hungary 490 0.04 494 0.75 496 0.88 496 1.11 491 0.09 491 0.10 7.6Iceland 506 0.13 503 0.78 513 0.96 505 0.37 526 3.37 506 0.23 10.1Ireland 499 2.35 484 0.55 478 1.69 492 0.75 493 1.06 484 0.56 13.3Israel 443 0.76 447 0.03 449 0.38 444 0.53 444 0.48 445 0.44 6.4Italy 483 0.14 482 0.32 484 0.37 483 0.16 478 1.84 486 1.09 11.1japan 525 0.67 529 0.07 530 0.22 527 0.51 537 1.70 530 0.22 11.8Korea 559 2.23 539 1.35 547 0.07 544 0.45 547 0.15 541 0.94 10.1Luxembourg 499 1.81 474 2.80 502 2.31 489 0.00 482 1.14 492 0.58 18.3mexico* 423 1.68 420 0.78 418 0.05 417 0.58 419 0.21 417 0.76 10.6netherlands 530 0.17 520 1.68 533 0.62 538 1.22 535 0.83 533 0.52 12.1new Zealand 511 1.63 522 0.55 520 0.18 518 0.21 518 0.17 520 0.14 11.5norway 503 0.87 517 4.29 490 1.58 495 0.65 500 0.22 492 1.31 14.4Poland 502 1.41 491 0.79 488 1.14 487 1.64 505 1.58 495 0.15 14.3Portugal 483 0.88 487 0.09 491 0.69 477 1.92 486 0.23 491 0.72 9.5Slovak republic 495 0.58 492 1.26 501 0.56 499 0.32 493 0.96 497 0.22 8.9Slovenia 500 0.32 498 1.00 511 1.40 503 0.12 500 0.49 503 0.06 7.9Spain 483 0.19 488 1.25 485 0.36 479 1.11 481 0.90 481 0.65 9.7Sweden 500 0.98 493 0.10 488 1.14 485 1.66 497 0.61 495 0.27 10.2Switzerland 528 1.07 529 1.28 545 1.95 540 1.49 525 1.82 538 0.94 14.7turkey 425 3.60 464 3.38 448 0.37 455 1.61 430 2.63 447 0.21 16.4united Kingdom 498 1.08 502 2.51 481 2.84 487 1.23 491 0.37 490 0.41 13.6united States 485 0.41 496 1.53 483 0.59 487 0.16 495 1.27 482 0.95 9.6
Part
ners albania* 356 3.26 393 2.44 379 0.05 388 1.72 360 2.47 381 0.51 14.5
argentina* 396 1.22 377 1.99 392 0.65 386 0.28 383 0.69 390 0.33 10.8
azerbaijan* 406 5.89 422 2.49 403 6.02 440 1.96 493 13.28 434 0.49 52.3
Brazil* 389 0.69 377 2.45 395 2.51 381 1.31 381 1.77 387 0.09 24.6
Bulgaria* 419 1.15 431 0.46 431 0.35 428 0.01 433 0.66 426 0.23 7.5
Colombia* 383 0.42 379 0.41 393 2.00 374 1.63 377 0.84 378 0.88 16.5
Croatia 451 1.72 458 0.50 464 0.89 459 0.29 454 1.14 460 0.11 13.4
dubai (uae)* 461 1.49 445 1.52 436 3.09 459 1.18 463 1.90 451 0.28 16.4
hong Kong-China 539 3.26 565 2.08 563 1.67 562 1.32 547 1.36 551 0.70 16.9
Indonesia 375 0.73 382 2.09 367 0.89 368 0.74 371 0.05 374 0.53 7.0
jordan* 385 0.29 385 0.31 395 1.68 385 0.30 390 0.55 389 0.52 9.2
Kazakhstan* 410 1.01 407 0.61 410 1.07 404 0.19 396 1.93 406 0.16 8.1
Kyrgyzstan* 329 0.31 348 3.13 338 1.26 316 3.37 323 1.49 330 0.01 14.4
Latvia 489 1.16 456 4.43 486 0.66 478 0.69 486 0.58 479 0.54 11.8
Liechtenstein 509 1.42 547 0.55 549 0.76 528 0.39 545 0.47 526 0.53 7.0
Lithuania 471 1.06 476 0.07 474 0.62 488 2.39 468 1.98 473 0.69 10.3
macao-China 519 1.50 527 0.36 520 1.01 530 1.09 522 0.84 523 0.58 8.6
montenegro 387 2.84 403 0.06 415 2.22 402 0.00 396 1.35 403 0.09 12.7
Panama* 358 0.27 359 0.17 382 3.00 372 1.37 345 2.15 362 0.19 15.7
Peru* 364 0.17 370 1.09 368 0.54 356 2.02 355 1.95 370 0.86 13.4
Qatar* 381 3.41 370 0.50 364 1.30 369 0.30 366 0.44 366 0.54 13.2
romania* 429 0.49 428 0.15 434 1.54 434 1.39 416 2.32 427 0.10 10.5
russian Federation 475 1.17 467 0.18 465 0.43 463 0.97 464 0.74 472 0.73 7.9
Serbia* 439 0.75 431 2.58 453 2.16 453 2.72 444 0.37 444 0.22 13.4
Shanghai-China 593 1.49 595 1.02 602 0.45 614 2.58 593 1.40 601 0.24 9.8
Singapore 548 2.62 560 0.31 570 1.38 567 0.81 556 0.86 565 0.49 11.3
Chinese taipei 514 5.36 560 3.28 554 2.06 557 2.42 532 2.12 540 0.83 20.8
thailand 410 1.83 443 5.14 416 0.65 420 0.32 406 2.36 420 0.25 19.3
trinidad and tobago* 430 2.72 424 2.14 389 4.85 401 1.94 417 0.70 414 0.18 15.6
tunisia* 358 3.18 376 1.18 373 0.40 367 1.00 370 0.23 372 0.23 11.0
uruguay* 436 1.87 430 0.71 427 0.13 416 2.70 428 0.23 418 1.55 10.9
Note: Values that are statistically significant are indicated in bold.* These countries opted for the easier booklets.

12Scaling OutcOmeS
PISA 2009 TECHNICAL REPORT – © OECD 2012 207
[Part 1/2]
table 12.20 variance in reading booklet means
expected mean
Booklet 1(21) Booklet 2(22) Booklet 3(23) Booklet 4(24) Booklet 5(25) Booklet 6(26) Booklet 7(27)
mean Z-Score mean Z-Score mean Z-Score mean Z-Score mean Z-Score mean Z-Score mean Z-Score
OEC
D australia 515 518 0.98 518 0.69 523 1.99 512 0.84 507 2.09 516 0.38 508 1.82austria 475 477 0.58 472 0.44 460 2.65 474 0.13 471 0.85 478 0.83 478 0.82Belgium 511 512 0.15 511 0.02 509 0.64 507 1.12 520 2.19 514 0.79 508 0.90Canada 524 514 3.18 522 0.55 536 3.29 524 0.01 519 1.50 528 1.25 522 0.53Chile* 450 454 1.04 447 0.35 451 0.35 445 0.99 443 1.62 447 0.49 449 0.17Czech republic 482 480 0.38 488 0.98 473 1.88 483 0.23 486 0.91 478 0.88 490 1.75denmark 495 492 0.55 493 0.43 498 0.57 499 0.79 491 0.76 499 0.85 493 0.63estonia 501 501 0.04 505 0.60 486 2.68 498 0.63 493 1.62 500 0.17 510 1.98Finland 537 540 0.72 532 0.71 549 2.42 535 0.36 521 3.05 550 2.77 534 0.59France 495 505 1.80 499 0.57 504 1.54 498 0.47 499 0.59 491 0.79 496 0.16germany 503 494 2.03 505 0.42 489 2.58 499 0.92 503 0.04 495 1.79 508 1.09greece 483 498 2.82 477 0.85 482 0.12 473 1.60 484 0.24 487 0.50 485 0.30hungary 494 490 0.84 488 1.05 493 0.33 486 1.66 493 0.29 495 0.15 499 0.93Iceland 500 500 0.06 499 0.09 504 0.71 495 0.82 490 1.81 508 1.21 492 1.37Ireland 496 500 0.66 493 0.48 492 0.74 485 1.74 494 0.47 492 0.67 505 1.72Israel 473 477 0.44 453 3.32 477 0.61 468 0.96 482 1.61 488 2.10 474 0.12Italy 486 491 2.05 491 1.57 484 0.62 486 0.21 495 3.41 484 0.67 483 1.22japan 519 504 3.26 524 0.90 515 0.86 508 2.41 517 0.39 531 2.49 517 0.53Korea 538 530 1.91 543 0.77 534 0.73 536 0.35 533 1.08 537 0.16 541 0.53Luxembourg 472 474 0.36 471 0.18 462 1.58 458 2.59 478 1.02 476 0.61 483 1.69mexico* 425 424 0.17 430 1.50 429 1.32 423 0.96 416 3.98 424 0.40 414 3.36netherlands 511 509 0.37 520 1.54 511 0.02 499 1.93 499 1.67 513 0.37 507 0.57new Zealand 521 521 0.11 516 0.79 524 0.50 509 2.24 516 0.91 535 2.48 516 0.87norway 503 511 1.50 509 0.92 507 0.61 513 1.85 507 0.86 505 0.35 498 1.01Poland 501 504 0.65 499 0.33 498 0.52 492 1.59 506 1.09 498 0.68 496 0.98Portugal 489 491 0.49 499 1.63 501 2.55 497 1.65 497 1.74 492 0.73 481 1.86Slovak republic 478 473 0.85 485 1.27 470 1.60 482 0.86 484 1.39 480 0.44 482 0.91Slovenia 485 473 2.15 499 2.61 473 2.10 489 0.65 488 0.53 479 1.11 491 1.11Spain 482 480 0.39 479 0.77 492 2.90 483 0.35 492 3.17 485 0.94 481 0.16Sweden 497 503 1.18 497 0.06 495 0.44 497 0.10 509 1.89 499 0.30 503 0.92Switzerland 501 499 0.44 495 1.30 483 3.79 495 1.07 496 1.00 502 0.06 511 2.20turkey 465 475 2.25 454 1.98 475 1.89 464 0.17 467 0.30 461 0.85 466 0.17united Kingdom 494 495 0.16 493 0.28 492 0.47 493 0.23 488 1.25 502 1.51 495 0.12united States 500 503 0.55 492 1.01 508 1.43 502 0.40 490 1.84 502 0.31 496 0.65
Part
ners albania* 386 367 2.81 399 2.03 373 1.70 384 0.23 397 1.81 387 0.16 387 0.26
argentina* 398 411 1.85 412 1.68 400 0.18 401 0.34 410 2.07 379 2.60 387 2.03
azerbaijan* 362 386 5.07 359 0.75 359 0.58 352 1.88 356 1.58 355 1.68 378 3.29
Brazil* 412 420 1.68 415 0.64 414 0.48 409 0.80 406 1.66 413 0.29 410 0.47
Bulgaria* 428 420 1.14 434 0.63 418 1.36 415 1.64 438 1.17 444 1.49 438 1.04
Colombia* 412 428 3.05 427 2.44 419 1.09 414 0.43 408 0.56 408 0.64 387 5.22
Croatia 477 472 0.84 488 2.32 467 1.99 467 2.07 483 1.55 476 0.05 489 2.73
dubai (uae)* 459 442 2.64 452 1.18 462 0.51 452 1.42 450 1.71 473 2.30 466 1.28
hong Kong-China 532 519 3.52 538 1.25 518 3.63 529 1.04 521 2.75 532 0.17 528 0.96
Indonesia 401 398 0.77 394 1.40 398 0.69 394 1.87 407 1.06 394 1.76 400 0.30
jordan* 405 399 1.10 379 4.38 408 0.57 388 3.12 382 4.95 420 2.49 396 1.69
Kazakhstan* 391 377 2.51 388 0.38 380 2.07 377 2.81 393 0.58 390 0.10 390 0.15
Kyrgyzstan* 314 313 0.22 310 0.55 305 1.42 311 0.64 328 2.83 309 0.87 310 0.79
Latvia 485 468 3.18 480 0.85 470 2.37 491 1.34 486 0.20 495 1.97 490 0.87
Liechtenstein 499 498 0.00 503 0.28 504 0.31 492 0.48 508 0.64 517 0.86 496 0.14
Lithuania 468 458 2.32 495 5.45 447 3.99 462 1.40 474 1.28 458 2.04 471 0.56
macao-China 487 472 3.72 489 0.50 466 5.94 475 3.11 490 0.66 489 0.36 478 2.15
montenegro 408 410 0.27 411 0.52 395 2.34 408 0.03 426 3.28 412 0.55 419 1.96
Panama* 373 349 2.09 355 1.65 348 2.47 372 0.14 376 0.34 372 0.19 378 0.63
Peru* 369 387 2.97 367 0.45 366 0.58 366 0.62 368 0.23 370 0.19 357 2.51
Qatar* 372 356 3.70 365 1.35 365 1.29 367 1.17 363 1.82 384 2.74 371 0.25
romania* 425 410 2.81 440 2.46 400 3.84 413 1.97 423 0.41 426 0.13 432 1.28
russian Federation 459 455 0.66 468 1.50 453 1.26 451 1.72 469 1.76 461 0.43 457 0.53
Serbia* 442 430 2.38 445 0.57 428 3.69 430 3.01 428 3.03 462 5.03 459 3.62
Shanghai-China 555 543 2.86 562 1.32 546 2.32 556 0.30 549 1.45 549 1.46 573 3.61
Singapore 525 520 1.04 516 1.65 522 0.51 521 0.93 522 0.58 524 0.36 521 0.96
Chinese taipei 496 483 2.72 504 2.08 480 3.25 485 2.24 501 1.33 493 0.55 498 0.59
thailand 421 420 0.27 420 0.33 411 2.60 408 3.51 421 0.04 420 0.19 424 0.64
trinidad and tobago* 416 416 0.12 418 0.39 420 0.57 417 0.19 420 0.67 412 0.45 419 0.43
tunisia* 404 404 0.01 409 1.01 385 3.41 404 0.15 403 0.27 401 0.78 401 0.68
uruguay* 426 433 1.42 434 1.44 432 0.99 435 1.65 436 1.99 424 0.39 419 1.42
Note: Values that are statistically significant are indicated in bold.* These countries opted for the easier booklets.

12Scaling OutcOmeS
208 © OECD 2012 – PISA 2009 TECHNICAL REPORT
[Part 2/2]
table 12.20 variance in reading booklet meansBooklet 8 Booklet 9 Booklet 10 Booklet 11 Booklet 12 Booklet 13 Chi-sq
mean Z-Score mean Z-Score mean Z-Score mean Z-Score mean Z-Score mean Z-Score (df=12)
OEC
D australia 510 1.14 509 1.43 514 0.30 526 2.88 528 3.62 504 2.75 20.9austria 487 2.51 476 0.29 469 1.27 480 1.08 464 1.82 477 0.37 13.7Belgium 506 1.33 504 1.62 521 2.54 510 0.27 511 0.06 511 0.06 11.7Canada 521 1.02 518 1.84 526 0.74 527 0.97 530 1.83 527 0.94 17.7Chile* 452 0.54 455 1.31 444 1.18 455 1.04 440 1.91 459 2.13 13.1Czech republic 487 0.99 479 0.57 473 1.80 481 0.09 476 1.01 489 1.57 13.0denmark 509 3.04 492 0.66 490 1.08 503 1.88 486 2.08 490 1.14 14.5estonia 506 1.01 505 0.72 496 1.10 508 1.26 498 0.41 506 0.94 13.2Finland 536 0.12 534 0.59 523 2.44 542 1.20 524 2.39 546 1.97 19.3France 493 0.42 481 2.65 494 0.34 493 0.47 505 1.57 487 1.57 12.9germany 513 2.28 509 1.31 505 0.44 512 2.27 495 1.65 505 0.45 17.3greece 477 0.92 493 1.55 479 0.57 470 1.88 500 2.45 471 1.94 15.7hungary 492 0.52 505 2.06 498 0.81 494 0.11 500 1.06 493 0.39 10.2Iceland 492 1.22 498 0.38 505 0.86 504 0.68 520 3.38 495 0.89 13.5Ireland 513 3.09 491 0.89 492 0.75 499 0.36 485 1.84 501 0.90 14.3Israel 462 2.07 461 1.93 497 4.07 469 0.69 485 1.76 465 1.45 21.1Italy 481 1.65 482 1.59 492 2.08 479 1.89 483 0.97 485 0.17 18.1japan 520 0.21 509 2.16 520 0.11 523 0.64 557 7.59 512 1.70 23.3Korea 555 3.30 534 1.04 518 4.52 554 2.88 553 3.09 541 0.59 21.0Luxembourg 478 1.04 483 2.06 466 0.99 477 0.65 467 0.81 464 1.34 14.9mexico* 428 1.07 434 3.41 426 0.68 431 2.05 417 2.94 432 2.69 24.5netherlands 511 0.12 504 1.12 518 1.00 517 0.88 518 0.95 520 1.24 11.8new Zealand 507 2.25 528 1.35 519 0.25 524 0.59 526 0.91 530 1.49 14.7norway 507 0.72 496 1.36 501 0.33 496 1.34 500 0.60 492 2.08 13.5Poland 509 1.62 507 1.03 498 0.49 491 1.84 494 1.17 515 2.73 14.7Portugal 476 2.89 479 2.14 491 0.37 480 1.82 493 0.92 486 0.75 19.5Slovak republic 469 1.82 478 0.01 489 2.39 472 1.30 470 1.61 478 0.09 14.5Slovenia 492 1.59 477 1.63 483 0.33 487 0.39 478 1.30 492 1.37 16.9Spain 476 1.29 477 1.32 487 1.43 472 2.27 476 1.44 473 2.14 18.6Sweden 505 1.38 491 0.98 494 0.55 488 1.68 486 2.16 501 0.68 12.3Switzerland 504 0.74 500 0.30 503 0.46 509 1.79 500 0.40 509 1.95 15.5turkey 460 1.08 475 2.03 482 3.44 454 2.13 432 6.03 469 0.76 23.1united Kingdom 496 0.27 494 0.09 503 1.77 488 1.28 497 0.65 488 1.21 9.3united States 494 1.07 514 2.55 497 0.41 502 0.46 507 1.34 490 1.71 13.7
Part
ners albania* 374 1.49 397 1.69 370 2.32 395 1.56 382 0.51 391 0.94 17.5
argentina* 408 1.32 386 1.80 396 0.34 392 0.80 402 0.52 395 0.50 16.0
azerbaijan* 385 4.76 345 3.13 388 4.28 352 1.92 339 3.75 344 3.45 36.1
Brazil* 404 1.56 414 0.45 409 0.77 399 2.76 424 2.90 417 1.34 15.8
Bulgaria* 427 0.17 432 0.48 432 0.41 421 0.71 428 0.01 432 0.59 10.8
Colombia* 407 0.87 413 0.22 415 0.63 418 1.08 419 1.23 405 1.34 18.8
Croatia 472 0.99 490 3.08 474 0.63 457 3.58 477 0.10 473 0.75 20.6
dubai (uae)* 460 0.15 465 1.11 448 2.08 469 1.80 465 0.99 468 1.23 18.4
hong Kong-China 543 2.80 539 1.80 535 0.59 550 3.60 550 3.71 530 0.49 26.3
Indonesia 399 0.54 413 2.38 413 2.56 406 1.07 396 0.86 410 1.69 17.0
jordan* 414 1.92 420 3.07 412 1.41 418 2.41 408 0.66 423 3.41 31.2
Kazakhstan* 401 1.97 384 1.38 408 3.60 407 3.53 380 2.02 398 1.54 22.6
Kyrgyzstan* 305 1.53 317 0.56 334 2.95 308 1.21 320 1.03 314 0.06 14.7
Latvia 492 1.31 490 0.88 486 0.28 490 1.08 476 1.43 479 0.88 16.6
Liechtenstein 486 0.73 487 0.77 483 0.75 514 0.67 506 0.46 500 0.12 6.2
Lithuania 475 1.41 481 2.62 456 3.15 473 0.84 468 0.13 473 1.06 26.3
macao-China 491 1.09 481 1.54 487 0.03 512 6.88 513 6.80 484 0.90 33.7
montenegro 399 1.43 415 1.42 411 0.44 394 2.62 398 1.67 401 1.16 17.7
Panama* 379 0.52 382 0.95 391 1.90 386 1.44 354 1.84 382 1.12 15.3
Peru* 364 1.02 383 2.57 374 0.80 364 0.99 364 0.87 376 1.26 15.1
Qatar* 385 3.17 388 3.58 372 0.04 362 2.36 371 0.19 383 2.37 24.0
romania* 429 0.83 431 1.05 416 1.91 426 0.18 443 3.43 431 1.12 21.4
russian Federation 444 2.86 455 0.57 476 3.19 456 0.55 472 2.27 455 0.80 18.1
Serbia* 443 0.20 461 4.93 431 2.86 443 0.16 447 1.25 439 0.69 31.4
Shanghai-China 568 3.35 557 0.42 538 4.63 572 3.72 557 0.55 558 0.62 26.6
Singapore 520 1.01 524 0.19 524 0.32 535 1.74 553 4.97 535 1.58 15.8
Chinese taipei 485 2.26 496 0.10 511 3.58 504 1.73 505 1.92 493 0.75 23.1
thailand 421 0.04 437 3.79 432 2.70 422 0.13 410 2.43 432 2.77 19.5
trinidad and tobago* 409 1.11 412 0.63 408 1.22 413 0.31 447 4.45 400 2.37 12.9
tunisia* 396 1.82 410 1.34 411 1.50 406 0.51 401 0.56 415 2.43 14.5
uruguay* 421 1.08 417 1.72 417 1.86 426 0.01 433 1.30 409 2.75 18.0
Note: Values that are statistically significant are indicated in bold.* These countries opted for the easier booklets.

12Scaling OutcOmeS
PISA 2009 TECHNICAL REPORT – © OECD 2012 209
[Part 1/2]
table 12.21 variance in science booklet means
expected mean
Booklet 1(21) Booklet 2(22) Booklet 3(23) Booklet 4(24) Booklet 5(25) Booklet 6(26) Booklet 7(27)
mean Z-Score mean Z-Score mean Z-Score mean Z-Score mean Z-Score mean Z-Score mean Z-Score
OEC
D australia 527 532 1.29 538 2.23 534 1.57 525 0.37 528 0.29 525 0.46 525 0.48austria 499 499 0.10 490 1.54 491 1.44 513 2.57 501 0.30 502 0.46 495 0.85Belgium 513 514 0.24 521 1.71 515 0.58 504 2.27 522 1.95 516 0.79 523 2.37Canada 528 529 0.26 540 2.98 535 1.85 525 0.91 529 0.34 529 0.22 525 0.79Chile* 448 446 0.26 455 1.26 452 0.85 433 3.25 446 0.44 447 0.08 439 1.60Czech republic 505 510 0.97 501 0.79 498 1.48 515 1.96 507 0.38 503 0.40 511 1.07denmark 499 499 0.07 499 0.01 493 0.89 513 2.61 503 0.79 500 0.16 485 3.14estonia 528 531 0.62 535 1.08 529 0.23 530 0.44 524 0.67 524 0.67 522 1.28Finland 554 549 0.98 550 0.72 557 0.45 552 0.49 548 1.20 559 0.91 567 2.30France 499 502 0.49 503 0.60 501 0.35 495 0.65 495 0.61 494 0.75 491 1.37germany 527 526 0.20 521 1.45 531 0.87 541 3.40 527 0.01 526 0.12 526 0.09greece 471 471 0.07 481 1.40 471 0.06 465 1.02 470 0.19 470 0.21 467 0.54hungary 503 500 0.52 484 3.11 500 0.55 505 0.26 497 1.28 506 0.52 503 0.05Iceland 496 492 0.61 491 0.72 493 0.39 497 0.30 495 0.18 495 0.07 496 0.13Ireland 508 515 1.20 498 1.41 500 1.32 502 0.80 506 0.22 507 0.12 520 2.19Israel 456 453 0.42 454 0.20 457 0.30 451 0.85 453 0.36 458 0.35 454 0.34Italy 489 489 0.20 488 0.41 484 2.07 495 1.93 490 0.38 489 0.03 482 2.70japan 540 543 0.75 539 0.07 538 0.28 543 0.76 537 0.50 541 0.25 522 3.72Korea 538 539 0.31 542 0.61 548 1.90 517 3.84 537 0.08 537 0.15 536 0.36Luxembourg 484 484 0.05 481 0.45 486 0.45 476 1.24 483 0.13 488 0.71 491 1.00mexico* 414 413 0.39 434 6.38 418 1.17 410 1.91 417 1.25 416 0.69 410 1.59netherlands 527 532 0.86 536 1.55 533 0.95 504 3.50 520 1.05 531 0.56 536 1.18new Zealand 532 529 0.45 527 0.74 540 1.30 525 1.32 535 0.52 543 1.71 524 1.43norway 500 498 0.42 495 0.82 481 3.17 525 4.53 503 0.52 499 0.26 483 3.44Poland 508 508 0.03 509 0.23 512 0.90 507 0.08 509 0.29 507 0.17 495 2.66Portugal 493 490 0.63 493 0.01 489 0.98 508 3.26 492 0.33 495 0.44 492 0.26Slovak republic 491 491 0.09 517 3.88 497 1.13 496 1.14 490 0.19 496 0.87 478 2.40Slovenia 513 511 0.38 524 1.94 517 0.71 526 2.02 508 0.85 515 0.34 507 1.18Spain 488 488 0.09 494 1.53 486 0.51 492 1.10 492 1.43 489 0.41 483 1.51Sweden 495 501 1.02 493 0.33 492 0.49 505 1.70 500 0.82 497 0.39 494 0.25Switzerland 516 523 1.28 516 0.16 515 0.21 517 0.12 514 0.41 513 0.61 519 0.53turkey 454 451 0.73 443 1.98 450 0.89 453 0.24 452 0.38 456 0.40 461 1.34united Kingdom 514 515 0.20 499 2.99 506 1.66 529 2.73 515 0.26 517 0.71 519 1.03united States 502 502 0.03 494 1.18 500 0.37 510 1.52 502 0.05 505 0.41 497 0.73
Part
ners albania* 394 394 0.45 380 1.83 389 0.33 395 0.47 397 0.85 388 0.49 381 1.50
argentina* 403 403 0.28 418 2.58 398 0.50 403 0.31 405 0.65 397 0.59 386 2.36
azerbaijan* 373 373 0.57 436 10.49 387 3.53 360 1.90 376 1.04 373 0.67 345 6.57
Brazil* 407 407 0.08 396 2.60 410 0.94 403 1.04 406 0.05 406 0.15 415 2.84
Bulgaria* 445 445 0.88 439 0.04 436 0.41 444 0.58 441 0.29 444 0.52 431 1.08
Colombia* 406 406 0.83 431 4.53 396 0.96 409 1.26 394 1.08 404 0.57 398 0.69
Croatia 491 491 0.82 492 1.17 486 0.20 489 0.52 485 0.41 485 0.36 483 0.73
dubai (uae)* 468 468 0.20 451 2.52 471 0.74 465 0.42 468 0.13 470 0.43 481 2.54
hong Kong-China 552 552 0.78 550 0.26 554 1.08 544 1.27 543 1.17 550 0.28 546 0.61
Indonesia 381 381 0.31 365 3.32 385 0.48 378 0.90 383 0.06 381 0.34 398 3.16
jordan* 415 415 0.15 393 3.65 409 1.11 415 0.18 416 0.03 418 0.25 422 1.30
Kazakhstan* 397 397 0.80 395 0.87 389 2.35 414 2.86 402 0.20 400 0.19 397 0.81
Kyrgyzstan* 332 332 0.32 322 1.42 321 1.82 335 1.04 329 0.30 328 0.37 324 1.35
Latvia 486 486 1.45 492 0.39 494 0.04 514 3.66 499 0.96 499 0.86 490 0.82
Liechtenstein 528 528 0.51 520 0.06 552 1.64 519 0.04 537 1.04 532 0.53 499 1.32
Lithuania 493 493 0.54 505 2.70 489 0.36 493 0.46 491 0.06 493 0.36 485 1.13
macao-China 512 512 0.23 509 0.51 511 0.07 516 1.26 510 0.18 511 0.12 504 1.76
montenegro 403 403 0.16 391 2.22 399 0.50 415 2.82 401 0.24 403 0.06 396 1.10
Panama* 369 369 0.66 347 3.51 368 1.10 388 1.54 378 0.18 385 1.13 382 0.74
Peru* 370 370 0.16 368 0.09 361 1.52 380 1.97 367 0.35 373 0.84 364 1.10
Qatar* 380 380 0.11 363 3.40 377 0.61 382 0.64 381 0.27 380 0.06 383 0.79
romania* 429 429 0.02 407 3.96 419 1.69 437 1.77 430 0.20 427 0.30 440 2.18
russian Federation 469 469 1.46 476 0.44 470 1.61 493 2.95 480 0.19 480 0.35 472 1.18
Serbia* 440 440 0.57 442 0.24 439 1.12 437 1.20 442 0.22 445 0.47 443 0.08
Shanghai-China 574 574 0.22 568 1.41 577 0.48 575 0.11 576 0.25 573 0.54 582 1.40
Singapore 543 543 0.29 527 2.63 547 0.86 535 1.26 544 0.48 537 0.93 559 3.01
Chinese taipei 519 519 0.55 514 1.56 519 0.36 520 0.19 524 0.57 521 0.06 520 0.36
thailand 423 423 0.65 401 5.15 415 2.34 437 2.85 425 0.28 428 0.38 431 0.90
trinidad and tobago* 414 414 0.64 405 0.65 424 2.01 409 0.12 410 0.02 410 0.06 405 0.74
tunisia* 396 396 1.07 386 3.31 393 1.64 413 2.28 400 0.37 402 0.00 421 4.05
uruguay* 429 429 0.37 431 0.85 426 0.23 430 0.56 431 0.79 425 0.39 422 0.91
Note: Values that are statistically significant are indicated in bold.* These countries opted for the easier booklets.

12Scaling OutcOmeS
210 © OECD 2012 – PISA 2009 TECHNICAL REPORT
[Part 2/2]
table 12.21 variance in science booklet meansBooklet 8 Booklet 9 Booklet 10 Booklet 11 Booklet 12 Booklet 13 Chi-sq
mean Z-Score mean Z-Score mean Z-Score mean Z-Score mean Z-Score mean Z-Score (df=12)
OEC
D australia 529 0.51 520 1.78 530 0.87 528 0.35 529 0.49 513 3.66 14.3austria 487 2.41 511 2.06 506 1.47 503 0.70 502 0.50 488 1.80 16.2Belgium 521 1.87 494 4.73 511 0.44 515 0.53 506 1.85 514 0.26 19.6Canada 528 0.04 522 2.24 527 0.43 529 0.29 526 0.54 528 0.02 10.9Chile* 477 7.35 439 2.01 449 0.34 450 0.40 445 0.70 438 2.23 20.8Czech republic 510 0.80 503 0.54 509 0.77 502 0.66 503 0.48 497 1.63 11.9denmark 502 0.58 513 2.76 508 1.55 499 0.11 496 0.47 482 3.23 16.4estonia 548 3.77 523 0.79 536 1.66 531 0.49 521 1.06 508 3.56 16.3Finland 556 0.34 543 2.27 554 0.16 558 0.82 560 1.30 551 0.56 12.5France 494 0.73 493 1.10 492 1.25 502 0.60 498 0.08 516 3.70 12.3germany 516 2.25 526 0.10 534 1.53 527 0.01 528 0.18 519 1.79 12.0greece 449 3.05 477 1.06 460 1.78 472 0.08 471 0.06 487 3.18 12.7hungary 508 0.82 517 3.25 507 0.74 506 0.55 506 0.61 495 1.96 14.2Iceland 489 1.02 495 0.03 492 0.51 505 1.48 505 1.52 497 0.18 7.1Ireland 521 1.99 508 0.08 506 0.24 512 0.66 506 0.26 500 1.58 12.1Israel 438 2.99 458 0.44 457 0.30 457 0.23 451 0.82 473 3.61 11.2Italy 481 2.22 500 4.24 486 0.87 489 0.07 489 0.24 492 1.10 16.4japan 527 2.19 549 2.28 552 2.22 536 0.70 544 0.96 540 0.00 14.7Korea 567 5.57 524 2.99 540 0.53 538 0.13 538 0.08 531 1.36 17.9Luxembourg 477 1.22 488 0.78 479 0.81 487 0.46 480 0.65 491 1.20 9.2mexico* 436 6.84 411 1.53 413 0.81 417 1.20 410 2.22 402 5.61 31.6netherlands 535 1.07 510 2.82 526 0.17 529 0.26 522 0.70 540 1.78 16.4new Zealand 527 0.76 542 1.58 533 0.06 531 0.17 526 0.97 535 0.52 11.5norway 497 0.57 524 4.92 497 0.49 500 0.09 503 0.54 492 1.68 21.5Poland 526 3.62 500 1.49 507 0.09 504 0.82 516 1.38 504 0.72 12.5Portugal 484 1.81 501 1.74 485 1.68 490 0.61 497 0.93 491 0.51 13.2Slovak republic 492 0.29 492 0.17 497 1.26 491 0.07 478 2.61 476 2.66 16.7Slovenia 519 0.91 514 0.11 524 1.80 515 0.29 508 0.93 488 4.32 15.8Spain 497 2.04 488 0.04 489 0.44 487 0.10 483 1.49 478 2.52 13.2Sweden 490 0.80 497 0.40 485 1.78 489 1.06 499 0.73 494 0.26 10.0Switzerland 512 0.94 516 0.10 525 1.71 516 0.17 513 0.85 516 0.15 7.2turkey 454 0.05 462 1.56 456 0.45 460 1.06 451 0.57 452 0.46 10.1united Kingdom 500 2.65 527 2.96 515 0.22 509 0.90 514 0.12 513 0.13 16.5united States 494 1.47 513 1.80 506 0.67 503 0.14 505 0.54 496 1.04 9.9
Part
ners albania* 379 1.72 412 3.69 392 0.00 391 0.12 396 0.64 386 0.91 13.0
argentina* 397 0.55 405 0.65 396 0.79 402 0.10 397 0.55 405 0.58 10.5
azerbaijan* 372 0.43 349 4.94 419 9.61 377 1.34 354 3.11 332 7.25 51.5
Brazil* 400 1.20 397 2.76 401 1.59 403 0.84 412 1.59 417 3.12 18.8
Bulgaria* 442 0.39 438 0.12 444 0.59 440 0.16 441 0.24 427 1.73 7.0
Colombia* 406 0.83 403 0.31 390 2.11 400 0.24 387 2.40 401 0.10 15.9
Croatia 493 1.21 493 1.44 491 1.14 481 1.12 483 0.68 471 3.17 13.0
dubai (uae)* 480 2.46 452 2.60 465 0.34 467 0.02 465 0.27 461 0.83 13.5
hong Kong-China 556 1.62 546 0.67 561 2.70 550 0.24 548 0.28 537 2.72 13.7
Indonesia 368 2.78 390 1.59 369 2.71 383 0.08 387 0.88 406 4.20 20.8
jordan* 408 1.58 416 0.04 415 0.11 420 0.73 422 1.21 431 2.68 13.0
Kazakhstan* 398 0.40 420 4.11 409 1.65 400 0.22 395 1.14 389 2.43 18.0
Kyrgyzstan* 314 2.73 353 4.48 329 0.23 328 0.41 326 0.76 342 2.49 17.7
Latvia 508 2.38 485 1.65 497 0.40 493 0.17 486 1.26 476 2.92 17.0
Liechtenstein 501 1.19 516 0.18 525 0.33 507 0.49 539 1.12 497 1.24 9.7
Lithuania 510 3.42 481 1.69 485 1.26 495 0.74 488 0.61 480 2.37 15.7
macao-China 519 2.00 518 1.92 506 1.16 513 0.51 510 0.20 504 1.96 11.9
montenegro 383 2.79 418 2.90 405 0.51 403 0.22 403 0.12 396 0.93 14.6
Panama* 388 1.15 379 0.30 377 0.10 383 0.79 374 0.23 371 0.73 12.2
Peru* 362 1.41 384 3.23 357 2.74 367 0.38 366 0.65 382 2.49 16.9
Qatar* 375 1.18 377 0.75 376 0.97 381 0.21 390 2.81 387 1.60 13.4
romania* 427 0.35 432 0.68 434 1.02 429 0.15 433 1.07 421 1.53 14.9
russian Federation 467 1.97 503 4.20 476 0.51 475 0.66 474 0.96 484 0.87 17.4
Serbia* 468 5.80 445 0.68 449 1.63 447 1.12 439 0.83 420 5.52 19.5
Shanghai-China 576 0.31 574 0.21 580 1.23 576 0.32 577 0.55 564 2.52 9.6
Singapore 538 0.67 530 2.11 533 1.38 545 0.58 543 0.19 563 3.73 18.1
Chinese taipei 510 2.23 529 2.39 530 2.04 523 0.42 527 1.26 511 2.41 14.4
thailand 394 5.92 447 4.44 425 0.26 430 0.78 438 2.40 437 2.27 28.6
trinidad and tobago* 416 0.97 412 0.31 402 1.43 403 0.87 405 0.89 418 1.08 9.8
tunisia* 367 7.26 410 2.20 389 2.85 398 0.82 415 3.03 418 3.97 32.8
uruguay* 432 0.86 429 0.46 428 0.13 428 0.20 418 2.01 425 0.29 8.1
Note: Values that are statistically significant are indicated in bold.* These countries opted for the easier booklets.
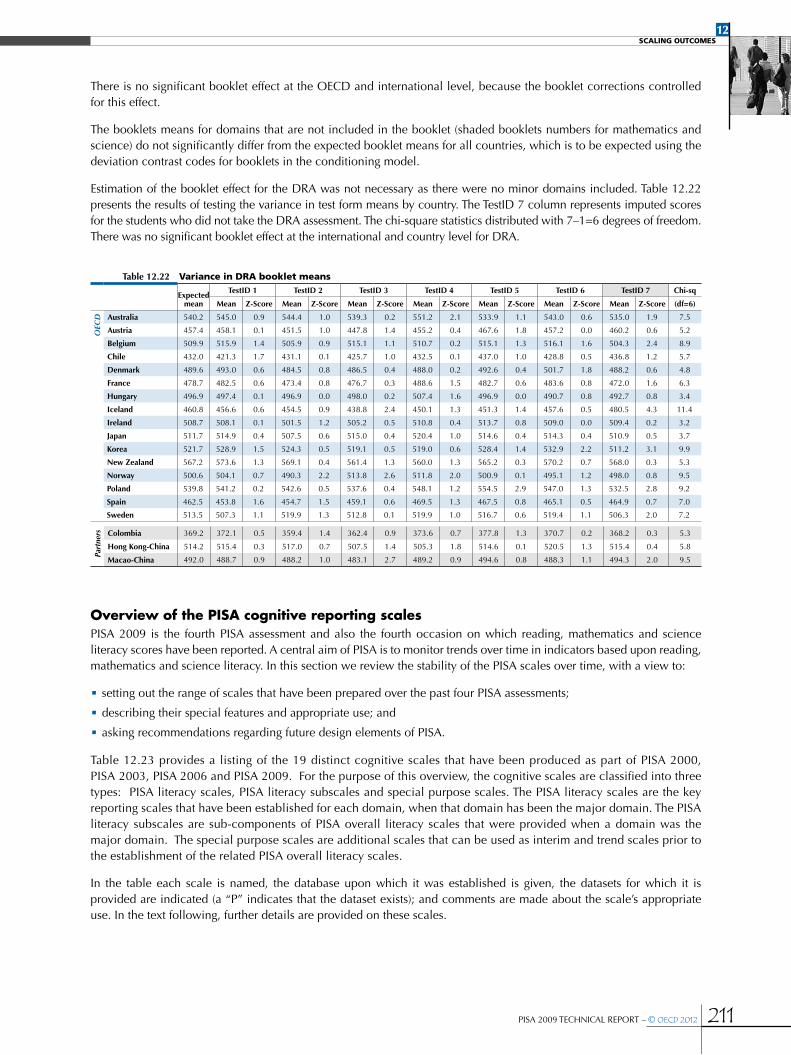
12Scaling OutcOmeS
PISA 2009 TECHNICAL REPORT – © OECD 2012 211
There is no significant booklet effect at the OECD and international level, because the booklet corrections controlled for this effect.
The booklets means for domains that are not included in the booklet (shaded booklets numbers for mathematics and science) do not significantly differ from the expected booklet means for all countries, which is to be expected using the deviation contrast codes for booklets in the conditioning model.
Estimation of the booklet effect for the DRA was not necessary as there were no minor domains included. Table 12.22 presents the results of testing the variance in test form means by country. The TestID 7 column represents imputed scores for the students who did not take the DRA assessment. The chi-square statistics distributed with 7–1=6 degrees of freedom. There was no significant booklet effect at the international and country level for DRA.
table 12.22 variance in dra booklet means
expected mean
testId 1 testId 2 testId 3 testId 4 testId 5 testId 6 testId 7 Chi-sq
mean Z-Score mean Z-Score mean Z-Score mean Z-Score mean Z-Score mean Z-Score mean Z-Score (df=6)
OEC
D australia 540.2 545.0 0.9 544.4 1.0 539.3 0.2 551.2 2.1 533.9 1.1 543.0 0.6 535.0 1.9 7.5
austria 457.4 458.1 0.1 451.5 1.0 447.8 1.4 455.2 0.4 467.6 1.8 457.2 0.0 460.2 0.6 5.2
Belgium 509.9 515.9 1.4 505.9 0.9 515.1 1.1 510.7 0.2 515.1 1.3 516.1 1.6 504.3 2.4 8.9
Chile 432.0 421.3 1.7 431.1 0.1 425.7 1.0 432.5 0.1 437.0 1.0 428.8 0.5 436.8 1.2 5.7
denmark 489.6 493.0 0.6 484.5 0.8 486.5 0.4 488.0 0.2 492.6 0.4 501.7 1.8 488.2 0.6 4.8
France 478.7 482.5 0.6 473.4 0.8 476.7 0.3 488.6 1.5 482.7 0.6 483.6 0.8 472.0 1.6 6.3
hungary 496.9 497.4 0.1 496.9 0.0 498.0 0.2 507.4 1.6 496.9 0.0 490.7 0.8 492.7 0.8 3.4
Iceland 460.8 456.6 0.6 454.5 0.9 438.8 2.4 450.1 1.3 451.3 1.4 457.6 0.5 480.5 4.3 11.4
Ireland 508.7 508.1 0.1 501.5 1.2 505.2 0.5 510.8 0.4 513.7 0.8 509.0 0.0 509.4 0.2 3.2
japan 511.7 514.9 0.4 507.5 0.6 515.0 0.4 520.4 1.0 514.6 0.4 514.3 0.4 510.9 0.5 3.7
Korea 521.7 528.9 1.5 524.3 0.5 519.1 0.5 519.0 0.6 528.4 1.4 532.9 2.2 511.2 3.1 9.9
new Zealand 567.2 573.6 1.3 569.1 0.4 561.4 1.3 560.0 1.3 565.2 0.3 570.2 0.7 568.0 0.3 5.3
norway 500.6 504.1 0.7 490.3 2.2 513.8 2.6 511.8 2.0 500.9 0.1 495.1 1.2 498.0 0.8 9.5
Poland 539.8 541.2 0.2 542.6 0.5 537.6 0.4 548.1 1.2 554.5 2.9 547.0 1.3 532.5 2.8 9.2
Spain 462.5 453.8 1.6 454.7 1.5 459.1 0.6 469.5 1.3 467.5 0.8 465.1 0.5 464.9 0.7 7.0
Sweden 513.5 507.3 1.1 519.9 1.3 512.8 0.1 519.9 1.0 516.7 0.6 519.4 1.1 506.3 2.0 7.2
Part
ners Colombia 369.2 372.1 0.5 359.4 1.4 362.4 0.9 373.6 0.7 377.8 1.3 370.7 0.2 368.2 0.3 5.3
hong Kong-China 514.2 515.4 0.3 517.0 0.7 507.5 1.4 505.3 1.8 514.6 0.1 520.5 1.3 515.4 0.4 5.8
macao-China 492.0 488.7 0.9 488.2 1.0 483.1 2.7 489.2 0.9 494.6 0.8 488.3 1.1 494.3 2.0 9.5
Overview of the PISA cognitive reporting scalesPISA 2009 is the fourth PISA assessment and also the fourth occasion on which reading, mathematics and science literacy scores have been reported. A central aim of PISA is to monitor trends over time in indicators based upon reading, mathematics and science literacy. In this section we review the stability of the PISA scales over time, with a view to:
•setting out the range of scales that have been prepared over the past four PISA assessments;
•describing their special features and appropriate use; and
•asking recommendations regarding future design elements of PISA.
Table 12.23 provides a listing of the 19 distinct cognitive scales that have been produced as part of PISA 2000, PISA 2003, PISA 2006 and PISA 2009. For the purpose of this overview, the cognitive scales are classified into three types: PISA literacy scales, PISA literacy subscales and special purpose scales. The PISA literacy scales are the key reporting scales that have been established for each domain, when that domain has been the major domain. The PISA literacy subscales are sub-components of PISA overall literacy scales that were provided when a domain was the major domain. The special purpose scales are additional scales that can be used as interim and trend scales prior to the establishment of the related PISA overall literacy scales.
In the table each scale is named, the database upon which it was established is given, the datasets for which it is provided are indicated (a “P” indicates that the dataset exists); and comments are made about the scale’s appropriate use. In the text following, further details are provided on these scales.

12Scaling OutcOmeS
212 © OECD 2012 – PISA 2009 TECHNICAL REPORT
table 12.23 Summary of PiSa cognitive reporting scales
name established 2000 2003 2006 2009 Comment
PISa literacy scale
Print reading 2000 P P P P Trends can be reported between any of the three cycles, by country or by subgroups within countries.
Print mathematics 2003 P P P Trends can be reported between 2003, 2006 and 2009 by country or by subgroups within countries.
Print science 2006 P P Trends can be reported between 2006 and 2009 by country or by subgroups within countries.
PISa literacy subscales
Reading subscale:Retrieving Information 2000 P P
Reading subscale: Interpreting Texts 2000 P P
Reading subscale:Reflection and Evaluation 2000 P P
Reading subscale: Continuous Texts 2009 P
Reading subscale: Non-Continuous Texts 2009 P
Mathematics subscale: Quantity 2003 P
Mathematics subscale: Uncertainty 2003 P
Mathematics subscale:Space and Shape 2003 P P
Established in 2003 and then applied to 2000 with a rescaling (no conditioning). Trends can be reported for countries, but are not optimal for subgroups within countries.
Mathematics subscale:Change and Relationships 2003 P P
Established in 2003 and then applied to 2000 with a rescaling (no conditioning). Trends can be reported for countries, but are not optimal for subgroups within countries.
Science subscale: Explaining Phenomena Scientifically 2006 P
Science subscale:Identifying Scientific Issues 2006 P
Science subscale:Using Scientific Evidence 2006 P
Science subscale: Physical Systems 2006 PLimited conditioning implemented permitting unbiased estimation by country and by gender. Results for other subgroups are not optimal.
Science subscale:Earth and Space Systems 2006 P
Limited conditioning implemented permitting unbiased estimation by country and by gender. Results for other subgroups are not optimal.
Science subscale: Living Systems 2006 PLimited conditioning implemented permitting unbiased estimation by country and by gender. Results for other subgroups are not optimal.
Special purpose scales
Interim mathematics 2000 P
Interim science 2000 P P
Science trend 2003-2006 2006 P P Uses items that were common to PISA 2003 and 2006.
Electronic reading 2009 P
PISA literacy scalesThe primary PISA reporting scales are reading, mathematics and science. These scales were established in the year in which the respective domain was the major domain, since in that year the framework for the domain was fully developed and the domain was comprehensively assessed. When the overall literacy scale is established the mean of the scale is set at 500 and the standard deviation is set at 100 (for the pooled, equally weighted OECD countries) – for example, 500 on the PISA mathematics scale is the mean achievement of assessed students in OECD countries in 2003.
The intention is that these overall literacy scales will stay in place until the specification of the domain is changed or updated.
PISA literacy subscalesAcross the four PISA assessments a total of 19 subscales have been prepared and reported. In PISA 2000, three reading aspect-based scales were prepared; in PISA 2003, four mathematics content-based scales were prepared, in 2006 a total of six science scales were prepared; and in PISA 2009 two text format scales were prepared.
The subscales are typically prepared only in the year in which a domain is a major domain, since when a domain is a major domain there are sufficient items in each sub-area to support the reporting of the scales. The one exception to this general practice is mathematics, for which the space and shape and change and relationships scales were reported for the PISA 2000 data as well as the PISA 2003 data. These scales, which were established in 2003 when mathematics was the major domain, could be applied to the 2000 data because only these two areas of mathematics had been assessed in PISA 2000 and sufficient common items were available to support the scaling.

12Scaling OutcOmeS
PISA 2009 TECHNICAL REPORT – © OECD 2012 213
For the 2000 data the mathematics scales where prepared using a methodology that permits trend analysis at the national level (or at the level of adjudicated regions), but the scales are not optimal for analysis at the level of student sub-groups.3
For science in PISA 2006, two alternative sets of scales were prepared. The first was a set of three process-based scales and the second was a set of three content-based scales. It is important to note that these are alternative scalings that each rely on the same test items. As such, it is inappropriate to jointly analyse scales that are selected from the alternative scalings. For example, it would not be meaningful or defensible to correlate or otherwise compare performance on the “Physical systems” scale, with performance on the using scientific evidence scale. Furthermore the content-based scales can be analysed at the national level (or at the level of adjudicated regions), and can be analysed by gender, but they are not optimal for use at the level of any other student sub-groups, whereas the process-based scales are suitable in addition for sub-group analyses.4
The metric of all of the PISA subscales is set so that scales within a domain can be compared to each other and with the matching overall PISA reporting scale.5
Special purpose scalesThere are three special purpose scales.
An interim mathematics scale was established and reported in PISA 2000. This scale was prepared to provide an overall mathematics score, and it used all of the mathematics items that were included in the PISA 2000 assessment. This scale was discontinued in 2003 when mathematics was the major domain and the alternative and more comprehensive PISA overall mathematics literacy scale was established.
An interim science scale was established and reported in PISA 2000. This scale was prepared to provide an overall science score, and it used all of the science items that were included in the PISA 2000 assessment. The PISA 2003 science data were linked to this scale so that the PISA 2003 science results were also reported on this interim science scale. For PISA 2006 this scale was not provided since science was the major domain and the alternative and more comprehensive overall PISA science scale was established.
To allow comparisons between science outcomes in 2003 and 2006 a science trend 2003-2006 scale was prepared. This scale is based upon the science items that are common to PISA 2003 and 2006 and can be used to examine trends (on those common items) between 2003 and 2006. The PISA 2003 abilities that are based on the common items can be analysed at the national level (or at the level of adjudicated regions), and can be analysed by gender, but they are not optimal for use at the level of any other student sub-groups. The PISA 2006 abilities, associated with the fully developed overall PISA science scale, can be analysed by national subgroups as well.
obServationS concerning the conStruction oF the PiSa overall literacy ScaleSA number of the PISA scales have been established to permit trend analyses. A review of the various links available and necessary to establish these scales is given below. Table 12.24 illustrates the nine linkages of the PISA domains that are examined and discussed below. Links (1), (2) and (3) are for reading 2000 to 2003, 2003 to 2006 and 2006 to 2009 respectively, links (4), (5) and (6) are for mathematics 2000 to 2003, 2003 to 2006 and 2006 to 2009 respectively, links (7), (8) and (9) are for science 2000 to 2003, 2003 to 2006 and 2006 to 2009 respectively.
Table 12.24 also indicates in which data collections the domain was a major domain and on which occasions it was a minor domain. As a consequence one can note that on three occasions the links are major to minor (links (1), (5) and (9)), on three occasions they are minor to minor (links (2), (6) and (7)), and on three occasions they are minor to major (links (3), (4) and (8)).
table 12.24 linkage types among PiSa domains 2000 - 2009
2000 2003 2006 2009
reading major (1) → Minor (2)
→ Minor (3) → major
mathematics Minor (4) → major (5)
→ Minor (6) → Minor
Science Minor (7) → Minor (8)
→ major (9) → Minor

12Scaling OutcOmeS
214 © OECD 2012 – PISA 2009 TECHNICAL REPORT
When a proficiency area is assessed as a major domain there are two key characteristics that distinguish it from a minor domain. First the framework for the area is fully developed and elaborated. Second the framework is comprehensively assessed since more assessment time is allocated to the major domain than is allocated to each of the minor domains.
Framework developmentFor PISA 2000 a full and comprehensive framework was developed for reading to guide the assessment of reading as a major domain. Less fully articulated frameworks were developed to support the assessment of mathematics and science as minor domains.6
For PISA 2003, the mathematics framework was updated and fully developed to support a comprehensive assessment of mathematics. The science frameworks were retained largely as they had been for PISA 2000.7
The key changes to the mathematics framework between 2000 and 2003 were:
•addition of a theoretical underpinning of the mathematics assessment, expanding the rationale for the PISA emphasis on using mathematical knowledge and skills to solve problems encountered in life;
•restructuring and expansion of domain content: expansion from two broad content areas (overarching ideas) to four; removal of all reference to mathematics curricular strands as a separate content categorisation (instead, definitions of the overarching ideas were expanded to include the kinds of school mathematics topics associated with each);
•a more elaborated rational for the existing balance between realistic mathematics and more traditional context-free items, in line with the literacy for life notion underlying OECD/PISA assessments;
•a redeveloped discussion of the relevant mathematical processes: a clearer and much enhanced link between the process referred to as mathematisation, the underlying mathematical competencies, and the competency clusters; and a better operationalisation of the competency classes through a more detailed description of the underlying proficiency demands they place on students; and
•considerable elaboration through addition of examples, including items from previous test administrations.
Clearly, the framework change involving an effective doubling of the mathematical content base of the study was of such significance that trend measures would be very seriously affected. Hence, only scale links to 2000 were possible, and the new framework provided the first comprehensive basis for the calculation of future trend estimates.
For PISA 2006, science was the major domain so the science framework was updated and fully developed to support a comprehensive assessment of science. The reading framework was retained largely as it had been for PISA 2000, and the mathematics framework as it had been for PISA 2003.8 The key changes to the science framework between 2003 and 2006 as they relate to comparison in the science scales over time were:
•A clearer separation of knowledge about science as a form of human enquiry from knowledge of science, meaning knowledge of the natural world as articulated in the different scientific disciplines. In particular, PISA 2006 gives greater emphasis to knowledge about science as an aspect of science performance, through the addition of elements that underscore students’ knowledge about the characteristic features of science and scientific endeavour.
•The addition of new components on the relationship between science and technology.
Both of these changes carry the potential to disrupt links with the previous special purpose science scales: the interim science and trend science scales.
With regard to reading, much of the substance of the PISA 2000 framework was retained in the PISA 2009 framework, respecting one of the central purposes of the PISA project: to collect and report trend information about performance in reading, mathematics and science. However, the PISA domain frameworks are also aimed to be evolving documents that will adapt to and integrate new developments in theory and practice over time. There was therefore some evolution, reflecting both an expansion in our understanding of the nature of reading and changes in the world. At the same time there was no need to develop a new scale for reading, so that performance from 2009 could be compared to 2000.
There were two major modifications in the reading framework:
•incorporating the reading of electronic texts; and
•elaborating the constructs of reading engagement and metacognition.
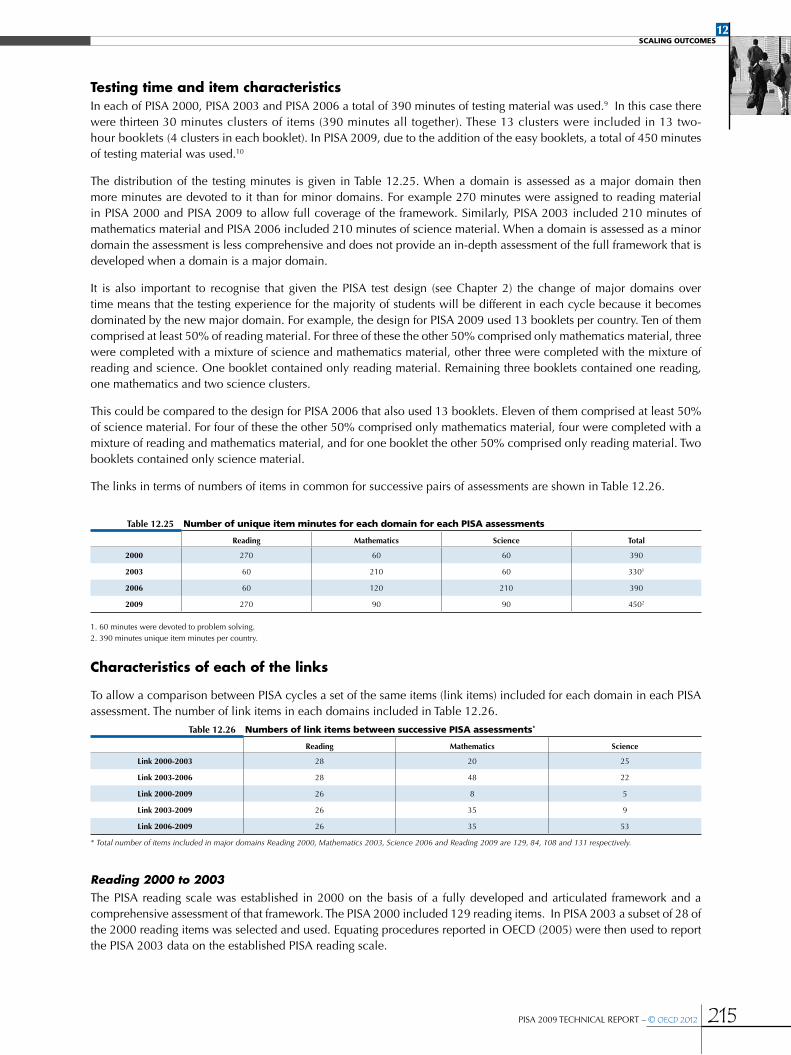
12Scaling OutcOmeS
PISA 2009 TECHNICAL REPORT – © OECD 2012 215
Testing time and item characteristicsIn each of PISA 2000, PISA 2003 and PISA 2006 a total of 390 minutes of testing material was used.9 In this case there were thirteen 30 minutes clusters of items (390 minutes all together). These 13 clusters were included in 13 two-hour booklets (4 clusters in each booklet). In PISA 2009, due to the addition of the easy booklets, a total of 450 minutes of testing material was used.10
The distribution of the testing minutes is given in Table 12.25. When a domain is assessed as a major domain then more minutes are devoted to it than for minor domains. For example 270 minutes were assigned to reading material in PISA 2000 and PISA 2009 to allow full coverage of the framework. Similarly, PISA 2003 included 210 minutes of mathematics material and PISA 2006 included 210 minutes of science material. When a domain is assessed as a minor domain the assessment is less comprehensive and does not provide an in-depth assessment of the full framework that is developed when a domain is a major domain.
It is also important to recognise that given the PISA test design (see Chapter 2) the change of major domains over time means that the testing experience for the majority of students will be different in each cycle because it becomes dominated by the new major domain. For example, the design for PISA 2009 used 13 booklets per country. Ten of them comprised at least 50% of reading material. For three of these the other 50% comprised only mathematics material, three were completed with a mixture of science and mathematics material, other three were completed with the mixture of reading and science. One booklet contained only reading material. Remaining three booklets contained one reading, one mathematics and two science clusters.
This could be compared to the design for PISA 2006 that also used 13 booklets. Eleven of them comprised at least 50% of science material. For four of these the other 50% comprised only mathematics material, four were completed with a mixture of reading and mathematics material, and for one booklet the other 50% comprised only reading material. Two booklets contained only science material.
The links in terms of numbers of items in common for successive pairs of assessments are shown in Table 12.26.
table 12.25 number of unique item minutes for each domain for each PiSa assessments
reading mathematics Science total
2000 270 60 60 390
2003 60 210 60 3301
2006 60 120 210 390
2009 270 90 90 4502
1. 60 minutes were devoted to problem solving.2. 390 minutes unique item minutes per country.
Characteristics of each of the links
To allow a comparison between PISA cycles a set of the same items (link items) included for each domain in each PISA assessment. The number of link items in each domains included in Table 12.26.
table 12.26 numbers of link items between successive PiSa assessments*
reading mathematics Science
Link 2000-2003 28 20 25
Link 2003-2006 28 48 22
Link 2000-2009 26 8 5
Link 2003-2009 26 35 9
Link 2006-2009 26 35 53
* Total number of items included in major domains Reading 2000, Mathematics 2003, Science 2006 and Reading 2009 are 129, 84, 108 and 131 respectively.
Reading 2000 to 2003The PISA reading scale was established in 2000 on the basis of a fully developed and articulated framework and a comprehensive assessment of that framework. The PISA 2000 included 129 reading items. In PISA 2003 a subset of 28 of the 2000 reading items was selected and used. Equating procedures reported in OECD (2005) were then used to report the PISA 2003 data on the established PISA reading scale.

12Scaling OutcOmeS
216 © OECD 2012 – PISA 2009 TECHNICAL REPORT
The trend results for the OECD countries that participated in both PISA 2000 and PISA 2003 showed that of 32 countries, 10 had a significant decline in mean score and 5 had a significant rise in mean score (OECD, 2004).
When reviewing the potential causes for this possible instability a number of relevant issues where observed. First, there was a substantial test design change between PISA 2000 and PISA 2003. The PISA 2003 design was fully balanced whereas the PISA 2000 design systematically placed minor domain items and some reading items at the end of the student booklets (see Adams and Wu, 2002). The complexity of the PISA 2000 design is such that the impact of this on the item parameter estimation and hence the equating is unclear. Second, the units that were selected from PISA 2000 for use in PISA 2003 were edited in minor ways. While none of the individual link items was edited, some items in the units were removed. As with the test design change, the impact of this change on the item parameter estimation and hence the equating is unclear. Third, the clusters of items that were used were not pre-existing clusters. In particular, units from PISA 2000 clusters one to seven were selected and reconstituted as two new clusters. Intact clusters of items could not be used from PISA 2000 since none of the individual pre-existing clusters provided an adequate coverage of the framework.
The percentage correct on reading items that link PISA 2000 and PISA 2003 are given in Table 12.27, with the corresponding scatter plot in Figure 12.5. To compute the percentage correct, all students were included from countries that were included in trend analysis between PISA 2000 and PISA 2003. For this analysis 25 OECD countries were included. Those excluded were the United Kingdom (who did not meet school response rate in 2003), the Netherlands (who did not meet school response rate in 2000), Luxembourg (who used multilingual booklets in 2000), and the Slovak Republic and Turkey (who did not participate in the PISA 2000 study). In addition, recent OECD members such as Chile, Estonia, Israel and Slovenia were not included.
The mean of the differences between PISA 2003 and PISA 2000 is -1.11, and the standard deviation of the differences is 2.82.
table 12.27 international percent correct for reading link items in PiSa 2000 and PiSa 2003
% correct
Item 2000 2003
R055Q01 84.4 82.9
R055Q02 53.4 49.1
R055Q03 62.7 59.8
R055Q05 77.7 72.5
R067Q01 88.5 89.7
R067Q04 54.7 57
R067Q05 62.9 67.1
R102Q04A 37.1 32.4
R102Q05 42.2 44.9
R102Q07 86.2 83.5
R104Q01 83 83.2
R104Q02 41.6 34.5
R104Q05 29.2 24.9
R111Q01 64.8 66.3
R111Q02B 34.2 34
R111Q06B 44.8 44.5
R219Q01 70.2 71.2
R219Q01E 57.4 59.3
R219Q02 76.5 78.8
R220Q01 46.8 44.4
R220Q02B 64.8 64
R220Q04 60.8 61.3
R220Q05 85.5 83.2
R220Q06 66.6 67.1
R227Q01 59 53.8
R227Q02 59.8 57.7
R227Q03 56 54.9
R227Q06 75.2 72.9

12Scaling OutcOmeS
PISA 2009 TECHNICAL REPORT – © OECD 2012 217
• Figure 12.5 •Scatter plot of percentage correct for reading link items in PiSa 2000 and PiSa 2003
100
90
80
70
60
50
40
30
20
10
0
0 10 20 30 40 50 60 70 80 90 100
Ave
rage
% c
orre
ct P
ISA
200
3
Average % correct PISA 2000
Reading link item
Reading 2003 to 2006To link the PISA 2006 data to the PISA reading scale the same 28 items (units and clusters) as were used in PISA 2003 were again used. The trend results for the OECD countries that participated in both PISA 2003 and PISA 2006 showed that of the 38 countries which could be compared, five had a significant decline in mean score and two had a significant rise in mean score (OECD, 2007). The number of significant changes was less than reported for the 2000-2003 link.
A number of reasons might be conjectured as possible explanations of this lack of consistency. First, presenting a large number of reading items with a small number of mathematics and science items interspersed, provides for a very different test-taking experience for students compared to a test with a majority of mathematics items, and a few reading, general problem solving and science items interspersed. This may have impacted on the trend estimates. Second, the mix of reading items by aspect type was somewhat different between the two test administrations. In 2003 there was a larger proportion of score points in the reflection and evaluation aspect than had been the case for 2006.
The percentage correct on reading items that link PISA 2003 and PISA 2006 are given in Table 12.28, with the corresponding scatter plot in Figure 12.6. To compute the percentage correct, all students were included from countries that were included in these trend analyses. For percentage correct, 28 OECD countries were included. Excluded were the United Kingdom (because of low response rate) and the United States (reading scores are not available for PISA 2006 because of a printing error).
The mean of the differences between PISA 2003 and PISA 2006 is -1.17 (PISA 2006 minus PISA 2003), and the standard deviation of the differences is 1.07. The standard deviation of this difference is much less than that for 2000 to 2003 and most likely due to the use of identical items in identical clusters for the two assessments.

12Scaling OutcOmeS
218 © OECD 2012 – PISA 2009 TECHNICAL REPORT
table 12.28 international percent correct for reading link items in PiSa 2003 and PiSa 2006
% correct
Item 2003 2006
R055Q01 81.4 80.9
R055Q02 47.9 46.8
R055Q03 58.2 57.2
R055Q05 72.6 71
R067Q01 89.5 88.2
R067Q04 56.1 55.6
R067Q05 66.4 65.9
R102Q04A 32.4 32.2
R102Q05 43.1 42.8
R102Q07 81.8 82.9
R104Q01 83 80.3
R104Q02 34.3 32.9
R104Q05 25.3 22.8
R111Q01 64.9 63.4
R111Q02B 32.9 33.4
R111Q06B 43.3 40.9
R219Q01 69.6 68.4
R219Q01E 57.5 57.4
R219Q02 78.1 78.8
R220Q01 43.2 42.5
R220Q02B 63.5 61.2
R220Q04 62.1 59.2
R220Q05 83.2 81
R220Q06 67.1 66.4
R227Q01 53.7 52.3
R227Q02 57.9 55
R227Q03 54.4 53.3
R227Q06 71.3 69.3
• Figure 12.6 •Scatter plot of percentage correct for reading link items in PiSa 2003 and PiSa 2006
100
90
80
70
60
50
40
30
20
10
0
0 10 20 30 40 50 60 70 80 90 100
Ave
rage
% c
orre
ct P
ISA
200
6
Average % correct PISA 2003
Reading link item
Reading 2000 to 2009To link the PISA 2009 data to the PISA reading scale the same 28 items (units and clusters) used in both PISA 2003 and PISA 2006 were again used. Two link items were deleted from the link item set because of data entry errors. The trend results for the OECD countries that participated in both PISA 2000 and PISA 2009 showed that of the 38 countries which could be compared, 5 had a significant decline in mean score and 13 had a significant rise in mean score (OECD, 2010b).

12Scaling OutcOmeS
PISA 2009 TECHNICAL REPORT – © OECD 2012 219
• Figure 12.7 •Scatter plot of percentage correct for reading link items in PiSa 2000 and PiSa 2009
100Reading link item
90
80
70
60
50
40
30
20
10
0
0 10 20 30 40 50 60 70 80 90 100
Ave
rage
% c
orre
ct P
ISA
200
9
Average % correct PISA 2000
table 12.29 international percent correct for reading link items in PiSa 2000 and PiSa 2009
% correct
Item 2000 2009
R055Q01 84.4 82.9
R055Q02 53.5 49.7
R055Q03 63.0 60.7
R055Q05 77.8 73.5
R067Q01 88.5 89.2
R067Q04 55.0 57.9
R067Q05 63.2 68.3
R102Q04A 36.9 32.5
R102Q05 42.9 47.2
R102Q07 86.3 84.5
R104Q01 83.2 80.2
R104Q02 41.8 34.9
R104Q05 29.1 20.3
R111Q01 64.7 66.7
R111Q02B 34.8 37.9
R111Q06B 45.1 44.4
R219Q02 77.1 81.6
R220Q01 46.7 41.9
R220Q02B 64.9 63.6
R220Q04 60.6 58.6
R220Q05 85.4 81.4
R220Q06 66.2 66.6
R227Q01 58.6 55.1
R227Q02 59.9 56.3
R227Q03 56.2 56.1
R227Q06 75.4 75.5
The percentage correct on reading items that link PISA 2000 and PISA 2009 are given in Table 12.29, with the corresponding scatter plot in Figure 12.7. To compute the percentage correct, all students were included from countries that were included in these trend analyses. For percentage correct, 26 OECD countries were included. Excluded were the Netherlands, Luxembourg, the Slovak Republic and Turkey. The mean of the differences (PISA 2000 minus PISA 2009) is 1.30, and the standard deviation of the differences is 3.53. The standard deviation of this difference is greater than that for 2003 to 2006 but comparable to the 2000 to 2003 difference and most likely due to the inclusion of the new item clusters.

12Scaling OutcOmeS
220 © OECD 2012 – PISA 2009 TECHNICAL REPORT
Mathematics 2000 to 2003The mathematics framework that was prepared for PISA 2000 was preliminary and the assessment was restricted to two of the so-called big ideas – space and shape, and change and relationships. For the PISA 2003 assessment, when mathematics was a major domain, the framework was fully developed and the assessment was broadened to cover the four overarching ideas – quantity, uncertainty, space and shape, and change and relationships.
Given that the mathematics framework was fully developed for PISA 2003, the PISA mathematics scale was developed at that point. As PISA 2000 had covered two of the four 2003 mathematic scales, only two trend scales could be developed. These were for comparison of performance between 2000 and 2003 for space and shape, and change and relationships.
PISA 2000 and PISA 2003 percentages correct for mathematics space and shape and change and relationships link items are given in Table 12.28, with the corresponding scatter plot in Figure 12.8. Similar to the reading 2000 to 2003 item analysis student responses from only 25 OECD countries were included in computation of the percentage correct.
The mean of the differences between PISA 2003 and PISA 2000 is 2.39, and the standard deviation of the differences is 2.79.
table 12.30 international percent correct for mathematics link items in PiSa 2000 and PiSa 2003
% correct
Item 2000 2003
M033Q01 74.2 77.8
M034Q01 39.3 44.2
M124Q01 35.0 36.3
M124Q03 19.3 20.9
M144Q01 64.1 62.4
M144Q02 26.5 28.6
M144Q03 77.3 77.5
M144Q04 37.5 39.5
M145Q01 58.6 68.2
M150Q01 62.0 68.0
M150Q02 70.0 69.6
M150Q03 45.5 44.7
M155Q01 60.8 65.2
M155Q02 60.1 61.7
M155Q03 14.9 17.1
M155Q04 52.1 57.8
M192Q01 38.1 41.0
M266Q01 20.4 20.5
M273Q01 55.0 55.3

12Scaling OutcOmeS
PISA 2009 TECHNICAL REPORT – © OECD 2012 221
• Figure 12.8 •Scatter plot of percentage correct for mathematics space and shape and change and relationships
link items in PiSa 2000 and PiSa 2003
100
90
80
70
60
50
40
30
20
10
0
0 10 20 30 40 50 60 70 80 90 100
Ave
rage
% c
orre
ct P
ISA
200
3
Average % correct PISA 2000
Mathematics link item
Mathematics 2003 to 2006A set of 48 mathematics items was selected from PISA 2003 and used again in PISA 2006.11 Hence the change from 2003 to 2006 involved reducing the number of items by almost half, and as was the case when reading changed from a major to a minor domain, it was not possible to make such a reduction whilst retaining intact clusters. Four new clusters were formed for PISA 2006 from the units retained from PISA 2003. The trend results for the OECD countries that participated in both PISA 2003 and 2006 showed that of the 39 countries which could be compared 4 had a significant decline in mean score and 4 had a significant rise in mean score (OECD, 2007). The magnitude and number of these changes is consistent with the figures for reading from 2003 to 2006 and with figures observed in other international studies such as TIMSS (Mullis, Martin, and Foy [with Olson, Preuschoff, Erberber, Arora, and Galia], 2008).
The percentage correct on mathematics items that link PISA 2003 and PISA 2006 are given in Table 12.31, with the corresponding scatter plot in Figure 12.9. To compute the percentage correct, all students were included from countries that were included in these trend analyses. For percentage correct, 29 OECD countries were included. The United Kingdom was excluded because it was excluded from PISA 2003.
It is interesting to contrast these results with those observed for reading. At the item level the consistency seems somewhat less for mathematics than for reading, whereas at the scale level the consistency is comparable. It is possible that the item-level inconsistency is caused by the change from mathematics as a major domain to mathematics as a minor domain. Two specific aspects of the change are likely to have contributed to this inconsistency. One is the fact that it was necessary to select a subset of items and form new trend clusters. The rearrangement of items into new clusters appears to have a small impact on relative item difficulty. The second is the fact that the items were presented to students in a different context from before; specifically that the items were no longer from the dominant domain, rather they represented a smaller set of items presented amongst a much larger number of science items.
The mean of the differences (PISA 2003 minus PISA 2006) is 1.40, and the standard deviation of the differences is 1.77. This standard deviation is less than that for reading between 2000 and 2003 but greater than that for reading between 2003 and 2006. This is consistent with the fact that 2003 and 2006 designs where both balanced but, unlike the reading items, the mathematics link items between 2003 and 2006 where not presented in the same clusters.
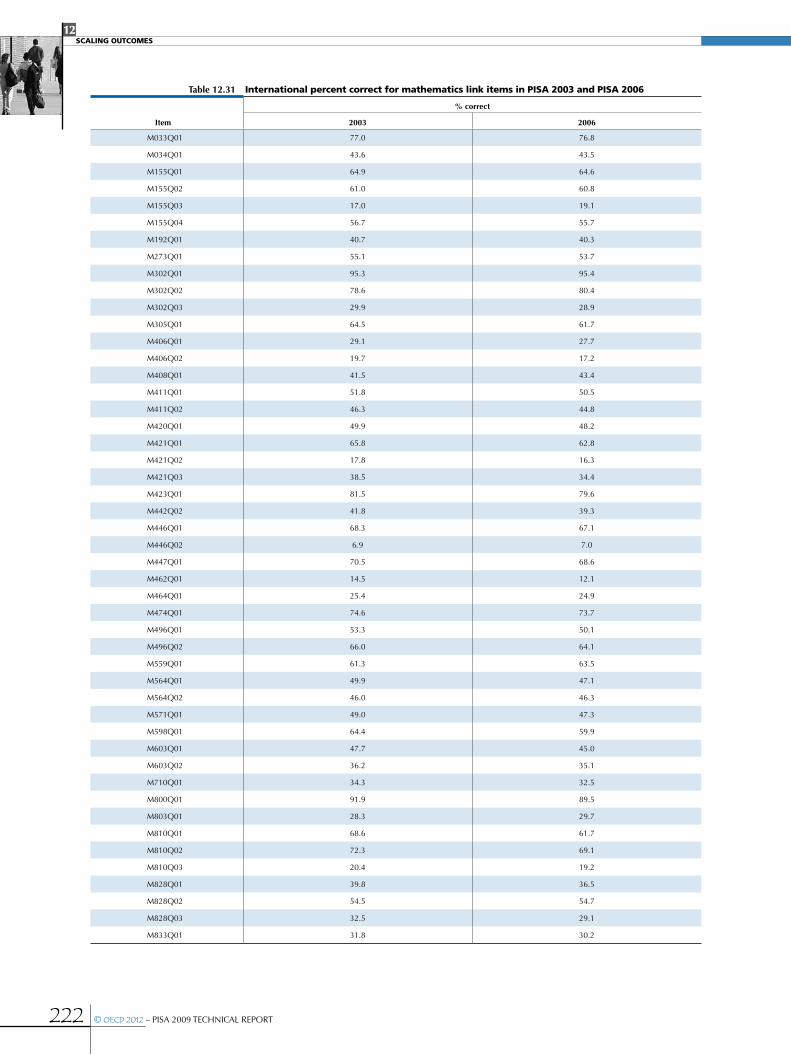
12Scaling OutcOmeS
222 © OECD 2012 – PISA 2009 TECHNICAL REPORT
table 12.31 international percent correct for mathematics link items in PiSa 2003 and PiSa 2006
% correct
Item 2003 2006
M033Q01 77.0 76.8
M034Q01 43.6 43.5
M155Q01 64.9 64.6
M155Q02 61.0 60.8
M155Q03 17.0 19.1
M155Q04 56.7 55.7
M192Q01 40.7 40.3
M273Q01 55.1 53.7
M302Q01 95.3 95.4
M302Q02 78.6 80.4
M302Q03 29.9 28.9
M305Q01 64.5 61.7
M406Q01 29.1 27.7
M406Q02 19.7 17.2
M408Q01 41.5 43.4
M411Q01 51.8 50.5
M411Q02 46.3 44.8
M420Q01 49.9 48.2
M421Q01 65.8 62.8
M421Q02 17.8 16.3
M421Q03 38.5 34.4
M423Q01 81.5 79.6
M442Q02 41.8 39.3
M446Q01 68.3 67.1
M446Q02 6.9 7.0
M447Q01 70.5 68.6
M462Q01 14.5 12.1
M464Q01 25.4 24.9
M474Q01 74.6 73.7
M496Q01 53.3 50.1
M496Q02 66.0 64.1
M559Q01 61.3 63.5
M564Q01 49.9 47.1
M564Q02 46.0 46.3
M571Q01 49.0 47.3
M598Q01 64.4 59.9
M603Q01 47.7 45.0
M603Q02 36.2 35.1
M710Q01 34.3 32.5
M800Q01 91.9 89.5
M803Q01 28.3 29.7
M810Q01 68.6 61.7
M810Q02 72.3 69.1
M810Q03 20.4 19.2
M828Q01 39.8 36.5
M828Q02 54.5 54.7
M828Q03 32.5 29.1
M833Q01 31.8 30.2

12Scaling OutcOmeS
PISA 2009 TECHNICAL REPORT – © OECD 2012 223
• Figure 12.9 •Scatter plot of percentage correct for mathematics link items in PiSa 2003 and PiSa 2006
100
90
80
70
60
50
40
30
20
10
0
0 10 20 30 40 50 60 70 80 90 100
Ave
rage
% c
orre
ct P
ISA
200
6
Average % correct PISA 2003
Mathematics link items
Mathematics 2006 to 2009A set of 35 mathematics items (three out of four PISA 2006 mathematics clusters) was selected from PISA 2006 and used again in PISA 2009.12 The trend results for the OECD countries that participated in both PISA 2006 and PISA 2009 showed that of the 55 countries which could be compared 9 had a significant decline in mean score and 11 had a significant rise in mean score (OECD, 2010b).
The percentage correct on mathematics items that link PISA 2006 and PISA 2009 are given in Table 12.32, with the corresponding scatter plot in Figure 12.10. To compute the percentage correct, all students were included from countries that were included in these trend analyses. For percentage correct, 34 OECD countries were included.
The mean of the differences (PISA 2009 minus PISA 2006) is 0.22, and the standard deviation of the differences is 1.36. The standard deviation of this difference is less than that for 2003 to 2006 and most likely due to the use of identical clusters for the two assessments as it was a case for the reading for 2003 to 2006.
[Part 1/2]
table 12.32 international percent correct for mathematics link items in PiSa 2006 and PiSa 2009
% correct
Item 2006 2009
M033Q01 76.1 75.3
M034Q01T 42.6 42.4
M155Q01 64.3 66.3
M155Q02D 59.8 61.5
M155Q03D 18.3 18.5
M155Q04T 55.0 54.9
M192Q01T 39.4 41.1
M273Q01T 52.9 52.7
M406Q01 26.6 26.7
M406Q02 16.3 16.7
M408Q01T 42.2 40.2
M411Q01 49.0 47.9
M411Q02 44.3 44.8
M420Q01T 47.4 50.6
M423Q01 79.3 79.1
M442Q02 38.4 38.4
M446Q01 66.8 69.0
M446Q02 6.7 7.1

12Scaling OutcOmeS
224 © OECD 2012 – PISA 2009 TECHNICAL REPORT
[Part 2/2]
table 12.32 international percent correct for mathematics link items in PiSa 2006 and PiSa 2009
% correct
Item 2006 2009
M447Q01 67.6 67.4
M462Q01D 12.0 11.4
M464Q01T 23.8 23.2
M474Q01 72.9 73.1
M496Q01T 49.4 51.5
M496Q02 63.1 65.7
M559Q01 62.8 63.3
M564Q01 46.5 46.4
M564Q02 45.9 45.8
M571Q01 46.5 46.6
M603Q01T 44.5 43.5
M603Q02T 34.3 34.8
M800Q01 89.3 89.0
M803Q01T 28.7 27.3
M828Q01 35.9 32.3
M828Q02 53.9 56.0
M828Q03 28.8 28.5
• Figure 12.10 •Scatter plot of percentage correct for mathematics link items in PiSa 2006 and PiSa 2009
100
90
80
70
60
50
40
30
20
10
0
0 10 20 30 40 50 60 70 80 90 100
Ave
rage
% c
orre
ct P
ISA
200
9
Average % correct PISA 2006
Mathematics link item
Science 2000 to 2003Science was a minor domain in both PISA 2000 and 2003. As such the assessment on both of these occasions was less comprehensive than it was in 2006, when a more fully articulated framework and more testing time was available. There were 25 items that were common to both PISA 2000 and PISA 2003. The trend results for the OECD countries that had participated in both PISA 2000 and PISA 2003 showed that of 32 countries, 5 had a significant decline in mean score and 13 a significant rise in mean score (OECD, 2004).

12Scaling OutcOmeS
PISA 2009 TECHNICAL REPORT – © OECD 2012 225
The number of inconsistencies between 2000 and 2003 was greater than expected at both the item-level and at the scale level. When reviewing the potential causes for this possible instability a number of relevant issues were observed. First, as mentioned above for reading, there was a substantial test design change between PISA 2000 and PISA 2003. The complexity of the PISA 2000 design is such that impact of this on the item parameter estimation and hence the equating is unclear. Second, the units that were selected from PISA 2000 for use in PISA 2003 were edited in minor ways. As with reading, while none of the link items were edited, some items in the units were removed. And as with the test design change, the impact of this on the item parameter estimation and hence the equating is unclear. Third, the clusters of items that were used were not pre-existing clusters. The material retained from the two PISA 2000 clusters was supplemented with a small number of new units, and reconstituted as two new clusters. Fourth, there were just 25 link items between these two assessments, and unlike mathematics these items were spread across all aspects of the framework. This number was less than desirable and was a result of choices made concerning the release of items following the 2000 assessment to illustrate the nature of the PISA assessment to the public.
The percentage correct on science items that link PISA 2000 and PISA 2003 are given in Table 12.33, with the corresponding scatter plot in Figure 12.11. To compute the percentage correct, all students were included from countries that were included in these trend analyses. For percentage correct 25 OECD countries were included. The United Kingdom, the Netherlands, Luxembourg, the Slovak Republic and Turkey where excluded because they did not participate in either PISA 2000 or PISA 2003 or because they excluded for quality assurance reasons from either PISA 2000 or PISA 2003. In addition, recent OECD members, such as Chile, Estonia, Israel and Slovenia were not included.
The mean of the differences (PISA 2000 minus PISA 2003) is –0.28, and the standard deviation of the differences is 2.79. This standard deviation is consistent with that observed for reading between 2000 and 2003.
table 12.33 international percent correct for science link items in PiSa 2000 and PiSa 2003
% correct
Item 2000 2003
S114Q03 57.3 55
S114Q04 39.8 36.8
S114Q05 24.9 22.7
S128Q01 62.6 65.7
S128Q02 45.2 49
S128Q03 61.2 62.5
S129Q01 38.8 41.6
S129Q02 17.9 19
S131Q02 50.9 47.9
S131Q04 25.2 26.5
S133Q01 56.7 61.6
S133Q03 42.3 36.6
S133Q04 43.8 44.7
S213Q01 40.3 43.2
S213Q02 76.1 76.6
S252Q01 48.8 52.8
S252Q02 72.2 68.6
S252Q03 55 59.2
S256Q01 88.3 87.3
S268Q01 73.7 72.4
S268Q02 40.8 38.1
S268Q06 57.9 57.4
S269Q01 59.2 60.2
S269Q03 41.8 41.6
S269Q04 35.9 36.5

12Scaling OutcOmeS
226 © OECD 2012 – PISA 2009 TECHNICAL REPORT
• Figure 12.11 •Scatter plot of percentage correct for science link items in PiSa 2000 and PiSa 2003
100
90
80
70
60
50
40
30
20
10
0
0 10 20 30 40 50 60 70 80 90 100
Ave
rage
% c
orre
ct P
ISA
200
3
Average % correct PISA 2000
Science link item
Science 2003 to 2006In PISA 2006, science was the major domain and as such it was comprehensively assessed on the basis of a newly developed and elaborated framework. As noted above there were quite substantial changes between the preliminary framework that had underpinned PISA 2000 and PISA 2003 assessments and the more fully developed framework used for PISA 2006. Note that in addition to the framework changes mentioned above, there was an important change in the way science was assessed in PISA 2006, when compared with PISA 2003 and PISA 2000. First, to more clearly distinguish scientific literacy from reading literacy, the PISA 2006 science test items required on average less reading than the science items used in earlier PISA surveys. Second, as with each domain when it goes from a minor to a major domain the item pool, the testing experience for the majority of students becomes dominated by the new major domain. For example, there were 108 science items used in PISA 2006, compared with 35 in PISA 2003; of these, just 22 items were common to PISA 2006 and PISA 2003 and 14 were common to PISA 2006 and PISA 2000.
Therefore, as the first major assessment of science, the PISA 2006 assessment was used to establish the basis for the PISA science scale.
The percentage correct on science items that link PISA 2003 and PISA 2006 are given in Table 12.34, with the corresponding scatter plot Figure 12.12. To compute the percentage correct, all students were included from countries that were included in these trend analyses. For percentage correct, 29 OECD countries were included. The United Kingdom was excluded because it was excluded from the PISA 2003 Database.
The mean of the differences (PISA 2006 minus PISA 2003) is 0.01, and the standard deviation of the differences is 1.89. This standard deviation is less than for science from 2000 to 2003 but greater than that for reading from 2003 to 2006. As with the previous observations regarding the standard deviations of the differences, this is consistent with PISA test design changes.
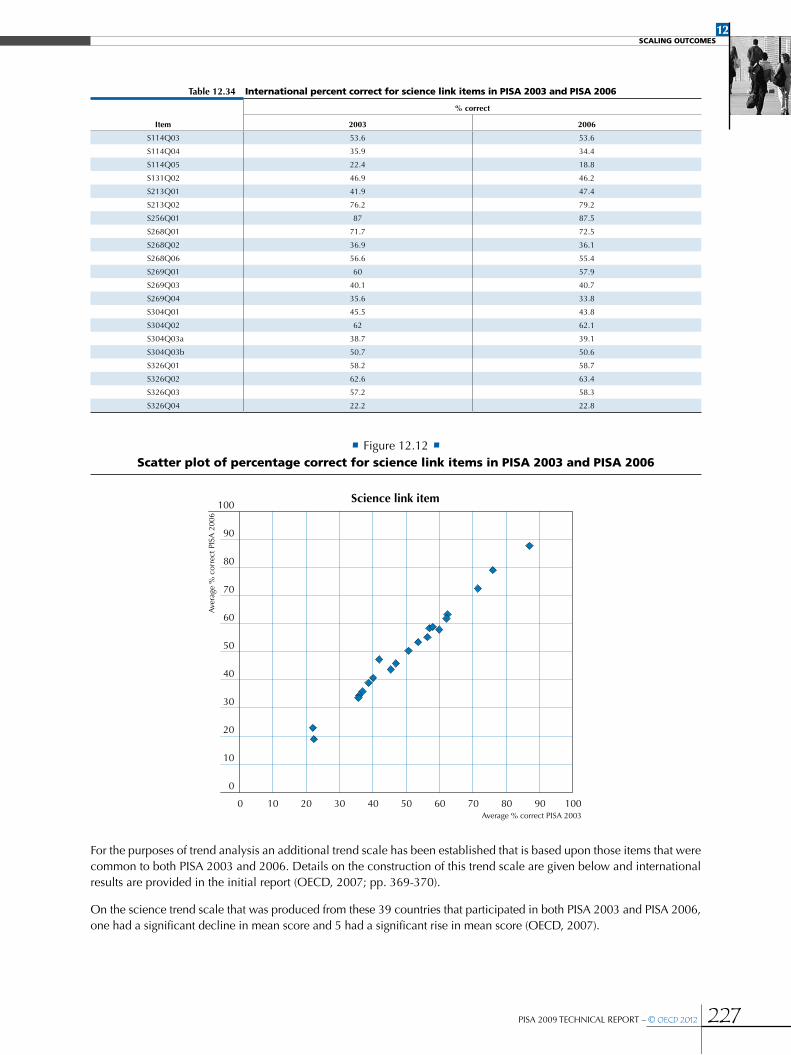
12Scaling OutcOmeS
PISA 2009 TECHNICAL REPORT – © OECD 2012 227
• Figure 12.12 •Scatter plot of percentage correct for science link items in PiSa 2003 and PiSa 2006
100
90
80
70
60
50
40
30
20
10
0
0 10 20 30 40 50 60 70 80 90 100
Ave
rage
% c
orre
ct P
ISA
200
6
Average % correct PISA 2003
Science link item
table 12.34 international percent correct for science link items in PiSa 2003 and PiSa 2006
% correct
Item 2003 2006
S114Q03 53.6 53.6
S114Q04 35.9 34.4
S114Q05 22.4 18.8
S131Q02 46.9 46.2
S213Q01 41.9 47.4
S213Q02 76.2 79.2
S256Q01 87 87.5
S268Q01 71.7 72.5
S268Q02 36.9 36.1
S268Q06 56.6 55.4
S269Q01 60 57.9
S269Q03 40.1 40.7
S269Q04 35.6 33.8
S304Q01 45.5 43.8
S304Q02 62 62.1
S304Q03a 38.7 39.1
S304Q03b 50.7 50.6
S326Q01 58.2 58.7
S326Q02 62.6 63.4
S326Q03 57.2 58.3
S326Q04 22.2 22.8
For the purposes of trend analysis an additional trend scale has been established that is based upon those items that were common to both PISA 2003 and 2006. Details on the construction of this trend scale are given below and international results are provided in the initial report (OECD, 2007; pp. 369-370).
On the science trend scale that was produced from these 39 countries that participated in both PISA 2003 and PISA 2006, one had a significant decline in mean score and 5 had a significant rise in mean score (OECD, 2007).
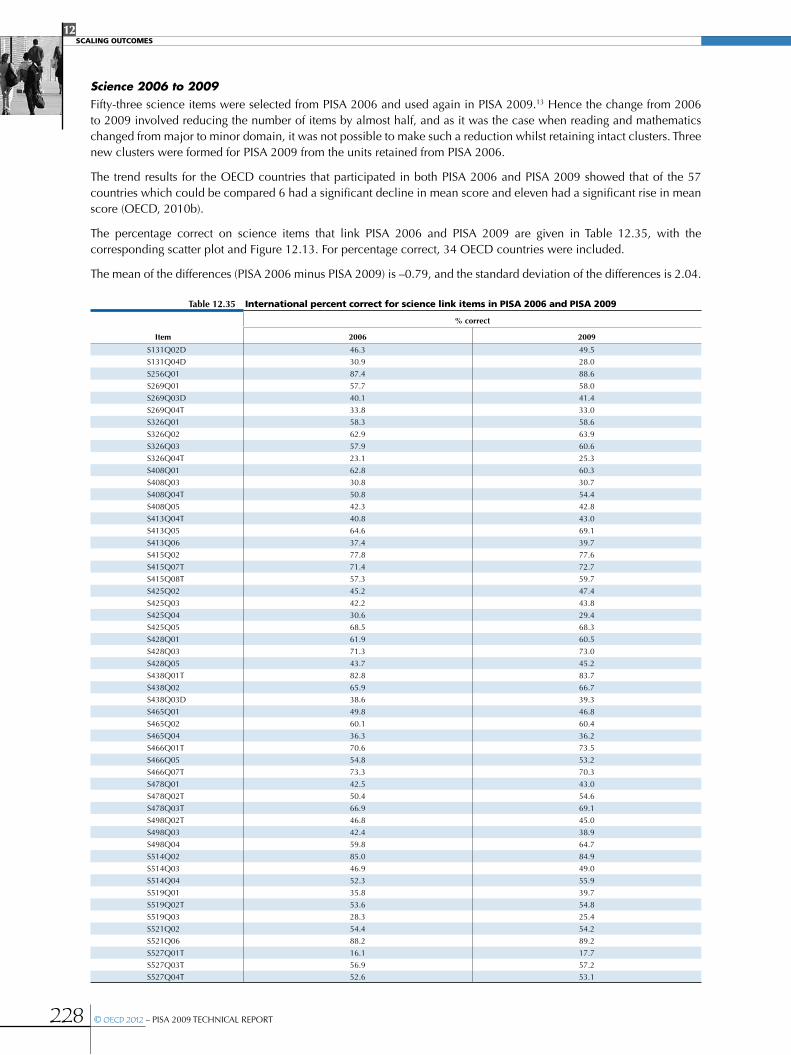
12Scaling OutcOmeS
228 © OECD 2012 – PISA 2009 TECHNICAL REPORT
Science 2006 to 2009Fifty-three science items were selected from PISA 2006 and used again in PISA 2009.13 Hence the change from 2006 to 2009 involved reducing the number of items by almost half, and as it was the case when reading and mathematics changed from major to minor domain, it was not possible to make such a reduction whilst retaining intact clusters. Three new clusters were formed for PISA 2009 from the units retained from PISA 2006.
The trend results for the OECD countries that participated in both PISA 2006 and PISA 2009 showed that of the 57 countries which could be compared 6 had a significant decline in mean score and eleven had a significant rise in mean score (OECD, 2010b).
The percentage correct on science items that link PISA 2006 and PISA 2009 are given in Table 12.35, with the corresponding scatter plot and Figure 12.13. For percentage correct, 34 OECD countries were included.
The mean of the differences (PISA 2006 minus PISA 2009) is –0.79, and the standard deviation of the differences is 2.04.
table 12.35 international percent correct for science link items in PiSa 2006 and PiSa 2009
% correct
Item 2006 2009
S131Q02D 46.3 49.5
S131Q04D 30.9 28.0
S256Q01 87.4 88.6
S269Q01 57.7 58.0
S269Q03D 40.1 41.4
S269Q04T 33.8 33.0
S326Q01 58.3 58.6
S326Q02 62.9 63.9
S326Q03 57.9 60.6
S326Q04T 23.1 25.3
S408Q01 62.8 60.3
S408Q03 30.8 30.7
S408Q04T 50.8 54.4
S408Q05 42.3 42.8
S413Q04T 40.8 43.0
S413Q05 64.6 69.1
S413Q06 37.4 39.7
S415Q02 77.8 77.6
S415Q07T 71.4 72.7
S415Q08T 57.3 59.7
S425Q02 45.2 47.4
S425Q03 42.2 43.8
S425Q04 30.6 29.4
S425Q05 68.5 68.3
S428Q01 61.9 60.5
S428Q03 71.3 73.0
S428Q05 43.7 45.2
S438Q01T 82.8 83.7
S438Q02 65.9 66.7
S438Q03D 38.6 39.3
S465Q01 49.8 46.8
S465Q02 60.1 60.4
S465Q04 36.3 36.2
S466Q01T 70.6 73.5
S466Q05 54.8 53.2
S466Q07T 73.3 70.3
S478Q01 42.5 43.0
S478Q02T 50.4 54.6
S478Q03T 66.9 69.1
S498Q02T 46.8 45.0
S498Q03 42.4 38.9
S498Q04 59.8 64.7
S514Q02 85.0 84.9
S514Q03 46.9 49.0
S514Q04 52.3 55.9
S519Q01 35.8 39.7
S519Q02T 53.6 54.8
S519Q03 28.3 25.4
S521Q02 54.4 54.2
S521Q06 88.2 89.2
S527Q01T 16.1 17.7
S527Q03T 56.9 57.2
S527Q04T 52.6 53.1
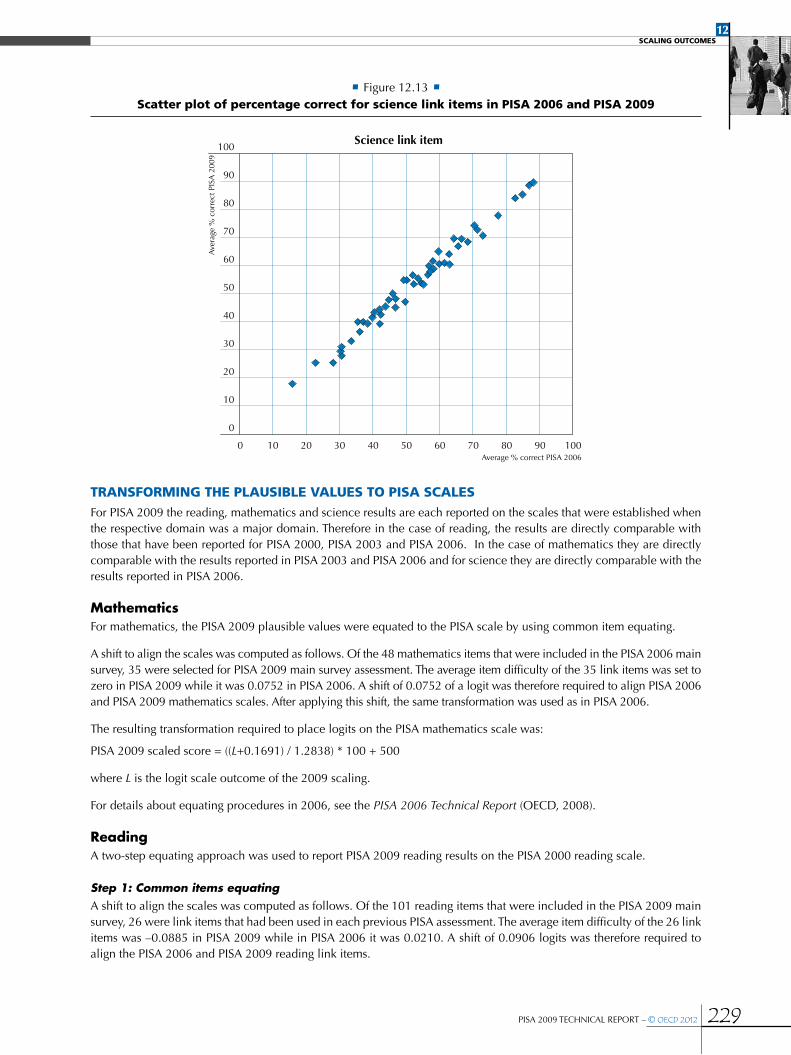
12Scaling OutcOmeS
PISA 2009 TECHNICAL REPORT – © OECD 2012 229
• Figure 12.13 •Scatter plot of percentage correct for science link items in PiSa 2006 and PiSa 2009
100
90
80
70
60
50
40
30
20
10
0
0 10 20 30 40 50 60 70 80 90 100
Ave
rage
% c
orre
ct P
ISA
200
9
Average % correct PISA 2006
Science link item
tranSForMing the PlauSible valueS to PiSa ScaleSFor PISA 2009 the reading, mathematics and science results are each reported on the scales that were established when the respective domain was a major domain. Therefore in the case of reading, the results are directly comparable with those that have been reported for PISA 2000, PISA 2003 and PISA 2006. In the case of mathematics they are directly comparable with the results reported in PISA 2003 and PISA 2006 and for science they are directly comparable with the results reported in PISA 2006.
MathematicsFor mathematics, the PISA 2009 plausible values were equated to the PISA scale by using common item equating.
A shift to align the scales was computed as follows. Of the 48 mathematics items that were included in the PISA 2006 main survey, 35 were selected for PISA 2009 main survey assessment. The average item difficulty of the 35 link items was set to zero in PISA 2009 while it was 0.0752 in PISA 2006. A shift of 0.0752 of a logit was therefore required to align PISA 2006 and PISA 2009 mathematics scales. After applying this shift, the same transformation was used as in PISA 2006.
The resulting transformation required to place logits on the PISA mathematics scale was:
PISA 2009 scaled score = ((L+0.1691) / 1.2838) * 100 + 500
where L is the logit scale outcome of the 2009 scaling.
For details about equating procedures in 2006, see the PISA 2006 Technical Report (OECD, 2008).
ReadingA two-step equating approach was used to report PISA 2009 reading results on the PISA 2000 reading scale.
Step 1: Common items equating A shift to align the scales was computed as follows. Of the 101 reading items that were included in the PISA 2009 main survey, 26 were link items that had been used in each previous PISA assessment. The average item difficulty of the 26 link items was –0.0885 in PISA 2009 while in PISA 2006 it was 0.0210. A shift of 0.0906 logits was therefore required to align the PISA 2006 and PISA 2009 reading link items.

12Scaling OutcOmeS
230 © OECD 2012 – PISA 2009 TECHNICAL REPORT
Step 2: Common person equating To equate PISA 2009 student proficiency scores to PISA scale, the dataset that included PISA 2009 OECD countries was scaled twice, once using all the reading items and once using only link items. The difference between the student proficiency means of these two scalings was 0.1261 logits and this shift was applied to the student PVs to place PISA 2009 student performance to the PISA scale.
After applying this shift, the transformations required to place logits on the PISA reading scale were as given below. Note that the transformation is done separately by gender, as has been the case since PISA 2003.
For female students:PISA 2009 scaled score = ((0.8739 * L – 0.4416) / 1.1002) * 100 + 500
For male students:PISA 2009 scaled score = ((0.8823 * L – 0.5185) / 1.1002) * 100 + 500
For students with missing gender code:PISA 2009 scaled score = ((0.8830 * L – 0.4837) / 1.1002) * 100 + 500
ScienceFor science, the PISA 2009 plausible values were equated to the PISA scale by using the common items equating method.
A shift to align the scales was computed as follows. Of the 103 science items that were included in the PISA 2006 main survey, 53 were selected for the PISA 2009 main survey assessment. The average item difficulty of the 53 link items was set to zero in PISA 2009 while it was 0.0151 in PISA 2006. A shift of 0.0151 of a logit is required to align PISA 2006 and PISA 2009 science scales.
After applying this shift, the transformation required to place logits on the PISA science scales was:PISA 2009 scaled score = ((L– 0.1646) / 1.0724) * 100 + 500
where L is the logit scale outcome of the 2009 scaling.
DRADRA logits were standardised to have mean of 0 and standard deviation of 1 for a combined set of 16 equal weighted OECD countries. Then the mean and standard deviation of PISA paper and pencil reading scale for this combined set was computed. Final linear transformation of the DRA logit value yields a mean and standard deviation of DRA PISA results to be equal to PISA paper and pencil reading results for a combined set.
The transformation required to place DRA logits on the PISA scales was:
PISA 2009 scaled score = (((L-0.5165)/1.1011)*96.3956) + 498.9126
where L is the logit scale outcome of the 2009 scaling.
linK errorLink errors estimated using the methodology discussed in Chapter 9 were computed for the following eleven links: PISA mathematics scales 2003 to 2006, 2006 to 2009 and 2003 to 2009; PISA reading scales 2000 to 2003, 2000 to 2006, 2000 to 2009, 2003 to 2006, 2003 to 2009 and 2006 to 2009; and PISA science scale 2006 to 2009 and science trend scale 2003 to 2006. The results are given in Table 12.36.
table 12.36 link error estimatesLink error on PISa scale
PISA mathematics scale 2003 to 2006 1.382
PISA reading scale 2000 to 2003 4.474
PISA reading scale 2000 to 2006 4.976
PISA reading scale 2003 to 2006 5.307
Interim science scale 2000 to 2003 3.112
Science trend scale 2003 to 2006 4.963
PISA mathematics scale 2003 to 2009 1.990
PISA mathematics scale 2006 to 2009 1.333
PISA reading scale 2000 to 2009 4.937
PISA reading scale 2003 to 2009 4.088
PISA reading scale 2006 to 2009 4.069
PISA science scale 2006 to 2009 2.566

12Scaling OutcOmeS
PISA 2009 TECHNICAL REPORT – © OECD 2012 231
Notes
1. The “Xs” represent a different number of students in each graph.
2. Note that this section refers to cognitive scales only. PISA has also produced a wide range of other scales that are affective or behavioural scales.
3. This is because conditioning variables were not used in the construction of the scales for the PISA 2000 data (see PISA 2003 Technical Report, OECD 2005).
4. This is because gender was the only conditioning variable used in the construction of the content-bases scales. (see PISA 2006 Technical Report, OECD 2008).
5. Note, of course, that as mentioned above comparison across alternative scalings of the same domain are not appropriate.
6. The PISA 2000 frameworks were published as OECD (1999) Measuring Student Knowledge and Skills: A new Framework for Assessment.
7. The PISA 2003 frameworks were published as OECD (2003) The PISA 2003 Assessment Framework: Mathematics, Reading, Science and Problem Solving Knowledge and Skills.
8. The PISA 2006 frameworks were published as OECD (2006) Assessing Scientific, Reading and Mathematical Literacy: A Framework for PISA 2006.
9. In 2003 the total testing time was also 390 minutes, but 60 minutes of that testing time was allocated to an assessment of problem-solving skills.
10. In 2009 the total testing time per country was also 390 minutes.
11. Representing 120 minutes of testing time.
12. Representing 90 minutes of testing time.
13. Representing 90 minutes of testing time.

13
PISA 2009 TECHNICAL REPORT – © OECD 2012 233
Coding Reliability Studies
Consistency analyses ............................................................................................................................................. 234
International coder review ................................................................................................................................ 239

13Coding Reliability StudieS
234 © OECD 2012 – PISA 2009 TECHNICAL REPORT
A substantial proportion of the PISA 2009 items were open-ended and required coding by trained personnel. It was important therefore that PISA implemented procedures which maximised the validity and consistency (both within and between countries) of this coding. Each country coded items on the basis of coding guides prepared by the Consortium (see Chapter 2) using the design described in Chapter 6. Training sessions to train coders from different countries on the use of the coding guides were held prior to both the field trial and the main survey.
This chapter describes the outcomes of three aspects of the coding reliability studies undertaken in conjunction with the field trial and the main survey. These are: i) the consistency analyses undertaken with the field trial data to assist the test developers in constructing valid, reliable scoring rubrics and to inform national centres about within-country coder reliability, ii) the consistency analyses undertaken with the main survey data to assess within-country coder reliability and iii) the international coder review undertaken to examine the between-country consistency in applying the coding guides. The objective of the international coder review was to estimate potential bias (either leniency or harshness) in the coding standards applied in each national centre, and to express this potential bias in PISA units.
conSiStency analySeSBoth in the field trial and the main survey consistency analysis was used to estimate the level of agreement between coders of constructed-response items. In the field trial the primary purpose of the consistency analysis is to obtain data to inform the selection of items for the main survey – in the field trial, many more items were tried than were finally used in the main survey. An obvious goal of PISA is to ensure that coders largely agree in their categorisation of the answers.
The consistency analyses are based on data gained from having the same items coded by a number of different coders. For the PISA 2009 main survey only open-ended items from the first cluster in each booklet were multiple coded. This design also helped to ensure that the amount of missing data was minimised (the amount of missing data and non-responses increases towards the end of the booklet). For their main test language each country was required to randomly assign 100 booklets of each type that they were using for testing for multiple coding, and for minority languages the requirement was at least 50 booklets of each type. There were two groups of countries: those who did standard booklets only (booklets 1-13) and those who did some standard booklets and some non-standard easier booklets (booklets 8-13 and 21-27). There were 20 countries that chose this second option.1
All analysis was done by booklet. Each response was coded by four coders. Only students with four non-missing codes were used for analysis. The following notation is used in this chapter:
i=1,....,I – items in the booklet
c=1,...,C – country-by-language unit
j=1,...,Ji,c – students in the country-by-language unit who attended to the booklet
k=1,...,Kic – coders in the country-by-language unit who coded items in the booklet during multiple coding exercise
xijk=0, 1, 2, ... – code allocated by coder k to student j when coding item i.
To investigate the level of disagreement between coders, the data collected were used to first compute a coder-item disagreement index Rikc. This index was computed for each coder k and each item i across all records j in the multiple coding exercise within a given country-by-language unit c. The index was computed as an average residual multiplied by 100 for readability purposes.
13.1
Rikc= x
icijk
xijkj k
−Σ Σ100J
14
Rikc is then aggregated to compute other indices. A value of Rikc=0 shows a perfect agreement among coders for all students responding to the item of a particular language in the country (e.g. shaded cells for item A in Table 13.1).
Each disagreement between coders contributes to an increase of the index. For example, if coder X disagrees by one score with three others, all of whom agree with each other, the residual for X would be 0.75 and the residual for each of three others would be 0.25. In the example in Table 13.1, coder 201 disagrees by one score with three

13Coding Reliability StudieS
PISA 2009 TECHNICAL REPORT – © OECD 2012 235
other coders 20% of the time when coding item B and there are no other cases of disagreement for this item (a fictitious situation). In this case Rikc=15 for this coder and for the three other coders it is 5.
On the other hand, if two of the coders disagree with the two others in 20% of the cases and there are no other cases of disagreement (this is another fictitious situation with all residuals being 0.5), then Rikc=10 for all coders (shaded cells for item C in Table 13.1).
In a real situation there is always a mix of different combinations of disagreement and the Rikc would look more like shaded cells for items D and E in Table 13.1.
table 13.1 examples of various indices calculated on country-by-language level
Item A Item B Item C Item D Item ECoder reliability
index DkcCoder Coder-item disagreement Rikc
201 0 15 10 9.88 11.82 9.34
202 0 5 10 4.45 10.91 6.07
203 0 5 10 5.14 10.45 6.12
204 0 5 10 5.14 10.45 6.12
Country-by-language item reliability index Sic 0 7.5 10 6.15 10.91
The average across all coders was calculated as a country-by-language item reliability index Sic for each item in each country-by-language unit (13.2) and the average across all items coded by a particular coder was calculated as a coder reliability index Qic (13.3). Examples of some possible Sic values are shown in the bottom line in Table 13.1 and examples of some possible Qic values are shown in the last column in Table 13.1. In this example coder 201 appears less reliable than three other coders.
13.2
Sic = Ric
ikckΣ1
K
13.3
Qkc = Rikci
Σ1I
Sic was further aggregated across all country-by-language units to the international item reliability index (Ti).
13.4
Ti = Sicc
Σ1C
The international item reliability index Ti for each item in the multiple-coding exercise is presented in Table 13.2. In this table we can see that on average mathematics items have fewer inconsistencies between coders than reading and science items. The ten items with the most discrepancies between coders across all domains are shown in bold. There are 8 (out of 57) of them in reading and 2 (out of 17) in science. There are no mathematics items in the top ten. The four highest on discrepancies items in reading were all link items from PISA 2000. The other four have much lower level of discrepancies. All new items improved slightly compared to the field trial.
Let C^ be a set of σ country-by-language units and δ be the number of items in the domain D (D=r for reading, m for mathematics or s for science). The average for each country across all items in each of the three domains is then presented by national domain index NcD.
13.5
NcD = S=
icN
cDi DΣ1
δ1σ c CΣ
The national domain index NcD for three domains (reading, science and mathematics) is presented in Table 13.3. The countries’ highest ten discrepancies across all domains are highlighted in dark blue and countries’ lowest ten discrepancies are highlighted in dark grey. It should be noted that some countries that had a very high level of discrepancies during the field trial improved for the main survey. For example, Latvia had very high level of discrepancies in reading for the Field Trial, but is just outside one standard deviation from the mean for reading for the Main Survey. It can

13Coding Reliability StudieS
236 © OECD 2012 – PISA 2009 TECHNICAL REPORT
be noted from the Table 13.3 that OECD countries have high level of discrepancies only for Science, the domain that they did not do during the Field Trial. Therefore, these discrepancies may be attributed to the lack of training.
An extremely low level of discrepancies (e.g. no discrepancies in Azerbaijan for mathematics) is also highlighted as a potential candidate for bias. To identify bias the international coder review is used. It is described in the next section.
[Part 1/2]
table 13.2 international item reliability indices (ti)
Mathematics
ItemID Ti Number of countries
M155Q01 1.61 63
M155Q02D 4.03 64
M155Q03D 5.18 64
M406Q01 1.32 64
M406Q02 2.21 64
M442Q02 1.05 64
M446Q02 0.84 64
M462Q01D 1.80 64
M828Q01 4.41 64
M828Q02 1.89 64
M828Q03 1.09 64
Science
ItemID Ti Number of countries
S131Q02D 3.35 64
S131Q04D 4.12 64
S269Q01 2.22 64
S269Q03D 2.82 64
S326Q01 4.35 64
S326Q02 3.77 64
S408Q03 5.04 64
S425Q03 7.22 64
S425Q04 3.51 64
S428Q05 3.61 64
S438Q03D 6.88 64
S465Q01 5.95 64
S498Q04 7.86 64
S514Q02 1.40 64
S514Q03 4.39 64
S519Q01 12.06 63
S519Q03 6.09 64
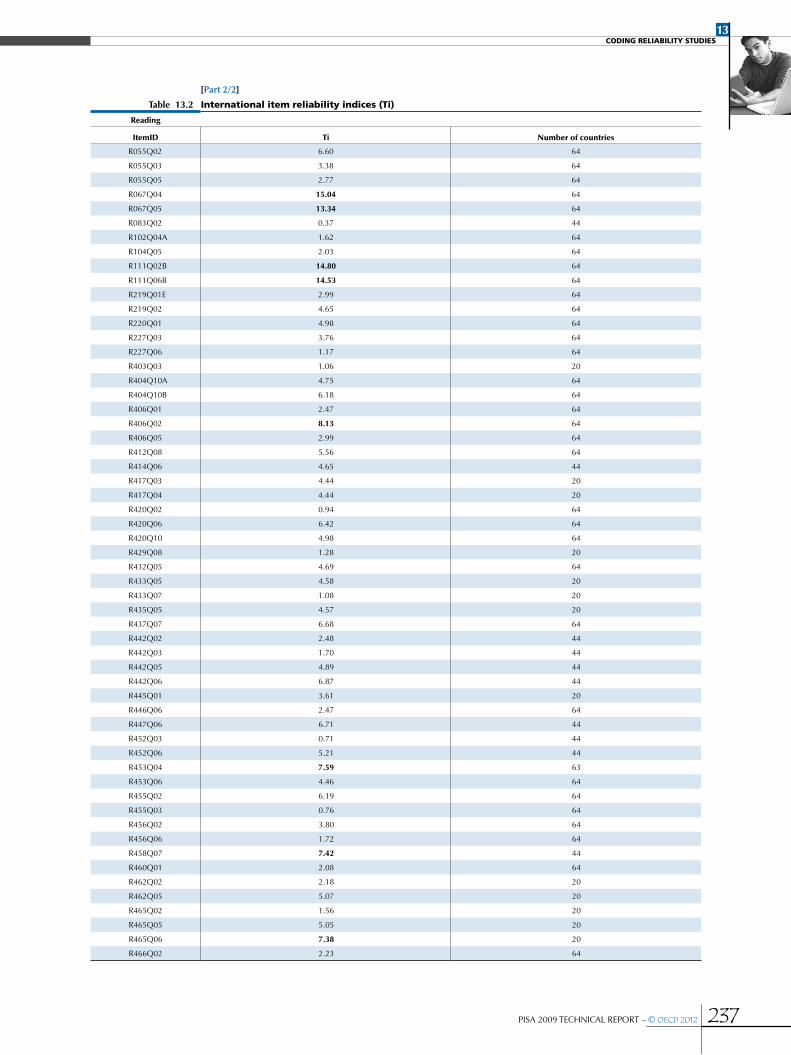
13Coding Reliability StudieS
PISA 2009 TECHNICAL REPORT – © OECD 2012 237
[Part 2/2]
table 13.2 international item reliability indices (ti)
Reading
ItemID Ti Number of countries
R055Q02 6.60 64
R055Q03 3.38 64
R055Q05 2.77 64
R067Q04 15.04 64
R067Q05 13.34 64
R083Q02 0.37 44
R102Q04A 1.62 64
R104Q05 2.03 64
R111Q02B 14.80 64
R111Q06B 14.53 64
R219Q01E 2.99 64
R219Q02 4.65 64
R220Q01 4.98 64
R227Q03 3.76 64
R227Q06 1.17 64
R403Q03 1.06 20
R404Q10A 4.75 64
R404Q10B 6.18 64
R406Q01 2.47 64
R406Q02 8.13 64
R406Q05 2.99 64
R412Q08 5.56 64
R414Q06 4.65 44
R417Q03 4.44 20
R417Q04 4.44 20
R420Q02 0.94 64
R420Q06 6.42 64
R420Q10 4.98 64
R429Q08 1.28 20
R432Q05 4.69 64
R433Q05 4.58 20
R433Q07 1.08 20
R435Q05 4.57 20
R437Q07 6.68 64
R442Q02 2.48 44
R442Q03 1.70 44
R442Q05 4.89 44
R442Q06 6.87 44
R445Q01 3.61 20
R446Q06 2.47 64
R447Q06 6.71 44
R452Q03 0.71 44
R452Q06 5.21 44
R453Q04 7.59 63
R453Q06 4.46 64
R455Q02 6.19 64
R455Q03 0.76 64
R456Q02 3.80 64
R456Q06 1.72 64
R458Q07 7.42 44
R460Q01 2.08 64
R462Q02 2.18 20
R462Q05 5.07 20
R465Q02 1.56 20
R465Q05 5.05 20
R465Q06 7.38 20
R466Q02 2.23 64

13Coding Reliability StudieS
238 © OECD 2012 – PISA 2009 TECHNICAL REPORT
table 13.3 national domain reliability indicesmathematics reading Science
OEC
D australia 2.47 6.23 11.30
austria 3.26 5.81 6.83
Belgium 4.09 3.97 7.67
Canada 6.09 7.10 10.14
Chile 1.31 7.26 6.29
Czech republic 3.28 7.47 6.87
denmark 3.85 8.04 8.92
estonia 2.64 4.85 5.25
Finland 1.81 4.41 4.85
France 2.79 7.78 8.04
germany 4.34 6.05 6.85
greece 0.82 1.32 0.60
hungary 3.23 5.39 1.24
Iceland 2.83 5.91 6.43
Ireland 3.45 5.35 7.10
Israel 4.37 7.48 9.09
Italy 1.76 4.73 5.52
japan 1.37 2.85 1.77
Korea 1.49 3.25 2.44
mexico 1.48 2.96 0.86
netherlands 2.84 6.72 5.44
new Zealand 3.56 5.24 5.76
norway 3.34 4.88 8.17
Poland 2.12 3.67 3.04
Portugal 0.50 6.65 3.89
Slovak republic 1.73 4.27 4.00
Slovenia 1.84 5.62 5.08
Spain 4.09 6.19 7.98
Sweden 3.74 6.00 6.08
Switzerland 3.49 7.98 6.85
turkey 3.24 0.97 4.25
united Kingdom 2.17 4.99 4.48
united States 3.00 0.65 2.64
Part
ners albania 0.28 0.44 0.34
argentina 2.27 2.46 5.50
azerbaijan 0.00 0.55 0.35
Brazil 0.04 1.40 1.02
Bulgaria 1.28 8.53 5.08
Colombia 2.70 10.33 7.02
Croatia 0.83 1.85 2.74
dubai (uae) 3.88 8.41 10.67
hong Kong-China 2.98 3.05 6.44
Indonesia 1.44 6.72 5.71
jordan 0.43 1.52 1.48
Kazakhstan 0.91 0.92 1.20
Kyrgyzstan 1.45 1.88 1.37
Latvia 4.92 7.92 10.50
Lithuania 2.44 5.31 4.79
Luxembourg 2.20 5.61 6.86
macao-China 0.86 0.83 1.13
montenegro 1.50 9.65 9.55
Panama 1.29 7.60 5.60
Peru 2.40 7.50 3.65
Qatar 1.07 1.42 0.83
romania 1.18 6.73 0.83
russian Federation 0.49 0.93 1.11
Serbia 3.26 3.90 5.51
Shanghai-China 1.76 5.25 4.03
Singapore 2.80 7.48 3.76
Chinese taipei 3.12 3.01 5.33
thailand 0.15 0.82 0.64
trinidad and tobago 0.16 1.55 0.46
tunisia 3.30 8.65 9.45
uruguay 4.35 8.43 9.65
International average 2.31 4.89 4.97
Sd 1.35 2.68 3.05
Note: The countries’ highest ten discrepancies across all domains are highlighted in dark blue and countries’ lowest ten discrepancies are highlighted in dark grey.
11.30
9.65
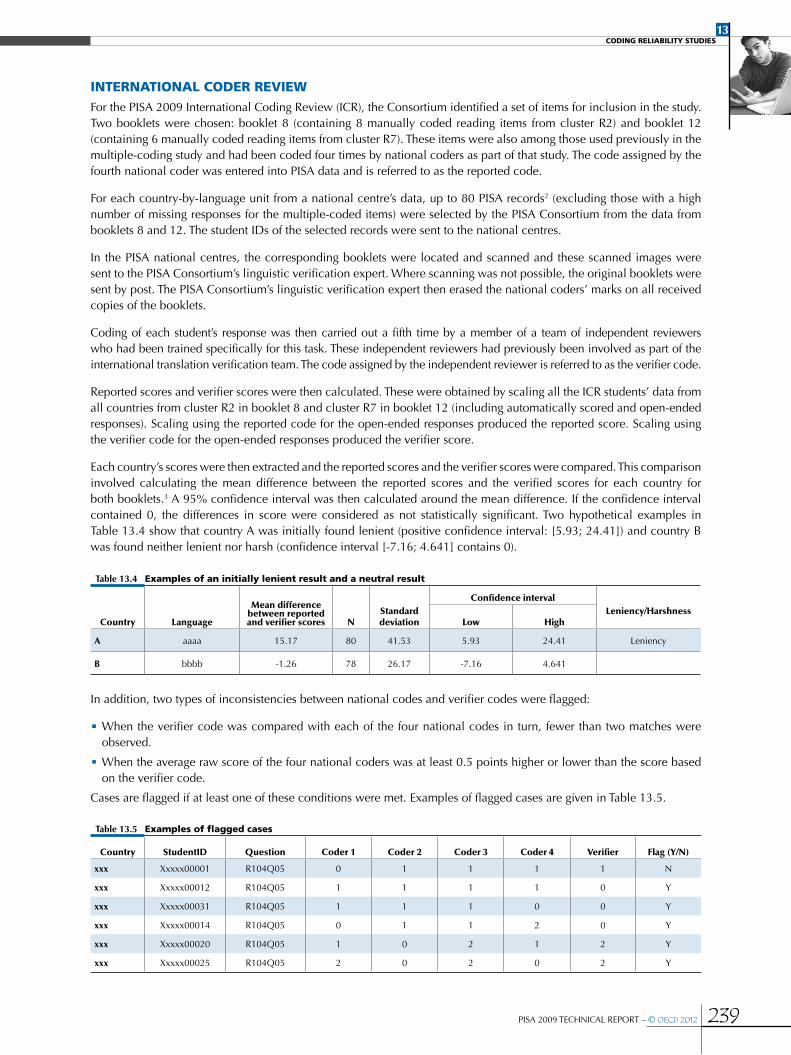
13Coding Reliability StudieS
PISA 2009 TECHNICAL REPORT – © OECD 2012 239
international coder reviewFor the PISA 2009 International Coding Review (ICR), the Consortium identified a set of items for inclusion in the study. Two booklets were chosen: booklet 8 (containing 8 manually coded reading items from cluster R2) and booklet 12 (containing 6 manually coded reading items from cluster R7). These items were also among those used previously in the multiple-coding study and had been coded four times by national coders as part of that study. The code assigned by the fourth national coder was entered into PISA data and is referred to as the reported code.
For each country-by-language unit from a national centre’s data, up to 80 PISA records2 (excluding those with a high number of missing responses for the multiple-coded items) were selected by the PISA Consortium from the data from booklets 8 and 12. The student IDs of the selected records were sent to the national centres.
In the PISA national centres, the corresponding booklets were located and scanned and these scanned images were sent to the PISA Consortium’s linguistic verification expert. Where scanning was not possible, the original booklets were sent by post. The PISA Consortium’s linguistic verification expert then erased the national coders’ marks on all received copies of the booklets.
Coding of each student’s response was then carried out a fifth time by a member of a team of independent reviewers who had been trained specifically for this task. These independent reviewers had previously been involved as part of the international translation verification team. The code assigned by the independent reviewer is referred to as the verifier code.
Reported scores and verifier scores were then calculated. These were obtained by scaling all the ICR students’ data from all countries from cluster R2 in booklet 8 and cluster R7 in booklet 12 (including automatically scored and open-ended responses). Scaling using the reported code for the open-ended responses produced the reported score. Scaling using the verifier code for the open-ended responses produced the verifier score.
Each country’s scores were then extracted and the reported scores and the verifier scores were compared. This comparison involved calculating the mean difference between the reported scores and the verified scores for each country for both booklets.3 A 95% confidence interval was then calculated around the mean difference. If the confidence interval contained 0, the differences in score were considered as not statistically significant. Two hypothetical examples in Table 13.4 show that country A was initially found lenient (positive confidence interval: [5.93; 24.41]) and country B was found neither lenient nor harsh (confidence interval [-7.16; 4.641] contains 0).
table 13.4 examples of an initially lenient result and a neutral result
Country Language
Mean difference between reported and verifier scores N
Standard deviation
Confidence intervalLeniency/Harshness
Low High
a aaaa 15.17 80 41.53 5.93 24.41 Leniency
B bbbb -1.26 78 26.17 -7.16 4.641
In addition, two types of inconsistencies between national codes and verifier codes were flagged:
•When the verifier code was compared with each of the four national codes in turn, fewer than two matches were observed.
•When the average raw score of the four national coders was at least 0.5 points higher or lower than the score based on the verifier code.
Cases are flagged if at least one of these conditions were met. Examples of flagged cases are given in Table 13.5.
table 13.5 examples of flagged cases
Country StudentID Question Coder 1 Coder 2 Coder 3 Coder 4 Verifier Flag (Y/N)
xxx Xxxxx00001 R104Q05 0 1 1 1 1 N
xxx Xxxxx00012 R104Q05 1 1 1 1 0 Y
xxx Xxxxx00031 R104Q05 1 1 1 0 0 Y
xxx Xxxxx00014 R104Q05 0 1 1 2 0 Y
xxx Xxxxx00020 R104Q05 1 0 2 1 2 Y
xxx Xxxxx00025 R104Q05 2 0 2 0 2 Y

13Coding Reliability StudieS
240 © OECD 2012 – PISA 2009 TECHNICAL REPORT
The percentage of flagged cases was calculated for each item in each booklet. Table 13.6 shows that items R111Q02B and R111Q06B in booklet 8 had a high percentage of disagreement in nearly all countries (Table 13.7 shows the same information for booklet 12). These two items also showed a very high percentage of disagreement between national coders across all countries (Table 13.2). Therefore it was decided to exclude these items from calculations of leniency/harshness and to investigate these two items separately. They were adjudicated for English speaking countries. The Consortium adjudicator recoded, blind, all Australian, Irish and Qatar-English student responses in the ICR set for items R111Q02B and R111Q06B. Only 40% agreement with the verifier was obtained on the flagged cases, a result that supports the decision to exclude these items from the calculations of leniency/harshness and subsequently from PISA database.
After exclusion of items R111Q02B and R111Q06B, a country was selected for the adjudication process if it was found lenient or harsh for both booklets (see Table 13.8). This adjudication process involved additional coding by senior Consortium staff of a random sample of 30 student responses from each identified country. The following countries were initially found to be lenient and were adjudicated: Albania, Azerbaijan, Bulgaria, Indonesia, and Romania. The following country-by-language units were initially found to be harsh and were adjudicated: Israel (Arabic coders only), Kazakhstan (Kazakh coders only) and Sweden. It was decided to also adjudicate Brazil due to high number of items having a high percentage of flagged cases between verifier and national coders in both booklets and leniency in booklet 12.
The sampled student responses were back-translated into English, and the responses together with the four national codes and the verifier code for these selected cases were reviewed by the international adjudicator.
Systematic coder harshness or leniency on the national PISA score for each domain is confirmed if the percentage of agreement between verifier and adjudicator is above 50%.
[Part 1/2]
table 13.6 Percentage of flagged records for booklet 8 icr items
Language R055Q02 R055Q03 R055Q05 R104Q05 R111Q02B R111Q06B R227Q03 R227Q06 Total N
albania Albanian 11.25 8.75 18.75 3.75 42.50 25.00 12.50 6.25 10.21 80
argentina Spanish 15.94 1.45 5.80 0.00 17.39 14.49 10.14 1.45 5.80 69
australia English 3.75 2.50 2.50 0.00 33.75 11.25 5.00 0.00 2.29 80
austria German 1.25 6.25 0.00 0.00 27.50 17.50 1.25 0.00 1.46 80
azerbaijan Azerbaijani 38.75 5.00 2.50 3.75 22.50 30.00 8.75 2.50 10.21 80
Belgium Dutch 20.00 8.75 0.00 2.50 36.25 41.25 3.75 0.00 5.83 80
Belgium French 6.25 1.25 1.25 1.25 30.00 30.00 0.00 2.50 2.08 80
Brazil Portuguese 17.65 3.92 27.45 0.00 39.22 13.73 13.73 0.00 10.46 51
Bulgaria Bulgarian 8.75 6.25 6.25 2.50 31.25 32.50 5.00 16.25 7.50 80
Canada English 8.75 2.50 0.00 0.00 35.00 15.00 11.25 2.50 4.17 80
Canada French 2.50 1.25 5.00 1.25 22.50 23.75 10.00 0.00 3.33 80
Chile Spanish 5.00 1.25 5.00 2.50 13.75 21.25 8.75 0.00 3.75 80
Colombia Spanish 8.75 3.75 8.75 0.00 23.75 30.00 15.00 0.00 6.04 80
Croatia Croatian 3.75 1.25 1.25 2.50 12.50 20.00 21.25 1.25 5.21 80
Czech republic Czech 3.75 0.00 1.25 1.25 38.75 15.00 6.25 0.00 2.08 80
denmark Danish 8.75 5.00 2.50 2.50 25.00 21.25 1.25 2.50 3.75 80
dubai (uae) Arabic 8.82 8.82 26.47 5.88 23.53 26.47 2.94 2.94 9.31 34
dubai (uae) English 19.64 1.79 3.57 1.79 21.43 14.29 1.79 0.00 4.76 56
estonia Estonian 3.13 0.00 0.00 1.56 17.19 6.25 6.25 1.56 2.08 64
estonia Russian 0.00 0.00 5.00 0.00 45.00 45.00 10.00 0.00 2.50 20
Finland Finnish 3.75 0.00 0.00 5.00 26.25 18.75 2.50 1.25 2.08 80
France French 3.75 1.25 3.75 2.50 21.25 17.50 6.25 0.00 2.92 80
germany German 7.14 0.00 0.00 3.57 25.00 25.00 0.00 0.00 1.79 28
greece Greek, Modern 11.25 3.75 3.75 1.25 33.75 15.00 8.75 1.25 5.00 80
hong Kong-China Chinese 5.00 3.75 1.25 0.00 25.00 36.25 7.50 0.00 2.92 80
hungary Hungarian 10.00 2.50 3.75 5.00 27.50 32.50 6.25 0.00 4.58 80
Iceland Icelandic 8.86 5.06 6.33 3.80 83.54 30.38 8.86 1.27 5.70 79
Indonesia Indonesian 8.75 0.00 7.50 6.25 31.25 17.50 10.00 3.75 6.04 80
Ireland English 2.50 0.00 2.50 3.75 22.50 15.00 7.50 1.25 2.92 80
Israel Arabic 5.00 2.50 2.50 0.00 27.50 7.50 40.00 0.00 8.33 40
Israel Hebrew 18.75 1.25 5.00 0.00 31.25 22.50 1.25 1.25 4.58 80

13Coding Reliability StudieS
PISA 2009 TECHNICAL REPORT – © OECD 2012 241
[Part 2/2]
table 13.6 Percentage of flagged records for booklet 8 icr items
Language R055Q02 R055Q03 R055Q05 R104Q05 R111Q02B R111Q06B R227Q03 R227Q06 Total N
Italy Italian 3.75 0.00 0.00 1.25 11.25 33.75 3.75 0.00 1.46 80
japan Japanese 21.25 3.75 8.75 7.50 33.75 35.00 3.75 1.25 7.71 80
jordan Arabic 16.25 2.50 11.25 5.00 50.00 20.00 7.50 0.00 7.08 80
Kazakhstan Kazakh 25.00 10.00 7.50 7.50 37.50 55.00 17.50 0.00 11.25 40
Kazakhstan Russian 7.50 2.50 5.00 5.00 17.50 17.50 5.00 0.00 4.17 40
Korea Korean 8.75 0.00 2.50 1.25 55.00 23.75 5.00 0.00 2.92 80
Kyrgyzstan Kyrgyz 12.50 4.69 12.50 4.69 14.06 10.94 10.94 0.00 7.55 64
Kyrgyzstan Russian 3.57 0.00 7.14 0.00 10.71 3.57 7.14 3.57 3.57 28
Latvia Latvian 7.94 6.35 3.17 7.94 30.16 26.98 0.00 1.59 4.50 63
Latvia Russian 4.17 4.17 8.33 4.17 16.67 58.33 8.33 0.00 4.86 24
Lithuania Lithuanian 2.50 2.50 2.50 1.25 7.50 13.75 10.00 0.00 3.13 80
Luxembourg French 4.55 18.18 0.00 4.55 18.18 18.18 4.55 0.00 5.30 22
Luxembourg German 7.81 1.56 0.00 1.56 15.63 28.13 3.13 0.00 2.34 64
macao-China Chinese 38.75 0.00 1.25 0.00 18.75 26.25 5.00 0.00 7.50 80
mexico Spanish 10.13 5.06 8.86 0.00 31.65 30.38 18.99 0.00 7.17 79
montenegroSerbian of a
yekavian variant or Montenegrin
3.75 3.75 3.75 3.75 20.00 20.00 3.75 7.50 4.38 80
netherlands Dutch 20.00 2.50 0.00 0.00 42.50 18.75 6.25 1.25 5.00 80
new Zealand English 6.25 2.50 5.00 2.50 31.25 15.00 1.25 0.00 2.92 80
norway Norwegian 3.75 0.00 1.25 0.00 18.75 15.00 1.25 0.00 1.04 80
Panama Spanish 12.50 3.75 13.75 8.75 37.50 23.75 10.00 1.25 8.33 80
Peru Spanish 10.00 7.50 11.25 1.25 12.50 16.25 23.75 0.00 8.96 80
Poland Polish 6.25 11.25 0.00 2.50 28.75 16.25 3.75 1.25 4.17 80
Portugal Portuguese 5.00 0.00 1.25 1.25 25.00 13.75 1.25 0.00 1.46 80
Qatar Arabic 18.75 1.25 7.50 2.50 27.50 15.00 18.75 0.00 8.13 80
Qatar English 7.50 5.00 5.00 2.50 22.50 12.50 5.00 0.00 4.17 40
romania Romanian 15.00 3.75 5.00 0.00 33.75 45.00 10.00 3.75 6.25 80
russian Federation Russian 7.50 0.00 6.25 2.50 27.50 12.50 13.75 2.50 5.42 80
Scotland English 2.50 0.00 0.00 0.00 26.25 18.75 3.75 1.25 1.25 80
Serbia Serbian 7.50 3.75 3.75 1.25 15.00 16.25 7.50 0.00 3.96 80
Shanghai-China Chinese 1.25 1.25 3.75 0.00 32.50 31.25 6.25 0.00 2.08 80
Singapore English 5.00 2.50 3.75 0.00 38.75 30.00 2.50 1.25 2.50 80
Slovak republic Slovak 6.25 2.50 2.50 0.00 28.75 16.25 5.00 0.00 2.71 80
Slovenia Slovenian 5.88 2.94 2.94 0.00 19.12 10.29 10.29 0.00 3.68 68
Spain Galician 7.50 2.50 2.50 7.50 32.50 17.50 7.50 2.50 5.00 40
Spain Spanish 10.29 7.35 7.35 1.47 35.29 17.65 8.82 1.47 6.13 68
Sweden Swedish 2.50 1.25 0.00 1.25 32.50 12.50 1.25 0.00 1.04 80
Switzerland French 0.00 0.00 0.00 0.00 0.00 9.09 18.18 0.00 3.03 11
Switzerland German 2.04 0.00 2.04 2.04 10.20 14.29 0.00 0.00 1.02 49
Chinese taipei Chinese 11.25 1.25 1.25 0.00 28.75 22.50 5.00 0.00 3.13 80
thailand Thai 13.75 1.25 10.00 0.00 20.00 15.00 17.50 1.25 7.29 80
trinidad and tobago English 8.75 6.25 13.75 3.75 17.50 25.00 5.00 0.00 6.25 80
tunisia Arabic 12.50 3.75 10.00 3.75 25.00 36.25 3.75 0.00 5.63 80
turkey Turkish 8.75 8.75 2.50 0.00 41.25 17.50 13.75 0.00 5.63 80
united Kingdom(excl. Scotland)
English 2.50 0.00 1.25 0.00 20.00 18.75 2.50 1.25 1.25 80
united States English 11.25 3.75 3.75 0.00 20.00 8.75 7.50 0.00 4.38 80
uruguay Spanish 3.80 3.80 10.13 1.27 8.86 18.99 8.86 0.00 4.64 79

13Coding Reliability StudieS
242 © OECD 2012 – PISA 2009 TECHNICAL REPORT
[Part 1/2]
table 13.7 Percentage of flagged records for booklet 12 icr items
Language R432Q05 R446Q06 R456Q02 R456Q06 R460Q01 R466Q02 Total N
albania Albanian 26.25 8.75 15.00 11.25 17.50 2.50 13.54 80
argentina Spanish 5.13 11.54 10.26 1.28 7.69 1.28 6.20 78
australia English 1.25 2.50 3.75 0.00 3.75 1.25 2.08 80
austria German 5.00 0.00 2.50 1.25 3.75 1.25 2.29 80
azerbaijan Azerbaijani 26.25 45.00 6.25 3.75 1.25 20.00 17.08 80
Belgium Dutch 0.00 5.00 11.25 0.00 0.00 7.50 3.96 80
Belgium French 1.25 2.50 2.50 1.25 1.25 7.50 2.71 80
Brazil Portuguese 10.20 2.04 22.45 10.20 10.20 12.24 11.22 49
Bulgaria Bulgarian 10.00 1.25 6.25 5.00 17.50 1.25 6.88 80
Canada English 1.25 1.25 2.50 1.25 1.25 0.00 1.25 80
Canada French 0.00 1.25 2.50 3.75 0.00 6.25 2.29 80
Chile Spanish 5.00 6.25 8.75 6.25 6.25 6.25 6.46 80
Colombia Spanish 7.50 7.50 7.50 1.25 0.00 2.50 4.38 80
Croatia Croatian 3.75 6.25 8.75 5.00 16.25 6.25 7.71 80
Czech republic Czech 2.50 16.25 0.00 0.00 0.00 16.25 5.83 80
denmark Danish 5.00 6.25 5.00 3.75 0.00 1.25 3.54 80
dubai (uae) Arabic 23.53 0.00 26.47 0.00 8.82 5.88 10.78 34
dubai (uae) English 1.79 3.57 7.14 3.57 0.00 5.36 3.57 56
estonia Estonian 4.69 0.00 4.69 4.69 1.56 0.00 2.60 64
estonia Russian 0.00 5.00 0.00 5.00 5.00 0.00 2.50 20
Finland Finnish 0.00 0.00 2.50 1.25 5.00 1.25 1.67 80
France French 2.50 0.00 1.25 0.00 2.50 3.75 1.67 80
germany German 3.33 0.00 3.33 0.00 0.00 10.00 2.78 30
greece Greek, Modern 7.50 1.25 2.50 0.00 2.50 0.00 2.29 80
hong Kong-China Chinese 3.75 1.25 10.00 1.25 1.25 0.00 2.92 80
hungary Hungarian 3.75 8.75 21.25 3.75 10.00 3.75 8.54 80
Iceland Icelandic 3.85 16.67 8.97 3.85 2.56 7.69 7.26 78
Indonesia Indonesian 35.00 8.75 15.00 2.50 5.00 5.00 11.88 80
Ireland English 2.53 0.00 7.59 3.80 5.06 2.53 3.59 79
Israel Arabic 12.50 10.00 22.50 7.50 0.00 2.50 9.17 40
Israel Hebrew 2.50 3.75 7.50 3.75 5.00 1.25 3.96 80
Italy Italian 5.00 5.00 3.75 1.25 1.25 6.25 3.75 80
japan Japanese 2.50 1.25 3.75 1.25 0.00 2.50 1.88 80
jordan Arabic 17.50 2.50 5.00 8.75 0.00 1.25 5.83 80
Kazakhstan Kazakh 20.00 2.50 25.00 15.00 0.00 0.00 10.42 40
Kazakhstan Russian 17.50 5.00 10.00 0.00 0.00 0.00 5.42 40
Korea Korean 6.25 5.00 2.50 1.25 0.00 1.25 2.71 80
Kyrgyzstan Kyrgyz 7.14 1.79 32.14 8.93 7.14 3.57 10.12 56
Kyrgyzstan Russian 7.14 3.57 3.57 0.00 7.14 0.00 3.57 28
Latvia Latvian 9.38 3.13 6.25 3.13 3.13 3.13 4.69 64
Latvia Russian 0.00 0.00 0.00 4.35 4.35 4.35 2.17 23

13Coding Reliability StudieS
PISA 2009 TECHNICAL REPORT – © OECD 2012 243
[Part 2/2]
table 13.7 Percentage of flagged records for booklet 12 icr items
Language R432Q05 R446Q06 R456Q02 R456Q06 R460Q01 R466Q02 Total N
Lithuania Lithuanian 7.50 5.00 7.50 3.75 2.50 1.25 4.58 80
Luxembourg French 4.55 4.55 4.55 4.55 4.55 0.00 3.79 22
Luxembourg German 0.00 1.56 0.00 0.00 6.25 1.56 1.56 64
macao-China Chinese 10.00 11.25 2.50 3.75 0.00 3.75 5.21 80
mexico Spanish 15.00 7.50 13.75 2.50 2.50 1.25 7.08 80
montenegroSerbian of a
yekavian variant or Montenegrin
10.00 0.00 2.50 5.00 1.25 6.25 4.17 80
netherlands Dutch 16.25 1.25 6.25 0.00 1.25 1.25 4.38 80
new Zealand English 2.50 0.00 0.00 0.00 1.25 0.00 0.63 80
norway Norwegian 1.25 1.25 8.75 0.00 1.25 7.50 3.33 80
Panama Spanish 17.50 23.75 22.50 5.00 1.25 6.25 12.71 80
Peru Spanish 11.25 5.00 5.00 1.25 0.00 2.50 4.17 80
Poland Polish 5.00 1.25 5.00 2.50 0.00 2.50 2.71 80
Portugal Portuguese 6.25 2.50 5.00 7.50 2.50 2.50 4.38 80
Qatar Arabic 20.00 5.00 0.00 5.00 7.50 1.25 6.46 80
Qatar English 10.00 10.00 27.50 2.50 0.00 5.00 9.17 40
romania Romanian 23.75 7.50 21.25 2.50 7.50 2.50 10.83 80
russian Federation Russian 13.75 2.50 8.75 3.75 2.50 0.00 5.21 80
Scotland English 1.25 1.25 5.00 0.00 2.50 2.50 2.08 80
Serbia Serbian 13.75 1.25 13.75 2.50 3.75 7.50 7.08 80
Shanghai-China Chinese 6.25 10.00 2.50 0.00 3.75 0.00 3.75 80
Singapore English 5.00 0.00 7.50 0.00 0.00 2.50 2.50 80
Slovak republic Slovak 3.75 1.25 2.50 1.25 13.75 8.75 5.21 80
Slovenia Slovenian 8.57 5.71 10.00 2.86 4.29 12.86 7.38 70
Spain Galician 2.50 2.50 5.00 2.50 0.00 15.00 4.58 40
Spain Spanish 10.00 5.00 15.00 1.25 5.00 3.75 6.67 80
Sweden Swedish 3.75 0.00 7.50 1.25 0.00 1.25 2.29 80
Switzerland French 0.00 0.00 6.67 0.00 0.00 0.00 1.11 15
Switzerland German 2.56 2.56 5.13 0.00 0.00 2.56 2.14 39
Chinese taipei Chinese 2.50 1.25 11.25 0.00 3.75 1.25 3.33 80
thailand Thai 7.59 2.53 6.33 7.59 3.80 3.80 5.27 79
trinidad and tobago English 15.00 2.50 6.25 5.00 2.50 2.50 5.63 80
tunisia Arabic 12.50 3.75 17.50 1.25 1.25 1.25 6.25 80
turkey Turkish 2.50 1.25 23.75 1.25 0.00 2.50 5.21 80
united Kingdom (excl. Scotland) English 1.25 1.25 13.75 1.25 5.00 2.50 4.17 80
united States English 3.75 1.25 6.25 2.50 0.00 2.50 2.71 80
uruguay Spanish 5.06 2.53 8.86 6.33 2.53 0.00 4.22 79

13Coding Reliability StudieS
244 © OECD 2012 – PISA 2009 TECHNICAL REPORT
[Part 1/2]
table 13.8 leniency/harshness analysis
Booklet 8 excluding R111Q02B and R111Q06B Booklet 12 Overall
Language Mean NStd.
deviation CI_lo CI_hi tLeniency/ Harshness Mean N
Std. deviation CI_lo CI_hi t
Leniency/ Harshness
Leniency/ Harshness
albania Albanian 7.34 80 27.30 1.27 13.42 1.99 Lenient 15.17 80 41.53 5.93 24.41 1.99 Lenient Lenient
argentina Spanish 6.35 69 25.19 0.30 12.40 2.00 Lenient -1.26 78 26.17 -7.16 4.64 1.99
australia English 1.82 80 22.04 -3.09 6.72 1.99 4.44 80 21.19 -0.28 9.15 1.99
austria German -0.94 80 20.91 -5.59 3.72 1.99 5.10 80 24.10 -0.27 10.46 1.99
azerbaijan Azerbaijani 18.40 80 23.79 13.10 23.69 1.99 Lenient 10.96 80 33.04 3.61 18.31 1.99 Lenient Lenient
Belgium Dutch 0.48 80 32.87 -6.84 7.79 1.99 4.32 80 31.11 -2.60 11.24 1.99
Belgium French -0.34 80 12.08 -3.03 2.35 1.99 -0.73 80 25.37 -6.38 4.91 1.99
Brazil Portuguese 6.86 51 30.13 -1.61 15.33 2.01 8.15 49 33.79 -1.56 17.85 2.01
Bulgaria Bulgarian 10.40 80 34.25 2.77 18.02 1.99 Lenient 13.34 80 46.01 3.10 23.58 1.99 Lenient Lenient
Canada English 1.41 80 24.54 -4.05 6.87 1.99 -3.07 80 24.48 -8.52 2.38 1.99
Canada French 3.38 80 22.61 -1.65 8.41 1.99 4.50 80 27.58 -1.64 10.64 1.99
Chile Spanish 0.00 80 23.23 -5.17 5.17 1.99 -0.63 80 29.50 -7.19 5.94 1.99
Colombia Spanish -0.21 80 21.67 -5.03 4.61 1.99 1.63 80 30.55 -5.17 8.43 1.99
Croatia Croatian 2.62 80 19.21 -1.66 6.89 1.99 5.14 80 32.02 -1.98 12.27 1.99
Czech republic Czech -1.25 80 20.85 -5.89 3.39 1.99 2.58 80 29.33 -3.94 9.11 1.99
denmark Danish -4.16 80 21.60 -8.97 0.64 1.99 5.74 80 24.23 0.35 11.13 1.99 Lenient
dubai (uae) Arabic 1.06 34 25.27 -7.75 9.88 2.03 6.61 34 35.16 -5.66 18.88 2.03
dubai (uae) English -2.89 56 21.38 -8.62 2.83 2.00 0.51 56 23.96 -5.91 6.92 2.00
estonia Estonian -2.68 64 20.33 -7.76 2.40 2.00 3.74 64 20.93 -1.49 8.96 2.00
estonia Russian -5.18 20 19.80 -14.44 4.09 2.09 -3.01 20 13.70 -9.42 3.40 2.09
Finland Finnish -0.78 80 13.95 -3.88 2.33 1.99 3.30 80 23.61 -1.96 8.55 1.99
France French 4.39 80 18.20 0.33 8.44 1.99 Lenient -2.14 80 35.08 -9.95 5.66 1.99
germany German -2.35 28 17.06 -8.97 4.26 2.05 0.85 30 32.41 -11.25 12.95 2.05
greece Greek, Modern -0.95 80 19.69 -5.33 3.44 1.99 -4.60 80 22.72 -9.66 0.46 1.99
hong Kong-China Chinese 2.42 80 18.30 -1.65 6.49 1.99 8.17 80 32.69 0.89 15.44 1.99 Lenient
hungary Hungarian -2.04 80 20.68 -6.64 2.56 1.99 -11.70 80 48.35 -22.46 -0.94 1.99 Harsh
Iceland Icelandic -3.44 79 28.17 -9.75 2.87 1.99 -20.33 78 34.18 -28.03 -12.62 1.99 Harsh
Indonesia Indonesian 16.35 80 52.59 4.64 28.05 1.99 Lenient 16.39 80 33.50 8.94 23.85 1.99 Lenient Lenient
Ireland English -1.07 80 18.95 -5.28 3.15 1.99 1.95 79 24.84 -3.61 7.51 1.99
Israel Arabic -13.47 40 26.68 -22.00 -4.93 2.02 Harsh -15.65 40 32.91 -26.17 -5.13 2.02 Harsh Harsh
Israel Hebrew -1.28 80 20.43 -5.82 3.27 1.99 -1.92 80 33.64 -9.41 5.56 1.99
Italy Italian -1.37 80 18.06 -5.39 2.65 1.99 0.82 80 37.24 -7.46 9.11 1.99
japan Japanese 5.05 80 25.02 -0.52 10.61 1.99 -3.19 80 24.43 -8.62 2.25 1.99
jordan Arabic -9.02 80 26.20 -14.85 -3.19 1.99 Harsh -1.06 80 29.30 -7.58 5.46 1.99
Kazakhstan Kazakh -9.02 40 25.29 -17.10 -0.93 2.02 Harsh -9.72 40 24.18 -17.46 -1.99 2.02 Harsh Harsh
Kazakhstan Russian -0.23 40 13.56 -4.57 4.11 2.02 3.83 40 22.64 -3.41 11.07 2.02
Korea Korean -0.48 80 19.33 -4.79 3.82 1.99 -0.85 80 20.98 -5.52 3.82 1.99
Kyrgyzstan Kyrgyz -1.96 64 23.87 -7.92 4.01 2.00 -13.33 56 24.12 -19.79 -6.87 2.00 Harsh
Kyrgyzstan Russian -9.55 28 22.14 -18.14 -0.97 2.05 Harsh 7.22 28 20.38 -0.68 15.12 2.05
Latvia Latvian 5.50 63 29.43 -1.92 12.91 2.00 7.23 64 30.15 -0.30 14.76 2.00
Latvia Russian 1.47 24 17.87 -6.08 9.01 2.07 2.61 23 17.40 -4.91 10.14 2.07

13Coding Reliability StudieS
PISA 2009 TECHNICAL REPORT – © OECD 2012 245
[Part 2/2]
table 13.8 leniency/harshness analysis
Booklet 8 excluding R111Q02B and R111Q06B Booklet 12 Overall
Language Mean NStd.
deviation CI_lo CI_hi tLeniency/ Harshness Mean N
Std. deviation CI_lo CI_hi t
Leniency/ Harshness
Leniency/ Harshness
Lithuania Lithuanian 1.28 80 14.85 -2.02 4.59 1.99 -9.69 80 23.21 -14.86 -4.53 1.99 Harsh
Luxembourg French -5.83 22 23.48 -16.24 4.57 2.08 -3.38 22 17.75 -11.25 4.49 2.08
Luxembourg German -0.87 64 15.15 -4.65 2.92 2.00 -1.00 64 21.77 -6.44 4.44 2.00
macao-China Chinese -12.99 80 22.79 -18.06 -7.92 1.99 Harsh 0.16 80 33.83 -7.37 7.69 1.99
mexico Spanish 6.61 79 24.06 1.22 12.00 1.99 Lenient -3.70 80 32.97 -11.04 3.64 1.99
montenegroSerbian of a
yekavian variant or Montenegrin
-5.38 80 20.31 -9.90 -0.86 1.99 Harsh -0.62 80 25.81 -6.36 5.13 1.99
netherlands Dutch 7.18 80 21.36 2.43 11.93 1.99 Lenient 4.31 80 29.34 -2.22 10.84 1.99
new Zealand English -5.68 80 20.55 -10.26 -1.11 1.99 Harsh -0.43 80 17.84 -4.40 3.53 1.99
norway Norwegian -0.70 80 14.42 -3.91 2.51 1.99 1.12 80 25.14 -4.47 6.72 1.99
Panama Spanish 6.00 80 36.78 -2.19 14.19 1.99 17.34 80 35.70 9.39 25.28 1.99 Lenient
Peru Spanish 13.40 80 26.52 7.50 19.30 1.99 Lenient -3.34 80 21.83 -8.20 1.52 1.99
Poland Polish 2.89 80 24.82 -2.64 8.41 1.99 -1.38 80 27.91 -7.59 4.83 1.99
Portugal Portuguese 4.24 80 19.31 -0.06 8.54 1.99 -1.24 80 32.13 -8.39 5.91 1.99
Qatar Arabic -9.49 80 28.46 -15.82 -3.15 1.99 Harsh 1.27 80 21.20 -3.44 5.99 1.99
Qatar English 0.31 40 19.34 -5.87 6.50 2.02 18.07 40 39.00 5.60 30.55 2.02 Lenient
romania Romanian 5.92 80 19.81 1.51 10.32 1.99 Lenient 19.59 80 36.90 11.37 27.80 1.99 Lenient Lenient
russian Federation
Russian -3.21 80 20.62 -7.80 1.38 1.99 -4.93 80 24.16 -10.31 0.44 1.99
Scotland English -0.47 80 14.09 -3.61 2.66 1.99 -1.16 80 23.50 -6.39 4.07 1.99
Serbia Serbian -2.12 80 18.52 -6.24 2.00 1.99 3.27 80 30.27 -3.47 10.01 1.99
Shanghai-China Chinese 9.15 80 27.28 3.08 15.22 1.99 Lenient -5.93 80 36.00 -13.94 2.08 1.99
Singapore English -9.27 80 29.46 -15.83 -2.72 1.99 Harsh 1.81 80 24.84 -3.71 7.34 1.99
Slovak republic Slovak 3.22 80 16.12 -0.37 6.81 1.99 0.79 80 32.84 -6.52 8.10 1.99
Slovenia Slovenian 4.73 68 16.09 0.84 8.63 2.00 Lenient -2.86 70 30.00 -10.01 4.30 1.99
Spain Galician 8.62 40 34.80 -2.50 19.75 2.02 11.87 40 27.14 3.19 20.55 2.02 Lenient
Spain Spanish -3.21 68 21.98 -8.53 2.11 2.00 0.93 80 33.96 -6.62 8.49 1.99
Sweden Swedish -3.31 80 14.86 -6.62 -0.01 1.99 Harsh -21.88 80 39.08 -30.58 -13.18 1.99 Harsh Harsh
Switzerland French -6.95 11 15.47 -17.34 3.44 2.23 -10.74 15 24.18 -24.13 2.65 2.14
Switzerland German 5.44 49 23.10 -1.19 12.08 2.01 4.33 39 17.63 -1.39 10.05 2.02
Chinese taipei Chinese -5.90 80 20.09 -10.37 -1.43 1.99 Harsh 4.00 80 27.37 -2.09 10.09 1.99
thailand Thai -2.20 80 22.50 -7.21 2.80 1.99 -4.01 79 20.79 -8.67 0.64 1.99
trinidad and tobago
English -3.24 80 30.36 -9.99 3.52 1.99 6.90 80 27.43 0.80 13.01 1.99 Lenient
tunisia Arabic 7.02 80 25.87 1.26 12.78 1.99 Lenient -10.11 80 35.83 -18.08 -2.13 1.99 Harsh
turkey Turkish 0.25 80 18.08 -3.78 4.27 1.99 -11.51 80 26.19 -17.34 -5.69 1.99 Harsh
united Kingdom (excl. Scotland)
English 1.85 80 14.34 -1.34 5.04 1.99 -2.99 80 26.76 -8.94 2.97 1.99
united States English -0.66 80 18.38 -4.75 3.43 1.99 -0.05 80 20.08 -4.52 4.42 1.99
uruguay Spanish 2.79 79 20.12 -1.72 7.30 1.99 5.18 79 21.36 0.40 9.97 1.99 Lenient
The coder reliability studies formed part of the data adjudication process undertaken by the PISA Technical Advisory Group to ensure the quality of the data which was publicly released.

13Coding Reliability StudieS
246 © OECD 2012 – PISA 2009 TECHNICAL REPORT
Notes
1. Albania, Argentina, Azerbaijan, Brazil, Bulgaria, Chile, Colombia, Dubai (UAE), Jordan, Kazakhstan, Kyrgyzstan, Mexico, Panama, Peru, Qatar, Romania, Serbia, Trinidad and Tobago, Tunisia, Uruguay.
2. For some adjudicated entities or certain languages all booklets were selected if, for a variety of reasons, there were fewer than 80 PISA records per booklet per country-by-language unit in the multiple coding exercise.
3. These results are further investigated by a Consortium adjudicator to confirm that the leniency or harshness was found to be on the national coder’s side rather than a lenient or harsh international verifier.

14
PISA 2009 TECHNICAL REPORT – © OECD 2012 247
Data Adjudication
Introduction .................................................................................................................................................................. 248
General outcomes .................................................................................................................................................... 251

248 © OECD 2012 – PISA 2009 TECHNICAL REPORT
14Data aDjuDication
introductionThis chapter describes the process used to adjudicate the implementation of PISA 2009 in each of the adjudicated entity (i.e. the participating countries, economies and adjudicated regions) and it gives the outcomes of the data adjudication which are mainly based on the following aspects:
•the extent to which each adjudicated entity met PISA sampling standards;
•the outcomes of the adaptation, translation and verification process;
•the outcomes of the national centre and PISA quality monitoring visits;
•the quality and completeness of the submitted data; and
•the outcomes of the international coding review.
In PISA 2009 all implementation procedures and documentations are developed in accordance with the PISA 2009 Technical Standards (see Annex G). The standards as presented in Annex G were also used as the basis for data adjudication. The areas covered in those standards include the following:
Data standards•Target population and sampling
•Language of testing
•Field trial participation
•Adaptation of tests, questionnaires and manuals
•Translation of tests, questionnaires and manuals
•Test administration
•Implementation of national options
•Security of the material
•Quality monitoring
•Printing of material
•Response coding
•Data submission
Management standards•Communication with the International Contractors
•Notification of international and national options
•Schedule for submission of materials
•Drawing samples
•Management of data
•Archiving of materials
National involvement standards•National feedback
Implementing the standards – quality assuranceNational Project Managers (NPMs) of participating countries, economies and adjudicated regions are responsible for implementing the standards based on Consortium’s advice as contained in the various operational manuals and guidelines. Throughout the cycle of activities for each PISA survey the Consortium carried out quality assurance activities in two steps. The first step was to set up quality control using the operational manuals, as well as the agreement processes for national submissions on various aspects of the project. These processes give the Consortium staff the opportunity to ensure that PISA implementation was planned in accordance with the PISA 2009 Technical Standards, and to provide advice on taking rectifying action when required and before critical errors occurred. The second step was quality monitoring, which involved the systematic collection of data that monitored the implementation of the assessment in relation to the standards. For data adjudication it was the information collected during both the quality control and quality monitoring activities that was used to determine the level of compliance with the standards.

PISA 2009 TECHNICAL REPORT – © OECD 2012 249
14Data aDjuDication
Information available for adjudicationThe Consortium monitors a country’s implementation of the data collection procedures from a range of perspectives and from processes occurring during many stages of the PISA cycle. The information is combined together in the database so that:
•indications of non-compliance with the standards can be identified early on in order to enable rectifying measures;
•the point at which the problem occurred can be easily identified; and
•information relating to the same PISA standard can be cross-checked between different areas or sources.
Many of these data collection procedures refer to specific “milestone” documents that the Consortium requires for Field Trial and Main Survey preparation from each national centre. The data adjudication process provides a motivation for collating and summarising the specific information relating to PISA standards collected in these documents, combined with information collected from specific quality monitoring procedures such as the National Centre Quality Monitoring Interview, PISA Quality Monitor visits and from information in the submitted data.
The quality monitoring information was collected from the following main administrative areas covering various quality monitoring instruments:
•Consortium Administration and Management: information relating to administration processes, agreement of adaptation spreadsheets, submission of information.
•Data analysis: information from the dodgy item reports, Field Trial (FT) sample, Item Information for Cleaning.
•Field operations – Manuals: information from the agreement of adaptations to test administration procedures and field operations.
•Final Optical Check (FOC) team: information from the pre- and post-Main Survey Final Optical Checks of Main Survey booklets.
•Main Survey (MS) Review: information provided by the National Project Managers in the Main Survey Review process.
•National Centre Quality Monitoring (NCQM): information gathered during the pre-Main Survey National Centre Quality Monitoring visit.
•PISA Quality Monitor (PQM) country reports: information gathered via the test session reports from PISA Quality Monitors and through their interviews with School Co-ordinators.
•Sampling: information from the submitted data such as school and student response rates, exclusion rates and eligibility problems.
•Translation: information relating to the verification and translation process.
•PQM co-ordinator: information relating to the recruitment and selection of PISA Quality Monitors and national quality monitoring issues.
•Data cleaners: issues identified during the data cleaning checks and from data cleaners’ reports.
•Item developers: issues identified in the coder query service and training of coders.
•Data processing: issues relating to the eligibility of students tested.
•Questionnaire data: issues relating to the questionnaire data in the national questionnaire reports provided by the Consortium.
•Questionnaire FOC: issues arising from the Final Optical Check of the questionnaires.
Each of the quality monitoring instruments addressed different aspects of the standards and these were collected at different times during the data collection phase. There were two types of PISA Quality Monitoring (PQM) reports, one containing data for each observed session in each school and another detailing the general observations across all schools visited by each quality monitor. The PQM reports contain data related to test administration as well as a record of interview with school co-ordinators. The test administrator session report was completed by the test administrator after each test session and also contained data related to test administration. The data from this report were recorded by the national centre and submitted as part of the national dataset to the Consortium. The National Centre Quality Monitor Interview Schedule contained information on all the standards, as did the Main Survey Review.
The National Centre Quality Monitor Interview Schedule and the Main Survey Review were self-declared by the NPM. The PQM data are collected independently of the NPM.
250 © OECD 2012 – PISA 2009 TECHNICAL REPORT
14Data aDjuDication
Data adjudication processThe main aim of the adjudication process is to make a single determination on each national dataset in a manner that is transparent, based on evidence and defensible. The data adjudication process achieved this through the following steps:
•Step 1: Quality control and quality monitoring data were collected throughout the survey cycle.
•Step 2: Data collected from both quality control and quality monitoring activities were entered into a single quality assurance database.
•Step 3: Experts compiled country-by-country reports that contained quality assurance data for key areas of project implementation.
•Step 4: Experts considered the quality assurance data that were collected from both the quality control and quality monitoring activities, to make a judgement. In this phase the experts collaborated with the project director and other Consortium staff to address any identified areas of concern. Where necessary, the relevant NPM was contacted through the project director. At the end of this phase experts constructed, for each adjudicated dataset, a summary detailing how the PISA technical standards had been met.
•Step 5: The Consortium and the Technical Advisory Group (TAG) reviewed the reports and made a determination with regard to the quality of the data.
Monitoring compliance to any single standard occurs through responses to one or more quality assurance questions regarding test implementation and national procedures which may come from more than one area. For example, the session report data are used in conjunction with the PQM reports and information from the adaptation of national manuals to assess compliance with the PISA session timing standard (6.1).
Information is collected in relation to these standards through a variety of mechanisms: through PISA quality monitor reports; through the field trial and Main Survey reviews; through information negotiated and stored on the MyPISA website in relation to specific PISA implementation tasks; through communications and visits of Consortium staff to national centres; through the formal and informal exchanges between the Consortium and national centres over matters such as sampling, translation and verification, specially requested analyses (such as non-response bias analysis); through a detailed post-hoc inspection of all main survey assessment materials (test booklets); and through the data cleaning and data submission process.
For PISA 2009, an adjudication database was developed to capture, summarise and store the most important information derived from these various information sources. The Consortium staff members who lead each area of work were responsible for identifying relevant information, and entering it into the database. This means that at the time of data adjudication, relevant information is easily accessible for making recommendations about the fitness of use of data from each PISA adjudicated entity.
The adjudication database captures information related to the major phases of the data operation: field operations, sampling, digital reading assessment, questionnaires, cognitive tests. Within each of these phases, the specific activities are identified, and linked directly to the corresponding standards.
Within each section of the database, specific comments are entered that describe the situation of concern, the source of the evidence about that situation, and the recommended action. Each entry is classified as serious, minor or is rated as being of no importance for adjudication. Typically, events classified as serious would warrant very close expert scrutiny, and possibly action affecting adjudication outcomes. Events classified as minor would typically not directly affect adjudication outcomes, but will be reported back to national centres to assist them in reviewing procedures.
It was expected that the data adjudication would result in a range of possible recommendations. Some possible, foreseen recommendations included:
•that the data be declared fit for use;
•that some data be removed for a particular country, for example the removal of data for some items such as open-ended items, or the removal of data for some schools;
•that rectifying action be performed by the NPM, for example; providing additional evidence to demonstrate that there is no non-response bias, or rescoring open-ended items;
•that the data not be endorsed for use in certain types of analyses; and
•that the data not be endorsed for inclusion in the PISA 2009 database.

PISA 2009 TECHNICAL REPORT – © OECD 2012 251
14Data aDjuDication
Throughout PISA 2009 the Consortium concentrated its quality control activities to ensure that the highest scientific standards were met. However during data adjudication a wider definition of quality was used especially when considering data that were at risk. In particular the underlying criterion used in adjudication was fitness for use. That is, data were endorsed for use if they were deemed to be fit for meeting the major intended purposes of PISA.
general outcoMeS
Overview of response rate issuesThe PISA school response rate requirements are discussed in Chapter 4. Figure 14.1 is a scatter plot of the attained PISA school response rates before and after replacements. Those countries that are plotted in the green shaded region were regarded as fully satisfying the PISA school response rate criterion.
• Figure 14.1 •attained school response rates
Before replacement (%)
Afte
r re
plac
emen
t (%
)
100
95
90
85
80
75
70
65
60
55
50
10095908580757065605550
Panama
United Kingdom
United States
Acceptable Intermediate Not acceptable
Three countries, Panama, the United Kingdom and the United States, failed to meet the school response rate requirements.
After reviewing the sampling outcomes, the Consortium asked Panama, the United Kingdom and the United States to provide additional data that would assist the Consortium in making a balanced judgement about the threat of non-response to the accuracy of inferences that could be made from their PISA data.
In each case the Consortium determined that the data were acceptable.
Digital Reading Assessment (DRA)In the absence of agreed technical standards for the response rate of students undertaking the digital reading assessment (DRA), the TAG advised that the desired response rate was 0.8 of the response rate of students undertaking the paper-based assessment. Comments for the response rates of the countries which implemented DRA are discussed with those criteria.

252 © OECD 2012 – PISA 2009 TECHNICAL REPORT
14Data aDjuDication
Detailed country commentsIt is important to recognise that PISA data adjudication is a late but not necessarily final step in the quality assurance process. By the time each country was adjudicated at the TAG meeting that took place in Melbourne in March 2010, various quality assurance mechanisms (such as the sampling procedures documentation, translation verification, data cleaning and site visits) had already been applied at various stages of PISA 2009, and these had identified a range of issues. The purpose of these mechanisms was early identification of potential problems, and intervention to ensure that they had been rectified wherever possible so that data quality would be affected as little as possible. Details on the various quality assurance procedures and their outcomes are documented elsewhere (see Chapter 7).
Data adjudication focused on residual issues that remained after these quality assurance processes had been carried out. There were not many such issues and their projected impact on the validity of the PISA results was deemed to be negligible in most cases. These issues fall under two broad categories: 1) adaptations to the recommended international standard procedures in a country’s data collection plan; and 2) a failure to meet international standards at the implementation stage.
Departures from standard procedures in the national data collection planWith such a broad and diverse range of participation, it is to be expected that the international best practice approaches to data collection articulated in the PISA Technical Standards document may not be achieved in all national and local contexts. This may be the case for a number of reasons. For example, it may be contrary to national protocols to have unannounced visits of quality monitors to schools to observe test administration. Or it may not be possible for teachers from very remote or very small schools to leave their schools to attend training in the mechanics of PISA test administration. Typically these were discussed with Consortium experts in advance of the assessment and alternative approaches were considered jointly between the NPM and the Consortium. In isolated departures from best practice in cases such as these, a judgement might easily be made by Consortium experts that there was minimal risk in relation to the quality of the data collection plan. Such isolated departures are not reported in the country summaries below.
On the other hand, it may not have been straightforward to determine in advance of the assessment how more extensive, or multiple departures from PISA Standards may interact with each other, and with other aspects of a country’s data collection plan. Cases such as these were considered as part of the data adjudication process, and are included in the country summaries below.
Departures from standards arising from implementationDepartures from the standards at the implementation stage range from errors within the national centre (e.g. during the final stages of preparing materials, or in the administration of the coding operation following data collection), through to a failure to meet documented targets during data collection, for example a shortfall from the minimum school and student sample sizes.
A point in the preparation stage that led to significant errors in several countries was in the final stages of the preparation of the test booklets and questionnaire instruments at the national centre, following the final optical check of these materials by the international verification team (see Chapter 5). These errors included a failure to correct errors that had been identified by the international verifiers as part of the final optical check, or the introduction of completely new errors to the booklets and/or questionnaires following the final optical check. An obvious example of such an error (which was emphatically warned against, but nevertheless unfortunately occurred in a number of countries) is in the repagination of the booklets, so that the location of the item components (e.g. stimulus material and multiple-choice responses) would differ from the materials approved internationally. The nature and extent of such errors, the estimated impact on data quality, and actions taken with regard to the international database, are reported in the country summaries below.
A small number of countries failed to reach the required minimum sample sizes of 4 500 students and 150 schools. Such cases were considered as part of the data adjudication process. Even a minor deviation in sample size might be considered a substantive enough issue to report, for example in countries where standard errors tend to be higher for a given sample size. On the other hand, minor deviations from these minimal sample sizes (i.e. shortfalls of fewer than 50 students or 5 schools, and in countries that nevertheless achieved comparable standard errors on the major survey estimates) are not reported below.
A component of the data adjudication process was to consider the cases of multiple, or more complex departures from the PISA standard procedures, as well as to consider the impact of errors or shortfalls across all aspects of each country’s data collection plan and implementation, and make an evaluation with respect to the quality and international comparability of the PISA results. Notable departures from the standards are reported in the country summaries below.

PISA 2009 TECHNICAL REPORT – © OECD 2012 253
14Data aDjuDication
If a country is not listed below then it fully met the PISA standards. Further, in the case of minor deviations from the standards, unless otherwise noted, additional data was available to suggest the data was suitable for use.
Austria There was a non-systematic boycott by students in some schools in some regions. Based on an analysis of the student response patterns, the Consortium proposed a scheme to remove some students from the database and this was agreeable to the Secretariat and to Austria.
AzerbaijanAnalysis of the data for Azerbaijan suggest that the PISA Technical Standards may not have been fully met for the following four main reasons: i) the order of difficulty of the clusters is inconsistent with previous experience and the ordering varies across booklets; ii) the percentage correct on some items is higher than that of the highest scoring countries; iii) the difficulty of the clusters varies widely across booklets; and iv) the coding of items in Azerbaijan is at an extremely high level of agreement between independent coders, and was judged, on some items, to be too lenient. However, further investigation of the survey instruments, the procedures for test implementation and coding of student responses at the national level did not provide sufficient evidence of systematic errors or violations of the PISA Technical Standards. Azerbaijan’s data are, therefore, included in the PISA 2009 international dataset.
CanadaThere was a total of 5.46% exclusions in Canada. A bias analysis showed that the non-response bias would be negligible. It was thought that the extra students excluded were special needs students.
The student response rate for Canada was 79.4%. Additional analysis supported the case that no notable bias would result from non-response.
Canada’s data were, therefore, included in the final database.
ChileThe weighted digital reading assessment (DRA) response rate for Chile was 73%. The TAG guideline for the DRA response rate was 0.8 of the final weighted paper-based PISA rate of 93% (which is 74%) meaning that the TAG guideline for the DRA response rate was not met by Chile.
The Consortium conducted an analysis to determine DRA non-response bias and any effect such bias would have on the country’s imputed DRA scores. This analysis was presented to TAG during the adjudication of the PISA 2009 data and the Consortium and the TAG were satisfied with the outcomes of this analysis and recommended that the DRA data for Chile be included in the international DRA database.
ColombiaThe weighted DRA response rate for Colombia was 69%. The TAG guideline for the DRA response rate was 0.8 of the final weighted paper-based PISA rate of 93% (which is 74%) meaning that the TAG guideline for the DRA response rate was not met by Colombia.
The Consortium conducted an analysis to determine DRA non-response bias and any effect such bias would have on the country’s imputed DRA scores. This analysis was presented to TAG during the adjudication of the PISA 2009 data and the Consortium and the TAG were satisfied with the outcomes of this analysis and recommended that the DRA data for Colombia be included in the international DRA database.
DenmarkOverall exclusions were greater than 5% (8.57%). Data were fully explained – there was a difficulty in defining the school population – some international schools were not included when they should have been. Denmark’s data were included in the international database.
The weighted DRA response rate for Denmark was 63%. The TAG guideline for the DRA response rate was 0.8 of the final weighted paper-based PISA rate of 89% (which is 71%) meaning that the TAG guideline for the DRA response rate was not met by Denmark.

254 © OECD 2012 – PISA 2009 TECHNICAL REPORT
14Data aDjuDication
The Consortium conducted an analysis to determine DRA non-response bias and any effect such bias would have on the country’s imputed DRA scores. This analysis was presented to TAG during the adjudication of the PISA 2009 data and the Consortium and the TAG were satisfied with the outcomes of this analysis and recommended that the DRA data for Denmark be included in the international DRA database.
FranceThe weighted DRA response rate for France was 65%. The TAG guideline for the DRA response rate was 0.8 of the final weighted paper-based PISA rate of 87% (which is 70%) and so the TAG guideline for the DRA rate was not met by France.
The Consortium conducted an analysis to determine DRA non-response bias and any effect such bias would have on the country’s imputed DRA scores. This analysis was presented to TAG during the adjudication of the PISA 2009 data and the Consortium and the TAG were satisfied with the outcomes of this analysis and recommended that the DRA data for France be included in the international DRA database.
IcelandThere were less than 1 200 students assessed in DRA (954). The weighted DRA response rate for Iceland was 63%. The TAG guideline for the DRA response rate was 0.8 of the final weighted paper-based PISA rate of 84% (which is 67%) and so the TAG guideline for the DRA rate was not met by Iceland.
The Consortium conducted an analysis to determine DRA non-response bias and any effect such bias would have on the country’s imputed DRA scores. This analysis was presented to TAG during the adjudication of the PISA 2009 data and the Consortium and the TAG were satisfied with the outcomes of this analysis and recommended that the DRA data for Iceland be included in the international DRA database.
IrelandIn Ireland less than 4 500 students were assessed (3 937 students participated) and less than 150 schools participated (141 schools participated). This was deemed to be acceptable and Ireland’s data were included in the international database.
Italy•Provincia Bolzano
The tests were incorrectly printed. After completing the Final Optical Check the printer made changes which resulted in questions being presented to the students in non-standard ways. After further investigation, it was decided that the data be included.
JapanThe weighted DRA response rate for Japan was 53%. The TAG guideline for the DRA response rate was 0.8 of the final weighted paper-based PISA rate of 95% (which is 76%) and so the TAG guideline for the DRA response rate was not met by Japan.
The Consortium conducted an analysis to determine DRA non-response bias and any effect such bias would have on the country’s imputed DRA scores. This analysis was presented to TAG during the adjudication of the PISA 2009 data and the Consortium and the TAG were satisfied with the outcomes of this analysis and recommended that the DRA data for Japan be included in the international DRA database.
LuxembourgThere was a total of 7.19% exclusions in Luxembourg. Further analysis indicated that the non-response bias would be negligible. The data from Luxembourg, therefore, were included in the international database.
Mexico The tests were incorrectly printed. After completing the Final Optical Check the printer made changes which resulted in questions being presented to the students in non-standard ways. Item difficulty was calculated and no systematic influence was observed in these cases. The data from Mexico, therefore, were included in the international database.
NorwayThere was a total of 6.02% exclusions in Norway. Data were included in the final database.

PISA 2009 TECHNICAL REPORT – © OECD 2012 255
14Data aDjuDication
PanamaPanama: 83.8% school response rate and 3 913 students were assessed in total. Additional analysis supported the case that no notable bias would result from non-response. The data from Panama, therefore, were included in the international database.
Spain•Catalonia
There was a total of 5.97% exclusions in Catalonia. Data were included in the final database.
•Ceuta and Melilla
There were less than 1 500 students assessed (1 483). Data were included in the final database.
•La Rioja
La Rioja had less than 1 500 students assessed (1 427). Data were included in the final database.
•Murcia
There was a total of 5.65% exclusions in Murcia. Murcia had less than 1 500 students assessed (1 490). Data were included in the final database.
TunisiaThe tests were incorrectly printed. After completing the Final Optical Check the printer made changes which resulted in questions being presented to the students in non-standard ways. Item difficulty was calculated and no systematic influence was observed in these cases. The data from Tunisia, therefore, were included in the international database.
United KingdomThe United Kingdom had a school response rate before replacements of 70.2%. After replacement the response rate was 87.2% which was above the PISA standard.
United States There was a total of 5.04% exclusions in the United States. Additional analysis supported the case that no notable bias would result from non-response. It was thought that the extra students excluded were special needs students.
The United States had a school response rate of 77.5%. Additional analysis supported the case that no notable bias would result from non-response. The data from the United States, therefore, were included in the international database.

15
PISA 2009 TECHNICAL REPORT – © OECD 2012 257
Proficiency Scale Construction
Introduction .................................................................................................................................................................. 258
Development of the described scales ...................................................................................................... 259
Defining proficiency levels ............................................................................................................................... 261
Reporting the results for PISA reading .................................................................................................... 263

258 © OECD 2012 – PISA 2009 TECHNICAL REPORT
15Proficiency Scale conStruction
introduction PISA reports student performance not just as scores, but also in terms of content, by describing what students who achieve a given level on a PISA scale typically know and can do. This chapter explains how these “described proficiency scales” are developed, and also how the results are reported and how they can be interpreted.
The scales are called “proficiency scales” rather than “performance scales” because they report what students typically know and can do at given levels, rather than what the individuals who were tested actually did on a single occasion (the test administration). This is because PISA is interested in reporting general results, rather than the results of individuals. PISA uses samples of students and items to make estimates about populations: a sample of 15-year-old students is selected to represent all the 15-year-olds in a country, and a sample of test items from a large pool is administered to each student. Results are then analysed using statistical models that estimate the likely proficiency of the population, based on this sampling.
The PISA test design makes it possible to use techniques of modern item response modelling (see Chapter 9) to simultaneously estimate the ability of all students taking the PISA assessment, and the difficulty of all PISA items, locating these estimates of student ability and item difficulty on a single continuum.
The relative ability of students taking a particular test can be estimated by considering the proportion of test items they get correct. The relative difficulty of items in a test can be estimated by considering the proportion of test takers getting each item correct. The mathematical model employed to analyse PISA data, generated from a rotated test design in which students take different but overlapping tasks, is implemented through test analysis software that uses iterative procedures to simultaneously estimate the likelihood that a particular person will respond correctly to a given test item, and the likelihood that a particular test item will be answered correctly by a given student. The result of these procedures is a set of estimates that enables a continuum to be defined, which is a realisation of the variable of interest. On that continuum it is possible to estimate the location of individual students, thereby seeing how much of the literacy variable they demonstrate, and it is possible to estimate the location of individual test items, thereby seeing how much of the literacy variable each item embodies. This continuum is referred to as the overall PISA literacy scale in the relevant test domain of reading, mathematics or science.
PISA assesses students, and uses the outcomes of that assessment to produce estimates of students’ proficiency in relation to a number of literacy variables. These variables are defined in the relevant PISA literacy framework (OECD, 2009). For each of these literacy variables, one or more scales are defined, which stretch from very low levels of literacy through to very high levels. What such a scale means in terms of student proficiency is that students whose ability estimate places them at a certain point on the PISA literacy scale would most likely be able to successfully complete tasks at or below that location, and increasingly more likely to complete tasks located at progressively lower points on the scale, but would be less likely to be able to complete tasks above that point, and increasingly less likely to complete tasks located at progressively higher points on the scale. Figure 15.1 depicts a literacy scale, stretching from relatively low levels of literacy at the bottom of the figure, to relatively high levels towards the top. Six items of varying difficulty are placed along the scale, as are three students of varying ability. The relationship between the students and items at various levels is described.
It is possible to describe the scales using words that encapsulate various demonstrated competencies typical of students possessing varying amounts of the underlying literacy constructs. Each student’s location on those scales is estimated, and those location estimates are then aggregated in various ways to generate and report useful information about the literacy levels of 15-year-old students within and among participating countries.
Development of a method for describing proficiency in PISA reading, mathematical and scientific literacy occurred in the lead-up to the reporting of outcomes of the PISA 2000 survey and was revised in the lead-up to the PISA 2003 and PISA 2006 surveys. Essentially the same methodology has again been used to develop proficiency descriptions for PISA 2009. Given the volume and breadth of data that were available from the PISA 2009 assessment, review and extension of the descriptions of print reading literacy that had been developed from the PISA 2000 data became possible. The detailed proficiency descriptions that had been developed for the mathematics domain in PISA 2003 were used again with the reduced data available from PISA 2006 and 2009; and the descriptions used for science in 2006 were used again with the reduced data available from 2009. In addition, a new described proficiency scale for digital reading was developed using the data collected from Digital Reading Assessment DRA in PISA 2009.
The Reading Expert Group (REG) worked with the Consortium to review and revise the sets of described proficiency scale and subscales for PISA print reading, and to develop the DRA described proficiency scale.
This chapter discusses the methodology used to develop those scales and to describe a number of levels of proficiency in the different PISA literacy variables, and presents the outcomes of that development process.

PISA 2009 TECHNICAL REPORT – © OECD 2012 259
15Proficiency Scale conStruction
• Figure 15.1 •the relationship between items and students on a proficiency scale
Item VI
Item V
Item IV
Item III
Item II
Item I
Items with relatively high difficulty
Items with moderate difficulty
Items with relatively low difficulty
It is expected that Student C will be unable to complete Items II to VI successfully and will also have a low probability of completing Item I successfully.
Student C, with relatively low proficiency
It is expected that Student A will be able to complete Items I to V successfullyand probably Item VI as well.
Student A, with relatively high proficiency
It is expected that Student B will be able to complete Items I, II and III successfully, will have a lower probability of completing Item IV and is unlikely to complete Items V and VI successfully.
Student B, with moderate proficiency
Reading literacy scale
develoPMent oF the deScribed ScaleSSince PISA 2000 the development of described proficiency scales for PISA has been carried out through a process involving a number of stages. The stages are described here in a linear fashion, but in reality the development process involved some backwards and forwards movement where stages were revisited and descriptions were progressively refined.
Stage 1: Identifying possible scalesThe first stage in the process involved the experts in each domain articulating possible reporting scales (dimensions) for the domain.
For reading in the PISA 2000 survey cycle, two main options were actively considered – scales based on the type of reading task, and scales based on the form of reading material. For the international report, the first of these was implemented, leading to the development of scales to describe the types of reading tasks, or “aspects” of reading: a subscale for retrieving information, a second subscale for interpreting texts and a third for reflection and evaluation.1 The thematic report for PISA 2000, Reading for Change, also reported on the development of subscales based on the form of reading material: continuous texts and non-continuous texts (OECD, 2002). Volume I of the PISA 2009 international report includes descriptions of both of these sets of subscales as well as a combined print reading scale (OECD, 2010b). The names of the aspect subscales were modified in order to better apply to digital as well as print reading tasks. The modified aspect category names are access and retrieve (replacing retrieving information), integrate and interpret (replacing interpreting texts) and reflect and evaluate (for reflection and evaluation). For digital reading, a separate, single scale has been developed based on the DRA items administered in 19 countries in PISA 2009 as an international option (OECD, 2011).
In the case of mathematics, a single proficiency scale was developed for PISA 2000. With the additional data available in the 2003 survey cycle, when mathematics was the major test domain, the possibility of reporting according to the four overarching ideas or the three competency clusters described in the PISA mathematics framework were both considered. Accordingly, in 2003 subscales based on the four overarching ideas – space and shape, change and relationships, quantity and uncertainty – were reported. In PISA 2006 and PISA 2009, when mathematics was again a minor domain, a single scale only was reported.
260 © OECD 2012 – PISA 2009 TECHNICAL REPORT
15Proficiency Scale conStruction
For science, given the small number of items in PISA 2000 and PISA 2003, a single overall proficiency scale was developed to report results. As with mathematics in 2003, the expanded focus on science in 2006 allowed for a division into scales for reporting purposes. Two forms of scale were considered. One of these was based on definitions of scientific competencies involving the identification of scientific issues, the explanation of phenomena scientifically and the use of scientific evidence. The other form separated scientific knowledge into “knowledge of science” involving the application of scientific concepts in the major fields of physics, chemistry, biology, earth and space science, and technology; and “knowledge about science” involving the central processes underpinning in the way scientists go about obtaining and using data – in other words, understanding scientific methodology. The scales finally selected for inclusion in the PISA 2006 database were the three competency based scales: identifying scientific issues, explaining phenomena scientifically and using scientific evidence. In PISA 2009, science as a minor domain was reported as a single scale only.
Wherever subscales were under consideration, they arose clearly from the framework for the domain, they were seen to be meaningful and potentially useful for feedback and reporting purposes, and they needed to be defensible with respect to their measurement properties. Due to the longitudinal nature of the PISA project, the decision about the number and nature of reporting scales also had to take into account the fact that in some test cycles a domain will be treated as minor and in other cycles as major.
Stage 2: Assigning items to scalesThe second stage in the process was to associate each test item used in the study with each of the subscales under consideration. Domain experts (including members of the relevant subject matter expert group, the test developers and Consortium staff) judged the characteristics of each test item against the relevant framework categories. Later, statistical analysis of item scores from the field trial was used to obtain a more objective measure of fit of each item to its assigned subscale.
Stage 3: Skills auditThe next stage involved a detailed expert analysis of each item, and in the case of items with partial credit, for each score step within the item, in relation to the definition of the relevant subscale from the domain framework. The skills and knowledge required to achieve each score step were identified and described.
This stage involved negotiation and discussion among the experts involved, circulation of draft material, and progressive refinement of drafts on the basis of expert input and feedback. Further detail on this analysis is provided below.
Stage 4: Analysing field trial dataFor each set of scales being considered, the field trial item data were analysed using item response techniques to derive difficulty estimates for each achievement threshold for each item.
Many items had a single achievement threshold (associated with students providing a correct rather than incorrect response). Where partial credit was available, more than one achievement threshold could be calculated (achieving a score of one or more rather than zero, two or more rather than one, and so on).
Within each scale, achievement thresholds were placed along a difficulty continuum linked directly to student abilities. This analysis gives an indication of the utility of each scale from a measurement perspective.
Stage 5: Defining the dimensionsThe information from the domain-specific expert analysis (Stage 3) and the statistical analysis (Stage 4) were combined. For each set of scales being considered, the item score steps were ordered according to the size of their associated thresholds and then linked with the descriptions of associated knowledge and skills, giving a hierarchy of knowledge and skills that defined the dimension. Clusters of skills were found using this approach, which provided a basis for understanding each dimension and describing proficiency in different regions of the scale.
Stage 6: Revising and refining with main survey dataWhen the main survey data became available, the information arising from the statistical analysis about the relative difficulty of item thresholds was updated. This enabled a review and revision of Stage 5 by the working groups and other interested parties. The preliminary descriptions and levels were then reviewed and revised in the light of further technical information that was provided by the TAG, and the approach to defining levels and associating students with those levels that had been used in the reporting of PISA 2000, PISA 2003 and PISA 2006 results was applied.

PISA 2009 TECHNICAL REPORT – © OECD 2012 261
15Proficiency Scale conStruction
deFining ProFiciency levelSHow should we divide the proficiency continuum up into levels that might have some utility? And having defined levels, how should we decide on the level to which a particular student should be assigned? What does it mean to be at a level? The relationship between the student and the items is probabilistic: that is, there is some probability that a particular student can correctly do any particular item. If a student is located at a point above an item, the probability that the student can successfully complete that item is relatively high, and if the student is located below the item, the probability of success for that student on that item is relatively low.
This leads to the question as to the precise criterion that should be used to locate a student on the same scale as that on which the items are laid out. When placing a student at a particular point on the scale, what probability of success should we deem sufficient in relation to items located at the same point on the scale? If a student were given a test comprising a large number of items each with the same specified difficulty, what proportion of those items would we expect the student to successfully complete? Or, thinking of it in another way, if a large number of students of equal ability were given a single test item with a specified item difficulty, about how many of those students would we expect to successfully complete the item?
The answer to these questions is essentially arbitrary, but in order to define and report PISA outcomes in a consistent manner, we need an approach to defining performance levels, and to associating students with those levels. The methodology that was developed and used for PISA 2000, 2003 and 2006 was essentially retained for PISA 2009.
Defining proficiency levels for PISA 2000 progressed in two broad phases. The first, which came after the development of the described scales, was based on a substantive analysis of PISA items in relation to the aspects of literacy that underpinned each test domain. This produced descriptions of increasing proficiency that reflected observations of student performance and a detailed analysis of the cognitive demands of PISA items. The second phase involved decisions about where to set cut-off points for levels and how to associate students with each level. This is both a technical and very practical matter of interpreting what it means to be at a level, and has very significant consequences for reporting national and international results.
Several principles were considered for developing and establishing a useful meaning for being at a level, and therefore for determining an approach to locating cut-off points between levels and associating students with them.
A common understanding of the meaning of levels should be developed and promoted. First, it is important to understand that the literacy skills measured in PISA must be considered as continua: there are no natural breaking points to mark borderlines between stages along these continua. Dividing each of these continua into levels, though useful for communication about students’ development, is essentially arbitrary. Like the definition of units on, for example, a scale of length, there is no fundamental difference between 1 metre and 1.5 metres – it is a matter of degree. It is useful, however, to define stages, or levels along the continua, because they enable us to communicate about the proficiency of students in terms other than numbers. The approach adopted for PISA 2000 was that it would only be useful to regard students as having attained a particular level if this would mean that we can have certain expectations about what these students are capable of in general when they are said to be at that level. It was decided that this expectation would have to mean at a minimum that students at a particular level would be more likely than not to successfully complete tasks at that level. By implication, it must be expected that they would succeed on at least half of the items on a test composed of items uniformly spread across that level. This definition of being “at a level” is useful in helping to interpret the proficiency of students at different points across the proficiency range defined at each level.
For example, students at the bottom of a level would complete at least 50% of tasks correctly on a test set at the level, while students at the middle and top of each level would be expected to achieve a much higher success rate. At the top end of the bandwidth of a level would be the students who are masters of that level. These students would be likely to solve about 70% of the tasks at that level. But, being at the top border of that level, they would also be at the bottom border of the next level up, where according to the reasoning here they should have a likelihood of at least 50% of solving any tasks defined to be at that higher level.
Further, the meaning of being at a level for a given scale should be more or less consistent for each level. In other words, to the extent possible within the substantively based definition and description of levels, cut-off points should create levels of more or less constant breadth. Some small variation may be appropriate, but in order for interpretation and definition of cut-off points and levels to be consistent, the levels have to be about equally broad. Clearly this would not apply to the highest and lowest proficiency levels, which are unbounded.

262 © OECD 2012 – PISA 2009 TECHNICAL REPORT
15Proficiency Scale conStruction
• Figure 15.2 •what it means to be at a level
A more or less consistent approach should be taken to defining levels for the different scales. Their breadth may not be exactly the same for the proficiency scales in different domains, but the same kind of interpretation should be possible for each scale that is developed.
A way of implementing these principles was developed for PISA 2000 and used again in PISA 2003, PISA 2006 and PISA 2009. This method links the two variables mentioned in the preceding paragraphs, and a third related variable. The three variables can be expressed as follows:
•the expected success of a student at a particular level on a test containing items at that level (proposed to be set at a minimum that is near 50% for the student at the bottom of the level, and higher for other students in the level);
•the width of the levels in that scale (determined largely by substantive considerations of the cognitive demands of items at the level and observations of student performance on the items); and
•the probability that a student in the middle of a level would correctly answer an item of average difficulty for that level (in fact, the probability that a student at any particular level would get an item at the same level correct), sometimes referred to as the “RP-value” for the scale (where “RP” indicates “response probability”).
Figure 15.2 summarises the relationship among these three mathematically linked variables. It shows a vertical line representing a part of the scale being defined, one of the bounded levels on the scale, a student at both the top and the bottom of the level, and reference to an item at the top and an item at the bottom of the level. Dotted lines connecting the students and items are labelled “P=?” to indicate the probability associated with that student correctly responding to that item.
PISA 2000 implemented the following solution: start with the substantively determined range of abilities for each bounded level in each scale (the desired band breadth); then determine the highest possible RP value that will be common across domains − that would give effect to the broad interpretation of the meaning of being at a level (an expectation of correctly responding to a minimum of 50% of the items in a test at that level).
Student at top of level
Student at bottom of levelP=?
P=?
P=?
P=?
Item at bottom of level
Item at top of level
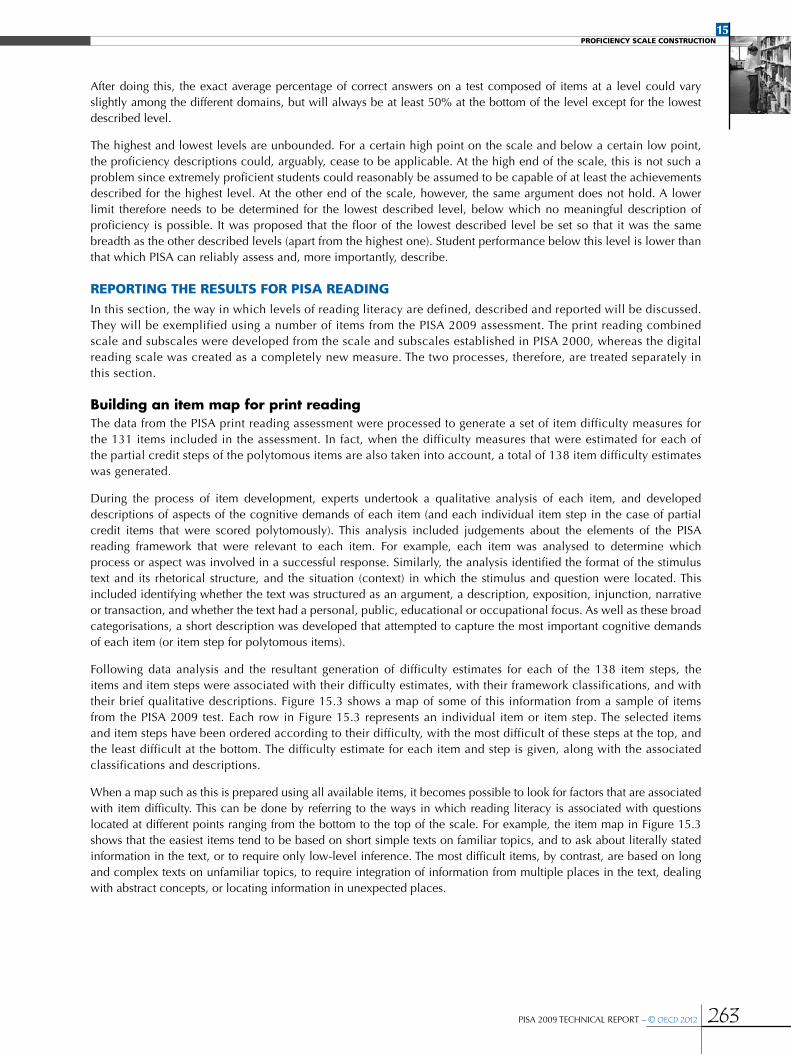
PISA 2009 TECHNICAL REPORT – © OECD 2012 263
15Proficiency Scale conStruction
After doing this, the exact average percentage of correct answers on a test composed of items at a level could vary slightly among the different domains, but will always be at least 50% at the bottom of the level except for the lowest described level.
The highest and lowest levels are unbounded. For a certain high point on the scale and below a certain low point, the proficiency descriptions could, arguably, cease to be applicable. At the high end of the scale, this is not such a problem since extremely proficient students could reasonably be assumed to be capable of at least the achievements described for the highest level. At the other end of the scale, however, the same argument does not hold. A lower limit therefore needs to be determined for the lowest described level, below which no meaningful description of proficiency is possible. It was proposed that the floor of the lowest described level be set so that it was the same breadth as the other described levels (apart from the highest one). Student performance below this level is lower than that which PISA can reliably assess and, more importantly, describe.
rePorting the reSultS For PiSa readingIn this section, the way in which levels of reading literacy are defined, described and reported will be discussed. They will be exemplified using a number of items from the PISA 2009 assessment. The print reading combined scale and subscales were developed from the scale and subscales established in PISA 2000, whereas the digital reading scale was created as a completely new measure. The two processes, therefore, are treated separately in this section.
Building an item map for print readingThe data from the PISA print reading assessment were processed to generate a set of item difficulty measures for the 131 items included in the assessment. In fact, when the difficulty measures that were estimated for each of the partial credit steps of the polytomous items are also taken into account, a total of 138 item difficulty estimates was generated.
During the process of item development, experts undertook a qualitative analysis of each item, and developed descriptions of aspects of the cognitive demands of each item (and each individual item step in the case of partial credit items that were scored polytomously). This analysis included judgements about the elements of the PISA reading framework that were relevant to each item. For example, each item was analysed to determine which process or aspect was involved in a successful response. Similarly, the analysis identified the format of the stimulus text and its rhetorical structure, and the situation (context) in which the stimulus and question were located. This included identifying whether the text was structured as an argument, a description, exposition, injunction, narrative or transaction, and whether the text had a personal, public, educational or occupational focus. As well as these broad categorisations, a short description was developed that attempted to capture the most important cognitive demands of each item (or item step for polytomous items).
Following data analysis and the resultant generation of difficulty estimates for each of the 138 item steps, the items and item steps were associated with their difficulty estimates, with their framework classifications, and with their brief qualitative descriptions. Figure 15.3 shows a map of some of this information from a sample of items from the PISA 2009 test. Each row in Figure 15.3 represents an individual item or item step. The selected items and item steps have been ordered according to their difficulty, with the most difficult of these steps at the top, and the least difficult at the bottom. The difficulty estimate for each item and step is given, along with the associated classifications and descriptions.
When a map such as this is prepared using all available items, it becomes possible to look for factors that are associated with item difficulty. This can be done by referring to the ways in which reading literacy is associated with questions located at different points ranging from the bottom to the top of the scale. For example, the item map in Figure 15.3 shows that the easiest items tend to be based on short simple texts on familiar topics, and to ask about literally stated information in the text, or to require only low-level inference. The most difficult items, by contrast, are based on long and complex texts on unfamiliar topics, to require integration of information from multiple places in the text, dealing with abstract concepts, or locating information in unexpected places.

264 © OECD 2012 – PISA 2009 TECHNICAL REPORT
15Proficiency Scale conStruction
text format aspect Situation
Code Item nameScale score Item demands C
onti
nuou
s
non
-con
tinu
ous
mul
tipl
e
acc
ess
and
retr
ieve
Inte
grat
e an
d in
terp
ret
refl
ect
and
eval
uate
educ
atio
nal
occ
upat
iona
l
Pers
onal
Publ
ic
R452Q03 the PLay'Sthe thIng
730 Locate a reference to action taking place before the events of a play. The information is explicitly stated but in an unexpected place, in the middle of a lengthy text. Strongly distracting information appears earlier in the text and much more prominently.
• • •
R414Q11 moBILe Phone SaFety
604 Recognise the relationship between a generalised highly abstract statement external to the text and a pair of statements in a table dealing with contradictory research findings. The topic of the research described is everyday and familiar, but the findings are expressed in academic language.
• • •
R417Q03(2) BaLLoon (SteP 2) 595 Locate two pieces of information in a diagrammatic descriptive text by making a synonymous match between a category provided in the question and instances in the text.
• • •
R414Q02 moBILe Phone SaFety
561 Recognise the purpose of a section (a table) in an expository text, distinguishing what the content implies from what each part of the section states. • • •
R452Q07 the PLay'Sthe thIng
556 Recognise the conceptual theme of a section of a play. The theme is literary and abstract. • • •
R433Q05 mISer 548 Relate a detail in a very short fable to its main idea. • • •
R458Q01 teLeCommutIng 537 Recognise the relationship(contrast) between two short argumentative texts dealing with dealing with a part of everyday adult life. • • •
R414Q06 moBILe Phone SaFety
526 Use prior knowledge to reflect on an abstract category presented in a text and generate a relevant example that would fit the category. The category can only be understood with reference to an adjacent piece of text.
• • •
R458Q07 teLeCommutIng 514 Use prior knowledge to generate an example that fits a category described in a text dealing with a part of everyday adult life, and explain why example fits this category.
• • •
R417Q04 BaLLoon 510 Identify the purpose of an illustration in a diagrammatic descriptive text explaining details of the personal achievement of an individual. Recognise that the purpose is comparative and provides a frame of reference for the main topic of the text.
• • •
R414Q09 moBILe Phone SaFety
488 Recognise an assumption in an injunctive section of an expository text dealing with abstract features associated with a familiar object. • • •
R452Q04 the PLay'Sthe thIng
474 Infer the meaning of a sentence (simile) in a play using references to textual structure described by one of the characters. The relationship described in the simile appears contradictory.
• • •
R417Q03 (1) BaLLoon (SteP 1) 449 Locate one piece of information in a diagrammatic descriptive text by making a synonymous match between a category provided in the question and an instance in the text.
• • •
R429Q08 BLood donatIon notICe
438 Make links across a short text to reach a conclusion, using conditional information provided in a public notice (advertisement). • • •
R417Q06 BaLLoon 411 Recognise the purpose of linked illustrations in a diagrammatic descriptive text (emphasis on one feature of the object portrayed). • • •
R403Q04 BruShIngyour teeth
399 Recognise the purpose of a simple analogy in a short text describing very familiar everyday experience. • • •
R433Q01 mISer 373 Organise the events in a very short fable into the sequence in which they occur. • • •
R417Q08 BaLLoon 370 Recognise the main idea of a diagrammatic descriptive text using information explicitly and prominently stated several times at the beginning of the text.
• • •
R429Q09 BLood donatIon notICe
368 Recognise the persuasive purpose of a phrase in an advertisement dealing with an everyday topic (public health). There is little plausible competing information.
• • •
R403Q02 BruShIngyour teeth
358 Locate a synonymous match between a term in the question (recommended action) and information in an expository text dealing with a very familiar everyday health topic.
• • •
R403Q01 BruShIngyour teeth
353 Recognise the main idea of a short expository text dealing with a very familiar everyday topic. • • •
R433Q07 mISer 310 Locate information (an action leading to a specified result) that is explicitly stated in the opening sentence of a short story (a fable). • • •
R403Q03 BruShIng your teeth
285 Locate information (the reason for a very familiar everyday action) explicitly stated in a short expository text. • • •
• Figure 15.3 •a map for selected print reading items

PISA 2009 TECHNICAL REPORT – © OECD 2012 265
15Proficiency Scale conStruction
More generally, the ascending difficulty of reading questions in PISA 2009 is associated with the following characteristics, some of which are closely related to features of tasks, some to features of texts, but most to the interaction between these two sets of features:
•Number of features and conditions: how many elements the reader needs to locate in the text, or to account for, in order to answer the question. The fewer the features and conditions required, the easier the task.
•Proximity of pieces of required information: how close to each other the relevant pieces of information in the text are. The closer to each other the required pieces of information are, the easier the task tends to be.
•Extent of competing information: how much information there is in the text that is similar in one or more respects to the target information and therefore likely to be mistakenly identified by the reader as the target information. The more competing information there is in a text, the more difficult the associated task is likely to be.
•Prominence of necessary textual information: how easy it is for the reader to locate the information required for the response. Information is more prominent (and therefore easier to find) when it is clearly indicated by headings, or is near the beginning of a text, or is part of a very short text.
•Relationship between task and required information: how transparent the task is in relation to the text. The more transparent the relationship, the easier the task is likely to be. If the task’s wording is linguistically complex or requires an inference on the part of the reader to recognise its relationship to the text, the task is likely to be more difficult. Moreover, tasks that require the reader to generate criteria for their response are more difficult than those that provide the reader with explicit directions about the criteria.
•Semantic match between task and text: the extent to which tasks use the same words or words from the same lexical field as relevant parts of the text. The closer the lexical match, the easier the task.
•Concreteness of information: the kind of information that the reader needs to access. The more abstract the information, the harder the task is likely to be.
•Familiarity of information needed to answer the question: how well acquainted the reader is with the content or topic of the task. The more familiar the information, the easier the task.
•Register of the text: how formal and syntactically complex the text is. The more personal and idiomatic the text, the easier the task. By contrast, use of lower-frequency words and complex syntactical structures such as passives and nominalisation make a text more formal and more difficult.
•Extent to which information from outside the text is required to answer the question: the extent to which the reader needs to draw on prior knowledge. In the sense that active reading requires the reader to construct the text, all texts assume some prior knowledge. Nevertheless some tasks, especially those where students are required to reflect upon and evaluate the text, more explicitly draw on what the reader brings to the text, and by implication tend on average to be more difficult.
Levels of print reading literacyThe approach to reporting used by the OECD has been defined in previous cycles of PISA and is based on the definition of a number of levels of literacy proficiency. Descriptions were developed to characterise typical student performance at each level. The levels were used to summarise the performance of students, to compare performances across subgroups of students, and to compare average performances among groups of students, in particular among the students from different participating countries. A similar approach has been used here to analyse and report PISA 2009 outcomes for reading.
For print reading in PISA 2000, student scores were transformed to the PISA scale, with a mean of 500 and a standard deviation of 100, and five levels of proficiency were defined and described. For PISA 2009, the new items together with link items from PISA 2000 that were administered again in PISA 2009 were calibrated independently as a set and then equated with the PISA 2000 scale. In PISA 2009 a deliberate strategy was adopted to extend the described proficiency scales at the extremes of the existing scale by including some very easy and some very difficult items. As a result, it has become possible to describe one level below the lowest previously-described level, and one level above the highest previously-described level. Thus the PISA 2009 reading scale has seven described levels instead of the five defined for PISA 2000. The previously-named Level 1 was renamed Level 1a, and the level defined below this was named Level 1b.

266 © OECD 2012 – PISA 2009 TECHNICAL REPORT
15Proficiency Scale conStruction
The level definitions on the PISA scale are given in Table 15.1.
Level Score points on the PISa scale
6 Higher than 698.32
5 Higher than 625.61 and less than or equal to 698.32
4 Higher than 552.89 and less than or equal to 625.61
3 Higher than 480.18 and less than or equal to 552.89
2 Higher than 407.47 and less than or equal to 480.18
1a Higher than 334.75 and less than or equal to 407.47
1b 262.04 to less than or equal to 334.75
table 15.1 reading literacy performance band definitions on the PiSa scale
The information about the items in each band is used to develop summary descriptions of the kinds of reading literacy associated with different levels of proficiency. These summary descriptions can then be used to encapsulate typical reading proficiency of students associated with each level. As a set, they describe development in reading literacy.
PISA is administered once every three years, with each of the three core domains the major focus in turn. Reading was the major focus of the inaugural administration of PISA in the year 2000, and it is therefore the first of the domains to repeat its appearance as a major domain. In PISA 2009, therefore, PISA print reading already had a set of band descriptions to build upon.
In PISA 2000, to develop the summary descriptions, growth in reading literacy was first analysed in relation to items from each of the three aspects of reading. Three sets of band descriptions, each specific to one of the aspects, were developed. Building on this process, in PISA 2009, the new items that had been developed were considered in relation to the existing five band descriptions. For example, the new access and retrieve items that were calibrated at Level 4 (between 552.89 and 625.61) were considered in relation to the existing description for Level 4 on the access and retrieve subscale. The description was adjusted if necessary to take into account any new features that might have become apparent from the new items. For the most part, however, the new items fitted well with the existing descriptions. At the top and bottom ends of the aspect subscales, new band descriptions were added, based on the items (from both PISA 2000 and PISA 2009) that were located in the relevant, newly defined regions of the scale.
A similar process was used to develop the two text format subscales. Described proficiency scales spanning five levels had been developed for continuous text and non-continuous texts subscales from the PISA 2000 data. Using the PISA 2009 item calibration (equated to the PISA 2000 scale) the band descriptions were inspected in relation to the new items in each region of the scale, and adjustments made to the text format band descriptions where appropriate. As with the aspect subscales, new band descriptions were written for Level 1b and Level 6, based on the items from PISA 2000 and PISA 2009 located in the respective regions.
At the end of this process, there were five subscale descriptions for each Level: one each of the three aspects, access and retrieve, integrate and interpret and reflect and evaluate; and one for each of the two text formats: continuous and non-continuous.
As a final step, the five descriptions for each band level were combined to produce summary descriptions of the seven levels of combined reading literacy, Level 1b to Level 6, presented here in Figure 15.4. The continuum of increasing print reading literacy that is represented in Figure 15.4 is divided into these seven bands, each of equal width, and two unbounded regions, one at each end of the continuum.
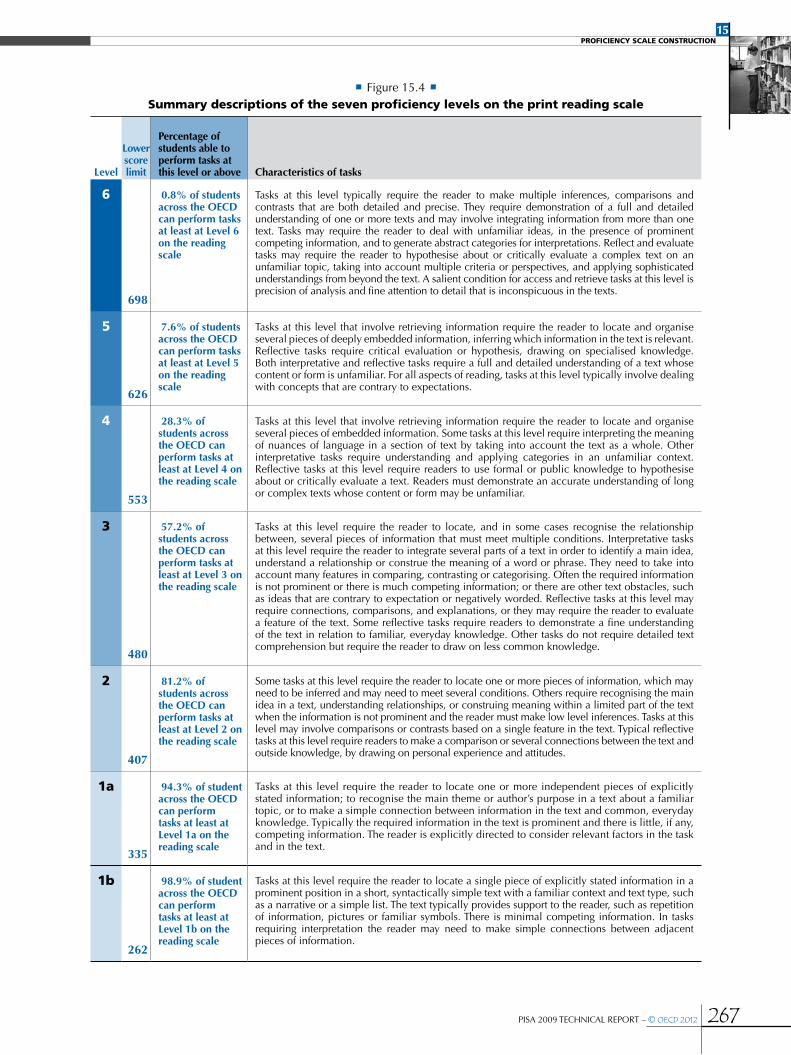
PISA 2009 TECHNICAL REPORT – © OECD 2012 267
15Proficiency Scale conStruction
Level
Lower score limit
Percentage of students able to perform tasks at this level or above Characteristics of tasks
6
698
0.8% of students across the oeCd can perform tasks at least at Level 6 on the reading scale
Tasks at this level typically require the reader to make multiple inferences, comparisons and contrasts that are both detailed and precise. They require demonstration of a full and detailed understanding of one or more texts and may involve integrating information from more than one text. Tasks may require the reader to deal with unfamiliar ideas, in the presence of prominent competing information, and to generate abstract categories for interpretations. Reflect and evaluate tasks may require the reader to hypothesise about or critically evaluate a complex text on an unfamiliar topic, taking into account multiple criteria or perspectives, and applying sophisticated understandings from beyond the text. A salient condition for access and retrieve tasks at this level is precision of analysis and fine attention to detail that is inconspicuous in the texts.
5
626
7.6% of students across the oeCd can perform tasks at least at Level 5 on the reading scale
Tasks at this level that involve retrieving information require the reader to locate and organise several pieces of deeply embedded information, inferring which information in the text is relevant. Reflective tasks require critical evaluation or hypothesis, drawing on specialised knowledge. Both interpretative and reflective tasks require a full and detailed understanding of a text whose content or form is unfamiliar. For all aspects of reading, tasks at this level typically involve dealing with concepts that are contrary to expectations.
4
553
28.3% of students across the oeCd can perform tasks at least at Level 4 on the reading scale
Tasks at this level that involve retrieving information require the reader to locate and organise several pieces of embedded information. Some tasks at this level require interpreting the meaning of nuances of language in a section of text by taking into account the text as a whole. Other interpretative tasks require understanding and applying categories in an unfamiliar context. Reflective tasks at this level require readers to use formal or public knowledge to hypothesise about or critically evaluate a text. Readers must demonstrate an accurate understanding of long or complex texts whose content or form may be unfamiliar.
3
480
57.2% of students across the oeCd can perform tasks at least at Level 3 on the reading scale
Tasks at this level require the reader to locate, and in some cases recognise the relationship between, several pieces of information that must meet multiple conditions. Interpretative tasks at this level require the reader to integrate several parts of a text in order to identify a main idea, understand a relationship or construe the meaning of a word or phrase. They need to take into account many features in comparing, contrasting or categorising. Often the required information is not prominent or there is much competing information; or there are other text obstacles, such as ideas that are contrary to expectation or negatively worded. Reflective tasks at this level may require connections, comparisons, and explanations, or they may require the reader to evaluate a feature of the text. Some reflective tasks require readers to demonstrate a fine understanding of the text in relation to familiar, everyday knowledge. Other tasks do not require detailed text comprehension but require the reader to draw on less common knowledge.
2
407
81.2% of students across the oeCd can perform tasks at least at Level 2 on the reading scale
Some tasks at this level require the reader to locate one or more pieces of information, which may need to be inferred and may need to meet several conditions. Others require recognising the main idea in a text, understanding relationships, or construing meaning within a limited part of the text when the information is not prominent and the reader must make low level inferences. Tasks at this level may involve comparisons or contrasts based on a single feature in the text. Typical reflective tasks at this level require readers to make a comparison or several connections between the text and outside knowledge, by drawing on personal experience and attitudes.
1a
335
94.3% of student across the oeCd can perform tasks at least at Level 1a on the reading scale
Tasks at this level require the reader to locate one or more independent pieces of explicitly stated information; to recognise the main theme or author’s purpose in a text about a familiar topic, or to make a simple connection between information in the text and common, everyday knowledge. Typically the required information in the text is prominent and there is little, if any, competing information. The reader is explicitly directed to consider relevant factors in the task and in the text.
1b
262
98.9% of student across the oeCd can perform tasks at least at Level 1b on the reading scale
Tasks at this level require the reader to locate a single piece of explicitly stated information in a prominent position in a short, syntactically simple text with a familiar context and text type, such as a narrative or a simple list. The text typically provides support to the reader, such as repetition of information, pictures or familiar symbols. There is minimal competing information. In tasks requiring interpretation the reader may need to make simple connections between adjacent pieces of information.
• Figure 15.4 •Summary descriptions of the seven proficiency levels on the print reading scale

268 © OECD 2012 – PISA 2009 TECHNICAL REPORT
15Proficiency Scale conStruction
Figure 15.5, Figure 15.6 and Figure 15.7 provide the summary descriptions of skills and knowledge and understanding required to complete tasks located within the defined bands for the aspect subscales: access and retrieve, integrate and interpret and reflect and evaluate respectively. Examples of tasks that contributed to the building of each of the subscales are listed in the right hand column.
Level Characteristics of tasks
examples of releasedaccess and retrievequestions
6 Combine multiple pieces of independent information, from different parts of a mixed text, in an accurate and precise sequence, working in an unfamiliar context.
5 Locate and possibly combine multiple pieces of deeply embedded information, some of which may be outside the main body of the text. Deal with strongly distracting competing information.
4 Locate several pieces of embedded information, each of which may need to meet multiple criteria, in a text with unfamiliar context or form. Possibly combine verbal and graphical information. Deal with extensive and/or prominent competing information.
r417Q03.2 BaLLoon
3 Locate several pieces of information, each of which may need to meet multiple criteria. Combine pieces of information within a text. Deal with competing information.
r417Q03.1 BaLLoon
2 Locate one or more pieces of information, each of which may need to meet multiple criteria. Deal with some competing information.
r403Q02 BruShIng your teeth
1a Locate one or more independent pieces of explicitly stated information meeting a single criterion, by making a literal or synonymous match. The target information may not be prominent in the text but there is little or no competing information.
1b Locate a single piece of explicitly stated information in a prominent position in a simple text, by making a literal or synonymous match, where there is no competing information. May make simple connections between adjacent pieces of information.
r433Q07 mISer
r403Q03 BruShIng your teeth
• Figure 15.5 •Summary descriptions of the seven proficiency levels on the print reading aspect subscale
access and retrieve
A corrigendum has been issued for this page. See http://www.oecd.org/about/publishing/Corrigendum_PISA-2009-Technical-Report.pdf

PISA 2009 TECHNICAL REPORT – © OECD 2012 269
15Proficiency Scale conStruction
Level Characteristics of tasks
examples of releasedintegrate and interpretquestions
6 Make multiple inferences, comparisons and contrasts that are both detailed and precise. Demonstrate a full and detailed understanding of the whole text or specific sections. May involve integrating information from more than one text. Deal with unfamiliar abstract ideas, in the presence of prominent competing information. Generate abstract categories for interpretations.
r452Q03 the PLay’S the thIng
5 Demonstrate a full and detailed understanding of a text. Construe the meaning of nuanced language. Apply criteria to examples scattered through a text, using high level inference. Generate categories to describe relationships between parts of a text. Deal with ideas that are contrary to expectations.
4 Use text-based inferences to understand and apply categories in an unfamiliar context, and to construe the meaning of a section of text by taking into account the text as a whole. Deal with ambiguities and ideas that are negatively worded.
r414Q02 moBILe Phone SaFety
r452Q07 the PLay’S the thIng
r433Q05 mISer
3 Integrate several parts of a text in order to identify the main idea, understand a relationship or construe the meaning of a word or phrase. Compare, contrast or categorise taking many criteria into account. Deal with competing information.
r414Q09 moBILe Phone SaFety
r458Q01 teLeCommutIng
2 Identify the main idea in a text, understand relationships, form or apply simple categories, or construe meaning within a limited part of the text when the information is not prominent and low-level inferences are required.
r452Q04 the PLay’S the thIng
r429Q08 BLood donatIon notICe
1a Recognise the main theme or author’s purpose in a text about a familiar topic, when the required information in the text is prominent.
r433Q01 mISer
r417Q08 BaLLoon
r403Q01 BruShIng your teeth
1b Either recognise a simple idea that is reinforced several times in the text (possibly with picture cues), or interpret a phrase, in a short text on a familiar topic.
• Figure 15.6 •Summary descriptions of the seven proficiency levels on the print reading aspect subscale
integrate and interpret
A corrigendum has been issued for this page. See http://www.oecd.org/about/publishing/Corrigendum_PISA-2009-Technical-Report.pdf
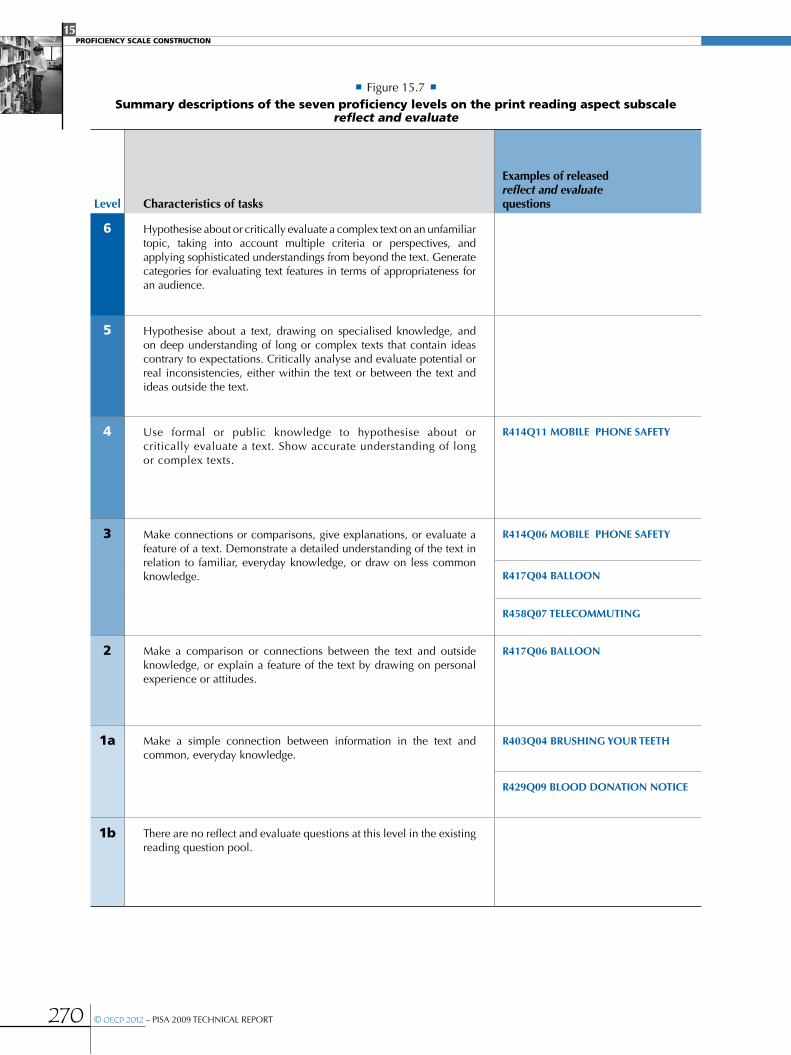
270 © OECD 2012 – PISA 2009 TECHNICAL REPORT
15Proficiency Scale conStruction
Level Characteristics of tasks
examples of releasedreflect and evaluatequestions
6 Hypothesise about or critically evaluate a complex text on an unfamiliar topic, taking into account multiple criteria or perspectives, and applying sophisticated understandings from beyond the text. Generate categories for evaluating text features in terms of appropriateness for an audience.
5 Hypothesise about a text, drawing on specialised knowledge, and on deep understanding of long or complex texts that contain ideas contrary to expectations. Critically analyse and evaluate potential or real inconsistencies, either within the text or between the text and ideas outside the text.
4 Use formal or public knowledge to hypothesise about or critically evaluate a text. Show accurate understanding of long or complex texts.
r414Q11 moBILe Phone SaFety
3 Make connections or comparisons, give explanations, or evaluate a feature of a text. Demonstrate a detailed understanding of the text in relation to familiar, everyday knowledge, or draw on less common knowledge.
r414Q06 moBILe Phone SaFety
r417Q04 BaLLoon
r458Q07 teLeCommutIng
2 Make a comparison or connections between the text and outside knowledge, or explain a feature of the text by drawing on personal experience or attitudes.
r417Q06 BaLLoon
1a Make a simple connection between information in the text and common, everyday knowledge.
r403Q04 BruShIng your teeth
r429Q09 BLood donatIon notICe
1b There are no reflect and evaluate questions at this level in the existing reading question pool.
• Figure 15.7 •Summary descriptions of the seven proficiency levels on the print reading aspect subscale
reflect and evaluate

PISA 2009 TECHNICAL REPORT – © OECD 2012 271
15Proficiency Scale conStruction
Figure 15.8 and Figure 15.9 provide the summary descriptions of skills and knowledge and understanding required to complete tasks located within the defined bands for the text format subscales: continuous texts and non-continuous texts respectively. Examples of tasks that contributed to the building of each of the two text format subscales are listed in the right hand column.
Level Characteristics of tasks
examples of releasedcontinuous textsquestions
6 Negotiate single or multiple texts that may be long, dense or deal with highly abstract and implicit meanings. Relate information in texts to multiple, complex or counterintuitive ideas.
r452Q03 the PLay’S the thIng
5 Negotiate texts whose discourse structure is not obvious or clearly marked, in order to discern the relationship of specific parts of the text to the implicit theme or intention.
4 Follow linguistic or thematic links over several paragraphs, often in the absence of clear discourse markers, in order to locate, interpret or evaluate embedded information.
r452Q07 the PLay’S the thIng
r433Q05 mISer
3 Use conventions of text organisation, where present, and follow implicit or explicit logical links such as cause and effect relationships across sentences or paragraphs in order to locate, interpret or evaluate information.
r458Q01 teLeCommutIng
r458Q07 teLeCommutIng
2 Follow logical and linguistic connections within a paragraph in order to locate or interpret information; or synthesise information across texts or parts of a text in order to infer the author’s purpose.
r452Q04 the PLay’S the thIng
r429Q08 BLood donatIon notICe
1a Use redundancy, paragraph headings or common print conventions to identify the main idea of the text, or to locate information stated explicitly within a short section of text.
r403Q04 BruShIng your teeth
r433Q01 mISer
r429Q09 BLood donatIon notICe
r403Q02 BruShIng your teeth
r403Q01 BruShIng your teeth
1b Recognise information in short, syntactically simple texts that have a familiar context and text type, and include ideas that are reinforced by pictures or by repeated verbal cues.
r433Q07 mISer
r403Q03 BruShIng your teeth
• Figure 15.8 •Summary descriptions of the seven proficiency levels on the print reading text format subscale
continuous texts
A corrigendum has been issued for this page. See http://www.oecd.org/about/publishing/Corrigendum_PISA-2009-Technical-Report.pdf

272 © OECD 2012 – PISA 2009 TECHNICAL REPORT
15Proficiency Scale conStruction
Level Characteristics of tasks
examples of releasednon-continuous textsquestions
6 Identify and combine information from different parts of a complex document that has unfamiliar content, sometimes drawing on features that are external to the display, such as footnotes, labels and other organisers. Demonstrate a full understanding of the text structure and its implications.
5 Identify patterns among many pieces of information presented in a display that may be long and detailed, sometimes by referring to information that is in an unexpected place in the text or outside the text.
4 Scan a long, detailed text in order to find relevant information, often with little or no assistance from organisers such as labels or special formatting, to locate several pieces of information to be compared or combined.
r414Q11 moBILe Phone SaFety
r417Q03.2 BaLLoon
r414Q02 moBILe Phone SaFety
3 Consider one display in the light of a second, separate document or display, possibly in a different format, or draw conclusions by combining several pieces of graphical, verbal and numeric information.
r414Q06 moBILe Phone SaFety
r417Q04 BaLLoon
r417Q03.1 BaLLoon
r414Q09 moBILe Phone SaFety
2 Demonstrate a grasp of the underlying structure of a visual display such as a simple tree diagram or table, or combine two pieces of information from a graph or table.
r417Q06 BaLLoon
1a Focus on discrete pieces of information, usually within a single display such as a simple map, a line graph or bar graph that presents only a small amount of information in a straightforward way, and in which most of the verbal text is limited to a small number of words or phrases.
r417Q08 BaLLoon
1b Identify information in a short text with a simple list structure and a familiar format.
• Figure 15.9 •Summary descriptions of the seven proficiency levels on the print reading text format subscale
non-continuous texts
Building an item map for digital readingThe data from the PISA digital reading assessment were processed to generate a set of item difficulty measures for the 29 items, comprising 38 item difficulty estimates (because of several polytomously scored items) that were included in the assessment.
As with the print items, a qualitative analysis of each item was undertaken during the development process; descriptions of the cognitive demands of each item were generated, and a category from each framework variable was assigned to each item, in terms of text, aspect and situation. Text variables included text format and text type. In addition, digital reading items were categorised according to the new variable, text environment: authored or message based. Items were also categorised according to the aspect that was considered most salient to completing the task successfully. Because of a deliberate attempt to emulate the complex and multiple steps in completing reading tasks on line, in the case of
A corrigendum has been issued for this page. See http://www.oecd.org/about/publishing/Corrigendum_PISA-2009-Technical-Report.pdf

PISA 2009 TECHNICAL REPORT – © OECD 2012 273
15Proficiency Scale conStruction
about one fifth of the items, the complexity was such that any single aspect would have been inadequate to capture the item’s processing demand; these items were categorised as complex by aspect. The situation categories by which digital reading items were categorised were identical to those used for the print item set. As well as these broad categorisations, a short description was developed that attempted to capture the most important cognitive demands of each item (or item step for polytomous items). It emerged early in the development of the digital reading items and the conceptual work which accompanied the development that navigation tools and features were a distinctive and essential feature of digital reading texts. Although no framework variable was generated to categorise navigation features, the descriptions of each item take into account the navigation processes that contribute to its difficulty. Some of the navigation demand involves familiarity with the conventions of the digital medium (knowledge of text features and structures); other parts of the demand essentially involve text processing, to determine what navigation must be undertaken.
environment text format aspect Situation
Code Item nameScale score Item demands a
utho
red
mes
sage
bas
ed
Con
tinu
ous
mix
ed
mul
tipl
e
non
-con
tinu
ous
acc
ess
and
retr
ieve
Inte
grat
e an
d in
terp
ret
refl
ect
and
eval
uate
Com
plex
educ
atio
nal
occ
upat
iona
l
Pers
onal
Publ
ic
E006Q05 SmeLL(taSK 2)
657 Evaluate a web page in terms of credibility/trustworthiness of information after following an explicitly directed link from search results, generating own criteria for evaluation. Scroll to read the full text, which includes some specialised (scientific) language.
• • • •
E012Q03(2) joB SearCh (taSK 2, SteP 2)
624 Analyse a list of options in a descriptive text related to employment, using predefined criteria. Follow two links using explicit instructions, and scroll. Select four options from drop down menus, combining prior knowledge with information integrated from a second page. (Full Credit)
• • • •
E006Q02 SmeLL(taSK 1)
572 Distinguish between the main idea and subsidiary ideas in an expository scientific text, in the presence of strong distracting information. Follow a link from search results to a web page using a literal match, scrolling to read the full text.
• • • •
E005Q08(2) IwanttoheLP(taSK 4, SteP 2)
567 Integrate and reflect upon information from several web pages by comparing short texts on multiple pages of a website about community work with criteria referred to on a personal blog; explain a choice based on this comparison.. Follow a series of at least four links, using explicit instructions. (Full Credit)
• • • • •
E012Q05 joB SearCh(taSK 3)
558 Hypothesise about the reason for including a condition in a job advertisement. Support explanation using prior knowledge and information from the text. No navigation required.
• • • •
E005Q08(1) IwanttoheLP(taSK 4, SteP 1)
525 Integrate information by comparing a short text on one website about community work with criteria referred to on a personal blog. Follow a series of at least four links, using explicit instructions. (Partial Credit)
• • • • •
E006Q06 SmeLL (taSK 3) 485 Synthesise information from two web sites, following links from search results guided by explicit directions. Identify a generalisation common to information on the two sites using low-level inference.
• • • •
E012Q01 joB SearChtaSK 1
463 Select a job suitable for a student from a list of four search results comprising short descriptions of jobs. • • • •
E005Q03 IwanttoheLP(taSK 3)
462 Recognise the main purpose of a website dealing with a community activity from a short description on its Home page. Follow a single link with explicit directions.
• • • •
E012Q03(1) joB SearCh(taSK 2, SteP 1)
462 Analyse a list of options in a descriptive text related to employment, using predefined criteria. Follow two links using explicit instructions. Select three suitable options from drop down menus. (Partial Credit)
• • • •
E005Q02 IwanttoheLP (taSK 2)
417 Locate explicitly stated personal information on a page of a personal blog, following one explicitly directed link and using two literal matches between task and text.
• • • •
E005Q01 IwanttoheLP (taSK 1)
362 Locate explicitly stated information in a personal blog. Find a synonymous match between the task and the text. No navigation required.
• • • •
• Figure 15.10 •a map for selected digital reading items

274 © OECD 2012 – PISA 2009 TECHNICAL REPORT
15Proficiency Scale conStruction
Following data analysis and the resultant generation of difficulty estimates for each of the 38 item steps, the items and item steps were associated with their difficulty estimates, with their framework classifications, and with their brief qualitative descriptions. Figure 15.10 shows a map of some of this information from a sample of items from the PISA 2009 digital reading assessment. Each row in Figure 15.10 represents an individual item or item step. The selected items and item steps have been ordered according to their difficulty, with the most difficult of these steps at the top, and the least difficult at the bottom. The difficulty estimate for each item and step is given, along with the associated classifications and descriptions.
When a map such as this is prepared using all available items, it becomes possible to look for factors that are associated with item difficulty. This can be done by referring to the ways in which digital reading literacy is associated with questions located at different points ranging from the bottom to the top of the scale. The item map in Figure 15.10 shows that the easiest items are based on short texts on familiar topics, ask about explicitly stated information in the text or broad general ideas, and require little or no navigation. The most difficult items, by contrast, are based on more complex texts on less familiar topics, and require integration of information from multiple places, pages or sites (with multiple navigation steps), or evaluation of the credibility of the source.
The ascending difficulty of reading questions in PISA 2009 is associated with the following characteristics, which are related both to features of texts (text processing) and to navigation characteristics of the tasks. Four key characteristics associated with task difficulty in digital reading tasks are described as follows:
•Characteristics of text: This variable relates to the features of the texts that need to be processed to complete a task. Tasks based on texts with unfamiliar content in formal or technical language will, on average, be more difficult than short texts with familiar, everyday content expressed in idiomatic language. The complexity of text structure, the vocabulary and the layout all influence the ease with which a text-based task can be completed. Moreover, the sheer quantity of text influences difficulty. The longer the text, and the more pages of digital text that must be consulted, the more difficult a task is likely to be.
•Complexity of navigation: A digital reading task may focus on information that is immediately visible on the starting page of the task, it may require scrolling on that page, or it may require the reader to visit several pages or sites. Tasks become more difficult when the information needed to complete the task is not immediately visible. Complexity of navigation also depends on the quantity, prominence, consistency and familiarity of navigation tools and structures on the available pages. When moving between pages is required, if there are many hyperlinks or menu items to choose from, the reader is likely to find the task more difficult than if there are only one or two hyperlinks to choose from. A task is made easier if there are prominently placed links in a conventional location on the screen; a task is more difficult if links are embedded in the text or are in an otherwise unconventional or inconspicuous location. Finally, the degree of direction in navigating influences task difficulty. Even when the reader needs to consult several pages, explicit directions about the pages that must be visited and the navigation structures to use can make the task relatively easy.
•Explicitness of task demands: This variable relates to the specificity of direction in completing the task: how much the reader needs to infer the scope and substance of what is required for the response. Difficulty is influenced by the relationship between the task and the text that must be processed. If the question uses the same or similar terminology to that used in the text, the task will be easier than if the terms used are different. When the criteria for responding are not explicitly stated in the task, so that readers have to generate their own criteria, difficulty increases. In this context, task formats in which the student selects a response from a limited list, such as multiple-choice items, tend to be easier than those for which the student needs to construct the response. (This variable does not reflect the specificity of guidance for navigation, which is accounted for in the complexity of navigation variable.)
•Nature of response: This variable relates to the kind of mental processing that the reader has to undertake to complete the task. Where the reader needs to generate concepts from within the text, rather than having them supplied, the task is likely to be more demanding. Where the reader needs to make a series of inferences, to evaluate and reflect, to construct relationships, such as causation or contrast among elements of the text, the task is typically more difficult than one in which processing the text only requires a simple transfer or basic identification of material. Further, a task that focuses on abstract concepts will be more difficult than one in which concrete information is the focus.

PISA 2009 TECHNICAL REPORT – © OECD 2012 275
15Proficiency Scale conStruction
Levels of digital reading literacyThe approach to developing described proficiency levels for digital reading was similar to that used for print reading. However, some variations were employed, because of two factors. First, because digital and print reading were conceived of, in the framework, as a single construct – reading – it was intended to construct the digital reading scale in such a way as to allow comparison with print reading, and combination of the two scales into a composite reading scale. Second, because there were relatively few items in the digital reading pool for PISA 2009, there was no attempt to construct subscales.
On account of the first of these factors, the metric for the digital reading scale was set so that the mean and the standard deviation of the 16 equally weighted OECD countries that participated in the digital reading assessment are the same as those for the same group of countries’ print reading mean and standard deviation. This mean was 499 score points, with a standard deviation of 90.
On account of the second of these factors, the relatively small number of items in the pool for PISA 2009, not only was there no attempt at subscale definition, but also only four levels, rather than seven, were described. The levels were aligned with the four middle print reading levels and labelled Level 2, Level 3, Level 4 and Level 5 or above. Below Level 2 there is a “place-holder” region of the scale, with too few items to support level descriptions. This area is called “Below Level 2”. It is anticipated that items reflecting this low level of proficiency will be developed for future PISA surveys. Similarly, tasks may be added to the top of the scale to allow for the description of a Level 6. In the current scale, Level 5 in digital reading is unbounded (hence “Level 5 and above”), and accounts for the region above 625.61.
The level definitions on the PISA digital reading scale are given in Table 15.2, with the print reading levels included for comparison.
Level fordigital reading Score points on the PISa scale
Level forprint reading
5Higher than 698.32 6
and aboveHigher than 625.61 and less than or equal to 698.32 5
4 Higher than 552.89 and less than or equal to 625.61 4
3 Higher than 480.18 and less than or equal to 552.89 3
2 Higher than 407.47 and less than or equal to 480.18 2
Below 2 Higher than 334.75 and less than or equal to 407.47 1a
262.04 to less than or equal to 334.75 1b
table 15.2 digital and print reading literacy performance band definitions on the PiSa scale
As with print reading, the information about the digital reading items in each level, from Level 2 to Level 5 and above, is used to develop summary descriptions of the kinds of digital reading literacy associated with different levels of proficiency.
The continuum of increasing digital reading literacy that is represented in Figure 15.11 is divided into these four described levels, each of equal width, and two unbounded regions, one at each end of the continuum.
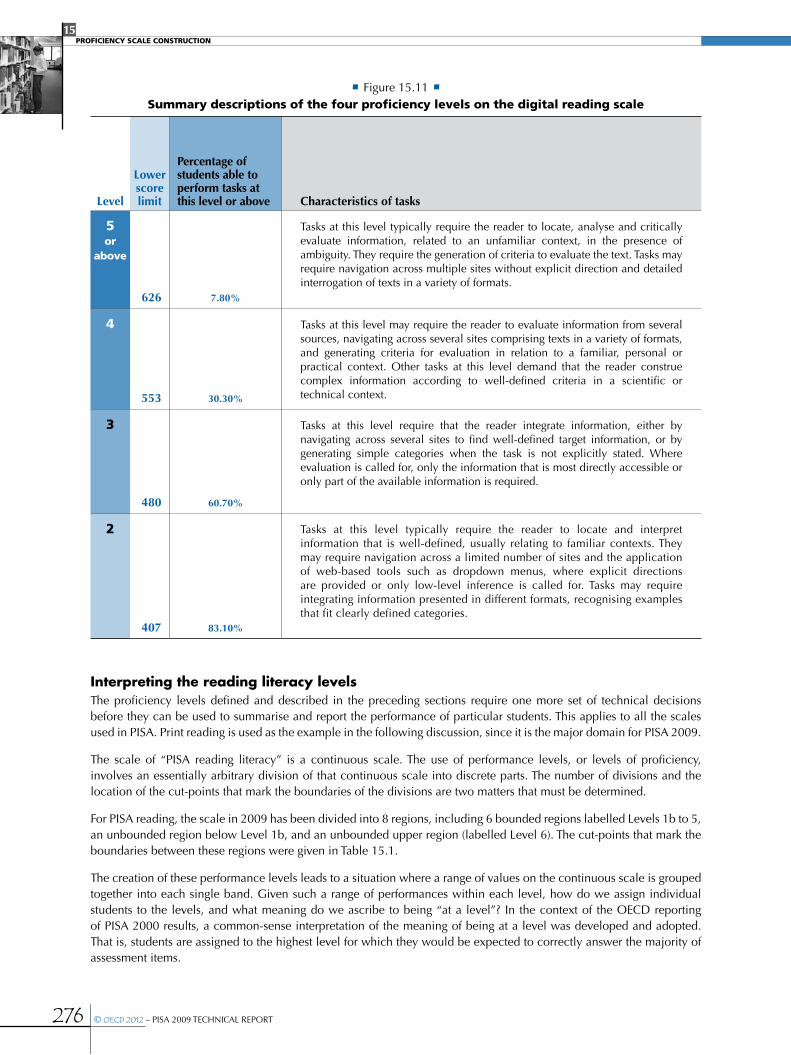
276 © OECD 2012 – PISA 2009 TECHNICAL REPORT
15Proficiency Scale conStruction
Level
Lower score limit
Percentage of students able to perform tasks at this level or above Characteristics of tasks
5or
above
626 7.80%
Tasks at this level typically require the reader to locate, analyse and critically evaluate information, related to an unfamiliar context, in the presence of ambiguity. They require the generation of criteria to evaluate the text. Tasks may require navigation across multiple sites without explicit direction and detailed interrogation of texts in a variety of formats.
4
553 30.30%
Tasks at this level may require the reader to evaluate information from several sources, navigating across several sites comprising texts in a variety of formats, and generating criteria for evaluation in relation to a familiar, personal or practical context. Other tasks at this level demand that the reader construe complex information according to well-defined criteria in a scientific or technical context.
3
480 60.70%
Tasks at this level require that the reader integrate information, either by navigating across several sites to find well-defined target information, or by generating simple categories when the task is not explicitly stated. Where evaluation is called for, only the information that is most directly accessible or only part of the available information is required.
2
407 83.10%
Tasks at this level typically require the reader to locate and interpret information that is well-defined, usually relating to familiar contexts. They may require navigation across a limited number of sites and the application of web-based tools such as dropdown menus, where explicit directions are provided or only low-level inference is called for. Tasks may require integrating information presented in different formats, recognising examples that fit clearly defined categories.
• Figure 15.11 •Summary descriptions of the four proficiency levels on the digital reading scale
Interpreting the reading literacy levelsThe proficiency levels defined and described in the preceding sections require one more set of technical decisions before they can be used to summarise and report the performance of particular students. This applies to all the scales used in PISA. Print reading is used as the example in the following discussion, since it is the major domain for PISA 2009.
The scale of “PISA reading literacy” is a continuous scale. The use of performance levels, or levels of proficiency, involves an essentially arbitrary division of that continuous scale into discrete parts. The number of divisions and the location of the cut-points that mark the boundaries of the divisions are two matters that must be determined.
For PISA reading, the scale in 2009 has been divided into 8 regions, including 6 bounded regions labelled Levels 1b to 5, an unbounded region below Level 1b, and an unbounded upper region (labelled Level 6). The cut-points that mark the boundaries between these regions were given in Table 15.1.
The creation of these performance levels leads to a situation where a range of values on the continuous scale is grouped together into each single band. Given such a range of performances within each level, how do we assign individual students to the levels, and what meaning do we ascribe to being “at a level”? In the context of the OECD reporting of PISA 2000 results, a common-sense interpretation of the meaning of being at a level was developed and adopted. That is, students are assigned to the highest level for which they would be expected to correctly answer the majority of assessment items.

PISA 2009 TECHNICAL REPORT – © OECD 2012 277
15Proficiency Scale conStruction
If we could imagine a test composed of items spread uniformly across a level, a student near the bottom of the level will be expected to correctly answer at least half of the test questions from that level. Students at progressively higher points in that level would be expected to correctly answer progressively more of the questions in that level. It should be remembered that the relationship between students and items is probabilistic: it is possible to estimate the probability that a student at a particular location on the scale will get an item at a particular location on the scale correct. Students assigned to a particular level will be expected to successfully complete some items from the next higher level, and it is only when that expectation reaches the threshold of “at least half of the items” in the next higher level that the student would be placed in the next higher level.
Mathematically, the probability level used to assign students to the scale to achieve this common-sense interpretation of being at a level is 0.62. Students are placed on the scale at the point where they have a 62% chance of correctly answering test questions located at the same point.
The same meaning has been applied in the reporting of PISA since 2000. Such an approach makes it possible to summarise aspects of student proficiency by describing the things related to PISA reading literacy that students can be expected to do at different locations on the scale.
Note
1. Strictly speaking while the scales based on aspects of reading are subscales of the combined reading literacy scale, for simplicity they are mostly referred to as “scales” rather than “subscales” in this report.


16
PISA 2009 TECHNICAL REPORT – © OECD 2012 279
Scaling Proceduresand Construct Validation ofContext Questionnaire Data
Overview.......................................................................................................................................................................... 280
Simple questionnaire indices .......................................................................................................................... 280
Scaling methodology and construct validation ................................................................................ 284
Questionnaire scale indices ............................................................................................................................. 287

16SCALING PROCEDURES AND CONSTRUCT VALIDATION OF CONTEXT QUESTIONNAIRE DATA
280 © OECD 2012 – PISA 2009 TECHNICAL REPORT
overviewThe PISA 2009 context questionnaires included numerous items on student characteristics, student family background, student perceptions, school characteristics and perceptions of school principals. In 14 countries the optional parent questionnaires were administered to the parents of the tested students.
Some of the items were designed to be used in analyses as single items (for example, gender). However, most questionnaire items were designed to be combined in some way so as to measure latent constructs that cannot be observed directly. For these items, transformations or scaling procedures are needed to construct meaningful indices.
This chapter describes how student, school and parent questionnaire indices were constructed and validated. As in previous PISA surveys, two different kinds of indices can be distinguished:
•simple indices: These indices were constructed through the arithmetical transformation or recoding of one or more items; and
•scale indices: These indices were constructed through the scaling of items. Typically, scale scores for these indices are estimates of latent traits derived through IRT scaling of dichotomous or Likert-type items.
This chapter: i) outlines how simple indices were constructed, ii) describes the methodology used for construct validation and scaling, iii) details the construction and validation of scaled indices and iv) illustrates the computation of the index on economic, social and cultural status (ESCS). Some indices have been used in previous PISA surveys and were constructed based on a similar scaling methodology (see Schulz, 2002; and OECD, 2005). Most indices, however, were based on the elaboration of the questionnaire framework and are related to reading as the major domain of the fourth PISA survey (see Chapter 3).
SiMPle QueStionnaire indiceS
Student ageThe age of a student (AGE) was calculated as the difference between the year and month of the testing and the year and month of a student’s birth. Data on student’s age were obtained from both the questionnaire and the student tracking forms. If the month of testing was not known for a particular student, the median month of testing for that country was used in the calculation. The formula for computing AGE was
16.1
AGE = (100 + Ty – Sy)+(Tm – Sm)
12 where Ty and Sy
are the year of the test and the year of the students’ birth of the tested student, respectively in two-digit format (for example “06” or “92”), and Tm and Sm are the month of the test and month of the students’ birth respectively. The result is rounded to two decimal places.
Study programme indicesPISA 2009 collected data on study programmes available to 15-year-old students in each country. This information was obtained through the student tracking form and the student questionnaire. In the final database, all national programmes will be included in a separate variable (PROGN) where the first three digits are the ISO code for a country, the next two digits are the sub-national category, and the last two digits are the nationally specific programme code. All study programmes were classified using the International Standard Classification of Education (ISCED) (OECD, 1999). The following indices are derived from the data on study programmes: programme level (ISCEDL) indicating whether students are on the lower or upper secondary level (ISCED 2 or ISCED 3); programme designation (ISCEDD) indicating the designation of the study programme (A = general programmes designed to give access to the next programme level, B = programmes designed to give access to vocational studies at the next programme level, C = programmes designed to give direct access to the labour market, M = modular programmes that combine any or all of these characteristics; and programme orientation (ISCEDO) indicating whether the programme’s curricular content is general, pre-vocational or vocational.
Highest occupational status of parentsOccupational data for both the student’s father and student’s mother were obtained by asking open-ended questions. The response were coded to four-digit ISCO codes (ILO,1990) and then mapped to the international socio-economic

16SCALING PROCEDURES AND CONSTRUCT VALIDATION OF CONTEXT QUESTIONNAIRE DATA
PISA 2009 TECHNICAL REPORT – © OECD 2012 281
index of occupational status (ISEI) (Ganzeboom et al., 1992). Three indices were obtained from these scores: father’s occupational status (BFMJ); mother’s occupational status (BMMJ); and the highest occupational status of parents (HISEI) which corresponds to the higher ISEI score of either parent or to the only available parent’s ISEI score. For all three indices, higher ISEI scores indicate higher levels of occupational status.
Educational level of parentsParental education is a second family background variable that is often used in the analysis of educational outcomes. Theoretically, it has been argued that parental education is a more relevant influence on student’s outcomes than is parental occupation. Like occupation, the collection of internationally comparable data on parental education poses significant challenges, and less work has been done on internationally comparable measures of educational outcomes than has been done on occupational status. The core difficulties with parental education relate to international comparability (education systems differ widely between countries and within countries over time), response validity (students are often unable to accurately report their parents’ level of education) and, especially with increasing immigration, difficulties in the national mapping of parental qualifications gained abroad.
Parental education is classified using ISCED (OECD, 1999). Indices on parental education are constructed by recoding educational qualifications into the following categories: (0) None; (1) ISCED 1 (primary education); (2) ISCED 2 (lower secondary); (3) ISCED Level 3B or 3C (vocational/pre-vocational upper secondary); (4) ISCED 3A (upper secondary) and/or ISCED 4 (non-tertiary post-secondary); (5) ISCED 5B (vocational tertiary); and (6) ISCED 5A, 6 (theoretically oriented tertiary and post-graduate). Indices with these categories were provided for the students’ mother (MISCED) and the students’ father (FISCED). In addition, the index on the highest educational level of parents (HISCED) corresponds to the higher ISCED level of either parent.
The index scores for highest educational level of parents were also recoded into estimated years of schooling (PARED). A mapping of ISCED levels of years of schooling is provided in Annex E.
Immigration backgroundInformation on the country of birth of the students and their parents was also collected. Included in the database are three country-specific variables relating to the country of birth of the student, mother, and father (CTNUMS, CTNUMM, and CTNUMF). Also, the items ST17Q01, ST17Q02 and ST17Q03 have been recoded for the database into the following categories: (1) country of birth is same as country of assessment, and (2) otherwise.
The index on immigrant background (IMMIG) is calculated from these variables, and has the following categories: (1) native students (those students who had at least one parent born in the country), (2) second-generation students (those born in the country of assessment but whose parent(s) were born in another country) and (3) first-generation students (those students born outside the country of assessment and whose parents were also born in another country). Students with missing responses for either the student or for both parents have been given missing values for this variable.
Language spoken at homeStudents also indicated what language they usually spoke at home, and the database includes a variable (LANGN) containing country-specific code for each language. In addition, an internationally comparable variable ST19Q01 is derived from this information and has the following categories: (1) language at home is same as the language of assessment for that student, (2) language at home is another language.
Family structureInformation on family structure was collected and an index FAMSTRUC was based on it. The index has the following categories: FAMSTRUC=1 if “single parent family” (students living with only one of the following: mother, father, male guardian, female guardian), FAMSTRUC=2 if “two parent family” (students living with a father or step/foster father and a mother or step/foster mother), FAMSTRUC=3 if “other”.
Relative gradeIn order to capture between country variations, the relative grade index (GRADE) was computed. It indicated whether students are at a modal grade in a country (value of 0) or whether they are below or above the modal grade (+x grades, -x grades).

16SCALING PROCEDURES AND CONSTRUCT VALIDATION OF CONTEXT QUESTIONNAIRE DATA
282 © OECD 2012 – PISA 2009 TECHNICAL REPORT
Learning timeLearning time in test language (LMINS) was computed by multiplying the number of minutes on average in the test language class by number of test language class periods per week. Comparable indices were computed for mathematics (MMINS) and science (SMINS).
Meta-cognition The two meta-cognition tasks “Understanding and remembering” (UNDREM) and “Summarising” (METASUM), consist of a stem (which is a reading task) and set of strategies. For each strategy students were asked to rate the usefulness of the strategy. Through a variety of trial activities both with reading experts and national centres an agreed preferred ordering of the strategies according to their effectiveness was determined. For each student a score on each of the tasks was then computed. To do this the expert orderings for each task were represented as a set of order relations. Then for each student the ratings they gave to the strategies were expressed as order relations and the consistency between the student order relations and expert order relations was determined. The final scores assigned to each student for each task was a number that ranged from 0 to 1 and can be interpreted as the proportion of the total number of expert pair wise relations that are consistent with the student ordering.
For the meta-cognition scale “Understanding and Remembering” the expert agreed ordering strategy was CDE>ABF where the alphabets represent the item numbers (going from A to F) as they appear in the scale. Thus 3x3=9 pair wise rules are created (C>A, C>B, C>F, D>A, D>B, D>F, E>A, E>B, E>F. If the responses of a student on this task follow 6 of the 9 rules, the student gets a score of 6 / 9 = 0.67. However if there is a missing response on any item in the meta-cognition scales, the scale score is treated as a missing. Likewise for the meta-cognition scale “Summarising”, the following pair wise rules were created DE>AC>B. These two meta-cognition indices were standardised to having an OECD mean of 0 and a standard deviation of 1 (for the pooled data with equally weighted country samples).
Blue-collar/white-collar parental occupationThe ISCO codes of parents were recoded into 4 categories: (1) white collar high skilled, (2) white collar low skilled, (3) blue collar high skilled, and (4) blue collar low skilled (see Table 16.1). Three variables are included, one indicating the mother’s employment category (MSECATEG), another indicating father’s employment category (FSECATEG), and another indicating the highest employment category of either parent (HSECATEG).
table 16.1 iSco major group white-collar/blue-collar classification
ISCo major group white-collar\blue-collar classification
1 White-collar high skilled
2 White-collar high skilled
3 White-collar high skilled
4 White-collar low skilled
5 White-collar low-skilled
6 Blue-collar high skilled
7 Blue -collar high skilled
8 Blue-collar low-skilled
9 Blue-collar low-skilled
School questionnaire indices
School sizeThe PISA 2009 index of school size (SCHLSIZE) contains the total enrolment at school based on the enrolment data provided by the school principal, summing the number of girls and boys at a school.
Proportion of girls enrolled at schoolThe PISA 2009 index on the proportion of girls at school (PCGIRLS) is based on the enrolment data provided by the school principal, dividing the number of girls by the total of girls and boys at a school.
School typeSchools are classified as either public or private according to whether a private entity or a public agency has the ultimate power to make decisions concerning its affairs. As in previous PISA surveys, the index on school type (SCHLTYPE) has

16SCALING PROCEDURES AND CONSTRUCT VALIDATION OF CONTEXT QUESTIONNAIRE DATA
PISA 2009 TECHNICAL REPORT – © OECD 2012 283
three categories: (1) public schools controlled and managed by a public education authority or agency, (2) government-dependent private schools controlled by a non-government organisation or with a governing board not selected by a government agency which receive more than 50% of their core funding from government agencies, (3) government-independent private schools controlled by a non-government organisation or with a governing board not selected by a government agency which receive less than 50% of their core funding from government agencies.
Availability of computersSchool principals were asked to report the number of computers available at school. However, the question wording was modified for 2009 where principals were asked to report on the total number of students in the modal grade for 15-year-olds, the number of computers available for educational purposes for these students and the number of these computers that are connected to the internet. The index of availability of computers (IRATCOMP) is the ratio of computers for educational purposes available to 15 year olds to the number of students in the modal grade for 15-year-olds. In PISA 2009 the index COMPWEB will be the ratio of number of computers for educational purposes connected to the web to the number of computers for educational purposes available to students in the modal grade for 15-year-olds.
Quantity of teaching staff at school Principals were asked to report the number of full-time and part-time teachers at school. However, as in PISA 2006, the number of items was reduced in 2009 to capture only teachers in total, certified teachers, and teachers with an ISCED 5A qualification.
The student-teacher ratio (STRATIO) was obtained by dividing the school size by the total number of teachers. The number of part-time teachers is weighted by 0.5 and the number of full-time teachers is weighted by 1.0. The proportion of fully certified teachers (PROPCERT) was computed by dividing the number of fully certified teachers by the total number of teachers. The proportion of teachers who have an ISCED 5A qualification (PROPQUAL) was calculated by dividing the number of these kinds of teachers by the total number of teachers.
School selectivityAs in previous surveys, school principals were asked about admittance policies at their school. Among these policies, principles were asked how much consideration was given to the following factors when students are admitted to the school, based on a scale with the categories “not considered”, “considered”, “high priority”, and “pre-requisite”: students’ academic record (including placement tests) and the recommendation of feeder schools.
An index of academic school selectivity (SELSCH) was computed by assigning schools to four different categories: (1) schools where neither of these two factors is considered for student admittance, (2) schools considering at least one of these two factors, (3) schools where at least one of these two factors is a prerequisite for student admittance.
Ability groupingSchool principals were asked to report the extent to which their school organises instruction differently for students with different abilities. There were two items which asked about subject grouping in a more general sense. One item asked about the occurrence of ability grouping into different classes and the other regarding ability grouping within classes (with the response categories “For all subjects”, “For some subjects” and “Not for any subject”).
An index of ability grouping between classes (ABGROUP) was derived from the two items by assigning schools to three categories: (1) schools with no ability grouping for any subjects, (2) schools with one of these forms of ability grouping between classes for some subjects and (3) schools with one of these forms of ability grouping for all subjects.
School responsibility for resource allocationAn index of the relative level of responsibility of school staff in allocating resources (RESPRES) was derived from six items measuring the school principals’ report on who has considerable responsibility for tasks regarding school management of resource allocation (“Selecting teachers for hire”, “Firing teachers”, “Establishing teachers’ starting salaries”, “Determining teachers’ salaries increases”, “Formulating the school budget”, “Deciding on budget allocations within the school”). The index was calculated on the basis of the ratio of “yes” responses for principal or teachers to “yes” responses for regional/local education authority or national educational authority. Higher values on the scale indicate relatively higher levels of school responsibility in this area. The index was standardised to having an OECD mean of 0 and a standard deviation of 1 (for the pooled data with equally weighted country samples).

16SCALING PROCEDURES AND CONSTRUCT VALIDATION OF CONTEXT QUESTIONNAIRE DATA
284 © OECD 2012 – PISA 2009 TECHNICAL REPORT
School responsibility for curriculum and assessmentAn index of the relative level of responsibility of school staff in issues relating to curriculum and assessment (RESPCURR) was computed from four items measuring the school principal’s report concerning who had responsibility for curriculum and assessment (“Establishing student assessment policies”, “Choosing which textbooks are used”, “Determining course content”, and “Deciding which courses are offered”). The index was calculated on the basis of the ratio of “yes” responses for principal or teachers to “yes” responses for regional/local education authority or national educational authority. Higher values indicate relatively higher levels of school responsibility in this area. The index was standardised to having an OECD mean of zero and a standard deviation of one (for the pooled data with equally weighted country samples).
Parent questionnaire indices
Educational level of parentsAdministration of this instrument in PISA 2009 provided the opportunity to collect data on parental education directly from the parents in addition to the data provided by the student questionnaire. Similar to the student questionnaire data, parental education were classified using ISCED (OECD, 1999). The question format differed from the one used in the student questionnaire as only four items were included with dichotomous response categories of “yes’’ or “no’’.
Indices were constructed by taking the highest level for father and mother and having the following categories: (0) None, (1) ISCED 3A (upper secondary) and/or ISCED 4 (non-tertiary post-secondary), (2) ISCED 5B (vocational tertiary), (3) ISCED 5A, 6 (theoretically oriented tertiary and post-graduate). Indices with these categories were computed for mother (PQMISCED) and father (PQFISCED). Highest educational level of parents (PQHISCED) corresponds to the higher ISCED level of either parent.
Scaling Methodology and conStruct validation
Scaling proceduresMost questionnaire items were scaled using IRT scaling methodology. With the One-Parameter (Rasch) model (Rasch, 1960) for dichotomous items, the probability of selecting category 1 instead of 0 is modelled as
16.2
Pi (θ) =exp (θn – δi )
1+ exp (θn – δi ) where Pi (qn ) is the probability of person n to score 1 on item i. qn is the estimated latent trait of person n and δi the estimated location of item i on this dimension. For each item, item responses are modelled as a function of the latent trait qn.
In the case of items with more than two (k) categories (as for example with Likert-type items) this model can be generalised to the Partial credit model (Masters and Wright, 1997), which takes the form of
16.3
Pxi (θ) =exp
x
�k=0
(θn–δi +τij)
mi
�h=0
exph
�k=0
(θn – δi +τik)
xi = 0,1,...,mi
where Pxi (qn ) denotes the probability of person n to score x on item i out of the mi possible scores on the item. qn denotes the person’s latent trait, the item parameter δi gives the location of the item on the latent continuum and tij denotes an additional step parameter.
International item parameters were obtained using the MIRT software.1 The calibration samples consisted of randomly selected sub-samples:
•For the calibration of student item parameters, sub-samples of 500 students were randomly selected within each OECD country sample. As final student weights had not been available at the time the calibration sample was drawn, the random selection was based on preliminary student weights obtained from the ratio between sampled and enrolled student within explicit sampling strata. The final calibration sample included data from 15 500 students.
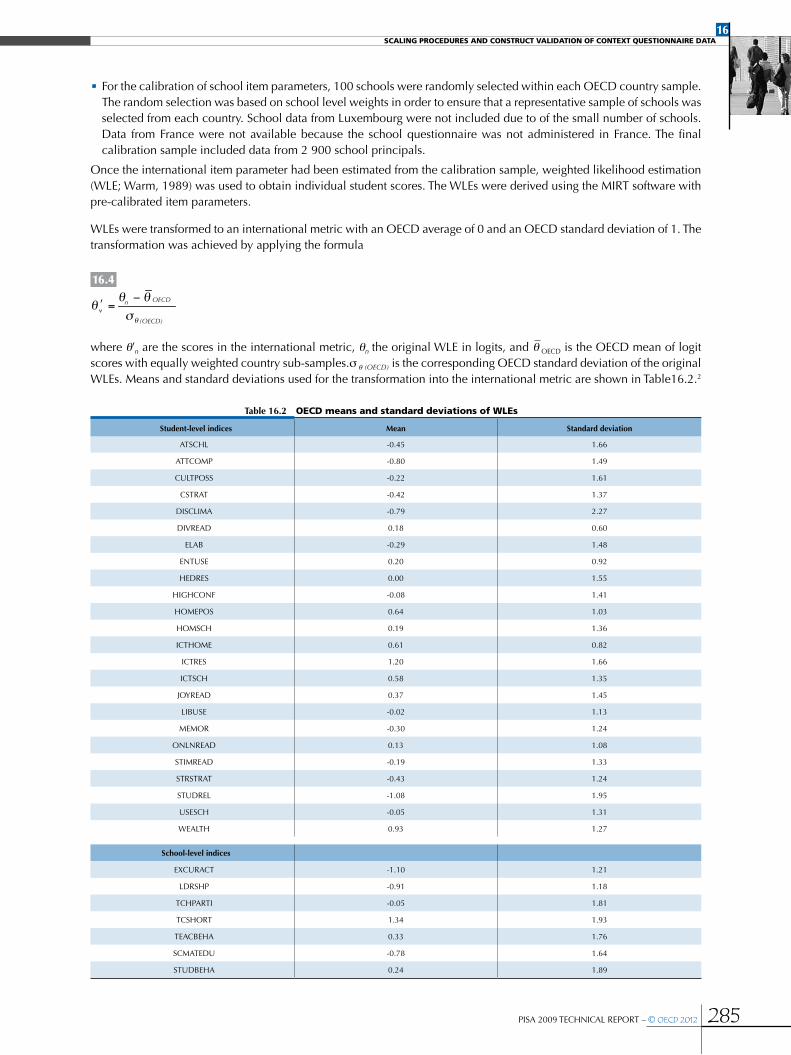
16SCALING PROCEDURES AND CONSTRUCT VALIDATION OF CONTEXT QUESTIONNAIRE DATA
PISA 2009 TECHNICAL REPORT – © OECD 2012 285
•For the calibration of school item parameters, 100 schools were randomly selected within each OECD country sample. The random selection was based on school level weights in order to ensure that a representative sample of schools was selected from each country. School data from Luxembourg were not included due to of the small number of schools. Data from France were not available because the school questionnaire was not administered in France. The final calibration sample included data from 2 900 school principals.
Once the international item parameter had been estimated from the calibration sample, weighted likelihood estimation (WLE; Warm, 1989) was used to obtain individual student scores. The WLEs were derived using the MIRT software with pre-calibrated item parameters.
WLEs were transformed to an international metric with an OECD average of 0 and an OECD standard deviation of 1. The transformation was achieved by applying the formula
16.4
(OECD)
OECDnν
θσθθ
θ−
=ʹ
where qʹn are the scores in the international metric, qn the original WLE in logits, and q OECD is the OECD mean of logit scores with equally weighted country sub-samples.σ q (OECD) is the corresponding OECD standard deviation of the original WLEs. Means and standard deviations used for the transformation into the international metric are shown in Table16.2.2
table 16.2 oecd means and standard deviations of wles
Student-level indices mean Standard deviation
ATSCHL -0.45 1.66
ATTCOMP -0.80 1.49
CULTPOSS -0.22 1.61
CSTRAT -0.42 1.37
DISCLIMA -0.79 2.27
DIVREAD 0.18 0.60
ELAB -0.29 1.48
ENTUSE 0.20 0.92
HEDRES 0.00 1.55
HIGHCONF -0.08 1.41
HOMEPOS 0.64 1.03
HOMSCH 0.19 1.36
ICTHOME 0.61 0.82
ICTRES 1.20 1.66
ICTSCH 0.58 1.35
JOYREAD 0.37 1.45
LIBUSE -0.02 1.13
MEMOR -0.30 1.24
ONLNREAD 0.13 1.08
STIMREAD -0.19 1.33
STRSTRAT -0.43 1.24
STUDREL -1.08 1.95
USESCH -0.05 1.31
WEALTH 0.93 1.27
School-level indices
EXCURACT -1.10 1.21
LDRSHP -0.91 1.18
TCHPARTI -0.05 1.81
TCSHORT 1.34 1.93
TEACBEHA 0.33 1.76
SCMATEDU -0.78 1.64
STUDBEHA 0.24 1.89

16SCALING PROCEDURES AND CONSTRUCT VALIDATION OF CONTEXT QUESTIONNAIRE DATA
286 © OECD 2012 – PISA 2009 TECHNICAL REPORT
Construct validationThe development of comparable measures of student background, attitudes and perceptions is a major goal of PISA. Cross-country validity of these constructs is of particular importance as measures derived from questionnaires are often used to explain differences in student performance within and across countries and are, thus, potential sources of policy-relevant information about ways of improving educational systems. There are different methodological approaches for validating questionnaire constructs, each with their advantages, limitations and problems.
Cross-country validity of the constructs not only requires a thorough and closely monitored process of translation into different languages. It also makes assumptions about having measured similar characteristics, attitudes and perceptions in different national and cultural contexts. Psychometric techniques can be used to analyse the extent to which constructs have consistent construct validity across participating countries. This is done by first checking the reliability of the scales across individual countries and then correlations are also estimated for certain scales which are thought to be related. These correlations should be consistent across countries. This can be seen, for example, in Table 16.8 where there are similar correlations across the OECD countries between the indices, diversity of reading and enjoyment of reading. Table 16.9 for the partner countries shows correlations which are also similar, but not to the same degree as in the OECD countries. Similar results are found in Tables 16.21 and 16.22 for the indices, teacher-student relations and disciplinary climate and in the Tables 16.25 and 16.26 for the indices, teachers’ stimulation of reading and teaching strategies.
Describing questionnaire scale indicesAs in previous PISA surveys, in PISA 2009 categorical items from the context questionnaires were scaled using IRT modelling. WLEs (logits) for the latent dimensions were transformed to scales with an OECD average of 0 and a standard deviation of 1 (with equally weighted samples). It is possible to interpret these scores by comparing individual scores or group average scores to the OECD mean, but the individual scores do not reveal anything about the actual item responses and it is impossible to determine from scale score values to what extent respondents endorsed the items used for the measurement of the latent variable. However, the scaling model used to derive individual scores allows descriptions of these scales by mapping scale scores to (expected) item responses.3
Item characteristics can be described using the parameters of the partial credit model by summing for each category its probability of being chosen with the probabilities of all higher categories. This is equivalent to computing the odds of scoring higher than a particular category.
The results of plotting these cumulative probabilities against scale scores for a fictitious item are displayed in Figure 16.1. The three vertical lines denote those points on the latent continuum where it becomes more likely to score > 0, >1 or >2. These locations, Gk , are Thurstonian thresholds that can be obtained through an iterative procedure that calculates summed probabilities for each category at each (decimal) point on the latent variable.
• Figure 16.1 •Summed category probabilities for fictitious item
1.0
0.8
0.6
0.4
0.2
0
-4 -3 -2 -1 0 1 2 3 4
Prob
abili
ty
THETA
Strongly disagree Strongly agreeDisagree Agree
Γ3Γ2Γ1
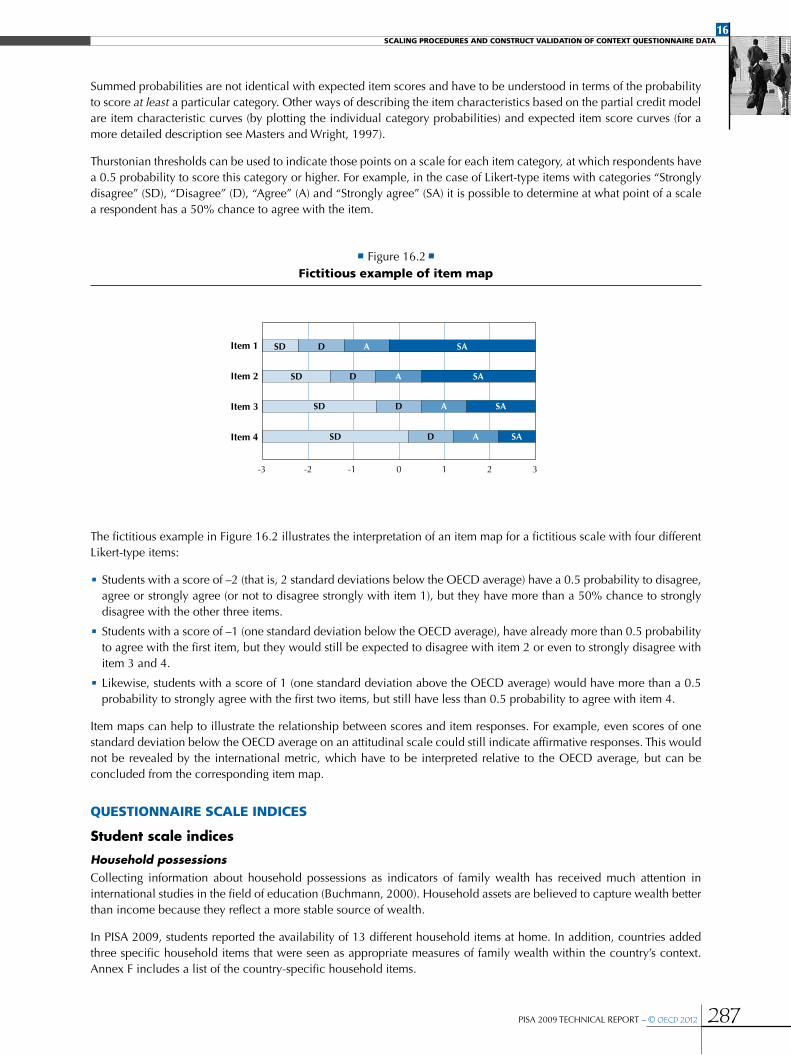
16SCALING PROCEDURES AND CONSTRUCT VALIDATION OF CONTEXT QUESTIONNAIRE DATA
PISA 2009 TECHNICAL REPORT – © OECD 2012 287
Summed probabilities are not identical with expected item scores and have to be understood in terms of the probability to score at least a particular category. Other ways of describing the item characteristics based on the partial credit model are item characteristic curves (by plotting the individual category probabilities) and expected item score curves (for a more detailed description see Masters and Wright, 1997).
Thurstonian thresholds can be used to indicate those points on a scale for each item category, at which respondents have a 0.5 probability to score this category or higher. For example, in the case of Likert-type items with categories “Strongly disagree” (SD), “Disagree” (D), “Agree” (A) and “Strongly agree” (SA) it is possible to determine at what point of a scale a respondent has a 50% chance to agree with the item.
• Figure 16.2 •Fictitious example of item map
The fictitious example in Figure 16.2 illustrates the interpretation of an item map for a fictitious scale with four different Likert-type items:
•Students with a score of –2 (that is, 2 standard deviations below the OECD average) have a 0.5 probability to disagree, agree or strongly agree (or not to disagree strongly with item 1), but they have more than a 50% chance to strongly disagree with the other three items.
•Students with a score of –1 (one standard deviation below the OECD average), have already more than 0.5 probability to agree with the first item, but they would still be expected to disagree with item 2 or even to strongly disagree with item 3 and 4.
•Likewise, students with a score of 1 (one standard deviation above the OECD average) would have more than a 0.5 probability to strongly agree with the first two items, but still have less than 0.5 probability to agree with item 4.
Item maps can help to illustrate the relationship between scores and item responses. For example, even scores of one standard deviation below the OECD average on an attitudinal scale could still indicate affirmative responses. This would not be revealed by the international metric, which have to be interpreted relative to the OECD average, but can be concluded from the corresponding item map.
QueStionnaire Scale indiceS
Student scale indices
Household possessionsCollecting information about household possessions as indicators of family wealth has received much attention in international studies in the field of education (Buchmann, 2000). Household assets are believed to capture wealth better than income because they reflect a more stable source of wealth.
In PISA 2009, students reported the availability of 13 different household items at home. In addition, countries added three specific household items that were seen as appropriate measures of family wealth within the country’s context. Annex F includes a list of the country-specific household items.
Item 1
-3 -2 -1 0 1 2 3
Item 2
Item 3
Item 4
SD D A SA
SD D A SA
SD D A SA
SD D A SA

16SCALING PROCEDURES AND CONSTRUCT VALIDATION OF CONTEXT QUESTIONNAIRE DATA
288 © OECD 2012 – PISA 2009 TECHNICAL REPORT
Five different indices were derived from these items: i) family wealth possessions (WEALTH), ii) cultural possessions (CULTPOSS), iii) home educational resources (HEDRES), ICT resources at home (ICTRES) and iv) home possessions (HOMEPOS). The last index is a summary index of all household items and also included the variable indicating the number of books at home, but recoded into four categories: (0) 0-25 books, (1) 26-100 books, (2) 100-500 books and (3) more than 500 books. HOMEPOS was also one of three components in the construction of the index of economic, social and cultural status ESCS (see the section on ESCS index construction at the end of this chapter). Table 16.3 shows the wording of items and their allocation to the four indices.
table 16.3 household possessions and home background indices
Item
Item is used to measure index
weaLth CuLtPoSS hedreS homePoS ICtreS
ST20 In your home, do you have:
ST20Q01 A desk to study at X X
ST20Q02 A room of your own X X
ST20Q03 A quiet place to study X X
ST20Q04 A computer you can use for school work X X
ST20Q05 Educational software X X X
ST20Q06 A link to the internet X X X
ST20Q07 Classical Literature X X
ST20Q08 Books of poetry X X
ST20Q09 Works of art X X
ST20Q10 Books to help with your school work X X
ST20Q11 Technical reference books X X
ST20Q12 A dictionary X X
ST20Q13 A dishwasher X X
ST20Q14 A <DVD> player X X
ST20Q15 <Country-specific wealth item 1> X X
ST20Q16 <Country-specific wealth item 2> X X
ST20Q17 <Country-specific wealth item 3> X X
ST21 How many of these are there at your home?
ST21Q01 Cellular phones X X
ST21Q02 Televisions X X
ST21Q03 Computers X X X
ST21Q04 Cars X X
ST21Q05 Rooms with a bath or shower X X
ST22 How many books are there in your home X
It was decided to use nationally defined item parameters for scaling the possessions indices instead of using parameters estimated for the combined OECD sample. The scales were constructed in two stages. In stage 1 item parameters were estimated concurrently within countries with equally weighted sampled data from all cycles. A sample of 500 students was taken from each cycle that a country participated in. In stage 2 a linear transformation was applied to the withincountry estimates of the possessions scales to make them comparable across countries. The linear transformation reflected the relative mean positions of the countries on a common scale. For the linear transformation, the relative means of the individual countries estimated on the common scale were simply added to their national means to make them comparable. For transforming the WEALTH and HOMEPOS scales a “basket” of common items was chosen

16SCALING PROCEDURES AND CONSTRUCT VALIDATION OF CONTEXT QUESTIONNAIRE DATA
PISA 2009 TECHNICAL REPORT – © OECD 2012 289
excluding the country specific items appearing in these scales and the relative means of the countries were estimated for each country based on this item set. The linear transformations for CULTPOSS. HEDRES and ICTRES were based on all items present in these scales.
Table 16.4 shows the alpha reliabilities in OECD countries for all five scales; Table 16.5 shows these in partner countries. When comparing OECD and partner countries it appears that scale reliabilities for WEALTH, HEDRES and HOMEPOS are generally higher in partner countries. This may be due to the higher degree of accessibility of household items for larger proportions of the population in developed countries. In more developed countries there are very high percentages of students reporting the existence of many of the household items which makes them less appropriate as indicators of wealth. In general, the reliability of the ICTRES index is much lower than other indices as this index is based on just three items. As this index is estimated to analyse trends, there is no data for countries that did not participate in PISA 2000.
table 16.4 Scale reliabilities for home possession indices in oecd countries
weaLth hedreS CuLtPoSS homePoS ICtreS
australia 0.61 0.61 0.61 0.71 0.30
austria 0.65 0.48 0.58 0.70 0.26
Belgium 0.65 0.52 0.63 0.71 0.29
Canada 0.66 0.59 0.61 0.72 0.28
Chile 0.78 0.61 0.46 0.83 0.67
Czech republic 0.69 0.50 0.60 0.71 0.34
denmark 0.61 0.47 0.63 0.69 0.20
estonia 0.70 0.41 0.55 0.72 M
Finland 0.58 0.46 0.65 0.65 0.17
France 0.66 0.46 0.63 0.72 0.34
germany 0.63 0.55 0.61 0.71 0.30
greece 0.68 0.48 0.58 0.75 0.55
hungary 0.71 0.50 0.63 0.79 0.50
Iceland 0.62 0.57 0.61 0.70 0.21
Ireland 0.59 0.57 0.59 0.70 0.32
Israel 0.76 0.56 0.64 0.77 0.39
Italy 0.62 0.47 0.57 0.71 0.40
japan 0.62 0.51 0.61 0.72 0.48
Korea 0.66 0.49 0.61 0.76 0.26
Luxembourg 0.61 0.50 0.64 0.72 0.23
mexico 0.84 0.62 0.54 0.87 0.76
netherlands 0.57 0.46 0.59 0.65 0.11
new Zealand 0.66 0.62 0.58 0.75 0.37
norway 0.61 0.54 0.65 0.69 0.23
Poland 0.73 0.54 0.55 0.78 0.45
Portugal 0.68 0.45 0.63 0.76 0.40
Slovak republic 0.66 0.57 0.65 0.73 M
Slovenia 0.62 0.47 0.67 0.70 M
Spain 0.64 0.48 0.57 0.71 0.35
Sweden 0.63 0.56 0.62 0.73 0.23
Switzerland 0.57 0.49 0.57 0.66 0.16
turkey 0.83 0.70 0.54 0.88 M
united Kingdom 0.62 0.60 0.64 0.72 0.26
united States 0.71 0.65 0.62 0.80 0.49
median 0.65 0.51 0.61 0.72 0.31

16SCALING PROCEDURES AND CONSTRUCT VALIDATION OF CONTEXT QUESTIONNAIRE DATA
290 © OECD 2012 – PISA 2009 TECHNICAL REPORT
table 16.5 Scale reliabilities for home possession indices in partner countries
weaLth hedreS CuLtPoSS homePoS ICtreS
albania 0.76 0.63 0.39 0.83 0.75
argentina 0.78 0.58 0.49 0.83 0.69
azerbaijan 0.81 0.65 0.60 0.85 M
Brazil 0.77 0.57 0.42 0.81 0.65
Bulgaria 0.73 0.62 0.63 0.80 0.59
Colombia 0.79 0.63 0.46 0.85 M
Croatia 0.67 0.50 0.68 0.75 M
dubai (uae) 0.76 0.62 0.55 0.78 M
hong Kong-China 0.66 0.57 0.58 0.77 0.25
Indonesia 0.82 0.56 0.47 0.84 0.69
jordan 0.79 0.71 0.52 0.84 M
Kazakhstan 0.76 0.64 0.51 0.83 M
Kyrgyzstan 0.78 0.60 0.48 0.83 M
Latvia 0.71 0.45 0.59 0.75 0.58
Liechtenstein 0.51 0.53 0.61 0.63 0.09
Lithuania 0.70 0.51 0.64 0.78 M
macao-China 0.68 0.52 0.51 0.74 M
montenegro 0.76 0.57 0.63 0.81 M
Panama 0.87 0.63 0.54 0.88 M
Peru 0.82 0.67 0.42 0.86 0.75
Qatar 0.77 0.65 0.53 0.80 M
romania 0.78 0.60 0.51 0.82 0.60
russian Federation 0.71 0.55 0.53 0.77 0.68
Serbia 0.72 0.56 0.64 0.78 M
Shanghai-China 0.77 0.51 0.55 0.82 M
Singapore 0.62 0.55 0.64 0.73 M
Chinese taipei 0.63 0.58 0.69 0.74 M
thailand 0.82 0.66 0.59 0.85 0.77
trinidad and tobago 0.70 0.66 0.49 0.78 M
tunisia 0.80 0.71 0.53 0.85 M
uruguay 0.76 0.59 0.57 0.82 M
median 0.76 0.59 0.54 0.81 0.66
Enjoyment of reading and frequency of reading Eleven items were used to measure enjoyment of reading in PISA 2009. There are four response categories varying from “strongly disagree”, “disagree”, “agree” to “strongly agree”. All items which are negatively phrased (items a, d, f, h, i) were reverse scored for IRT scaling such that positive WLE scores on this index for PISA 2009 indicate higher levels of enjoyment of reading. Table 16.6 shows the item wording and the international item parameters for this scale. The distribution of item and step difficulties for this scale is reasonable and appropriate.
table 16.6 item parameters for enjoyment of reading (Joyread)
Itemhow much do you agree or disagree with these statements
about reading? delta tau_1 tau_2 tau_3
ST24Q01 I read only if I have to -0.0717 -1.3343 -0.0913 1.4257
ST24Q02 Reading is one of my favourite hobbies 1.0880 -1.5450 0.0170 1.5280
ST24Q03 I like talking about books with other people 1.1800 -1.6360 -0.2850 1.9210
ST24Q04 I find it hard to finish books -0.3073 -1.4187 -0.1557 1.5743
ST24Q05 I feel happy if I receive a book as a present 0.7757 -1.4627 -0.5287 1.9913
ST24Q06 For me, reading is a waste of time -0.6240 -0.8260 -0.5930 1.4190
ST24Q07 I enjoy going to a bookstore or a library 0.7563 -1.4353 -0.3083 1.7437
ST24Q08 I read only to get information that I need 0.1930 -1.7380 -0.0490 1.7870
ST24Q09 I cannot sit still and read for more than a few minutes -0.6363 -0.9887 -0.3687 1.3573
ST24Q10 I like to express my opinions about books I have read 0.3027 -1.4567 -0.4417 1.8983
ST24Q11 I like to exchange books with my friends 1.0583 -1.3383 -0.1973 1.5357

16SCALING PROCEDURES AND CONSTRUCT VALIDATION OF CONTEXT QUESTIONNAIRE DATA
PISA 2009 TECHNICAL REPORT – © OECD 2012 291
Five items measuring the construct of diversity in reading were included in the PISA 2009 main study. There are five response categories varying from “never or almost never”, “a few times a year”, “about once a month”, “several times a month” to “several times a week”. Positive WLE scores on this index for PISA 2009 indicate higher diversity in reading. Similarly, positive item difficulties indicate reading activities that are more difficult to endorse. Table 16.7 shows the item wording and the international item parameters for this scale. The distribution of item and step difficulties for this scale is reasonable and appropriate for most items in this scale.
table 16.7 item parameters for reading diversity (divread)
Itemhow often do you read these materials
because you want to? delta tau_1 tau_2 tau_3 tau_4
ST25Q01 Magazines -0.2193 -0.3218 -0.1458 -0.1858 0.6533
ST25Q02 Comic books 0.5888 0.1203 0.0533 -0.2238 0.0503
ST25Q03 Fiction (novels, narratives, stories) 0.4408 -0.3848 0.0433 -0.0068 0.3483
ST25Q04 Non-fiction books 0.7663 -0.4683 -0.0743 -0.0223 0.5648
ST25Q05 Newspapers -0.1463 0.1723 0.0773 -0.2248 -0.0248
Table 16.8 shows the scale reliabilities for both reading indices in OECD countries and the latent correlations between them. The internal consistency for JOYREAD is very high in all OECD countries and is relatively lower for DIVREAD across all countries. This low reliability for the reading diversity scale may have to do with the lack of availability of the different reading materials listed in this scale.
table 16.8Scale reliabilities for enjoyment of reading and diversity of reading and latent correlations in oecd countries
joyread dIvreadLatent correlations between:
joyread\dIvread
australia 0.93 0.55 0.49
austria 0.91 0.49 0.43
Belgium 0.92 0.57 0.48
Canada 0.93 0.58 0.48
Chile 0.85 0.66 0.44
Czech republic 0.90 0.52 0.40
denmark 0.89 0.62 0.49
estonia 0.90 0.50 0.36
Finland 0.93 0.53 0.49
France 0.91 0.54 0.45
germany 0.92 0.49 0.42
greece 0.87 0.46 0.33
hungary 0.90 0.62 0.39
Iceland 0.91 0.64 0.51
Ireland 0.92 0.49 0.44
Israel 0.89 0.65 0.49
Italy 0.90 0.47 0.42
japan 0.89 0.47 0.42
Korea 0.88 0.61 0.42
Luxembourg 0.90 0.52 0.40
mexico 0.84 0.59 0.29
netherlands 0.91 0.61 0.52
new Zealand 0.92 0.57 0.47
norway 0.91 0.57 0.47
Poland 0.89 0.60 0.35
Portugal 0.90 0.51 0.40
Slovak republic 0.88 0.55 0.40
Slovenia 0.90 0.56 0.43
Spain 0.89 0.49 0.44
Sweden 0.91 0.63 0.49
Switzerland 0.92 0.52 0.46
turkey 0.84 0.58 0.29
united Kingdom 0.92 0.54 0.45
united States 0.92 0.59 0.42
median 0.90 0.56

16SCALING PROCEDURES AND CONSTRUCT VALIDATION OF CONTEXT QUESTIONNAIRE DATA
292 © OECD 2012 – PISA 2009 TECHNICAL REPORT
Table 16.9 shows the scale reliabilities for both indices in partner countries and the latent correlations between them. The internal consistency for JOYREAD is very high in most partner countries and for DIVREAD is relatively lower across all partner countries.
table 16.9Scale reliabilities for enjoyment of reading and diversity of reading and latent correlations in partner countries
joyread dIvreadLatent correlations between:
joyread/dIvread
albania 0.80 0.58 0.23
argentina 0.81 0.59 0.36
azerbaijan 0.72 0.68 0.32
Brazil 0.85 0.60 0.40
Bulgaria 0.86 0.61 0.35
Colombia 0.80 0.64 0.37
Croatia 0.89 0.53 0.38
dubai (uae) 0.87 0.58 0.40
hong Kong-China 0.87 0.57 0.35
Indonesia 0.71 0.69 0.24
jordan 0.77 0.66 0.34
Kazakhstan 0.83 0.66 0.37
Kyrgyzstan 0.73 0.62 0.24
Latvia 0.88 0.54 0.42
Liechtenstein 0.91 0.62 0.50
Lithuania 0.88 0.56 0.38
macao-China 0.86 0.53 0.39
montenegro 0.87 0.50 0.33
Panama 0.78 0.63 0.33
Peru 0.77 0.62 0.31
Qatar 0.81 0.71 0.40
romania 0.84 0.59 0.31
russian Federation 0.86 0.56 0.30
Serbia 0.89 0.50 0.30
Shanghai-China 0.84 0.56 0.30
Singapore 0.90 0.60 0.37
Chinese taipei 0.88 0.66 0.31
thailand 0.79 0.70 0.29
trinidad and tobago 0.86 0.63 0.37
tunisia 0.84 0.55 0.36
uruguay 0.87 0.67 0.43
median 0.85 0.60
Seven items are used to measure online reading activities in PISA 2009. There are five response categories varying from “I don’t know what it is”, “never or almost never”, “several times a month”, “several times a week” to “several times a day”. Positive WLE scores on this index for PISA 2009 indicate higher levels of online reading activities. Similarly, positive item difficulties indicate online reading activities that are more difficult to endorse. Table 16.10 shows the item wording and the international item parameters for this scale. The distribution of item and step difficulties for this scale is reasonable and appropriate.
table 16.10 item parameters for online reading (onlnread)
Item how often are you involved in the following reading activities? delta tau_1 tau_2 tau_3 tau_4
ST26Q01 Reading emails -0.9158 -2.2363 0.1168 0.3098 1.8098
ST26Q02 <Chat online> (e.g. <MSN®>) -1.1345 -1.9265 0.8765 0.0845 0.9655
ST26Q03 Reading online news -0.5045 -2.7615 0.6165 0.6025 1.5425
ST26Q04 Using an online dictionary or encyclopaedia (e.g. <Wikipedia®>) -0.3030 -2.5340 -0.4190 0.8250 2.1280
ST26Q05 Searching online information to learn about a particular topic -0.7835 -2.2605 -0.8445 0.9215 2.1835
ST26Q06 Taking part in online group discussions or forums 0.4290 -2.5640 1.0810 0.5260 0.9570
ST26Q07 Searching for practical information online (e.g. schedules, events, tips, recipes) -0.2310 -2.5590 -0.3810 0.9840 1.9560
Table 16.11 shows the scale reliabilities for this index in both OECD and partner countries. The internal consistency for ONLNREAD is quite high in nearly all OECD and partner countries.

16SCALING PROCEDURES AND CONSTRUCT VALIDATION OF CONTEXT QUESTIONNAIRE DATA
PISA 2009 TECHNICAL REPORT – © OECD 2012 293
table 16.11 Scale reliabilities for online readingonLnread onLnread
OEC
D australia 0.77
Part
ners albania 0.89
austria 0.76 argentina 0.82
Belgium 0.72 azerbaijan 0.92
Canada 0.78 Brazil 0.86
Chile 0.84 Bulgaria 0.87
Czech republic 0.81 Colombia 0.83
denmark 0.75 Croatia 0.85
estonia 0.77 dubai (uae) 0.79
Finland 0.76 hong Kong-China 0.78
France 0.76 Indonesia 0.87
germany 0.76 jordan 0.89
greece 0.84 Kazakhstan 0.93
hungary 0.83 Kyrgyzstan 0.88
Iceland 0.76 Latvia 0.79
Ireland 0.78 Liechtenstein 0.75
Israel 0.78 Lithuania 0.82
Italy 0.83 macao-China 0.75
japan 0.75 montenegro 0.86
Korea 0.69 Panama 0.87
Luxembourg 0.76 Peru 0.85
mexico 0.84 Qatar 0.86
netherlands 0.70 romania 0.88
new Zealand 0.78 russian Federation 0.89
norway 0.74 Serbia 0.88
Poland 0.86 Shanghai-China 0.82
Portugal 0.79 Singapore 0.80
Slovak republic 0.82 Chinese taipei 0.79
Slovenia 0.79 thailand 0.89
Spain 0.76 trinidad and tobago 0.86
Sweden 0.76 tunisia 0.89
Switzerland 0.75 uruguay 0.85
turkey 0.87
united Kingdom 0.76
united States 0.80
median 0.77 median 0.86
The approaches to learning scale consist of three subscales: memorisation, elaboration and control strategies. Positive WLE scores on these indices for PISA 2009 indicate higher importance attached to the given reading strategy. Thirteen items measuring the construct of learning strategies were included in the PISA 2009 main study, four items each for memorisation and elaboration strategies and five items for control strategies. There are four response categories varying from “almost never”, “sometimes”, “often” to “almost always”. Positive WLE scores on a given learning strategy index indicate greater use of that learning strategy.
table 16.12 item parameters for memorisation strategies (MeMor)Item when you are studying, how often do you do the following? delta tau_1 tau_2 tau_3
ST27Q01 When I study, I try to memorize everything that is covered in the text -0.4073 -1.8207 0.3373 1.4833
ST27Q03 When I study, I try to memorize as many details as possible -0.7453 -1.4217 0.0173 1.4043
ST27Q05 When I study, I read the text so many times that I can recite it 0.4703 -1.0203 0.3017 0.7187
ST27Q07 When I study, I read the text over and over again -0.4580 -1.4130 0.2040 1.2090
table 16.13 item parameters for elaboration strategies (elab)Item when you are studying, how often do you do the following? delta tau_1 tau_2 tau_3
ST27Q04 When I study, I try to relate new information to prior knowledge acquired in other subjects -0.3577 -1.7963 0.1797 1.6167
ST27Q08 When I study, I figure out how the information might be useful outside school 0.5393 -1.5353 0.2127 1.3227
ST27Q10 When I study, I try to understand the material better by relating it to my own experiences 0.0690 -1.7290 0.1510 1.5780
ST27Q12 When I study, I figure out how the text information fits in with what happens in real life 0.2383 -1.8163 0.2007 1.6157
table 16.14 item parameters for control strategies (cStrat)Item when you are studying, how often do you do the following? delta tau_1 tau_2 tau_3
ST27Q02 When I study, I start by figuring out what exactly I need to learn -1.2090 -1.6050 -0.0070 1.6120
ST27Q06 When I study, I check if I understand what I have read -1.1813 -1.6817 0.1333 1.5483
ST27Q09 When I study, I try to figure out which concepts I still haven’t really understood -0.7520 -1.9190 0.0630 1.8560
ST27Q11 When I study, I make sure that I remember the most important points in the text -1.5233 -1.6357 -0.0327 1.6683
ST27Q13 When I study and I don’t understand something, I look for additional information to clarify this -0.4603 -1.5477 0.2123 1.3353
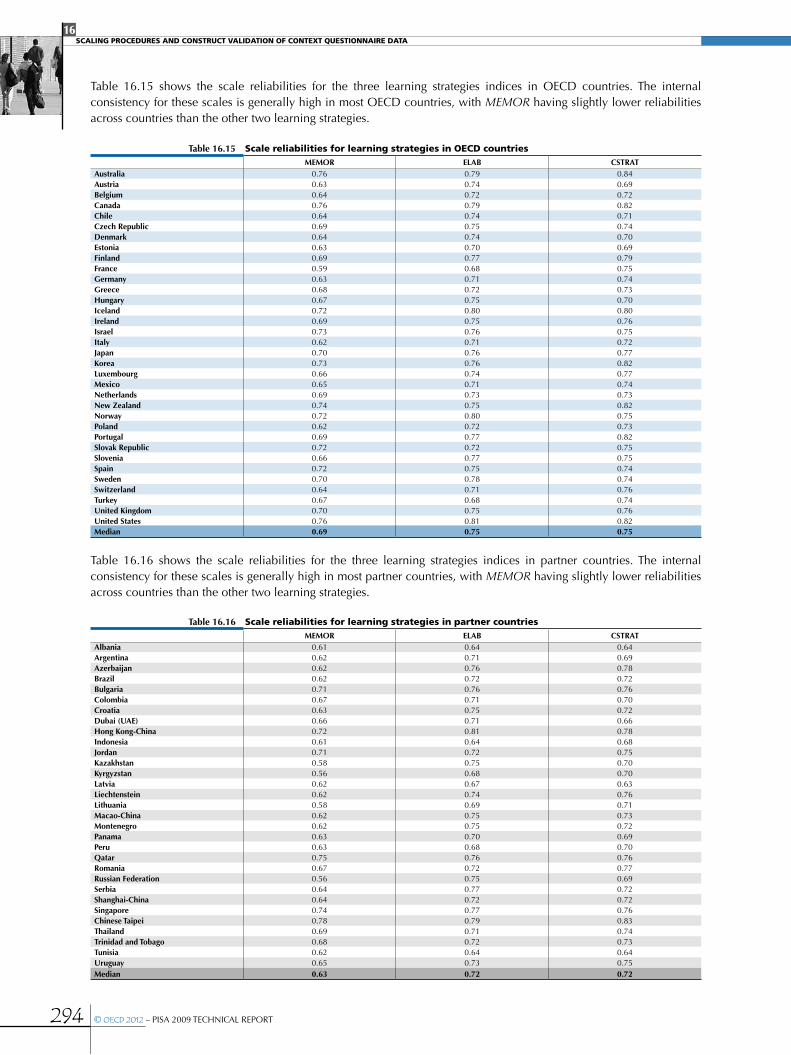
16SCALING PROCEDURES AND CONSTRUCT VALIDATION OF CONTEXT QUESTIONNAIRE DATA
294 © OECD 2012 – PISA 2009 TECHNICAL REPORT
Table 16.15 shows the scale reliabilities for the three learning strategies indices in OECD countries. The internal consistency for these scales is generally high in most OECD countries, with MEMOR having slightly lower reliabilities across countries than the other two learning strategies.
table 16.15 Scale reliabilities for learning strategies in oecd countriesmemor eLaB CStrat
australia 0.76 0.79 0.84austria 0.63 0.74 0.69Belgium 0.64 0.72 0.72Canada 0.76 0.79 0.82Chile 0.64 0.74 0.71Czech republic 0.69 0.75 0.74denmark 0.64 0.74 0.70estonia 0.63 0.70 0.69Finland 0.69 0.77 0.79France 0.59 0.68 0.75germany 0.63 0.71 0.74greece 0.68 0.72 0.73hungary 0.67 0.75 0.70Iceland 0.72 0.80 0.80Ireland 0.69 0.75 0.76Israel 0.73 0.76 0.75Italy 0.62 0.71 0.72japan 0.70 0.76 0.77Korea 0.73 0.76 0.82Luxembourg 0.66 0.74 0.77mexico 0.65 0.71 0.74netherlands 0.69 0.73 0.73new Zealand 0.74 0.75 0.82norway 0.72 0.80 0.75Poland 0.62 0.72 0.73Portugal 0.69 0.77 0.82Slovak republic 0.72 0.72 0.75Slovenia 0.66 0.77 0.75Spain 0.72 0.75 0.74Sweden 0.70 0.78 0.74Switzerland 0.64 0.71 0.76turkey 0.67 0.68 0.74united Kingdom 0.70 0.75 0.76united States 0.76 0.81 0.82median 0.69 0.75 0.75
Table 16.16 shows the scale reliabilities for the three learning strategies indices in partner countries. The internal consistency for these scales is generally high in most partner countries, with MEMOR having slightly lower reliabilities across countries than the other two learning strategies.
table 16.16 Scale reliabilities for learning strategies in partner countriesmemor eLaB CStrat
albania 0.61 0.64 0.64argentina 0.62 0.71 0.69azerbaijan 0.62 0.76 0.78Brazil 0.62 0.72 0.72Bulgaria 0.71 0.76 0.76Colombia 0.67 0.71 0.70Croatia 0.63 0.75 0.72dubai (uae) 0.66 0.71 0.66hong Kong-China 0.72 0.81 0.78Indonesia 0.61 0.64 0.68jordan 0.71 0.72 0.75Kazakhstan 0.58 0.75 0.70Kyrgyzstan 0.56 0.68 0.70Latvia 0.62 0.67 0.63Liechtenstein 0.62 0.74 0.76Lithuania 0.58 0.69 0.71macao-China 0.62 0.75 0.73montenegro 0.62 0.75 0.72Panama 0.63 0.70 0.69Peru 0.63 0.68 0.70Qatar 0.75 0.76 0.76romania 0.67 0.72 0.77russian Federation 0.56 0.75 0.69Serbia 0.64 0.77 0.72Shanghai-China 0.64 0.72 0.72Singapore 0.74 0.77 0.76Chinese taipei 0.78 0.79 0.83thailand 0.69 0.71 0.74trinidad and tobago 0.68 0.72 0.73tunisia 0.62 0.64 0.64uruguay 0.65 0.73 0.75median 0.63 0.72 0.72
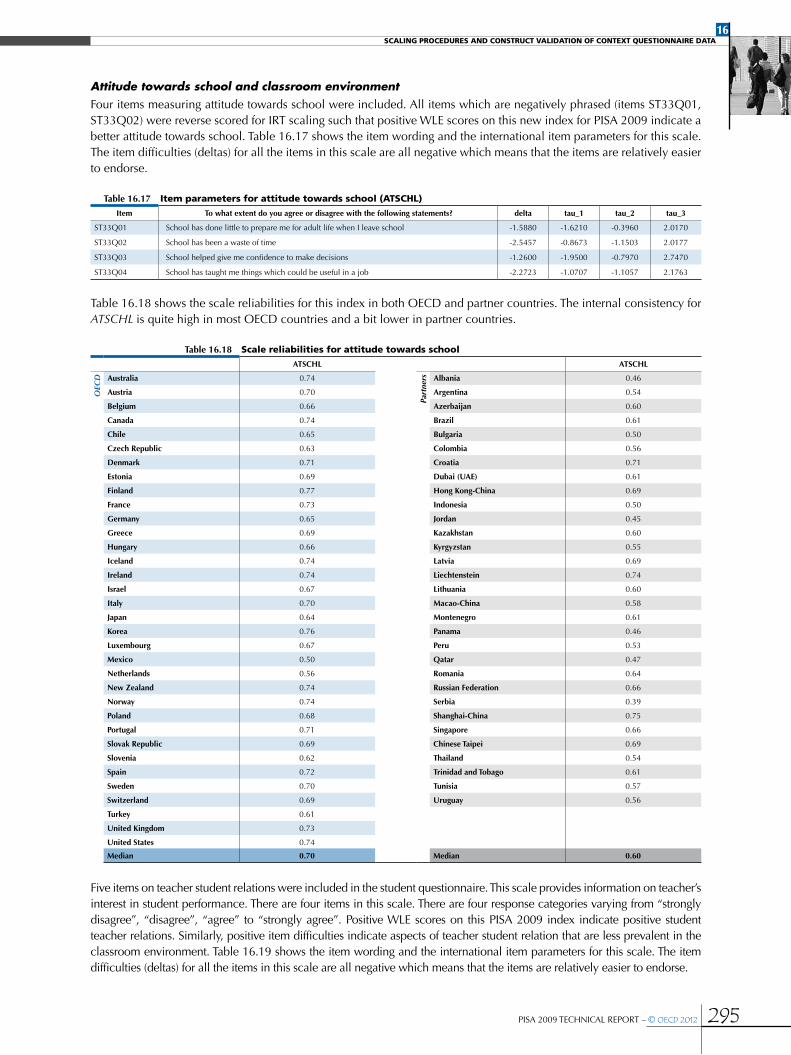
16SCALING PROCEDURES AND CONSTRUCT VALIDATION OF CONTEXT QUESTIONNAIRE DATA
PISA 2009 TECHNICAL REPORT – © OECD 2012 295
Attitude towards school and classroom environmentFour items measuring attitude towards school were included. All items which are negatively phrased (items ST33Q01, ST33Q02) were reverse scored for IRT scaling such that positive WLE scores on this new index for PISA 2009 indicate a better attitude towards school. Table 16.17 shows the item wording and the international item parameters for this scale. The item difficulties (deltas) for all the items in this scale are all negative which means that the items are relatively easier to endorse.
table 16.17 item parameters for attitude towards school (atSchl)
Item to what extent do you agree or disagree with the following statements? delta tau_1 tau_2 tau_3
ST33Q01 School has done little to prepare me for adult life when I leave school -1.5880 -1.6210 -0.3960 2.0170
ST33Q02 School has been a waste of time -2.5457 -0.8673 -1.1503 2.0177
ST33Q03 School helped give me confidence to make decisions -1.2600 -1.9500 -0.7970 2.7470
ST33Q04 School has taught me things which could be useful in a job -2.2723 -1.0707 -1.1057 2.1763
Table 16.18 shows the scale reliabilities for this index in both OECD and partner countries. The internal consistency for ATSCHL is quite high in most OECD countries and a bit lower in partner countries.
table 16.18 Scale reliabilities for attitude towards school
atSChL atSChL
OEC
D australia 0.74
Part
ners albania 0.46
austria 0.70 argentina 0.54
Belgium 0.66 azerbaijan 0.60
Canada 0.74 Brazil 0.61
Chile 0.65 Bulgaria 0.50
Czech republic 0.63 Colombia 0.56
denmark 0.71 Croatia 0.71
estonia 0.69 dubai (uae) 0.61
Finland 0.77 hong Kong-China 0.69
France 0.73 Indonesia 0.50
germany 0.65 jordan 0.45
greece 0.69 Kazakhstan 0.60
hungary 0.66 Kyrgyzstan 0.55
Iceland 0.74 Latvia 0.69
Ireland 0.74 Liechtenstein 0.74
Israel 0.67 Lithuania 0.60
Italy 0.70 macao-China 0.58
japan 0.64 montenegro 0.61
Korea 0.76 Panama 0.46
Luxembourg 0.67 Peru 0.53
mexico 0.50 Qatar 0.47
netherlands 0.56 romania 0.64
new Zealand 0.74 russian Federation 0.66
norway 0.74 Serbia 0.39
Poland 0.68 Shanghai-China 0.75
Portugal 0.71 Singapore 0.66
Slovak republic 0.69 Chinese taipei 0.69
Slovenia 0.62 thailand 0.54
Spain 0.72 trinidad and tobago 0.61
Sweden 0.70 tunisia 0.57
Switzerland 0.69 uruguay 0.56
turkey 0.61
united Kingdom 0.73
united States 0.74
median 0.70 median 0.60
Five items on teacher student relations were included in the student questionnaire. This scale provides information on teacher’s interest in student performance. There are four items in this scale. There are four response categories varying from “strongly disagree”, “disagree”, “agree” to “strongly agree”. Positive WLE scores on this PISA 2009 index indicate positive student teacher relations. Similarly, positive item difficulties indicate aspects of teacher student relation that are less prevalent in the classroom environment. Table 16.19 shows the item wording and the international item parameters for this scale. The item difficulties (deltas) for all the items in this scale are all negative which means that the items are relatively easier to endorse.

16SCALING PROCEDURES AND CONSTRUCT VALIDATION OF CONTEXT QUESTIONNAIRE DATA
296 © OECD 2012 – PISA 2009 TECHNICAL REPORT
table 16.19 item parameters for teacher student relations (Studrel)
Itemhow much do you disagree or agree with each of the following statements
about teachers at your school? delta tau_1 tau_2 tau_3
ST34Q01 I get along well with most of my teachers -2.1940 -2.3140 -0.7980 3.1120
ST34Q02 Most of my teachers are interested in my well-being -1.7457 -2.6323 -0.6603 3.2927
ST34Q03 Most of my teachers really listen to what I have to say -1.7100 -2.6870 -0.6340 3.3210
ST34Q04 If I need extra help, I will receive it from my teachers -2.1990 -2.3250 -0.9100 3.2350
ST34Q05 Most of my teachers treat me fairly -2.1270 -2.1380 -1.0280 3.1660
This scale provides information on disciplinary climate in the classroom. There are five items in this scale. There are four response categories varying from “strongly disagree”, “disagree”, “agree” to “strongly agree”. The items in this scale were reverse coded (i.e. higher WLE’s on this scale indicate a better disciplinary climate and lower WLE’s a poorer disciplinary climate). Similarly, positive item difficulties indicate aspects of disciplinary climate that are less likely to be found in the classroom environment. Table 16.20 shows the item wording and the international item parameters for this scale. The item difficulties (deltas) for all the items in this scale are all negative which means that the items are relatively easier to endorse.
table 16.20 item parameters for disciplinary climate (diScliMa)Item how often do these things happen in your <test language lessons>? delta tau_1 tau_2 tau_3
ST36Q01 Students don’t listen to what the teacher says -1.9113 -2.7887 -0.5737 3.3623
ST36Q02 There is noise and disorder -1.8010 -2.6180 -0.3230 2.9410
ST36Q03 The teacher has to wait a long time for students to <quiet down> -2.0953 -2.3997 -0.3987 2.7983
ST36Q04 Students cannot work well -2.3637 -3.0073 -0.1563 3.1637
ST36Q05 Students don’t start working for a long time after the lesson begins -2.1123 -2.5987 -0.1797 2.7783
Table 16.21 shows the scale reliabilities for the indices STUDREL and DISCLIMA in OECD countries and the latent correlations between them. The internal consistency for both indices is very high in all OECD countries. The latent correlations between the indices are low across OECD countries.
table 16.21Scale reliabilities for disciplinary climate and teacher student relations and latent correlations in oecd countries
StudreL dISCLImaLatent correlations between:
StudreL\dISCLIma
australia 0.88 0.90 0.24
austria 0.83 0.89 0.21
Belgium 0.81 0.87 0.19
Canada 0.86 0.87 0.18
Chile 0.80 0.85 0.16
Czech republic 0.83 0.89 0.21
denmark 0.86 0.84 0.21
estonia 0.80 0.89 0.14
Finland 0.83 0.89 0.19
France 0.81 0.87 0.17
germany 0.82 0.86 0.21
greece 0.79 0.76 0.16
hungary 0.79 0.88 0.25
Iceland 0.89 0.88 0.21
Ireland 0.85 0.90 0.22
Israel 0.85 0.88 0.24
Italy 0.83 0.86 0.21
japan 0.83 0.84 0.19
Korea 0.79 0.84 0.15
Luxembourg 0.85 0.89 0.19
mexico 0.78 0.78 0.13
netherlands 0.76 0.85 0.22
new Zealand 0.85 0.89 0.22
norway 0.86 0.88 0.24
Poland 0.81 0.88 0.20
Portugal 0.83 0.88 0.17
Slovak republic 0.81 0.86 0.20
Slovenia 0.79 0.91 0.14
Spain 0.84 0.88 0.16
Sweden 0.86 0.86 0.19
Switzerland 0.85 0.86 0.25
turkey 0.86 0.84 0.15
united Kingdom 0.85 0.90 0.22
united States 0.87 0.88 0.21median 0.83 0.88

16SCALING PROCEDURES AND CONSTRUCT VALIDATION OF CONTEXT QUESTIONNAIRE DATA
PISA 2009 TECHNICAL REPORT – © OECD 2012 297
Table 16.22 shows the scale reliabilities for the indices STUDREL and DISCLIMA in partner countries and the latent correlations between them. The internal consistency for both indices is very high across partner countries. The latent correlations between the indices are low across partner countries.
table 16.22Scale reliabilities for disciplinary climate and teacher student relations and latent correlations in partner countries
StudreL dISCLImaLatent correlations between
StudreL/dISCLIma
albania 0.73 0.78 0.17
argentina 0.80 0.84 0.14
azerbaijan 0.83 0.83 0.16
Brazil 0.79 0.78 0.09
Bulgaria 0.82 0.85 0.07
Colombia 0.79 0.74 0.09
Croatia 0.83 0.88 0.17
dubai (uae) 0.81 0.85 0.21
hong Kong-China 0.85 0.88 0.16
Indonesia 0.64 0.76 0.08
jordan 0.81 0.81 0.19
Kazakhstan 0.80 0.81 0.22
Kyrgyzstan 0.74 0.77 0.05
Latvia 0.79 0.85 0.17
Liechtenstein 0.88 0.84 0.33
Lithuania 0.80 0.87 0.14
macao-China 0.82 0.81 0.17
montenegro 0.84 0.83 0.17
Panama 0.80 0.76 0.05
Peru 0.79 0.74 0.11
Qatar 0.85 0.85 0.12
romania 0.78 0.81 0.14
russian Federation 0.79 0.88 0.19
Serbia 0.83 0.85 0.13
Shanghai-China 0.86 0.85 0.26
Singapore 0.84 0.87 0.14
Chinese taipei 0.84 0.87 0.17
thailand 0.78 0.79 0.16
trinidad and tobago 0.81 0.85 0.16
tunisia 0.71 0.74 0.13
uruguay 0.77 0.86 0.10
median 0.80 0.84
Teachers’ stimulation of reading and teaching strategiesThe scale on teachers’ stimulation of reading and teaching strategies is new to PISA 2009 and provides information on how teachers stimulate students reading engagement and reading skills. There are seven items in this scale. There are four response categories varying from “never or hardly ever”, “in some lessons”, “in most lessons” to “in all lessons”. Higher WLEs indicate higher teacher stimulation or reading engagement. Similarly, positive item difficulties indicate aspects of teacher stimulation that are less common in the classroom environment. Table 16.23 shows the item wording and the international item parameters for this scale. The distribution of item and step difficulties for this scale is reasonable and appropriate.
table 16.23 item parameters for teachers’ stimulation of reading engagement (StiMread)Item In your <test language lessons>, how often does the following occur? delta tau_1 tau_2 tau_3
ST37Q01 The teacher asks students to explain the meaning of a text -0.4040 -2.3850 0.1590 2.2260
ST37Q02 the teacher asks questions that challenge students to get a better understanding of a text -0.5650 -2.0960 -0.0370 2.1330
ST37Q03 The teacher gives students enough time to think about their answers -0.6090 -1.8210 -0.0630 1.8840
ST37Q04 The teacher recommends a book or author to read 0.2943 -1.5683 0.1767 1.3917
ST37Q05 The teacher encourages students to express their opinion about a text -0.4357 -1.7473 0.0217 1.7257
ST37Q06 The teacher helps students relate the stories they read to their lives 0.4817 -1.4837 0.0353 1.4483
ST37Q07 The teacher shows students how the information in texts builds on what they already know 0.0287 -1.9137 0.1473 1.7663
The question on teachers’ use of structuring and scaffolding strategies is new to PISA 2009 and provides information on how teachers use of structuring and scaffolding strategies in test language lessons. There are nine items in this scale. There are four response categories varying from “never or hardly ever”, “in some lessons”, “in most lessons” to “in all lessons”. Higher WLEs indicate greater use of structuring strategies. Table 16.24 shows the item wording and the international item parameters for this scale. The item difficulties (deltas) for all the items in this scale are all negative which means that the items are relatively easier to endorse.

16SCALING PROCEDURES AND CONSTRUCT VALIDATION OF CONTEXT QUESTIONNAIRE DATA
298 © OECD 2012 – PISA 2009 TECHNICAL REPORT
table 16.24 item parameters for teachers’ use of structuring and scaffolding strategies (StrStrat)Item In your <test language lessons>, how often does the following occur? delta tau_1 tau_2 tau_3
ST38Q01 The teacher explains beforehand what is expected of the students -0.4880 -1.7010 0.1700 1.5310
ST38Q02 The teacher checks that students are concentrating while working on the <reading assignment> -0.8210 -1.7380 -0.0860 1.8240
ST38Q03 The teacher discusses students' work, after they have finished the <reading assignment> -0.6650 -1.5640 -0.0890 1.6530
ST38Q04 The teacher tells students in advance how their work is going to be judged -0.8107 -1.4803 -0.0003 1.4807
ST38Q05 The teacher asks whether every student has understood how to complete the <reading assignment> -1.0253 -1.3247 0.0393 1.2853
ST38Q06 The teacher marks students' work -1.1623 -1.6357 0.2763 1.3593
ST38Q07 The teacher gives students the chance to ask questions about the <reading assignment> -1.3427 -1.5863 0.1077 1.4787
ST38Q08 The teacher poses questions that motivate students to participate actively -0.7127 -1.6133 -0.0073 1.6207
ST38Q09 The teacher tells students how well they did on the <reading assignment> immediately after -0.1257 -1.4713 0.1007 1.3707
Table 16.25 shows the scale reliabilities for STIMREAD and STRSTRAT in OECD countries and the latent correlations between them. The internal consistency for both indices is very high in all OECD countries. The latent correlations between them are moderate.
table 16.25Scale reliabilities for teachers’ stimulation of reading and teaching strategies and latent correlations in oecd countries
StImread StrStratLatent correlations between:
StImread\StrStrat
australia 0.84 0.87 0.64
austria 0.78 0.80 0.57
Belgium 0.75 0.80 0.55
Canada 0.83 0.86 0.61
Chile 0.81 0.84 0.64
Czech republic 0.78 0.80 0.58
denmark 0.81 0.78 0.55
estonia 0.78 0.80 0.60
Finland 0.76 0.82 0.55
France 0.72 0.77 0.56
germany 0.76 0.78 0.60
greece 0.76 0.79 0.60
hungary 0.79 0.79 0.60
Iceland 0.84 0.89 0.57
Ireland 0.80 0.84 0.65
Israel 0.84 0.84 0.63
Italy 0.74 0.77 0.61
japan 0.81 0.81 0.58
Korea 0.83 0.83 0.61
Luxembourg 0.78 0.83 0.60
mexico 0.81 0.85 0.62
netherlands 0.76 0.82 0.55
new Zealand 0.84 0.87 0.66
norway 0.81 0.82 0.60
Poland 0.83 0.85 0.64
Portugal 0.80 0.84 0.62
Slovak republic 0.81 0.82 0.60
Slovenia 0.82 0.84 0.60
Spain 0.79 0.82 0.60
Sweden 0.82 0.86 0.59
Switzerland 0.74 0.77 0.54
turkey 0.84 0.87 0.70
united Kingdom 0.81 0.87 0.61
united States 0.87 0.89 0.65
median 0.81 0.83
Table 16.26 shows the scale reliabilities for STIMREAD and STRSTRAT in partner countries and the latent correlations between them. The internal consistency for both indices is very high across the partner countries. The latent correlations between them are moderate.

16SCALING PROCEDURES AND CONSTRUCT VALIDATION OF CONTEXT QUESTIONNAIRE DATA
PISA 2009 TECHNICAL REPORT – © OECD 2012 299
table 16.26Scale reliabilities for teachers’ stimulation of reading and teaching strategies and latent correlations in partner countries
StImread StrStratLatent correlations between
StImread/StrStrat
albania 0.74 0.80 0.55
argentina 0.78 0.84 0.62
azerbaijan 0.82 0.89 0.64
Brazil 0.78 0.85 0.59
Bulgaria 0.83 0.86 0.62
Colombia 0.81 0.84 0.60
Croatia 0.82 0.82 0.61
dubai (uae) 0.81 0.86 0.67
hong Kong-China 0.83 0.85 0.66
Indonesia 0.80 0.83 0.59
jordan 0.83 0.87 0.64
Kazakhstan 0.84 0.85 0.68
Kyrgyzstan 0.80 0.82 0.65
Latvia 0.79 0.80 0.60
Liechtenstein 0.78 0.81 0.58
Lithuania 0.81 0.82 0.61
macao-China 0.80 0.80 0.60
montenegro 0.85 0.85 0.60
Panama 0.80 0.87 0.58
Peru 0.79 0.84 0.65
Qatar 0.85 0.89 0.73
romania 0.79 0.84 0.59
russian Federation 0.88 0.89 0.68
Serbia 0.84 0.82 0.57
Shanghai-China 0.78 0.79 0.54
Singapore 0.82 0.85 0.62
Chinese taipei 0.86 0.85 0.60
thailand 0.85 0.89 0.61
trinidad and tobago 0.82 0.87 0.68
tunisia 0.75 0.82 0.68
uruguay 0.79 0.83 0.62
median 0.81 0.84
LibrariesSeven items provide information on how students make use of a library. There were five response categories varying from “never”, “a few times a year”, “about once a month”, “several times a month” to “several times a week”. Higher WLEs indicate a greater use of libraries. Similarly, positive item difficulties indicate aspects of library usage that are less frequent. The item difficulties for all the items in this scale are all positive which means that the items are relatively harder to endorse. Further more, many of the step difficulties (taus) are out of order (not monotonically increasing) which can mean that the response categories are not well differentiated. Table 16.27 shows the item wording and the international IRT parameters used for scaling.
table 16.27 item parameters for library use (libuSe)
Item how often do you visit a <library> for the following activities? delta tau_1 tau_2 tau_3 tau_4
ST39Q01 Borrow books to read for pleasure 1.3003 -0.9403 -0.1123 -0.0903 1.1428
ST39Q02 Borrow books for school work 1.2683 -1.4983 -0.1233 0.2208 1.4008
ST39Q03 Work on homework, course assignments or research papers 0.9480 -0.4300 0.0230 -0.1870 0.5940
ST39Q04 Read magazines or newspapers 0.9973 0.2768 -0.1323 -0.3293 0.1848
ST39Q05 Read books for fun 1.1198 -0.1808 -0.1588 -0.1678 0.5073
ST39Q06 Learn about things that are not course-related, such as sports, hobbies, people or music 0.8938 -0.1348 0.0472 -0.2078 0.2953
ST39Q07 Use the Internet 0.4950 0.5200 0.2450 -0.3080 -0.4570
Table 16.28 shows the scale reliabilities for LIBUSE in OECD and partner countries and the latent correlations between them. The internal consistency for this index is very high across both OECD and partner countries.

16SCALING PROCEDURES AND CONSTRUCT VALIDATION OF CONTEXT QUESTIONNAIRE DATA
300 © OECD 2012 – PISA 2009 TECHNICAL REPORT
table 16.28 Scale reliabilities for libuSeLIBuSe LIBuSe
OEC
D australia 0.85
Part
ners albania 0.81
austria 0.81 argentina 0.82
Belgium 0.80 azerbaijan 0.82
Canada 0.85 Brazil 0.85
Chile 0.83 Bulgaria 0.88
Czech republic 0.81 Colombia 0.84
denmark 0.82 Croatia 0.80
estonia 0.79 dubai (uae) 0.83
Finland 0.82 hong Kong-China 0.87
France 0.84 Indonesia 0.78
germany 0.81 jordan 0.80
greece 0.87 Kazakhstan 0.85
hungary 0.84 Kyrgyzstan 0.82
Iceland 0.85 Latvia 0.83
Ireland 0.83 Liechtenstein 0.86
Israel 0.86 Lithuania 0.81
Italy 0.85 macao-China 0.83
japan 0.82 montenegro 0.87
Korea 0.81 Panama 0.77
Luxembourg 0.85 Peru 0.80
mexico 0.80 Qatar 0.86
netherlands 0.79 romania 0.83
new Zealand 0.86 russian Federation 0.84
norway 0.84 Serbia 0.82
Poland 0.81 Shanghai-China 0.82
Portugal 0.87 Singapore 0.82
Slovak republic 0.81 Chinese taipei 0.86
Slovenia 0.81 thailand 0.84
Spain 0.85 trinidad and tobago 0.84
Sweden 0.83 tunisia 0.75
Switzerland 0.81 uruguay 0.81
turkey 0.84
united Kingdom 0.86
united States 0.86
median 0.83 median 0.83
ICT availabilityThe ICT familiarity questionnaire was an optional instrument administered which was administered in 45 of the participating countries in PISA 2009, for which 7 scaled indices were computed.
Eight items provide information on ICT availability at home. Items are reverse coded for IRT scaling and positive WLE scores on this index indicate higher availability. Table 16.29 shows the item wording and international IRT parameters for this scale. The distribution of item and step difficulties for this scale is reasonable and appropriate.
table 16.29 item parameters for ict availability at home (icthoMe)
Item Is any of these devices available for you to use at home? delta tau_1 tau_2
IC01Q01 Desktop computer -0.4910 1.0610 -1.0610
IC01Q02 Portable laptop or notebook 0.4600 1.2330 -1.2330
IC01Q03 Internet connection -0.7845 2.6465 -2.6465
IC01Q04 <Video games console>, e.g. <Sony Play StationTM> 0.3450 0.6100 -0.6100
IC01Q05 Cell phone -1.8040 1.0220 -1.0220
IC01Q06 Mp3/Mp4 player, iPod or similar -0.7030 1.1530 -1.1530
IC01Q07 Printer -0.4170 0.9400 -0.9400
IC01Q08 USB (memory) stick -0.5535 0.6315 -0.6315
Five items provide information on ICT availability at school. Positive WLE scores on this index indicate higher availability. Table 16.30 shows the item wording and international IRT parameters for this scale. The distribution of item and step difficulties for this scale is reasonable and appropriate.

16SCALING PROCEDURES AND CONSTRUCT VALIDATION OF CONTEXT QUESTIONNAIRE DATA
PISA 2009 TECHNICAL REPORT – © OECD 2012 301
table 16.30 item parameters for ict availability at school (ictSch)Item Is any of these devices available for you to use at school? delta tau_1 tau_2
IC02Q01 Desktop computer -1.1110 -0.4470 0.4470
IC02Q02 Portable laptop or notebook 1.5720 0.3850 -0.3850
IC02Q03 Internet connection -1.2005 -0.3905 0.3905
IC02Q04 Printer -0.4880 -0.5020 0.5020
IC02Q05 USB (memory) stick 1.3315 0.0495 -0.0495
Table 16.31 shows the scale reliabilities for ICTHOME and ICTSCH in OECD countries. The internal consistency for ICTHOME varies across OECD countries. The internal consistency for ICTSCH varies less across OECD countries.
table 16.31 Scale reliabilities for ict availability at home and ict availability at school in oecd countriesICthome ICtSCh
australia 0.50 0.44
austria 0.46 0.60
Belgium 0.49 0.72
Canada 0.57 0.57
Chile 0.75 0.68
Czech republic 0.54 0.56
denmark 0.36 0.38
estonia 0.49 0.67
Finland 0.34 0.61
germany 0.49 0.70
greece 0.68 0.64
hungary 0.67 0.62
Iceland 0.38 0.59
Ireland 0.59 0.74
Israel 0.70 0.73
Italy 0.56 0.70
japan 0.70 0.71
Korea 0.52 0.74
netherlands 0.40 0.35
new Zealand 0.61 0.57
norway 0.49 0.48
Poland 0.66 0.68
Portugal 0.56 0.64
Slovak republic 0.60 0.61
Slovenia 0.49 0.63
Spain 0.61 0.63
Sweden 0.52 0.44
Switzerland 0.49 0.68
turkey 0.81 0.74
median 0.54 0.63
Table 16.32 shows the scale reliabilities for ICTHOME and ICTSCH in partner countries. The internal consistency for ICTHOME varies across OECD countries. It is quite high in some countries and lower in others. The internal consistency for ICTSCH varies less across partner countries.
table 16.32 Scale reliabilities for ict availability at home and ict availability at school in partner countriesICthome ICtSCh
Bulgaria 0.72 0.66
Croatia 0.62 0.67
hong Kong-China 0.56 0.54
jordan 0.82 0.68
Latvia 0.64 0.67
Liechtenstein 0.41 0.63
Lithuania 0.64 0.60
macao-China 0.55 0.55
Panama 0.87 0.79
Qatar 0.74 0.73
russian Federation 0.69 0.72
Serbia 0.71 0.64
Singapore 0.56 0.67
thailand 0.81 0.69
trinidad and tobago 0.80 0.69
uruguay 0.78 0.73
median 0.70 0.67

16SCALING PROCEDURES AND CONSTRUCT VALIDATION OF CONTEXT QUESTIONNAIRE DATA
302 © OECD 2012 – PISA 2009 TECHNICAL REPORT
ICT useEight items provide information on use of ICT and Internet for entertainment. Positive WLE scores on this index indicate greater use of ICT for entertainment. Similarly, positive item difficulties indicate aspects of ICT usage that are less common. Table 16.33 shows the item wording and international IRT parameters for this scale. The distribution of item and step difficulties for this scale is reasonable and appropriate.
table 16.33 item parameters for ict entertainment use (entuSe)Item how often do you use a computer for following activities at home? delta tau_1 tau_2 tau_3
IC04Q01 Play one-player games 0.7033 -0.4733 -0.2133 0.6867
IC04Q02 Play collaborative online games 1.6000 -0.5300 -0.0300 0.5600
IC04Q04 Use e-mail -0.5367 0.2567 -0.2233 -0.0333
IC04Q05 <Chat on line> (e.g. <MSN®>) -0.4733 0.8233 -0.0167 -0.8067
IC04Q06 Browse the Internet for fun (such as watching videos, e.g. <YouTube™>) -1.7267 0.8667 -0.2033 -0.6633
IC04Q07 Download music, films, games or software from the Internet -0.3333 0.1933 -0.1667 -0.0267
IC04Q08 Publish and maintain a personal website or blog 2.0533 -0.5533 -0.0333 0.5867
IC04Q09 Participate in online forums, virtual communities or spaces (e.g. <Second Life® or MySpace™>) 1.3067 -0.0967 0.0033 0.0933
Table 16.34 shows the scale reliabilities for ENTUSE in OECD and partner countries. The internal consistency for this index is high across OECD countries and even higher across partner countries.
table 16.34 Scale reliabilities for ict entertainment useentuSe entuSe
OEC
D australia 0.77
Part
ners Bulgaria 0.84
austria 0.75 Croatia 0.83
Belgium 0.73 hong Kong-China 0.69
Canada 0.74 jordan 0.89
Chile 0.86 Latvia 0.78
Czech republic 0.76 Liechtenstein 0.78
denmark 0.66 Lithuania 0.81
estonia 0.65 macao-China 0.70
Finland 0.67 Panama 0.91
germany 0.74 Qatar 0.84
greece 0.87 russian Federation 0.89
hungary 0.81 Serbia 0.88
Iceland 0.62 Singapore 0.77
Ireland 0.79 thailand 0.95
Israel 0.77 trinidad and tobago 0.89
Italy 0.83 uruguay 0.88
japan 0.81
Korea 0.73
new Zealand 0.79
norway 0.67
Poland 0.80
Portugal 0.80
Slovak republic 0.82
Slovenia 0.76
Spain 0.78
Sweden 0.68
Switzerland 0.74
turkey 0.91
median 0.77 median 0.84
Eight items provide information on use of ICT for school related tasks. Positive WLE scores on this index indicate greater use of ICT at home for doing school related tasks. Similarly, positive item difficulties indicate aspects of teacher student relation that are less prevalent in the classroom environment. Table 16.35 shows the item wording and international IRT parameters for this scale. The item difficulties for all the items in this scale are all positive which means that the items are relatively harder to endorse.
table 16.35 item parameters for ict use at home for school related tasks (hoMSch)Item how often do you do the following at home? delta tau_1 tau_2 tau_3
IC05Q01 Browse the Internet for schoolwork (e.g. preparing an essay or presentation) 0.3617 -1.5967 -0.0047 1.6013
IC05Q02 Use e-mail for communication with other students about schoolwork 0.9047 -0.4507 -0.2317 0.6823
IC05Q03 Use e-mail for communication with teachers and submission of homework or other schoolwork 1.9180 -0.5680 -0.0980 0.6660
IC05Q04 Download, upload or browse material from your school's website (e.g. time table or course materials) 1.4570 -0.5340 -0.1170 0.6510
IC05Q05 Check the school's website for announcements, e.g. absence of teachers 1.5320 -0.1870 -0.1790 0.3660

16SCALING PROCEDURES AND CONSTRUCT VALIDATION OF CONTEXT QUESTIONNAIRE DATA
PISA 2009 TECHNICAL REPORT – © OECD 2012 303
Nine items provide information on student involvement in ICT related tasks at school. Positive WLE scores on this index indicate greater involvement in ICT related tasks at school. Similarly, positive item difficulties indicate aspects of involvement in ICT related tasks at school that are less common. Table 16.36 shows the item wording and international IRT parameters for this scale. The item difficulties for all the items in this scale are all positive which means that the items are relatively harder to endorse.
table 16.36 item parameters for use of ict at school (uSeSch)
Item how often do you use a computer for following activities at school? delta tau_1 tau_2 tau_3
IC06Q01 <Chat on line> at school 1.6867 0.0923 -0.8017 0.7093
IC06Q02 Use e-mail at school 1.4447 -0.4647 -0.5197 0.9843
IC06Q03 Browse the Internet for schoolwork 0.4963 -1.2673 -0.3063 1.5737
IC06Q04 Download, upload or browse material from the school's website (e.g. <intranet>) 1.6397 -0.2737 -0.5527 0.8263
IC06Q05 Post your work on the school's website 2.0830 0.1640 -0.7360 0.5720
IC06Q06 Play simulations at school 2.0197 -0.0217 -0.5697 0.5913
IC06Q07 Practice and drilling, such as for foreign language learning or mathematics 1.6927 -0.6637 -0.2347 0.8983
IC06Q08 Doing individual homework on a school computer 1.4450 -0.5500 -0.3550 0.9050
IC06Q09 Use school computers for group work and communication with other students 1.2080 -0.9560 -0.1780 1.1340
Table 16.37 shows the scale reliabilities for HOMSCH and USESCH in OECD countries. The internal consistency for both these indices index is high across OECD countries.
table 16.37 Scale reliabilities for ict use at home for school related tasks and for use of ict at school in oecd countries
homSCh uSeSCh
australia 0.81 0.77
austria 0.77 0.82
Belgium 0.76 0.83
Canada 0.80 0.82
Chile 0.81 0.84
Czech republic 0.76 0.82
denmark 0.72 0.79
estonia 0.66 0.83
Finland 0.71 0.78
germany 0.69 0.83
greece 0.82 0.89
hungary 0.77 0.84
Iceland 0.80 0.83
Ireland 0.77 0.84
Israel 0.80 0.90
Italy 0.74 0.82
japan 0.60 0.71
Korea 0.76 0.85
netherlands 0.65 0.80
new Zealand 0.81 0.82
norway 0.77 0.81
Poland 0.75 0.84
Portugal 0.81 0.89
Slovak republic 0.79 0.81
Slovenia 0.78 0.89
Spain 0.75 0.82
Sweden 0.79 0.81
Switzerland 0.77 0.82
turkey 0.84 0.89
median 0.77 0.82
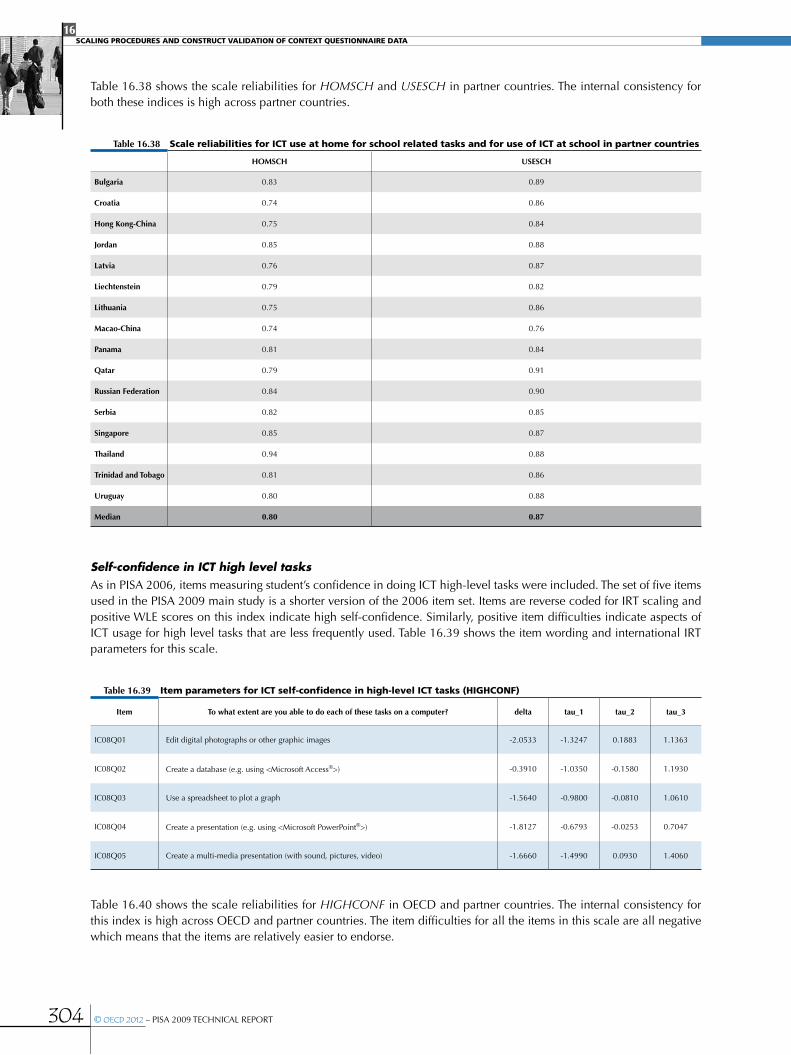
16SCALING PROCEDURES AND CONSTRUCT VALIDATION OF CONTEXT QUESTIONNAIRE DATA
304 © OECD 2012 – PISA 2009 TECHNICAL REPORT
Table 16.38 shows the scale reliabilities for HOMSCH and USESCH in partner countries. The internal consistency for both these indices is high across partner countries.
table 16.38 Scale reliabilities for ict use at home for school related tasks and for use of ict at school in partner countries
homSCh uSeSCh
Bulgaria 0.83 0.89
Croatia 0.74 0.86
hong Kong-China 0.75 0.84
jordan 0.85 0.88
Latvia 0.76 0.87
Liechtenstein 0.79 0.82
Lithuania 0.75 0.86
macao-China 0.74 0.76
Panama 0.81 0.84
Qatar 0.79 0.91
russian Federation 0.84 0.90
Serbia 0.82 0.85
Singapore 0.85 0.87
thailand 0.94 0.88
trinidad and tobago 0.81 0.86
uruguay 0.80 0.88
median 0.80 0.87
Self-confidence in ICT high level tasksAs in PISA 2006, items measuring student’s confidence in doing ICT high-level tasks were included. The set of five items used in the PISA 2009 main study is a shorter version of the 2006 item set. Items are reverse coded for IRT scaling and positive WLE scores on this index indicate high self-confidence. Similarly, positive item difficulties indicate aspects of ICT usage for high level tasks that are less frequently used. Table 16.39 shows the item wording and international IRT parameters for this scale.
table 16.39 item parameters for ict self-confidence in high-level ict tasks (highconF)
Item to what extent are you able to do each of these tasks on a computer? delta tau_1 tau_2 tau_3
IC08Q01 Edit digital photographs or other graphic images -2.0533 -1.3247 0.1883 1.1363
IC08Q02 Create a database (e.g. using <Microsoft Access®>) -0.3910 -1.0350 -0.1580 1.1930
IC08Q03 Use a spreadsheet to plot a graph -1.5640 -0.9800 -0.0810 1.0610
IC08Q04 Create a presentation (e.g. using <Microsoft PowerPoint®>) -1.8127 -0.6793 -0.0253 0.7047
IC08Q05 Create a multi-media presentation (with sound, pictures, video) -1.6660 -1.4990 0.0930 1.4060
Table 16.40 shows the scale reliabilities for HIGHCONF in OECD and partner countries. The internal consistency for this index is high across OECD and partner countries. The item difficulties for all the items in this scale are all negative which means that the items are relatively easier to endorse.

16SCALING PROCEDURES AND CONSTRUCT VALIDATION OF CONTEXT QUESTIONNAIRE DATA
PISA 2009 TECHNICAL REPORT – © OECD 2012 305
table 16.40 Scale reliabilities for confidence in high level ict tasks
hIghConF hIghConFO
ECD australia 0.72
Part
ners Bulgaria 0.82
austria 0.73 Croatia 0.79
Belgium 0.70 hong Kong-China 0.73
Canada 0.76 jordan 0.85
Chile 0.73 Latvia 0.73
Czech republic 0.73 Liechtenstein 0.73
denmark 0.70 Lithuania 0.73
estonia 0.74 macao-China 0.74
Finland 0.79 Panama 0.86
germany 0.74 Qatar 0.80
greece 0.83 russian Federation 0.83
hungary 0.80 Serbia 0.82
Iceland 0.76 Singapore 0.73
Ireland 0.82 thailand 0.85
Israel 0.78 trinidad and tobago 0.84
Italy 0.74 uruguay 0.81
japan 0.86
Korea 0.80
netherlands 0.71
new Zealand 0.77
norway 0.67
Poland 0.77
Portugal 0.72
Slovak republic 0.74
Slovenia 0.76
Spain 0.75
Sweden 0.78
Switzerland 0.76
turkey 0.86
median 0.76 median 0.81
Attitude towards computersFour items provide information on attitude towards computers. Higher scores on this index reflect a more positive attitude towards computers. Item response categories were collapsed into two categories (Yes/No) for the analyses from the four response categories in the questionnaire. The first two response categories were collapsed into a single category and likewise the last two response categories were also collapsed into one category. This was done for the purpose of enabling trends across cycles because in PISA 2000 this scale had only two response categories. Table 16.41 shows the item wording and international IRT parameters for this scale.
table 16.41 item parameters for attitude towards computers (attcoMP)
Item to what extent do you agree with the following statements? delta
IC10Q01 It is very important to me to work with a computer. -1.911
IC10Q02 I think playing or working with a computer is really fun. -2.961
IC10Q03 I use a computer because I am very interested. -1.576
IC10Q04 I lose track of time when I am working with the computer. -1.200
Table 16.42 shows the scale reliabilities for ATTCOMP in OECD and partner countries. The internal consistency for this index is low across OECD and partner countries. These low reliabilities are largely because of the collapsing of four response categories into two response categories.

16SCALING PROCEDURES AND CONSTRUCT VALIDATION OF CONTEXT QUESTIONNAIRE DATA
306 © OECD 2012 – PISA 2009 TECHNICAL REPORT
table 16.42 Scale reliabilities for attitude towards computers
attComP attComPO
ECD australia 0.53
Part
ners Bulgaria 0.62
austria 0.59 Croatia 0.43
Belgium 0.54 hong Kong-China 0.46
Canada 0.59 jordan 0.73
Chile 0.51 Latvia 0.51
Czech republic 0.63 Liechtenstein 0.67
denmark 0.56 Lithuania 0.54
estonia 0.46 macao-China 0.41
Finland 0.56 Panama 0.62
germany 0.59 Qatar 0.68
greece 0.68 russian Federation 0.77
hungary 0.60 Serbia 0.59
Iceland 0.54 Singapore 0.42
Ireland 0.62 thailand 0.69
Israel 0.65 trinidad and tobago 0.57
Italy 0.54 uruguay 0.72
japan 0.77
Korea 0.61
new Zealand 0.53
norway 0.53
Poland 0.79
Portugal 0.42
Slovak republic 0.62
Slovenia 0.57
Spain 0.67
Sweden 0.58
Switzerland 0.57
turkey 0.78
median 0.59 median 0.61
School questionnaire scale indicesThe Index on Teacher Shortage (TCSHORT) was derived from four items measuring the school principal’s perceptions of potential factors hindering instruction at school. Similar items were used in PISA 2000, 2003 and 2006. The items were not inverted for scaling. Higher WLE scores mean fewer teachers at a school. Table 16.43 shows the item wording and the international parameters used for IRT scaling. The item difficulties for all the items in this scale are all positive which means that the items are relatively harder to endorse.
table 16.43 item parameters for teacher shortage (tcShort)
Item Is your school’s capacity to provide instruction hindered by any of the following issues? delta tau_1 tau_2 tau_3
SC11Q01 A lack of qualified science teachers 3.5877 -1.4017 -0.5437 1.9453
SC11Q02 A lack of qualified mathematics teachers 3.5967 -1.1917 -0.3777 1.5693
SC11Q03 A lack of qualified <test language> teachers 4.1250 -1.2890 -0.2400 1.5290
SC11Q04 A lack of qualified teachers of other subjects 3.0293 -2.4913 -0.5183 3.0097
The index on the school’s educational resources (SCMATEDU) was computed on the basis of seven items measuring the school principal’s perceptions of potential factors hindering instruction at school. Similar items were used in PISA 2000 and 2003 but question format and item wording were modified for PISA 2006 and PISA 2009. All items were inverted for IRT scaling and positive WLE scores indicate better quality of educational resources. Similarly, positive item difficulties indicate aspects of school’s educational resources that are less likely to be available at a school. Table 16.44 shows the item wording and the international parameters used for IRT scaling. The item difficulties for all the items in this scale are all negative which means that the items are relatively easier to endorse.
table 16.44 item parameters for quality of educational resources (ScMatedu)
Item Is your school’s capacity to provide instruction hindered by any of the following issues? delta tau_1 tau_2 tau_3
SC11Q07 Shortage or inadequacy of science laboratory equipment -1.5670 -1.4670 0.2520 1.2150
SC11Q08 Shortage or inadequacy of instructional materials (e.g. textbooks) -2.2897 -1.5613 0.1437 1.4177
SC11Q09 Shortage or inadequacy of computers for instruction -1.7637 -1.8093 0.3807 1.4287
SC11Q10 Lack or inadequacy of Internet connectivity -2.3883 -1.4297 0.3193 1.1103
SC11Q11 Shortage or inadequacy of computer software for instruction -1.7797 -1.9363 0.2077 1.7287
SC11Q12 Shortage or inadequacy of library materials -1.8593 -1.7867 0.1743 1.6123
SC11Q13 Shortage or inadequacy of audio-visual resources -1.7343 -2.0317 0.1293 1.9023

16SCALING PROCEDURES AND CONSTRUCT VALIDATION OF CONTEXT QUESTIONNAIRE DATA
PISA 2009 TECHNICAL REPORT – © OECD 2012 307
The question on extra-curricular activities offered by the school is new to PISA 2009. School principals are asked to report what extra-curricular activities occur at their school. Responses to the items were coded such that positive WLE scores indicate higher levels of extra-curricular school activities. Similarly, positive item difficulties indicate extra curricular activities that are less likely to be offered by the school. Table 16.45 shows the item wording and the international parameters used for IRT scaling. The item difficulties for all the items in this scale are all negative which means that the items are relatively easier to endorse.
table 16.45 item parameters for teacher participation (excuract)
Item<this academic year>, which of the following activities does your school offer to students
in the <national modal grade for 15-year-olds>? delta
SC13Q01 Band, orchestra or choir -1.477
SC13Q02 School play or school musical -1.375
SC13Q03 School yearbook, newspaper or magazine -1.387
SC13Q04 Volunteering or service activities, e.g. <national examples> -2.055
SC13Q05 Book club -0.208
SC13Q06 Debating club or debating activities -0.218
SC13Q07 School club or school competition for foreign language, math or science -1.704
SC13Q08 <Academic club> -0.057
SC13Q09 Art club or art activities -1.589
SC13Q10 Sporting team or sporting activities -3.297
SC13Q11 Lectures and/or seminars (e.g. guest speakers such as writers or journalists) -2.117
SC13Q12 Collaboration with local libraries -0.825
SC13Q13 Collaboration with local newspapers -0.318
The question on school leadership is new to PISA 2009 and provides information on the principal’s active involvement in school affairs. This scale is based on fourteen items. Positive WLE scores on this index indicate greater involvement of school leadership in school affairs. Similarly, positive item difficulties indicate aspects of leadership that school leaders engage in less frequently. Table 16.46 shows the item wording and the international parameters used for IRT scaling. The item difficulties for all the items in this scale are all negative which means that the items are relatively easier to endorse.
table 16.46 item parameters for school principal leadership (ldrShP)
ItemBelow you can find statements about your management of this school. Please indicate the
frequency of the following activities and behaviours in your school during the last school year. delta tau_1 tau_2 tau_3
SC26Q01 I make sure that the professional development activities of teachers are in accordance with the teaching goals of the school -2.6140 -1.5530 -0.3880 1.9410
SC26Q02 I ensure that teachers work according to the school's educational goals -3.0617 -1.6503 -0.4943 2.1447
2SC6Q03 I observe instruction in classrooms -1.1647 -2.1553 0.2857 1.8697
2SC6Q04 I use student performance results to develop the school's educational goals -1.9903 -1.8147 -0.1387 1.9533
SC26Q05 I give teachers suggestions as to how they can improve their teaching -1.9967 -2.8063 0.1637 2.6427
SC26Q06 I monitor students' work -1.5603 -2.0567 -0.0987 2.1553
SC26Q07 When a teacher has problems in his/her classroom, I take the initiative to discuss matters -2.7620 -2.4300 -0.0550 2.4850
SC26Q08 I inform teachers about possibilities for updating their knowledge and skills -3.1050 -2.5380 -0.0290 2.5670
SC26Q09 I check to see whether classroom activities are in keeping with our educational goals -2.0850 -2.6240 0.1070 2.5170
SC26Q10 I take exam results into account in decisions regarding curriculum development -1.3187 -1.5573 -0.1763 1.7337
SC26Q11 I ensure that there is clarity concerning the responsibility for coordinating the curriculum -2.2640 -1.6680 -0.3220 1.9900
SC26Q12 When a teacher brings up a classroom problem, we solve the problem together -3.3700 -2.0500 -0.3380 2.3880
SC26Q13 I pay attention to disruptive behaviour in classrooms -3.2640 -2.1940 -0.0840 2.2780
SC26Q14 I take over lessons from teachers who are unexpectedly absent -0.5283 -1.6587 0.5713 1.0873

16SCALING PROCEDURES AND CONSTRUCT VALIDATION OF CONTEXT QUESTIONNAIRE DATA
308 © OECD 2012 – PISA 2009 TECHNICAL REPORT
The question on teacher participation was also present in the 2003 database. For the 2009 cycle it is computed as follows. The WLEs for the index TCHPARTI are based on IRT analyses of the number of ticks on items SC24Q01 to SC24Q12 in the “Teachers” column. A “tick” on an item was treated as positive score on that item and the absence of a “tick” meant a negative score on that item. Table 16.47 shows the item wording and the international parameters used for IRT scaling. The distribution of item difficulties for this scale is reasonable and appropriate.
table 16.47 item parameters for teacher participation (tchParti)
Item regarding your school, who has a considerable responsibility for the following tasks? delta
SC24Q01 Selecting teachers for hire 3.198
SC24Q02 Firing teachers 4.988
SC24Q03 Establishing teachers’ starting salaries 5.827
SC24Q04 Determining teachers’ salaries increases 5.001
SC24Q05 Formulating the school budget 3.466
SC24Q06 Deciding on budget allocations within the school 2.193
SC24Q07 Establishing student disciplinary policies -0.705
SC24Q08 Establishing student assessment policies -1.293
SC24Q09 Approving students for admission to the school 2.587
SC24Q10 Choosing which textbooks are used -2.379
SC24Q11 Determining course content -1.210
SC24Q12 Deciding which courses are offered 0.168
The question on teacher related factors affecting school climate has appeared before in PISA 2003 and is used for the index on the Teacher-related factors affecting school climate. All items were reverse coded for IRT scaling and positive WLE scores indicate positive teacher behaviour. Similarly, positive item difficulties indicate aspects of teacher related factors affecting school climate that are less likely to be present. Table 16.48 shows the item wording and the international parameters used for IRT scaling. The item difficulties for all the items in this scale are all negative which means that the items are relatively easier to endorse.
table 16.48 item parameters for teacher-related factors affecting school climate (teacbeha)
ItemIn your school, to what extent is the learning of students hindered
by the following phenomenon? delta tau_1 tau_2 tau_3
SC17Q01 Teachers' low expectations of students -1.5047 -2.7263 0.4457 2.2807
SC17Q03 Poor student-teacher relations -1.7170 -2.2500 -0.6930 2.9430
SC17Q05 Teachers not meeting individual students' needs -1.1583 -3.3527 0.0413 3.3113
SC17Q06 Teacher absenteeism -1.5477 -2.0973 -0.5013 2.5987
SC17Q09 Staff resisting change -0.9617 -2.5333 -0.0093 2.5427
SC17Q11 Teachers being too strict with students -2.1953 -2.6127 -0.3557 2.9683
SC17Q13 Students not being encouraged to achieve their full potential -1.3400 -2.5880 0.1240 2.4640
The question on student related aspects of school climate, which has appeared before in PISA 2003, is used for the index on the student-related aspects of school climate. This question is reverse coded, i.e. higher WLEs on this scale represent a positive student behaviour. Similarly, positive item difficulties indicate student related aspects of school climate that are less likely to be present. Table 16.49 shows the item wording and the international parameters used for IRT scaling. The distribution of item and step difficulties for this scale is reasonable and appropriate.
table 16.49 item parameters for student-related aspects of school climate (Studbeha)
ItemIn your school, to what extent is the learning of students hindered
by the following phenomenon? delta tau_1 tau_2 tau_3
SC17Q02 Student absenteeism 0.0860 -2.5130 -0.1220 2.6350
SC17Q04 Disruption of classes by students -0.3363 -3.0007 -0.0517 3.0523
SC17Q07 Students skipping classes -0.6937 -2.4813 -0.2263 2.7077
SC17Q08 Students lacking respect for teachers -1.1477 -2.8443 -0.3173 3.1617
SC17Q10 Student use of alcohol or illegal drugs -2.1460 -1.4080 -0.7940 2.2020
SC17Q12 Students intimidating or bullying other students -1.7127 -2.8573 -0.5693 3.4267

16SCALING PROCEDURES AND CONSTRUCT VALIDATION OF CONTEXT QUESTIONNAIRE DATA
PISA 2009 TECHNICAL REPORT – © OECD 2012 309
Table 16.50 shows the scale reliabilities for school-level indices in OECD countries. The internal consistencies are generally high for all the scales except TCHPARTI. For the scale TCSHORT the internal consistency is low in some countries.
table 16.50 Scale reliabilities for school-level scales in oecd countriestCShort SCmatedu exCuraCt StudBeha teaCBeha tChPartI LdrShP
australia 0.84 0.90 0.70 0.87 0.86 0.73 0.85austria 0.72 0.85 0.99 0.84 0.83 0.60 0.94Belgium 0.95 0.82 0.88 0.96 0.91 0.62 0.91Canada 0.86 0.84 0.96 0.85 0.88 0.71 0.96Chile 0.84 0.89 0.97 0.80 0.77 0.66 0.80Czech republic 0.94 0.94 0.97 0.93 0.91 0.72 0.96denmark 0.46 0.80 0.99 0.86 0.86 0.74 0.71estonia 0.63 0.69 0.97 0.69 0.71 0.60 0.97Finland 0.52 0.84 0.95 0.78 0.78 0.65 0.82germany 0.69 0.82 0.98 0.83 0.61 0.68 0.75greece 0.64 0.84 0.91 0.97 0.93 0.43 0.96hungary 0.57 0.80 0.88 0.77 0.66 0.65 0.78Iceland 0.67 0.76 0.93 0.90 0.84 0.61 0.77Ireland 0.78 0.89 0.92 0.94 0.96 0.60 0.83Israel 0.40 0.89 0.98 0.91 0.93 0.71 0.88Italy 0.94 0.92 0.96 0.78 0.80 0.61 0.84japan 0.74 0.84 0.52 0.82 0.84 0.87 0.84Korea 0.86 0.76 0.73 0.82 0.80 0.75 0.92Luxembourg 0.95 0.96 0.59 0.79 0.61 0.78 0.96mexico 0.92 0.90 0.97 0.79 0.83 0.47 0.89netherlands 0.74 0.82 0.97 0.82 0.78 0.67 0.72new Zealand 0.96 0.97 0.97 0.96 0.96 0.99 0.97norway 0.75 0.69 0.62 0.77 0.78 0.59 0.78Poland 0.24 0.75 0.79 0.72 0.72 0.49 0.81Portugal 0.98 0.92 0.91 0.96 0.95 0.49 0.94Slovak republic 0.58 0.81 0.56 0.74 0.72 0.69 0.76Slovenia 0.82 0.74 0.72 0.79 0.76 0.50 0.80Spain 0.94 0.89 0.96 0.81 0.79 0.60 0.87Sweden 0.83 0.87 0.92 0.87 0.86 0.59 0.89Switzerland 0.89 0.59 0.84 0.81 0.83 0.49 0.91turkey 0.91 0.80 0.62 0.91 0.90 0.74 0.83united Kingdom 0.91 0.90 0.90 0.90 0.88 0.57 0.73united States 0.89 0.85 0.99 0.80 0.83 0.78 0.87median 0.83 0.84 0.92 0.82 0.83 0.65 0.85
Table 16.51 shows the scale reliabilities for school-level indices in partner countries. The internal consistencies are generally high for all the scales except TCHPARTI. For the scale TCSHORT the internal consistency is low in some countries.
table 16.51 Scale reliabilities for school-level scales in partner countriesCountry tCShort SCmatedu exCuraCt StudBeha teaCBeha tChPartI LdrShP
albania 0.90 0.82 0.91 0.69 0.68 0.64 0.97argentina 0.95 0.87 0.99 0.93 0.93 0.70 0.95azerbaijan 0.91 0.91 0.90 0.86 0.85 0.42 0.97Brazil 0.96 0.92 0.99 0.92 0.91 0.60 0.96Bulgaria 0.97 0.94 0.99 0.93 0.92 0.65 0.79Colombia 0.89 0.93 0.96 0.89 0.95 0.68 0.96Croatia 0.98 0.98 0.98 0.99 0.98 0.76 0.99dubai (uae) 0.96 0.95 0.99 0.81 0.78 0.83 0.70hong Kong-China 0.73 0.83 0.39 0.74 0.83 0.75 0.97Indonesia 0.92 0.87 0.94 0.91 0.86 0.83 0.83jordan 0.81 0.83 0.85 0.84 0.79 0.54 0.70Kazakhstan 0.92 0.82 0.88 0.91 0.88 0.64 0.76Kyrgyzstan 0.74 0.79 0.83 0.81 0.81 0.63 0.68Latvia 0.55 0.69 0.99 0.71 0.69 0.70 0.76Liechtenstein 0.85 0.85 0.09 0.70 0.67 0.56 0.83Lithuania 0.87 0.91 0.97 0.74 0.71 0.66 0.80macao-China 0.94 0.92 0.99 0.94 0.90 0.81 0.81montenegro 0.54 0.65 0.86 0.96 0.95 0.77 0.72Panama 0.98 0.91 0.97 0.94 0.95 0.72 0.96Peru 0.95 0.95 0.96 0.82 0.83 0.80 0.88Qatar 0.93 0.91 0.96 0.88 0.87 0.79 0.96romania 0.24 0.79 0.69 0.77 0.73 0.63 0.78russian Federation 0.90 0.92 0.88 0.77 0.85 0.67 0.84Serbia 0.97 0.62 0.99 0.71 0.85 0.60 0.97Shanghai-China 0.92 0.94 0.81 0.96 0.94 0.80 0.82Singapore 0.82 0.82 0.92 0.81 0.84 0.76 0.85Chinese taipei 0.93 0.93 0.98 0.90 0.92 0.82 0.92thailand 0.61 0.85 0.50 0.78 0.78 0.83 0.86trinidad and tobago 0.81 0.88 0.97 0.92 0.89 0.97 0.93tunisia 0.44 0.76 0.99 0.72 0.71 0.31 0.83uruguay 0.92 0.88 0.86 0.87 0.81 0.62 0.95median 0.91 0.88 0.96 0.86 0.85 0.70 0.85

16SCALING PROCEDURES AND CONSTRUCT VALIDATION OF CONTEXT QUESTIONNAIRE DATA
310 © OECD 2012 – PISA 2009 TECHNICAL REPORT
Parent questionnaire scale indicesParent questionnaire indices are only available for the 15 countries which chose to administer the optional parent questionnaire.
Seven items measuring parents’ perceptions of the quality of school learning are included in the PISA 2009 parent questionnaire as was the case in PISA 2006. The items were reverse coded for scaling so that positive WLE scores on this index indicate positive evaluations of the school’s quality. The item wording and international parameters for IRT scaling are shown in Table 16.52. The item difficulties for all the items in this scale are all negative which means that the items are relatively easier to endorse.
table 16.52 item parameters for parents’ perception of school quality (PQSchool)
Item how much do you agree or disagree with the following statements? delta tau_1 tau_2 tau_3
PA14Q01 Most of my child's school teachers seem competent and dedicated -1.9257 -2.8903 -1.0833 3.9737
PA14Q02 Standards of achievement are high in my child's school -1.2527 -3.3013 -0.4123 3.7137
PA14Q03 I am happy with the content taught and the instructional methods used in my child's school -1.5367 -3.1523 -0.8353 3.9877
PA14Q04 I am satisfied with the disciplinary atmosphere in my child's school -1.3673 -2.5647 -0.8517 3.4163
PA14Q05 My child's progress is carefully monitored by the school -1.3920 -3.1050 -0.6850 3.7900
PA14Q06 My child's school provides regular and useful information on my child's progress -1.0000 -2.6020 -0.6170 3.2190
PA14Q07 My child's school does a good job in educating students -1.8233 -2.8847 -0.9347 3.8193
The scale on parental involvement is new to PISA and eight items measure parents’ involvement in their child’s school. Positive WLE scores on this index indicate greater parental involvement in their child’s school. Similarly, positive item difficulties indicate aspects of parental involvement in school that are less likely to be there. The item wording and international parameters for IRT scaling are shown in Table 16.53. The distribution of item difficulties for this scale is reasonable and appropriate.
table 16.53 item parameters for parental involvement (Parinvol)
Item the last <academic year>, have you participated in any of the following school-related activities? delta
PA15Q01 Discuss your child's behaviour or progress with a teacher on your own initiative -0.657
PA15Q02 Discuss your child's behaviour or progress on the initiative of one of your child's teachers -0.474
PA15Q03 Volunteer in physical activities, e.g. building maintenance, carpentry, gardening or yard work 2.664
PA15Q04 Volunteer in extra curricular activities, e.g. book club, school play, sports, field trip 1.713
PA15Q05 Volunteer in the school library or media centre 3.498
PA15Q06 <Assist a teacher in the school> 2.183
PA15Q07 Appear as a guest speaker 3.642
PA15Q08 Participate in local school <government>, e.g. parent counsel or school management committee 1.884
The question on students reading resources at home is new to PISA. Six items provide information on reading resources available to the student at home. Positive WLE scores on this index indicate greater availability of reading resources at home. Similarly, positive item difficulties indicate aspects of reading resources that are less likely to be found at home. The item wording and international parameters for IRT scaling are shown in Table 16.54. The distribution of item difficulties for this scale is reasonable and appropriate.
table 16.54 item parameters for students’ reading resources at home (readreS)
Item which of the following are available to your child in your home? delta
PA07Q01 Email -1.645
PA07Q02 <Chat on line> / <MSN®> -1.432
PA07Q03 Internet connection -2.058
PA07Q04 Daily newspaper -0.262
PA07Q05 A subscription to a journal or magazine 0.838
PA07Q06 Books of his/her very own (do not count school books) -2.103

16SCALING PROCEDURES AND CONSTRUCT VALIDATION OF CONTEXT QUESTIONNAIRE DATA
PISA 2009 TECHNICAL REPORT – © OECD 2012 311
The question on parents’ current support of child’s reading literacy is new to PISA. Six items measure parental support of the child’s reading literacy. Positive WLE scores on this index indicate greater parental support of child’s reading literacy. Similarly, positive item difficulties indicate aspects of parental support that are less frequently extended to the child. The item wording and international parameters for IRT scaling are shown in Table 16.55. The distribution of item and step difficulties for this scale is reasonable and appropriate.
table 16.55 item parameters for parents’ current support of child’s reading literacy (curSuPP)
Item how often do you or someone else in your home do the following things with your child? delta tau_1 tau_2 tau_3
PA08Q01 Discuss political or social issues -0.1647 -0.9103 -0.2153 1.1257
PA08Q02 Discuss books, films or television programmes -0.9087 -1.1103 -0.1613 1.2717
PA08Q03 Discuss how well your child is doing at school -1.7193 -1.0787 0.1603 0.9183
PA08Q06 Go to a bookstore or library with your child 1.2607 -1.4127 0.5273 0.8853
PA08Q07 Talk with your child about what he/she is reading on his/her own 0.0920 -1.2230 0.0690 1.1540
PA08Q08 Help your child with his/her homework 0.1477 -0.3967 -0.1587 0.5553
The question on parental support of child’s reading literacy at beginning of ISCED 1 is new to PISA. Eight items provide information on parental support of child’s reading literacy at the beginning of ISCED 1. Positive WLE scores on this index indicate greater parental support of child’s reading literacy at the beginning of ISCED 1. Similarly, positive item difficulties indicate aspects of parental support that are less frequently extended to the child. The item wording and international parameters for IRT scaling are shown in Table 16.56. The distribution of item and step difficulties for this scale is reasonable and appropriate.
table 16.56 item parameters for parental support of child’s reading literacy at beginning of iSced 1 (PreSuPP)
Itemwhen your child attended the first year of <ISCed 1>, how often did you or someone else
in your home undertake the following activities with her or him? delta tau_1 tau_2 tau_3
PA03Q01 Read books -0.7893 -0.9217 -0.0687 0.9903
PA03Q02 Tell stories -0.4463 -0.9657 -0.2787 1.2443
PA03Q03 Sing songs -0.1303 -0.4997 -0.2447 0.7443
PA03Q04 Play with alphabet toys (for example: blocks with letters of the alphabet) -0.0407 -0.5933 -0.5363 1.1297
PA03Q06 Talk about what you had read -0.1937 -0.8213 -0.1813 1.0027
PA03Q07 Play word games 0.0537 -0.9927 -0.3307 1.3233
PA03Q08 Write letters or words -1.1080 -0.5550 -0.2800 0.8350
PA03Q09 Read aloud signs and labels -0.4810 -0.3470 -0.2720 0.6190
The question on motivational attributes of parents own reading engagement is new to the PISA 2009 parent questionnaire but is a shorter version of the question on motivational attributes of students own reading engagement which appears in the student questionnaire of both PISA 2009 and PISA 2000. Item 3 of this scale is reverse coded for scaling purposes. Positive WLE scores on this index indicate greater parental motivation to engage in reading activities. Similarly, positive item difficulties indicate motivational attributes of parents own reading engagement that are less frequent. The item wording and international parameters for IRT scaling are shown in Table 16.57. The item difficulties for all the items in this scale are all negative which means that the items are relatively easier to endorse.
table 16.57 item parameters for motivational attributes of parents’ own reading engagement (Motread)
Item how much do you agree or disagree with these statements about reading? delta tau_1 tau_2 tau_3
PA06Q01 Reading is one of my favourite hobbies -1.4567 -2.6103 -0.3453 2.9557
PA06Q02 I feel happy if I receive a book as a present -1.7383 -2.1037 -0.7097 2.8133
PA06Q03 For me, reading is a waste of time -2.9690 -1.2410 -0.9830 2.2240
PA06Q04 I enjoy going to a bookstore or a library -1.2003 -2.3797 -0.5627 2.9423
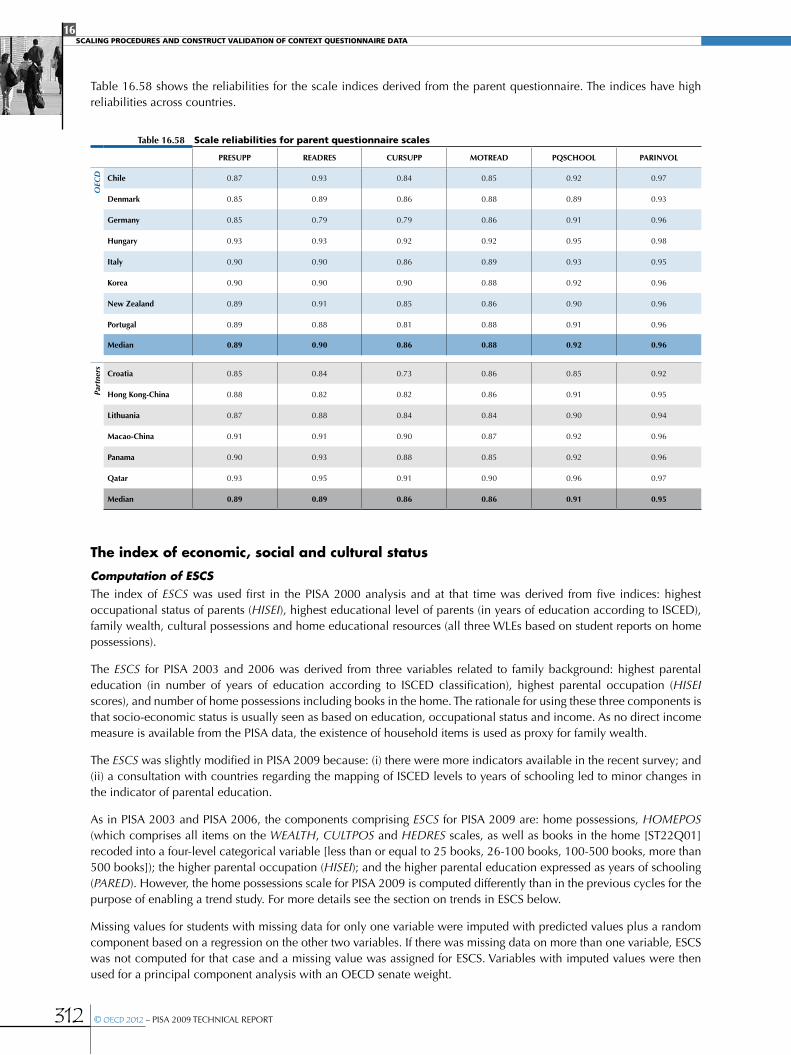
16SCALING PROCEDURES AND CONSTRUCT VALIDATION OF CONTEXT QUESTIONNAIRE DATA
312 © OECD 2012 – PISA 2009 TECHNICAL REPORT
Table 16.58 shows the reliabilities for the scale indices derived from the parent questionnaire. The indices have high reliabilities across countries.
table 16.58 Scale reliabilities for parent questionnaire scales
PreSuPP readreS CurSuPP motread PQSChooL ParInvoL
OEC
D Chile 0.87 0.93 0.84 0.85 0.92 0.97
denmark 0.85 0.89 0.86 0.88 0.89 0.93
germany 0.85 0.79 0.79 0.86 0.91 0.96
hungary 0.93 0.93 0.92 0.92 0.95 0.98
Italy 0.90 0.90 0.86 0.89 0.93 0.95
Korea 0.90 0.90 0.90 0.88 0.92 0.96
new Zealand 0.89 0.91 0.85 0.86 0.90 0.96
Portugal 0.89 0.88 0.81 0.88 0.91 0.96
median 0.89 0.90 0.86 0.88 0.92 0.96
Part
ners Croatia 0.85 0.84 0.73 0.86 0.85 0.92
hong Kong-China 0.88 0.82 0.82 0.86 0.91 0.95
Lithuania 0.87 0.88 0.84 0.84 0.90 0.94
macao-China 0.91 0.91 0.90 0.87 0.92 0.96
Panama 0.90 0.93 0.88 0.85 0.92 0.96
Qatar 0.93 0.95 0.91 0.90 0.96 0.97
median 0.89 0.89 0.86 0.86 0.91 0.95
The index of economic, social and cultural status
Computation of ESCSThe index of ESCS was used first in the PISA 2000 analysis and at that time was derived from five indices: highest occupational status of parents (HISEI), highest educational level of parents (in years of education according to ISCED), family wealth, cultural possessions and home educational resources (all three WLEs based on student reports on home possessions).
The ESCS for PISA 2003 and 2006 was derived from three variables related to family background: highest parental education (in number of years of education according to ISCED classification), highest parental occupation (HISEI scores), and number of home possessions including books in the home. The rationale for using these three components is that socio-economic status is usually seen as based on education, occupational status and income. As no direct income measure is available from the PISA data, the existence of household items is used as proxy for family wealth.
The ESCS was slightly modified in PISA 2009 because: (i) there were more indicators available in the recent survey; and (ii) a consultation with countries regarding the mapping of ISCED levels to years of schooling led to minor changes in the indicator of parental education.
As in PISA 2003 and PISA 2006, the components comprising ESCS for PISA 2009 are: home possessions, HOMEPOS (which comprises all items on the WEALTH, CULTPOS and HEDRES scales, as well as books in the home [ST22Q01]recoded into a four-level categorical variable [less than or equal to 25 books, 26-100 books, 100-500 books, more than 500 books]); the higher parental occupation (HISEI); and the higher parental education expressed as years of schooling (PARED). However, the home possessions scale for PISA 2009 is computed differently than in the previous cycles for the purpose of enabling a trend study. For more details see the section on trends in ESCS below.
Missing values for students with missing data for only one variable were imputed with predicted values plus a random component based on a regression on the other two variables. If there was missing data on more than one variable, ESCS was not computed for that case and a missing value was assigned for ESCS. Variables with imputed values were then used for a principal component analysis with an OECD senate weight.
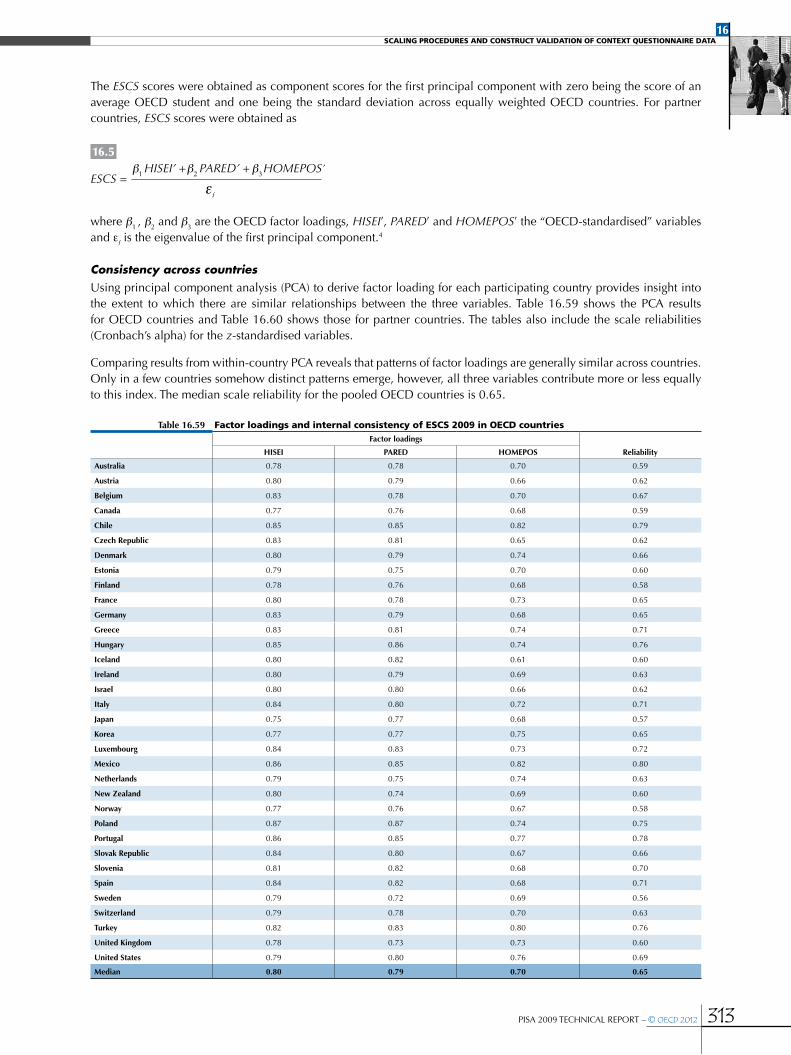
16SCALING PROCEDURES AND CONSTRUCT VALIDATION OF CONTEXT QUESTIONNAIRE DATA
PISA 2009 TECHNICAL REPORT – © OECD 2012 313
The ESCS scores were obtained as component scores for the first principal component with zero being the score of an average OECD student and one being the standard deviation across equally weighted OECD countries. For partner countries, ESCS scores were obtained as
16.5
ESCS = 1HISEI’ + ββ β2PARED’ +
3HOMEPOS’
ε f where b1 , b2 and b3 are the OECD factor loadings, HISEIʹ, PAREDʹ and HOMEPOSʹ the “OECD-standardised” variables and ef is the eigenvalue of the first principal component.4
Consistency across countriesUsing principal component analysis (PCA) to derive factor loading for each participating country provides insight into the extent to which there are similar relationships between the three variables. Table 16.59 shows the PCA results for OECD countries and Table 16.60 shows those for partner countries. The tables also include the scale reliabilities (Cronbach’s alpha) for the z-standardised variables.
Comparing results from within-country PCA reveals that patterns of factor loadings are generally similar across countries. Only in a few countries somehow distinct patterns emerge, however, all three variables contribute more or less equally to this index. The median scale reliability for the pooled OECD countries is 0.65.
table 16.59 Factor loadings and internal consistency of eScS 2009 in oecd countriesFactor loadings
reliabilityhISeI Pared homePoS
australia 0.78 0.78 0.70 0.59
austria 0.80 0.79 0.66 0.62
Belgium 0.83 0.78 0.70 0.67
Canada 0.77 0.76 0.68 0.59
Chile 0.85 0.85 0.82 0.79
Czech republic 0.83 0.81 0.65 0.62
denmark 0.80 0.79 0.74 0.66
estonia 0.79 0.75 0.70 0.60
Finland 0.78 0.76 0.68 0.58
France 0.80 0.78 0.73 0.65
germany 0.83 0.79 0.68 0.65
greece 0.83 0.81 0.74 0.71
hungary 0.85 0.86 0.74 0.76
Iceland 0.80 0.82 0.61 0.60
Ireland 0.80 0.79 0.69 0.63
Israel 0.80 0.80 0.66 0.62
Italy 0.84 0.80 0.72 0.71
japan 0.75 0.77 0.68 0.57
Korea 0.77 0.77 0.75 0.65
Luxembourg 0.84 0.83 0.73 0.72
mexico 0.86 0.85 0.82 0.80
netherlands 0.79 0.75 0.74 0.63
new Zealand 0.80 0.74 0.69 0.60
norway 0.77 0.76 0.67 0.58
Poland 0.87 0.87 0.74 0.75
Portugal 0.86 0.85 0.77 0.78
Slovak republic 0.84 0.80 0.67 0.66
Slovenia 0.81 0.82 0.68 0.70
Spain 0.84 0.82 0.68 0.71
Sweden 0.79 0.72 0.69 0.56
Switzerland 0.79 0.78 0.70 0.63
turkey 0.82 0.83 0.80 0.76
united Kingdom 0.78 0.73 0.73 0.60
united States 0.79 0.80 0.76 0.69
median 0.80 0.79 0.70 0.65

16SCALING PROCEDURES AND CONSTRUCT VALIDATION OF CONTEXT QUESTIONNAIRE DATA
314 © OECD 2012 – PISA 2009 TECHNICAL REPORT
table 16.60 Factor loadings and internal consistency of eScS 2009 in partner countries
Factor loadings
reliabilityhISeI Pared homePoS
albania 0.80 0.80 0.75 0.71
argentina 0.81 0.79 0.80 0.72
azerbaijan 0.70 0.78 0.74 0.58
Brazil 0.81 0.81 0.79 0.74
Bulgaria 0.79 0.80 0.75 0.68
Colombia 0.81 0.81 0.80 0.75
Croatia 0.82 0.81 0.70 0.67
dubai (uae) 0.66 0.76 0.62 0.41
hong Kong-China 0.83 0.84 0.78 0.76
Indonesia 0.82 0.83 0.80 0.76
jordan 0.83 0.82 0.74 0.72
Kazakhstan 0.81 0.80 0.67 0.63
Kyrgyzstan 0.77 0.79 0.72 0.63
Latvia 0.80 0.77 0.72 0.65
Liechtenstein 0.77 0.82 0.70 0.62
Lithuania 0.83 0.80 0.74 0.70
macao-China 0.78 0.77 0.75 0.65
montenegro 0.82 0.81 0.70 0.68
Panama 0.82 0.78 0.83 0.77
Peru 0.84 0.82 0.80 0.77
Qatar 0.80 0.80 0.60 0.56
romania 0.79 0.77 0.77 0.67
russian Federation 0.82 0.80 0.72 0.70
Scotland 0.79 0.69 0.76 0.61
Serbia 0.84 0.83 0.68 0.69
Shanghai-China 0.82 0.83 0.80 0.75
Singapore 0.81 0.79 0.74 0.68
Chinese taipei 0.80 0.78 0.73 0.66
thailand 0.86 0.87 0.84 0.81
trinidad tobago 0.79 0.74 0.74 0.63
tunisia 0.84 0.85 0.81 0.78
uruguay 0.85 0.86 0.81 0.80
median 0.81 0.80 0.75 0.69
Trends in ESCSThe ESCS consists of three sub-components, (HISEI) the higher parental occupation, (PARED) the higher parental education expressed as years of schooling and (HOMEPOS) the index of home possessions which comprises all items on the WEALTH, CULTPOS and HEDRES scales, as well as books in the home (ST22Q01) recoded into a four-level categorical variable (less than or equal to 25 books, 26-100 books, 100-500 books, and more than 500 books).
In order to enable a trends study, the ESCS was computed in such a way that the ESCS scores are more comparable across cycles. The ESCS was computed for the current cycle and also recomputed for the earlier cycles using similar methodology as described below.The mapping scheme for occupational status HISEI remained consistent across the cycles. In order to make the PARED sub-component of ESCS comparable across cycles, similar ISCED to PARED mapping schemes were employed for all the cycles. These mappings to years of education can be found in Annex E. To make the HOMEPOS sub-component more comparable across cycles, the scale was constructed in two steps. In step 1 a concurrent estimation was done to compute these indices using national item parameters (i.e. item parameters were estimated within countries). Items that were absent in a certain cycle were treated as structurally missing data. This enabled within country trends in the possessions indices to be seen. However, in order to enable comparisons across countries for these scales, the relative positions of the countries were estimated on a joint scale and the resulting differences in the means of the HOMEPOS index were imposed on the weighted maximum likelihood estimates (from step 1) using a linear transformation.

16SCALING PROCEDURES AND CONSTRUCT VALIDATION OF CONTEXT QUESTIONNAIRE DATA
PISA 2009 TECHNICAL REPORT – © OECD 2012 315
The PCA for obtaining ESCS scores was then done for each cycle using these three comparable sub components (HISEI, PARED and HOMEPOS). The relative weights for the PCA across cycles can be seen in Table 16.61 below. As can be seen, the weights remained consistent across cycles.
table 16.61 eScS component weights in 2000, 2003, 2006 and 2009
eSCS sub-component weights
PISa cycle hISeI Pared homePoS
2000 0.81 0.79 0.75
2003 0.81 0.81 0.77
2006 0.81 0.81 0.75
2009 0.81 0.81 0.74
Notes
1. MIRT software can be downloaded from this website: http://www.utwente.nl/gw/omd/afdeling/Glas/ (see bottom of the web page).
2. In the previous PISA cycles student and school questionnaire scaled indices were standardised using equally weighted students’ samples. In PISA 2009 school questionnaire scaled indices were standardised using equally weighted schools’ samples. It should be noted that different standardisation of the school indices do not change country ranking.
3. A similar approach was used in the IEA Civic Education Study (see Schulz, 2004).
4. Only one principal component with an eigenvalue greater than 1 was identified in each of the participating countries.


17
PISA 2009 TECHNICAL REPORT – © OECD 2012 317
Digital Reading Assessment
Item authoring tool ................................................................................................................................................. 318
Online item review .................................................................................................................................................. 318
Translation ...................................................................................................................................................................... 318
School hardware requirements ..................................................................................................................... 319
Test delivery system ................................................................................................................................................ 320
Data capture and submission .......................................................................................................................... 321
Scoring student responses ................................................................................................................................ 321
Online Coding System .......................................................................................................................................... 321

17DIGITAL READING ASSESSMENT
318 © OECD 2012 – PISA 2009 TECHNICAL REPORT
PISA 2009 included an assessment of digital reading which was known during the cycle as the Digital Reading Assessment (DRA). Chapter 2 dealt with the associated test development activities, test design and framework coverage of the DRA. This chapter focuses on the technicalities and functionality of the delivery system and the various supporting systems.
iteM authoring toolTest developers designed a generic browser page as the basis of the stimulus pages. The stimuli were authored in the HyperTextBuilder1 (HTB) software. The version of HTB used was specially adapted for and supported web browser simulations, simple text editing, e-mail clients and similar environments with dynamic behaviour. The HTB offers a wysiwyg-like authoring tool implemented in the open-source Eclipse software2 development environment. From this, an executable item can be generated using a model-driven architecture (MDA) approach. For PISA 2009 DRA, a Flash description was generated using the asWing3 framework.
online iteM reviewThe item review activities described in Chapter 2 were conducted using a secure Online Review System developed by the Consortium. Each National Centre was provided with one primary account to securely view, rate and comment upon each item. Several secondary accounts (as many as requested) were provided so that national experts could securely view, rate and comment upon each item. The primary account contained a reporting facility that enabled the National Project Manager to view the responses from national experts and collate these into a single response per country through the primary account.
tranSlationOnly English source versions of the items were released for translation (or adaptation for English testing locales). The workflows of the translation and verification processes were facilitated with an online translation management system (TMS) developed by the Consortium.
Translation of material was achieved by first creating XML Localisation Interchange File Format4 (XLIFF) compliant text files, and then translating or editing these files in an XLIFF compatible translation editor (see Figure 17.1).
• Figure 17.1 •editing an xliFF file
translation
management
System
open
Language
tool
xLIFF file
translated
or edited
xLIFF file
17DIGITAL READING ASSESSMENT
PISA 2009 TECHNICAL REPORT – © OECD 2012 319
In addition to requiring XLIFF compliance, the various commercial and open-source translation editors have unique XML tag requirements. To prevent the proliferation of XLIFF file types it was decided initially to produce XLIFF files compatible with two translation editors for the Field Trial, one commercial, SDL Trados5, and one open source, Sun Microsystems’ Open Language Tool6 (OLT).
Trados was supported in the Field trial because it required few modifications to the XLIFF and it is widely used by professional translators. However, the OLT was almost universally used in the PISA Field Trial and so only the OLT was supported in the Main Survey.
The Translation Management System supported the following workflow:
•independent double translation of source items;
•reconciliation of the two translated versions;
•verification of the reconciled version of the items (verification was the responsibility of the National Centre in the Field Trial, and the Consortium in the Main Survey);
•review by the Consortium Translation referee (Main Survey only);
•review and edit by the National Centre (including implementation of key corrections as advised by the Translation referee; for Main Survey only); and
•a final check by the Consortium that key corrections were implemented.
The question arose as to whether the whole of the material in the DRA should be translated into the language of instruction. It was argued, for example, that it was common for students to browse websites in English even where this was not the language of instruction at school. After wide consultation it was concluded that all material that appears in the DRA should be translated into the language of instruction for the major domain. This is consistent with the print PISA assessment and with the goal to assess reading literacy in the language of instruction. At its March 2007 meeting in Oslo, the PGB reiterated that the DRA “should be carried out in the national language of instruction”.
Once translation was completed, national language versions of the test delivery software were provided to national centres via downloads from Consortium FTP sites in both Australia and Germany.
School hardware reQuireMentSThe basic hardware requirement for delivering the test was the availability of a suitable PC computer for each student. To be suitable, a computer needed to satisfy the following four criteria:
•be manufactured in 2001 or later;
•have a keyboard and a pointing device (e.g. a mouse);
•have a 15 inch or larger colour display; and
•have at least one accessible USB port (e.g. at the front of the machine).
For the Field Trial, CD was the only delivery media and so a CD/DVD player was an additional hardware requirement. In the Main Survey, a USB flash drive version of the delivery system was provided, meaning that a CD/DVD drive was not required.
For both the Field Trial and the Main Survey, the data were written to and stored on a USB flash drive.
The computers had to be located so that the test could be supervised by a single test administrator, and in such a manner that students could not easily observe each others’ screens.
School computer resources surveyFor the PISA 2009 Field Trial the Consortium sought to ascertain national readiness to implement the DRA through a “school capability survey”. The survey enquired about a school’s computer hardware resources, operating systems and boot configurations. The survey was administered online and was available in three languages: English, French and German. Thirteen countries or regions participated in the survey: Belgium (Flemish), Canada, Chile, Colombia, Germany, Hungary, Iceland, Ireland, Korea, Norway, Scotland, Sweden and the United Kingdom (excluding Scotland).
Across countries, 85% of schools indicated that at least 11 suitable computers were available for DRA in one room. Only 2.5% of schools indicated they were unable to provide any suitable computer facilities whatsoever. Four per cent of schools
17DIGITAL READING ASSESSMENT
320 © OECD 2012 – PISA 2009 TECHNICAL REPORT
indicated that they had Macintosh® computers (with a maximum of 8% in one country). On the basis of this finding, the Consortium considered it would be inefficient to develop a parallel delivery system to run on Macintosh computers.
A subset of seven countries included additional questions about the impact of the DRA procedures on the school’s willingness to participate in PISA. Interestingly, only 40% of schools indicated that it would affect their decision, with 34% of schools indicating they would be more likely to participate.
Of particular importance was the finding that, of the 574 schools surveyed that could provide suitable computer facilities, 71 (12%) indicated they would not allow their computers to be configured to boot directly from a CD or USB drive – a condition which was necessary to run the DRA test. However, upon follow-up many of the schools indicated that they had simply not understood what the configuration procedure involved, or its benign nature.
Technical problems in the Field TrialThere were three significant technical problems experienced in the Field Trial.
There were reports of the system freezing: the screen froze during navigation and the student could not continue. This problem was experienced more in some countries than others and affected between 5% and 20% of students undertaking the test. This was overcome in the Main Survey by improving the efficiency of the programme and by providing a keyboard shortcut failsafe that would return the system to a usable state.
The second significant problem experienced was the browser crashing during the test, preventing the student from continuing. Like the freezing problem, this crashing problem was experienced more in some countries than others and affected between 5% and 20% of students undertaking the test. The Consortium’s investigations concluded that the crashing problems were mostly caused by insufficient computer resources. This was solved in the Main Survey by testing for appropriate memory resources prior to the test through the use of a hardware diagnostic tool. In addition the Consortium added an automatic crash recovery mechanism so that in the event of a browser crash, the student would be returned to the beginning of the unit they were working on within a few seconds.
The third major technical was that, overall, about 10% of computers would not boot the Field Trial version of the CD. This usually happened because the hardware in the computers was not recognised by the delivery system. Non-recognition of hardware usually happens either because computers have particularly unusual hardware configurations or, more commonly, because the hardware drivers for very recent models have not yet been incorporated into the version of Knoppix7 operating system being used. Another reason that the CD might not have booted was that the CD drive was faulty.
In the Main Survey a USB version was developed which increased the likelihood that the DRA system will boot, because there were now two potential boot mechanisms. In addition, a newer version of Knoppix was used in the Main Study.
Hardware diagnosticTo determine a computer’s suitability for delivering the DRA test in the Main Survey, a hardware diagnostic tool was distributed by the Consortium. The DRA Hardware Diagnostic was designed in part to emulate the test delivery system but it also provided feedback on the computer’s memory, processing power and screen resolution.
The DRA Main Survey test ran either: 1) from a USB alone or 2) from a CD with an accompanying USB to capture the data. Correspondingly, the DRA Hardware Diagnostic was provided in two modes – one for USB delivery and one for CD delivery.
Following the experience in the field trial where some computers lacked sufficient memory and processing resources to stably run the test, the Consortium recommended that school computers had at least 512MB RAM and a processing power of at least 3 000 BogoMips.8 The Hardware Diagnostic informed whether these recommended levels were met.
teSt delivery SySteMThe DRA test was delivered in schools via a set of software programs (described below) and national versions of the items bundled together onto one of two media: CD or USB drive. Regardless of the delivery media, a USB drive was required to collect the student data. If the delivery media was a USB drive, that same drive was used to collect the data.
Generally, three variants of data collection were used by national centres, sometimes in combination:
•the computers that existed in the sampled school were used to collect the data;
•laptops with preloaded software were carried into schools and used to collect the data; and
•students were transported to test centres (Macao-China only).

17DIGITAL READING ASSESSMENT
PISA 2009 TECHNICAL REPORT – © OECD 2012 321
An open-source computer-based assessment platform, TAO® (Testing Assisté par Ordinateur),9 was used to sequence and store the items, store the results data, facilitate the student navigation, and provide all interface elements such as indicating progress through the test. A special fork of TAO 1.1 was used. Substantial development was performed on the delivery system to cope with external stimuli and to correct Flash memory problems.
The test delivery system also incorporated the Knoppix operating system and so it did not need to be installed on the local computer. Thus, the local computer’s BIOS had to be configured to allow booting of the delivery system directly from the CD or USB device. This configuration was often the default setting in school computers but sometimes Test Administrators had to enter the BIOS menu and reconfigure the settings.
Knoppix 4 was the operating system used in the Field Trial but was upgraded to Knoppix 5 for the Main Survey to take advantage of the inclusion of the latest hardware drivers. Knoppix is a Debian10 Linux11 system modified to enable booting directly from DVD. Knoppix 5 was further modified by the Consortium. The modifications included the removal of a large number of libraries, drivers and programs that were extraneous to PISA needs, to reduce the system to size so that it would fit on a single CD, along with other software components of the delivery system.
The rebranded Firefox browser Iceweasel12 was bundled with Knoppix 5 and was included as a client frontend. The web server that was included was a “LAMP” system, consisting of Linux (kernel), Apache (server), MySQL13 (database) and PHP14. A licensed version of Adobe® Flash® Player15 was additionally distributed with the delivery system. However, at the time, Flash support for Linux was limited and this had some unfortunate, but unavoidable, consequences:
•the input of right to left languages was not supported;
•the input of Cyrillic script was not supported; and
•the input of characters with diacritics was not fully supported.
A range of input method editors were tried for the Chinese, Japanese and Korean character sets during the Field Trial. GCIN was eventually selected for the Main Survey for Chinese and UIM for Japanese and Korean.
Access to the secure test was granted though a PHP login script. The student entered a 13-digit identifier (unique to each PISA student within a country). This identifier was then validated by entering a five-digit checksum. The checksum was generated by applying a CRC 16 security algorithm to the identifier. The identifier and checksum were communicated to the student via a form produced by the KeyQuest student sampling software. A second two-digit identifier (incorporating a check sum, also provided by KeyQuest) was entered by the student and allocated the appropriate pre-determined test form.
data caPture and SubMiSSionResults data were written to the USB after the completion of each unit. The DRA system produced one raw results datafile per student. Data were transferred either directly by Test Administrators or from National Centres to the Consortium via a secure FTP account.
In addition to results data that contributed directly towards students cognitive scores, the system collected behavioural data such as time spent on browser pages, sequence of pages visited, and use of stimulus elements such as drop down menus. The timing data from the Field Trial were useful to gauge the appropriate amount of material in the Main Survey. Some of the behavioural data were also analysed for Volume 6 of the PISA 200916 international report.
Scoring Student reSPonSeSMost DRA items were of types for which the responses could be scored automatically on receipt of the student response datafiles. The remaining open constructed-response items were collated from the raw results datafiles, and then inserted into an Online Coding System (OCS) that was developed by the Consortium to be coded by experts trained within each national centre.
online coding SySteMThe user interface for the Online Coding System was localisable – the language elements could be translated into any language variant used in the DRA. The National Project Manager was able to create user accounts with different roles:
•a coding supervisor responsible for organising and managing the DRA coding operation;
• leading coders, who played a central role in monitoring the quality of coding, as well as coding responses themselves; and
•coders
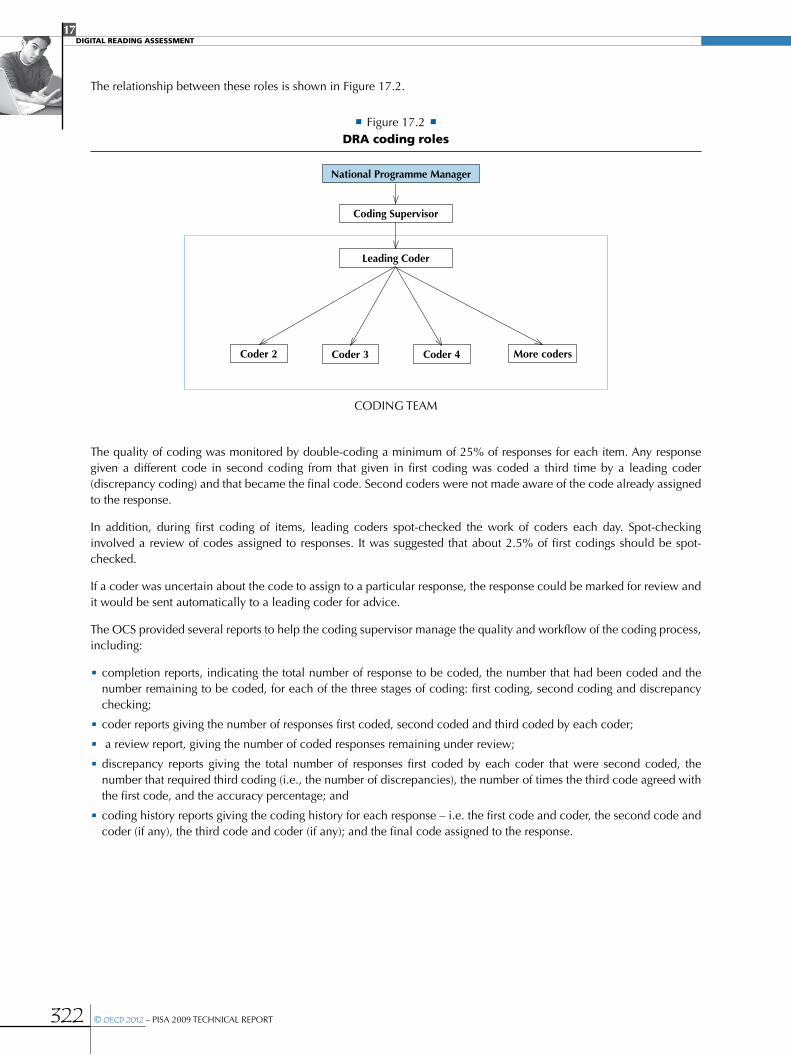
17DIGITAL READING ASSESSMENT
322 © OECD 2012 – PISA 2009 TECHNICAL REPORT
Coding Supervisor
Leading Coder
Coder 2 Coder 3 Coder 4 more coders
national Programme manager
• Figure 17.2 •dra coding roles
CODING TEAM
The relationship between these roles is shown in Figure 17.2.
The quality of coding was monitored by double-coding a minimum of 25% of responses for each item. Any response given a different code in second coding from that given in first coding was coded a third time by a leading coder (discrepancy coding) and that became the final code. Second coders were not made aware of the code already assigned to the response.
In addition, during first coding of items, leading coders spot-checked the work of coders each day. Spot-checking involved a review of codes assigned to responses. It was suggested that about 2.5% of first codings should be spot-checked.
If a coder was uncertain about the code to assign to a particular response, the response could be marked for review and it would be sent automatically to a leading coder for advice.
The OCS provided several reports to help the coding supervisor manage the quality and workflow of the coding process, including:
•completion reports, indicating the total number of response to be coded, the number that had been coded and the number remaining to be coded, for each of the three stages of coding: first coding, second coding and discrepancy checking;
•coder reports giving the number of responses first coded, second coded and third coded by each coder;
• a review report, giving the number of coded responses remaining under review;
•discrepancy reports giving the total number of responses first coded by each coder that were second coded, the number that required third coding (i.e., the number of discrepancies), the number of times the third code agreed with the first code, and the accuracy percentage; and
•coding history reports giving the coding history for each response – i.e. the first code and coder, the second code and coder (if any), the third code and coder (if any); and the final code assigned to the response.

17DIGITAL READING ASSESSMENT
PISA 2009 TECHNICAL REPORT – © OECD 2012 323
Notes
1. Developed by DIPF and SoftCon.
2. See http://www.eclipse.org/.
3. AsWing is an Open Source Flash ActionScript GUI framework and library. See http://www.aswing.org/.
4. For a description see http://en.wikipedia.org/wiki/XLIFF. Version 1.1 was current and specifications for this version can be found at http://www.oasis-open.org/committees/xliff/documents/cs-xliff-core-1.1-20031031.htm.
5. See http://www.trados.com/en/.
6. Version 1.2.7 was used. See http://java.net/projects/open-language-tools/ for the latest version of this tool. For a general description see http://en.wikipedia.org/wiki/Open_Language_Tools.
7. As noted in the “Test delivery system” section in this chapter Knoppix is a Debian Linux system modified to enable booting directly from DVD. See http://www.knoppix.net/ and http://en.wikipedia.org/wiki/Knoppix.
8. BogoMips is a measurement of CPU speed made by the Linux kernel. See http://en.wikipedia.org/wiki/BogoMips.
9. Developed by the Centre de Recherche Public (CRP): Henri Tudor and the Univeristé du Luxembourg. See https://www.tao.lu/.
10. See http://www.debian.org/ and http://en.wikipedia.org/wiki/Debian.
11. See http://www.kernel.org/ and http://en.wikipedia.org/wiki/Linux.
12. See http://wiki.debian.org/Iceweasel.
13. An open source database, see http://www.mysql.com/ and http://en.wikipedia.org/wiki/MySQL.
14. PHP is a free web development scripting language. See http://www.php.net/ and http://en.wikipedia.org/wiki/PHP.
15. See http://www.adobe.com/products/flashplayer/ and http://en.wikipedia.org/wiki/Adobe_Flash_Player.
16. For data, see OECD (2011), PISA 2009 Results: Students On Line: Digital Technologies and Performance, OECD Publishing.


18
PISA 2009 TECHNICAL REPORT – © OECD 2012 325
International Database
Files in the database................................................................................................................................................ 326
Records in the database ...................................................................................................................................... 328
Representing missing data ................................................................................................................................ 329
How are students and schools identified? ............................................................................................ 329
DRA database ............................................................................................................................................................... 330
Further information ................................................................................................................................................ 330

326 © OECD 2012 – PISA 2009 TECHNICAL REPORT
18InternatIonal DataBase
FileS in the databaSeThe PISA 2009 international database consists of five data files: three with student responses, one with school responses and one with parent responses. All are provided in text (or ASCII format) with the corresponding SAS® and SPSS® control files.
Student filesThe student performance and questionnaire data file (filename: INT_STQ09_Dec10.txt; available at http://pisa2009.acer.edu.au/) contains, for each student who participated in the assessment, the following information:
•identification variables for the country, school and student;
•the student responses to the four questionnaires, i.e. the student questionnaire, reading for school (RFS) questionnaire, the international option information communication technology (ICT) questionnaire and education career (EC) questionnaire;
•the indices derived from each student’s responses to the original questions in the questionnaires;
•the students’ performance scores in mathematics, reading, science, and the five subscales of reading (five plausible values for each domain);
•the student weight variable and 80 Fay’s replicates for the computation of the sampling variance estimates;
•weight factor to compute normalised (replicate) weights for countries’ multi-level analysis;
•three sampling related variables: the randomised final variance stratum, the final variance unit and the original explicit strata, mostly labelled by country;
•test language variable from the cognitive test; and
•database version with the date of the release.
Two sets of indices are provided in the student questionnaire files. The first set is based on a transformation of one variable or it is based on a combination of information gathered from two or more variables. Twenty-seven indices of the first type are included in the database. The second set is the result of a Rasch scaling and consists of weighted likelihood estimate indices. Twenty-two indices from the student questionnaire and seven indices from the information communication technology questionnaire are included in the database from this second type. The PISA index of economic, social and cultural status (ESCS) is derived as factor scores from a principal component analysis and is also included in the database. For a full description of the indices, see Chapter 16.
For each domain, reading, mathematics and science, and for each scale in reading, i.e. access and retrieve, integrate and interpret, reflect and evaluate, continuous text and non-continuous text, a set of five plausible values transformed to the PISA scale are provided.
It is important to note that three aspect scales and two text format scales are based on the same test items. As such, it is inappropriate to jointly analyse any of the three aspect scales with any of the two text format scales. For example, it would not be meaningful to correlate or otherwise compare performance on the access and retrieve scale, with performance on the continuous text scale as some of the items are included in both of these two scales.
The metrics of the various scales are established so that in the year that the scale is first established the OECD students’ mean score is 500 and the pooled OECD standard deviation is 100.1 The reading scale was established in 2000, the mathematics scale in 2003 and the science scale in 2006. When establishing the scale, the data is weighted to ensure that each OECD country is given equal weight.
Plausible values for reading were mapped to the PISA 2000 scale, plausible values for mathematics were mapped to the PISA 2003 scale and plausible values for science were mapped to the PISA 2006 scale. See Chapter 12 for details of these mappings.
The variable W_FSTUWT is the final student weight. The sum of the weights constitutes an estimate of the size of the target population. When analysing weighted data at the international level, large countries have a greater contribution to the results than small countries. This weighting is used for the OECD total in the tables of the international report for the first results from PISA 2009 (OECD, 2010b). To weight all countries equally for a summary statistic, the OECD average is computed and reported. The OECD average is computed as follows. First, the statistic of interest is computed for each OECD country using the final student weights. Second, the mean of the country statistics is computed and reported as the OECD average.2

PISA 2009 TECHNICAL REPORT – © OECD 2012 327
18InternatIonal DataBase
For a full description of the weighting methodology and the calculation of the weights, see Chapter 8. How to use weights in analysis of the database is described in detail in the PISA Data Analysis Manual for SPSS® or SAS® users (OECD, 2009),3 which is available at www.pisa.oecd.org. The data analysis manual also explains the theory behind sampling, plausible values and replication methodology and how to compute standard errors in case of two-stage, stratified sampling designs.
Two files with student cognitive data are available. One file contains single digit and original responses (filename: INT_Cog09_TD_Dec10.txt; available at http://pisa2009.acer.edu.au/). The second file contains scored responses (filename: INT_Cogn09_S_Dec10.txt; available at http://pisa2009.acer.edu.au/).
For each student who participated in the assessment, the following information is available:
•Identification variables for the country, school and student.
•Test booklet identification.
•The student responses to the cognitive items. When the original responses consist of multiple digits (complex multiple choice or open ended items), the multiple digits were recoded into single digit variables for use in scaling software). A “T” was added to the end of the recoded single digit variable names. The original response variables have been added at the end of the single digit, unscored file (with an “R“ at the end of the variable name see further below). For the double-digit variables (M155Q02, M155Q03, M462Q01, S131Q02, S131Q04, S269Q03, S438Q03) a “D” was added to the end of the recoded single-digit variable.
•Test language.
•Database version with the date of the release.
The PISA items are organised into units. Each unit consists of a stimulus (consisting of a piece of text or related texts, pictures or graphs) followed by one or more questions. A unit is identified by a short label and by a long label. The units’ short labels consist of four characters and form the first part of the variable names in the data files. The first character is R, M or S for reading, mathematics or science, respectively. The next three characters indicate the unit within the domain.
For example, M155 is a mathematics unit. The item names (usually seven or eight digits) represent questions within a unit and are used as variable names (in the current example the item names within the unit are M155Q01, M155Q02D, M155Q03D and M155Q04T). Thus items within a unit have the same initial four characters plus a question number.
Responses that needed to be recoded into single digit variables have a “T“ or “D“ at the end of the variable name. The original multiple digit responses have been added to the end of the single digit and original responses file (filename: INT_Cogn09_TD_Dec10.txt) with an “R“ at the end of the variable name (for example, the variable M155Q02D is a recoded item with the corresponding original responses in M155Q02R at the end of the file).
The full variable label indicates the domain the unit belongs to, the PISA cycle in which the item was first used, the full name of the unit and the question number. For example, the variable label for M155Q01 is “MATH - P2000 POPULATION PYRAMIDS (Q01)“.
The scored data file (INT_Cogn09_S_Dec10.txt) only includes one single digit variable per item with scores instead of response categories.
In both files, the cognitive items are sorted by domain and alphabetically by item name within domain. This means that the mathematics items appear at the beginning of the file, followed by the reading items and then the science items. Within domains, units with smaller numeric identification appear before those with larger identification, and within each unit, the first question will precede the second, and so on.
School fileThe school questionnaire data file (filename: INT_SCQ09_Dec10.txt; available at http://pisa2009.acer.edu.au/) contains the following information for each school that participated in the assessment:
•the identification variables for the country and school;
•the school responses on the school questionnaire;
•the school indices derived from the original questions in the school questionnaire;
•the school weight;

328 © OECD 2012 – PISA 2009 TECHNICAL REPORT
18InternatIonal DataBase
•explicit strata with national labels; and
•database version with the date of the release.
The school file contains the original variables collected through the school context questionnaire. In addition, two types of indices are provided in the school questionnaire files. The first set is based on a transformation of one variable or on a combination of two or more variables. The database includes 10 indices from this first type. The second set is the result of a Rasch scaling and consists of weighted likelihood estimate indices. Nine indices are included in the database from this second type. For a full description of the indices and how to interpret them see Chapter 16. The school weight (W_FSCHWT) is the trimmed school-base weight adjusted for non-response (see also Chapter 8).
Although the student samples were drawn from within a sample of schools, the school sample was designed to optimise the resulting sample of students, rather than to give an optimal sample of schools. For this reason, it is always preferable to analyse the school-level variables as attributes of students, rather than as elements in their own right (Gonzalez and Kennedy, 2003).
Following this recommendation one would not estimate the percentages of private schools versus public schools, for example, but rather the percentages of students attending a private school or public schools. From a practical point of view, this means that the school data should be merged with the student data file prior to analysis.
For general information about analysis of the data, see the PISA Data Analysis Manual for SPSS® or SAS® users (OECD, 2009),4 also available at www.pisa.oecd.org. Chapter 10 of the data analysis manual describes analysis with school level variables. Chapter 15 is about multi-level analysis using PISA data.
Parent fileThe parent questionnaire file (filename: INT_PAQ09_Dec10.txt, available at http://pisa2009.acer.edu.au/) contains the following information:
•identification variables for the country, school and student;
•the parents’ responses on the parent questionnaire;
•the parent indices derived from the original questions in the parent questionnaire; and
•the database version with the date of the release.
The parent file contains the original variables collected through the parent context questionnaire as a national option instrument. In addition, two types of indices are provided in the parent questionnaire file. The first set is based on a transformation of one variable or on a combination of two or more variables. The database includes three indices from this first type. The second set is the result of a Rasch scaling and consists of weighted likelihood estimate indices. Six indices are included in the database from this second type. For a detailed description of the indices see Chapter 16.
Due to the high parent non-response in most countries, caution is needed when analysing this data. Non-response is unlikely to be random. When using the final student weights from the student file, the weights of valid students in the analysis do not sum up to the population size of parents of PISA eligible students. A weight adjustment is not provided in the database.
recordS in the databaSe
Records included in the database
Student and parent files•All PISA students who attended test (assessment) sessions.
•PISA students who only attended the questionnaire session are included if they provided at least one response to the student questionnaire and the father’s or the mother’s occupation is known from the student or the parent questionnaire.
School file•All participating schools – that is, any school where at least 25% of the sampled eligible, non-excluded students were
assessed – have a record in the school-level international database, regardless of whether the school returned the school questionnaire.
PISA 2009 TECHNICAL REPORT – © OECD 2012 329
18InternatIonal DataBase
Records excluded from the database
Student and parent file•Additional data collected by countries as part of national or international options.
•Sampled students who were reported as not eligible, students who were no longer at school, students who were excluded for physical, mental or linguistic reasons, and students who were absent on the testing day.
•Students who refused to participate in the assessment sessions.
•Students from schools where less than 25% of the sampled and eligible, non-excluded students participated.
School file•Additional data collected by countries as part of national or international options.
•Schools where fewer than 25% of the sampled eligible, non-excluded students participated in the testing sessions.
rePreSenting MiSSing dataThe coding of the data distinguishes between four different types of missing data:
•Item level non-response: 9 for a one-digit variable, 99 for a two-digit variable, 999 for a three-digit variable, and so on. Missing codes are shown in the codebooks. This missing code is used if the student or school principal was expected to answer a question, but no response was actually provided.
•Multiple or invalid responses: 8 for a one-digit variable, 98 for a two-digit variable, 998 for a three-digit variable, and so on. For the multiple-choice items code 8 is used when the student selected more than one alternative answer.
•Not-administered: 7 for a one-digit variable, 97 for a two-digit variables, 997 for a three-digit variable, and so on. Generally this code is used for cognitive and questionnaire items that were not administered to the students and for items that were deleted after assessment because of misprints or translation errors.
•Not reached items: all consecutive missing values clustered at the end of test session were replaced by the non-reached code, “r”, except for the first value of the missing series, which is coded as item level non-response.
how are StudentS and SchoolS identiFied?The student identification from the student and parent files consists of three variables, which together form a unique identifier for each student:
•a country identification variable labelled COUNTRY – the country codes used in PISA are the ISO numerical three-digit country codes (http://unstats.un.org/unsd/methods/m49/m49alpha.htm);
•a school identification variable labelled SCHOOLID; and
•a student identification variable labelled STIDSTD.
A fourth variable has been included to differentiate adjudicated sub-national entities within countries. This variable (SUBNATIO) is used for three countries as follows:
•Belgium. The value “05601” is assigned to the Flemish region and “05600” to the French and German regions of Belgium.
•Spain. The value “72401” is assigned to Andalusia, “72402” to Aragon, “72403” to Asturias, “72404” to “Balearic Islands”, “72405” to Canary Islands,”72406” to Cantabria, “72407” to Castile and Leon, “72409” to Catalonia, “72411” to Galicia, “72412” to La Rioja, “72413” to Madrid, “72414” to Murcia, “72415” to Navarre, “72416” to the Basque Country, “72418” to Ceuta and Melilla, and “72499” to the rest of Spain.
•United Kingdom. The value “82600” is assigned to England, Northern Ireland and Wales and the value “82620” is assigned to Scotland.
A fifth variable is added to make the identification of countries more convenient. The variable CNT uses the ISO 3166-1 ALPHA-3 classification (http://unstats.un.org/unsd/methods/m49/m49alpha.htm), which is based on alphabetical characters rather than numeric characters (for example, for Sweden has COUNTRY=752 and CNT=SWE). It should be noted that for Shanghai the China numerical code (COUNTRY=156) was used along with a three letter code “QCN” (the three letter code for China is CHN).
A sixth variable (STRATUM) is also included to differentiate sampling strata. Value labels are provided in the control files to indicate the population defined by each stratum.5
330 © OECD 2012 – PISA 2009 TECHNICAL REPORT
18InternatIonal DataBase
The school identification consists of two variables, which together form a unique identifier for each school:
•The country identification variable labelled COUNTRY. The country codes used in PISA are the ISO numerical three-digit country codes.
•The school identification variable labelled SCHOOLID.
dra databaSeFor the 19 countries that participated in the PISA 2009 digital reading assessment, a separate database was prepared.
With the exception of Colombia and Spain, the number of cases included in the DRA database is the same as the number of cases in the PISA 2009 international database. Colombia and Spain chose to subsample schools from their large national school sample – see Chapter 4 for details on DRA sampling. The weight and replicate weight variables for these two countries have been adjusted in the DRA database to reflect this subsampling. For all other countries, the DRA weights and the pencil and paper weights are identical.
The PISA DRA international database consists of four data files: three with student responses and one with school responses. All are provided in text (or ASCII format) with the corresponding SAS® and SPSS® control files.
Student filesStudent performance and questionnaire data file (filename: ERA_STQ09_ June11.txt; available at http://pisa2009.acer.edu.au/).
For each student all the variables that are included in the international database are also included in DRA data file. The following additional information is also included:
•The students’ performance scores in DRA (five plausible values).
•DRA Language variable.
•DRA Test Form.
Two files with student cognitive data are available. One file contains single digit and original responses (filename: ERA_Cog09_TD_June11.txt; available at http://pisa2009.acer.edu.au/). The second file contains scored responses (filename: ERA_Cogn09_S_ June11.txt; available at http://pisa2009.acer.edu.au/).
Additional information included in the DRA cognitive files is as follows:
•Original and coded responses for DRA items.
•DRA Language variable.
•DRA Test Form.
School fileThe school questionnaire data file (filename: ERA_SCQ09_ June11.txt; available at http://pisa2009.acer.edu.au/).
The DRA school file contains the same information as the international data file for the participating countries.
Further inForMationA full description on how to analyse the PISA database in accordance with the complex methodologies used to collect and process the data is provided in the PISA Data Analysis Manual (OECD, 2009),6 available at www.pisa.oecd.org.

PISA 2009 TECHNICAL REPORT – © OECD 2012 331
18InternatIonal DataBase
Notes
1. The list of OECD countries included in each cycle when the scales were established is included in Annex J.
2. The definition of the OECD average has changed between PISA 2003 and PISA 2006. In previous cycles, the OECD average was based on a pooled, equally weighted database. To compute the OECD average, the data was weighted by an adjusted student weight variable that made the sum of the weights equal in all countries.
3. This publication is focused on PISA 2006, but the principles remain the same for PISA 2009.
4. This publication is focused on PISA 2006, but the principles remain the same for PISA 2009.
5. Note that not all participants permit the identification of all sampling strata in the database.
6. This publication is focused on PISA 2006, but the principles remain the same for PISA 2009.


references
PISA 2009 TECHNICAL REPORT – © OECD 2012 333
References
adams, r.j. (2005), “Reliability as a Measurement Design Effect”, Studies in Educational Evaluation, Vol. 31, pp. 162-172.
adams, r.j. and m.L. wu, (2002), PISA 2000 Technical Report, OECD Publishing.
adams, r.j., m. wilson and w.C. wang (1997), “The Multidimensional Random Coefficients Multinomial Logit Model”, Applied Psychological Measurement, No. 21, pp. 1-23.
Beaton, a.e. (1987), Implementing the New Design: The NAEP 1983-84 Technical Report (Rep. No. 15-TR-20), Educational Testing Service, Princeton, NJ.
Buchmann, C. (2000), “Family Structure, Parental Perceptions and Child Labor in Kenya: What Factors Determine Who is Enrolled in School?”, Soc. Forces, No. 78, pp. 1349-79.
Ceneval (2007), Cognitive Labs in Mexico: CITO Questionnaire Pre-trial Report, Ceneval, Mexico City.
Creemers, B.P.m. (1994), The Effective Classroom, Cassell, London.
Cochran, w.g. (1977), Sampling Techniques, third edition, John Wiley and Sons, New York.
ebel, r.L. and d.a. Frisbie (1986), Essentials of Education Measurement, Prentice Hall, Englewood Cliffs, New Jersey.
ganzeboom, h.B.g., P.m. de graaf and d.j. treiman (1992), “A Standard International Socio-economic Index of Occupational Status”, Social Science Research, No. 21, pp. 1-56.
ganzeboom h.B. and d.j. treiman (1996), “Internationally Comparable Measures of Occupational Status for the 1988 International Standard Classification of Occupations”, Social Science Research, No. 25, pp. 201-239
gonzalez, e.j. and a.m. Kennedy (2003), PIRLS 2001 User Guide for the International Database, Boston College, Chestnut Hill.
good, t.L. and j. Brophy (1986), “School Effects”, in M.C. Wittrock (ed.), Handbook of Research on Teaching, McMillan Inc., New York, pp. 328-375.
grisay, a. et al. (2007), “Translation Equivalence across PISA Countries”, Journal of Applied Measurement, No. 8(3), pp. 249-266.
grisay, a. (2008), “Opportunity to Learn in Grade 4 Classes – Reading Instruction”, in Y. Zhang, T.N. Postlethwaite and A. Grisay (eds.), A View Inside Primary Schools: A World Education Indicators (WEI) Cross-National Study, UNESCO Institute of Statistics, Montreal, pp. 175-207.
International Labour organisation (ILo) (1990), International Standard Classification of Occupations: ISCO-88, International Labour Office, Geneva.
jaeger, r.m. (1984), Sampling in Education and the Social Sciences, Longman, New York.
judkins, d.r. (1990), “Fay’s Method of Variance Estimation”, Journal of Official Statistics, No. 6(3), pp. 223-239.
Keyfitz, n. (1951), “Sampling with Probabilities Proportionate to Science: Adjustment for Changes in Probabilities”, Journal of the American Statistical Association, No. 46, American Statistical Association, Alexandria, pp. 105-109.
Kish, L. (1992), “Weighting for Unequal”, Pi. Journal of Official Statistics, No. 8(2), pp. 183-200.
Kuhlemeier, h., I. Smits and h. van den Bergh (2007), Findings of the Dutch and Finnish Cognitive Interviews Concerning Questions and Instruments Proposed by the REG, Cito, Arnhem.
Lohr, S.L. (1999), Sampling: Design and Analysis, Pacific Grove, Duxberry.
masters, g.n. (1982), “A Rasch Model for Partial Credit Scoring”, Psychometrika, No. 47(2), pp. 149-174.
masters, g.n. and B.d. wright (1997), “The Partial Credit Model”, in W.J. van der Linden and R.K. Hambleton (eds.), Handbook of Modern Item Response Theory, Springer, New York/Berlin/Heidelberg, pp. 101-122.
macaskill, g., r.j. adams and m.L. wu (1998), “Scaling Methodology and Procedures for the Mathematics and Science Literacy, Advanced Mathematics and Physics Scale”, in M. Martin and D.L. Kelly (eds.), Third International Mathematics and Science Study, Technical Report Volume 3: Implementation and Analysis, Boston College, Chestnut Hill, MA.
mislevy, r.j. (1991), “Randomization-based Inference about Latent Variables from Complex Samples”, Psychometrika, No. 56, pp. 177-196.
mislevy, r.j., a. Beaton, B.a. Kaplan and K. Sheehan (1992), “Estimating Population Characteristics from Sparse Matrix Samples of Item Responses”, Journal of Educational Measurement, No. 29(2), pp. 133-161.

references
334 © OECD 2012 – PISA 2009 TECHNICAL REPORT
mislevy, r.j. and K.m. Sheehan (1987), “Marginal Estimation Procedures”, in A.E. Beaton (ed.), The NAEP 1983-84 Technical Report, National Assessment of Educational Progress, Educational Testing Service, Princeton, pp. 293-360.
mislevy, r.j. and K.m. Sheehan (1989), “Information Matrices in Latent-Variable Models”, Journal of Educational Statistics, No. 14, pp. 335-350.
mislevy, r.j. and K.m. Sheehan (1989), “The Role of Collateral Information about Examinees in Item Parameter Estimation”, Psychometrika, No. 54, pp. 661-679.
monseur, C. and a. Berezner (2007), “The Computation of Equating Errors in International Surveys in Education”, Journal of Applied Measurement, No. 8(3), pp. 323-335.
mullis, I.v.S., m.o. martin and P. Foy (with j.F. olson, C. Preuschoff, e. erberber, a. arora and j. galia) (2008), TIMSS 2007 International Mathematics Report: Findings from IEA’s Trends in International Mathematics and Science Study at the Fourth and Eighth Grades, TIMSS & PIRLS International Study Center, Boston College, Chestnut Hill, Massachusetts.
oeCd (1999), “Classifying Educational Programmes”, Manual for ISCED-97 Implementation in OECD Countries, OECD Publishing.
oeCd (2002), Reading for Change: Performance and Engagement across Countries: Results from PISA 2000, PISA, OECD Publishing.
oeCd (2003), The PISA 2003 Assessment Framework: Mathematics, Reading, Science and Problem Solving Knowledge and Skills, OECD Publishing.
oeCd (2004), Learning for Tomorrow’s World: First Results from PISA 2003, OECD Publishing.
oeCd (2007), PISA 2006: Science Competencies for Tomorrow’s World, OECD Publishing.
oeCd (2009), PISA Data Analysis Manual: SPSS, Second Edition, PISA, OECD Publishing.
oeCd (2010a), PISA 2009 Assessment Framework: Key Competencies in Reading, Mathematics and Science, PISA, OECD Publishing.
oeCd (2010b), PISA 2009 Results: What Students Know and Can Do: Student Performance in Reading, Mathematics and Science (Volume I), PISA, OECD Publishing.
oeCd (2011), PISA 2009 Results: Students On Line: Digital Technologies and Performance (Volume VI), PISA, OECD Publishing.
Purkey, S.C. and m.S. Smith (1983), “Effective Schools: A Review”, The Elementary School Journal, No. 83(4), pp. 427-452.
Purves, a.C. (1973), Literature Education in Ten Countries, John Wiley & Sons, New York.
rasch, g. (1960), Probabilistic Models for Some Intelligence and Attainment Tests, Nielsen & Lydiche, Copenhagen.
rubin, d.B. (1987), Multiple Imputation for Nonresponse in Surveys, John Wiley & Sons, New York.
rust, K. (1985), “Variance Estimation for Complex Estimators in Sample Surveys”, Journal of Official Statistics, No. 1, pp. 381-397.
rust, K.F. and j.n.K. rao (1996), “Variance Estimation for Complex Surveys Using Replication Techniques”, Survey Methods in Medical Research, No. 5, pp. 283-310.
Sammons, P., j. hillman and P. mortimore (1995), Key Characteristics of Effective Schools: A Review of School Effectiveness Research, OFSTED, London.
Särndal, C.-e., B. Swensson and j. wretman (1992), Model Assisted Survey Sampling, Springer-Verlag, New York.
Scheerens, j. (1992), Effective Schooling, Research, Theory and Practice, Cassell, London.
Scheerens, j. and r.j. Bosker (1997), The Foundations of Educational Effectiveness, Elsevier Science Ltd., Oxford.
Schulz, w. (2002), “Constructing and Validating the Questionnaire Composites”, in R.J. Adams and M.L. Wu (eds.), PISA 2000 Technical Report, OECD Publishing.
Schulz, w. (2004), “Mapping Student Scores to Item Responses”, in W. Schulz and H. Sibberns (eds.), IEA Civic Education Study, Technical Report, IEA, Amsterdam, pp. 127-132.
Shao, j. (1996), “Resampling Methods in Sample Surveys (with Discussion)”, Statistics, No. 27, pp. 203-254.
Sulkunen, S. and P. reinikainen (2007), Summary of the Finnish Cognitive Interviews on PISA Student Questionnaire Items, University of Jyväskylä, Institute for Educational Research, Jyväskylä.
teddlie, C. and d. reynolds (2000), The International Handbook of School Effectiveness Research, Falmer Press, London.
thorndike, r.L. (1973), Reading Comprehension in Fifteen Countries, Wiley, New York, and Almqvist & Wiksell, Stockholm.
warm, t.a. (1989), “Weighted Likelihood Estimation of Ability in Item Response Theory”, Psychometrika, No. 54(3), pp. 427-450.
westat (2007), WesVar® 5.1 Computer Software and Manual, Author, Rockville, MD (also see http://www.westat.com/wesvar/).
wolter, K.m. (2007), Introduction to Variance Estimation (second edition), Springer, New York.
wu, m.L., r.j. adams and m.r. wilson (1997), ConQuest®: Multi-Aspect Test Software [computer program manual], Australian Council for Educational Research, Camberwell, Vic.
PISA 2009 TECHNICAL REPORT – © OECD 2012 335
Annexes
Annex A Main study item pool classification ................................................................................. 336
Annex B Contrast coding used in conditioning ............................................................................. 344
Annex C Design effect tables .................................................................................................................... 353
Annex D Changes to core questionnaire items ............................................................................. 359
Annex E Mapping of ISCED to years ................................................................................................... 364
Annex F National household possession items ............................................................................ 365
Annex G PISA 2009 technical standards ........................................................................................... 367
Annex H PISA Consortium, staff and consultants ........................................................................ 381
Annex I Selection of OECD PISA publications ........................................................................... 384
Annex J OECD countries included in standardisation of major PISA scales .......... 385

Annex A: MAin Study iteM pool ClASSifiCAtion
336 © OECD 2012 – PISA 2009 TECHNICAL REPORT
annex a – Main Study iteM Pool claSSiFication
Item parameters (rP=.50)
thresholds (rP=.62) PISa scale
Item unit name Source Language Scale Cluster
Inter- national
% correctSe %
correct delta tau(1) tau(2) 1 2
M033Q01 "MATH - P2000 A View Room (Q01)" Consortium Dutch Space
and ShapeM1,
UHM 75.3 0.20 -1.65 423.0
M034Q01T "MATH - P2000 Bricks (Q01)" Consortium Dutch Space
and Shape M1 42.4 0.23 0.20 566.7
M155Q01 "MATH - P2000 Population Pyramids (Q01)" Consortium Dutch Change and
Relationships M1 66.3 0.22 -1.10 465.6
M155Q02D "MATH - P2000 Population Pyramids (Q02)" Consortium Dutch Change and
Relationships M1 61.5 0.21 -0.68 0.57 -0.57 476.6 520.1
M155Q03D "MATH - P2000 Population Pyramids (Q03)" Consortium Dutch Change and
Relationships M1 18.5 0.16 1.39 0.21 -0.21 628.6 690.3
M155Q04T "MATH - P2000 Population Pyramids (Q04)" Consortium Dutch Change and
Relationships M1 54.9 0.23 -0.43 518.2
M192Q01T "MATH - P2000 Containers (Q01)" Germany German Change and
Relationships M3 41.1 0.24 0.30 574.4
M273Q01T "MATH - P2000 Pipelines (Q01)"
Czech Republic Czech Space
and Shape M2 52.7 0.23 -0.33 525.7
M406Q01 "MATH - P2003 Running Tracks (Q01)" Consortium English Space
and Shape M3 26.7 0.22 1.07 634.9
M406Q02 "MATH - P2003 Running Tracks (Q02)" Consortium English Space
and Shape M3 16.7 0.19 1.88 697.6
M408Q01T "MATH - P2003 Lotteries (Q01)" Consortium English Uncertainty M2 40.2 0.22 0.30 574.4
M411Q01 "MATH - P2003 Diving (Q01)" Consortium English Quantity M1 47.9 0.25 -0.06 546.4
M411Q02 "MATH - P2003 Diving (Q02)" Consortium English Uncertainty M1 44.8 0.23 0.16 563.5
M420Q01T "MATH - P2003 Transport (Q01)" Consortium English Uncertainty M2 50.6 0.23 -0.21 534.6
M423Q01 "MATH - P2003 Tossing Coins (Q01)" Consortium English Uncertainty M3 79.1 0.19 -1.85 407.2
M442Q02 "MATH - P2003 Braille (Q02)" Consortium English Quantity M1 38.4 0.24 0.47 588.1
M446Q01 "MATH - P2003 Thermometer Cricket (Q01)" Consortium English Change and
Relationships M2 69.0 0.22 -1.18 459.7
M446Q02 "MATH - P2003 Thermometer Cricket (Q02)" Consortium English Change and
Relationships M2 7.1 0.13 2.99 784.1
M447Q01 "MATH - P2003 Tile Arrangement (Q01)" Consortium English Space
and Shape M2 67.4 0.21 -1.09 466.1
M462Q01D "MATH - P2003 Third Side (Q01)" Sweden English Space
and ShapeM1,
UHM 11.4 0.15 1.91 0.52 -0.52 677.4 722.9
M464Q01T "MATH - P2003 The Fence (Q01)" Sweden English Space
and Shape M2 23.2 0.20 1.35 656.1
M474Q01 "MATH - P2003 Running Time (Q01)" Canada English Quantity M1 73.1 0.20 -1.54 431.5
M496Q01T "MATH - P2003 Cash Withdrawal (Q01)" Consortium English Quantity M3,
UHM 51.5 0.23 -0.31 527.2
M496Q02 "MATH - P2003 Cash Withdrawal (Q02)" Consortium English Quantity M3,
UHM 65.7 0.22 -1.07 467.9
M559Q01 "MATH - P2003 Telephone Rates (Q01)" Italy English Quantity M2 63.3 0.23 -0.93 479.2
M564Q01 "MATH - P2003 Chair Lift (Q01)" Italy English Quantity M3,
UHM 46.4 0.23 -0.01 550.1
M564Q02 "MATH - P2003 Chair Lift (Q02)" Italy English Uncertainty M3,
UHM 45.8 0.23 0.02 552.6
M571Q01 "MATH - P2003 Stop The Car (Q01)" Germany German Change and
Relationships M3 46.6 0.25 -0.01 550.4
M603Q01T "MATH - P2003 Number Check (Q01)" Austria German Quantity M3 43.5 0.23 0.15 563.1
M603Q02T "MATH - P2003 Number Check (Q02)" Austria German Quantity M3 34.8 0.24 0.66 602.6
M800Q01 "MATH - P2003 Computer Game (Q01)" Canada English Quantity M2,
UHM 89.0 0.14 -2.71 340.5
M803Q01T "MATH - P2003 Labels (Q01)" Canada English Uncertainty M1 27.3 0.22 1.03 631.5
M828Q01 "MATH - P2003 Carbon Dioxide (Q01)"
The Netherlands English Change and
Relationships M2 32.3 0.22 0.76 610.4
M828Q02 "MATH - P2003 Carbon Dioxide (Q02)"
The Netherlands English Uncertainty M2 56.0 0.23 -0.48 513.7
M828Q03 "MATH - P2003 Carbon Dioxide (Q03)"
The Netherlands English Quantity M2 28.5 0.22 1.02 630.5
[Part 1/1] table a.1 2009 Main study mathematics item classification

MAin Study iteM pool ClASSifiCAtion: Annex A
PISA 2009 TECHNICAL REPORT – © OECD 2012 337
ScaleItem parameters
(rP=.50)thresholds
(rP=.62) PISa scale
Item unit name Source Language text Format aspect Cluster
Inter- national
% correctSe %
correct delta tau(1) tau(2) 1 2
R055Q01 "READ - P2000 Drugged Spiders (Q01)" CITO English Continuous Integrate
and interpret R2 81.93 0.18 -1.46 378.22
R055Q02 "READ - P2000 Drugged Spiders (Q02)" CITO English Continuous Reflect
and evaluate R2 47.60 0.24 0.47 533.44
R055Q03 "READ - P2000 Drugged Spiders (Q03)" CITO English Continuous Integrate
and interpret R2 59.75 0.25 0.01 496.28
R055Q05 "READ - P2000 Drugged Spiders (Q05)" CITO English Continuous Integrate
and interpret R2 73.19 0.21 -0.77 433.44
R067Q01 "READ - P2000 Aesop (Q01)" Greece English/
Greek Continuous Integrate and interpret R1 88.84 0.15 -2.14 323.89
R067Q04 "READ - P2000 Aesop (Q04)" Greece English/
Greek Continuous Reflect and evaluate R1 57.56 0.19 0.08 -0.50 0.50 441.47 562.10
R067Q05 "READ - P2000 Aesop (Q05)" Greece English/
Greek Continuous Reflect and evaluate R1 67.61 0.21 -0.26 0.72 -0.72 454.87 493.48
R083Q01 "READ - P2000 Household Work Q1" ACER English Mixed Integrate
and interpret R4A 60.55 0.23 0.07 501.10
R083Q02 "READ - P2000 Household Work Q2" ACER English Non-
continuousAccess
and retrieve R4A 82.33 0.18 -1.38 384.40
R083Q03 "READ - P2000 Household Work Q3" ACER English Non-
continuousAccess
and retrieve R4A 78.73 0.20 -1.05 411.13
R083Q04 "READ - P2000 Household Work Q4" ACER English Non-
continuousIntegrate
and interpret R4A 66.10 0.22 -0.31 470.60
R101Q01 "READ - P2000 Rhinoceros - Q1" Sweden Swedish Continuous Integrate
and interpret R4A 52.24 0.23 0.49 534.33
R101Q02 "READ - P2000 Rhinoceros - Q2" Sweden Swedish Continuous Integrate
and interpret R4A 83.20 0.17 -1.46 378.39
R101Q03 "READ - P2000 Rhinoceros - Q3" Sweden Swedish Continuous Reflect
and evaluate R4A 62.22 0.24 0.03 497.57
R101Q04 "READ - P2000 Rhinoceros - Q4" Sweden Swedish Continuous Integrate
and interpret R4A 78.40 0.20 -1.03 413.06
R101Q05 "READ - P2000 Rhinoceros - Q5" Sweden Swedish Continuous Integrate
and interpret R4A 45.93 0.23 0.81 560.17
R102Q04A "READ - P2000 Shirts (Q04a)" CITO English Continuous Integrate
and interpret R1 31.43 0.22 1.42 609.45
R102Q05 "READ - P2000 Shirts (Q05)" CITO English Non-
continuousIntegrate
and interpret R1 44.34 0.23 0.67 548.93
R102Q07 "READ - P2000 Shirts (Q07)" CITO English Mixed Integrate
and interpret R1 83.32 0.19 -1.55 371.16
R104Q01 "READ - P2000 Telephone (Q01)"
New Zealand English Non-
continuousAccess
and retrieve R2 79.29 0.20 -1.25 394.60
R104Q02 "READ - P2000 Telephone (Q02)"
New Zealand English Non-
continuousAccess
and retrieve R2 34.20 0.22 1.33 602.06
R104Q05 "READ - P2000 Telephone (Q05)"
New Zealand English Non-
continuousAccess
and retrieve R2 19.48 0.13 2.48 -1.20 1.20 591.23 796.69
R111Q01 "READ - P2000 Exchange (Q01)" Finland Finnish Continuous Integrate
and interpret R2 65.08 0.23 -0.38 465.06
R111Q02B "READ - P2000 Exchange (Q02b)" Finland Finnish Continuous Reflect
and evaluate R2 36.52 0.18 1.17 -0.82 0.82 511.05 667.47
R111Q06B "READ - P2000 Exchange (Q06b)" Finland Finnish Continuous Reflect
and evaluate R2 42.70 0.24 0.76 0.76 -0.76 537.86 575.02
R219Q02 "READ - P2000 Employment (Q02)" IALS English Non-
continuousReflect
and evaluate R1 80.73 0.19 -1.42 381.11
R220Q01 "READ - P2000 South Pole (Q01)" France French Mixed Access
and retrieve R1 40.31 0.24 0.90 567.55
R220Q02B "READ - P2000 South Pole (Q02b)" France French Mixed Integrate
and interpret R1 62.27 0.24 -0.18 480.96
R220Q04 "READ - P2000 South Pole (Q04)" France French Continuous Integrate
and interpret R1 58.89 0.24 0.00 494.92
R220Q05 "READ - P2000 South Pole (Q05)" France French Continuous Integrate
and interpret R1 81.17 0.20 -1.35 387.21
R220Q06 "READ - P2000 South Pole (Q06)" France French Continuous Integrate
and interpret R1 65.92 0.22 -0.44 460.41
R227Q01 "READ - P2000 Optician (Q01)" Switzerland German Mixed Integrate
and interpret R2 54.96 0.23 0.17 509.13
R227Q02T "READ - P2000 Optician (Q02)" Switzerland German Continuous Access
and retrieve R2 55.78 0.16 0.09 -1.02 1.02 411.85 593.72
R227Q03 "READ - P2000 Optician (Q03)" Switzerland German Continuous Reflect
and evaluate R2 55.37 0.24 0.22 513.38
[Part 1/4] table a.2 2009 Main study reading item classification

Annex A: MAin Study iteM pool ClASSifiCAtion
338 © OECD 2012 – PISA 2009 TECHNICAL REPORT
ScaleItem parameters
(rP=.50)thresholds
(rP=.62) PISa scale
Item unit name Source Language text Format aspect Cluster
Inter- national
% correctSe %
correct delta tau(1) tau(2) 1 2
R227Q06 "READ - P2000 Optician (Q06)" Switzerland German Non-
continuousAccess
and retrieve R2 73.46 0.22 -0.89 424.05
R245Q01 "READ - P2000 Movie Reviews - Q1" IALS English Mixed Access
and retrieve R4A 68.35 0.21 -0.38 465.06
R245Q02 "READ - P2000 Movie Reviews - Q2" IALS English Mixed Integrate
and interpret R4A 68.01 0.22 -0.41 462.01
R403Q01 "READ - P2009 Brushing your teeth Q1" ILS Norwegian Continuous Integrate
and interpret R3B 84.97 0.03 -1.77 353.34
R403Q02 "READ - P2009 Brushing your teeth Q2" ILS Norwegian Continuous Access
and retrieve R3B 81.40 0.04 -1.71 358.32
R403Q03 "READ - P2009 Brushing your teeth Q3" ILS Norwegian Continuous Access
and retrieve R3B 94.31 0.02 -2.63 284.56
R403Q04 "READ - P2009 Brushing your teeth Q4" ILS Norwegian Continuous Reflect
and evaluate R3B 73.41 0.04 -1.20 399.33
R404Q03 "READ - P2009 Sleep Q3" ILS Norwegian Continuous Integrate
and interpret R5 73.03 0.22 -0.76 434.57
R404Q06 "READ - P2009 Sleep Q6" ILS Norwegian Non-
continuousIntegrate
and interpret R5 48.89 0.23 0.65 547.81
R404Q07T "READ - P2009 Sleep Q7" ILS Norwegian Non-
continuousIntegrate
and interpret R5 33.95 0.23 1.44 610.65
R404Q10A "READ - P2009 Sleep Q10A" ILS Norwegian Non-
continuousReflect
and evaluate R5 43.32 0.24 0.94 570.68
R404Q10B "READ - P2009 Sleep Q10B" ILS Norwegian Non-
continuousReflect
and evaluate R5 37.72 0.23 1.19 590.75
R406Q01 "READ - P2009 Kokeshi Dolls Q1" NIER Japanese Continuous Integrate
and interpretR5,
UHR 66.55 0.23 -0.34 468.11
R406Q02 "READ - P2009 Kokeshi Dolls Q2" NIER Japanese Continuous Integrate
and interpretR5,
UHR 32.47 0.21 1.43 609.77
R406Q05 "READ - P2009 Kokeshi Dolls Q5" NIER Japanese Continuous Integrate
and interpretR5,
UHR 73.44 0.21 -0.76 434.08
R412Q01 "READ - P2009 World Languages Q1" ACER English Non-
continuousAccess
and retrieve R6 84.96 0.16 -1.65 362.98
R412Q05 "READ - P2009 World Languages Q5" ACER English Continuous Integrate
and interpret R6 57.97 0.22 0.11 504.23
R412Q06T "READ - P2009 World Languages Q6" ACER English Continuous Integrate
and interpret R6 37.96 0.21 1.11 584.65
R412Q08 "READ - P2009 World Languages Q8" ACER English Mixed Integrate
and interpret R6 37.75 0.24 1.05 579.83
R414Q02 "READ - P2009 Mobile Phone Safety Q2" ACER English Non-
continuousIntegrate
and interpret R3A 45.56 0.22 0.82 560.89
R414Q06 "READ - P2009 Mobile Phone Safety Q6" ACER English Non-
continuousReflect
and evaluate R3A 54.91 0.25 0.38 525.74
R414Q09 "READ - P2009 Mobile Phone Safety Q9" ACER English Non-
continuousIntegrate
and interpret R3A 63.29 0.22 -0.09 487.94
R414Q11 "READ - P2009 Mobile Phone Safety Q11" ACER English Non-
continuousReflect
and evaluate R3A 35.61 0.22 1.36 604.07
R417Q03 "READ - P2009 Balloon Q3" ILS Norwegian Non-
continuousAccess
and retrieve R3B 41.83 0.04 0.33 -0.73 0.73 449.25 595.00
R417Q04 "READ - P2009 Balloon Q4" ILS Norwegian Non-
continuousReflect
and evaluate R3B 51.24 0.05 0.18 509.85
R417Q06 "READ - P2009 Balloon Q6" ILS Norwegian Non-
continuousReflect
and evaluate R3B 74.61 0.05 -1.05 410.81
R417Q08 "READ - P2009 Balloon Q8" ILS Norwegian Non-
continuousIntegrate
and interpret R3B 82.54 0.03 -1.56 370.28
R420Q02 "READ - P2009 Childrens Futures Q2" NIER Japanese Non-
continuousAccess
and retrieve R6 83.00 0.18 -1.58 368.27
R420Q06 "READ - P2009 Childrens Futures Q6" NIER Japanese Non-
continuousReflect
and evaluate R6 45.22 0.23 0.77 557.04
R420Q09 "READ - P2009 Childrens Futures Q9" NIER Japanese Non-
continuousAccess
and retrieve R6 76.60 0.21 -1.04 412.09
R420Q10 "READ - P2009 Childrens Futures Q10" NIER Japanese Non-
continuousIntegrate
and interpret R6 70.88 0.22 -0.35 2.24 -2.24 462.66 471.16
R424Q02T "READ - P2009 Fair Trade Q2" aSPe French Non-
continuousIntegrate
and interpret R5 42.41 0.23 0.96 572.21
R424Q03 "READ - P2009 Fair Trade Q3" aSPe French Non-
continuousReflect
and evaluate R5 66.59 0.23 -0.32 469.24
R424Q07 "READ - P2009 Fair Trade Q7" aSPe French Continuous Reflect
and evaluate R5 75.95 0.21 -0.91 422.13
[Part 2/4] table a.2 2009 Main study reading item classification

MAin Study iteM pool ClASSifiCAtion: Annex A
PISA 2009 TECHNICAL REPORT – © OECD 2012 339
ScaleItem parameters
(rP=.50)thresholds
(rP=.62) PISa scale
Item unit name Source Language text Format aspect Cluster
Inter- national
% correctSe %
correct delta tau(1) tau(2) 1 2
R429Q08 "READ - P2009 Blood Donation Notice Q8" aSPe French Continuous Integrate
and interpret R3B 69.91 0.05 -0.71 438.42
R429Q09 "READ - P2009 Blood Donation Notice Q9" aSPe French Continuous Reflect
and evaluate R3B 81.33 0.03 -1.59 367.55
R429Q11 "READ - P2009 Blood Donation Notice Q11" aSPe French Continuous Integrate
and interpret R3B 68.85 0.05 -1.22 397.65
R432Q01 "READ - P2009 About a book Q1" DIPF German Continuous Integrate
and interpret R7 85.76 0.17 -1.57 369.16
R432Q05 "READ - P2009 About a book Q5" DIPF German Multiple Reflect
and evaluate R7 73.42 0.23 -0.66 442.35
R432Q06T "READ - P2009 About a book Q6" DIPF German Continuous Integrate
and interpret R7 14.95 0.16 2.89 727.27
R433Q01 "READ - P2009 Miser Q1" Portugal Greek Continuous Integrate
and interpret R3B 79.60 0.04 -1.52 373.41
R433Q02 "READ - P2009 Miser Q2" Portugal Greek Continuous Integrate
and interpret R3B 54.59 0.03 -0.67 441.87
R433Q05 "READ - P2009 Miser Q5" Portugal Greek Continuous Integrate
and interpret R3B 30.22 0.04 0.65 547.65
R433Q07 "READ - P2009 Miser Q7" Portugal Greek Continuous Access
and retrieve R3B 87.91 0.03 -2.30 310.41
R435Q01 "READ - P2009 Dust Mites Q1" Canada English Continuous Integrate
and interpret R4B 67.90 0.04 -1.11 406.48
R435Q02 "READ - P2009 Dust Mites Q2" Canada English Continuous Access and
retrieve R4B 94.40 0.02 -2.80 270.84
R435Q05 "READ - P2009 Dust Mites Q5" Canada English Continuous Reflect
and evaluate R4B 63.41 0.05 -0.86 426.46
R435Q08T "READ - P2009 Dust Mites Q8" Canada English Continuous Reflect
and evaluate R4B 54.35 0.04 -0.34 467.71
R437Q01 "READ - P2009 Narcissus Q1" Sweden Portuguese Continuous Integrate
and interpret R6 52.18 0.24 0.33 522.21
R437Q06 "READ - P2009 Narcissus Q6" Sweden Portuguese Continuous Integrate
and interpret R6 52.75 0.23 0.33 522.05
R437Q07 "READ - P2009 Narcissus Q7" Sweden Portuguese Continuous Integrate
and interpret R6 17.01 0.17 2.48 694.52
R442Q02 "READ - P2009 Galileo Q2" Colombia Spanish Continuous Access
and retrieve R4A 70.63 0.22 -0.50 455.11
R442Q03 "READ - P2009 Galileo Q3" Colombia Spanish Continuous Integrate
and interpret R4A 71.48 0.23 -0.59 447.81
R442Q05 "READ - P2009 Galileo Q5" Colombia Spanish Continuous Reflect
and evaluate R4A 35.32 0.23 1.34 603.27
R442Q06 "READ - P2009 Galileo Q6" Colombia Spanish Continuous Reflect
and evaluate R4A 24.65 0.21 1.97 653.35
R442Q07 "READ - P2009 Galileo Q7" Colombia Spanish Continuous Integrate
and interpret R4A 39.34 0.24 1.20 591.31
R445Q01 "READ - P2009 Road Q1" Spain Spanish Continuous Integrate
and interpret R4B 74.04 0.04 -1.02 413.38
R445Q03 "READ - P2009 Road Q3" Spain Spanish Continuous Integrate
and interpret R4B 88.70 0.03 -2.19 319.40
R445Q04 "READ - P2009 Road Q4" Spain Spanish Continuous Integrate
and interpret R4B 86.10 0.03 -2.01 333.76
R445Q06 "READ - P2009 Road Q6" Spain Spanish Continuous Integrate
and interpret R4B 63.86 0.05 -0.80 431.20
R446Q03 "READ - P2009 Job Vacancy Q3" ACER English Non-
continuousAccess
and retrieveR7,
UHR 92.62 0.13 -2.48 295.96
R446Q06 "READ - P2009 Job Vacancy Q6" ACER English Non-
continuousReflect
and evaluateR7,
UHR 78.06 0.20 -1.05 411.45
R447Q01T "READ - P2009 Acne Vulgaris Q1" China English Non-
continuousAccess
and retrieve R3A 66.28 0.21 -0.25 475.18
R447Q04 "READ - P2009 Acne Vulgaris Q4" China English Continuous Reflect
and evaluate R3A 54.75 0.24 0.33 521.81
R447Q05 "READ - P2009 Acne Vulgaris Q5" China English Continuous Access
and retrieve R3A 78.97 0.19 -1.04 412.09
R447Q06 "READ - P2009 Acne Vulgaris Q6" China English Continuous Reflect
and evaluate R3A 48.72 0.24 0.69 550.54
R452Q03 "READ - P2009 The Plays the Thing Q3" Hungary Hungarian Continuous Integrate
and interpret R3A 13.32 0.16 2.92 729.51
R452Q04 "READ - P2009 The Plays the Thing Q4" Hungary Hungarian Continuous Integrate
and interpret R3A 66.35 0.21 -0.27 473.97
[Part 3/4] table a.2 2009 Main study reading item classification

Annex A: MAin Study iteM pool ClASSifiCAtion
340 © OECD 2012 – PISA 2009 TECHNICAL REPORT
ScaleItem parameters
(rP=.50)thresholds
(rP=.62) PISa scale
Item unit name Source Language text Format aspect Cluster
Inter- national
% correctSe %
correct delta tau(1) tau(2) 1 2
R452Q06 "READ - P2009 The Plays the Thing Q6" Hungary Hungarian Continuous Integrate
and interpret R3A 49.68 0.24 0.63 546.12
R452Q07 "READ - P2009 The Plays the Thing Q7" Hungary Hungarian Continuous Integrate
and interpret R3A 46.21 0.24 0.76 556.40
R453Q01 "READ - P2009 Find Summer Job Q1" Finland Finnish Continuous Integrate
and interpret R6 81.08 0.19 -1.31 390.42
R453Q04 "READ - P2009 Find Summer Job Q4" Finland Finnish Continuous Reflect
and evaluate R6 62.87 0.23 -0.16 482.56
R453Q05T "READ - P2009 Find Summer Job Q5" Finland Finnish Continuous Access
and retrieve R6 62.71 0.23 -0.17 481.68
R453Q06 "READ - P2009 Find Summer Job Q6" Finland Finnish Continuous Reflect
and evaluate R6 70.37 0.22 -0.61 446.28
R455Q02 "READ - P2009 Chocolate and Health Q2"
New Zealand English Continuous Reflect and
evaluateR5,
UHR 35.55 0.22 1.24 595.24
R455Q03 "READ - P2009 Chocolate and Health Q3"
New Zealand English Continuous Access
and retrieveR5,
UHR 78.30 0.19 -1.04 411.77
R455Q04 "READ - P2009 Chocolate and Health Q4"
New Zealand English Continuous Integrate
and interpretR5,
UHR 64.44 0.23 -0.25 475.18
R455Q05T "READ - P2009 Chocolate and Health Q5"
New Zealand English Continuous Integrate
and interpretR5,
UHR 25.92 0.21 1.96 652.63
R456Q01 "READ - P2009 Biscuits Q1" Serbia English Continuous Access
and retrieve R7 96.11 0.09 -3.40 222.76
R456Q02 "READ - P2009 Biscuits Q2" Serbia English Continuous Integrate
and interpret R7 82.48 0.18 -1.38 384.57
R456Q06 "READ - P2009 Biscuits Q6" Serbia English Continuous Integrate
and interpret R7 83.01 0.18 -1.37 385.77
R458Q01 "READ - P2009 Telecommuting Q1" Korea Korean Mixed Integrate
and interpret R3A 52.26 0.22 0.52 536.98
R458Q04 "READ - P2009 Telecommuting Q4" Korea Korean Mixed Integrate
and interpret R3A 60.09 0.23 0.10 502.95
R458Q07 "READ - P2009 Telecommuting Q7" Korea Korean Continuous Reflect
and evaluate R3A 56.16 0.24 0.24 514.34
R460Q01 "READ - P2009 Gulf of Mexico Q1" Mexico Spanish Continuous Access
and retrieveR7,
UHR 67.30 0.23 -0.30 471.65
R460Q05 "READ - P2009 Gulf of Mexico Q5" Mexico Spanish Continuous Access
and retrieveR7,
UHR 83.11 0.19 -1.37 385.45
R460Q06 "READ - P2009 Gulf of Mexico Q6" Mexico Spanish Continuous Integrate
and interpretR7,
UHR 62.15 0.23 0.00 495.56
R462Q02 "READ - P2009 Parcel Post Q2" Greece Greek Non-
continuousAccess
and retrieve R4B 45.46 0.05 0.27 516.75
R462Q04 "READ - P2009 Parcel Post Q4" Greece Greek Non-
continuousAccess
and retrieve R4B 73.05 0.05 -1.19 399.97
R462Q05 "READ - P2009 Parcel Post Q5" Greece Greek Non-
continuousIntegrate
and interpret R4B 34.33 0.04 0.45 531.52
R465Q01 "READ - P2009 How to survive at work Q1" ACER English Non-
continuousAccess
and retrieve R4B 92.80 0.02 -2.63 284.32
R465Q02 "READ - P2009 How to survive at work Q2" ACER English Non-
continuousIntegrate
and interpret R4B 55.89 0.05 0.06 500.06
R465Q05 "READ - P2009 How to survive at work Q5" ACER English Non-
continuousReflect
and evaluate R4B 21.40 0.04 0.55 539.14
R465Q06 "READ - P2009 How to survive at work Q6" ACER English Non-
continuousReflect
and evaluate R4B 65.71 0.05 -0.34 468.35
R466Q02 "READ - P2009 Work Right Q2" aSPe French Continuous Access
and retrieve R7 46.41 0.23 0.86 563.94
R466Q03T "READ - P2009 Work Right Q3" aSPe French Mixed Integrate
and interpret R7 16.44 0.17 2.66 708.97
R466Q06 "READ - P2009 Work Right Q6" aSPe French Continuous Access
and retrieve R7 80.74 0.20 -1.17 401.34
[Part 4/4] table a.2 2009 Main study reading item classification

MAin Study iteM pool ClASSifiCAtion: Annex A
PISA 2009 TECHNICAL REPORT – © OECD 2012 341
Item parameters (rP=.50)
thresholds (rP=.62) PISa scale
Item unit name Source Language Scale Cluster
Inter-national
% correctSe %
correct delta tau(1) tau(2) 1 2
S131Q02D "SCIE - P2000 Good Vibrations (Q02)" ACER English Using scientific
evidence S1 49.53 0.24 0.29 557.62
S131Q04D "SCIE - P2006 (broken link) Good Vibrations (Q04)" ACER English Identifying scientific
issues S1 27.99 0.21 1.38 659.17
S256Q01 "SCIE - P2000 Spoons (Q01)" TIMSS English Explaining phenomena
scientificallyS3,
UHS 88.57 0.15 -2.12 332.43
S269Q01 "SCIE - P2000 Earth Temperature (Q01)" CITO Dutch Explaining phenomena
scientifically S2 58.00 0.24 -0.19 512.40
S269Q03D "SCIE - P2000 Earth Temperature (Q03)" CITO Dutch Explaining phenomena
scientifically S2 41.41 0.23 0.58 584.67
S269Q04T "SCIE - P2000 Earth Temperature (Q04)" CITO Dutch Explaining phenomena
scientifically S2 33.03 0.22 1.03 626.16
S326Q01 "SCIE - P2003 Milk (Q01)" CITO Dutch Using scientific
evidence S3 58.59 0.22 -0.22 509.41
S326Q02 "SCIE - P2003 Milk (Q02)" CITO Dutch Using scientific
evidence S3 63.89 0.23 -0.43 489.92
S326Q03 "SCIE - P2003 Milk (Q03)" CITO Dutch Using scientific
evidence S3 60.62 0.23 -0.29 503.17
S326Q04T "SCIE - P2003 Milk (Q04)" CITO Dutch Explaining phenomena
scientifically S3 25.32 0.20 1.54 674.28
S408Q01 "SCIE - P2006 Wild Oat Grass (Q01)" ILS Norwegian Explaining phenomena
scientifically S2 60.29 0.23 -0.27 504.75
S408Q03 "SCIE - P2006 Wild Oat Grass (Q03)" ILS Norwegian Explaining phenomena
scientifically S2 30.73 0.22 1.19 641.36
S408Q04T "SCIE - P2006 Wild Oat Grass (Q04)" ILS Norwegian Explaining phenomena
scientifically S2 54.39 0.22 -0.01 529.00
S408Q05 "SCIE - P2006 Wild Oat Grass (Q05)" ILS Norwegian Identifying scientific
issues S2 42.81 0.22 0.61 586.72
S413Q04T "SCIE - P2006 Plastic Age (Q04)" IPN German Using scientific
evidence S3 43.04 0.23 0.58 584.11
S413Q05 "SCIE - P2006 Plastic Age (Q05)" IPN German Using scientific
evidence S3 69.11 0.22 -0.69 465.49
S413Q06 "SCIE - P2006 Plastic Age (Q06)" IPN German Explaining phenomena
scientifically S3 39.69 0.25 0.74 598.84
S415Q02 "SCIE - P2006 Solar Power Generation (Q02)" NIER Japanese Explaining phenomena
scientifically S1 77.57 0.20 -1.34 405.35
S415Q07T "SCIE - P2006 Solar Power Generation (Q07)" ACER English Identifying scientific
issues S1 72.72 0.21 -1.01 435.93
S415Q08T "SCIE - P2006 Solar Power Generation (Q08)" ACER English Identifying scientific
issues S1 59.65 0.23 -0.23 508.57
S425Q02 "SCIE - P2006 Penguin Island (Q02)" ACER English Using scientific
evidence S3 47.40 0.24 0.36 564.15
S425Q03 "SCIE - P2006 Penguin Island (Q03)" ACER English Explaining phenomena
scientifically S3 43.80 0.23 0.56 582.89
S425Q04 "SCIE - P2006 Penguin Island (Q04)" ACER English Using scientific
evidence S3 29.38 0.22 1.29 650.87
S425Q05 "SCIE - P2006 Penguin Island (Q05)" ACER English Identifying scientific
issues S3 68.34 0.21 -0.78 457.38
S428Q01 "SCIE - P2006 Bacteria in Milk (Q01)" IPN German Using scientific
evidenceS1,
UHS 60.50 0.24 -0.25 507.18
S428Q03 "SCIE - P2006 Bacteria in Milk (Q03)" IPN German Using scientific
evidenceS1,
UHS 73.00 0.21 -1.01 435.93
S428Q05 "SCIE - P2006 Bacteria in Milk (Q05)" IPN German Explaining phenomena
scientificallyS1,
UHS 45.16 0.24 0.47 573.75
S438Q01T "SCIE - P2006 Green Parks (Q01)" ACER English Identifying scientific
issues S1 83.72 0.17 -1.86 357.14
[Part 1/2] table a.3 2009 Main study science item classification

Annex A: MAin Study iteM pool ClASSifiCAtion
342 © OECD 2012 – PISA 2009 TECHNICAL REPORT
Item parameters (rP=.50)
thresholds (rP=.62) PISa scale
Item unit name Source Language Scale Cluster
Inter-national
% correctSe %
correct delta tau(1) tau(2) 1 2
S438Q02 "SCIE - P2006 Green Parks (Q02)" ACER English Identifying scientific
issues S1 66.69 0.22 -0.60 473.98
S438Q03D "SCIE - P2006 Green Parks (Q03)" ACER English Identifying scientific
issues S1 39.32 0.24 0.82 606.49
S465Q01 "SCIE - P2006 Different Climates (Q01)" ILS Norwegian Using scientific
evidence S1 46.83 0.22 0.36 0.04 -0.04 520.51 606.49
S465Q02 "SCIE - P2006 Different Climates (Q02)" ILS Norwegian Explaining phenomena
scientifically S1 60.36 0.23 -0.32 500.74
S465Q04 "SCIE - P2006 Different Climates (Q04)" ILS Norwegian Explaining phenomena
scientifically S1 36.24 0.22 0.91 614.88
S466Q01T "SCIE - P2006 Forest Fires (Q01)" ILS Norwegian Identifying scientific
issuesS2,
UHS 73.54 0.20 -1.05 432.30
S466Q05 "SCIE - P2006 Forest Fires (Q05)" ILS Norwegian Using scientific
evidenceS2,
UHS 53.15 0.23 0.05 534.96
S466Q07T "SCIE - P2006 Forest Fires (Q07)" ILS Norwegian Identifying scientific
issuesS2,
UHS 70.33 0.21 -0.91 445.44
S478Q01 "SCIE - P2006 Antibiotics (Q01)" France French Explaining phenomena
scientifically S3 42.96 0.22 0.58 584.85
S478Q02T "SCIE - P2006 Antibiotics (Q02)" France French Using scientific
evidence S3 54.62 0.24 0.05 534.68
S478Q03T "SCIE - P2006 Antibiotics (Q03)" France French Explaining phenomena
scientifically S3 69.09 0.21 -0.73 462.14
S498Q02T "SCIE - P2006 Experimental Digestion (Q02)" France French Identifying scientific
issues S3 45.01 0.23 0.51 577.58
S498Q03 "SCIE - P2006 Experimental Digestion (Q03)" France French Identifying scientific
issues S3 38.92 0.22 0.75 600.52
S498Q04 "SCIE - P2006 Experimental Digestion (Q04)" France French Using scientific
evidence S3 64.70 0.23 -0.28 1.18 -1.18 490.30 518.83
S514Q02 "SCIE - P2006 Development and Disaster (Q02)" NIER Japanese Using scientific
evidence S1 84.90 0.17 -1.86 357.23
S514Q03 "SCIE - P2006 Development and Disaster (Q03)" NIER Japanese Explaining phenomena
scientifically S1 48.99 0.23 0.29 557.34
S514Q04 "SCIE - P2006 Development and Disaster (Q04)" NIER Japanese Using scientific
evidence S1 55.93 0.24 -0.10 520.79
S519Q01 "SCIE - P2006 Airbags (Q01)" France French Using scientific
evidence S2 39.72 0.20 0.60 0.22 -0.22 549.79 623.08
S519Q02T "SCIE - P2006 Airbags (Q02)" France French Explaining phenomena
scientifically S2 54.80 0.23 0.00 530.21
S519Q03 "SCIE - P2006 Airbags (Q03)" France French Identifying scientific
issues S2 25.40 0.20 1.35 656.56
S521Q02 "SCIE - P2006 Cooking Outdoors (Q02)" ACER English Explaining phenomena
scientifically S2 54.17 0.22 -0.10 521.07
S521Q06 "SCIE - P2006 Cooking Outdoors (Q06)" ACER English Explaining phenomena
scientifically S2 89.17 0.15 -2.14 330.28
S527Q01T "SCIE - P2006 Extinction of the Dinosaurs (Q01)" Korea Korean Using scientific
evidence S2 17.71 0.17 2.09 724.91
S527Q03T "SCIE - P2006 Extinction of the Dinosaurs (Q03)" Korea Korean Explaining phenomena
scientifically S2 57.21 0.22 -0.15 515.85
S527Q04T "SCIE - P2006 Extinction of the Dinosaurs (Q04)" Korea Korean Explaining phenomena
scientifically S2 53.13 0.23 0.00 530.02
[Part 2/2] table a.3 2009 Main study science item classification

MAin Study iteM pool ClASSifiCAtion: Annex A
PISA 2009 TECHNICAL REPORT – © OECD 2012 343
Item parameters (rP=.50)
thresholds (rP=.62) PISa scale
Item unit name Source Language Cluster
Inter- national
% correctSe %
correct delta tau(1) tau(2) tau(3) 1 2 3
E002Q01 Seraing aSPe French -2.72 258.2
E002Q03 Seraing aSPe French -1.34 379.5
E002Q05 Seraing aSPe French 0.63 1.15 -1.15 537.6 565.4
E005Q01 iwanttohelp ACER English -1.54 362.3
E005Q02 iwanttohelp ACER English -0.91 417.1
E005Q03 iwanttohelp ACER English -0.39 462.3
E005Q08 iwanttohelp ACER English 0.57 0.72 -0.72 525.2 567.3
E006Q02 Smell ACER English 0.87 572.4
E006Q05 Smell ACER English 1.84 657.5
E006Q06 Smell ACER English -0.13 485.0
E011Q01AT Cinema ACER English -0.87 420.2
E011Q01BT Cinema ACER English -0.23 0.2 -0.20 441.4 511.2
E012Q01 Job Search ACER English -0.39 462.6
E012Q03T Job Search ACER English 0.53 -0.76 0.76 461.6 623.7
E012Q05 Job Search ACER English 0.7 557.9
E013Q01 Sports Club DIPF German -0.47 455.4
E013Q04 Sports Club DIPF German -0.07 490.5
E013Q07 Sports Club DIPF German 0.63 0.65 -0.65 529.4 574.7
E014Q01 Hay Fever DIPF German 0.69 -0.42 0.42 495.4 618.3
E014Q06 Hay Fever DIPF German 0.68 556.3
E014Q07 Hay Fever DIPF German -0.2 479.5
E014Q11 Hay Fever DIPF German 0.98 582.3
E017Q01 Language Learning DIPF German 0.45 535.8
E017Q04 Language Learning DIPF German -1.83 336.3
E017Q07 Language Learning DIPF German 0.8 -0.43 0.43 505.0
E021Q01 Counterfeiting Canada English/French 0.09 504.5
E021Q04 Counterfeiting Canada English/French -0.51 451.6
E021Q05 Counterfeiting Canada English/French -0.19 480.2
E021Q08 Counterfeiting Canada English/French 2.33 0.19 -1.21 1.02 629.3 665.7 800.8
[Part 1/1] table a.4 2009 Main study dra item classification
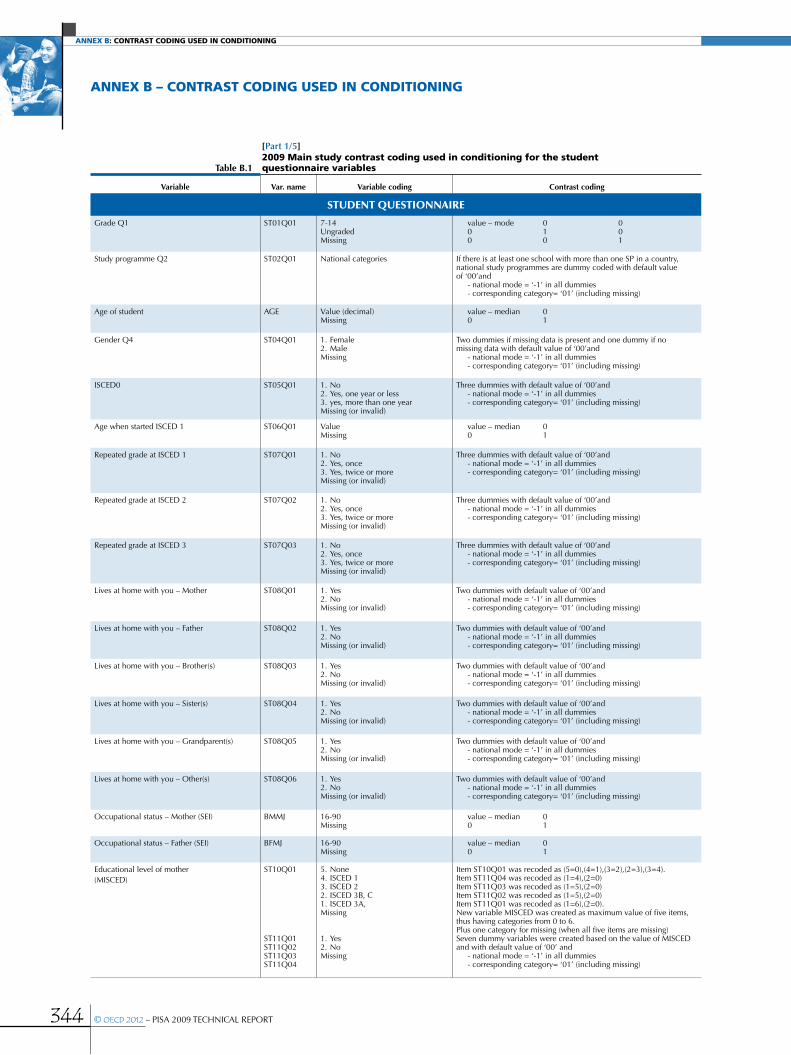
Annex B: ContrAst Coding used in Conditioning
344 © OECD 2012 – PISA 2009 TECHNICAL REPORT
annex b – contraSt coding uSed in conditioning
variable var. name variable coding Contrast coding
STUDENT QUESTIONNAIRE
Grade Q1 ST01Q01 7-14 Ungraded Missing
value – mode 0 0 0 1 0 0 0 1
Study programme Q2 ST02Q01 National categories If there is at least one school with more than one SP in a country, national study programmes are dummy coded with default value of ‘00’and - national mode = ‘-1’ in all dummies - corresponding category= ‘01’ (including missing)
Age of student AGE Value (decimal)Missing
value – median 0 0 1
Gender Q4 ST04Q01 1. Female2. MaleMissing
Two dummies if missing data is present and one dummy if no missing data with default value of ‘00’and - national mode = ‘-1’ in all dummies - corresponding category= ‘01’ (including missing)
ISCED0 ST05Q01 1. No2. Yes, one year or less3. yes, more than one yearMissing (or invalid)
Three dummies with default value of ‘00’and - national mode = ‘-1’ in all dummies - corresponding category= ‘01’ (including missing)
Age when started ISCED 1 ST06Q01 Value Missing
value – median 0 0 1
Repeated grade at ISCED 1 ST07Q01 1. No2. Yes, once3. Yes, twice or moreMissing (or invalid)
Three dummies with default value of ‘00’and - national mode = ‘-1’ in all dummies - corresponding category= ‘01’ (including missing)
Repeated grade at ISCED 2 ST07Q02 1. No2. Yes, once3. Yes, twice or moreMissing (or invalid)
Three dummies with default value of ‘00’and - national mode = ‘-1’ in all dummies - corresponding category= ‘01’ (including missing)
Repeated grade at ISCED 3 ST07Q03 1. No2. Yes, once3. Yes, twice or moreMissing (or invalid)
Three dummies with default value of ‘00’and - national mode = ‘-1’ in all dummies - corresponding category= ‘01’ (including missing)
Lives at home with you – Mother ST08Q01 1. Yes2. NoMissing (or invalid)
Two dummies with default value of ‘00’and - national mode = ‘-1’ in all dummies - corresponding category= ‘01’ (including missing)
Lives at home with you – Father ST08Q02 1. Yes2. NoMissing (or invalid)
Two dummies with default value of ‘00’and - national mode = ‘-1’ in all dummies - corresponding category= ‘01’ (including missing)
Lives at home with you – Brother(s) ST08Q03 1. Yes2. NoMissing (or invalid)
Two dummies with default value of ‘00’and - national mode = ‘-1’ in all dummies - corresponding category= ‘01’ (including missing)
Lives at home with you – Sister(s) ST08Q04 1. Yes2. NoMissing (or invalid)
Two dummies with default value of ‘00’and - national mode = ‘-1’ in all dummies - corresponding category= ‘01’ (including missing)
Lives at home with you – Grandparent(s) ST08Q05 1. Yes2. NoMissing (or invalid)
Two dummies with default value of ‘00’and - national mode = ‘-1’ in all dummies - corresponding category= ‘01’ (including missing)
Lives at home with you – Other(s) ST08Q06 1. Yes2. NoMissing (or invalid)
Two dummies with default value of ‘00’and - national mode = ‘-1’ in all dummies - corresponding category= ‘01’ (including missing)
Occupational status – Mother (SEI) BMMJ 16-90Missing
value – median 0 0 1
Occupational status – Father (SEI) BFMJ 16-90Missing
value – median 0 0 1
Educational level of mother (MISCED)
ST10Q01
ST11Q01ST11Q02ST11Q03ST11Q04
5. None4. ISCED 13. ISCED 22. ISCED 3B, C1. ISCED 3A, Missing
1. Yes2. NoMissing
Item ST10Q01 was recoded as (5=0),(4=1),(3=2),(2=3),(3=4). Item ST11Q04 was recoded as (1=4),(2=0)Item ST11Q03 was recoded as (1=5),(2=0)Item ST11Q02 was recoded as (1=5),(2=0)Item ST11Q01 was recoded as (1=6),(2=0). New variable MISCED was created as maximum value of five items, thus having categories from 0 to 6. Plus one category for missing (when all five items are missing)Seven dummy variables were created based on the value of MISCED and with default value of ‘00’ and - national mode = ‘-1’ in all dummies - corresponding category= ‘01’ (including missing)
[Part 1/5]
table B.12009 Main study contrast coding used in conditioning for the student questionnaire variables

Contrast Coding used in Conditioning: annex B
PISA 2009 TECHNICAL REPORT – © OECD 2012 345
variable var. name variable coding Contrast coding
STUDENT QUESTIONNAIRE
Educational level of father (FISCED)
ST14Q01
ST15Q01ST15Q02ST15Q03ST15Q04
5. None4. ISCED 13. ISCED 22. ISCED 3B, C1. ISCED 3A, Missing
1. Yes2. NoMissing
Item ST14Q01 was recoded as (5=0),(4=1),(3=2),(2=3),(3=4). Item ST15Q04 was recoded as (1=4),(2=0)Item ST15Q03 was recoded as (1=5),(2=0)Item ST15Q02 was recoded as (1=5),(2=0)Item ST15Q01 was recoded as (1=6),(2=0). New variable FISCED was created as maximum value of five items, thus having categories from 0 to 6. Plus one category for missing (when all five items are missing)Seven dummy variables were created based on the value of FISCED and with default value of ‘00’ and - national mode = ‘-1’ in all dummies - corresponding category= ‘01’ (including missing)
What mother is currently doing ST12Q01 1. Working full-time2. Working part-time3. Not working, looking 4. OtherMissing (or invalid)
Four dummy variables with default value of ‘00’and - national mode = ‘-1’ in all dummies - corresponding category= ‘01’ (including missing)
What father is currently doing ST16Q01 1. Working full-time2. Working part-time3. Not working, looking 4. OtherMissing (or invalid)
Four dummy variables with default value of ‘00’and - national mode = ‘-1’ in all dummies - corresponding category= ‘01’ (including missing)
Immigration status (IMMIG) ST17int(CTSELF)(CTFATHER)(CTMOTHER)
1. Native2. Second-Generation3. First-GenerationMissing
Three dummy variables with default value of ‘00’and - national mode = ‘-1’ in all dummies - corresponding category= ‘01’ (including missing)
Country arrival age ST18Q01 ValueN/A (born in country)Missing (or >17)
(copy) 0 0 0 0 -1
Language at home (Q19) ST19int 1. Language of test2. Other languageMissing
-1 -1 01 00 00 01
Family wealth (WEALTH)
ST20Q02ST20Q06ST20Q13ST20Q14ST20Q15ST20Q16ST20Q17
ST21Q01ST21Q02ST21Q03ST21Q04ST21Q05
1. Yes2. NoMissing
1. None2. One3. Two4. Three or more
All items of Q20 were recoded as (Yes=1, No=0) and all items of Q21 were recoded as (1=0,2=1,3=2,4=3). Total score was calculated as a ratio of a sum of all items over maximum score of valid responses (items with missing value did not contribute to max score). Two dummy variables were created as follows: Value value – mean 0 Missing 0 1
Home educational resources (HEDRES)
ST20Q01ST20Q03ST20Q04ST20Q05ST20Q10ST20Q11ST20Q12
1. Yes2. NoMissing
All items were recoded as (Yes=1, No=0). Total score was calculated as a ratio of a sum of all items over maximum score of valid responses (items with missing value did not contribute to max score). Two dummy variables were created as follows: Value value – mean 0 Missing 0 1
Cultural possessions at home(CULTPOSS)
ST20Q07ST20Q08ST20Q09
1. Yes2. NoMissing
All items were recoded as (Yes=1, No=0). Total score was calculated as a ratio of a sum of all items over maximum score of valid responses (items with missing value did not contribute to max score). Two dummy variables were created as follows: Value value – mean 0 Missing 0 1
How many books at home ST22Q01 1. 0-10 books2. 11-25 books3. 26-100 books4. 101-200 books5. 201-500 books6. More than 500 booksMissing
Six dummy variables with default value of ‘00’and - national mode = ‘-1’ in all dummies - corresponding category= ‘01’ (including missing)
Time spent reading for enjoyment ST23Q01 1. Don’t read to enjoy2. 30 min or less a day3. 30 to 60 min a day4. 1 to 2 hours a day5. > 2 hours a dayMissing
Value value – median 0 Missing 0 1
Enjoyment of reading (JOYREAD)
ST24Q01ST24Q02ST24Q03ST24Q04ST24Q05ST24Q06ST24Q07ST24Q08ST24Q09ST24Q10ST24Q11
1. Strongly disagree2. Disagree3. Agree4. Strongly disagreeMissing
Items 02, 04, 06, 08, 09 were reversely recoded as (4=0),(3=1),(2=2),(1=3). All other items were recoded as (1=0),(2=1),(3=2),(4=3). Total score was calculated as a ratio of a sum of all questions over maximum score of valid responses (questions with missing value did not contribute to max score). Two dummy variables were created as follows: Value value – mean 0 Missing 0 1
[Part 2/5]
table B.12009 Main study contrast coding used in conditioning for the student questionnaire variables

Annex B: ContrAst Coding used in Conditioning
346 © OECD 2012 – PISA 2009 TECHNICAL REPORT
variable var. name variable coding Contrast coding
STUDENT QUESTIONNAIRE
Diversity in reading (DIVREAD)
ST25Q01ST25Q02ST25Q03ST25Q04ST25Q05
1. Never or almost never2. A few times a year3. About once a month4. Several times a month5. Several times a week Missing
All items were recoded as (1=0),(2=1),(3=2),(4=3),(5=4). Total score was calculated as a ratio of a sum of all questions over maximum score of valid responses (questions with missing value did not contribute to max score). Two dummy variables were created as follows: Value value – mean 0 Missing 0 1
Online reading activities (ONLNREAD)
ST26Q01ST26Q02ST26Q03ST26Q04ST26Q05ST26Q06ST26Q07
1. I don’t know what it is2. Never or almost never3. Several times a month4. Several times a week5. Several times a day Missing
All items were recoded as (1=0),(2=1),(3=2),(4=3),(5=4). Total score was calculated as a ratio of a sum of all questions over maximum score of valid responses (questions with missing value did not contribute to max score). Two dummy variables were created as follows: Value value – mean 0 Missing 0 1
Memorisation (MEMOR)
ST27Q01ST27Q03ST27Q05ST27Q07
1. Almost never2. Sometimes3. Often4. Almost alwaysMissing
All items were recoded as (1=0),(2=1),(3=2),(4=3). Total score was calculated as a ratio of a sum of all questions over maximum score of valid responses (questions with missing value did not contribute to max score). Two dummy variables were created as follows: Value value – mean 0 Missing 0 1
Elaboration (ELAB)
ST27Q04ST27Q08ST27Q10ST27Q12
1. Almost never2. Sometimes3. Often4. Almost alwaysMissing
All items were recoded as (1=0),(2=1),(3=2),(4=3). Total score was calculated as a ratio of a sum of all questions over maximum score of valid responses (questions with missing value did not contribute to max score). Two dummy variables were created as follows: Value value – mean 0 Missing 0 1
Control strategies (CSTRAT)
ST27Q02ST27Q06ST27Q09ST27Q11ST27Q13
1. Almost never2. Sometimes3. Often4. Almost alwaysMissing
All items were recoded as (1=0),(2=1),(3=2),(4=3). Total score was calculated as a ratio of a sum of all questions over maximum score of valid responses (questions with missing value did not contribute to max score). Two dummy variables were created as follows: Value value – mean 0 Missing 0 1
Average time per week on LANGUAGE(LMINS)
ST28Q01ST29Q01
ValueMissing
The value is the product of ST28Q01*ST29Q01. Two dummy variable were created as follows: Value value – mean 0 Missing 0 1
Average time per week on MATH(MMINS)
ST28Q02ST29Q02
ValueMissing
The value is the product of ST28Q02*ST29Q02. Two dummy variable were created as follows: Value value – median 0 Missing 0 1
Average time per week on SCIENCE(SMINS)
ST28Q03ST29Q03
ValueMissing
The value is the product of ST28Q03*ST29Q03. Two dummy variable were created as follows: Value value – median 0 Missing 0 1
Total number of classes per week (DELETED from conditioning)
ST30Q01 Value Missing
value – median 0 0 1
Out of school lessons (Q31) - enrichment in LANGUAGE
ST31Q01 1. Yes2. NoMissing
Two dummy variables with default value of ‘00’and - national mode = ‘-1’ in both dummies - corresponding category= ‘01’ (including missing)
Out of school lessons (Q31) - enrichment in MATH
ST31Q02 1. Yes2. NoMissing
Two dummy variables with default value of ‘00’and - national mode = ‘-1’ in both dummies - corresponding category= ‘01’ (including missing)
Out of school lessons (Q31) - enrichment in SCIENCE
ST31Q03 1. Yes2. NoMissing
Two dummy variables with default value of ‘00’and - national mode = ‘-1’ in both dummies - corresponding category= ‘01’ (including missing)
Out of school lessons (Q31) - enrichment in OTHER SUBJECTS
ST31Q04 1. Yes2. NoMissing
Two dummy variables with default value of ‘00’and - national mode = ‘-1’ in both dummies - corresponding category= ‘01’ (including missing)
Out of school lessons (Q31) - remedial in LANGUAGE
ST31Q05 1. Yes2. NoMissing
Two dummy variables with default value of ‘00’and - national mode = ‘-1’ in both dummies - corresponding category= ‘01’ (including missing)
Out of school lessons (Q31) - remedial in MATH
ST31Q06 1. Yes2. NoMissing
Two dummy variables with default value of ‘00’and - national mode = ‘-1’ in both dummies - corresponding category= ‘01’ (including missing)
Out of school lessons (Q31) - remedial in SCIENCE
ST31Q07 1. Yes2. NoMissing
Two dummy variables with default value of ‘00’and - national mode = ‘-1’ in both dummies - corresponding category= ‘01’ (including missing)
Out of school lessons (Q31) - remedial in OTHER SUBJECTS
ST31Q08 1. Yes2. NoMissing
Two dummy variables with default value of ‘00’and - national mode = ‘-1’ in both dummies - corresponding category= ‘01’ (including missing)
Out of school lessons (Q31) - improve skills
ST31Q09 1. Yes2. NoMissing
Two dummy variables with default value of ‘00’and - national mode = ‘-1’ in both dummies - corresponding category= ‘01’ (including missing)
[Part 3/5]
table B.12009 Main study contrast coding used in conditioning for the student questionnaire variables

Contrast Coding used in Conditioning: annex B
PISA 2009 TECHNICAL REPORT – © OECD 2012 347
variable var. name variable coding Contrast coding
STUDENT QUESTIONNAIRE
How many hours attending out of school lessons in LANGUAGE
ST32Q01 1. Do not attend2. <2 hours a week3. 2 to 4 hours a week4. 4 to 6 hours a week5. >6 hours a weekMissing
Items were recoded as (1=0),(2=1),(3=3),(4=5),(5=7). Two dummy variable were created as follows: Value value – median 0 Missing 0 1
How many hours attending out of school lessons in MATH
ST32Q02 1. Do not attend2. <2 hours a week3. 2 to 4 hours a week4. 4 to 6 hours a week5. >6 hours a weekMissing
Items were recoded as (1=0),(2=1),(3=3),(4=5),(5=7). Two dummy variable were created as follows: Value value – median 0 Missing 0 1
How many hours attending out of school lessons in SCIENCE
ST32Q03 1. Do not attend2. <2 hours a week3. 2 to 4 hours a week4. 4 to 6 hours a week5. >6 hours a weekMissing
Items were recoded as (1=0),(2=1),(3=3),(4=5),(5=7). Two dummy variable were created as follows: Value value – median 0 Missing 0 1
How many hours attending out of school lessons in OTHER SUBJECTS
ST32Q04 1. Do not attend2. <2 hours a week3. 2 to 4 hours a week4. 4 to 6 hours a week5. >6 hours a weekMissing
Items were recoded as (1=0),(2=1),(3=3),(4=5),(5=7). Two dummy variable were created as follows: Value value – median 0 Missing 0 1
Attitude towards school (ATSCHL)
ST33Q01ST33Q02ST33Q03ST33Q04
1. Strongly disagree2. Disagree3. Agree4. Strongly agreeMissing
Items 01 and 02 were recoded as (1=3),(2=2),(3=1),(4=0).Items 03 and 04 were recoded as (1=0),(2=1),(3=2),(4=3).Total score was calculated as a ratio of a sum of all questions over maximum score of valid responses (questions with missing value did not contribute to max score). Two dummy variables were created as follows: Value value – mean 0 Missing 0 1
Teacher-student relation (STUDREL)
ST34Q01ST34Q02ST34Q03ST34Q04ST34Q05
1. Strongly disagree2. Disagree3. Agree4. Strongly agreeMissing
Items were recoded as (1=0),(2=1),(3=2),(4=3).Total score was calculated as a ratio of a sum of all questions over maximum score of valid responses (questions with missing value did not contribute to max score). Two dummy variables were created as follows: Value value – mean 0 Missing 0 1
Students in language class(DELETED from conditioning)
ST35Q01 ValueMissing
value – median 0 0 1
Disciplinary climate (DISCLIM)
ST36Q01ST36Q02ST36Q03ST36Q04ST36Q05
1. Never or hardly ever2. Some lessons3. In most lessons4. In all lessonsMissing
Items were reverse recoded as (1=3),(2=2),(3=1),(4=0).Total score was calculated as a ratio of a sum of all questions over maximum score of valid responses (questions with missing value did not contribute to max score). Two dummy variables were created as follows: Value value – mean 0 Missing 0 1
Teacher stimulation of reading engagement (STIMREAD)
ST37Q01ST37Q02ST37Q03ST37Q04ST37Q05ST37Q06ST37Q07
1. Never or hardly ever2. Some lessons3. In most lessons4. In all lessonsMissing
Items were recoded as (1=0),(2=1),(3=2),(4=3).Total score was calculated as a ratio of a sum of all questions over maximum score of valid responses (questions with missing value did not contribute to max score). Two dummy variables were created as follows: Value value – mean 0 Missing 0 1
Use of structuring and scaffolding strategies (STRCSTRAT)
ST38Q01ST38Q02ST38Q03ST38Q04ST38Q05ST38Q06ST38Q07ST38Q08ST38Q09
1. Never or hardly ever2. Some lessons3. In most lessons4. In all lessonsMissing
Items were recoded as (1=0),(2=1),(3=2),(4=3).Total score was calculated as a ratio of a sum of all questions over maximum score of valid responses (questions with missing value did not contribute to max score). Two dummy variables were created as follows: Value value – mean 0 Missing 0 1
Libraries (LIBUSE)
ST39Q01ST39Q02ST39Q03ST39Q04ST39Q05ST39Q06ST39Q07
1. Never2. A few times a year3. Once a month4. Several a month5. Several times a weekMissing
Items were recoded as (1=0),(2=1),(3=2),(4=3),(5=4).Total score was calculated as a ratio of a sum of all questions over maximum score of valid responses (questions with missing value did not contribute to max score). Two dummy variables were created as follows: Value value – mean 0 Missing 0 1
Does your school have a library ST40Q01 1. Yes2. NoMissing
Two dummy variables with default value of ‘00’and - national mode = ‘-1’ in both dummies - corresponding category= ‘01’ (including missing)
[Part 4/5]
table B.12009 Main study contrast coding used in conditioning for the student questionnaire variables

Annex B: ContrAst Coding used in Conditioning
348 © OECD 2012 – PISA 2009 TECHNICAL REPORT
variable var. name variable coding Contrast coding
STUDENT QUESTIONNAIRE
Meta-cognition: understanding and remembering (UNDREM)
ST41Q01ST41Q02ST41Q03ST41Q04ST41Q05ST41Q06
1. Not useful at all2. 3. 4. 5. 6. Very usefulMissing
Total score was calculated as a ratio of a sum of positive outcomes of nine pair wise items comparisons over maximum score of valid pairs (pairs with one or both missing values did not contribute to max score). The pairs wise comparisons used:ST41Q03>ST41Q01ST41Q03>ST41Q02ST41Q03>ST41Q06ST41Q04>ST41Q01ST41Q04>ST41Q02ST41Q04>ST41Q06ST41Q05>ST41Q01ST41Q05>ST41Q02ST41Q05>ST41Q06Two dummy variables were created as follows: Value value – mean 0 Missing 0 1
Meta-cognition: summarising(METASUM)
ST42Q01ST42Q02ST42Q03ST42Q04ST42Q05
1. Not useful at all2. 3. 4. 5. 6. Very usefulMissing
Total score was calculated as a ratio of a sum of positive outcomes of nine pair wise items comparisons over maximum score of valid pairs (pairs with one or both missing values did not contribute to max score). The pairs wise comparisons used:ST42Q04>ST42Q01ST42Q04>ST42Q03ST42Q04>ST42Q02ST42Q05>ST42Q01ST42Q05>ST42Q03ST42Q05>ST42Q02ST42Q01>ST42Q02ST42Q03>ST42Q02Two dummy variables were created as follows: Value value – mean 0 Missing 0 1
variable var. name variable coding Contrast coding
READING FOR SCHOOL
Interpretation of literary texts (RFSINTRP)
RFS1Q04 RFS2Q02 RFS2Q03 RFS2Q05
1. Many times2. Two or three times3. Once4. Not at allMissing
Items were recoded as (4=0),(3=1),(2=2),(1=3).Total score was calculated as a ratio of a sum of all questions over maximum score of valid responses (questions with missing value did not contribute to max score). Two dummy variables were created as follows: Value value – mean 0 Missing 0 1
Non-continuous materials (RFSNCONT)
RFS1Q03 RFS1Q07 RFS2Q01 RFS2Q08
1. Many times2. Two or three times3. Once4. Not at allMissing
Items were recoded as (4=0),(3=1),(2=2),(1=3).Total score was calculated as a ratio of a sum of all questions over maximum score of valid responses (questions with missing value did not contribute to max score). Two dummy variables were created as follows: Value value – mean 0 Missing 0 1
Traditional literature(RFSTRLIT)
RFS1Q01 RFS1Q02 RFS2Q04 RFS2Q06 RFS2Q07
1. Many times2. Two or three times3. Once4. Not at allMissing
Items were recoded as (4=0),(3=1),(2=2),(1=3).Total score was calculated as a ratio of a sum of all questions over maximum score of valid responses (questions with missing value did not contribute to max score). Two dummy variables were created as follows: Value value – mean 0 Missing 0 1
Use of functional materials (RFSFUMAT)
RFS1R05 RFS1R06 RFS1R08
1. Many times2. Two or three times3. Once4. Not at all Missing
Items were recoded as (4=0),(3=1),(2=2),(1=3).Total score was calculated as a ratio of a sum of all questions over maximum score of valid responses (questions with missing value did not contribute to max score). Two dummy variables were created as follows: Value value – mean 0 Missing 0 1
[Part 5/5]
table B.12009 Main study contrast coding used in conditioning for the student questionnaire variables
[Part 1/1]
table B.22009 Main study contrast coding used in conditioning for the reading for school questionnaire variables

Contrast Coding used in Conditioning: annex B
PISA 2009 TECHNICAL REPORT – © OECD 2012 349
variable var. name variable coding Contrast coding
ICT QUESTIONNAIRE
ICT availability at home (ICTHOME)
IC01Q01IC01Q02IC01Q03IC01Q04IC01Q05IC01Q06IC01Q07IC01Q08
1. Yes, and I use it2. Yes, but I don’t use it3. NoMissing
Items were recoded as (3=0),(2=1),(1=2).Total score was calculated as a ratio of a sum of all questions over maximum score of valid responses (questions with missing value did not contribute to max score). Two dummy variables were created as follows: Value value – mean 0 Missing 0 1
ICT availability at school (ICTSCH)
IC02Q01IC02Q02IC02Q03IC02Q04IC02Q05
1. Yes, and I use it2. Yes, but I don’t use it3. NoMissing
Items were recoded as (3=0),(2=1),(1=2).Total score was calculated as a ratio of a sum of all questions over maximum score of valid responses (questions with missing value did not contribute to max score). Two dummy variables were created as follows: Value value – mean 0 Missing 0 1
Have you ever used a computer IC03Q01 1. Yes2. NoMissing
Two dummy variables with default value of ‘00’and - national mode = ‘-1’ in both dummies - corresponding category= ‘01’ (including missing)
ICT internet/entertainment use (ENTUSE)
IC04Q01IC04Q02IC04Q03IC04Q04IC04Q05IC04Q06IC04Q07IC04Q08IC04Q09
1. Never or hardly ever2. Once or twice a month3. Once or twice a week4. Every day or almost Missing
Items were recoded as (1=0),(2=1),(3=2),(4=3).Total score was calculated as a ratio of a sum of all questions over maximum score of valid responses (questions with missing value did not contribute to max score). Two dummy variables were created as follows: Value value – mean 0 Missing 0 1
ICT for school-related tasks (HOMSCH)
IC05Q01IC05Q02IC05Q03IC05Q04IC05Q05
1. Never or hardly ever2. Once or twice a month3. Once or twice a week4. Every day or almost Missing
Items were recoded as (1=0),(2=1),(3=2),(4=3).Total score was calculated as a ratio of a sum of all questions over maximum score of valid responses (questions with missing value did not contribute to max score). Two dummy variables were created as follows: Value value – mean 0 Missing 0 1
Use of ICT for school (USESCH)
IC06Q01IC06Q02IC06Q03IC06Q04IC06Q05IC06Q06IC06Q07IC06Q08IC06Q09
1. Never or hardly ever2. Once or twice a month3. Once or twice a week4. Every day or almost Missing
Items were recoded as (1=0),(2=1),(3=2),(4=3).Total score was calculated as a ratio of a sum of all questions over maximum score of valid responses (questions with missing value did not contribute to max score). Two dummy variables were created as follows: Value value – mean 0 Missing 0 1
Time using computer during classroom lessons in LANGUAGE
IC07Q01 1. No time2. 0-30 min a week3. 31-60 min a week4. >60 min a weekMissing
Items were recoded as (1=0),(2=3),(3=6),(4=8). Two dummy variable were created as follows: Value value – median 0 Missing 0 1
Time using computer during classroom lessons in MATH
IC07Q02 1. No time2. 0-30 min a week3. 31-60 min a week4. >60 min a weekMissing
Items were recoded as (1=0),(2=3),(3=6),(4=8). Two dummy variable were created as follows: Value value – median 0 Missing 0 1
Time using computer during classroom lessons in SCIENCE
IC07Q03 1. No time2. 0-30 min a week3. 31-60 min a week4. >60 min a weekMissing
Items were recoded as (1=0),(2=3),(3=6),(4=8). Two dummy variable were created as follows: Value value – median 0 Missing 0 1
Time using computer during classroom lessons in FOREIGN LANGUAGE
IC07Q04 1. No time2. 0-30 min a week3. 31-60 min a week4. >60 min a weekMissing
Items were recoded as (1=0),(2=3),(3=6),(4=8). Two dummy variable were created as follows: Value value – median 0 Missing 0 1
Self-confidence in ICT high level tasks(HIGHCONF)
IC08Q01IC08Q02IC08Q03IC08Q04IC08Q05
1. I can do this very well myself2. I can do this with help from someone3. I know what this means, but can’t do this4. I don’t know what this meansMissing
Items were recoded as (1=3),(2=2),(3=1),(4=0).Two dummy variable were created as follows: Value value – median 0 Missing 0 1
Time using computer outside classroom lessons
IC09Q01 1. Never use computer outside classroom2. About 0.5 hour a week3. About an hour a week4. About 2 hours a week5. About 3 hours a week6. About 4 hours a week or moreMissing
Items were recoded as (1=0),(2=1),(3=2),(4=4),(5=6),(6=8).Two dummy variable were created as follows: Value value – median 0 Missing 0 1
Attitude towards computers (ATTCOMP)
IC10Q01IC10Q02IC10Q03IC10Q04
1. Strongly disagree2. Disagree3. Agree4. Strongly agreeMissing
Items were recoded as (1=0),(2=1),(3=2),(4=3).Total score was calculated as a ratio of a sum of all questions over maximum score of valid responses (questions with missing value did not contribute to max score). Two dummy variables were created as follows: Value value – mean 0 Missing 0 1
[Part 1/1] table B.3 2009 Main study contrast coding used in conditioning for the ict questionnaire variables
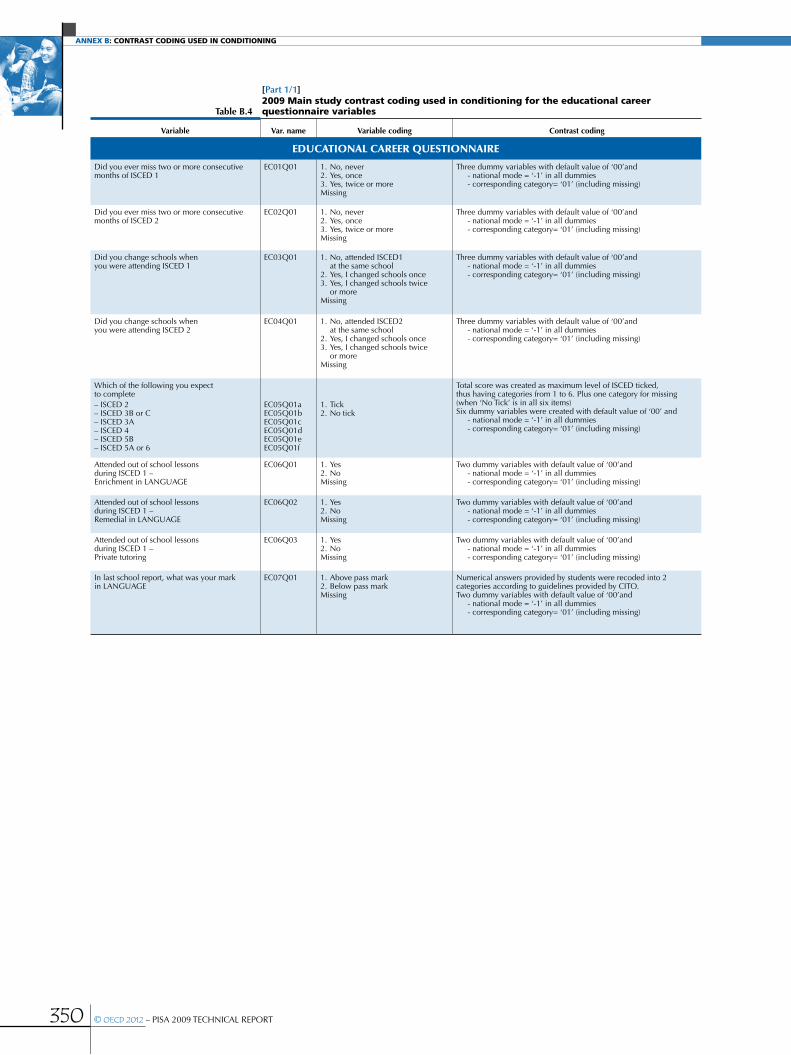
Annex B: ContrAst Coding used in Conditioning
350 © OECD 2012 – PISA 2009 TECHNICAL REPORT
variable var. name variable coding Contrast coding
EDUCATIONAL CAREER QUESTIONNAIRE
Did you ever miss two or more consecutive months of ISCED 1
EC01Q01 1. No, never2. Yes, once3. Yes, twice or moreMissing
Three dummy variables with default value of ‘00’and - national mode = ‘-1’ in all dummies - corresponding category= ‘01’ (including missing)
Did you ever miss two or more consecutive months of ISCED 2
EC02Q01 1. No, never2. Yes, once3. Yes, twice or moreMissing
Three dummy variables with default value of ‘00’and - national mode = ‘-1’ in all dummies - corresponding category= ‘01’ (including missing)
Did you change schools when you were attending ISCED 1
EC03Q01 1. No, attended ISCED1 at the same school2. Yes, I changed schools once3. Yes, I changed schools twice or moreMissing
Three dummy variables with default value of ‘00’and - national mode = ‘-1’ in all dummies - corresponding category= ‘01’ (including missing)
Did you change schools when you were attending ISCED 2
EC04Q01 1. No, attended ISCED2 at the same school2. Yes, I changed schools once3. Yes, I changed schools twice or moreMissing
Three dummy variables with default value of ‘00’and - national mode = ‘-1’ in all dummies - corresponding category= ‘01’ (including missing)
Which of the following you expect to complete – ISCED 2– ISCED 3B or C– ISCED 3A– ISCED 4– ISCED 5B– ISCED 5A or 6
EC05Q01aEC05Q01bEC05Q01cEC05Q01dEC05Q01eEC05Q01f
1. Tick2. No tick
Total score was created as maximum level of ISCED ticked, thus having categories from 1 to 6. Plus one category for missing (when ‘No Tick’ is in all six items)Six dummy variables were created with default value of ‘00’ and - national mode = ‘-1’ in all dummies - corresponding category= ‘01’ (including missing)
Attended out of school lessons during ISCED 1 – Enrichment in LANGUAGE
EC06Q01 1. Yes2. NoMissing
Two dummy variables with default value of ‘00’and - national mode = ‘-1’ in all dummies - corresponding category= ‘01’ (including missing)
Attended out of school lessons during ISCED 1 – Remedial in LANGUAGE
EC06Q02 1. Yes2. NoMissing
Two dummy variables with default value of ‘00’and - national mode = ‘-1’ in all dummies - corresponding category= ‘01’ (including missing)
Attended out of school lessons during ISCED 1 – Private tutoring
EC06Q03 1. Yes2. NoMissing
Two dummy variables with default value of ‘00’and - national mode = ‘-1’ in all dummies - corresponding category= ‘01’ (including missing)
In last school report, what was your mark in LANGUAGE
EC07Q01 1. Above pass mark2. Below pass markMissing
Numerical answers provided by students were recoded into 2 categories according to guidelines provided by CITO.Two dummy variables with default value of ‘00’and - national mode = ‘-1’ in all dummies - corresponding category= ‘01’ (including missing)
[Part 1/1]
table B.42009 Main study contrast coding used in conditioning for the educational career questionnaire variables

Contrast Coding used in Conditioning: annex B
PISA 2009 TECHNICAL REPORT – © OECD 2012 351
variable var. name variable coding Contrast coding
PARENT QUESTIONNAIRE
Who will complete this questionnaire – mother or female guardian
PA01Q01 1. Tick2. No tickMissing (N/A)
Two dummy variables with default value of ‘00’and - national mode = ‘-1’ in all dummies - corresponding category= ‘01’ (including missing)
Who will complete this questionnaire – father or male guardian
PA01Q02 1. Tick2. No tickMissing (N/A)
Two dummy variables with default value of ‘00’and - national mode = ‘-1’ in all dummies - corresponding category= ‘01’ (including missing)
Who will complete this questionnaire – other PA01Q03 1. Tick2. No tickMissing (N/A)
Two dummy variables with default value of ‘00’and - national mode = ‘-1’ in all dummies - corresponding category= ‘01’ (including missing)
Did your child participate in child care before ISCED 0
PA02Q01 1. Yes2. NoMissing
Two dummy variables with default value of ‘00’and - national mode = ‘-1’ in all dummies - corresponding category= ‘01’ (including missing)
Parental support of child’s reading literacy at beginning of ISCED 1 (PRESUPP)
PA03Q01PA03Q02PA03Q03PA03Q04PA03Q05PA03Q06PA03Q07PA03Q08PA03Q09
1. Never or hardly ever2. Once or twice a month3. Once or twice a week4. Every day or almostMissing
Items were recoded as (1=0),(2=1),(3=2),(4=3).Total score was calculated as a ratio of a sum of all questions over maximum score of valid responses (questions with missing value did not contribute to max score). Two dummy variables were created as follows: Value value – mean 0 Missing 0 1
In what language activities in Q3 take place
PA04Q01 1. Test language2. Another languageMissing
Two dummy variables with default value of ‘00’and - national mode = ‘-1’ in all dummies - corresponding category= ‘01’ (including missing)
When at home, how much time do you spend reading for your own enjoyment
PA05Q01 1. >10 hours a week2. 6-10 hours a week3. 1-5 hours a week4. <1 hour a week
Items were recoded as (1=12),(2=7),(3=3),(4=1). Two dummy variable were created as follows: Value value – median 0 Missing 0 1
Motivational attributes of parent own reading engagement (MOTREAD)
PA06Q01PA06Q02PA06Q03PA06Q04
1. Strongly agree2. Agree3. Disagree4. Strongly disagreeMissing
Item 03 was reversely recoded as (1=0),(2=1),(3=2),(4=3).Items 01, 02, 04 were recoded as (1=3),(2=2),(3=1),(4=0).Total score was calculated as a ratio of a sum of all questions over maximum score of valid responses (questions with missing value did not contribute to max score). Two dummy variables were created as follows: Value value – mean 0 Missing 0 1
Student’ reading resources at home (READRES) PA07Q01PA07Q02PA07Q03PA07Q04PA07Q05PA07Q06
1. Yes2. NoMissing
Items were recoded as (1=1),(2=0).Total score was calculated as a ratio of a sum of all questions over maximum score of valid responses (questions with missing value did not contribute to max score). Two dummy variables were created as follows: Value value – mean 0 Missing 0 1
Parents current support of child’s reading literacy (CURSUPP)
PA08Q01PA08Q02PA08Q03PA08Q06PA08Q07PA08Q08
1. Never or hardly ever2. Once or twice a month3. Once or twice a week4. Everyday or almost
Items were recoded as (1=0),(2=1),(3=2),(4=3).Total score was calculated as a ratio of a sum of all questions over maximum score of valid responses (questions with missing value did not contribute to max score). Two dummy variables were created as follows: Value value – mean 0 Missing 0 1
How often do you do the following things with your child- Eat with your child around the table
PA08Q04 1. Never or hardly ever2. Once or twice a month3. Once or twice a week4. Everyday or almost
Items were recoded as (1=0),(2=1),(3=2),(4=3). Two dummy variable were created as follows: Value value – median 0 Missing 0 1
How often do you do the following things with your child- Spend time just talking to your child
PA08Q05 1. Never or hardly ever2. Once or twice a month3. Once or twice a week4. Everyday or almost
Items were recoded as (1=0),(2=1),(3=2),(4=3). Two dummy variable were created as follows: Value value – median 0 Missing 0 1
Does the child’s father have any of the following qualifications- ISCED 5A, 6- ISCED 5B- ISCED 4- ISCED 3A
(PQFISCED)
PA09Q01PA09Q02PA09Q03PA09Q04
1. Yes2. NoMissing
Item 01 was recoded as (1=3),(2=0).Item 02 was recoded as (1=2),(2=0).Items 03 and 04 were recoded as (1=1),(2=0).Total score was created as maximum value in items 01-04, thus having categories from 0 to 3. Plus one category for missing (when all items are missing).Four dummy variables were created with default value of ‘00’ and - national mode = ‘-1’ in all dummies - corresponding category= ‘01’ (including missing)
Does the child’s mother have any of the following qualifications- ISCED 5A, 6- ISCED 5B- ISCED 4- ISCED 3A
(PQMISCED)
PA10Q01PA10Q02PA10Q03PA10Q04
1. Yes2. NoMissing
Item 01 was recoded as (1=3),(2=0).Item 02 was recoded as (1=2),(2=0).Items 03 and 04 were recoded as (1=1),(2=0).Total score was created as maximum value in items 01-04, thus having categories from 0 to 3. Plus one category for missing (when all items are missing).Four dummy variables were created with default value of ‘00’ and - national mode = ‘-1’ in all dummies - corresponding category= ‘01’ (including missing)
[Part 1/2]
table B.52009 Main study contrast coding used in conditioning for the parent questionnaire variables

Annex B: ContrAst Coding used in Conditioning
352 © OECD 2012 – PISA 2009 TECHNICAL REPORT
variable var. name variable coding Contrast coding
PARENT QUESTIONNAIRE
What is your annual household income PA11Q01 1. Less than $A2. $A or more, but <$B3. $B or more, but <$C4. $C or more, but <$D5. $D or more, but <$E6. $E or more Missing
Items were recoded as (1=0),(2=1),(3=2),(4=3),(5=4),(6=5). Two dummy variable were created as follows: Value value – median 0 Missing 0 1
In the last 12 months, about how much would you have paid to educational providers for services
PA12Q01 1. Nothing2. >$0, but <$W3. $W or more, but <$X4. $X or more, but <$Y5. $Y or more, but <$Z6. $Z or moreMissing
Items were recoded as (1=0),(2=1),(3=2),(4=3),(5=4),(6=5). Two dummy variable were created as follows: Value value – median 0 Missing 0 1
How many children are there in your household
PA13Q01 1. One2. Two3. Three4. Four5. Five6. Six or moreMissing (or invalid)
Items were recoded as (1=0),(2=1),(3=2),(4=3),(5=4),(6=5). Two dummy variable were created as follows: Value value – median 0 Missing 0 1
Parents’ perception of school quality(PQSCHOOL)
PA14Q01PA14Q02PA14Q03PA14Q04PA14Q05PA14Q06PA14Q07
1. Strongly agree2. Agree3. Disagree4. Strongly disagreeMissing
Items were recoded as (1=3),(2=2),(3=1),(4=0).Total score was calculated as a ratio of a sum of all questions over maximum score of valid responses (questions with missing value did not contribute to max score). Two dummy variables were created as follows: Value value – mean 0 Missing 0 1
Parental involvement in their child’s school (PARINVOL)
PA15Q01PA15Q02PA15Q03PA15Q04PA15Q05PA15Q06PA15Q07PA15Q08
1. Yes2. NoMissing
Items were recoded as (1=1),(2=0).Total score was calculated as a ratio of a sum of all questions over maximum score of valid responses (questions with missing value did not contribute to max score). Two dummy variables were created as follows: Value value – mean 0 Missing 0 1
Which of the following best describes the schooling available to students in your location
PA16Q01 1. Two more other schools2. One more other school3. No other schoolsMissing
Items were recoded as (1=2),(2=1),(3=0). Two dummy variable were created as follows: Value value – median 0 Missing 0 1
How important are following reasons for choosing a school for your child
PA17Q01PA17Q02PA17Q03PA17Q04PA17Q05PA17Q06PA17Q07PA17Q08PA17Q09PA17Q10PA17Q11
1. Not important2. Somewhat important3. Important4. Very importantMissing
Items were recoded as (1=0),(2=1),(3=2),(4=3).Two dummy variable were created as follows: Value value – median 0 Missing 0 1
variable var. name variable coding Contrast coding
OTHER VARIABLES
School identification number SCHOOLID Unique 5-digit school ID IDs for small schools (less than 8 students) were recoded into ‘99999’ for schools which did not administer UH booklet to students, ‘99998’ for schools which administered UH booklet to all students and ‘99997’ for schools which administered both UH and normal booklet to all studentsTotal number of schools minus one dummies were created for school membership with default value of ‘00’ and - largest school in the country = ‘-1’ in all dummies - corresponding SCHOOLID= ‘01’ .
Booklet number BOOKID 1 or 21 . . . . . . . . . . . . . . . . . . . . . . .2 or 22 . . . . . . . . . . . . . . . . . . . . . . .3 or 23 . . . . . . . . . . . . . . . . . . . . . . .4 or 24 . . . . . . . . . . . . . . . . . . . . . . .5 or 25 . . . . . . . . . . . . . . . . . . . . . . .6 or 26 . . . . . . . . . . . . . . . . . . . . . . .7 or 27 . . . . . . . . . . . . . . . . . . . . . . .8. . . . . . . . . . . . . . . . . . . . . . . . . . . .9. . . . . . . . . . . . . . . . . . . . . . . . . . . .10. . . . . . . . . . . . . . . . . . . . . . . . . . .11. . . . . . . . . . . . . . . . . . . . . . . . . . .12. . . . . . . . . . . . . . . . . . . . . . . . . . .13. . . . . . . . . . . . . . . . . . . . . . . . . . .20 (UH) . . . . . . . . . . . . . . . . . . . . . .
01 00 00 00 00 00 00 00 00 00 00 0000 01 00 00 00 00 00 00 00 00 00 0000 00 01 00 00 00 00 00 00 00 00 0000 00 00 01 00 00 00 00 00 00 00 0000 00 00 00 01 00 00 00 00 00 00 0000 00 00 00 00 01 00 00 00 00 00 0000 00 00 00 00 00 01 00 00 00 00 00 -1 -1 -1 -1 -1 -1 -1 -1 -1 -1 -1 -100 00 00 00 00 00 00 01 00 00 00 0000 00 00 00 00 00 00 00 01 00 00 0000 00 00 00 00 00 00 00 00 01 00 0000 00 00 00 00 00 00 00 00 00 01 0000 00 00 00 00 00 00 00 00 00 00 0100 00 00 00 00 00 00 00 00 00 00 00
[Part 2/2]
table B.52009 Main study contrast coding used in conditioning for the parent questionnaire variables
[Part 1/1] table B.6 2009 Main study contrast coding used in conditioning for other variables

DESIGN EFFECT TABLES: ANNEx C
PISA 2009 TECHNICAL REPORT – © OECD 2012 353
annex c – deSign eFFect tableS
PISa 2000 PISa 2003 PISa 2006 PISa 2009
readingmathe-matics Science reading
mathe-matics Science reading
mathe-matics Science reading
mathe-matics Science
OEC
D australia 3.52 3.49 3.47 2.13 2.15 2.10 2.06 2.24 2.26 2.34 2.53 2.53austria 2.40 2.51 2.55 3.76 3.27 3.44 4.08 3.74 3.92 2.95 2.66 3.24Belgium 3.56 3.90 4.29 2.58 2.29 2.48 3.04 2.95 2.48 2.35 2.25 2.52Canada 1.56 1.40 1.57 1.75 1.82 2.02 2.44 1.97 2.03 1.48 1.61 1.62Chile 3.59 3.68 3.44 4.99 4.58 4.32 3.13 3.06 2.92Czech republic 2.37 2.78 2.43 3.46 3.55 3.38 4.18 3.55 3.48 2.89 2.83 2.97denmark 2.35 2.44 2.81 2.82 2.74 2.97 3.18 2.62 3.11 2.07 2.60 2.48estonia 2.93 2.75 2.52 2.64 2.57 2.67Finland 2.58 2.15 2.48 1.64 1.87 1.92 2.15 2.30 2.02 2.25 2.17 2.34France 2.73 2.71 3.18 2.68 2.50 2.99 4.06 3.17 3.36 3.44 3.09 3.60germany 2.47 2.52 2.43 3.39 3.32 3.64 4.41 3.87 3.80 2.66 2.86 2.80greece 4.97 5.58 4.89 4.10 3.90 3.82 4.04 2.97 3.23 4.32 3.88 4.04hungary 3.95 4.01 4.17 2.47 2.84 2.77 3.28 2.89 2.68 3.17 3.45 3.14Iceland 1.45 2.25 2.17 1.56 1.42 1.47 1.95 1.81 1.64 1.41 1.39 1.41Ireland 3.24 2.72 3.18 2.63 2.45 2.69 3.54 2.79 3.19 2.97 2.54 3.27Israel 8.47 9.31 9.01 4.58 4.35 3.71 3.63 3.28 3.11Italy 2.91 2.93 3.05 3.04 3.08 3.13 2.43 2.28 2.02 1.57 1.86 1.77japan 5.21 5.49 5.48 3.92 4.02 4.14 3.65 3.34 3.37 3.47 3.33 3.41Korea 2.42 2.76 2.69 3.09 3.24 3.54 3.81 3.76 3.36 3.46 4.02 3.44Luxembourg 1.59 1.99 2.32 1.48 0.97 1.50 1.28 1.07 1.05 1.25 1.18 1.23mexico 3.31 3.36 3.18 4.09 3.64 3.49 3.06 2.93 2.71 1.95 1.83 1.79netherlands 3.35 3.61 4.01 2.85 3.13 3.15 2.92 2.59 2.74 5.15 4.75 5.42new Zealand 2.78 3.14 2.40 2.46 2.26 2.35 2.99 2.39 2.69 2.35 2.31 2.58norway 2.80 2.77 2.75 2.78 2.38 2.87 3.18 2.64 3.11 2.58 2.40 2.60Poland 4.46 5.48 5.12 2.88 2.50 2.86 2.79 2.44 2.34 2.60 2.84 2.41Portugal 4.52 4.08 4.00 3.73 3.40 3.46 3.56 3.07 3.02 3.07 2.91 2.90Slovak republic 3.12 3.35 3.71 3.06 2.82 2.59 2.54 3.08 2.99Slovenia 0.99 1.04 1.11 1.03 1.23 1.15Spain 2.71 3.12 2.95 2.60 2.41 2.61 2.23 2.33 2.57 2.02 2.11 2.05Sweden 2.20 2.46 2.51 2.42 2.56 2.72 3.44 2.41 2.37 2.88 2.90 2.72Switzerland 4.25 4.38 4.44 3.28 3.38 3.69 3.06 3.15 3.16 2.44 3.30 2.82turkey 5.79 6.74 5.89 4.21 4.90 3.84 3.52 4.44 3.60united Kingdom 2.56 2.50 2.69 2.46 2.43 2.52 2.26 2.14 2.29 2.28 2.42 2.52united States 7.05 7.64 7.31 3.22 2.95 3.08 4.02 4.22 3.65 3.57 3.64
Part
ners albania 3.29 3.08 2.89 4.04 3.98 3.94
argentina 9.86 9.38 8.56 7.17 6.24 6.08 4.63 4.09 4.58azerbaijan 3.12 2.26 2.75 3.33 2.76 3.05Brazil 3.10 3.71 3.26 4.58 4.83 4.35 3.74 2.93 2.79 2.73 2.39 2.43Bulgaria 4.89 5.67 4.58 6.91 6.13 6.11 6.68 5.86 5.86Colombia 5.08 3.78 3.37 3.74 3.24 3.63Croatia 2.81 2.37 2.45 2.87 3.09 2.83dubai (uae) 1.14 1.07 1.22hong Kong-China 2.93 3.26 3.01 3.69 4.54 4.26 2.42 2.67 2.47 2.12 2.73 2.75Indonesia 3.99 4.54 3.94 3.38 3.91 3.21 5.92 5.63 5.73 3.74 3.72 3.78jordan 3.27 3.30 2.84 3.31 3.71 3.54Kazakhstan 3.07 3.04 3.13Kyrgyzstan 3.48 3.41 2.93 3.19 2.87 2.92Latvia 5.27 4.46 5.62 3.67 3.69 3.89 3.73 3.03 2.97 2.96 3.07 3.07Liechtenstein 4.12 6.99 7.09 3.58 4.12 4.33 3.91 4.21 4.10 2.80 4.06 3.42Lithuania 2.98 2.93 2.76 2.39 2.62 2.93macao-China 2.16 2.89 3.03 1.10 1.30 1.06 0.89 0.92 1.03macedonia 1.93 2.68 2.10montenegro 1.22 1.37 1.06 1.72 2.03 2.03Panama 6.54 5.25 5.74Peru 4.42 4.41 3.98 3.95 4.00 3.49Qatar 1.20 1.02 0.86 0.76 0.70 0.89romania 3.47 4.25 3.37 4.69 4.21 4.20 4.09 3.41 3.36russian Federation 4.16 5.46 4.74 3.94 4.20 4.14 4.32 3.87 3.67 3.34 3.29 3.30Serbia 3.56 3.75 3.50 3.46 3.51 3.04 2.43 2.92 2.37Shanghai-China 2.40 2.82 2.30Singapore 1.06 1.44 1.36Chinese taipei 3.38 4.10 3.57 2.60 3.40 2.63thailand 3.24 3.60 3.06 2.81 3.00 2.70 2.59 2.34 2.14 2.64 3.23 2.98trinidad and tobago 1.24 1.28 1.24tunisia 2.81 2.54 2.56 4.02 3.96 2.96 2.88 2.98 2.69uruguay 3.43 3.29 2.90 3.43 2.61 2.75 2.60 2.59 2.57
Central tendency indices on 35 countries that participated in the four surveysmedian 3.10 3.26 3.18 2.88 3.00 3.08 3.18 2.89 2.79 2.66 2.83 2.80mean 3.32 3.61 3.58 3.00 2.99 3.08 3.23 2.92 2.92 2.72 2.80 2.83
[Part 1/1] table C.1 Standard errors of the student performance mean estimate by country, by domain and cycle

Annex C: DeSIGn eFFeCT TABLeS
354 © OECD 2012 – PISA 2009 TECHNICAL REPORT
PISa 2000 PISa 2003 PISa 2006 PISa 2009
School sample
size
overall student sample
size
average within-school
sample size
School sample
size
overall student sample
size
average within-school
sample size
School sample
size
overall student sample
size
average within-school
sample size
School sample
size
overall student sample
size
average within-school
sample size
OEC
D australia 231 5 176 22.4 321 12 551 39.1 356 14 170 39.8 353 14 251 40.4austria 213 4 745 22.3 193 4 597 23.8 199 4 927 24.8 282 6 590 23.4Belgium 216 6 670 30.9 277 8 796 31.8 269 8 857 32.9 278 8 501 30.6Canada 1 117 29 687 26.6 1 087 27 953 25.7 896 22 646 25.3 978 23 207 23.7Chile 179 4 889 27.3 173 5 233 30.2 200 5 669 28.3Czech republic 229 5 365 23.4 260 6 320 24.3 245 5 932 24.2 261 6 064 23.2denmark 225 4 235 18.8 206 4 218 20.5 211 4 532 21.5 285 5 924 20.8estonia 169 4 865 28.8 175 4 727 27.0Finland 155 4 864 31.4 197 5 796 29.4 155 4 714 30.4 203 5 810 28.6France 177 4 673 26.4 170 4 300 25.3 182 4 716 25.9 168 4 298 25.6germany 219 5 073 23.2 216 4 660 21.6 226 4 891 21.6 226 4 979 22.0greece 157 4 672 29.8 171 4 627 27.1 190 4 873 25.6 184 4 969 27.0hungary 194 4 887 25.2 253 4 765 18.8 189 4 490 23.8 187 4 605 24.6Iceland 130 3 372 25.9 129 3 350 26.0 139 3 789 27.3 131 3 646 27.8Ireland 139 3 854 27.7 145 3 880 26.8 165 4 585 27.8 144 3 937 27.3Israel 165 4 498 27.3 149 4 584 30.8 176 5 761 32.7Italy 172 4 984 29.0 406 11 639 28.7 799 21 773 27.3 1 097 30 905 28.2japan 135 5 256 38.9 144 4 707 32.7 185 5 952 32.2 186 6 088 32.7Korea 146 4 982 34.1 149 5 444 36.5 154 5 176 33.6 157 4 989 31.8Luxembourg 24 3 528 147.0 29 3 923 135.3 31 4 567 147.3 39 4 622 118.5mexico 183 4 600 25.1 1 124 29 983 26.7 1 140 30 971 27.2 1 535 38 250 24.9netherlands 100 2 503 25.0 154 3 992 25.9 185 4 871 26.3 186 4 760 25.6new Zealand 153 3 667 24.0 173 4 511 26.1 170 4 823 28.4 163 4 643 28.5norway 176 4 147 23.6 182 4 064 22.3 203 4 692 23.1 197 4 660 23.7Poland 127 3 654 28.8 166 4 383 26.4 221 5 547 25.1 185 4 917 26.6Portugal 149 4 585 30.8 153 4 608 30.1 173 5 109 29.5 214 6 298 29.4Slovak republic 281 7 346 26.1 189 4 731 25.0 189 4 555 24.1Slovenia 361 6 595 18.3 341 6 155 18.0Spain 185 6 214 33.6 383 10 791 28.2 686 19 604 28.6 889 25 887 29.1Sweden 154 4 416 28.7 185 4 624 25.0 197 4 443 22.6 189 4 567 24.2Switzerland 282 6 100 21.6 445 8 420 18.9 510 12 192 23.9 426 11 812 27.7turkey 159 4 855 30.5 160 4 942 30.9 170 4 996 29.4united Kingdom 362 9 340 25.8 383 9 535 24.9 502 13 152 26.2 482 12 179 25.3united States 153 3 846 25.1 274 5 456 19.9 166 5 611 33.8 165 5 233 31.7
Part
ners albania 174 4 980 28.6 181 4 596 25.4
argentina 156 3 983 25.5 176 4 339 24.7 199 4 774 24.0azerbaijan 171 5 184 30.3 162 4 691 29.0Brazil 324 4 893 15.1 228 4 452 19.5 625 9 295 14.9 947 20 127 21.3Bulgaria 160 4 657 29.1 180 4 498 25.0 178 4 507 25.3Colombia 165 4 478 27.1 275 7 921 28.8Croatia 161 5 213 32.4 158 4 994 31.6dubai (uae) 190 5 620 29.6hong Kong-China 140 4 405 31.5 145 4 478 30.9 146 4 645 31.8 151 4 837 32.0Indonesia 290 7 368 25.4 346 10 761 31.1 352 10 647 30.2 183 5 136 28.1jordan 210 6 509 31.0 210 6 486 30.9Kazakhstan 199 5 412 27.2Kyrgyzstan 201 5 904 29.4 173 4 986 28.8Latvia 154 3 893 25.3 157 4 627 29.5 176 4 719 26.8 184 4 502 24.5Liechtenstein 11 314 28.5 12 332 27.7 12 339 28.3 12 329 27.4Lithuania 197 4 744 24.1 196 4 528 23.1macao-China 39 1 250 32.1 43 4 760 110.7 45 5 952 132.3macedonia 91 4 510 49.6montenegro 51 4 455 87.4 52 4 825 92.8Panama 188 3 969 21.1Peru 177 4 429 25.0 240 5 985 24.9Qatar 131 6 265 47.8 153 9 078 59.3romania 177 4 829 27.3 174 5 118 29.4 159 4 776 30.0russian Federation 246 6 701 27.2 212 5 974 28.2 209 5 799 27.7 213 5 308 24.9Serbia 149 4 405 29.6 162 4 798 29.6 190 5 523 29.1Shanghai-China 152 5 115 33.7Singapore 171 5 283 30.9Chinese taipei 236 8 815 37.4 158 5 831 36.9thailand 179 5 340 29.8 179 5 236 29.3 212 6 192 29.2 230 6 225 27.1trinidad and tobago 158 4 778 30.2tunisia 149 4 721 31.7 152 4 640 30.5 165 4 955 30.0uruguay 243 5 835 24.0 278 4 839 17.4 232 5 957 25.7
Central tendency indices on 35 countries that participated in the four surveysmedian 26.4 26.7 27.3 27.1mean 30.2 29.8 30.7 29.7
[Part 1/1] table C.2 Sample sizes by country and cycle

DESIGN EFFECT TABLES: ANNEx C
PISA 2009 TECHNICAL REPORT – © OECD 2012 355
PISa 2000 PISa 2003 PISa 2006 PISa 2009
readingmathe-matics Science reading
mathe-matics Science reading
mathe-matics Science reading
mathe-matics Science
OEC
D australia 1 888 1 405 1 500 2 009 1 927 2 079 1 878 1 694 1 839 2 102 2 031 2 243austria 6 417 5 173 5 241 7 566 5 250 5 823 6 861 5 785 5 464 5 886 5 143 5 905
Belgium 7 025 6 291 6 939 7 186 7 240 5 983 6 593 5 814 5 182 6 358 6 769 7 501
Canada 1 588 1 255 1 279 1 199 1 270 1 492 2 163 1 547 1 668 1 541 1 602 1 492
Chile 4 968 4 208 3 702 6 011 4 800 4 740 3 862 3 485 3 148
Czech republic 4 814 4 055 3 612 4 507 4 942 4 388 7 325 6 451 5 617 5 175 5 596 6 359
denmark 1 876 1 363 1 760 1 437 1 147 1 308 1 593 1 281 1 393 1 114 1 319 1 499
estonia 2 217 1 594 1 437 1 547 1 399 1 420
Finland 1 009 410 448 257 343 361 643 489 433 550 554 597
France 4 243 3 704 5 006 4 245 3 830 5 803 6 090 5 049 5 488 6 455 5 599 5 906
germany 6 903 5 653 5 191 7 001 6 101 7 036 9 733 6 183 5 944 5 867 6 255 6 659
greece 5 060 5 576 3 786 3 976 3 357 2 723 5 493 3 877 4 369 3 812 2 663 3 296
hungary 6 408 5 236 5 731 4 919 5 710 5 424 7 164 6 181 5 453 6 303 6 022 5 293
Iceland 696 430 572 382 319 365 1 220 725 898 1 380 1 592 1 655
Ireland 1 566 816 1 242 1 712 1 218 1 408 2 010 1 310 1 539 2 256 1 590 2 124
Israel 5 109 5 673 4 953 5 641 4 668 3 926 6 130 4 919 4 781
Italy 4 844 3 578 4 188 5 009 4 915 5 701 6 210 4 951 4 758 5 055 4 245 4 582
japan 3 377 3 727 3 646 4 998 5 400 5 543 5 459 4 474 4 867 5 093 5 090 4 911
Korea 1 840 2 889 2 574 2 475 3 607 3 870 3 205 3 494 2 869 2 052 2 989 2 184
Luxembourg 3 069 2 056 2 474 2 656 2 673 3 018 2 817 2 777 2 738 3 585 3 138 4 095
mexico 3 969 3 467 2 429 2 818 2 496 1 934 3 296 2 580 2 293 3 002 2 481 2 266
netherlands 3 984 3 873 4 262 4 316 5 508 5 743 5 567 4 880 5 359 4 698 4 911 5 770
new Zealand 1 892 1 702 1 732 1 916 1 781 1 922 2 108 1 406 1 930 2 200 2 101 2 537
norway 1 111 726 845 819 578 846 1 385 942 964 874 802 923
Poland 6 127 5 483 4 684 1 351 1 035 1 489 1 580 1 121 1 108 1 309 1 335 1 105
Portugal 3 457 2 492 2 427 3 315 2 620 2 733 3 449 2 746 2 502 2 416 2 674 1 982
Slovak republic 3 538 3 794 4 560 5 567 4 541 3 690 3 557 4 288 4 541
Slovenia 6 634 4 674 5 811 5 306 4 834 5 169
Spain 1 473 1 445 1 595 1 700 1 489 1 677 1 271 1 240 1 151 1 445 1 543 1 415
Sweden 793 691 679 873 970 1 046 1 694 1 215 1 091 1 514 1 576 1 594
Switzerland 4 421 3 970 4 024 2 608 3 165 3 314 3 101 3 283 3 375 2 624 3 158 3 084
turkey 4 772 5 915 4 732 4 047 4 557 3 653 4 118 5 876 4 049
united Kingdom 2 114 1 865 2 195 1 857 1 892 2 089 2 234 1 726 2 200 1 796 1 804 2 177
united States 3 236 3 127 3 637 2 481 2 345 2 270 2 201 2 626 2 235 2 458 2 606
Part
ners albania 4 046 3 355 2 521 2 856 2 754 2 355
argentina 5 920 6 282 4 897 6 881 5 072 4 794 6 532 4 863 5 954
azerbaijan 2 359 1 655 1 612 2 533 1 960 2 289
Brazil 3 379 3 548 2 453 3 416 4 159 3 182 4 555 4 342 3 711 3 315 2 720 2 795
Bulgaria 6 162 5 732 3 781 7 870 5 199 6 226 8 333 5 725 6 753
Colombia 3 466 2 973 2 244 2 706 2 107 2 376
Croatia 3 794 2 721 3 036 3 418 3 014 2 911
dubai (uae) 6 429 4 878 5 868
hong Kong-China 3 318 3 955 3 198 2 949 4 573 3 915 2 605 3 420 3 072 2 944 3 753 3 073
Indonesia 2 019 2 253 1 704 1 991 2 720 1 605 2 422 2 746 1 745 2 070 2 364 2 097
jordan 2 629 1 660 1 792 2 809 2 594 2 493
Kazakhstan 3 159 2 909 2 784
Kyrgyzstan 4 334 3 159 2 763 4 108 2 901 3 302
Latvia 3 305 2 836 2 775 1 666 1 761 1 778 2 183 1 537 1 316 1 499 1 553 1 574
Liechtenstein 3 456 3 395 3 171 2 998 3 461 3 510 3 452 2 921 3 176 2 641 2 212 2 292
Lithuania 2 671 2 687 2 308 2 360 2 452 2 228
macao-China 1 105 1 455 1 356 1 708 1 733 1 739 2 089 1 983 1 804
macedonia 3 994 3 019 2 350
montenegro 2 715 1 752 1 812 2 833 2 262 2 112
Panama 5 319 3 621 4 515
Peru 5 992 4 842 2 504 5 149 4 166 3 787
Qatar 7 141 5 015 4 240 7 276 5 374 5 659
romania 5 139 5 361 3 235 4 658 3 614 3 182 4 673 2 846 2 920
russian Federation 3 079 3 896 3 034 2 034 2 558 2 086 3 121 2 325 2 166 2 224 2 129 2 080
Serbia 2 305 2 566 1 978 3 941 3 723 3 086 2 914 3 284 2 676
Shanghai-China 2 830 5 033 2 857
Singapore 3 239 3 726 3 866
Chinese taipei 3 194 5 020 4 120 2 627 4 579 2 751
thailand 1 848 2 324 1 789 2 120 2 602 2 176 2 863 2 480 2 294 2 162 2 769 2 264
trinidad and tobago 8 353 6 489 7 157
tunisia 3 024 2 807 2 549 4 636 4 003 2 904 3 117 2 857 2 746
uruguay 5 553 4 618 4 108 6 018 3 926 3 525 4 153 3 428 3 899
Central tendency indices on 35 countries that participated in the four surveys
median 3 305 3 127 2 574 2 481 2 620 2 270 2 982 2 746 2 502 2 256 2 481 2 266
mean 3 303 2 990 2 909 2 936 2 999 3 018 3 628 3 006 2 931 3 016 2 987 3 084
[Part 1/1] table C.3 School variance estimate by country, by domain and cycle
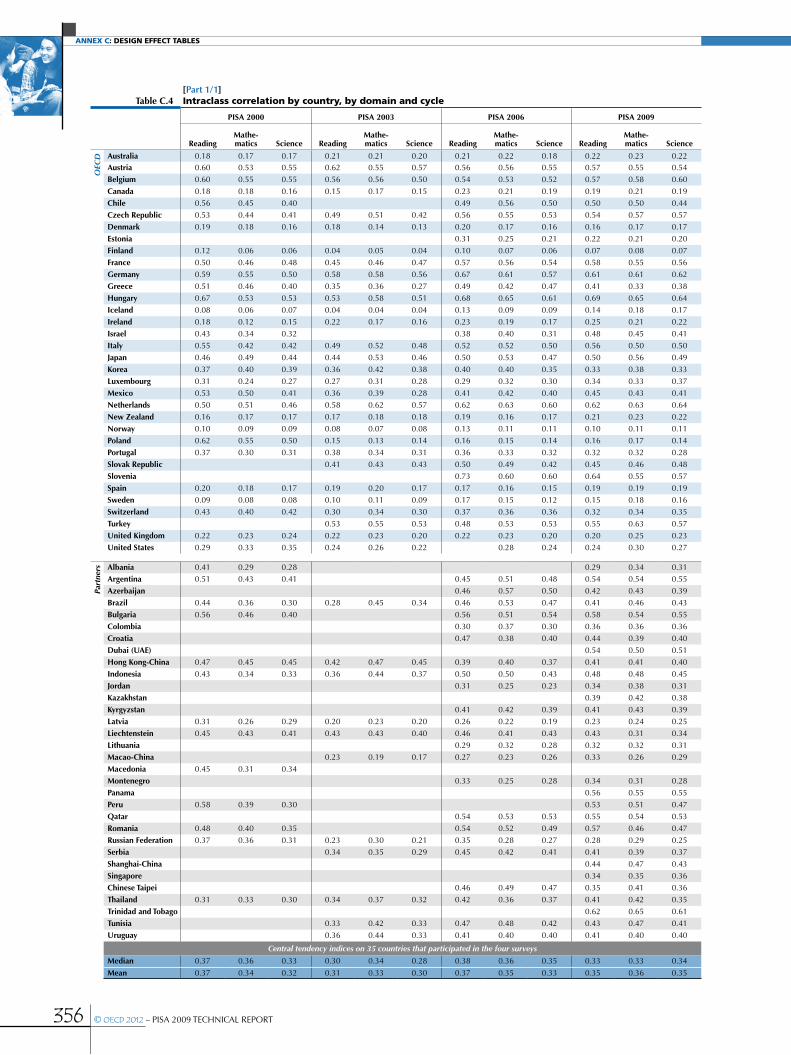
Annex C: DeSIGn eFFeCT TABLeS
356 © OECD 2012 – PISA 2009 TECHNICAL REPORT
PISa 2000 PISa 2003 PISa 2006 PISa 2009
readingmathe-matics Science reading
mathe-matics Science reading
mathe-matics Science reading
mathe-matics Science
OEC
D australia 0.18 0.17 0.17 0.21 0.21 0.20 0.21 0.22 0.18 0.22 0.23 0.22austria 0.60 0.53 0.55 0.62 0.55 0.57 0.56 0.56 0.55 0.57 0.55 0.54
Belgium 0.60 0.55 0.55 0.56 0.56 0.50 0.54 0.53 0.52 0.57 0.58 0.60
Canada 0.18 0.18 0.16 0.15 0.17 0.15 0.23 0.21 0.19 0.19 0.21 0.19
Chile 0.56 0.45 0.40 0.49 0.56 0.50 0.50 0.50 0.44
Czech republic 0.53 0.44 0.41 0.49 0.51 0.42 0.56 0.55 0.53 0.54 0.57 0.57
denmark 0.19 0.18 0.16 0.18 0.14 0.13 0.20 0.17 0.16 0.16 0.17 0.17
estonia 0.31 0.25 0.21 0.22 0.21 0.20
Finland 0.12 0.06 0.06 0.04 0.05 0.04 0.10 0.07 0.06 0.07 0.08 0.07
France 0.50 0.46 0.48 0.45 0.46 0.47 0.57 0.56 0.54 0.58 0.55 0.56
germany 0.59 0.55 0.50 0.58 0.58 0.56 0.67 0.61 0.57 0.61 0.61 0.62
greece 0.51 0.46 0.40 0.35 0.36 0.27 0.49 0.42 0.47 0.41 0.33 0.38
hungary 0.67 0.53 0.53 0.53 0.58 0.51 0.68 0.65 0.61 0.69 0.65 0.64
Iceland 0.08 0.06 0.07 0.04 0.04 0.04 0.13 0.09 0.09 0.14 0.18 0.17
Ireland 0.18 0.12 0.15 0.22 0.17 0.16 0.23 0.19 0.17 0.25 0.21 0.22
Israel 0.43 0.34 0.32 0.38 0.40 0.31 0.48 0.45 0.41
Italy 0.55 0.42 0.42 0.49 0.52 0.48 0.52 0.52 0.50 0.56 0.50 0.50
japan 0.46 0.49 0.44 0.44 0.53 0.46 0.50 0.53 0.47 0.50 0.56 0.49
Korea 0.37 0.40 0.39 0.36 0.42 0.38 0.40 0.40 0.35 0.33 0.38 0.33
Luxembourg 0.31 0.24 0.27 0.27 0.31 0.28 0.29 0.32 0.30 0.34 0.33 0.37
mexico 0.53 0.50 0.41 0.36 0.39 0.28 0.41 0.42 0.40 0.45 0.43 0.41
netherlands 0.50 0.51 0.46 0.58 0.62 0.57 0.62 0.63 0.60 0.62 0.63 0.64
new Zealand 0.16 0.17 0.17 0.17 0.18 0.18 0.19 0.16 0.17 0.21 0.23 0.22
norway 0.10 0.09 0.09 0.08 0.07 0.08 0.13 0.11 0.11 0.10 0.11 0.11
Poland 0.62 0.55 0.50 0.15 0.13 0.14 0.16 0.15 0.14 0.16 0.17 0.14
Portugal 0.37 0.30 0.31 0.38 0.34 0.31 0.36 0.33 0.32 0.32 0.32 0.28
Slovak republic 0.41 0.43 0.43 0.50 0.49 0.42 0.45 0.46 0.48
Slovenia 0.73 0.60 0.60 0.64 0.55 0.57
Spain 0.20 0.18 0.17 0.19 0.20 0.17 0.17 0.16 0.15 0.19 0.19 0.19
Sweden 0.09 0.08 0.08 0.10 0.11 0.09 0.17 0.15 0.12 0.15 0.18 0.16
Switzerland 0.43 0.40 0.42 0.30 0.34 0.30 0.37 0.36 0.36 0.32 0.34 0.35
turkey 0.53 0.55 0.53 0.48 0.53 0.53 0.55 0.63 0.57
united Kingdom 0.22 0.23 0.24 0.22 0.23 0.20 0.22 0.23 0.20 0.20 0.25 0.23
united States 0.29 0.33 0.35 0.24 0.26 0.22 0.28 0.24 0.24 0.30 0.27
Part
ners albania 0.41 0.29 0.28 0.29 0.34 0.31
argentina 0.51 0.43 0.41 0.45 0.51 0.48 0.54 0.54 0.55
azerbaijan 0.46 0.57 0.50 0.42 0.43 0.39
Brazil 0.44 0.36 0.30 0.28 0.45 0.34 0.46 0.53 0.47 0.41 0.46 0.43
Bulgaria 0.56 0.46 0.40 0.56 0.51 0.54 0.58 0.54 0.55
Colombia 0.30 0.37 0.30 0.36 0.36 0.36
Croatia 0.47 0.38 0.40 0.44 0.39 0.40
dubai (uae) 0.54 0.50 0.51
hong Kong-China 0.47 0.45 0.45 0.42 0.47 0.45 0.39 0.40 0.37 0.41 0.41 0.40
Indonesia 0.43 0.34 0.33 0.36 0.44 0.37 0.50 0.50 0.43 0.48 0.48 0.45
jordan 0.31 0.25 0.23 0.34 0.38 0.31
Kazakhstan 0.39 0.42 0.38
Kyrgyzstan 0.41 0.42 0.39 0.41 0.43 0.39
Latvia 0.31 0.26 0.29 0.20 0.23 0.20 0.26 0.22 0.19 0.23 0.24 0.25
Liechtenstein 0.45 0.43 0.41 0.43 0.43 0.40 0.46 0.41 0.43 0.43 0.31 0.34
Lithuania 0.29 0.32 0.28 0.32 0.32 0.31
macao-China 0.23 0.19 0.17 0.27 0.23 0.26 0.33 0.26 0.29
macedonia 0.45 0.31 0.34
montenegro 0.33 0.25 0.28 0.34 0.31 0.28
Panama 0.56 0.55 0.55
Peru 0.58 0.39 0.30 0.53 0.51 0.47
Qatar 0.54 0.53 0.53 0.55 0.54 0.53
romania 0.48 0.40 0.35 0.54 0.52 0.49 0.57 0.46 0.47
russian Federation 0.37 0.36 0.31 0.23 0.30 0.21 0.35 0.28 0.27 0.28 0.29 0.25
Serbia 0.34 0.35 0.29 0.45 0.42 0.41 0.41 0.39 0.37
Shanghai-China 0.44 0.47 0.43
Singapore 0.34 0.35 0.36
Chinese taipei 0.46 0.49 0.47 0.35 0.41 0.36
thailand 0.31 0.33 0.30 0.34 0.37 0.32 0.42 0.36 0.37 0.41 0.42 0.35
trinidad and tobago 0.62 0.65 0.61
tunisia 0.33 0.42 0.33 0.47 0.48 0.42 0.43 0.47 0.41
uruguay 0.36 0.44 0.33 0.41 0.40 0.40 0.41 0.40 0.40
Central tendency indices on 35 countries that participated in the four surveys
median 0.37 0.36 0.33 0.30 0.34 0.28 0.38 0.36 0.35 0.33 0.33 0.34
mean 0.37 0.34 0.32 0.31 0.33 0.30 0.37 0.35 0.33 0.35 0.36 0.35
[Part 1/1] table C.4 intraclass correlation by country, by domain and cycle
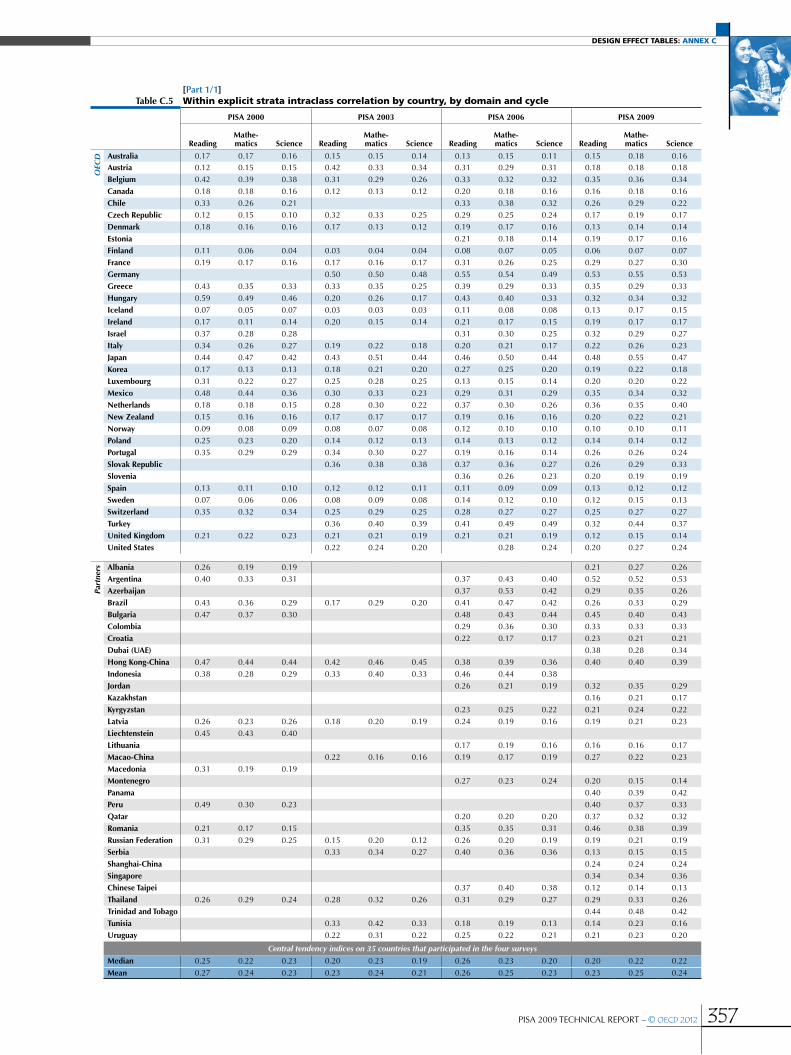
DESIGN EFFECT TABLES: ANNEx C
PISA 2009 TECHNICAL REPORT – © OECD 2012 357
PISa 2000 PISa 2003 PISa 2006 PISa 2009
readingmathe-matics Science reading
mathe-matics Science reading
mathe-matics Science reading
mathe-matics Science
OEC
D australia 0.17 0.17 0.16 0.15 0.15 0.14 0.13 0.15 0.11 0.15 0.18 0.16austria 0.12 0.15 0.15 0.42 0.33 0.34 0.31 0.29 0.31 0.18 0.18 0.18
Belgium 0.42 0.39 0.38 0.31 0.29 0.26 0.33 0.32 0.32 0.35 0.36 0.34
Canada 0.18 0.18 0.16 0.12 0.13 0.12 0.20 0.18 0.16 0.16 0.18 0.16
Chile 0.33 0.26 0.21 0.33 0.38 0.32 0.26 0.29 0.22
Czech republic 0.12 0.15 0.10 0.32 0.33 0.25 0.29 0.25 0.24 0.17 0.19 0.17
denmark 0.18 0.16 0.16 0.17 0.13 0.12 0.19 0.17 0.16 0.13 0.14 0.14
estonia 0.21 0.18 0.14 0.19 0.17 0.16
Finland 0.11 0.06 0.04 0.03 0.04 0.04 0.08 0.07 0.05 0.06 0.07 0.07
France 0.19 0.17 0.16 0.17 0.16 0.17 0.31 0.26 0.25 0.29 0.27 0.30
germany 0.50 0.50 0.48 0.55 0.54 0.49 0.53 0.55 0.53
greece 0.43 0.35 0.33 0.33 0.35 0.25 0.39 0.29 0.33 0.35 0.29 0.33
hungary 0.59 0.49 0.46 0.20 0.26 0.17 0.43 0.40 0.33 0.32 0.34 0.32
Iceland 0.07 0.05 0.07 0.03 0.03 0.03 0.11 0.08 0.08 0.13 0.17 0.15
Ireland 0.17 0.11 0.14 0.20 0.15 0.14 0.21 0.17 0.15 0.19 0.17 0.17
Israel 0.37 0.28 0.28 0.31 0.30 0.25 0.32 0.29 0.27
Italy 0.34 0.26 0.27 0.19 0.22 0.18 0.20 0.21 0.17 0.22 0.26 0.23
japan 0.44 0.47 0.42 0.43 0.51 0.44 0.46 0.50 0.44 0.48 0.55 0.47
Korea 0.17 0.13 0.13 0.18 0.21 0.20 0.27 0.25 0.20 0.19 0.22 0.18
Luxembourg 0.31 0.22 0.27 0.25 0.28 0.25 0.13 0.15 0.14 0.20 0.20 0.22
mexico 0.48 0.44 0.36 0.30 0.33 0.23 0.29 0.31 0.29 0.35 0.34 0.32
netherlands 0.18 0.18 0.15 0.28 0.30 0.22 0.37 0.30 0.26 0.36 0.35 0.40
new Zealand 0.15 0.16 0.16 0.17 0.17 0.17 0.19 0.16 0.16 0.20 0.22 0.21
norway 0.09 0.08 0.09 0.08 0.07 0.08 0.12 0.10 0.10 0.10 0.10 0.11
Poland 0.25 0.23 0.20 0.14 0.12 0.13 0.14 0.13 0.12 0.14 0.14 0.12
Portugal 0.35 0.29 0.29 0.34 0.30 0.27 0.19 0.16 0.14 0.26 0.26 0.24
Slovak republic 0.36 0.38 0.38 0.37 0.36 0.27 0.26 0.29 0.33
Slovenia 0.36 0.26 0.23 0.20 0.19 0.19
Spain 0.13 0.11 0.10 0.12 0.12 0.11 0.11 0.09 0.09 0.13 0.12 0.12
Sweden 0.07 0.06 0.06 0.08 0.09 0.08 0.14 0.12 0.10 0.12 0.15 0.13
Switzerland 0.35 0.32 0.34 0.25 0.29 0.25 0.28 0.27 0.27 0.25 0.27 0.27
turkey 0.36 0.40 0.39 0.41 0.49 0.49 0.32 0.44 0.37
united Kingdom 0.21 0.22 0.23 0.21 0.21 0.19 0.21 0.21 0.19 0.12 0.15 0.14
united States 0.22 0.24 0.20 0.28 0.24 0.20 0.27 0.24
Part
ners albania 0.26 0.19 0.19 0.21 0.27 0.26
argentina 0.40 0.33 0.31 0.37 0.43 0.40 0.52 0.52 0.53
azerbaijan 0.37 0.53 0.42 0.29 0.35 0.26
Brazil 0.43 0.36 0.29 0.17 0.29 0.20 0.41 0.47 0.42 0.26 0.33 0.29
Bulgaria 0.47 0.37 0.30 0.48 0.43 0.44 0.45 0.40 0.43
Colombia 0.29 0.36 0.30 0.33 0.33 0.33
Croatia 0.22 0.17 0.17 0.23 0.21 0.21
dubai (uae) 0.38 0.28 0.34
hong Kong-China 0.47 0.44 0.44 0.42 0.46 0.45 0.38 0.39 0.36 0.40 0.40 0.39
Indonesia 0.38 0.28 0.29 0.33 0.40 0.33 0.46 0.44 0.38
jordan 0.26 0.21 0.19 0.32 0.35 0.29
Kazakhstan 0.16 0.21 0.17
Kyrgyzstan 0.23 0.25 0.22 0.21 0.24 0.22
Latvia 0.26 0.23 0.26 0.18 0.20 0.19 0.24 0.19 0.16 0.19 0.21 0.23
Liechtenstein 0.45 0.43 0.40
Lithuania 0.17 0.19 0.16 0.16 0.16 0.17
macao-China 0.22 0.16 0.16 0.19 0.17 0.19 0.27 0.22 0.23
macedonia 0.31 0.19 0.19
montenegro 0.27 0.23 0.24 0.20 0.15 0.14
Panama 0.40 0.39 0.42
Peru 0.49 0.30 0.23 0.40 0.37 0.33
Qatar 0.20 0.20 0.20 0.37 0.32 0.32
romania 0.21 0.17 0.15 0.35 0.35 0.31 0.46 0.38 0.39
russian Federation 0.31 0.29 0.25 0.15 0.20 0.12 0.26 0.20 0.19 0.19 0.21 0.19
Serbia 0.33 0.34 0.27 0.40 0.36 0.36 0.13 0.15 0.15
Shanghai-China 0.24 0.24 0.24
Singapore 0.34 0.34 0.36
Chinese taipei 0.37 0.40 0.38 0.12 0.14 0.13
thailand 0.26 0.29 0.24 0.28 0.32 0.26 0.31 0.29 0.27 0.29 0.33 0.26
trinidad and tobago 0.44 0.48 0.42
tunisia 0.33 0.42 0.33 0.18 0.19 0.13 0.14 0.23 0.16
uruguay 0.22 0.31 0.22 0.25 0.22 0.21 0.21 0.23 0.20
Central tendency indices on 35 countries that participated in the four surveys
median 0.25 0.22 0.23 0.20 0.23 0.19 0.26 0.23 0.20 0.20 0.22 0.22
mean 0.27 0.24 0.23 0.23 0.24 0.21 0.26 0.25 0.23 0.23 0.25 0.24
[Part 1/1] table C.5 within explicit strata intraclass correlation by country, by domain and cycle
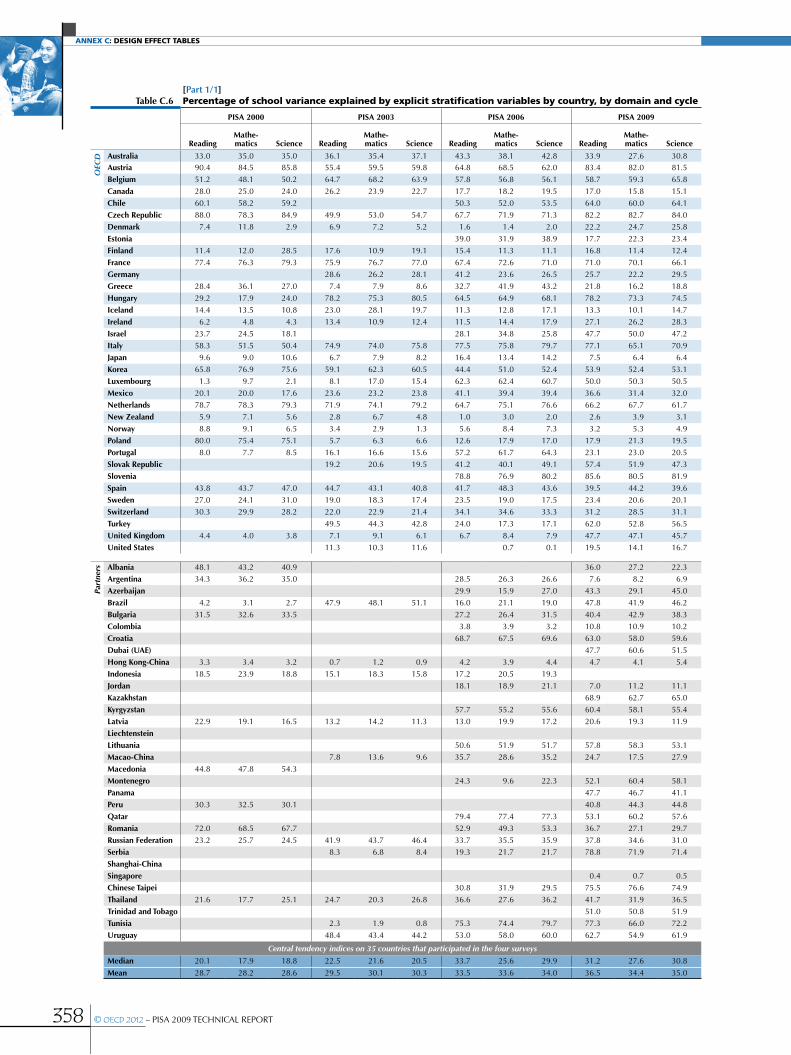
Annex C: DeSIGn eFFeCT TABLeS
358 © OECD 2012 – PISA 2009 TECHNICAL REPORT
PISa 2000 PISa 2003 PISa 2006 PISa 2009
readingmathe-matics Science reading
mathe-matics Science reading
mathe-matics Science reading
mathe-matics Science
OEC
D australia 33.0 35.0 35.0 36.1 35.4 37.1 43.3 38.1 42.8 33.9 27.6 30.8austria 90.4 84.5 85.8 55.4 59.5 59.8 64.8 68.5 62.0 83.4 82.0 81.5
Belgium 51.2 48.1 50.2 64.7 68.2 63.9 57.8 56.8 56.1 58.7 59.3 65.8
Canada 28.0 25.0 24.0 26.2 23.9 22.7 17.7 18.2 19.5 17.0 15.8 15.1
Chile 60.1 58.2 59.2 50.3 52.0 53.5 64.0 60.0 64.1
Czech republic 88.0 78.3 84.9 49.9 53.0 54.7 67.7 71.9 71.3 82.2 82.7 84.0
denmark 7.4 11.8 2.9 6.9 7.2 5.2 1.6 1.4 2.0 22.2 24.7 25.8
estonia 39.0 31.9 38.9 17.7 22.3 23.4
Finland 11.4 12.0 28.5 17.6 10.9 19.1 15.4 11.3 11.1 16.8 11.4 12.4
France 77.4 76.3 79.3 75.9 76.7 77.0 67.4 72.6 71.0 71.0 70.1 66.1
germany 28.6 26.2 28.1 41.2 23.6 26.5 25.7 22.2 29.5
greece 28.4 36.1 27.0 7.4 7.9 8.6 32.7 41.9 43.2 21.8 16.2 18.8
hungary 29.2 17.9 24.0 78.2 75.3 80.5 64.5 64.9 68.1 78.2 73.3 74.5
Iceland 14.4 13.5 10.8 23.0 28.1 19.7 11.3 12.8 17.1 13.3 10.1 14.7
Ireland 6.2 4.8 4.3 13.4 10.9 12.4 11.5 14.4 17.9 27.1 26.2 28.3
Israel 23.7 24.5 18.1 28.1 34.8 25.8 47.7 50.0 47.2
Italy 58.3 51.5 50.4 74.9 74.0 75.8 77.5 75.8 79.7 77.1 65.1 70.9
japan 9.6 9.0 10.6 6.7 7.9 8.2 16.4 13.4 14.2 7.5 6.4 6.4
Korea 65.8 76.9 75.6 59.1 62.3 60.5 44.4 51.0 52.4 53.9 52.4 53.1
Luxembourg 1.3 9.7 2.1 8.1 17.0 15.4 62.3 62.4 60.7 50.0 50.3 50.5
mexico 20.1 20.0 17.6 23.6 23.2 23.8 41.1 39.4 39.4 36.6 31.4 32.0
netherlands 78.7 78.3 79.3 71.9 74.1 79.2 64.7 75.1 76.6 66.2 67.7 61.7
new Zealand 5.9 7.1 5.6 2.8 6.7 4.8 1.0 3.0 2.0 2.6 3.9 3.1
norway 8.8 9.1 6.5 3.4 2.9 1.3 5.6 8.4 7.3 3.2 5.3 4.9
Poland 80.0 75.4 75.1 5.7 6.3 6.6 12.6 17.9 17.0 17.9 21.3 19.5
Portugal 8.0 7.7 8.5 16.1 16.6 15.6 57.2 61.7 64.3 23.1 23.0 20.5
Slovak republic 19.2 20.6 19.5 41.2 40.1 49.1 57.4 51.9 47.3
Slovenia 78.8 76.9 80.2 85.6 80.5 81.9
Spain 43.8 43.7 47.0 44.7 43.1 40.8 41.7 48.3 43.6 39.5 44.2 39.6
Sweden 27.0 24.1 31.0 19.0 18.3 17.4 23.5 19.0 17.5 23.4 20.6 20.1
Switzerland 30.3 29.9 28.2 22.0 22.9 21.4 34.1 34.6 33.3 31.2 28.5 31.1
turkey 49.5 44.3 42.8 24.0 17.3 17.1 62.0 52.8 56.5
united Kingdom 4.4 4.0 3.8 7.1 9.1 6.1 6.7 8.4 7.9 47.7 47.1 45.7
united States 11.3 10.3 11.6 0.7 0.1 19.5 14.1 16.7
Part
ners albania 48.1 43.2 40.9 36.0 27.2 22.3
argentina 34.3 36.2 35.0 28.5 26.3 26.6 7.6 8.2 6.9
azerbaijan 29.9 15.9 27.0 43.3 29.1 45.0
Brazil 4.2 3.1 2.7 47.9 48.1 51.1 16.0 21.1 19.0 47.8 41.9 46.2
Bulgaria 31.5 32.6 33.5 27.2 26.4 31.5 40.4 42.9 38.3
Colombia 3.8 3.9 3.2 10.8 10.9 10.2
Croatia 68.7 67.5 69.6 63.0 58.0 59.6
dubai (uae) 47.7 60.6 51.5
hong Kong-China 3.3 3.4 3.2 0.7 1.2 0.9 4.2 3.9 4.4 4.7 4.1 5.4
Indonesia 18.5 23.9 18.8 15.1 18.3 15.8 17.2 20.5 19.3
jordan 18.1 18.9 21.1 7.0 11.2 11.1
Kazakhstan 68.9 62.7 65.0
Kyrgyzstan 57.7 55.2 55.6 60.4 58.1 55.4
Latvia 22.9 19.1 16.5 13.2 14.2 11.3 13.0 19.9 17.2 20.6 19.3 11.9
LiechtensteinLithuania 50.6 51.9 51.7 57.8 58.3 53.1
macao-China 7.8 13.6 9.6 35.7 28.6 35.2 24.7 17.5 27.9
macedonia 44.8 47.8 54.3
montenegro 24.3 9.6 22.3 52.1 60.4 58.1
Panama 47.7 46.7 41.1
Peru 30.3 32.5 30.1 40.8 44.3 44.8
Qatar 79.4 77.4 77.3 53.1 60.2 57.6
romania 72.0 68.5 67.7 52.9 49.3 53.3 36.7 27.1 29.7
russian Federation 23.2 25.7 24.5 41.9 43.7 46.4 33.7 35.5 35.9 37.8 34.6 31.0
Serbia 8.3 6.8 8.4 19.3 21.7 21.7 78.8 71.9 71.4
Shanghai-ChinaSingapore 0.4 0.7 0.5
Chinese taipei 30.8 31.9 29.5 75.5 76.6 74.9
thailand 21.6 17.7 25.1 24.7 20.3 26.8 36.6 27.6 36.2 41.7 31.9 36.5
trinidad and tobago 51.0 50.8 51.9
tunisia 2.3 1.9 0.8 75.3 74.4 79.7 77.3 66.0 72.2
uruguay 48.4 43.4 44.2 53.0 58.0 60.0 62.7 54.9 61.9
Central tendency indices on 35 countries that participated in the four surveys
median 20.1 17.9 18.8 22.5 21.6 20.5 33.7 25.6 29.9 31.2 27.6 30.8
mean 28.7 28.2 28.6 29.5 30.1 30.3 33.5 33.6 34.0 36.5 34.4 35.0
[Part 1/1] table C.6 Percentage of school variance explained by explicit stratification variables by country, by domain and cycle
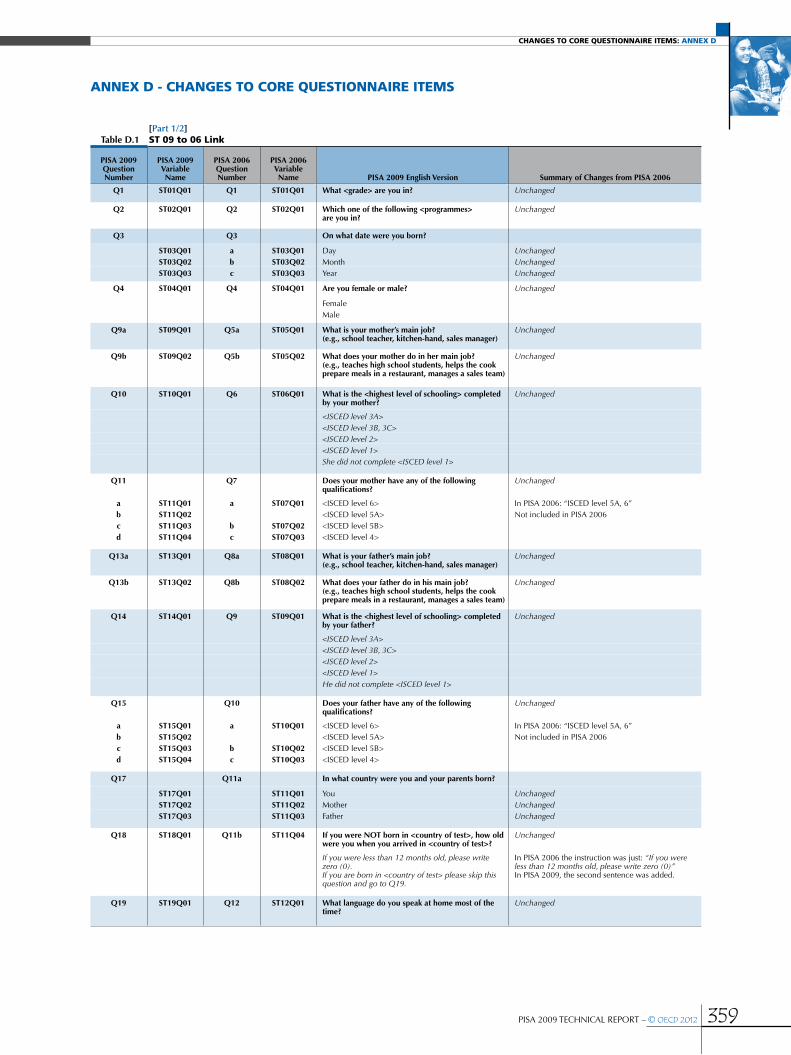
Changes to Core questionnaire items: annex D
PISA 2009 TECHNICAL REPORT – © OECD 2012 359
annex d - changeS to core QueStionnaire iteMS
PISa 2009 Question number
PISa 2009 variable name
PISa 2006 Question number
PISa 2006 variable name PISa 2009 english version Summary of Changes from PISa 2006
Q1 St01Q01 Q1 St01Q01 what <grade> are you in? Unchanged
Q2 St02Q01 Q2 St02Q01 which one of the following <programmes> are you in?
Unchanged
Q3 Q3 on what date were you born?
St03Q01 a St03Q01 Day Unchanged St03Q02 b St03Q02 Month Unchanged St03Q03 c St03Q03 Year Unchanged
Q4 St04Q01 Q4 St04Q01 are you female or male? Unchanged
Female Male
Q9a St09Q01 Q5a St05Q01 what is your mother’s main job? (e.g., school teacher, kitchen-hand, sales manager)
Unchanged
Q9b St09Q02 Q5b St05Q02 what does your mother do in her main job? (e.g., teaches high school students, helps the cook prepare meals in a restaurant, manages a sales team)
Unchanged
Q10 St10Q01 Q6 St06Q01 what is the <highest level of schooling> completed by your mother?
Unchanged
<ISCED level 3A> <ISCED level 3B, 3C> <ISCED level 2> <ISCED level 1> She did not complete <ISCED level 1>
Q11 Q7 does your mother have any of the following qualifications?
Unchanged
a St11Q01 a St07Q01 <ISCED level 6> In PISA 2006: “ISCED level 5A, 6”b St11Q02 <ISCED level 5A> Not included in PISA 2006c St11Q03 b St07Q02 <ISCED level 5B>d St11Q04 c St07Q03 <ISCED level 4>
Q13a St13Q01 Q8a St08Q01 what is your father’s main job? (e.g., school teacher, kitchen-hand, sales manager)
Unchanged
Q13b St13Q02 Q8b St08Q02 what does your father do in his main job? (e.g., teaches high school students, helps the cook prepare meals in a restaurant, manages a sales team)
Unchanged
Q14 St14Q01 Q9 St09Q01 what is the <highest level of schooling> completed by your father?
Unchanged
<ISCED level 3A> <ISCED level 3B, 3C> <ISCED level 2>
<ISCED level 1>
He did not complete <ISCED level 1>
Q15 Q10 does your father have any of the following qualifications?
Unchanged
a St15Q01 a St10Q01 <ISCED level 6> In PISA 2006: “ISCED level 5A, 6”b St15Q02 <ISCED level 5A> Not included in PISA 2006c St15Q03 b St10Q02 <ISCED level 5B>d St15Q04 c St10Q03 <ISCED level 4>
Q17 Q11a In what country were you and your parents born?
St17Q01 St11Q01 You Unchanged St17Q02 St11Q02 Mother Unchanged St17Q03 St11Q03 Father Unchanged
Q18 St18Q01 Q11b St11Q04 If you were not born in <country of test>, how old were you when you arrived in <country of test>?
Unchanged
If you were less than 12 months old, please write zero (0).If you are born in <country of test> please skip this question and go to Q19.
In PISA 2006 the instruction was just: “If you were less than 12 months old, please write zero (0)”In PISA 2009, the second sentence was added.
Q19 St19Q01 Q12 St12Q01 what language do you speak at home most of the time?
Unchanged
[Part 1/2] table d.1 St 09 to 06 link
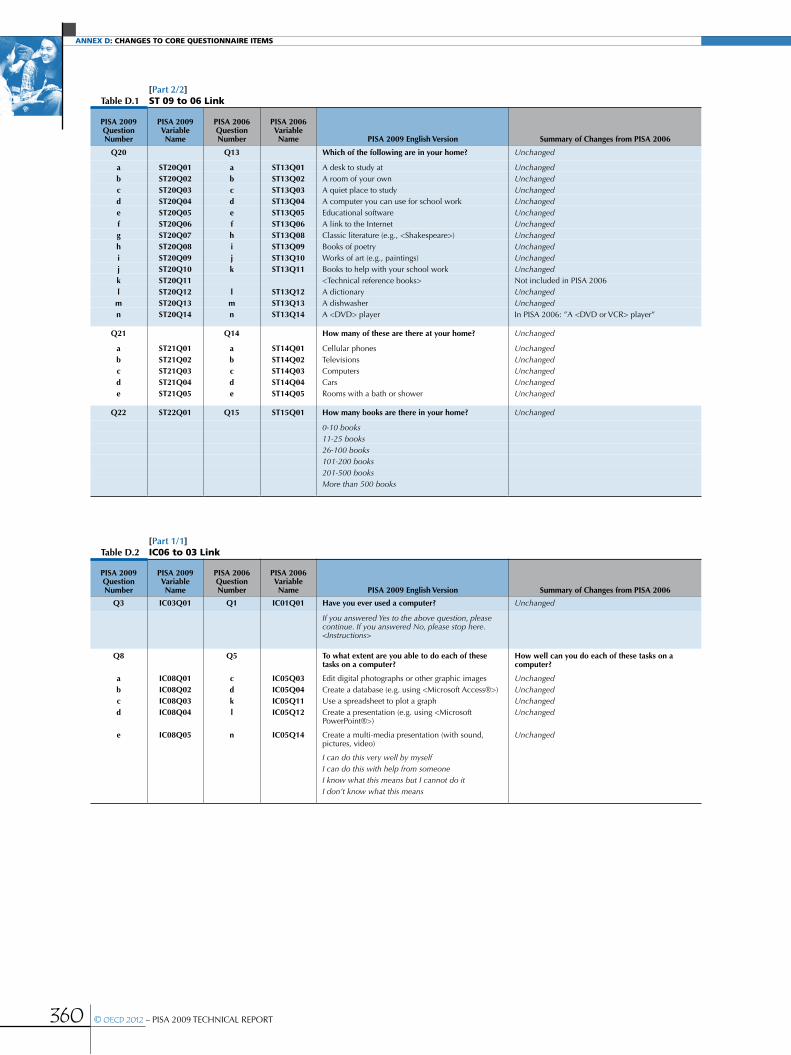
Annex D: ChAnges to Core questionnAire items
360 © OECD 2012 – PISA 2009 TECHNICAL REPORT
PISa 2009 Question number
PISa 2009 variable name
PISa 2006 Question number
PISa 2006 variable name PISa 2009 english version Summary of Changes from PISa 2006
Q20 Q13 which of the following are in your home? Unchanged
a St20Q01 a St13Q01 A desk to study at Unchangedb St20Q02 b St13Q02 A room of your own Unchangedc St20Q03 c St13Q03 A quiet place to study Unchangedd St20Q04 d St13Q04 A computer you can use for school work Unchangede St20Q05 e St13Q05 Educational software Unchangedf St20Q06 f St13Q06 A link to the Internet Unchangedg St20Q07 h St13Q08 Classic literature (e.g., <Shakespeare>) Unchangedh St20Q08 i St13Q09 Books of poetry Unchangedi St20Q09 j St13Q10 Works of art (e.g., paintings) Unchangedj St20Q10 k St13Q11 Books to help with your school work Unchangedk St20Q11 <Technical reference books> Not included in PISA 2006l St20Q12 l St13Q12 A dictionary Unchanged
m St20Q13 m St13Q13 A dishwasher Unchangedn St20Q14 n St13Q14 A <DVD> player In PISA 2006: ”A <DVD or VCR> player”
Q21 Q14 how many of these are there at your home? Unchanged
a St21Q01 a St14Q01 Cellular phones Unchangedb St21Q02 b St14Q02 Televisions Unchangedc St21Q03 c St14Q03 Computers Unchangedd St21Q04 d St14Q04 Cars Unchangede St21Q05 e St14Q05 Rooms with a bath or shower Unchanged
Q22 St22Q01 Q15 St15Q01 how many books are there in your home? Unchanged
0-10 books 11-25 books 26-100 books 101-200 books 201-500 books More than 500 books
[Part 2/2] table d.1 St 09 to 06 link
PISa 2009 Question number
PISa 2009 variable name
PISa 2006 Question number
PISa 2006 variable name PISa 2009 english version Summary of Changes from PISa 2006
Q3 IC03Q01 Q1 IC01Q01 have you ever used a computer? Unchanged
If you answered Yes to the above question, please continue. If you answered No, please stop here. <Instructions>
Q8 Q5 to what extent are you able to do each of these tasks on a computer?
how well can you do each of these tasks on a computer?
a IC08Q01 c IC05Q03 Edit digital photographs or other graphic images Unchangedb IC08Q02 d IC05Q04 Create a database (e.g. using <Microsoft Access®>) Unchangedc IC08Q03 k IC05Q11 Use a spreadsheet to plot a graph Unchangedd IC08Q04 l IC05Q12 Create a presentation (e.g. using <Microsoft
PowerPoint®>)Unchanged
e IC08Q05 n IC05Q14 Create a multi-media presentation (with sound, pictures, video)
Unchanged
I can do this very well by myself I can do this with help from someone I know what this means but I cannot do it I don’t know what this means
[Part 1/1] table d.2 ic06 to 03 link

Changes to Core questionnaire items: annex D
PISA 2009 TECHNICAL REPORT – © OECD 2012 361
PISa 2009 Question number
PISa 2009 variable name
PISa 2006 Question number
PISa 2006 variable name PISa 2009 english version Summary of Changes from PISa 2006
Q1 Q4 do you have the following <grade levels> in your school?
a SC01Q01 a SC04Q01 <Grade 1> Unchangedb SC01Q02 b SC04Q02 <Grade 2> Unchangedc SC01Q03 c SC04Q03 <Grade 3> Unchangedd SC01Q04 d SC04Q04 <Grade 4> Unchangede SC01Q05 e SC04Q05 <Grade 5> Unchangedf SC01Q06 f SC04Q06 <Grade 6> Unchangedg SC01Q07 g SC04Q07 <Grade 7> Unchangedh SC01Q08 h SC04Q08 <Grade 8> UnchangedI SC01Q09 I SC04Q09 <Grade 9> Unchangedj SC01Q10 j SC04Q10 <Grade 10> Unchangedk SC01Q11 k SC04Q11 <Grade 11> Unchangedl SC01Q12 l SC04Q12 <Grade 12> Unchangedm SC01Q13 m SC04Q13 <Grade 13> Unchangedn SC01Q14 n SC04Q14 <Ungraded school> Unchanged
Q2 SC02Q01 Q2 SC02Q01 Is your school a public or a private school? Unchanged
A public school A private school
Q3 Q3 about what percentage of your total funding for a typical school year comes from the following sources?
Unchanged
a SC03Q01 a SC03Q01 Government (includes departments, local, regional, state and national)
Unchanged
b SC03Q02 b SC03Q02 Student fees or school charges paid by parents Unchanged
c SC03Q03 c SC03Q03 Benefactors, donations, bequests, sponsorships, parent fund raising
Unchanged
d SC03Q04 d SC03Q04 Other Unchanged
Q4 SC04Q01 Q7 SC07Q01 which of the following definitions best describes the community in which your school is located?
which of the following best describes the community in which your school is located?
A village, hamlet or rural area (fewer than 3 000 people)
A small town (3 000 to about 15 000 people) A town (15 000 to about 100 000 people) A city (100 000 to about 1 000 000 people) A large city (with over 1 000 000 people )
Q5 SC05Q01 Q18 SC18Q01 We are interested in the options parents have when choosing a school for their children.
We are interested in the options parents have when choosing a school for their children.
which of the following statements best describes the schooling available to students in your location?
which of the following best describes the schooling available to students in your location?
There are two or more other schools in this area that compete for our students
There is one other school in this area that competes for our students
There are no other schools in this area that compete for our students
Q6 Q1 as at <February 1, 2009>, what was the total school enrolment (number of students)?
as at <February 1, 2006>, what was the total school enrolment (number of students)?
a SC06Q01 a SC01Q01 Number of boys: Unchangedb SC06Q02 b SC01Q02 Number of girls: Unchanged
Q7 Q5 about what percentage of students in your school repeated a <grade>, at these <ISCed levels>, last academic year?
Unchanged
a SC07Q01 a SC05Q01 The approximate percentage of students repeating a <grade> at <ISCED 2> in this school last year was:
Unchanged
b SC07Q02 b SC05Q02 The approximate percentage of students repeating a <grade> at <ISCED 3> in this school last year was:
Unchanged
<ISCED level> not available in this school
Q9 Q9 how many of the following teachers are on the staff of your school?
how many of the following are on the staff of your school?
a a Teachers in TOTAL Unchanged SC09Q11 SC09Q11 Full time SC09Q12 SC09Q21 Part time b b Teachers fully certified by <the appropriate
authority>Unchanged
SC09Q21 SC09Q12 Full time SC09Q22 SC09Q22 Part time c c Teachers with an <ISCED 5A> qualification Unchanged
SC09Q31 SC09Q31 Full time SC09Q32 SC09Q32 Part time
[Part 1/3] table d.3 Sc06 to 03 link

Annex D: ChAnges to Core questionnAire items
362 © OECD 2012 – PISA 2009 TECHNICAL REPORT
PISa 2009 Question number
PISa 2009 variable name
PISa 2006 Question number
PISa 2006 variable name PISa 2009 english version Summary of Changes from PISa 2006
Q10a SC10Q01 Q13a SC13Q01 at your school, what is the total number of students in the <national modal grade for 15-year-olds>?
about how many computers are available in the school altogether?
Q10b SC10Q02 Q13b SC13Q02 approximately, how many computers are available for these students for educational purposes?
about how many of these computers are available for instruction?
Q10c SC10Q03 Q13c SC13Q03 approximately, how many of these computers are connected to the Internet/world wide web?
about how many computers in the school are connected to the Internet/world wide web?
Q11 Q14 Is your school’s capacity to provide instruction hindered by any of the following issues?
Is your school’s capacity to provide instruction hindered by any of the following?
a SC11Q01 a SC14Q01 A lack of qualified science teachers Unchangedb SC11Q02 b SC14Q02 A lack of qualified mathematics teachers Unchangedc SC11Q03 c SC14Q03 A lack of qualified <test language> teachers Unchangedd SC11Q04 d SC14Q04 A lack of qualified teachers of other subjects Unchangede SC11Q05 e SC14Q05 A lack of library staff A lack of laboratory techniciansf SC11Q06 f SC14Q06 A lack of other support personnel Unchangedg SC11Q07 g SC14Q07 Shortage or inadequacy of science laboratory
equipmentUnchanged
h SC11Q08 h SC14Q08 Shortage or inadequacy of instructional materials (e.g. textbooks)
Unchanged
i SC11Q09 i SC14Q09 Shortage or inadequacy of computers for instruction Unchangedj SC11Q10 j SC14Q10 Lack or inadequacy of Internet connectivity Unchangedk SC11Q11 k SC14Q11 Shortage or inadequacy of computer software for
instructionUnchanged
l SC11Q12 l SC14Q12 Shortage or inadequacy of library materials Unchangedm SC11Q13 m SC14Q13 Shortage or inadequacy of audio-visual resources Unchanged Not at all Very little To some extent A lot
Q12 Q8 Some schools organise instruction differently for students with different abilities. what is your school’s policy about this for students in <national modal grade for 15-year-olds>?
Unchanged
a SC12Q01 a SC08Q01 Students are grouped by ability into different classes Unchangedb SC12Q02 b SC08Q02 Students are grouped by ability within their classes Unchanged For all subjects For some subjects Not for any subjects
Q18 Q16 which statement below best characterises parental expectations towards your school?
Unchanged
There is constant pressure from many parents, who expect our school to set very high academic standards and to have our students achieve them.
Unchanged
Pressure on the school to achieve higher academic standards among students comes from a minority of parents.
Unchanged
Pressure from parents on the school to achieve higher academic standards among students is largely absent.
Unchanged
Q19 Q19 how often are the following factors considered when students are admitted to your school?
how much consideration is given to the following factors when students are admitted to your school?
a SC19Q01 a SC19Q01 Residence in a particular area Unchangedb SC19Q02 b SC19Q02 Student's record of academic performance
(including placement tests)Student’s academic record (including placement tests)
c SC19Q03 c SC19Q03 Recommendation of feeder schools Unchangedd SC19Q04 d SC19Q04 Parents' endorsement of the instructional or religious
philosophy of the schoolUnchanged
e SC19Q05 e SC19Q05 Whether the student requires or is interested in a special programme
Student's need or desire for a special programme
f SC19Q06 f SC19Q06 Preference given to family members of current or former students
Attendance of other family members at the school (past or present)
Never In PISA 2006 there were four response options: ‘Prerequisite’,’ High priority’, ‘Considered’ and ‘Not considered’.
Sometimes Always
[Part 2/3] table d.3 Sc06 to 03 link

Changes to Core questionnaire items: annex D
PISA 2009 TECHNICAL REPORT – © OECD 2012 363
PISa 2009 Question number
PISa 2009 variable name
PISa 2006 Question number
PISa 2006 variable name PISa 2009 english version Summary of Changes from PISa 2006
Q21 Q15 this set of questions explores aspects of the school's <accountability> to parents.
Unchanged
a SC21Q01 a SC15Q01 Does your school provide information to parents of students in <national modal grade for 15-year-olds> on their child's academic performance relative to other students in <national modal grade for 15-year-olds> in your school?
Unchanged
b SC21Q02 b SC15Q02 Does your school provide information to parents of students in <national modal grade for 15-year-olds> on their child's academic performance relative to national or regional <benchmarks>?
Unchanged
c SC21Q03 c SC15Q03 Does your school provide information to parents on the academic performance of students in <national modal grade for 15-year-olds> as a group relative to students in the same grade in other schools?
Unchanged
Q22 Q17 In your school, are achievement data used in any of the following <accountability procedures>?
Unchanged
a SC22Q01 a SC17Q01 Achievement data are posted publicly (e.g. in the media)
Unchanged
b SC22Q02 b SC17Q02 Achievement data are used in evaluation of the principal's performance
Unchanged
c SC22Q03 c SC17Q03 Achievement data are used in evaluation of teachers' performance
Unchanged
d SC22Q04 d SC17Q04 Achievement data are used in decisions about instructional resource allocation to the school
Unchanged
e SC22Q05 e SC17Q05 Achievement data are tracked over time by an administrative authority
Unchanged
Q24 Q11 regarding your school, who has a considerable responsibility for the following tasks?
Unchanged
a SC24Q01 a SC11Q01 Selecting teachers for hire Unchangedb SC24Q02 b SC11Q02 Firing teachers Unchangedc SC24Q03 c SC11Q03 Establishing teachers’ starting salaries Unchangedd SC24Q04 d SC11Q04 Determining teachers’ salaries increases? Unchangede SC24Q05 e SC11Q05 Formulating the school budget Unchangedf SC24Q06 f SC11Q06 Deciding on budget allocations within the school Unchangedg SC24Q07 g SC11Q07 Establishing student disciplinary policies Unchangedh SC24Q08 h SC11Q08 Establishing student assessment policies UnchangedI SC24Q09 i SC11Q09 Approving students for admission to the school Unchangedj SC24Q10 j SC11Q10 Choosing which textbooks are used Unchangedk SC24Q11 k SC11Q11 Determining course content Unchangedl SC24Q12 l SC11Q12 Deciding which courses are offered Unchanged Principals Principal or teachers
Teachers <School governing board> <Regional or local education authority> National education authority
Q25 Q12 regarding your school, which of the following bodies exert a direct influence on decision making about staffing, budgeting, instructional content and assessment practices?
Unchanged
a SC25Q01 a SC12Q01 Regional or national education authorities(e.g. inspectorates)
Unchanged
b SC25Q02 b SC12Q02 The school’s <governing board> Unchangedc SC25Q03 c SC12Q03 Parent groups Unchangedd SC25Q04 d SC12Q04 Teacher groups
(e.g. Staff Association, curriculum committees, trade union)
Unchanged
e SC25Q05 e SC12Q05 Student groups(e.g. Student Association, youth organisation)
Unchanged
f SC25Q06 f SC12Q06 External examination boards
Unchanged
Staffing Budgeting Instructional content Assessment practices
[Part 3/3] table d.3 Sc06 to 03 link
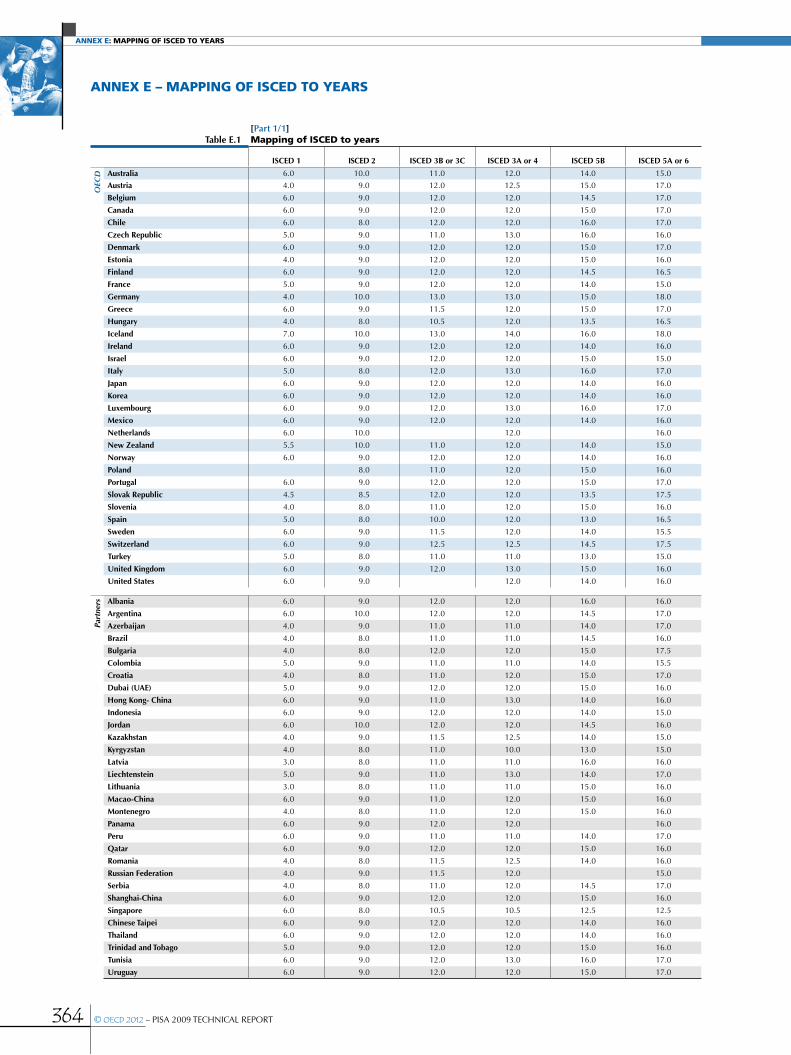
Annex e: MApping of iSCeD to yeArS
364 © OECD 2012 – PISA 2009 TECHNICAL REPORT
annex e – MaPPing oF iSced to yearS
ISCed 1 ISCed 2 ISCed 3B or 3C ISCed 3a or 4 ISCed 5B ISCed 5a or 6
OEC
D australia 6.0 10.0 11.0 12.0 14.0 15.0
austria 4.0 9.0 12.0 12.5 15.0 17.0
Belgium 6.0 9.0 12.0 12.0 14.5 17.0
Canada 6.0 9.0 12.0 12.0 15.0 17.0
Chile 6.0 8.0 12.0 12.0 16.0 17.0
Czech republic 5.0 9.0 11.0 13.0 16.0 16.0
denmark 6.0 9.0 12.0 12.0 15.0 17.0
estonia 4.0 9.0 12.0 12.0 15.0 16.0
Finland 6.0 9.0 12.0 12.0 14.5 16.5
France 5.0 9.0 12.0 12.0 14.0 15.0
germany 4.0 10.0 13.0 13.0 15.0 18.0
greece 6.0 9.0 11.5 12.0 15.0 17.0
hungary 4.0 8.0 10.5 12.0 13.5 16.5
Iceland 7.0 10.0 13.0 14.0 16.0 18.0
Ireland 6.0 9.0 12.0 12.0 14.0 16.0
Israel 6.0 9.0 12.0 12.0 15.0 15.0
Italy 5.0 8.0 12.0 13.0 16.0 17.0
japan 6.0 9.0 12.0 12.0 14.0 16.0
Korea 6.0 9.0 12.0 12.0 14.0 16.0
Luxembourg 6.0 9.0 12.0 13.0 16.0 17.0
mexico 6.0 9.0 12.0 12.0 14.0 16.0
netherlands 6.0 10.0 12.0 16.0
new Zealand 5.5 10.0 11.0 12.0 14.0 15.0
norway 6.0 9.0 12.0 12.0 14.0 16.0
Poland 8.0 11.0 12.0 15.0 16.0
Portugal 6.0 9.0 12.0 12.0 15.0 17.0
Slovak republic 4.5 8.5 12.0 12.0 13.5 17.5
Slovenia 4.0 8.0 11.0 12.0 15.0 16.0
Spain 5.0 8.0 10.0 12.0 13.0 16.5
Sweden 6.0 9.0 11.5 12.0 14.0 15.5
Switzerland 6.0 9.0 12.5 12.5 14.5 17.5
turkey 5.0 8.0 11.0 11.0 13.0 15.0
united Kingdom 6.0 9.0 12.0 13.0 15.0 16.0
united States 6.0 9.0 12.0 14.0 16.0
Part
ners albania 6.0 9.0 12.0 12.0 16.0 16.0
argentina 6.0 10.0 12.0 12.0 14.5 17.0
azerbaijan 4.0 9.0 11.0 11.0 14.0 17.0
Brazil 4.0 8.0 11.0 11.0 14.5 16.0
Bulgaria 4.0 8.0 12.0 12.0 15.0 17.5
Colombia 5.0 9.0 11.0 11.0 14.0 15.5
Croatia 4.0 8.0 11.0 12.0 15.0 17.0
dubai (uae) 5.0 9.0 12.0 12.0 15.0 16.0
hong Kong- China 6.0 9.0 11.0 13.0 14.0 16.0
Indonesia 6.0 9.0 12.0 12.0 14.0 15.0
jordan 6.0 10.0 12.0 12.0 14.5 16.0
Kazakhstan 4.0 9.0 11.5 12.5 14.0 15.0
Kyrgyzstan 4.0 8.0 11.0 10.0 13.0 15.0
Latvia 3.0 8.0 11.0 11.0 16.0 16.0
Liechtenstein 5.0 9.0 11.0 13.0 14.0 17.0
Lithuania 3.0 8.0 11.0 11.0 15.0 16.0
macao-China 6.0 9.0 11.0 12.0 15.0 16.0
montenegro 4.0 8.0 11.0 12.0 15.0 16.0
Panama 6.0 9.0 12.0 12.0 16.0
Peru 6.0 9.0 11.0 11.0 14.0 17.0
Qatar 6.0 9.0 12.0 12.0 15.0 16.0
romania 4.0 8.0 11.5 12.5 14.0 16.0
russian Federation 4.0 9.0 11.5 12.0 15.0
Serbia 4.0 8.0 11.0 12.0 14.5 17.0
Shanghai-China 6.0 9.0 12.0 12.0 15.0 16.0
Singapore 6.0 8.0 10.5 10.5 12.5 12.5
Chinese taipei 6.0 9.0 12.0 12.0 14.0 16.0
thailand 6.0 9.0 12.0 12.0 14.0 16.0
trinidad and tobago 5.0 9.0 12.0 12.0 15.0 16.0
tunisia 6.0 9.0 12.0 13.0 16.0 17.0
uruguay 6.0 9.0 12.0 12.0 15.0 17.0
[Part 1/1] table e.1 Mapping of iSced to years

NatioNal household possessioN items: aNNex F
PISA 2009 TECHNICAL REPORT – © OECD 2012 365
annex F – national houSehold PoSSeSSion iteMS
St20Q15 St20Q16 St20Q17
OEC
D australia Cable/pay TV iPhone Plasma or LCD TV
austria Laptop/notebook of your own Electronical devices for playing (Playstation, Nintendo, X-Box) Digital video camera
Belgium (Flemish region) Plasma or LCD television Alarm system Home cinema
Belgium (French and german regions) Home cinema Alarm system Housekeeper
Canada IPOD®/MP3 player Subscription to a daily newspaper Central air conditioning
Czech republic Your own notebook (laptop) Camcorder Home cinema (screen, DVD player, speakers)
denmark Piano Digital camera Flat screen TV
Finland Laptop Flat screen TV Home alarm system
France Flat screen TV Digital camera (not part of a portable) Portable computer
germany Video game console (Playstation, Nintendo, X-Box, Wii) TV in your own room Audio-books
greece Home cinema Cable TV (Nova, Filmnet) Alarm system
hungary Your own computer MP3/MP4 player Digital camera (not part of a phone)
Iceland Jacuzzi Satellite dish Plasma TV or TV projector
Ireland Flat screen TV Bedroom with an en-suite bathroom Premium cable TV package (e.g. Sky Movies, Sky Sports)
Italy Antique furniture Plasma TV set Air conditioning
japan Digital camera Air conditioner Clothing Dryer
Korea Air conditioner Digital TV (e.g.: PDP, LCD,LED) Kimchi refrigerator (for maturing)
Luxembourg Digital video-camera iPod or iPhone Games console
mexico Pay TV (Sky, cablevision, etc.) Phone line Microwave
netherlands Alarm system on the house Piano Laptop
new Zealand Broad band internet connection Pay television e.g. Sky, SaturnDo you and your family have a holiday away from home for at least one week each year?
norway Video camera (not including camera on mobile phone and photo camera) Jacuzzi TV with flatscreen
Poland Cable TV with at least 30 channels Digital camera Plasma or LCD TV
Portugal Cable TV or television by parabolic antenna Plasma or LCD television Air conditioning
Slovak republic Video camera Digital camera (not as a part of a mobile phone, but separate one) Lawn-mower
Spain (Spanish and Catalan regions) Video camera Digital TV Home Cinema
Spain (Basque region) Video camera Parabolic aerial Home Cinema
Spain (galician region) Video camera Satellite dish or digital TV Home Cinema
Sweden Piano Video camera Flat screen TV
Switzerland and Liechtenstein Musical instrument (no flute) iPhone Digital video camera
turkey Air-conditioned type heating and cooling system Video camera Digital camera
united Kingdom (england, wales and nI) Flat-screen TV MP3 player, e.g. iPod Premium TV package (e.g. Sky Movies, Sky Sports)
united Kingdom (Scotland) Flat-screen TV Bedroom with an ensuite bathroom Premium TV package (e.g. Sky Movies, Sky Sports)
united States Guest room High speed internet connection Musical instrument
[Part 1/2] table F.1 national household possession items

Annex F: nAtionAl household possession items
366 © OECD 2012 – PISA 2009 TECHNICAL REPORT
St20Q15 St20Q16 St20Q17
Part
ners albania Microwave Culture TV programmes with payment Traditional dishes
argentina Air conditioner LCD/Plasma TV Washing machine
azerbaijan Satellite antenna Video camera Colour printer
Brazil Cable TV Videogame IPod
Bulgaria MP3 or MP4 player Digital camera Air-conditioner
Chile Cable TV Digital Video camera Microwave oven
Colombia Digital camera Cable TV or Direct to Home TV Encyclopedia
Croatia Plasma or LCD TV Play Station Cable or digital TV
dubai (uae) Plasma TV Laptop computer Designer clothing
estonia Video camera Digital photo camera Plasma or LCD TV
hong Kong-China Plasma TV/LCD TV (40" or above) Piano Pay TV Channel
Indonesia Digital camera Refrigerator Car
Israel 4x4 Vehicle Espresso machine Home cinema system
jordan Central heating Plasma TV set Digital camera
Kazakhstan Digital photo camera Video camera Satellite antenna
Kyrgyzstan Photo camera Vacuum cleaner Imported laundry washer (e.g. "Ariston" or "Indesit")
Lithuania Digital camera Press subscription Cinecamera
Latvia Notebook Bicycle Digital photo camera
macao-China Video game Digital camera MP3 player
montenegro Cable TV Plasma TV Digital camera
Panama Video games e.g. Wii, Nintendo, Game Cube Media Player3 and Media Player4 Digital camera
Peru Stereo with speakers Refrigerator A washing machine
Qatar MP3 walkman Digital video camera Home cinema system
romania Digital video camera IPod Home cinema system
russian Federation Digital photo camera or video camera Home cinema Satellite antenna
Serbia Digital camera Clothes dryer Cable TV
Shanghai Digital camera or digital video recorder Juice extractor Microwave oven
Singapore Cable television Air conditioner Domestic helper (e.g. house maid)
Slovenia Your own computerDo you attend the following activities (extra out-of-school-time activities paid by your parents)?
Travelling abroad for one week or more
Chinese taipei Piano or violin iPod Digital camera
thailand Air condition Washing machine Microwave Oven
trinidad and tobago Refrigerator with ice maker Flat screen television Camcorder
tunisia Home theatre system Digital Camera Home flat screen TV
uruguay Cable TV Freezer Laptop (XO Ceibal not included)
[Part 2/2] table F.1 national household possession items

PISA 2009 TECHNICAL STANDARDS: ANNEx G
PISA 2009 TECHNICAL REPORT – © OECD 2012 367
annex g – PiSa 2009 technical StandardS
introductionAt the meeting on 16-18 October 2006, the PISA Governing Board (PGB) reviewed a first set of draft technical standards for the PISA 2009 assessment.
The purpose of this document is to list the set of standards upon which the PISA 2009 data collection activities will be based, as was the case for previous PISA assessments. In following the procedures specified in the standards, the partners involved in the data collection activities contribute to creating an international dataset of a quality that allows for valid cross-national inferences to be made.
The standards for data collection and submission were developed with three major, and inter-related, goals in mind: consistency, precision and generalisability of the data. Furthermore, the standards serve to ensure a timely progression of the project in general.
•Consistency: Data should be collected in an equivalent fashion in all countries, using equivalent test materials. A comparable sample of the student population should perform under test conditions that are as similar as possible. Given consistent data collection, test results are comparable across regions and countries. The test results in different countries will reflect differences in the literacy’s measured, and will not be caused by factors which are un-related to literacy.
•Precision: Data collection and submission practices should leave as little room as possible for spurious variation or error. This holds for both systematic and random error sources, e.g. when the testing environment differs from one group of students to another, or when data entry procedures leave room for interpretation. An increase in precision relates directly to the quality of results one can expect: The more precise the data, the more powerful the (statistical) analyses, and the more trustworthy the results to be obtained.
•generalisability: Data are collected from specific individuals, in a specific situation, and at a certain point in time. Individuals to be tested, test materials and tasks etc. should be selected in a way that will ensure that the conclusions reached from a given set of data do not simply reflect the setting in which the data were collected but hold for a variety of settings and are valid in the target population at large. Thus, collecting data from a representative sample of the population, for example, will lead to results that accurately reflect the level of literacy of fifteen-year-old students in a country.
•timeliness: Consistency, precision and generalisability of the data can be obtained in a variety of ways. However, the tight timelines and budgets in PISA, as well as the sheer number of participating countries, preclude the option of developing and monitoring local solutions to be harmonized at a later stage in the project. Therefore, the standards specify one clear-cut path along which data collection and data submission should progress.
This document strives to establish a collective agreement of mutual accountability among countries, and of the International Contractors towards the countries. This document details each standard, its rationale, and the quality assurance data that need to be collected to demonstrate that the standard has been met.
Where standards have been fully met, data will be recommended for inclusion in the PISA 2009 dataset. Where standards have not been fully met, an adjudication process will determine the extent to which the quality and international comparability of the data have been affected. The result of data adjudication will determine whether the data will be recommended for inclusion in the PISA 2009 dataset.
Since attaining the various standards is cumulative and potentially interactive (i.e. not attaining standard X is NOT the same as not attaining standards X, Y and Z), in principle each dataset should be evaluated against all standards jointly. Also, it is possible that countries’ proposed plans for implementation are not, for various and often unforeseen circumstances, actually implemented (e.g. national teacher strike affecting not only response rates but also testing conditions; unforeseen National Centre budget cuts which impact on print and data management quality). Therefore, the final evaluation of standards needs to be made with respect to the data as submitted since this is the definitive indication of what may appear in the released international dataset.
If any issues with attaining standards are identified, the International Project Director initiates communication with the National Centre as soon as possible. Priority in communication rectifies the identified issues.

Annex G: PISA 2009 TeCHnICAL STAnDARDS
368 © OECD 2012 – PISA 2009 TECHNICAL REPORT
The PISA standards act as a benchmark of best practice. As such, the standards are designed to assist national centres and international contractors by explicitly indicating the expectations of data quality and study implementation endorsed by the PISA Governing Board, and by clarifying the timelines of the activities involved. The standards formulate levels of attainment, while timelines and feedback schedules of both the participating countries and the international contractors are defined in the PISA Operations Manuals.
As specified in the Contracts for the Implementation of the fourth cycle of the OECD Programme for International Student Assessment, the International Contractors take responsibility for developing and implementing procedures for assuring data quality (Annexes B and D). Therefore, the International Contractors mediate, and monitor the countries’ activities specified in this document, while the International Contractors’ adherence to the standards is monitored by the participating countries via the OECD Secretariat.
There are three types of standards in this document; each with a specific purpose:
•data Standards refer to aspects of study implementation that directly concern the quality of the data or the assurance of that quality. These standards have been endorsed by the Technical Advisory Group and wherever proportions or quantities are specified (for example, response rates), these have reached through examination of research undertaken or reviewed by members of the Technical Advisory Group with the aim of minimising the effect of any potential bias in the data.
•management Standards are in place to ensure that all PISA operational objectives are met in a timely and co-ordinated manner.
•national Involvement Standards reflect the expectations set out in the PISA 2009 Terms of Reference that the content of the PISA tests is established in consultation with national representatives with international content expertise. In particular, these standards ensure that the internationally developed instruments are widely examined for cross-national, cross-cultural and cross-linguistic validity and that the interests and involvement of national stakeholders are considered throughout the study.
ForMat oF the docuMentThe standards are grouped into sections that relate to specific tasks in the PISA data collection process. For every section, a rationale is given explaining why standard setting is necessary. The standards in each section consist of three distinct elements. First, there are the Standards themselves that are numbered and are shown in shaded boxes . Second, there are notes that provide additional information on the standards directly. The notes are listed after the standards in each section. Third, there are the Quality assurance measures that will be used to assess if a standard has been met or not. These are listed at the end of each section. In addition, the standards contain words that have a defined meaning in the context of the standards. These words are shown in italics throughout the document and are clarified in the definitions section at the end of the document, where the terms are listed alphabetically.
ScoPeThe standards in this document apply to data from adjudicated entities that include both PISA participants and additional adjudicated entities. The PISA Governing Board will approve the list of adjudicated entities to be included in a PISA cycle.
data StandardS
1. Target population and samplingRationale: Meeting the standards specified in this section will ensure that in all countries, the students tested come from the same target population in every country, and are in a nearly equivalent age range. Therefore, the results obtained will not be confounded by potential age effects. Furthermore, to be able to draw conclusions that are valid for the entire population of fifteen-year-old students, a representative sample shall be selected for participation in the test. The size of this representative sample should not be too small, in order to achieve a certain precision of measurement in all countries. For this reason, minimum numbers of participating students and schools are specified.
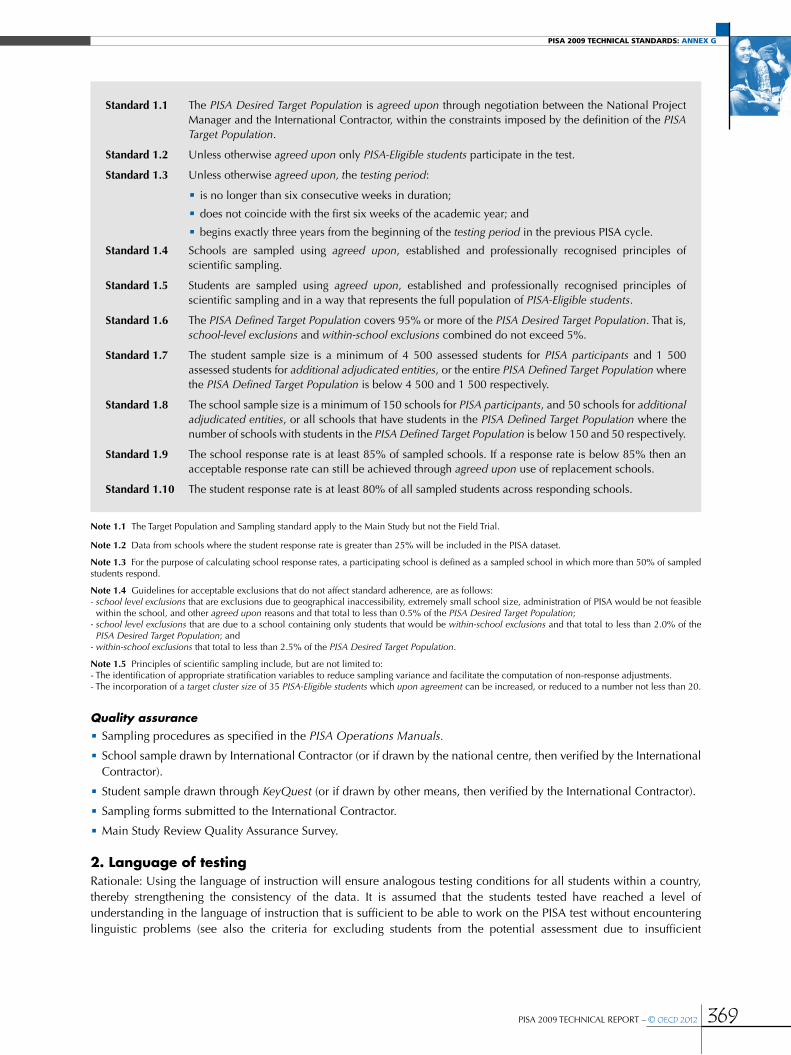
PISA 2009 TECHNICAL STANDARDS: ANNEx G
PISA 2009 TECHNICAL REPORT – © OECD 2012 369
Standard 1.1 The PISA Desired Target Population is agreed upon through negotiation between the National Project Manager and the International Contractor, within the constraints imposed by the definition of the PISA Target Population.
Standard 1.2 Unless otherwise agreed upon only PISA-Eligible students participate in the test.
Standard 1.3 Unless otherwise agreed upon, the testing period:
•is no longer than six consecutive weeks in duration;
•does not coincide with the first six weeks of the academic year; and
•begins exactly three years from the beginning of the testing period in the previous PISA cycle.
Standard 1.4 Schools are sampled using agreed upon, established and professionally recognised principles of scientific sampling.
Standard 1.5 Students are sampled using agreed upon, established and professionally recognised principles of scientific sampling and in a way that represents the full population of PISA-Eligible students.
Standard 1.6 The PISA Defined Target Population covers 95% or more of the PISA Desired Target Population. That is, school-level exclusions and within-school exclusions combined do not exceed 5%.
Standard 1.7 The student sample size is a minimum of 4 500 assessed students for PISA participants and 1 500 assessed students for additional adjudicated entities, or the entire PISA Defined Target Population where the PISA Defined Target Population is below 4 500 and 1 500 respectively.
Standard 1.8 The school sample size is a minimum of 150 schools for PISA participants, and 50 schools for additional adjudicated entities, or all schools that have students in the PISA Defined Target Population where the number of schools with students in the PISA Defined Target Population is below 150 and 50 respectively.
Standard 1.9 The school response rate is at least 85% of sampled schools. If a response rate is below 85% then an acceptable response rate can still be achieved through agreed upon use of replacement schools.
Standard 1.10 The student response rate is at least 80% of all sampled students across responding schools.
note 1.1 The Target Population and Sampling standard apply to the Main Study but not the Field Trial.
note 1.2 Data from schools where the student response rate is greater than 25% will be included in the PISA dataset.
note 1.3 For the purpose of calculating school response rates, a participating school is defined as a sampled school in which more than 50% of sampled students respond.
note 1.4 Guidelines for acceptable exclusions that do not affect standard adherence, are as follows:- school level exclusions that are exclusions due to geographical inaccessibility, extremely small school size, administration of PISA would be not feasible
within the school, and other agreed upon reasons and that total to less than 0.5% of the PISA Desired Target Population;- school level exclusions that are due to a school containing only students that would be within-school exclusions and that total to less than 2.0% of the
PISA Desired Target Population; and- within-school exclusions that total to less than 2.5% of the PISA Desired Target Population.
note 1.5 Principles of scientific sampling include, but are not limited to: - The identification of appropriate stratification variables to reduce sampling variance and facilitate the computation of non-response adjustments.- The incorporation of a target cluster size of 35 PISA-Eligible students which upon agreement can be increased, or reduced to a number not less than 20.
Quality assurance•Sampling procedures as specified in the PISA Operations Manuals.
•School sample drawn by International Contractor (or if drawn by the national centre, then verified by the International Contractor).
•Student sample drawn through KeyQuest (or if drawn by other means, then verified by the International Contractor).
•Sampling forms submitted to the International Contractor.
•Main Study Review Quality Assurance Survey.
2. Language of testingRationale: Using the language of instruction will ensure analogous testing conditions for all students within a country, thereby strengthening the consistency of the data. It is assumed that the students tested have reached a level of understanding in the language of instruction that is sufficient to be able to work on the PISA test without encountering linguistic problems (see also the criteria for excluding students from the potential assessment due to insufficient
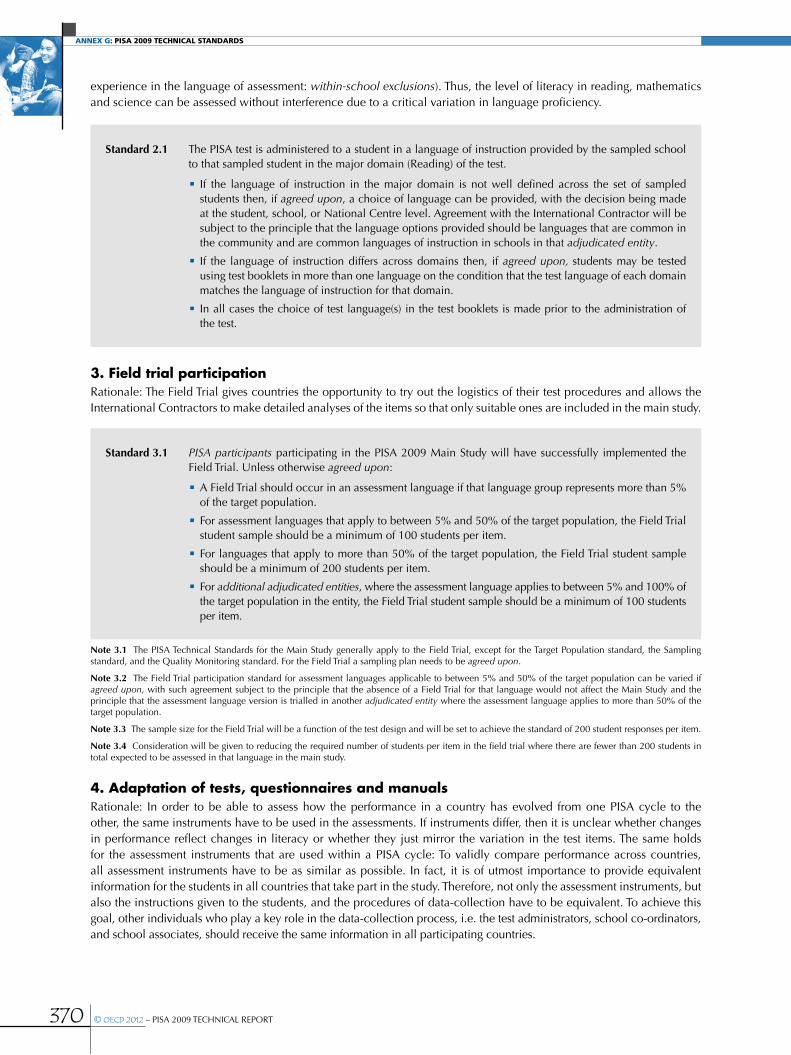
Annex G: PISA 2009 TeCHnICAL STAnDARDS
370 © OECD 2012 – PISA 2009 TECHNICAL REPORT
experience in the language of assessment: within-school exclusions). Thus, the level of literacy in reading, mathematics and science can be assessed without interference due to a critical variation in language proficiency.
Standard 2.1 The PISA test is administered to a student in a language of instruction provided by the sampled school to that sampled student in the major domain (Reading) of the test.
•If the language of instruction in the major domain is not well defined across the set of sampled students then, if agreed upon, a choice of language can be provided, with the decision being made at the student, school, or National Centre level. Agreement with the International Contractor will be subject to the principle that the language options provided should be languages that are common in the community and are common languages of instruction in schools in that adjudicated entity.
•If the language of instruction differs across domains then, if agreed upon, students may be tested using test booklets in more than one language on the condition that the test language of each domain matches the language of instruction for that domain.
•In all cases the choice of test language(s) in the test booklets is made prior to the administration of the test.
3. Field trial participationRationale: The Field Trial gives countries the opportunity to try out the logistics of their test procedures and allows the International Contractors to make detailed analyses of the items so that only suitable ones are included in the main study.
Standard 3.1 PISA participants participating in the PISA 2009 Main Study will have successfully implemented the Field Trial. Unless otherwise agreed upon:
•A Field Trial should occur in an assessment language if that language group represents more than 5% of the target population.
•For assessment languages that apply to between 5% and 50% of the target population, the Field Trial student sample should be a minimum of 100 students per item.
•For languages that apply to more than 50% of the target population, the Field Trial student sample should be a minimum of 200 students per item.
•For additional adjudicated entities, where the assessment language applies to between 5% and 100% of the target population in the entity, the Field Trial student sample should be a minimum of 100 students per item.
note 3.1 The PISA Technical Standards for the Main Study generally apply to the Field Trial, except for the Target Population standard, the Sampling standard, and the Quality Monitoring standard. For the Field Trial a sampling plan needs to be agreed upon.
note 3.2 The Field Trial participation standard for assessment languages applicable to between 5% and 50% of the target population can be varied if agreed upon, with such agreement subject to the principle that the absence of a Field Trial for that language would not affect the Main Study and the principle that the assessment language version is trialled in another adjudicated entity where the assessment language applies to more than 50% of the target population.
note 3.3 The sample size for the Field Trial will be a function of the test design and will be set to achieve the standard of 200 student responses per item.
note 3.4 Consideration will be given to reducing the required number of students per item in the field trial where there are fewer than 200 students in total expected to be assessed in that language in the main study.
4. Adaptation of tests, questionnaires and manualsRationale: In order to be able to assess how the performance in a country has evolved from one PISA cycle to the other, the same instruments have to be used in the assessments. If instruments differ, then it is unclear whether changes in performance reflect changes in literacy or whether they just mirror the variation in the test items. The same holds for the assessment instruments that are used within a PISA cycle: To validly compare performance across countries, all assessment instruments have to be as similar as possible. In fact, it is of utmost importance to provide equivalent information for the students in all countries that take part in the study. Therefore, not only the assessment instruments, but also the instructions given to the students, and the procedures of data-collection have to be equivalent. To achieve this goal, other individuals who play a key role in the data-collection process, i.e. the test administrators, school co-ordinators, and school associates, should receive the same information in all participating countries.

PISA 2009 TECHNICAL STANDARDS: ANNEx G
PISA 2009 TECHNICAL REPORT – © OECD 2012 371
Standard 4.1 Test items used for linking are administered unchanged from their previous administration.
Standard 4.2 All test instruments are psychometrically equivalent to the source versions. Agreed upon adaptations to the local context are made if needed.
Standard 4.3 The questionnaire instruments are equivalent to the source versions. Agreed upon adaptations to the local context are made if needed.
Standard 4.4 The Test Administrator Manual and the School Co-ordinator Manual (or the School Associate Manual) are equivalent to the source versions. Agreed upon adaptations to the local context are made if needed.
note 4.1 The quality assurance requirements for this standard apply to instruments that are in an assessment language used as a language of instruction for more than 5% of the target population.
Quality assurance•Agreed Upon National Adaptation Spreadsheet
•Verifier Report
•Final Optical Check Report (test booklets and questionnaires only)
•Field Trial and Main Study Review Quality Assurance Surveys
•Item and scale statistics
5. Translation of tests, questionnaires and manualsRationale: To be able to compare the performance of students across countries, and of students with different instruction languages within a country, the linguistic equivalence of all materials is central. While Standards 4.1 to 4.4 serve to ensure that equivalent information is given to the students in all countries involved, in general, the following Standards 5.1 and 5.2 emphasise the importance of language. Again the goal is to ensure that literacy will be assessed, and not variations of information caused by differences in the translation of materials.
Standard 5.1 The following documents are translated into the assessment language in order to be linguistically equivalent to the international source versions.
•All administered test instruments
•All administered questionnaires
•The Test Administrator script from the Test Administrator (or School Associate) Manual
•The Coding Guides
Standard 5.2 Unless otherwise agreed upon, the following documents are translated/adapted into the assessment language to make them linguistically equivalent to the international source versions.
•The Test Administrator (or School Associate) Manual
•The School Co-ordinator (or School Associate) Manual
In the case of the manuals, only specified parts are made linguistically equivalent.
note 5.1 The quality assurance requirements for this standard apply to instruments that are in a language that is administered to more than 5% of the target population.
note 5.2 The "specified parts" of manuals referred to in Standard 5.2 for which checking of the linguistic equivalence to the source versions would be undertaken are the following:-The criteria for student eligibility.-The number of students to be sampled from each school.-The definitions, codes and instructions related to the coding of the Student Tracking Form, including examples to illustrate these codes.-The General Directions as well as instructions relating to the timing of sessions. -The Session Report Form completed by the test administrator for each testing session, which records session and timing information.
Quality assurance•Agreed upon Translation Plan developed in accordance with the specifications in the PISA operations manuals where
the Translation Plan would normally require double translation by independent translators from French and English source versions.
•Verifier report.
•Final Optical Check report (test booklets and questionnaires only).
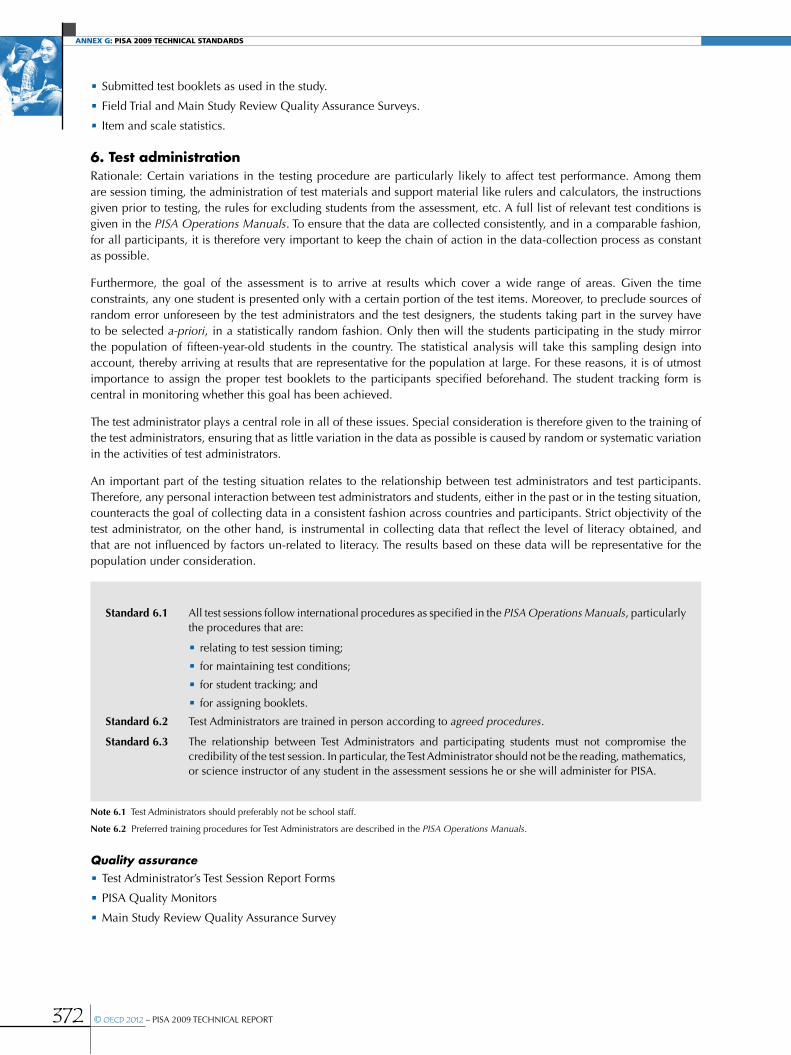
Annex G: PISA 2009 TeCHnICAL STAnDARDS
372 © OECD 2012 – PISA 2009 TECHNICAL REPORT
•Submitted test booklets as used in the study.
•Field Trial and Main Study Review Quality Assurance Surveys.
•Item and scale statistics.
6. Test administrationRationale: Certain variations in the testing procedure are particularly likely to affect test performance. Among them are session timing, the administration of test materials and support material like rulers and calculators, the instructions given prior to testing, the rules for excluding students from the assessment, etc. A full list of relevant test conditions is given in the PISA Operations Manuals. To ensure that the data are collected consistently, and in a comparable fashion, for all participants, it is therefore very important to keep the chain of action in the data-collection process as constant as possible.
Furthermore, the goal of the assessment is to arrive at results which cover a wide range of areas. Given the time constraints, any one student is presented only with a certain portion of the test items. Moreover, to preclude sources of random error unforeseen by the test administrators and the test designers, the students taking part in the survey have to be selected a-priori, in a statistically random fashion. Only then will the students participating in the study mirror the population of fifteen-year-old students in the country. The statistical analysis will take this sampling design into account, thereby arriving at results that are representative for the population at large. For these reasons, it is of utmost importance to assign the proper test booklets to the participants specified beforehand. The student tracking form is central in monitoring whether this goal has been achieved.
The test administrator plays a central role in all of these issues. Special consideration is therefore given to the training of the test administrators, ensuring that as little variation in the data as possible is caused by random or systematic variation in the activities of test administrators.
An important part of the testing situation relates to the relationship between test administrators and test participants. Therefore, any personal interaction between test administrators and students, either in the past or in the testing situation, counteracts the goal of collecting data in a consistent fashion across countries and participants. Strict objectivity of the test administrator, on the other hand, is instrumental in collecting data that reflect the level of literacy obtained, and that are not influenced by factors un-related to literacy. The results based on these data will be representative for the population under consideration.
Standard 6.1 All test sessions follow international procedures as specified in the PISA Operations Manuals, particularly the procedures that are:
•relating to test session timing;
•for maintaining test conditions;
•for student tracking; and
•for assigning booklets.
Standard 6.2 Test Administrators are trained in person according to agreed procedures.
Standard 6.3 The relationship between Test Administrators and participating students must not compromise the credibility of the test session. In particular, the Test Administrator should not be the reading, mathematics, or science instructor of any student in the assessment sessions he or she will administer for PISA.
note 6.1 Test Administrators should preferably not be school staff.
note 6.2 Preferred training procedures for Test Administrators are described in the PISA Operations Manuals.
Quality assurance•Test Administrator’s Test Session Report Forms
•PISA Quality Monitors
•Main Study Review Quality Assurance Survey

PISA 2009 TECHNICAL STANDARDS: ANNEx G
PISA 2009 TECHNICAL REPORT – © OECD 2012 373
7. Implementation of national optionsRationale: These standards serve to ensure that for students participating both in the international and the national survey, the national instruments will not affect the data used for the international comparisons. Data are therefore collected consistently across countries, and potential effects like test fatigue, or learning effects from national test items, are precluded.
Standard 7.1 Only national options that are agreed upon between the National Centre and the International Contractor are implemented.
Standard 7.2 Any national option instruments that are not part of the core component of PISA are administered after all the test and questionnaire instruments of the core component of PISA have been administered to students that are part of the international PISA sample.
8. Security of the materialRationale: The goal of the PISA assessment is to measure the literacy levels in the content domains. Prior familiarisation with the test materials, or training to the test, will heavily degrade the consistency and validity of the data. In the extreme case, the results would only reflect how well participants are able to memorise the test items. In order to be able to assess the competencies obtained during schooling rather than short-term learning success, and to make valid international comparisons, confidentiality is extremely important.
Standard 8.1 PISA materials designated as secure are kept confidential at all times. Secure materials include all test materials, data, and draft materials. In particular:
•no-one other than approved project staff and participating students during the test session is able to access and view the test material;
•no-one other than approved project staff will have access to secure PISA data and embargoed material; and
•formal confidentiality arrangements will be in place for all approved project staff.
Quality assurance•Security arrangements as specified in the PISA operations manuals or agreed upon variation
•National Centre Quality Monitor Interview
•Field Trial and Main Study Review Quality Assurance Surveys
9. Quality monitoringRationale: To obtain valid results from the assessment, the data collected have to be of high quality, i.e. they have to be collected in a consistent, reliable and valid fashion. This goal is implemented first and foremost by the test administrators, who are seconded by the quality monitors. The quality monitors provide country-wide supervision of all data-collection activities.
Standard 9.1 PISA test administration is monitored using site visits by trained independent quality monitors.
Standard 9.2 At least 15 site visits are conducted for each PISA participant. At least five site visits are conducted for each additional adjudicated region.
Standard 9.3 Test administration sessions that are the subject of a site visit are randomly selected.
note 9.1 A failure to meet the Quality Monitoring standard in the Main Study will lead to a significant lack of quality assurance data for other standards.
note 9.2 The Quality Monitoring standards apply to the Main Study but not to the Field Trial.
note 9.3 The National Centre provides the International Contractor the assistance required to implement the site visits effectively.
Quality assurance•Curricula Vitae of the PISA Quality Monitor nominees forwarded by the National Project Manager to the International
Contractor
•PISA Quality Monitor Reports
•National Centre Quality Monitor Visit Report

Annex G: PISA 2009 TeCHnICAL STAnDARDS
374 © OECD 2012 – PISA 2009 TECHNICAL REPORT
10. Printing of materialRationale: Variations in print quality may affect data quality. When the quality of paper and print is very poor, the performance of students is influenced not only by their levels of literacy, but also by the degree to which test materials are legible. To rule out this potential source of error, and to increase the consistency and precision of the data collection, paper and print quality samples are solicited from national centres in their first cycle of participation.
Standard 10.1 All student assessment material is printed using an agreed upon paper and print quality.
Standard 10.2 The cover page of all PISA assessment instruments used in schools contains all information as specified by the PISA Governing Board.
Standard 10.3 The layout and pagination of all test material is the same as in the source versions, unless otherwise agreed upon.
Standard 10.4 The layout and formatting of the questionnaire material is equivalent to the source versions.
note 10.1 For National Centres that have participated in previous cycles, PISA instruments used in previous cycles or from the Field Trial preceding the Main Study that have been submitted to the International Contractors can be used for the purpose of agreeing on printing quality where the national centre indicates that printing and paper of the same standard will be used. Otherwise, National Centres will submit a sample of printed material to the International Contractors for agreement, including the cover and selected items as specified in the PISA Operations Manuals.
note 10.2 The cover page of all PISA assessment instruments used in schools should contain all information necessary to identify the material as being part of the data-collection process for PISA, and for checking whether the data collection follows the assessment design, i.e. whether the mapping of the student on the one hand, and test booklets and questionnaires, on the other, have been correctly established The features of the cover page referred to in Standard 10.2 are specified in the PISA Operations Manuals.
Quality assurance•Submitted sample or agreement that quality will be similar to previous cycle or Field Trial versions.
•Booklets submitted to International Contractor to meet Standard 16.4.
•Booklets submitted for The International Coding Review (ICR) (Main Study only).
•Field Trial and Main Study Review Quality Assurance Surveys.
11. Response coding1
Rationale: To ensure the comparability of the data, the responses from all test participants in all participating countries have to be coded following one single coding scheme. Therefore, all coding procedures have to be standardised, and coders have to complete training sessions to master this task.
Standard 11.1 The coding scheme described in the coding guide in the distributed items is implemented according to instructions from the International Contractors’ item developers.
Standard 11.2 Representatives from each National Centre attend the international PISA coder training session for both the Field Trial and the Main Study.
Standard 11.3 Both the single and multiple coding procedures as specified in the PISA Operations Manuals (See Note 1), or an agreed upon variation thereof, are implemented.
Standard 11.4 Coders are recruited and trained following agreed procedures.
note 11.1 Preferred procedures for recruiting and training coders are outlined in the PISA Operations Manuals
note 11.2 The optimum number of Coder Training session participants would depend on factors such as the expertise of National Centre staff, and resource availability.
Quality assurance
•Indices of inter-coder agreement
•International Coding Review (ICR)
•Field Trial and Main Study Review Quality Assurance Surveys
1. The terms coding, coders and codes are used instead of other terms such as marking, markers, marks, rating and raters.

PISA 2009 TECHNICAL STANDARDS: ANNEx G
PISA 2009 TECHNICAL REPORT – © OECD 2012 375
12. Data submissionRationale: The timely progression of the project, within the tight timelines given depends on the quick and efficient submission of all collected data. Therefore, one single data submission format is proposed, and countries are asked to submit only one database to the International Contractor. Furthermore, to avoid potential errors when consolidating the national databases, any changes in format that were implemented subsequent to the general agreement have to be announced.
Standard 12.1 Each PISA participant submits its data in a single database, unless otherwise agreed upon.
Standard 12.2 Data are submitted in the KeyQuest format.
Standard 12.3 Data for all instruments are submitted. This includes the test data, questionnaire data, and tracking data as described in the PISA Operations Manuals.
Standard 12.4 Unless agreed upon, all data are submitted without recoding any of the original response variables.
Standard 12.5 Each PISA participating country’s database is submitted with full documentation as specified in the PISA Operations Manuals.
ManageMent StandardS
13. Communication with the International ContractorsRationale: Given the tight schedule of the project, delays in communication between the National Centres and the International Contractors should be minimised. Therefore, National Centres need continuous access to the resources provided by the International Contractors.
Standard 13.1 The International Contractors ensure that qualified staff are available to respond to requests by the National Centres during all stages of the project. The qualified staff:
•are authorised to respond to National Centre queries;
•acknowledge receipt of National Centre queries within one working day;
•respond to coder queries from National Centres within one working day; and
•respond to other queries from National Centres within five working days, or, if processing the query takes longer, give an indication of the amount of time required to respond to the query.
note 13.1 Response timelines and feedback schedules for the National Centres and the International Contractors are further specified in the PISA Operations Manuals.
14. Notification of international and national optionsRationale: Given the tight timelines, the deadlines given in the following two standards will enable the International Contractors to progress with their work on time.
Standard 14.1 National options are agreed upon before 1 December 2007 for the Field Trial and before 1 December 2008 for the Main Study (Standard 7.1).
Standard 14.2 The national centre notifies the International Contractors of its intention to participate in specific international options before 1 December 2007.

Annex G: PISA 2009 TeCHnICAL STAnDARDS
376 © OECD 2012 – PISA 2009 TECHNICAL REPORT
15. Schedule for submission of materialsRationale: To meet the requirements of the work programme, and to progress according to the timelines of the project, the International Contractors will need to receive a number of materials on time.
Standard 15.1 An agreed upon Translation Plan and Preferred Verification Schedule will be negotiated between each national centre and the International Contractor.
Standard 15.2 The following items are submitted to the International Contractor in accordance with agreed timelines:
•the Translation Plan and Preferred Verification Schedule;
•a print sample of booklets prior to final printing (where this is required, see Standard 10.1 and Note 10.1);
•sampling forms (see Standard 1);
•Study Programme Tables;
•Field Trial and Main Study Reviews; and
•other documents as specified in the PISA Operations Manuals.
Standard 15.3 Questionnaire materials are submitted for linguistic verification only after all adaptations have been agreed upon.
Standard 15.4 Those elements of the Test Administrator and School Co-ordinator (or School Associate) manuals requiring linguistic verification (specified in Standard 5.2) are submitted only after all adaptations have been agreed upon.
Quality assurance•Agreed upon Translation Plan and Preferred Verification Schedule
•International Contractor records
16. Drawing samplesRationale: The mode of drawing the samples used in the study is crucial to data quality. The goal of the project is to collect data that are representative for the population at large. To reach this goal, the sampling procedures have to follow established scientific rules. Furthermore, the comparability of the data across countries is guaranteed if the same procedure is used for all national samples. If different sampling procedures are used, then the equivalence of the sampling quality has to be determined.
Standard 16.1 For efficient and effective quality assurance provision, unless otherwise agreed upon, the International Contractor will draw the school sample for the Main Study and KeyQuest will be used to draw the student sample.
•Agreement with the International Contractor will be subject to the principle that the sampling methods used are scientifically valid and consistent with PISA’s documented sampling methods. Where a PISA participating country chooses to draw the school sample or to not use KeyQuest to draw the student sample, the National Centre provides the International Contractor with the data and documentation required for it to verify the correctness of the sampling procedures applied.
note 16.1 Any costs associated with verifying a sample taken by the National Centre will be borne by the National Centre.
17. Management of data Rationale: Consolidating and merging the national databases is a time-consuming and difficult task. To ensure the timely and efficient progress of the project, the International Contractors need continuous access to national resources helping to rule out uncertainties and to resolve discrepancies. This standard aims to prevent substantial delays to the whole project which could result from a delay in processing the data of a small number of participating countries.

PISA 2009 TECHNICAL STANDARDS: ANNEx G
PISA 2009 TECHNICAL REPORT – © OECD 2012 377
Standard 17.1 The timeline for submission of national databases to the International Contractor is within eight weeks of the last day of testing for the Field Trial and within 12 weeks of the last day of testing for the Main Study, unless otherwise agreed upon.
Standard 17.2 National Centres execute data checking procedures as specified in the PISA Operation Manuals before submitting the database.
Standard 17.3 National Centres make a data manager available upon submission of the database. The data manager:
•is authorised to respond to International Contractor data queries;
•is available for a three-month period immediately after the database is submitted unless otherwise agreed upon;
•is able to respond to International Contractor queries within three working days; and
•is able to resolve data discrepancies.
Standard 17.4 A complete set of PISA instruments as administered and including any national options, is forwarded to the International Contractor on or before the first day of testing. The submission includes the following:
•hard copies of instruments; and
•PDF copies of instruments.
Standard 17.5 To enable the PISA participant to submit a single dataset, all instruments for all additional adjudicated entities will contain the same variables as the primary adjudicated entity of the PISA participant.
Quality assurance•International Contractor Records
18. Archiving of materialsRationale: The International Contractor will maintain an electronic archive. This will provide an overview of all materials used and ensure continuity of materials available in participating countries across PISA survey cycles, therefore building upon the knowledge gained nationally in the course of the PISA cycles. This will also ensure that the International Contractors have the relevant materials available during data cleaning, when they are first required.
Standard 18.1 The International Contractor will maintain a permanent electronic archive of all assessment materials, field manuals and coding guides. To facilitate this, the National Project Manager submits one copy of each of the following translated and adapted Main Study materials to the International Contractor in the source version software format:
•all administered Test Instruments, including national options;
•all administered Questionnaires, including national options;
•Test Administrator, School Co-ordinator and School Associate manuals; and
•Coding Guides.
Standard 18.2 Unless otherwise requested, National Centres will archive all Field Trial materials until the beginning of the Main Study, and all Main Study materials until the publication of the international report. Materials to be archived include:
•all respondents’ test booklets and questionnaires;
•sampling forms;
•student lists;
•student tracking instruments; and
•all data submitted to the International Contractor.
note 18.1 Each participating country/economy will receive its own national micro-level PISA database (the “national database”), in electronic form as soon as it has been processed from the International Contractors for PISA. The national database will contain the complete set of responses from the students, parents, school principals and surveyed participants in that country/economy.
Each participating country/economy has access to and can publish its own data after a date that is established by the PISA Governing Board for the publication of the initial OECD publication of the survey results (the “initial international OECD publication”).
The OECD Secretariat will not release national data to other countries/economies until participating countries/economies have been given an opportunity to review and comment on their own national data and until the release of such data has been approved by the national authorities.

Annex G: PISA 2009 TeCHnICAL STAnDARDS
378 © OECD 2012 – PISA 2009 TECHNICAL REPORT
A deadline and procedures for withdrawing countries/economies’ national data from the international micro-level PISA database (the “international database”) will be decided upon by the PISA Governing Board. Countries/economies can withdraw data only prior to obtaining access to data from other countries/economies. Withdrawn data will not be made available to other countries/economies.
The PISA Governing Board will discuss with participating countries/economies whose data manifests technical anomalies as to whether the data concerned can be included in the international database. The decision of the PISA Governing Board will be final. Participating countries/economies may, however, continue to use data that are excluded from the international database at the national level.
The OECD Secretariat will then compile the international database, which will comprise the complete set of national PISA databases, except those data elements that have been withdrawn by participating countries/economies or by the PISA Governing Board at the previous stage. The international database will remain confidential until the date on which the initial international OECD publication is released.
National data from all participating countries/economies represented in the international database will be made available to all participating countries/economies from the date on which the initial international OECD publication is released.
After release of the initial international OECD publication, the international database will be made publicly available on a cost-free basis, through the OECD Secretariat. The database may not be offered for sale.
The international database will form the basis for OECD indicator reports and publications.
The International Contractors for PISA 2009 will have no ownership of instruments or data nor any rights of publication and will be subject to the confidentiality terms set in this agreement.
The OECD establishes rules to ensure adherence to the above procedure and to the continued confidentiality of the PISA data and materials until the agreed release dates. These include confidentiality agreements with all individuals that have access to the PISA material prior to its release.
As guardian of the process and producer of the international database, the OECD will hold copyright in the database and in all original material used to develop, or be included in, the PISA Field Trial and PISA Main Study (among them the assessment materials, field manuals, and coding guides) in any language and format.
national involveMent StandardS
19. National feedbackNational feedback in areas such as test development is important in maintaining the dynamic and collaborative nature of PISA. National feedback ensures that instruments achieve cross-national, cross-cultural and cross-linguistic validity. It also promotes the inclusion of the interests and involvement of national stakeholders.
Standard 19.1 National Centres develop appropriate mechanisms in order to promote participation, effective implementation, and dissemination of results amongst all relevant national stakeholders.
Standard 19.2 National Centres provide feedback to the International Contractors on the development of instruments, domain frameworks, the adaptation of instruments, and other domain related matters that represents the perspectives of the relevant national stakeholders.
note 19.1 As a guideline feedback might be sought from the following relevant stakeholders: policy makers, curriculum developers, domain experts, test developers, linguistic experts and experienced teachers.
Quality assurance•National Centre Quality Monitor Visit
•Documented strategies
•List of committees and groups
•Membership records of representative groups and/or committees
•Meeting records of representative groups and/or committees
deFinitionSadditional adjudicated entities - entities in addition to the first and primary entity managed by a PISA participant, where a PISA participant manages more than one adjudicated entity.
adjudicated entity - a country, geographic region, or similarly defined population, for which the International Contractor fully implements quality assurance and quality control mechanisms and endorses, or otherwise, the publication of separate PISA results.
agreed procedures - procedures that are specified in the PISA operations manuals, or variations that are agreed upon between the National Project Manager and the International Contractors.
agreed timelines - timelines that are specified in the PISA operations manuals, or variations that are agreed upon between the National Project Manager and the International Contractors.

PISA 2009 TECHNICAL STANDARDS: ANNEx G
PISA 2009 TECHNICAL REPORT – © OECD 2012 379
agreed upon - variations and definitions agreed upon between the National Project Manager and the International Contractors. Agreed upon variations will be available to National Project Managers on their National Centre webpage on the International Contractor Website.
International Contractor website - website with address http://mypisa.acer.edu.au. This website contains the source versions of instruments, manuals and other documents and information relating to National Centres.
International Coding review - a quality assurance exercise that requires National Centres to send a sample of student test booklets to the International Contractors. The booklets required for the quality assurance study will be identified by the International Contractors after the National Centre’s data has been submitted. The number of booklets to be submitted by each PISA participating country/economy will depend on the number of languages of assessment, the number of adjudicated entities, and the number of coding centres used.
International option - optional additional international instruments or procedures designed and fully supported by the International Contractors.
KeyQuest - software developed by the International Contractor specifically for the PISA project. The software assists with sampling, student tracking and data submission practices that meet the PISA 2009 technical standards.
national Centre Quality monitor - an International Contractor representative who visits a National Centre in the month preceding the Main Study to train PISA Quality Monitors and conduct a scheduled interview with the National Project Manager.
national option - A national option occurs if:
•a National Centre administers any additional instrumentation, for example a test or questionnaire, to schools or students that are part of the PISA international sample. Note that in the case of adding items to the questionnaires, an addition of five or more items to either the school questionnaire or the student questionnaire is regarded as a national option.
OR
•a National Centre administers any PISA international instrumentation to any students or schools that are not part of an international PISA sample (age-based or grade-based) and therefore will not be included in the respective PISA international database.
PISa defined target Population - all PISA-Eligible students in the schools that are listed on the school sampling frame. That is, the PISA Desired Target Population minus exclusions.
PISa desired target Population - the PISA Target Population defined for a specific adjudicated entity. It provides the most exhaustive coverage of PISA-Eligible students in the adjudicated entity as is feasible.
PISa-eligible Students - students who are in the PISA Target Population.
PISa operations manuals - manuals provided by the International Contractors, that is the following:
•National Project Manager’s Manual
•Test Administrator Manual
•School Co-ordinator Manual
•School Associate Manual
•School Sampling Preparations Manual
•Data Management Manual
•All other key documents referenced within the National Project Manager’s manual
The preparation of the PISA Operations Manuals will be carried out by the International Contractors and will describe procedures developed by the International Contractors. The manuals will be prepared following consultation with participating countries/economies, the OECD Secretariat, the Technical Advisory Group and other stakeholders.
PISa Participant - an administration centre, commonly called a National Centre that is managed by a person, commonly called a National Project Manager, who is responsible for administering PISA in an adjudicated entity and in zero or more additional adjudicated entities. The National Project Manager must be authorised to communicate with the International Contractors on all operational matters relating to the adjudicated entities for which the National Project Manager is responsible.

Annex G: PISA 2009 TeCHnICAL STAnDARDS
380 © OECD 2012 – PISA 2009 TECHNICAL REPORT
PISa Quality monitor - a person nominated by the National Project Manager and employed by the International Contractors to monitor test administration quality in an adjudicated entity.
PISa target Population - students aged between 15 years and 3 (completed) months and 16 years and 2 (completed) months at the beginning of the testing period, attending educational institutions located within the adjudicated entity, and in grade 7 or higher. The age range of the population may vary up to one month, either older or younger, but the age range must remain 12 months in length. That is, the population can be as young as between 15 years and 2 (completed) months and 16 years and 1 (completed) months at the beginning of the testing period; or as old as between 15 years and 4 (completed) months and 16 years and 3 (completed) months at the beginning of the testing period.
Preferred verification Schedule - a schedule that provides a timeline for the submission of material relating to the adaptation of instruments and the submission of instruments for linguistic verification including the final optical check. This schedule can be found in the PISA National Project Manager’s Manual.
School Level exclusions - exclusion of schools from the sampling frame because:
•of geographical inaccessibility (but not part of a region that is omitted from the PISA Desired Target Population);
•of an extremely small size;
•administration of the PISA assessment within the school would not be feasible;
•all students in the school would be within-school exclusions; or
•of other reasons as agreed upon.
Source versions - documents provided in English and French by the International Contractors.
target Cluster Size - the number of students that are to be sampled from schools where not all students are to be included in the sample.
testing Period - the period of time during which data is collected in an adjudicated entity.
translation Plan - documentation of all the processes that are intended to be used for all activities related to translation and languages.
within-school exclusions - exclusion of students from potential assessment because of one of the following:
•They are functionally disabled in such a way that they cannot take the PISA test. Functionally disabled students are those with a moderate to severe permanent physical disability.
•They have a cognitive, behavioural or emotional disability confirmed by qualified staff, meaning they cannot take the PISA test. These are students who are cognitively, behaviourally or emotionally unable to follow even the general instructions of the assessment.
•They have insufficient assessment language experience to take the PISA test. Students who have insufficient assessment language experience are those who meet all the following criteria:
- they are not native speakers of the assessment language;
- they have limited proficiency in the assessment language;
- they have received less than one year of instruction in the assessment language;
- they cannot be assessed for some other reason as agreed upon.

pisa Consortium, staff and Consultants: annex H
PISA 2009 TECHNICAL REPORT – © OECD 2012 381
annex h – PiSa conSortiuM, StaFF and conSultantS
PISA Technical Advisory GroupKeith Rust (Chair) (Westat, USA)Ray Adams (ACER)John de Jong (Language Testing Services, Netherlands)Cees Glas (University of Twente, Netherlands)Aletta Grisay (Consultant, Saint-Maurice, France)David Kaplan (University of Wisconsin - Madison, USA)Christian Monseur (University of Liège, Belgium)Sophia Rabe-Hesketh (University of California - Berkeley, USA)Thierry Rocher (Ministry of Education, France)Norman Verhelst (CITO, Netherlands)Kentaro Yamamoto (ETS, New Jersey, USA)Rebecca Zwick (University of California - Santa Barbara, USA)
PISA Expert GroupsReading Expert GroupIrwin Kirsch (Education Testing Service, New Jersey, USA)Sachiko Adachi (Nigata University, Japan)Charles Alderson (Lancaster University, UK)John de Jong (Language Testing Services, Netherlands)John Guthrie (University of Maryland, USA)Dominique Lafontaine (University of Liège, Belgium)Minwoo Nam (Korea Institute of Curriculum and Evaluation)Jean-François Rouet (University of Poitiers, France)Wolfgang Schnotz (University of Koblenz-Landau, Germany)Eduardo Vidal-Abarca (University of Valencia, Spain)
Science Expert GroupRodger Bybee (Chair) (BSCS, Colorado Springs, USA)Peter Fensham (Queensland University of Technology, Australia)Svein Lie (University of Oslo, Norway)Yasushi Ogura (National Institute for Educational Policy Research, Japan)Manfred Prenzel (University of Kiel, Germany)Andrée Tiberghien (University of Lyon, France)
Mathematics Expert GroupJan de Lange (Chair) (Utrecht University, Netherlands)Werner Blum (University of Kassel, Germany)John Dossey (Illinois State University, USA)Zbigniew Marciniak (University of Warsaw, Poland)Mogens Niss (University of Roskilde, Denmark)Yoshinori Shimizu (University of Tsukuba, Japan)
Questionnaire Expert GroupJaap Scheerens (Chair) (University of Twente, Netherlands)Pascal Bressoux (Pierre Mendès University, France)Yin Cheong Cheng (Hong Kong Institute of Education, Hong Kong-China)David Kaplan (University of Wisconsin - Madison, USA)Eckhard Klieme (DIPF, Germany)Henry Levin (Columbia University, USA)Pirjo Linnakylä (University of Jyväskylä, Finland)Ludger Wößmann (University of Munich, Germany)
ACERRay Adams (International project director)Susan Bates (Project administration)Alla Berezner (Data management and analysis)Yan Bibby (Data processing and analysis)Esther Brakey (Administrative support)Wei Buttress (Project administration, quality monitoring)Renee Chow (Data processing and analysis)Judith Cosgrove (Data processing and analysis, national centre support)John Cresswell (Reporting and dissemination)

Annex H: pisA Consortium, stAff And ConsultAnts
382 © OECD 2012 – PISA 2009 TECHNICAL REPORT
Alex Daraganov (Data processing and analysis)Daniel Duckworth (Reading instruments, test development)Kate Fitzgerald (Data processing, sampling)Daniel Fullarton (IT services)Eveline Gebhardt (Data processing and analysis)Mee-Young Handayani (Data processing and analysis)Elizabeth Hersbach (Quality assurance)Sam Haldane (IT services, computer-based assessment)Karin Hohlfield (Reading instruments, test development)Jennifer Hong (Data processing, sampling)Tony Huang (Project administration and IT services)Madelaine Imber (Reading instruments, administrative support)Nora Kovarcikova (Survey operations)Winson Lam (IT services)Tom Lumley (Print and digital reading instruments, test development)Greg Macaskill (Data management and processing, sampling)Ron Martin (Science instruments, test development)Barry McCrae (Digital Reading Assessment manager, Science instruments, test development)Juliette Mendelovits (Print and digital reading instruments, test development)Martin Murphy (Field operations and sampling)Thoa Nguyen (Data processing and analysis)Penny Pearson (Administrative support)Anna Plotka (Graphic design)Alla Routitsky (Data management and processing)Wolfram Schulz (Management, Data analysis)Dara Searle (Print and digital reading instruments, test development)Naoko Tabata (Survey operations)Ross Turner (Management, mathematics instruments, test development)Daniel Urbach (Data processing and analysis)Eva Van de gaer (Data analysis)Charlotte Waters (Project administration, data processing and analysis)Maurice Walker (Digital Reading Assessment, Sampling)Wahyu Wardono (Project administration, IT services)Louise Wenn (Data processing and analysis)Yan Wiwecka (IT services)
WestatEugene Brown (Weighting)Fran Cohen (Weighting)Susan Fuss (Sampling and weighting)Amita Gopinath (Weighting)Sheila Krawchuk (Sampling, weighting and quality monitoring)Thanh Le (Sampling, weighting, and quality monitoring)Jane Li (Sampling and weighting)John Lopdell (Sampling and weighting)Shawn Lu (Weighting)Keith Rust (Director of the PISA Consortium for sampling and weighting)William Wall (Weighting)Erin Wilson (Sampling and weighting)Marianne Winglee (Weighting)Sergey Yagodin (Weighting).
The National Institute for Educational Research in Japan Hidefumi Arimoto (Reading instruments, test development) Hisashi Kawai (Reading instruments, test development)
cApStAn Linguistic Quality Control Steve Dept (Translation and verification operations)Andrea Ferrari (Translation and verification methodology)Laura Wäyrynen (Verification management)
Unité d’analyse des systèmes et des pratiques d'enseignement (aSPe)Ariane Baye (Print reading and digital reading instruments, test development)Casto Grana-Monteirin (Translation and verification)Dominique Lafontaine (Member of the Reading Expert Group)Christian Monseur (Data analysis and member of the TAG)

pisa Consortium, staff and Consultants: annex H
PISA 2009 TECHNICAL REPORT – © OECD 2012 383
Anne Matoul (Translation and verification)Patricia Schillings (Print reading and digital reading instruments, test development)
Deutsches Institut für Internationale Pädagogische Forschung (DIPF)Cordula Artelt (University of Bamberg) (Reading instrument and framework development)Michel Dorochevsky (Softcon) (Software Development)Frank Goldhammer (Digital reading instruments, test development)Dieter Heyer (Softcon) (Software Development) Nina Jude (Digital reading instruments, test development)Eckhard Klieme (Project Co-Director at DIPF)Holger Martin (Softcon) (Software Development)Johannes Naumann (Digital reading instruments, test development)Jean-Paul Reeff (International Consultant)Heiko Roelke (Project Co-Director at DIPF)Wolfgang Schneider (University of Würzburg) (Reading instrument and framework development)Petra Stanat (Humboldt University, Berlin) (Reading instruments, test development)Britta Upsing (Digital reading instruments, test development)
CITOEva van der Brugge (Questionnaire development)Anneke de Graaf (Questionnaire development)Janny Harmsen (Administrative support)Wil Knappers (Questionnaire development)Johanna Kordes (Questionnaire development)Hans Kuhlemeier (Questionnanaire development)Claudia Loijens (Questionnaire development)Henk Moelands (Project Director Core B)Astrid Mols (Administrative support)José Noijons (Co-ordinator Core B)Iris Smits (Questionnaire development)Saskia Wools (Questionnaire development)
University of TwenteCees Glas (Data analysis and member of the TAG)Khurrem Jehangir (Data analysis)Hans Luyten (Questionnaire development)Jaap Scheerens (Questionnaire development and chair of the QEG)
University of JyväskyläPirjo Linnakylä (Questionnaire development and member of the QEG)Jouni Välijärvi (Questionnaire development)
Direction de l'évaluation, de la prospective et de la performance (DEPP)Jacqueline Levasseur (Questionnaire development)Nathalie Mons (Questionnaire development)
Other expertsMieke van Diepen (Marnix Academy, Utrecht, Netherlands) (Questionnaire development)Tobias Dörfler (University of Bamberg) (Reading instrument development)Tove Stjern Frønes (ILS, University of Oslo) (Reading instrument development)Beatrice Halleux (Consultant, HallStat SPRL) (Translation/verification referee, French source development) Jannes Hartkamp (DESAN) (ISCO coding)Øystein Jetne (ILS, University of Oslo) (Print reading and digital reading instruments, test development)Kees Lagerwaard (Institute for Educational Measurement of Netherlands) (Mathematics instrument development)Pirjo Linnakylä (University of Jyväskylä) (Reading instrument development)Anne-Laure Monnier (Consultant, France) (French source development)Jan Mejding (Danish School of Education, University of Aarhus) (Print reading and digital reading development)Eva Kristin Narvhus (ILS, University of Oslo) (Print reading and digital reading instruments, test instruments, test development)Rolf V. Olsen (ILS, University of Oslo) (Science instrument development)Francesc Pedró (CERI, OECD, Paris) (Questionnaire development)Manfred Prenzel (IPN, University of Kiel, Germany) (Questionnaire development)Laurie Robert (New Brunswick Department of Education, Canada) (Science instrument development)Astrid Roe (ILS, University of Oslo) (Print reading and digital reading instruments, test development)Martin Senkbeil (IPN, University of Kiel, Germany) (Questionnaire development)Hanako Senuma (University of Tamagawa, Japan) (Mathematics instrument development)

Annex I: SeLeCTIOn OF OeCD PISA PUBLICATIOnS
384 © OECD 2012 – PISA 2009 TECHNICAL REPORT
annex i – Selection oF oecd PiSa PublicationS
oeCd (2000), Measuring Student Knowledge and Skills – The PISA 2000 Assessment of Reading, Mathematical and Scientific
Literacy, OECD Publishing.
oeCd (2001), Knowledge and Skills for Life: First Results from PISA 2000, OECD Publishing.
oeCd (2002), Reading for Change: Performance and Engagement across Countries – Results from PISA 2000, OECD Publishing.
oeCd (2002), PISA 2000 Technical Report, OECD Publishing.
oeCd (2002), Sample Tasks from the PISA 2000 Assessment, OECD Publishing.
oeCd (2004), Learning for Tomorrow’s World: First results from PISA 2003, OECD Publishing.
oeCd (2005), PISA 2003 Technical Report, OECD Publishing.
oeCd (2005), School Factors Related to Quality and Equity, OECD Publishing.
oeCd (2005), Where Immigrant Students Succeed – A Comparative Review of Performance and Engagement in PISA 2003,
OECD Publishing.
oeCd (2005), Are Students Ready for a Technology-Rich World – What PISA Studies Tell Us, OECD Publishing.
oeCd (2005), PISA 2003 Technical Report, OECD Publishing.
oeCd (2006), Assessing Scientific, Reading and Mathematical Literacy: A Framework for PISA 2006, OECD Publishing.
oeCd (2007), PISA 2006: Science Competencies for Tomorrow’s World, OECD Publishing.
oeCd (2008), PISA Data Analysis Manual, OECD Publishing.
oeCd (2008), PISA 2006 Technical Report, OECD Publishing.
oeCd (2009), Top of the Class, OECD Publishing.
oeCd (2009), Green at Fifteen – How 15-year-olds Perform in Environmental Science and Geoscience in PISA 2006,
OECD Publishing.
oeCd (2009), Take the Test – Sample Questions from OECD’s PISA Assessments, OECD Publishing.
oeCd (2010), Pathways to Success: How Knowledge and Skills at Age 15 Shape Future Lives in Canada, OECD Publishing.
oeCd (2010), The High Cost of Low Educational Performance, OECD Publishing.
oeCd (2010), Against the Odds: Disadvantaged Students who Succeed at School, OECD Publishing.
oeCd (2010), PISA 2009 Assessment Framework: Key Competencies in Reading, Mathematics and Science, OECD Publishing.
oeCd (2010), PISA 2009 Results: What Students Know and Can Do: Student Performance in Reading, Mathematics and Science
(Volume I), PISA, OECD Publishing.
oeCd (2010), PISA 2009 Results: Overcoming Social Background: Equity in Learning Opportunities and Outcomes (Volume II), PISA,
OECD Publishing.
oeCd (2010), PISA 2009 Results: Learning to Learn: Student Engagement, Strategies and Practices (Volume III),
PISA, OECD Publishing.
oeCd (2010), PISA 2009 Results: What Makes a School Successful?: Resources, Policies and Practices (Volume IV),
PISA, OECD Publishing.
oeCd (2010), PISA 2009 Results: Learning Trends: Changes in Student Performance Since 2000 (Volume V), PISA, OECD Publishing.
oeCd (2011), PISA 2009 Results: Students On Line: Digital Technologies and Performance (Volume VI), PISA, OECD Publishing.
oeCd (2010), Quality Time for Students: Learning In and Out of Schools, OECD Publishing.

OECD COuntriEs inCluDED in stanDarDisatiOn Of majOr Pisa sCalEs: annEx j
PISA 2009 TECHNICAL REPORT – © OECD 2012 385
annex J – oecd countrieS included in StandardiSation oF MaJor PiSa ScaleS
PISa 2000 reading PISa 2003 mathematics PISa 2006 Science
australia ✓ ✓ ✓
austria ✓ ✓ ✓
Belgium ✓ ✓ ✓
Canada ✓ ✓ ✓
Czech republic ✓ ✓ ✓
denmark ✓ ✓ ✓
Finland ✓ ✓ ✓
France ✓ ✓ ✓
germany ✓ ✓ ✓
greece ✓ ✓ ✓
hungary ✓ ✓ ✓
Iceland ✓ ✓ ✓
Ireland ✓ ✓ ✓
Italy ✓ ✓ ✓
japan ✓ ✓ ✓
Korea ✓ ✓ ✓
Luxembourg ✓ ✓ ✓
mexico ✓ ✓ ✓
netherlands ✓ ✓
new Zealand ✓ ✓ ✓
norway ✓ ✓ ✓
Poland ✓ ✓ ✓
Portugal ✓ ✓ ✓
Slovak republic ✓ ✓
Spain ✓ ✓ ✓
Sweden ✓ ✓ ✓
Switzerland ✓ ✓ ✓
turkey ✓ ✓
united Kingdom ✓ ✓ ✓
united States ✓ ✓ ✓
[Part 1/1] table j.1 oecd countries included in standardisation of major PiSa scales


ORGANISATION FOR ECONOMIC CO-OPERATION AND DEVELOPMENT
The OECD is a unique forum where governments work together to address the economic, social and
environmental challenges of globalisation. The OECD is also at the forefront of efforts to understand and
to help governments respond to new developments and concerns, such as corporate governance, the
information economy and the challenges of an ageing population. The Organisation provides a setting
where governments can compare policy experiences, seek answers to common problems, identify good
practice and work to co-ordinate domestic and international policies.
The OECD member countries are: Australia, Austria, Belgium, Canada, Chile, the Czech Republic,
Denmark, Estonia, Finland, France, Germany, Greece, Hungary, Iceland, Ireland, Israel, Italy, Japan, Korea,
Luxembourg, Mexico, the Netherlands, New Zealand, Norway, Poland, Portugal, the Slovak Republic, Slovenia,
Spain, Sweden, Switzerland, Turkey, the United Kingdom and the United States. The European Union takes
part in the work of the OECD.
OECD Publishing disseminates widely the results of the Organisation’s statistics gathering and
research on economic, social and environmental issues, as well as the conventions, guidelines and
standards agreed by its members.
OECD PUBLISHING, 2, rue André-Pascal, 75775 PARIS CEDEX 16
(98 2012 01 1 P) ISBN 978-92-64-04018-2 – No. 59805 2012

Please cite this publication as:
OECD (2012), PISA 2009 Technical Report, PISA, OECD Publishing.http://dx.doi.org/10.1787/9789264167872-en
This work is published on the OECD iLibrary, which gathers all OECD books, periodicals and statistical databases. Visit www.oecd-ilibrary.org, and do not hesitate to contact us for more information.
PISA 2009 Technical ReportThe PISA 2009 Technical Report describes the methodology underlying the PISA 2009 survey. It examines additional features related to the implementation of the project at a level of detail that allows researchers to understand and replicate its analyses. The reader will fi nd a wealth of information on the test and sample design, methodologies used to analyse the data, technical features of the project and quality control mechanisms.
Contents
Chapter 1. Programme for International Student Assessment: An overview
Chapter 2. Test design and test development
Chapter 3. The development of the PISA context questionnaires
Chapter 4. Sample design
Chapter 5. Translation and verifi cation of the test and survey material
Chapter 6. Field operations
Chapter 7. Quality assurance
Chapter 8. Survey weighting and the calculation of sampling variance
Chapter 9. Scaling PISA cognitive data
Chapter 10. Data management procedures
Chapter 11. Sampling outcomes
Chapter 12. Scaling outcomes
Chapter 13. Coding reliability studies
Chapter 14. Data adjudication
Chapter 15. Profi ciency scale construction
Chapter 16. Scaling procedures and construct validation of context questionnaire data
Chapter 17. Digital reading assessment
Chapter 18. International database
THE OECD PROGRAMME FOR INTERNATIONAL STUDENT ASSESSMENT (PISA)PISA focuses on young people’s ability to use their knowledge and skills to meet real-life challenges. This orientation refl ects a change in the goals and objectives of curricula themselves, which are increasingly concerned with what students can do with what they learn at school and not merely with whether they have mastered specifi c curricular content. PISA’s unique features include its:
– Policy orientation, which highlights differences in performance patterns and identifi es features common to high-performing students, schools and education systems by linking data on learning outcomes with data on student characteristics and other key factors that shape learning in and outside of school.
– Innovative concept of “literacy”, which refers both to students’ capacity to apply knowledge and skills in key subject areas and to their ability to analyse, reason and communicate effectively as they pose, interpret and solve problems in a variety of situations.
– Relevance to lifelong learning, which goes beyond assessing students’ competencies in school subjects by asking them to report on their motivation to learn, their beliefs about themselves and their learning strategies.
– Regularity, which enables countries to monitor their progress in meeting key learning objectives.
– Breadth of geographical coverage and collaborative nature, which, in PISA 2009, encompasses the 34 OECD member countries and 41 partner countries and economies.
ISBN 978-92-64-04018-298 2012 01 1 P -:HSTCQE=UYUV]W:
PIS
A 2009 Tech
nical R
epo
rt
PISA 2009 Technical Report
P r o g r a m m e f o r I n t e r n a t i o n a l S t u d e n t A s s e s s m e n t
982012011.indd 1 21-Mar-2012 10:20:32 AM