Chapter 3 - The digital transformation for all - OECD iLibrary
52
Chapter 3 The digital transformation for all Access to and use of digital tools in Latin America and the Caribbean can have a strong impact on inclusiveness. Digital tools, such as the Internet, are less unequally distributed than income and some public services. Despite significant reductions in socio‑economic, gender, age and geographical disparities, policies should focus on closing the remaining gaps. This chapter describes such advances and the trends in Internet access and use at home, work and school. It presents the potential impacts of the future of work, and assesses the digital skills of the current workforce. It also analyses schools’ role in the digitalisation era and in fostering digital inclusiveness. It concludes by describing how, in the context of the coronavirus (Covid‑19) crisis, the digital divide constitutes a vulnerability in the region and may amplify other inequalities in the absence of appropriate policies. In this context, digital inclusion must be understood as necessary to ensure social welfare.
-
Upload
khangminh22 -
Category
Documents
-
view
0 -
download
0
Transcript of Chapter 3 - The digital transformation for all - OECD iLibrary

118LATIN AMERICAN ECONOMIC OUTLOOK 2020 © OECD/UNITED NATIONS/CAF/EUROPEAN UNION 2020
119LATIN AMERICAN ECONOMIC OUTLOOK 2020 © OECD/UNITED NATIONS/CAF/EUROPEAN UNION 2020
Chapter 3
The digital transformation for allAccess to and use of digital tools in Latin America
and the Caribbean can have a strong impact on
inclusiveness. Digital tools, such as the Internet,
are less unequally distributed than income and
some public services. Despite significant reductions
in socio‑economic, gender, age and geographical
disparities, policies should focus on closing the
remaining gaps. This chapter describes such advances
and the trends in Internet access and use at home,
work and school. It presents the potential impacts
of the future of work, and assesses the digital skills
of the current workforce. It also analyses schools’
role in the digitalisation era and in fostering digital
inclusiveness. It concludes by describing how, in
the context of the coronavirus (Covid‑19) crisis, the
digital divide constitutes a vulnerability in the region
and may amplify other inequalities in the absence of
appropriate policies. In this context, digital inclusion
must be understood as necessary to ensure social
welfare.

3. The digiTal TransformaTion for all
120LATIN AMERICAN ECONOMIC OUTLOOK 2020 © OECD/UNITED NATIONS/CAF/EUROPEAN UNION 2020
121
LAC policies are essential in making the most of the digital transformation, fostering
inclusion and improving well-being
Yet the Internet usage gap between the richest and poorest is almost 40 percentage points...
Access to the Internet has expanded in
the last decade and is better distributed than most services
... and the gap between urban and rural households is more than 25 percentage points
Large gender differences persists in
student disposition
towards science-related
careers
Although a similar share of boys and girls expect to work in a science-related occupation,
they tend to select different fields
A large share of LAC adults
have little or no computer
experience
Internet access and use is strongly linked to household income and location
Policies should not focus only on job losses, but also on job creation and transformation
The Covid-19 crisis highlighted the equity role of ICTs in education
Gender is a discriminating factor in many aspects of the digital transformation
1 out of 4 jobs is at high risk of automation
More th
an
5%
of LAC studentscan only access ICT
at school
Very few workers have proficiency in and use
of digital tools at work
The % of primary school students with Internet connection
at home varies
In addition to physical
obstacles, such as limited
infrastructure, countries also face the lack of
ICT-knowledgeable staff and teachers
?
Poor
14%
Rich
80%
The under-representation
of women in ICT careers negatively
affects LAC’s innovative
and economic potential

3. The digiTal TransformaTion for all3. The digiTal TransformaTion for all
120LATIN AMERICAN ECONOMIC OUTLOOK 2020 © OECD/UNITED NATIONS/CAF/EUROPEAN UNION 2020
121LATIN AMERICAN ECONOMIC OUTLOOK 2020 © OECD/UNITED NATIONS/CAF/EUROPEAN UNION 2020
Introduction
More people in Latin America and the Caribbean (LAC) are connected to the Internet than ever, but gaps persist, and new ones may emerge. The digital divide, or the opportunity gap of individuals, households, businesses and geographical areas to access information and communications technology (ICT), has contracted in many countries in the region. However, the scope and speed of digitalisation vary greatly across countries, sectors, people and geographical areas in LAC.
Technological progress has the potential to improve well‑being and remove social barriers. It can also deepen income, gender, age and territorial inequalities. Digitalisation will only fully benefit individuals, societies and economies if policies spread the gains across all households, schools and firms. In the context of the coronavirus (Covid‑19) crisis, lack of access to communication infrastructure and skills can widen disparities, producing winners and losers. Policy action must help accelerate digital transformation, ensuring social inclusion. In responding to the coronavirus (Covid‑19) pandemic and economic recovery, policy needs to articulate better digital tools, which are a decisive factor in social welfare progress.
Digitalisation can bring new social inclusion opportunities, sustaining the progress of the past two decades. New technologies can improve access to public services, health and education, government transparency and job creation. They can bring previously under‑represented groups, such as women, those with disabilities, migrants and indigenous populations, into public policy and create new occupations that expand entry into the labour market.
With its capacity to improve skills, services and jobs, digitalisation can mitigate the social vulnerability trap in LAC. Work trajectories in the region are unstable. The predominance of low‑quality informal jobs and the high level of rotation between precarious jobs leave many workers vulnerable to the effects of individual, household or macro shocks (OECD et al., 2019). Digitalisation can automate dangerous or routine tasks, make work environments safer and healthier, and allow people to choose more freely when and where to work, improving work‑life balance. Maximising new technologies can enable informal businesses to transition to the formal sector. By overcoming traditional barriers to labour market participation, new technologies can integrate previously under‑represented groups. Digitalisation also offers cheaper and easier ways to save and invest in human capital and entrepreneurial activity. These impacts boost labour productivity, enhance job quality and support income stability, potentially transforming the vicious circle of low productivity, poor human capital and volatile income – in which 40% of the LAC population is trapped – into a virtuous circle of social inclusion and sustainable growth.
At the same time, new technologies can widen disparities and reinforce the social vulnerability trap (OECD et al., 2019). Digitalisation has increased automation and replacement of some tasks by technology. The first of those tasks were routine tasks, such as administrative work, financial tasks, paralegal work and reporting, putting low‑skilled workers and women out of work. The surge in Big Data, artificial intelligence and computing power is progressively automating non‑routine tasks (OECD, 2019a), requiring a population prepared to meet these new challenges. Gaps in ICT access, use, impact, and foundational, technical and digital skills can hinder the opportunities and advantages of digitalisation for vulnerable groups. Policies will determine whether digital tools foster inclusion or extend inequality. Technologies are changing rapidly, demanding enduring adaptation skills. Beyond basic digital device and Internet skills, people must develop computational thinking, ability to frame and solve problems using computers, and capacity to select and interpret the information produced by digital tools.

3. The digiTal TransformaTion for all
122LATIN AMERICAN ECONOMIC OUTLOOK 2020 © OECD/UNITED NATIONS/CAF/EUROPEAN UNION 2020
123
Early appropriate use of digital technologies, along with lifelong learning opportunities to develop skills to interact with and take advantage of them, is key to seizing the opportunities of digitalisation. LAC countries’ readiness depends on addressing gaps in access to, use of and proficiency with new technologies in homes, schools and workplaces. As countries expand digital services, tools and infrastructure, education plays a central role, throughout the life cycle, in ensuring foundational, technical and digital skills for all and preventing the perpetuation of socio‑economic inequalities in the labour market.
Digital technologies allow individuals to overcome some traditional barriers to labour participation and can reduce some costs for both employers and employees. However, new forms of work, such as telework and the platform economy, bring new challenges in terms of social protection. Well‑being losses may emerge in systems not prepared to absorb and regulate non‑standard ways of working.
The coronavirus (Covid‑19) crisis highlights the digital divide as an urgent concern, as poor and vulnerable workers without the infrastructure or skills to benefit from digital tools are being left behind. Digital tools have allowed some sectors and firms to continue, at least partially, safely by complying with social distancing measures. For instance, in response to lockdown measures, digital transformation offered workers, students, firms and households opportunities for telework, online distance learning, platforms and e‑commerce, and access to public and private services. However, the digital divide prevented most of the poor and vulnerable population from benefitting from these opportunities. Those unable to exploit these tools are likely to be more affected by the economic and social consequences of the crisis and potentially widening socio‑economic inequalities.
Impacts of the coronavirus (Covid‑19) crisis on jobs, individuals and households remain uncertain, but it is evident that people experience inequality in adapting to it. The affluent and middle class are more likely to be connected and to have integrated digital technologies into work, education and family life. The poor and vulnerable are more likely to have little or no digital access or skills, negatively affecting their access to public and private goods and services. Workers with no access or skills are more prone to short‑ and long‑term economic and other losses, for instance, because they have no opportunity to telework or sell goods online, while their children may be unable to continue education remotely.
Several actions are needed to promote an economic recovery in which everyone benefits from the opportunities of digital transformation. In particular, there is a need to consolidate the process of expansion of access and use of digital technologies and ICT infrastructure, while also strengthening digital, cognitive and non‑cognitive skills. Ensuring that all people can access, use and benefit from new technologies requires comprehensive and co‑ordinated policy efforts (see Chapter 4). A package of policies needs to both promote digitalisation, where it increases productivity and well‑being, and cushion its negative impacts (OECD, 2019b).
This chapter describes advances in expanding household Internet access and use across geographical areas and socio‑economic, gender and age groups. It then focuses on digitalisation and labour markets and presents the potential impacts of the future of work in the region and the current labour force’s digital skills. It compares trends in Internet access in schools and schools’ role in fostering digital inclusiveness and future workers better equipped for digitalisation. It examines how the coronavirus (Covid‑19) has highlighted the digital divide. All sections cover gender as a key consideration. The chapter concludes with policy implications.

3. The digiTal TransformaTion for all3. The digiTal TransformaTion for all
122LATIN AMERICAN ECONOMIC OUTLOOK 2020 © OECD/UNITED NATIONS/CAF/EUROPEAN UNION 2020
123LATIN AMERICAN ECONOMIC OUTLOOK 2020 © OECD/UNITED NATIONS/CAF/EUROPEAN UNION 2020
Digitalisation and households: Inclusive connectivity
LAC countries have experienced significant growth in Internet access in the 21st century. In 2018, 68% of the population used the Internet, almost twice the share in 2010 (see Chapter 2). This expansion reduced the gap in the number of users connected to the Internet between LAC and the Organisation for Economic Co‑operation and Development (OECD) countries (84% in 2018). Yet, large gaps remain across multiple dimensions.
As evidenced by the coronavirus (Covid‑19) crisis, the digital divide can widen inequalities. Households with access to ICT infrastructure and quality Internet connection are more resilient and can more easily adapt to new ways of doing work and everyday activities. Access to and effective use of ICT and the Internet are defining inclusion in the labour market, participation in remote education and access to public and private goods, while also reducing contact and therefore the probability of infection. Households with fewer ICT resources are likely to be more affected by the crisis. This section looks at developments in Internet and ICT access and use in the region across socio‑economic groups and geographical areas. ICT infrastructure and skills are also becoming complementary to social welfare; this section presents an overview of how prepared LAC households are to meet the challenges of digital transformation in the context of the coronavirus (Covid‑19) crisis.
While the income digital divide remains, Internet access and use are more equally distributed than income, secondary education and pensions
The expansion of the Internet has generated a more equal distribution of opportunity than the expansion of other services in LAC (Figure 3.1). Access and use are also less concentrated than income and pensions. Yet, they are more unevenly distributed than access to sewerage and electricity.
At an aggregate regional level, Internet use is less unequal than access. People can use the Internet in spaces other than their homes on a daily basis, for instance, at work, school, friends’ or families’ homes, specific urban public spaces or Internet cafes. Mobile phone connectivity is also increasing, helping close the gap.
Most countries, including Bolivia, Honduras, Paraguay and Peru, follow similar patterns, with Internet and computer access and use more equally distributed than access to secondary education and pensions (Figure 3.A1.1). The distribution of Internet use in Chile and Uruguay is as equal as the distribution of access to basic public services, such as sewerage and electricity. In Colombia, Ecuador and Mexico, Internet and computer access are more equal than access to education but more unequal than access to basic public services. In countries with large inequality in access to basic services, including El Salvador and Honduras, access to ICT is also unequal.
Policies must respond to the digital transformation with actions that mitigate the digital divide by: 1) providing the infrastructure needed to expand access; 2) supporting digital skills; and 3) enabling access for traditionally excluded groups.
Internet access and use in LAC is still strongly linked to household income. On average, the gap in Internet use between households in the richest and poorest quintiles is almost 40 percentage points (Figure 3.2). Most countries are in line with the LAC average. The gap is larger in Honduras (58 percentage points) and Peru (60 percentage points), and smaller in Chile (22 percentage points) and Uruguay (17 percentage points).

3. The digiTal TransformaTion for all
124LATIN AMERICAN ECONOMIC OUTLOOK 2020 © OECD/UNITED NATIONS/CAF/EUROPEAN UNION 2020
125
Figure 3.1. Distribution of Internet access, Internet use and other services by income decile in selected Latin American countries, 2017 or latest available year
0
10
20
30
40
50
60
70
80
90
100
0 10 20 30 40 50 60 70 80 90 100Cumulative share of households, from poorest to richest (%)
Equality line Internet access Internet use Computer accessSewerage system Electricity Education Pensions (affiliates)Pensions (contributors) Income
Cumulative distribution (%)
Notes: Simple average by decile for selected LAC countries. X‑axis = income decile. Y‑axis = cumulative percentage of people with Internet and computer access in their households; cumulative percentage of people reporting Internet use in the previous 3 or 12 months, depending on household survey question; cumulative percentage of people in a household with sewerage or electricity; and cumulative percentage of people aged 20 or older with at least secondary education. Calculations based on 2017 household surveys or latest available year: 2016 for Bolivia, Honduras and Mexico. Start age of Internet use varies by country: El Salvador and Paraguay measure from age 10; Bolivia, Chile, Ecuador and Honduras from age 5; Peru and Uruguay from age 6. Previous Internet use period, from survey data, is the previous 3 months for Bolivia, Honduras, Paraguay and Uruguay, and the previous 12 months for Chile, Ecuador and El Salvador. Other variables include all ages. Brazil, Chile, Costa Rica, Ecuador, El Salvador, Paraguay and Uruguay include mobile Internet in Internet access. Bolivia, Colombia, Mexico and Peru do not specify whether mobile Internet is included. Bolivia, Brazil, Chile, Costa Rica, Ecuador, Paraguay and Uruguay include laptops and tablets in computer access. Colombia, El Salvador, Mexico and Peru do not specify whether laptops or tablets are included.Source: Own calculations based on ORBA/ECLAC (2019), Household Survey Data Bank (database), www.cepal.org/es/observatorio‑ regional‑de‑banda‑ancha.12 https://doi.org/10.1787/888934171894
Figure 3.2. Internet users by income quintile in selected Latin American countries, 2017 or latest available year
% of population
86
77 73 73 72
58 56
4639
3430
0
10
20
30
40
50
60
70
80
90
100
OECDaverage
Uruguay Chile Paraguay Costa Rica Ecuador LACaverage
Peru Bolivia El Salvador Honduras
Total individuals Individuals living in households in Q1 Individuals living in households in Q5
Notes: Start age of Internet use varies by country: El Salvador and Paraguay measure from age 10; Bolivia, Chile, Ecuador and Honduras from age 5; Peru and Uruguay from age 6. Previous Internet use period, from survey data, is the previous 3 months for Bolivia, Honduras, Paraguay, Uruguay and the OECD, and the previous 12 months for Chile, Ecuador and El Salvador. Bolivia data are from 2016. LAC average is a simple average by quintile for the available countries. The OECD sample shows figures for the first and fourth quartile for individuals aged 16 or older.Source: Own calculations based on ORBA/ECLAC (2019), Household Survey Data Bank (database), www.cepal.org/es/observatorio‑ regional‑de‑banda‑ancha.12 https://doi.org/10.1787/888934171913

3. The digiTal TransformaTion for all3. The digiTal TransformaTion for all
124LATIN AMERICAN ECONOMIC OUTLOOK 2020 © OECD/UNITED NATIONS/CAF/EUROPEAN UNION 2020
125LATIN AMERICAN ECONOMIC OUTLOOK 2020 © OECD/UNITED NATIONS/CAF/EUROPEAN UNION 2020
Connectivity and ICT use gaps need to be closed
Older age groups are not taking advantage of the opportunities of connectivity. Computer and Internet use is significantly higher among the younger population (aged 15 to 34) (Figure 3.3). Access is more homogeneous across groups, although older people (aged 65 and older) still lag. Adults and older people could benefit from Internet use to access private and public goods and services more efficiently and to a greater extent. Policies to build adult digital skills are key for development and inclusion.
Figure 3.3. ICT access and use by age group in Latin America and the Caribbean, 2018 or latest available year
0
10
20
30
40
50
60
70
80
5-14 15-24 25-34 35-44 45-54 55-64 65-74 75+
% of population
Age
Internet access Computer access Internet use Computer use
Notes: Access variables refer to the population living in a household with an Internet connection and in a household owning a computer. Internet access includes Argentina, Bolivia, Chile, Colombia, Costa Rica, El Salvador, Mexico and Peru. Computer access includes Argentina, Bolivia, Chile, Colombia, Costa Rica, El Salvador, Honduras, Mexico and Peru. The inclusion of fixed or mobile connections varies in household surveys. Internet use refers to the percentage of people reporting Internet use at least once a week. Owing to varying definitions of use, averages may differ from other figures. Internet use includes Argentina, Bolivia, Chile, Colombia, Costa Rica, El Salvador, Honduras and Peru. Computer use refers to the percentage of people reporting computer use at least once a week. Computer use includes Bolivia and Colombia. Chile has no available data on Internet and computer access for people under age 15.Source: Own calculations based on household surveys (2018 or latest available year): Encuesta Permanente de Hogares (2018) (Argentina), Encuesta de Hogares (2018) (Bolivia), Encuesta de Caracterización Socioeconómica Nacional (2017) (Chile), Encuesta Nacional de Calidad de Vida (2017) (Colombia), Encuesta de Hogares de Propósitos Múltiples (2017) (El Salvador), Encuesta Permanente de Hogares de Propósitos Múltiples (2014) (Honduras), Encuesta Nacional de los Hogares (2018) (Mexico), Encuesta Permanente de Hogares (2018) (Paraguay) and Encuesta Nacional de Hogares (2018) (Peru).12 https://doi.org/10.1787/888934171932
Addressing the large urban‑rural digital divide across LAC countries at national and local levels is especially critical. Among countries analysed, urban Internet users exceeded rural users in both number and share – up to fourfold in some countries (Figure 3.4).The narrowing urban‑rural divide in a majority of OECD countries is partially linked to policies setting national targets for broadband availability (OECD, 2018a). Bridging the digital divide in rural areas is challenging for LAC countries owing to the strategic location of backbone networks closer to large, densely populated cities (OECD, 2018a). Clear strategies to connect less populated areas and extend the Internet to all citizens should be a priority of national digital agendas and strategies (DAs) (see Chapter 4). The digital transformation first requires basic infrastructure and closing basic services gaps between rural and urban areas (see Box 3.1). Access to the electricity and roads or fluvial transport systems required for high‑speed infrastructure remains a challenge in some LAC countries.

3. The digiTal TransformaTion for all
126LATIN AMERICAN ECONOMIC OUTLOOK 2020 © OECD/UNITED NATIONS/CAF/EUROPEAN UNION 2020
127
Figure 3.4. Share of urban and rural Internet users in Latin America, 2017
0102030405060708090
Para
guay
Urug
uay
Chile
Cost
a R
ica
Mex
ico
Dom
inic
an R
ep.
Colo
mbi
a
Braz
il
Ecua
dor
Peru
Boliv
ia
El S
alva
dor
Hond
uras
LAC
aver
age
%
Urban Rural
Sources: Own calculations based on ORBA/ECLAC (2019), Household Survey Data Bank (database), www.cepal.org/es/observatorio‑ regional‑de‑banda‑ancha; ITU (2019), World Telecommunication/ICT Indicators Database (database), www.itu.int/pub/D‑IND‑WTID.OL‑2019.12 https://doi.org/10.1787/888934171951
Box 3.1. Ensuring Internet access and use across Latin America and the Caribbean
Strategies to increase Internet access and use for disadvantaged populations focus on barriers to demand or supply. On the demand side, Latin Americans have difficulty accessing the Internet, mostly owing to the cost of ICT devices and provider fees. Income inequality exacerbates affordability barriers, as low‑income households tend to have a much lower income than the average (OECD/IDB, 2016). On the supply side, among other barriers, limited telecommunications infrastructure, tax burdens, inefficiencies in service provision, price distortions due to lack of competition and adequate regulation limit the reach of ICT services for a significant share of the population (West, 2015).
Supply‑side initiatives that have increased Internet affordability include enhanced competition, effective broadband expansion strategies, efficient spectrum allocation and infrastructure‑sharing models (A4AI, 2019). Peru’s Internet para Todos (Internet for all) aims to bring 4G mobile Internet access to 6 million people in more than 30 000 rural areas by the end of 2021. This partnership between Telefónica, Facebook, IDB (Inter‑American Development Bank) Invest and CAF – Development Bank of Latin America – enables operators to use communication infrastructure to expand coverage in rural areas. Telefónica has 3 130 towers across Peru; Internet para Todos aims to install an additional 866 by 2021. This programme also constitutes a growth opportunity for Telefónica by offering the possibility to test new business models and technologies in new locations and potentially expand the customer base in new markets (MAEUEC, 2020). The long‑term goal is to replicate the approach in other LAC countries, where some 100 million still have no Internet access (IDB, 2020).
Redes Comunitarias (Community networks) are gaining ground in the region. As part of Ecuador’s digital plan, Ecuador Conectado (Connected Ecuador) aims to bring community networks to 127 000 households, enabling Internet access at a reduced price (MINTEL, 2019). The Colombian government is scaling community access areas to increase rural connectivity: the programme aims to connect 1 000 rural zones and install networks with the capacity to serve at least ten users simultaneously at a minimum speed of 9 Mbps (MinTIC, 2019). Similarly, Conectar lo no conectado (Connecting what is not connected) supports the implementation of community networks in Argentina, Ecuador and Mexico by providing ICT training, ensuring the sustainability of networks and promoting the creation of better regulatory frameworks (APC, 2020).
3. The digiTal TransformaTion for all3. The digiTal TransformaTion for all
126LATIN AMERICAN ECONOMIC OUTLOOK 2020 © OECD/UNITED NATIONS/CAF/EUROPEAN UNION 2020
127LATIN AMERICAN ECONOMIC OUTLOOK 2020 © OECD/UNITED NATIONS/CAF/EUROPEAN UNION 2020
On the demand side, although general transfer schemes (e.g. conditional cash transfer programmes) can alleviate cost barriers, beneficiaries choose how to spend the money, i.e. potentially on other goods and services. Direct Internet‑only subsidies channel resources to increase Internet use by targeted groups. These subsidies can be distributed through a voucher system or direct transfers to operators, or through lower prices, which are effectively equivalent to income increases (OECD/IDB, 2016). This type of programme also allows targeting of vulnerable populations, such as the elderly, women and rural households. Colombia’s Vive Digital (Live Digital) aims to increase Internet access among the poorest two of six strata of the population, including through subsidies to buy devices and Internet services, and computers and digital pedagogical content for rural public schools. Costa Rica’s Hogares Conectados (Connected households) aims to help vulnerable people in quintiles 1, 2 and 3 access ICT with subsidised computers and Internet access for shortlisted households (OECD/IDB, 2016).
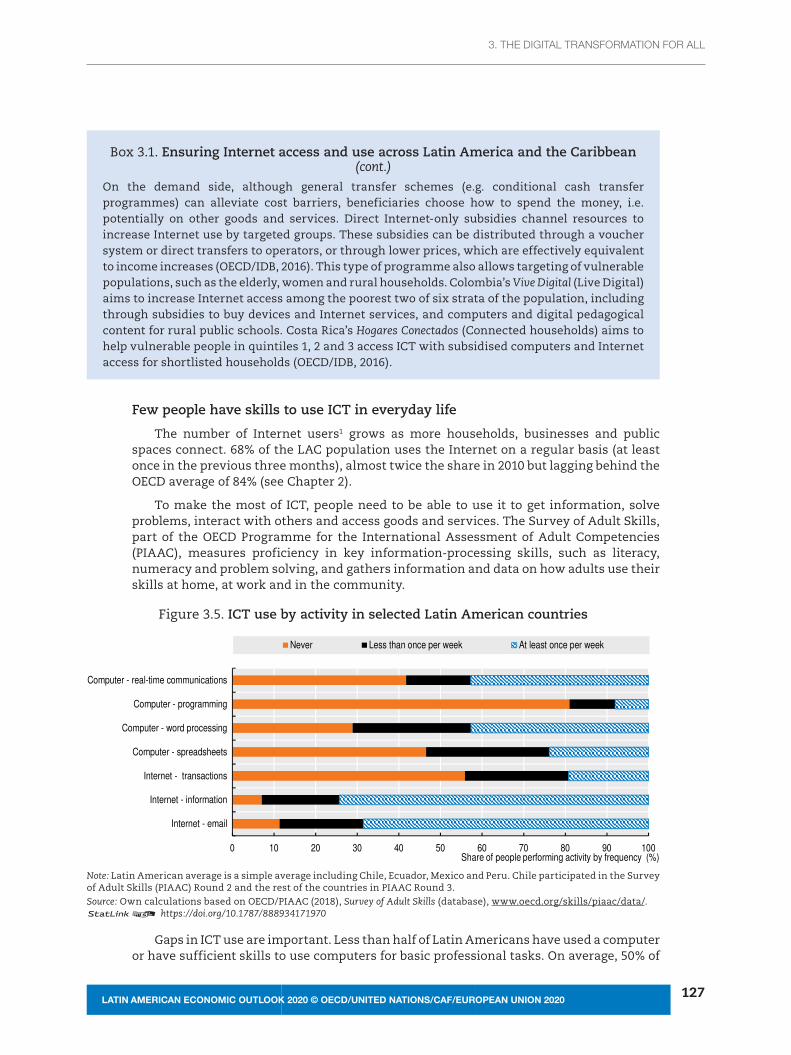
Few people have skills to use ICT in everyday life
The number of Internet users1 grows as more households, businesses and public spaces connect. 68% of the LAC population uses the Internet on a regular basis (at least once in the previous three months), almost twice the share in 2010 but lagging behind the OECD average of 84% (see Chapter 2).
To make the most of ICT, people need to be able to use it to get information, solve problems, interact with others and access goods and services. The Survey of Adult Skills, part of the OECD Programme for the International Assessment of Adult Competencies (PIAAC), measures proficiency in key information‑processing skills, such as literacy, numeracy and problem solving, and gathers information and data on how adults use their skills at home, at work and in the community.
Figure 3.5. ICT use by activity in selected Latin American countries
0 10 20 30 40 50 60 70 80 90 100
Internet - email
Internet - information
Internet - transactions
Computer - spreadsheets
Computer - word processing
Computer - programming
Computer - real-time communications
Share of people performing activity by frequency (%)
Never Less than once per week At least once per week
Note: Latin American average is a simple average including Chile, Ecuador, Mexico and Peru. Chile participated in the Survey of Adult Skills (PIAAC) Round 2 and the rest of the countries in PIAAC Round 3.Source: Own calculations based on OECD/PIAAC (2018), Survey of Adult Skills (database), www.oecd.org/skills/piaac/data/.12 https://doi.org/10.1787/888934171970
Gaps in ICT use are important. Less than half of Latin Americans have used a computer or have sufficient skills to use computers for basic professional tasks. On average, 50% of
Box 3.1. Ensuring Internet access and use across Latin America and the Caribbean (cont.)

3. The digiTal TransformaTion for all
128LATIN AMERICAN ECONOMIC OUTLOOK 2020 © OECD/UNITED NATIONS/CAF/EUROPEAN UNION 2020
129
adults aged 16 to 65 in the LAC countries surveyed (Chile, Ecuador, Mexico and Peru) had used a computer or had basic computer skills, according to the computer‑based section of the PIAAC, ranging from 42% in Mexico to 67% in Chile (OECD, 2019c).
The most common daily activities among those with computer skills were using the Internet for information gathering (73%) and email (69%), followed by real‑time communications, such as videoconference or chat (Figure 3.5). Only 8% used computers for programming. Computer and Internet use varies by country. In Mexico, 15% use ICT to conduct transactions at least once per week, compared with 30% in Chile (Figure 3.A1.2).
Figure 3.6. ICT use by gender, age and education in selected Latin American countries
Share of individuals performing activity at least once per week
0
5
10
15
20
25
30
Men Women <30 30-50 >50 Less thansecondary
Secondary Post-secondary/tertiary
Gender Age Education
%
Panel A. Conduct online transactions
0
5
10
15
20
25
30
Men Women <30 30-50 >50 Less thansecondary
Secondary Post-secondary/tertiary
Gender Age Education
%
Panel B. Work with spreadsheets
Notes: Latin American average is a simple average including Chile, Ecuador, Mexico and Peru. Tabulations based on self‑reporting after taking out individuals with no ICT skills or who do not use ICT in everyday life. Chile participated in the Survey of Adult Skills (PIAAC) Round 2 and the rest of the LAC countries in PIAAC Round 3.
Source: Own calculations based on OECD/PIAAC (2018), Survey of Adult Skills (database), www.oecd.org/skills/piaac/data/.12 https://doi.org/10.1787/888934171989
There is little variation across respondents in the use of basic digital tools, such as email and chat. Gender, age and education affect the use of more complex tools (Figure 3.6). Men are more likely than women to use ICT to conduct transactions or work with spreadsheets. Individuals with tertiary education use these tools more frequently than those with less education, while the latter are slightly more likely to engage in

3. The digiTal TransformaTion for all3. The digiTal TransformaTion for all
128LATIN AMERICAN ECONOMIC OUTLOOK 2020 © OECD/UNITED NATIONS/CAF/EUROPEAN UNION 2020
129LATIN AMERICAN ECONOMIC OUTLOOK 2020 © OECD/UNITED NATIONS/CAF/EUROPEAN UNION 2020
real‑time communications. Middle‑aged and older individuals conduct transactions more frequently than younger individuals, while the latter work with spreadsheets much more often.
Digitalisation and labour markets: The future of work and skills
New production technologies, new organisation models and evolving worker preferences are generating new forms of work and new demands for skills. Digital technologies in production have contributed to automation, restructuring of operations and processes, and development and implementation of technological solutions. Categories of jobs are being replaced, modernised and created. Many worry about the potential for massive unemployment, precarious work, workers with little or no bargaining power, and skills gaps as people age. Most jobs will change as economies go digital.
With the economic crisis generated by the pandemic, job loss could be massive. Unemployment in LAC could rise to 13.5% at the end of 2020 (ECLAC, 2020a). Governments have implemented policy actions to support employed workers and businesses, such as job retention schemes and targeted subsidies for income substitution. These actions should leave no one behind. The crisis presents an opportunity to rethink support programmes for workers, especially young and other traditionally vulnerable groups, in both education and training opportunities and in the labour market entry experience, to avoid having a generation of young people whose careers are permanently diminished by the disruption to the labour market (OECD, 2020a). With quarantines, telework and non‑standard ways of working have become prevalent. However, such measures are just benefitting a portion of workers whose occupations can be done remotely and are associated to a higher level of training and higher salaries (ECLAC, 2020b), potentially amplifying existing inequalities. Fostering access to ICT infrastructure and, more importantly, digital skills is essential for workers to adapt to new labour market conditions.
This section is based on the findings and main policy messages of the OECD Employment Outlook 2019: The Future of Work and Skills Matter: Additional Results from the Survey of Adult Skills (OECD, 2019a, 2019c). It analyses the risk of automation, use of digital skills at work, key determinants and why digital skills matter for workers and economies. It draws on data from the Survey of Adult Skills, which tests the ability to solve problems in technology‑rich environments using ICT tools, such as email, spreadsheets, word processing and the Internet. Four Latin American countries participated in PIAAC surveys: Chile in Round 2 (2015) and Ecuador, Mexico and Peru in Round 3 (2018). LAC averages are a simple average of the four countries’ results.
Jobs will disappear, change and emerge owing to digitalisation
Despite widespread anxiety about potential job loss driven by technological change and globalisation, a sharp decline in employment seems unlikely. Tasks are disappearing, evolving and emerging, generating structural changes in labour markets and skills demands. Yet, employment has been growing, and there is no evidence indicating a jobless future any time soon (OECD, 2019a).
Two methodologies have been developed to estimate the impact of digitalisation on employment levels. First, occupational analysis calculates the share of workers in occupations that could be performed by computers, algorithms and robots. Frey and Osborne (2017) labelled a sample of US occupations as automatable or not automatable. Using a standardised set of features for each occupation, they used a machine learning algorithm to generate a “probability of computerisation” of occupations, generating

3. The digiTal TransformaTion for all
130LATIN AMERICAN ECONOMIC OUTLOOK 2020 © OECD/UNITED NATIONS/CAF/EUROPEAN UNION 2020
131
a single prediction per occupation. Results, therefore, assume that all workers in an occupation face the same risk of replacement due to digitalisation.
Second, task analysis accounts for the considerable variation in the task composition of occupations with the same title. Rather than assume replacement of entire occupations by computers, algorithms and robots, it considers replacement of tasks within occupations. Arntz, Gregory and Zierahn (2016) and Nedelkoska and Quintini (2018) used the same outputs as Frey and Osborne (2017) to calculate the effect of automation on each task and estimated the probability of automation of each occupation based on the share of repetitive and routine tasks that could be replaced. Estimates account for the fact that the same occupation may be more or less susceptible to automation in different workplaces. The methodology applied depends on the availability of information; task analysis requires much greater detail.
Some 25% of jobs are at high risk of automation in LAC countries, according to OECD task analysis estimates for Chile, Ecuador, Mexico and Peru. Estimates range from 21% in Chile to 28% in Peru. Additionally, 35% of jobs in these countries may undergo substantial changes in the tasks performed and how they are carried out (OECD, 2019a). Jobs are at high risk of automation if at least 70% of their tasks are likely to be automated. Jobs are at risk of significant change if 50% to 70% of their tasks are likely to be automated (Nedelkoska and Quintini, 2018). By comparison, an estimated 14% of jobs in the OECD area could be replaced through automation. The potential automation of jobs does not mean machines will replace workers in the near future; automation may not always be cost‑effective or desirable, may raise legal and ethical concerns, and will be affected by worker preferences and policy decisions (OECD, 2019a).
Estimates for OECD countries (including Chile and Mexico) and other partners, such as Ecuador and Peru, were calculated using task analysis and Survey of Adult Skills data on a comprehensive list of tasks people perform in their occupations (Nedelkoska and Quintini, 2018) (Figure 3.7). By using individual data, estimates account for the variation in tasks performed within the same occupation. The self‑reported tasks are likely a better indicator of actual tasks than occupational descriptions.
ECLAC occupational analysis estimates indicate that 16% of jobs in LAC are at high risk of automation, ranging from 5% in Bolivia to 29% in Uruguay (ECLAC, 2019) (Figure 3.8). A further 16% may change substantially (occupations at medium risk of automation). These estimates were calculated using an adjusted occupational analysis methodology following Weller, Gontero and Campbell (2019) and labour force survey data. Frey and Osborne’s (2017) occupational analysis methodology is based on the US labour market. LAC labour markets differ significantly in at least two respects: market segmentation and lag in technology implementation (Katz, 2017, 2018).
On average, results indicate a similar probability of technological substitution for occupations typically held by men and women, with some variation across countries (Bustelo et al., 2020; ECLAC, 2019).

3. The digiTal TransformaTion for all3. The digiTal TransformaTion for all
130LATIN AMERICAN ECONOMIC OUTLOOK 2020 © OECD/UNITED NATIONS/CAF/EUROPEAN UNION 2020
131LATIN AMERICAN ECONOMIC OUTLOOK 2020 © OECD/UNITED NATIONS/CAF/EUROPEAN UNION 2020
Figure 3.7. Percentage of workers by risk of automation (task analysis) in selected OECD and Latin American and Caribbean countries, 2018 or latest available year
0
10
20
30
40
50
60
70% of workers
High likelihood of automation (>70%) Significant likelihood of automation (50-70%)
Notes: Occupations are at high risk of automation if their likelihood to be automated is at least 70%. Occupations are at risk of significant change if their likelihood to be automated is 50% to 70%. Estimates based on Nedelkoska and Quintini (2018). Values for OECD countries are simple averages.1 Note by Turkey: The information in this document with reference to “Cyprus” relates to the southern part of the Island. There is no single authority representing both Turkish and Greek Cypriot people on the Island. Turkey recognises the Turkish Republic of Northern Cyprus (TRNC). Until a lasting and equitable solution is found within the context of the United Nations, Turkey shall preserve its position concerning the “Cyprus issue”.Note by all the European Union Member States of the OECD and the European Union: The Republic of Cyprus is recognised by all members of the United Nations with the exception of Turkey. The information in this document relates to the area under the effective control of the Government of the Republic of Cyprus.2 The sample for the Russian Federation does not include the population of the Moscow municipal area. Detailed information regarding Russian Federation data can be found in the Technical Report of the Survey of Adult Skills, Third Edition (OECD, 2019d).Sources: OECD (2019c), Skills Matter: Additional Results from the Survey of Adult Skills, OECD Skills Studies; OECD/PIAAC (2018), Survey of Adult Skills (database), www.oecd.org/skills/piaac/data/.12 https://doi.org/10.1787/888934172008
Figure 3.8. Percentage of jobs at high risk of automation (occupational analysis) in selected Latin American countries, 2018
4.8
9.812 12.4 13.1 13.7
14.9 1617.9
21.4 21.7 22.2
28.8
0
5
10
15
20
25
30
35
Bolivia ElSalvador
DominicanRep.
Brazil Ecuador Honduras Peru LatinAmericaaverage
Guatemala Chile Argentina Mexico Uruguay
% of jobs
Source: Weller, Gontero and Campbell (2019), “Cambio tecnológico y empleo: Una perspectiva latinoamericana. Riesgos de la sustitución tecnológica del trabajo humano y desafíos de la generación de nuevos puestos de trabajo”, www.cepal.org/es/publicaciones/44637‑cambio‑tecnologico‑empleo‑perspectiva‑latinoamericana‑riesgos‑la‑sustitucion.12 https://doi.org/10.1787/888934172027

3. The digiTal TransformaTion for all
132LATIN AMERICAN ECONOMIC OUTLOOK 2020 © OECD/UNITED NATIONS/CAF/EUROPEAN UNION 2020
133
Digitalisation is changing jobs, tasks and skills demands
The shift in occupations is driving shifts in skills requirements (Amaral et al., 2018). LinkedIn recent hires data for Argentina, Australia, Brazil, Chile, France, India, Mexico, South Africa, the United Kingdom and the United States show that advanced digital and tech‑related skills are among the fastest growing: tech‑related skills categories are among the top two fastest growing in all countries except Brazil. Other trends include skills in data storage, software development life cycle, social media management, human‑computer interaction and mobile app development. The shift in occupations also appears to be driving an increase in categories such as marketing, advertising, graphic design and digital marketing, which overlaps with the tech category.
Demand for project, business, people and account management skills are declining. Administrative assistance and procurement skills are among the fastest declining categories. Given that these are people‑centred skills, although jobs requiring them may be declining, their value may be increasing if combined with technical skills (Amaral et al., 2018).
Adults working in digital‑intensive environments more frequently perform different types of tasks from those working in non‑digital‑intensive environments. For this section, workers in the same group of occupations (1‑digit ISCO‑08 [International Standard Classification of Occupations 2008]) are divided according to their jobs’ exposure to a digital environment. Workers in digital‑intensive jobs are defined as those who score higher than the median on the index of use of ICT skills at work.2 Workers in non‑digital‑intensive jobs are defined as those who score lower than the median of all Latin American countries.
Workers in digital‑intensive jobs use skills beyond those required for use of digital devices and ICT. In particular, they require greater use of reading and writing skills (across most occupations) and numeracy skills (especially for plant and machine operators and assemblers, craft and related trades workers, legislators and managers) (Figure 3.9).
Effective lifelong learning policies to train students and workers in fundamental and technical skills are essential to minimise the risks and maximise the benefits of labour market changes. Identifying and understanding countries’ emerging and declining occupations and skills requirements will help inform policy decisions regarding training, career guidance and resource prioritisation (Amaral et al., 2018). In a context of changing skills needs, both foundational skills and ability to learn and update skills are central to strong skills policies. Adult learning can help prevent skills depreciation and obsolescence and facilitate transition from declining to expanding occupations and sectors. Vocational education and training systems need to adapt to the rapidly evolving skills demand (OECD, 2020a).
Disadvantaged workers usually face multiple training barriers. Low‑skilled workers, workers in occupations at high risk of automation and workers who lose their jobs are often reluctant to train or unable to identify relevant learning activities. Even when well informed and motivated, some workers face other barriers, such as lack of time, money or skills to start a specific training. At the same time, employers are more likely to invest in training higher skilled workers, as return on investment is expected to be higher.

3. The digiTal TransformaTion for all3. The digiTal TransformaTion for all
132LATIN AMERICAN ECONOMIC OUTLOOK 2020 © OECD/UNITED NATIONS/CAF/EUROPEAN UNION 2020
133LATIN AMERICAN ECONOMIC OUTLOOK 2020 © OECD/UNITED NATIONS/CAF/EUROPEAN UNION 2020
Figure 3.9. Difference in skills use between digital-intensive and non-digital-intensive jobs in Latin America
Effect of dummy variable of being in a digital‑intensive occupation over standardised indexes of skills use, ac‑counting for years of schooling (bars displayed when difference is significant at 5%)
00.511.5
Panel A. Index of readiness to learn at work
0 0.5 1 1.5
Panel B. Index of use of influencing skills at work
00.511.5
Panel C. Index of use of numeracy skills at work
0 0.5 1 1.5
Panel D. Index of use of planning skills at work
00.511.5
Panel E. Index of use of reading skills at work
0 0.5 1 1.5
Panel F. Index of use of writing skills at workElementary occupations
Crafts and trades
Operators
Skilled agriculture
Service
Clerks
Technicians
Managers
Legislators
Armed forces
Elementary occupations
Crafts and trades
Skilled agriculture
Service
Clerks
Technicians
Managers
Legislators
Armed forces
Operators
Elementary occupations
Crafts and trades
Skilled agriculture
Service
Clerks
Technicians
Managers
Legislators
Armed forces
Operators
Notes: Figures display estimated coefficients of having a digital‑intensive occupation on different indexes of skills use derived from the Survey of Adult Skills (PIAAC) Rounds 2 and 3 (coefficients only displayed when significant at 5%). The higher the value, the greater the difference in skills use within the same occupation. Having a digital‑intensive occupation is measured by a dummy variable equal to 1 if the index of use of ICT skills at work is greater than or equal to the median of the index across the four participating LAC countries: Chile, Ecuador, Mexico and Peru. The dependent variable corresponds to the standardised values of the use of skills indexes using the mean and standard deviation for the pool of participating LAC countries. In this sense, coefficients measure the change in standard deviations from the mean in the use of skills indexes for a person in a digital‑intensive occupation compared with a person in a non‑digital‑intensive occupation. Separate regressions are estimated for each 1‑digit ISCO‑08 occupation. Regressions are estimated using standard ordinary least squares methodology and are controlled by years of education and country fixed effects.Source: Own calculations based on OECD/PIAAC (2018), Survey of Adult Skills (database), www.oecd.org/skills/piaac/data/.12 https://doi.org/10.1787/888934172046

3. The digiTal TransformaTion for all
134LATIN AMERICAN ECONOMIC OUTLOOK 2020 © OECD/UNITED NATIONS/CAF/EUROPEAN UNION 2020
135
Few workers can or do use digital tools at work in Latin America
In technology‑rich environments, the use of digital skills at work is as important a determinant of individual and aggregate economic outcomes as the use of general skills. Countries will continue to face significant labour market changes with implications for skills demands. Digital devices, connectivity, software and data are profoundly changing work tasks and the organisation of production and firms.
Digital and problem‑solving skills in technology‑rich environments are increasingly important for people to participate in labour markets, education and social life. PIAAC assesses workers’ basic computer literacy skills, as well as problem solving in technology‑rich environments, both at and outside work. It should be noted that the PIAAC is not representative of informal workers. Given the large share of informal labour in LAC countries, some of the figures of this section based on PIAAC data might be biased, if informal workers use ICT differently from formal workers.
Problem solving in technology‑rich environments is defined as “using digital technology, communication tools and networks to acquire and evaluate information, communicate with others and perform practical tasks” at a proficiency level of 1 to 5 (PIAAC Expert Group in Problem Solving in Technology‑Rich Environments, 2009). Proficiency below level 1 refers to the ability to use only familiar apps to solve problems that involve few steps and explicit criteria, such as sorting emails into existing folders (Figure 3.10).
Figure 3.10. Proficiency in problem solving in technology-rich environments in selected OECD and Latin American countries
Percentage of adults aged 16 to 65 scoring at each proficiency level
-80-60-40-20
020406080
100%
Level 1 or below Levels 2 and 3 Opted out of computer-based assessment Failed ICT core test or had no computer experience
Notes: The “missing” category comprises adults unable to provide sufficient background information to impute proficiency scores because of language barriers or learning or mental disabilities (i.e. literacy‑related non‑response) and those unable to complete the assessment because of technical problems. Countries and economies ranked in descending order of the combined percentages of adults scoring at levels 2 and 3.Sources: OECD (2015a); OECD/PIAAC (2018), Survey of Adult Skills (database), www.oecd.org/skills/piaac/data/.12 https://doi.org/10.1787/888934172065
A large share of Latin American adults have very little or no computer experience, ranging from 43.6% in Peru to 25.2% in Chile. The share of adults with no basic ICT skills or computer experience reflects countries’ level of economic development and ICT penetration (OECD, 2019c). Aside from adults who did not meet minimum requirements to take the problem‑solving assessment, a large proportion of adults opted out of the

3. The digiTal TransformaTion for all3. The digiTal TransformaTion for all
134LATIN AMERICAN ECONOMIC OUTLOOK 2020 © OECD/UNITED NATIONS/CAF/EUROPEAN UNION 2020
135LATIN AMERICAN ECONOMIC OUTLOOK 2020 © OECD/UNITED NATIONS/CAF/EUROPEAN UNION 2020
computer assessment, even when they had computer experience (a 7.5% share in Chile, 10.0% in the OECD, 11.1% in Peru, 17.8% in Mexico and 18.1% in Ecuador).
Few adults in LAC have medium and strong computer use knowledge and problem‑solving skills in technology‑rich environments. Shares of adults performing at levels 2 and 3 were much lower than the OECD average (29.7%): 5.2% in Ecuador, 6.6% in Peru, 10.2% Mexico and 14.6% in Chile.
One‑third of LAC workers use computers, smartphones or other ICT tools at work once per week or more, compared with over half of European workers (OECD, 2018b). Skills used at work are those observed in a worker’s job within a given skills domain (OECD, 2016b). Some 30% of those who took the computer assessment did not use problem‑solving skills to solve complex problems at work (OECD, 2019g).
There is large variation in use of computers, Internet, email and software. More than 25% of LAC workers used ICT regularly for simple tasks, such as email or job‑related information searches. Less than 10% used ICT for more advanced tasks, such as programming and real‑time communications (Figure 3.11).
Figure 3.11. ICT use at work by activity in selected Latin American countries
0 10 20 30 40 50 60 70 80 90 100
Programming
Online real-time discussions
Online transactions
Spreadsheets
Word processing
Internet - information
Share of workers performing activity by frequency
Never Less than once per week At least once per week
Note: “Never” includes workers who have never used a computer or who do not use ICT in their occupations. Chile participated in the Survey of Adult Skills (PIAAC) Round 2 and the rest of the LAC countries (Mexico, Peru, Ecuador) in PIAAC Round 3.Source: Own calculations based on OECD/PIAAC (2018), Survey of Adult Skills (database), www.oecd.org/skills/piaac/data/.12 https://doi.org/10.1787/888934172084
Socio‑economic factors shape ICT skills use in Latin America. A large share of adults without upper secondary education lacked the basic proficiency required to take the Survey of Adult Skills problem‑solving assessment, e.g. the ability to operate a mouse (OECD, 2019c). On average, 42% of low‑educated adults in OECD countries had no computer experience or failed the ICT core test, compared with 66% in Chile, 69% in Mexico and Ecuador and 86% in Peru. Less than 2% of adults in the four Latin American countries scored at levels 2 or 3 in ICT skills use, compared with 47% in OECD countries. Some 20% of Latin Americans with tertiary education scored at level 2 or above, on average: 30% in Chile, 26% in Mexico, 14% in Peru and 12% in Ecuador (Figure 3.12). Improving access and quality of pre‑primary, primary and secondary education is key to strengthening the digital skills of LAC’s working population, as are lifelong learning and overcoming barriers to training, given that many leave education without having acquired the necessary skills.

3. The digiTal TransformaTion for all
136LATIN AMERICAN ECONOMIC OUTLOOK 2020 © OECD/UNITED NATIONS/CAF/EUROPEAN UNION 2020
137
Figure 3.12. Proficiency in problem solving by education level in selected Latin American countries
Percentage of low‑educated and highly educated adults scoring at levels 2 or 3 in problem solving in technology‑rich environments or having no computer experience (adults aged 25 to 65)
-100 -80 -60 -40 -20 0 20%
Panel A. Less than upper secondary education
-20 0 20 40 60 80 100%
Panel B. Tertiary education
LAC average
OECD average
Chile
Mexico
Peru
Ecuador
No computer experience or failed ICT core Level 2 Level 3
Notes: Adults are divided into one of the following mutually exclusive categories: opted out of the computer‑based assessment; no computer experience; failed the ICT core test; below level 1, at level 1, at level 2 and at level 3 (of the problem solving in technology‑rich environments scale). For detailed results for each category, see OECD (2019c). Countries and economies are ranked in descending order of the combined percentages of adults with tertiary education scoring at level 2 or 3. Chile participated in the Survey of Adult Skills (PIAAC) Round 2 and the rest of the LAC countries (Mexico, Peru, Ecuador) in PIAAC Round 3.Source: Own elaboration based on OECD/PIAAC (2018), Survey of Adult Skills (database), www.oecd.org/skills/piaac/data/.12 https://doi.org/10.1787/888934172103
Gender gaps were not as large. Across OECD countries, men had a small advantage in scoring at levels 2 or 3: 32% of men vs. 28% of women. Gaps were similar or slightly smaller in LAC countries. However, at the bottom of the skills distribution, in all countries, a higher proportion of women than men had no computer experience or failed the ICT core test: 26% vs. 24% in Chile, 35% vs. 31% in Ecuador, 41% vs. 38% in Mexico and 47% vs. 41% in Peru.
Proficiency explains a remarkably small part of the variance of skills use at work in LAC (1% to 6%), mainly affecting industry, occupation, firm size and high‑performance work practices (Figure 3.13). The use of the workers’ skills is affected by both the extent to which they deploy those skills at work – which in turn may depend on incentives and the workers’ own initiatives – and the skills required for the job. Some workers may have skills in excess and may not use them fully; others may have insufficient skills but maintain their jobs, at least in the short term, despite resulting poor performance (OECD, 2016b). The relationship between skills proficiency and skills use is thus likely to be mediated by workers’ sorting into occupations, industries and firms (OECD, 2016c).
The characteristics of occupations and firms, as measured by the application of High‑performance work practices, are important predictors of digital and problem‑solving skills use at work in LAC. Occupations explain between 25% (Ecuador) and 31% (Peru) of the variance in ICT skills use at work. High‑performance work practices explain between 17% (Peru) and 19% (Ecuador) of the variance in problem‑solving skills use at work in technology‑rich environments.
Digital skills use varies strongly by occupation. Managers, professionals, technicians and clerical support workers use ICT skills relatively frequently; workers in service and sales, agriculture, forestry and fishery, craft and trades, plant and machine operators and elementary occupations use them much less (OECD, 2016b).

3. The digiTal TransformaTion for all3. The digiTal TransformaTion for all
136LATIN AMERICAN ECONOMIC OUTLOOK 2020 © OECD/UNITED NATIONS/CAF/EUROPEAN UNION 2020
137LATIN AMERICAN ECONOMIC OUTLOOK 2020 © OECD/UNITED NATIONS/CAF/EUROPEAN UNION 2020
Figure 3.13. Contribution of skills proficiency and other factors to variance of skills use at work in selected Latin American countries and OECD average
Percentage of the variance in skills use at work by factor
0
10
20
30
40
50
60
70
Chile Ecuador Mexico Peru OECDaverage
Panel A. ICT skills
0
5
10
15
20
25
30
35
40
Chile Ecuador Mexico Peru OECDaverage
Panel B. Problem-solving skills
Firm size Occupation IndustryHigh-performance work practices Skill proficiency Country fixed effects
% %
Notes: OECD average corresponds to the regression for OECD pooled countries including country fixed effects. Reading, writing, numeracy and ICT skills use indicator ranges from 0 to 1. Index of problem‑solving skills at work is computed by averaging the frequency with which workers solve simple and complex problems and ranges from 0 to 4. High‑performance work practices include the following variables: choosing and changing the sequence of tasks, speed of work and how to do the work; organising time and planning activities; co‑operating with others; instructing, teaching or training people; sharing information with co‑workers; earning bonuses; participating in training; and having flexible work hours. For problem solving, skills proficiency = proficiency in problem solving in technology‑rich environments; analysis therefore excludes countries that do not test this proficiency domain. Chile participated in the Survey of Adult Skills (PIAAC) Round 2 and the rest of the LAC countries (Mexico, Peru, Ecuador) in PIAAC Round 3.Source: OECD (2019c), Skills Matter: Additional Results from the Survey of Adult Skills, https://doi.org/10.1787/1f029d8f‑en.12 https://doi.org/10.1787/888934172122
Policies can foster inclusion in LAC labour markets
Labour markets are partially polarised in most LAC countries. Share of employment and wages have grown substantially for high‑skilled and some low‑skilled jobs, especially in the service sector, and fallen for middle‑skilled jobs (Azuara Herrera et al., 2019). Manual work in highly automatable occupations, such as machine operator or equipment repair, has declined significantly, and wage gains in other automatable occupations have decreased. However, these changes are smaller than observed in other regions and the OECD area.
The labour market for the most qualified people has not absorbed the volume of highly educated professionals who joined the labour force between 2000 and 2015. This contrasts with more developed countries, where the incorporation of new technologies has boosted demand for and wages of professionals with higher levels of education. Also, in contrast to the OECD area, knowledge occupations have experienced lower wage gains than manual occupations (Azuara Herrera et al., 2019).
Cleaning personnel and financial specialist jobs grew the most in LAC between 2000 and 2015. Salesperson, computer and mathematics specialist, food preparer, health technician, lawyer, pilot and air traffic controller, construction worker and administrative personnel jobs also grew, according to the household surveys of Bolivia, Brazil, Chile, Costa Rica, the Dominican Republic, Ecuador, Jamaica, Mexico and Paraguay. Manager, machinery operator, caregiver, machine maintenance and repair, driver, physical science technician, education specialist, biology technician, artist, athlete and security guard jobs decreased the most during the period (Azuara Herrera et al., 2019).

3. The digiTal TransformaTion for all
138LATIN AMERICAN ECONOMIC OUTLOOK 2020 © OECD/UNITED NATIONS/CAF/EUROPEAN UNION 2020
139
Digitalisation and rapid progress in ICT have accelerated “winner‑takes‑most” dynamics, which could contribute to further wage inequality in LAC. ICT has improved matching of geographically distant sellers and buyers. It has also facilitated the emergence of markets with global scale in a number of traditional services industries, such as retail and transport, as well as ICT services, for which the marginal cost of scaling up is near zero (OECD, 2018c). In some of these industries, especially ICT services, retail and transport, network externalities that favour a dominant player have become more important. Consistent with winner‑takes‑most, evidence suggests that trade integration and digitalisation have contributed to the wage divergence between the most successful firms and the rest (Berlingieri, Blanchenay and Criscuolo, 2017).
Digitalisation raises concerns about job quality. While diversity in employment contracts can provide flexibility for many workers and firms, challenges remain in ensuring the quality of non‑standard contracts. Labour market disparities could increase unless policy action ensures more equal sharing of the costs of structural adjustment in the world of work (OECD, 2019a).
Many OECD and emerging economies have seen growth in non‑standard forms of employment, bringing various challenges. New forms of work are the result of changes in worker preferences, innovations in business models and work organisation, technological developments and policy choices. They include the gig economy, in which workers provide services through online platforms. Other non‑standard forms of work, such as on‑call or zero‑hour contracts and own‑account work, have expanded in many countries. These more flexible working arrangements often emerge in response to the needs of both employers and workers but may result in well‑being losses for workers in the absence of policies guaranteeing adequate rights and protections. This is an important concern in countries where non‑standard forms of work are proliferating and where firms increasingly rely on networks of contractors and subcontractors to perform many functions rather than on a permanent labour force (giving rise to the concept of the “fissured workplace”) (OECD, 2019a).
In countries with a large incidence of informality, gig economy work could offer a route to formalisation. It could reduce costs and improve monitoring of economic activities through the digitalisation of transactions. However, to capitalise on these opportunities, emerging economies will need to ensure adequate tax and social protection mechanisms.
As these transformations occur, challenges arise in managing the transition of workers in declining industries and regions to new employment opportunities, and moving towards universal social protection. The key message of the OECD Employment Outlook 2019 is that the future of work will largely depend on policy decisions (OECD, 2019a). Policies and institutions can support workers to seize the opportunities of digitalisation, globalisation and longer lives and mitigate the risks (OECD, 2019a).
Policies to build a more rewarding and inclusive world of work will require adequate financial resources, in particular for strengthening adult learning and social protection. Given constraints on public finances, new thinking on how to find the necessary resources is needed. At the same time, some policy options involve barely any public expenditure and may even increase tax revenue.
Digitalisation and schools: Equity and quality in education
Digitalisation brings advantages and opportunities for those with the needed skills but can exacerbate inequality and vulnerability for those not adequately prepared. Acquisition of skills, distribution of knowledge and education opportunities are crucial to improving citizen well‑being in the digital age. Preventing increased education gaps

3. The digiTal TransformaTion for all3. The digiTal TransformaTion for all
138LATIN AMERICAN ECONOMIC OUTLOOK 2020 © OECD/UNITED NATIONS/CAF/EUROPEAN UNION 2020
139LATIN AMERICAN ECONOMIC OUTLOOK 2020 © OECD/UNITED NATIONS/CAF/EUROPEAN UNION 2020
during the pandemic is key to promoting inclusive recovery. It is therefore crucial to increase digital capacities in schools and support digital skills acquisition by teachers, parents and students (see Digitalisation and the coronavirus [Covid‑19] section).
New technologies could be useful to reduce skills gaps between LAC and the OECD and, more importantly, promote basic skills acquisition among traditionally marginalised groups. Use of technologies at school could support addressing these challenges, especially as tackling the effect on skills of unfavourable conditions, for instance socio‑economic disadvantage, is more effective early in life (Cunha, Heckman and Schennach, 2010). At the same time, education systems need to teach young people the skills they will use in an increasingly digital‑intensive future.
New technologies allow the development of innovative teaching practices, enable personalised and remote courses and feedback, and encourage student interest and engagement through new learning modalities, such as gamification. Connectivity allows schools to access new learning resources and materials; the digital transformation could therefore provide additional support for the development of fundamental cognitive, non‑cognitive and digital skills, preparing students to live and succeed in the digital world.
This section analyses schools’ role in training better‑equipped future generations to face the digital era and promoting digital inclusiveness. It explores how well equipped schools are to foster strong digital skills, how students aged 15 use ICT tools and acquire digital skills, and which students benefit the most. It draws on data from the OECD Programme for International Student Assessment (PISA). Some 600 000 students completed PISA 2018, which represents about 32 million 15‑year‑olds in schools in 79 countries. The section presents results from the ten Latin American countries that participated in PISA 2018 (Argentina, Brazil, Chile, Colombia, Costa Rica, the Dominican Republic, Mexico, Panama, Peru and Uruguay), although Argentina, Colombia and Peru did not administer the optional ICT Familiarity Questionnaire.3
Students are accessing ICT at increasingly younger ages
Rapid digitalisation over the last decade has influenced how students learn, do homework, interact with peers and spend leisure time. Internet access and use have had a particular impact. Internet use at school among students aged 15 in LAC more than doubled between 2012 and 2018 to over one hour on a typical school day. Time on line outside school increased, on average, by almost 1.4 hours per day, to 3.0 hours on weekdays (Figure 3.14) and almost 3.5 hours on weekends, in line with the OECD average.
LAC students are going on line at increasingly younger ages. In 2015, in the five LAC countries with available PISA ICT information in both 2015 and 2018 (Brazil, Chile, Costa Rica, the Dominican Republic, Mexico, Peru and Uruguay), 61% of students aged 15 accessed a digital device for the first time before age 10, rising to 62% in 2018. In 2018, more than 20% accessed a digital device before age 6 and 7% before age 3. These trends are likely to continue (OECD, 2016d, 2016e).
There is a large variation in the average age of digital initiation across LAC countries. In 2015, 73% of students aged 15 in Chile had interacted with digital devices, compared with 41% in Peru. In 2018, almost 75% of students aged 15 in Chile and Uruguay started using digital devices before age 10 vs. just over 50% in Mexico and the Dominican Republic. In the Dominican Republic and Panama, between 3% and 5% had never used a digital device (OECD, 2018d).
On average, people go on line at a younger age in the OECD area. In 2015, in OECD countries with PISA data, 73% of students aged 15 accessed the Internet for the first time

3. The digiTal TransformaTion for all
140LATIN AMERICAN ECONOMIC OUTLOOK 2020 © OECD/UNITED NATIONS/CAF/EUROPEAN UNION 2020
141
before age 10 – 34% before age 6 (OECD, 2017a) – with small changes for 2018. Less than 1% of students aged 15 in OECD countries had never used a digital device vs. more than 2% in LAC.
Figure 3.14. Time spent by students on the Internet at school and at home on weekdays in selected Latin American countries, 2012 and 2018
0
50
100
150
200
250
Brazil Chile Costa Rica DominicanRep.
Mexico Panama Uruguay LAC average OECD average
Minutes per day
At school 2018 At home 2018 At school 2012 At home 2012
Notes: Responses were no time, 1‑30 minutes, 31‑60 minutes, 1‑2 hours, 2‑4 hours, 4‑6 hours and more than 6 hours. Responses were converted into the smallest number of minutes in the interval: 0, 1, 31, 61, 121, 241 or 361. As such, numbers are lower bounds of the average time spent on the Internet per day. OECD and LAC averages are simple averages using available data for each year.Source: OECD (2018d), PISA 2018 Database (database), www.oecd.org/pisa/data/2018database/.12 https://doi.org/10.1787/888934172141
Access to ICT and developing digital skills are linked to basic skills acquisition. When looking at the age of first exposure to digital devices by school performance, on average, students with higher levels of proficiency in PISA (i.e. levels 5 and 6 in science) started using digital devices at a younger age (Figure 3.15). Students at level 2, the baseline for science, can draw on their knowledge of basic science content and procedures to identify an appropriate explanation, interpret data and identify the question being addressed in a simple experiment. At level 2, students demonstrate sufficient scientific knowledge and skills to participate actively in life situations related to science and technology. All students should attain level 2 by the end of compulsory education (OECD, 2015b, 2016e). A large proportion of those performing below level 2 had never used or had started using technologies at age 10 or older. The proportion is higher in LAC countries, indicating a digital divide.
Early exposure to digital devices is correlated with better performance in PISA: starting to use ICT before age 9 is significantly associated with higher scores than starting after age 12. Starting before age 3 has a lesser beneficial effect on performance than starting between ages 3 and 6, meaning that starting at the earliest ages has no major correlation with school performance (Figure 3.16). It is unclear whether technology is behind correlations between ICT use and performance in PISA. Students more motivated to study and perform better may also be more motivated to use ICT early in life. Students who use ICT earlier in life may have parents who stimulate them more and encourage new experiences, including use of ICT, which may support skills development and better performance. However, simply providing ICT might not immediately improve performance, there is a need for co‑ordinated ICT and education policies.

3. The digiTal TransformaTion for all3. The digiTal TransformaTion for all
140LATIN AMERICAN ECONOMIC OUTLOOK 2020 © OECD/UNITED NATIONS/CAF/EUROPEAN UNION 2020
141LATIN AMERICAN ECONOMIC OUTLOOK 2020 © OECD/UNITED NATIONS/CAF/EUROPEAN UNION 2020
Figure 3.15. Age of first use of digital devices by PISA science proficiency level, OECD and LAC averages, 2018
Proportion of students in each age category of first use of digital devices by science proficiency level
0
10
20
30
40
50
60
70
80
90
100
1 2 3 4 5 6 1 2 3 4 5 6
OECD average LAC average
%
6 or younger 7-9 10-12 13 or older Never
Note: The difference between LAC and the OECD area (excluding Mexico, Colombia and Chile) in the proportion of students who used a digital device for the first time at older than age 9 is significant.Source: Own calculations based on OECD (2018d), PISA 2018 Database (database), www.oecd.org/pisa/data/2018database/.12 https://doi.org/10.1787/888934172160
Figure 3.16. Age of first use of a digital device and performance in PISA in Latin America and the Caribbean, 2018
0 50 100
Effect on test scores (in pts)
Panel C. Reading
0 50 100
Panel B. Mathematics
0 50 100
Never
13 or older
10-12
7-9
4-6
3 or younger
Age Panel A. Science
Notes: Estimated effects of the age of first use of a digital device, by age categories relative to the category “Have never used a digital device”, on performance in science, mathematics and reading. Bars display coefficients from a regression estimating the effect of age categories for first use of a digital device on performance. Regression controls include the PISA index of student socio‑economic status, age, gender, immigration status, a dummy variable for attending a private school and a variable for living in a rural area. Country fixed effects are included in the regression. Error bars correspond to 1.96 standard errors and, as such, represent the 95% confidence interval. Sample includes all LAC countries that participated in PISA 2018 with available data.Source: Own calculations based on OECD (2018d), PISA 2018 Database (database), www.oecd.org/pisa/data/2018database/.12 https://doi.org/10.1787/888934172179
Schools contribute to equity in access to ICT in LAC
In countries where household connectivity is not universal, public spaces and institutions, such as schools, facilitate Internet access (UNESCO, 2017). More than 5%

3. The digiTal TransformaTion for all
142LATIN AMERICAN ECONOMIC OUTLOOK 2020 © OECD/UNITED NATIONS/CAF/EUROPEAN UNION 2020
143
of LAC students have access to ICT exclusively at school. This section uses the school module of PISA 2018, answered by principals or authorities, to analyse access by students aged 15 to computers, ICT and the Internet at school.
Although LAC schools increasingly offer access to digital tools, the gap with the OECD area remains. On average, two or more students share a school computer vs. one computer per student in the OECD. Internet access is also essential for acquiring relevant digital skills. Some 95% of school computers in the OECD area have connectivity, compared with 74% in LAC (Figure 3.17).
Figure 3.17. Number of students per computer and per Internet-connected computer in selected Latin American and Caribbean countries, 2015 and 2018
0
1
2
3
4
5
6
Colombia Chile Costa Rica DominicanRep.
Peru Panama Argentina Uruguay Mexico Brazil LACaverage
OECDaverage
Number of students
Per computer 2018 Per computer with Internet 2018 Per computer 2015 Per computer with Internet 2015
Source: Own calculations based on OECD (2018d), PISA 2018 Database (database), www.oecd.org/pisa/data/2018database/.12 https://doi.org/10.1787/888934172198
Having computers but lacking connectivity or trained staff hinders the effective use of ICT as a tool for developing foundational and digital skills. LAC countries face not only physical barriers, including limited infrastructure, software, hardware and Internet connection quality, but others, in particular lack of ICT‑knowledgeable staff and teachers (OECD, 2019g), which is key for quality education. Technology is not enough to improve education quality and skills development: access is a necessary but not sufficient condition. A more wide‑ranging approach to education is needed. Education studies suggest that the effect of ICT on student performance rests on how technology complements or substitutes for teaching practices (Box 3.2).
Computer access at school varies among and within LAC countries. Schools in Chile and Colombia provide almost one computer per student, on a par with most OECD countries. Almost all have an Internet connection in Chile; fewer than two‑thirds do in Colombia. In Brazil, more than five students share each Internet‑connected computer.
There is large variation in access and connectivity within LAC countries, in several respects. In villages, three students share each Internet‑connected computer, compared with two students in large cities. Three students in the bottom quartile of the PISA index of economic, social and cultural status (ESCS) indicator share an Internet‑connected computer, compared with two or fewer in the top quartile. In public schools, on average, three students share each Internet‑connected computers vs. almost one per student in private schools (Figure 3.18).

3. The digiTal TransformaTion for all3. The digiTal TransformaTion for all
142LATIN AMERICAN ECONOMIC OUTLOOK 2020 © OECD/UNITED NATIONS/CAF/EUROPEAN UNION 2020
143LATIN AMERICAN ECONOMIC OUTLOOK 2020 © OECD/UNITED NATIONS/CAF/EUROPEAN UNION 2020
Figure 3.18. Number of students per computer and per Internet-connected computer by socio-demographic characteristics, LAC and OECD averages, 2015 and 2018
0.51.01.52.02.53.03.54.0
Village Small town(3 000-15 000people)
Town(15 000-100 000)
City(100 000-1 000 000)
Large city(> 1 000
000)
1 2 3 4 Public Private
Location Proportion of socio-economically disadvantagedstudents (quartiles)
School ownership
Number of students
LAC average 2015 OECD average 2015 LAC average 2018 OECD average 2018
Source: Own calculations based on OECD (2018d), PISA 2018 Database (database), www.oecd.org/pisa/data/2018database/ and OECD (2015c), PISA 2015 Database (database), www.oecd.org/pisa/data/2015database/.12 https://doi.org/10.1787/888934172217
By providing computer and Internet access, schools help bridge the gap between students with and without ICT access at home (OECD/IDB, 2016). PISA derives ICT availability indexes for school and home.4 These indicators calculate the combined availability of various digital tools, including computers, the Internet and smartphones, on a scale of 0 (no access to any digital tool) to 10 (access to every tool listed; 11 in the case of ICT availability at home). Inequality in ICT availability between socio‑economically advantaged and disadvantaged students is greater at home than at school. In LAC, the ICT availability index at home is 50% (40% in the OECD area) higher for students in the fourth quartile of the PISA index of economic, social and cultural status (ESCS) than for students in the first quartile. The ICT availability index at school is 42% (18% in the OECD area) higher for students in the fourth quartile (Figure 3.19). Schools help reduce the digital divide in access to ICT. Extending ICT infrastructure in LAC schools is relevant and needed.
Fairness in resource allocation is important to ensure equity in education opportunities and is related to education system performance overall. High‑performing countries tend to allocate resources, including computers and digital tools, more equitably, regardless of schools’ socio‑economic profiles. Better access to ICT at school may compensate for low access in rural or socio‑economically disadvantaged homes (OECD, 2015d).
Too often, scarce education resources, such as ICT, are inequitably distributed between advantaged and disadvantaged schools in LAC. Principals in most schools report inadequate education resources. Costa Rica, Mexico and Peru tend to allocate the scarce resources to advantaged schools; lack of or inadequate resources hinder learning in many schools, particularly in socio‑economically disadvantaged schools. By contrast, principals in Finland report a similar share of resources, regardless of how advantaged their schools are (OECD, 2016d).
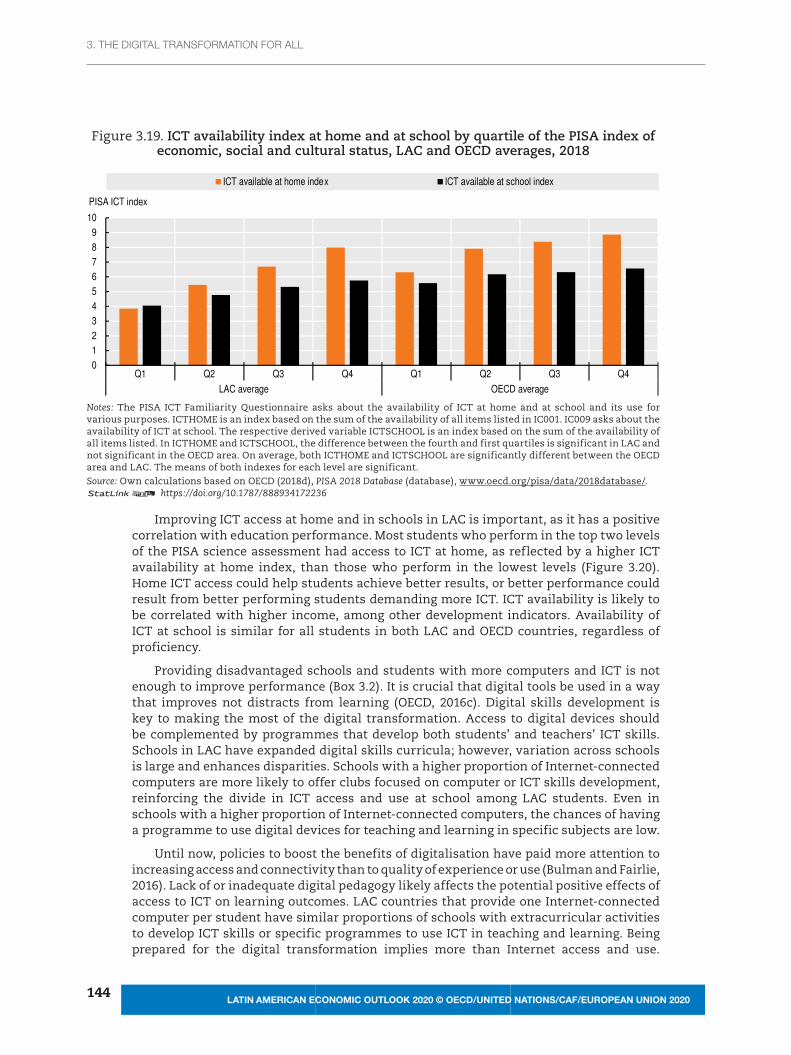
3. The digiTal TransformaTion for all
144LATIN AMERICAN ECONOMIC OUTLOOK 2020 © OECD/UNITED NATIONS/CAF/EUROPEAN UNION 2020
145
Figure 3.19. ICT availability index at home and at school by quartile of the PISA index of economic, social and cultural status, LAC and OECD averages, 2018
0123456789
10
Q1 Q2 Q3 Q4 Q1 Q2 Q3 Q4
LAC average OECD average
PISA ICT index
ICT available at home index ICT available at school index
Notes: The PISA ICT Familiarity Questionnaire asks about the availability of ICT at home and at school and its use for various purposes. ICTHOME is an index based on the sum of the availability of all items listed in IC001. IC009 asks about the availability of ICT at school. The respective derived variable ICTSCHOOL is an index based on the sum of the availability of all items listed. In ICTHOME and ICTSCHOOL, the difference between the fourth and first quartiles is significant in LAC and not significant in the OECD area. On average, both ICTHOME and ICTSCHOOL are significantly different between the OECD area and LAC. The means of both indexes for each level are significant.Source: Own calculations based on OECD (2018d), PISA 2018 Database (database), www.oecd.org/pisa/data/2018database/.12 https://doi.org/10.1787/888934172236
Improving ICT access at home and in schools in LAC is important, as it has a positive correlation with education performance. Most students who perform in the top two levels of the PISA science assessment had access to ICT at home, as reflected by a higher ICT availability at home index, than those who perform in the lowest levels (Figure 3.20). Home ICT access could help students achieve better results, or better performance could result from better performing students demanding more ICT. ICT availability is likely to be correlated with higher income, among other development indicators. Availability of ICT at school is similar for all students in both LAC and OECD countries, regardless of proficiency.
Providing disadvantaged schools and students with more computers and ICT is not enough to improve performance (Box 3.2). It is crucial that digital tools be used in a way that improves not distracts from learning (OECD, 2016c). Digital skills development is key to making the most of the digital transformation. Access to digital devices should be complemented by programmes that develop both students’ and teachers’ ICT skills. Schools in LAC have expanded digital skills curricula; however, variation across schools is large and enhances disparities. Schools with a higher proportion of Internet‑connected computers are more likely to offer clubs focused on computer or ICT skills development, reinforcing the divide in ICT access and use at school among LAC students. Even in schools with a higher proportion of Internet‑connected computers, the chances of having a programme to use digital devices for teaching and learning in specific subjects are low.
Until now, policies to boost the benefits of digitalisation have paid more attention to increasing access and connectivity than to quality of experience or use (Bulman and Fairlie, 2016). Lack of or inadequate digital pedagogy likely affects the potential positive effects of access to ICT on learning outcomes. LAC countries that provide one Internet‑connected computer per student have similar proportions of schools with extracurricular activities to develop ICT skills or specific programmes to use ICT in teaching and learning. Being prepared for the digital transformation implies more than Internet access and use.

3. The digiTal TransformaTion for all3. The digiTal TransformaTion for all
144LATIN AMERICAN ECONOMIC OUTLOOK 2020 © OECD/UNITED NATIONS/CAF/EUROPEAN UNION 2020
145LATIN AMERICAN ECONOMIC OUTLOOK 2020 © OECD/UNITED NATIONS/CAF/EUROPEAN UNION 2020
Education systems must adapt content and services to the demands students will face in a digital‑intensive future.
Figure 3.20. ICT availability index at home and at school by PISA level of proficiency in science, LAC and OECD averages, 2018
0
1
2
3
4
5
6
7
8
9
1 2 3 4 5 6 1 2 3 4 5 6LAC average OECD average
PISA ICT indexICT available at home index ICT available at school index
Notes: The PISA ICT Familiarity Questionnaire asks about the availability of ICT at home and its use for various purposes. ICTHOME is an index based on the sum of the availability of all items listed in IC001. IC009 asks about the availability of ICT at school. The respective derived variable ICTSCHOOL is an index based on the sum of the availability of all items listed. For LAC and the OECD area, the difference in ICTHOME is significant between levels 1 and 6, while ICTSCHOOL is not significantly different. On average, both ICTHOME and ICTSCHOOL are significantly different between the OECD area and LAC. The means of both indexes for each level are significant.Source: Own calculations based on OECD (2018d), PISA 2018 Database (database), www.oecd.org/pisa/data/2018database/.12 https://doi.org/10.1787/888934172255
Most regional governments have limited resources. They must evaluate which programmes to implement and scale‑up policies that would substantially improve education quality. Evidence on the effect of programmes that provide digital tools (computers, software, connectivity) and skills is key to determining which are most beneficial to learning (Escueta et al., 2017; J‑PAL Evidence Review, 2019; Malamud et al., 2018).
Box 3.2. Computers in education
ICT has become a critical part of learning inside and outside the classroom. LAC governments have invested heavily in adopting ICT in their education systems over the last two decades, but the impact of access and use on student performance and achievement has not been as expected.
Lessons learned from One Laptop per Child programmes
One Laptop Per Child programmes in LAC, which distribute laptops to students for school and home use on a large scale, have been key in the debate about the ability of computers to enhance learning. Evaluations have found mixed results: there are significant uncertainties about effectiveness and impact.
Uruguay was one of the few countries to implement such a programme nationally. It had no effect on mathematics and reading scores in the first two years (Melo, Machado and Miranda, 2014), possibly owing to lack of compulsory teacher training and the primary use in classrooms for Internet searches.
Peru spent over USD 200 million to distribute 900 000 computers. While computer literacy improved, abilities in reading and mathematics did not. Observers argued that

3. The digiTal TransformaTion for all
146LATIN AMERICAN ECONOMIC OUTLOOK 2020 © OECD/UNITED NATIONS/CAF/EUROPEAN UNION 2020
147
the programme did not encompass Internet access and was carried out in mostly rural areas, where neither teachers nor parents had the knowledge to help children engage with digital technology. By contrast, an experimental programme in Lima, which provided laptops, high‑speed Internet access and eight training sessions for children on how to access education websites and search for information on sites such as Wikipedia, increased access and use of home computers, and performance on a proficiency test by 0.8 standard deviations (Beuermann et al., 2015).
Lessons learned from computer use at school
Providing digital devices does not ensure better performance (Bulman and Fairlie, 2016; Escueta et al., 2017; OECD, 2020b). PISA 2012 results showed that students with limited use of computers at school performed better at reading than students who did not use them at all; however, students who used them at a level above the OECD average had significantly poorer results (OECD, 2015d). If not used properly, computer use can have no or negative effects on outcomes.
Other studies show that the impact of computer‑assisted instruction, e.g. education software, depends on whether it is used as a substitute for or complement to traditional teaching. Its effect also depends on the quality of teaching methodology that computer‑assisted instruction is replacing or complementing. Use of computer‑assisted instruction is more effective in improving performance in developing countries when it replaces lower‑quality instruction or compensates for lack of teachers (Banerjee et al., 2007; OECD, 2020b).
There are ways to improve the outcomes of ICT use. A significant body of research suggests that teacher‑guided learning – well‑designed software used at school that expands course material – is among the most effective ways to help children develop skills (IDB, 2011).
Evidence indicates that children with weak adult supervision may spend more time using computers in ways that do little to boost their achievement than for homework or studying. Interventions to increase access should implement mechanisms to ensure proper use, for instance, computers preloaded with interactive educational software and apps that launch automatically to stimulate their use (IDB, 2011).
Providing training in computer labs one or two hours per week has had positive impacts on learning and employment opportunities. This may be a cheaper investment for the region, yielding relatively high returns, particularly for countries with limited resources: setting up and maintaining a school computer lab costs approximately USD 23 per student, compared with USD 217 per student for one computer per child programmes (IDB, 2011).
Teachers must have adequate technological skills to maximise skills transmission (Paniagua and Istance, 2018; Peterson et al., 2018). According to the Survey of Adult Skills, the share of teachers in OECD countries with low problem‑solving skills in technology‑rich environments ranged from less than 5% in Australia to 20% or more in Chile and Turkey (OECD, 2019g, 2016e).
Teachers can use massive open online courses (MOOCs) to improve their skills or as a pedagogical tool. Some US universities have collaborated with MOOC platforms to offer preparatory courses for high school students in advanced placement classes. Students following MOOCs rather than standard material tend to achieve slightly better learning results. Many MOOC participants are teachers (Seaton et al., 2014). Beyond increasing computers per student, investment in digital devices dedicated to teachers and in teacher training tends to result in higher student performance (Denoël et al., 2017). The quality of the tools, their co‑ordination with other teaching practices and teacher training are essential.
Box 3.2. Computers in education (cont.)

3. The digiTal TransformaTion for all3. The digiTal TransformaTion for all
146LATIN AMERICAN ECONOMIC OUTLOOK 2020 © OECD/UNITED NATIONS/CAF/EUROPEAN UNION 2020
147LATIN AMERICAN ECONOMIC OUTLOOK 2020 © OECD/UNITED NATIONS/CAF/EUROPEAN UNION 2020
Schools contribute to equity in use of ICT in LAC
Having the needed skills and level of education can protect against the digital divide and mitigate other divides. Digital inclusion requires more than improved access to ICT tools and infrastructure; it requires a broad set of cognitive, metacognitive and digital skills to benefit from the technology. How people use the Internet and digital technologies determines their benefits. As ICT access gaps decrease, differences in use and use outcomes are becoming increasingly important, especially in education.
The digital divide commonly relates to the gap in how individuals with different socio‑demographic profiles use the Internet and ICT and thus benefit from the opportunities of the digital transformation. Digital exclusion is compound and sequential; the amplification mechanism of digital exclusion suggests that the Internet is a magnifier of existing offline inequalities (van Deursen et al., 2017). Digitalisation may widen gaps if rural, socio‑economically disadvantaged or low‑performing students have less contact with digital education content, use the Internet for studying poorly and/or use the Internet predominantly for entertainment (OECD, 2019g).
Outside school, LAC students most commonly use ICT to engage in social networks, chat and search for information (Figure 3.21). Two in three engage in social networks and chat every day or almost every day (at least three times per week), compared with three in four in OECD countries. Similar to OECD countries, more than one in three LAC students regularly browses the Internet for practical information.
Figure 3.21. Student ICT use outside school in selected Latin American and Caribbean countries, 2018 or latest available year
Share of students using ICT outside school for an activity every day or almost every day (at least three times per week)
0
10
20
30
40
50
60
70
80
90
100
Social networks Chat Practical information Games News Email
%
Uruguay Chile Brazil Costa Rica Colombia Mexico Dominican Rep. Peru LAC average OECD average
Notes: Percentages are significant for each country/region. Proportion of students using digital devices for each activity is not significantly different between the OECD area and LAC. Colombia and Peru correspond to the 2015 PISA database owing to technical availability of data at the time of elaboration.Source: Own calculations based on OECD (2018d), PISA 2018 Database (database), www.oecd.org/pisa/data/2018database/ and OECD (2015c), PISA 2015 Database (database), www.oecd.org/pisa/data/2015database/.12 https://doi.org/10.1787/888934172274
Factors that shape inequalities in digital access, such as gender, socio‑economic background, labour force status, geography or skills, also shape inequalities in use (Demoussis and Giannakopoulos, 2006; Dewan and Riggins, 2005; Fairlie, 2004; Hargittai and Hsieh, 2013; Robinson, Dimaggio and Hargittai, 2003). The share of low‑educated Latin Americans with no connectivity declined in the last decade. Studies show that

3. The digiTal TransformaTion for all
148LATIN AMERICAN ECONOMIC OUTLOOK 2020 © OECD/UNITED NATIONS/CAF/EUROPEAN UNION 2020
149
low‑educated individuals use the Internet for recreation more than for learning, in contrast to highly educated individuals (van Deursen and van Dijk, 2014; OECD, 2019d).
Socio‑economic background and skills inform student use of ICT outside school in LAC. In OECD countries, socio‑economically disadvantaged students engage in social networks and chat almost as much as advantaged students but differ in getting practical information and emailing. In LAC countries, all uses differ between the two groups (Figure 3.22). Top performers tend to use ICT more frequently than low performers in both the OECD area and LAC, but the difference is more pronounced in LAC, indicating a greater digital divide in frequency of use in terms of skills characteristics.
Figure 3.22. ICT use outside and at school by socio-demographic category, LAC and OECD averages, 2018
Share of students using ICT outside and at school for an activity at least three times per week
0
10
20
30
40
50
60
70
80
Chat Email Practicalinformation
News Games Socialnetworks
Panel B. Socio-economic differences outside school
OECD advantaged OECD disadvantaged
LAC advantaged LAC disadvantaged
0
10
20
30
40
50
60
70
80
Chat Email Practicalinformation
News Games Socialnetworks
Panel A. Rural-urban differences outside school
OECD urban OECD rural LAC urban LAC rural
0
10
20
30
40
50
60
70
80
Chat Email Browse Homework Practice anddrills
Panel D. Socio-economic differences at school
OECD advantaged OECD disadvantaged
LAC advantaged LAC disadvantaged
0
10
20
30
40
50
60
70
80
Chat Email Browse Homework Practice anddrills
Panel C. Rural-urban differences at school
OECD urban OECD rural LAC urban LAC rural
%%
%%
Notes: Shares computed as averages of OECD and LAC countries that participated in the PISA ICT Familiarity Questionnaire. Students are considered socio‑economically disadvantaged if their values on the PISA ESCS index are in the bottom 25% in their country or economy. Rural students are those whose school is located in “a village, hamlet or rural area with fewer than 3 000 people”; urban students are those whose school is located in a city of over 100 000 people. Browse refers to “browsing the Internet for schoolwork” and “downloading, uploading or browsing material from the school’s website (e.g. <intranet>)”. Practice and drills refers to “practising and drilling, such as for foreign language learning or mathematics”. Homework refers to “doing homework on a school computer” and “using school computers for group work and communication with other students”.Source: Own calculations based on OECD (2018d), PISA 2018 Database (database), www.oecd.org/pisa/data/2018database/.12 https://doi.org/10.1787/888934172293

3. The digiTal TransformaTion for all3. The digiTal TransformaTion for all
148LATIN AMERICAN ECONOMIC OUTLOOK 2020 © OECD/UNITED NATIONS/CAF/EUROPEAN UNION 2020
149LATIN AMERICAN ECONOMIC OUTLOOK 2020 © OECD/UNITED NATIONS/CAF/EUROPEAN UNION 2020
Inequalities in ICT use also relate to gender and geography. Even when differences are small, boys and girls in LAC and OECD countries use digital devices differently (see the following section). While there are marginal differences in use between rural and urban students in OECD countries, urban students in LAC engage in social networks almost 30 percentage points more and chat over 20 percentage points more than rural students.
Schools also contribute to closing the digital divide in LAC countries in terms of Internet use. Across use categories, gaps in Internet use among students with different socio‑economic backgrounds were smaller at than outside school, even when differences were still significant.
Schools play a substantial role in decreasing the digital divide that will shape future skills (Figure 3.23). Yet, large variation persists across LAC schools, which policy makers need to address. Socio‑economically advantaged students are 5 percentage points to 10 percentage points more likely to chat and browse the Internet at school for schoolwork than disadvantaged students (Figure 3.23, Panel B). This is probably related to Internet access at school but could be related to students having and using mobile phones at school. They are also more likely to practise and use ICT to develop digital skills (practice and drilling). Boys in LAC are more likely than girls to use the Internet at school for email, homework, and practice and drills. Territorial inequalities exacerbate socio‑economic and gender inequalities in use of digital devices both at home and at school. Disadvantaged rural students are less likely to use ICT than advantaged urban students.
Figure 3.23. ICT use outside and at school by socio-economic status and location, LAC averages, 2018
Share of students using ICT outside and at school for an activity at least three times per week
0
10
20
30
40
50
60
70
80
90
Chat Email Practicalinformation
News Games Socialnetworks
Panel A. Outside schoolSocio-economically disadvantaged and ruralSocio-economically disadvantaged and urbanSocio-economically advantaged and ruralSocio-economically advantaged and urban%
0
10
20
30
40
50
60
70
80
90
Chat Email Browsing Homework Practisingand drilling
Panel B. At schoolSocio-economically disadvantaged and ruralSocio-economically disadvantaged and urbanSocio-economically advantaged and ruralSocio-economically advantaged and urban%
Notes: Shares computed as averages of OECD and LAC countries that participated in the PISA ICT Familiarity Questionnaire. Students are considered socio‑economically disadvantaged if their values on the PISA ESCS index are in the bottom 25% in their country or economy. Rural students are those whose school is located in “a village, hamlet or rural area with fewer than 3 000 people”; urban students are those whose school is located in a city of over 100 000 people. Browse refers to “browsing the Internet for schoolwork” and “downloading, uploading or browsing material from the school’s website (e.g. <intranet>)”. Practice and drills refers to “practising and drilling, such as for foreign language learning or mathematics”. Homework refers to “doing homework on a school computer” and “using school computers for group work and communication with other students”.Source: Own calculations based on OECD (2018d), PISA 2018 Database (database), www.oecd.org/pisa/data/2018database/.12 https://doi.org/10.1787/888934172312
How socio‑economic and urban‑rural divides affect ICT use is compounded when considering combined characteristics. Outside school use showed greater differences between disadvantaged rural students and advantaged urban students. Both advantaged

3. The digiTal TransformaTion for all
150LATIN AMERICAN ECONOMIC OUTLOOK 2020 © OECD/UNITED NATIONS/CAF/EUROPEAN UNION 2020
151
urban and rural students were more likely to use ICT at school, compared with their disadvantaged peers, but differences were not significant.
Gender differences in access and use of technologies start early
Gender is a critical dimension in many aspects of the digital transformation, especially labour markets, skills development, political participation and cyber violence (see Chapter 4). A gender perspective is relevant for developing inclusive, non‑discriminatory public policies that promote women’s economic and social rights, end gender stereotypes and close the digital gender divide.
Gender differences in access to technology start early in life. In both LAC and OECD countries, boys are 4 percentage points more likely than girls to start using digital devices before age 4 and 5 percentage points more likely to start between ages 4 and 6. Girls are about 5 percentage points more likely than boys to use a digital device for the first time between ages 10 and 12. Because, as shown above, early exposure is positively and significantly correlated with higher scores across PISA assessments, girls are at a disadvantage early in life.
Boys also enjoy greater ICT access than girls. The access gender gap is larger for LAC than OECD students. The difference between boys and girls in the OECD area and LAC is significant for the indexes that measure ICT access at and outside school. Girls aged 15 still have comparatively less exposure to and therefore development of digital skills (Figure 3.24).
Figure 3.24. Student ICT access by gender, OECD and LAC averages, 2018
0
1
2
3
4
5
6
7
8
9
10
Boy Girl Boy Girl
OECD average LAC average
PISA ICT index
ICT available at home index ICT available at school index
Notes: The difference between boys and girls is significant at 10% in the OECD area and LAC for both indexes. The difference between the OECD area and LAC is significant for both indexes when referring to either boys or girls.Source: Own calculations based on OECD (2018d), PISA 2018 Database (database), www.oecd.org/pisa/data/2018database/.12 https://doi.org/10.1787/888934172331
Gender differences are evident in ICT use. The PISA database derives ICT use indexes based on responses to how often digital devices are used: 1) outside school for leisure activities; 2) outside school for schoolwork; and 3) at school for any type of activity, including email, games, social networks, homework and posting work on the school website. On average, boys tend to use more ICT outside school for leisure activities in both OECD and LAC countries. Differences are less pronounced for ICT use outside school for schoolwork, since boys and girls have similar ICT use for homework (Figure 3.25).

3. The digiTal TransformaTion for all3. The digiTal TransformaTion for all
150LATIN AMERICAN ECONOMIC OUTLOOK 2020 © OECD/UNITED NATIONS/CAF/EUROPEAN UNION 2020
151LATIN AMERICAN ECONOMIC OUTLOOK 2020 © OECD/UNITED NATIONS/CAF/EUROPEAN UNION 2020
Figure 3.25. Student ICT use by gender, OECD and LAC averages, 2018
Indexes are transformed into an international metric with an OECD mean of 0 and an OECD standard deviation of 1
-0.3
-0.2
-0.1
0
0.1
0.2
0.3
0.4
Boy Girl Boy Girl
OECD average LAC average
PISA ICT use index
ICT use outside school for leisure activities ICT use outside school for schoolwork ICT use at school for activities
Notes: The difference between boys and girls is significant in the OECD area and LAC only for the ENTUSE (leisure activities outside school) index. The difference between the OECD area and LAC, when referring to boys and when comparing girls in the two geographical groups, is only significant for the HOMESCH schoolwork outside school index when referring to girls. Three questions in the ICT Familiarity Questionnaire ask about how often digital devices are used outside school for leisure activities (IC008), outside school for schoolwork (IC010) and at school for activities (IC011). Possible responses are “never or hardly ever”, “once or twice a month”, “once or twice a week”, “almost every day” and “every day”. The respective indexes – ENTUSE (leisure activities outside school), HOMESCH (schoolwork outside school) and USESCH (ICT use at school) – are scaled using the IRT (item response theory) scaling methodology (OECD, 2017b). Weighted likelihood estimates (WLEs; Warm, 1989) are used as individual participant scores and transformed into an international metric with an OECD mean of 0 and an OECD standard deviation of 1 (OECD, 2017b). Indexes of ICT use IRT scaling methodology, with the generalised partial credit model that estimates the probability of selecting a frequency of use for each of the items that are part of each of the three scenarios: outside school for leisure activities, outside school for schoolwork and at school for activities. International item and person parameters are obtained in a single analysis based on data from all persons in all countries. For each scale, only persons with minimum three valid responses are included. Students are weighted using the final student weight, and all countries contribute equally to the estimation. After this process, weighted likelihood estimates are used as individual participant scores, where 0 suggests a low frequency of use and values approaching 5 suggest a high frequency. Last, PISA derives a variable that eases comparison, and scores are transformed into an international metric with an OECD mean of 0 and an OECD standard deviation of 1. For detailed information on the construction on the indexes, see OECD (2017b).Source: Own calculations based on OECD (2018d), PISA 2018 Database (database), www.oecd.org/pisa/data/2018database/.12 https://doi.org/10.1787/888934172350
Girls have a lower estimation of their ICT skills, less autonomy using ICT and do not discuss ICT as a topic in social interaction as frequently as boys in LAC (Figure 3.26). PISA 2015 derives four variables to measure and compare students’ ICT interest, perceived competence in ICT usage, perceived autonomy related to ICT usage and degree to which ICT is a topic in daily social interaction. Students responded on a scale of “strongly disagree” to “strongly agree” to statements that captured self‑assessment in various situations regarding the four variables. Girls’ lack of ICT use and lack of confidence when using ICT places them at a disadvantage with respect to boys and is likely to discourage them from undertaking careers in digital or ICT professions.
Gender differences affect future choices and professional development. Gender stereotypes can dissuade girls from pursuing a career in science. Schools can redress these stereotypes and help all students adopt broad perspectives, for instance, through better information on career or professional choices. Employers and educators in perceived masculine or feminine scientific fields can help eliminate stereotypes by underscoring the relationships among disciplines (OECD, 2018e, 2016e, 2015b).
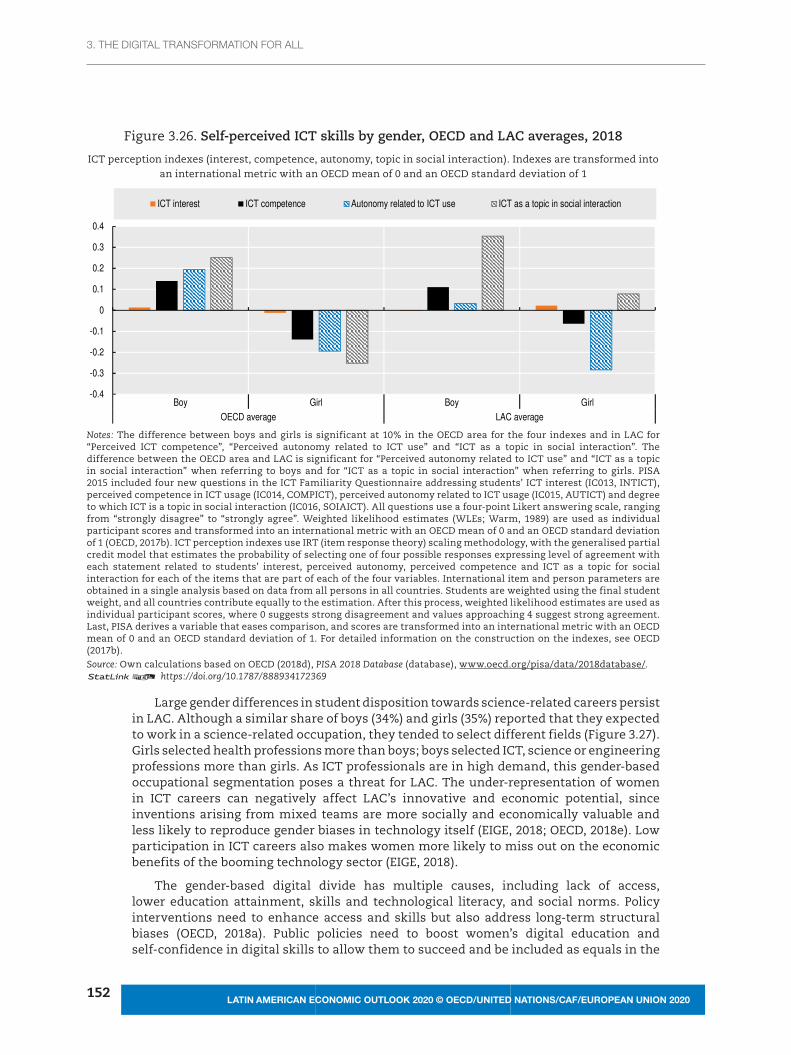
3. The digiTal TransformaTion for all
152LATIN AMERICAN ECONOMIC OUTLOOK 2020 © OECD/UNITED NATIONS/CAF/EUROPEAN UNION 2020
153
Figure 3.26. Self-perceived ICT skills by gender, OECD and LAC averages, 2018
ICT perception indexes (interest, competence, autonomy, topic in social interaction). Indexes are transformed into an international metric with an OECD mean of 0 and an OECD standard deviation of 1
-0.4
-0.3
-0.2
-0.1
0
0.1
0.2
0.3
0.4
Boy Girl Boy GirlOECD average LAC average
ICT interest ICT competence Autonomy related to ICT use ICT as a topic in social interaction
Notes: The difference between boys and girls is significant at 10% in the OECD area for the four indexes and in LAC for “Perceived ICT competence”, “Perceived autonomy related to ICT use” and “ICT as a topic in social interaction”. The difference between the OECD area and LAC is significant for “Perceived autonomy related to ICT use” and “ICT as a topic in social interaction” when referring to boys and for “ICT as a topic in social interaction” when referring to girls. PISA 2015 included four new questions in the ICT Familiarity Questionnaire addressing students’ ICT interest (IC013, INTICT), perceived competence in ICT usage (IC014, COMPICT), perceived autonomy related to ICT usage (IC015, AUTICT) and degree to which ICT is a topic in social interaction (IC016, SOIAICT). All questions use a four‑point Likert answering scale, ranging from “strongly disagree” to “strongly agree”. Weighted likelihood estimates (WLEs; Warm, 1989) are used as individual participant scores and transformed into an international metric with an OECD mean of 0 and an OECD standard deviation of 1 (OECD, 2017b). ICT perception indexes use IRT (item response theory) scaling methodology, with the generalised partial credit model that estimates the probability of selecting one of four possible responses expressing level of agreement with each statement related to students’ interest, perceived autonomy, perceived competence and ICT as a topic for social interaction for each of the items that are part of each of the four variables. International item and person parameters are obtained in a single analysis based on data from all persons in all countries. Students are weighted using the final student weight, and all countries contribute equally to the estimation. After this process, weighted likelihood estimates are used as individual participant scores, where 0 suggests strong disagreement and values approaching 4 suggest strong agreement. Last, PISA derives a variable that eases comparison, and scores are transformed into an international metric with an OECD mean of 0 and an OECD standard deviation of 1. For detailed information on the construction on the indexes, see OECD (2017b).Source: Own calculations based on OECD (2018d), PISA 2018 Database (database), www.oecd.org/pisa/data/2018database/.12 https://doi.org/10.1787/888934172369
Large gender differences in student disposition towards science‑related careers persist in LAC. Although a similar share of boys (34%) and girls (35%) reported that they expected to work in a science‑related occupation, they tended to select different fields (Figure 3.27). Girls selected health professions more than boys; boys selected ICT, science or engineering professions more than girls. As ICT professionals are in high demand, this gender‑based occupational segmentation poses a threat for LAC. The under‑representation of women in ICT careers can negatively affect LAC’s innovative and economic potential, since inventions arising from mixed teams are more socially and economically valuable and less likely to reproduce gender biases in technology itself (EIGE, 2018; OECD, 2018e). Low participation in ICT careers also makes women more likely to miss out on the economic benefits of the booming technology sector (EIGE, 2018).
The gender‑based digital divide has multiple causes, including lack of access, lower education attainment, skills and technological literacy, and social norms. Policy interventions need to enhance access and skills but also address long‑term structural biases (OECD, 2018a). Public policies need to boost women’s digital education and self‑confidence in digital skills to allow them to succeed and be included as equals in the

3. The digiTal TransformaTion for all3. The digiTal TransformaTion for all
152LATIN AMERICAN ECONOMIC OUTLOOK 2020 © OECD/UNITED NATIONS/CAF/EUROPEAN UNION 2020
153LATIN AMERICAN ECONOMIC OUTLOOK 2020 © OECD/UNITED NATIONS/CAF/EUROPEAN UNION 2020
digital transformation. Policies should also combat the social norms that contribute to the gender‑based digital divide, for instance, with campaigns conveying women’s aptitude for science, technology, engineering and mathematics (STEM)‑ and ICT‑related occupations, and by promoting female leadership role models and fostering mixed‑gender teamwork, especially in STEM‑related subjects (OECD, 2018a). Women’s more active participation in the digital world, such as through online campaigns to raise awareness on gender inequality or participation in policy‑making processes, may promote their full enjoyment of the benefits of digital technologies (see Chapter 4).
Figure 3.27. Share of students who desire a career in science, technology, engineering and mathematics at age 30 by gender, OECD and LAC averages, 2018
05
101520253035404550
Boy Girl Boy Girl
OECD average LAC average
%
Science and engineering professional Health professional Information and communications professional
Science and engineering technician Health technician Information and communications technician
Notes: The difference between boys and girls is significant at 10% in the OECD area for health professional, information and communications technology professional, health technician and information and communications technician. The difference between boys and girls is significant in LAC for all occupations except health technician. The difference between LAC and the OECD area is significant at 10% for health professional when referring to boys and not significant for any occupation when referring to girls. According to the ILO Resolution Concerning Updating the International Standard Classification of Occupations, science career includes: science and engineering professionals; health professionals; information and communications technology professionals; science and engineering technicians and associate professionals; health technicians and associate professionals; and information and communications technology technicians and associate professionals.Source: Own calculations based on OECD (2018d), PISA 2018 Database (database), www.oecd.org/pisa/data/2018database/.12 https://doi.org/10.1787/888934172388
Digitalisation and the coronavirus (Covid‑19): The widening divide
The coronavirus (Covid‑19) crisis highlights the importance of digital transformation, which has ensured some level of continuity for firms, workers, students and citizens. Broader telework could make labour markets more inclusive by making work more accessible to people with disabilities and other traditionally excluded groups. Yet, in light of policy responses, the digital divide becomes an even greater concern: a fraction of workers, students and consumers have the digital tools and skills to benefit from their advantages.
Absent strong policy actions, the crisis may exacerbate socio‑economic and geographical disparities in LAC. Lack of access to basic public services and quality housing make it hard for poor and vulnerable households to comply with social distancing measures. Some 21% of the LAC population live in slums, informal settlements or inadequate housing with more than three people sharing a room and with difficult access to basic services, such as potable water (Oxfam, 2020). These conditions hamper adherence to basic health and

3. The digiTal TransformaTion for all
154LATIN AMERICAN ECONOMIC OUTLOOK 2020 © OECD/UNITED NATIONS/CAF/EUROPEAN UNION 2020
155
safety measures, such as hand washing and isolating people with symptoms. Limited Internet access and lack of appropriate spaces hinder e‑learning and telework.
Decreased economic activity will negatively affect labour markets, increasing unemployment by 5.4 percentage points (ECLAC, 2020a) and affecting job quality in a region with 58% informality (OECD, 2020c). Effects will likely affect poor workers disproportionally, widening inequalities, with an estimated 7.1 percentage point increase in the poverty rate in 2020, affecting 37.3% of the population (ECLAC, 2020a).
Closure of businesses, especially those involving personal interactions, and quarantine measures are likely to affect disproportionally the poorest workers (living on less than USD 5.5 per capita per day [PPP 2011]) and vulnerable workers (living on USD 5.5‑13.0 per capita per day [PPP 2011]). Vulnerable workers are frequently informal, have low‑quality jobs with low social protection and face higher income volatility (OECD et al., 2019), making them more prone to macro and household shocks. Job losses globally will be enormous. The LAC region faces the potential loss of 17 million formal jobs and a potential increase in informality to 62% (Altamirano Montoya, Azuara Herrera and González, 2020).
Inequality arising from the pandemic is first and foremost evident in the ability to work from home (Birdsall and Lustig, 2020). In fact, the percentage of jobs that can migrate to telework is positively related to the level of GDP per capita (Dingel and Neiman, 2020) and lower degrees of informality. The sectoral composition of the labour market, as well as the limited access to ICT and insufficient digital skills for some workers affect the possibility to telework (ECLAC, 2020b).
Most poor and vulnerable workers in LAC perform manual tasks and work in sectors notably more affected by the coronavirus (Covid‑19) crisis, such as retail, restaurants, hotels, services, manufacturing, transport and construction. Some 42% of workers in social services and 62% in retail commerce and sales, restaurants and hotels are informal (Altamirano Montoya, Azuara Herrera and González, 2020). Workers in these sectors have the lowest probabilities of being able to telework, ranging from less than 5% in hotels and restaurants to around 15% for wholesale and retail trade (ECLAC, 2020b). Owing to the characteristics of informal and low‑quality jobs, these workers are more exposed to infection and have less access to quality health care. The risk of slipping back into poverty is considerable, and it is harder for these workers to comply with lockdown measures, given that their jobs entail human interaction and most have limited savings to face extended inactivity (ECLAC/ILO, 2020). Supporting the most vulnerable, those in poverty and informal workers will be decisive in counteracting the impact of the coronavirus (Covid‑19) on inequalities (OECD, 2020c).
Despite LAC’s progress in ICT access, poor and vulnerable workers are especially excluded from the benefits of ICT. Even if their jobs could be performed remotely, on average, only around 15% of poor workers and 25% of vulnerable workers in LAC have access to an Internet‑connected computer to enable working from home. By contrast, 50% of middle‑class workers (living on USD 13‑70 per capita day [PPP 2011]) and 81% of the most affluent workers (living on over USD 70 per capita per day [PPP 2011]) have the required ICT. Moreover, as seen, very few workers have strong digital skills, including computer knowledge and problem‑solving skills in technology‑rich environments (Figure 3.11).
Increasing connectivity and offering training programmes can help workers more rapidly adapt to telework. Hardships for those unable to work remotely also need to be addressed. Economic recovery should go hand in hand with policies that prioritise workplace health and safety. Workplace conditions, social distancing in facilities and

3. The digiTal TransformaTion for all3. The digiTal TransformaTion for all
154LATIN AMERICAN ECONOMIC OUTLOOK 2020 © OECD/UNITED NATIONS/CAF/EUROPEAN UNION 2020
155LATIN AMERICAN ECONOMIC OUTLOOK 2020 © OECD/UNITED NATIONS/CAF/EUROPEAN UNION 2020
commuting should be taken into account in designing protocols to return to work (ECLAC/ILO, 2020).
Female workers are more exposed to the material hardships associated with the coronavirus (Covid‑19) economic fallout. In general, women are likely to be more vulnerable than men to any crisis‑driven loss of income. Women’s incomes and wealth are, on average, lower than men’s, and their poverty rates are higher. Women may also find securing employment and income following lay‑off more difficult because of greater caring obligations. Some 10% of working women in the region are domestic employees, including caring and cleaning duties, most under no formal contract (Oxfam, 2020). Industries in which women workers are over‑represented, such as travel, tourism, accommodation services, food and beverage service and retail, have been hardest hit by the crisis. Although telework reduces some immediate economic impacts of social distancing measures, it is available to a small share of workers in these industries, some of whom have additional care responsibilities and costs due to school closure and vulnerable family members (OECD, 2020d).
The coronavirus (Covid‑19) crisis is changing the world of work and may have long‑lasting impacts on the future of jobs. The role of digital transformation in lives will be more evident if changes to deal with the pandemic persist. Telework, remote learning and other strategies observed during lockdowns reinforce the need to: improve communication infrastructure and skills; help employers, employees and university students better prepare; and increase systems’ resilience (OECD, 2020e). Governments should support firms, especially small and medium‑sized enterprises, own‑account workers and employees, to develop telework and e‑commerce capacities quickly, and elaborate suitable policies (OECD, 2020f).
Negative effects of the crisis will also depend on the speed with which societies and governments adapt to new forms of work, such as jobs in gig and platform economies, zero‑hour and part‑time contracts and telework. Sectors most affected by the crisis employ a large proportion of non‑standard workers (part‑time, self‑employed and fixed‑term contract workers). Many have less access to social protection and health benefits, and are more likely to lose their jobs (OECD, 2020g). Policy measures should set conditions for appropriate company actions and to prevent long‑lasting distributional effects. A more flexible labour market that absorbs new forms of work, with social security systems and occupational health and safety regulations, is urgently needed.
Policies should enhance consumer awareness about purchasing goods and services and accessing public services on line. Accessing health, banking and local authority services via digital technologies can be more efficient, while complying with social distancing. Service availability, affordability and digital skills limit adoption of digital technologies and Internet use in many countries. Lack of awareness and lack of ICT skills most affect rural households and older adults (Galperin, 2017), i.e. those especially vulnerable to the virus and who could most benefit from doing everyday activities remotely.
The pandemic may amplify inequalities in education. With schools closed in almost all LAC countries, online learning became critical (UNICEF, 2020). In a matter of days, principals and teachers transitioned to co‑ordinating virtual and broadcast classes, designing remote material and organising school feeding programme delivery (Basto‑Aguirre, Cerutti and Nieto‑Parra, 2020). Despite these efforts, LAC school systems have limited capacity to deliver quality remote learning: not all households are equipped with the necessary technology; not all parents are prepared to take on teaching duties alongside trying to keep or find a job. Suspension of in‑person classes may most affect students in low‑income countries and from disadvantaged socio‑economic backgrounds. School closure limits learning and may lead to losses in earnings and labour productivity

3. The digiTal TransformaTion for all
156LATIN AMERICAN ECONOMIC OUTLOOK 2020 © OECD/UNITED NATIONS/CAF/EUROPEAN UNION 2020
157
(Psacharopoulos et al., 2020). The extent of the impacts on human capital accumulation and future earnings will depend on government responses.
Only a few schools in Latin America were sufficiently prepared for digital learning before the pandemic. Students aged 15 attending advantaged schools in the region are more likely to have access to an effective online learning support platform, compared with those attending disadvantaged schools (Figure 3.28). Thus, unpreparedness may amplify socio‑economic gaps in education.
Figure 3.28. Availability of an effective online learning support platform by school socio-economic status in selected Latin American countries, 2018
Percentage of students in schools whose principals agreed or strongly agreed that an effective online learning support platform was available, PISA 2018
0
10
20
30
40
50
60
70
80
90
100
Uruguay DominicanRep.
Chile Colombia Brazil Mexico Peru Panama Costa Rica Argentina OECDaverage
%
All schools Disadvantaged schools Advantaged schools
Note: Socio‑economically disadvantaged (advantaged) schools are those in which the average socio‑economic status of students is in the bottom (top) quarter of the PISA ESCS among all schools in the country/economy. Countries/economies are ranked in descending order of percentage of schools with an effective online learning support platform. The difference between disadvantaged and advantaged schools in Uruguay is not statistically significant.
Source: OECD (2018d), PISA 2018 Database (database), www.oecd.org/pisa/data/2018database/.12 https://doi.org/10.1787/888934172407
Moreover, technological tools are only as effective as their use. On average, 58% of 15‑year‑olds in the region attended schools whose principals considered that teachers had the necessary technical and pedagogical skills to integrate digital devices into the curricula. This highlights the vast training needs that lie ahead for education systems. There was a significant discrepancy in digital teaching capacity between socio‑economically advantaged and disadvantaged schools. In Colombia, three in four advantaged schools reported being prepared, compared with fewer than half of disadvantaged schools. Schools can, therefore, reinforce rather than temper students’ relative disadvantage (OECD, 2020h). Almost half of LAC countries provided guidance or training on engaging with students remotely. One in three provided guidance on communicating with students, even when they did not provide training on remote teaching, but only 18% provided both guidance and training (Vargas, 2020).
Household readiness is equally relevant. As with telework, studying remotely is difficult to impossible for students from vulnerable and poor households. Computer and Internet access at home are prerequisites for online learning. Some 34% of primary, 41% of secondary and 68% of tertiary education students have access to an Internet‑connected

3. The digiTal TransformaTion for all3. The digiTal TransformaTion for all
156LATIN AMERICAN ECONOMIC OUTLOOK 2020 © OECD/UNITED NATIONS/CAF/EUROPEAN UNION 2020
157LATIN AMERICAN ECONOMIC OUTLOOK 2020 © OECD/UNITED NATIONS/CAF/EUROPEAN UNION 2020
computer. Access is especially low for students from poor households. For instance, less than 14% of poor students in primary education have a computer connected to Internet at home, compared to more than 80% of affluent students with the same education level (Figure 3.29) (Basto‑Aguirre, Cerutti and Nieto‑Parra, 2020). Access to a place to study may also influence remote education outcomes. In countries including Mexico, one in four students have no quiet place to study at home; the region’s average is more than one in five (OECD, 2020h).
Figure 3.29. Share of students enrolled in primary education with an Internet-connected computer at home by income group, 2018 or latest available year
0
10
20
30
40
50
60
70
80
90
100
Argentina Chile Uruguay Brazil Colombia Peru Ecuador Mexico CostaRica
ElSalvador
Paraguay Bolivia LatinAmericanaverage
%
Middle class Poor Vulnerable Affluent
Note: The regional average is a simple average. Poor are those living with less than USD 5.5 per capita per day (PPP 2011). Vulnerable, those living with USD 5.5 to USD 13 per capita per day (PPP 2011). Middle‑class, those living with USD 13 to USD 70 per capita day (PPP 2011). And, affluent are those living with more than USD 70 per capita per day (PPP 2011).Source: Basto‑Aguirre, Cerutti and Nieto‑Parra (2020).12 https://doi.org/10.1787/888934172426
Learning gaps between advantaged and disadvantaged students were large before the pandemic. In Brazil and Uruguay, the most disadvantaged students aged 15 trailed their most advantaged peers by the equivalent of four school years in science (OECD, 2018d). Disadvantaged students tend to experience larger learning losses when out of school (Alexander, Entwisle and Olson, 2001; Quinn et al., 2016). On average, across subjects and grades, disadvantaged students lose about three more months of learning than middle‑income students (Busso and Camacho Munoz, 2020; Cooper et al., 1996; Evans and Yuan, 2018). In particular, disadvantaged children tend to lose mathematics and reading knowledge, compared with their advantaged peers. Access to school and learning materials at home partially explains the difference. The coronavirus (Covid‑19) may extend these outcomes, with advantaged schools, families and students better equipped, trained and positioned to mitigate the effects of school closure. Although the pandemic’s effects on education are not measurable yet, advantaged students, usually among the top performers, might continue learning almost as if schools were open, while disadvantaged students, usually among the worst performers, might fall further behind (Iqbal et al., 2020).
To overcome both school closure and lack of connectivity, and prevent the deepening of education inequalities during the pandemic, LAC school systems drew on their experiences in reaching remote areas and mass media education broadcasting. To reduce inequalities, it is not enough to ensure that all students have access to ICT infrastructure. Investments must also address teacher training in adopting digital devices as part of
3. The digiTal TransformaTion for all
158LATIN AMERICAN ECONOMIC OUTLOOK 2020 © OECD/UNITED NATIONS/CAF/EUROPEAN UNION 2020
159
their practice, and strengthen the cognitive and digital skills that allow students to make the most of the advantages offered by the digital transformation. The coronavirus (Covid‑19) crisis could be an opportunity to implement policy responses that accelerate transformations in education systems, with long‑lasting positive effects that help close socio‑economic gaps in education quality and skills. At the same time, to prevent gaps from widening, systems are incorporating other media channels, such as radio and television, and combining them with online platforms, social media and traditional print materials to support students and households lacking the necessary communication infrastructure (Basto‑Aguirre, Cerutti and Nieto‑Parra, 2020).
Increasing connectivity, infrastructure for learning and alternatives for education provision to remote areas are key to mitigating negative effects. Besides addressing the urgent need to provide remote learning, governments must strategise for a successful return to class (OECD, 2020i).
The coronavirus (Covid‑19) crisis shed light on the fact that Internet and ICT access and use are basic necessities for equality of opportunity. Digital technology promises workers continued access to sustained income, students to high‑quality learning and consumers to basic services. To ensure inequalities are not amplified, countries need to provide not only ICT access, facilities, equipment and content but the foundational, cognitive and digital skills that enable workers, students and consumers to benefit equally.
Conclusion
Digitalisation is transforming the way people work, consume, communicate and learn, and how families, societies and businesses function. New technologies are bringing many opportunities for better social, political and economic inclusion. To make the most of this new context, people need to be resilient and mobile and adapt to the new demands of a digital world at home, work and school. Governments, the private sector and citizens should work together to integrate individuals into society better with digital tools that improve services, information and jobs.
More people are connected to the Internet than ever before in LAC, but gaps persist, and new ones may emerge. Access to and use of the Internet has become more equitable than other public services, such as secondary education or pensions. Still, less than 4 in 10 households with per capita monthly income in the lowest quintile do not use Internet, compared to nearly 8 in 10 in the highest quintile. A striking gap remains in how people with low and high education levels use the Internet. Social and economic inclusion depends on both access and digital skills.
New technologies bring labour market opportunities and challenges. Based on occupational estimates, almost two in ten jobs are at high risk of automation in LAC countries. Furthermore, by taking into consideration the replacement of tasks within occupations, on average, 25% of jobs in Chile, Ecuador, Mexico and Peru are at high risk of automation, and 35% may experience substantial changes in tasks and how they are carried out. Policies to support the transition of workers in declining industries to new employment, and moving towards universal social protection, are key. Social protection should be reshaped to protect workers and promote inclusion in a changing world of work, including ensuring more neutral treatment of various forms of work to prevent arbitrage among them, extending the reach of existing social protection systems to new forms of work, and boosting portability of entitlements among social insurance programmes intended for various labour market groups (OECD, 2019b).
Countries can enable the digital transformation and improve citizens’ lives by promoting the necessary infrastructure and skills to reap the opportunities of digitalisation.

3. The digiTal TransformaTion for all3. The digiTal TransformaTion for all
158LATIN AMERICAN ECONOMIC OUTLOOK 2020 © OECD/UNITED NATIONS/CAF/EUROPEAN UNION 2020
159LATIN AMERICAN ECONOMIC OUTLOOK 2020 © OECD/UNITED NATIONS/CAF/EUROPEAN UNION 2020
Accessibility and quality of mobile data and Internet connection remain major issues in many LAC countries. However, improving connectivity is only the first step in making the most of digital technologies and opportunities (OECD, 2019c). Until now, policies to boost the benefits of digitalisation have paid more attention to increasing access and connectivity than to quality of experience or use. Governments must identify and address foundational and digital skills gaps that might widen the digital divide through labour market interventions and education policies. Countries need to develop comprehensive skills strategies that mirror their productive strategies and include early and lifelong education in cognitive, metacognitive, technical and digital skills for all.
To navigate the transition to a digital world of work and thrive in it, individuals need not only digital skills but also a broad mix of skills, including cognitive and socio‑emotional skills (OECD, 2019a). Latin American countries covered by the Survey of Adult Skills and PISA lag in digital and basic skills and access to digital tools, intimating that a large share of the population may not have the skills required to face and benefit from the digital transformation. For workers whose jobs are being reshaped by the digital transformation, digital resources expand opportunities to acquire knowledge and develop skills flexibly (OECD, 2020b).
Developing digital skills early and throughout the life cycle is essential to closing gaps. A higher proportion of women than men with fewer skills had no computer experience. There are also gaps between the rich and more educated and the more vulnerable and less educated. At all levels of education and training, new technologies offer learning opportunities. New technologies in education can support the development of 21st century skills. Teachers can play a central role in making the digital transformation inclusive by integrating digital technologies into classrooms and ensuring that ICT has a positive effect on learning. This requires high‑quality, comprehensive and appropriate teacher training. Providing disadvantaged schools and students with greater access to ICT is not enough; they require programmes that develop the necessary skills.
Crises generally widen inequalities. Measures to contain the coronavirus (Covid‑19) exposed the digital divides in LAC – the gap between adopters and those who lag – among companies, individuals and countries. Throughout the crisis, digital transformation has proven essential to continue everyday activities and preserve jobs. Digital technologies have played an important role in mitigating income shock for households, workers and enterprises in socio‑economically privileged positions. Families, workers and students with Internet and ICT access continued to conduct business almost as usual, sustain incomes and learn, while those disconnected from digitalisation were left even farther behind. Fewer than half of Latin Americans had enough experience using computers and digital tools for basic professional tasks, effectively excluding them from remote activities. Tackling digital divides may produce better and more productive jobs, improve inclusiveness and access to public services, and create societies better equipped to face the crises that come with an increasingly globalised economy.
The coronavirus (Covid‑19) crisis made inclusive digital transformation a top priority, to temper negative effects and accelerate inclusive economic recovery. The need to embrace digital transformation beneficial to all is a main lesson of the crisis and may be an opportunity for countries to prioritise it in their DAs (see Chapter 4).
Societies that aspire to equality of opportunity must enable everyone to reach their full potential. Digital technology promises great progress in this direction. However, to avoid amplifying inherited inequalities and ensure that technology benefits all, countries should extend both access and skills among schools, students, households and workers. Policy actions should respond quickly and effectively articulate digital transformation processes as key enablers of social welfare.

3. The digiTal TransformaTion for all
160LATIN AMERICAN ECONOMIC OUTLOOK 2020 © OECD/UNITED NATIONS/CAF/EUROPEAN UNION 2020
161
Annex 3.A1 : Selected data at country level on Internet access and ICT use
Figure 3.A1.1. Distribution of Internet access and use, and other services by income decile in selected Latin American countries, 2017 or latest available year
0
0.20.1
0.40.3
0.50.60.70.80.91.0
00.10.20.30.4
0.60.5
0.80.7
1.00.9
0 0.1 0.2 0.3 0.4 0.5 0.6 0.7 0.8 0.9 1.0 0 0.1 0.2 0.3 0.4 0.5 0.6 0.7 0.8 0.9 1.0
0
0.20.1
0.40.3
0.50.60.70.80.91.0
00.10.20.30.4
0.60.5
0.80.7
1.00.9
0 0.1 0.2 0.3 0.4 0.5 0.6 0.7 0.8 0.9 1.0 0 0.1 0.2 0.3 0.4 0.5 0.6 0.7 0.8 0.9 1.0
0
0.20.1
0.40.3
0.50.60.70.80.91.0
00.10.20.30.4
0.60.5
0.80.7
1.00.9
0 0.1 0.2 0.3 0.4 0.5 0.6 0.7 0.8 0.9 1.0 0 0.1 0.2 0.3 0.4 0.5 0.6 0.7 0.8 0.9 1.0
Cumulative distribution Cumulative distribution
Pensions (contributors)
Sewerage system
Equality line
Income
Electricity
Internet access
Education
Internet use
Pensions (affiliates)
Computer access
Panel A. Brazil Panel B. Bolivia
Cumulative share of househodls from poorest to wealthest Cumulative share of househodls from poorest to wealthest
Cumulative distribution Cumulative distributionPanel C. Chile Panel D. Costa Rica
Cumulative share of househodls from poorest to wealthest Cumulative share of househodls from poorest to wealthest
Cumulative distribution Cumulative distributionPanel E. Colombia Panel F. Ecuador
Cumulative share of househodls from poorest to wealthest Cumulative share of househodls from poorest to wealthest

3. The digiTal TransformaTion for all3. The digiTal TransformaTion for all
160LATIN AMERICAN ECONOMIC OUTLOOK 2020 © OECD/UNITED NATIONS/CAF/EUROPEAN UNION 2020
161LATIN AMERICAN ECONOMIC OUTLOOK 2020 © OECD/UNITED NATIONS/CAF/EUROPEAN UNION 2020
Figure 3.A1.1. Distribution of Internet access and use, and other services by income decile in selected Latin American countries, 2017 or latest available year (cont.)
0
0.20.1
0.40.3
0.50.60.70.80.91.0
00.10.20.30.4
0.60.5
0.80.7
1.00.9
0 0.1 0.2 0.3 0.4 0.5 0.6 0.7 0.8 0.9 1.0 0 0.1 0.2 0.3 0.4 0.5 0.6 0.7 0.8 0.9 1.0
0
0.20.1
0.40.3
0.50.60.70.80.91.0
00.10.20.30.4
0.60.5
0.80.7
1.00.9
0 0.1 0.2 0.3 0.4 0.5 0.6 0.7 0.8 0.9 1.0 0 0.1 0.2 0.3 0.4 0.5 0.6 0.7 0.8 0.9 1.0
0
0.20.1
0.40.3
0.50.60.70.80.91.0
00.10.20.30.4
0.60.5
0.80.7
1.00.9
0 0.1 0.2 0.3 0.4 0.5 0.6 0.7 0.8 0.9 1.0 0 0.1 0.2 0.3 0.4 0.5 0.6 0.7 0.8 0.9 1.0
Cumulative distribution Cumulative distribution
Pensions (contributors)
Sewerage system
Equality line
Income
Electricity
Internet access
Education
Internet use
Pensions (affiliates)
Computer access
Panel G. El Salvador Panel H. Honduras
Cumulative share of househodls from poorest to wealthest Cumulative share of househodls from poorest to wealthest
Cumulative distribution Cumulative distributionPanel I. Mexico Panel J. Paraguay
Cumulative share of househodls from poorest to wealthest Cumulative share of househodls from poorest to wealthest
Cumulative distribution Cumulative distributionPanel K. Peru Panel L. Uruguay
Cumulative share of househodls from poorest to wealthest Cumulative share of househodls from poorest to wealthest
Notes: Simple average by decile for selected LAC countries. X‑axis = income decile. Y‑axis = cumulative percentage of people with Internet and computer access in their households; cumulative percentage of people reporting Internet use in the previous 3 or 12 months, depending on household survey question; cumulative percentage of people in a household with sewerage or electricity; and cumulative percentage of people aged 20 or older with at least secondary education. Calculations based on 2017 household surveys or latest available year: 2016 for Bolivia, Honduras and Mexico. Start age of Internet use varies by country: El Salvador and Paraguay measure from age 10; Bolivia, Chile, Ecuador and Honduras from age 5; Peru and Uruguay from age 6. Previous Internet use period, from survey date, is the previous 3 months for Bolivia, Honduras, Paraguay and Uruguay, and the previous 12 months for Chile, Ecuador and El Salvador. Other variables include all ages. Brazil, Chile, Costa Rica, Ecuador, El Salvador, Paraguay and Uruguay include mobile Internet in Internet access. Bolivia, Colombia, Mexico and Peru do not specify whether mobile Internet is included. Bolivia, Brazil, Chile, Costa Rica, Ecuador, Paraguay and Uruguay include laptops and tablets in computer access. Colombia, El Salvador, Mexico and Peru do not specify whether laptops or tablets are included.Source: Own calculations based on ORBA/ECLAC (2019), Household Survey Data Bank (database), www.cepal.org/es/observatorio‑ regional‑de‑banda‑ancha.12 https://doi.org/10.1787/888934172445

3. The digiTal TransformaTion for all
162LATIN AMERICAN ECONOMIC OUTLOOK 2020 © OECD/UNITED NATIONS/CAF/EUROPEAN UNION 2020
163
Figure 3.A1.2. ICT use by activity in selected Latin American countriesShare of people performing activity by frequency (%)
0 50 100
Internet - email
Internet - gather information
Internet - conduct transactions
Computer - spreadsheets
Computer - word
Computer - programming
Computer - real-time discussions
Panel C. Mexico
0 50 100
Internet - email
Internet - gather information
Internet - conduct transactions
Computer - spreadsheets
Computer - word
Computer - programming
Computer - real-time discussions
Panel D. Peru
0 50 100
Internet - email
Internet - gather information
Internet - conduct transactions
Computer - spreadsheets
Computer - word
Computer - programming
Computer - real-time discussions
Panel A. Chile
0 50 100
Internet - email
Internet - gather information
Internet - conduct transactions
Computer - spreadsheets
Computer - word
Computer - programming
Computer - real-time discussions
Panel B. Ecuador
Never Less than once per week At least once per week
Note: Latin American average is a simple average including Chile, Ecuador, Mexico and Peru. Chile participated in PIAAC Round 2 and the other LAC countries (Mexico, Peru, Ecuador) in Round 3.Source: Own calculations based on OECD/PIAAC (2018), Survey of Adult Skills (database), www.oecd.org/skills/piaac/data/.12 https://doi.org/10.1787/888934172464

3. The digiTal TransformaTion for all3. The digiTal TransformaTion for all
162LATIN AMERICAN ECONOMIC OUTLOOK 2020 © OECD/UNITED NATIONS/CAF/EUROPEAN UNION 2020
163LATIN AMERICAN ECONOMIC OUTLOOK 2020 © OECD/UNITED NATIONS/CAF/EUROPEAN UNION 2020
Figure 3.A1.3. ICT use at work by activity in selected Latin American countriesShare of workers performing activity by frequency (%)
0 50 100
Internet for information
Online money transactions
Spreadsheets
Word processing
Programming language
Online real-time discussions
Panel C. Mexico
0 50 100
Internet for information
Online money transactions
Spreadsheets
Word processing
Programming language
Online real-time discussions
Panel D. Peru
0 50 100
Internet for information
Online money transactions
Spreadsheets
Word processing
Programming language
Online real-time discussions
Panel A. Chile
0 50 100
Internet for information
Online money transactions
Spreadsheets
Word processing
Programming language
Online real-time discussions
Panel B. Ecuador
Never Less than once per week At least once per week
Note: “Never” includes workers who have never used a computer or who do not use ICT in their occupations. Chile participated in PIAAC Round 2 and the other LAC countries (Mexico, Peru, Ecuador) in Round 3.Source: Own calculations based on OECD/PIAAC (2018), Survey of Adult Skills (database), www.oecd.org/skills/piaac/data/.12 https://doi.org/10.1787/888934172483
Notes
1. Internet users are calculated based on estimates and survey data corresponding to the proportion of individuals using the Internet. The number should reflect the total population of the country at least 5 years old and older where possible.
2. The index of use of ICT skills at work is a derived variable in the PIAAC. The background questionnaire collects a range of information on respondents’ reading‑ and numeracy‑related activities, ICT use at work and in everyday life, and generic skills required in their work. The index attempts to summarise how frequently certain activities are performed at work. Respondents are asked about the extent to which they use ICT (email, Internet, spreadsheets, word processing, programming, online transactions, online communications [conference calls, chats]) and asked to rate the frequency with which they engage in each activity on a scale of “never” to “every day”. The index is then rescaled using the generalised partial credit model. See The Survey of Adult Skills: Reader’s Companion (OECD, 2019e). This information is collected through the background questionnaire of the Survey of Adult Skills, which asks about the use of literacy, numeracy, ICT skills and other skills at work and in everyday life. Questions regarding ICT activities (computer use, email, Internet for information, Internet for

3. The digiTal TransformaTion for all
164LATIN AMERICAN ECONOMIC OUTLOOK 2020 © OECD/UNITED NATIONS/CAF/EUROPEAN UNION 2020
165
transactions, spreadsheets, word processing, computer programming, Internet for real‑time communications) attempt to measure overall level of ICT skills use in terms of frequency and complexity. Indexes of use of other skills include numeracy, writing, reading, planning and influencing. The main characteristic of the items is the ordering behind the structure of possible answers: consecutive alternatives indicate a higher frequency of performing a task detailed in a given item, ranging from 0 (never) to 4 (daily). The PIAAC uses the generalised partial credit model, an item response theory (IRT) model resulting in a continuous one‑dimensional scale that explains the covariance among item responses: people with a higher level on the derived scale have a higher probability of frequently performing the task. Individuals who report never performing any of the tasks included in each IRT scale are excluded from the scales. The items used to calculate the scales related to ICT skills use at work and at home are only posed to people who report having used a computer before. IRT‑derived indices are continuous variables, which should be interpreted as representing the level of use of the underlying skills and which, for easier comparisons, have been standardised to have a mean equal to 2 and a standard deviation equal to 1 across the pooled sample of respondents in all countries/economies (appropriately weighted). This results in indices for which at least 90% of the observations lay between 0 and 4 whereby values approaching 0 suggest a low frequency of use and values approaching 4 suggest a high frequency. For detailed information on the construction of the indices, see OECD (2019d, 2019e).
3. This chapter uses data from the school, student and optional ICT Familiarity Questionnaires of PISA 2012, 2015 and 2018. Of the ten Latin American countries that participated in PISA 2018, Argentina, Colombia and Peru did not administer the ICT Familiarity Questionnaire. See OECD (2017b, 2016d, 2016e). When not indicated otherwise, the LAC average includes all countries that participated in each PISA round, excluding those with no available data for the ICT variables.
4. ICT availability indexes are derived variables of the PISA ICT Familiarity Questionnaire (OECD, 2017b). They are based on the sum of technologies available at home and at school. At home, these include desktop computer, portable laptop or notebook, tablet, Internet connection, video game console, mobile phone, smartphone, portable music player, printer, USB (memory) stick and e‑book reader. At school, they include desktop computer, portable laptop or notebook, tablet, Internet‑connected school computer, wireless Internet connection, storage space for school‑related data, USB stick, e‑book reader, data projector and interactive whiteboard.

3. The digiTal TransformaTion for all3. The digiTal TransformaTion for all
164LATIN AMERICAN ECONOMIC OUTLOOK 2020 © OECD/UNITED NATIONS/CAF/EUROPEAN UNION 2020
165LATIN AMERICAN ECONOMIC OUTLOOK 2020 © OECD/UNITED NATIONS/CAF/EUROPEAN UNION 2020
References
A4AI (2019), Affordability Report: Americas 2019, Alliance for Affordable Internet, Washington, DC, https://a4ai.org/affordability‑report/report/2019/.
Alexander, K., D. Entwisle and L. Olson (2001), “Schools, achievement, and inequality: A seasonal perspective”, Educational Evaluation and Policy Analysis, Vol. 23, No. 2, American Educational Research Association, Washington, DC, pp. 171‑191, available at www.jstor.org/stable/3594128?seq=1.
Altamirano Montoya, A., O. Azuara Herrera and S. González (2020), ¿Cómo Impactará la COVID‑19 al Empleo?: Posibles Escenarios para América Latina y el Caribe, Inter‑American Development Bank, Washington, DC, http://dx.doi.org/10.18235/0002301.
Amaral, N. et al. (2018), “How far can your skills take you: Understanding skill demand changes due to occupational shifts and the transferability of workers across occupations”, Labour Markets and Social Technical Note, No. IDB‑TN‑01501, IDB Labour Markets and Social Security Division, Inter‑American Development Bank, Washington, DC, http://dx.doi.org/10.18235/0001291.
APC (2020), “Conectar lo no conectado: apoyo a las redes comunitarias y otras iniciativas de conectividad con base en la comunidad”, Asociación para el Progreso de las Comunicaciones, Melville, ZA, www.apc.org/es/project/conectar‑lo‑no‑conectado‑apoyo‑las‑redes‑comunitarias‑ y‑otras‑iniciativas‑de‑conectividad.
Arntz, M., T. Gregory and O. Zierahn (2016), “The risk of automation for jobs in OECD Countries”, OECD Social, Employment and Migration Working Papers, No. 189, OECD Publishing, Paris, https://doi.org/10.1787/1815199X.
Azuara Herrera et al. (2019), The Future of Work in Latin America and the Caribbean: What are the Most In‑demand Occupations and Emerging Skills in the Region?, Inter‑American Development Bank, Washington, DC, http://dx.doi.org/10.18235/0001677.
Banerjee, A. et al. (2007), “Remedying education: Evidence from two randomized experiments in India”, The Quarterly Journal of Economics, Vol. 122, Iss. 3, Oxford University Press, Oxford, pp. 1235‑1264, http://dx.doi.org/10.1162/qjec.122.3.1235.
Basto‑Aguirre, N., P. Cerutti and S. Nieto‑Parra (2020), “COVID‑19 can widen educational gaps in Latin America: Some lessons for urgent policy action” (blog), Vox Lacea, Bogotá, https://vox.lacea.org/?q=blog/covid19_widen_educational_gaps.
Berlingieri, Blanchenay and Criscuolo (2017), “The great divergence(s)”, OECD Science, Technology and Industry Policy Papers, No. 39, OECD Publishing, Paris, https://doi.org/10.1787/953f3853‑en.
Beuermann, D. W. et al. (2015), “One Laptop per Child at home: Short‑term impacts from a randomized experiment in Peru”, American Economic Journal: Applied Economics, Vol. 7, No. 2, American Economic Association, Nashville, pp. 53‑80, http://dx.doi.org/10.1257/app.20130267.
Birdsall, N. and N. Lustig (2020), “The new inequalities and people‑to‑people social protection”, Center for Global Development, Washington, DC, www.cgdev.org/blog/new‑inequalities‑and‑people‑people‑social‑protection.
Bulman, G. and R. Fairlie (2016), “Chapter 5 ‑ Technology and education: Computers, software, and the Internet”, in Handbook of the Economics of Education, Vol. 5, Elsevier B.V., Amsterdam, pp. 239‑280, http://dx.doi.org/10.1016/B978‑0‑444‑63459‑7.00005‑1.
Busso, M. and J. Camacho Munoz (2020), “Pandemic and inequality: How much human capital is lost when schools close?”, IDB Improving Lives, Inter‑American Development Bank, Washington, DC, https://blogs.iadb.org/ideas‑matter/en/pandemic‑and‑inequality‑how‑much‑human‑capital‑ is‑lost‑when‑schools‑close/.
Bustelo, M. et al. (2020), “Automation in Latin America: Are Women at Higher Risk of Losing Their Jobs?”, IDB Working Paper Series; 1137. http://dx.doi.org/10.18235/0002566.
Cooper, H. et al. (1996), “The effects of summer vacation on achievement test scores: A narrative and meta‑analytic review”, Review of Educational Research, Vol. 66, No. 3, American Educational Research Association, Washington, DC, pp. 227‑268, available at www.jstor.org/stable/1170523.
Cunha, F., J. Heckman and S. Schennach (2010), “Estimating the technology of cognitive and noncognitive skill formation”, Econometrica, Vol. 78, Iss. 3, Wiley Online Library, pp. 883‑931, http://dx.doi.org/10.3982/ECTA6551.
Demoussis, M. and N. Giannakopoulos (2006), “Facets of the digital divide in Europe: Determination and extent of Internet use”, Economics of Innovation and New Technology, Vol. 15, Iss. 3, Taylor & Francis Online, pp. 235‑246, http://dx.doi.org/10.1080/10438590500216016.
Denoël, E. et al. (2017), Drivers of Student Performance: Insights from Europe, McKinsey & Company, New York, www.mckinsey.com/industries/social‑sector/our‑insights/drivers‑of‑student‑performance‑ insights‑from‑europe.

3. The digiTal TransformaTion for all
166LATIN AMERICAN ECONOMIC OUTLOOK 2020 © OECD/UNITED NATIONS/CAF/EUROPEAN UNION 2020
167
Dewan, S. and F. Riggins (2005), “The digital divide: Current and future research directions”, Journal of the Association for Information Systems, Vol. 6, No. 12, Association for Information Systems, Atlanta, pp. 298‑337, https://pdfs.semanticscholar.org/d6c1/18d8c0461b350e9925103db435776714781d.pdf (accessed 17 October 2018).
Dingel, J. and B. Neiman (2020), “How many jobs can be done at home?”, Journal of Public Economics, Vol 189, 2020, 104235, ISSN 0047‑2727, https://doi.org/10.1016/j.jpubeco.2020.104235.
ECLAC (2020a), Addressing the growing impact of COVID‑19 with a view to reactivation with equality: New projections, Economic Commission for Latin America and the Caribbean, Santiago, www.cepal.org/en/publications/45784‑addressing‑growing‑impact‑covid‑19‑view‑reactivation‑equality‑new‑projections.
ECLAC (2020b), Universalizing access to digital technologies to address the consequences of COVID‑19, Special Report COVID‑19, No. 7, Economic Commission for Latin America and the Caribbean, Santiago, https://repositorio.cepal.org/handle/11362/45939.
ECLAC (2019), Observatorio Regional de Banda Ancha (database), based on households surveys from ORBA/ECLAC Household Survey Data Bank (BADEHOG) (database), sample for households with Internet access includes Bolivia (2016), Chile (2017), Colombia (2017), Costa Rica (2017), Ecuador (2017), Paraguay (2017), Uruguay (2017), El Salvador (2017), Brazil (2017) and Perú (2017), Economic Commission for Latin America and the Caribbean, Santiago, www.cepal.org/es/observatorio‑regional‑de‑banda‑ancha (accessed 12 September 2019).
ECLAC/ILO (2020), “Work in times of pandemic: The challenges of the coronavirus disease (COVID‑19)”, Employment Situation in Latin America and the Caribbean, No. 22 (LC/TS.2020/46), Economic Commission for Latin America and the Caribbean/International Labour Organization, Santiago, www.cepal.org/en/publications/45582‑employment‑situation‑latin‑america‑and‑caribbean‑work‑times‑pandemic‑challenges.
EIGE (2018), Gender Equality and Digitalisation in the European Union, factsheet, European Institute for Gender Equality, Vilnius, https://eige.europa.eu/publications/gender‑equality‑and‑digitalisation‑european‑union.
Escueta, M. et al. (2017), “Education technology: An evidence‑based review”, NBER Working Paper, No. 23744, National Bureau of Economic Research, Cambridge, www.nber.org/papers/w23744.
Evans, D. and F. Yuan (2018), “Equivalent years of schooling: A metric to communicate learning gains in concrete terms”, World Bank Policy Research Working Paper, No. WPS 8752, World Bank Group, Washington, DC, http://documents.worldbank.org/curated/en/123371550594320297/Equivalent‑Years‑of‑Schooling‑A‑Metric‑to‑Communicate‑Learning‑Gains‑in‑Concrete‑Terms.
Fairlie, R. (2004), “Race and the digital divide”, The B.E. Journal of Economic Analysis & Policy, Vol. 3, Iss. 1, Berkeley Electronic Press, Berkeley, pp. 1‑40, https://econpapers.repec.org/article/bpjbejeap/v_3acontributions.3_3ay_3a2004_3ai_3a1_3an_3a15.htm (accessed 17 October 2018).
Frey, C. and M. Osborne (2017), “The future of employment: How susceptible are jobs to computerisation?”, Technological Forecasting and Social Change, Vol. 114, Elsevier Inc., Amsterdam, pp. 254‑280, http://dx.doi.org/10.1016/j.techfore.2016.08.019.
Galperin, H. (2017), “Why are half of Latin Americans not online? A four‑country study of reasons for Internet non‑adoption”, International Journal of Communication, Vol. 11, University of Southern California Annenberg Press, Los Angeles, pp. 3332‑3354, https://ijoc.org/index.php/ijoc/article/view/6287.
Hargittai, E. and Y. Hsieh (2013), Digital Inequality, Oxford University Press, Oxford, http://dx.doi.org/10.1093/oxfordhb/9780199589074.013.0007.
IDB (2020), Internet Para Todos: Helping Latin America to Log On, Technologies, Inter‑American Development Bank, Washington, DC, www.iadb.org/en/improvinglives/internet‑para‑todos‑helping‑latin‑america‑log.
IDB (2011), Development Connections: Unveiling the Impact of New Information Technologies, Inter‑American Development Bank, Washington, DC, https://publications.iadb.org/en/publication/16270/development‑connections‑unveiling‑impact‑new‑information‑technologies‑summary.
Iqbal, S. A. et al. (2020), “We should avoid flattening the curve in education – Possible scenarios for learning loss during the school lockdowns” (blog), World Bank Group, Washington, DC, https://blogs.worldbank.org/education/we‑should‑avoid‑flattening‑curve‑education‑possible‑scenarios‑learning‑loss‑during‑school (accessed 16 April 2020).
ITU (2019), World Telecommunication Indicators Database (database), International Telecommunication Union, Geneva, www.itu.int/pub/D‑IND‑WTID.OL‑2019.
J‑PAL Evidence Review (2019), “Will technology transform education for the better?”, J‑PAL Evidence Review, Abdul Latif Jameel Poverty Action Lab, Cambridge, www.povertyactionlab.org/sites/default/files/2020‑03/education‑technology‑evidence‑review.pdf.
3. The digiTal TransformaTion for all3. The digiTal TransformaTion for all
166LATIN AMERICAN ECONOMIC OUTLOOK 2020 © OECD/UNITED NATIONS/CAF/EUROPEAN UNION 2020
167LATIN AMERICAN ECONOMIC OUTLOOK 2020 © OECD/UNITED NATIONS/CAF/EUROPEAN UNION 2020
Katz, R. (2018), Capital Humano para la Transformación Digital en América Latina, Serie Desarrollo Productivo, United Nations Economic Commission for Latin America and the Caribbean, Santiago, www.cepal.org/es/publicaciones/43529‑capital‑humano‑la‑transformacion‑digital‑america‑latina.
Katz, R. (2017), “Social and economic impact of digital transformation on the economy”, Discussion Paper presented at the GSR‑17 of the International Telecommunications Union, Nassau, www.itu.int/en/ITU‑D/Conferences/GSR/Documents/GSR2017/Soc_Eco_impact_Digital_transformation_finalGSR.pdf.
MAEUEC (2020), Contribución de las Empresas Españolas al Desarrollo Sostenible en Iberoamérica, Ministry of Foreign Affairs, European Union and Co‑operation of Spain, Madrid, www.espanha‑brasil.org/img/documentos/2020_05_DOC%20CONTRIBUCION%20EMPRESAS%20final.pdf.
Malamud, O. et al. (2018), “Do children benefit from Internet access? Experimental evidence from Peru”, NBER Working Paper, No. 25312, National Bureau of Economic Research, Cambridge, http://dx.doi.org/10.3386/w25312.
Melo, G., A. Machado and A. Miranda (2014), “The impact of a One Laptop per Child Program on learning: Evidence from Uruguay”, Discussion Paper, No. 8489, Center for Research and Teaching of Economics/Institute of Labor Economics, Mexico/Bonn, http://ftp.iza.org/dp8489.pdf.
MINTEL (2019), Ecuador Digital, Ministerio de las Telecomunicaciones y de la Sociedad de la Información de Ecuador, Quito, www.telecomunicaciones.gob.ec/wp‑content/uploads/2019/05/PPT‑Estrategia‑Ecuador‑Digital.pdf.
MinTIC (2019), “MinTIC anuncia inicio de nuevo proyecto que conectará 1.000 zonas rurales en el país”, Ministerio de Tecnologías de la Información y las Comunicaciones de Colombia, Bogotá, www.mintic.gov.co/portal/inicio/Sala‑de‑Prensa/Noticias/101504:MinTIC‑anuncia‑inicio‑de‑nuevo‑proyecto‑que‑conectara‑1‑000‑zonas‑rurales‑en‑el‑pais.
Nedelkoska, L. and G. Quintini (2018), “Automation, skills use and training”, OECD Social, Employment and Migration Working Papers, No. 202, OECD Publishing, Paris, https://doi.org/10.1787/2e2f4eea‑en.
OECD (2020a), OECD Employment Outlook 2020: Worker Security and the COVID‑19 Crisis, OECD Publishing, Paris, https://doi.org/10.1787/1686c758‑en.
OECD (2020b), Making the Most of Technology for Learning and Training in Latin America, OECD Skills Studies, OECD Publishing, Paris, https://doi.org/10.1787/ce2b1a62‑en.
OECD (2020c), COVID‑19 in Latin America and the Caribbean: Regional Socio‑economic Implications and Policy Priorities, OECD Publishing, Paris, www.oecd.org/coronavirus/policy‑responses/covid‑19‑in‑latin‑america‑and‑the‑caribbean‑regional‑socio‑economic‑implications‑and‑policy‑priorities‑93a64fde/.
OECD (2020d), Women at the Core of the Fight Against COVID‑19, OECD Publishing, Paris, www.oecd.org/coronavirus/policy‑responses/women‑at‑the‑core‑of‑the‑fight‑against‑covid‑19‑crisis/.
OECD (2020e), COVID‑19: Protecting People and Societies, OECD Publishing, Paris, www.oecd.org/coronavirus/policy‑responses/covid‑19‑protecting‑people‑and‑societies‑e5c9de1a/.
OECD (2020f), Supporting People and Companies to deal with the COVID‑19 Virus: Options for an Immediate Employment and Social‑policy Response, OECD publishing, Paris, www.oecd.org/coronavirus/policy‑responses/supporting‑people‑and‑companies‑to‑deal‑with‑the‑covid‑19‑virus‑options‑for‑an‑immediate‑employment‑and‑social‑policy‑response‑d33dffe6/.
OECD (2020g), Distributional Risks Associated with Non‑standard Work: Stylised Facts and Policy Considerations, OECD Publishing, Paris, www.oecd.org/coronavirus/policy‑responses/distr ibutional‑r isks‑associated‑with‑non‑standard‑work‑stylised‑facts‑and‑policy‑considerations‑68fa7d61/.
OECD (2020h), Learning Remotely When Schools Close: How Well Are Students and Schools Prepared? Insights from PISA, OECD Publishing, Paris, https://read.oecd‑ilibrary.org/view/?ref=127_127063‑iiwm328658&title=Learning‑remotely‑when‑schools‑close.
OECD (2020i), A Framework to Guide an Education Response to the COVID‑19 Pandemic of 2020, OECD Publishing, Paris, https://read.oecd‑ilibrary.org/view/?ref=126_126988‑t63lxosohs&title=A‑framework‑to‑guide‑an‑education‑response‑to‑the‑Covid‑19‑Pandemic‑of‑2020.
OECD (2019a), OECD Employment Outlook 2019: The Future of Work, OECD Publishing, Paris, https://doi.org/10.1787/9ee00155‑en.
OECD (2019b), How’s Life in the Digital Age?: Opportunities and Risks of the Digital Transformation for People’s Well‑being, OECD Publishing, Paris, https://doi.org/10.1787/9789264311800‑en.
OECD (2019c), Skills Matter: Additional Results from the Survey of Adult Skills, OECD Skills Studies, OECD Publishing, Paris, https://doi.org/10.1787/1f029d8f‑en.

3. The digiTal TransformaTion for all
168LATIN AMERICAN ECONOMIC OUTLOOK 2020 © OECD/UNITED NATIONS/CAF/EUROPEAN UNION 2020
169
OECD (2019d), Technical Report of the Survey of Adult Skills (PIAAC), Third Edition, OECD Publishing, Paris, www.oecd.org/skills/piaac/publications/PIAAC_Technical_Report_2019.pdf.
OECD (2019e), Survey of Adult Skills (PIAAC) (webpage), OECD Publishing, Paris, www.oecd.org/skills/piaac/.
OECD (2019f), The Survey of Adult Skills: Reader’s Companion, Third Edition, OECD Skills Studies, OECD Publishing, Paris, https://doi.org/10.1787/f70238c7‑en.
OECD (2019g), OECD Skills Outlook 2019: Thriving in a Digital World, OECD Publishing, Paris, https://doi.org/10.1787/df80bc12‑en.
OECD (2018a), “Bridging the rural digital divide”, OECD Digital Economy Papers, No. 265, OECD Publishing, Paris, https://dx.doi.org/10.1787/852bd3b9‑en.
OECD (2018b), Good Jobs for All in a Changing World of Work: The OECD Jobs Strategy, OECD Publishing, Paris, https://doi.org/10.1787/9789264308817‑en.
OECD (2018c), OECD Employment Outlook 2018, OECD Publishing, Paris, http://dx.doi.org/10.1787/empl_outlook‑2018‑en.
OECD (2018d), PISA 2018 Database (database), OECD Publishing, Paris, www.oecd.org/pisa/data/2018database/.
OECD (2018e), Bridging the Digital Gender Divide: Include, Upskill, Innovate, OECD Publishing, Paris, www.oecd.org/internet/bridging‑the‑digital‑gender‑divide.pdf.
OECD (2017a), PISA 2015 Results (Volume III): Students’ Well‑Being, PISA, OECD Publishing, Paris, https://dx.doi.org/10.1787/9789264273856‑en.
OECD (2017b), PISA 2015 Technical Report, OECD Publishing, Paris, www.oecd.org/pisa/data/2015‑technical‑report/.
OECD (2016a), Ministerial Declaration on the Digital Economy: Innovation, Growth and Social Prosperity, OECD Publishing, Paris, www.oecd.org/internet/Digital‑Economy‑Ministerial‑Declaration‑2016.pdf.
OECD (2016b), OECD Employment Outlook 2016, OECD Publishing, Paris, https://doi.org/10.1787/empl_outlook‑2016‑en.
OECD (2016c), Skills Matter: Further Results from the Survey of Adult Skills, OECD Skills Studies, OECD Publishing, Paris, https://dx.doi.org/10.1787/9789264258051‑en.
OECD (2016d), PISA 2015 Results (Volume II): Policies and Practices for Successful Schools, PISA, OECD Publishing, Paris, http://dx.doi.org/10.1787/9789264267510‑en.
OECD (2016e), PISA 2015 Results (Volume I): Excellence and Equity in Education, PISA, OECD Publishing, Paris, http://dx.doi.org/10.1787/9789264266490‑en.
OECD (2015a), Survey of Adult Skills (PIAAC 2015): Full selection of indicators (database), OECD Publishing, Paris, www.oecd.org/skills/piaac/.
OECD (2015b), Education at a Glance 2015: OECD Indicators, OECD Publishing, Paris, http://dx.doi.org/10.1787/eag‑2015‑en.
OECD (2015c), PISA 2015 Database (database), OECD Publishing, Paris, www.oecd.org/pisa/data/2015database/.
OECD (2015d), “How Computers are related to students’ performance”, in Students, Computers and Learning: Making the Connection, OECD Publishing, Paris, https://doi.org/10.1787/9789264239555‑en.
OECD et al. (2019), Latin American Economic Outlook 2019: Development in Transition, OECD/CAF/ECLAC/EU, OECD Publishing, Paris, https://doi.org/10.1787/g2g9ff18‑en.
OECD/IDB (2016), Broadband Policies for Latin America and the Caribbean: A Digital Economy Toolkit, OECD Publishing, Paris, https://www.oecd‑ilibrary.org/science‑and‑technology/broadband‑policies‑for‑latin‑america‑and‑the‑caribbean_9789264251823‑en.
OECD/PIAAC (2018), Survey of Adult Skills (database), OECD Publishing, Paris, www.oecd.org/skills/piaac/data/.
ORBA/ECLAC (2019), Household Survey Data Bank (database), United Nations Economic Commission for Latin America and the Caribbean, Santiago, www.cepal.org/es/observatorio‑regional‑de‑banda‑ancha.
Oxfam (2020), “El COVID‑19 no discrimina, las desigualdades sí”, Oxfam Briefing, Oxfam International, https://oi‑files‑d8‑prod.s3.eu‑west‑2.amazonaws.com/s3fs‑public/2020‑03/Covid%2019%20en%20LAC_nota%20informativa_F_0.pdf.
Paniagua, A. and D. Istance (2018), Teachers as Designers of Learning Environments: The Importance of Innovative Pedagogies, Centre for Educational Research and Innovation, OECD Publishing, Paris, https://doi.org/10.1787/9789264085374‑en.

3. The digiTal TransformaTion for all3. The digiTal TransformaTion for all
168LATIN AMERICAN ECONOMIC OUTLOOK 2020 © OECD/UNITED NATIONS/CAF/EUROPEAN UNION 2020
169LATIN AMERICAN ECONOMIC OUTLOOK 2020 © OECD/UNITED NATIONS/CAF/EUROPEAN UNION 2020
Peterson, A. et al. (2018), “Understanding innovative pedagogies: Key themes to analyse new approaches to teaching and learning”, OECD Education Working Papers, No. 172, OECD Publishing, Paris, https://dx.doi.org/10.1787/9f843a6e‑en.
PIAAC Expert Group in Problem Solving in Technology‑Rich Environments (2009), “PIAAC problem solving in technology‑rich Environments: A conceptual framework”, OECD Education Working Papers, No. 36, OECD Publishing, Paris, https://doi.org/10.1787/220262483674.
Psacharopoulos, G. et al. (2020), “Lost wages: The COVID‑19 cost of school closures”, Policy Research Working Paper Series, No. 9246, World Bank Group, Washington, DC, available at https://papers.ssrn.com/sol3/papers.cfm?abstract_id=3601422.
Quinn, D. et al. (2016), “Seasonal dynamics of academic achievement inequality by socioeconomic status and race/ethnicity: Updating and extending past research with new national data”, Educational Researcher, Vol. 45, Iss. 8, SAGE Publishing, Thousand Oaks, CA, pp. 443‑453, https://doi.org/10.3102/0013189X16677965.
Robinson, J., P. Dimaggio and E. Hargittai (2003), “New social survey perspectives on the digital divide”, IT & Society, Vol. 1, Northwestern University, Evanston, IL, pp. 1‑22, www.scholars.northwestern.edu/en/publications/new‑social‑survey‑perspectives‑on‑the‑digital‑divide.
Seaton, D. et al. (2014), “Teacher enrollment in MITx MOOCs: Are we educating educators?”, SSRN Electronic Journal, Elsevier, Amsterdam, http://dx.doi.org/10.2139/ssrn.2515385.
UNESCO (2017), “Digital society: Gaps and challenges for digital inclusion in Latin America and the Caribbean”, UNESCO Policy Papers, UNESCO Office Montevideo and Regional Bureau for Science in Latin America and the Caribbean, Montevideo, https://unesdoc.unesco.org/ark:/48223/pf0000262860_eng?posInSet=1&queryId=12146cc0‑ecca‑4b00‑bf19‑2d26b45d9af0.
UNICEF (2020), “Covid 19: More than 95 per cent of children are out of school in Latin America and the Caribbean”, UNICEF Latin America and the Caribbean, Panama, www.unicef.org/press‑releases/covid‑19‑more‑95‑cent‑children‑are‑out‑school‑latin‑america‑and‑caribbean.
van Deursen, A. et al. (2017), “The compoundness and sequentiality of digital inequality”, International Journal of Communication, Vol. 11(2017), University of Southern California Annenberg Press, Los Angeles, pp. 452‑473, https://ijoc.org/index.php/ijoc/article/view/5739/1911.
van Deursen, A. and J. van Dijk (2014), “The digital divide shifts to differences in usage”, New Media & Society, Vol. 16, Iss. 3, SAGE Publishing, Thousand Oaks, CA, pp. 507‑526, http://dx.doi.org/10.1177/1461444813487959.
Vargas, E. (2020), School Closures, Government Responses, and Learning Inequality around the World during COVID‑19, The Brookings Institution, Washington, DC, www.brookings.edu/research/school‑closures‑government‑responses‑and‑learning‑inequality‑around‑the‑world‑during‑covid‑19/?preview_id=799315.
Warm, T. A. (1989), “Weighted likelihood estimation of ability in item response theory”, Psychometrika, Vol. 54, SpringerLink, pp. 427‑450, https://doi.org/10.1007/BF02294627.
Weller J., S. Gontero and S. Campbell (2019), “Cambio tecnológico y empleo: Una perspectiva latinoamericana. Riesgos de la sustitución tecnológica del trabajo humano y desafíos de la generación de nuevos puestos de trabajo”, Serie Macroeconomía del Desarrollo, No. 201 (LC/TS.2019/37), United Nations Economic Commission for Latin America and the Caribbean, Santiago, www.cepal.org/es/publicaciones/44637‑cambio‑tecnologico‑empleo‑perspectiva‑latinoamericana‑riesgos‑la‑sustitucion.
West, D. (2015), Digital Divide: Improving Internet Access in the Developing World, Center for Technology Innovation at Brookings, Washington, DC, www.brookings.edu/wp‑content/uploads/2016/06/West_Internet‑Access.pdf.

From:Latin American Economic Outlook 2020Digital Transformation for Building Back Better
Access the complete publication at:https://doi.org/10.1787/e6e864fb-en
Please cite this chapter as:
OECD, et al. (2020), “The digital transformation for all”, in Latin American Economic Outlook 2020: DigitalTransformation for Building Back Better, OECD Publishing, Paris.
DOI: https://doi.org/10.1787/e7a00fd6-en
This work is published under the responsibility of the Secretary-General of the OECD. The opinions expressed and argumentsemployed herein do not necessarily reflect the official views of OECD member countries.
This document, as well as any data and map included herein, are without prejudice to the status of or sovereignty over anyterritory, to the delimitation of international frontiers and boundaries and to the name of any territory, city or area. Extracts frompublications may be subject to additional disclaimers, which are set out in the complete version of the publication, available atthe link provided.
The use of this work, whether digital or print, is governed by the Terms and Conditions to be found athttp://www.oecd.org/termsandconditions.