NCHEMS - OECD
83
HEFCE-OECD/IMHE 2004 – National Report – United States OECD IMHE-HEFCE PROJECT ON INTERNATIONAL COMPARATIVE HIGHER EDUCATION FINANCIAL MANAGEMENT AND GOVERNANCE FINANCIAL MANAGEMENT AND GOVERNANCE IN HEIS: UNITED STATES Aimes C. McGUINNESS, Jr. National VCenter for Higher Education Management Systems P.O. Box 9752 Boulder, Colorado 80301-9752 NCHEMS
-
Upload
khangminh22 -
Category
Documents
-
view
0 -
download
0
Transcript of NCHEMS - OECD
HEFCE-OECD/IMHE 2004 – National Report – United States
OECD IMHE-HEFCE PROJECT ON INTERNATIONAL COMPARATIVE HIGHER EDUCATION FINANCIAL
MANAGEMENT AND GOVERNANCE
FINANCIAL MANAGEMENT AND GOVERNANCE IN HEIS: UNITED STATES
Aimes C. McGUINNESS, Jr.
National VCenter for Higher Education Management Systems
P.O. Box 9752
Boulder, Colorado 80301-9752
NCHEMS
HEFCE-OECD/IMHE 2004 – National Report – United States
Page 2
TABLE OF CONTENTS
OECD IMHE-HEFCE PROJECT ON INTERNATIONAL COMPARATIVE HIGHER EDUCATION FINANCIAL MANAGEMENT AND GOVERNANCE ..........................1
FINANCIAL MANAGEMENT AND GOVERNANCE IN HEIS: UNITED STATES.1
Purpose..................................................................................................................................5 Sections of the paper............................................................................................................5
NATIONAL OVERVIEW .....................................................................................................6
Institutions and students ......................................................................................................6 Differences between federal and state roles ......................................................................9 Differences among the states ............................................................................................10 State structures and relationships between government and institutions ......................13 Differences in budgeting and financing relationships between states and institutions..1 Current context.....................................................................................................................3 Selection of state cases ........................................................................................................7
KENTUCKY............................................................................................................................8
KENTUCKY............................................................................................................................9
Constitutional position of public higher education in Kentucky .....................................9 Current policy context .......................................................................................................17 Description of policy instruments.....................................................................................22 State policy instruments and institutional financial management..................................25
NORTH DAKOTA ...............................................................................................................27
NORTH DAKOTA ...............................................................................................................28
Constitutional position of public higher education in North Dakota.............................28 Current policy context .......................................................................................................34
ANALYSIS AND CONCLUSION .....................................................................................43
ANALYSIS AND CONCLUSION .....................................................................................44
Comparison of Kentucky and North Dakota ...................................................................44 Long-term concerns/risks ..................................................................................................46 Conclusion ..........................................................................................................................47
SELECTED REFERENCES ................................................................................................47
SELECTED REFERENCES ................................................................................................48
3 HEFCE-OECD/IMHE 2004 – National Report – United states
APPENDICES .......................................................................................................................51
AppendixA State Grades on State Report Card on Higher Education, Measuring Up 2002 52 Appendix B Influence of Governance Relationships on Financing, Budgeting, and Accountability ......................................................................................................................1 Appendix C State Procedural Controls Affecting State-Higher Education Relationships 3 Appendix D Key Indicators of Progress Toward Postsecondary Reform in Kentucky.8 Appendix E North Dakota University System Performance and Fiscal Accountability Measures .............................................................................................................................10
4 HEFCE-OECD/IMHE 2004 – National Report – United States
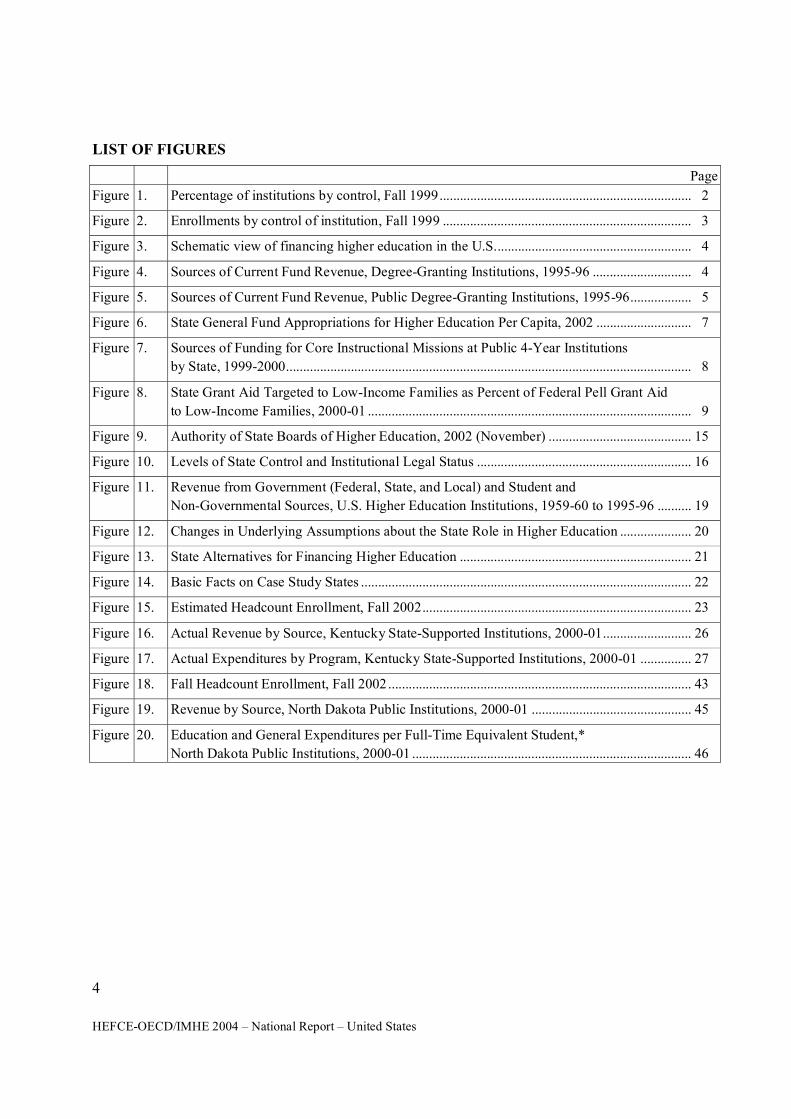
LIST OF FIGURES
Page
Figure 1. Percentage of institutions by control, Fall 1999.......................................................................... 2
Figure 2. Enrollments by control of institution, Fall 1999 ......................................................................... 3
Figure 3. Schematic view of financing higher education in the U.S.......................................................... 4
Figure 4. Sources of Current Fund Revenue, Degree-Granting Institutions, 1995-96 ............................. 4
Figure 5. Sources of Current Fund Revenue, Public Degree-Granting Institutions, 1995-96.................. 5
Figure 6. State General Fund Appropriations for Higher Education Per Capita, 2002 ............................ 7
Figure 7. Sources of Funding for Core Instructional Missions at Public 4-Year Institutions
by State, 1999-2000....................................................................................................................... 8
Figure 8. State Grant Aid Targeted to Low-Income Families as Percent of Federal Pell Grant Aid
to Low-Income Families, 2000-01 ............................................................................................... 9
Figure 9. Authority of State Boards of Higher Education, 2002 (November) .......................................... 15
Figure 10. Levels of State Control and Institutional Legal Status ............................................................... 16
Figure 11. Revenue from Government (Federal, State, and Local) and Student and
Non-Governmental Sources, U.S. Higher Education Institutions, 1959-60 to 1995-96 .......... 19
Figure 12. Changes in Underlying Assumptions about the State Role in Higher Education ..................... 20
Figure 13. State Alternatives for Financing Higher Education .................................................................... 21
Figure 14. Basic Facts on Case Study States ................................................................................................. 22
Figure 15. Estimated Headcount Enrollment, Fall 2002............................................................................... 23
Figure 16. Actual Revenue by Source, Kentucky State-Supported Institutions, 2000-01.......................... 26
Figure 17. Actual Expenditures by Program, Kentucky State-Supported Institutions, 2000-01 ............... 27
Figure 18. Fall Headcount Enrollment, Fall 2002......................................................................................... 43
Figure 19. Revenue by Source, North Dakota Public Institutions, 2000-01 ............................................... 45
Figure 20. Education and General Expenditures per Full-Time Equivalent Student,*
North Dakota Public Institutions, 2000-01 .................................................................................. 46
5 HEFCE-OECD/IMHE 2004 – National Report – United states
INTRODUCTION
Purpose
1. The purpose of this paper is to describe and analyze the role of governments in the United States in ensuring the viability of higher education institutions and enhancing the effectiveness of institutional financial governance and management. The report is one of several national reports prepared for a project of the Organisation for Economic Co-operation and Development (OECD) Institutional Management in Higher Education Program (IMHE) and the Higher Education Funding Council for England (HEFCE).1 The paper is written primarily for a non-U.S. audience and is intended to provide information for comparison with approaches of other nations to similar issues. The views expressed in this report are those of the author and not of the sponsoring organizations.
2. The other countries participating in the OECD/IMHE/HEFCE project prepared national reports. Because of the complexity of the U.S. higher education system, the decision was made to provide both a national overview as well as case studies of two states for the purpose of international comparison. The decision to focus on states for detailed description and analysis rather than the U.S. as a whole was based on the fact that in the U.S. it is at the state level that the financial governance relationships between higher education institutions and government are most pronounced and relevant for the purpose of international comparison. The federal government plays important but narrowly defined roles (e.g., in establishing basic Constitutional protections and legal requirements in areas such as civil rights, the environment, employment policy, and in funding student financial assistance and research). Nevertheless, the federal government does not generally become directly involved in issues related to institutional viability and financial management and governance.
Sections of the paper
3. The paper has four sections. The first section provides a national overview of the relationship between government and higher education in the U.S., including the differences between the federal and state roles and the differences among the 50 states. The second and third sections present case studies of financial management policies and systems in two states, Kentucky and North Dakota. These sections follow to the extent possible the outline as required by the OECD/IMHE/HEFCE project for comparing these states with the other countries participating in the study. The fourth section presents a comparison and analysis of the approaches to state policy and institutional financial management of the two case study states and overall conclusions from the study.
1 Other participating countries include Australia, Germany, Ireland, Japan, Sweden, The Netherlands, and the U.K.
(England).
6 HEFCE-OECD/IMHE 2004 – National Report – United States
NATIONAL OVERVIEW
Institutions and students
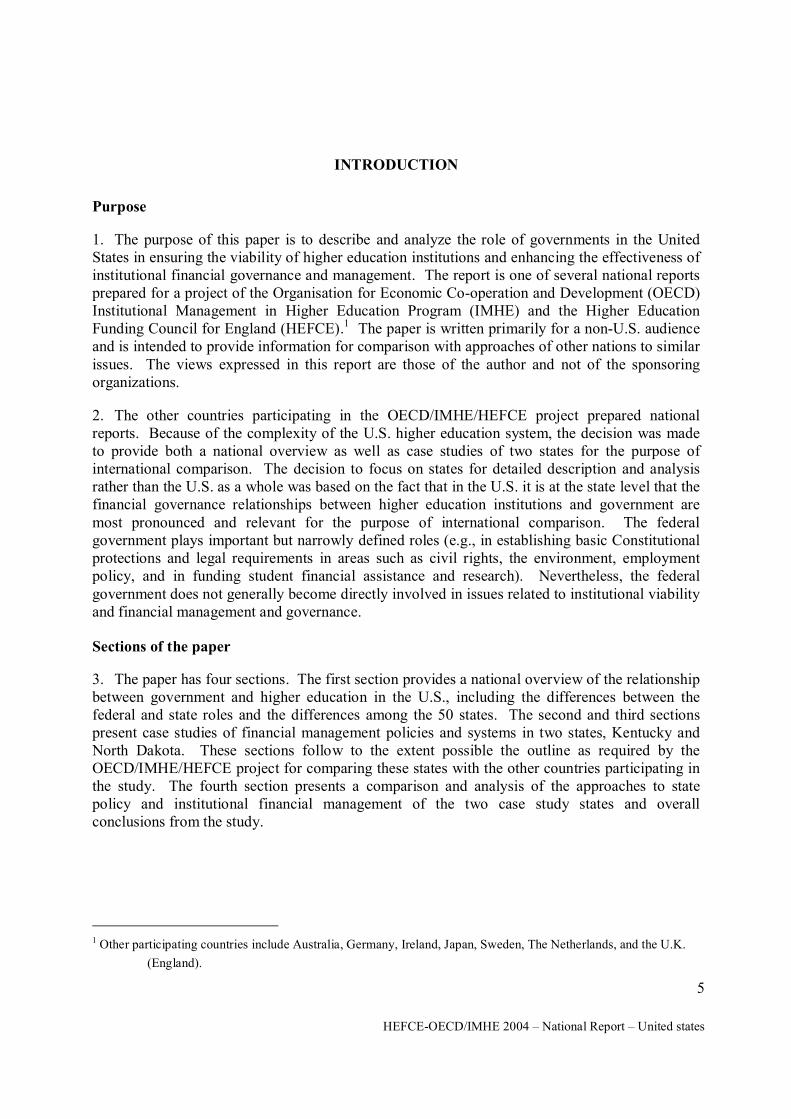
4. A total of 4 182 institutions enroll 14.8 million students in the U.S. Approximately 59% of the institutions are private (either private non-profit or for profit) and 41% are public (institutions responsible to and funded primarily by state and local governments).
Figure 1. Percentage of institutions by control, Fall 1999
Public 4 year.,15%
Private 4 year non-profit,
37%
Public 2 year, 26%
Private 2-year non-profit, 3%
Private 4 year for-profit, 7%
Private 2-year for-profit, 12%
Source: National Center for Education Statistics, Digest of Education Statistics: 2001, Table 244.
7 HEFCE-OECD/IMHE 2004 – National Report – United states
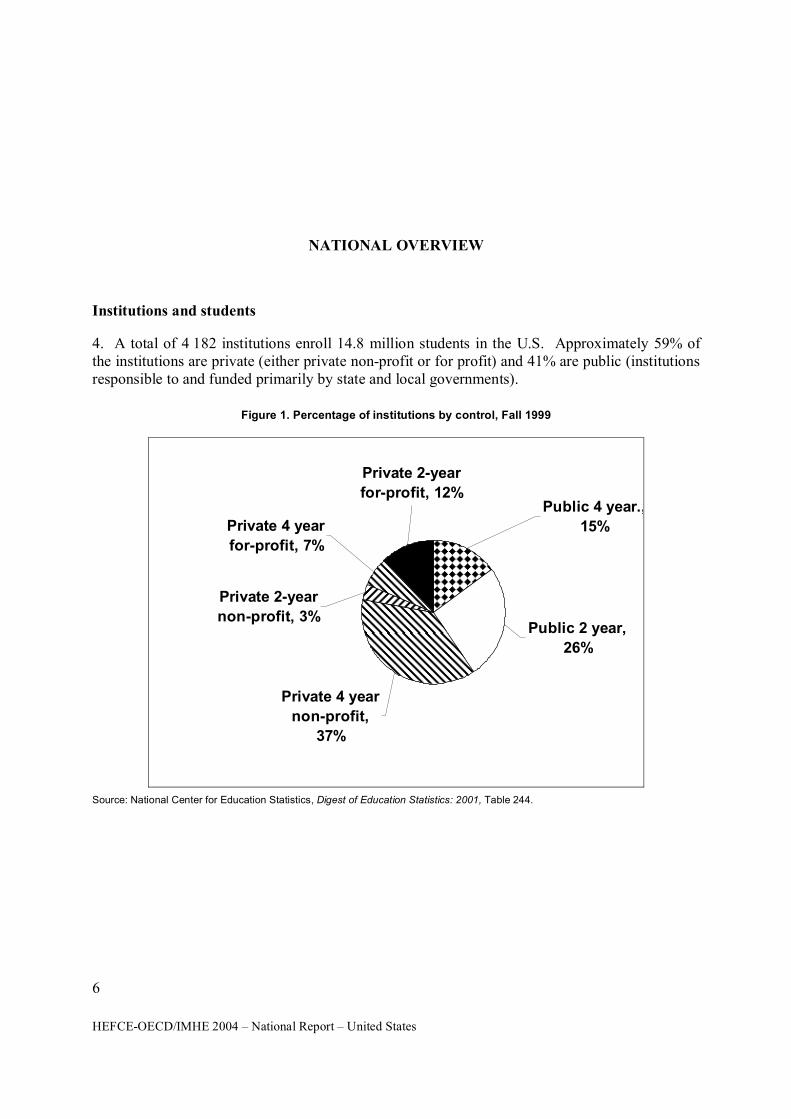
5. Most students (76%) are enrolled in public institutions and almost of half these students are enrolled in public 2-year community and technical institutions.
Figure 2. Enrollments by control of institution, Fall 1999
Public 2-year36%
Public 4-year40%
Private 2-year2%
Private 4-year22%
Source: National Center for Education Statistics, Digest of Education Statistics: 2001, Table 173.
Overall financing system
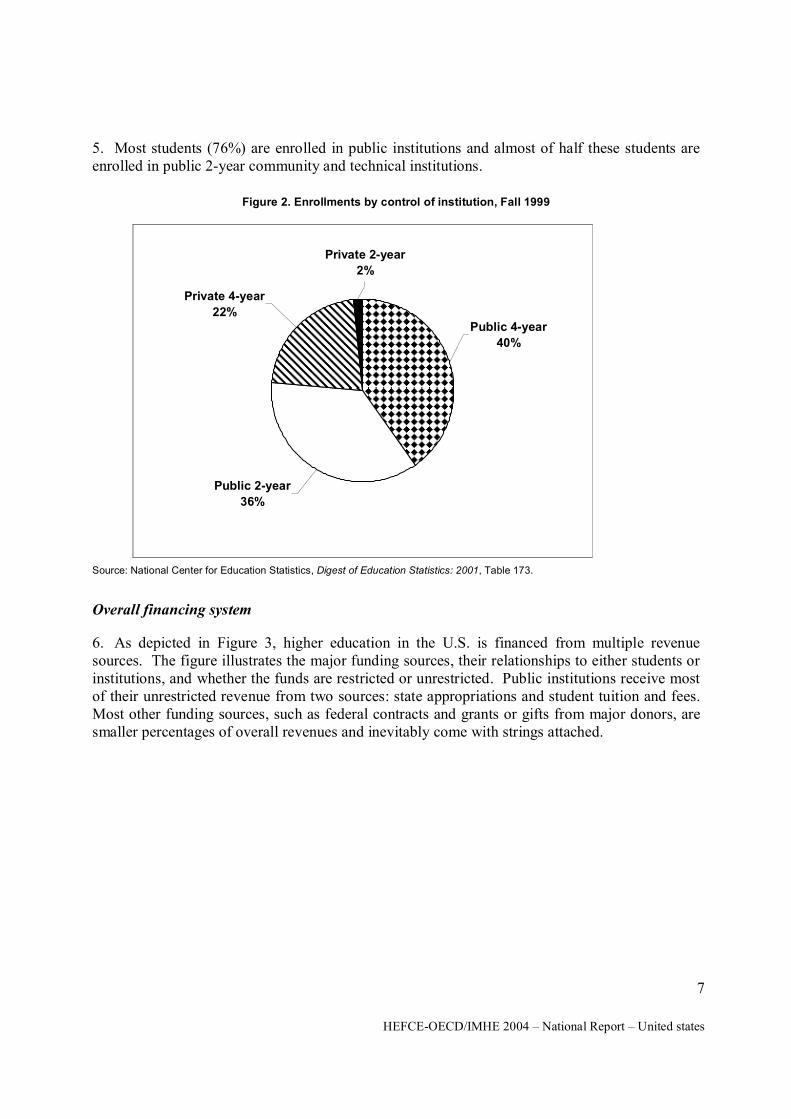
6. As depicted in Figure 3, higher education in the U.S. is financed from multiple revenue sources. The figure illustrates the major funding sources, their relationships to either students or institutions, and whether the funds are restricted or unrestricted. Public institutions receive most of their unrestricted revenue from two sources: state appropriations and student tuition and fees. Most other funding sources, such as federal contracts and grants or gifts from major donors, are smaller percentages of overall revenues and inevitably come with strings attached.
8 HEFCE-OECD/IMHE 2004 – National Report – United States
Figure 3. Schematic view of financing higher education in the U.S
Source: Adapted from Jones, D.P. (2003) Financing in Sync: Aligning Fiscal Policy with State Objectives.
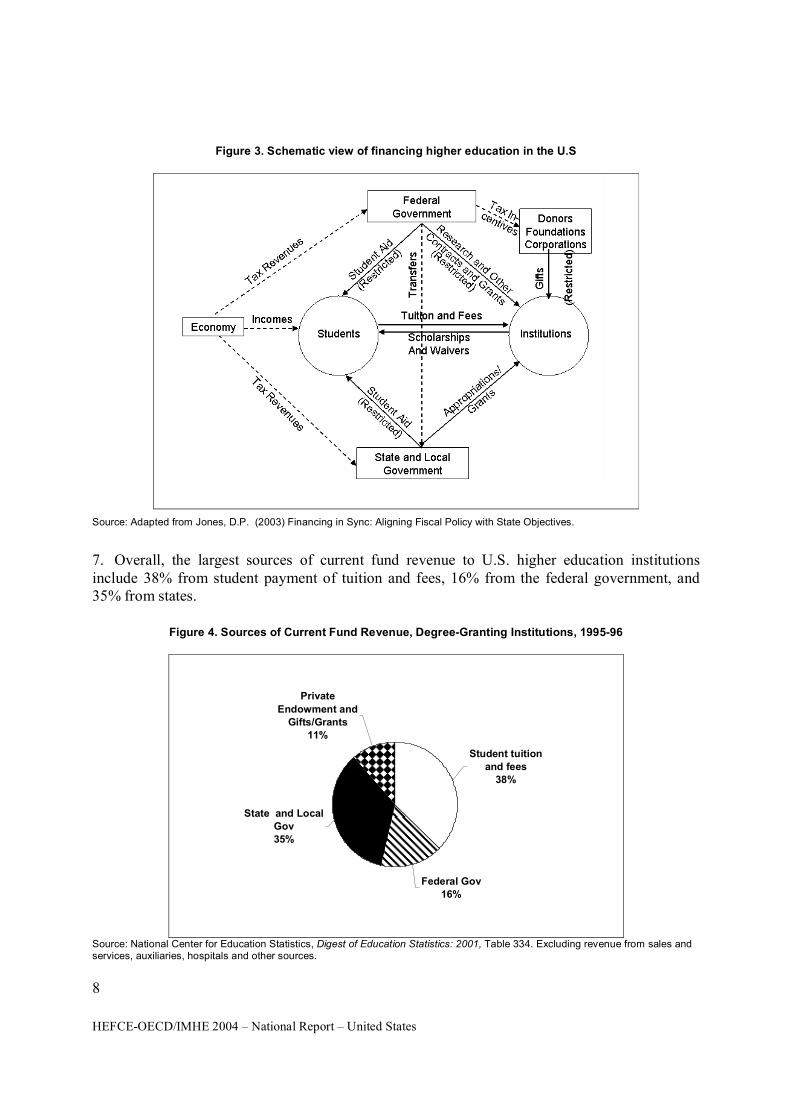
7. Overall, the largest sources of current fund revenue to U.S. higher education institutions include 38% from student payment of tuition and fees, 16% from the federal government, and 35% from states.
Figure 4. Sources of Current Fund Revenue, Degree-Granting Institutions, 1995-96
State and Local Gov35%
Federal Gov16%
Student tuition and fees
38%
Private Endowment and
Gifts/Grants11%
Source: National Center for Education Statistics, Digest of Education Statistics: 2001, Table 334. Excluding revenue from sales and services, auxiliaries, hospitals and other sources.
9 HEFCE-OECD/IMHE 2004 – National Report – United states
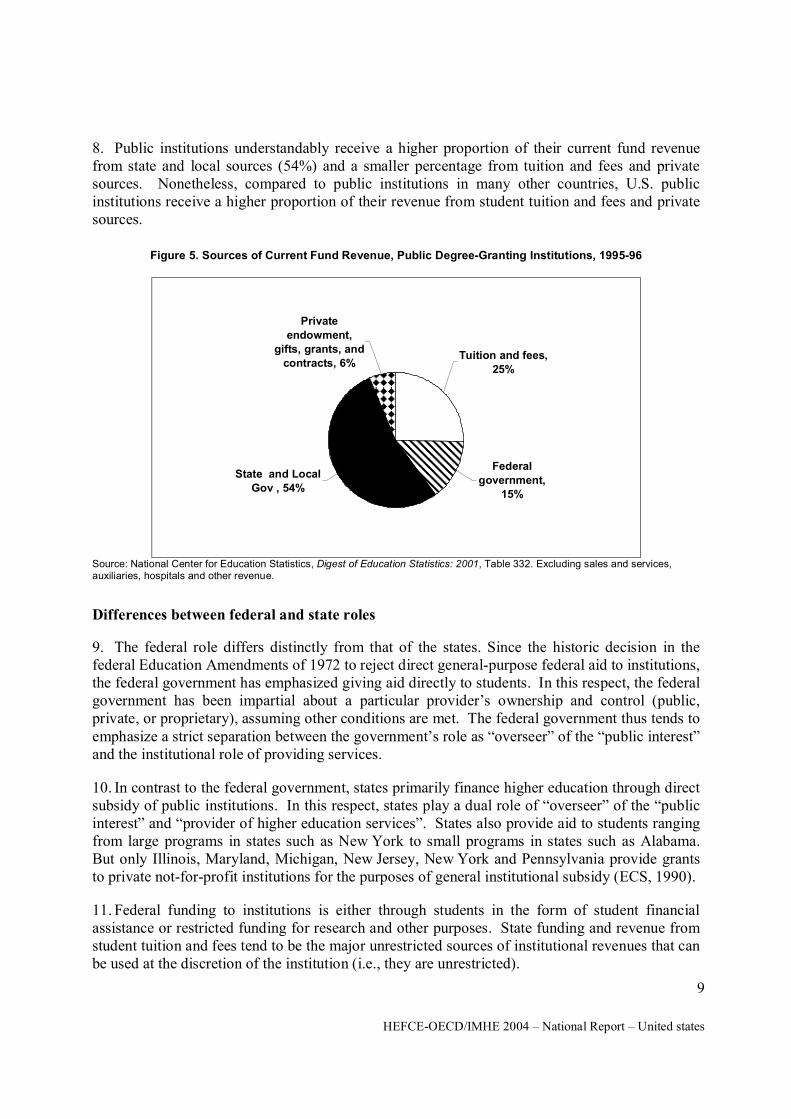
8. Public institutions understandably receive a higher proportion of their current fund revenue from state and local sources (54%) and a smaller percentage from tuition and fees and private sources. Nonetheless, compared to public institutions in many other countries, U.S. public institutions receive a higher proportion of their revenue from student tuition and fees and private sources.
Figure 5. Sources of Current Fund Revenue, Public Degree-Granting Institutions, 1995-96
State and Local Gov , 54%
Federal government,
15%
Tuition and fees, 25%
Private endowment,
gifts, grants, and contracts, 6%
Source: National Center for Education Statistics, Digest of Education Statistics: 2001, Table 332. Excluding sales and services, auxiliaries, hospitals and other revenue.
Differences between federal and state roles
9. The federal role differs distinctly from that of the states. Since the historic decision in the federal Education Amendments of 1972 to reject direct general-purpose federal aid to institutions, the federal government has emphasized giving aid directly to students. In this respect, the federal government has been impartial about a particular provider’s ownership and control (public, private, or proprietary), assuming other conditions are met. The federal government thus tends to emphasize a strict separation between the government’s role as “overseer” of the “public interest” and the institutional role of providing services.
10. In contrast to the federal government, states primarily finance higher education through direct subsidy of public institutions. In this respect, states play a dual role of “overseer” of the “public interest” and “provider of higher education services”. States also provide aid to students ranging from large programs in states such as New York to small programs in states such as Alabama. But only Illinois, Maryland, Michigan, New Jersey, New York and Pennsylvania provide grants to private not-for-profit institutions for the purposes of general institutional subsidy (ECS, 1990).
11. Federal funding to institutions is either through students in the form of student financial assistance or restricted funding for research and other purposes. State funding and revenue from student tuition and fees tend to be the major unrestricted sources of institutional revenues that can be used at the discretion of the institution (i.e., they are unrestricted).
10 HEFCE-OECD/IMHE 2004 – National Report – United States
12. Although the private higher education sector is an important provider of educational services in the U.S. and in several states, this paper will focus primarily on the state role related to the financial management of public institutions because this role is most relevant to the experience of other nations.
Differences among the states
13. In addition to the obvious differences in size, population and enrollments, the 50 states differ significantly not only in how they finance higher education but also in their approach to issues of institutional financial management. The following are examples of several of the more important differences.
Differences in overall performance of state higher education systems
14. Measuring Up, the state-by-state report card on state performance in higher education published every other year by the National Center for Public Policy and Higher Education, assigns grades to states based on their performance in comparison to the best performing states on five measures:
• Preparation: How well are students in each state prepared to take advantage of college?
• Participation: Do state residents have sufficient opportunities to enroll in college-level programs?
• Affordability: How affordable is higher education for students and families in each state?
• Completion: Do those who enroll make progress toward and complete their certificates and degrees in a timely manner?
• Benefits: What economic and civic benefits does each state receive from the education of its residents?
15. In future report cards states will be graded on a sixth measure: Learning: What do we know about student learning as a result of education and training beyond high school?
16. The national report card grades states on the performance of the higher education system as a whole in terms of its impact on the state’s population and economy. The report card does not grade institutions, but the grades reflect indirectly each state’s combined institutional capacity and the alignment of that capacity with state priorities. The important point is that differences in state performance are related to differences in state policies (financing, regulation, accountability, and structure/governance).2 The grades for each state are presented in Appendix A.
2 National Center for Public Policy and Higher Education (2002) Measuring Up 2002: The State-by-State Report
Card for Higher Education. San Jose: NCPPHE, November 2002.
11 HEFCE-OECD/IMHE 2004 – National Report – United states
Differences in financing policy
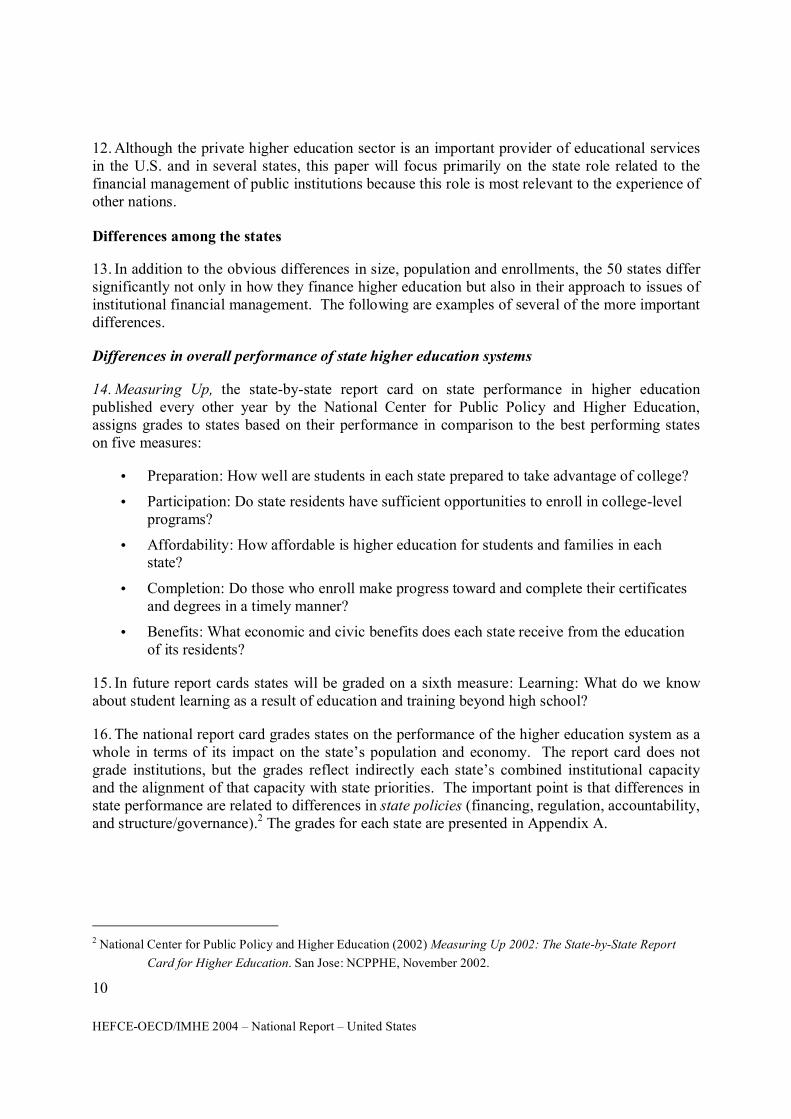
17. States differ significantly in their capacity and effort to finance higher education.3 One indicator of these differences is state appropriations per capita as shown in Figure 6. State funding ranges from a high of more than USD 325 per capita to a low of less than USD 100 per capita.
Figure 6. State General Fund Appropriations for Higher Education Per Capita, 2002
$0
$50
$100
$150
$200
$250
$300
$350
NM
CA
WY
NC
NE
MS IA KS
AK WI
MN
ND HI
IL MI
AL
KY
AZ
UT
DE
OK
SC
AR
VA ID W NJ
MD
TX
OR
CT IN
WV
NY
GA
MO
OH
LA
FL
CO
MA
TN
ME
SD
PA
NV
MT RI
VT
Source: Center for Higher Education and Finance. Grapevine: A National Database for Tax Support for Higher Education. Normal,
IL: Illinois State University. http://www.coe.ilstu.edu/grapevine/table10.html.
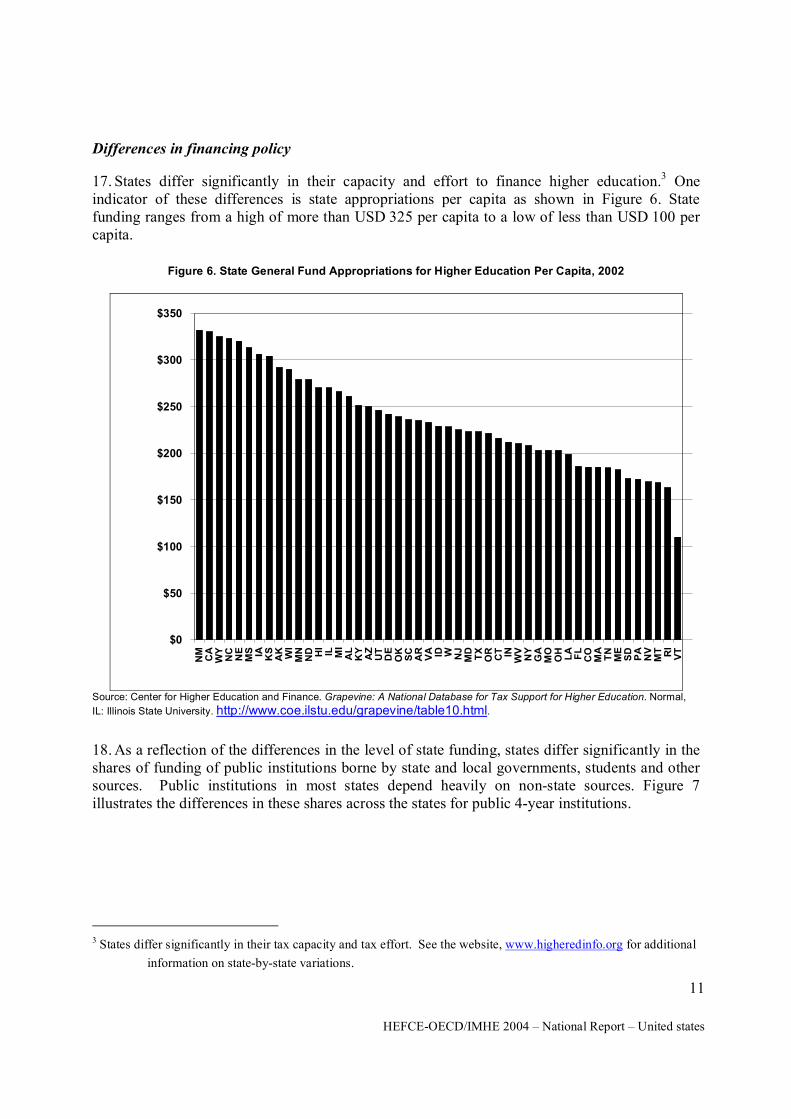
18. As a reflection of the differences in the level of state funding, states differ significantly in the shares of funding of public institutions borne by state and local governments, students and other sources. Public institutions in most states depend heavily on non-state sources. Figure 7 illustrates the differences in these shares across the states for public 4-year institutions.
3 States differ significantly in their tax capacity and tax effort. See the website, www.higheredinfo.org for additional
information on state-by-state variations.
12 HEFCE-OECD/IMHE 2004 – National Report – United States
Figure 7. Sources of Funding for Core Instructional Missions at Public 4-Year Institutions by State, 1999-2000
0%
10%
20%
30%
40%
50%
60%
70%
80%
90%
100%
AK FL
NC
MS
CT
NM HI
GA
WY
OK
AR IA ID NY
WV
MA
NE
NV
NJ
SC
AZ
KY IL TN
KS
TX
CA
AL
MN
SD
ME
LA
VA IN
MO RI
WA
ND
MD WI
OH MI
OR
UT
MT
CO
PA
DE
NH
VT
State and Local Tuition and Fees Other
Source: National Center for Education Statistics, IPEDS, NCHEMS Finance Data Set. Note: “Funding for core instructional mission” is defined as generally unrestricted revenue from tuition and fees, state and local appropriations and other sources. “Other” includes private grants and contracts, endowment, and sales and services but does not include auxiliary services such as food service and student housing. Federal grants and contracts are not included because these are generally restricted.
19. Another indicator of state differences is the level of state commitment to need-based student financial aid targeted at low-income students. Many states that provide relatively low levels of state appropriations to institutions and therefore rely heavily on tuition and fees also provide state funding for need-based student financial aid. Differences in level of effort in this respect are illustrated in Figure 8.
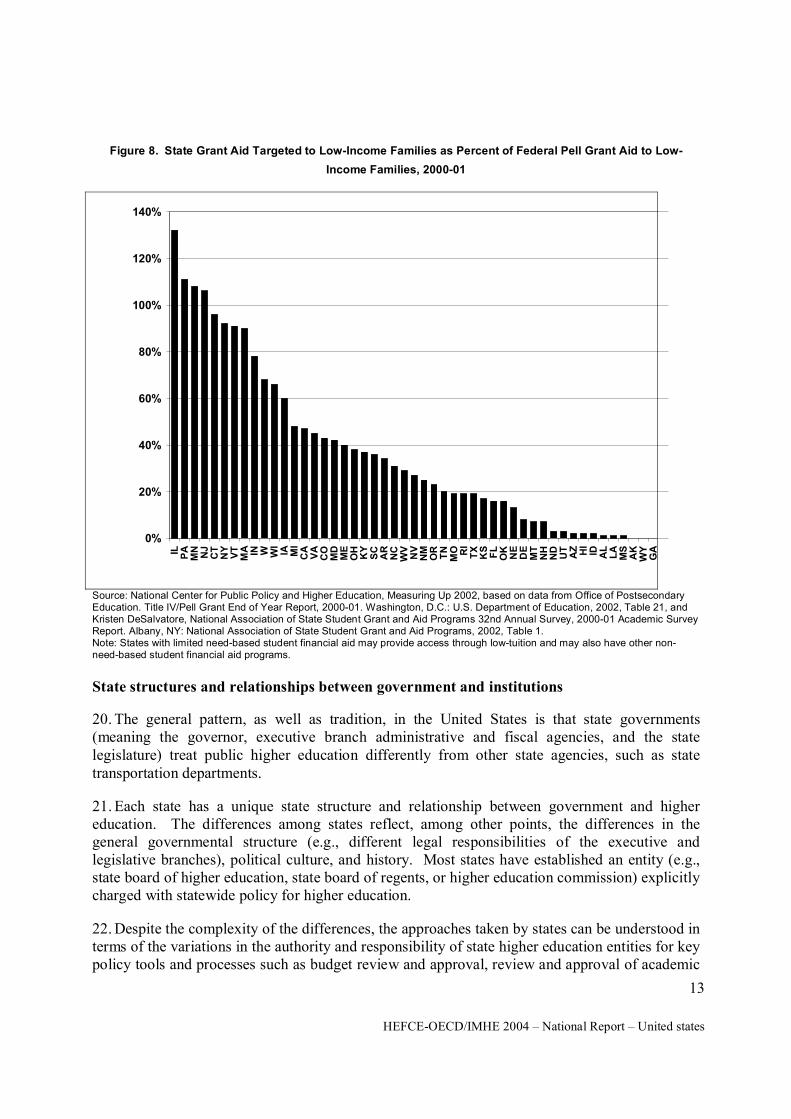
13 HEFCE-OECD/IMHE 2004 – National Report – United states
Figure 8. State Grant Aid Targeted to Low-Income Families as Percent of Federal Pell Grant Aid to Low-
Income Families, 2000-01
0%
20%
40%
60%
80%
100%
120%
140%
IL PA
MN
NJ
CT
NY
VT
MA IN W WI
IA MI
CA
VA
CO
MD
ME
OH
KY
SC
AR
NC
WV
NV
NM
OR
TN
MO RI
TX
KS
FL
OK
NE
DE
MT
NH
ND
UT
AZ HI
ID AL
LA
MS
AK
WY
GA
Source: National Center for Public Policy and Higher Education, Measuring Up 2002, based on data from Office of Postsecondary Education. Title IV/Pell Grant End of Year Report, 2000-01. Washington, D.C.: U.S. Department of Education, 2002, Table 21, and Kristen DeSalvatore, National Association of State Student Grant and Aid Programs 32nd Annual Survey, 2000-01 Academic Survey Report. Albany, NY: National Association of State Student Grant and Aid Programs, 2002, Table 1. Note: States with limited need-based student financial aid may provide access through low-tuition and may also have other non-need-based student financial aid programs.
State structures and relationships between government and institutions
20. The general pattern, as well as tradition, in the United States is that state governments (meaning the governor, executive branch administrative and fiscal agencies, and the state legislature) treat public higher education differently from other state agencies, such as state transportation departments.
21. Each state has a unique state structure and relationship between government and higher education. The differences among states reflect, among other points, the differences in the general governmental structure (e.g., different legal responsibilities of the executive and legislative branches), political culture, and history. Most states have established an entity (e.g., state board of higher education, state board of regents, or higher education commission) explicitly charged with statewide policy for higher education.
22. Despite the complexity of the differences, the approaches taken by states can be understood in terms of the variations in the authority and responsibility of state higher education entities for key policy tools and processes such as budget review and approval, review and approval of academic
14 HEFCE-OECD/IMHE 2004 – National Report – United States
programs, public accountability, and the extent to which these entities are directly involved in institutional operations (governance). The following is an overview of these variations.4
Coordination versus governance
23. The distinction between governance and coordination is fundamental to an understanding of the higher education structures that exist in each state and the assignment of responsibility for decision-making on budget/financing and for institutional financial management. Some structures are established to govern institutions while others are established to coordinate the state postsecondary education system or sectors (e.g., a system of locally governed community colleges).
Governing boards
24. The term governance has a particular meaning when applied to the authority and responsibility of governing public boards of colleges and universities. There is a strong historical and legal tradition in American postsecondary education of institutional autonomy – a high degree of freedom from external intervention and control. Institutional autonomy is a relative, not an absolute, concept to be tempered by the broader interests of the public and society.5 A basic responsibility of governing boards is to oversee the delicate balance between institutional autonomy and public accountability.
25. All states assign responsibility for governing public colleges and universities to one or more boards most often composed of a majority of lay citizens representing the public interest. The names of these boards vary, but "board of trustees" and "board of regents" are the most common. The responsibilities of these boards are similar to those of boards of directors for non-profit corporations. Public institution governing boards were modeled after the lay boards of private colleges and universities. Private college boards usually govern a single institution. In contrast, public institution boards most often govern several public institutions. In fact, 65% of the students in American public postsecondary education attend institutions whose governing boards cover multiple campuses.
26. Common responsibilities of public governing boards include:
• Governing a single corporate entity, including all the rights and responsibilities of that corporation as defined by state law and, if a system board, encompassing all institutions within a system. Individual institutions within the board's jurisdiction usually do not have separate corporate status, although governing boards may have subsidiary corporations for hospitals, foundations, or other purposes.
4 The following section on state structures is drawn from A. C. McGuinness, Jr. (2002). State Postsecondary
Education Governance Database. Education Commission of the States
http://www.ecs.org/clearinghouse/31/02/3102.htm
5 R.O. Berdahl (1971). Statewide Coordination of Higher Education. Washington, D.C.: American Council on
Education, p. 9.
15 HEFCE-OECD/IMHE 2004 – National Report – United states
• Appointing, setting the compensation for, and evaluating both system and institutional chief executives.
• Strategic planning, budgeting (operating and capital), and allocating resources between and among the institutions within the board’s jurisdiction.
• Ensuring public accountability for effective and efficient use of resources to achieve institutional missions.
• Maintaining the institution’s assets (human, programmatic and physical) and ensuring alignment of these assets with institutional mission.
• Developing and implementing policy on a wide range of institutional concerns (e.g., academic and student affairs policies) without approval of external agencies or authorities.
• Awarding academic degrees.
• Advocating for the needs of the institutions under the board’s jurisdiction to the legislature and governor.
• Establishing faculty and other personnel policies, including approving awarding of tenure and serving as the final point of appeal on personnel grievances.
27. There are a number of ways to categorize public governing boards, but the approach suggested by Clark Kerr and Marian Gade in The Guardians: Boards of Trustees of American Colleges and Universities is particularly useful.6 They categorize public governing boards as follows:
• Consolidated governance systems. One board governs all public two- and four-year institutions, or one board covers all four-year campuses with separate arrangements for two-year institutions.
• Segmental systems. Separate boards govern distinct types of campuses, e.g., research universities, comprehensive colleges and universities, community colleges. This may include separate boards for postsecondary technical institutes or colleges and adult education, as well.
• Campus-level boards. Governing boards have full, "autonomous" authority over a single campus that is not part of a consolidated governing board or multi-campus system. Several states combine consolidated governance and campus-level boards. For example, in North Carolina and Utah, campus-level boards have authority delegated by the central board and can make some decisions on their own. The State University of New York, the University of Maine System and the University System of Maryland also have campus boards, though they are largely advisory
6 C. Kerr and M. Gade. (1989). The Guardians: Boards of Trustees of American Colleges and Universities: What
They Do and How Well They Do It. Washington, D.C.: Association of Governing Boards of Universities
and Colleges [AGB], pp. 116, 128-129.
16 HEFCE-OECD/IMHE 2004 – National Report – United States
Coordinating Boards
28. A number of states have established coordinating boards responsible for key aspects of the state’s role in postsecondary education. Some coordinating boards have the responsibility for the state-wide coordination of many policy tools or functions (e.g., planning and policy leadership, institutional missions, program review and approval, and budget development and resource allocation). Other coordinating boards are responsible for only a single sector such as community colleges.
29. The important point is that coordinating boards do not govern institutions, in the sense defined above (e.g., appoint institutional chief executives or set faculty personnel policies). Specifically, coordinating boards:
• Appoint, set compensation for, and evaluate only the agency executive officer and staff, but not the institutional chief executives. In several states, the governor is the final appointing authority for the agency executive, but usually with recommendations from the coordinating board.
• Do not have corporate status independent of state government.
• Focus more on state and system needs and priorities than on advocating the interests of a particular institution or system of institutions.
• Plan primarily for the state postsecondary education system as a whole. In most coordinating board states, this planning includes both public and private institutions, and in some states, for-profit institutions.
• May or may not review and make recommendations on budgets for the state system as a whole rather than only for one part of that system. A few coordinating agencies recommend consolidated budgets for the whole public system. Others simply make recommendations to the governor or legislature on individual institutional or segmental budgets. Most coordinating boards have responsibility to implement budget policy only for funds appropriated specifically to the agency for operations, special initiatives, or reallocation to the institutions for performance, incentives, or other purposes.
• May or may not review or approve proposals for new academic programs and may or may not have authority to require institutions to review existing programs.
• Are not involved directly in setting or carrying out human resource or personnel policies, except to carry out legislative mandates for studies of issues such as faculty workload and productivity or tenure policy.
Classification of states
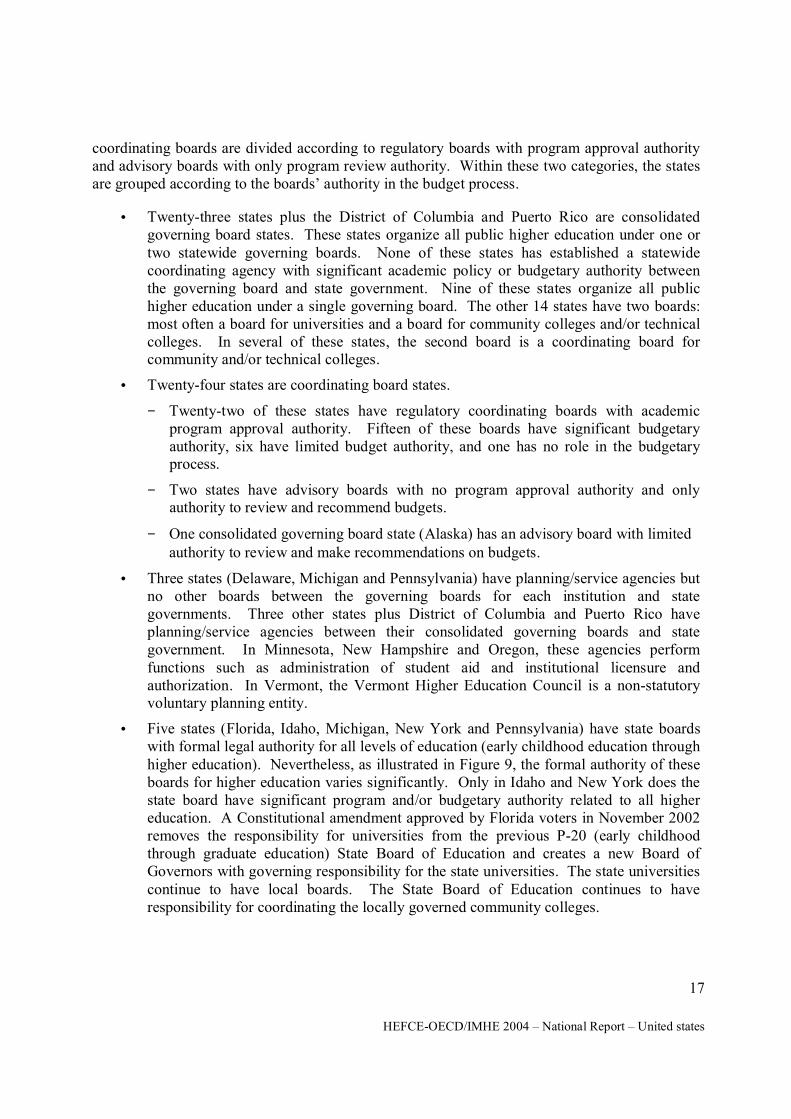
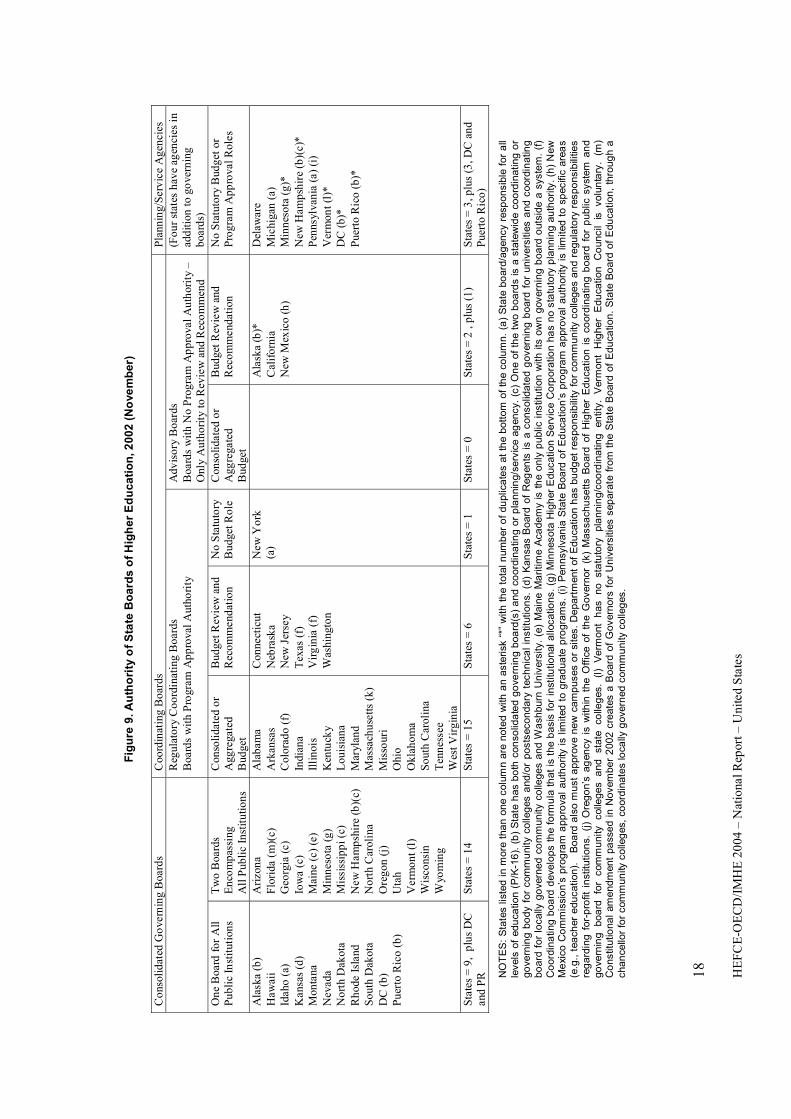
30. Figure 9 displays all states according to three broad categories: consolidated governing boards, coordinating boards, and planning/service agencies. The figure organizes states according to the extent of the boards’ formal authority for academic policy and budget. Reading from left to right, the boards in the states on the left have more formal authority in these policy domains than those to the right. Consolidated governing boards have broad authority for both academic policy and budget related to the institutions under their authority. The states with
17 HEFCE-OECD/IMHE 2004 – National Report – United states
coordinating boards are divided according to regulatory boards with program approval authority and advisory boards with only program review authority. Within these two categories, the states are grouped according to the boards’ authority in the budget process.
• Twenty-three states plus the District of Columbia and Puerto Rico are consolidated governing board states. These states organize all public higher education under one or two statewide governing boards. None of these states has established a statewide coordinating agency with significant academic policy or budgetary authority between the governing board and state government. Nine of these states organize all public higher education under a single governing board. The other 14 states have two boards: most often a board for universities and a board for community colleges and/or technical colleges. In several of these states, the second board is a coordinating board for community and/or technical colleges.
• Twenty-four states are coordinating board states.
− Twenty-two of these states have regulatory coordinating boards with academic program approval authority. Fifteen of these boards have significant budgetary authority, six have limited budget authority, and one has no role in the budgetary process.
− Two states have advisory boards with no program approval authority and only authority to review and recommend budgets.
− One consolidated governing board state (Alaska) has an advisory board with limited authority to review and make recommendations on budgets.
• Three states (Delaware, Michigan and Pennsylvania) have planning/service agencies but no other boards between the governing boards for each institution and state governments. Three other states plus District of Columbia and Puerto Rico have planning/service agencies between their consolidated governing boards and state government. In Minnesota, New Hampshire and Oregon, these agencies perform functions such as administration of student aid and institutional licensure and authorization. In Vermont, the Vermont Higher Education Council is a non-statutory voluntary planning entity.
• Five states (Florida, Idaho, Michigan, New York and Pennsylvania) have state boards with formal legal authority for all levels of education (early childhood education through higher education). Nevertheless, as illustrated in Figure 9, the formal authority of these boards for higher education varies significantly. Only in Idaho and New York does the state board have significant program and/or budgetary authority related to all higher education. A Constitutional amendment approved by Florida voters in November 2002 removes the responsibility for universities from the previous P-20 (early childhood through graduate education) State Board of Education and creates a new Board of Governors with governing responsibility for the state universities. The state universities continue to have local boards. The State Board of Education continues to have responsibility for coordinating the locally governed community colleges.
18
H
EF
CE
-OE
CD
/IM
HE
20
04
– N
atio
nal
Rep
ort
– U
nit
ed S
tate
s
Fig
ure
9. A
uth
ori
ty o
f S
tate
Bo
ard
s o
f H
igh
er
Ed
uc
ati
on
, 20
02
(N
ove
mb
er)
Co
nsol
idat
ed G
ove
rnin
g B
oard
s C
oord
inat
ing
Bo
ards
P
lann
ing/
Ser
vic
e A
gen
cies
R
egul
ato
ry C
oo
rdin
atin
g B
oar
ds
Boa
rds
wit
h P
rogr
am A
pp
rova
l A
utho
rity
A
dvis
ory
Bo
ards
B
oard
s w
ith
No
Pro
gra
m A
pp
rova
l A
uth
orit
y –
O
nly
Au
tho
rity
to
Rev
iew
and
Rec
om
men
d
(Fo
ur
stat
es h
ave
agen
cies
in
add
itio
n t
o go
vern
ing
b
oard
s)
On
e B
oard
fo
r A
ll
Pu
bli
c In
stit
utio
ns
Tw
o B
oard
s E
nco
mp
assi
ng
All
Pub
lic
Inst
itu
tio
ns
Con
soli
date
d o
r A
ggre
gate
d B
udge
t
Bud
get
Rev
iew
an
d R
eco
mm
end
atio
n N
o S
tatu
tory
B
udg
et R
ole
C
onso
lida
ted
or
Agg
rega
ted
Bud
get
Bud
get
Rev
iew
and
R
eco
mm
enda
tion
N
o S
tatu
tory
Bud
get
or
Pro
gra
m A
pp
rova
l R
oles
Ala
ska
(b)
Haw
aii
Idah
o (a
) K
ansa
s (d
)
Mon
tana
N
evad
a N
ort
h D
akot
a R
hod
e Is
land
S
out
h D
akot
a D
C (
b)
Pu
erto
Ric
o (b
)
Ari
zon
a F
lori
da (
m)(
c)
Geo
rgia
(c)
Io
wa
(c)
Mai
ne (
c) (
e)
Min
nes
ota
(g
) M
issi
ssip
pi
(c)
New
Ham
psh
ire
(b)(
c)
No
rth
Car
olin
a O
reg
on (
j)
Uta
h
Ver
mo
nt
(l)
Wis
cons
in
Wyo
min
g
Ala
bam
a A
rkan
sas
Col
orad
o (f
) In
dian
a Il
lin
ois
Ken
tuck
y L
ouis
ian
a M
aryl
and
Mas
sach
use
tts
(k)
Mis
sour
i O
hio
Okl
aho
ma
So
uth
Car
olin
a T
enn
esse
e W
est
Vir
gin
ia
Con
nect
icut
N
ebra
ska
New
Jer
sey
Tex
as (
f)
Vir
gin
ia (
f)
Was
hing
ton
New
Yo
rk
(a)
A
lask
a (b
)*
Cal
ifo
rnia
N
ew M
exic
o (h
)
Del
awar
e M
ichi
gan
(a)
M
inn
eso
ta (
g)*
N
ew H
amp
shir
e (b
)(c)
*
Pen
nsyl
van
ia (
a) (
i)
Ver
mon
t (l
)*
DC
(b
)*
Pue
rto
Ric
o (
b)*
Sta
tes
= 9
, p
lus
DC
an
d P
R
Sta
tes
= 1
4
Sta
tes
= 1
5
Sta
tes
= 6
S
tate
s =
1
Sta
tes
= 0
S
tate
s =
2 ,
plu
s (1
) S
tate
s =
3, p
lus
(3, D
C a
nd
Pue
rto
Ric
o)
NO
TE
S:
Sta
tes
liste
d in
more
tha
n o
ne c
olu
mn
are
note
d w
ith a
n a
sterisk
“*”
with
th
e to
tal n
umb
er o
f du
plic
ate
s at
the
bott
om
of
the
colu
mn.
(a)
Sta
te b
oard
/ag
ency
res
ponsi
ble
for
all
leve
ls o
f ed
uca
tion
(P
/K-1
6).
(b
) S
tate
has
bo
th c
on
solid
ate
d g
ove
rnin
g b
oa
rd(s
) a
nd c
oord
ina
ting o
r p
lannin
g/s
erv
ice
ag
ency
. (c
) O
ne
of
the t
wo
boa
rds
is a
sta
tew
ide c
oo
rdin
atin
g o
r go
vern
ing b
ody
for
com
mu
nity
colle
ges
and/o
r post
seco
ndary
tec
hnic
al in
stitu
tion
s. (
d)
Kan
sas
Board
of
Reg
ents
is
a c
onso
lidate
d g
ove
rnin
g b
oard
for
univ
ers
ities
and
coor
din
atin
g
bo
ard
for
loca
lly g
ove
rned c
om
munity
colle
ges
and
Wa
shburn
Un
iver
sity
. (e
) M
ain
e M
aritim
e A
cadem
y is
th
e only
public
ins
titutio
n w
ith its
ow
n g
over
nin
g b
oa
rd o
uts
ide a
sys
tem
. (f
) C
oord
ina
ting
boa
rd d
evelo
ps
the
form
ula
th
at
is t
he b
asi
s fo
r in
stitu
tional
allo
catio
ns.
(g)
Min
nes
ota
Hig
her
Educa
tion S
erv
ice
Co
rpora
tion h
as
no s
tatu
tory
pla
nnin
g a
uth
ori
ty. (h
) N
ew
M
exi
co C
om
mis
sio
n’s
pro
gra
m a
pp
rova
l auth
ority
is
limite
d t
o g
rad
ua
te p
rogra
ms.
(i) P
ennsy
lvan
ia S
tate
Boa
rd o
f E
duca
tion’s
pro
gra
m a
ppro
val
auth
ority
is
limite
d t
o s
pec
ific
are
as
(e.g
., t
each
er e
duca
tion).
B
oa
rd a
lso m
ust
appro
ve n
ew
cam
puse
s o
r si
tes.
Depart
men
t of
Edu
catio
n h
as
bu
dg
et r
espo
nsi
bili
ty f
or
com
mun
ity c
olle
ges
an
d r
egula
tory
res
po
nsi
bili
ties
reg
ard
ing f
or-
pro
fit i
nst
itutio
ns.
(j) O
rego
n’s
ag
ency
is
with
in t
he O
ffic
e o
f th
e G
ove
rnor
(k)
Mass
ach
use
tts
Bo
ard
of
Hig
her
Edu
catio
n i
s co
ord
ina
ting
board
for
public
sys
tem
an
d go
vern
ing
boa
rd
for
com
munity
co
lleges
and
st
ate
co
lleg
es.
(l)
Verm
ont
has
no
st
atu
tory
pla
nnin
g/c
oo
rdin
atin
g
entit
y.
Ver
mont
Hig
her
Edu
catio
n
Co
unci
l is
vo
lun
tary
. (m
) C
onst
itutio
na
l am
endm
ent
pa
ssed i
n N
ove
mber
2002
cre
ate
s a
Board
of
Gove
rnors
for
Univ
ers
ities
sep
ara
te f
rom
the S
tate
Board
of
Edu
catio
n.
Sta
te B
oard
of
Edu
catio
n,
thro
ug
h a
ch
an
cello
r fo
r co
mm
un
ity c
olle
ges
, co
ord
inate
s lo
cally
gove
rned
com
mu
nity
colle
ges
.
C-1
Differences in budgeting and financing relationships between states and institutions
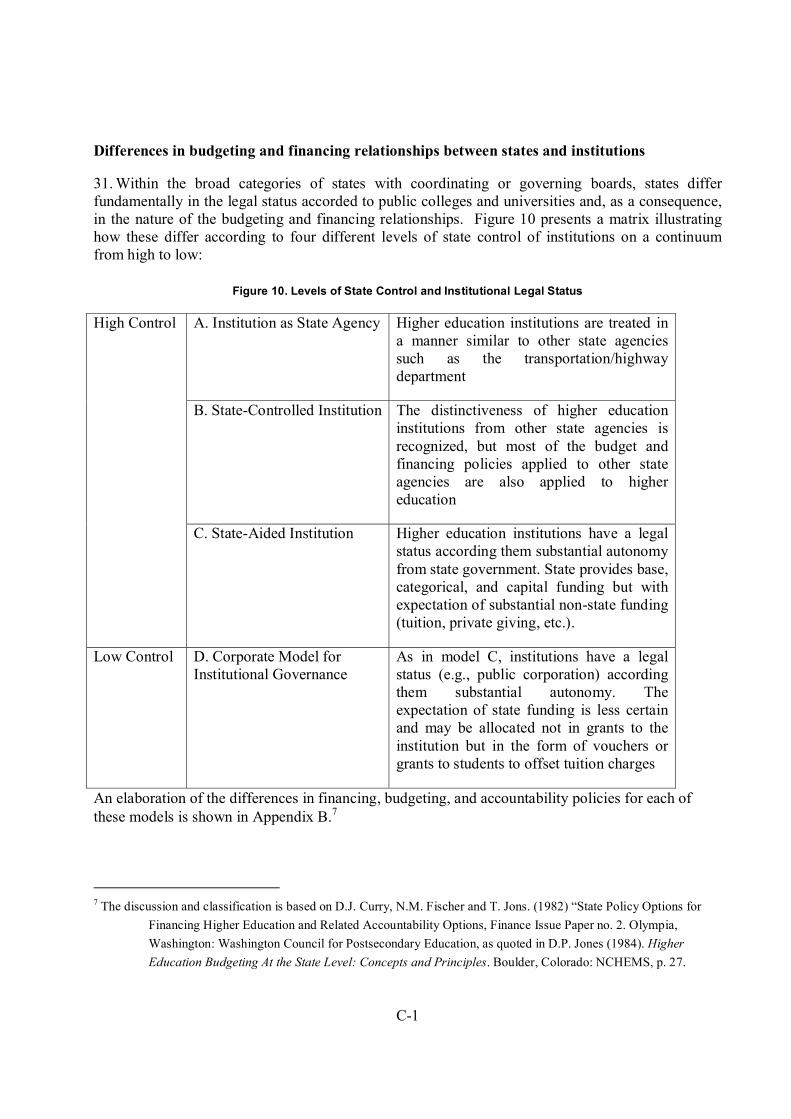
31. Within the broad categories of states with coordinating or governing boards, states differ fundamentally in the legal status accorded to public colleges and universities and, as a consequence, in the nature of the budgeting and financing relationships. Figure 10 presents a matrix illustrating how these differ according to four different levels of state control of institutions on a continuum from high to low:
Figure 10. Levels of State Control and Institutional Legal Status
A. Institution as State Agency Higher education institutions are treated in a manner similar to other state agencies such as the transportation/highway department
B. State-Controlled Institution The distinctiveness of higher education institutions from other state agencies is recognized, but most of the budget and financing policies applied to other state agencies are also applied to higher education
High Control
C. State-Aided Institution Higher education institutions have a legal status according them substantial autonomy from state government. State provides base, categorical, and capital funding but with expectation of substantial non-state funding (tuition, private giving, etc.).
Low Control D. Corporate Model for Institutional Governance
As in model C, institutions have a legal status (e.g., public corporation) according them substantial autonomy. The expectation of state funding is less certain and may be allocated not in grants to the institution but in the form of vouchers or grants to students to offset tuition charges
An elaboration of the differences in financing, budgeting, and accountability policies for each of these models is shown in Appendix B.7
7 The discussion and classification is based on D.J. Curry, N.M. Fischer and T. Jons. (1982) “State Policy Options for
Financing Higher Education and Related Accountability Options, Finance Issue Paper no. 2. Olympia,
Washington: Washington Council for Postsecondary Education, as quoted in D.P. Jones (1984). Higher
Education Budgeting At the State Level: Concepts and Principles. Boulder, Colorado: NCHEMS, p. 27.
2 HEFCE-OECD/IMHE 2004 – National Report – United States
32. The four categories of institutional legal status in Figure 10 represent theoretical types. In practice, no state currently treats all of its public institutions as if they were in either of the two extremes: institution as state agency or institution as an independent corporation.8 There are three common patterns:
• Pattern A: Different sectors are accorded different levels of independence from state procedural controls. For example, both the University of California and the California State University System are treated as “state-aided” institutions, although each is subjected to specific regulations that treat the institutions as “state-controlled.” The University of California is established in the State Constitution and has a higher level of independence from state procedural controls than the California State University which is established in state statutes and until the early 1990s was closely linked to state budget, personnel, and purchasing requirements. In contrast to the two university systems, the California Community Colleges are governed by extensive state statutory and regulatory policies and in many respects are treated as “state-controlled” institutions.
• Pattern B: All public universities are established as public corporations (“state-aided”) but are subject to detailed state oversight in specific areas such as capital construction or personnel. The two cases included in this paper, North Dakota and Kentucky, are examples of this pattern–the North Dakota University System (NDUS) as a single university system and Kentucky with each university as a separate public corporation. In both cases, the institutions are subject to specific state procedural controls related to capital construction and other areas. As another example, the University of Wisconsin System is organized as a public corporation but is subject to detailed oversight by the Wisconsin State Department of Administration on all capital projects and all classified (non-professional) personnel are included in the state civil service system.
• Pattern C: Most public institutions are established as public corporations (“state aided”), but specific institutions are accorded greater independence from state procedural controls as the result of deliberate state actions to decentralize governance and diversify revenue sources. The University System of Maryland, for example, is accorded a degree of independence as a public corporation (“state aided”), but St. Mary’s College of Maryland was granted increased autonomy in return for meeting specific accountability requirements. The State of Colorado has implemented a similar policy through which institutions may enter into “compacts” with the State in return for increased autonomy.9
33. In the U.S., universities are often accorded “substantive” autonomy within the bounds of state-defined missions and accountability requirements; but at the same time, they are required to conform to state regulatory/procedural requirements. As state funding is becoming a smaller share of these
8 Robert Berdahl makes an important distinction between “substantive” autonomy, meaning autonomy on matters of
standards, curriculum, faculty appointments, and similar matters, and “procedural” autonomy, meaning
autonomy from state procedural controls.
9 See R.O. Berdahl, “Balancing Self-Interest and Accountability: St. Mary’s College of Maryland,” and other chapters in
T. J. MacTaggart and Associates (1998). Seeking Excellence Through Independence. San Francisco: Jossey-
Bass Publishers.
C-3
institutions’ revenues, some are urging that the institutions be given “corporate” status as reflected in the “low control” end of the continuum in Figure 10.10 See Appendix C for a listing of other common state procedural controls.
Current context
Fiscal crisis in the states
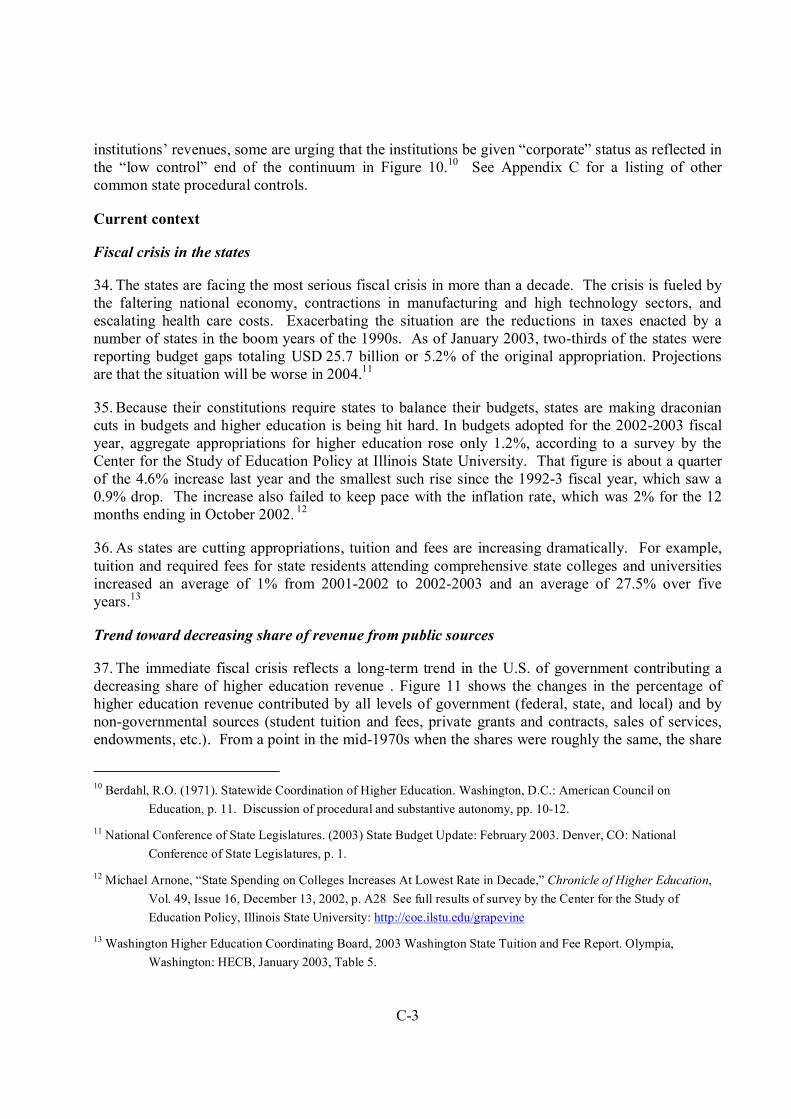
34. The states are facing the most serious fiscal crisis in more than a decade. The crisis is fueled by the faltering national economy, contractions in manufacturing and high technology sectors, and escalating health care costs. Exacerbating the situation are the reductions in taxes enacted by a number of states in the boom years of the 1990s. As of January 2003, two-thirds of the states were reporting budget gaps totaling USD 25.7 billion or 5.2% of the original appropriation. Projections are that the situation will be worse in 2004.11
35. Because their constitutions require states to balance their budgets, states are making draconian cuts in budgets and higher education is being hit hard. In budgets adopted for the 2002-2003 fiscal year, aggregate appropriations for higher education rose only 1.2%, according to a survey by the Center for the Study of Education Policy at Illinois State University. That figure is about a quarter of the 4.6% increase last year and the smallest such rise since the 1992-3 fiscal year, which saw a 0.9% drop. The increase also failed to keep pace with the inflation rate, which was 2% for the 12 months ending in October 2002. 12
36. As states are cutting appropriations, tuition and fees are increasing dramatically. For example, tuition and required fees for state residents attending comprehensive state colleges and universities increased an average of 1% from 2001-2002 to 2002-2003 and an average of 27.5% over five years.13
Trend toward decreasing share of revenue from public sources
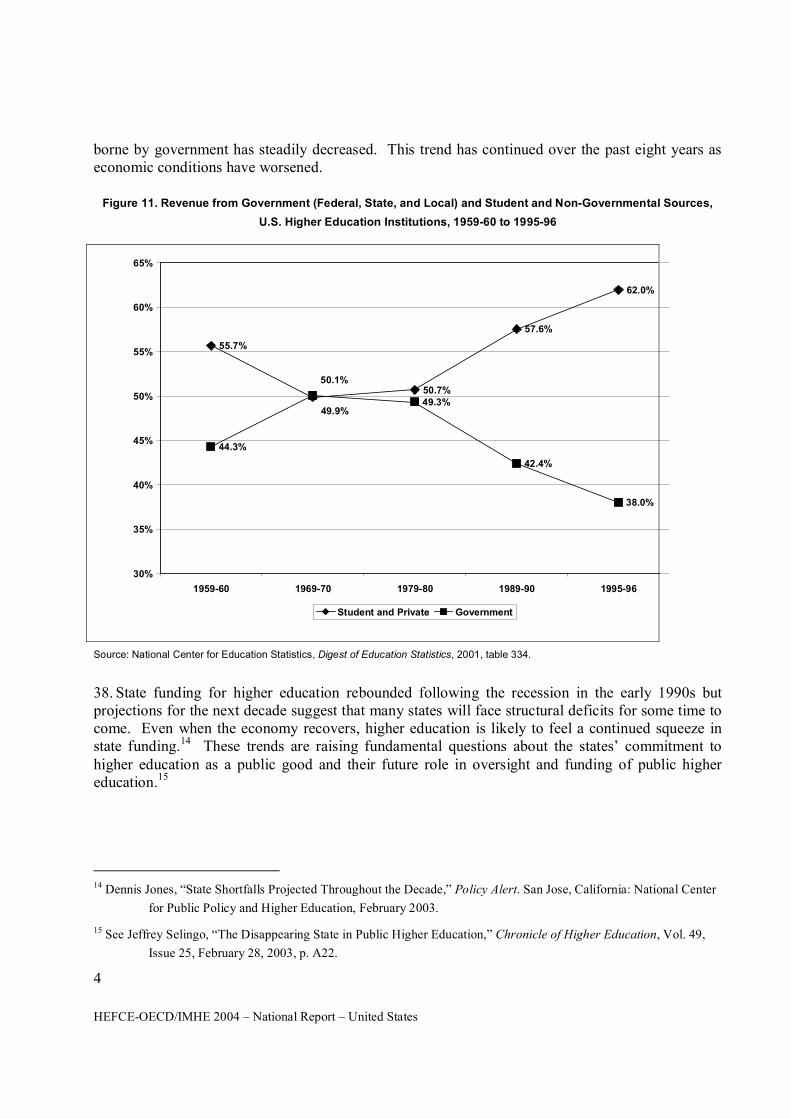
37. The immediate fiscal crisis reflects a long-term trend in the U.S. of government contributing a decreasing share of higher education revenue . Figure 11 shows the changes in the percentage of higher education revenue contributed by all levels of government (federal, state, and local) and by non-governmental sources (student tuition and fees, private grants and contracts, sales of services, endowments, etc.). From a point in the mid-1970s when the shares were roughly the same, the share
10 Berdahl, R.O. (1971). Statewide Coordination of Higher Education. Washington, D.C.: American Council on
Education, p. 11. Discussion of procedural and substantive autonomy, pp. 10-12.
11 National Conference of State Legislatures. (2003) State Budget Update: February 2003. Denver, CO: National
Conference of State Legislatures, p. 1.
12 Michael Arnone, “State Spending on Colleges Increases At Lowest Rate in Decade,” Chronicle of Higher Education,
Vol. 49, Issue 16, December 13, 2002, p. A28 See full results of survey by the Center for the Study of
Education Policy, Illinois State University: http://coe.ilstu.edu/grapevine
13 Washington Higher Education Coordinating Board, 2003 Washington State Tuition and Fee Report. Olympia,
Washington: HECB, January 2003, Table 5.
4 HEFCE-OECD/IMHE 2004 – National Report – United States
borne by government has steadily decreased. This trend has continued over the past eight years as economic conditions have worsened.
Figure 11. Revenue from Government (Federal, State, and Local) and Student and Non-Governmental Sources,
U.S. Higher Education Institutions, 1959-60 to 1995-96
55.7%
50.7%
57.6%
62.0%
44.3%
49.3%
42.4%
38.0%
49.9%
50.1%
30%
35%
40%
45%
50%
55%
60%
65%
1959-60 1969-70 1979-80 1989-90 1995-96
Student and Private Government
Source: National Center for Education Statistics, Digest of Education Statistics, 2001, table 334.
38. State funding for higher education rebounded following the recession in the early 1990s but projections for the next decade suggest that many states will face structural deficits for some time to come. Even when the economy recovers, higher education is likely to feel a continued squeeze in state funding.14 These trends are raising fundamental questions about the states’ commitment to higher education as a public good and their future role in oversight and funding of public higher education.15
14 Dennis Jones, “State Shortfalls Projected Throughout the Decade,” Policy Alert. San Jose, California: National Center
for Public Policy and Higher Education, February 2003.
15 See Jeffrey Selingo, “The Disappearing State in Public Higher Education,” Chronicle of Higher Education, Vol. 49,
Issue 25, February 28, 2003, p. A22.
C-5
Changes in the basic assumptions about the role of government
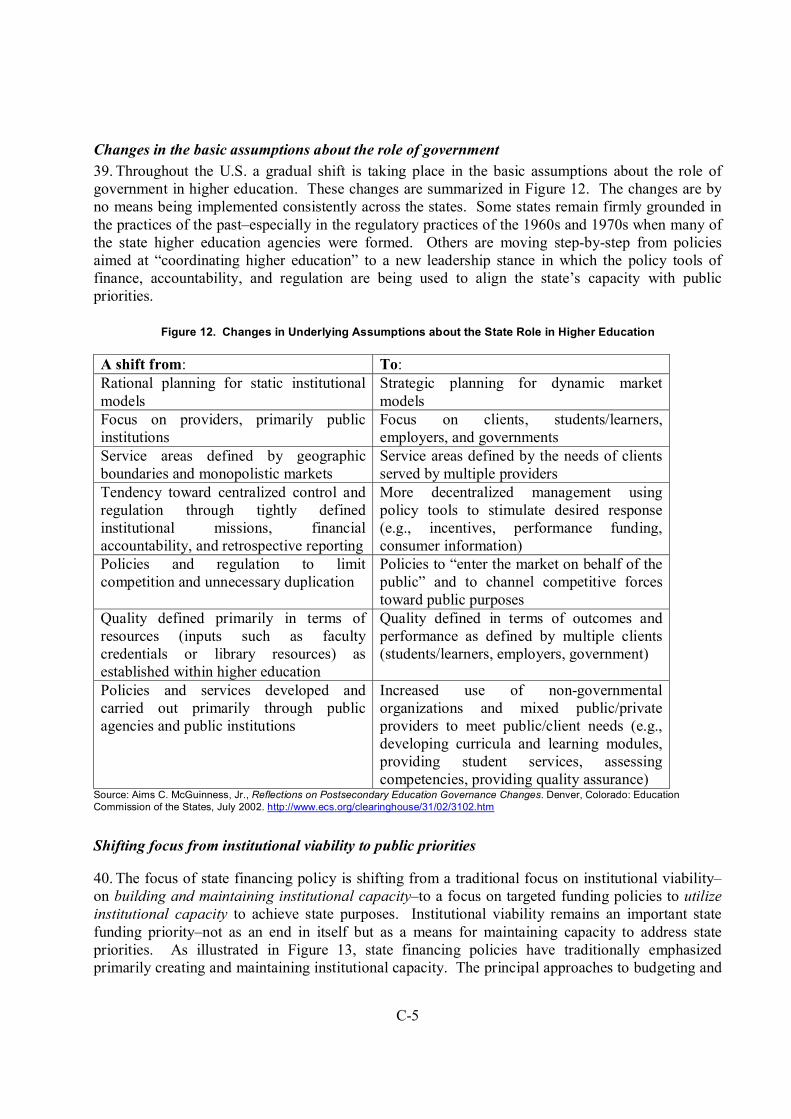
39. Throughout the U.S. a gradual shift is taking place in the basic assumptions about the role of government in higher education. These changes are summarized in Figure 12. The changes are by no means being implemented consistently across the states. Some states remain firmly grounded in the practices of the past–especially in the regulatory practices of the 1960s and 1970s when many of the state higher education agencies were formed. Others are moving step-by-step from policies aimed at “coordinating higher education” to a new leadership stance in which the policy tools of finance, accountability, and regulation are being used to align the state’s capacity with public priorities.
Figure 12. Changes in Underlying Assumptions about the State Role in Higher Education
A shift from: To: Rational planning for static institutional models
Strategic planning for dynamic market models
Focus on providers, primarily public institutions
Focus on clients, students/learners, employers, and governments
Service areas defined by geographic boundaries and monopolistic markets
Service areas defined by the needs of clients served by multiple providers
Tendency toward centralized control and regulation through tightly defined institutional missions, financial accountability, and retrospective reporting
More decentralized management using policy tools to stimulate desired response (e.g., incentives, performance funding, consumer information)
Policies and regulation to limit competition and unnecessary duplication
Policies to “enter the market on behalf of the public” and to channel competitive forces toward public purposes
Quality defined primarily in terms of resources (inputs such as faculty credentials or library resources) as established within higher education
Quality defined in terms of outcomes and performance as defined by multiple clients (students/learners, employers, government)
Policies and services developed and carried out primarily through public agencies and public institutions
Increased use of non-governmental organizations and mixed public/private providers to meet public/client needs (e.g., developing curricula and learning modules, providing student services, assessing competencies, providing quality assurance)
Source: Aims C. McGuinness, Jr., Reflections on Postsecondary Education Governance Changes. Denver, Colorado: Education Commission of the States, July 2002. http://www.ecs.org/clearinghouse/31/02/3102.htm
Shifting focus from institutional viability to public priorities
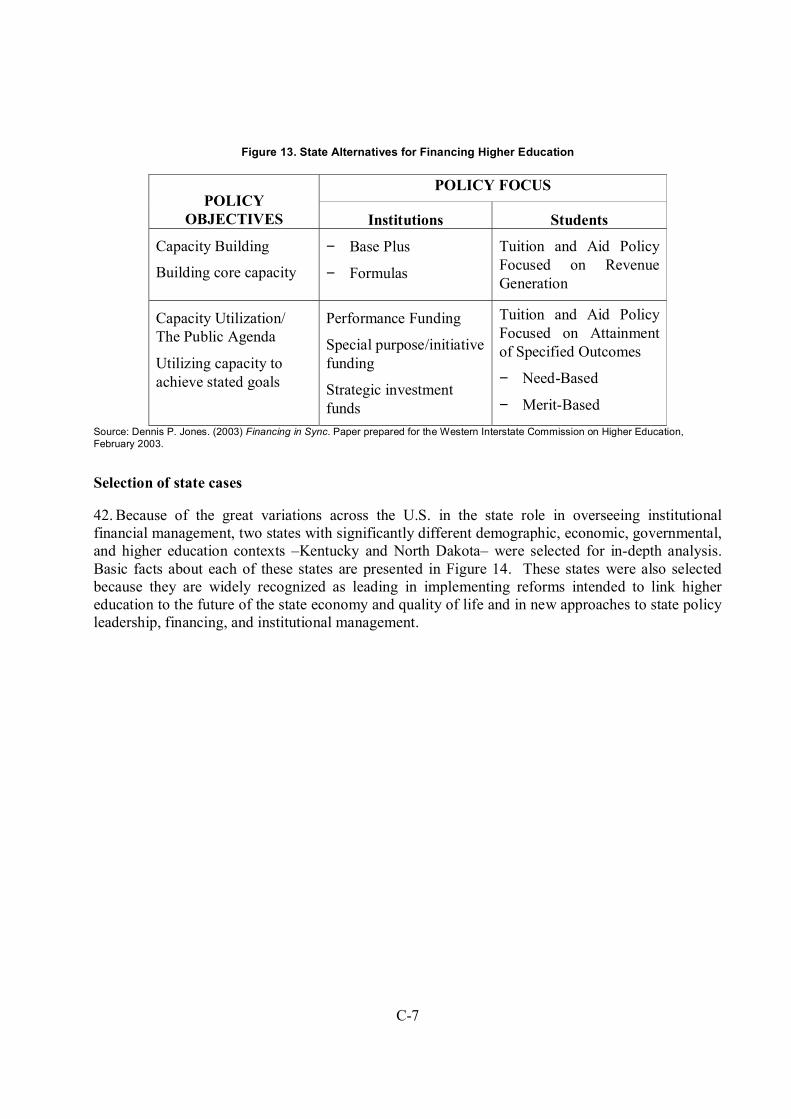
40. The focus of state financing policy is shifting from a traditional focus on institutional viability–on building and maintaining institutional capacity–to a focus on targeted funding policies to utilize institutional capacity to achieve state purposes. Institutional viability remains an important state funding priority–not as an end in itself but as a means for maintaining capacity to address state priorities. As illustrated in Figure 13, state financing policies have traditionally emphasized primarily creating and maintaining institutional capacity. The principal approaches to budgeting and
6 HEFCE-OECD/IMHE 2004 – National Report – United States
resource allocation have been either “base-plus” funding (taking the previous year’s funding and adjusting it for increased costs and other variables) or formulas based on a combination of costs and a measure of workload such as enrollment or credit hours. Policies regarding student financing have traditionally focused on establishing tuition and student aid policies designed to maximize institutional revenues.
41. In the new environment, states continue to be concerned with the objective of capacity building, but they are increasingly concerned also with capacity utilization, that is, on investment or performance funding of institutions or targeted aid to students as illustrated in Figure 13.16
16 Dennis P. Jones, Financing in Sync: Aligning Fiscal Policy with State Objectives, paper prepared for Western
Interstate Commission for Higher Education, February 10, 2003.
C-7
Figure 13. State Alternatives for Financing Higher Education
POLICY FOCUS POLICY
OBJECTIVES Institutions Students
Capacity Building
Building core capacity
− Base Plus
− Formulas
Tuition and Aid Policy Focused on Revenue Generation
Capacity Utilization/ The Public Agenda
Utilizing capacity to achieve stated goals
Performance Funding
Special purpose/initiative funding
Strategic investment funds
Tuition and Aid Policy Focused on Attainment of Specified Outcomes
− Need-Based
− Merit-Based
Source: Dennis P. Jones. (2003) Financing in Sync. Paper prepared for the Western Interstate Commission on Higher Education, February 2003.
Selection of state cases
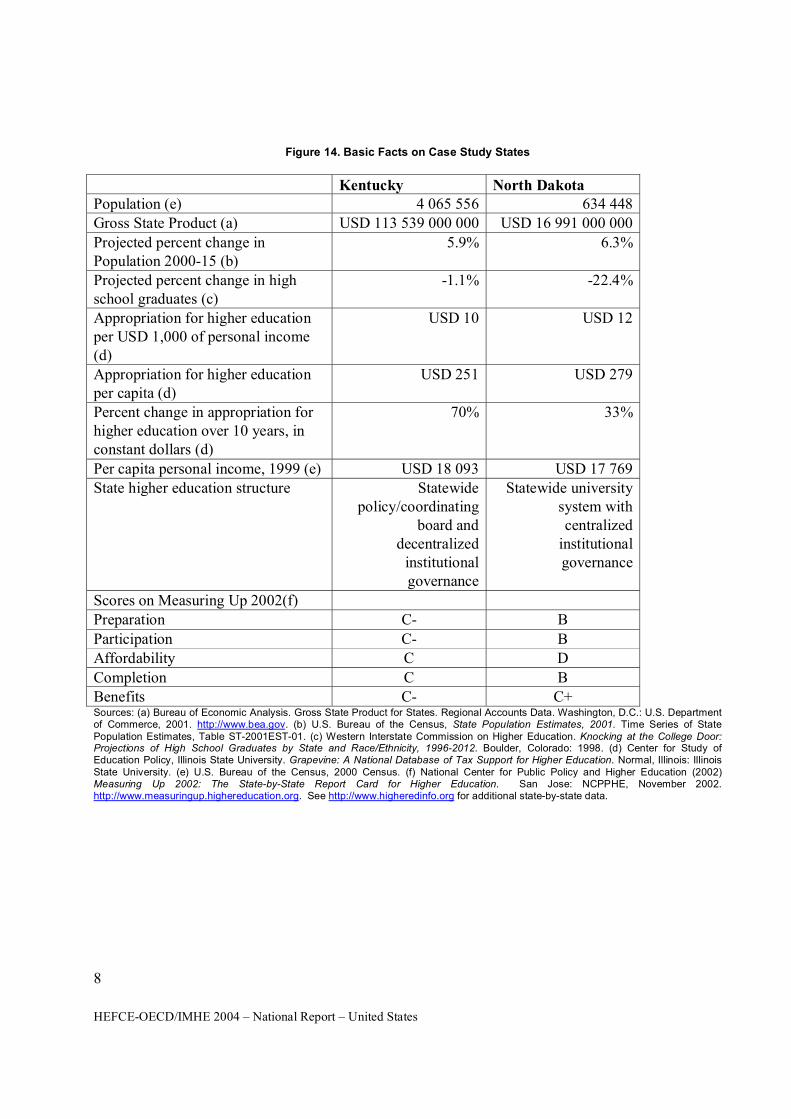
42. Because of the great variations across the U.S. in the state role in overseeing institutional financial management, two states with significantly different demographic, economic, governmental, and higher education contexts –Kentucky and North Dakota– were selected for in-depth analysis. Basic facts about each of these states are presented in Figure 14. These states were also selected because they are widely recognized as leading in implementing reforms intended to link higher education to the future of the state economy and quality of life and in new approaches to state policy leadership, financing, and institutional management.
8 HEFCE-OECD/IMHE 2004 – National Report – United States
Figure 14. Basic Facts on Case Study States
Kentucky North Dakota Population (e) 4 065 556 634 448Gross State Product (a) USD 113 539 000 000 USD 16 991 000 000
Projected percent change in Population 2000-15 (b)
5.9% 6.3%
Projected percent change in high school graduates (c)
-1.1% -22.4%
Appropriation for higher education per USD 1,000 of personal income (d)
USD 10 USD 12
Appropriation for higher education per capita (d)
USD 251 USD 279
Percent change in appropriation for higher education over 10 years, in constant dollars (d)
70% 33%
Per capita personal income, 1999 (e) USD 18 093 USD 17 769State higher education structure Statewide
policy/coordinating board and
decentralized institutional governance
Statewide university system with centralized
institutional governance
Scores on Measuring Up 2002(f) Preparation C- B
Participation C- B Affordability C D
Completion C B Benefits C- C+ Sources: (a) Bureau of Economic Analysis. Gross State Product for States. Regional Accounts Data. Washington, D.C.: U.S. Department of Commerce, 2001. http://www.bea.gov. (b) U.S. Bureau of the Census, State Population Estimates, 2001. Time Series of State Population Estimates, Table ST-2001EST-01. (c) Western Interstate Commission on Higher Education. Knocking at the College Door: Projections of High School Graduates by State and Race/Ethnicity, 1996-2012. Boulder, Colorado: 1998. (d) Center for Study of Education Policy, Illinois State University. Grapevine: A National Database of Tax Support for Higher Education. Normal, Illinois: Illinois State University. (e) U.S. Bureau of the Census, 2000 Census. (f) National Center for Public Policy and Higher Education (2002) Measuring Up 2002: The State-by-State Report Card for Higher Education. San Jose: NCPPHE, November 2002. http://www.measuringup.highereducation.org. See http://www.higheredinfo.org for additional state-by-state data.
C-9
KENTUCKY
Constitutional position of public higher education in Kentucky
Institutions and enrollments
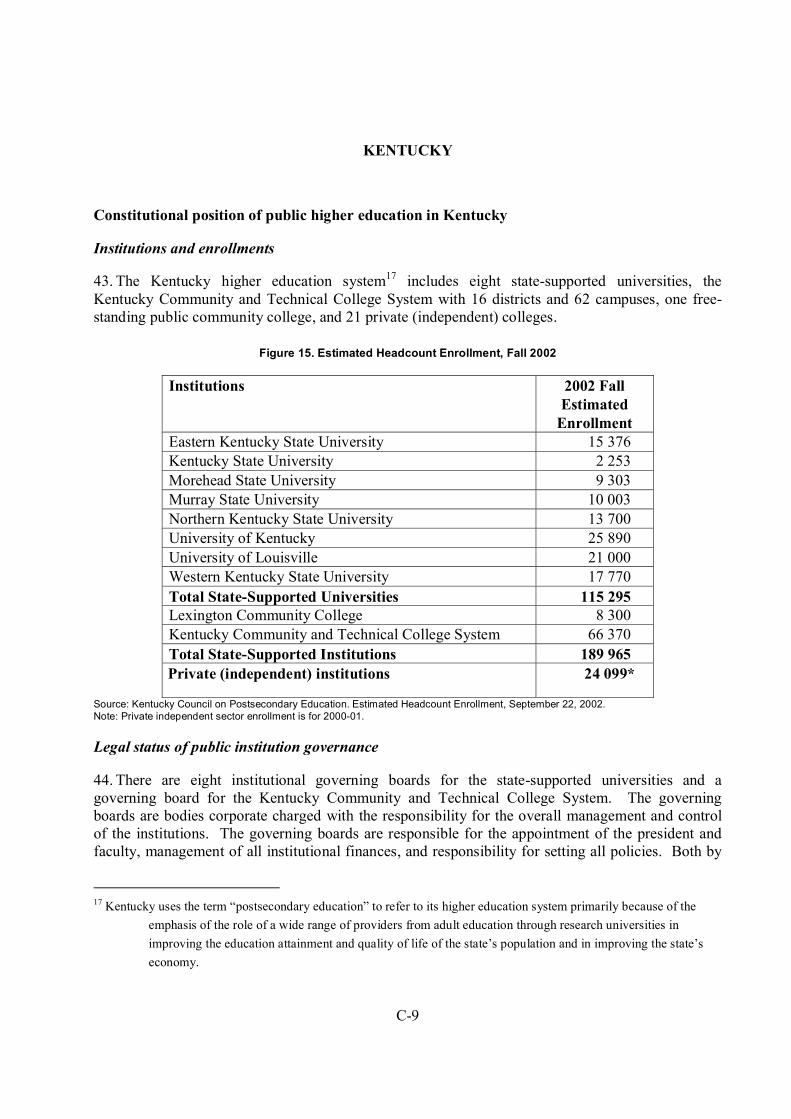
43. The Kentucky higher education system17 includes eight state-supported universities, the Kentucky Community and Technical College System with 16 districts and 62 campuses, one free-standing public community college, and 21 private (independent) colleges.
Figure 15. Estimated Headcount Enrollment, Fall 2002
Institutions 2002 Fall Estimated
Enrollment Eastern Kentucky State University 15 376 Kentucky State University 2 253
Morehead State University 9 303 Murray State University 10 003
Northern Kentucky State University 13 700 University of Kentucky 25 890
University of Louisville 21 000 Western Kentucky State University 17 770
Total State-Supported Universities 115 295 Lexington Community College 8 300 Kentucky Community and Technical College System 66 370
Total State-Supported Institutions 189 965
Private (independent) institutions 24 099*
Source: Kentucky Council on Postsecondary Education. Estimated Headcount Enrollment, September 22, 2002. Note: Private independent sector enrollment is for 2000-01.
Legal status of public institution governance
44. There are eight institutional governing boards for the state-supported universities and a governing board for the Kentucky Community and Technical College System. The governing boards are bodies corporate charged with the responsibility for the overall management and control of the institutions. The governing boards are responsible for the appointment of the president and faculty, management of all institutional finances, and responsibility for setting all policies. Both by
17 Kentucky uses the term “postsecondary education” to refer to its higher education system primarily because of the
emphasis of the role of a wide range of providers from adult education through research universities in
improving the education attainment and quality of life of the state’s population and in improving the state’s
economy.
10 HEFCE-OECD/IMHE 2004 – National Report – United States
law and tradition, the Kentucky institutional governing boards have substantial independent authority and responsibility for institutional financial management. The language of the authorizing statute is as follows:
1. The government of each of the state universities and the Kentucky Community and Technical College System is vested in its respective board of regents. Each board of regents, when its members have been appointed and qualified, shall constitute a body corporate, with the usual corporate powers, and with all immunities, rights, privileges, and franchises usually attaching to the governing bodies of educational institutions. Each board may:
a) Receive grants of money and expend the same for the use and benefit of the university or college;
b) Adopt bylaws, rules, and regulations for the government of its members, officers, agents, and employees, and enforce obedience to such rules;
c) Require such reports from the president, officers, faculty, and employees as it deems necessary and proper from time to time;
d) Determine the number of divisions, departments, bureaus, offices, and agencies needed for the successful conduct of the affairs of the university or college; and
e) Grant diplomas and confer degrees upon the recommendation of the president and faculty.
2. Each board of regents shall periodically evaluate the institution's progress in implementing its missions, goals, and objectives to conform to the Strategic Agenda. Officers and officials shall be held accountable for the status of the institution's progress….
The board of regents shall assure that the budget planning and implementation processes are consistent with the adopted Strategic Agenda and biennial budget and with the missions of the institutions within the system.18
45. The institutional governing boards are composed primarily of citizen members who are appointed by the Governor from nominations submitted by the Governor’s Postsecondary Nominating Committee. Other members include ex officio members and certain designated or elected members (e.g., faculty and student representatives).
State-level structure
Council on Postsecondary Education (CPE)
46. The Council on Postsecondary Education (CPE) is the statewide coordinating board for the higher education system in the Commonwealth of Kentucky. The Council is an independent board reporting to the governor and is responsive to the legislature. As a coordinating board, the Council does not govern institutions. As indicated above, governance, including responsibility for institutional financial management, is the responsibility of the institutional governing boards.
18 Kentucky Revised Statutes (KRS) 164.350
C-11
47. The Council was established by House Bill 1 (HB 1) in May 1997 and replaced the Council on Higher Education which was originally established in 1934. The 1997 reform legislation gave the Council new membership and stronger coordinating powers. The Council consists of 16 members, including 13 citizens appointed by the governor from persons nominated by the Governor’s Postsecondary Nominating Committee and confirmed by the House and Senate members, 1 faculty member and 1 student member, and the state's commissioner of education as a nonvoting ex-officio member.
48. Among the powers of the restructured Council on Postsecondary Education are the following19:
• Develop and implement the Strategic Agenda with the advice and counsel of the Strategic Committee on Postsecondary Education.
• Develop a system of public accountability related to the Strategic Agenda by evaluating the performance and effectiveness of the state's postsecondary system.
• Review, revise, and approve the missions of the state's universities and the Kentucky Community and Technical College System.
• Determine tuition and approve the minimum qualifications for admission to the state postsecondary educational system.
• Devise, establish, and periodically review and revise policies to be used in making recommendations to the Governor for consideration in developing recommendations to the General Assembly for appropriations to the universities and the Kentucky Community and Technical College System.
• Devise, at the sole discretion of the Council, policies that provide for allocation of funds among the universities and the Kentucky Community and Technical College System.
• Lead and provide staff support for the biennial budget process.
• Review and approve all capital construction projects covered including real property acquisitions, regardless of the source of funding for projects or acquisitions.
• Eliminate, at its discretion, existing programs or make any changes in existing academic programs at the state's postsecondary educational institutions, taking into consideration these criteria: (a) Consistency with the institution’s mission and the Strategic Agenda; (b) Alignment with the priorities in the strategic implementation plan for achieving the Strategic Agenda; (c) Elimination of unnecessary duplication of programs within and among institutions.
• Develop a financial reporting procedure to be used by all state postsecondary education.
Strategic Committee on Postsecondary Education
49. The 1997 reform legislation also created the Strategic Committee on Postsecondary Education (SCOPE). The committee is comprised of members of the Council on Postsecondary Education and representatives of the legislative and executive branches of state government. This important advisory body meets quarterly to consider a variety of issues affecting postsecondary education. 19 Excerpts from KRS 164.020
12 HEFCE-OECD/IMHE 2004 – National Report – United States
SCOPE provides a forum for bringing key issues to the public’s attention, particularly key budget issues, in advance of legislative sessions. Among other things, the committee receives a budget planning report in the fall of each odd-number year in advance of the biennial budget session. This report affords the governor an opportunity to advise SCOPE about the financial condition of the Commonwealth and the likely funds the executive branch will recommend to the General Assembly be appropriated for postsecondary education. This venue also affords an opportunity for the council to advise SCOPE about how the projected postsecondary education funds should be allocated based on its priorities.20
Funding of public higher education institutions in Kentucky
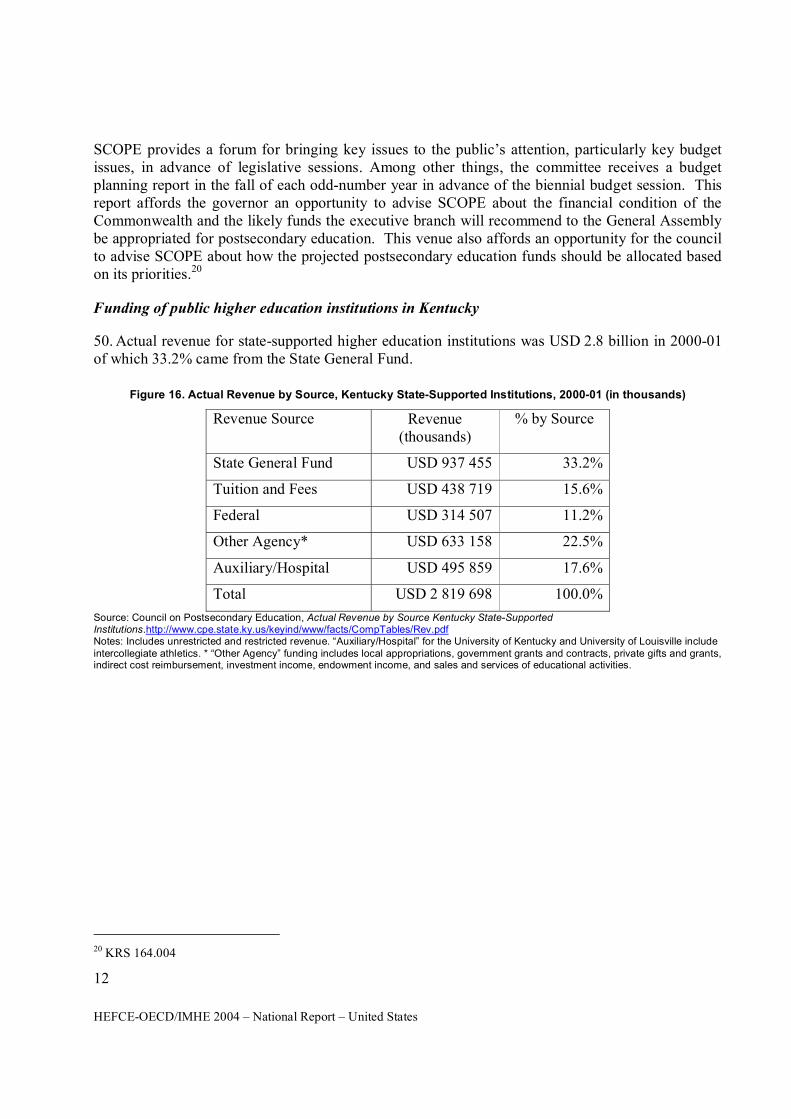
50. Actual revenue for state-supported higher education institutions was USD 2.8 billion in 2000-01 of which 33.2% came from the State General Fund.
Figure 16. Actual Revenue by Source, Kentucky State-Supported Institutions, 2000-01 (in thousands)
Revenue Source Revenue (thousands)
% by Source
State General Fund USD 937 455 33.2%
Tuition and Fees USD 438 719 15.6%
Federal USD 314 507 11.2%
Other Agency* USD 633 158 22.5%
Auxiliary/Hospital USD 495 859 17.6%
Total USD 2 819 698 100.0%
Source: Council on Postsecondary Education, Actual Revenue by Source Kentucky State-Supported Institutions.http://www.cpe.state.ky.us/keyind/www/facts/CompTables/Rev.pdf Notes: Includes unrestricted and restricted revenue. “Auxiliary/Hospital” for the University of Kentucky and University of Louisville include intercollegiate athletics. * “Other Agency” funding includes local appropriations, government grants and contracts, private gifts and grants, indirect cost reimbursement, investment income, endowment income, and sales and services of educational activities.
20 KRS 164.004
C-13
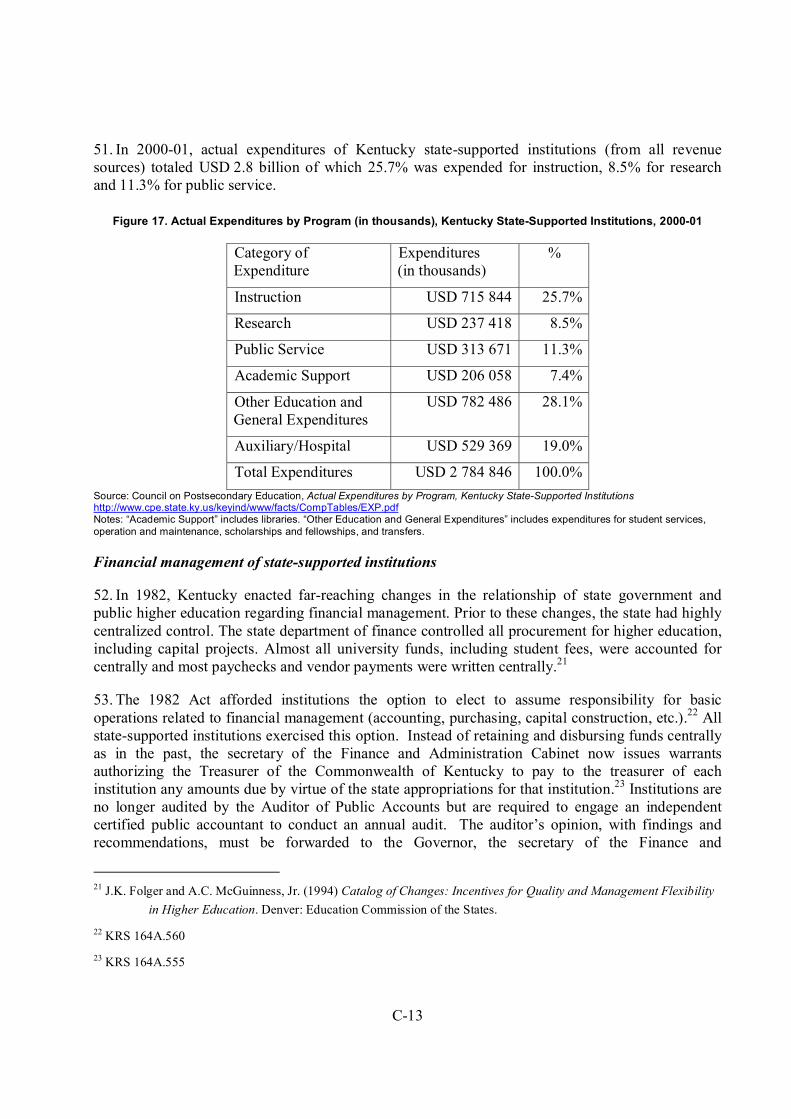
51. In 2000-01, actual expenditures of Kentucky state-supported institutions (from all revenue sources) totaled USD 2.8 billion of which 25.7% was expended for instruction, 8.5% for research and 11.3% for public service.
Figure 17. Actual Expenditures by Program (in thousands), Kentucky State-Supported Institutions, 2000-01
Category of Expenditure
Expenditures (in thousands)
%
Instruction USD 715 844 25.7%
Research USD 237 418 8.5%
Public Service USD 313 671 11.3%
Academic Support USD 206 058 7.4%
Other Education and General Expenditures
USD 782 486 28.1%
Auxiliary/Hospital USD 529 369 19.0%
Total Expenditures USD 2 784 846 100.0%
Source: Council on Postsecondary Education, Actual Expenditures by Program, Kentucky State-Supported Institutions http://www.cpe.state.ky.us/keyind/www/facts/CompTables/EXP.pdf Notes: “Academic Support” includes libraries. “Other Education and General Expenditures” includes expenditures for student services, operation and maintenance, scholarships and fellowships, and transfers.
Financial management of state-supported institutions
52. In 1982, Kentucky enacted far-reaching changes in the relationship of state government and public higher education regarding financial management. Prior to these changes, the state had highly centralized control. The state department of finance controlled all procurement for higher education, including capital projects. Almost all university funds, including student fees, were accounted for centrally and most paychecks and vendor payments were written centrally.21
53. The 1982 Act afforded institutions the option to elect to assume responsibility for basic operations related to financial management (accounting, purchasing, capital construction, etc.).22 All state-supported institutions exercised this option. Instead of retaining and disbursing funds centrally as in the past, the secretary of the Finance and Administration Cabinet now issues warrants authorizing the Treasurer of the Commonwealth of Kentucky to pay to the treasurer of each institution any amounts due by virtue of the state appropriations for that institution.23 Institutions are no longer audited by the Auditor of Public Accounts but are required to engage an independent certified public accountant to conduct an annual audit. The auditor’s opinion, with findings and recommendations, must be forwarded to the Governor, the secretary of the Finance and
21 J.K. Folger and A.C. McGuinness, Jr. (1994) Catalog of Changes: Incentives for Quality and Management Flexibility
in Higher Education. Denver: Education Commission of the States.
22 KRS 164A.560
23 KRS 164A.555
14 HEFCE-OECD/IMHE 2004 – National Report – United States
Administration Cabinet, the Auditor of Public Accounts, the director of the Legislative Research Commission, the president of the Council of Postsecondary Education, and members of the governing board.24
54. The independent audit is the principal means for external institutional accountability for financial management of current operations. However, capital projects and expenditures, regardless of the source of funding for these projects, are subject to more extensive external scrutiny. The Capital Projects and Bond Oversight Committee, a committee within the General Assembly’s Legislative Research Commission, oversees all ongoing capital projects for all state government, including those at higher education institutions.
Budget process and allocation of funds among institutions
55. The 1997 Postsecondary Reform Act brought about a fundamental change in the budget and funds allocation process for Kentucky’s state-supported institutions. Prior to the 1998-2000 biennium, Kentucky used a funding model that had its origins in the early 1980s and was modified periodically in the intervening period. In the broadest terms, the change was from a “cost-reimbursement” model to a “strategic investment” approach linked to state priorities. The 1984-86 appropriations recommendations described the funding formula as:
… [A] method of calculating an equitable, adequate, and proper need level at a specific institution during a specific time period. It takes into account variables such as number of students, square feet of space, and levels of instruction, research, and service, and applies to them established factors such as rates per credit hour for instruction, maintenance and operation amounts per square foot, and relative complexity of institutions and of activities in areas such as libraries.25
56. Prior to the 1998-2000 biennium, the recommendations to the Governor and General Assembly were based on a formula calculation such as described above with a series of technical adjustments (e.g., for changes in debt service). The funding model also provided for performance funding linked to the Council’s system strategic plan.
57. As the result of enactment in May 1997 of the Kentucky Postsecondary Education Reform Act (House Bill 1) Kentucky changed to a “base plus strategic investment” funding policy.
58. Beginning in the 1998-2000 biennium, the Council on Postsecondary Education’s budget recommendations included – in essence – these components:
• The base budgets for the previous fiscal year, plus a “current services” (inflationary) increase and technical adjustments (e.g., for changes in debt service)
• Recommendations for funding of trust funds under the newly enacted Strategic Investment and Incentive Funding Program. The original trust funds were:
24 KRS 164A.570
25 Council on Postsecondary Education. (2000) Kentucky Postsecondary Education: Funding History: 1980-2002,
Frankfort: CPE, Appendix B, p. 2
C-15
− Research Challenge Trust Fund
− Regional University Excellence Trust Fund
− Physical Facilities Trust Fund
− Technology Incentives Trust Fund
− Student Financial Aid and Advancement Trust Fund
59. The policy tool of trust funds was a critical element of the 1997 Postsecondary Education Improvement Act designed to provide the Council on Postsecondary Education with the leverage of financial incentives to drive reform toward the Strategic Agenda and the long-term goals defined by the Reform Act. Appropriations to these trust funds are made directly to the Council on Postsecondary Education, which is responsible for establishing criteria for the distribution of funds to the institutions. As described in the new statute:
“It is the intent of the General Assembly to make appropriations, including general fund appropriations, each fiscal biennium to each of the individual trust funds in the funding program in a form and manner consistent with the Strategic Agenda adopted by the Council on Postsecondary Education. Appropriations made to individual trust funds in the Strategic Investment and Incentive Funding Program shall not lapse at the end of a fiscal year but shall be carried forward in the respective trust fund accounts and shall be available for allotment for their respective purposes in the next fiscal year.”26
60. For the 2002-2004 biennium, the Council developed a “benchmark funding” methodology for adjusting institutional base funding using comparisons of “public funding” (state appropriations plus tuition and fees) per full-time equivalent (FTE) for each Kentucky institution with a carefully selected set of peer institutions in other states.
61. The 2002-2004 budget recommendations therefore included27:
• Base funding
• “Benchmark” funding adjustments to the base
• Adjustments for current services and other technicalities
• Funding for the original six trust funds as well as four other new initiatives:
− Adult Education and Literacy Trust Program
− Science and Technology Trust Fund
− Endowment Match Program (“Bucks-for-Brains”) providing state matching on a one-to-one basis with funds generated from external sources to endow chairs, professorships,
26 KRS 164.7911
27 Commonwealth of Kentucky, Strategic Committee on Postsecondary Education, “Points of Consensus among
University Presidents, KCTCS President, and the Council President Concerning the 2002-2004 Funding
Methodology,” January 8, 2001.
16 HEFCE-OECD/IMHE 2004 – National Report – United States
and fellowships and to advance the Commonwealth’s Strategic Agenda and university missions
− Funding for Enrollment Growth and Retention to advance the Council’s Action Agenda (these funds were included within three of the original six trust funds).
62. As described in the next section of this report, the recent severe economic downturn across the U.S. and in Kentucky is resulting in serious constraints on funding for higher education in Kentucky. Although several elements of the new funding strategy (e.g., the Enrollment Growth and Retention Program) are not funded in the revised 2002-2004 state appropriations, the basic framework remains intact.
Ownership of assets
63. As a public corporation, each institution is the owner of its assets. As indicated above, the Commonwealth of Kentucky, through the Council on Postsecondary Education and the Capital Projects and Bond Oversight Committee, oversees the capital development process at each institution. Subject to certain statutory requirements, in most cases the governing boards of the institutions have authority to purchase, sell, and lease facilities and land without approval from a state agency.
Staff employment
64. The staff (faculty, administrators, support staff, and others) of each state institution are employees of that institution and are subject to the policies established by the governing board. Within certain statutory requirements, the governing board is the final authority on human resource/personnel decisions at the institution.
C-17
Current policy context
Postsecondary education reform
65. Kentucky’s postsecondary reform initiative is widely recognized as one of the most far-reaching, significant state-level higher education reforms of the past quarter century in the United States. 28, 29 It is recognized as such because it reflects:
• A Strategic Agenda with long-term goals (2020) focused on the future of the state’s quality of life and economy.
• More than a decade of continuity of education reform beginning with the Kentucky Education Reform Act of 1990 (KERA).
• Alignment of finance policy with the Strategic Agenda – not only a commitment of the Governor and General Assembly to substantial increases in funding but also the use of financing policy (e.g., investment funds and incentives) to stimulate change and improvement.
• Balance among the components of reform (adult education, community and technical colleges, comprehensive universities, virtual university, and research universities).
• Quality and commitment of leadership at every level of the system.
• Creativity and intellectual rigor of reform resulting in models that are being replicated elsewhere in the country.
• A clear focus on accountability with concrete goals and measurable results.
66. The question in Kentucky, as in many other states, is if the reforms can be sustained in bad as well as good economic times and over changes in leadership.
Assessment of the system
67. In 1996, the Governor’s Task Force on Higher Education made an assessment of higher education in Kentucky to assist the task force in shaping recommendations.30 Some of the major findings of that assessment were as follows:
• System performance
− Low education attainment.
28 The following is an excerpt from A. C. McGuinness, Jr. (2002). An Assessment of Postsecondary Education Reform in
Kentucky. Lexington: Prichard Committee for Academic Excellence. http://www.prichardcommittee.org/
29 The National Governors Association (NGA) Center for Best Practices (2001) Postsecondary Education Reform in
Kentucky. Washington, D.C: National Governors Association. http://www.nga.org/center/1,1188,,00.html
30 Commonwealth of Kentucky, Task Force on Postsecondary Education (1997) An Assessment of Postsecondary
Education in Kentucky, Frankfort, March 1997.
18 HEFCE-OECD/IMHE 2004 – National Report – United States
− High levels of “leakage” at every transition point – low rates of retention, transfer, and degree completion.
− A highly fragmented, uncoordinated and under-funded network of community colleges, technical institutes, and two-year programs at universities.
− Lack of coordination and collaboration among universities.
− Comparatively poor research competitiveness, especially in areas critical to the New Economy.
• Major barriers to improvement
− A system driven by the interests of institutions and their political networks and not by the needs of the state’s people and economy. The system was plagued by political and turf battles among institutions, especially between the major state university and the comprehensive universities.
− Lack of leadership: Lack of an effective structure for statewide policy leadership to achieve common goals and coordinate efforts of its diverse institutions.
− No linkage with statewide mission.
− Lack of strategic financial planning: Financing policy and the allocation formula had lost their credibility and were not linked to a strategic agenda.
− Lack of strategic planning for technology.
− Financial barriers for students. Future planning for student aid was not linked to planning by CHE.
68. Above all, the 1997 assessment found pervasive lack of confidence that Kentucky could overcome long-standing cultural and political barriers that historically had thwarted efforts to improve the quality and responsiveness of the state’s higher education system. A common response to the question, “Why not?” was “This is Kentucky – we don’t do that here.”
Enactment of House Bill 1
69. Using the Assessment as the case for reform, Governor Paul E. Patton, led the process concluding in the enactment of the Postsecondary Education Improvement Act (HB 1) of 1997.31 HB 1 established the basic framework for reform, including:
• Goals to be achieved by 2020
• A policy leadership structure through the Council on Postsecondary Education (CPE) to provide strategic direction and overall coordination of the system, and the Strategic Committee on Postsecondary Education (SCOPE) to engage the Governor, the leaders of the General Assembly, and the CPE in a shared commitment to sustaining reform
31 House Bill 1, Postsecondary Education Reform Act, enacted in the 1997 First Extraordinary Session of the Kentucky
General Assembly
C-19
• Strategic investment and incentive funding linked to a Strategic Agenda designed to move the system toward the goals for 2020
• The Kentucky Virtual University
• The Kentucky Community and Technical College System
70. Following the enactment of HB 1 in 1997, the General Assembly acted on several other critical elements of reform, including:
• The “Bucks-for-Brains” endowment match (1998)
• Incentive funding linked to the Action Agenda and enrollment and retention
• SB 1, Adult Education, enacted in 2000
• The Kentucky Innovation Act, enacted in 2000, creating the Kentucky Innovation Commission and the Office of the New Economy
71. Beyond the new statutes, the key to the momentum of reform has been the leadership exhibited by both political leaders and educators in the implementation phases of the reform:
• The Governor has consistently placed postsecondary reform at the top of his agenda in terms of budget priorities, and the quality of appointments to the CPE and governing boards, and in advocacy for reform.
• The Governor and the Executive Branch team (in collaboration with the President of the CPE, SCOPE, and the university presidents) have played pivotal roles in designing and negotiating the details of a new financing policy.
• The CPE has emerged as one of the most respected policy leadership and coordinating boards in the nation because of the vision, creativity, and quality of its work, and its leadership in key areas such as shaping a Strategic Agenda and public accountability process.
72. The Kentucky Community and Technical College System (KCTCS), created in one of the most hotly contested legislative battles in recent Kentucky history, has developed into a dynamic, responsive, coordinated network providing access and links to the economy and quality of life of every region in Kentucky.32
Assessment of the progress in reform
73. Kentucky has made significant progress since the 1997 Assessment. To a striking degree, the reforms have addressed most of the issues identified just five years earlier and established the foundation for step-by-step progress over the next decade and beyond.
32 See website for Kentucky Community and Technical College System, www.kctcs.net, for more information on this
system.
20 HEFCE-OECD/IMHE 2004 – National Report – United States
74. The CPE’s use of five questions to frame the indicators of progress toward reform has become a model for states across the U.S.33 The five questions are:
1. Are more Kentuckians ready for postsecondary education?
2. Are more students enrolling?
3. Are more students advancing through the system?
4. Are we preparing Kentuckians for life and work?
5. Are Kentucky’s communities and economy benefiting?
75. The latest report uses a system of traffic lights (green for “good progress,” yellow for “some progress,” and red for “no progress”) to signal the status of reform. The report assigns green lights to questions 2, 3 and 5, reflecting progress toward goals set for 2002, and yellow lights to question 1, reflecting mixed performance on some indicators of preparation for postsecondary education. Indicators for the 4th question are still under development (see Appendix D for full list of indicators).
76. Remarkable progress is being made on several of the major problems identified in the 1997 Assessment:
• Improving per capita income
• Reducing the percentage of the population with less than a high school credential
• Increasing overall enrollments by 19.9%
• Increasing total R&D spending per capita
Despite these improvements, progress has not been as rapid in other areas.
• Increasing percentage of the adult population with at least a bachelor’s degree
• Reducing the large number of young adults age 18 to 24 who do not have a high school diploma
• Improving retention and completion rates
• Improving degree production at all levels of postsecondary education
Challenge of sustaining reform
77. The message from these results is clear: While Kentucky is making progress, it will take a sustained commitment over a 10 to 20 year period to raise the standard of living of all Kentucky to
33 See Council on Postsecondary Education website, www.cpe.state.ky.us, for five questions and related indicators and
performance data. A report on the status of education reform as a whole is available on the following website:
http://www.e4ky.org/default.htm
.
C-21
levels at or above the national average. The danger is that temporary setbacks or a failure to demonstrate short-term results will lead to discouragement and cynicism about reform.
78. Kentucky faces a number of challenges to sustain reform and counter tendencies to drift back to the policies and practices of the past. An assessment of the reform emphasized that, if the momentum of reform is to be continued, Kentucky must:
• Sustain the focus on the future of Kentucky’s population and economy (e.g., the “five questions” used by the Council on Postsecondary Education)
• Broaden and deepen engagement of the state’s business, legislative, and civic leaders in reform
• Engage institutional leaders – both presidents and governing boards – in collective responsibility to sustain reform
• Sustain the link between financing policy and the Strategic Agenda
• Strengthen strategic leadership and governance
• Clarify the roles and missions of the comprehensive universities in postsecondary reform
• Increase incentives for partnerships among institutions and with the elementary and secondary education system (K-12)
• Recognize the role of independent institutions in postsecondary reform
Critical transition period
79. Kentucky is in a critical period of both transition in leadership and severe economic conditions similar to those facing states throughout the U.S. 34 Governor Paul Patton, who has been the champion of reform, is in the final months of his term. A newly appointed president of the Council on Postsecondary Education will assume his position in April 2003. Action just completed on the appropriations for the 2002-2004 biennium demonstrates a commitment of the General Assembly to funding of education, although critical elements of the reform agenda (e.g., the Enrollment and Retention Program originally proposed in 2002) did not receive funding because of the state’s fiscal crisis and other considerations. Action on the budget, which usually would have occurred in early 2002, was delayed because of political controversies unrelated to higher education. The approved budget35 includes:
• A 2.6% recurring budget reduction for fiscal year FY 2002-2003 – a reduction applied to all state government because of revenue short-falls
• A continuing commitment to benchmark funding adjustments to institutions’ base budgets
• Authorization for funding of some of the Trust Fund initiatives including:
34 Michael Arnone (2003) Revamping of Kentucky College System Faces a ‘Make-or-Break Moment.’ The Chronicle of
Education, March 14, 2003, pp. A23-A24.
35 Commonwealth of Kentucky, Council on Postsecondary Education, Budget Updates, March 2003.
http://www.cpe.state.ky.us/announce/announce_budget_rec.asp
22 HEFCE-OECD/IMHE 2004 – National Report – United States
− Authorization of USD 120 million in taxable bonds to fund the Endowment Match Program (“Bucks-for-Brains”)
− Funding (at levels below requested amounts) for the Technology, Financial Aid and Advancement, and Science and Technology Trust Funds and the Adult Education and Literacy Incentives Program
80. The appropriations bill provides for a slight increase in funding for the second year (2003-2004) of the biennium, but the prospects for continued serious budget short-falls make these figures problematic. The overall assessment, however, is that the General Assembly demonstrated a commitment to sustaining reform despite the serious fiscal conditions.
Description of policy instruments
Principal policy instruments
81. As described in the previous two sections of this report, the principal policy instruments employed in Kentucky are:
• A Strategic Agenda linking higher education to the future of the state’s economy and quality of life. Governor Patton’s driving aim of reform was to increase the state’s per capita income to a level at or above the national average.36 The basic thrust of this agenda is clearly enunciated in the Council on Postsecondary Education’s mission: “One mission, better lives,” and in the five questions used to guide reform:
− Are more Kentuckians ready for postsecondary education?
− Are more students enrolling?
− Are more students advancing through the system?
− Are we preparing Kentuckians for life and work?
− Are Kentucky’s communities and economy benefiting?
• Financing policy linked directly to the Strategic Agenda–primarily through the Strategic Investment and Incentive Funding Programs.
• Decentralized governance of institutions through which the governing boards of state-supported institutions are assigned substantial responsibility and are held accountable both for effective management (including financial management) of their institutions and for performance related to the Strategic Agenda.
• Accountability linked to institutional and system performance related to the Strategic Agenda. Each institution’s performance is monitored in terms of the indicators related to each of the five questions listed above. Accountability is linked directly to funding policy.
• A policy leadership and coordinating entity, the Council on Postsecondary Education, which is the single point of accountability for leading reform, with responsibility to develop
36 From 1990 to 2000, Kentucky’s per capita income increased from 77.3% to 83.8% of the U.S. average – the fifth
highest rate of increase (62.2%) in the U.S. The state’s rank moved up from 43 to 41 among the fifty states.

C-23
and gain a consensus around a Strategic Agenda and with sufficient authority in the key areas of financing and accountability to provide the leverage for change in the largely decentralized system.
• A forum, the Strategic Committee for Postsecondary Education, to obtain the commitment of the state’s principal policy leaders, the Governor and the leadership of the General Assembly, to the development of the Strategic Agenda and a long-term financing strategy to support that Agenda.
Changes in financing policy
82. As described in the first section of this report, the deregulation in 1982 gave the institutional governing board significant management flexibility. In theory, the legislation gave the governing boards the responsibility for effective management of institutional assets as well as all sources of revenue (state, tuition and fees, and non-state) to carry out their missions. Balancing institutional autonomy, the Council on Higher Education, the state coordinating board that preceded the current council, had limited regulatory authority in areas such as mission and academic program approval, review of existing programs for low-productivity and unnecessary duplication, and approval of new campuses and off-campus sites. The previous Council had responsibility for making budget recommendations to the Governor and General Assembly, but these were primarily based on the agreed-upon “cost-reimbursement” funding formula, a formula that allocated state appropriations to institutions based primarily on historical cost data and measures of workload (primarily enrollment). The focus was on an institutional goal of “adequate and equitable” funding. The funding methodology’s primary incentive was for institutions to increase enrollments as a means of maximizing state revenue. Except for limited performance funding implemented in the early 1990s, the funding methodology contained few explicit connections to a Public Agenda–to the Council’s strategic plan or state policy objectives. In other words, the previous Council had limited leverage in financing policy to pursue a Public Agenda and to reinforce its planning and regulatory authority.
83. Prior to 1997, the focus of state policy was primarily on the allocation and utilization of public funds (state appropriations and state-approved tuition and fee revenue), but not on the full range of revenue available to institutions to carry out their missions. Likewise, institutional governing boards tended to look to the state government as the primary source of funding rather than assume full responsibility for effective financial management and utilization of all existing institutional resources (both public and non-public) in undertaking new programs and initiatives.
84. The intent of the Postsecondary Education Reform Act of 1997 (H.B. 1) was to shift the emphasis from an institutional agenda to a Public Agenda– to make an explicit link between financing policy and the State’s Strategic Agenda as a means for the State to gain leverage in the direction of state priorities on the largely decentralized system. The Act made this change by intentionally shifting the focus of the funding methodology from “cost-reimbursement” to “strategic investment.” The effect of this was to:
• Reinforce the responsibility and authority of the institutional governing boards for leading an institutional agenda consistent with the institution’s mission and the Strategic Agenda and for effective management of all institutional assets and resources to those ends, and
24 HEFCE-OECD/IMHE 2004 – National Report – United States
• Change the focus of the state (the Governor, General Assembly, and Council on Postsecondary Education) from primarily attention to capacity building (detailed issues of institutional costs and expenditures) to a greater emphasis on strategic questions of capacity utilization (questions about how the state could invest a portion of the public funding to “purchase” attention of the institutions to the priorities defined in the Strategic Agenda).
85. Referring back to Figure 13 on state alternatives for financing higher education, the new Kentucky policies established a balance between policies to strengthen the core general support of institutions and policies designed to advance state priorities.
Financing policy and institutional viability
86. “Benchmark” funding is a key element of Kentucky’s new financing policy designed to ensure adequate core institutional capacity. “Benchmark” funding is intended to ensure that over time the base funding of each institution is comparable on a per student basis to the level of a carefully selected group of peer institutions in other states. In the biennial budget recommendations summarized in section “Budget process and allocation of funds among institutions” above, the components included not only base funding but also “benchmark” funding adjustments to the base.
87. At the beginning of the 1997 reforms, it was clear that there were significant disparities among the state-supported institutions in unrestricted operating revenue per student. Despite evidence of these disparities, the General Assembly had been unable to make the kinds of differentiated funding decisions needed to narrow these disparities. The Postsecondary Education Reform Act replaced the previous funding policy and made explicit the policy goal of narrowing disparities in base funding between Kentucky institutions and peer institutions in other states. Once the new statute was enacted, the Council on Postsecondary Education led a process of identifying national peer institutions for each Kentucky institution and then identifying the differences in the level of funding of each Kentucky institution and its peers. The comparison focuses on “public funds,” meaning state appropriated funds plus revenue for state-mandated tuition and fees. The policy objective is to move each Kentucky institution to an established level (e.g., the peer institution at the 55th percentile of funding compared to other peers for the 2000-02 biennial budget request).37
88. As indicated above, the “benchmark funding” designed to ensure adequate institutional capacity is only one component of the financing policy. The other policies are designed to ensure that this capacity is utilized in line with state priorities. The responsibility for managing this capacity is delegated to the institutional governing boards.
37 Council on Postsecondary Education (2000). A Case Study Using Eastern Kentucky University: Explanation of the
2000-02 Council on Postsecondary Education’s Base Budget Recommendation Using the Benchmark Funding
Approach and the 55th Percentile Funding Target. Frankfort, Kentucky: CPE. October 25, 2000.
C-25
State policy instruments and institutional financial management
Division of responsibility
89. State policy in Kentucky places responsibility for institutional financial management and, by definition, issues of institutional financial viability squarely in the hands of the institutional governing boards. Both by statutory authority and tradition, the Council on Postsecondary Education and other state agencies such as the Secretary of the Finance and Administration Cabinet, do not become directly involved in issues of institutional financial management. As described in the first section of this report, the institutions are required to submit annual independent audit reports to several state entities, including the Council on Postsecondary Education. Nevertheless, in practice these reports are not analyzed.
Principal policy instruments
90. The principal policy instruments employed by the State to affect institutional behavior are indirect policy tools of:
• The process for appointing members of the governing boards
• Training and technical assistance for developing institutional governing boards
• Financing policy linked to accountability for accomplishing the goals in the Strategic Agenda and institutional missions.
Board appointments
91. As described in the first section of this report, Kentucky is one of only two states in the U.S. that has a statutory body, the Governor’s Postsecondary Education Nominating Committee, responsible for screening and nominating candidates for board membership to the Governor. Each Governor has a responsibility to exercise great care in making board appointments, including underscoring the role of each member in carrying out the governing board’s responsibility for institutional financial management.
Board development and training
92. Recognizing the limited direct State role in institutional management, state law mandates that the Council on Postsecondary Education undertake a program of training and development for governing boards and members. With the support of the Council, the Governor sponsors an annual conference for trustees at which issues such as the board’s role in financial management are addressed. For example, the 2002 trustees’ conference focused on the topic, “Understanding Key Information and Performance Indicators Regarding Institutional Budgets and Finances”. Conference sessions included an orientation on how to read and use institutional financial statements in a new format mandated by the Governmental Accounting Standards Board (GASB). The conference then provided board members with information on using ratio analysis based on the KPMG publication, Ratio Analysis in Higher Education.38 Each board was then engaged in a group problem-solving
38 KPMG (2002). Ratio Analysis in Higher Education: New Insights for Leaders of Public Institutions
26 HEFCE-OECD/IMHE 2004 – National Report – United States
exercise using ratios to assess alternatives for a major policy decision facing an institution, the establishment of a new academic program.
93. The Council on Postsecondary Education in 2002 joined with the Prichard Committee on Academic Excellence, a private, non-profit, non-partisan citizens’ advisory organization, to establish the Institute for Effective Governance. The institute will provide an ongoing means for orienting new board members, conducting training sessions on special topics, and conducting the annual Governor’s conference.39
94. A recent case in which questions arose about the financial management of one of the state-supported institutions presents a clear illustration of the division of responsibility between the State and institutional governing boards on questions of institutional financial management–if not viability. Institutional constituencies and community members made allegations about mismanagement by the institution’s president. These allegations were reported to the key state officials but also were reported in the local news media. Because the institution’s governing board was responsible for institutional financial management as well as for appointing, evaluating, and, if necessary, dismissing the president, the focus of the Governor, the Council on Postsecondary Education, and other state entities was on actions that would support and strengthen the capacity of the governing board to assume its responsibilities. State officials consciously resisted pressure to intervene directly in a manner that would have taken over or undermined the authority and responsibility of the governing board. The policy tools summarized above were the principal ones employed in this case:
• The authority of the state to require the institution to obtain and submit an independent audit.
• Appointment (or, as necessary, replacement) of board members.
• Training and technical assistance. In this case, the Council on Postsecondary Education and the governing board jointly engaged a consultant to examine the institution’s management. The Council’s focus was only on issues within its purview such as mission, academic programs, and consistency with the Strategic Agenda.
Monitoring institutional accountability for mission and fulfilling the Strategic Agenda
95. From the State perspective, institutional viability in Kentucky is directly linked to the fundamental question of whether an institution is fulfilling its state-mandated mission and accomplishing the goals in the Strategic Agenda. For this reason, the Council on Postsecondary Education concentrates on institutional performance on the key indicators (e.g., “five questions”), not on indicators of financial management that are more appropriately the tools to be used by institutional governing boards. In fact, none of the key indicators used by the Council to monitor
39 The Prichard Committee for Academic Excellence is a non-partisan, non-profit, independent citizens’ advocacy
group. Since 1983, the committee, made up of volunteer parents and citizens from around Kentucky, has worked to
improve education in the Commonwealth at all levels. The Prichard Committee has provided a strong, independent voice
for sustaining reform in Kentucky over the past 20 years despite periodic changes in political leadership.
C-27
institutional performance are “financial management” either for individual institutions or for the system as a whole. Most of the indicators are designed to monitor the impact of the higher education system on:
• The education attainment of the population
• Student preparation for higher education, participation, affordability, retention and graduation
• The state’s quality of life (e.g., civic participation) and economy
96. Accountability measures for individual institutions differ depending on their missions. For example, some institutions such as the community colleges have a greater role in adult education and workforce development. The comprehensive universities play significant roles in teacher preparation and other links with reform of elementary and secondary education. The research universities are assessed in terms of the quality and competitiveness of their research and the connections of their research agendas with the future of the Commonwealth.
97. In summary, the principle underlying Kentucky’s approach to accountability is that a viable state-supported institution is an institution that is accomplishing its mission and serving public purposes. The state focus is on the ends to be achieved (what); responsibility for how to achieve these ends is clearly delegated to the institutional governing boards.
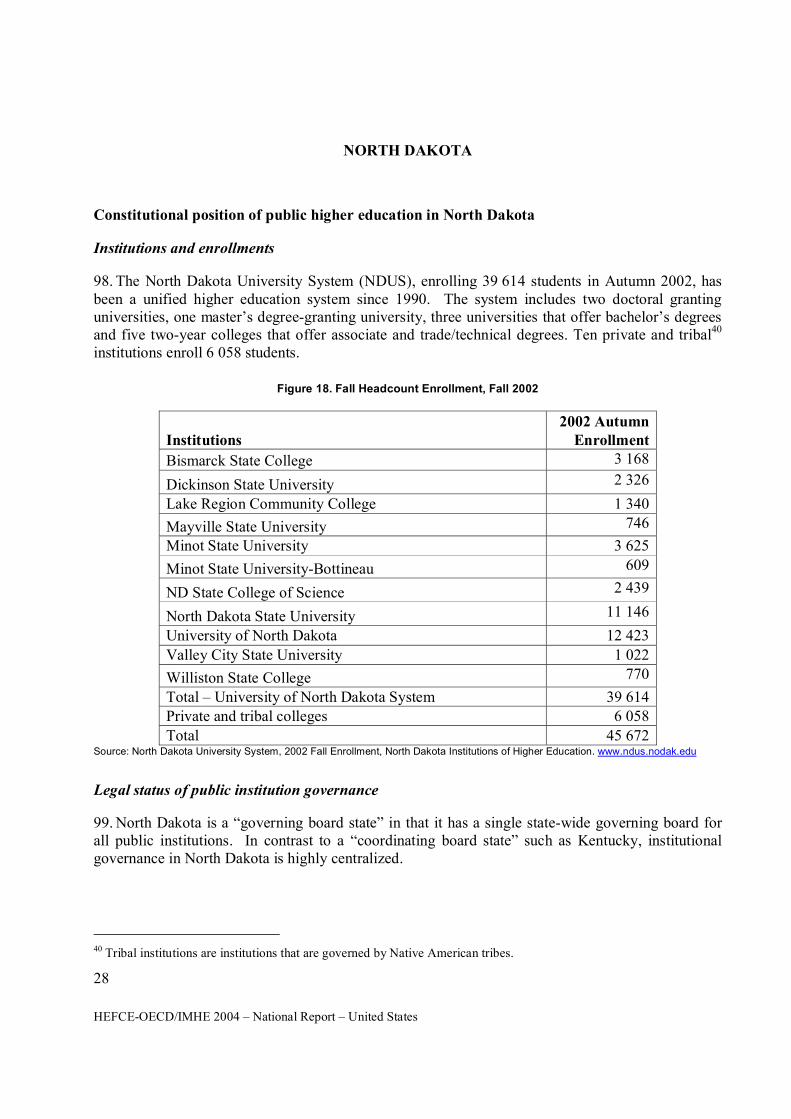
28 HEFCE-OECD/IMHE 2004 – National Report – United States
NORTH DAKOTA
Constitutional position of public higher education in North Dakota
Institutions and enrollments
98. The North Dakota University System (NDUS), enrolling 39 614 students in Autumn 2002, has been a unified higher education system since 1990. The system includes two doctoral granting universities, one master’s degree-granting university, three universities that offer bachelor’s degrees and five two-year colleges that offer associate and trade/technical degrees. Ten private and tribal40 institutions enroll 6 058 students.
Figure 18. Fall Headcount Enrollment, Fall 2002
Institutions 2002 Autumn
Enrollment
Bismarck State College 3 168
Dickinson State University 2 326
Lake Region Community College 1 340
Mayville State University 746
Minot State University 3 625
Minot State University-Bottineau 609
ND State College of Science 2 439
North Dakota State University 11 146
University of North Dakota 12 423
Valley City State University 1 022
Williston State College 770
Total – University of North Dakota System 39 614Private and tribal colleges 6 058
Total 45 672Source: North Dakota University System, 2002 Fall Enrollment, North Dakota Institutions of Higher Education. www.ndus.nodak.edu
Legal status of public institution governance
99. North Dakota is a “governing board state” in that it has a single state-wide governing board for all public institutions. In contrast to a “coordinating board state” such as Kentucky, institutional governance in North Dakota is highly centralized.
40 Tribal institutions are institutions that are governed by Native American tribes.
C-29
100. The State Board of Higher Education was established in 1939 and functions as the constitutional governing body for North Dakota's public higher education institutions. In 1990, the Board of Higher Education created the North Dakota University System whereby all 11 institutions are accountable to a chancellor appointed by the board. The chancellor is the chief executive officer of the North Dakota University System. The board consists of eight members. Seven members represent the general public and are appointed by the governor and confirmed by the senate and serve 4-year terms. The Governor makes these appointments for each position from a list of three names, selected by action of four of the following five persons: the president of the North Dakota education association, the chief justice of the Supreme Court, the superintendent of public instruction, the president pro tempore of the senate, and the speaker of the house of representatives. The Governor appoints as the eighth member a full-time resident student in good academic standing at an institution under the jurisdiction of the state board. The student serves a one-year term.41
101. All institutions within the North Dakota University System, including their geographic location, are named in the State Constitution. The Constitution states that, “All colleges, universities, and other educational institutions, for the support of which lands have been granted to this state, or which are supported by a public tax, shall remain under the absolute and exclusive control of the state.”42 A Constitutional Amendment to remove the institutions from the State Constitution--presumably to provide more flexibility in determining the numbers and locations of institutions--was defeated in 1998.
102. The Constitution specifies in detail the powers and duties of the State Board.43 For example, the Constitution specifies that the State Board shall:
• Have full authority over the institutions under its control with the right, among its other powers, to prescribe, limit, or modify the courses offered at the several institutions.
• Have full authority to organize or reorganize within Constitutional and statutory limitations, the work of each institution under its control, and do each and everything necessary and proper for the efficient and economic administration of said state educational institutions.
• Prescribe for all institutions standard systems of accounts and records and shall biennially, and within six months immediately preceding the regular session of the legislature, make a report to the governor, covering in detail the operations of the educational institutions under its control.
103. The Constitution also further specifies the budget process and the responsibilities of the State Board for overseeing all institutional expenditures.
• The heads of institutions are to submit budget requests for the biennial appropriations to the State Board of Higher Education.
41 Constitution of North Dakota, Article VIII, section 6.2.a.
42 Constitution of North Dakota, Article VIII, sections 5 and 6.
43 Constitution of North Dakota, Article VIII, section 6, paragraph 6. http://www.state.nd.us/lr/cencode/Const.pdf
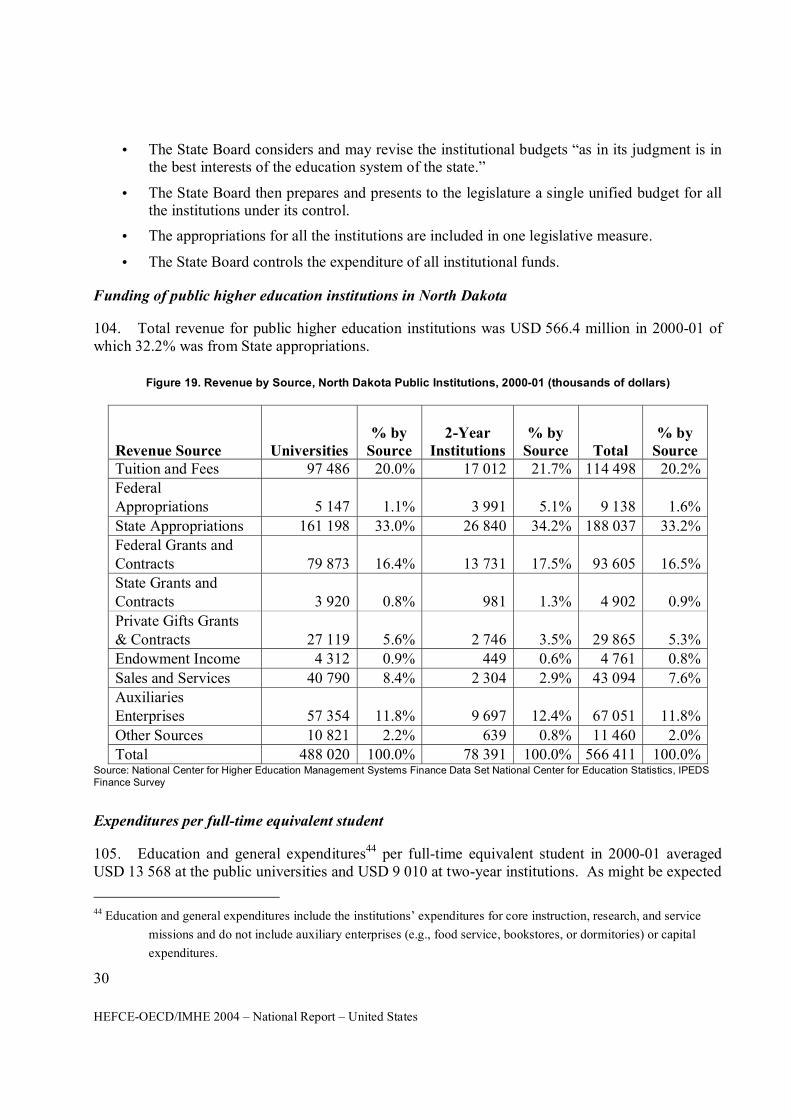
30 HEFCE-OECD/IMHE 2004 – National Report – United States
• The State Board considers and may revise the institutional budgets “as in its judgment is in the best interests of the education system of the state.”
• The State Board then prepares and presents to the legislature a single unified budget for all the institutions under its control.
• The appropriations for all the institutions are included in one legislative measure.
• The State Board controls the expenditure of all institutional funds.
Funding of public higher education institutions in North Dakota
104. Total revenue for public higher education institutions was USD 566.4 million in 2000-01 of which 32.2% was from State appropriations.
Figure 19. Revenue by Source, North Dakota Public Institutions, 2000-01 (thousands of dollars)
Revenue Source Universities % by
Source 2-Year
Institutions % by
Source Total % by
Source Tuition and Fees 97 486 20.0% 17 012 21.7% 114 498 20.2%Federal Appropriations 5 147 1.1% 3 991 5.1% 9 138 1.6%
State Appropriations 161 198 33.0% 26 840 34.2% 188 037 33.2%Federal Grants and Contracts 79 873 16.4% 13 731 17.5% 93 605 16.5%State Grants and Contracts 3 920 0.8% 981 1.3% 4 902 0.9%
Private Gifts Grants & Contracts 27 119 5.6% 2 746 3.5% 29 865 5.3%Endowment Income 4 312 0.9% 449 0.6% 4 761 0.8%
Sales and Services 40 790 8.4% 2 304 2.9% 43 094 7.6%Auxiliaries Enterprises 57 354 11.8% 9 697 12.4% 67 051 11.8%
Other Sources 10 821 2.2% 639 0.8% 11 460 2.0%Total 488 020 100.0% 78 391 100.0% 566 411 100.0%
Source: National Center for Higher Education Management Systems Finance Data Set National Center for Education Statistics, IPEDS Finance Survey
Expenditures per full-time equivalent student
105. Education and general expenditures44 per full-time equivalent student in 2000-01 averaged USD 13 568 at the public universities and USD 9 010 at two-year institutions. As might be expected
44 Education and general expenditures include the institutions’ expenditures for core instruction, research, and service
missions and do not include auxiliary enterprises (e.g., food service, bookstores, or dormitories) or capital
expenditures.
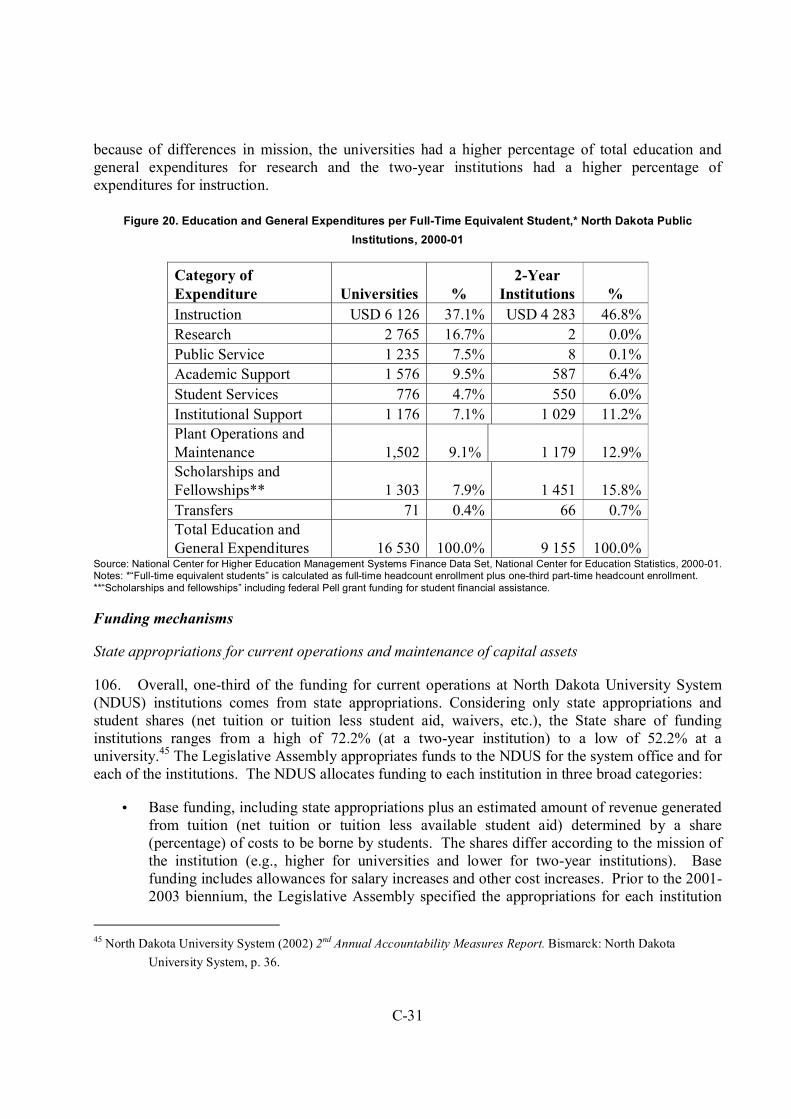
C-31
because of differences in mission, the universities had a higher percentage of total education and general expenditures for research and the two-year institutions had a higher percentage of expenditures for instruction.
Figure 20. Education and General Expenditures per Full-Time Equivalent Student,* North Dakota Public
Institutions, 2000-01
Category of Expenditure Universities %
2-Year Institutions %
Instruction USD 6 126 37.1% USD 4 283 46.8%
Research 2 765 16.7% 2 0.0%
Public Service 1 235 7.5% 8 0.1%
Academic Support 1 576 9.5% 587 6.4%
Student Services 776 4.7% 550 6.0%
Institutional Support 1 176 7.1% 1 029 11.2%
Plant Operations and Maintenance 1,502 9.1% 1 179 12.9%Scholarships and Fellowships** 1 303 7.9% 1 451 15.8%
Transfers 71 0.4% 66 0.7%Total Education and General Expenditures 16 530 100.0% 9 155 100.0%
Source: National Center for Higher Education Management Systems Finance Data Set, National Center for Education Statistics, 2000-01. Notes: *“Full-time equivalent students” is calculated as full-time headcount enrollment plus one-third part-time headcount enrollment. **“Scholarships and fellowships” including federal Pell grant funding for student financial assistance.
Funding mechanisms
State appropriations for current operations and maintenance of capital assets
106. Overall, one-third of the funding for current operations at North Dakota University System (NDUS) institutions comes from state appropriations. Considering only state appropriations and student shares (net tuition or tuition less student aid, waivers, etc.), the State share of funding institutions ranges from a high of 72.2% (at a two-year institution) to a low of 52.2% at a university.45 The Legislative Assembly appropriates funds to the NDUS for the system office and for each of the institutions. The NDUS allocates funding to each institution in three broad categories:
• Base funding, including state appropriations plus an estimated amount of revenue generated from tuition (net tuition or tuition less available student aid) determined by a share (percentage) of costs to be borne by students. The shares differ according to the mission of the institution (e.g., higher for universities and lower for two-year institutions). Base funding includes allowances for salary increases and other cost increases. Prior to the 2001-2003 biennium, the Legislative Assembly specified the appropriations for each institution
45 North Dakota University System (2002) 2nd Annual Accountability Measures Report. Bismarck: North Dakota
University System, p. 36.
32 HEFCE-OECD/IMHE 2004 – National Report – United States
by line-item. Beginning in the 2001-2003 biennium, appropriations are made in a block grant to each institution through the Board of Higher Education. Institutions are authorized to carry over unexpended appropriations from year-to-year; they are also authorized to retain tuition revenue, including revenue generated in excess of the shares used in the budget process.
• Benchmark funding, an amount determined to be necessary according to the NDUS long-term finance plan to move each institution’s funding (state appropriations and net tuition per full-time equivalent student (FTE)) closer to funding per FTE at “benchmark” institutions.
• Incentive funding to institutions for specific initiatives linked to the objectives in the report of the Roundtable for the North Dakota Legislative Council Interim Committee on Higher Education, A North Dakota University System for the 21st Century.
• Capital asset funding, an appropriation for maintenance of assets, excluding major capital projects.
• Special legislative initiatives. For example, in 2001-2003, the Legislative Assembly provided funding for a technology funding pool from the general fund to be allocated by the State Board of Higher Education.
Capital funding
107. Capital projects at institutions within the North Dakota University System are typically funded through bonded indebtedness. The Legislative Assembly authorizes two different kinds of debt for capital projects:
• Projects for the core education, research, and service missions of institutions. The Legislative Assembly authorizes the North Dakota Building Commission to finance these projects through the issuance of state general obligation bonds and other available funds.
• Projects for self-supporting purposes, such as residence and dining halls (auxiliary enterprises). The Legislative Assembly authorizes the State Board of Higher Education to issue self-liquidating, tax-exempt bonds. These are not state general obligation bonds and debt service is financed through revenue generated by the relevant function (e.g., student fees for use of facilities).
Institutional governance and management
108. As indicated above, the Board of Higher Education is the governing body for all the institutions within the North Dakota University System. The chancellor is the chief executive officer of the System. The president, the chief executive officer of each institution, is appointed by and serves at the pleasure of the State Board of Higher Education. The institutional president is accountable to the State Board of Higher Education through the Chancellor for the financial management of his or her institution. No institutional-level governing body exists between each institution and the chancellor and the State Board of Higher Education.
109. The North Dakota Board of Higher Education Policy Manual defines the responsibilities of the board, chancellor, and presidents for financial affairs. The section on budget management and control defines the responsibilities of the institutional presidents:
C-33
a. Allocate institution resources in a manner consistent with expected Board outcomes and pertinent laws, rules, policies, and governing accounting policies and procedures, and, within limits established by this policy, reallocate resources within the institution. Annual budgets are approved at the institutional level, not functional or departmental level. Institutions may make budget revisions if the revisions are adequately documented and the president or other institution officer who is delegated that authority has approved the revisions. Institutions may spend income collected from non-general fund and non-tuition income sources provided the president or other institution officer who is delegated that authority has approved the expenditures;
b. Ensure that the Board’s budget guidelines for a given fiscal year are incorporated into the institution budget and are carried out operationally;
c. Be accountable for all funds, property, equipment, and other facilities assigned or provided to the institution to ensure that all are used consistent with laws, policies, or other specific requirements;
d. Periodically report budget and other fiscal status to the Board, consistent with the format and intervals as established by the Board, to alert the Board to significant budget and fiscal variances;
e. Adequately plan and make necessary budget or spending adjustments to avoid unusual deficit fund balances at fiscal year end;
f. Ensure that monitoring procedures are in place to ensure that the campus operates within the annual budget as approved, except as otherwise permitted by this policy; and
g. Ensure that all institution officers and employees act in a manner that is consistent with established university system priorities.46
Asset ownership, management and reporting
110. All assets of the North Dakota University System are owned and managed by the North Dakota Board of Higher Education. Reporting mechanisms are summarized earlier in this paper.
Staff employment
111. All staff of the North Dakota University System are employed according to policies established by the Board of Higher Education.47 The Board delegates substantial responsibility to the institutional presidents for human resource management at the institutional level. The presidents have authority to “Approve all personnel actions, except the award or change in tenure status, involving all faculty members and other institution employees”.48
46 North Dakota University System, North Dakota Board of Higher Education Policy Manual, sec. 802.6, Budget
Management and Control.
47 North Dakota University System, North Dakota Board of Higher Education Human Resource Policy Manual.
48 North Dakota University System, North Dakota Board of Higher Education Policy Manual, section 305.1.
34 HEFCE-OECD/IMHE 2004 – National Report – United States
Current policy context
Higher education reform
Reform background
112. Over the past decade, the relationship between the legislature and executive branches of State government, the private sector, and the University System has changed in fundamental ways. This relationship grew out of the recommendations from the 1999-2000 Roundtable on Higher Education.49
113. The 1999 North Dakota Legislative Assembly passed a resolution directing a study be conducted which would:
…address the expectations of the North Dakota University System in meeting the state’s needs in the twenty-first century, the funding methodology needed to meet these expectations and needs, and an accountability system and reporting methodology for the University System.
114. An interim committee on higher education was formed to conduct the study. This group of 21 legislators was augmented by an additional 40 leaders from government, education, and the private sector to form the Roundtable.
115. This group reviewed trends specific to North Dakota–trends that at the very least are disquieting. They looked into the future and saw a state that, in the absence of overt action, would continue to:
• Lose population, especially young people and adults in the prime working years of their lives.
• Fall farther and farther behind the rest of the country in per capita income, threatening the ability of its citizens to maintain their quality of life.
• Be unable as a state to compete in the new information-based economy.
116. These leaders refused to accept this view of the future of their state as inevitable. They are firm in their belief that North Dakota and its citizens deserve better. They quickly came to a consensus that bold steps were needed to change the downward trajectory of the state – steps that must be pursued with the utmost urgency. There was also agreement that the longer the current trends continue, the more difficult it will be to reverse them. Out of this consensus arose the Roundtable’s expectations for the North Dakota University System – that the NDUS would focus its considerable assets and talents on:
• Promoting the expansion and diversification of the state’s economy, and;
49 North Dakota University System (2002). 2nd Accountability Measure Report. Bismarck: North Dakota University
System, December 2002, p. i.
C-35
• Enhancing the quality of life of the citizens of the state.
117. Their broad expectation is that the NDUS (as a system, not as a collection of campuses) become the prototype land-grant institution of the twenty-first century, and that it be:
• Academically competitive, nationally and internationally.
• Engaged at every level with the needs and problems of the state and its citizens.
• Accessible and responsive to all citizens of the state, both individual and corporate.
118. The Roundtable called for a new form of relationship between the NDUS and the state, a relationship based on trust and common purpose. The basis of this new relationship was stated by the Roundtable as “flexibility with accountability”: the NDUS must have freedom of action to pursue the agreed-upon agenda, but it must also be accountable for both resources used and results obtained. In return for these new-found freedoms, the NDUS had to be able to demonstrate accountability for performance.
Overall goal and six “cornerstones”
119. The Roundtable defined an overall goal and six “cornerstones” and accountability measures related to each.
• Goal: To enhance the economic vitality of North Dakota and the quality of life of its citizens through a high quality, more responsive, equitable, flexible, accessible entrepreneurial, and accountable University System.
• The Cornerstones around which specific actions and related accountability measures were developed included:
− Economic Development Connection
− Education Excellence
− Flexible and Responsive System
− Accessible System
− Funding and Rewards
− Sustaining the Vision
120. In July 2000, the State Board of Higher Education adopted the Roundtable’s expectations and recommendations and moved aggressively toward implementation. Actions included:
• Developing a Long-Term Finance Plan and Resource Allocation Model50
• Changing Board policies and procedures to decentralize management responsibility to the institutions
50 See North Dakota Board of Higher Education (2002) Strategic Plan, “Long-Range Finance Plan,”, p. 17-21.
36 HEFCE-OECD/IMHE 2004 – National Report – United States
Senate Bill 2003
121. The 2001 Legislative Assembly acted on many of the Roundtable recommendations in Senate Bill 2003, granting the University System “flexibility with accountability,” including among other points51:
• Reduced significantly the number of line items in the state appropriation to the NDUS System and to the institutions. Instead of appropriating funds for separate line items of salaries and wages, operating expenses, and equipment, the Legislature appropriated a single amount for “operations,” delegated responsibility to the State Board of Higher Education for establishing salaries and wages, and provided additional flexibility at both the System and institutional levels for managing state appropriations.
• Increased the flexibility of the State Board of Higher Education and the institutions in the management of non-state resources.
• Provided for carry-over of unexpended state appropriations from one biennium to the next and authorized institutions to retain tuition revenues.
• Provided additional flexibility on personnel position controls and other State procedural requirements.
• Changed the requirements for preparation of budget for the NDUS to include block grants for the base funding component and for an initiative funding component for specific strategies or initiatives.
• Defined by legislative intent the accountability measures to be used by the State Board of Higher Education in 5 categories:
− Education excellence
− Economic development
− Student access
− Student affordability
− Financial operations
122. Based on these legislatively mandated accountability measures, the State Board of Higher Education developed an Annual Accountability Measures Report, the second edition of which was published in December 2002.52
51 State of North Dakota, 57th Legislative Assembly, Senate Bill No. 2003, Chapter 28.
52 North Dakota State Board of Higher Education (2002). 2nd Annual Accountability Measures Report, November 2002.
http://www.ndus.nodak.edu/reports/details.asp?id=465
C-37
Description of policy instruments
123. The principal policy instruments relevant to institutional management include the report of the Roundtable and the NDUS Strategic Plan and the link of both financing policy and accountability to the goals of the Strategic Plan. These are summarized below.
Roundtable report and strategic plan
124. As described in the previous section, the Roundtable emphasized the link between the strength of the North Dakota University System and a “bright future” for the State of North Dakota. The State Board of Higher Education adopted the Roundtable’s expectations and recommendations and moved aggressively toward implementation. Prior to the Roundtable, the State Board of Higher Education had a Strategic Plan for the period of 1998-2004. The State Board concluded that all the major components of the previous plan could be incorporated in the six cornerstones as enunciated in the Roundtable Report. Nevertheless, the emphasis of the Roundtable Report was fundamentally different. In essence, the report shifted from an internal focus on the NDUS and the institutions toward an external focus on the future of North Dakota. The State Board, therefore, adopted new statements of Vision and Mission as follows:
• Vision: The North Dakota University System is the vital link to a brighter future.
− A brighter future for:
− Our students
− The citizens of North Dakota
− All those we serve
− A brighter future through:
− A University System where students have the opportunity to receive the education necessary to be professionally and personally successful
− High quality, innovative learning opportunities tailored to the needs of students and other clients and readily accessible to all learners in the state
− The creation of strategic alliances with economic entities in the state and being a major player and primary engine in impacting the economic and demographic trends
− A University System which is a solid investment for the state and is seen as such by its citizens
• Mission: To enhance the quality of life for all those we serve and the economic and social vitality of North Dakota through the discovery, sharing, and application of knowledge.53
53 North Dakota State Board of Higher Education, Strategic Plan, November 2002, p. 4.
38 HEFCE-OECD/IMHE 2004 – National Report – United States
Long-term finance plan linked to the strategic plan
Principles
125. To support the long-range goals of the Roundtable Report as elaborated in the Strategic Plan, the State Board of Higher Education (SBHE) adopted a Long-Term Finance Plan and Resource Allocation Model based on the following principles54:
• Funding for higher education should be a shared responsibility of the state (through state general fund appropriations), students (through tuition), and campuses (through efficiency and generating other revenues).
• Campuses should be encouraged to generate additional revenues.
• Campuses should be encouraged to diversify their revenue sources.
• Campuses, faculty, and staff should be rewarded and recognized for behavior consistent with the Roundtable principles (i.e. flexible, responsive, entrepreneurial, accountable, and collaborative).
• Campuses should be given the flexibility to set price; however, the SBHE should continue to be accountable for maintaining affordability for North Dakota citizens. The board would continue to approve a base tuition rate for each campus, with campuses given increased flexibility to charge additional tuition for targeted courses/programs (e.g. high demand, high cost, etc.) and discounting policies.
• Campuses should retain their current state general fund appropriations as base operating funds and biennial appropriations should be provided to address parity or inflationary operating cost increases (i.e., cost-to-continue salary increases from the previous biennium, operating and utility inflation, and new compensation and benefits adjustments) to this base.
• Equity differentials, based on peer comparators, should be regularly addressed in appropriations based on agreed-upon targets (i.e., benchmark, state/student share, phased approach to reaching benchmarks) and outlined in the finance plan.
• The state should invest in activities that support statewide priorities through separate initiative appropriations to the SBHE. Funds should be allocated from the board initiative appropriation to encourage and reward collaboration between campuses.
• Campuses should be held accountable for the outcomes of the goals and objectives outlined in their campus strategic plans and Roundtable campus alignment plans.
• The campuses’ unique missions should be recognized in establishing base operating funding, and adequate funds should be provided to maintain institutional capacity to achieve their missions.
• Campuses should be given the flexibility to allocate resources consistent with the priorities established in their campus strategic plans.
54 North Dakota State Board of Higher Education, Strategic Plan, p. 17.
C-39
• The SBHE should request and the legislature should provide dedicated appropriations for the maintenance and replacement of state assets (facilities and infrastructure).
126. Following from the principles, the State Board’s budget request for the 2003-2005 biennium included three components:
• Base operating budget
• Capital asset funding
• Special initiative funding to support state priorities (2 percent of the total North Dakota University System state general fund appropriation, phased-in over six years)
Financing policy and institutional viability
127. The North Dakota financing policy addresses the issue of institutional financial viability primarily through the means of “equity” funding. As indicated in the principles summarized above, the long-term financing plan calls for the state to appropriate funds for equity differentials, based on peer comparators and agreed-upon targets (i.e., benchmark, state/student share, phased approach to reaching benchmarks). In a methodology similar to that employed in Kentucky, North Dakota identified peer institutions in other states for each of the institutions, identified the differential funding levels, and then established benchmarks for funding per student to be achieved over a multi-year period. The long-term plan establishes a goal of moving all institutions currently below 85% of their peer benchmarks to 8% within six years, and then moving all institutions below 95% of their peer benchmarks to 9% within 12 years. Progress toward this goal is monitored in the annual accountability process (see section below).
128. North Dakota has several comparatively small institutions located in rural communities. The costs per student at these institutions are higher because of their size and locations. The state has debated from time to time closing one or more of these institutions, but, after extensive debate, the voters defeated a Constitutional amendment in 1998 that would have removed the institutions from the State Constitution and potentially opened the way for institutional closures. A broad consensus was reached through the Roundtable and other forums that the institutions were critical to the future of the small communities in which they were located and to the future economy and quality of life of the state as a whole. Prior to the benchmark funding process, it was difficult to make the case that the small institutions required a higher level of funding per student than the larger universities. However, once peers of a similar size and program structure were established, the case could be made for equity differential funding for these institutions to bring them closer to their peer benchmarks.
129. As in the case of Kentucky, North Dakota employs special initiative funding to leverage the use of the core institutional capacity in a manner consistent with state priorities.
Accountability measures
Accountability reports
130. The State Board of Higher Education adopted 37 performance and fiscal accountability measures including those mandated by the Legislature in Senate Bill 2003 and additional measures
40 HEFCE-OECD/IMHE 2004 – National Report – United States
developed by the State Board (see Appendix E for full list of measures). The State Board uses several of these measures to monitor the status of the Long-Term Finance Plan and the financial conditions of the system and individual institutions. A summary of these measures is as follows55:
• How well are NDUS campuses funded compared to the Long-Term Finance Plan? Measure: Higher education financing–a status report on higher education financing as compared to the Long-Term Finance Plan. This measure is intended to demonstrate progress toward achieving the funding goals of the Long-Term Finance Plan, including the following components:
− Operating fund benchmark per full-time equivalent (FTE) student. An operating fund benchmark per FTE student, comprised of state appropriations and net tuition revenues, was established for each NDUS campus, based on a selected group of peer institutions.
− State/student share targets. Recognizing that there is a shared funding responsibility among higher education stakeholders, state/student share target ratios were established for each type of NDUS campus.
− Capital asset funding targets. The capital asset funding model calls for funding all campuses at 100% of a building and infrastructure formula established by the North Dakota Office of Management and Budget (OMB), phased in over 10 years, plus 100 percent funding of outstanding deferred maintenance, phased in over 14 years.
• How well does North Dakota fund NDUS campuses, compared to peer institutions? Measure: State general fund appropriation levels for the NDUS institutions compared to peer institutions’ general fund appropriation levels. Over time, this measure is intended to demonstrate progress toward achieving the Long-Term Finance Plan goal of moving all institutions currently below 85% of their peer benchmarks to 85% within six years, and then moving all institutions below 95% of their peer benchmarks to 95% within 12 years.
• How was incentive funding used in relationship to the objectives identified in the Roundtable Report? Measure: Incentive funding, including the allocation and use of incentive funding. This measure reports on the allocation and use of the Board Initiative Block Grant, an appropriation to the State Board to carry out objectives identified in the Roundtable Report.
• How do trends in state general fund appropriations compare to trends in the state’s economy? Measure: State general fund appropriation levels and trends as compared to changes in the state’s economy and total state general fund appropriations. To compare state general fund appropriations with changes in the state’s economy, changes in personal income and gross state product are used as state economic indicators.
• To what extent do North Dakota taxpayers provide financial support for NDUS students? Measure: Per capita general fund appropriations for higher education. This measure is intended to demonstrate whether the state, on an individual per capita basis, is providing an increasing or decreasing amount of funding for higher education over time.
55North Dakota State Board of Higher Education, 2nd Annual Accountability Measures Report, December 2002, pp. 33-
51.
C-41
• What proportion of the per-student cost is covered by general fund appropriations? Measure: Cost per student in terms of general fund appropriations and total NDUS funding. This measure represents whether the NDUS’s annual state general fund and total fund revenues on a per-student basis are increasing or decreasing. The measure also indicates whether the state is contributing a larger or smaller proportion of the total cost over time.
• How much does the NDUS spend annually per student? Measure: Administrative, instructional and other costs per student. This measure represents changes in total costs per full-time equivalent (FTE) student by category of expense. These categories and their components are:
− Core services: instruction, research, and public service
− Support services and student aid: academic support, student services, and scholarships and fellowships
− Administration and physical plant: institutional support and operations and maintenance of the physical plant
• What proportion of higher education resources are dedicated to its core services? Measure: Percentage of total University System funding used for instruction, research, and public service. This measure represents whether resources used to support core services are consuming an increasing or decreasing share of total institutional resources. Core services include expenses for instruction, research, and public service; these costs are linked directly to the core mission of the campuses.
• What proportion of higher education resources are dedicated to support services and aid to students? Measure: Percentage of total NDUS funding used for academic support, student services, and scholarships and fellowships. This measure represents whether resources used for support services and aid to students are consuming an increasing or decreasing share of total institutional resources. “Support services” includes academic support and student services which also support the mission of the institution. Aid to students includes scholarships and fellowships.
• What proportion of higher education resources are dedicated to general support services? Measure: Percentage of total NDUS funding used for institutional support and operations and maintenance of physical plant. This measure represents whether resources used for general support expenses are consuming an increasing or decreasing share of total institutional resources. The category of general support services includes institutional support and operations and maintenance of the physical plant. Institutional support is made up of the administrative units at the eleven campuses and includes, for example, the president’s office, the business office, and the budget and accounting offices. Physical plant includes all staffing and operating expenses related to the operation of the physical plant, such as custodians and utilities.
• What percent of NDUS revenues are self-generated? Measure: Ratio measuring the funding derived from operating and contributed income compared to total NDUS funding. This measure represents the portion of the University System’s overall funding that is self-generated, either internally from fees for services or externally from contributions. The total includes revenue sources that are restricted in use by the donor, grant, or other source.
42 HEFCE-OECD/IMHE 2004 – National Report – United States
• Is the NDUS able to cover its debts? Measure: Ratio measuring the amount of expendable net assets as compared to the amount of long-term debt. This ratio measures one of the basic factors of financial health — the availability of expendable net assets to cover debt should the NDUS need to settle its obligations at the end of the fiscal year.
• Is the NDUS able to fund outstanding deferred maintenance needs? Measure: Ratio measuring the size of the NDUS’s outstanding maintenance as compared to its expendable net assets. This ratio shows whether the NDUS has sufficient expendable net assets to fund outstanding deferred maintenance needs from its own capital from operations.
• Are major capital projects completed within budget? Measure: Report on new construction and major renovation capital projects for which specific appropriations are made, including budget-to-actual comparison, use of third-party funding, and related debt.
131. The State Board monitors performance at both the system and institutional levels. As suggested in the brief descriptions summarized above, several of the measures apply to the system as a whole. An accountability report is prepared for each institution on the measures that can be applied campus-by-campus.
Monitoring fiscal health
132. In addition to following performance with the measures summarized above, the Budget and Finance Committee of the State Board of Higher Education is responsible for monitoring the fiscal health of the NDUS as well as individual institutions. The individual institutions are required to report to the committee semi-annually if any one of the following conditions exists56:
• A variance (+/-) of USD 100 000 or 2% or more, whichever is greater, is expected between original and revised biennial tuition revenue estimates.
• A negative variance of 4% or more is expected between original and revised annual revenue estimates for total auxiliaries (student housing, food service, etc.).
• Campus anticipates an individual deficit fund balance of USD 50 000 or more (for smaller campuses) and USD 100 000 or more for the larger campuses that will be reportable at the fiscal year end.
• Campus does not anticipate meeting annual bond reserve requirements.
• Campus is a party to a legal action.
• A variance of 5% (+/-) in residence hall occupancy rates (Spring and Fall) over the previous year is expected and/or realized.
• Actual expenditures for specifically appropriated or Board approved capital projects are projected to exceed legislative or Board authorization, there is a change in funding sources for the project, or there is a major change in the scope of the project.
• Campus anticipates the need for a deficiency appropriation from the legislature.
56 North Dakota University System, Semi-Annual Budget Reporting to the SBHE Budget and Finance Committee for FY
03 – Period Ending December 31, 2002.

C-43
• Other events have a significant impact on campus revenues and expenses.
44 HEFCE-OECD/IMHE 2004 – National Report – United States
ANALYSIS AND CONCLUSION
Comparison of Kentucky and North Dakota
Differences
133. In addition to obvious differences of size, economy, and geography, Kentucky and North Dakota are structured in fundamentally different ways that have implications for financial management.
• Kentucky decentralizes institutional governance within the framework of statewide policy leadership and coordination. As a result, responsibility for institutional financial management is assigned to the governing boards of state-supported institutions, not to a statewide board or an agency of state government. The state-level entity, the Council on Postsecondary Education, does not routinely monitor the financial health/viability of individual institutions.
• North Dakota assigns responsibility for institutional governance to a single statewide board, the State Board of Higher Education and public higher education is organized within a single university system. Within this centralized system, the State Board of Higher Education delegates responsibility for day-to-day institutional financial management to the institutional presidents. In contrast to the state-level entity in Kentucky, the State Board of Higher Education does monitor the financial health/viability of each institution and the system as a whole.
Similarities
134. Despite these differences, there are a number of important similarities in their approaches to reform and higher education financing policy.
Shifts to a Public Agenda linking higher education to the future of the state and established means for public accountability for measurable progress toward goals
135. Both states changed the focus of state policy in the late 1990s from an earlier emphasis on funding institutions (creating and maintaining capacity) to an emphasis on funding higher education as a means to address critical state priorities (utilization of capacity). As underscored earlier in this report, maintaining and strengthening capacity remained a high priority, but funding “on the margin” was deliberately aimed at achieving a closer relationship between capacity and state priorities. Common characteristics included:
• Developing and building consensus around a Public Agenda. In Kentucky, the 1997 Task Force on Higher Education followed by the enactment of House Bill 1 (HB 1), the 1997 Postsecondary Education Reform Act, set forth long-term goals for the Commonwealth designed to raise per capita personal income in the State to a level at or above the national average. The Council on Postsecondary Education developed an Action Agenda under the theme “Better Lives” using the “five questions” to frame accountability for the system and
C-45
each institution. The report of the Roundtable in North Dakota was framed by serious concerns about the future of the State and the critical role that higher education must play in ensuring a “Bright Future.”
• Shaping state agendas through groups representing a cross section of states’ political, business, civic, and higher education leadership. The Kentucky Task Force on Higher Education was chaired by the Governor and included leaders from the executive and legislative branches and higher education leaders, as well as representatives of the State’s business and civic leadership. The HB 1 established the Council on Postsecondary Education and the Strategic Committee on Postsecondary Education (SCOPE) to ensure continuity of reform over a multi-year period across changes in political leadership. The North Dakota Roundtable involved not only important legislative leaders and the Governor but also a broad spectrum of key civic, business and higher education leaders. The State Board of Higher Education reconvenes the Roundtable each year to receive the accountability report and to review the status of reforms.
• Using long-term, measurable goals, indicators and benchmarks to monitor progress. Both states emphasize the use of information for public accountability.
• Establishing mechanisms to sustain attention to the Public Agenda. As indicated above, the CPE and SCOPE in Kentucky and the State Board of Higher Education and the Roundtable in North Dakota are charged with the responsibility to sustain reform.
Implementation of new funding methodologies linking funding to a public agenda
136. Both states implemented new funding models with similar components:
• Base funding adjusted by “equity”/benchmark funding aimed at ensuring adequacy of base funding defined through peer comparisons
• Special purpose/initiative funding to advance state priorities.
137. The Kentucky Strategic Investment funds are more complex than the North Dakota funding for the State Board of Higher Education initiatives, but the general intent to advance state priorities is the same. The basic framework for Kentucky’s financing policies (e.g., the Strategic Investment Funds) is defined by law while the North Dakota State Board of Higher Education shapes specific initiatives and includes these within the Annual Accountability Report.
138. Both states have plans or agreements on financial policy that spell out the relative priority of each component and how the components should relate to each other–provided that state budgetary support is available. The North Dakota State Board of Higher Education has incorporated the Long-Term Financing Plan within the Strategic Plan for the North Dakota University System. The “Points of Consensus” developed by SCOPE in Kentucky and agreed to by all major stakeholders, represented an understanding of priorities and how the components should relate to each other. Although the budget crisis in Kentucky has had an impact on this agreement, the basic framework remains intact.
46 HEFCE-OECD/IMHE 2004 – National Report – United States
Implementation of public accountability/reporting systems to monitor system and institutional performance
139. Both Kentucky and North Dakota have implemented public accountability systems. Reflecting the difference in authority and responsibility for institutional financial management, the North Dakota State Board of Higher Education monitors institutional financial health, whereas the Kentucky Council on Postsecondary Education does not. Instead, the Council emphasizes training of governing boards on their financial oversight responsibilities and holds the institutions accountable for accomplishing their missions and for their performance related to the CPE’s Action Agenda.
Long-term concerns/risks
140. The reforms in both states are in their early stages. Both are intended to bring about changes over a multi-year period. As reflected in accountability reports and other assessments, the states are making progress toward reform goals, but only time will tell if they will affect goals such as raising per capita income. The following are several of the concerns/risks.
Sustaining attention to both capacity maintenance and capacity utilization
141. Both states face a challenge of maintaining the balance between funding to maintain capacity and funding for capacity utilization in the public interest. The reports that led to the reforms, the 1997 Assessment in Kentucky and the North Dakota Roundtable Report, made a compelling case that a failure to change–that is, to simply continue business-as-usual–would put at risk in the long term not only the higher education system, but also the states’ quality of life and economy. Nevertheless, especially in periods of fiscal crisis such as both states are currently experiencing, the institutions will insist on support for (if not protection of) base funding at all costs, including if necessary abandoning funding for change. This means that institutions will lobby state leaders to abandon budgetary support for both “benchmark” funding to move institutions closer to their peers and special initiative funding for state priorities. Such efforts have already been attempted in Kentucky, but despite these pressures and severe fiscal constraints, the Governor and General Assembly agreed to a budget for the 2002-2004 biennium which retains the basic framework of reform.
142. While the budget process for the 2003-2005 biennium in North Dakota was still underway at the time this paper was written, it appears that the North Dakota Legislative Assembly will continue the basic commitments made in 2001 to support the Roundtable recommendations. The 2001 legislation, SB 2003, called for statements of legislative intent (e.g., regarding a “lump sum” appropriation to the State Board of Higher Education according to a limited number of budget lines, budget carry-over authority, etc.) to be enacted into statute in 2003. The current expectation is that this will not occur but that these provisions will be continued in effect for the next biennium through language of intent in the appropriations bill.
Monitoring and supporting effective institutional governance and financial management
143. As pointed out above, the North Dakota State Board of Higher Education has more direct responsibility for monitoring institutional viability and financial management than the Kentucky
C-47
Council on Postsecondary Education. In the likely protracted period of state budget constraints, institutions will face extraordinary fiscal pressures that could threaten their viability–and, thereby, their capacity to contribute to state priorities. Even more likely, institutional leaders may make short-term decisions to curb expenditures or raise revenues that are directly contrary to public priorities. Examples would be decisions to deny access to students from high priority target groups (e.g., low-income students) or to raise tuition and fees without offsetting student financial aid. Under these circumstances, an argument could be made that the Kentucky Council on Postsecondary Education (CPE) should add to its monitoring process indicators related to system and institutional financial health similar to those used in North Dakota (see North Dakota case). The risk of such a move would be that it would draw the CPE directly into institutional governance and a conflict with the statutory authority and responsibility of the institutional governing boards. It could also draw the CPE away from its primary mission of leading the Strategic Agenda and sustaining the momentum of reform.
Conclusion
144. The purpose of this paper was to describe and analyze the role of governments in the U.S. in ensuring higher education institutional viability and enhancing the effectiveness of institutional financial governance and management. Because of the complexity of the variations among the states, it was decided to focus on two states--Kentucky and North Dakota--as case studies of the state/institutional relationship. These states are somewhat typical of two kinds of state/institutional relationship in the U.S. About half the states have “coordinating board” structures similar to Kentucky with decentralized institutional governance coordinated by a policy board. The other states govern most, if not all, of their public institutions through one or more centralized boards such as the North Dakota State Board of Higher Education. In both types of states, maintaining institutional financial viability (basic institutional capacity) is important–not as an end in itself, but as a means to achieve public purposes. The trend, as illustrated by Kentucky and North Dakota, is for states to provide institutions with a base level of support and then to rely upon institutional governing boards to assume responsibility for institutional financial management and ensuring institutional viability. At the same time, states are increasingly shaping public agendas emphasizing the role of higher education in serving public purposes and are using funding “on the margin” (strategic investment, initiative or other special purpose funding) to leverage the utilization of institutional capacity to serve these purposes.
48 HEFCE-OECD/IMHE 2004 – National Report – United States
SELECTED REFERENCES
Berdahl, R.O. (1971). Statewide Coordination of Higher Education. Washington, D.C.: American Council on Education.
Burke, J.C. and Minassians, H. (2002). Performance Reporting: The Preferred “No Cost” Accountability Program. Sixth Annual Report. Albany, N.Y.: The Nelson A. Rockefeller Institute of Government.
Callan, P.M. and Finney, J.E. (1997). Public and Private Financing of Higher Education: Shaping Public Policy for the Future. Washington, D.C.: American Council on Education, Oryx Press.
Center for Study of Higher Education Policy (2003). Grapevine: A National Database of State Tax Support for Higher Education. Normal, Illinois: Illinois State University. http://www.coe.ilstu.edu/grapevine/Welcome.htm
Commonwealth of Kentucky, Council on Postsecondary Education (2000). Kentucky Postsecondary Education Funding History: 1980-2002. Frankfort: Council on Postsecondary Education. http://www.cpe.state.ky.us/keyind/www/index/index.asp
Commonwealth of Kentucky, Council on Postsecondary Education (2003). 2020 Vision: An Agenda for Kentucky’s System of Postsecondary Education. Frankfort: Council on Postsecondary Education.
Commonwealth of Kentucky, Legislative Research Commission, Task Force on Postsecondary Education (1997). Kentucky Postsecondary Education: An Assessment. Frankfort: Legislative Research Commission.
Education Commission of the States (ECS) (1990). The Preservation of Excellence in American Higher Education: The Essential Role of Private Colleges and Universities. Report of the ECS Task Force on State Policy and Independent Higher Education. John Ashcroft and Clark Kerr, chairmen. Denver, Colorado: ECS.
Education Commission of the States (2002). State Postsecondary Education Structures Database. Denver: ECS. http://www.ecs.org/clearinghouse/31/02/3102.htm
Kerr, C. and Gade, M. (1989). The Guardians: Boards of Trustees of American Colleges and Universities: What They Do and How Well They Do It. Washington, D.C.: Association of Governing Boards of Universities and Colleges.
Jones D.P. (2003). “Financing in Sync: Aligning Fiscal Policy with State Objectives.” Paper Prepared for Western Interstate Commission for Higher Education. Boulder: WICHE. http://www.wiche.edu
C-49
Jones, D.P. (1984). Higher-Education Budgeting At the State Level: Concepts and Principles. Boulder: National Center for Higher Education Management Systems http://www.nchems.org
Jones, D.P. (2003). “State Shortfalls Projected Throughout the Decade: Higher Education Budgets Likely to Feel Continued Squeeze.” Policy Alert. San Jose: National Center for Public Policy and Higher Education, February 2003. http://www.highereducation.org
Lamb, J.A. (1986). An Analysis of the Structure of 1985 State Budget Formulas for Public Higher Education with a Comparison of 1973, 1979, and 1985 Data. Doctoral dissertation, The University of Tennessee, 1986. Ann Arbor: University Microfilms International.
McGuinness, A.C. Jr. (2002). An Assessment of Postsecondary Education Reform in Kentucky. Lexington: Prichard Committee for Academic Excellence. http:www.prichardcommittee.org
McGuinness, A. C. Jr. (2002). “Models of Postsecondary Coordination and Governance in the States,” “Reflections on Recent Postsecondary Governance Changes,” “State Policy and Postsecondary Education,” “Governance and Coordination: Distinction and Definitions.” Education Commission of the States. http://www.ecs.org/clearinghouse/31/02/3102.htm
National Center for Public Policy and Higher Education (2002). Measuring Up 2002: The State-By-State Report Card for Higher Education. San Jose: NCPPHE. http://www.highereducation.org
National Governors Association Center for Best practices (2001). Postsecondary Education Reform in Kentucky. Issue Brief. Washington, D.C.: NGA.http://www.nga.org/center/divisions/1,1188,T_CEN_EDS^C_ISSUE_BRIEF^D_2566,00.html
National Information Center for Higher Education Policymaking and Analysis. http://www.higheredinfo.org
Newman, F. (1987). Choosing Quality: Reducing Conflict Between the State and the University. Denver: Education Commission of the States.
North Dakota Legislative Council Interim Committee on Higher Education (2000). A North Dakota University System for the 21st Century. The Report of the Roundtable on Higher Education. Bismarck: State Board of Higher Education. http://www.ndus.nodak.edu/
North Dakota State Board of Higher Education (1997). Partners for Progress: The Next Steps. A Bush Foundation Study. Bismarck: North Dakota State Board of Higher Education.
North Dakota State Board of Higher Education (2002). Strategic Plan: Creating a University System for the 21st Century. Bismarck: State Board of Higher Education. http://www.ndus.nodak.edu/
North Dakota State Board of Higher Education (2002). 2nd Accountability Report: Creating a University System for the 21st Century. Bismarck: State Board of Higher Education. http://www.ndus.nodak.edu/
50 HEFCE-OECD/IMHE 2004 – National Report – United States
Richardson, R.C., Bracco, K.R., Callan, P.M. and Finney, J.E. (1999). Designing State Higher Education Systems for a New Century. Washington, D.C. American Council on Education, Oryx Press.
C-51
APPENDICES
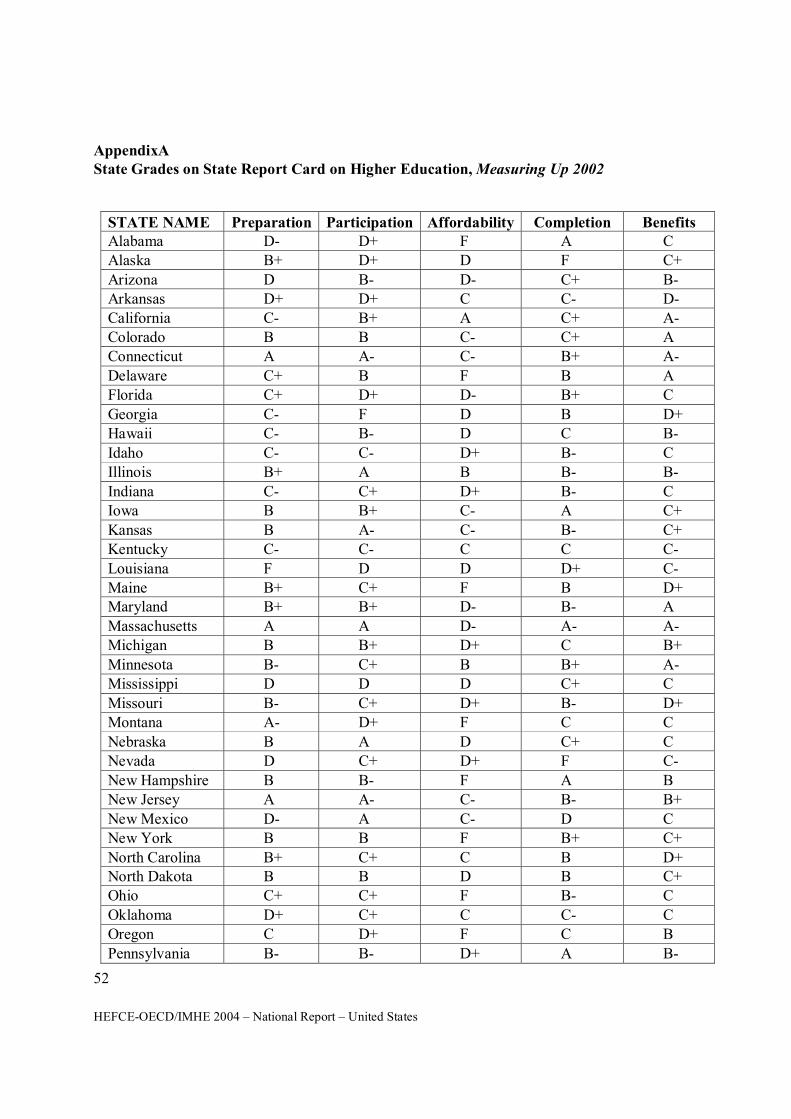
52 HEFCE-OECD/IMHE 2004 – National Report – United States
AppendixA State Grades on State Report Card on Higher Education, Measuring Up 2002
STATE NAME Preparation Participation Affordability Completion Benefits Alabama D- D+ F A C Alaska B+ D+ D F C+
Arizona D B- D- C+ B- Arkansas D+ D+ C C- D- California C- B+ A C+ A- Colorado B B C- C+ A Connecticut A A- C- B+ A-
Delaware C+ B F B A Florida C+ D+ D- B+ C
Georgia C- F D B D+ Hawaii C- B- D C B-
Idaho C- C- D+ B- C Illinois B+ A B B- B-
Indiana C- C+ D+ B- C Iowa B B+ C- A C+
Kansas B A- C- B- C+ Kentucky C- C- C C C-
Louisiana F D D D+ C- Maine B+ C+ F B D+ Maryland B+ B+ D- B- A
Massachusetts A A D- A- A- Michigan B B+ D+ C B+
Minnesota B- C+ B B+ A- Mississippi D D D C+ C
Missouri B- C+ D+ B- D+ Montana A- D+ F C C
Nebraska B A D C+ C Nevada D C+ D+ F C-
New Hampshire B B- F A B New Jersey A A- C- B- B+
New Mexico D- A C- D C New York B B F B+ C+
North Carolina B+ C+ C B D+ North Dakota B B D B C+ Ohio C+ C+ F B- C
Oklahoma D+ C+ C C- C Oregon C D+ F C B
Pennsylvania B- B- D+ A B-
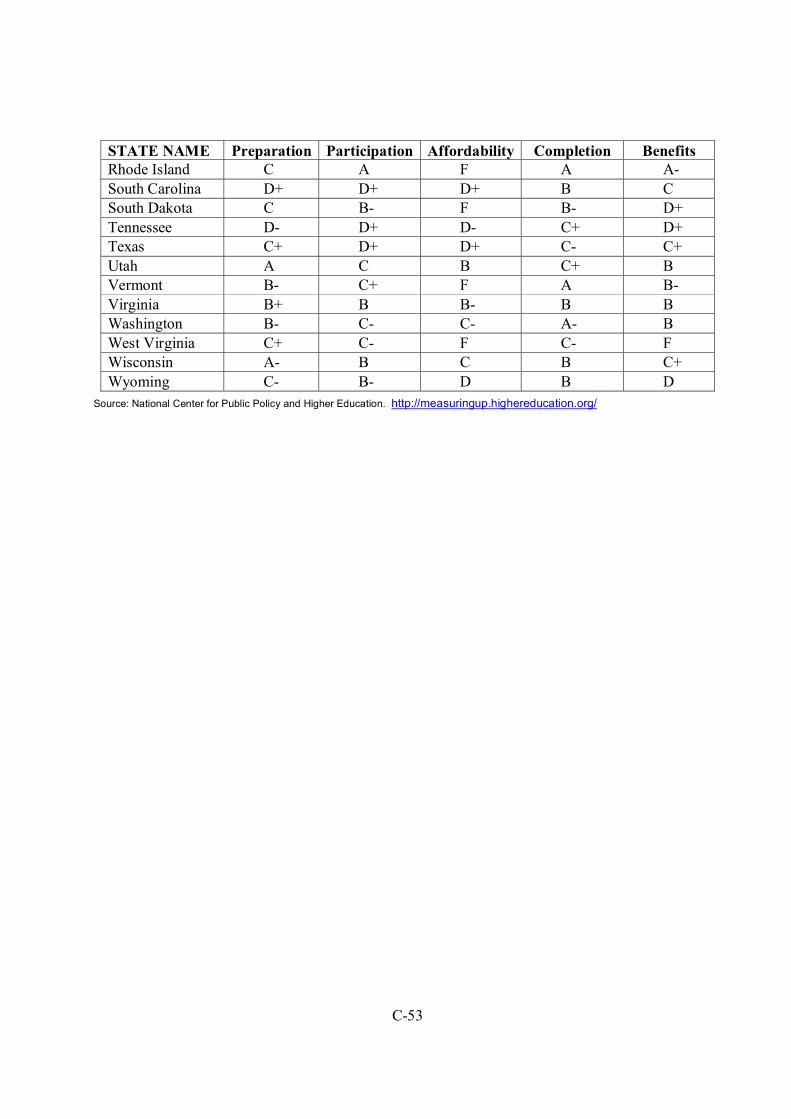
C-53
STATE NAME Preparation Participation Affordability Completion Benefits Rhode Island C A F A A-
South Carolina D+ D+ D+ B C South Dakota C B- F B- D+
Tennessee D- D+ D- C+ D+ Texas C+ D+ D+ C- C+
Utah A C B C+ B Vermont B- C+ F A B-
Virginia B+ B B- B B Washington B- C- C- A- B
West Virginia C+ C- F C- F Wisconsin A- B C B C+
Wyoming C- B- D B D
Source: National Center for Public Policy and Higher Education. http://measuringup.highereducation.org/

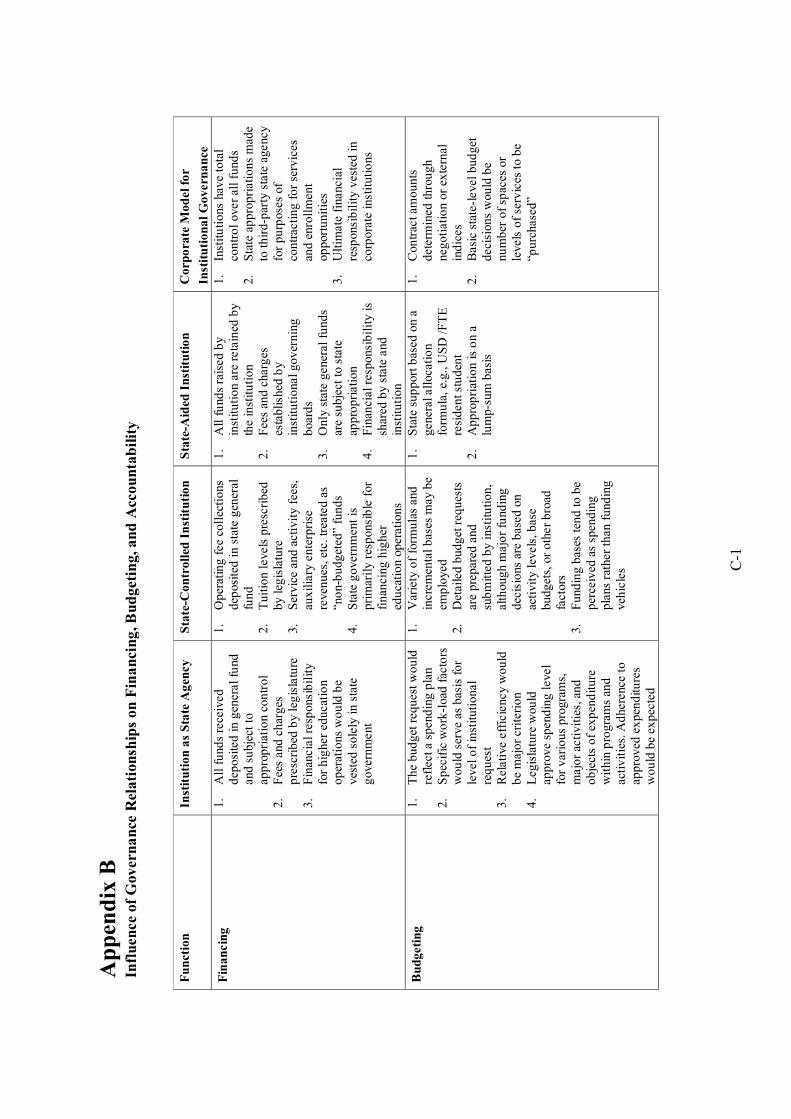
C-1
Ap
pen
dix
B
Infl
uen
ce o
f G
over
na
nce
Rel
ati
onsh
ips
on
Fin
an
cin
g, B
ud
get
ing
, an
d A
cco
un
tab
ilit
y
Fu
nct
ion
In
stit
uti
on
as
Sta
te A
gen
cy
Sta
te-C
on
tro
lled
In
stit
uti
on
S
tate
-Aid
ed I
nst
itu
tio
n
Co
rpo
rate
Mo
del
fo
r
Inst
itu
tio
na
l G
ov
ern
an
ce
Fin
an
cin
g
1.
All
fu
nds
rece
ived
d
epo
site
d i
n g
ener
al f
und
an
d s
ub
ject
to
ap
pro
pri
atio
n co
ntr
ol
2.
Fee
s an
d c
har
ges
p
resc
rib
ed b
y le
gis
latu
re
3.
Fin
anci
al r
esp
onsi
bil
ity
for
hig
her
edu
cati
on
op
erat
ions
wo
uld
be
ves
ted
so
lely
in
sta
te
gov
ern
men
t
1.
Op
erat
ing
fee
co
llec
tio
ns
dep
osit
ed i
n s
tate
gen
eral
fu
nd
2
. T
uit
ion
lev
els
pre
scri
bed
b
y le
gis
latu
re
3.
Ser
vic
e an
d a
ctiv
ity
fee
s,
aux
ilia
ry e
nte
rpri
se
reve
nu
es, e
tc.
trea
ted
as
“no
n-b
ud
get
ed”
fun
ds
4.
Sta
te g
ove
rnm
ent
is
pri
mar
ily
resp
onsi
ble
for
fi
nan
cing
hig
her
ed
uca
tio
n op
erat
ion
s
1.
All
fu
nds
rais
ed b
y in
stit
uti
on
are
reta
ined
by
the
inst
itu
tio
n 2
. F
ees
and
cha
rges
es
tab
lish
ed b
y in
stit
uti
ona
l g
ov
ern
ing
b
oard
s 3
. O
nly
sta
te g
ener
al f
un
ds
are
sub
ject
to
stat
e ap
pro
pri
atio
n 4
. F
inan
cial
res
pon
sib
ilit
y i
s sh
ared
by
stat
e an
d
inst
itu
tio
n
1.
Inst
itu
tio
ns h
ave
tota
l co
ntr
ol
over
all
fu
nds
2.
Sta
te a
pp
rop
riat
ion
s m
ade
to t
hir
d-p
arty
sta
te a
gen
cy
for
pu
rpos
es o
f co
ntr
acti
ng
fo
r se
rvic
es
and
enr
oll
men
t op
por
tun
itie
s 3
. U
ltim
ate
fina
ncia
l re
spon
sib
ilit
y v
este
d i
n
corp
ora
te i
nsti
tuti
ons
Bu
dg
etin
g
1.
Th
e b
ud
get
req
ues
t w
ou
ld
refl
ect
a sp
end
ing
pla
n
2.
Sp
ecif
ic w
ork
-loa
d f
acto
rs
wo
uld
ser
ve a
s b
asis
fo
r le
vel
of
inst
itu
tio
nal
req
ues
t 3
. R
elat
ive
effi
cien
cy w
ou
ld
be
maj
or
crit
erio
n 4
. L
egis
latu
re w
ould
ap
pro
ve
spen
din
g l
evel
fo
r v
ario
us
pro
gra
ms,
m
ajo
r ac
tiv
itie
s, a
nd
o
bje
cts
of
exp
end
itu
re
wit
hin
pro
gra
ms
and
ac
tiv
itie
s. A
dhe
renc
e to
ap
pro
ved
ex
pen
dit
ure
s w
ou
ld b
e ex
pec
ted
1.
Var
iety
of
form
ula
s an
d
incr
emen
tal
bas
es m
ay b
e em
plo
yed
2
. D
etai
led
bu
dg
et r
equ
ests
ar
e p
rep
ared
and
su
bm
itte
d b
y in
stit
uti
on
, al
thou
gh
maj
or
fund
ing
d
ecis
ions
are
bas
ed o
n ac
tiv
ity
leve
ls,
bas
e b
ud
get
s, o
r o
ther
bro
ad
fact
ors
3.
Fu
ndin
g b
ases
ten
d t
o b
e p
erce
ived
as
spen
din
g
pla
ns r
athe
r th
an f
und
ing
ve
hic
les
1.
Sta
te s
up
por
t b
ased
on
a g
ener
al a
lloc
atio
n fo
rmu
la,
e.g
., U
SD
/F
TE
re
sid
ent
stu
den
t 2
. A
pp
rop
riat
ion
is
on
a lu
mp
-su
m b
asis
1.
Con
trac
t am
ou
nts
d
eter
min
ed t
hro
ug
h
neg
oti
atio
n or
ex
tern
al
ind
ices
2
. B
asic
sta
te-l
evel
bu
dg
et
dec
isio
ns
wou
ld b
e nu
mb
er o
f sp
aces
or
leve
ls o
f se
rvic
es t
o b
e “p
urc
hase
d”
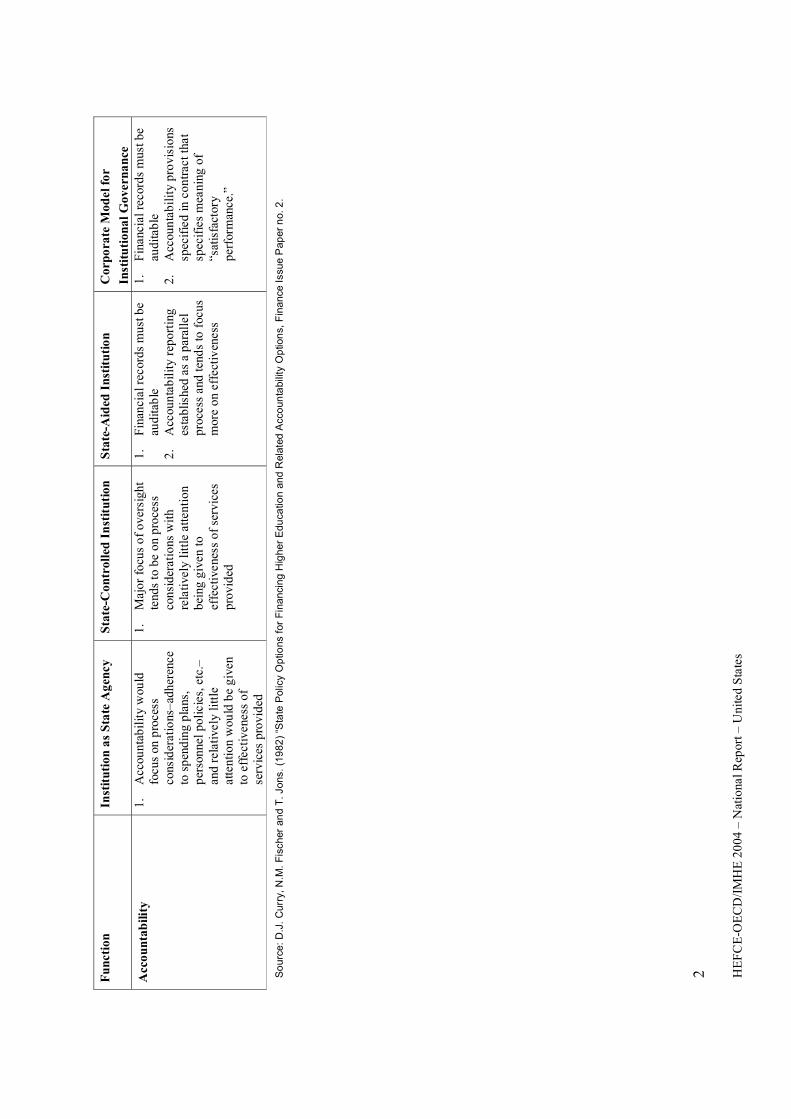
2
HE
FC
E-O
EC
D/I
MH
E 2
00
4 –
Nat
iona
l R
epor
t –
Un
ited
Sta
tes
Fu
nct
ion
In
stit
uti
on
as
Sta
te A
gen
cy
Sta
te-C
on
tro
lled
In
stit
uti
on
S
tate
-Aid
ed I
nst
itu
tio
n
Co
rpo
rate
Mo
del
fo
r
Inst
itu
tio
na
l G
ov
ern
an
ce
Acc
ou
nta
bil
ity
1
. A
ccou
nta
bil
ity
wou
ld
focu
s on
pro
cess
co
nsid
erat
ions
–ad
her
ence
to
sp
end
ing
pla
ns,
per
son
nel
po
lici
es,
etc.
–an
d r
elat
ivel
y l
ittl
e at
ten
tio
n w
ould
be
giv
en
to e
ffec
tiv
enes
s o
f se
rvic
es p
rov
ided
1.
Maj
or
focu
s o
f o
ver
sig
ht
tend
s to
be
on
pro
cess
co
nsi
der
atio
ns w
ith
re
lati
vely
lit
tle
atte
nti
on
bei
ng g
iven
to
ef
fect
iven
ess
of
serv
ices
p
rov
ided
1.
Fin
anci
al r
ecor
ds
mu
st b
e au
dit
able
2
. A
ccou
nta
bil
ity
rep
ort
ing
es
tab
lish
ed a
s a
par
alle
l p
roce
ss a
nd t
end
s to
foc
us
mor
e o
n ef
fect
iven
ess
1.
Fin
anci
al r
ecor
ds
mu
st b
e au
dit
able
2
. A
ccou
nta
bil
ity
pro
vis
ions
sp
ecif
ied
in
co
ntr
act
that
sp
ecif
ies
mea
nin
g o
f “s
atis
fact
ory
per
form
ance
.”
So
urc
e: D
.J.
Curr
y, N
.M.
Fis
cher
an
d T
. Jo
ns.
(19
82
) “S
tate
Polic
y O
ptio
ns
for
Fin
anci
ng
Hig
her
Edu
catio
n a
nd
Rel
ate
d A
cco
un
tab
ility
Op
tion
s, F
inance
Iss
ue P
ap
er
no. 2
.
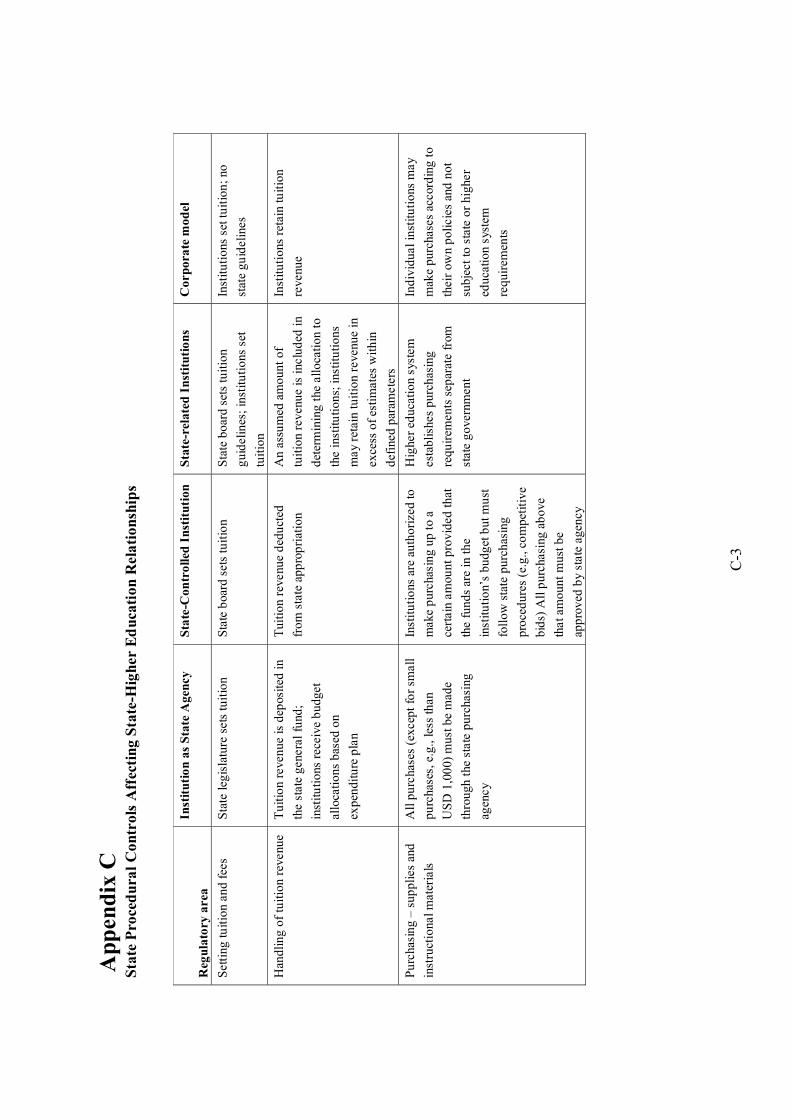
C-3
Ap
pen
dix
C
Sta
te P
roce
du
ral
Co
ntr
ols
Aff
ecti
ng
Sta
te-H
igh
er E
du
cati
on
Rel
ati
on
ship
s
Reg
ula
tory
are
a
Inst
itu
tio
n a
s S
tate
Ag
ency
S
tate
-Co
ntr
oll
ed I
nst
itu
tio
n
Sta
te-r
ela
ted
In
stit
uti
on
s C
orp
ora
te m
od
el
Set
ting
tu
itio
n an
d f
ees
Sta
te l
egis
latu
re s
ets
tuit
ion
S
tate
boa
rd s
ets
tuit
ion
Sta
te b
oar
d s
ets
tuit
ion
gu
idel
ines
; in
stit
uti
ons
set
tuit
ion
Inst
itu
tio
ns s
et t
uit
ion
; no
stat
e g
uid
elin
es
Han
dli
ng
of
tuit
ion
reve
nue
Tu
itio
n re
ven
ue
is d
epos
ited
in
the
stat
e g
ener
al f
und
;
inst
itu
tio
ns r
ecei
ve b
ud
get
allo
cati
on
s b
ased
on
exp
end
itu
re p
lan
Tu
itio
n re
venu
e d
edu
cted
fro
m s
tate
ap
pro
pri
atio
n
An
ass
um
ed a
mo
un
t o
f
tuit
ion
rev
enu
e is
inc
lud
ed i
n
det
erm
inin
g t
he a
llo
cati
on
to
the
inst
itu
tio
ns;
ins
titu
tio
ns
may
ret
ain
tu
itio
n r
even
ue
in
exce
ss o
f es
tim
ates
wit
hin
def
ined
par
amet
ers
Inst
itu
tio
ns r
etai
n t
uit
ion
reve
nue
Pu
rcha
sin
g –
su
pp
lies
and
inst
ruct
iona
l m
ater
ials
All
pu
rcha
ses
(ex
cep
t fo
r sm
all
pu
rcha
ses,
e.g
., l
ess
than
US
D 1
,00
0)
mu
st b
e m
ade
thro
ug
h t
he s
tate
pu
rcha
sing
agen
cy
Inst
itu
tio
ns a
re a
uth
ori
zed
to
mak
e p
urc
hasi
ng
up
to
a
cert
ain
am
oun
t p
rov
ided
th
at
the
fun
ds
are
in t
he
inst
itu
tio
n’s
bu
dg
et b
ut
mu
st
foll
ow
sta
te p
urc
has
ing
pro
ced
ure
s (e
.g.,
com
pet
itiv
e
bid
s) A
ll p
urc
hasi
ng a
bo
ve
that
am
ou
nt
mu
st b
e
app
rov
ed b
y st
ate
agen
cy
Hig
her
edu
cati
on
sys
tem
esta
bli
shes
pu
rch
asin
g
req
uir
emen
ts s
epar
ate
from
stat
e g
ove
rnm
ent
Ind
ivid
ual
in
stit
uti
ons
may
mak
e p
urc
hase
s ac
cord
ing
to
thei
r ow
n p
oli
cies
and
no
t
sub
ject
to
sta
te o
r h
ighe
r
edu
cati
on
sys
tem
req
uir
emen
ts
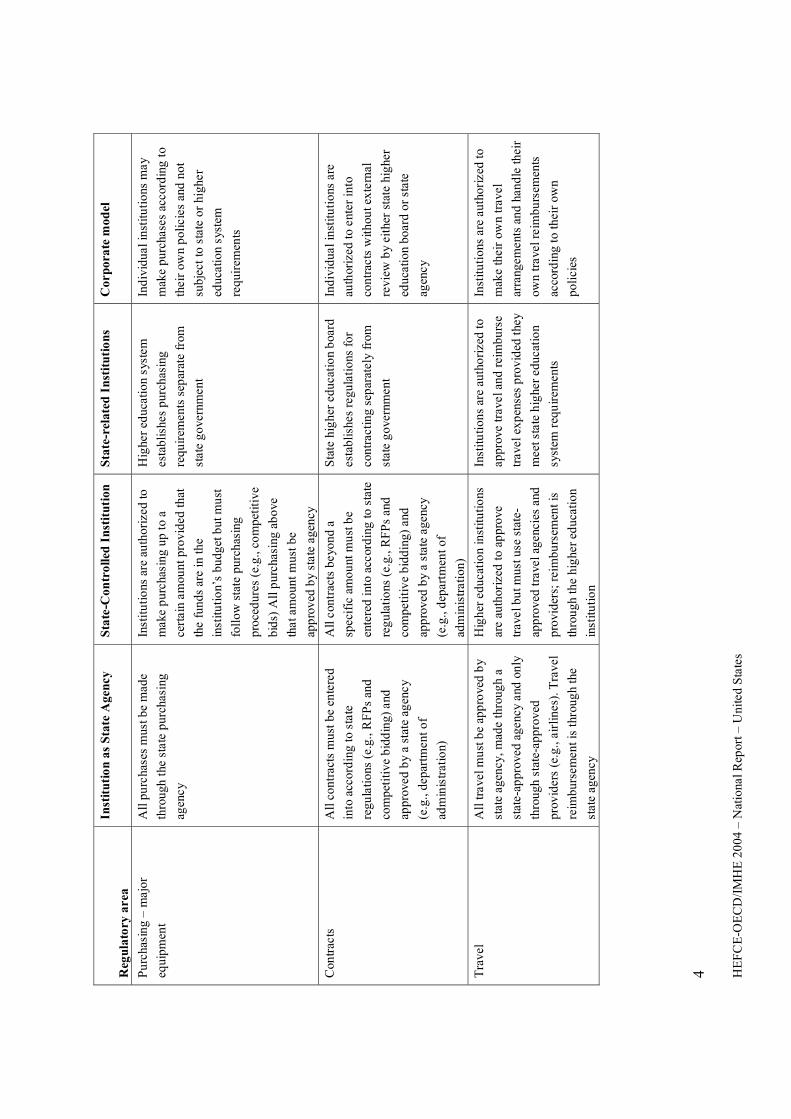
4
HE
FC
E-O
EC
D/I
MH
E 2
00
4 –
Nat
iona
l R
epor
t –
Un
ited
Sta
tes
Reg
ula
tory
are
a
Inst
itu
tio
n a
s S
tate
Ag
ency
S
tate
-Co
ntr
oll
ed I
nst
itu
tio
n
Sta
te-r
ela
ted
In
stit
uti
on
s C
orp
ora
te m
od
el
Pu
rcha
sin
g –
maj
or
equ
ipm
ent
All
pu
rcha
ses
mus
t b
e m
ade
thro
ug
h t
he s
tate
pu
rcha
sing
agen
cy
Inst
itu
tio
ns a
re a
uth
ori
zed
to
mak
e p
urc
hasi
ng
up
to
a
cert
ain
am
oun
t p
rov
ided
th
at
the
fun
ds
are
in t
he
inst
itu
tio
n’s
bu
dg
et b
ut
mu
st
foll
ow
sta
te p
urc
has
ing
pro
ced
ure
s (e
.g.,
com
pet
itiv
e
bid
s) A
ll p
urc
hasi
ng a
bo
ve
that
am
ou
nt
mu
st b
e
app
rov
ed b
y st
ate
agen
cy
Hig
her
edu
cati
on
sys
tem
esta
bli
shes
pu
rch
asin
g
req
uir
emen
ts s
epar
ate
from
stat
e g
ove
rnm
ent
Ind
ivid
ual
in
stit
uti
ons
may
mak
e p
urc
hase
s ac
cord
ing
to
thei
r ow
n p
oli
cies
and
no
t
sub
ject
to
sta
te o
r h
ighe
r
edu
cati
on
sys
tem
req
uir
emen
ts
Con
trac
ts
All
co
ntr
acts
mu
st b
e en
tere
d
into
acc
ord
ing
to
sta
te
reg
ula
tio
ns (
e.g
., R
FP
s an
d
com
pet
itiv
e b
idd
ing
) an
d
app
rove
d b
y a
stat
e ag
ency
(e.g
., d
epar
tmen
t o
f
adm
inis
trat
ion)
All
con
trac
ts b
eyo
nd
a
spec
ific
am
ou
nt m
ust
be
ente
red
int
o ac
cord
ing
to
sta
te
reg
ula
tio
ns (
e.g
., R
FP
s an
d
com
pet
itiv
e b
idd
ing
) an
d
app
rov
ed b
y a
stat
e ag
ency
(e.g
., d
epar
tmen
t o
f
adm
inis
trat
ion
)
Sta
te h
igh
er e
du
cati
on
boa
rd
esta
bli
shes
reg
ula
tio
ns f
or
con
trac
tin
g s
epar
atel
y fr
om
stat
e g
ove
rnm
ent
Ind
ivid
ual
in
stit
uti
ons
are
auth
oriz
ed t
o e
nter
in
to
con
trac
ts w
ith
out
exte
rnal
rev
iew
by
eith
er s
tate
hig
her
edu
cati
on
bo
ard
or
stat
e
agen
cy
Tra
vel
A
ll t
rave
l m
ust
be
app
rove
d b
y
stat
e ag
ency
, m
ade
thro
ug
h a
stat
e-ap
pro
ved
ag
ency
and
on
ly
thro
ug
h s
tate
-ap
pro
ved
pro
vid
ers
(e.g
., a
irli
nes
). T
rav
el
reim
bu
rsem
ent
is t
hrou
gh
the
stat
e ag
ency
Hig
her
ed
uca
tio
n in
stit
uti
ons
are
auth
oriz
ed t
o a
pp
rove
trav
el b
ut
mu
st u
se s
tate
-
app
rov
ed t
rave
l ag
enci
es a
nd
pro
vid
ers;
rei
mb
urs
emen
t is
thro
ug
h t
he
hig
her
edu
cati
on
inst
itu
tio
n
Inst
itu
tio
ns
are
auth
ori
zed
to
app
rove
tra
vel
and
rei
mb
urs
e
trav
el e
xp
ense
s p
rov
ided
the
y
mee
t st
ate
hig
her
edu
cati
on
syst
em r
equ
irem
ents
Inst
itu
tio
ns a
re a
uth
ori
zed
to
mak
e th
eir
own
trav
el
arra
ngem
ents
an
d h
and
le t
hei
r
own
tra
vel
reim
bu
rsem
ents
acco
rdin
g t
o th
eir
own
po
lici
es
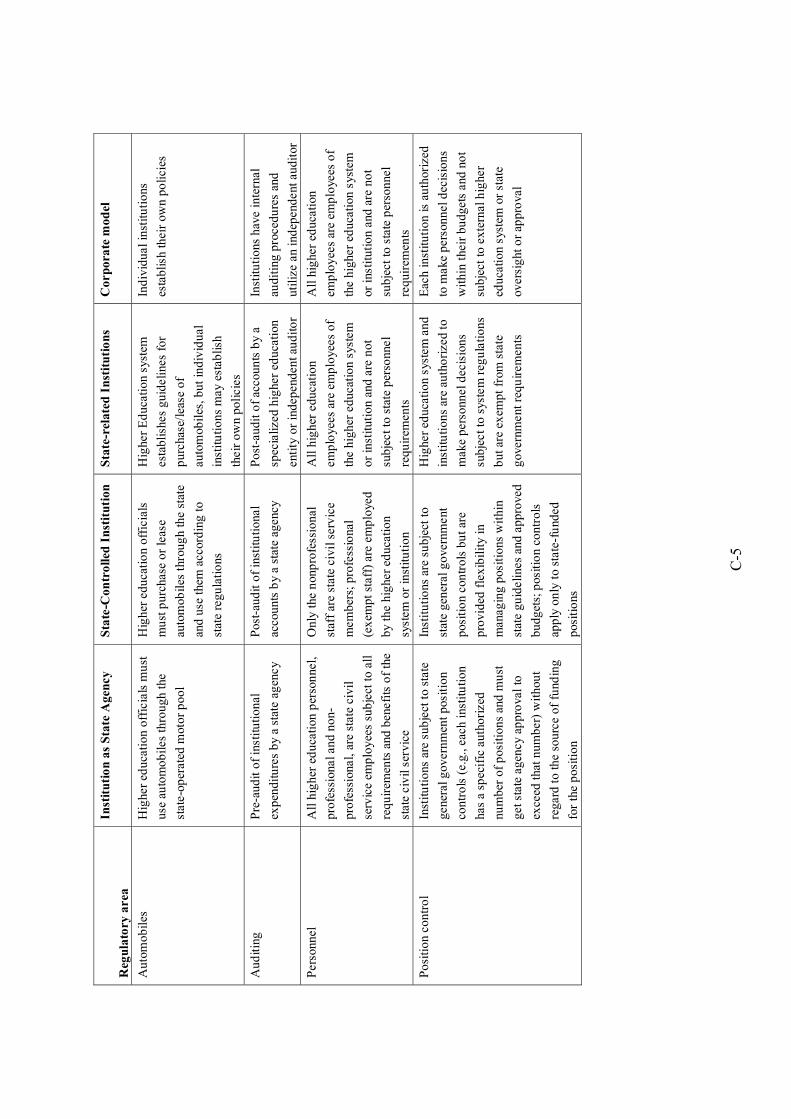
C-5
Reg
ula
tory
are
a
Inst
itu
tio
n a
s S
tate
Ag
ency
S
tate
-Co
ntr
oll
ed I
nst
itu
tio
n
Sta
te-r
ela
ted
In
stit
uti
on
s C
orp
ora
te m
od
el
Au
tom
ob
iles
H
ighe
r ed
uca
tio
n o
ffic
ials
mu
st
use
au
tom
ob
iles
th
rou
gh
the
stat
e-op
erat
ed m
oto
r p
oo
l
Hig
her
ed
uca
tio
n o
ffic
ials
mu
st p
urc
hase
or
leas
e
auto
mob
iles
thr
oug
h th
e st
ate
and
use
the
m a
ccor
din
g t
o
stat
e re
gu
lati
ons
Hig
her
Ed
uca
tio
n sy
stem
esta
bli
shes
gu
idel
ines
fo
r
pu
rcha
se/l
ease
of
auto
mob
iles
, b
ut
ind
ivid
ual
inst
itu
tio
ns
may
est
abli
sh
thei
r o
wn
po
lici
es
Ind
ivid
ual
in
stit
uti
ons
esta
bli
sh t
hei
r ow
n p
oli
cies
Au
dit
ing
P
re-a
ud
it o
f in
stit
uti
on
al
exp
end
itu
res
by
a st
ate
agen
cy
Pos
t-au
dit
of
inst
itu
tio
nal
acco
un
ts b
y a
stat
e ag
ency
Po
st-a
ud
it o
f ac
cou
nts
by
a
spec
iali
zed
hig
her
edu
cati
on
enti
ty o
r in
dep
end
ent
aud
ito
r
Inst
itu
tio
ns h
ave
inte
rnal
aud
itin
g p
roce
du
res
and
uti
lize
an
ind
epen
den
t au
dit
or
Per
sonn
el
All
hig
her
ed
uca
tion
per
son
nel,
pro
fess
iona
l an
d n
on
-
pro
fess
iona
l, a
re s
tate
civ
il
serv
ice
emp
loy
ees
sub
ject
to
all
req
uir
emen
ts a
nd b
enef
its
of
the
stat
e ci
vil
ser
vic
e
On
ly t
he n
onp
rofe
ssio
nal
staf
f ar
e st
ate
civ
il s
erv
ice
mem
ber
s; p
rofe
ssio
nal
(ex
emp
t st
aff)
are
em
plo
yed
by
the
hig
her
edu
cati
on
syst
em o
r in
stit
uti
on
All
hig
her
ed
uca
tio
n
emp
loye
es a
re e
mp
loye
es o
f
the
hig
her
ed
uca
tio
n s
yste
m
or
inst
itu
tio
n a
nd a
re n
ot
sub
ject
to
sta
te p
erso
nnel
req
uir
emen
ts
All
hig
her
edu
cati
on
emp
loy
ees
are
emp
loye
es o
f
the
hig
her
edu
cati
on s
yste
m
or i
nsti
tuti
on
and
are
no
t
sub
ject
to
sta
te p
erso
nne
l
req
uir
emen
ts
Po
siti
on
co
ntr
ol
Inst
itu
tio
ns a
re s
ub
ject
to
stat
e
gen
eral
gov
ern
men
t p
osit
ion
con
tro
ls (
e.g
., ea
ch i
nsti
tuti
on
has
a sp
ecif
ic a
uth
ori
zed
num
ber
of
po
siti
on
s an
d m
ust
get
sta
te a
gen
cy a
pp
rova
l to
exce
ed t
hat
nu
mb
er)
wit
hou
t
reg
ard
to
the
sou
rce
of
fund
ing
for
the
po
siti
on
Inst
itu
tio
ns a
re s
ub
ject
to
stat
e g
ener
al g
ove
rnm
ent
pos
itio
n co
ntr
ols
bu
t ar
e
pro
vid
ed f
lex
ibil
ity
in
man
agin
g p
osit
ions
wit
hin
stat
e g
uid
elin
es a
nd a
pp
rove
d
bu
dg
ets;
pos
itio
n c
on
tro
ls
app
ly o
nly
to
stat
e-fu
nded
pos
itio
ns
Hig
her
edu
cati
on
sys
tem
an
d
inst
itu
tio
ns
are
auth
ori
zed
to
mak
e p
erso
nnel
dec
isio
ns
sub
ject
to
sys
tem
reg
ula
tio
ns
bu
t ar
e ex
emp
t fr
om s
tate
gov
ernm
ent
req
uir
emen
ts
Eac
h in
stit
uti
on
is a
uth
oriz
ed
to m
ake
per
son
nel
dec
isio
ns
wit
hin
the
ir b
ud
get
s an
d n
ot
sub
ject
to
ex
tern
al h
ighe
r
edu
cati
on
sys
tem
or
stat
e
over
sig
ht o
r ap
pro
val
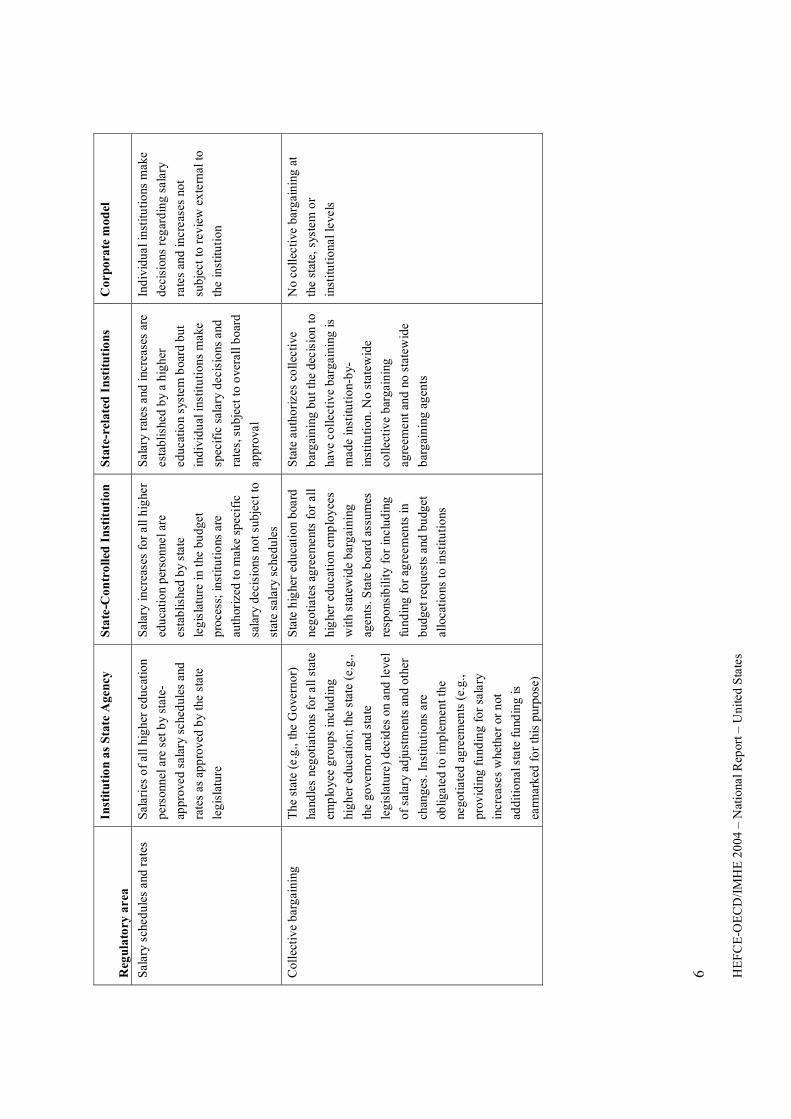
6
HE
FC
E-O
EC
D/I
MH
E 2
00
4 –
Nat
iona
l R
epor
t –
Un
ited
Sta
tes
Reg
ula
tory
are
a
Inst
itu
tio
n a
s S
tate
Ag
ency
S
tate
-Co
ntr
oll
ed I
nst
itu
tio
n
Sta
te-r
ela
ted
In
stit
uti
on
s C
orp
ora
te m
od
el
Sal
ary
sch
edu
les
and
rat
es
Sal
arie
s o
f al
l h
igh
er e
du
cati
on
per
sonn
el a
re s
et b
y st
ate-
app
rove
d s
alar
y sc
hed
ule
s an
d
rate
s as
ap
pro
ved
by
the
stat
e
leg
isla
ture
Sal
ary
incr
ease
s fo
r al
l h
ighe
r
edu
cati
on
per
son
nel
are
esta
bli
shed
by
stat
e
leg
isla
ture
in
the
bu
dg
et
pro
cess
; in
stit
uti
ons
are
auth
oriz
ed t
o m
ake
spec
ific
sala
ry d
ecis
ions
no
t su
bje
ct t
o
stat
e sa
lary
sch
edu
les
Sal
ary
rat
es a
nd i
ncre
ases
are
esta
bli
shed
by
a h
igh
er
edu
cati
on
syst
em b
oard
bu
t
ind
ivid
ual
ins
titu
tio
ns
mak
e
spec
ific
sal
ary
dec
isio
ns a
nd
rate
s, s
ub
ject
to
ove
rall
bo
ard
app
rova
l
Ind
ivid
ual
in
stit
uti
ons
mak
e
dec
isio
ns r
egar
din
g s
alar
y
rate
s an
d i
ncr
ease
s no
t
sub
ject
to
rev
iew
ex
tern
al t
o
the
inst
itu
tio
n
Co
llec
tiv
e b
arg
ain
ing
T
he
stat
e (e
.g.,
the
Go
vern
or)
hand
les
neg
otia
tio
ns f
or
all
stat
e
emp
loye
e g
rou
ps
incl
ud
ing
hig
her
ed
uca
tio
n;
the
stat
e (e
.g.,
the
go
vern
or
and
sta
te
leg
isla
ture
) d
ecid
es o
n a
nd l
evel
of
sala
ry a
dju
stm
ents
an
d o
ther
chan
ges
. In
stit
uti
ons
are
obli
gat
ed t
o i
mp
lem
ent
the
neg
oti
ated
ag
reem
ents
(e.
g.,
pro
vid
ing
fu
nd
ing
fo
r sa
lary
incr
ease
s w
heth
er o
r n
ot
add
itio
nal
sta
te f
und
ing
is
earm
ark
ed f
or
this
pu
rpos
e)
Sta
te h
ighe
r ed
uca
tio
n b
oard
neg
oti
ates
ag
reem
ents
fo
r al
l
hig
her
edu
cati
on
emp
loy
ees
wit
h st
atew
ide
bar
gai
nin
g
agen
ts. S
tate
bo
ard
ass
um
es
resp
ons
ibil
ity
for
incl
ud
ing
fun
din
g f
or
agre
emen
ts i
n
bu
dg
et r
equ
ests
and
bu
dget
allo
cati
ons
to
in
stit
uti
ons
Sta
te a
uth
ori
zes
coll
ecti
ve
bar
gai
nin
g b
ut
the
dec
isio
n t
o
hav
e co
llec
tiv
e b
arg
ain
ing
is
mad
e in
stit
uti
on-
by-
inst
itu
tio
n.
No
stat
ewid
e
coll
ecti
ve
bar
gai
nin
g
agre
emen
t an
d n
o s
tate
wid
e
bar
gai
nin
g a
gen
ts
No
coll
ecti
ve b
arg
ain
ing
at
the
stat
e, s
yste
m o
r
inst
itu
tio
nal
leve
ls
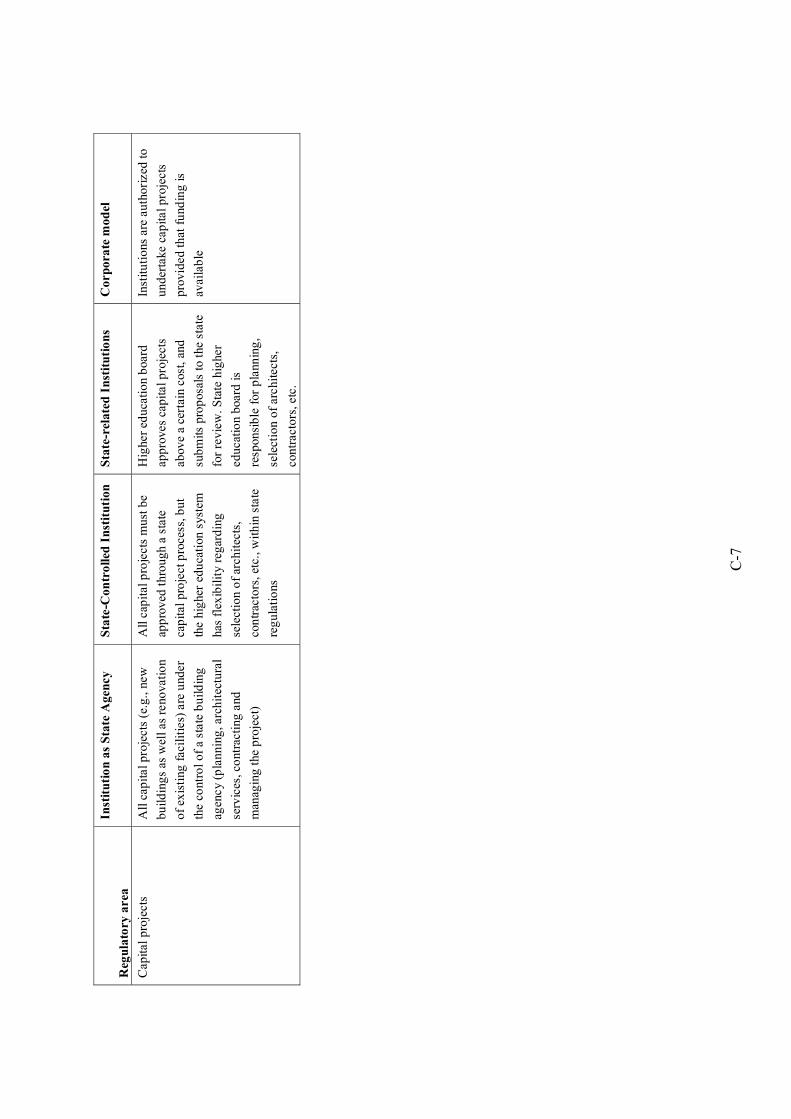
C-7
Reg
ula
tory
are
a
Inst
itu
tio
n a
s S
tate
Ag
ency
S
tate
-Co
ntr
oll
ed I
nst
itu
tio
n
Sta
te-r
ela
ted
In
stit
uti
on
s C
orp
ora
te m
od
el
Cap
ital
pro
ject
s A
ll c
apit
al p
roje
cts
(e.g
., n
ew
bu
ild
ing
s as
wel
l as
ren
ov
atio
n
of
exis
ting
fac
ilit
ies)
are
und
er
the
cont
rol
of
a st
ate
bu
ild
ing
agen
cy (
pla
nn
ing
, arc
hit
ectu
ral
serv
ices
, co
ntra
ctin
g a
nd
man
agin
g t
he p
roje
ct)
All
cap
ital
pro
ject
s m
ust
be
app
rov
ed t
hro
ug
h a
sta
te
cap
ital
pro
ject
pro
cess
, bu
t
the
hig
her
edu
cati
on s
yste
m
has
flex
ibil
ity
reg
ard
ing
sele
ctio
n o
f ar
chit
ects
,
con
trac
tors
, et
c., w
ith
in s
tate
reg
ula
tio
ns
Hig
her
edu
cati
on
boa
rd
app
rove
s ca
pit
al p
roje
cts
abov
e a
cert
ain
cos
t, a
nd
sub
mit
s p
rop
osal
s to
the
sta
te
for
rev
iew
. S
tate
hig
her
edu
cati
on
boa
rd i
s
resp
onsi
ble
for
pla
nnin
g,
sele
ctio
n o
f ar
chit
ects
,
con
trac
tors
, etc
.
Inst
itu
tio
ns a
re a
uth
ori
zed
to
un
der
take
cap
ital
pro
ject
s
pro
vid
ed t
hat
fu
ndin
g i
s
avai
lab
le

8
Appendix D
Key Indicators of Progress Toward Postsecondary Reform in Kentucky
1. Are more Kentuckians ready for postsecondary education? Preparation of Adults 1. Percentage of adults at literacy levels one and two 2. Percentage of adults with less than high school diploma or GED Preparation of Recent High School Graduates 3. Average ACT scores of high school graduates 4. Percentage of high school graduates taking the ACT 5. Number of college-level courses per 1,000 HS juniors and seniors 6. Percentage of high school students completing the ACT core coursework 7. High school test scores Affordability (Family Ability to Pay) 8. Affordability indicators from Measuring Up
2. Are more students enrolling? Postsecondary Enrollment 1. Number of undergraduates 2. Number of graduates/professionals 3. Number of students enrolled in KYVU credit courses 4. Number of "new students" enrolled in KYVU credit courses College Participation 5. Percentage of the adult population enrolled in KY colleges 6. Percentage of the adult population enrolled in KY colleges from target counties College-Going 7. Percentage of high school freshman enrolling in college within 4 years in any state 8. Percentage of students attending college directly out of high school from target counties 9. College-going rates of GED completers within two years
3. Are more students advancing through the system? Persistence and Completion 1. One-year retention rates of first-time freshmen 2. One-year retention rates of under-prepared students 3. Number of community and technical college transfers 4. Average number of credit hours transferred Graduation 5. Percentage of adults with a bachelor's degree or higher 6. Six-year graduation rates of bachelor's degree students 7. Five-year graduation rates of transfer students
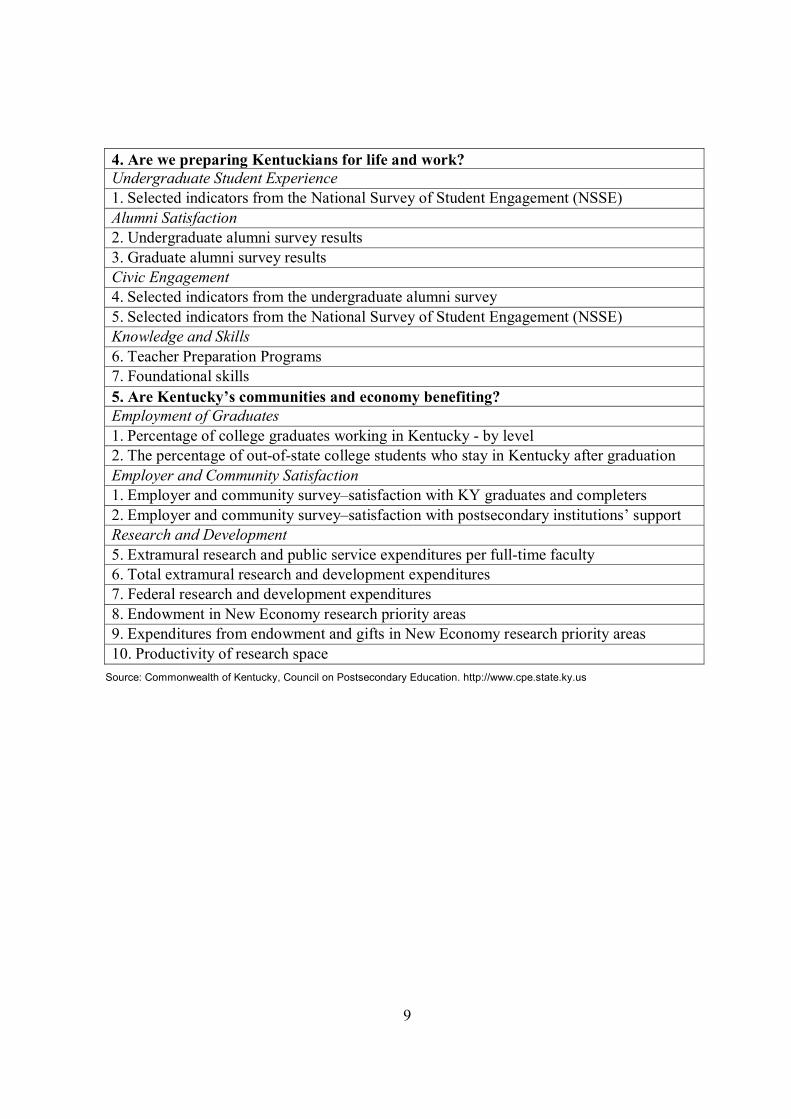
9
4. Are we preparing Kentuckians for life and work? Undergraduate Student Experience 1. Selected indicators from the National Survey of Student Engagement (NSSE) Alumni Satisfaction 2. Undergraduate alumni survey results 3. Graduate alumni survey results Civic Engagement 4. Selected indicators from the undergraduate alumni survey 5. Selected indicators from the National Survey of Student Engagement (NSSE) Knowledge and Skills 6. Teacher Preparation Programs 7. Foundational skills
5. Are Kentucky’s communities and economy benefiting? Employment of Graduates 1. Percentage of college graduates working in Kentucky - by level 2. The percentage of out-of-state college students who stay in Kentucky after graduation Employer and Community Satisfaction 1. Employer and community survey–satisfaction with KY graduates and completers 2. Employer and community survey–satisfaction with postsecondary institutions’ support Research and Development 5. Extramural research and public service expenditures per full-time faculty 6. Total extramural research and development expenditures 7. Federal research and development expenditures 8. Endowment in New Economy research priority areas 9. Expenditures from endowment and gifts in New Economy research priority areas 10. Productivity of research space
Source: Commonwealth of Kentucky, Council on Postsecondary Education. http://www.cpe.state.ky.us
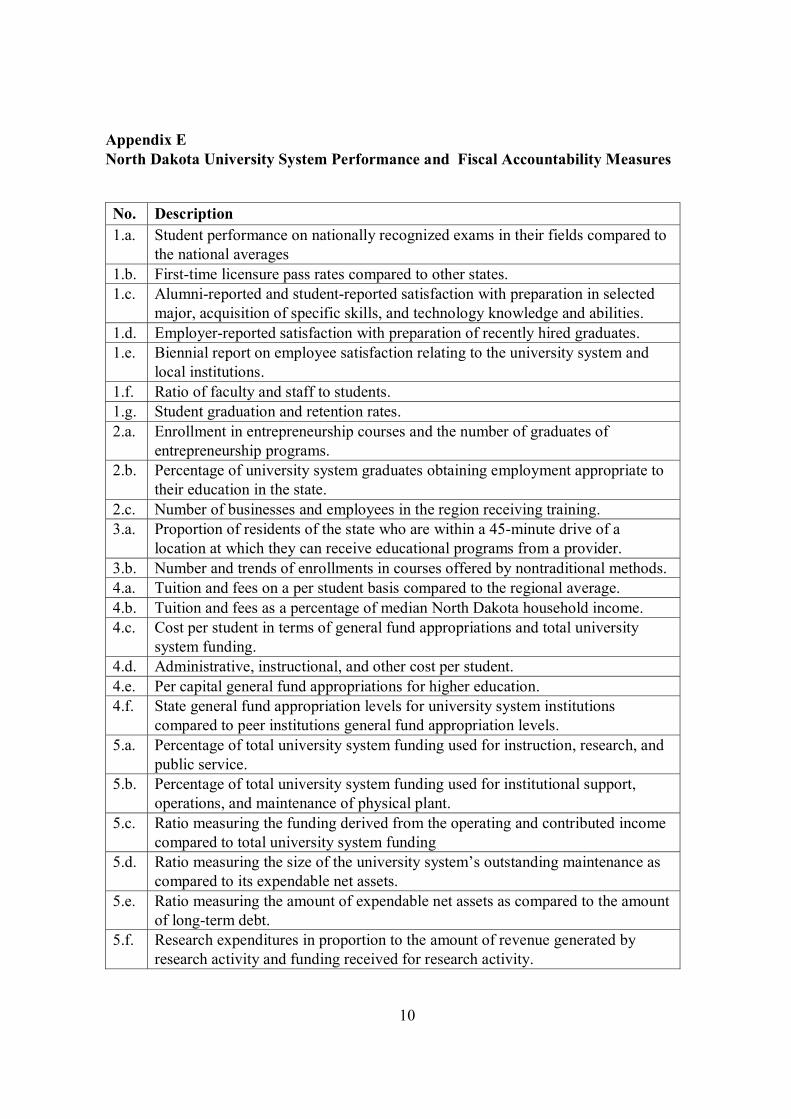
10
Appendix E North Dakota University System Performance and Fiscal Accountability Measures
No. Description
1.a. Student performance on nationally recognized exams in their fields compared to the national averages
1.b. First-time licensure pass rates compared to other states. 1.c. Alumni-reported and student-reported satisfaction with preparation in selected
major, acquisition of specific skills, and technology knowledge and abilities. 1.d. Employer-reported satisfaction with preparation of recently hired graduates. 1.e. Biennial report on employee satisfaction relating to the university system and
local institutions. 1.f. Ratio of faculty and staff to students. 1.g. Student graduation and retention rates. 2.a. Enrollment in entrepreneurship courses and the number of graduates of
entrepreneurship programs. 2.b. Percentage of university system graduates obtaining employment appropriate to
their education in the state. 2.c. Number of businesses and employees in the region receiving training. 3.a. Proportion of residents of the state who are within a 45-minute drive of a
location at which they can receive educational programs from a provider. 3.b. Number and trends of enrollments in courses offered by nontraditional methods. 4.a. Tuition and fees on a per student basis compared to the regional average. 4.b. Tuition and fees as a percentage of median North Dakota household income. 4.c. Cost per student in terms of general fund appropriations and total university
system funding. 4.d. Administrative, instructional, and other cost per student. 4.e. Per capital general fund appropriations for higher education. 4.f. State general fund appropriation levels for university system institutions
compared to peer institutions general fund appropriation levels. 5.a. Percentage of total university system funding used for instruction, research, and
public service. 5.b. Percentage of total university system funding used for institutional support,
operations, and maintenance of physical plant. 5.c. Ratio measuring the funding derived from the operating and contributed income
compared to total university system funding 5.d. Ratio measuring the size of the university system’s outstanding maintenance as
compared to its expendable net assets. 5.e. Ratio measuring the amount of expendable net assets as compared to the amount
of long-term debt. 5.f. Research expenditures in proportion to the amount of revenue generated by
research activity and funding received for research activity.
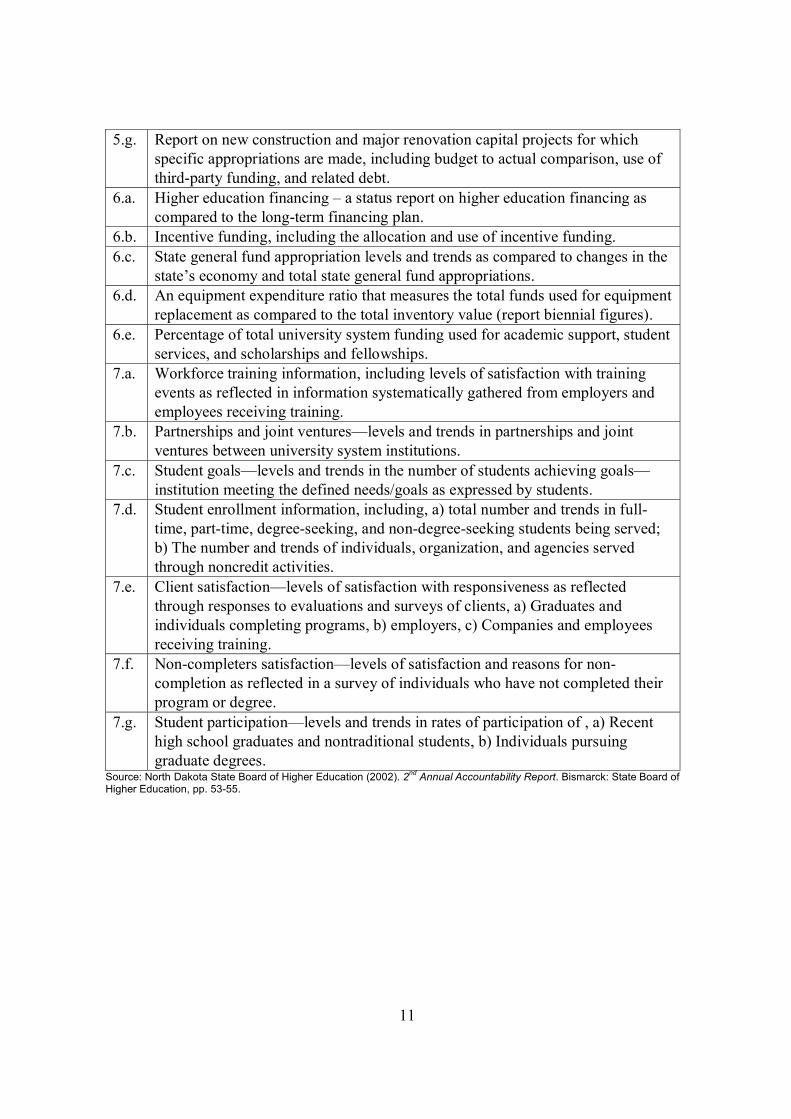
11
5.g. Report on new construction and major renovation capital projects for which specific appropriations are made, including budget to actual comparison, use of third-party funding, and related debt.
6.a. Higher education financing – a status report on higher education financing as compared to the long-term financing plan.
6.b. Incentive funding, including the allocation and use of incentive funding. 6.c. State general fund appropriation levels and trends as compared to changes in the
state’s economy and total state general fund appropriations. 6.d. An equipment expenditure ratio that measures the total funds used for equipment
replacement as compared to the total inventory value (report biennial figures). 6.e. Percentage of total university system funding used for academic support, student
services, and scholarships and fellowships. 7.a. Workforce training information, including levels of satisfaction with training
events as reflected in information systematically gathered from employers and employees receiving training.
7.b. Partnerships and joint ventures—levels and trends in partnerships and joint ventures between university system institutions.
7.c. Student goals—levels and trends in the number of students achieving goals—institution meeting the defined needs/goals as expressed by students.
7.d. Student enrollment information, including, a) total number and trends in full-time, part-time, degree-seeking, and non-degree-seeking students being served; b) The number and trends of individuals, organization, and agencies served through noncredit activities.
7.e. Client satisfaction—levels of satisfaction with responsiveness as reflected through responses to evaluations and surveys of clients, a) Graduates and individuals completing programs, b) employers, c) Companies and employees receiving training.
7.f. Non-completers satisfaction—levels of satisfaction and reasons for non-completion as reflected in a survey of individuals who have not completed their program or degree.
7.g. Student participation—levels and trends in rates of participation of , a) Recent high school graduates and nontraditional students, b) Individuals pursuing graduate degrees.
Source: North Dakota State Board of Higher Education (2002). 2nd Annual Accountability Report. Bismarck: State Board of Higher Education, pp. 53-55.