OECD Economic Surveys: Denmark 2021
54
OECD Economic Surveys Denmark December 2021 OVERVIEW http://www.oecd.org/economy/denmark-economic-snapshot/
-
Upload
khangminh22 -
Category
Documents
-
view
0 -
download
0
Transcript of OECD Economic Surveys: Denmark 2021

OECD Economic Surveys
Denmark December 2021 OVERVIEW
http://www.oecd.org/economy/denmark-economic-snapshot/

This Overview is extracted from the 2021 Economic Survey of Denmark. The Survey is published on the responsibility of the Economic and Development Review Committee of the OECD, which is charged with the examination of the economic situation of member countries.
This document, as well as any data and any map included herein, are without prejudice to the status of or sovereignty over any territory, to the delimitation of international frontiers and boundaries and to the name of any territory, city or area.
The statistical data for Israel are supplied by and under the responsibility of the relevant Israeli authorities. The use of such data by the OECD is without prejudice to the status of the Golan Heights, East Jerusalem and Israeli settlements in the West Bank under the terms of international law.
OECD Economic Surveys: Denmark© OECD 2021
You can copy, download or print OECD content for your own use, and you can include excerpts from OECD publications, databases and multimedia products in your own documents, presentations, blogs, websites and teaching materials, provided that suitable acknowledgement of OECD as source and copyright owner is given. All requests for public or commercial use and translation rights should be submitted to [email protected]. Requests for permission to photocopy portions of this material for public or commercial use shall be addressed directly to the Copyright Clearance Center (CCC) at [email protected] or the Centre français d’exploitation du droit de copie (CFC) at [email protected] of or sovereignty over any territory, to the delimitation of international frontiers and boundaries and to the name of any territory, city or area.

| 3
OECD ECONOMIC SURVEYS: DENMARK 2021 © OECD 2021
Executive summary

4 |
OECD ECONOMIC SURVEYS: DENMARK 2021 © OECD 2021
Macroeconomic policy has supported the recovery from the COVID crisis Denmark used its large fiscal space when COVID-19 hit. Rapid action to support firms and households in spring 2020 and again in the winter contained the economic contraction to one of the mildest in Europe. Fast vaccine rollout enabled the removal of shutdown restrictions and an early reopening, though restrictions on the unvaccinated were reintroduced in late 2021 as Delta variant cases rose rapidly. Low interest rates and credit guarantees have also facilitated the recovery.
Employment support has mitigated job losses. Unemployment increased by around 1 percentage point, less than in most EU countries. A temporary job retention scheme reduced the number of job losses while allowing people to quickly return to work once the economy improved.
Growth is projected ease to 2.4% in 2022 and 1.7% in 2023 (Table 1). Activity has rebounded fast, with GDP exceeding its pre-pandemic level by mid-2021 (Figure 1). Nevertheless, downside risks remain, notably further outbreaks domestically and abroad threatening domestic and external demand. On the upside, labour shortages have become widespread and household spending of excess saving during the crisis could see higher growth.
Table 1. A strong recovery in 2021 2021 2022 2023
Gross domestic product 4.7 2.4 1.7 Unemployment rate 4.9 4.2 4.2 Consumer price index 1.8 2.6 2.3 Fiscal balance (% of GDP) -1.5 0.3 0.8 Public debt (gross, Maastricht, %GDP) 39.8 38.4 38.0
Source: OECD, Economic Outlook 110 database.
Policy support should continue to be withdrawn where economic activity has recovered. The uncertain worldwide health and economic situation warrants ongoing flexibility in policy action. While employment has rebounded, structural measures should now be targeted at the youth, migrant workers, and low-educated.
Fiscal space remains available to deploy public investment during the post-pandemic recovery. Denmark has ambitious plans to build back better once the outbreak is under control. Low-carbon
public investments are key aspects of the recovery strategy, together with transfers to households to protect inclusiveness. This will be enabled by available fiscal space if plans to prepare for an ageing society via strong indexation of retirement ages to life expectancy are fully implemented. Relaxation of the 0.5% structural deficit limit would provide space to address longer-term challenges, without threatening fiscal sustainability.
Figure 1. The economy has recovered quickly
Source: OECD, Economic Outlook 110 database. StatLink 2 https://stat.link/ug6vtd
Denmark’s tax system is overall well-designed, but the shift from income to less distortionary forms of taxation should continue. High top marginal tax rates on wage and capital income dull incentives for entrepreneurship, investment and increasing employment. Simultaneously increasing taxes on housing, with costs falling predominantly on high-income groups, would reduce negative distributional consequences.
Monetary policy is strongly expansionary. Inflation has picked up due to energy price growth, while wage pressures remain contained despite labour shortages. The currency peg to the Euro has served Denmark well, but implies negative interest rates that could generate macroeconomic imbalances as the recovery proceeds. In particular, rapid house price growth and high household gross debt (Figure 2) exacerbate financial risks. Some features of the mortgage loan market are worrisome: high share of loans with variable interest rates or no repayments; comparatively low down payment requirements; and no absolute debt-to-income limit. Macro-prudential tightening would impact households without sufficient income to service their debt, increasing the importance of access to affordable social rental housing. Danish
85
90
95
100
105
110
2019Q4 2020Q4 2021Q4 2022Q4 2023Q4
Real GDPIndex 2019 Q4 = 100
DenmarkEuro area

| 5
OECD ECONOMIC SURVEYS: DENMARK 2021 © OECD 2021
saving is already high, however, and reducing access to mortgages could increase the already large current account surplus.
Figure 2. Household gross debt is very high
Source: OECD, Economic Outlook and National Accounts databases.
StatLink 2 https://stat.link/7eu61f
Physical and transition risks associated with climate change could affect financial stability. The central bank has started to assess the exposure of banks to climate change. Though systemic risks in case of gradual increases in stringency of environmental policy are contained, other financial vulnerabilities are likely elsewhere in the financial system. More information and monitoring is necessary to assess these risks.
Reforms would boost labour market inclusion and productivity Denmark is well prepared to benefit from the digital transformation. Danish firms are leaders in adoption of digital tools, assisted by good broadband coverage, digital government services and digital skills. The benefits of new technologies could be spread more widely by supporting the growth of new firms through access to finance and reducing barriers to digital trade.
Danish women suffer from a significant drop in earnings after motherhood and are under-represented among managers. Increasing the share of parental leave reserved for the second parent, as planned, while increasing gender balance in leadership positions and offering greater flexibility in childcare services has the potential to improve equality and boost aggregate output.
Benefits from immigration are held back by large gaps in employment and educational outcomes. Insufficient language skills remain a key barrier facing immigrants.
Climate policies need to be cost-effective and socially acceptable Denmark cut its greenhouse gas emissions by 36% between 1990 and 2019, largely thanks to renewable energy (including biomass), which now accounts for over 80% of electricity generation. It is now one of the least carbon-intensive countries.
Emissions have been cut without overall employment losses. Workers displaced by stringent environmental policies have been helped by Denmark’s reskilling programmes, which demonstrated their capacity to cushion much larger displacements in manufacturing during the 2008 financial crisis. Thanks to this, Denmark has preserved full employment, with 75% of the working-age population having a job, one of the highest employment rates in the OECD.
Denmark plans to halve its emissions over the next decade. The Climate Act sets the legally-binding objective of reducing emissions by 70% by 2030 from 1990. The target is one of the most ambitious among OECD countries and would put the country on track for carbon emissions neutrality by 2050 (Figure 3). However, this will require radical technological changes and vast resource reallocation. Greater certainty on how targets will be met is important to send strong signals to investors. Investment needs in the order of 1% to 2% of GDP will need to be funded, though could also carry long-term benefits if there is good project selection and incentives for private involvement.
Denmark’s well-functioning “flexicurity” facilitates reemployment of workers displaced by the energy transition. Jobs have already declined in fossil fuel generation, but new jobs were created in renewables. Projections of further abatement suggest that job losses in agriculture would be roughly matched by job creation elsewhere.
Uniform carbon pricing would effectively mitigate emissions but needs to be complemented by flanking measures that provide a clear and predictable regulatory environment and support green infrastructure and innovation. Pricing all greenhouse gas emissions at a uniform minimum rate reflecting the evolution of prices in the EU Emissions Trading System would contribute to cost-effective abatement, though on its own would be insufficient to meet targets. Public
0
150
300
450
600
750
0
50
100
150
200
250
HUN
SVN
POL
ITA
CZE
AUT
DEU
GRC
USA
ESP
JPN
BEL
PRT
IRL
FRA
GBR
FIN
CAN
AUS
SWE
NLD
NOR
DNK
%%
Gross debt (left) Financial net worth (right)
Household gross debt and net worth, % of disposable income2020 or latest year available

6 |
OECD ECONOMIC SURVEYS: DENMARK 2021 © OECD 2021
acceptability for increased pricing is crucial and can be enhanced by transparent use of government revenue to support to the green transition, reskilling of workers and offsetting distributional effects. If high carbon prices cannot be sustained, the government will need other incentives to attract private investment and innovation in clean energy, as well as public investment in green infrastructure.
Figure 3. Meeting targets will require accelerating progress in all sectors
Source: UNFCCC GHG Data Interface; Danish Climate Law.
StatLink 2 https://stat.link/qlc6ax
Denmark has made huge progress towards renewable energy (Figure 4). Through learning by doing, the cost of renewable energy has fallen considerably. Large investments are being made to progress further with low-carbon energy, supporting new technologies such as clean hydrogen and carbon storage. Emissions have been cut in district heating by switching from coal to biomass and the next step is to switch to other renewables and free up scarce supplies of sustainable biomass for other uses. Attracting private investment and enhancing competition would ensure that new technologies are commercially viable and affordable.
Cutting transport emissions should continue to avoid leaving behind vulnerable groups. CO2 emissions from transport have not substantially declined so far (Figure 5). Denmark is encouraging take-up of vehicles using electricity, hydrogen and biogas, requiring large investments in charging and refuelling stations, including in remote areas. The overall taxation of vehicles should still reflect their external costs, including congestion, noise, road damage and local air pollution. Policies are needed to support those most adversely affected and offer
alternatives to private car use including public transport, shared mobility, cycling and walking.
Figure 4. Renewable generation has grown fast, but relies increasingly on biomass
Source: IEA, World Energy Balances and Statistics databases.
StatLink 2 https://stat.link/zmfrqb
Figure 5. Increasing car use has pushed up transport emissions despite greener vehicles
Source: OECD estimation based on EEA; Statistics Denmark; ITF.
StatLink 2 https://stat.link/yuzrfp
Agriculture is a major and growing source of greenhouse gases, mainly from livestock. The sector has made little progress in cutting emissions so far. A recent agreement will enable emission cuts from low-hanging fruit such as rewetting of peatlands, with limited impact on activity while also reducing other environmental damages. Domestic regulation should focus on emission-intensive activities such as livestock and grain and detailed monitoring of farms’ emissions. This would make a substantial contribution to the 2030 target, reducing the burden on other sectors. Further investment for research and development could substantially enhance the contribution of agriculture to a net-zero target. However, agriculture is highly exposed to international trade and carbon leakage. Hence, Denmark should work with other EU member states towards greening the Common Agricultural Policy.
0
20
40
60
80
100
120
1990 2000 2010 2020 2030 2040 2050
Mt CO2e
Energy industriesTransportAgricultureOther sectorsClimate policy target
0102030405060708090
1990 1995 2000 2005 2010 2015 2020
%
DNK incl. biomassOECD incl. biomassDNK excl. biomassOECD excl. biomass
Share of renewable sources in electricity generation
60
80
100
120
140
160
2000 2002 2004 2006 2008 2010 2012 2014 2016 2018
Stock of private carsRoad passenger transportCO2 emissions from transportEmission intensity of vehicles
Index 2000 = 100

| 7
OECD ECONOMIC SURVEYS: DENMARK 2021 © OECD 2021
MAIN FINDINGS KEY RECOMMENDATIONS Macroeconomic policies to support the recovery
The recovery is well established, with important downside risks from further virus outbreaks and upside risks from continued strong demand and labour market pressures. Fiscal tightening is planned for 2022, with DKK 4 billion (0.17% of GDP) set aside for COVID-related measures.
Continue to withdraw exceptional COVID-related measures in 2022, as planned. Be prepared to resume targeted support if an unexpected deterioration of the health situation threatens domestic and external demand.
Fiscal policy is sustainable, but the Budget Law leaves little fiscal space to meet longer-term challenges.
Provide greater flexibility in the fiscal rule over the medium term by allowing a larger deficit, without threatening fiscal sustainability.
Top income tax rates are among the highest in the OECD, with negative consequences for incentives to increase earnings by working more or further education. High taxes on capital income blunt incentives for entrepreneurship, investment and job creation.
Reduce top income tax rates while offsetting revenue and distributional consequences by increasing taxes on owner-occupied housing and environmental harm.
An acceleration of house and equity prices amid high household debt is increasing macroeconomic and financial stability risks as the economy recovers.
Be ready to tighten macroprudential regulation if risks continue to build, for example by introducing general debt-to-income limits.
Boosting labour market inclusion and productivity Female labour force participation is high and the gender wage gap low, but women still suffer a motherhood penalty and there are few women in leadership positions.
Implement planned increase in parental leave reserved for fathers and increase payment rates if take-up disappoints.
Benefits from immigration are hampered by the large gap in employment and education between immigrants and native Danes, with immigrants particularly badly affected by the COVID crisis.
Improve immigrant integration programmes by broader adoption of best practices across municipalities, especially for language training, and extension of the Integration Education Programme.
A climate strategy that minimises adverse economic consequences Denmark’s ambitious domestic climate targets will be challenging to achieve, making complementary structural reforms important.
Continue the implementation of a well-balanced policy mix of pricing, regulatory measures, investment and structural reforms to cut domestic emissions.
The scope and evolution of carbon pricing is still to be defined and will not be implemented before 2023, delaying action and thus increasing costs to meet targets.
Clarify and communicate the climate strategy at an early stage, so as to reduce policy uncertainty and encourage firms and households to prepare for upcoming changes. Make emission pricing outside the EU Emissions Trading System more uniform by implementing a minimum price that reflects the evolution of prices in the EU Emissions Trading System.
Denmark’s business-friendly regulatory settings, labour market flexibility and reskilling policies will help unleash private investment and reallocation needed for the transition to net zero emissions.
Continue to undertake regulatory reform to facilitate market entry, competition and skill formation, such as for district heating, passenger rail and carbon capture and storage.
Acceptability of climate mitigation policies can be hindered by fear of adverse distributional consequences. Distributional consequences from emission pricing can be offset by reducing high energy taxes.
Offset distributional consequences of climate policy in a transparent manner via reduced taxation of renewable energy, means-tested transfers and support to labour-market reallocation.
The threat of carbon leakage can hinder action in some sectors and reduce policy effectiveness. Any compensation for affected firms should be delinked from their emissions to maintain incentives to reduce emissions per unit of production.
Provide time-limited rebates of emission pricing based on production levels in emissions-intensive trade-exposed industries, informed by an institutionalised assessment of leakage rates. A second-best solution could be to provide time-limited subsidies for investment in abatement technologies, such as carbon capture and storage.
Cutting emissions from heating, transport and agriculture Heavy reliance on woody biomass, for district heating in particular, reduces availability of scarce biomass for other uses.
Better align incentives for woody biomass use with its climate and environmental impact. Ease regulation of district heating to allow private investment to drive a shift towards new technologies, such as large capacity heat pumps.
Transport emissions remain high, in part because replacing the stock of conventional vehicles takes decades.
Continue to encourage the shift towards low and zero-carbon vehicles, including with incentives to invest in recharging stations particularly in remote areas.
Emissions from agriculture are disproportionally high relative to the share of the sector in the economy and are among the most cost-effective to reduce.
Prioritise action at the EU level and support further reform of the Common Agricultural Policy to include ambitious climate (and environmental) measures, and more particularly a large shift of EU subsidies from agricultural land to ecosystem services.

8 |
OECD ECONOMIC SURVEYS: DENMARK 2021 © OECD 2021
The Danish economy has recovered quickly from the COVID-19 crisis. Rapid action to support firms and households contained the economic contraction to one of the mildest in Europe, while fast vaccine rollout enabled the removal of shutdown restrictions and an early reopening. Policy support should continue to be removed where activity has recovered, though the uncertain worldwide health and economic situation warrants ongoing flexibility. Monetary policy is set to remain strongly expansionary, increasing the importance of being ready to tighten macroprudential regulation if risks from rapid house price appreciation continue to build. The crisis was worse for the young, the foreign-born and those with low educational attainment. While employment rates for these groups have now recovered, policy should return to addressing long term structural issues facing these groups, such as helping the labour-market entry of young people and improving the integration of migrants.
1 Key Policy Insights

| 9
OECD ECONOMIC SURVEYS: DENMARK 2021 © OECD 2021
Introduction
The Danish economy performed solidly in the decade preceding the COVID-19 pandemic, with real GDP growth averaging 1.8% per year driven primarily by labour productivity growth (Figure 1.1, Panel A). Successive Danish governments have favoured policy settings that have led to high labour-market flexibility, market competition, strong adoption of digital tools and a business-friendly climate, which have underpinned investment and productivity (Figure 1.1, Panel B). This has been done while reducing environmental damages and maintaining social policies conducive to high inclusiveness.
The arrival of the COVID-19 pandemic in 2020 caused substantial disruption and loss of life. Denmark suffered a first wave of cases in the second quarter of 2020, a more deadly second wave in early-2021, and a resurgence in late 2021 linked to the spread of the virus’s Delta variant. Thanks to rapid action to control the virus and strong fiscal support, the contraction of activity and employment has been milder than expected. Progress in health protocols, together with high vaccination rates, allowed an early reopening of the economy. Activity bounced back in the second quarter, with GDP and employment surpassing pre-crisis levels, and growth is projected to remain solid in the absence of further worsening in the health situation.
Figure 1.1. Labour productivity is high and growth has been solid
Note: Other Nordics refers to a simple average of Finland, Iceland, Norway and Sweden. Labour productivity is defined as GDP per hour worked. Source: OECD, National Accounts and Productivity databases.
StatLink 2 https://stat.link/gt5cfk
Government measures have helped those who were hit the hardest by the crisis. Young people (those aged 15-34) and the foreign-born saw the biggest declines in employment at the height of the crisis, though employment for these groups had recovered by mid-2021 (Statistics Denmark, 2021[1]). The loss of employment during the crisis was also severe among those with low educational attainment, in contrast to employment gains recorded for people with tertiary education (Statistics Denmark, 2021[1]).
In the short term, Denmark is withdrawing exceptional support for liquidity, households and the health system, while keeping some funds in reserve in case further COVID-related spending is necessary. Once the recovery is well established, it should resume its strong focus on structural changes to achieve strong, resilient and inclusive post-pandemic growth. Medium-term objectives include climate policy, preparing for an ageing population, and accelerating the country’s digital transformation. While Danish firms are overall well placed to benefit from digital transformation, more could be done to boost the diffusion of ICT tools and productivity.
30
35
40
45
50
55
60
65
70
2000 2002 2004 2006 2008 2010 2012 2014 2016 2018 2020
A. GDP per capitaUSD thousand, constant prices, 2015 PPPs
United StatesDenmarkOther NordicsEuro areaOECD
-0.4-0.20.00.20.40.60.81.01.21.41.6
ITA
LUX
NLD
BEL
GBR
FRA
NOR
DEU
CAN
NZL
FIN
JPN
CHE
AUT
DNK
AUS
SWE
USA
B. Labour productivity growth decompositionAnnual average, 2000-2019, %
Multifactor productivity
Capital deepening

10 |
OECD ECONOMIC SURVEYS: DENMARK 2021 © OECD 2021
Lowering carbon emissions is at the heart of the recovery strategy. Denmark has had considerable success in reducing its greenhouse gas emissions over the past decade. To continue this trend, the Climate Act adopted by Parliament in 2020 has set an ambitious legal obligation to reduce carbon emissions by 70% relative to 1990 by 2030 – one of the most ambitious abatement objectives among OECD countries. Denmark intends to lead by example and to encourage other countries to follow its course. However, such deep cuts in emissions will be difficult to achieve with existing technologies, and failing to prioritise the most cost-effective abatement opportunities would increase costs from the transition. Designing climate policies that minimise adverse economic and social consequences will therefore be crucial, though there will still be a structural adjustment challenge as decarbonisation creates winners and losers (Chapter 2). In theory, high carbon prices encourage efficient cuts in emissions, but they often face low acceptability by households, even in Denmark, and as for other environmental policy measures, they can affect competitiveness of trade-exposed firms. As a first step, emission pricing should be made more uniform through a minimum price of EUR 60 per tonne of CO2e, complemented by measures to mitigate social impacts. They should continue to be complemented by measures to accelerate private investment in low-carbon activities such as easier regulatory measures to facilitate market entry, public investment in green networks, and support to research and development in clean technologies.
Cutting emissions from energy, transport and agriculture will be particularly challenging. These sectors face large transformations – both challenges and opportunities (Chapter 3). For these transformations to be economically sustainable, a supportive policy environment should facilitate the emergence of new and innovative firms that challenge incumbents, flexibility to reallocate labour and capital, and support for reskilling displaced workers. The Danish system of “flexicurity” has been well-suited to similar challenges in the past, and should once again be helpful. While Denmark can act on its own in many areas, it will need to take into account policy changes at the broader level of the European Union, which are likely to be important, though future EU climate policies remain uncertain at present.
Against this background, the key messages of this Economic Survey are that:
• Denmark weathered the COVID-19 crisis relatively well and has returned to solid growth. Withdrawal of exceptional fiscal support is warranted, but the government needs to be ready to restore substantial stimulus should the health situation unexpectedly deteriorate. As the recovery is now well established, structural reforms should once again be the main driver of strong and sustainable growth.
• The crisis was worse for the young, the foreign-born and those with low educational attainment. While employment rates for these groups have now recovered, policy should return to addressing long term structural issues facing these groups, such as helping the labour-market entry of young people and improving the integration of migrants. Further progress in reducing gender gaps is also a priority.
• Denmark has made the commendable commitment to cut its carbon emissions rapidly. However, achieving deep cuts while managing the socioeconomic consequences will be a challenge. The focus needs to be put on encouraging private investment and innovation in clean technologies. A just transition should help those adversely affected by climate policy.
Denmark weathered the crisis well, but imbalances are increasing
Denmark weathered the COVID-19 crisis better than other countries, as rapid action to contain the spread of the virus in March 2020 and again in December 2020 was successful in quickly bringing down the number of cases (Figure 1.2, Panel A) and containing mortality (Figure 1.2, Panel B). Combined with one of the fastest vaccination rollouts in the EU, this provided space to ease containment measures earlier than in many countries, though uncertainties prevail regarding future virus mutations and the situation is still precarious. Proof of vaccination or a recent negative test was again required for visits to restaurants,
| 11
OECD ECONOMIC SURVEYS: DENMARK 2021 © OECD 2021
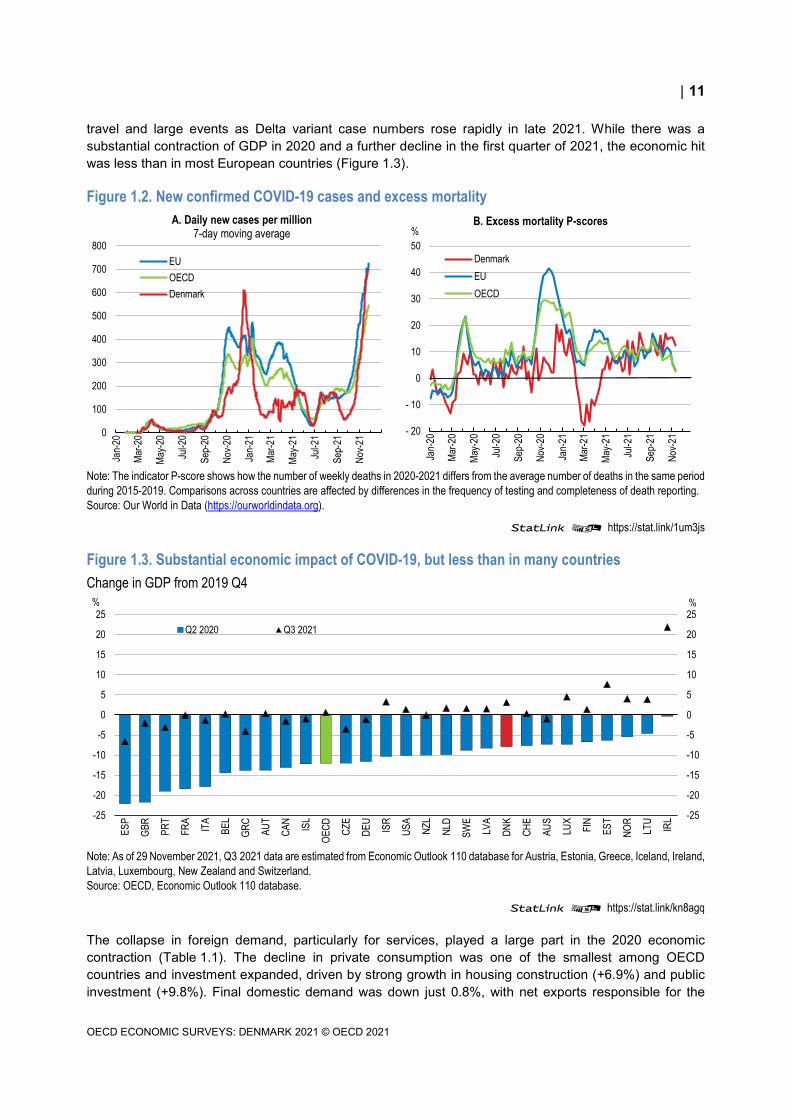
travel and large events as Delta variant case numbers rose rapidly in late 2021. While there was a substantial contraction of GDP in 2020 and a further decline in the first quarter of 2021, the economic hit was less than in most European countries (Figure 1.3).
Figure 1.2. New confirmed COVID-19 cases and excess mortality
Note: The indicator P-score shows how the number of weekly deaths in 2020-2021 differs from the average number of deaths in the same period during 2015-2019. Comparisons across countries are affected by differences in the frequency of testing and completeness of death reporting. Source: Our World in Data (https://ourworldindata.org).
StatLink 2 https://stat.link/1um3js
Figure 1.3. Substantial economic impact of COVID-19, but less than in many countries Change in GDP from 2019 Q4
Note: As of 29 November 2021, Q3 2021 data are estimated from Economic Outlook 110 database for Austria, Estonia, Greece, Iceland, Ireland, Latvia, Luxembourg, New Zealand and Switzerland. Source: OECD, Economic Outlook 110 database.
StatLink 2 https://stat.link/kn8agq
The collapse in foreign demand, particularly for services, played a large part in the 2020 economic contraction (Table 1.1). The decline in private consumption was one of the smallest among OECD countries and investment expanded, driven by strong growth in housing construction (+6.9%) and public investment (+9.8%). Final domestic demand was down just 0.8%, with net exports responsible for the
- 20
- 10
0
10
20
30
40
50
Jan-
20
Mar-2
0
May-2
0
Jul-2
0
Sep-
20
Nov-2
0
Jan-
21
Mar-2
1
May-2
1
Jul-2
1
Sep-
21
Nov-2
1
%B. Excess mortality P-scores
DenmarkEUOECD
0
100
200
300
400
500
600
700
800
Jan-
20
Mar-2
0
May-2
0
Jul-2
0
Sep-
20
Nov-2
0
Jan-
21
Mar-2
1
May-2
1
Jul-2
1
Sep-
21
Nov-2
1
A. Daily new cases per million7-day moving average
EUOECDDenmark
-25
-20
-15
-10
-5
0
5
10
15
20
25
-25
-20
-15
-10
-5
0
5
10
15
20
25
ESP
GBR
PRT
FRA
ITA
BEL
GRC
AUT
CAN ISL
OECD CZ
E
DEU
ISR
USA
NZL
NLD
SWE
LVA
DNK
CHE
AUS
LUX
FIN
EST
NOR
LTU IRL
%%
Q2 2020 Q3 2021

12 |
OECD ECONOMIC SURVEYS: DENMARK 2021 © OECD 2021
majority of the contraction in GDP. This reflected a smaller effect of the first wave of the virus within Denmark, with bigger contractions in major trading partners translating to lower external demand, even as the composition of Danish exports increased resilience (see below). Exceptional fiscal support supported domestic demand during 2020, in particular via wage subsidies and disbursement of frozen holiday allowances (Box 1.1).
Table 1.1. The Danish economy has recovered rapidly in 2021 and capacity use is set to tighten
Annual percentage change, volume (2015 prices)
2018 Current prices
(DKK billion)
2019 2020 2021 2022 2023
Gross domestic product (GDP) 2 253.6 2.9 -2.7 4.7 2.4 1.7 Private consumption 1 052.8 1.4 -1.9 3.3 3.7 1.7 Government consumption 546.7 1.2 -0.1 4.7 -0.3 0.5 Gross fixed capital formation 496.4 2.8 2.1 8.3 3.2 3.1 Housing 107.2 6.3 6.9 13.1 1.4 2.8 Business 313.6 2.7 -1.4 7.0 4.4 3.3 Government 75.6 -1.6 9.8 6.2 1.1 2.8 Final domestic demand 2 095.9 1.7 -0.5 4.9 2.5 1.7 Stockbuilding1 19.6 -0.3 -0.2 -0.3 0.2 0.0 Total domestic demand 2 121.1 1.4 -0.8 4.5 2.7 1.7 Exports of goods and services 1 268.6 5.0 -7.7 3.4 3.2 3.6 Imports of goods and services 1 136.1 2.4 -2.1 0.5 -0.1 04.0 Net exports1 132.5 1.6 -2.1 0.5 -0.1 0.0 Other indicators (growth rates, unless specified)
Potential GDP 1.8 1.6 1.5 1.5 1.5 Output gap (% of potential GDP) 1.6 -2.7 0.3 1.2 1.4 Employment . . 1.5 -0.8 1.0 1.2 0.5 Working-age population (15-74)
0.2 -0.2 -0.3 -0.3 -0.2
Unemployment rate (% of labour force) . . 5.0 5.6 4.9 4.2 4.2 GDP deflator . . 0.7 2.3 1.4 1.6 2.3 Consumer price index . . 0.8 0.4 1.8 2.6 2.3 Core consumer prices (excluding food and energy) . . 0.8 0.9 1.2 2.0 2.3 Household saving ratio, net (% of disposable income) . . 3.6 5.8 5.7 3.8 3.7 Current account balance (% of GDP) . . 8.7 8.2 7.6 7.7 7.7 General government fiscal balance (% of GDP) . . 4.0 -0.2 -1.5 0.3 0.8 Underlying general government fiscal balance2 3.0 1.9 -1.1 -0.7 -0.3 Underlying government primary fiscal balance2 3.0 1.8 -1.3 -1.0 -0.7 General government gross debt (% of GDP) . . 48.1 58.8 56.4 55.0 54.6 General government gross debt (Maastricht, % of GDP) . . 33.3 42.2 39.8 38.4 38.0 General government net debt (% of GDP) -6.3 -11.3 -9.2 -9.1 -9.5 Three-month money market rate, average . . -0.4 -0.2 -0.2 -0.3 -0.2 Ten-year government bond yield, average . . -0.2 -0.4 -0.1 -0.1 -0.1
1. Contribution to change in real GDP. 2. As a percentage of potential GDP. Source: OECD, Economic Outlook 110 database. The cut-off date for information used in the projections was 25 November 2021.

| 13
OECD ECONOMIC SURVEYS: DENMARK 2021 © OECD 2021
Box 1.1. Exceptional fiscal support during the COVID crisis Initial broad support for badly affected firms and households The Danish Government acted quickly and decisively to provide fiscal support during the crisis. Throughout 2020, VAT and tax payments for firms of DKK 276 billion (11.8% of GDP) were postponed. In 2021 tax payments for firms of a further DKK 57 billion (2.3% of GDP) were postponed. The last postponed tax payment has been deferred until January 2022. Firms have also had the opportunity to apply for interest-free loans from the Danish government for VAT and tax payments for a total amount of DKK 258 billion (10.6% of GDP) from April 2020 to June 2021. Firms have received loans for a total amount of DKK 36.1 billion (1.5% of GDP). The loans were initially planned to be due for repayment from November 2021 to May 2023. To provide further liquidity, repayment dates for DKK 20.8 billion (0.9% of GDP) of loans for have been postponed to begin from April 2022.
In addition to the measures to improve liquidity through deferred payments and loans, compensation has been provided to firms and self-employed people with declines in turnover of at least 30%, later increased to 45% at an estimated cost of DKK 79 billion (3.4% of GDP) as of June 2020. This compensation was subsequently extended, specifically to companies affected by restrictions between September and December 2020 and more broadly from December 2020 to June 2021. Entitlement periods for unemployment and sick leave benefits were frozen and job search requirement cancelled.
Wage compensation was made available for employees of firms experiencing large falls in demand, with the government covering at least 75% of salary for hours not worked. Following extensions, wage compensation expired on 31 August 2020 but was reintroduced in December 2020 and ran until 30 June 2021. Two loan guarantee schemes were launched, with DKK 66 billion (2.8% of GDP) in off-balance sheet funding. Additional measures to support the financial system included release of the counter-cyclical capital buffer and extraordinary lending facilities from the central bank.
Subsequent stimulus packages targeted household incomes and green investment A further stimulus package was agreed in June 2020, totalling around 2.5% of GDP in 2020 and 0.8% in 2021, including some previously announced and off-budget measures. Releasing holiday allowances from mandatory pension savings boosted household income by about 1½ per cent of GDP after tax. Frontloading of energy renovation of social housing was expected to boost investment by 0.2% of GDP in 2020 and 0.4% in 2021. A one-off payment of DKK 1000 to transfer recipients was estimated to cost DKK 2.3 billion (0.1% of GDP). The package also included a temporary increase in the R&D enhanced tax allowance to 130% in 2020 and 2021 (later extended to 2022) for R&D expenses up to DKK 850 million.
Finally, in December 2020 the green recovery package for 2021-22 passed at an estimated cost of 2.6% of GDP, partly funded by EU Recovery and Resilience Facility grants. This package included another disbursement of holiday allowances in March 2021, expected to boost incomes by DKK 22 billion (0.9% of GDP) after tax. More funds were allocated to support firms affected by restrictions over the winter and for investments that reduce greenhouse gas emissions in energy, buildings, transport and agriculture. About 0.7% of GDP was allocated in 2021 to compensate the mink industry, which had to cull its stock in late 2020 following infection with a mutated strain of COVID-19. Further funding was provided to increase the generosity of the “housing-job scheme”, which gives tax deductions for household services such as cleaning and childcare and for the costs of energy saving renovations of private homes.
Actual expenditure in 2020 was well below expectations and small by international comparison As of June 2020, the Ministry of Finance estimated the cost of COVID packages at DKK 125 billion (5.4% of GDP). Despite extension and expansion of aid, total expenditure in 2020 has been tentatively

14 |
OECD ECONOMIC SURVEYS: DENMARK 2021 © OECD 2021
estimated by the Danish Economic Councils (2021[2]) at less than DKK 50 billion (2.2% of GDP). Public consumption, wage compensation and transfers increased roughly in line with expectations, but compensation to badly affected firms and calls on guarantee schemes were substantially less than expected. After accounting for the fall in revenue, the budget balance declined by almost 5% of GDP in 2020, which is large historically but among the smallest declines in OECD countries.
Source: Danish government information releases; Danish Economic Councils (2021[2]); OECD Economic Outlook database.
A rapid recovery in consumption began in March 2021 as virus containment measures eased (Figure 1.4, Panel A). Household consumption exceeded the pre-crisis (2019) level in the second quarter of 2021. However, spending was roughly flat from the start of June as the immediate rebound ended, and additional savings built up during the crisis had not yet been spent by mid-2021 (Figure 1.4, Panel B). While the decline in private consumption during the crisis was smaller than elsewhere, forced saving during lockdowns in conjunction with an increase in government transfers to households saw a considerable increase in the household saving rate, which reached its highest level in at least 20 years during the second quarter of 2020 and again in the first quarter of 2021. The rapid rebound in consumption spending as constraints ease is consistent with the small role of precautionary saving (Danmarks Nationalbank, 2021[3]), reflecting the relatively milder downturn in Denmark and strong social safety net. Consumer confidence has also recovered, turning positive in May for the first time since the pandemic began.
Figure 1.4. Consumption has recovered, but savings built up in the crisis have not yet been spent
Note: The spending data is based on online and offline transactions, both domestically and abroad, with cards and MobilePay in stores for around 1 million Danske Bank Danish personal customers with active accounts. The series shown are two-week centred moving average of daily data. The household saving ratio is underestimated in late 2020 and early 2021 due to tax paid on released holiday allowances. Data for 2021Q1 and 2021Q2 are estimates based on national accounts data released to date. Source: Danske Bank; OECD, Economic Outlook database; and Statistics Denmark
StatLink 2 https://stat.link/8vnmp4
The consequences of the crisis varied considerably across the economy, with some industries such as agriculture, manufacturing, construction and information and communication expanding production (Figure 1.5). Materials shortages were constraining production in about 35% of industrial companies as of mid-2021, although differences in specialisation have meant this problem has not been as severe as in neighbouring countries. Public sector employment expanded, particularly in the health sector as testing and vaccination capacity ramped up. Conversely, industries requiring face-to-face contact were particularly badly hit, such as trade, transport, hotels and restaurants as well as cultural services.
0
1
2
3
4
5
6
7
8
9
10
11
2019Q1 2020Q1 2021Q1
B. Household saving ratioPercent of disposable income
Household saving ratio
Average 2013-2019-40
-30
-20
-10
0
10
20
30
40
50
60
Jan-20 Apr-20 Jul-20 Oct-20 Jan-21 Apr-21 Jul-21 Oct-21
A. Cards and MobilePay spendingPercentage change from the same period in 2019
Total spendingOnlineOffline

| 15
OECD ECONOMIC SURVEYS: DENMARK 2021 © OECD 2021
The COVID-19 crisis disrupted an almost decade-long strengthening of the labour market, although the increase in unemployment was smaller than in most OECD countries (Figure 1.6). The small effect on aggregate unemployment reflects the success of the government-supported wage compensation (or job retention) scheme in preventing job separations, as well as rapid recovery once the virus situation improved. Around 250 000 employees (9% of all employees) were on wage compensation in spring 2020 and early estimates indicate that government policy support saved 81,000 jobs (Bennedsen, Birthe Larsen and Scur, 2020[4]). Sectors badly affected by the crisis, such as hospitality, culture, leisure and retail were over-represented in the take-up of wage compensation (Andersen, Svarer and Schrøder, 2020[5]). When the scheme ended temporarily in August 2020, over 90% of those who had been on wage compensation were back in employment by October (Danish Economic Councils, 2021[2]). The take up of wage compensation was lower during the second wave, peaking at 100 000 in January 2021.
The labour market recovered rapidly from spring 2021, with declining unemployment, a high number of job postings and increasing labour shortages across much of the economy. Shortages can be expected to ease as the immediate rebound ends, the job matching process has time to operate, increases in the retirement age boost participation, and excess labour in the health sector is released. At the same time, decreasing spare capacity will put upward pressure on wages through 2022. Wage pressures remain contained overall (+2.6% in the year to the second quarter of 2021, or +3.1% in the private sector), but are higher in some industries, notably construction, real estate, and information and communication.
By avoiding a larger labour market disruption, the wage compensation scheme has reduced the magnitude of any “scarring” effects on long-term labour market outcomes due to the crisis. Long-term unemployment, which increases the risk of scarring and entrenched labour market disadvantage, rose during the crisis but remains lower than following the Global Financial Crisis (Danish Economic Councils, 2021[2]). Long-term unemployment comprises a relatively small share of total unemployment in comparison with other OECD countries. The downside of a wage compensation scheme is the risk of impeding reallocation in response to structural adjustments, which would normally be facilitated by the flexibility, low level of employment protection and high active labour market program spending inherent in Denmark’s “flexicurity” model (Box 1.2). The phase-out of the wage compensation scheme in June 2021 reduces this risk, as does the temporary nature of the COVID crisis. However, there is some evidence that the COVID shock may have accelerated labour reallocation already underway in the Danish economy, with relatively low-skilled occupational groups that were already in decline prior to the crisis most likely to see high take-up of wage compensation (Mattana, Smeets and Warzynski, 2020[6]).

16 |
OECD ECONOMIC SURVEYS: DENMARK 2021 © OECD 2021
Box 1.2. The Danish “flexicurity” labour market model
The Danish flexicurity model is characterised by three core elements: flexible rules for hiring and dismissals, generous replacement rates of unemployment insurance benefits, and substantial active labour market policies. Furthermore, the labour market is largely organised by social partners, through broad based collective agreements. Two thirds of Danish workers are union members and labour issues such as minimum wages, working hours and holidays are mainly covered by collective agreements rather than Danish law.
The flexicurity model in its current form was largely developed through the 1990s. A substantial decrease in the duration of unemployment benefits and a much stronger emphasis on active labour market policies was implemented to promote return to work through upskilling and to ensure that the unemployed are available to the labour market. Together with a prolonged economic boom, these adjustments are seen as a major driver of the decrease in structural and actual unemployment since the mid-1990s (Unemployment Benefit Commission, 2015[7]).
The main advantage of flexicurity is that it limits the financial risk to both employers and employees. The high degree of flexibility allows companies to make quick adjustments to their work force in the different phases of the business cycle, reducing the risk associated with hiring new staff. At the same time, the high unemployment replacement rate limits the risk for employees when taking up a new job, and allows for consumption smoothing in case of joblessness. The model delivers a high rate of job turnover and low skills mismatches compared with other OECD countries. During the global financial crisis, a sustained increase in structural unemployment was avoided as the flexicurity system enabled a large proportion of the jobless to find employment relatively quickly (Eriksson, 2012[8]).
The Danish flexicurity system is nevertheless expensive, due to the high replacement rate of unemployment benefits and the highest spending on active labour market policies in the OECD.
Source: OECD (2016), OECD Economic Surveys: Denmark, Ministry of Foreign Affairs of Denmark (2021), The Danish Labour Market.
Figure 1.5. Outcomes during the COVID crisis have varied considerably by industry Real value added, percentage change between 2021 Q1 and 2019 Q4
Source: OECD, Quarterly National Accounts database.
StatLink 2 https://stat.link/xuf9my
-10
-5
0
5
10
15
-10
-5
0
5
10
15
All a
ctivit
ies
Agric
ultur
e, fo-
restr
y & fis
hing
Indus
try,
incl. e
nerg
y
of wh
ich:
Manu
factur
ing
Cons
tructi
on
Total
ser
vices
Trad
e, tra
nspo
rt,ho
tels &
resta
uran
ts
Infor
matio
n and
comm
unica
tion
Finan
ce &
insur
ance
Real
estat
e acti
vities
Busin
ess s
ervic
es
Publi
c adm
inistr
ation
,co
mpuls
ory s
oc.se
c.,ed
uc., h
uman
healt
h
Othe
r ser
vices
%%
-37.4

| 17
OECD ECONOMIC SURVEYS: DENMARK 2021 © OECD 2021
Figure 1.6. The increase in unemployment was smaller than in most OECD countries
Increase in unemployment rate from 2019 Q4
Note: As of 8 December 2021, 2021 Q3 data are estimates for Austria, France, Greece, Slovak Republic, Slovenia and Switzerland. Source: OECD, Economic Outlook database.
StatLink 2 https://stat.link/drwch7
Danish trade is diversified in terms of destinations and commodities (Figure 1.7). Products that are less sensitive to fluctuations in foreign activity, such as agriculture, pharmaceuticals and green technologies, underpinned an increase in Danish export market share during 2020, even as exports declined overall due to the collapse of foreign demand. Uncertainty around the exit of the United Kingdom from the EU was significantly reduced by the finalisation of a trade agreement, avoiding a worst case scenario that could have seen Danish exports to the UK fall by 17% (Smith, Hermansen and Malthe-Thagaard, 2019[9]).
Exports of services fell more than goods during the crisis, in part due to the collapse in international tourism. Shipping is Denmark’s biggest service export and the value of sea transport exports declined but then recovered (in part driven by price increases from global supply constraints), whereas exports of travel, construction and business services have been recovering more slowly (Statistics Denmark, 2021[10]). As for neighbouring countries, Denmark was a net importer of travel services prior to the crisis, as Danes spent more on travel abroad than international visitors spent in Denmark (OECD, 2020[11]). During the crisis, exports of travel services declined to a similar extent as imports, with little change in the overall balance.
Denmark’s large current account surplus fell slightly to 8.2% of GDP in 2020 as exports contracted by more than imports. The current account surplus reflects the gap between (particularly) high saving and low domestic investment, as strong returns on international investment combine with a trade surplus, and is assessed by the IMF (2021[12]) to be stronger than implied by medium-term fundamentals and desirable policies. The strong peg of the Danish Krone to the Euro may also contribute to the current account surplus if it contributes to undervaluation of the currency, though evidence on valuation relative to fundamentals is mixed (IMF, 2021[12]). The external imbalance acts as a drain on demand elsewhere in the European Union but also provides a source of financing for investment in other countries. Denmark had a current account deficit as recently as 1998, building up a substantial surplus since then as a consequence of tax revenue from North Sea oil production, tax reforms that have reduced interest rate deductability and pension reforms. The pension system has been gradually shifting from a pay-as-you-go system to a generous fully funded system, which is associated with an increase in national saving and therefore an increasing current account balance (Koomen and Wicht, 2021[13]).
-4.0
-3.0
-2.0
-1.0
0.0
1.0
2.0
3.0
4.0
-4.0
-3.0
-2.0
-1.0
0.0
1.0
2.0
3.0
4.0
FRA
GRC
NLD ITA
PRT
NZL
DEU
AUS
NOR
LUX
DNK
LTU
GBR
CZE
FIN
CHE
ISR
BEL
OECD LV
A
ESP
SWE
USA
CAN
EST
IRL
AUT
ISL
% points% points
2021 Q12021 Q3

18 |
OECD ECONOMIC SURVEYS: DENMARK 2021 © OECD 2021
The demographic shift to a higher share of older people with a low propensity to save is set to reduce the current account via the saving rate, but this effect is likely to be small (Leszczuk and Pojar, 2016[14]). A sustainable increase in public and private investment would bring the current account closer to balance and several recommendations in this Survey push in this direction, including shifting towards less distortionary taxation that creates less disincentives to investment, providing more support to green investment and R&D, and relaxing the medium-term deficit limit in the Budget Law. Conversely, recommendations to tighten macroprudential policy and mortgage interest deductions could increase already high saving rates.
Consumer price inflation picked up to 3% in October 2021, following weak price growth in 2020. The pickup reflects a recovery in commodity prices and supply constraints (particularly affecting container shipping) as economies reopen globally. A gradual acceleration in wage growth, notably in construction where annual wage growth approached 4% in mid-2021, is set to underpin more durable price growth as the recovery of the economy sees spare capacity used up. Policy measures that support industries, such as construction, with little spare capacity should be better targeted, for example by reforming the housing-job scheme (BoligJobordningen) to better support cost-effective energy savings (Chapter 3).
GDP is forecast to grow by 2.4% in 2022 and 1.7% in 2023 (Table 1.1 above). A contraction in the first quarter of 2021 gave way to strong growth as vaccination enabled a gradual relaxation of containment measures, with economic activity further supported by the global recovery. The recovery is now well established, with output and labour market indicators consistent in showing that little spare capacity remained in the second half of 2021.
The divergence between economic conditions in Denmark and the Euro Area is likely to see expansionary ECB monetary policy becoming less well-suited to Denmark. Denmark has maintained a fixed currency peg for almost 40 years, which has reduced uncertainty from exchange rate volatility and enjoys broad political support. The peg to the euro means that Denmark’s monetary policy is de facto set by the ECB, with negative real interest rates contributing to credit growth. As the recovery in Denmark picks up speed, the level of interest rates will be lower than indicated by the level of inflation and extent of spare capacity (Figure 1.8). Fiscal and/or macroprudential policy may need to be tighter to prevent overheating, though inflation is still projected to remain contained in the near term.
Figure 1.7. Trade is diverse in terms of recipient countries and products Share of total exports, 2020
Source: Statistics Denmark.
StatLink 2 https://stat.link/432vrp
Germany13%
Sweden9%
Netherlands6%
Norway6%
United Kingdom
5%United States
4%Other OECD
Europe19%
Other OECD4%
China4%
Rest of the world30%
A. Main export destinationsMeat, dairy and fish
10%
Other food & beverages
8%
Crude materials excl. fuels
3%
Mineral fuels, lubricants
3%
Medicinal & pharmaceutical
products20%Other
chemicals7%
Machinery equipment
21%
Transport equipment
4%
Apparel, clothing & footwear
5%
Other manufactured
goods18%
Other1%
B. Main export commodities

| 19
OECD ECONOMIC SURVEYS: DENMARK 2021 © OECD 2021
Figure 1.8. Interest rates are lower than befitting economic conditions in Denmark
Note: The Taylor rule rate is calculated as: i = annual real potential GDP growth + core inflation + 0.5 × output gap + 0.5 × (core inflation - 1.9). Source: OECD, Economic Outlook 110 database.
StatLink 2 https://stat.link/nhzw5p
The volatility of economic activity during 2020 and early 2021 points to substantial risks around the forecast. Slower progress in bringing the pandemic under control globally is the key downside risk, with potential under a worst case scenario for further substantial outbreaks (Table 1.2). Like other OECD countries, Denmark should re-orient its development assistance to contribute further to global efforts to reduce the risk of new strains and protect people in less developed countries, including by expanding its pledge to provide 1 million vaccine doses and USD 16 million to the COVAX initiative. A larger-than-expected increase in insolvencies as exceptional fiscal support is removed (see below) would slow jobs growth and put pressure on banks’ balance sheets, potentially combining with low bank profitability to constrain the availability of finance for new activity. On the upside, household spending of excess saving during the crisis would boost private expenditure and profits, with potential for positive feedback loops via faster wage growth as labour shortages intensify. Risks of overheating and accelerating price growth have increased with the fast pace of the recovery in 2021. A globally synchronised recovery could further boost demand for Danish exports and in particular Denmark could benefit from an upturn in demand for renewable energy technologies if green recovery packages become more extensive.
Table 1.2. Events that could lead to major changes in the outlook Vulnerability Possible outcomes
Multiple COVID-19 outbreaks over several years, for example due to vaccine-resistant strains.
Curtailment of activities where distancing is a concern, leading to firm failures and increased unemployment. Consumer and business uncertainty holding back consumption demand and investment, while depressed global demand weighs on exports.
Financial disruption spilling over to the housing market.
Interest rate rises or tightened credit conditions could adversely affect highly leveraged households, triggering house price falls spilling over to aggregate demand via negative wealth effects.
“Green swan” event: unexpected, catastrophic, irreversible and largely unhedgeable shock to the financial system due to physical or transition risks from climate change (Svartzman et al., 2020[15]).
Physical risks could see insurance claims and revaluation of assets exposed to sea level rise and flooding, potentially destabilising the financial sector and creating fiscal costs. The systemic shift inherent in large-scale structural change during the transition to a low-emissions economy may have major repercussions for the stability of financial systems, via abrupt asset revaluations, defaults on debt, and the creation of bubbles in rising industries (Semieniuk et al., 2020[16]).
Further increases in trade barriers globally. A new wave of protectionism would lower global trade and would be particularly harmful for Denmark’s small open economy.
-1
0
1
2
3
4
5
6
-1
0
1
2
3
4
5
6
2007 2008 2009 2010 2011 2012 2013 2014 2015 2016 2017 2018 2019 2020 2021 2022 2023
%%
Taylor rule interest rate
Short-term interest rate
20 |
OECD ECONOMIC SURVEYS: DENMARK 2021 © OECD 2021
House prices have risen rapidly
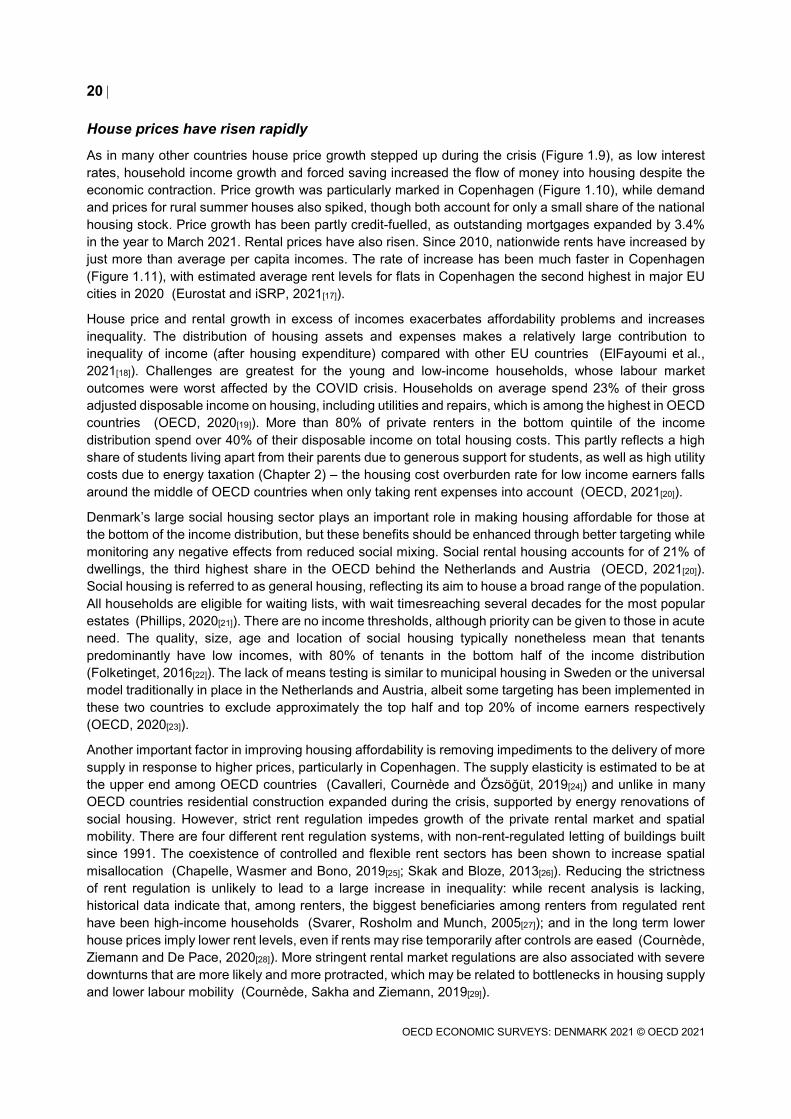
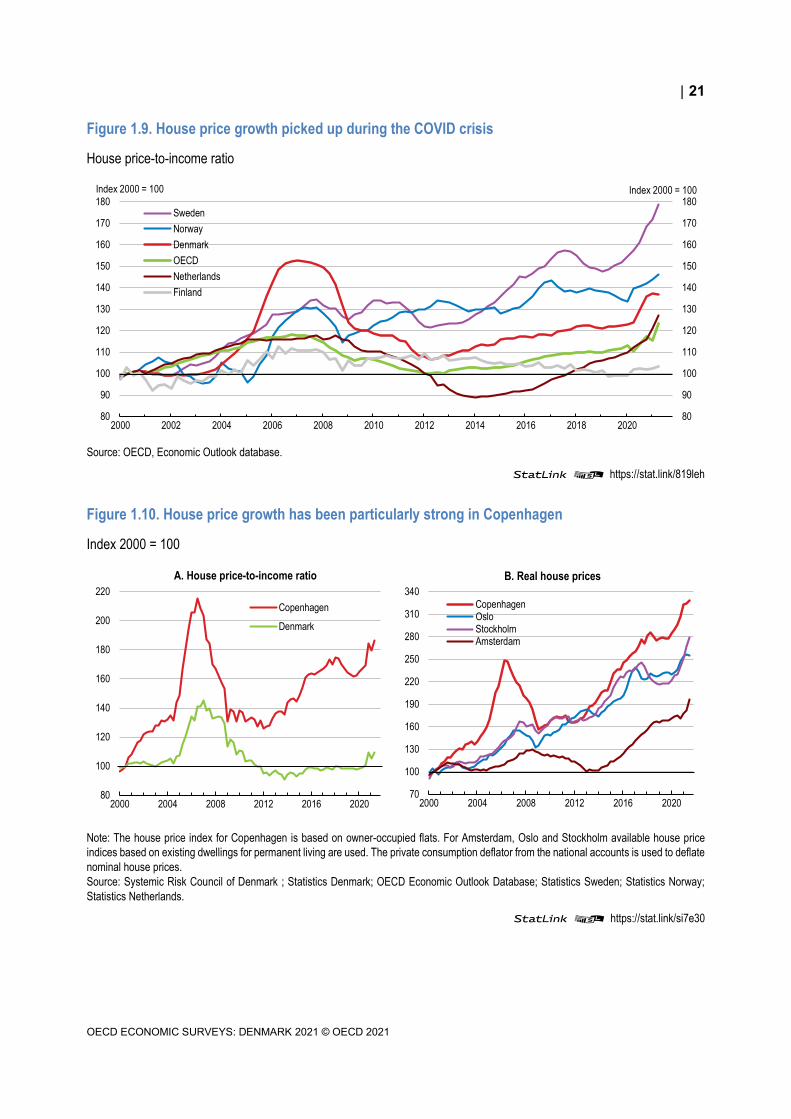
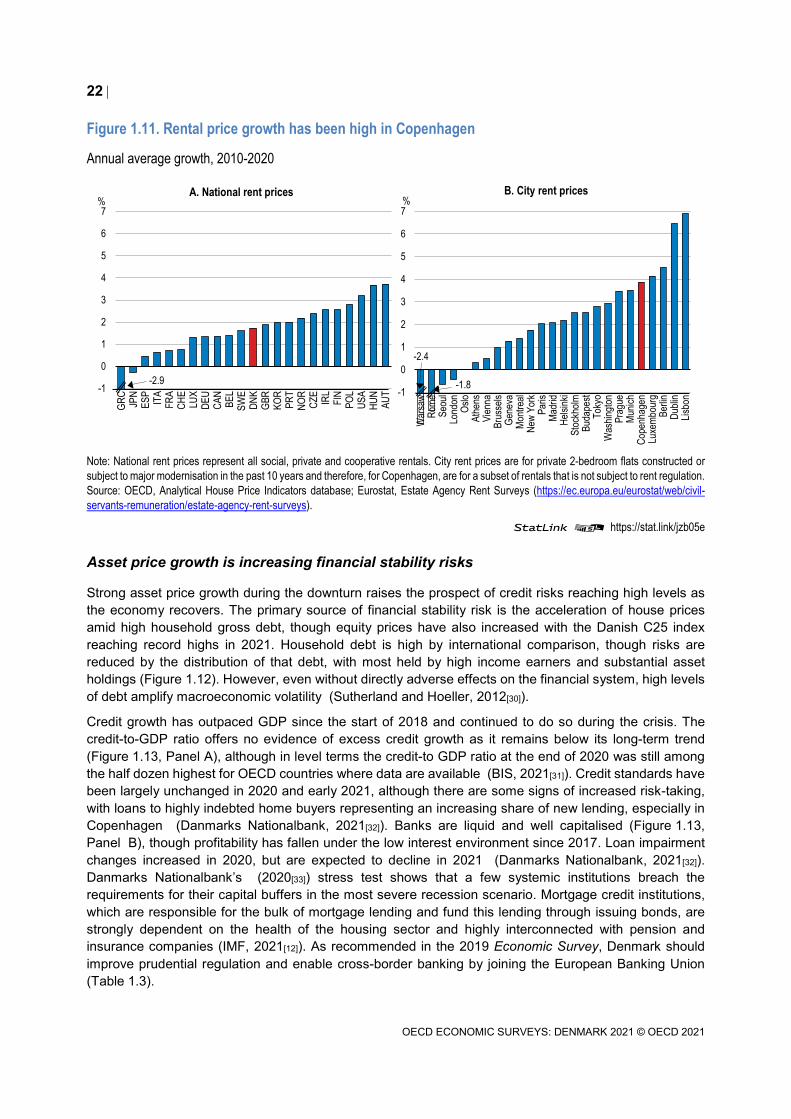
As in many other countries house price growth stepped up during the crisis (Figure 1.9), as low interest rates, household income growth and forced saving increased the flow of money into housing despite the economic contraction. Price growth was particularly marked in Copenhagen (Figure 1.10), while demand and prices for rural summer houses also spiked, though both account for only a small share of the national housing stock. Price growth has been partly credit-fuelled, as outstanding mortgages expanded by 3.4% in the year to March 2021. Rental prices have also risen. Since 2010, nationwide rents have increased by just more than average per capita incomes. The rate of increase has been much faster in Copenhagen (Figure 1.11), with estimated average rent levels for flats in Copenhagen the second highest in major EU cities in 2020 (Eurostat and iSRP, 2021[17]).
House price and rental growth in excess of incomes exacerbates affordability problems and increases inequality. The distribution of housing assets and expenses makes a relatively large contribution to inequality of income (after housing expenditure) compared with other EU countries (ElFayoumi et al., 2021[18]). Challenges are greatest for the young and low-income households, whose labour market outcomes were worst affected by the COVID crisis. Households on average spend 23% of their gross adjusted disposable income on housing, including utilities and repairs, which is among the highest in OECD countries (OECD, 2020[19]). More than 80% of private renters in the bottom quintile of the income distribution spend over 40% of their disposable income on total housing costs. This partly reflects a high share of students living apart from their parents due to generous support for students, as well as high utility costs due to energy taxation (Chapter 2) – the housing cost overburden rate for low income earners falls around the middle of OECD countries when only taking rent expenses into account (OECD, 2021[20]).
Denmark’s large social housing sector plays an important role in making housing affordable for those at the bottom of the income distribution, but these benefits should be enhanced through better targeting while monitoring any negative effects from reduced social mixing. Social rental housing accounts for of 21% of dwellings, the third highest share in the OECD behind the Netherlands and Austria (OECD, 2021[20]). Social housing is referred to as general housing, reflecting its aim to house a broad range of the population. All households are eligible for waiting lists, with wait timesreaching several decades for the most popular estates (Phillips, 2020[21]). There are no income thresholds, although priority can be given to those in acute need. The quality, size, age and location of social housing typically nonetheless mean that tenants predominantly have low incomes, with 80% of tenants in the bottom half of the income distribution (Folketinget, 2016[22]). The lack of means testing is similar to municipal housing in Sweden or the universal model traditionally in place in the Netherlands and Austria, albeit some targeting has been implemented in these two countries to exclude approximately the top half and top 20% of income earners respectively (OECD, 2020[23]).
Another important factor in improving housing affordability is removing impediments to the delivery of more supply in response to higher prices, particularly in Copenhagen. The supply elasticity is estimated to be at the upper end among OECD countries (Cavalleri, Cournède and Özsöğüt, 2019[24]) and unlike in many OECD countries residential construction expanded during the crisis, supported by energy renovations of social housing. However, strict rent regulation impedes growth of the private rental market and spatial mobility. There are four different rent regulation systems, with non-rent-regulated letting of buildings built since 1991. The coexistence of controlled and flexible rent sectors has been shown to increase spatial misallocation (Chapelle, Wasmer and Bono, 2019[25]; Skak and Bloze, 2013[26]). Reducing the strictness of rent regulation is unlikely to lead to a large increase in inequality: while recent analysis is lacking, historical data indicate that, among renters, the biggest beneficiaries among renters from regulated rent have been high-income households (Svarer, Rosholm and Munch, 2005[27]); and in the long term lower house prices imply lower rent levels, even if rents may rise temporarily after controls are eased (Cournède, Ziemann and De Pace, 2020[28]). More stringent rental market regulations are also associated with severe downturns that are more likely and more protracted, which may be related to bottlenecks in housing supply and lower labour mobility (Cournède, Sakha and Ziemann, 2019[29]).
| 21
OECD ECONOMIC SURVEYS: DENMARK 2021 © OECD 2021
Figure 1.9. House price growth picked up during the COVID crisis
House price-to-income ratio
Source: OECD, Economic Outlook database.
StatLink 2 https://stat.link/819leh
Figure 1.10. House price growth has been particularly strong in Copenhagen
Index 2000 = 100
Note: The house price index for Copenhagen is based on owner-occupied flats. For Amsterdam, Oslo and Stockholm available house price indices based on existing dwellings for permanent living are used. The private consumption deflator from the national accounts is used to deflate nominal house prices. Source: Systemic Risk Council of Denmark ; Statistics Denmark; OECD Economic Outlook Database; Statistics Sweden; Statistics Norway; Statistics Netherlands.
StatLink 2 https://stat.link/si7e30
80
90
100
110
120
130
140
150
160
170
180
80
90
100
110
120
130
140
150
160
170
180
2000 2002 2004 2006 2008 2010 2012 2014 2016 2018 2020
Index 2000 = 100Index 2000 = 100
SwedenNorwayDenmarkOECDNetherlandsFinland
70
100
130
160
190
220
250
280
310
340
2000 2004 2008 2012 2016 2020
B. Real house prices
CopenhagenOsloStockholmAmsterdam
80
100
120
140
160
180
200
220
2000 2004 2008 2012 2016 2020
A. House price-to-income ratio
Copenhagen
Denmark
22 |
OECD ECONOMIC SURVEYS: DENMARK 2021 © OECD 2021
Figure 1.11. Rental price growth has been high in Copenhagen
Annual average growth, 2010-2020
Note: National rent prices represent all social, private and cooperative rentals. City rent prices are for private 2-bedroom flats constructed or subject to major modernisation in the past 10 years and therefore, for Copenhagen, are for a subset of rentals that is not subject to rent regulation. Source: OECD, Analytical House Price Indicators database; Eurostat, Estate Agency Rent Surveys (https://ec.europa.eu/eurostat/web/civil-servants-remuneration/estate-agency-rent-surveys).
StatLink 2 https://stat.link/jzb05e
Asset price growth is increasing financial stability risks
Strong asset price growth during the downturn raises the prospect of credit risks reaching high levels as the economy recovers. The primary source of financial stability risk is the acceleration of house prices amid high household gross debt, though equity prices have also increased with the Danish C25 index reaching record highs in 2021. Household debt is high by international comparison, though risks are reduced by the distribution of that debt, with most held by high income earners and substantial asset holdings (Figure 1.12). However, even without directly adverse effects on the financial system, high levels of debt amplify macroeconomic volatility (Sutherland and Hoeller, 2012[30]).
Credit growth has outpaced GDP since the start of 2018 and continued to do so during the crisis. The credit-to-GDP ratio offers no evidence of excess credit growth as it remains below its long-term trend (Figure 1.13, Panel A), although in level terms the credit-to GDP ratio at the end of 2020 was still among the half dozen highest for OECD countries where data are available (BIS, 2021[31]). Credit standards have been largely unchanged in 2020 and early 2021, although there are some signs of increased risk-taking, with loans to highly indebted home buyers representing an increasing share of new lending, especially in Copenhagen (Danmarks Nationalbank, 2021[32]). Banks are liquid and well capitalised (Figure 1.13, Panel B), though profitability has fallen under the low interest environment since 2017. Loan impairment changes increased in 2020, but are expected to decline in 2021 (Danmarks Nationalbank, 2021[32]). Danmarks Nationalbank’s (2020[33]) stress test shows that a few systemic institutions breach the requirements for their capital buffers in the most severe recession scenario. Mortgage credit institutions, which are responsible for the bulk of mortgage lending and fund this lending through issuing bonds, are strongly dependent on the health of the housing sector and highly interconnected with pension and insurance companies (IMF, 2021[12]). As recommended in the 2019 Economic Survey, Denmark should improve prudential regulation and enable cross-border banking by joining the European Banking Union (Table 1.3).
-1
0
1
2
3
4
5
6
7
GRC
JPN
ESP
ITA
FRA
CHE
LUX
DEU
CAN
BEL
SWE
DNK
GBR
KOR
PRT
NOR
CZE
IRL
FIN
POL
USA
HUN
AUT
%A. National rent prices
-2.9-1
0
1
2
3
4
5
6
7
War
saw
Rome
Seou
lLo
ndon
Oslo
Athe
nsVi
enna
Brus
sels
Gene
vaMo
ntrea
lNe
w Yo
rkPa
risMa
drid
Helsi
nki
Stoc
kholm
Buda
pest
Toky
oW
ashin
gton
Prag
ueMu
nich
Cope
nhag
enLu
xemb
ourg
Berlin
Dubli
nLis
bon
%B. City rent prices
-2.4
-1.8

| 23
OECD ECONOMIC SURVEYS: DENMARK 2021 © OECD 2021
Figure 1.12. Household debt is high and held predominantly by high income groups
As a percentage of disposable income
Note: In panel C, the self-employed households or households with zero or negative tax have been removed. Source: OECD, Economic Outlook and National Accounts databases; Danmarks Nationalbank.
StatLink 2 https://stat.link/21o0iy
Exposure of households to interest rate increases is heightened because around half of mortgage loans are at variable interest rates and just under half of mortgage debt is on deferred amortisation (interest-only) terms (Danmarks Nationalbank, 2021[34]). However, the composition of mortgage lending to households has recently shifted towards fixed interest rate loans (Figure 1.14), in part due to guidelines introduced between 2016 and 2018 that restrict the capacity of highly indebted households to take out variable interest rate loans without amortisation. The share of mortgage loans with deferred amortisation has increased since late 2020, and such loans are most widespread in the major cities of Copenhagen and Aarhus.
Denmark should be ready to further tighten macroprudential regulation, in order to stem risks from the combination of high asset prices, highly indebted households and “low for long” interest rates that are not calibrated to Danish economic conditions (Figure 1.8 above). A tighter macroprudential stance is generally linked to a lower likelihood of economic crises (Cournède, Sakha and Ziemann, 2019[29]) and restrictions
0
50
100
150
200
250
300
350
2000 2005 2010 2015 2020
%
A. Danish household gross debt development
075150225300375450525600675750
0255075
100125150175200225250
HUN
SVN
POL
ITA
CZE
AUT
DEU
GRC
USA
ESP
JPN
BEL
PRT
IRL
FRA
GBR
FIN
CAN
AUS
SWE
NLD
NOR
DNK
%%
Gross debt (left)Financial net worth (right)
0
100
200
300
400
500
600
0
100
200
300
400
500
600
1 2 3 4 5 6 7 8 9 10
%%
Income decile
C. Distribution of household gross debt by income decile in 2018
10th percentile 25th percentile Median 75th percentile 90th percentile
B. Household gross debt and net worth comparison2020 or latest year available

24 |
OECD ECONOMIC SURVEYS: DENMARK 2021 © OECD 2021
on loan-to-value and debt-to-income ratios are effective at curbing credit growth (Cerutti, Claessens and Laeven, 2017[35]; Carreras, Davis and Piggott, 2018[36]). However, distributional effects also need to be taken into account as tighter restrictions can prevent house purchases for people with low incomes and wealth. Consideration should be given to tightening loan-to-value restrictions, which are most effective preceding or during the build-up of risks (OECD, 2021[37]), particularly as the Danish requirement of a 5% down payment is low relative to the other Nordic countries and the vast majority of first-time buyers borrow right up to the threshold. Work should begin to implement the possibility of restrictions on debt-to-income (or as applied more commonly, on debt servicing) to complement loan-to-value caps by ensuring households have sufficient income to service their debt as valuations soar. Households with high debt-to-income ratios are restricted from loans with variable interest rates and deferred amortisation (Table 1.3), which reduces interest rate sensitivity. The government has not taken up the Systemic Risk Council’s recommedation in June 2021 to limit access to interest-only loans for borrowers with a loan-to-value ratio above 60%, but has acted on its recommendation to raise the countercyclical buffer to 1% from 30 September 2022.
Figure 1.13. Credit has picked up but is contained, while financial institutions are well capitalised
Source: BIS, Statistics Warehouse; IMF, Financial Soundness Indicators database.
StatLink 2 https://stat.link/4ja56l
-40
-30
-20
-10
0
10
20
30
40
-40
-30
-20
-10
0
10
20
30
40
2000-Q1 2002-Q1 2004-Q1 2006-Q1 2008-Q1 2010-Q1 2012-Q1 2014-Q1 2016-Q1 2018-Q1 2020-Q1
A. Credit-to-GDP gapsGap of actual ratio of bank lending to private non-financial sector-to-GDP relative to trend
GermanySwedenUnited StatesUnited KingdomDenmark
0
4
8
12
16
20
24
28
0
4
8
12
16
20
24
28
ISR
CAN
AUS
USA
ESP
GRC
PRT
AUT
ITA
FRA
DEU
OECD BE
L
GBR
FIN
NLD
CHE
LTU
DNK
SWE
CZE
NOR
LUX ISL
IRL
LVA
EST
%%B. Regulatory Tier 1 capital to risk-weighted assets
2020 or latest available data

| 25
OECD ECONOMIC SURVEYS: DENMARK 2021 © OECD 2021
Figure 1.14. The share of loans with variable interest rates and deferred amortisation is high but falling
Outstanding domestic mortgage loans from mortgage banks, share by interest rate type and instalment
Source: Danmarks Nationalbank, Banking and Mortgage Lending, Table DNRUDDKI.
StatLink 2 https://stat.link/m7d1vl
Table 1.3. Past recommendations and actions taken on housing and financial regulation
Recommendations Action taken since 2019 survey Deregulate the rental market and remove favourable conditions for parents to buy-to-let flats to their children. Establish a commission to investigate the scope for developing a bigger private rental market.
From January 2021, some of the favourable taxation conditions for parents to buy-to-let flats to their children were removed, such as a reduction of the basis of the capital return and of the tax value of the interest expenses.
Support a bigger private rental housing market by easing rent regulation while striking a balance between landlord and tenant protection.
No action taken.
Introduce local comparison rents for rent adjustments of existing contracts.
No action taken.
Review financial regulation for pension funds to remove barriers for investments in the domestic equity market, including innovative startups and SMEs through investment funds.
No action taken.
Give consideration to extending some of the locally targeted “Best practices” introduced by the regulator for granting a mortgage in hotspot areas to the whole country.
No action taken.
Encourage mortgage institutions to strengthen the use of debt-service-to-income ratios.
No further action since January 2018, when households with debt-to income ratios above 400% became required to fix interest rates for at least five years if the loan-to-value ratio is above 60%.
Improve prudential supervision and international collaboration by joining the European Banking Union.
In late 2020, the government announced its decision to postpone the decision about potential participation in the European Banking Union until the union’s function area is clearer. The prime minister also made it clear that participation requires a referendum.
Increase scrutiny and implement more severe penalties for money-laundering activities.
Implementation of initiatives to help prevent money-laundering has continued since a new agreement was reached in September 2018, including development of a new institutional risk assessment model that became operational in June 2021.
Encourage a further decrease of the maturity mismatch in variable-rate mortgage bonds.
From 2020, the share of lending which is refinanced each quarter must be less than 12.5% of the total lending portfolio. Annual refinancing must be less than 25% of the total lending portfolio.
0
10
20
30
40
50
60
70
80
90
100
0
10
20
30
40
50
60
70
80
90
100
Jan 2016 Jan 2017 Jan 2018 Jan 2019 Jan 2020 Jan 2021
%% Variable rate Variable rate with deferred amortisation Fixed rate Fixed rate with deferred amortisation

26 |
OECD ECONOMIC SURVEYS: DENMARK 2021 © OECD 2021
Improvements to preventive measures and supervision under Denmark’s anti-money laundering framework need to continue. Denmark has tightened its anti-money laundering framework since large-scale money laundering was disclosed in the Estonian branch of Denmark’s largest bank in 2018. While reforms have continued since the last Financial Action Task Force assessment (Figure 1.15), there is still scope to further intensify penalties for non-compliance and scrutiny, for example through more on-site inspection of higher-risk financial institutions and application of technological innovations (IMF, 2021[12]).
Control of corruption is perceived to be among the best in the OECD across a broad range of indices (Figure 1.16). There is room for improvement on foreign bribery, where there has been a failure to thoroughly investigate foreign bribery allegations involving major Danish companies, with sanctions rarely imposed (OECD, 2015[38]). Legal changes are still needed to reduce the difficulty of imposing corporate liability for the actions of employees and more tightly define the defence for small “facilitation payments”.
Figure 1.15. Denmark could improve further its tax transparency and preventive anti-money laundering measures
Note: Panel A summarises the overall assessment on the exchange of information in practice from peer reviews by the Global Forum on Transparency and Exchange of Information for Tax Purposes. Peer reviews assess member jurisdictions' ability to ensure the transparency of their legal entities and arrangements and to co-operate with other tax administrations in accordance with the internationally agreed standard. The figure shows first round results; a second round is ongoing. Panel B shows ratings from the FATF peer reviews of each member to assess levels of implementation of the FATF Recommendations. The ratings reflect the extent to which a country's measures are effective against 11 immediate outcomes. "Investigation and prosecution¹" refers to money laundering. "Investigation and prosecution²" refers to terrorist financing. Source: OECD Secretariat’s own calculation based on the materials from the Global Forum on Transparency and Exchange of Information for Tax Purposes; and OECD, Financial Action Task Force (FATF).
StatLink 2 https://stat.link/nxemd8
AUS
AUT
BEL
CAN
CHE
DEU
DNK
GBR
GRC
LUX
NLD
PRT
USA
ESP
FIN
FRA
IRL
ISL
ITA
NOR
NZL
SWE
A. Tax transparency: Exchange of information on request
Partially Compliant
Compliant
Non-Compliant
Largely Compliant
0
1
2
3
4Risk, policy & coordination
International co-operation
Supervision
Preventive measures
Legal persons andarrangements
Authorities' financialintelligence
Investigation andprosecution¹
Confiscation
Investigation andprosecution²
Deprivation of terroristfinancing
Financial sanctions againstproliferation
B. Anti-money laundering measuresScale: 1 (low) to 4 (high effectiveness)
DenmarkOECDEU

| 27
OECD ECONOMIC SURVEYS: DENMARK 2021 © OECD 2021
Figure 1.16. Control of corruption is perceived to be among the best in the OECD
Note: Panel B shows the point estimate and the margin of error. Panel D shows sector-based subcomponents of the “Control of Corruption” indicator by the Varieties of Democracy Project. Source: Panel A: Transparency International; Panels B & C: World Bank, Worldwide Governance Indicators; Panel D: Varieties of Democracy Project, V-Dem Dataset v11.
StatLink 2 https://stat.link/7va03i
Fiscal policy to support wellbeing
Government spending supported the economy during the crisis
Significant fiscal support during the COVID crisis (Box 1.1 above) prevented a wave of insolvencies or a big decline in employment, yet the structural balance remained in surplus in 2020. This reflected a strong budget position entering the crisis along with under-spending relative to government plans, which contributed to a deterioration in the budget balance that was smaller than most OECD countries (Figure 1.17). Strong revenue collection was partly due to taxation of holiday pay disbursements and the tax on pension yields, which depends on highly variable investment returns and reached 2.1% of GDP in 2020, substantially above the average of 1.3% of GDP over the past two decades. Despite strong automatic stabilisers – the budget balance semi-elasticity is the largest in the OECD, along with Belgium and Sweden (Price, Dang and Botev, 2015[39]) – Denmark in 2020 had the smallest general government deficit as a share of GDP in the OECD. Almost all of the 2% of GDP in discretionary fiscal easing in 2020 was due to one-off COVID-related measures.
0
20
40
60
80
100
GRC ITA
PRT
ESP EU USA
FRA
IRL
ISL
AUT
BEL
AUS
CAN
GBR
DEU
LUX
NLD
NOR
CHE
FIN
SWE
DNK
NZL
A. Corruption Perceptions IndexScale: 0 (worst) to 100 (best), 2020
-0.5
0.0
0.5
1.0
1.5
2.0
2.5
GRC ITA
ESP
PRT EU USA
FRA
BEL
AUT
IRL
CAN
AUS
GBR ISL
DEU
NLD
LUX
CHE
NOR
SWE
NZL
FIN
DNK
B. Control of corruptionScale: -2.5 (worst) to 2.5 (best), 2020
0.0
0.5
1.0
1.5
2.0
2.5
3.0
1996 1998 2000 2002 2004 2006 2008 2010 2012 2014 2016 2018 2020
C. Evolution of "Control of Corruption"Scale: -2.5 (higher) to 2.5 (lower corruption), 2020
DenmarkOECDEU 0.0
0.20.40.60.81.0
Executive bribery
Executiveembezzlement
Public sector bribery
Public sectorembezzlement
Legislature corruption
Judicial corruption
D. Corruption by sector, "Control of Corruption"Scale: 0 (worst) to 1 (best), 2020
DenmarkOECDEU

28 |
OECD ECONOMIC SURVEYS: DENMARK 2021 © OECD 2021
Figure 1.17. Fiscal support was substantial, but smaller than in most OECD countries Change in general government budget balance between the first half of 2019 and 2021, % points of GDP
Note: Outcomes for 2019, projections for 2021 for most countries. Source: OECD, Economic Outlook 110 database.
StatLink 2 https://stat.link/5mca1n
A larger budget deficit in 2021 reflects substantial temporary factors. Temporary spending due to COVID-19 is estimated by the Ministry of Finance (2021) at 1.5% of GDP, just below the 2020 level. A further 0.7% of GDP relates to one-off support to compensate the mink industry for culling, while revenue from the pension yield tax is expected to be lower than in 2020. Several initiatives boosted public investment in 2021 and will see it remain at an elevated level thereafter, including the Green Recovery Package, Digitisation Fund and EU Recovery and Resilience Facility. Unlike many recovery packages in other OECD countries, Denmark has not implemented any measures likely to worsen environmental outcomes (OECD, 2021[40]), and at around 60% the share of recovery spending directed towards environmental goals is high by international comparison (O’Callaghan,, Yau and Murdock, 2021[41]; European Commission, 2021[42]).
The Danish government should continue to remove exceptional COVID-related support where economic activity has recovered. This entails first making support more targeted. For example, the government-appointed Economic Expert Group (2021[43]) has recommended targeting to firms still affected by a significant decrease in turnover. The recovery is well underway, with the output gap closed and unemployment below its pre-crisis low as of the third quarter of 2021. There is evidence of capacity pressures in some sectors, notably in construction where there are increasing reports of skill shortages. Ending temporary COVID-19 spending (including one-off mink industry compensation) will be sufficient to return to close to structural balance in 2022, consistent with the government’s strategy to rapidly deploy substantial support and then withdraw support quickly once it is no longer necessary. The government’s budget proposal for 2022 would see the structural deficit reduced to 0.2% of GDP, including DKK 4 billion (0.17% of GDP) reserved for additional COVID-related measures. The government needs to be ready to restore substantial stimulus should the health situation deteriorate, which could threaten domestic and external demand.
-18
-16
-14
-12
-10
-8
-6
-4
-2
0
-18
-16
-14
-12
-10
-8
-6
-4
-2
0
USA ISL
ITA
GBR
ESP
OECD FR
A
LVA
HUN
BEL
AUT
EST
CZE
ISR
CAN
LTU
NLD
DEU
PRT
IRL
FIN
AUS
NZL
CHE
NOR
DNK
LUX
SWE

| 29
OECD ECONOMIC SURVEYS: DENMARK 2021 © OECD 2021
Sustainable public finances over the long term
Based on current settings, Danish fiscal policy is sustainable (Figure 1.18, Panel A). The re-imposition of the Budget Law structural deficit limit of 0.5% of GDP from 2022 will see public debt declining again as a share of GDP. The decline is set to accelerate after 2040, as strong indexation of retirement ages to increases in life expectancy combine with a relaxation of demographic headwinds following the retirement of the large baby boom generation (Figure 1.19). As set out in the 2019 Survey, long-term sustainability is contingent on the continued implementation of retirement age increases as life expectancy grows, under which the statutory retirement age is projected to reach 70 years in 2040 and 73 years in 2060. For someone starting work in 2018, Denmark is projected to have the highest retirement age in the OECD when they retire, which contributes to the affordability of high pension replacement rates (in excess of 100% for low-income earners) (OECD, 2019[44]). Already in 2016, 18% of males from the lowest socioeconomic quintile were not expected to survive from 50 to retirement age, compared with 4% of high socioeconomic females (Alvarez, Kallestrup-Lamb and Kjærgaard, 2021[45]). Under strong indexation, the effect of increasing retirement ages on lower socioeconomic groups needs to be monitored to ensure that disadvantaged older workers have sufficient access to lifelong learning, job opportunities and flexible work arrangements, with adequate safety net provisions such as disability benefits as a fall-back.
As a small open economy with its own currency and strong automatic stabilisers, Denmark needs to remain fiscally cautious. The Budget Law provided a strong starting point entering the crisis and has helped to reduce overspending by municipalities. That said, the temporary nature of adjusting to the retirement of a single large generation argues against overly restrictive policy settings in the medium term, as debt financing of the transition period would not put long-term sustainability at risk. There is also a need for substantial public investment in research and development as well as infrastructure to underpin the energy transition (Chapters 2 and 3), some of which should be debt funded to align the recovery of costs with benefits accruing well into the future. Finally, under low real interest rates, debt declines more quickly for a given primary balance and the costs of debt are lower (Blanchard, 2019). Current and expected interest rates are considerably lower than when the Budget Law was agreed in 2012, strengthening the budget balance, though this could change if high debt and rising inflation globally triggered an increase in interest rates. A review of the Budget Law after five years was planned as part of its introduction and is currently ongoing. Periodic evaluation and review can be valuable to update fiscal rules to changing circumstances, as in Sweden where the fiscal policy framework is re-evaluated every eight years.
Relaxing the structural deficit limit under the Budget Law to around 1% of GDP would provide space to address longer-term challenges from demographic headwinds (particularly between 2025 and 2040) and investment needs, without threatening fiscal sustainability or the capacity for active fiscal policy. Independent Danish institutions including the Central Bank and Economic Councils support such a move, which would keep the Budget Law in line with the EU Fiscal Compact structural limit of 1% of GDP for countries with a debt-to-GDP ratio well below 60%. There would also be benefits from increasing budget flexibility for municipalities. In particular, allowing a surplus from one year to be carried over would provide flexibility to react to the specific timing of local issues.
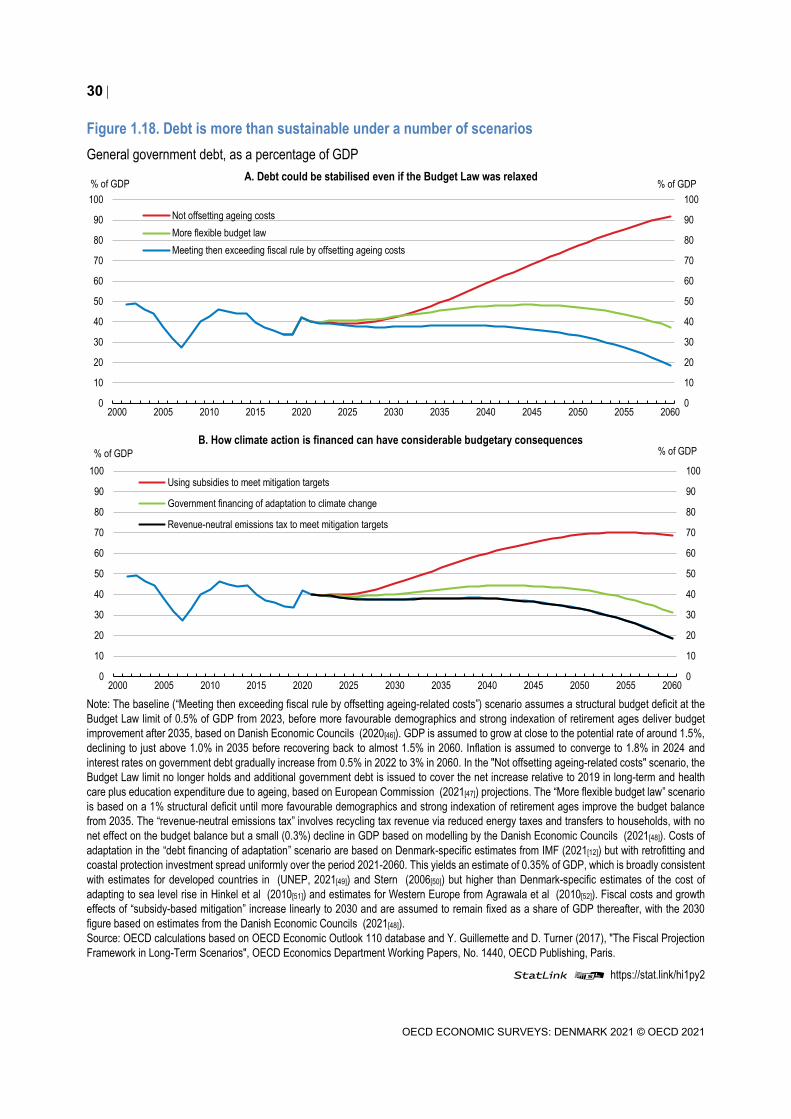
30 |
OECD ECONOMIC SURVEYS: DENMARK 2021 © OECD 2021
Figure 1.18. Debt is more than sustainable under a number of scenarios General government debt, as a percentage of GDP
Note: The baseline (“Meeting then exceeding fiscal rule by offsetting ageing-related costs”) scenario assumes a structural budget deficit at the Budget Law limit of 0.5% of GDP from 2023, before more favourable demographics and strong indexation of retirement ages deliver budget improvement after 2035, based on Danish Economic Councils (2020[46]). GDP is assumed to grow at close to the potential rate of around 1.5%, declining to just above 1.0% in 2035 before recovering back to almost 1.5% in 2060. Inflation is assumed to converge to 1.8% in 2024 and interest rates on government debt gradually increase from 0.5% in 2022 to 3% in 2060. In the "Not offsetting ageing-related costs" scenario, the Budget Law limit no longer holds and additional government debt is issued to cover the net increase relative to 2019 in long-term and health care plus education expenditure due to ageing, based on European Commission (2021[47]) projections. The “More flexible budget law” scenario is based on a 1% structural deficit until more favourable demographics and strong indexation of retirement ages improve the budget balance from 2035. The “revenue-neutral emissions tax” involves recycling tax revenue via reduced energy taxes and transfers to households, with no net effect on the budget balance but a small (0.3%) decline in GDP based on modelling by the Danish Economic Councils (2021[48]). Costs of adaptation in the “debt financing of adaptation” scenario are based on Denmark-specific estimates from IMF (2021[12]) but with retrofitting and coastal protection investment spread uniformly over the period 2021-2060. This yields an estimate of 0.35% of GDP, which is broadly consistent with estimates for developed countries in (UNEP, 2021[49]) and Stern (2006[50]) but higher than Denmark-specific estimates of the cost of adapting to sea level rise in Hinkel et al (2010[51]) and estimates for Western Europe from Agrawala et al (2010[52]). Fiscal costs and growth effects of “subsidy-based mitigation” increase linearly to 2030 and are assumed to remain fixed as a share of GDP thereafter, with the 2030 figure based on estimates from the Danish Economic Councils (2021[48]). Source: OECD calculations based on OECD Economic Outlook 110 database and Y. Guillemette and D. Turner (2017), "The Fiscal Projection Framework in Long-Term Scenarios", OECD Economics Department Working Papers, No. 1440, OECD Publishing, Paris.
StatLink 2 https://stat.link/hi1py2
0
10
20
30
40
50
60
70
80
90
100
0
10
20
30
40
50
60
70
80
90
100
2000 2005 2010 2015 2020 2025 2030 2035 2040 2045 2050 2055 2060
% of GDP% of GDP A. Debt could be stabilised even if the Budget Law was relaxed
Not offsetting ageing costsMore flexible budget lawMeeting then exceeding fiscal rule by offsetting ageing costs
0
10
20
30
40
50
60
70
80
90
100
0
10
20
30
40
50
60
70
80
90
100
2000 2005 2010 2015 2020 2025 2030 2035 2040 2045 2050 2055 2060
% of GDP% of GDPB. How climate action is financed can have considerable budgetary consequences
Using subsidies to meet mitigation targets
Government financing of adaptation to climate change
Revenue-neutral emissions tax to meet mitigation targets

| 31
OECD ECONOMIC SURVEYS: DENMARK 2021 © OECD 2021
The budgetary ramifications of climate change depend critically on policy choices (Figure 1.18 above, Panel B). A revenue-neutral carbon tax is estimated to have only a very small effect on debt dynamics via slightly lower GDP growth, which is due to the increased cost of producing greenhouse-gas intensive goods in Denmark. Revenue neutrality is feasible by using additional revenue to address distributional and leakage concerns (Chapter 2), and desirable as the tax base will be eroded by the long-term shift to net zero emissions. By contrast, relying heavily on subsidies could have a negative and enduring effect on public finances. Public funding of adaptation costs would worsen the budgetary position, but, on its own, would be unlikely to disrupt the declining trend in debt as a share of GDP. Municipalities have concerns around their capacity to deal with climate adaptation such as flood protection, where the costs could be too big for a single municipality to handle. A clear framework should be developed setting out where private, local or central authorities are responsible for the costs of adaptation, taking into account the limited fiscal capacity of municipalities. Integrating environmental risk into longer-term fiscal assessments, as in the UK and Germany, would help Denmark to identify and, if possible, quantify potential risks as well as opportunities for budget planning by the public sector (OECD, 2020[53]).
Figure 1.19. The fiscal costs of the demographic transition will be concentrated from 2025 to 2040
Note: AWG: Ageing Working Group. Source: Danish Economic Council (2020), Danish Economy - Autumn 2020 Report, Table III.1; European Commission (2020), The 2021 Ageing Report - Underlying Assumptions & Projection Methodologies, Institutional Paper 142, European Economy, Table III.1.137.
StatLink 2 https://stat.link/wj907x
The Danish tax system is overall well-designed and efficient, with limited use of tax expenditures and a total tax wedge around the OECD average (Figure 1.20, Panel A). Marginal tax rates are below the OECD average for low- and middle-income earners, but well above for high income earners due to the 55.9% top marginal tax rate (Figure 1.20, Panel B). Such high tax rates reduce the incentive to increase earnings through more working hours or further education. When benefits are also taken into account, marginal effective tax rates are high, at close to 100% between two-thirds of the average wage and the average wage for a couple with two children as social assistance payments are phased out (Figure 1.21). Tax rates are also high on capital income, blunting incentives for entrepreneurship, investment and job creation.
Top marginal tax rates should be reduced as recommended in past surveys (Table 1.4), but consideration should also be given to reducing high effective marginal tax rates faced by middle income families receiving social benefits. Further in-work tax benefits could be used to reduce marginal tax rates as benefits are withdrawn, though payoffs are smaller when the distribution of earnings is narrow, as in Denmark, or where tax rates or benefits are high (Immervoll and Pearson, 2009[54]).
24.0
24.5
25.0
25.5
26.0
26.5
27.0
27.5
28.0
49.0
49.5
50.0
50.5
51.0
51.5
52.0
52.5
53.0
2020 2025 2030 2035 2040 2045 2050 2055 2060 2065 2070
% of GDP% of population
Labour force (left)Total cost of ageing, AWG reference scenario (right)

32 |
OECD ECONOMIC SURVEYS: DENMARK 2021 © OECD 2021
To offset the negative revenue consequences of lower income taxation, planned updating of property valuations in 2024 should occur as soon as possible, in conjunction with a reduction of mortgage interest deductibility. Reducing mortgage tax deductibility, as recommended in previous surveys, would reduce incentives for high household leverage, easing housing demand and contributing to smoother housing cycles (Cournède, Sakha and Ziemann, 2019[29]). Taxation of housing (especially owner-occupied housing) is presently low, both relative to other forms of saving and by international comparison (OECD, 2018[55]), so that increasing taxation of housing will improve the overall efficiency of the tax system. Environmental taxes should continue to increase, in particular through broad-based greenhouse gas emissions pricing (Chapter 2) and better aligning incentives for woody biomass use with its environmental impacts (Chapter 3). Overall the tax and other recommendations in this survey would have a small long-term negative budgetary impact (Table 1.5), which as discussed above could be accommodated without threatening fiscal sustainability. Increasing taxation of housing will offset some of the negative distributional effect of reducing income taxation, though some tradeoff between equity and efficiency of the tax system is likely to remain for substantive reductions (2 percentage points or more) in the top marginal tax rate.
Figure 1.20. The total tax wedge is around average, but top income taxes are high
Single individual at the income level of the average worker, without children
Note: The threshold is the gross wage earnings threshold at which the top statutory rate first applies (measured as a multiple of the average wage). Source: OECD, Taxing Wages database.
StatLink 2 https://stat.link/a02dbt
05
10152025303540455055
NZL
CHE
USA
AUS
CAN
GBR ISL
IRL
OECD DN
KNO
RNL
DLT
ULU
XFI
NSW
EIT
AFR
AAU
TDE
UBE
L
A. Average tax wedgeAs a % of labour costs, 2020
0
4
8
12
16
20
24
0
10
20
30
40
50
60
LTU
NZL
NOR
CHE
USA
GBR
LUX ISL
AUS
ITA
DEU IRL
NLD
FIN
SWE
BEL
CAN
AUT
FRA
DNK
B. Top statutory tax rate, 2020
Top rate (% gross wage earnings, left)Threshold (multiple of average wage, right)

| 33
OECD ECONOMIC SURVEYS: DENMARK 2021 © OECD 2021
Figure 1.21. Net income for families increases very slowly over some earnings ranges Couple with two children, 2020 data
Note: AW stands for average wage for an individual and SS for social security. Source: OECD, Tax-Benefit Models database.
StatLink 2 https://stat.link/vp78zw
Table 1.4. Past recommendations and actions taken on the fiscal framework, taxation and social institutions
Recommendations Action taken since 2019 survey Reform public sector collective bargaining, in collaboration with trade unions, towards broader and higher-level agreements, allowing more bargaining at the local level.
No action taken.
Allocate a permanent disability pension only to those with permanent incapacity to work regardless of age. Review existing exceptions, and reassess eligibility to disability benefits on a regular basis.
No action taken.
Review the pension and tax system and implement reform to increase transparency and ease personal financial planning.
In August 2020, a pension commission was set up in order to look more closely at the Danish pension system.
Implement an allowance for corporate equity (ACE) in the corporate income tax, accompanied by a sufficient anti-avoidance framework.
No action taken.
Reduce top marginal tax rates on labour and capital income. Withdraw reduced inheritance taxation of family-owned businesses.
Reduced inheritance taxation of family-owned businesses was withdrawn in 2020.
Reduce deductibility of interest expenses in personal income taxation. No action taken. Limit the use of retroactive tax deductions for improving energy efficiency of housing to credit constrained households and exclude other house-work such as cleaning and gardening services.
No action taken.
Assess the lifetime pattern of benefit recipients and the costs of their inactivity.
No action taken.
Support competition on welfare services, notably by revising exemptions to the Competition Act in the public sector and relaxing regulation in the pharmaceutical sector.
No action taken.
Consider diversifying funding sources of healthcare and long-term care by raising co-payments, mean-testing public support for home care, and expanding “sin taxes”.
The tax on tobacco increased from April 2020.
Monitor work requirements for social assistance recipients. No action taken. Promote diversity in firms with information campaigns, audits on management policies, programmes for early identification and prevention of work-related health issues.
No action taken.
- 400
- 200
0
200
400
600
800
1 000
-400
-200
0
200
400
600
800
1000
0 25 50 75 100 125 150 175 200
Thousand DKK/yearThousand DKK/year
Current earnings, % of AW
Gross income Social assistanceHousing benefits Family benefitsIncome taxes Employee SS contributionsNet income
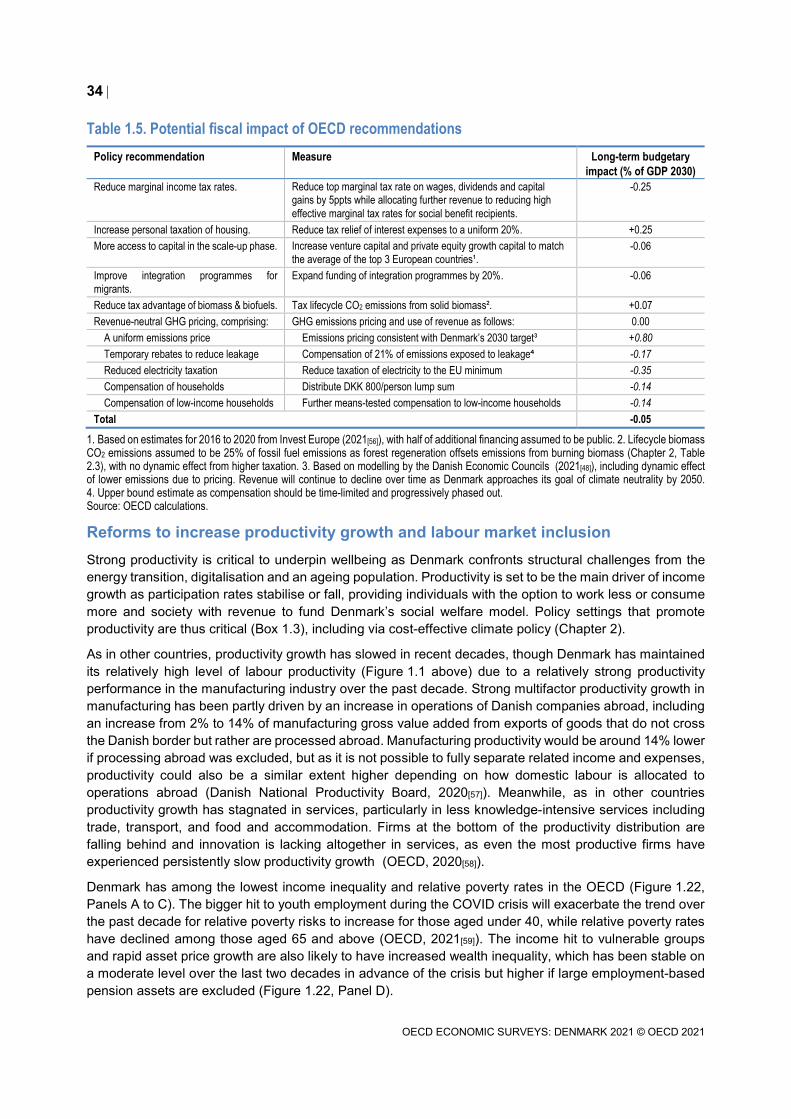
34 |
OECD ECONOMIC SURVEYS: DENMARK 2021 © OECD 2021
Table 1.5. Potential fiscal impact of OECD recommendations Policy recommendation Measure Long-term budgetary
impact (% of GDP 2030) Reduce marginal income tax rates. Reduce top marginal tax rate on wages, dividends and capital
gains by 5ppts while allocating further revenue to reducing high effective marginal tax rates for social benefit recipients.
-0.25
Increase personal taxation of housing. Reduce tax relief of interest expenses to a uniform 20%. +0.25 More access to capital in the scale-up phase. Increase venture capital and private equity growth capital to match
the average of the top 3 European countries¹. -0.06
Improve integration programmes for migrants.
Expand funding of integration programmes by 20%. -0.06
Reduce tax advantage of biomass & biofuels. Tax lifecycle CO2 emissions from solid biomass². +0.07 Revenue-neutral GHG pricing, comprising: GHG emissions pricing and use of revenue as follows: 0.00 A uniform emissions price Emissions pricing consistent with Denmark’s 2030 target³ +0.80 Temporary rebates to reduce leakage Compensation of 21% of emissions exposed to leakage⁴ -0.17 Reduced electricity taxation Reduce taxation of electricity to the EU minimum -0.35 Compensation of households Distribute DKK 800/person lump sum -0.14 Compensation of low-income households Further means-tested compensation to low-income households -0.14 Total -0.05
1. Based on estimates for 2016 to 2020 from Invest Europe (2021[56]), with half of additional financing assumed to be public. 2. Lifecycle biomass CO2 emissions assumed to be 25% of fossil fuel emissions as forest regeneration offsets emissions from burning biomass (Chapter 2, Table 2.3), with no dynamic effect from higher taxation. 3. Based on modelling by the Danish Economic Councils (2021[48]), including dynamic effect of lower emissions due to pricing. Revenue will continue to decline over time as Denmark approaches its goal of climate neutrality by 2050. 4. Upper bound estimate as compensation should be time-limited and progressively phased out. Source: OECD calculations.
Reforms to increase productivity growth and labour market inclusion Strong productivity is critical to underpin wellbeing as Denmark confronts structural challenges from the energy transition, digitalisation and an ageing population. Productivity is set to be the main driver of income growth as participation rates stabilise or fall, providing individuals with the option to work less or consume more and society with revenue to fund Denmark’s social welfare model. Policy settings that promote productivity are thus critical (Box 1.3), including via cost-effective climate policy (Chapter 2).
As in other countries, productivity growth has slowed in recent decades, though Denmark has maintained its relatively high level of labour productivity (Figure 1.1 above) due to a relatively strong productivity performance in the manufacturing industry over the past decade. Strong multifactor productivity growth in manufacturing has been partly driven by an increase in operations of Danish companies abroad, including an increase from 2% to 14% of manufacturing gross value added from exports of goods that do not cross the Danish border but rather are processed abroad. Manufacturing productivity would be around 14% lower if processing abroad was excluded, but as it is not possible to fully separate related income and expenses, productivity could also be a similar extent higher depending on how domestic labour is allocated to operations abroad (Danish National Productivity Board, 2020[57]). Meanwhile, as in other countries productivity growth has stagnated in services, particularly in less knowledge-intensive services including trade, transport, and food and accommodation. Firms at the bottom of the productivity distribution are falling behind and innovation is lacking altogether in services, as even the most productive firms have experienced persistently slow productivity growth (OECD, 2020[58]).
Denmark has among the lowest income inequality and relative poverty rates in the OECD (Figure 1.22, Panels A to C). The bigger hit to youth employment during the COVID crisis will exacerbate the trend over the past decade for relative poverty risks to increase for those aged under 40, while relative poverty rates have declined among those aged 65 and above (OECD, 2021[59]). The income hit to vulnerable groups and rapid asset price growth are also likely to have increased wealth inequality, which has been stable on a moderate level over the last two decades in advance of the crisis but higher if large employment-based pension assets are excluded (Figure 1.22, Panel D).
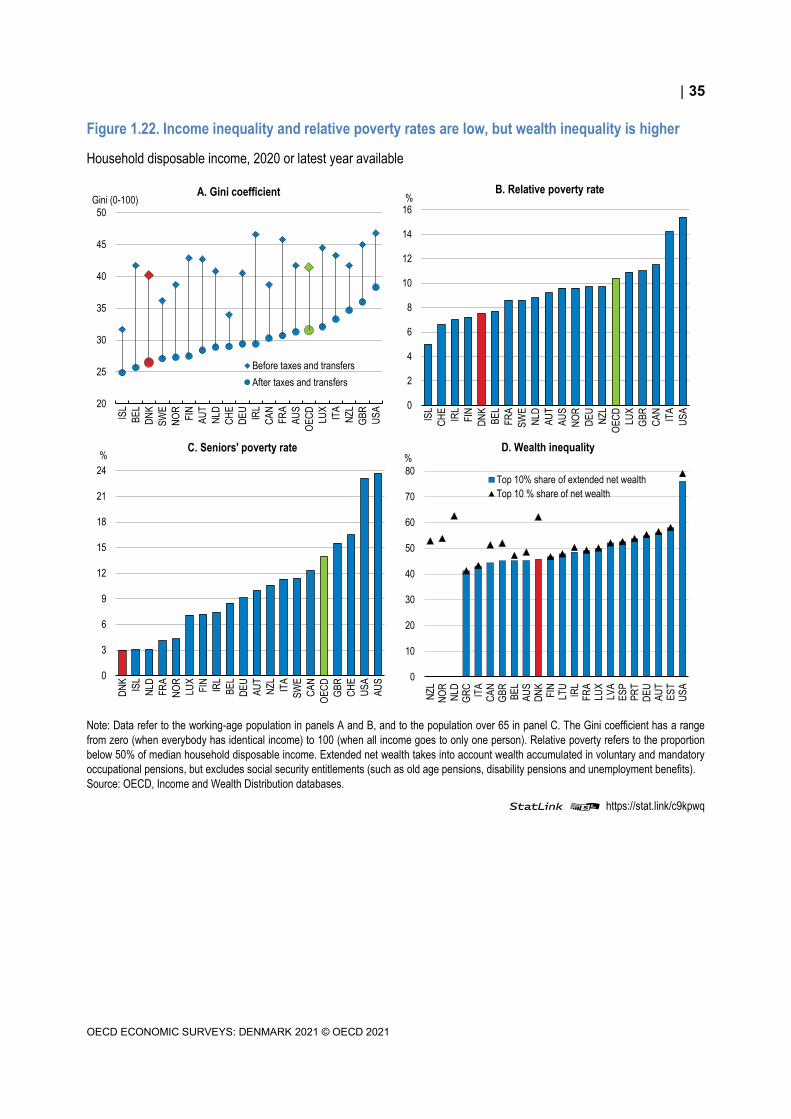
| 35
OECD ECONOMIC SURVEYS: DENMARK 2021 © OECD 2021
Figure 1.22. Income inequality and relative poverty rates are low, but wealth inequality is higher
Household disposable income, 2020 or latest year available
Note: Data refer to the working-age population in panels A and B, and to the population over 65 in panel C. The Gini coefficient has a range from zero (when everybody has identical income) to 100 (when all income goes to only one person). Relative poverty refers to the proportion below 50% of median household disposable income. Extended net wealth takes into account wealth accumulated in voluntary and mandatory occupational pensions, but excludes social security entitlements (such as old age pensions, disability pensions and unemployment benefits). Source: OECD, Income and Wealth Distribution databases.
StatLink 2 https://stat.link/c9kpwq
20
25
30
35
40
45
50
ISL
BEL
DNK
SWE
NOR
FIN
AUT
NLD
CHE
DEU IRL
CAN
FRA
AUS
OECD LU
XIT
ANZ
LGB
RUS
A
Gini (0-100)A. Gini coefficient
Before taxes and transfersAfter taxes and transfers
0
2
4
6
8
10
12
14
16
ISL
CHE
IRL
FIN
DNK
BEL
FRA
SWE
NLD
AUT
AUS
NOR
DEU
NZL
OECD LU
XGB
RCA
N ITA
USA
%B. Relative poverty rate
0
3
6
9
12
15
18
21
24
DNK ISL
NLD
FRA
NOR
LUX
FIN IRL
BEL
DEU
AUT
NZL
ITA
SWE
CAN
OECD GB
RCH
EUS
AAU
S
% C. Seniors' poverty rate
0
10
20
30
40
50
60
70
80
NZL
NOR
NLD
GRC ITA
CAN
GBR
BEL
AUS
DNK
FIN
LTU IRL
FRA
LUX
LVA
ESP
PRT
DEU
AUT
EST
USA
%D. Wealth inequality
Top 10% share of extended net wealthTop 10 % share of net wealth

36 |
OECD ECONOMIC SURVEYS: DENMARK 2021 © OECD 2021
Box 1.3. Simulation of the potential effect of structural reforms The estimated impact of some key structural reforms proposed in this Survey are calculated using historical relationships between reforms and growth in OECD countries (Table 1.6). As these simulations abstract from detail in the policy recommendations, are based on swift and full implementation of the proposed reforms and do not reflect Denmark’s particular institutional settings, the estimates should be seen as purely illustrative.
Table 1.6. Illustrative economic impact of some reforms proposed in this survey, after 10 years
GDP per capita (%)
Through employment (percentage points)
Through productivity (percentage points)
Increase parental leave for fathers¹. 0.5 0.3 0.2 Reduce marginal tax rates on labour and capital income while increasing less distortionary taxes.
0.2 0.2
Implement an allowance for corporate equity. 0.6 0.6 Reduce rent control to close half the gap to the lowest level (Finland)².
0.7 0.7
Expand support for young firms to scale-up and reduce barriers to digital trade.
0.7 0.7
Achieve 70% greenhouse gas emissions cut by 2030 using efficient policy3.
-0.3 -0.3
Total 2.4 0.5 1.9
1. Based on a temporary increase in employment and productivity for partnered women for the first three years after birth of a child from a six week increase in paternity leave entitlement drawing on Patnaik (2019[60]), with offsetting reduction in fathers’ employment. 2. Long-term gain in productivity from reducing skills mismatch as a consequence of greater labour mobility. 3. Reduction in gross value added from a uniform emissions price with a phase out of existing energy taxes (Danish Economic Councils, 2021[48]). Source: OECD calculations based on the framework in Égert and Gal (2017), “The Quantification of Structural Reforms in OECD Countries: A New Framework”, OECD Economics Department Working Papers, No. 1354; Adalet McGowan and Andrews (2017), “Skills mismatch, productivity and policies: Evidence from the second wave of PIAAC”, OECD Economics Department Working Papers, No. 1403; Sorbe, Gal, Nicoletti and Timiliotis (2019), “Digital Dividend: Policies to Harness the Productivity Potential of Digital Technologies”, OECD Economic Policy Paper, No. 26; Danish Economic Councils (2021), Economy and Environment, 2020.
Enhancing the benefits of digital transformation (section 1.4.1) and strong female labour force participation, (section 1.4.2) while improving the integration of migrants (section 1.4.3), are key steps to broaden Denmark’s productivity success. The latter two groups are also important for inclusiveness, as is the indigenous population in Greenland (Box 1.4). Lack of competition has been identified as one factor in weak productivity growth in some domestic-focused sectors, so implementation of the European Competition Network directive is welcome (Table 1.7). Sound infrastructure governance, including good project selection and planning, is associated with a significant boost in productivity growth among firms in infrastructure industries and in industries that use infrastructure intensively (Demmou and Franco, 2020[61]). Denmark ranks highly for infrastructure governance, but is among the bottom third of countries for national infrastructure planning (Oprisor, Hammerschmid and Löffler, 2015[62]). Consideration should be given to introducing an independent infrastructure advisory body, as in the United Kingdom and Australia (ITF, 2017[63]), to help prioritise projects according to cost-benefit analysis. Danish municipalities often have difficulty planning key infrastructure projects as they have limited capacity, and lessons from one region have not been used to inform others (for example when building new hospitals simultaneously).

| 37
OECD ECONOMIC SURVEYS: DENMARK 2021 © OECD 2021
Supporting diffusion of the benefits from the digital transformation
Danish firms are well-placed to benefit from digital transformation (Figure 1.23). Broadband and mobile internet speeds are high and growth in internet bandwidth in 2020 was well above the OECD average (OECD, 2021[64]), which is even more impressive given the solid starting point. Among 27 EU and 18 non-EU countries, Denmark ranked behind only Finland on the European Commission’s (2021[65]) International Digital Economy and Society Index, which summarises indexes of digital performance and competitiveness. There is strong uptake of digital security measures (Eurostat, 2021[66]). Denmark also has a high share of STEM graduates (Eurostat, 2021[67]) and Danish adults are among the top-performers in problem solving in technology-rich environments (OECD, 2019[68]). A digital growth reform package was introduced in 2018 and a new digitalisation strategy will be launched in early 2022 on the basis of of the Digitization Partnership (2021[69]) recommendations released in October 2021.
Denmark performs less well on barriers to cross-border data flows (ECIPE, 2019[70]). There are legitimate reasons to protect data privacy and Denmark should continue to comply with the General Data Protection Regulation. However, there are also examples where decisions by the Danish data protection agency have curtailed the use of digital tools, notably cloud computing (ECIPE, 2019[70]). Less trade restrictive measures, such as rules on how rather than where data are stored, should be considered. Denmark should also promote international discussions with a view to finding greater interoperability with other countries’ approaches to cross-border data flows, including in the context of the WTO’s Joint Statement Initiative on e-commerce.
Box 1.4. The Inuit in Greenland
Greenland is the world’s largest island and home to Denmark’s only recognised Indigenous group, the Inuit, who make up 85% of its population of just over 55 000. Greenland became a self-governing entity within the Kingdom of Denmark with the Home Rule Act of 1979 and autonomy in all areas except foreign and monetary affairs was reinforced with the 2009 Act of Self-Government. About half of the Greenland budget is financed by Denmark.
Socio-economic outcomes for the largely Inuit population of Greenland lag those for Denmark as a whole. Life expectancy is more than 10% lower in Greenland, which is similar to the gap for the indigenous population in Australia but larger than that for New Zealand, Canada, the United States and Mexico (OECD, 2019[71]). Relatively short life expectancy is primarily due to a high mortality rate from accidents and suicide. The life expectancy gap has changed little over the past two decades after rapid improvement between the late 1940s and early 1960s and more gradual convergence thereafter. Educational attainment is well below that in other Nordic countries, with about half of adults in Greenland aged 25-64 having no education beyond lower secondary school. Educational attainment is reflected in incomes, with average gross income for prime aged people with higher or general upper secondary education more than double that of those without upper secondary education, and overall average incomes consistently 30% lower than in Denmark over the past decade. Income inequality is high compared with the rest of Denmark. The unemployment rate halved between 2014 and 2019 to match that in Denmark as a whole at 5.1%. A lack of systematic data collection by indigenous status makes it difficult to make comparisons for the indigenous population specifically, including Inuit living elsewhere in Denmark.
Source: Statistics Greenland (various issues), Greenland in Figures; IWGIA (2021) The Indigenous World 2021: Kalaallit Nunaat (Greenland); StatBank Greenland.

38 |
OECD ECONOMIC SURVEYS: DENMARK 2021 © OECD 2021
Weak business dynamism reduces the scope for entry of new firms to boost the diffusion of ICT tools and productivity, heightening the importance of quickly phasing out COVID support measures that favour pre-existing firms as the economy reopens. New business entries have failed to reach the 2007 peak and have been falling since 2015, both of which are worse than the average of 14 OECD countries for which comparable data are available (OECD, 2021[72]). Entry and job reallocation rates declined between 2000 and 2015, with the magnitude of decline falling around the middle of OECD countries (Calvino, Criscuolo and Verlhac, 2020[73]). This contributes to a relatively low share of start-up firms (OECD, 2021[74]). Denmark generally performs well on key policy factors for business dynamism such as regulatory burdens and red tape, judicial and bankruptcy efficiency, innovation, and skills. However, there is scope to improve access to finance: early stage companies find it difficult to raise equity finance and access to capital in the scale-up phase is limited (EC, 2019[75]). This is reflected in a low share of new business lending going to SMEs (OECD, 2020[76]) and one of the smallest markets for private equity growth capital in EU countries (Invest Europe, 2021[56]). A well-developed venture capital market (though much of this is invested abroad) and public-private equity financing via the Danish Growth Fund are positive features to build upon.
Figure 1.23. Danish firms are well-placed to benefit from digital transformation
Note: Panel B refers to firms with 10 or more employees, excluding the financial sector. ERP stands for enterprise resource planning. Source: OECD Going Digital Toolkit, https://oe.cd/dgi-2019.
StatLink 2 https://stat.link/gjm7hn
0102030405060708090
100
GRC
GBR
FIN
CZE
ITA
FRA
AUT
LVA
CHE
NOR
DEU
ESP
EST
IRL
LTU
SWE
LUX
PRT
NLD
BEL
DNK
% of firms
A. Businesses with a broadband speed of over 30 Mbit/s2020 or latest
0
10
20
30
40
50
60
70
80
E-sales ERP Social media Cloudcomputing
Big data
% of firms
B. Adoption of digital technologies2020 or latest
DNK OECD Best performing
0
0.1
0.2
0.3
0.4
0.5
0.6
0.7
0.8
SWE ISL
GRC
FIN
LTU
DEU
BEL
IRL
CZE
NLD
AUT
LVA
EST
OECD IT
ALU
XNO
RNZ
LFR
APR
TIS
RES
PCA
NDN
KGB
R
C. Digital government indexIndex 1 = highest digital maturity, 2019
0
5
10
15
20
25
30
GRC
LVA
IRL
BEL
CZE
DEU ITA
LUX
ESP
LTU
SWE
DEST FR
AFI
NNL
DAU
TNO
RCH
EGB
R ISL
PRT
DNK
D. Young adults able to programAverage of the male and female shares, 2019
% of the 16-24

| 39
OECD ECONOMIC SURVEYS: DENMARK 2021 © OECD 2021
Investment in ICTs and knowledge-based capital is around average among peer countries, and intangible knowledge-based capital has not increased nearly as fast as in Finland, France, the Netherlands and Sweden (Figure 1.24). Intangible investment is typically riskier and harder to use as collateral, heightening the importance of making it easier for firms to raise equity finance. The 2019 Economic Survey recommended enabling pension funds to increase the share of investments in unlisted Danish equity (Table 1.7). Easing access to financing for young innovative firms and reducing barriers to digital trade each have the potential to increase firm productivity in Denmark by around half a per cent through increasing adoption of digital technologies (Sorbe et al., 2019[77]).
Figure 1.24. Investment in ICTs and knowledge-based capital is average among peer countries
Note: Other knowledge based capital assets, including organisational capital and training, are estimated on the basis of INTAN-Invest data and cover all industries excluding real estate activities, public administration, education, health and households. Source: OECD calculations based on OECD National Accounts database and INTAN-Invest data, http://www.intaninvest.net.
StatLink 2 https://stat.link/9bgev6
While Danes in general are highly educated and have strong technical skills, there is a relatively large share of young adults (17% in 2018) who do not finish high school or have a vocational qualification (OECD, 2020[19]). This is higher than the OECD median (13%) and well behind leading countries such as the United States, Canada, the Czech Republic and Korea with less than 10%. Around 38% of young adults who do not finish high school suffer from multiple or complex problems, while many others have been enrolled in further education without finishing it (MoF, 2020). These issues point to the importance of early intervention: Denmark already has among the highest rates of enrolment in Early Childhood Education and Care, but efforts are needed to make the teaching profession more attractive and strengthen the impact of professional development for educators (OECD, 2020[78]), including more formal ICT training. Tailoring such training towards engaging children most likely to drop out of school would deliver benefits through broadening the base of strong foundational skills needed to help people to adjust to new technology.
As in other OECD countries, teleworking became more prevalent during the COVID crisis. The Government should continue to take steps to maximise the potential productivity gains and reductions in commuting from more prevalent teleworking while managing the potential downsides. A high share of teleworking before the crisis reflected fast and reliable broadband coverage, high ICT skills as well as a high share of employment in knowledge and ICT-intensive services more amenable to remote work (Milasi, González-Vázquez and Fernández-Macías, 2021[79]). As high income workers can benefit from a wage premium from working from home, whereas lower income workers are less likely to be able to work from home, teleworking is likely to reinforce existing inequalities (Stantcheva, 2021[80]). Rural-urban disparities are likely to be exacerbated by differences in access to teleworking, while gender labour market disparities
0
2
4
6
8
10
12
14
16
DEU GBR FIN DNK FRA NLD USA SWE
Other knowledge-based capital assets R&D and other intellectual property products Computer software and databases ICT equipment
0
1
2
3
4
5
6
7
DEU DNK FIN GBR FRA USA NLD SWE
1995 2005 2016
B. Other knowledge-based capital assets over time% of GDP
A. Investment in ICTs and knowledge-based capital assets% of GDP, 2016
40 |
OECD ECONOMIC SURVEYS: DENMARK 2021 © OECD 2021
can be reduced by the greater likelihood of women in employment to work remotely (Stantcheva, 2021[80]). To continue to get the greatest benefits from teleworking, the government should disseminate best management practices for SMEs in particular, while working with social partners to reform labour laws to reflect new tele- and hybrid working arrangements across the income distribution, addressing concerns around issues such as hidden overtime and inappropriate home working environments.
Enhancing the benefits from strong female labour market participation
Danish women are well-integrated into the labour market thanks to strong educational attainment and supportive policy settings. The gap between employment rates of women and men is among the smallest in the OECD at 5.7 percentage points. The gender gap in employment is similarly low to other Nordic countries for people aged 15-54 but roughly 5 percentage points larger for those aged 55 to 64, suggesting a cohort effect that will bring the gender employment gap down further as this generation retires.The median wage gap for full-time employees of 4.9% is also relatively low (OECD, 2021[81]). The decline in women’s employment during the COVID crisis was similar to that for men, though a bigger fall in employment for women aged 25-34 is consistent with international evidence that mothers took on the bulk of the additional childcare responsibility when schools and childcare facilities closed (Sevilla and Smith, 2020[82]). Good access to parental leave and high-quality early childhood education and care helps support mothers to return to work, fostering gender equality in the labour market, though as recommended in the 2019 survey () more flexibility in the provision of childcare services would reduce the interruption to women’s pathway to senior and management positions. Taxes on the incomes of second earners fall around the middle of OECD countries (OECD, 2021[83]).
Despite the labour market success of Danish women, they still suffer a significant earnings penalty with motherhood (Figure 1.25, Panel A). One important step to remedy this is a more even split between the share of parental leave taken by mothers and fathers through implementing the EU-wide minimum of two months reserved for each parent (Table 1.7). Fathers who take leave are more likely to take an active role in childcare, even after they return to work. Danish evidence shows that when fathers take longer leave, mothers reduce their own leave and experience wage gains that increase overall earnings (Andersen, 2018[84]), consistent with quasi-experimental evidence from Canada that greater use of parental leave by fathers boosts female participation by more than it reduces male participation (Patnaik, 2019[60]). Denmark should monitor uptake after increasing the share of leave reserved for second parents, as the replacement rate of 53% of average earnings is below the OECD average (69%) (OECD, 2021[85]) and there has been low takeup in countries such as Japan, Korea and France with generous leave periods but below-average replacement rates (OECD, 2016[86]).
Danish women account for only a small share of managers (Figure 1.25, Panel B). Reporting of gender-disaggregated statistics to Statistics Denmark has been successful in reducing pay gaps (Bennedsen et al., 2019[87]), but there are no gender-based quotas for supervisory boards, which have been successful in raising the female share in a number of neighbouring countries including Austria, Belgium, France, Germany and Norway, or managers. Providing female role models and mentors is critical to change gender stereotypes, support leadership development and access to networks for women (OECD, 2017[88]). Requirements for gender balance in positions of leadership need to be strengthened, potentially including quotas as a transitional tool to drive the shift and provide role models for women. By expanding the overall talent pool, a higher share of women in leadership positions boosts corporate performance in countries with otherwise high gender parity (Post and Byron, 2015[89]) and removing barriers to the allocation of women and minorities into high-skilled occupations can have a substantial effect on aggregate economic performance (Hsieh et al., 2019[90]). That said, there is little evidence that gender quotas for boards of directors have raised short-term economic efficiency elsewhere, notably in Norway where a 40% quota for the boards of publicly listed companies was introduced in 2008 (Smith, 2018[91]). Complementary reforms may be needed, such as reducing barriers to women working outside the public sector, where the female share of almost 70% is among the highest in the OECD.

| 41
OECD ECONOMIC SURVEYS: DENMARK 2021 © OECD 2021
Figure 1.25. Women suffer a motherhood earnings penalty and are under-represented in management positions
Note: Panel A is based on Figure 1, panel A of Kleven (2019). For more details, see Source. Source: H. Kleven, C. Landais and J. E. Søgaard (2019), "Children and Gender Inequality: Evidence from Denmark", American Economic Journal: Applied Economics, vol. 11(4), pages 181-209, Figure 1; OECD, Gender - Employment Statistics database.
StatLink 2 https://stat.link/bf7wnd
Improving the integration of migrants
A relatively small share of the Danish population was born overseas, with the split between economic, family and humanitarian immigrants tilted towards workers (Figure 1.26). Foreign labour has the potential to increase productivity through new ideas and knowledge as well as complementary skills, but the benefits to Denmark are hampered by the large gap in employment and educational outcomes between immigrants and the native Danes (Figure 1.27). Reducing these gaps would benefit immigrants themselves as well as the economy more broadly, while enhancing the fiscal impact of immigrants, which is estimated at about -1% of GDP (Ministry of Finance, 2020[92]). Employment during the COVID crisis declined much more for the foreign born (-3.7%) than for people of Danish origin (-2.2%). In part this was because foreign-born people were more likely to be working in badly hit industries, notably transportation, accommodation and food services, and travel, cleaning and other operational services. By the second quarter of 2021, employment of immigrants and natives alike had exceeded the pre-crisis level.
As set out in the 2016 and 2019 Economic Surveys, the quality and implementation of integration programs for migrants is unequal across municipalities and should be improved. Subsidised employment schemes have had the largest effect on the rate of movement from social assistance to regular employment (Heinesen, Husted and Rosholm, 2013[93]) but the share of recent migrants in company-oriented employment or internships has fallen from a peak of 28% in 2017 to less than 20% in 2020 and 2021. The two-year Integration Education Programme established in 2016 and due to run until June 2022 has been succesful in building collaboration with employers and educational institutions to develop work experience, skills and networks while reducing hiring reticence on the part of employers (Rambøll, 2018[94]). This Programme should be extended and broadened further while working to reduce high dropout rates, partly due to low salaries. Enhanced language training should also be a key aspect of improving integration programmes: historical improvements in Danish language training for refugees had a significant permanent positive effect on earnings, led to better outcomes for their children and carried a benefit-cost ratio of up to 15 to 1 (Arendt et al., 2021[95]). Municipalities still see insufficient Danish skills as one of the greatest
-0.40
-0.35
-0.30
-0.25
-0.20
-0.15
-0.10
-0.05
0.00
0.05
0.10
-5 -4 -3 -2 -1 0 1 2 3 4 5 6 7 8 9 10Event time (years)
A. Impact of children on earnings
Male earningsFemale earnings
Long-run child penalty = 0.194
Earnings relative to t = -1
First child birth
0
10
20
30
40
50
60
LUX
DNK
NLD ITA
DEU
BEL
AUT
OECD CH
ENO
RFR
AIR
LGB
RFI
NAU
SSW
EUS
A ISL
%
B. Shares of female managers and of women in employment, 2020 or latest available year
Share of female managersShare of women in employment

42 |
OECD ECONOMIC SURVEYS: DENMARK 2021 © OECD 2021
barriers facing unemployed immigrants (VIVE, 2021[96]) and the Danish Education Association (2015[97]) has proposed improving integration through intensive Danish language training during the first 6 months and language mentoring once immigrants are in work. Providing greater certainty to refugees that they will be able to stay in Denmark would increase their incentives to integrate and learn Danish.
Figure 1.26. Denmark has relatively few immigrants, from a mix of migrant streams
Note: Economic category is defined as work immigrants and accompanying family of workers. Source: OECD, International Migration database and OECD, International Migration Outlook, various years.
StatLink 2 https://stat.link/ugvt1x
05101520253035404550
05
101520253035404550
MEX
POL
TUR
SVK
CHL
LTU
HUN
FIN
CZE
ITA
DNK
PRT
GRC
LVA
SVN
FRA
NLD
USA
GBR
ESP
EST
NOR
DEU
BEL
IRL
ISL
AUT
SWE
CAN
ISR
NZL
CHE
AUS
LUX
A. Stock of foreign-born populationPercent of total population, 2019 or latest year available
0102030405060708090100
0102030405060708090
100
ITA CHE FIN BEL SWE NOR KOR DEU USA AUT FRA MEX ESP NLD LUX PRT GBR DNK NZL CAN AUS JPN IRL
B. Permanent migration flows by categoryPercent of total migration flows excluding free movements and other, average 2015-2018
Economic Family Humanitarian

| 43
OECD ECONOMIC SURVEYS: DENMARK 2021 © OECD 2021
Figure 1.27. Danish immigrants are behind on skills and employment
Note: In Panel A, a positive score indicates better performance for non-immigrants than (first- and second-generation) immigrants. Source: OECD (2019), PISA 2018 Results (Vol II), Table II.3; OECD, Migration Statistics database.
StatLink 2 https://stat.link/l91uoc
-20-1001020304050607080
-20-10
01020304050607080
MEX
FIN ISL
SWE
SVK
EST
DNK
CZE
AUT
NOR
SVN
LTU
TUR
PRT
CHE
OECD NL
D ITA
GRC
BEL
DEU
LUX
CHL
FRA
CRI
IRL
NZL
HUN
LVA
GBR
CAN
ISR
AUS
USA
A. Difference in PISA reading performance between non-immigrant and immigrant studentsScore-point difference in reading, after accounting for socio-economic status
Statistically significantStatistically not significant
4045505560657075808590
4045505560657075808590
TUR
GRC
FRA
BEL
ITA
ESP
DNK
NLD
MEX
FIN
LVA
SVN
AUT
SWE
NOR
OECD DE
ULT
UAU
SUS
AES
TIR
LLU
XNZ
LGB
RPO
LCH
EPR
TCH
LCZ
EIS
RSV
KHU
N ISL
%%B. Employment rate by birth origin
2019 or latest year available
Foreign-bornNative-born

44 |
OECD ECONOMIC SURVEYS: DENMARK 2021 © OECD 2021
Table 1.7. Past recommendations and actions taken on productivity
Recommendations Action taken since 2019 survey Provide greater power to competition authorities to impose administrative fines and structural remedies within constitutional constraints.
Implementation of the European Competition Network directive in March 2021 will allow civil competition cases to be taken by the Danish Competition and Consumer Authority. The Authority will establish a new Competition Law, Investigation and Litigation Centre to undertake its new responsibilities, including the capacity for unannounced inspections and temporary structural orders.
Broaden public support to business R&D through well-designed R&D grants and tax credits for incremental R&D expenses.
The enhanced tax allowances have been raised to 130 % in 2020- 2022 for R&D expenses of up to DKK 850 million
Increase flexibility in the provision of childcare services, including outside of regular working hours to further narrow the gender gap. Encourage parents to split parental leave more equally by increasing the share reserved for each parent.
In 2019, the European Union decided that each parent should have a minimum of two months reserved parental leave. This directive will become effective in Denmark in June 2022.
Develop clearer standards for exemptions from the Competition Act and involve competition authorities in their determination.
No action taken.
Improve collaboration between universities and businesses by reducing the complexity of the system regulating cooperation, and improving intellectual property right policies of universities.
No action taken.
Reduce student grants for tertiary education and rely more on student loans. Link repayment conditions to subsequent income and labour market status.
No action taken.
Spread best integration practices across municipalities and strengthen co-ordination of services such as language training and subsidised work to ease integration. Improve the integration-training programme in collaboration with social partners and make it permanent.
No action taken.
Assess whether the current visa schemes for non-EU workers sufficiently address skill needs and consider simplifying entry procedures.
No action taken.
Proceed with revisions of regulatory frameworks to make them technology-neutral and monitor fast evolving sectors to swiftly respond to emerging market failures.
No action taken.
Deploy key enabling technology standards in the public sector and make government data more available and usable.
Legislative changes passed in May 2021 strengthened access to and availability of government data.
Raise awareness and education for digital risk management in businesses.
In March 2021, the Danish Business Authority launched an online tool for risk assessment of IT systems, aimed at helping SMEs in their management of digital risk.
Harnessing synergies between climate action and the local environment
Demark performs relatively well and has made notable progress across a range of environmental indicators (Figure 1.28). Apart from being a green energy pioneer, the country has also succeeded at mitigating air and water pollution with ambitious and innovative policies. The development of renewable energy, proactive energy efficiency policies and tightened regulation of vehicles, while reducing greenhouse gas emissions, also contributed to a substantial improvement in air quality. While exposure to particulate air pollution exceeding WHO recommendations (10 micrograms per m3) concerned nearly all inhabitants in 2000, it now affects a minority (36% of the population in Denmark against 74% of the European Union), and premature deaths related to particulate matters have also dropped. However, the average exposure of Denmark’s inhabitants still exceeds WHO recommendations, particularly in urban areas.
Denmark is also performing well on a number of waste management indicators. It has succeeded in reducing its share of landfilled waste to less than 1% of municipal waste (against 39% in all OECD countries), with more than half incinerated. Recovery and recycling rates exceed 85% for construction and destruction, end-of-life vehicles, and waste electrical and electronic equipment (OECD, 2019[98]).

| 45
OECD ECONOMIC SURVEYS: DENMARK 2021 © OECD 2021
Figure 1.28. Environmental performance
Source: IEA, Energy - World Energy Balances database; OECD, Environment - Green Growth database.
StatLink 2 https://stat.link/fw8hlq
This success stems from a long tradition of using a policy mix of economic incentives, together with support for innovation and green technologies, ambitious targets and an effective centralised governance for the environment. Environmental taxation amounts to 3.4% of GDP, ranking highly among OECD and European OECD countries (respectively 2.1% and 2.3% of GDP on average), mainly for taxing air emissions (including greenhouse gases, but also NOx and SOx). Taxation on landfilling and incineration succeeded in creating strong incentives and reducing landfilling (though incineration is still high). Denmark is also among the few countries that has implemented a tax on pesticides for agriculture, discouraging the most harmful substances by calibrating rates to their impact on the environment and human health. Finally, water discharge in the countryside is charged relative to the pollution load, applying to nitrogen, phosphorous and organic material (OECD, 2019[98]). Conversely, in agriculture, practices allowing for more efficient use of nutrients are subsidised at their cost (Chapter 3).
Despite progress, weaknesses remain with regard to water quality, biodiversity and waste. Although Denmark has successfully reduced its nutrient discharges using regulation and economic incentives, the nutrient balance of agriculture is still higher than the OECD average, contributing to the poor quality of surface water: 27% of all surface waterbodies and 62% of coastal waterbodies are in bad or poor ecological state, according to the Water Framework Directive classification, relative to 16% of all EU surface water
0
20
40
60
80
100
120
140
2000 2005 2010 2015 2020
Total energy supply per GDP(toe per 2015 USD PPP)
OECDDNK
0
5
10
15
20
25
30
35
40
2000 2005 2010 2015 2020
Share of renewable sources (% of total energy supply)
DNK
OECD
0
2
4
6
8
10
12
14
16
18
2000 2005 2010 2015 2020
OECDDNK
Mean population exposure to PM2.5(µg/m³)
0102030405060708090
100
DNK OECD
Incineration
Landfills
Recycling/composting
Other
Municipal waste by type of treatment (% of treated waste, 2019)
0
100
200
300
400
500
600
700
800
900
2000 2005 2010 2015 2020
Municipal waste generated(kg per capita)
DNK
OECD
0
3
6
9
12
15
18
21
24
27
2000 2005 2010 2015 2020
Terrestrial protected area(% of land area)
EU28OECDDNK

46 |
OECD ECONOMIC SURVEYS: DENMARK 2021 © OECD 2021
bodies and 9% of EU coastal waterbodies (EEA, 2018[99]). Facing similar issues on nitrogen pollution, the Netherlands in March 2021 adopted a new law with a comprehensive programme of nitrogen-reduction measures, supported by a monitoring system that will allow measures to be adjusted according to EU directives (OECD, 2021[100]). In Denmark, the share of protected areas at land is still low relative to other countries (Figure 1.28 above), particularly as regards to the EU objectives of establishing protected areas for at least 30% of lands and 30% of marine areas. This is partly due to the fact that Denmark is a densely populated country with a high share of land with intensive agricultural production and production forest land. Denmark is in the process of designating 19 new protected areas at sea which will allow to reach the 30% target (form 19% today) Habitats and biodiversity are also under threat, particularly in marine environments, as 55% of known species and 95% of habitats are considered to have a poor or bad conservation status in Demark, both of which are high relative to other EU countries (EEA, 2020[101]). In 2020 a broad political agreement was made in Denmark about a Danish Nature and Biodiversity Package, including up to 75 000 hectares of untouched forest, establishment of 15 new nature national park with a DKK 888 million budget for 2021-2024.
Efforts also remain to establish a circular economy, as Denmark has a very high material consumption and municipal waste volume per capita, showing a failure to consume low-material goods and to enhance circular economy patterns for municipal waste. A strategy to prevent or recycle waste is crucial, with clear objectives, milestones and responsibilities and the Action Plan for the Circular Economy published in July 2021 for the period 2020-2030 paves the way for a carbon neutral waste and recycling sector. However, this would require a new waste management pattern in the long term, dealing with the reduced supply of waste for energy generation. The use of large-scale electric heat-pumps and alternative fuels for residential heating, as recommended in Chapter 3, would efficiently address this risk of shortage without recourse to importing more waste for burning.
The large synergies between climate mitigation strategies and other environmental objectives should be harnessed (OECD, 2019[102]). Agriculture offers a particularly favourable ground for such synergies, as arable land covers 60% of Danish terrestrial territory (Chapter 3). Practices that contribute to carbon sequestration in soils and reduced nutrient loads in the environment generally also benefit biodiversity, as well as the quality of air, soils and waterbodies. Similarly, many measures that reduce transport or residential CO2 emissions will also improve air quality, such as the restriction of high-emission vehicle use or the electrification of house heating. Denmark has made progress in sustainable fishing practices and the fight against overfishing, notably through strong monitoring of fishing activities and endorsement of the Marine Stewardship Council label (over 85% of Denmark’s catch) (OECD, 2019[98]). Such action directly benefits marine biodiversity and habitats and secures resources for future economic growth, but can also preserve marine ecosystems and their capacity of to store carbon (Sala et al., 2021[103]) (Mariani et al., 2020[104]).
The integration of environmental dimensions other than climate change in policy decisions will help identify synergies and options to enhance them. It will also highlight the risk of trade-offs and help address them so that they do not turn into barriers to action. The material consumption and emissions to build low-carbon technologies (e.g. CCS plants or wind turbines) or non-exhaust pollutions from brakes, clutches, tyres and road surfaces due to electric vehicles use for instance, should be accounted for, even if life-cycle emissions of renewable technologies are overall much lower (IPCC, 2014[105]). Assessing the material impact of these technologies would also help anticipate waste management and alleviate detrimental environmental impact, for instance by integrating the material in the circular economy (Wind Denmark International, 2019[106]). Valuing a broad range of natural assets in policy decisions can be a first step forward (Dasgupta, 2021[107]).

| 47
OECD ECONOMIC SURVEYS: DENMARK 2021 © OECD 2021
MAIN FINDINGS, key policy insights chapter RECOMMENDATIONS (key recommendations in bold) Macroeconomic policies to support the recovery
The recovery is well established, with important downside risks from further virus outbreaks and upside risks from continued strong demand and labour market pressures. Fiscal tightening is planned for 2022, with DKK 4 billion (0.17% of GDP) set aside for COVID-related measures.
Continue to withdraw exceptional COVID-related measures in 2022, as planned. Be prepared to resume targeted support if an unexpected deterioration of the health situation threatens domestic and external demand.
Fiscal policy is sustainable, but the Budget Law leaves little fiscal space to to meet longer-term challenges.
Provide greater flexibility in the fiscal rule over the medium term by allowing a larger deficit, without threatening fiscal sustainability. Allow municipalities to carry forward surpluses for future use.
Top income tax rates are among the highest in the OECD, with negative consequences for incentives to increase earnings by working more or further education. High taxes on capital income blunt incentives for entrepreneurship, investment and job creation.
Reduce top income tax rates while offsetting revenue and distributional consequences by increasing taxes on owner-occupied housing and environmental harm.
An acceleration of house and equity prices amid high household debt is increasing macroeconomic and financial stability risks as the economy recovers.
Be ready to tighten macroprudential regulation if risks continue to build, for example by introducing general debt-to-income limits.
All households are eligible for social housing, with 80% of tenants in the bottom half of the income distribution. Among private renters the biggest beneficiaries of regulated rents have been high-income households.
Better target social housing to those in need, particularly in high-demand urban areas where waiting times are longest. Reduce stringency of rental regulation for buildings built before 1991.
Boosting labour market inclusion and productivity Danish firms are in a strong position to benefit from digital transformation, but weak business dynamism, limited access to capital for young firms, modest investment in intangibles and restrictions on the flow of data threaten the diffusion of productivity-boosting digital technologies.
Expand existing support measures to provide more equity finance and access to capital in the scale-up phase. Reduce barriers to digital trade through greater interoperability of approaches to cross-border data flows.
Female labour force participation is high and the gender wage gap low, but women still suffer a motherhood penalty and there are few women in leadership positions.
Implement planned increase in parental leave reserved for fathers and increase payment rates if take-up disappoints. Expand mentoring for women and consider quotas in supervisory and/or management boards as a transitional tool.
Benefits from immigration are hampered by the large gap in employment and education between immigrants and native Danes, with immigrants particularly badly affected by the COVID crisis.
Improve immigrant integration programmes by broader adoption of best practices across municipalities, especially for language training, and extension of the Integration Education Programme.
Exploiting synergies between climate action and the local environment Strong synergies exist between climate change mitigation and other environmental objectives.
Assess and monitor a broad set of environmental performance indicators in order to identify actions with co-benefits and anticipate potential trade-offs.
Water quality is low, particularly in coastal waters, despite strong improvement in recent decades. Denmark falls short in effectively preserving biodiversity and habitats.
Continue to improve the cost-effectiveness of measures to reduce nitrate pollution of coastal waters. Update the biodiversity strategy and ensure its coherence with EU targets for 2030; Set intermediate targets for protected areas and the connectivity of ecosystems.
Denmark generates a very large amount of municipal waste, while having succeeded to reduce landfilling to near zero.
Reinforce waste prevention as a key priority through expanded pricing based on volume or weight, the facilitation of recycling and composting and minimising single-use products, such as plastics.

48 |
OECD ECONOMIC SURVEYS: DENMARK 2021 © OECD 2021
References
Agrawala, S. et al. (2010), “Plan or React? Analysis of Adaptation Costs and Benefits Using Integrated Assessment Models”, OECD Environment Working Papers, No. 23, OECD Publishing, Paris, https://dx.doi.org/10.1787/5km975m3d5hb-en.
[52]
Alvarez, J., M. Kallestrup-Lamb and S. Kjærgaard (2021), “Linking retirement age to life expectancy does not lessen the demographic implications of unequal lifespans”, Insurance: Mathematics and Economics, Vol. 99, pp. 363-375, http://dx.doi.org/10.1016/j.insmatheco.2021.04.010.
[45]
Andersen, S. (2018), “Paternity Leave and the Motherhood Penalty: New Causal Evidence”, Journal of Marriage and Family, Vol. 80/5, pp. 1125-1143, http://dx.doi.org/10.1111/jomf.12507.
[84]
Andersen, T., M. Svarer and P. Schrøder (2020), Rapport fra den økonomiske ekspertgruppe vedrørende udfasning af hjælpepakker.
[5]
Arendt, J. et al. (2021), Language Training and Refugees’ Integration, IZA Institute of Labour Economics Discussion Paper No. 14145, http://ftp.iza.org/dp14145.pdf.
[95]
Bennedsen, M., I. Birthe Larsen and D. Scur (2020), “Preserving job matches during the COVID-19 pandemic: Firm-level evidence on the role of government aid”, Covid Economics, Vol. 27, pp. 1-30.
[4]
Bennedsen, M. et al. (2019), Do firms respond to gender pay gap transparency?, https://www.nber.org/system/files/working_papers/w25435/w25435.pdf.
[87]
BIS (2021), Credit-to-GDP gaps, https://www.bis.org/statistics/c_gaps.htm. [31]
Calvino, F., C. Criscuolo and R. Verlhac (2020), “Declining business dynamism: Structural and policy determinants”, OECD Science, Technology and Industry Policy Papers, No. 94, OECD Publishing, Paris, https://dx.doi.org/10.1787/77b92072-en.
[73]
Carreras, O., E. Davis and R. Piggott (2018), “Assessing macroprudential tools in OECD countries within a cointegration framework”, Journal of Financial Stability, Vol. 37, pp. 112-130, http://dx.doi.org/10.1016/j.jfs.2018.04.004.
[36]
Cavalleri, M., B. Cournède and E. Özsöğüt (2019), “How responsive are housing markets in the OECD? National level estimates”, OECD Economics Department Working Papers, No. 1589, OECD Publishing, Paris, https://dx.doi.org/10.1787/4777e29a-en.
[24]
Cerutti, E., S. Claessens and L. Laeven (2017), “The use and effectiveness of macroprudential policies: New evidence”, Journal of Financial Stability, Vol. 28, pp. 203-224, http://dx.doi.org/10.1016/j.jfs.2015.10.004.
[35]
Chapelle, G., E. Wasmer and P. Bono (2019), “Spatial Misallocation and Rent Controls”, AEA Papers and Proceedings, Vol. 109, pp. 389-392, http://dx.doi.org/10.1257/pandp.20191024.
[25]
Cournède, B., S. Sakha and V. Ziemann (2019), “Empirical links between housing markets and economic resilience”, OECD Economics Department Working Papers, No. 1562, OECD Publishing, Paris, https://dx.doi.org/10.1787/aa029083-en.
[29]

| 49
OECD ECONOMIC SURVEYS: DENMARK 2021 © OECD 2021
Cournède, B., V. Ziemann and F. De Pace (2020), “The Future of Housing: Policy Scenarios”, OECD Economics Department Working Papers, No. 1624, OECD Publishing, Paris, https://dx.doi.org/10.1787/0adf02cb-en.
[28]
Danish Economic Councils (2021), Danish Economy, Spring 2021, https://dors.dk/vismandsrapporter/dansk-oekonomi-foraar-2021.
[2]
Danish Economic Councils (2021), Economy and Environment, 2020. [48]
Danish Economic Councils (2020), Danish Economy, Autumn 2020, https://dors.dk/vismandsrapporter/dansk-oekonomi-efteraar-2020.
[46]
Danish Education Association (2015), Uddannelsesforbundet klar med nyt integrationsudspil, https://www.uddannelsesforbundet.dk/nyheder/2015/december/uddannelsesforbundet-klar-med-nyt-integrationsudspil?c=01896d&i=1089.
[97]
Danish National Productivity Board (2020), Productivity 2020, Danish Economic Councils, https://dors.dk/vismandsrapporter/produktivitet-2020.
[57]
Danmarks Nationalbank (2021), Banking and Mortgage Lending, Balances. [34]
Danmarks Nationalbank (2021), Financial Stablity - 1st half 2021: Build-up of risks in credit institutions.
[32]
Danmarks Nationalbank (2021), Høj opsparing under corona var drevet af restriktioner snarere end forsigtige forbrugere.
[3]
Danmarks Nationalbank (2020), A few banks fall short of capital requirements in stress test. [33]
Dasgupta, P. (2021), “The Economics of Biodiversity: The Dasgupta Review”, HM Treasury. [107]
Demmou, L. and G. Franco (2020), “Do sound infrastructure governance and regulation affect productivity growth? New insights from firm level data”, OECD Economics Department Working Papers, No. 1609, OECD Publishing, Paris, https://dx.doi.org/10.1787/410535403555.
[61]
Dititization Partnership (Digitaliserings Partnerskab) (2021), Visioner og anbefalinger til Danmark som et digitalt foregangsland, https://fm.dk/media/25213/visioner-og-anbefalinger-til-danmark-som-et-digitalt-foregangsland_digitaliseringspartnerskabet.pdf.
[69]
EC (2019), SME access to finance situation in EU member states, SME Envoys Finance, https://ec.europa.eu/docsroom/documents/39645/attachments/1/translations/en/renditions/native.
[75]
ECIPE (2019), Digital Trade Restrictiveness Index, European Centre for International Political Economy, https://globalgovernanceprogramme.eui.eu/wp-content/uploads/2019/09/Digital-Trade-Restrictiveness-Index.pdf.
[70]
Economic Expert Group (2021), Report from the Economic Expert Group on the phasing out of relief packages II, https://fm.dk/nyheder/nyhedsarkiv/2021/maj/oekonomiske-eksperter-er-klar-med-rapport-om-udfasning-af-hjaelpepakker/.
[43]
EEA (2020), State of nature in the EU — European Environment Agency, https://www.eea.europa.eu/publications/state-of-nature-in-the-eu-2020/.
[101]

50 |
OECD ECONOMIC SURVEYS: DENMARK 2021 © OECD 2021
EEA (2018), 2018 Water Assessment — European Environment Agency, https://www.eea.europa.eu/themes/water/european-waters/water-quality-and-water-assessment/water-assessments/eea-2018-water-assessment (accessed on 8 July 2021).
[99]
ElFayoumi, K. et al. (2021), Affordable Rental Housing: Making It Part of Europe’s Recovery, https://www.imf.org/en/Publications/Departmental-Papers-Policy-Papers/Issues/2021/05/24/Affordable-Rental-Housing-Making-It-Part-of-Europes-Recovery-50116.
[18]
Eriksson, T. (2012), “Flexicurity and the Economic Crisis 2008-2009: Evidence from Denmark”, OECD Social, Employment and Migration Working Papers, No. 139, OECD Publishing, Paris, https://dx.doi.org/10.1787/5k8x7gw8btq6-en.
[8]
European Commission (2021), International Digital Economy and Society Index 2020, http://file:///C:/Users/barker_a/Downloads/i_desi_2020_0087_final_report_CF99179F-A5B7-6ABF-2C1E8CB44E0EEFA7_72352.pdf.
[65]
European Commission (2021), Laying the Foundations for Recovery: Denmark, https://ec.europa.eu/info/system/files/denmark-recovery-resilience-factsheet_en.pdf.
[42]
European Commission (2021), The 2021 Ageing Report: Economic and Budgetary Projections for the EU Member States (2019-2070), https://ec.europa.eu/info/publications/2021-ageing-report-economic-and-budgetary-projections-eu-member-states-2019-2070_en.
[47]
Eurostat (2021), Education and Training Database, https://ec.europa.eu/eurostat/web/education-and-training/data/database.
[67]
Eurostat (2021), ICT Usage in Enterprises dataset, Digital Economy and Society database, https://ec.europa.eu/eurostat/web/digital-economy-and-society/data/database.
[66]
Eurostat and iSRP (2021), 2020 Current Market Rents Estimates, https://ec.europa.eu/eurostat/documents/6939681/7243182/Booklet_2021_rents_2020_e_mockup_FINAL.pdf/c90aa8a4-24df-05db-99a9-b75799fdac73?t=1614163006940.
[17]
Folketinget (2016), Almene boliger i Danmark (Social housing in Denmark), Velfærdspolitisk Analyse nr. 3 ∙ April 2016.
[22]
Heinesen, E., L. Husted and M. Rosholm (2013), “The effects of active labour market policies for immigrants receiving social assistance in Denmark”, IZA Journal of Migration, Vol. 2/1, http://dx.doi.org/10.1186/2193-9039-2-15.
[93]
Hinkel, J. et al. (2010), “Assessing risk of and adaptation to sea-level rise in the European Union: an application of DIVA”, Mitigation and Adaptation Strategies for Global Change, Vol. 15/7, pp. 703-719, http://dx.doi.org/10.1007/s11027-010-9237-y.
[51]
Hsieh, C. et al. (2019), “The Allocation of Talent and U.S. Economic Growth”, Econometrica, Vol. 87/5, pp. 1439-1474, http://dx.doi.org/10.3982/ecta11427.
[90]
IMF (2021), Denmark 2021 Article IV Consultation. [12]
Immervoll, H. and M. Pearson (2009), “A Good Time for Making Work Pay? Taking Stock of In-Work Benefits and Related Measures across the OECD”, OECD Social, Employment and Migration Working Papers, No. 81, OECD Publishing, Paris, https://dx.doi.org/10.1787/225442803245.
[54]

| 51
OECD ECONOMIC SURVEYS: DENMARK 2021 © OECD 2021
Invest Europe (2021), Investing in Europe: Private Equity Activity 2020, https://investeurope.eu/media/4004/investing-in-europe_private-equity-activity_2020_invest-europe_final.pdf.
[56]
IPCC (2014), AR5 Climate Change 2014: Mitigation of Climate Change. [105]
ITF (2017), Strategic Infrastructure Planning: International Best Practice, International Transport Forum, Paris.
[63]
Koomen, M. and L. Wicht (2021), “Pension systems and the current account: an empirical exploration”, Journal of International Money and Finance, p. 102520, http://dx.doi.org/10.1016/j.jimonfin.2021.102520.
[13]
Leszczuk, J. and S. Pojar (2016), What is Behind Denmark’s Current Account Surplus?, https://ec.europa.eu/info/sites/default/files/file_import/eb018_en_2.pdf.
[14]
Mariani, G. et al. (2020), “Let more big fish sink: Fisheries prevent blue carbon sequestration—half in unprofitable areas”, Science Advances, Vol. 6/44, p. eabb4848.
[104]
Mattana, E., V. Smeets and F. Warzynski (2020), “Changing skill structure and COVID-19”, Covid Economics, Vol. 43, pp. 1-30.
[6]
Milasi, S., I. González-Vázquez and E. Fernández-Macías (2021), “Telework before the COVID-19 pandemic: Trends and drivers of differences across the EU”, OECD Productivity Working Papers, No. 21, OECD Publishing, Paris, https://dx.doi.org/10.1787/d5e42dd1-en.
[79]
Ministry of Finance (2020), Økonomisk Analyse: Indvandreres nettobidrag til de offentlige finanser i 2017, https://fm.dk/udgivelser/2020/juni/oekonomisk-analyse-indvandreres-nettobidrag-til-de-offentlige-finanser-i-2017/.
[92]
O’Callaghan,, B., N. Yau and E. Murdock (2021), Global Recovery Observatory, https://recovery.smithschool.ox.ac.uk/tracking/ (accessed on 22 October 2021).
[41]
OECD (2021), Affordable Housing Database, https://www.oecd.org/housing/data/affordable-housing-database/.
[20]
OECD (2021), Brick by Brick, OECD, http://dx.doi.org/10.1787/b453b043-en. [37]
OECD (2021), Broadband Portal, https://www.oecd.org/sti/broadband/broadband-statistics/. [64]
OECD (2021), Employment database, https://www.oecd.org/employment/emp/onlineoecdemploymentdatabase.htm.
[81]
OECD (2021), Family Database, https://www.oecd.org/els/family/database.htm. [85]
OECD (2021), Going Digital Toolkit, https://goingdigital.oecd.org/. [74]
OECD (2021), Green Recovery Database, https://www.oecd.org/coronavirus/en/themes/green-recovery.
[40]
OECD (2021), OECD Economic Surveys: Netherlands, OECD Publishing, Paris, https://dx.doi.org/10.1787/19990367.
[100]
OECD (2021), “Scoping note: Towards a framework for a decarbonisation strategy”, OECD Working Paper.
[59]

52 |
OECD ECONOMIC SURVEYS: DENMARK 2021 © OECD 2021
OECD (2021), Taxing Wages 2021, OECD Publishing, Paris, https://dx.doi.org/10.1787/83a87978-en.
[83]
OECD (2021), Timely indicators of entrepreneurship (ISIC 4). [72]
OECD (2020), “Education Policy Outlook in Denmark”, OECD Education Policy Perspectives, No. 12, OECD Publishing, Paris, https://dx.doi.org/10.1787/3288629c-en.
[78]
OECD (2020), Financing SMEs and Entrepreneurs 2020: An OECD Scoreboard, OECD Publishing, Paris, https://dx.doi.org/10.1787/061fe03d-en.
[76]
OECD (2020), Green budgeting and tax policy tools to support a green recovery, https://www.oecd.org/coronavirus/policy-responses/green-budgeting-and-tax-policy-tools-to-support-a-green-recovery-bd02ea23/.
[53]
OECD (2020), How’s Life? 2020, OECD, http://dx.doi.org/10.1787/9870c393-en. [19]
OECD (2020), Insights on productivity and business dynamics: Denmark, https://www.oecd.org/sti/ind/oecd-productivity-insights-denmark.pdf.
[58]
OECD (2020), OECD Tourism Trends and Policies 2020, OECD Publishing, Paris, https://dx.doi.org/10.1787/6b47b985-en.
[11]
OECD (2020), Social housing: A key part of past and future housing policy, Employment, Labour and Social Affairs Policy Briefs, http://oe.cd/social-housing-2020.
[23]
OECD (2019), Accelerating Climate Action: Refocusing Policies through a Well-being Lens, OECD Publishing, Paris, https://dx.doi.org/10.1787/2f4c8c9a-en.
[102]
OECD (2019), OECD Economic Surveys: New Zealand 2019, OECD, http://dx.doi.org/10.1787/b0b94dbd-en.
[71]
OECD (2019), OECD Environmental Performance Reviews: Denmark 2019, OECD Publishing, Paris, https://dx.doi.org/10.1787/1eeec492-en.
[98]
OECD (2019), Pensions at a Glance 2019, OECD, http://dx.doi.org/10.1787/b6d3dcfc-en. [44]
OECD (2019), Skills Matter: Additional Results from the Survey of Adult Skills, OECD Skills Studies, OECD Publishing, Paris, https://dx.doi.org/10.1787/1f029d8f-en.
[68]
OECD (2018), Taxation of Household Savings, OECD Tax Policy Studies, No. 25, OECD Publishing, Paris, https://dx.doi.org/10.1787/9789264289536-en.
[55]
OECD (2017), The Pursuit of Gender Equality: An Uphill Battle, OECD Publishing, Paris, https://dx.doi.org/10.1787/9789264281318-en.
[88]
OECD (2016), Parental Leave: Where are the fathers?, https://www.oecd.org/policy-briefs/parental-leave-where-are-the-fathers.pdf.
[86]
OECD (2015), Denmark: Follow-up to the Phase 3 Report and Recommendations, https://www.oecd.org/daf/anti-bribery/Denmark-Phase-3-Written-Follow-Up-Report-EN.pdf.
[38]
Oprisor, A., G. Hammerschmid and L. Löffler (2015), The Hertie School-OECD Global Expert Survey on Public Infrastructure.
[62]
| 53
OECD ECONOMIC SURVEYS: DENMARK 2021 © OECD 2021
Patnaik, A. (2019), “Reserving Time for Daddy: The Consequences of Fathers’ Quotas”, Journal of Labor Economics, Vol. 37/4, pp. 1009-1059, http://dx.doi.org/10.1086/703115.
[60]
Phillips, L. (2020), “Decentralisation and inter-governmental relations in the housing sector”, OECD Working Papers on Fiscal Federalism, No. 32, OECD Publishing, Paris, https://dx.doi.org/10.1787/2d3c3241-en.
[21]
Post, C. and K. Byron (2015), “Women on Boards and Firm Financial Performance: A Meta-Analysis”, Academy of Management Journal, Vol. 58/5, pp. 1546-1571, http://dx.doi.org/10.5465/amj.2013.0319.
[89]
Price, R., T. Dang and J. Botev (2015), “Adjusting fiscal balances for the business cycle: New tax and expenditure elasticity estimates for OECD countries”, OECD Economics Department Working Papers, No. 1275, OECD Publishing, https://dx.doi.org/10.1787/5jrp1g3282d7-en.
[39]
Rambøll (2018), Evaluering af integrationsgrunduddannelsen (Evaluation of the basic integration education), https://integrationsbarometer.dk/tal-og-analyser/filer-tal-og-analyser/arkiv/evaluering-af-integrationsgrunduddannelsen.
[94]
Sala, E. et al. (2021), “Protecting the global ocean for biodiversity, food and climate”, Nature 2021 592:7854, Vol. 592/7854, pp. 397-402, http://dx.doi.org/10.1038/s41586-021-03371-z.
[103]
Semieniuk, G. et al. (2020), “Low‐carbon transition risks for finance”, WIREs Climate Change, Vol. 12/1, http://dx.doi.org/10.1002/wcc.678.
[16]
Sevilla, A. and S. Smith (2020), Childcare during a global pandemic: Many women left juggling work and childcare, but men do their share when they are not working, VoxEU, https://voxeu.org/article/covid-19-and-childcare-men-doing-their-share-only-if-they-are-not-working.
[82]
Skak, M. and G. Bloze (2013), “Rent Control and Misallocation”, Urban Studies, Vol. 50/10, pp. 1988-2005, http://dx.doi.org/10.1177/0042098012470390.
[26]
Smith, D., M. Hermansen and S. Malthe-Thagaard (2019), “The potential economic impact of Brexit on Denmark”, OECD Economics Department Working Papers, No. 1544, OECD Publishing, Paris, https://dx.doi.org/10.1787/41a95fb3-en.
[9]
Smith, N. (2018), “Gender quotas on boards of directors”, IZA World of Labor, http://dx.doi.org/10.15185/izawol.7.v2.
[91]
Sorbe, S. et al. (2019), “Digital Dividend: Policies to Harness the Productivity Potential of Digital Technologies”, OECD Economic Policy Papers, No. 26, OECD Publishing, Paris, https://dx.doi.org/10.1787/273176bc-en.
[77]
Stantcheva, S. (2021), Inequalities in the times of a pandemic, https://scholar.harvard.edu/files/stantcheva/files/stantcheva_covid19_policy.pdf.
[80]
Statistics Denmark (2021), Statbank: External Economy, https://www.statbank.dk/statbank5a/SelectTable/omrade0.asp?SubjectCode=13&PLanguage=1&ShowNews=OFF.
[10]
Statistics Denmark (2021), Statbank: Labour, Income and Wealth, https://www.statbank.dk/statbank5a/default.asp?w=1920.
[1]

54 |
OECD ECONOMIC SURVEYS: DENMARK 2021 © OECD 2021
Stern, N. (2006), Stern Review on the Economics of Climate Change, Cambridge University Press.
[50]
Sutherland, D. and P. Hoeller (2012), “Debt and Macroeconomic Stability: An Overview of the Literature and Some Empirics”, OECD Economics Department Working Papers, No. 1006, OECD Publishing, Paris, https://dx.doi.org/10.1787/5k8xb75txzf5-en.
[30]
Svarer, M., M. Rosholm and J. Munch (2005), “Rent control and unemployment duration”, Journal of Public Economics, Vol. 89/11-12, pp. 2165-2181, http://dx.doi.org/10.1016/j.jpubeco.2004.11.003.
[27]
Svartzman, R. et al. (2020), “Central banks, financial stability and policy coordination in the age of climate uncertainty: a three-layered analytical and operational framework”, Climate Policy, Vol. 21/4, pp. 563-580, http://dx.doi.org/10.1080/14693062.2020.1862743.
[15]
Unemployment Benefit Commission (2015), Dagpengekommissionens samlede anbefalinger. [7]
UNEP (2021), Adaptation Gap Report 2020, https://www.unep.org/resources/adaptation-gap-report-2020.
[49]
VIVE (2021), Kortlægning af integration i kommunerne, https://www.vive.dk/media/pure/16147/5596718.
[96]
Wind Denmark International (2019), Decommissioned wind turbine blades become noise barriers, https://en.winddenmark.dk/news/decommissioned-wind-turbine-blades-become-noise-barriers.
[106]