NORWAY - OECD
97
THEMATIC REVIEW OF THE TRANSITION FROM INITIAL EDUCATION TO WORKING LIFE NORWAY BACKGROUND REPORT SEPTEMBER 1997 "The Royal Ministry of Education, Research and Church Affairs and the Royal Ministry of Labour and Administrative Government (former Ministry of Local Government and Labour) in Norway has granted the OECD permission to include this document on the OECD Internet Home Page. The copyright conditions governing access to information on the OECD Home Page are provided at http://www.oecd.org/copyr.htm" OCDE OECD
-
Upload
khangminh22 -
Category
Documents
-
view
2 -
download
0
Transcript of NORWAY - OECD
THEMATIC REVIEW OF THE TRANSITION
FROM INITIAL EDUCATION TO WORKING LIFE
NORWAY
BACKGROUND REPORT
SEPTEMBER 1997
"The Royal Ministry of Education, Research and Church Affairs and the Royal Ministry of Labour and AdministrativeGovernment (former Ministry of Local Government and Labour) in Norway has granted the OECD permission toinclude this document on the OECD Internet Home Page. The copyright conditions governing access to informationon the OECD Home Page are provided athttp://www.oecd.org/copyr.htm"
OCDE OECD
2
TABLE OF CONTENTS
CHAPTER 1: CONTEXTUAL AND INSTITUTIONAL FACTORS ..........................................................4
1.1 A description of main economic developments ....................................................................................41.2 Main trends in overall and youth unemployment..................................................................................5
1.2.1 Economic development and its effect on employment and qualification requirements for youngpeople .......................................................................................................................................................51.2.2 Main trends in the labour market ....................................................................................................51.2.3 Main trends in the labour market for young people........................................................................61.2.4 Measuring methods .........................................................................................................................6
1.3 Demography, education and employment .............................................................................................71.4 Broad structure of the education and training system ...........................................................................7
1.4.1 Structure of the educational administration ....................................................................................71.4.2 The structure of upper secondary education ...................................................................................81.4.3 The structure of higher education ...................................................................................................81.4.4 The administration of the Public Employment Service (PES) .......................................................9
CHAPTER 2: CLARIFICATION OF PERCEPTIONS...............................................................................10
2.1 Transition from initial education to working life ................................................................................102.1.1 Transition from lower secondary education .................................................................................102.1.2 Transitions from upper secondary education................................................................................112.1.3 Transition from higher education to working life.........................................................................112.1.4 Summing up ..................................................................................................................................11
CHAPTER 3: POLICY CHANGES AND CONCERNS ABOUT TRANSITION PROCESSES ANDOUTCOMES .................................................................................................................................................12
3.1 Upper secondary education..................................................................................................................123.1.1 Problems before Reform 94 ..........................................................................................................123.1.2 Solutions........................................................................................................................................133.1.3 The statutory rights and obligations under the reform..................................................................133.1.4 The structural reform ....................................................................................................................143.1.5 The reform of content ...................................................................................................................163.1.6 Capacity and number of pupils .....................................................................................................173.1.7 Concerns about special aspects of Reform 94 ..............................................................................173.1.8 Other educational institutions and aspects....................................................................................17
3.2 Higher education..................................................................................................................................203.2.1 Admission to Higher Education....................................................................................................223.2.2 Number of students .......................................................................................................................243.2.3 Through-flow of students in higher education..............................................................................243.2.4 The OECD report on the first years of tertiary education.............................................................25
3.3 Labour market policy...........................................................................................................................253.3.1 The Public Employment Service...................................................................................................25
3
3.3.2 Information and placement ...........................................................................................................273.3.3 Evaluations of schemes for transition from unemployment to employment and education .......27
3.4 Concerns about the labour market .......................................................................................................283.4.1 An analyses of young people - from education to work ...............................................................283.4.2 Transition to the labour market for young people ........................................................................293.4.3 Young immigrants in the labour market .......................................................................................313.4.4 Transition to the labour market for young people by level of educational attainment................32
CHAPTER 4: CHANGING EXPECTATIONS AND OBJECTIVES..........................................................33
4.1 Participants in policy formation process .............................................................................................334.1.1 Tripartite co-operation ..................................................................................................................334.1.2 The labour market programme Trainee Places .............................................................................334.1.3 Industry .........................................................................................................................................344.1.4 Young people ................................................................................................................................354.1.5 Teachers’ organisations.................................................................................................................36
CHAPTER 5: MONITORING AND RESEARCH.......................................................................................38
5.1 Monitoring and research at upper secondary level..............................................................................385.1.1 National monitoring ......................................................................................................................385.1.2 Evaluation of Reform 94...............................................................................................................38The flow of pupils through upper secondary education.........................................................................39Apprenticeship places ............................................................................................................................40The follow-up service ............................................................................................................................43Interruption of studies ............................................................................................................................43Youths with special educational needs (Handicapped) .........................................................................43Transition from school to working life for handicapped youths ...........................................................44
5.2 Monitoring and research in higher education......................................................................................455.3 Future aspects of the educational policy..............................................................................................465.4 Future aspects of the labour market policy..........................................................................................47
ANNEX I, APPENDIX I: THE DIFFERENT LEVELS OF THE EDUCATIONAL SYSTEM .................56
ANNEX I, APPENDIX II: LABOUR FORCE STATISTICS.....................................................................58
ANNEX II: UPPER SECONDARY EDUCATION .....................................................................................59
ANNEX II, APPENDIX I: MAIN AGENCIES DEALING WITH VOCATIONAL TRAINING ATUPPER SECONDARY LEVEL....................................................................................................................67
ANNEX II, APPENDIX II: CAPACITY AND NUMBER OF PUPILS......................................................70
ANNEX III: HIGHER EDUCATION IN NORWAY...................................................................................76
ANNEX III, ADDENDA: STRUCTURE OF HIGHER EDUCATION......................................................86
ANNEX IV: ADDITIONAL STATISTICS ON EDUCATION IN NORWAY...........................................88
4
CHAPTER 1: CONTEXTUAL AND INSTITUTIONAL FACTORS
1.1 A description of main economic developments
Since 1993 the Norwegian economy has been experiencing a strong cyclical expansion, following severalyears of sluggish growth. After somedecreasein growth in 1995, mainland GDP is projected to haveincreased by 3.7 per cent in 1996 and to increase by 3.3 per cent in 1997. The main growth impulses areexpected to come from continued growth in demand from private households. Due to a strong expansionin oil production which constitutes roughly 15 per cent of GDP, total GDP growth equalled 5.3 per cent in1996. In 1997 and 1998, the expected growth in total GDP is 3.9 per cent and 3.5 per cent respectively.Medium-term projections of a more technical nature for the period 1998 - 2001 show a 1.7 per centgrowth in mainland GDP, and a growth of 2.0 per cent in total GDP, reflecting the further expansion of oilproduction.
The decline in petroleum activity after the turn of the century underlinesthe need to maintain goodconditions for Mainland industries,among other things by avoiding a deterioration of competitiveness andmaintaining the ability to adjust. This means that great caution is needed in the use of oil revenue in thedomestic economy. In order to limit the use of oil revenue domestically and to create a buffer for publicfinances, the government has put up the Petroleum fund to accumulate financial assets that will allow asmooth adjustment to the new situation. The supply of labour and natural resources will limit economicgrowth in the longer term, at the same time as profitability requirements and competition for capital willincrease. In the future, economic growth will to a greater extent depend oncompetence, technology andhigher productivity.
The expansion of the economy has been accompanied by strong growth in employment. Last year, thegrowth in employment was as high as 2.5 per cent, and in 1997 a growth of 2 per cent is forecasted. Theunemployment rate declined from 5.4 per cent in 1995 to 4.9 per cent in 1996, and is expected to continueto fall to below 4 per cent in 1997.
Overall, economic conditions are conducive to further growth in output and employment:
− Since 1989, price inflation in Norway has been generally lower than in our trading partnercountries. In 1996 the consumer price inflation was 1.3 per cent. Consumer price inflation isforecast to rise to an average of 2.5 per cent for 1997 due to a number of temporary factors. Therate of consumer price inflation is, however, expected to decline to the levels of our tradingpartner countries by the end of the year.
− Wages are estimated to increase by 3.5 per cent this year, down from 4.25 per cent in 1996.
5
− Public finances as shown by traditional measures are strong. The surplus on the generalgovernment balance is estimated to increase from about 6 per cent of GDP in 1996 to almost 7 percent in 19971.
1.2 Main trends in overall and youth unemployment
1.2.1 Economic development and its effect on employment and qualification requirements foryoung people
The labour market in Norway is constantly changing with a considerable number of jobs being created andlost every year. We may divide the labour market into different sectors according to job characteristics(i.e. qualifications needed, type of industry etc.), and according to employee characteristics. The changesin the distribution of jobs may change the employment structure and the qualification requirements.
A study2 of Norwegian manufacturing and service industries during the period 1976-92, shows that theannual job creations and job losses were equivalent to about 7-9 per cent of the total number of jobs inNorway. The study indicates that in the long run the overall tendency is to create jobs which demand moreeducation and more skills, rather than jobs which do not. This has contributed to higher unemploymentamong persons with little education and few skills. One implication of this development was that youngpeople had more problems in getting into the labour market, because they had not finished highereducation and lacked work experience.
However, the business cycle may lead to different developments in the short run. The recruitment study3
from the Directorate of Labour and Centre of Economic Analysis (ECON) shows that the upswing in theprivate sector in 1995 is directed towards production related work. The labour demand is consequently formore practically oriented employees rather than for those with higher education. From 1993 to 1995 therelative proportion of jobs where secondary education was regarded as most productive, increased from 35to 44 per cent. On the other hand the number of jobs where higher education was regarded as mostproductive, decreased from 59 to 50 per cent. The development must be regarded as positive for youngpeople who wished to enter the labour market in this period. The figures also confirm this. The generaleconomic improvement in this period has caused a considerable decline in unemployment among youngpersons, especially in the age group 20-24 years.
1.2.2 Main trends in the labour market
The situation on the labour market improved considerably between 1993 and 1996. According to thenational account, employment rose in this period by 121 000 persons (6 per cent). On average 2 137 000persons, or 67.9 per cent of the working age population (age groups 16-74), were employed in 1996 (Seeannex I, table 1). Employment rose in most sectors. It increased, however, particularly in the fields offinancing, insurance, real estate and in business services. The primary sector continued its downwardtrend in employment.
1 OECD, Economic Surveys, Norway 19972 Salvanes, K. G. (1996),Job Creation and Job Destruction in Norway 1976-1992,Norwegian Ministries of Finance,Local Government and Labour, and Industry and Energy, Oslo.3 Larsen, K.A. (1996), Rekrutteringsundersøkelsen 1995. Søking og rekruttering til ledige stillinger,Arbeidsdirektoratet og ECON, Rapport 1996:2.
6
At the same time there has been a considerable expansion of the labour force. Total labour forceparticipation has risen sharply, primarily because of a far greater number of women entering the labourmarket. The labour force participation rate was 71.5 per cent in 1996 (age groups 16-74). This is thehighest participation rate ever recorded in Norway. Since 1993 participation rates have increased for mostgroups in the population (See annex I, table 1).
Unemployment, measured as a share of the labour force, was reduced by 1.5 percentage points from 1993to 1996. However, decline in unemployment is slower than what might be expected, due to the expansionof the labour force. The unemployment rate fell to 4.9 per cent in 1996 (See annex I, table 1).
Labour market improvements are also shown in the figure from the Directorate of Labour. The figureshows a decline in the number of persons registered as unemployed (See annex I, figure 1). The youthunemployment rate has shown a particularly sharp decline from 10 per cent in 1993 to 6.1 per cent in firsthalf of 1997. At the same time there was a reduction in the number of participants on active labour marketprogrammes.
1.2.3 Main trends in the labour market for young people
Young people without work experience, or without recognised education have, in a difficult labour marketsituation, more problems finding work than most other age groups. Annex I, table 2 shows the sameindicators on the labour market as annex I, table 1, except for the age group 16-24 years. As regardslabour force participation and employment these figures show almost the same development, but not asstrong, as for the older age groups. On the other hand, unemployment has fallen particularly for youngpeople. This can be seen more clearly in the figures on registered youth unemployment from theDirectorate of Labour than in the figures on youth unemployment from the Labour Force Surveys. In 199310 per cent of the labour force below 25 years of age were registered as unemployed as opposed to 6.4 percent in 1996. The relatively strong decline in youth unemployment since 1993 is due to the businessupswing, the fact that labour market schemes give priority to young people, the fact that youths weregiven a statutory right to upper secondary education, that a greater proportion of those aged 16-19 stayedon and completed upper secondary education, as well as a reduction in the number of persons in the agegroup 16-24.
When comparing tables 1 and 2 in annex I, it can be seen that the unemployment rate is higher for the agegroup 16-24 years than for age groups above that age. This can partly be ascribed to the fact that only 59.3per cent of the age group 16-24 years were in the labour force in 1996, while 81.9 per cent of the agegroup 25-66 years were in the labour force in the same year.
1.2.4 Measuring methods
In international comparisons, one normally uses unemployment figures from Labour Force Surveys. Thereare, however, several problems associated with national comparisons of youth unemployment. Differentcountries have different definitions, which influence the figures of youth unemployment. For example,young persons who seek work at the same time as they are undergoing training or education, are in somecountries not counted as unemployed.
In Norway, however, they are. Also, differences in educational and labour market policies influence thenumbers. (See chapter 3 for a more thorough description of unemployment among young people inNorway).
7
1.3 Demography, education and employment
From the school year of 1984/85 to 1993/94 the year cohorts of 16-year-olds were reduced fromapproximately 67 500 to 52 300. From 1994 until today, the number has been rather stable onapproximately 53 000, and the number is excepted to stay stable until 2001/02. After 2001/02 the numberis excepted to increase, with a peak in 2007/08 of more than 60 0004. Due to the small age cohorts whenReform 94 was introduced, the capacity in schools were sufficient to meet the obligation to provideplaces.
To estimate capacity needs in higher education, the number of 19-year-olds in any given year is ofprimary importance. The cohorts of 19-year-olds will stay at a level of between 50 000 and 55 000 until2006, when they will again - like in the early ’90s - reach levels of around 60 000. Another importantfactor concerns the level of unemployment. Overall unemployment went down from 1995 to 1996, whileat the same time the share of graduates among the unemployed increased, raising the question of theindividual expectations and aspirations in connection with participation in higher education. (See annexIII, table 1).
The number of youths below 25 years of age has declined since 1989 and is expected to continue todecline until year 2000. Since the cohorts being retired are small, an increase in the labour forceparticipation is expected. This demographic trend implies less competition for the jobs where employersprefer young people and increased competition for jobs where youths compete with adults.
1.4 Broad structure of the education and training system
1.4.1 Structure of the educational administration
The educational system of Norway is mainly public. Due to the fact that Norway has a state religion - theLutheran Church - a Christian and moral upbringing has been seen as fundamental to the aims of schooleducation. The Ministry of Education, Research and Church Affairs is responsible for administering theeducational system and implementing a national policy in this field. The 435 municipalities areresponsible for providing primary and lower secondary education. From August 1997, with «Reform 97»,all children will start at the age of six and Norway will have 10 years of compulsory school. Primaryschools are for pupils of grades 1 to 7, and lower secondary schools are for grades 8 to 10.
The county municipalities own and run upper secondary schools and are responsible for the intake ofpupils and the appointment of teachers. Most of the funds come from state grants and the schools are freeof charge.
Higher education is directly administered by the Ministry and is mostly state funded, as more than 90 percent of all students attend state institutions where tuition is free. In addition, several of the privateinstitutions receive most of their funding from the state. (See annex I, figure 2, annex I, appendix I andannex III, figure 1).
4 The numbers are given by Statistics Norway. The numbers are rounded.
8
1.4.2 The structure of upper secondary education
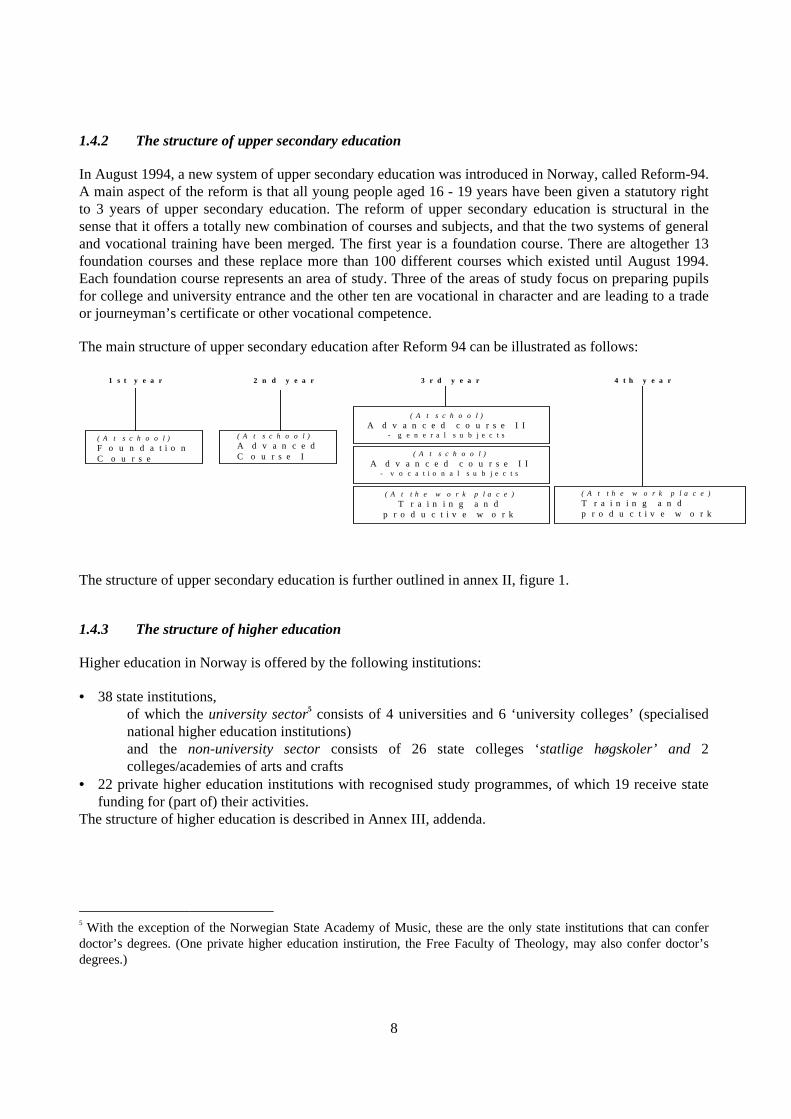
In August 1994, a new system of upper secondary education was introduced in Norway, called Reform-94.A main aspect of the reform is that all young people aged 16 - 19 years have been given a statutory rightto 3 years of upper secondary education. The reform of upper secondary education is structural in thesense that it offers a totally new combination of courses and subjects, and that the two systems of generaland vocational training have been merged. The first year is a foundation course. There are altogether 13foundation courses and these replace more than 100 different courses which existed until August 1994.Each foundation course represents an area of study. Three of the areas of study focus on preparing pupilsfor college and university entrance and the other ten are vocational in character and are leading to a tradeor journeyman’s certificate or other vocational competence.
The main structure of upper secondary education after Reform 94 can be illustrated as follows:
1 s t y e a r 2 n d y e a r 3 r d y e a r 4 t h y e a r
( A t s c h o o l )F o u n d a t i o nC o u r s e
( A t s c h o o l )A d v a n c e dC o u r s e I ( A t s c h o o l )
A d v a n c e d c o u r s e I I- v o c a t i o n a l s u b j e c t s
( A t s c h o o l )A d v a n c e d c o u r s e I I
- g e n e r a l s u b j e c t s
( A t t h e w o r k p l a c e )T r a i n i n g a n d
p r o d u c t i v e w o r k
( A t t h e w o r k p l a c e )
T r a i n i n g a n dp r o d u c t i v e w o r k
The structure of upper secondary education is further outlined in annex II, figure 1.
1.4.3 The structure of higher education
Higher education in Norway is offered by the following institutions:
• 38 state institutions,of which theuniversity sector5 consists of 4 universities and 6 ‘university colleges’ (specialisednational higher education institutions)and the non-university sectorconsists of 26 state colleges ‘statlige høgskoler’ and2colleges/academies of arts and crafts
• 22 private higher education institutions with recognised study programmes, of which 19 receive statefunding for (part of) their activities.
The structure of higher education is described in Annex III, addenda.
5 With the exception of the Norwegian State Academy of Music, these are the only state institutions that can conferdoctor’s degrees. (One private higher education instirution, the Free Faculty of Theology, may also confer doctor’sdegrees.)
9
1.4.4 The administration of the Public Employment Service (PES)6
The PES in Norway is the responsibility of the central rather than the regional and local governments. ThePES has an agency status under the supervision of the Ministry of Local Government and Labour whichsets broad policy objectives. The agency consists of 18 county employment offices, 167 districtemployment offices with 56 sub-offices, 18 employment counselling offices, the Centre for occupationalRehabilitation (Oslo), 18 working life advisory service centres, the PES’s Service centre and the PES’sUnemployment Benefit Control Office (per 1996). (See annex 1, figure 3).
The Directorate of Labour works to accomplish the objectives laid down in the legislation and policiesrelated to the agency’s activities. The Directorate shall monitor developments on the labour market andprovide information and advice to the ministry. It is also responsible for implementing labour marketpolicy by proposing, planning, developing and implementing the required measures.
County Employment Offices administrate the activities of the PES at the county level. These offices areresponsible for monitoring developments on the labour market and registering the needs of job-seekersand employers for services. The main functions of the offices are to provide guidance, and plan assistancefor and control the District Employment Offices. They also plan, develop and co-ordinate measures toreduce imbalances on the labour market.
District Employment Offices provide services to job-seekers and employers. The offices provideinformation about vacant positions, counselling with regard to occupations and education, and offer andimplement relevant measures, such as courses providing qualification and training. The offices organiserehabilitation measures and in-house rehabilitation. The offices visit businesses in their district andprocure manpower for employers. The offices administrate the unemployment benefit scheme andrehabilitation benefits.
6 The Public Employment Service (PES) is also named the Labour Market Administration (LMA).
10
CHAPTER 2: CLARIFICATION OF PERCEPTIONS
2.1 Transition from initial education to working life
The concept of transition from initial education to working life has in itself not been in focus in Norway.The government is however, very concerned about young people being able to get a place in secondary orin higher education or a job. The educational system in Norway places a natural focus on the transitionconcept for age groups when:
- completing compulsory school (at the age of 16)
- completing two years of vocational education in upper secondary school with anapprenticeship contract
- completing upper secondary education at the age of 19 with a school certificate
- completing upper secondary education with a trade or journeyman's certificate
- completing higher education with a lower or higher degree from college or university
The educational level of the population has risen considerably the last decade. In 1995, some 53 per centof the population had completed upper secondary education and training while 27 per cent had completeda college or university education. It is expected that the level of education will continue to increase. Thiswill obviously affect the transition period.
When discussing the transition concept, it is of essential importance to take into account the flow of pupilsand students through upper secondary education and higher education. An effective through-flow willreduce the period of time for transition to working life.
In our context, the term "working life" means: the period when the principle activity is work. Many youngpeople combine education with work. (See annex I, tables 1, 2 and 3). In our definition this is not«working life». We have no evidence of what effect combination of education and work will have on thetransition to working life. It may cause a delay in transition, but it may also make it easier to get anordinary job as they already have some work experience.
2.1.1 Transition from lower secondary education
There has been a continuous increase in the transition of 16-year-olds from lower to upper secondaryeducation. In 1980, the rate was 72.1 per cent, in 1990, it was 89.6 per cent and in 1994, the rate was 94.1per cent. (See annex II, appendix II , tables 1 and 2 and annex II, appendix III, table 1). In 1994, only 5.9per cent of the 16-year-olds were not attending upper secondary education. In 1993 and 1994, theemployment rate of 16-year-olds in full time work was around 1 percent. In addition, some of them were
11
employed by means of government measures. (See annex 1, appendix II, table 1). Generally, the chancesare small for those entering the labour market having compulsory school as their highest level ofeducation.
2.1.2 Transitions from upper secondary education
Pupils aiming at a trade or journeyman's certificate after the second year of upper secondary education,should normally get an apprenticeship contract. As the third and fourth year of vocational education arecombined with productive work, the apprentices are employed with an enterprise. According to ourdefinition, this is not transition to working life. Transition to ordinary work takes place when they arequalified as skilled workers. Approximately 20 per cent of the youth cohort apply for an apprenticeshipplace. As described in chapter 3 and 5, not all of them obtain a contract.
Those who complete upper secondary education after 3 years and receive a school certificate, may eitherhave a general education or a vocational education. Both groups may enter the labour market.
In 1993 and 1994, approximately 17 per cent of the 19-year-olds were employed. (See annex I, appendixII, table 1).
Those with a general education may also apply for higher education. In the 1990s, there has been atendency for more direct transitions from upper secondary to higher education: in 1992, 27 per cent of allNorwegian 19-year-olds applied for admission to tertiary education; in 1995, this percentage hadincreased to 31, and in 1996 to 35. (See annex III, table 1). Due to the fact that many young peoplepostpone enrolment in higher education, the percentage of each cohort entering higher education isestimated to be about 40.
Those who complete upper secondary education with a trade or journeyman's certificate, have theopportunity to enter the labour market as skilled workers. As there seems to be a lack of skilled workers atthe time being, it is assumed that the transition period for this group will be short.
2.1.3 Transition from higher education to working life
The last transition from initial education to working life takes place after finishing higher education with alower or higher degree. (See section 5.3).
2.1.4 Summing up
The transition from education to working life may occur at all levels from the age of 16. From the age of19 years up to 29 years the employment rate of the year cohort increases from approximately 17 per centto approximately 65 per cent. (See annex I, appendix II, table 1).
12
CHAPTER 3: POLICY CHANGES AND CONCERNS ABOUT TRANSITION PROCESSESAND OUTCOMES
3.1 Upper secondary education
The previous major reform in upper secondary education occurred in 1976. Until then, there was a varietyof schools offering different types of education and training. This was replaced by a single system whichprovided both an academic education and a vocational education, often in the same school building.General education and vocational education at school were put under one law and under «the same roof».
Vocational training at the workplace was reorganised in 1980. Considerable developments have takenplace in our society since then, and there was a need for a new reform. One of the main objectives of thenew reform was to make transition from school to work smoother.
3.1.1 Problems before Reform 947
A substantial proportion of young people was leaving school without work qualifications or furthereducation opportunities. They were basically trained for unemployment. Young people had lessopportunities to receive the place in the upper secondary education of their priority than adults.
The status of vocational courses was declining relative to courses preparing for higher education. Manywith vocational education who wanted to go on to college or university had to start again at square one.There were too few apprenticeships available and the links between vocational training in school andindustry were too weak.
Too many made the wrong choices from having to specialise too early; there were over 100 differentfoundation courses, or ports of entry, and not enough advanced courses to make the pupils attain avocational qualification.
The structure gave too little help for disadvantaged youths, and the drop-outs were not properly followedup.
There were geographical and social inequalities and the educational content and methods were notproperly adapted to the needs of the future.
The problems that we had and the solutions we chose were presented to the the Storting (NationalAssembly) in a white paper in 19928. This white paper formed the basis of the so-called Reform 94.
7 The problems described are not to be considered as unique for Norway.8 St.meld. nr. 33 1991-92 «Kunnskap og kyndighet - om visse sider ved videregående opplæring».
13
3.1.2 Solutions
The central principles and goals for national policy concerning education and vocational training inReform 94 are:
− Education is a public responsibility and it is supplied free of charge. The costs are met by thepublic budgets.
− Every young person completing compulsory education is entitled by law to three years ofupper secondary education leading to either university entrance qualifications, vocationalcompetence or partial competence.
− The supply of education and training shall be of high quality and broad enough to allow for arange of choices independently of geographical and social conditions.
Education and vocational training are also an important means to achieve goals in other policy areas suchas economic policy, regional policy and employment/labour market policy.
The goals shall be reached by means of :
• Sufficient number of places.• A changed educational structure to facilitate progress from one stage to the next.• Broader education, especially at foundation course level. Fewer ports of entry.• A broad concept of knowledge is introduced. Factual knowledge, manual skills, ethical values,
communicative skills and creativity are all given weight.• Improved co-ordination between the schools, private enterprises and the public sector.• All curricula are redesigned to meet future challenges in society and the labour market.• Easier recruitment to higher education from vocational education and training.• Establishing a follow-up service for young people who have the right to education, but are neither
undergoing education nor employed.• Access to recognised partial qualifications. Better educational opportunities are provided for adults
through modularised curricula, and regional authorities are responsible for offering courses adapted tothe needs of adults.
Reform 94 may be described as a reform of rights, a structural reform and a reform of content.
3.1.3 The statutory rights and obligations under the reform
The statutory right includes three years of full-time upper secondary education. The right has to be takenout within a four-year-period, which means that young people’s transition from education to working lifemay be suspended one year.
The statutory right to upper secondary education gives all pupils the right to be admitted to one of threefoundation courses chosen by themselves. Those who, with the support of expert opinion, have the right toa special, adapted education, are entitled to be admitted to their first-choice foundation course, and may begiven the right to an extended education up to five years.
The 19 county municipalities have an obligation to provide upper secondary education for all pupilsbetween 16 and 19 years of age.
14
They must also provide an additional number of places for other groups, among those adults, equal to 375per cent of the number of pupils between 16-19 (i.e. 3 year cohorts).
The county municipalities are also responsible for placing the apprentices with an appropriate enterprise,and this is carried out by the county vocational training committee. The committee is expected to maintainclose relations with the enterprises and to co-operate with them in matching the apprentice with theenterprise. However, the enterprises may decide whether they want to take on apprentices or not, and theyare free to choose among the applicants. (For further details see annex I, appendix 1).
Each county municipality has a statutory duty to establish a follow-up service. The follow-up service shallcontribute to ensuring that young people who have not applied for or accepted a school or training place,who have chosen to terminate their education or training without completing it, or who are not employed,get the opportunity to obtain an education that might lead to a recognised qualification. These youngpeople are offered educational and vocational guidance and, if necessary, a place in upper secondaryeducation, a trainee place or a combination of upper secondary education and a trainee place.
3.1.4 The structural reform
The main structure of the courses in the reform is illustrated in chapter 1 and annex II, figure 1). Theeducational structure shall provide pupils with either university entrance qualifications, vocationalcompetence or documented partial competence.
As a general rule, admission to advanced course I within an area of study is based on attending andpassing the relevant foundation course. Specialisation within the various subject areas takes place at thelevel of advanced courses I and II. In subjects covered by the Act concerning Vocational Training, finalspecialisation takes place primarily in business and industry.
Pupils and apprentices who wish to obtain university entrance qualifications in addition to their trade orjourneyman’s certificate, may take specially designed supplementary courses in general subjects after thecompletion of their vocational training. (See annex II, figure 2).
General education may be obtained through three years of education within three areas of study.
Vocational education
The main model of vocational education consists of two years at school + two years of apprenticeship, theso-called «2 + model». During the two years with the enterprise the apprentice will have one year oftraining and take part in the productive work for one year. In practice the training and the productivework are mixed throughout the two years. The apprentice is engaged by the enterprise from the first dayand is paid an equivalent to one year’s salary over two years. The salary is stipulated in the wageagreement of the trade and is about half the amount of what skilled workers get.
Training establishments that provide training for apprentices receive government grants. To encourage theenterprises to take on apprentices, the government grants have under the terms of Reform 94, beensubstantially increased. Additional grants will be given to enterprises which increase the number ofapprenticeships and to enterprises which take on apprentices for the first time. Furthermore, enterprisesthat take on disabled apprentices get additional grants.
15
When the training period is completed, the enterprise has no further obligations when it comes to furtherengagement of the apprentice, as the tradition was earlier.
According to the Act concerning Vocational Training pupils who are not able to obtain an apprenticeshipcontract, shall be offered a place in an advanced course II at school to complete their training. This groupdoes not receive additional training in an enterprise. They take the same trade or journeyman’sexaminations as those who follow he «2 + model». A much debated question is whether 3 years ofeducation and training at school gives an education of lower quality than education within the «2 +model».
For some trades there are deviations from the main model.
To meet the needs of young people who have difficulties following the «2+model», certain amendmentshave been added to the Act concerning Vocational Training. An exception from the «2+ model» can bemade for certain categories of pupils who need to follow specific arrangements, because of low motivationfor schooling or because they have problems following subjects with a large amount of theory related tothe trade. These pupils may enter into an apprenticeship contract providing the complete training in theenterprise.
Special courses for admission to higher education
A general matriculation standard has been introduced with Reform 94, satisfying formal admissionrequirements to higher education. (See section 3.2.1). General education is an integral part of vocationaltraining, with common subject syllabuses. (See annex II, figure 2). Those who choose vocational areas ofstudy, may obtain entrance qualifications for higher education by:
1 Taking one year in an advanced course II with general subjects after completing two years ofvocational education.
2 Taking half a year with general subjects after completing vocational education with a trade orjourneyman’s certificate.
Partial competence qualifications
Before Reform 94 many pupils did not meet the requirements to get a certificate. They left uppersecondary education without documentation of the actual competence they had attained.
In connection with Reform 94 the pupils therefore were granted a statutory right to attain a documentedpartial competence. This means that pupils may aim at completing only parts of upper secondaryeducation, and get the achieved competence documented at the end of the education. Based on thisdocumentation, the pupils later on may continue their education with the objective of obtaining fulluniversity entrance qualifications or vocational competence. By studying and passing examinations in theareas of the education they have not previously completed, the pupils may then get their certificate.
The Ministry of Education, Research and Church Affairs is elaborating the possibility of changing thelegislation in order to make it possible to achieve documented partial competence both through educationobtained at schools and training obtained in an enterprise.
16
3.1.5 The reform of content
The general process of change in society and the recent reforms in the educational system revealed theneed for a policy document defining aims, principles and basic values that all education should be basedon. A Core Curriculum (1993) was therefore developed for primary, secondary and adult education,including vocational education, in which humanistic, creative and social aspects of education andknowledge are emphasised.
The national curriculum in Norway refers to the written documents given formal status by the Ministry asbasic steering documents for the organisation, implementation and assessment at all levels of uppersecondary education. The curricula cover both training at school and in a training establishment. As aresult of the new curricula, vocational training is based on a common platform with greater elements oftheoretical and general subject areas.
The curriculum of upper secondary education consists of:
a) a core curriculumb) subject syllabuses or curricula which state the attainment targets and focal points of all subjects or
courses within the different areas of study
A wide concept of knowledge and competence is introduced in the Core Curriculum and the human beingand human values are focused. Greater emphasis is now put on developing certain "personal qualities"such as social abilities, communicative skills, creativity and study skills, problem finding and problemsolving. Ethical and moral values and attitudes are also emphasised. The Core curriculum describes itseducational objectives in terms of seven types of human beings and the seven types add up to “theintegrated human being”. (See annex, table 1).
The Core curriculum gives guidelines for the development of subject syllabuses. The greatest challenge inproducing the new subject syllabuses has been to integrate the core skills into the different syllabuses foreach subject or course. The core skills have to be taught and learned in relation to other skills orknowledge, i.e. put into context.
The development of the subject syllabuses is based on the following principles:
• Management by objectives• The link between the core curriculum and the subject syllabuses is to be apparent.• A wide concept of knowledge• The subject syllabuses are applicable regardless of which groups receive the training.• General education is an integral part of vocational training.• The syllabuses are divided into modules.
The syllabuses are modularised to meet the needs different groups have for linking parts of their educationtogether in order to gain recognised qualifications.
This is especially important for adults and for those who aim at partial competence. The modularisedsyllabuses will also meet the needs of labour market training.
17
3.1.6 Capacity and number of pupils
During the current school year, there are over 178 000 pupils at upper secondary level, includingvocational training. About half of the pupils are attending general courses and the other half are attendingvocational courses. The number of pupils has decreased since 1992 (see annex II, appendix II, table 2),despite of the fact that young people were given a statutory right to receive a school place. This is mainlydue to the small youth cohorts, but also to the fact that many of the county municipalities have not beenable to maintain a capacity of 375 per cent of the 3 youth cohorts. The reason for this, they assert, is lackof applications from adults. (See annex II, appendix II, table 3).
The number of apprenticeship contracts has increased from about 19 000 in 1993 to 28 000 in 1996. (Seeannex II, table 4).
3.1.7 Concerns about special aspects of Reform 94
There are three aspects of the reform that raise special concern when it comes to transition.
The first concern is the structure. The 13 foundation courses lead to more than 100 advanced courses I,while the intention was to keep the number down to 50. The high number of advanced courses I isestablished through strong pressure from the advisory bodies and different trades and is due to need for ahigher degree of specialisation at this level. This may cause a mismatch problem when it comes tomatching the pupils’ specialisation from advanced course I with the needs of the enterprises.
The second concern is the capacity of the enterprises to supply enough apprenticeship places for theapplicants. Even if the enterprises should be able to supply enough places, it is not certain that thevocation in which the pupil is offered an apprenticeship place, matches the pupil’s competence.
The third concern is connected to the pupils who do not have a statutory right to three years of education.As they will be last in the queue to receive a place they prioritise, they will either leave school or changetheir mind about educational pathway, thus their transition within the educational system will be delayed.
3.1.8 Other educational institutions and aspects
To complete the picture of education at upper secondary level, the following must be mentioned:
Technical schools (See annex II, table 7).
Skilled workers can build further on their trade or journeyman’s certificate by attending a technicalschool. The technical schools are public schools owned and managed by the counties. The main purposeof the technical schools is to provide education for persons having a relevant trade or journeyman’scertificate and a minimum of two years’ background in a specific trade covered by the Act concerningVocational Training.
Successful completion of studies at a technical school confers the status of technician. Having completedtechnical school, the technician can be admitted to higher education institutions in areas which offerfurther specialisation in the same field, for example in engineering. The position of the technical schoolsis currently under review. New admission requirements and curricula will come into force in autumn1999.
18
Resource centres in upper secondary schools:
One out of every two upper secondary schools participate actively in some kind of resource centre activityin addition to their regular education and training activities. The centres promote, market and providetraining measures to private and public institutions on a commercial basis. Often, the centres are organisedas separate departments within upper secondary schools, but they can also be organised as foundations oras individual limited companies.
The main tasks of these centres is to stimulate the co-operation between upper secondary schools and thelocal labour market and industry to contribute to the enhancement of competence both in working life andin schools. The centres also contribute in the task of finding new areas and forms of co-operation -between schools, institutions, public and private enterprises responsible for general education, vocationaltraining and adult education and the local industry - that will lead to more adapted educational andtraining opportunities for young people and adults and create more jobs in the local community. Examplesof such training tasks are courses in foreign languages for enterprises, the certification of welders for theoil industry, computer training and the placement of teachers in enterprises. Their efforts are designed tocontribute to better use of the schools’ professional and pedagogical resources and to strengthen theschools’ knowledge of industry. Many of the centres have tasks from the employment authorities as theirmain activity.
Folk high schools
In 1997, there are 79 folk high schools in Norway with a combined capacity of 7 000 pupils. Most of theseschools are boarding schools owned and run by religious organisations and other independent foundations.They provide general education courses and a variety of other courses for young people and adults. Thecourses do not result in formal qualifications, however from the school year 1997/98, pupils receive 3competition points upon applying for higher education. This measure has encouraged young people toapply folk high schools.
Most of the pupils who apply to these schools, do so because they wish to have a year in which to plan andthink ahead, either during or after completing upper secondary education. (See annex II, figure 3).
The military as a training institution for working life:
Norway has a compulsory military service for men ranging from 12 months for the Army to 15 months forthe Navy and Air Force. 67 per cent of each age cohort complete military service. Instead of militaryservice one may take 15 months’ community service work. Upon completion of military service thesoldiers get one competition point for admission to higher education. Women may also serve in the armedforces on a voluntary basis.
The transition period is affected by the military service.
Since 1995, the military has been a significant vocational training institution offering about 50 vocationalcourses e.g. cookery, auto repair, automation mechanics, service electronics and avionics. Per 1997, thereare about 600 apprentices who have signed an apprenticeship contract with the armed forces. Next yearthe number of apprentices is expected to increase further by 100 for the Army alone. Most apprentices are18 years old. The armed forces also run higher education institutions for the training of officers and othermilitary staff.
19
Adult study associations
Approximately one quarter of the adult population participates every year in organised education andtraining. This mainly consists of in-service training in enterprises or courses arranged by studyassociations. The latter accounts for around 40 per cent of the total number of participants. In addition,comprehensive, informal training takes place at the workplace – an activity which is considered importantin the development of the individual employee’s own skills. The study associations are a joint body forvoluntary, humanitarian, political and other non-government organisations. Examples are the FolkUniversity (Folkeuniversitet) and the Workers Educational Association in Norway (AOF). (See annex II,appendix II, table 3).
• 770 000 adults participate annually in various courses arranged by the adult study associations• 14 000 participate in courses at upper secondary level• 33 000 adults participate in courses at college or university level
External examinations
Section 20 of the Act concerning Vocational Training allows adults who wish to obtain a trade certificateto obtain formal recognition of professional knowledge and skills acquired over time in the context of ajob. The section 20 measure is not a training measure but a documentation measure. Candidates do notneed to go through a formal education and training process, but must have relevant professionalexperience that has lasted at least 25 per cent longer than the apprenticeship period for the trade, that is tosay, normally 5 years. They must take the same practical trade examination as the one taken by theapprentices and in addition pass an examination in the theory of the trade. The number of trade andjourneyman’s certificates obtained for section 20 candidates account for about 40 per cent of all theobtained trade or journeyman’s certificates each year. (See annex II, table 3).
It is also possible to take external examinations in all subjects in upper secondary education. This givesadults the opportunity to document their competence without having to attend a course. However, a widerange of courses are offered by private institutions for adults who want to have some schooling beforethey take the external examination. The majority of those who take external examinations do so becausethey have failed certain courses at school or because they want to improve their marks, and thereby theircompetition points for admission to higher education.
For higher education, there is a similar provision (Act no. 22 of 12 May 1995 on Universities andColleges, Article 40 no. 1) which regulates the rights for all citizens, whether registered students or not, tohave their qualifications and knowledge assessed: "Whoever satisfies the general, and, as the case may be,special admission requirements, as well as other requirements for taking the examination in a givendiscipline or course of study, is entitled to take the examination. This also applies to students who havenot been admitted to the discipline or course of study”.
In the autumn of 1995, there were 5 186 individuals who presented themselves for examinations withoutbeing admitted as students, mostly at the universities, and in 1996, the number was reduced to 4 445.
Vocational and educational guidance
The Ministry of Education, Research and Church Affairs and the Storting have in connection with theeducational reforms underlined the importance of a good vocational and educational guidance, both inprimary and lower secondary education and in upper secondary education.
20
Most primary schools have programmes for introducing pupils to working life for example by invitingrepresentatives from local industry or the community to the schools or by taking the pupils to visit localindustries and community services. This is often the young pupils’ first introduction to working life.
Guidance and information about the world of work form part of the curriculum, providing one weektraining placement during the 8th grade. Each institution has a counsellor, who provides information andindividual advice regarding upper secondary education and employment possibilities. In addition, manyschools at the lower secondary level (stage 8-10) have placement programmes called PRYO for placingpupils for a period of up to two weeks in work-places.
A book is distributed free of charge to all pupils in the 10th grade with information on all the study-programmes from which they can choose in upper secondary education and with short summaries of thecontent of these study-programmes (Pedlex).
Regional plans of action have been developed and put into use at lower and upper secondary schools inorder to develop competence within the field of vocational and educational guidance. The purpose of theseplans of action has been to create coherence between the young people’s choice of education and theavailability of apprenticeships and jobs. Among the results so far, we see better co-ordination and moreeffective co-operation between the different bodies that are responsible for providing vocational guidance.
Pupil enterprises
The ability to innovate and to adapt are qualifications which are in great demand in the public as well as inthe private sector. A central feature of the industrial development in Norway is that small firms constitutean important part of all new establishments. Human resources are in other words important. Schools andeducation can also contribute by placing emphasis on employer creativity rather than on being employed.
Pupil enterprises is an important means of developing positive attitudes towards the use of knowledge inan overall and creative way. Through the planning, establishment and running of the enterprise, the pupilsare given challenging and demanding tasks which stimulate fantasy and sense of initiative and venture9.
There are two models/projects in Norway for the organisation of pupil enterprises:
1) Community active schools (Distriktsaktiv skole)2) Young Enterprise
The project “Community active schools” has its roots in Norway and has a great impact, especially at thelower secondary level. Young Enterprise is linked to an international organisation, Young EnterpriseEurope, and is aimed especially towards the upper secondary level.
3.2 Higher education
In developing the Norwegian system of higher education, a main concern has been to design a systemwhich is comprehensive and diverse, meaning that our approach has been, and is, coloured by concerns forequality, for social and geographical considerations, and for overall measures. An important aim has been
9 The social science syllabus which is compulsory for all pupils in upper secondary education gives a basicintroduction on which steps to take in working towards establishing an enterprise.
21
to design a system with a great variety of supply both in terms of type and length of study programmes,with no dead ends, thus facilitating mobility between institutions and types of study for the individualstudent.
The considerable expansion of higher education in the 1960s and 1970s, the policy of upgradinginstitutions and the establishment of new kinds of colleges, with new types of study programmes in newsubjects areas as well as multi-disciplinary programmes, resulted in a vast number of higher educationinstitutions. At the most there were 144 state plus 20-odd private ones, of which only 17 (including the 4universities) had more than 1 000 students each.
Towards the end of the 1980s, it was therefore decided to review various aspects of higher education. Thepresent policy in higher education may be referred back to a 1988 Royal Commission Report (greenpaper) on higher education and an ensuing 1991 white paper, suggesting that higher education institutionsbe reorganised and merged. In addition the term ‘Network Norway’ was coined, to denote a nationalhigher education and research network based on the principles of specialisation, co-operation andcommunication.
A governing principle of the network is that new study programmes should be considered in relation to anoverall national plan.
Until the early nineties, the non-university higher education institutions were subject to quite detailed stateregulations. In order for more discretionary power of decision-making to be delegated to these institutions,it was considered necessary to obtain larger and more comprehensive institutions through reorganisationand merging processes. Consequently, on 1 August 1994, 98 former regional and vocational colleges werereorganised and merged to form 26 larger state colleges, and on 1 August 1996, seven colleges andacademies of arts, crafts and design were merged into two new institutions, one in Oslo and one in Bergen.In addition, a few minor mergers have taken place.
A new law for all state higher education institutions, Act no. 22 of 12 May 1995 on Universities andColleges, became applicable as of 1 January 1996. This law gives the institutions of higher education aconsiderable degree of academic and administrative autonomy, while leaving decisions on overallorganisation to the Ministry. The Act also formally established and secured 'Network Norway'.
The policy of encouraging equal opportunities in the access to higher education, irrespective of social,economic and/or geographical background is reflected in the legislation concerning loans and grants tostudents. The State Educational Loan Fund was established in 1947 to give financial assistance tostudents, and thereby facilitate the access to higher education for young people from all walks of life.Loans and grants are awarded following Regulations that are valid for the academic year in question, since1985-86 in accordance with Act no. 21 of 26 April 1985 on financial support to pupils and students, withsubsequent amendments.
The organisation of student welfare (i.e. student housing, canteens, kindergartens, medical services, sportsfacilities and the like) is also of great importance for the recruitment to higher education, and the latestlegislation in this field is Act of 28 June 1996 no. 54. Although tuition at public higher educationinstitutions in Norway is free, the institutions may ask a small fee for the running of student welfareactivities.
22
3.2.1 Admission to Higher Education
a) Admission requirements
For access to higher education, a general matriculation standard has been introduced, setting minimumrequirements which include the following components:
• Successful completion of three years of upper secondary education including foundation course,advanced course I and advanced course II (regardless of area of study), or a recognised vocationalqualification/trade certificate.
• 6 core subjects, which either are included in, or come in addition to, the above-mentioned criteria.These are general subjects from upper secondary school, and the required level of attainment isdetermined in periods (or lessons) per week: Norwegian (14); English (5); History - post 1850 (4) andSocial Studies (2); Mathematics (5); Natural Science (5). (See annex II, figure 2).
Applicants can be admitted to higher education without having passed the normal upper secondary finalexamination. Such students must, however, fulfil the specific minimum subject requirements mentionedabove, be 23 years old or more, and have at least five years of work experience, or of a combination ofwork experience, education and training.
For some studies, like for instance medicine, engineering and translation, applicants also need additionalqualifications from upper secondary school - in mathematics and natural sciences for the former, and inlanguages for the latter.
b) Admission capacity
Admission to many areas of study in higher education is competitive, since demand exceeds the numberof places available. Provisions regarding «Numerus Clausus» for specific study programmes or facultiesare open to revision on a yearly basis, and are decided by the Storting (national assembly) for theuniversities, and by the Government for the colleges.
However, it is seen as an objective by Government and Storting alike, that the universities and collegesteaching subjects for the lower degree in the humanities, in natural sciences and in social sciences, shouldbe open to all qualified applicants on a national basis in these subjects.
This system is called‘national access’and was introduced with effect from the academic year 1995/96.From then on, all qualified applicants would be accepted at the kind of faculty they applied to, but notnecessarily at the university of their first choice, in order both to ensure access for all, and to avoid toomuch pressure on the most popular institutions. Since last year (1996/97), the system also applies to thestate colleges teaching such subjects.
The main political aims of the 1990s concerning the admission capacity to tertiary education are definedin Proposition to theStorting (national assembly) no. 67 (1995/96) of 10 May 1996 on the admission tothe universities in the academic year 1996/97, as follows:
• to admit the largest possible number of qualified applicants (i.e. applicants that satisfy the minimumadmission requirements), in accordance with individual wishes and the country's need for a highlyeducated work force, and
23
• to ensure the quality of study programmes and learning environments, and• to enable a larger proportion of students to complete their studies within the prescribed time limits.
As will have appeared, it is of no primary concern to match the number of graduates with the needs of thelabour market directly, although consideration is made to this aspect as well, particularly for some of theprofessional study programmes.
In fields like education, health and social services, the employment market is very much a result ofpolitical decisions. Hence, due to the ongoing reforms of the school system and to insufficient recruitmentto the health and social services sector, the priorities in 1995 and 1996 were given to increasing thecapacity of provision in pre-school and general teacher education, as well as in medicine and studyprogrammes for paramedical professions, like for instance nursing. It is extremely difficult to foreseeexactly the pace of changes in demand for the various professional groups, and thus to match supply anddemand, so our planning has not been entirely successful.
c) Entrance delay - «backwater»
Many Norwegian students do not go to universities or colleges directly after leaving upper secondaryschool. As a consequence, the Norwegian student population is relatively old: in 1996, 25.2 per cent of theapplicants to higher education were over 24 years old, whereas the percentage for 1995 was 27. (Seeannex III, figure 2). There are several explanations to this: partly it derives from personal preferences likethe wish to gain working experience.
The admission requirements for higher education studies practising "numerus clausus" have alsocontributed. A few years ago, the most popular studies, like medicine and physiotherapy, demanded somany points, that school leavers could hardly compete. The admission requirements are defined by pointswith a heavy weight on good marks from upper secondary school. In addition, pupils can achieve pointsfor choosing special subjects in upper secondary education. Points can also be obtained for severalactivities like higher education exams, military service, working experience or simply for age countingfrom 19 to 23 years. This serves as a means to counterbalance mere school marks, but to some extent alsocauses a backwater effect. It should also be noted that applicants have the opportunity to improve examsin each subject from upper secondary school. This opportunity gives them a second chance, but it has aninflationary effect on the admission requirements.
In recent years, these two effects have been counteracted in college education by a quota reserved forapplicants between the ages of 19 and 21, and as for medicine and veterinary medicine by a quota forapplicants with original school diplomas, i.e. with no improved exams.
In June 1997, the Storting approved a white paper on the ranking of applicants. It was decided that fromthe year 2000, a quota of 30 - 40 per cent will be introduced for all studies based on original schooldiplomas and with no points for other activities. Furthermore, there will be no opportunity to improveexams on lower levels when having taken a superior course in upper secondary school. The intention is toreduce backwater effects, but still retain the opportunity to improve exams and to gain additional pointsafter leaving upper secondary school for the majority of the applicants.
24
3.2.2 Number of students
Today, there is an estimated total of 173 000 students in higher education, which corresponds to anincrease in total student population of 70 per cent over the past 7 years. (See annex III, tables 1-7)
There are:
81 600 in the university sector (74 400 at the universities and 7 200 at the university colleges)
68 800 in the non-university sector
13 600 in private institutions.
9 000 abroad
Norway’s present overall capacity in tertiary education corresponds to that which is necessary for roughly50 per cent of each year cohort for 6 years, and the policy at the moment is that of moving towards aconsolidation at approximately the present level, so that increases in admission to some study programmesat least to a certain extent should be compensated by reductions in others. In our view, we have developeda sufficient overall capacity in tertiary education, although adjustments of course will be necessary toregulate the prevailing mismatch between demand and provision for a number of vocational programmes.
After reaching a (preliminary?) peak in the number of applicants to tertiary education in 1994, of 109 054(of which 97 116 qualified), there was a tendency towards a stabilisation at a somewhat lower level, of101 255 applicants (83 884 qualified) in 1995, and 101 288 (82 294 qualified) in 1996. In 1997, thenumber of applicants to higher education dropped significantly, to 90 002 (72 445 qualified)10. At the sametime, total capacity has increased, thus reducing the number of qualified applicants without any offer ofadmission from 25 514 (1994) to 14 841 (1995), 12,433 (1996) and 6 450 (1997) in the same period.
3.2.3 Through-flow of students in higher education
It is a recognised problem for the overall productivity of the system of higher education that a lot of thestudents, particularly at the “open” studies at the universities (the humanities, social sciences, naturalsciences and law), spend more than the prescribed time before completion of their studies. This is partlydue to students taking up paid work in addition to their studies, but it could also be due to organisationalfeatures at the universities or the size of the student population.
The Ministry of Education, Research and Church Affairs lacks in-depth and systematic knowledgeconcerning this phenomenon, and has therefore asked the Norwegian Institute for studies in Research andHigher Education (NIFU) to observe the situation through a special programme on recruitment and theprogression of students through higher education compared to prescribed study periods (“through-flow”).In a report on growth and production of graduates in higher education, NIFU11 found that students overallprogressed 4 per cent more slowly in the period between 1 October 1992 and 1 October 1993 (92/93hereafter) than in the period 1 October 1987 to 1 October 1988 (87/88 hereafter). Moreover, students thatgraduated with a higher or professional degree in 92/93, had spent somewhat more time before completionof their studies than their counterparts graduating in 87/88. In 87/88, the 3 943 graduates that following
10 Preliminary numbers by 10 August 1997.11 Tore Neset: Utdanningsvekst og kandidatproduksjon, NIFU, U-notat 4/96.
25
prescribed study periods should have completed in an average of 5.41 years, did so in 6.59 years, whereasthe 5 600 graduates that should have completed within an average of 5.35 years in 92/93, only did so in6.66 years. If the 92/93 graduates had followed the same rate of progression as their 87/88 counterpart,they would have finished in 6.52 years on average and saved 775 student years or 120 student places peryear. According to the report, parts of this difference might be attributed to problems related to theexpansion in the number of students in higher education, which really started “taking off” at the end of the1980s. (The number of students increased by 63 per cent in the university sector and by 49 per cent in thenon-university sector in the period 1988 to 1993.)
A table indicating variations in the relationship between prescribed and real study periods required isenclosed in Annex III, table 8.
In order to encourage better “productivity”, some result oriented allocations have been introduced in thestate funding of the higher education institutions. Since 1995, the universities thus compete for theirrespective share of a reserved lump sum - 150 million NOK in 1995, 200 million NOK in 1996, and 250million NOK in 1997 - allocated on the basis of the average (study unit) credits obtained by the students ateach of the universities. The intention is to provide a stimulus for the institutions to encourage more oftheir students to complete their studies within the prescribed time limits. Special funds are also allocatedto the universities on the basis of the number of students having obtained higher university degrees (i.e.completed study programmes of between 5 and 7 years' duration), as well as of the number of obtaineddoctor's degrees. In 1997, the universities receive NOK 10 000 per graduate in a higher degree, as well asNOK 20 000 for each male, and NOK 30 000 for each female graduating with a doctor’s degree.
3.2.4 The OECD report on the first years of tertiary education
The team reviewing the first years of tertiary education (April, 1997), visited Norway in October 1995.
The review team assessing Norway in the ten country thematic review made several remarks andrecommendations. At the level of the individual course, programme or institution much satisfaction isexpressed. Standards of provision are generally high, the regional institutions often have a closerelationship with the community and employers, teachers and students interact often in small groups.
On the other hand, a number of problems are identified:
- the queuing problem, described in this report as part of the backwater problems,- a lack of close relations between tertiary education and demands of the labour market,- our universities' emphasis on exams rather than teaching,- that the evaluation of the students’ education is not systematic enough,- the concept of “Network Norway” should be given more substance, e.g. to achieve institutional
specialisation and as a way of rationalising resources, and- we could be more open-minded towards new ways of “user pays”.
3.3 Labour market policy
3.3.1 The Public Employment Service
The labour market policy is implemented by the Public Employment Service (PES). The PES offer a rangeof services to young job-seekers. The strategy towards job-seekers is first and foremost to provide
26
information about the labour market and education, secondly placement assistance, and if deemednecessary, to provide assistance so that individual job-seekers may improve qualifications throughparticipation in labour market programmes. The PES prioritises targeted efforts towards groups that haveparticular difficulties on the labour market. These groups are mainly young people and the long-termunemployed.
Normally, unemployed persons will be allocated places in a programme only after active job-seeking hasbeen tried for some time. However, measures must be set up sufficiently early, in order to prevent long-term unemployment. Very often vocational courses of short duration are sufficient to obtain an ordinaryjob.
The PES is given the responsibility to provide assistance to young people below the age of 20 who do notwish to exercise theirstatutoryright to an upper secondary education. The PES offers a range of servicesto young people, including placement, information about the labour market and education, as well as job-counselling. Counselling shall as far as possible aim at motivating young people to seek further education.The PES co-operates with the county follow-up service in their efforts for young people who do not wishto exercise their right to an education. Young people below the age of 20 without either a place in aneducational institution or work shall be offered participation in a trainee place scheme or a combination ofa trainee place scheme and ordinary upper secondary education.
To prevent long-term unemployment and passiveness among persons aged 20-24, this group ofunemployed has been prioritised with regard to labour market programmes since the second half of 1995.All those who have been unemployed, without a place in school, or in a labour market programme for thelast six months, will be offered a place in a programme. In order to follow up the unemployed in this agegroup more systematically, individual plans of action will be set up, which provide for a more structuredco-operation between the unemployed and the Employment Office.
The Norwegian unemployment benefit system is based on previous earned income to secure job-seekersagainst loss of income due to unemployment. From the first of January 1997 the unemployment benefitsystem has been revised. The income requirement was raised to 1,25 G (which is the equivalent to 53 125NOK per June 1997). Maximum benefit period for income between 1,25-2 G is 1,5 years and for incomesabove 2 G it is three years. It is an absolute requirement that all benefit recipients are job-seekers. As amain rule they must take any job that is offered them by the Public Employment Service, even if thismeans that they have to change their place of residence. Also work at lower wages than in previous jobsmust be accepted. A person who without valid reason, refuses to take a job offered him or her, or whorefuses to participate in a labour market scheme, will loose the right to unemployment benefits for 8weeks.
Participants in Labour market training courses (LMT) and trainee place schemes will receiveunemployment benefit, if they are entitled to it, or a grant of NOK 152 or 203 a day (per 1997) from theLabour Market Service. In addition, allowance for dependants and travel costs can be given.
Continued growth in employment and decline in unemployment is expected in 1997 and 1998. The PESwill pay more attention to the fact that their most important function is to match job-seekers with vacantjobs. Activation of job-seekers through information and follow-up, will be emphasised.
27
3.3.2 Information and placement
With the present strong labour market in Norway, information, counselling and placement from the PublicEmployment Service (PES) are important tools to reduce unemployment even more.
The PES collects, organises and disseminates information about job seekers, employers, vacant jobs andabout education. Altogether these records contain the essential elements of the information theemployment offices need in order to plan and implement labour market policies.
The information system on vacant jobs and school places is designed to facilitate self-service for jobseekers. Thus a majority of those looking for jobs or a school place can help themselves and resources areliberated for those who need follow-up. Unemployed persons are offered measures according to theirindividual needs. This follow-up from the employment office may be manifested through an individualplan of action. However, this is very work intensive and is not offered all job-seekers.
The plans of action include an obligation from job-seeker to take responsibility for his/her own situation,and contribute to clarifying and improving service of the PES towards the individual job-seekers.
The PES offers guidance in the choice of vocation and training for individuals looking for work. Acomputerised vocational guidance system has been developed for this purpose.
Most employers contact employment offices for assistance in connection with recruitment, butemployment offices themselves also actively take contact with employers to offer them a placementservice for job seekers who are registered at the PES.
To handle placements to and from countries covered by the EEA agreement a unit within the PES,EUROPA-service (Service Europe), has been established.
3.3.3 Evaluations of schemes for transition from unemployment to employment and education
The most common schemes for young unemployed are Trainee Places and Labour Market TrainingCourses (LMT). Other labour market schemes, e.g. Wage Subsidies and Training Substitution, are alsoutilised towards young unemployed. The Ministry of Local Government and Labour has during the lastyears initiated several evaluations of labour market programmes such as the LMT Courses and TraineePlaces.
Trainee places are one of the most common schemes for newcomers on the labour market. Youth andimmigrants are the main participants. The participants receive practical work training in privateenterprises or with public employers. The training can also be arranged in combination with uppersecondary school. Trainee place schemes normally last 26 weeks. Apart from job training, it is also anaim to encourage participants to take on more education.
The scheme has been evaluated12 for participants in the age group 20-24 years on the basis of data from1994 and 1995. The results of this evaluation show positive effects for the participants, both regarding jobopportunities and transition to education.
12 Eldring, L. and Grøgaard, J.B. (1996),Evaluering av Næringslivets fadderordning og praksisplasstiltaket,Forskningsstiftelsen FAFO, Oslo.
28
The purpose of Labour market training programmes is to qualify job-seekers for ordinary work, while atthe same time meeting the employer’s demand for various types of labour. It may also encourageparticipants to enter further education. The target group is unemployed above 19 years. LMTs also havean important task in removing «skill bottlenecks» in the labour market.
Statistics Norway13 (1997) undertook an evaluation of different labour market schemes, including traineeplaces and LMT courses, on the basis of registerdata from 1996. Effects on job opportunities, noteducation, are studied in this evaluation. The evaluation shows that participants in ordinary labour marketschemes in the age group 20-29 years have better chances getting a job after completing the scheme thanolder age groups.
An evaluation of the LMT programmes conducted by the Directorate of Labour14 confirms that thesecourses had effects both with regard to job opportunities and also with regard to further education. Thisevaluation also shows that the probability of acquiring a job or starting an education after the coursedecreases with age. Course participants below the age of 25 have 11 per cent higher chance of starting ajob or education than participants in the age group 30-49 years. The evaluation also shows that theprobability of acquiring a job after the course increases with the number of years of education, previousjob experience and the length of time one has looked for a job.
Another evaluation of the LMT programmes conducted by SNF15 shows that these courses are importantinstruments when it comes to qualifying unemployed for ordinary work. Applicants to LMT programmeswho were offered training in the autumn 1989, had higher annual earnings both in 1993 and 1994compared with applicants who were rejected because of scarce capacity. Annual earnings reflect both howfast participants on LMT courses got ordinary employment and the ordinary employment period up toparticipation in a course. Vocational courses are found to raise annual earnings after two to three years andmore than for other LMT courses. The effect on earnings is higher for applicants with low education andlong work experience compared to applicants with higher education and a shorter unemployment period.
3.4 Concerns about the labour market
3.4.1 An analyses of young people - from education to work
In a recent study from the Foundation for Research in Economics and Business Administration (SNF)16, allyoung people who finished their education in 1988-89 were followed into the 1990s in order to analyse thetransition from school to work. In the autumn of 1991, two years after they had left school, approximatelyhalf of them had found permanent jobs, while 20 per cent had a fluctuating job-situation. About 15 percent were not in the labour force, while 13 per cent were unemployed. This study shows that it may take along time for some to establish themselves in the labour market. Education is one of the most importantfactors influencing such establishment. Those with a long education have overall fewer problems finding
13 Lund, M., Landfald, Ø. and Try, S. (1997),Registerbasert evaluering av ordinære arbeidsmarkedstiltak,SSB.14 Arbeidsdirektoratet,Evaluering av AMO-kurs 1994. Del 2. Etterundersøkelse av AMO-deltakere, Rapport 1996:3.15 Raaum, O. and Torp, H. (1997),Labour Market Training in Norway - Effect on Earnings, The Foundation forResearch in Economics and Business Administration (SNF), Oslo.16 Brinch, C. (1995),Fra skole til jobb - en analyse av norske registerdata, SNF, Oslo.
29
jobs, while those below 20, and those who do not go through at least two years of upper secondaryeducation, are less successful with the transition from school to work.
A study of the educational progress of 16-year-olds was conducted in the period 1988 up until the schoolyear 1990/91. The study showed that of the 95 per cent of the 16-year-olds who in 1988 applied for afoundation course in upper secondary education, 84 per cent were admitted as pupils and 0.3 per cententered into an apprenticeship contract. 5 per cent of those who started on a foundation course becamedrop-outs.
More than 50 per cent of these became unemployed. 20 per cent of the age cohort did not attend uppersecondary education after one year (2nd school year), while there were 23 per cent after two years (3rdschool year). In the course of three years of education 39 per cent obtained general entrance qualificationsfor university or university college studies, while 4 per cent had obtained a trade or journeyman’scertificate17.
3.4.2 Transition to the labour market for young people
Normally, young people have more problems in a difficult labour market than other age groups. On theother hand, young people have more alternative activities than other age groups. Education, for instance,is a very common alternative to employment for young people.
Most young people in the age group 16-19 years attend school or have education as their main activityaccording to the Norwegian Labour Force Survey (See annex I, table 3). These figures will vary fromthose in annex I, table 1, because they are related to main activity and not labour force status. In the firsthalf of 1997, 85 per cent in this age group attended school or had education as their main activity. 8 percent were employed (employed includes full-time work and part-time workers who consider theemployment as their main activity) and 7 per cent were grouped under other activities or unspecified. Inthe age group 20-24 years, education is more unusual.
In the first half of 1997, 34 per cent had education as their main activity, 50 per cent were employed, 3 percent of these were working at home and 13 per cent were grouped under other activities/unspecified.According the figures in annex I, table 3 the distribution in activity has been relatively stable since 1992for both age groups.
Young persons without work experience, or without recognised education have, in a difficult labourmarket situation, more problems finding work than most other age groups. Unemployment is particularlyhigh in the age group 20-24. In the first half of 1997, there were on average 13 100 registered unemployedbetween 20-24 years, i.e. 6.0 per cent of the labour force in the age group. For those below 20 years of agethere was an average of 2 800 registered unemployed or 3.1 per cent of the labour force. For the adultpopulation (25 years and older) the registered unemployment was 4.3 per cent. The high unemploymentrate among young people can partly be ascribed to the fact that only 59.3 per cent of the age group 16-24years was in the labour force in 1996, while 81.9 per cent of the age group 25-66 years was in the labourforce in the same year.
The overrepresentation of young people among the unemployed is caused by several factors. Youngpeople are sometimes considered less attractive by employers because they lack experience, they are ontheir way into the labour market, i.e. in transition from school to work. Young people also change jobs
17 NOU 1991:4, page 28-30.
30
more often than others, and frequent transitions between work and education are common. Further, a highproportion is in the educational system, which means that full-time workers - and persons seeking full-time work - in this group to some extent consists of persons with low education. When it comes to highinitial wages, an expert-group18 concluded that this does not seem to be a general problem in Norway. Butthe wage structure may in some sectors be an obstacle to employment of youths without experience orfulfilled education. These factors together, may explain why it takes time to find a good adjustment toworking life.
Unemployment among young people is more sensitive towards fluctuations in the economy thanunemployment among adults, and the general economic improvement in Norway the last years has causeda considerable decline in unemployment among young people. (See annex I, figure 1). The relativelystrong decline in youth unemployment can also be ascribed to a reduction in the year cohorts entering thelabour market, and more places in upper secondary education, as well as a priority for young people inlabour market schemes. The number of registered unemployed in the age group 20-24 years was reducedby 23 per cent from the first half of 1996 until first half of 1997. During the same period the number ofregistered unemployed fell by 14 per cent for people aged 25 and older.
Most of the young unemployed are unemployed for a short period. The relative proportion of registeredlong term unemployed (unemployed for more than 26 weeks) is considerably lower than that of most otherage groups. (See annex I, table 4). The differences recorded between the age groups might be due to thehigh priority given to young unemployed below 25 years in labour market programmes. This priorityimplies that young unemployed are given an offer of a labour market scheme quite early in theirunemployment period.
Another factor that influences long-term unemployment is that the unemployment benefit system requiresregular registration at the Employment Office. This implies that unemployed who are not entitled tounemployment benefit more often will have breaks in their unemployment periods.
Another important factor is that employers, in some contexts, find younger persons more attractive asemployees.
SNF has conducted a study19 of the different pathways of all persons who were registered as unemployedin October 1990. The study gives information about the transfers between unemployment, labour marketschemes, work, education and different types of social security benefits in the period October 1990 toDecember 1992. The results show that the share which started a job in the period October 1990 toDecember 1992 was highest among the age group 20-24 years. The employment rate is falling with olderage groups. In the age group 16-19 years very few started working, but relatively many started aneducation during the period.
In another study20 by SNF the population aged 16-69 years was divided in 6 different categories, based ontheir connection to the labour market during the period 1989-1992. The categories vary from strongconnection to the labour market (i.e. in job or education for more than 3 years) to no connection to thelabour market (i.e. no job, education and not registered unemployed during the four years). In the last
18 NOU 1994:3,Ungdom, lønn og arbeidsledighet.19 Hernæs, E. og Strøm, S.,Fra ledighet til jobb, Centre for Research in Economics and Business Administration(SNF), Arbeidsnotat nr. 28/1994.20 Hernæs, E. og Sollie, M.,Befolkningens arbeidsmarkedstilknytning,1989-92, Centre for Research in Economics andBusiness Administration (SNF), SNF-rapport2/97.
31
group one will find housewives and people in the social security system. A category with a marginalconnection to the labour market consists of people which have been registered unemployed some timeduring the four-year-period. They have tried to get a job without any success. 4.2 per cent of thepopulation was in that group. Young people (16-24 years) are overrepresented in this category (7-9 percent). This indicates that young people have small opportunities on the labour market in an economicdownturn.
In a situation with very few jobs many young people do not get into the labour market because of lack ofexperience. On the other hand, figures from the Directorate of Labour show that very few young peopleare long-term unemployed. This must be seen as a result of the high priority of this group in the labourmarket policy.
Temporary employment is partly related to general job creation through the need enterprises have forflexibility, for example adjusting the number of employees to the demand for products. On the other hand,a temporary job implies a great portion of insecurity for many employees. A recent Norwegian study ontemporary employment arrangements21 shows that around 14 per cent of employees have temporary jobs.The study shows that nearly half of those who are temporary employed are less than 30 years old. It seemsthat a temporary job is the spring-board to a permanent position for many young people.
3.4.3 Young immigrants in the labour market
Job participation among immigrants is generally lower than for persons born in Norway. For the wholepopulation in the age group 16-25, about 42 per cent are employed (4th quarter 1996). Among firstgeneration immigrants in the same age group about 28 per cent are employed. There are, however,considerable differences between the various immigrant groups.
Registered unemployment among first generation immigrants fell from 11.6 per cent in November 1996 to10.6 per cent in November 1997. In the same period, the unemployment rate for first generationimmigrants in the age group 16-24 years fell from 14.4 per cent to 12.4 per cent. For this age group theunemployment rate declined for all national groups.
Obstacles to the labour market integration for immigrants can be lack of knowledge of the Norwegianlanguage and working life, and in some cases ethnic discrimination may also occur. Furthermore, there aresome problems regarding documentation of educational certificates from the country of origin, as well asthe recognition of diplomas and certificates. However, several problems are due to the short period of timethey have spent in Norway. The proportion of immigrants who are employed increases with the number ofyears lived in Norway.
A longitudinal study22 of those leaving primary school in 1989, shows that both among first and secondgeneration immigrants the percentage which continued to secondary education is clearly lower than foryouths with Norwegian background. Among those who completed secondary education, both first andsecond generation immigrants had lower income and higher unemployment than persons with Norwegianbackground. A similar study after the introduction of the reform for secondary education ("Reform 94")does not exist yet.
21 Nergaard, K. og Stokke, T. A. (1996),Midlertidige ansettelser i norsk arbeidsliv. Hvor mange, hvor og hvorfor?,FAFO, Oslo.22Hamre, J.I. and Raaum, O. (1997),Innvandrerungdom i og ut av videregående opplæring,SNF, Oslo.
32
A recent evaluation23 of the effect of labour market programmes for unemployed immigrants, indicate thatparticipants in the programmes Wage Subsidies, Labour Market Training Courses and Trainee Places withsponsors improve their job-chances and length of later employment compared to unemployed immigrantsnot participating in labour market programmes.
3.4.4 Transition to the labour market for young people by level of educational attainment
As in other OECD countries the unemployment rate is lowest for those with tertiary education and highestfor those not having completed upper secondary education. For the age group 20-24 years theunemployment rate in 1995 was 7 per cent among those with university tertiary education and 18.3 percent among those with below upper secondary education. For the age group 25-29 years, we find a similarpattern. (See annex I, table 5).
The unemployment rates for persons with higher education remained low even during the recession in theearly 1990s. It has not fallen much since then, however, due to excess supply of labour in a number ofprofessions.
On the other extreme, the unemployment rate among those with only primary education (or less) increasedstrongly during the recession and has broadly stayed at that level since. By contrast, the unemploymentrate for persons with upper-secondary education, although also hit by the recession, dropped significantlyfrom a 6.4 per cent peak in 1992 to 5.1 per cent in 1995, reflecting a substantial recovery in employment.Conversely, a similar fall in the unemployment rate for young people who have completed lower-secondary education has been due to a decline in participation rate. (See annex I, table 6).
There is a tendency that candidates from tertiary education to a larger degree take work they areoverqualified for and that many groups with higher education get a reduced relative pay. The projectedincrease in the excess supply of persons with tertiary education may result in reinforcement of thistendency.
Annex I, table 7 gives information about labour force status in November 1994 for persons aged 16-29years that completed an education in May or June 1994. The figures give information about the transferfrom fulfilled education to employment, unemployment or participation in labour market schemes,ordinary education, combining education and full-time or part-time employment. Most of those (42.0 percent) who completed upper secondary school are in education half a year later. Only 15.6 per cent of thiseducation group are in employment by the time of November. In addition, 4.0 per cent were combiningeducation and full time work at the same time. It should, however, be noted that the figures are from aperiod before Reform 94 was fully implemented. One of the objectives of Reform 94 is to improve thevocational training in order to strengthen the link between school and business and industry. This maylead to an increase in the number of pupils who transfers to the labour market.
When it comes to those who completed a tertiary education of 4 ½ years and more, transfers toemployment are of course more common. About 53 per cent of this group are employed half a year afterthey completed their education, and 10 per cent combine education and full-time employment. For thosehaving completed a tertiary education of 1-4 years duration the share of employed is clearly lower thanamong those with longer tertiary education (and higher than for those from upper secondary education).
23 Schøne, P. (1996),Innvandrere på arbeidsmarkedet. Evaluering av arbeidsmarkedstiltak, ISF, Oslo.
33
CHAPTER 4: CHANGING EXPECTATIONS AND OBJECTIVES
4.1 Participants in policy formation process
4.1.1 Tripartite co-operation
The social partners have traditionally had large influence on vocational training in Norway - especially inapprenticeship measures, through branch organisations on both the employees’ and employers’ sides.Norway has thus a long tradition of close co-operation, both formal and informal, between the education,training and labour market authorities and the social partners.
The Confederation of Trade Unions (LO) and the Confederation of Norwegian Business and Industry(NHO) and also the Norwegian Association of Local and Regional Authorities (KommunenesSentralforbund, KS, which is the employers’ organisation for the counties and municipalities) have had aformal dialogue with the authorities through the Council for Vocational Training (RFA) and the trainingcouncils (OR) and also direct contact and co-operation with the Ministries on a range of issues. The socialpartners were, for example, strong contributors in the development and launching of Reform 94. (Seeannex I, figure 2 and annex II, appendix 1).
The social partners’ contribution to the formation and implementation of vocational training in Norway isinstitutionalised through the Act concerning Vocational Training. It is also expressed through setprocedures for representation, participation in the development of curricula and the contribution to reportsconcerning the different fields and levels of education and training. The responsibilities and involvementof the social partners are also determined by work and wage agreements.
In addition to co-operating with and advising the authorities, the social partners fulfil their usual roles inthe field of vocational training and in the working community. Another important area of activity for thesocial partners is that of working conditions and the working environment. As part of this work, theynegotiate on the function and responsibilities of skilled workers in the respective trades. The Ministry alsoco-operates with the social partners on decisions concerning which professions and types of training tosupport through the public training and certification system.
4.1.2 The labour market programme Trainee Places
The PES has extensive co-operation with local governments, regional authorities and social partners in theimplementation of labour market policies. Co-operation consists both of co-ordinated efforts towards job-seekers and the disabled, as well as planning and arranging of labour market schemes. To strengthenregional co-operation, regional councils were set up on the initiative of the Ministry of Local Governmentand Labour. The aim of these councils is to contribute to the co-ordination of training and education at thelocal level, with the view of meeting the needs of the unemployed, as well as that of local businesses.
34
The employers’ and employees’ main organisations (NHO and LO), on the national level , have beenactively involved in developing the labour market programme Trainee Places. This programme is targetedtowards young people and immigrants. The co-operation with the social partners about this programmehas resulted in a stronger involvement from the enterprises in order to be able to offer a good combinationof instruction and practice. As part of the programme, each youngster gets a "sponsor" as a personal guidein the enterprise.
4.1.3 Industry24
As mentioned above, the employers’ and employees’ organisations have participated in the policyformation process. Below follows a description of their experiences and future prospectives concerningco-operation, challenges and objectives.
«The Confederation of Norwegian Business and Industry (NHO) has initiated a programme called«Industry in schools». The aim of the programme is to inform pupils about business and industry ingeneral. Educational authorities in every county are involved in the project. The Confederation of TradeUnions (LO) has a similar programme called «School and Working Life» aimed at providing pupils andteachers with information about possibilities in the labour market. The programme is aimed towards needsin the local labour market and is particularly directed towards vocational training.
Both NHO and LO point out that the situation on the labour market in Norway is somewhat different fromthe situation in most European countries, as unemployment in Norway is low compared to other Europeancountries. They are under the impression that employers in Norway «fight» for young people with tradeand journeyman’s certificates. Still, it is a major concern that unemployment among young people ishigher than overall unemployment, even though most unemployment among youths is short-termunemployment.
One concern is that the counties, when planning courses, emphasise the pupils’ freedom of choice morethan the local labour market’s needs. Another factor is that young people are reluctant to move to othercounties where the courses of their choice are offered, and they are also reluctant to move in order toobtain work. Another dilemma is that trades and industries in a region might be reluctant to take on youngpeople from other regions as apprentices, as they prefer locals who probably are more likely to stay onwith the company, when trained as a skilled worker.
In principle, NHO and LO and the training councils support the «2 + model», but they are worried aboutthe pupils who have to finish their training at school because of lack of apprenticeship places, thus leavingthem with only three years of school education before taking trade or journeyman’s examinations.
The pupils who receive a trade or journeyman’s certificate after three years at school will have moreproblems on the labour market in competition with those who have received the intended training in anenterprise (two years).
NHO and LO point out that they are concerned with the educational and training opportunities in Norwayas a whole. They do however point out that their member enterprises, in particular small and mediumsized enterprises, might be more concerned with their own needs for manpower. These enterprises aremore likely to take on apprentices for later employment in their own enterprise than to provide training for
24 Information obtained through interviews with LO and NHO and the training council for electromechanical,mechanical and engineering trades (ORMET), Aug. 97.
35
the common good. The training council for electromechanical, mechanical and engineering trades(ORMET) points out that it might be difficult to change this attitude.
There is a conflict of interest between the demands of the different trades, on the one hand, and interestsof the main employers’ and employees’ organisations, on the other hand. Many trades report that theyhave taken on the number of apprentices they need for the moment, while LO and NHO are concernedabout the future needs for competence. NHO points out that the municipalities would be the best bodies toprovide prognoses on development in the local labour markets, thus being able to inform the countymunicipalities so that they can plan courses in a more long-term perspective.
ORMET points out the need for good educational and vocational guidance to cope with the mismatchproblem in certain industries. Projects where the potential of apprentices is analysed for different regionsare necessary, so is more long-term planning. The different trades lack figures, therefore it is important tocontact those responsible for the development of industry in the different counties.
Another problem pointed out by ORMET is that some teachers have outdated competence, and since theseniority principle governs when hiring teachers, young teachers (who have adopted the new teachingmethods) are not able to get the jobs.
The social partners also emphasise the need for better educational and vocational guidance in lower andupper secondary schools in order to cope with the mismatch problem. NHO and LO regard exchangeagreements between schools and enterprises as a positive contribution to improving knowledge aboutworking life in schools.
ORMET claims to be satisfied with the tripartite-co-operation and the dialogue with the Ministry throughthe process of implementing the reform. ORMET does however think that the training councils shouldhave been more involved in the measures for further education of the education boards responsible fortrade and journeyman’s examinations. NHO and LO assert that they are satisfied with the tripartite co-operation at upper secondary level, but they think it can be improved in higher education.
ORMET thinks that in order to improve young people’s transition to working life it is important toestablish contacts with state colleges as early as in upper secondary education. The co-operation betweenstate colleges and industry in the different regions should be developed in order to improve the through-flow of pupils from upper secondary education to higher education.
4.1.4 Young people25
The pupils’ organisations have contributed with advice on policy formation. Below follows a descriptionof their experiences and future prospectives concerning co-operation, challenges and objectives.
The pupils’ organisations state that trends in society affect youths transition to working life. As of today,when the economy has an upward trend and unemployment is low, youths have a more positive outlook atthe future and future possibilities, and therefore are more likely to use more time to «broaden theirhorizons». The pupils’ organisations are however concerned about the “back-waters” of students seekingaccess to higher education.
25 Information obtained through interviews with the pupils’ organisations, Aug. 97.
36
The statutory right to upper secondary education gives pupils the opportunity to take one year off duringtheir studies, as the right must be taken out within a four-year-period. This limitation constitutes aproblem for applicants who chose a new area of study when the reform entered into force and forapplicants with a statutory right who have changed foundation course, or area of study more than once orduring advanced course I, thus loosing their right to upper secondary education. The pupils’ organisationspoint out that there is no guarantee to be admitted to the advanced course I and advanced course II ofone’s choice and many pupils have to complete their vocational training at school due to lack ofapprenticeship places.
The pupils’ organisations assert that the counties do not concentrate on providing courses adapted forapplicants without a statutory right e.g. comprised courses, courses that last longer than the estimatedtime, courses offered in the evening etc. They assert that the right to upper secondary education should beexpanded to include those above the age of 19 and that it should not be limited to a four-year-period. Thiswould leave greater freedom of choice and also improve the situation for young people above 19 years ofage who have not completed their upper secondary education. In the long run, this would ease youngpeople’s transition to working life, as young people’s employability seems to be proportionally increasedwith their level of education.
The pupils’ organisations report that, at upper secondary level, there seems to be a different developmentbetween those attending general courses and those attending vocational courses, when it comes tointerruption of studies for a year. Young people attending areas of study leading to university or collegeentrance qualifications seem to be more likely to interrupt their studies during and after finishing uppersecondary education, while those attending vocational areas of study are less likely to do so. Pupils whoare able to attain an apprenticeship contract are also more likely to finish upper secondary school withoutinterruptions, than those who are attending vocational courses where it is difficult to obtain anapprenticeship contract. The latter group is more likely to change their area of study after completing thefoundation course. The pupils’ organisations assert that better educational and vocational guidance atlower secondary level is a necessity when it comes to limiting this trend.
The pupils’ organisations also point out that the transition to working life may be more difficult for thosewho have had to finish their vocational training at school, due to lack of apprenticeship places. They alsoemphasise the need for attitude changes to make activities in schools more coherent with developments insociety.
Even though the new curricula emphasise a broad concept of knowledge, more in-service-training forteachers is necessary to make them more adaptable to changes in society.
4.1.5 Teachers’ organisations26
The teachers’ organisations are major contributors to the policy formation process, as they give advice oneducational and training policies. Below follows a description of their experiences and future prospectivesconcerning co-operation, challenges and objectives.
According to the teachers’ organisations teachers’ knowledge of and co-operation with business andindustry is not institutionalised, but is based on the individual teacher’s interest in acquiring knowledge ofbusiness and industry. Teachers who teach vocational subjects are more familiar with business and
26 Information obtained through interviews with the teachers’ organisations, Aug. 97.
37
industry than those teaching general subjects. Teachers of general subjects might therefore need moreencouragement in order to integrate knowledge of business and industry in their teaching.
The teachers’ organisations assert that it is important to distinguish between the individual teacher’sbackground and his/her need for professional development; thus both teachers of vocational subjects andteachers of general subjects need in-service training and further and continuing education. The teachers’organisations also point out that the need for professional development is the same among teachers inprimary and lower secondary education as it is in upper secondary education. In order to cope with themismatch problem it is important that the current reform of the teachers’ education as well as in-service-training and continuing education focus on developments in business and industry.
The teachers’ organisations are positive to the development and strengthening of co-operation betweenschools and industry, but they point out that it is important that contacts must be made both ways(schools- industry/ industry- schools). The teachers’ organisations point out two major problems withinvocational areas of study:
• The trade and journeyman’s examinations are evaluated by examination boards. Upon theimplementation of Reform 94, the number of members on the examination boards was reduced fromthree to two. Both members shall have formal vocational competence and ideally also work experiencein the relevant trade. According to the teachers’ organisations this makes it more difficult for teachersas they are not assured a place on the board as they were previously, and therefore it has also becomemore difficult for teachers to know the requirements of the trade and journeyman’s examination.
• Furthermore, the teachers’ organisations think the «2+ model» is too rigid. They think it would beeasier for pupils to adapt to working life if they were given the possibility of alternating betweenschool and enterprise. The teachers’ organisations are afraid that pupils who have had to finish theirvocational training at school (advanced course II) due to lack of apprenticeship places will have moreproblems with transition to working life. On the other hand, they also see the dilemma between thepupils’ freedom of choice versus the labour market’s needs for competent manpower. The teachers’organisations also point out that the choices made by pupils today are somewhat different than before,as many choices have already been made for them in the new educational system (e.g. statutory right to3 years of education).
The teachers’ organisations also point out the problems faced by those who are not covered by thestatutory right to 3 years of upper secondary education. They have registered a tendency among adults tomove sideways in the educational structure, since the county authorities have not planned any advancedcourses I in the area of study of their choice. Therefore the through-flow of pupils is not as good asexpected before Reform 94. The results of the project dealing with partial competence might prove toimprove the possibility of building up partial competence qualifications to ease the transition to workinglife for youths in the age group 19-30 who lack or have not finished upper secondary education.
When it comes to participation in the policy formation process, one of the organisations want aninstitutionalised right to representation, whereas the other organisation is satisfied with the situation as itis today, where the Ministry asks them for advice on appointment of representatives to differentcommittees etc.
When it comes to transition from upper secondary education to higher education, the teachers’organisations point out the need for more information about the system of higher education, as mostteachers only know the educational programmes they have attended themselves.

38
CHAPTER 5: MONITORING AND RESEARCH
For monitoring and research on labour market policy, see chapter 3.
5.1 Monitoring and research at upper secondary level
5.1.1 National monitoring
The Ministry of Education, Research and Church Affairs obtains reports and statistics on results ofexaminations, including trade and journeyman’s examinations, from the National Examination Board(Eksamenssekretariatet) and from the county municipalities. These statistics are not sufficient in order toprovide information on an individual level, therefore a data base is being developed supplying informationof individual results.
The Ministry also obtains statistics on the number of pupils and apprentices directly from the countymunicipalities.
The 18 National Education Offices that are attached to the Ministry of Education reports to the Ministryevery year on issues concerning education and training.
5.1.2 Evaluation of Reform 94
The initial phase of the educational reform has been followed by an ongoing evaluation by seven differentresearch institutes. (See annex II, table 8).
The evaluation should satisfy the following two main objectives:
• the evaluation should determine to what extent the most important goals of the reform have beenattained,
• the evaluation should provide information and insight while the evaluation itself is in progress. Thisshould be in a form which will enable quick decisions on necessary adjustments and corrections to bemade, with a view to changes and improvements in the light of the goals of the reform.
The Ministry of Education, Research and Church Affairs regards four main areas as important to assess:
1. Scale and capacity2. Through-flow and qualifications3. Organisation and co-operation4. The content and structure of education.
In addition, the following issues are regarded as important for the evaluation of the reform:
39
- adults- applicants with Norwegian as their second language- applicants with a recognised need for special education- the follow-up service for which the regional authorities are responsible.
A general concern touching on each of the main priority areas, is the question of gender distribution.
The flow of pupils through upper secondary education
The intention of Reform 94 is to provide a training supply with a best possible exploitation of resources,with as few unnecessary wrong choices as possible and without backwaters.
The research-based evaluation of Reform 94 shows that the reform has had a positive effect on the flow ofpupils through upper secondary education. The share of those following normal progression has increasedby 10 per cent after the introduction of the reform. The effect is particularly strong within vocationaltraining, where the share of those following normal progression has increased from 30 per cent to 58 percent.
A study conducted by the Norwegian Institute for Studies in Research and Higher Education (NIFU) forthe autumns of 1994 and 1995 deals with the new educational system’s success with regard to reaching thetarget of better flow of pupils through the system. NIFU has followed the first Reform cohorts (those whostarted a foundation course during the autumn of 1994). The study distinguishes between the pupils whohave a statutory right to 3 years of upper secondary education and those that do not have this statutoryright.
The through-flow of pupils from foundation course to advanced course I -- a comparison between the1989 cohort and the 1994 cohort
94 per cent of the 9th grade cohort of 1994 started upper secondary education in the autumn of 1994. Ayear later, 77 per cent had a normal progression through foundation course to advanced course I comparedto the 9th grade cohort of 1989, where this percentage was 66.
The situation in the autumn of 1995 for the 1994 cohort -- transition from foundation course to advancedcourse I:
• 92.9 per cent were still undergoing upper secondary education• 81.3 per cent continued on to an advanced course I within the same area of study• 2.3 per cent took the same foundation course again• 4.3 per cent applied for a new foundation course• 3.4 per cent followed a special programme, taking the foundation course over a period of two years• 3.6 per cent did not accept the educational offer they were given.
For the pupils without a statutory right, the situation was completely different:
• 47.3 per cent continued on to an advanced course I within the same area of study• Close to 1/3 of the cohort did not continue, either because they did not apply (10 per cent), or they
were not offered a course (15.2 per cent) or because they did not accept the offer (4.9 per cent).

40
The situation for the 1994 cohort -- transition from advanced course I to apprenticeship place inenterprise/advanced course II at school (autumn 1996):
• 86.4 per cent of the cohort were still undergoing training either at school or in industry• 73 per cent followed the normal progression• 13.4 per cent were delayed due to the fact that 3 per cent were at foundation course level and 10.4 per
cent were still on advanced course I level.• 2.6 per cent (of pupils in vocational areas of study) had chosen an advanced course II in general
subjects to obtain entrance qualifications for higher education.
For pupils without a statutory right the situation was different:
• Half of the cohort from 1994 did not receive upper secondary education in the autumn of 1996. NIFUexplains that this is due to pupils who failed to apply for a course or who rejected to accept the coursethey were offered.
• 35.5 per cent of the cohort followed normal progression• 12 per cent were delayed, most of them by a year.
Increased through-flow in vocational areas of study -- comparison between the 1991 cohort and the 1994cohort
The share of those following normal progression in the vocational areas of study has increased from 30per cent before the reform to 58 per cent after the reform. According to NIFU, this is due to the fact thatthe proportion of those being delayed in the system has been reduced by 50 per cent after the introductionof the reform, at the same time as the proportion of drop-outs has been reduced.
Apprenticeship places
Allocation of apprenticeship places in 1996 and 1997:
The social partners and the Ministry have agreed to share the responsibility for the vocational education ofskilled workers. A major condition for the proper functioning of this agreement, is that business andindustry provide a sufficient number of apprenticeship places. The agreement is based on voluntaryparticipation by the enterprises.
The county municipalities are now into their second year of allocating apprenticeship places. So far,experience shows that the target of allocating enough places, has not been achieved. Many young peoplehave not received their final training in an enterprise.
The 1996 status reports27 show the following:
• More than 16 000 pupils applied for an apprenticeship place; of these 10 000 had a statutory right toupper secondary education
• There were 16 500 apprenticeship contracts agreed• 9 550 applicants received an apprenticeship place; of these 6 400 had a statutory right to upper
secondary education
27 Statistics, Ministry of Education, Research and Church Affairs, 1997.

41
• 7 000 adults outside the scope of the reform were allocated an apprenticeship place• 3 000 reform-pupils did not receive an apprenticeship place, and accepted the offer of completing their
vocational training by attending an advanced course II at school• 2 700 applicants withdrew their applications for an apprenticeship place or turned down the offer they
were given.
A mismatch of both a vocational nature and a geographical nature has been revealed.
The results from 1996 showed that for certain vocational areas of study, there was a mismatch between thenumber of applicants applying for an apprenticeship place and the number of places available. In sometrades there were too many applicants compared to the number of apprenticeship places, while theproblem in other trades has been to recruit enough apprentices to meet future needs.
The trades concerned are the care workers, child and youth work, the electrical trade, cooking, carpentryand the repair of light vehicles. Fully 45 per cent of the pupils did not receive an apprenticeship place,thus the training for these people had to take place at school. (See annex II, figure 4).
In the following trades it was difficult to recruit enough apprentices: Building and Construction Trades,Technical Building Trades, Processing Trades and some within the mechanical and engineering trades.
There was a geographical mismatch throughout the country; while there in certain parts of the countrywere available apprenticeship places in a specific trade, there was a lack of apprenticeship places in thesame trade in other parts of the country.
The counties had to establish more than 270 classes for the applicants who did not receive anapprenticeship place. Those who attended these courses finished their vocational training in June 1997.They have taken their final examinations in order to obtain their trade or journeyman’s certificate. We stilldo not have the final results, but reports so far indicate that many of them have failed.
Temporary figures28 from 1997 show the following:
• 17 320 applied for an apprenticeship place; of these 11 500 had a statutory right to upper secondaryeducation.
• Enterprises had made preliminary agreements to supply 16 200 apprenticeship places.• By 1 September, 10 300 apprenticeship contracts were agreed.
The process of allocating applicants to apprenticeship places ended 15 September , but the numbers arenot available yet. It is expected that the number of apprenticeship contracts has increased. Those who havenot been able to obtain an apprenticeship contract will be offered an advanced course II at school.
The mismatch in 1997 is within the same trades as in 1996. The problem of recruiting enough apprenticeswithin the building and construction sector has increased markedly in 1997.
Preliminary results of the research show that:
• The total volume of new apprenticeship contracts increased by 60 per cent from 1995 to 1996.• More young apprentices are given an apprenticeship than before. The aim of achieving a greater
number of youths in apprenticeships has therefore been reached. The number of young apprentices (18
28 Statistics, Ministry of Education, Research and Church Affairs, 1997.
42
years or younger) increased nearly tenfold - from 711 in 1995 to 6 457 in 1996. However, immigrantswho have Norwegian as their second language and pupils with special training needs and handicappedhave greater difficulties than the lot when it comes to obtaining an apprenticeship place.
• Girls may have greater difficulties than boys getting an apprenticeship contract within certain male-dominated professions. Girls and boys still choose vocational courses which correspond to thetraditional gender roles. The Ministry of Education, Research and Church Affairs is about to launch aproject «Conscious Educational Choices» which shall contribute to making the labour market lessmarked by traditional gender distribution.
The project’s two main aims are:
1. To qualify and motivate youths to make conscious educational choices without regard totraditional patterns.
2. To identify and to adapt as much as possible central aspects of the framework for education whichmake such choices possible. (For further information, see section 5.3).
Which measures were taken?
The problems on the apprenticeship market have been at the centre of discussions during the past twoyears with the social partners and the counties. The ad hoc measures which have been possible toimplement by the parties involved, have been implemented. The following can be mentioned:
• Information campaigns have been carried out in order to make enterprises take on more apprentices.Newspapers and television media have been used for this purpose.
• In 1997, special economic grants were awarded enterprises in order to stimulate the enterprises to takeon apprentices.
• Strengthened vocational guidance in lower secondary schools has been introduced in order to giveyouths more information about upper secondary education and about trades where there are availableapprenticeship places.
In 1997, a white paper was presented to the Storting on the situation of the apprentices with proposedmeasures to be implemented if the situation does not improve. The measures that are listed are bothforeseen on a short-term basis and on a long-term basis.
1. A fund system is to be initiated in co-operation with the social partners. This alternative entails thatworking life as a whole must take responsibility for the salaries of the apprentices by paying into afund. Thereafter resources are paid out from the fund to enterprises which take on the responsibility oftraining an apprentice. Contributions to the training part of the apprenticeship are given to theenterprises by the educational authorities on the same basis and according to the same rules as before.
2. The social partners in the private as well as in the public sector are asked to submit prognosis for futurework force needs so that the educational authorities supply the courses at upper secondary schools inaccordance with these needs.
3. Vocational and educational guidance is to be strengthened to provide youths with knowledge aboutdifferent trades and available apprenticeship places, as a basis for young people’s right choice ofeducational pathway. This work will be done in close co-operation with the social partners.
4. The Ministry is currently considering changing the vocational pathways, especially with a view toachieving smoother transitions between vocational courses that are closely related.
43
The follow-up service
The follow-up service is based on interdisciplinary co-operation and interaction between different bodiessuch as: primary and lower secondary schools, upper secondary schools, the Public Employment Service,social and health services etc. The follow-up service is responsible for co-ordinating measures from thesedifferent bodies.
So far, experience shows that the follow-up service proves to give good results. The counties have beenable to survey the youth cohorts. Young people who are not attending upper secondary school for onereason or another, are being contacted. Estimates from the follow-up services (1 July 1997) show thatmore than 97 per cent in the age group 16-18 who have a statutory right to upper secondary education, areeither receiving education or are employed. Records from the follow-up service show that in the schoolyear 1996/97 there were 7 per cent of the youths who had a right to education who had a need forguidance and to be followed up. About 4 per cent have during the course of the school year accepted anoffer of education or work. 1.5 per cent were still being followed up by the counties. Less than 0.5 percent has rejected help from the follow-up service and about 0.3 per cent have been impossible to trace.
Interruption of studies
3.6 per cent of all pupils and apprentices with a statutory right to education (3 cohorts) have interruptedupper secondary education/training. The reports reveal that there are great differences between thecounties; expanding from 1.5 per cent in one county to 7 per cent in another county29.
Pupils who interrupt upper secondary education, either because they do not accept or apply for a place inupper secondary education, are more likely to resume their education than they were before Reform 94.Figures from NIFUs30 research shows that nearly ¾ of the pupils who did not receive education in theschool year 1995/96, appeared as applicants in 1996/97.
Experience from the follow-up service shows that youths who are under the responsibility of the follow-up service, are not necessarily «lost for schooling» forever, even though they drop-out one or severaltimes. Therefore, it is important that the «school gate is kept open» and that they are given several chancesof re-entry.
Researchers who evaluate the follow-up service pointed out in their report of February 199731 that theirmost interesting finding was: youths who have combined school education with training in an enterpriseare significantly more likely to choose school the second year than those who had chosen other solutionse.g. attended school, participated in a placement scheme, worked or just stayed at home.
Youths with special educational needs (Handicapped)
Applicants who are 20 years old or younger, with the support of expert opinion, have the right to a specialneeds education and are entitled to be admitted to their first-choice foundation course. The aim of this
29 Statistics, Ministry of Education, Research and Church Affairs, June 1997.30 NIFU, Rapport 1/97: «Etter halvgått løp» (Half-way through).31 FAFO, Notat 1997:2 «Evaluering av oppfølgingstjenesten i Reform 94» (Evaluation of the follow-up service ofReform 94).
44
provision is to make sure that the authorities, during the intake to a field of study, take into considerationthe specific educational needs handicapped pupils have. The main consideration to be taken into accountwhen choosing a foundation course for these youths, must be to find a field of study which in a largemeasure will provide competence for working life. Many of these pupils choose the three vocationalsubject areas: mechanical trades, health and social studies and the hotel and food-processing trades. Therewas also a similar bias before Reform 94.
Regarding special needs education, the educational opportunities differ somewhat from county to county.About 60 per cent of the pupils the research institution «Møre Research» calls «pupils who have a needfor a special, adapted education» are integrated in normal classes. This means that about 40 per cent attendspecial classes. There are great variations from county to county. In the county Møre og Romsdal 76 percent of the pupils receiving specially adapted training are integrated in normal classes, while only 37 percent and 39 per cent are integrated in normal classes in Hedmark and Oslo respectively32.
«Møre Research» also deals with the situation of so called «grey-zone pupils»: Pupils who have specialeducational needs, but who did not mention this in their application; thus the school has no informationabout their needs. This might have serious consequences for the organisation of their education. Since theschool has no information concerning their specific difficulties and needs when they start upper secondaryschool, it might take considerable time before the necessary mapping is done and measures areimplemented.
Transition from school to working life for handicapped youths
During the last 10-15 years there has been an increasing trend to integrate handicapped in ordinaryeducation and training schemes. Unfortunately, there has been no indication of increased transition toworking life among handicapped youths. The Ministry of Education, Research and Church Affairs in co-operation with the Ministry of Local Government and Labour and the Ministry of Health and SocialAffairs have completed a project aimed at finding measures to improve handicapped youths’ opportunitiesfor transition to working life and participation in society as a whole - after having completed their uppersecondary education.
The results of the project revealed that the handicapped youths who had participated in the project had thenecessary qualifications to participate in working life and to be integrated in ordinary employment,provided they received the necessary aid and support. The project revealed a strong need for aninterdisciplinary co-operation and the need of co-ordinating the different bodies’ individual programmesfor action. The co-operation between different bodies in support groups gave positive results. The resultsalso indicated that it was a necessity to have one body co-ordinate the division of responsibility in thedifferent stages of transition from initial education to working life.
The Ministry of Education, Research and Church Affairs, the Ministry of Local Government and Labourand the Ministry of Health and Social Affairs have discussed measures to ensure that actors on the supplyside co-ordinate their activities towards one main objective: employment, primarily in ordinary workinglife.
As an exception from the rule, it is in specific situations possible to obtain a trade or journeyman’scertificate without meeting the theoretical requirements in the general subject areas. (See annex II, figure2). This exception only applies to apprentices who can supply an expert opinion verifying they have e.g.
32 Høgskolen i Volda, Møreforskning Volda, Research report no. 24/97 «På særvilkår» (Special needs education)
45
dyslexia, or who of specific reasons have been excused from attending these courses in primary and lowersecondary school.
5.2 Monitoring and research in higher education
In Norway, what we have seen lately, is that in times of relative higher unemployment for graduates fromtertiary education, students tend to stay on and continue to higher degree studies rather than seekemployment after completion of a lower degree. It should be noted, however, that the possibilities on thelabour market for most graduates from tertiary education still are relatively good, and that so far, graduateunemployment has not been considered a serious problem, like it is in many other countries.
In 1994, unemployment among those with 1 - 4 years of higher education (HE) was 2.3 per cent (of thepopulation aged 16 to 74), and for those with 5 years of HE or more it was 1.4 per cent, compared to anoverall average of 3.7 per cent. In 1995, the numbers of unemployed in these categories were 2.5 per centand 1.3 per cent respectively, compared to an overall percentage of 3.4. However, as the labour market ispresently undergoing significant changes over a relatively short period of time, in that large numbers ofwell educated young people are entering the labour market, the situation is quickly becoming morecomplex, and is being followed closely by national authorities.
The Norwegian Institute for Studies in Research and Higher Education (NIFU) made its first survey of thesituation for university graduates on the labour market in 1972. For the past eleven years, such surveyshave been made on a yearly basis. Every second year, the surveys have dealt with the situation for variouscategories of university and college graduates 6 months after graduation, and in the years in between,there have been follow-up analyses of their work situation 2,5, or 10 years after graduation. This patternwas interrupted this year, as the 6-months-after 1995 survey was followed by a 6-months-after survey for1996 as well. Every year, all the graduates with a higher university degree (level 7, ISCED) are includedin the survey33, whereas the other categories of graduates may vary from one year to another.
The general trend of the 1995 survey was that fresh graduates were having a more difficult transitionperiod before integration into working life than they used to, despite the fact that the entire expansion ofthe labour market in the period 1993 to 1995 concerned jobs requiring a higher education background. In1995, 12 per cent of higher degree graduates were unemployed 6 months after graduation, as opposed to 9per cent in 1993, mostly because of the important increase in the number of graduates.
The six-months-after 1996 survey gives signs of better opportunities on the labour market for severalgroups of fresh graduates in 1996, and the overall percentage of unemployed 6 months after graduationwent down from 12 in 1995 to 10 in 1996. It should be noted, however, that another 10 percent report‘insufficient adaptation’ to the labour market, either because they are under-employed (i.e. involuntarypart-time) or because they consider that their job is irrelevant for their qualifications. The groups with thehighest decline in unemployment from 1995 to 1996 were graduates in business administration (downfrom 10 per cent in 1995 to 4 per cent in 1996) and in engineering (5-year degree, “sivilingeniør”). For thelatter, the overall percentage of unemployed went down from 17 in 1995 to 9 in 1996. Unemployment forgraduates in natural sciences went down from 11 per cent in 1995 to 9 per cent in 1996, and for graduatesin social sciences it went down from 13 to 9 per cent in the same period. In the humanities, unemployment
33In the 6-months-after surveys, the only exceptions to this are graduates in Medicine, which at that time willinvariably be doing their in-service training, and the Law graduates in the 1995 survey, of which there was made aselection of two thirds of the total population.
46
went up from 5 to 8 per cent from 1995 to 1996, which is not too bad considering that the number ofgraduates increased by 22 percent in the same period.
The 1996 survey shows that there are two groups of fresh graduates that seem to have important problemsof unemployment: First, architects - of which 27 per cent were unemployed in 1995 and 33 per cent in1996, with no increase in the number of graduates. Second, graduates in law, among which the number ofgraduates increased by 60 per cent from 1993 to 1995, and unemployment increased from 9 to 19 per cent.
5.3 Future aspects of the educational policy
Based on experience, the Ministry of Education, Research and Church Affairs has decided upon furthermeasures to encounter the problems of mismatch:
• The development of support material, giving methodological advice to teachers and school counsellorsregarding the integration of vocational guidance and learning activities from 8th grade of lowersecondary school to advanced course I at upper secondary school. Support material will also be handedout to pupils of upper secondary school in relation to their choice of vocational course and theapplication for apprenticeship. The main focus of the support material will be on the development ofyoung people’s knowledge and consciousness of the relationship between their own abilities and thedemands and availability of the labour market, as basis for making their own qualified decisionsregarding education and future work.
• The Ministry has also initiated actions to encounter problems of vocational guidance related to gender,ethnic background and differences of physical and mental abilities through the launching of the 3-year-project «Conscious Educational Choices». The project is aimed at gaining knowledge of effectivestrategies and models of educational and vocational guidance through carrying out action plans,followed by evaluation and dissemination of results. The project will be carried out in co-operationwith regional authorities.
• Of vital importance is also the securing of quality of updated electronically based guidance. TheMinistry has recently started the planning of a national data base providing educational and vocationalguidance on available apprenticeship places and jobs as well as educational and vocationalopportunities in upper secondary education for each county and the country as a whole. The socialpartners will be asked to contribute with information about the different trades. The measures are beingplanned in order to make the system of free flow of pupils and apprentices across county borders workmore sufficiently.
• The results of the research-based evaluation of Reform 94 will be presented in a white paper to theStorting in the spring of 1999.
In addition, the Ministry is about to implement 2 new reforms:
- Teachers’ education- Further and continuing education.
Time will show whether or not the different measures will contribute to a better transition from school toworking life.

47
5.4 Future aspects of the labour market policy
Even with continued increase in the employment the following years, it will still be necessary withtargeted efforts towards groups with a difficult situation in the labour market. As a consequence ofreduced unemployment, the number of places in labour market programmes will be reduced. In thissituation priority will be given to information, vocational guidance and placement. Labour marketprogrammes will mostly be used to qualify long-term unemployed, among them young people, forordinary work. An important issue will be the co-ordination between public agencies, so that persons whoneed assistance from more than one agency (among them young people) can receive co-ordinated support,in order to get access to the labour market or education and training opportunities.
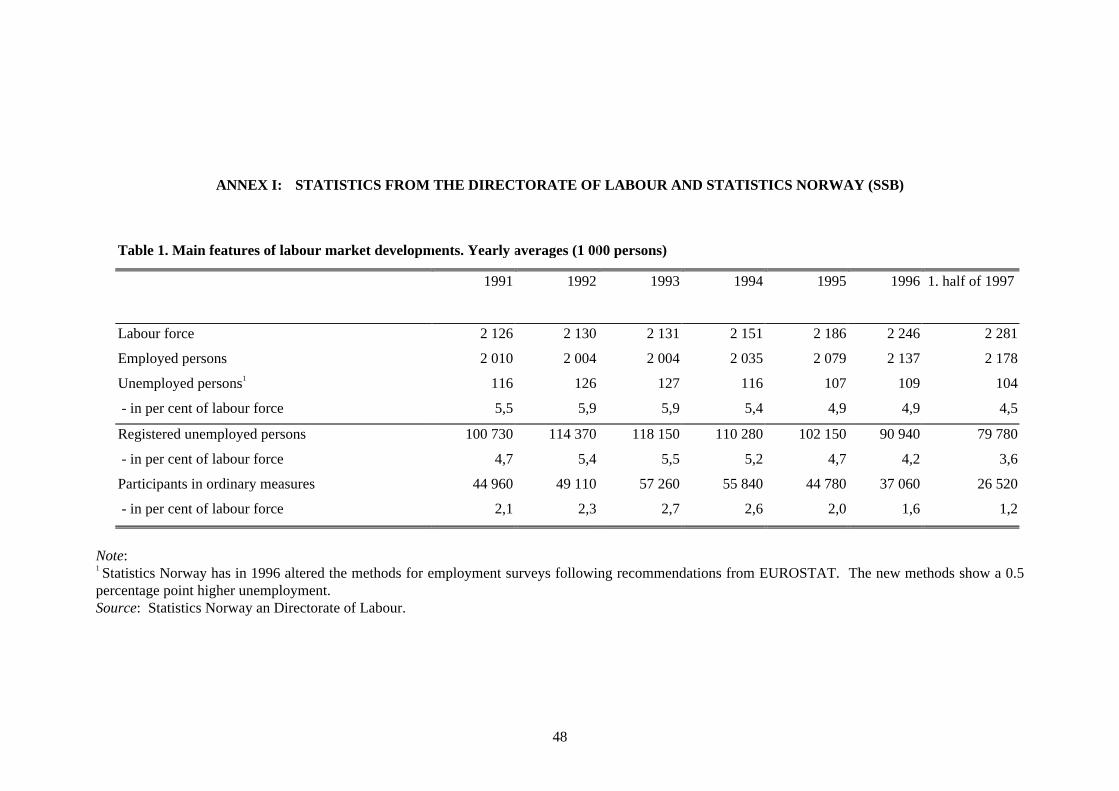
48
ANNEX I: STATISTICS FROM THE DIRECTORATE OF LABOUR AND STATISTICS NORWAY (SSB)
Table 1. Main features of labour market developments. Yearly averages (1 000 persons)
1991 1992 1993 1994 1995 1996 1. half of 1997
Labour force 2 126 2 130 2 131 2 151 2 186 2 246 2 281
Employed persons 2 010 2 004 2 004 2 035 2 079 2 137 2 178
Unemployed persons1 116 126 127 116 107 109 104
- in per cent of labour force 5,5 5,9 5,9 5,4 4,9 4,9 4,5
Registered unemployed persons 100 730 114 370 118 150 110 280 102 150 90 940 79 780
- in per cent of labour force 4,7 5,4 5,5 5,2 4,7 4,2 3,6
Participants in ordinary measures 44 960 49 110 57 260 55 840 44 780 37 060 26 520
- in per cent of labour force 2,1 2,3 2,7 2,6 2,0 1,6 1,2
Note:1 Statistics Norway has in 1996 altered the methods for employment surveys following recommendations from EUROSTAT. The new methods show a 0.5percentage point higher unemployment.Source: Statistics Norway an Directorate of Labour.
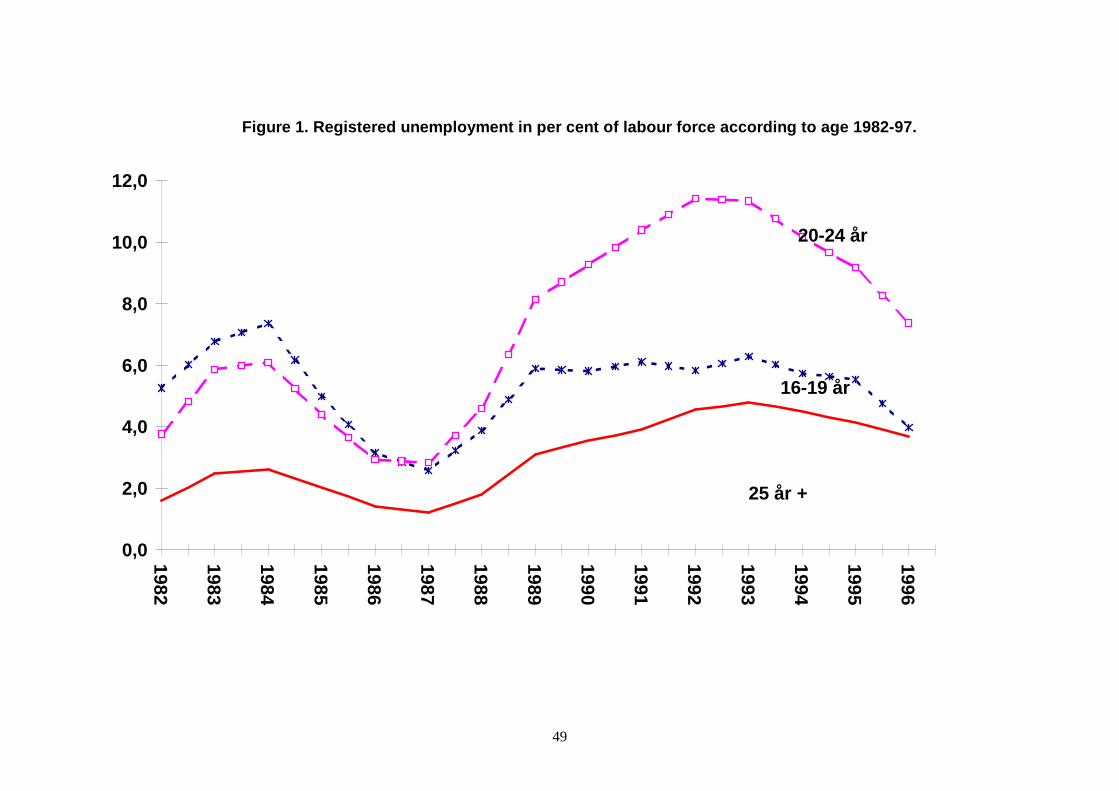
49
Figure 1. Registered unemployment in per cent of labour force according to age 1982-97.
0,0
2,0
4,0
6,0
8,0
10,0
12,0
1982
1983
1984
1985
1986
1987
1988
1989
1990
1991
1992
1993
1994
1995
1996
25 år +
20-24 år
16-19 år
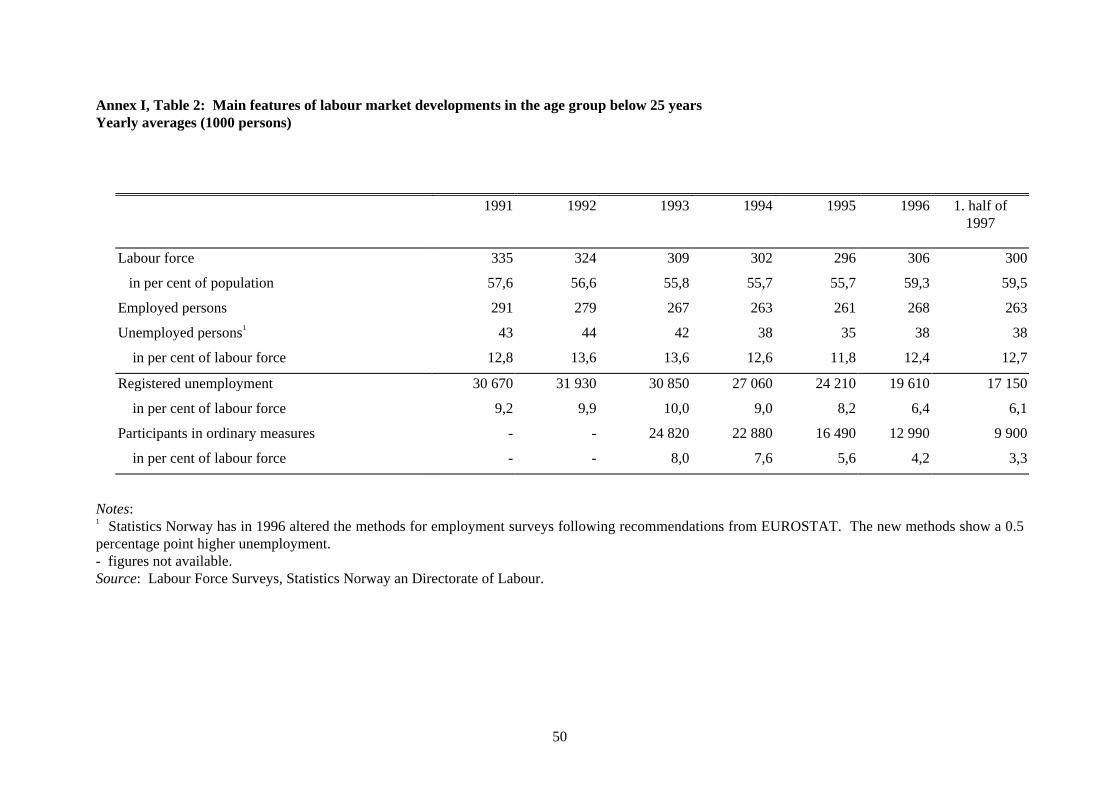
50
Annex I, Table 2: Main features of labour market developments in the age group below 25 yearsYearly averages (1000 persons)
1991 1992 1993 1994 1995 1996 1. half of1997
Labour force 335 324 309 302 296 306 300
in per cent of population 57,6 56,6 55,8 55,7 55,7 59,3 59,5
Employed persons 291 279 267 263 261 268 263
Unemployed persons1 43 44 42 38 35 38 38
in per cent of labour force 12,8 13,6 13,6 12,6 11,8 12,4 12,7
Registered unemployment 30 670 31 930 30 850 27 060 24 210 19 610 17 150
in per cent of labour force 9,2 9,9 10,0 9,0 8,2 6,4 6,1
Participants in ordinary measures - - 24 820 22 880 16 490 12 990 9 900
in per cent of labour force - - 8,0 7,6 5,6 4,2 3,3
Notes:1 Statistics Norway has in 1996 altered the methods for employment surveys following recommendations from EUROSTAT. The new methods show a 0.5percentage point higher unemployment.- figures not available.Source: Labour Force Surveys, Statistics Norway an Directorate of Labour.
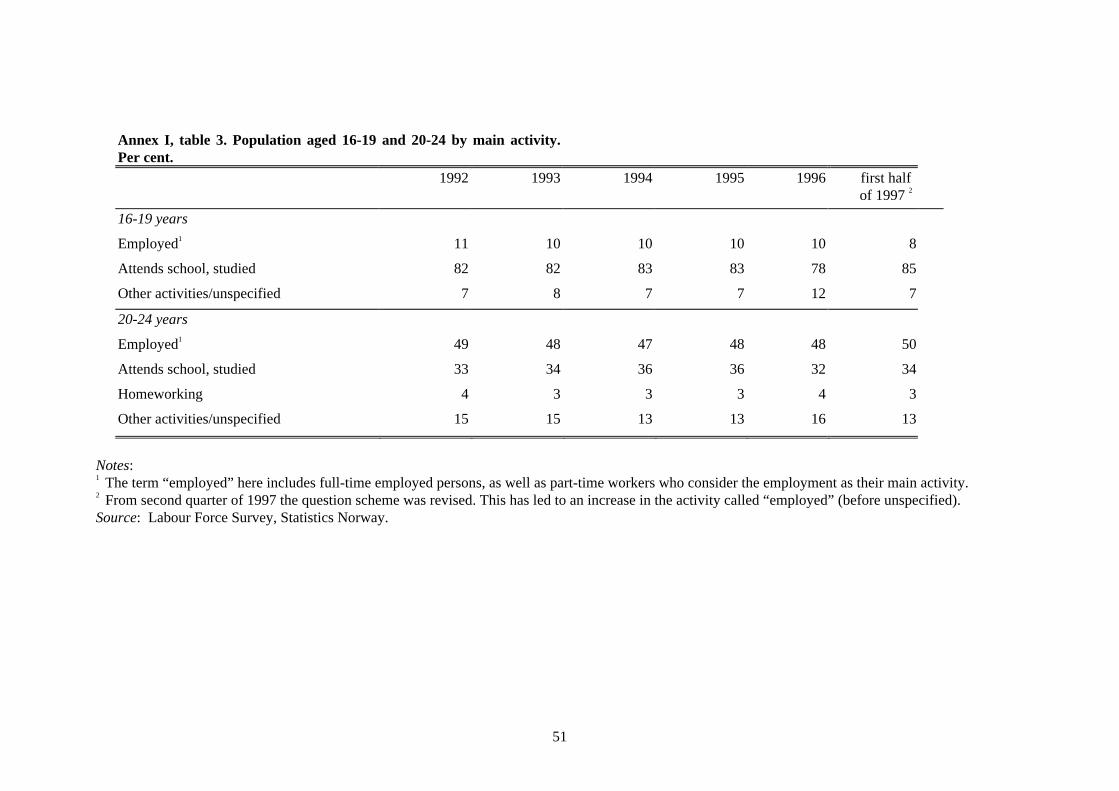
51
Annex I, table 3. Population aged 16-19 and 20-24 by main activity.Per cent.
1992 1993 1994 1995 1996 first halfof 19972
16-19 years
Employed1 11 10 10 10 10 8
Attends school, studied 82 82 83 83 78 85
Other activities/unspecified 7 8 7 7 12 7
20-24 years
Employed1 49 48 47 48 48 50
Attends school, studied 33 34 36 36 32 34
Homeworking 4 3 3 3 4 3
Other activities/unspecified 15 15 13 13 16 13
Notes:1 The term “employed” here includes full-time employed persons, as well as part-time workers who consider the employment as their main activity.2 From second quarter of 1997 the question scheme was revised. This has led to an increase in the activity called “employed” (before unspecified).Source: Labour Force Survey, Statistics Norway.
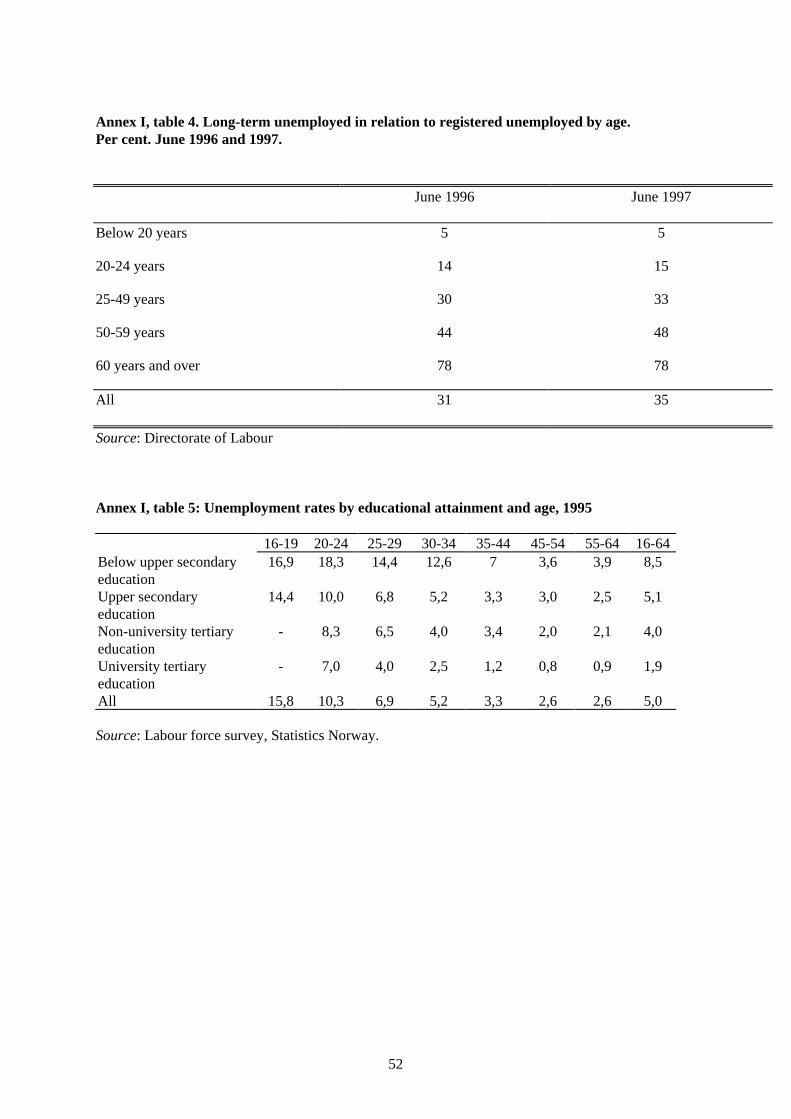
52
Annex I, table 4. Long-term unemployed in relation to registered unemployed by age.Per cent. June 1996 and 1997.
June 1996 June 1997
Below 20 years 5 5
20-24 years 14 15
25-49 years 30 33
50-59 years 44 48
60 years and over 78 78
All 31 35
Source: Directorate of Labour
Annex I, table 5: Unemployment rates by educational attainment and age, 1995
16-19 20-24 25-29 30-34 35-44 45-54 55-64 16-64Below upper secondaryeducation
16,9 18,3 14,4 12,6 7 3,6 3,9 8,5
Upper secondaryeducation
14,4 10,0 6,8 5,2 3,3 3,0 2,5 5,1
Non-university tertiaryeducation
- 8,3 6,5 4,0 3,4 2,0 2,1 4,0
University tertiaryeducation
- 7,0 4,0 2,5 1,2 0,8 0,9 1,9
All 15,8 10,3 6,9 5,2 3,3 2,6 2,6 5,0
Source: Labour force survey, Statistics Norway.
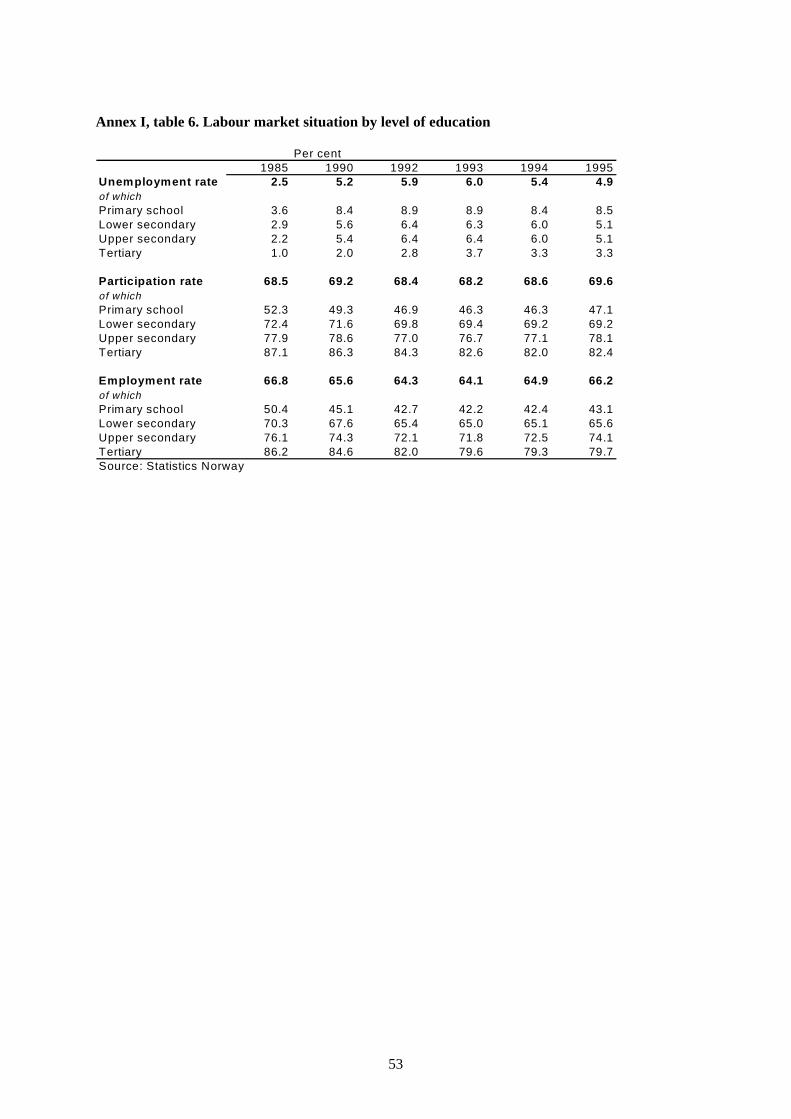
53
Annex I, table 6. Labour market situation by level of education
Per cent1985 1990 1992 1993 1994 1995
Unemployment rate 2.5 5.2 5.9 6.0 5.4 4.9of whichPrim ary school 3.6 8.4 8.9 8.9 8.4 8.5Lower secondary 2.9 5.6 6.4 6.3 6.0 5.1Upper secondary 2.2 5.4 6.4 6.4 6.0 5.1Tertiary 1.0 2.0 2.8 3.7 3.3 3.3
Participation rate 68.5 69.2 68.4 68.2 68.6 69.6of whichPrim ary school 52.3 49.3 46.9 46.3 46.3 47.1Lower secondary 72.4 71.6 69.8 69.4 69.2 69.2Upper secondary 77.9 78.6 77.0 76.7 77.1 78.1Tertiary 87.1 86.3 84.3 82.6 82.0 82.4
Employment rate 66.8 65.6 64.3 64.1 64.9 66.2of whichPrim ary school 50.4 45.1 42.7 42.2 42.4 43.1Lower secondary 70.3 67.6 65.4 65.0 65.1 65.6Upper secondary 76.1 74.3 72.1 71.8 72.5 74.1Tertiary 86.2 84.6 82.0 79.6 79.3 79.7Source: Statistics Norway
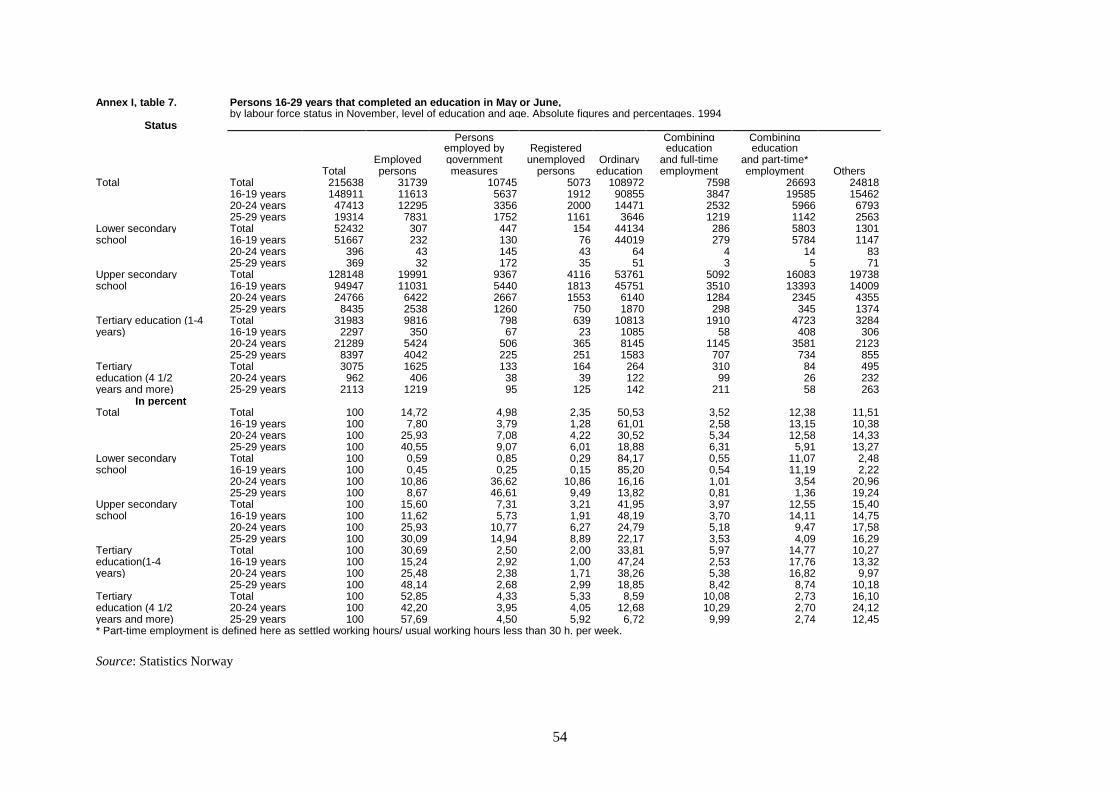
54
Annex I , table 7. Persons 16-29 years that com pleted an education in Ma y or June ,by labour force status in November, level of education and age. Absolute figures and percentages. 1994
StatusPersons Combining Combining
employed by Registered education educationEmployed government unemployed Ordinary and full-time and part-time*
Total persons measures persons education employment employment OthersTotal Total 215638 31739 10745 5073 108972 7598 26693 24818
16-19 years 148911 11613 5637 1912 90855 3847 19585 1546220-24 years 47413 12295 3356 2000 14471 2532 5966 679325-29 years 19314 7831 1752 1161 3646 1219 1142 2563
Lower secondary Total 52432 307 447 154 44134 286 5803 1301school 16-19 years 51667 232 130 76 44019 279 5784 1147
20-24 years 396 43 145 43 64 4 14 8325-29 years 369 32 172 35 51 3 5 71
Upper secondary Total 128148 19991 9367 4116 53761 5092 16083 19738school 16-19 years 94947 11031 5440 1813 45751 3510 13393 14009
20-24 years 24766 6422 2667 1553 6140 1284 2345 435525-29 years 8435 2538 1260 750 1870 298 345 1374
Tertiary education (1-4 Total 31983 9816 798 639 10813 1910 4723 3284years) 16-19 years 2297 350 67 23 1085 58 408 306
20-24 years 21289 5424 506 365 8145 1145 3581 212325-29 years 8397 4042 225 251 1583 707 734 855
Tertiary Total 3075 1625 133 164 264 310 84 495education (4 1/2 20-24 years 962 406 38 39 122 99 26 232years and more) 25-29 years 2113 1219 95 125 142 211 58 263
In percentTotal Total 100 14,72 4,98 2,35 50,53 3,52 12,38 11,51
16-19 years 100 7,80 3,79 1,28 61,01 2,58 13,15 10,3820-24 years 100 25,93 7,08 4,22 30,52 5,34 12,58 14,3325-29 years 100 40,55 9,07 6,01 18,88 6,31 5,91 13,27
Lower secondary Total 100 0,59 0,85 0,29 84,17 0,55 11,07 2,48school 16-19 years 100 0,45 0,25 0,15 85,20 0,54 11,19 2,22
20-24 years 100 10,86 36,62 10,86 16,16 1,01 3,54 20,9625-29 years 100 8,67 46,61 9,49 13,82 0,81 1,36 19,24
Upper secondary Total 100 15,60 7,31 3,21 41,95 3,97 12,55 15,40school 16-19 years 100 11,62 5,73 1,91 48,19 3,70 14,11 14,75
20-24 years 100 25,93 10,77 6,27 24,79 5,18 9,47 17,5825-29 years 100 30,09 14,94 8,89 22,17 3,53 4,09 16,29
Tertiary Total 100 30,69 2,50 2,00 33,81 5,97 14,77 10,27education(1-4 16-19 years 100 15,24 2,92 1,00 47,24 2,53 17,76 13,32years) 20-24 years 100 25,48 2,38 1,71 38,26 5,38 16,82 9,97
25-29 years 100 48,14 2,68 2,99 18,85 8,42 8,74 10,18Tertiary Total 100 52,85 4,33 5,33 8,59 10,08 2,73 16,10education (4 1/2 20-24 years 100 42,20 3,95 4,05 12,68 10,29 2,70 24,12years and more) 25-29 years 100 57,69 4,50 5,92 6,72 9,99 2,74 12,45* Part-time employment is defined here as settled working hours/ usual working hours less than 30 h. per week.
Source: Statistics Norway
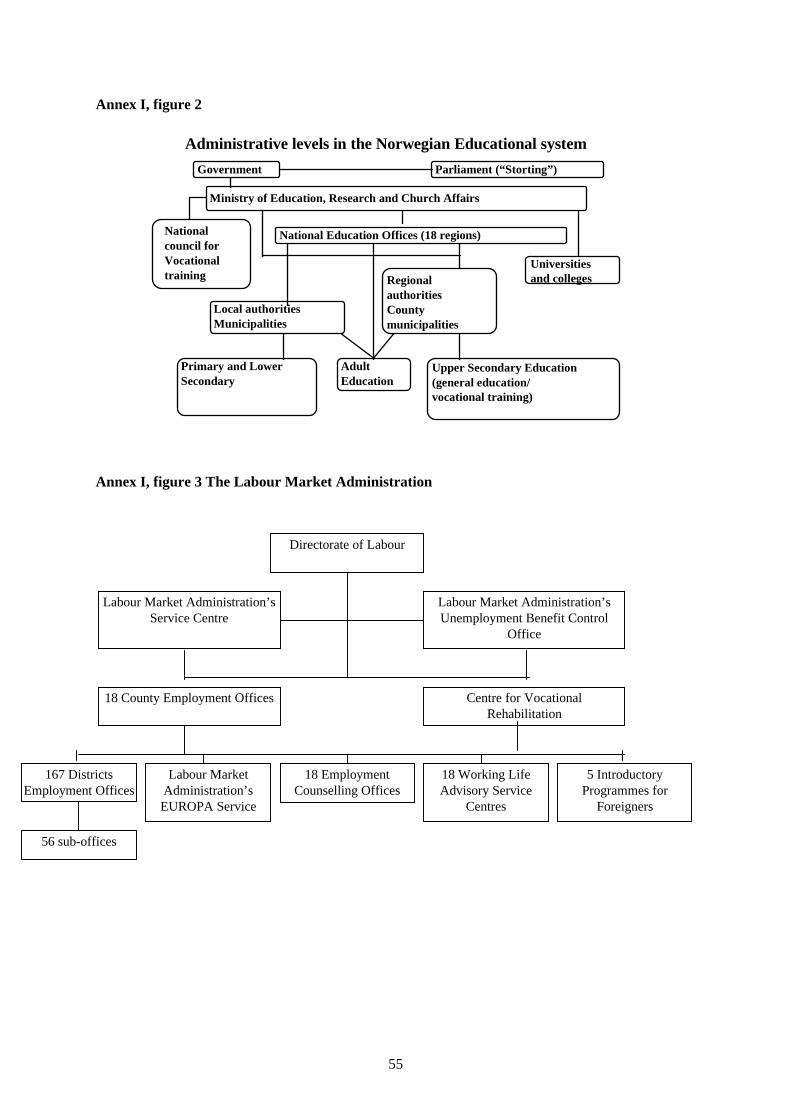
55
Annex I, figure 2
Administrative levels in the Norwegian Educational system
Government Parliament (“Storting”)
Ministry of Education, Research and Church Affairs
Nationalcouncil forVocationaltraining
National Education Offices (18 regions)
Universitiesand collegesRegional
authoritiesCountymunicipalities
Local authoritiesMunicipalities
Primary and LowerSecondary
AdultEducation
Upper Secondary Education(general education/vocational training)
Annex I, figure 3 The Labour Market Administration
Directorate of Labour
Labour Market Administration’sService Centre
Labour Market Administration’sUnemployment Benefit Control
Office
18 County Employment Offices Centre for VocationalRehabilitation
167 DistrictsEmployment Offices
Labour MarketAdministration’sEUROPA Service
18 EmploymentCounselling Offices
18 Working LifeAdvisory Service
Centres
5 IntroductoryProgrammes for
Foreigners
56 sub-offices
56
ANNEX I, APPENDIX I: THE DIFFERENT LEVELS OF THE EDUCATIONAL SYSTEM
The administration of the education system is divided into three levels:
• National level• County level• Municipal level
National level
The Ministry of Education, Research and Church Affairs has overall responsibility for the wholeeducation sector: primary, secondary and higher education, as well as adult education and training.The Ministry administers the institutions of higher education and research directly. Various otherministries, however, are responsible for measures relating to education and training. These areprimarily the Ministry of Local Government and Labour, which is responsible for employmentpolicy, regional policy and immigration policy, and the Ministry of Industry and Trade, which isresponsible for the industrial policy.
As a result of reorganisation of national education authorities in the early 1990s, 18 NationalEducation Offices were established. The National Education Offices are attached to the Ministry ofEducation. The head of the office, a Director of Education, is the state representative at county leveland is responsible for carrying out government tasks within the different fields of education. Theareas of responsibility cover primary and secondary education, as well as vocational training, but nothigher education. The main tasks are activity reports, information dissemination and, to a certainextent, legal supervision.
Decentralisation of decision-making has been a general trend in Norwegian education since the late1980s. A major step in the direction of decentralisation was made by the introduction of a new sectorgrant system in 1986, in which municipality and county authorities receive a lump sum covering allcentral government subsidies for school education and culture as well as the health service andtransport. As a consequence, the municipalities and counties now enjoy greater autonomy as regardsthe provision of education.
There has also been delegation of power of decision-making to the higher education institutions -first to the universities and university colleges through a 1989 Act concerning these institutions, andto the rest of the higher education institutions through the 1995 Universities and Colleges Act.
County level
The county municipalities are responsible for upper secondary education - for the running of theschools, the intake of pupils, and apprentices and the appointment of teachers. Reform 94 bringstogether education at school and training in enterprises into a combined education system. As theowners of the schools, the counties currently have full responsibility for 535 upper secondary schoolsand for apprenticeship measures i.e., for vocational training in the workplace. The educationauthorities in the counties administer both the upper secondary schools and the apprenticeship
57
measures. As advisory bodies on vocational training, the counties have vocational trainingcommittees on which the social partners are in the majority.
The county has a duty to provide places for all the pupils with a right to vocational training.
The enterprise decides whether to accept the apprentice whose name is submitted by the vocationaltraining committee. When it has accepted an apprentice, an apprenticeship contract has to be drawnup and sent to the vocational training committee for approval and registration
Municipal level
The municipalities are responsible for education at the primary and lower secondary level. They areresponsible for running the primary and lower secondary schools, for compulsory education, for thebuilding and maintenance of school buildings, and for appointment of teachers. There are currently3,208 primary and lower secondary schools. The municipal schools are responsible for the provisionof guidance concerning working life and the choice of training and careers.
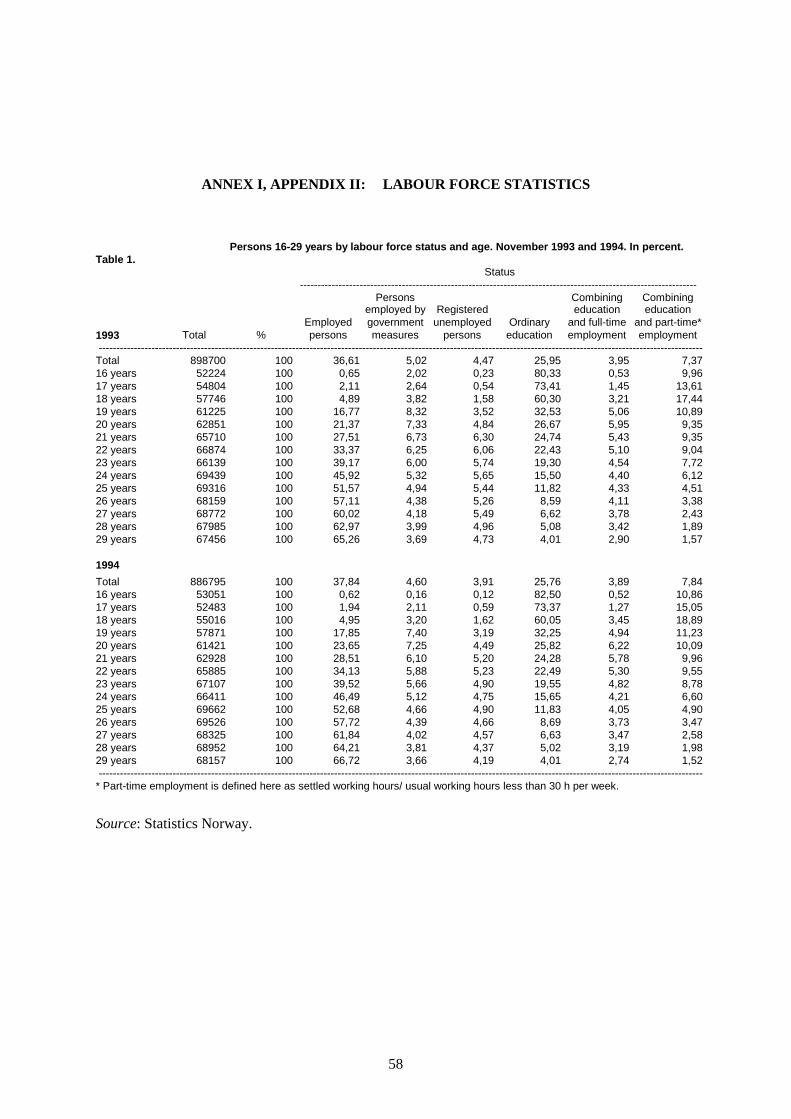
58
ANNEX I, APPENDIX II: LABOUR FORCE STATISTICS
Table 1.Persons 16-29 years by labour force status and age. November 1993 and 1994. In percent.
Status-----------------------------------------------------------------------------------------------------------------
Persons Combining Combiningemployed by Registered education education
Employed government unemployed Ordinary and full-time and part-time*1993 Total % persons measures persons education employment employment----------------------------------------------------------------------------------------------------------------------------------------------------------------------------
Total 898700 100 36,61 5,02 4,47 25,95 3,95 7,3716 years 52224 100 0,65 2,02 0,23 80,33 0,53 9,9617 years 54804 100 2,11 2,64 0,54 73,41 1,45 13,6118 years 57746 100 4,89 3,82 1,58 60,30 3,21 17,4419 years 61225 100 16,77 8,32 3,52 32,53 5,06 10,8920 years 62851 100 21,37 7,33 4,84 26,67 5,95 9,3521 years 65710 100 27,51 6,73 6,30 24,74 5,43 9,3522 years 66874 100 33,37 6,25 6,06 22,43 5,10 9,0423 years 66139 100 39,17 6,00 5,74 19,30 4,54 7,7224 years 69439 100 45,92 5,32 5,65 15,50 4,40 6,1225 years 69316 100 51,57 4,94 5,44 11,82 4,33 4,5126 years 68159 100 57,11 4,38 5,26 8,59 4,11 3,3827 years 68772 100 60,02 4,18 5,49 6,62 3,78 2,4328 years 67985 100 62,97 3,99 4,96 5,08 3,42 1,8929 years 67456 100 65,26 3,69 4,73 4,01 2,90 1,57
1994
Total 886795 100 37,84 4,60 3,91 25,76 3,89 7,8416 years 53051 100 0,62 0,16 0,12 82,50 0,52 10,8617 years 52483 100 1,94 2,11 0,59 73,37 1,27 15,0518 years 55016 100 4,95 3,20 1,62 60,05 3,45 18,8919 years 57871 100 17,85 7,40 3,19 32,25 4,94 11,2320 years 61421 100 23,65 7,25 4,49 25,82 6,22 10,0921 years 62928 100 28,51 6,10 5,20 24,28 5,78 9,9622 years 65885 100 34,13 5,88 5,23 22,49 5,30 9,5523 years 67107 100 39,52 5,66 4,90 19,55 4,82 8,7824 years 66411 100 46,49 5,12 4,75 15,65 4,21 6,6025 years 69662 100 52,68 4,66 4,90 11,83 4,05 4,9026 years 69526 100 57,72 4,39 4,66 8,69 3,73 3,4727 years 68325 100 61,84 4,02 4,57 6,63 3,47 2,5828 years 68952 100 64,21 3,81 4,37 5,02 3,19 1,9829 years 68157 100 66,72 3,66 4,19 4,01 2,74 1,52----------------------------------------------------------------------------------------------------------------------------------------------------------------------------
* Part-time employment is defined here as settled working hours/ usual working hours less than 30 h per week.
Source: Statistics Norway.
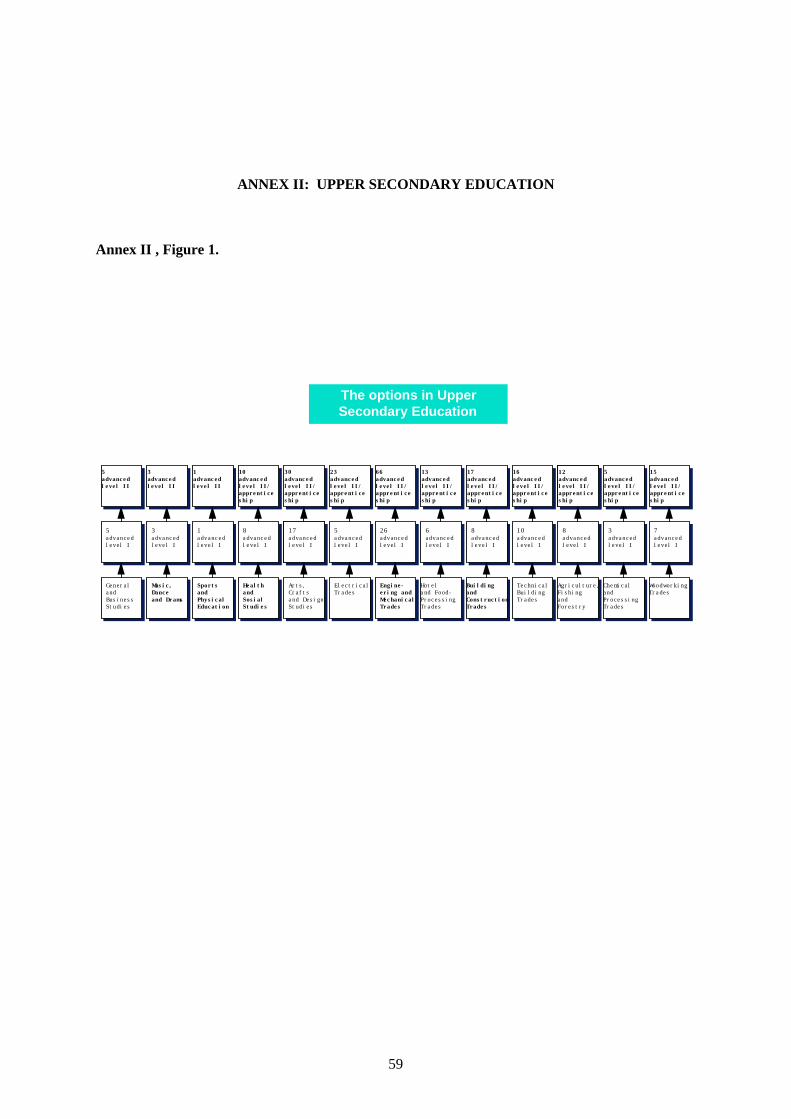
59
ANNEX II: UPPER SECONDARY EDUCATION
Annex II , Figure 1.
The options in UpperSecondary Education
5advancedl evel I I
3advancedl evel I I
1advancedl evel II
10advancedl evel I I /apprent i ceshi p
23advancedl evel I I /apprent i ceshi p
66advancedl evel I I /apprent i ceshi p
30advancedl evel I I /apprent i ceshi p
13advancedl evel I I /apprent i ceshi p
17advancedl evel I I /apprent i ceshi p
16advancedl evel I I /apprent i ceshi p
10advancedl evel I Iapprent i ceshi p
12advancedl evel I I /apprent i ceshi p
5advancedl evel I I /apprent i ceshi p
15advancedl evel I I /apprent i ceshi p
5advanc edl evel I
3advanc edl evel I
8advanc edl evel I
1advanc edl evel I
17advanc edl evel I
5advanc edl evel I
26advanc edl evel I
6advanc edl evel I
8advanc edl evel I
10advanc edl evel I
8advanc edl evel I
3advanc edl evel I
7advanc edl evel I
Gener alandBus i nessSt udi es
Musi c,Danceand Drams
Sport sandPhysi calEducat i on
Heal t handSosi alSt udi es
Ar t s ,Cr af t sand Desi gnSt udi es
El ec t r i c alTr ades
Engi ne-eri ng andMechani calTrades
Hot eland Food-Proc es s i ngTrades
Bui l di ngandConst ruct i onTrades
Tec hni c alBui l di ngTr ades
Agr i c ul t ur e,Fi shi ngandFor es t r y
Chemi c alandPr oces si ngTr ades
Woodwor ki ngTr ades
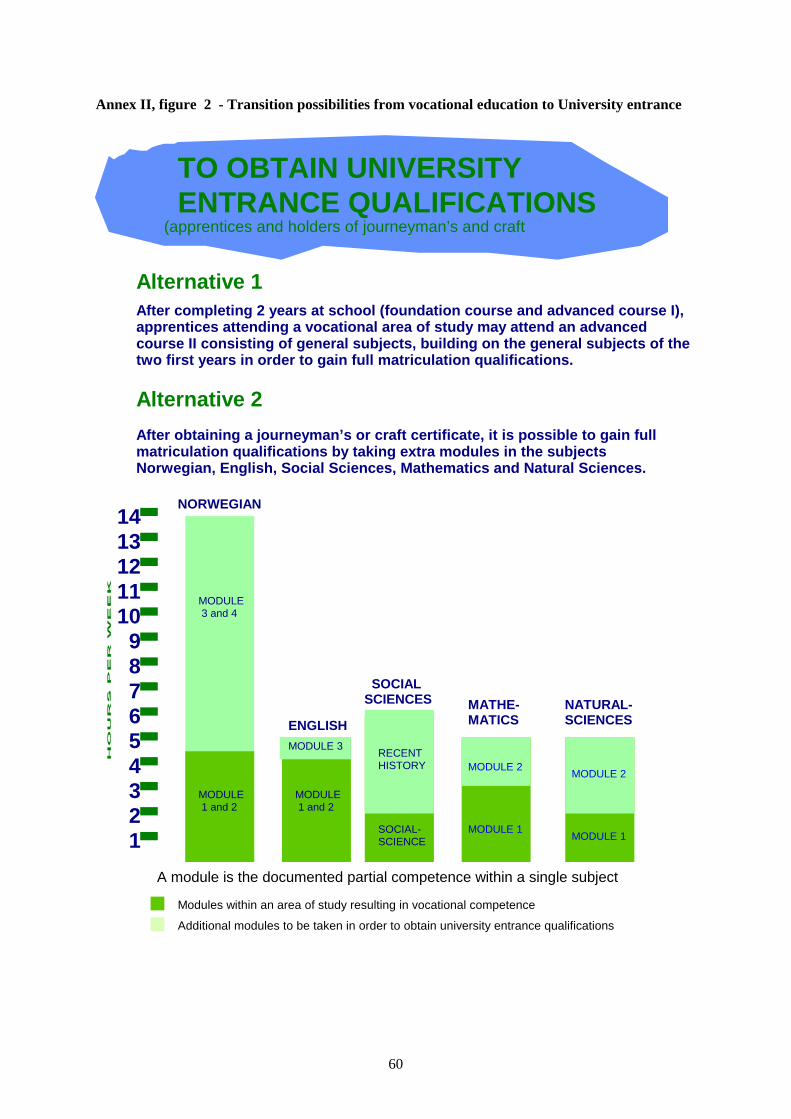
60
Annex II, figure 2 - Transition possibilities from vocational education to University entrance
Alternative 1
Alternative 2
After completing 2 years at school (foundation course and advanced course I),apprentices attending a vocational area of study may attend an advancedcourse II consisting of general subjects, building on the general subjects of thetwo first years in order to gain full matriculation qualifications.
After obtaining a journeyman’s or craft certificate, it is possible to gain fullmatriculation qualifications by taking extra modules in the subjectsNorwegian, English, Social Sciences, Mathematics and Natural Sciences.
----------------------------
1413121110
987654321
NORWEGIAN
ENGLISH
SOCIALSCIENCES MATHE-
MATICSNATURAL-SCIENCES
MODULE3 and 4
MODULE1 and 2
MODULE 3
MODULE1 and 2
RECENTHISTORY
SOCIAL-SCIENCE
MODULE 2
MODULE 1
MODULE 2
MODULE 1
--------------A module is the documented partial competence within a single subject
Modules within an area of study resulting in vocational competence
Additional modules to be taken in order to obtain university entrance qualifications
TO OBTAIN UNIVERSITYENTRANCE QUALIFICATIONS
(apprentices and holders of journeyman’s and craft
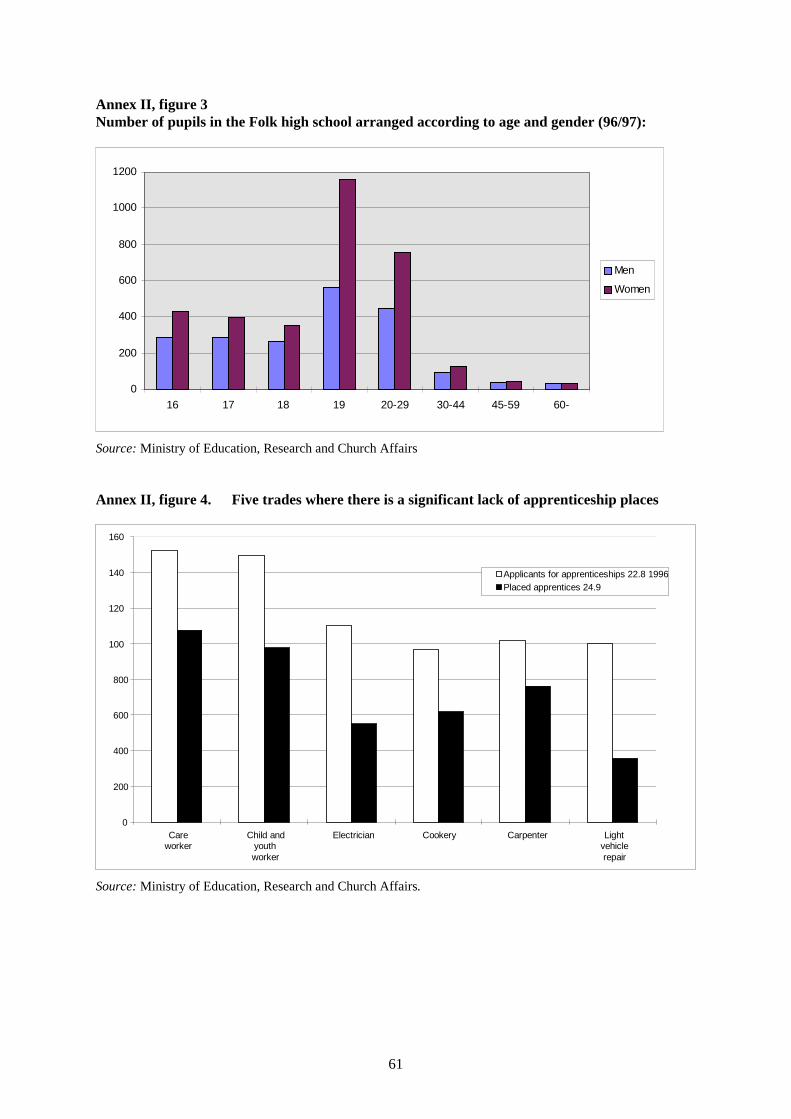
61
Annex II, figure 3Number of pupils in the Folk high school arranged according to age and gender (96/97):
0
200
400
600
800
1000
1200
16 17 18 19 20-29 30-44 45-59 60-
Men
Women
Source:Ministry of Education, Research and Church Affairs
Annex II, figure 4. Five trades where there is a significant lack of apprenticeship places
0
200
400
600
800
100
120
140
160
Careworker
Child andyouthworker
Electrician Cookery Carpenter Lightvehiclerepair
Applicants for apprenticeships 22.8 1996Placed apprentices 24.9
Source:Ministry of Education, Research and Church Affairs.

62
Ministry of Education, Research and Church Affairs - Evaluation of Reform 94 - Research Institutions
Annex II, table 1
“The integrated human being”The spiritual humanbeing
The creative humanbeing
The working humanbeing
The liberally-educatedhuman being
The social human being The environmentallyaware human being
• Familiarity withChristian andhumanistic values
• Awareness of culturalheritage, identity
and local traditions• Meet other cultures
openly• Respect for and
knowledge of otherreligions and faiths
• Develop creativeabilities and criticalsense
• Find new solutions toproblems
• Scientific thinking andmethods:
-The ability to wonder, topose new questions, toinvent possibleexplanations and to testone’s explanations
• Learning and workhabits
• learning to learn• responsibility for own
learning• plan and organise own
work and learningprocess
• A sound foundation ofknowledge and broadframes of reference
• The ability to organiseknowledge
• Methodological skills• Respect for facts and
sound argument• Familiarity in using
information technology• Internationalisation and
appreciation of tradition• The ability to acquire
and attain newknowledge
• entrepreneurial skills
• Trust in own abilities• Communication abilities• Co-operation, team-
work• Solving conflicts• Social responsibility• Concern for others• Know rights and duties• Take responsibility• Develop independent
and autonomouspersonality
• Joy of nature andphysical activity
• Awareness ofnature
• Awareness ofenvironment andconflicts of interest
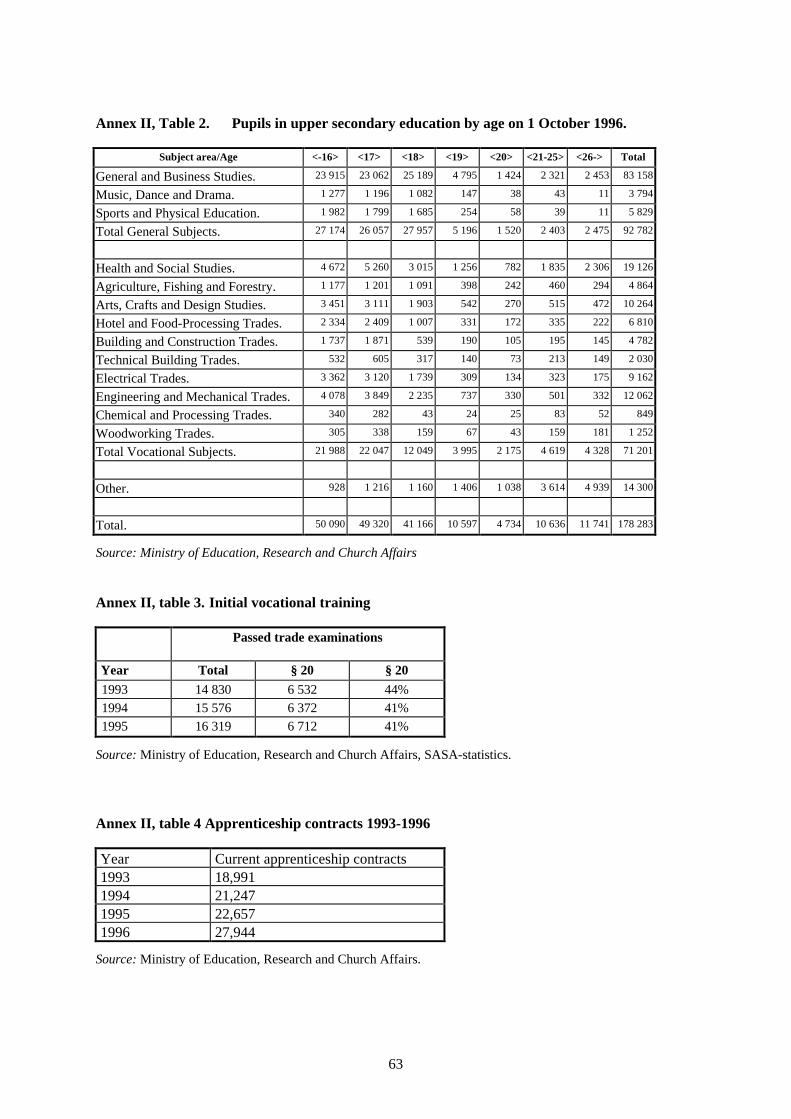
63
Annex II, Table 2. Pupils in upper secondary education by age on 1 October 1996.
Subject area/Age <-16> <17> <18> <19> <20> <21-25> <26-> Total
General and Business Studies. 23 915 23 062 25 189 4 795 1 424 2 321 2 453 83 158
Music, Dance and Drama. 1 277 1 196 1 082 147 38 43 11 3 794
Sports and Physical Education. 1 982 1 799 1 685 254 58 39 11 5 829
Total General Subjects. 27 174 26 057 27 957 5 196 1 520 2 403 2 475 92 782
Health and Social Studies. 4 672 5 260 3 015 1 256 782 1 835 2 306 19 126
Agriculture, Fishing and Forestry. 1 177 1 201 1 091 398 242 460 294 4 864
Arts, Crafts and Design Studies. 3 451 3 111 1 903 542 270 515 472 10 264
Hotel and Food-Processing Trades. 2 334 2 409 1 007 331 172 335 222 6 810
Building and Construction Trades. 1 737 1 871 539 190 105 195 145 4 782
Technical Building Trades. 532 605 317 140 73 213 149 2 030
Electrical Trades. 3 362 3 120 1 739 309 134 323 175 9 162
Engineering and Mechanical Trades. 4 078 3 849 2 235 737 330 501 332 12 062
Chemical and Processing Trades. 340 282 43 24 25 83 52 849
Woodworking Trades. 305 338 159 67 43 159 181 1 252
Total Vocational Subjects. 21 988 22 047 12 049 3 995 2 175 4 619 4 328 71 201
Other. 928 1 216 1 160 1 406 1 038 3 614 4 939 14 300
Total. 50 090 49 320 41 166 10 597 4 734 10 636 11 741 178 283
Source: Ministry of Education, Research and Church Affairs
Annex II, table 3. Initial vocational training
Passed trade examinations
Year Total § 20 § 20
1993 14 830 6 532 44%1994 15 576 6 372 41%1995 16 319 6 712 41%
Source:Ministry of Education, Research and Church Affairs, SASA-statistics.
Annex II, table 4 Apprenticeship contracts 1993-1996
Year Current apprenticeship contracts1993 18,9911994 21,2471995 22,6571996 27,944
Source:Ministry of Education, Research and Church Affairs.
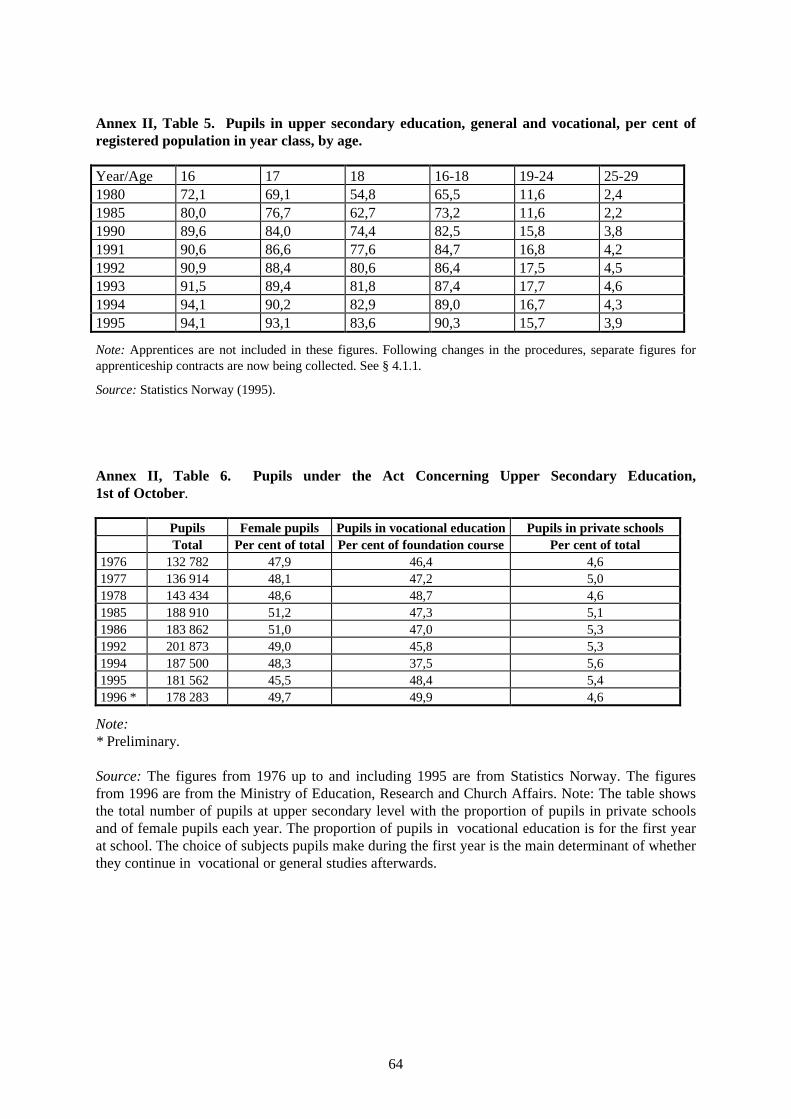
64
Annex II, Table 5. Pupils in upper secondary education, general and vocational, per cent ofregistered population in year class, by age.
Year/Age 16 17 18 16-18 19-24 25-291980 72,1 69,1 54,8 65,5 11,6 2,41985 80,0 76,7 62,7 73,2 11,6 2,21990 89,6 84,0 74,4 82,5 15,8 3,81991 90,6 86,6 77,6 84,7 16,8 4,21992 90,9 88,4 80,6 86,4 17,5 4,51993 91,5 89,4 81,8 87,4 17,7 4,61994 94,1 90,2 82,9 89,0 16,7 4,31995 94,1 93,1 83,6 90,3 15,7 3,9
Note: Apprentices are not included in these figures. Following changes in the procedures, separate figures forapprenticeship contracts are now being collected. See § 4.1.1.
Source:Statistics Norway (1995).
Annex II, Table 6. Pupils under the Act Concerning Upper Secondary Education,1st of October.
Pupils Female pupils Pupils in vocational education Pupils in private schoolsTotal Per cent of total Per cent of foundation course Per cent of total
1976 132 782 47,9 46,4 4,61977 136 914 48,1 47,2 5,01978 143 434 48,6 48,7 4,61985 188 910 51,2 47,3 5,11986 183 862 51,0 47,0 5,31992 201 873 49,0 45,8 5,31994 187 500 48,3 37,5 5,61995 181 562 45,5 48,4 5,41996 * 178 283 49,7 49,9 4,6
Note:* Preliminary.
Source:The figures from 1976 up to and including 1995 are from Statistics Norway. The figuresfrom 1996 are from the Ministry of Education, Research and Church Affairs. Note: The table showsthe total number of pupils at upper secondary level with the proportion of pupils in private schoolsand of female pupils each year. The proportion of pupils in vocational education is for the first yearat school. The choice of subjects pupils make during the first year is the main determinant of whetherthey continue in vocational or general studies afterwards.
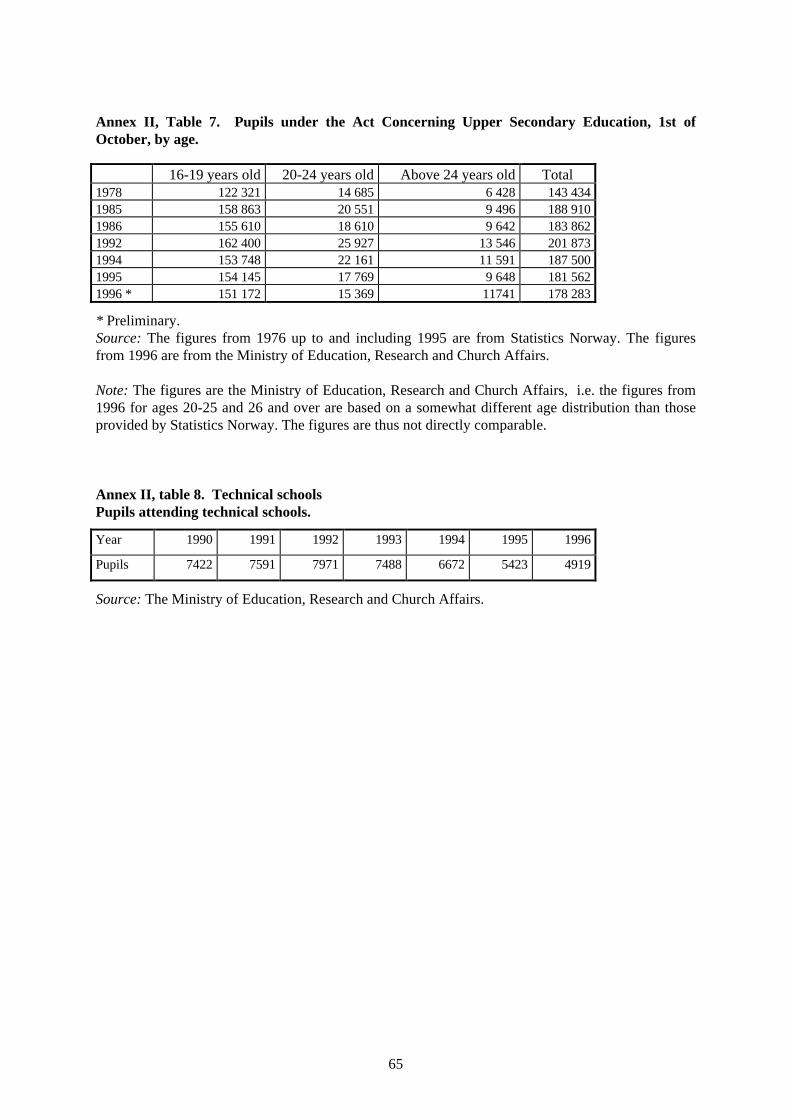
65
Annex II, Table 7. Pupils under the Act Concerning Upper Secondary Education, 1st ofOctober, by age.
16-19 years old 20-24 years old Above 24 years old Total1978 122 321 14 685 6 428 143 4341985 158 863 20 551 9 496 188 9101986 155 610 18 610 9 642 183 8621992 162 400 25 927 13 546 201 8731994 153 748 22 161 11 591 187 5001995 154 145 17 769 9 648 181 5621996 * 151 172 15 369 11741 178 283
* Preliminary.Source:The figures from 1976 up to and including 1995 are from Statistics Norway. The figuresfrom 1996 are from the Ministry of Education, Research and Church Affairs.
Note: The figures are the Ministry of Education, Research and Church Affairs, i.e. the figures from1996 for ages 20-25 and 26 and over are based on a somewhat different age distribution than thoseprovided by Statistics Norway. The figures are thus not directly comparable.
Annex II, table 8. Technical schoolsPupils attending technical schools.
Year 1990 1991 1992 1993 1994 1995 1996
Pupils 7422 7591 7971 7488 6672 5423 4919
Source:The Ministry of Education, Research and Church Affairs.
66
Annex II, table 9.
1. Norwegian Institute for Studies in Research and Higher Education
Its main task is to study through-flow and qualifications, mainly of the first pupils (cohort) from theirstart at Foundation Course, to Advanced Course I and Advanced Course II/Workplace level.
The institute is also concerned with applicants with Norwegian as their second language.
2. Lillehammer College
Lillehammer College evaluates the curriculum and the support system that exists in connection withthe reform.
3. Work Research Institute
This project concerns organisation and co-operation between different educational authorities at alllevels.
4. Multidiciplinary Group for the Study of Work and Society - University of Bergen
This group regards the organisation of the vocational training and the content of the vocationaleducation.
5. Møre Research
Møre Research pay especially attention to applicants with recognised need for special education.
6. Norwegian Institute of Adult Education
The educational reform is first and foremost a reform for pupils aged 16 -19 years. Despite this, theMinistry is concerned about the situation for older applicants for education.
7. FAFO- Institute for Applied Social Science
FAFO focuses the following-up service.
67
ANNEX II, APPENDIX I: MAIN AGENCIES DEALING WITH VOCATIONALTRAINING AT UPPER SECONDARY LEVEL
Because vocational training is of essential importance for the working community, concerningworking conditions, productivity and profitability, the employers’ and employees’ organisations haveconsiderable influence on vocational training at the upper secondary level. They have representativesin many of the agencies involved, such as the National Council for Vocational Training (RFA), thetraining councils(OR), the vocational training committees and the examination boards.
National Council for Vocational Training
The National Council for Vocational Training (RFA) was set up in 1981 upon the implementation ofthe vocational training act. It had both administrative and advisory functions. With Reform 94, thecouncil became a purely advisory body to the ministry on the major questions related to vocationaltraining. The administrative tasks were subsumed into the ministry and the vocational adviceconcerning individual trades for the most part now goes directly between the training councils andthe ministry. The secretariat functions of the RFA are taken care of by the Ministry.
The Training Councils
Norway has 20 national advisory bodies with representatives from the social partners which providevocational advice concerning individual trades, namely the training councils (opplæringsrådene).These are nominated according to the same principle as the RFA, but here it is the countrywidebranch organisations which propose the social partners’ members. The ministry nominates theremainder without outside advice.
The tasks of the training councils are related to the trades for which they are responsible. The workincludes drawing up final qualifications for trades and they participate in curriculum development.They also take the initiative in matters concerned with vocational training within their spheres ofresponsibility at school and in working life, submit expert opinions on matters such as therecognition of previous school attendance and experience, advise on the recognition of foreigneducation, draw up papers for the theoretical part of examinations for section 20 candidates, draw upguidelines for the practical part of the examinations, and at the ,same time generally provide adviceand expert opinion to the ministry on their respective trades. Another important field of activity is thedevelopment of trades themselves, both to prepare final qualifications for new trades and to changeexisting trades.
Vocational Training Committees
In every county, the county authorities nominate a vocational training committee. The committee,which is set up with representatives of the social partners and is an advisory body to the county, bearsa major responsibility for implementing vocational training on behalf of the county authorities.
68
Important tasks are to ensure that the provisions of the vocational training act are followed, toarrange apprenticeship places and to place pupils in training establishments. The committees approvethe training establishments and supervise the training in the establishments. The committees have theauthority to withdraw the right to have apprentices from an establishment. Furthermore, they areresponsible for approving the apprenticeship contracts, for ensuring that the trade and journeyman’sexaminations are held in accordance with the conditions, for appointing the examination boards andfor issuing trade and journeyman’s certificates. The vocational training committees also evaluate thetheoretical and practical grounding of the section 20 candidates and approve it, if appropriate.
Upon the introduction of Reform 94, the vocational training committees were assigned a new,important and extensive task, namely responsibility for assigning apprentices to enterprises. Thismade it necessary for the committees to work actively with the branch organisations and enterprisesto draw up needs analyses and overviews of available apprenticeship places.
The vocational training committees are nominated for a period of four years and follow the sameelectoral cycle as the county council. The social partners in the county propose four of the sevenmembers of the committees, two from each side. In addition, three members are nominated by thecounty, one apprentice and two with respective backgrounds in business/employment work andschools. The leader of the committee is chosen for a two-year period at a time. The vocationaltraining committee has a secretariat that carries out the day-to-day work of the committee. It hasregular contact with the training establishments and can provide expert advice and assistance inpractical matters. Normally, the administration of the committees is integrated into the county’seducation service and placed under the county schools officer.
Examination boards
The trade and journeyman’s examinations are evaluated by examination boards. In principle, eachcounty has an examination board for each trade. If necessary, several can be nominated. In somecases, the counties cooperate on joint boards, for example, for the small trades.
The tasks of the boards are to organise and manage the implementation of the practical side of thetrade examination and evaluate the results. The boards’ main task is the work with the tradeexamination but they can also be used as a vocational committee, i.e. as an advisory body for thecounty on questions relating to the respective trades. Normally, the vocational training committeesuse them as advisors on vocational questions related to the approval of training establishments, tosupervise enterprises, to evaluate experience, etc.
Until autumn 1996, the boards included representatives from the social partners, i.e. like the appealsboards, they had three members. Upon the implementation of Reform 94, the number of members onthe appeals boards was reduced to two. Both members shall have formal vocational competence andideally also work experience in the relevant trade.
Appeals boards
A candidate who has failed the trade or journeyman’s examination may appeal the decision of theexamination board. The appeal is decided by an appeals board for the relevant trade. In certain trades,there is such a range of different examinations that several appeals boards are needed.
The appeals boards have three members, one from the employers’ side and one from the employees’side as well as one who most frequently has a background of teaching the trade in school. They arenominated for four years at a time by the ministry through its National Examination Board(Eksamenssekretaritet). The training council for the trade proposes the members of the appeals board

69
for the trade. The appeals board may either reverse the decision of the examination board or reject theappeal.
Appeals against the way a matter is handled and formal errors are dealt with by the county authoritieson the basis of the Public Administration Act.
Vocational Comittees
The vocational training committee can appoint vocational committees, i.e. bodies that can assist thevocational training committee and training establishments with expert advice at different vocationalareas. As stated above, the counties may also use the appeals boards as advisory vocational bodies.
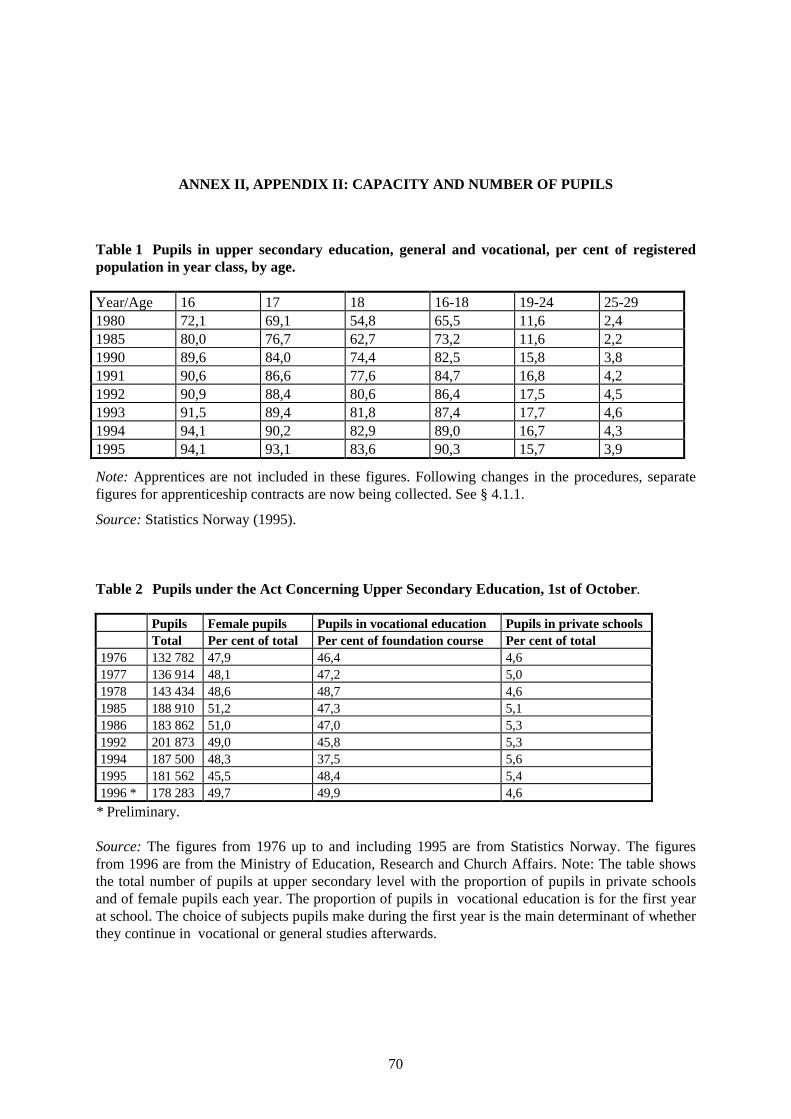
70
ANNEX II, APPENDIX II: CAPACITY AND NUMBER OF PUPILS
Table 1 Pupils in upper secondary education, general and vocational, per cent of registeredpopulation in year class, by age.
Year/Age 16 17 18 16-18 19-24 25-291980 72,1 69,1 54,8 65,5 11,6 2,41985 80,0 76,7 62,7 73,2 11,6 2,21990 89,6 84,0 74,4 82,5 15,8 3,81991 90,6 86,6 77,6 84,7 16,8 4,21992 90,9 88,4 80,6 86,4 17,5 4,51993 91,5 89,4 81,8 87,4 17,7 4,61994 94,1 90,2 82,9 89,0 16,7 4,31995 94,1 93,1 83,6 90,3 15,7 3,9
Note: Apprentices are not included in these figures. Following changes in the procedures, separatefigures for apprenticeship contracts are now being collected. See § 4.1.1.
Source:Statistics Norway (1995).
Table 2 Pupils under the Act Concerning Upper Secondary Education, 1st of October.
Pupils Female pupils Pupils in vocational education Pupils in private schoolsTotal Per cent of total Per cent of foundation course Per cent of total
1976 132 782 47,9 46,4 4,61977 136 914 48,1 47,2 5,01978 143 434 48,6 48,7 4,61985 188 910 51,2 47,3 5,11986 183 862 51,0 47,0 5,31992 201 873 49,0 45,8 5,31994 187 500 48,3 37,5 5,61995 181 562 45,5 48,4 5,41996 * 178 283 49,7 49,9 4,6
* Preliminary.
Source:The figures from 1976 up to and including 1995 are from Statistics Norway. The figuresfrom 1996 are from the Ministry of Education, Research and Church Affairs. Note: The table showsthe total number of pupils at upper secondary level with the proportion of pupils in private schoolsand of female pupils each year. The proportion of pupils in vocational education is for the first yearat school. The choice of subjects pupils make during the first year is the main determinant of whetherthey continue in vocational or general studies afterwards.
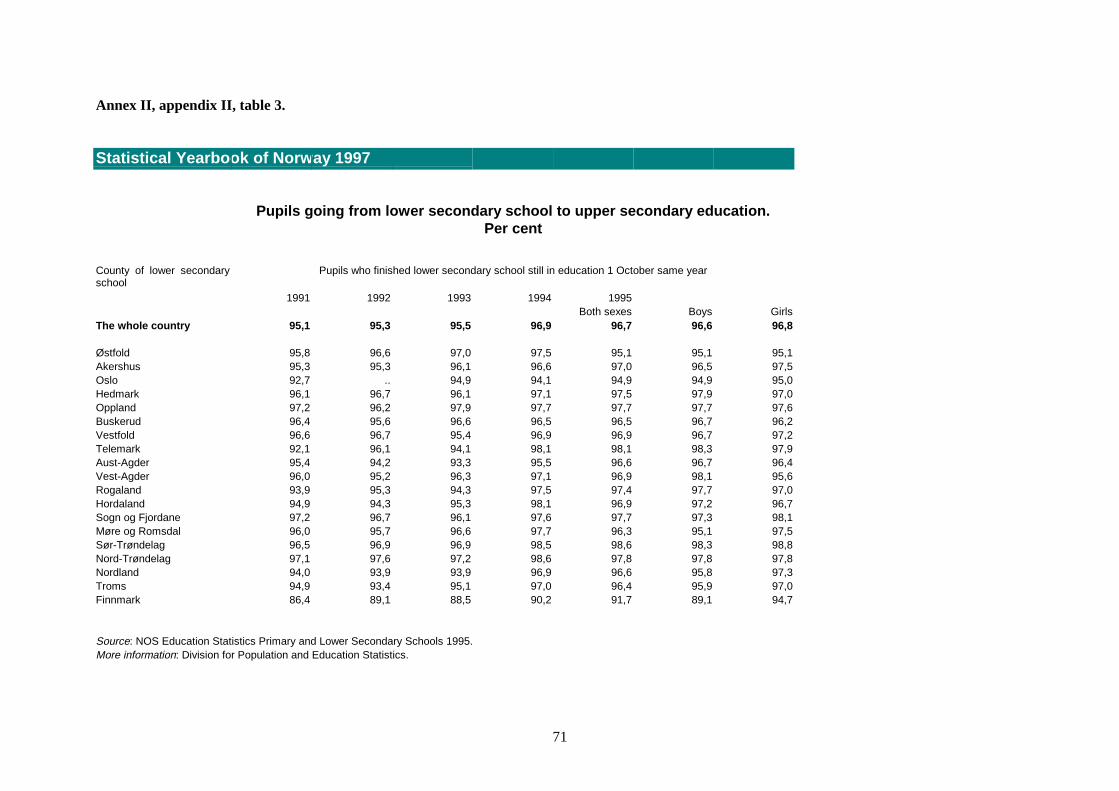
71
Annex II, appendix II, table 3.
Statistical Yearbook of Norway 1997
Pupils going from lower secondary school to upper secondary education.Per cent
County of lower secondaryschool
Pupils who finished lower secondary school still in education 1 October same year
1991 1992 1993 1994 1995Both sexes Boys Girls
The whole country 95,1 95,3 95,5 96,9 96,7 96,6 96,8
Østfold 95,8 96,6 97,0 97,5 95,1 95,1 95,1Akershus 95,3 95,3 96,1 96,6 97,0 96,5 97,5Oslo 92,7 .. 94,9 94,1 94,9 94,9 95,0Hedmark 96,1 96,7 96,1 97,1 97,5 97,9 97,0Oppland 97,2 96,2 97,9 97,7 97,7 97,7 97,6Buskerud 96,4 95,6 96,6 96,5 96,5 96,7 96,2Vestfold 96,6 96,7 95,4 96,9 96,9 96,7 97,2Telemark 92,1 96,1 94,1 98,1 98,1 98,3 97,9Aust-Agder 95,4 94,2 93,3 95,5 96,6 96,7 96,4Vest-Agder 96,0 95,2 96,3 97,1 96,9 98,1 95,6Rogaland 93,9 95,3 94,3 97,5 97,4 97,7 97,0Hordaland 94,9 94,3 95,3 98,1 96,9 97,2 96,7Sogn og Fjordane 97,2 96,7 96,1 97,6 97,7 97,3 98,1Møre og Romsdal 96,0 95,7 96,6 97,7 96,3 95,1 97,5Sør-Trøndelag 96,5 96,9 96,9 98,5 98,6 98,3 98,8Nord-Trøndelag 97,1 97,6 97,2 98,6 97,8 97,8 97,8Nordland 94,0 93,9 93,9 96,9 96,6 95,8 97,3Troms 94,9 93,4 95,1 97,0 96,4 95,9 97,0Finnmark 86,4 89,1 88,5 90,2 91,7 89,1 94,7
Source: NOS Education Statistics Primary and Lower Secondary Schools 1995.More information: Division for Population and Education Statistics.
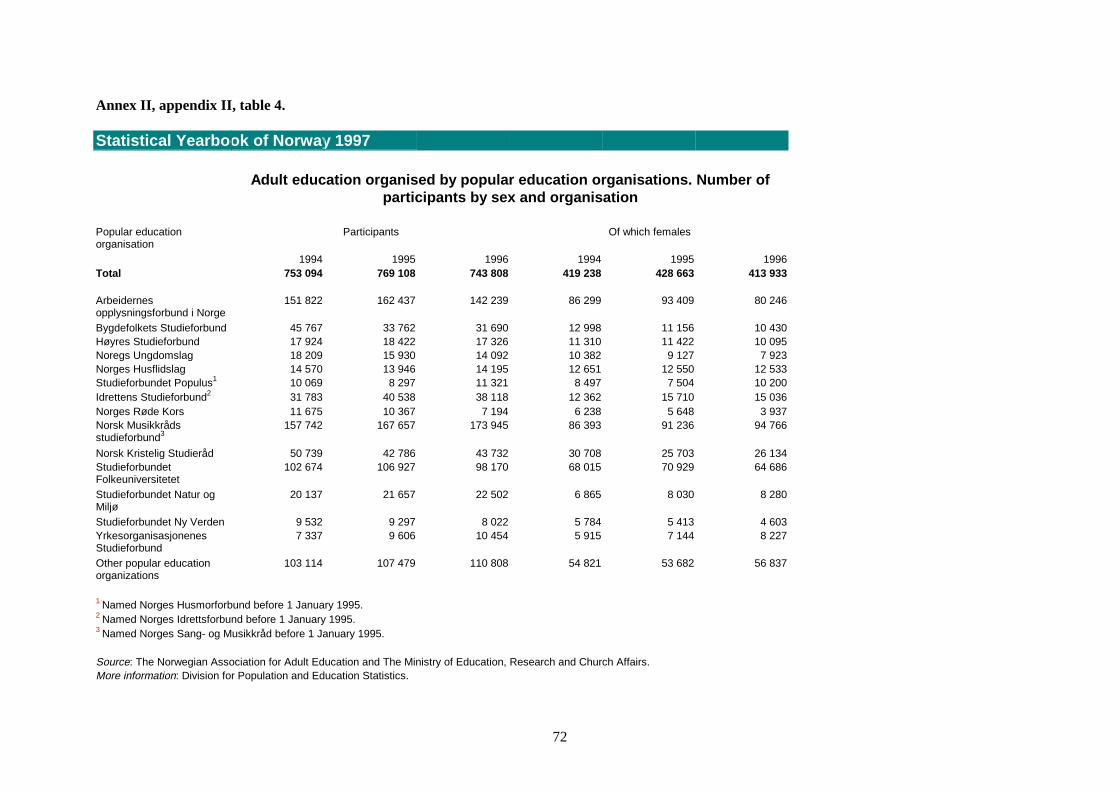
72
Annex II, appendix II, table 4.
Statistical Yearbook of Norway 1997
Adult education organised by popular education organisations. Number ofparticipants by sex and organisation
Popular educationorganisation
Participants Of which females
1994 1995 1996 1994 1995 1996Total 753 094 769 108 743 808 419 238 428 663 413 933
Arbeidernesopplysningsforbund i Norge
151 822 162 437 142 239 86 299 93 409 80 246
Bygdefolkets Studieforbund 45 767 33 762 31 690 12 998 11 156 10 430Høyres Studieforbund 17 924 18 422 17 326 11 310 11 422 10 095Noregs Ungdomslag 18 209 15 930 14 092 10 382 9 127 7 923Norges Husflidslag 14 570 13 946 14 195 12 651 12 550 12 533Studieforbundet Populus1 10 069 8 297 11 321 8 497 7 504 10 200Idrettens Studieforbund2 31 783 40 538 38 118 12 362 15 710 15 036Norges Røde Kors 11 675 10 367 7 194 6 238 5 648 3 937Norsk Musikkrådsstudieforbund3
157 742 167 657 173 945 86 393 91 236 94 766
Norsk Kristelig Studieråd 50 739 42 786 43 732 30 708 25 703 26 134StudieforbundetFolkeuniversitetet
102 674 106 927 98 170 68 015 70 929 64 686
Studieforbundet Natur ogMiljø
20 137 21 657 22 502 6 865 8 030 8 280
Studieforbundet Ny Verden 9 532 9 297 8 022 5 784 5 413 4 603YrkesorganisasjonenesStudieforbund
7 337 9 606 10 454 5 915 7 144 8 227
Other popular educationorganizations
103 114 107 479 110 808 54 821 53 682 56 837
1 Named Norges Husmorforbund before 1 January 1995.2 Named Norges Idrettsforbund before 1 January 1995.3 Named Norges Sang- og Musikkråd before 1 January 1995.
Source: The Norwegian Association for Adult Education and The Ministry of Education, Research and Church Affairs.More information: Division for Population and Education Statistics.
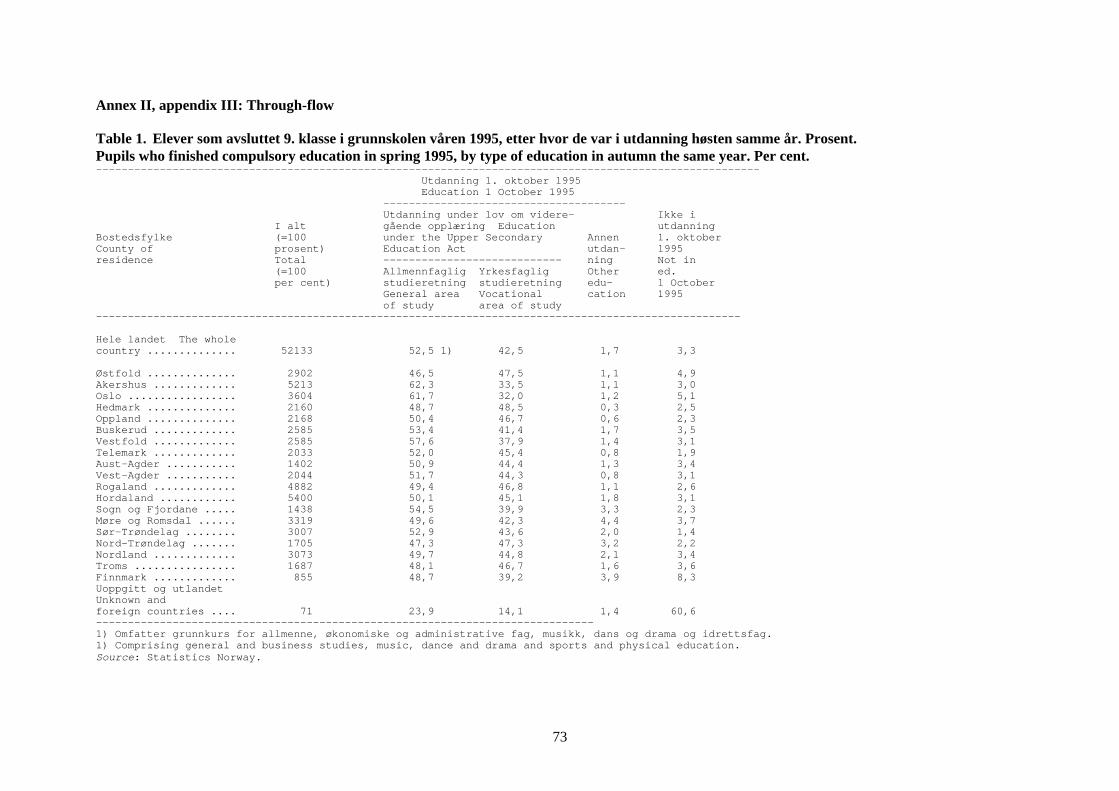
73
Annex II, appendix III: Through-flow
Table 1. Elever som avsluttet 9. klasse i grunnskolen våren 1995, etter hvor de var i utdanning høsten samme år. Prosent.Pupils who finished compulsory education in spring 1995, by type of education in autumn the same year. Per cent.————————————————————————————————————————————————————————————————————————————————————————————————————————
Utdanning 1. oktober 1995Education 1 October 1995
——————————————————————————————————————Utdanning under lov om videre- Ikke i
I alt gående opplæring Education utdanningBostedsfylke (=100 under the Upper Secondary Annen 1. oktoberCounty of prosent) Education Act utdan- 1995residence Total ———————————————————————————— ning Not in
(=100 Allmennfaglig Yrkesfaglig Other ed.per cent) studieretning studieretning edu- 1 October
General area Vocational cation 1995of study area of study
—————————————————————————————————————————————————————————————————————————————————————————————————————
Hele landet The wholecountry .............. 52133 52,5 1) 42,5 1,7 3,3
Østfold .............. 2902 46,5 47,5 1,1 4,9Akershus ............. 5213 62,3 33,5 1,1 3,0Oslo ................. 3604 61,7 32,0 1,2 5,1Hedmark .............. 2160 48,7 48,5 0,3 2,5Oppland .............. 2168 50,4 46,7 0,6 2,3Buskerud ............. 2585 53,4 41,4 1,7 3,5Vestfold ............. 2585 57,6 37,9 1,4 3,1Telemark ............. 2033 52,0 45,4 0,8 1,9Aust-Agder ........... 1402 50,9 44,4 1,3 3,4Vest-Agder ........... 2044 51,7 44,3 0,8 3,1Rogaland ............. 4882 49,4 46,8 1,1 2,6Hordaland ............ 5400 50,1 45,1 1,8 3,1Sogn og Fjordane ..... 1438 54,5 39,9 3,3 2,3Møre og Romsdal ...... 3319 49,6 42,3 4,4 3,7Sør-Trøndelag ........ 3007 52,9 43,6 2,0 1,4Nord-Trøndelag ....... 1705 47,3 47,3 3,2 2,2Nordland ............. 3073 49,7 44,8 2,1 3,4Troms ................ 1687 48,1 46,7 1,6 3,6Finnmark ............. 855 48,7 39,2 3,9 8,3Uoppgitt og utlandetUnknown andforeign countries .... 71 23,9 14,1 1,4 60,6——————————————————————————————————————————————————————————————————————————————1) Omfatter grunnkurs for allmenne, økonomiske og administrative fag, musikk, dans og drama og idrettsfag.1) Comprising general and business studies, music, dance and drama and sports and physical education.Source : Statistics Norway.
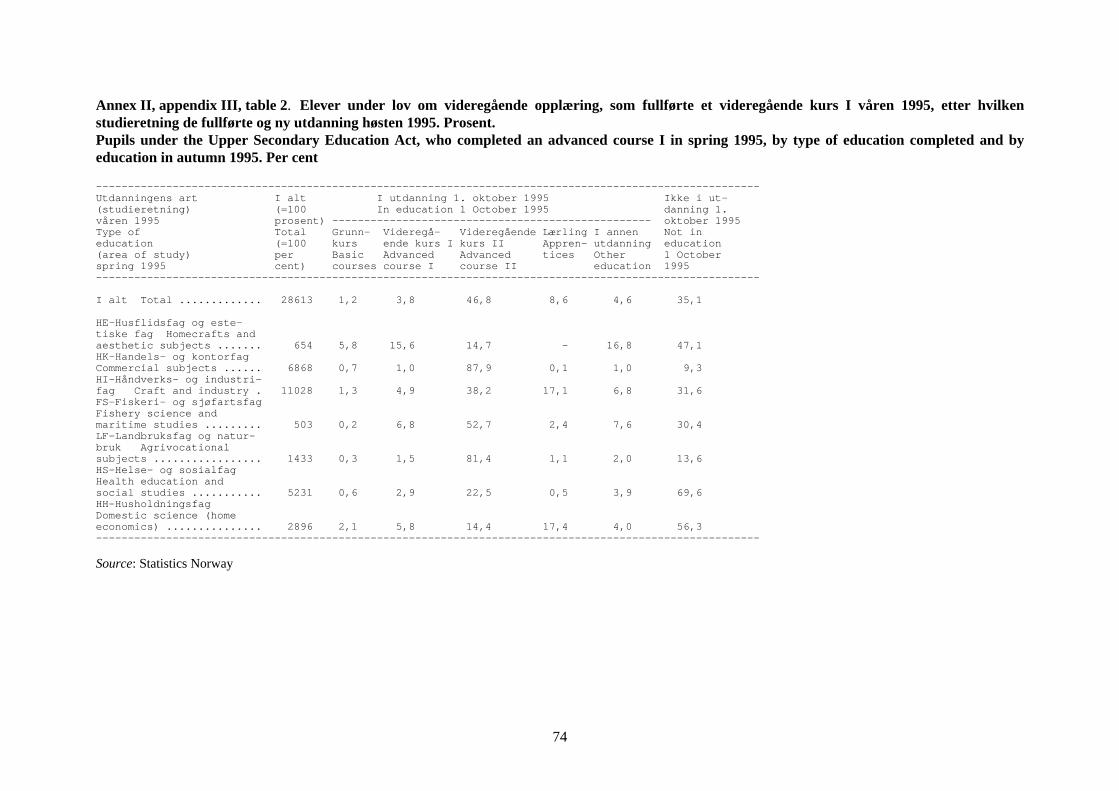
74
Annex II, appendix III, table 2 . Elever under lov om videregående opplæring, som fullførte et videregående kurs I våren 1995, etter hvilkenstudieretning de fullførte og ny utdanning høsten 1995. Prosent.Pupils under the Upper Secondary Education Act, who completed an advanced course I in spring 1995, by type of education completed and byeducation in autumn 1995. Per cent
————————————————————————————————————————————————————————————————————————————————————————————————————————Utdanningens art I alt I utdanning 1. oktober 1995 Ikke i ut-(studieretning) (=100 In education 1 October 1995 danning 1.våren 1995 prosent) —————————————————————————————————————————————————— oktober 1995Type of Total Grunn- Videregå- Videregående Lærling I annen Not ineducation (=100 kurs ende kurs I kurs II Appren- utdanning education(area of study) per Basic Advanced Advanced tices Other 1 Octoberspring 1995 cent) courses course I course II education 1995————————————————————————————————————————————————————————————————————————————————————————————————————————
I alt Total ............. 28613 1,2 3,8 46,8 8,6 4,6 35,1
HE-Husflidsfag og este-tiske fag Homecrafts andaesthetic subjects ....... 654 5,8 15,6 14,7 - 16,8 47,1HK-Handels- og kontorfagCommercial subjects ...... 6868 0,7 1,0 87,9 0,1 1,0 9,3HI-Håndverks- og industri-fag Craft and industry . 11028 1,3 4,9 38,2 17,1 6,8 31,6FS-Fiskeri- og sjøfartsfagFishery science andmaritime studies ......... 503 0,2 6,8 52,7 2,4 7,6 30,4LF-Landbruksfag og natur-bruk Agrivocationalsubjects ................. 1433 0,3 1,5 81,4 1,1 2,0 13,6HS-Helse- og sosialfagHealth education andsocial studies ........... 5231 0,6 2,9 22,5 0,5 3,9 69,6HH-HusholdningsfagDomestic science (homeeconomics) ............... 2896 2,1 5,8 14,4 17,4 4,0 56,3————————————————————————————————————————————————————————————————————————————————————————————————————————
Source: Statistics Norway
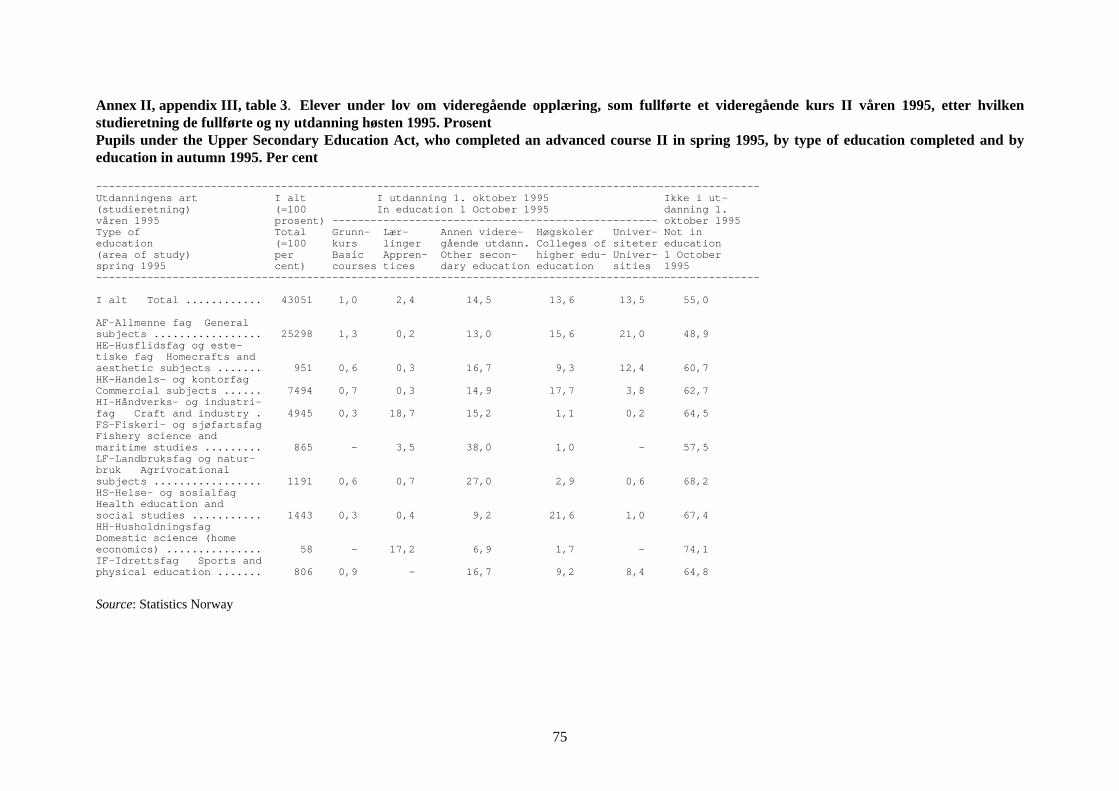
75
Annex II, appendix III, table 3 . Elever under lov om videregående opplæring, som fullførte et videregående kurs II våren 1995, etter hvilkenstudieretning de fullførte og ny utdanning høsten 1995. ProsentPupils under the Upper Secondary Education Act, who completed an advanced course II in spring 1995, by type of education completed and byeducation in autumn 1995. Per cent
————————————————————————————————————————————————————————————————————————————————————————————————————————Utdanningens art I alt I utdanning 1. oktober 1995 Ikke i ut-(studieretning) (=100 In education 1 October 1995 danning 1.våren 1995 prosent) ——————————————————————————————————————————————————— oktober 1995Type of Total Grunn- Lær- Annen videre- Høgskoler Univer- Not ineducation (=100 kurs linger gående utdann. Colleges of siteter education(area of study) per Basic Appren- Other secon- higher edu- Univer- 1 Octoberspring 1995 cent) courses tices dary education education sities 1995————————————————————————————————————————————————————————————————————————————————————————————————————————
I alt Total ............ 43051 1,0 2,4 14,5 13,6 13,5 55,0
AF-Allmenne fag Generalsubjects ................. 25298 1,3 0,2 13,0 15,6 21,0 48,9HE-Husflidsfag og este-tiske fag Homecrafts andaesthetic subjects ....... 951 0,6 0,3 16,7 9,3 12,4 60,7HK-Handels- og kontorfagCommercial subjects ...... 7494 0,7 0,3 14,9 17,7 3,8 62,7HI-Håndverks- og industri-fag Craft and industry . 4945 0,3 18,7 15,2 1,1 0,2 64,5FS-Fiskeri- og sjøfartsfagFishery science andmaritime studies ......... 865 - 3,5 38,0 1,0 - 57,5LF-Landbruksfag og natur-bruk Agrivocationalsubjects ................. 1191 0,6 0,7 27,0 2,9 0,6 68,2HS-Helse- og sosialfagHealth education andsocial studies ........... 1443 0,3 0,4 9,2 21,6 1,0 67,4HH-HusholdningsfagDomestic science (homeeconomics) ............... 58 - 17,2 6,9 1,7 - 74,1IF-Idrettsfag Sports andphysical education ....... 806 0,9 - 16,7 9,2 8,4 64,8
Source: Statistics Norway
76
Ministry of Education, Research and Church Affairs
————————————————————————————————————————————————————————————————————————————————————————————————————————
ANNEX III: HIGHER EDUCATION IN NORWAY
Figure 1. A broad description of the paths from primary education to higher education
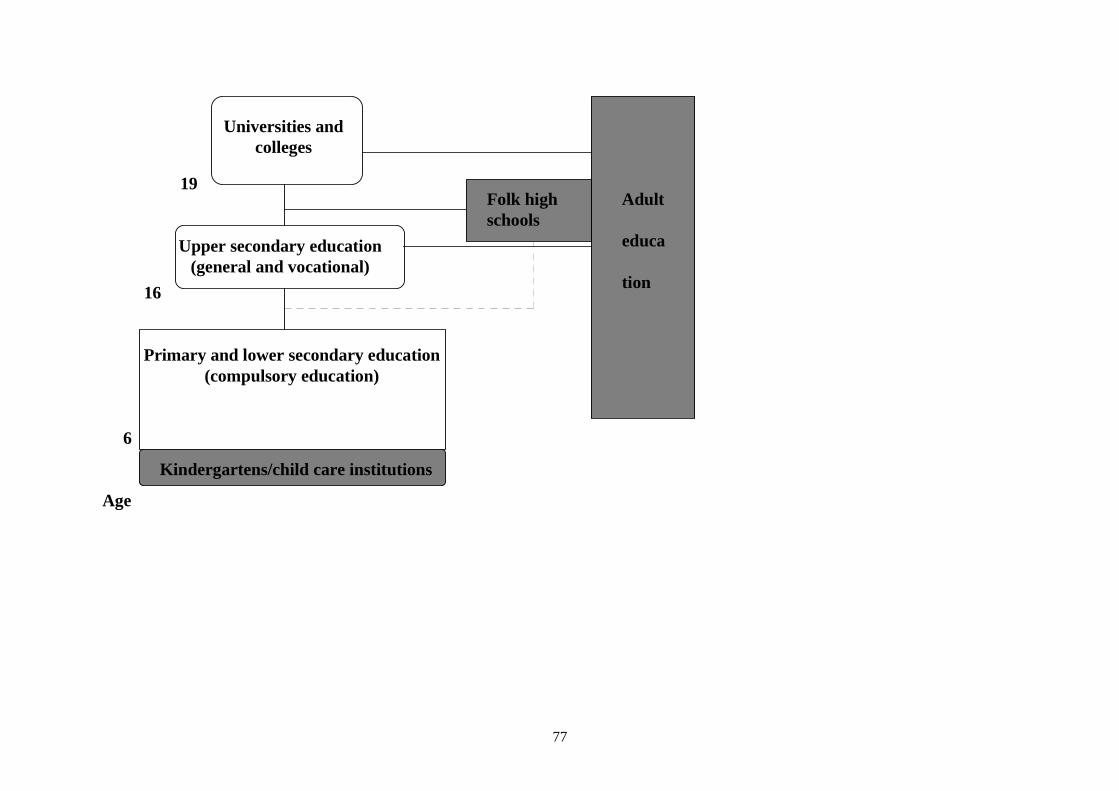
77
Universities andcolleges
Upper secondary education(general and vocational)
Primary and lower secondary education(compulsory education)
Kindergartens/child care institutions
Folk highschools
Adult
educa
tion
19
16
6
Age
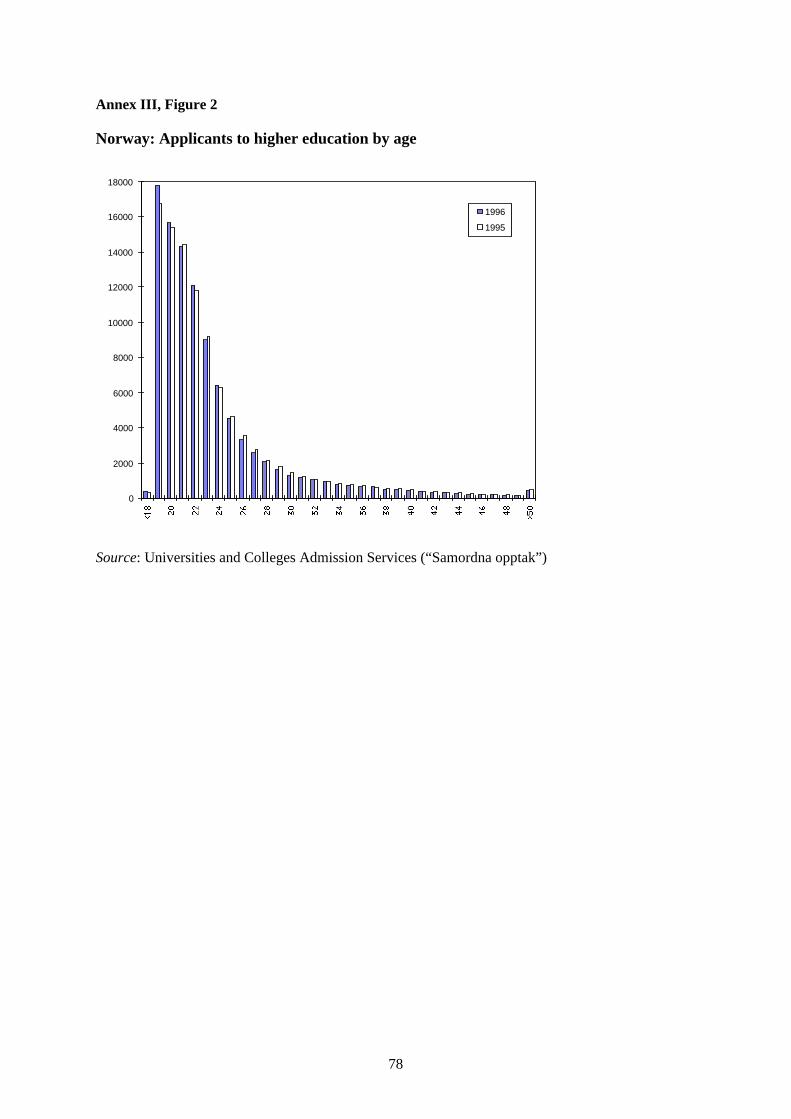
78
Annex III, Figure 2
Norway: Applicants to higher education by age
0
2000
4000
6000
8000
10000
12000
14000
16000
18000
1996
1995
Source: Universities and Colleges Admission Services (“Samordna opptak”)
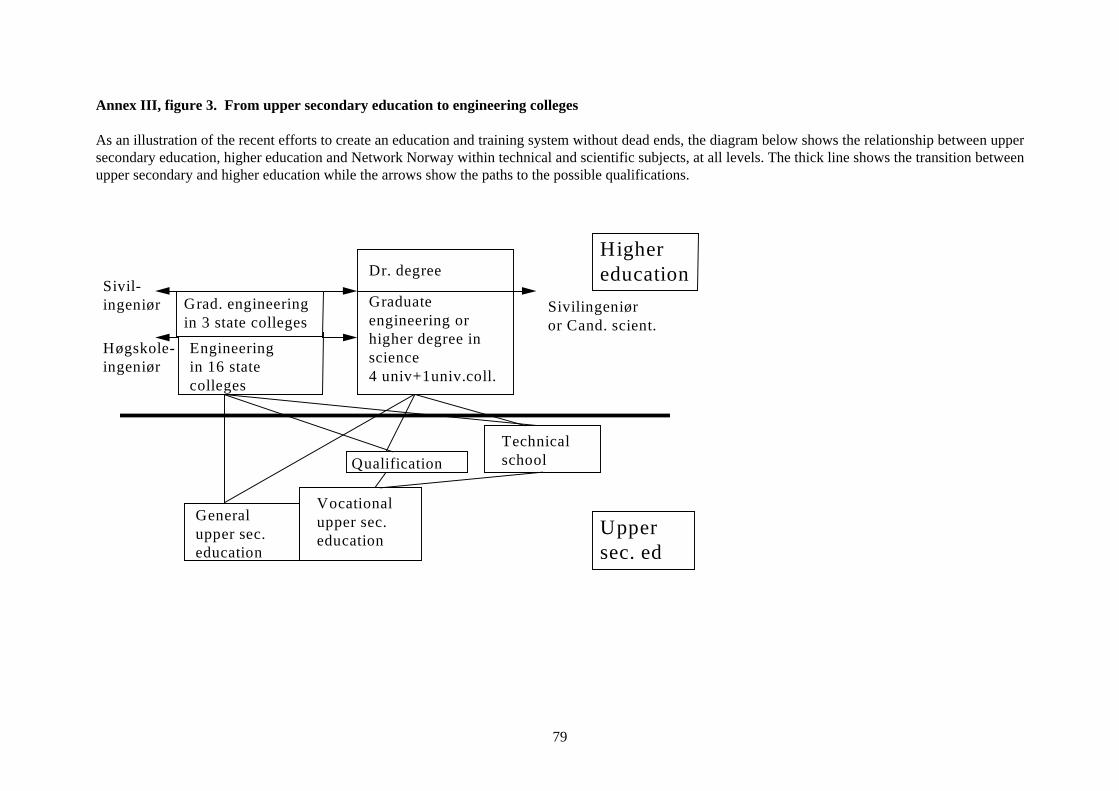
79
Annex III, figure 3. From upper secondary education to engineering colleges
As an illustration of the recent efforts to create an education and training system without dead ends, the diagram below shows the relationship between uppersecondary education, higher education and Network Norway within technical and scientific subjects, at all levels. The thick line shows the transition betweenupper secondary and higher education while the arrows show the paths to the possible qualifications.
Qualification
Generalupper sec.education
Vocationalupper sec.education
Technicalschool
Engineeringin 16 statecolleges
Graduateengineering orhigher degree inscience4 univ+1univ.coll.
Dr. degree
Grad. engineeringin 3 state colleges
Highereducation
Uppersec. ed
Sivilingeniøror Cand. scient.
Høgskole-ingeniør
Sivil-ingeniør
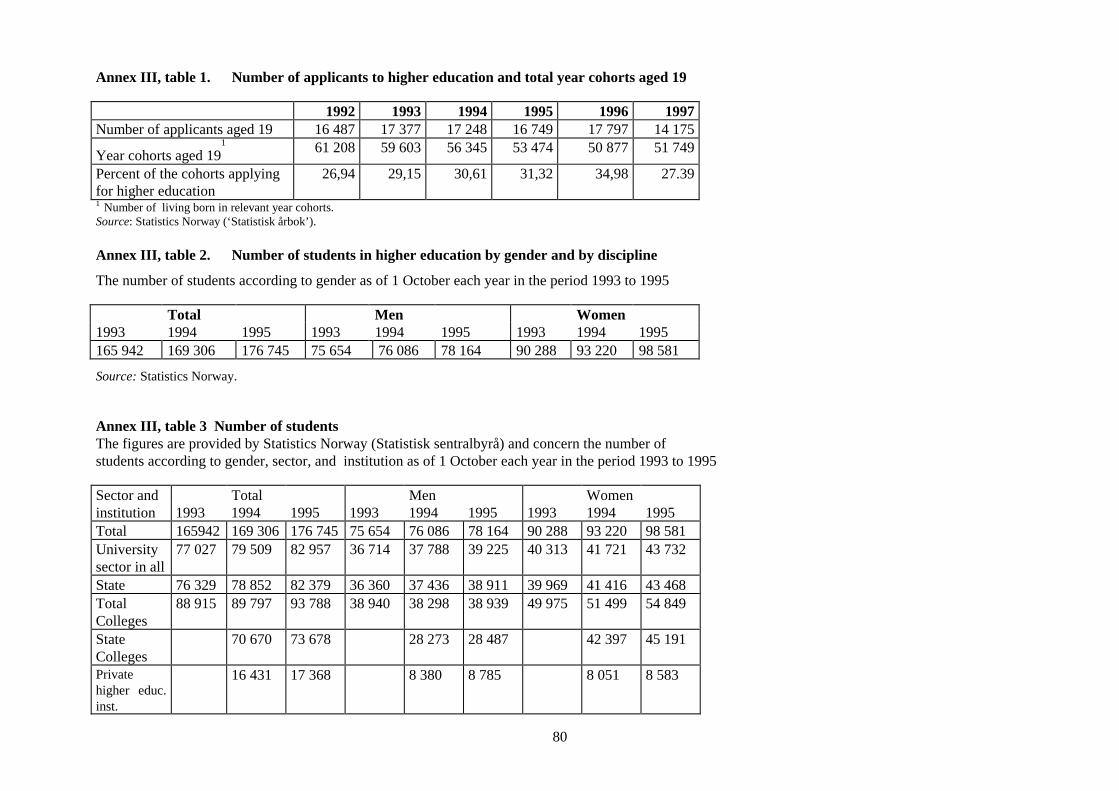
80
Annex III, table 1. Number of applicants to higher education and total year cohorts aged 19
1992 1993 1994 1995 1996 1997Number of applicants aged 19 16 487 17 377 17 248 16 749 17 797 14 175
Year cohorts aged 191 61 208 59 603 56 345 53 474 50 877 51 749
Percent of the cohorts applyingfor higher education
26,94 29,15 30,61 31,32 34,98 27.39
1 Number of living born in relevant year cohorts.Source: Statistics Norway (‘Statistisk årbok’).
Annex III, table 2. Number of students in higher education by gender and by discipline
The number of students according to gender as of 1 October each year in the period 1993 to 1995
Total Men Women1993 1994 1995 1993 1994 1995 1993 1994 1995165 942 169 306 176 745 75 654 76 086 78 164 90 288 93 220 98 581
Source:Statistics Norway.
Annex III, table 3 Number of studentsThe figures are provided by Statistics Norway (Statistisk sentralbyrå) and concern the number ofstudents according to gender, sector, and institution as of 1 October each year in the period 1993 to 1995
Sector and Total Men Womeninstitution 1993 1994 1995 1993 1994 1995 1993 1994 1995Total 165942 169 306 176 745 75 654 76 086 78 164 90 288 93 220 98 581Universitysector in all
77 027 79 509 82 957 36 714 37 788 39 225 40 313 41 721 43 732
State 76 329 78 852 82 379 36 360 37 436 38 911 39 969 41 416 43 468TotalColleges
88 915 89 797 93 788 38 940 38 298 38 939 49 975 51 499 54 849
StateColleges
70 670 73 678 28 273 28 487 42 397 45 191
Privatehigher educ.inst.
16 431 17 368 8 380 8 785 8 051 8 583
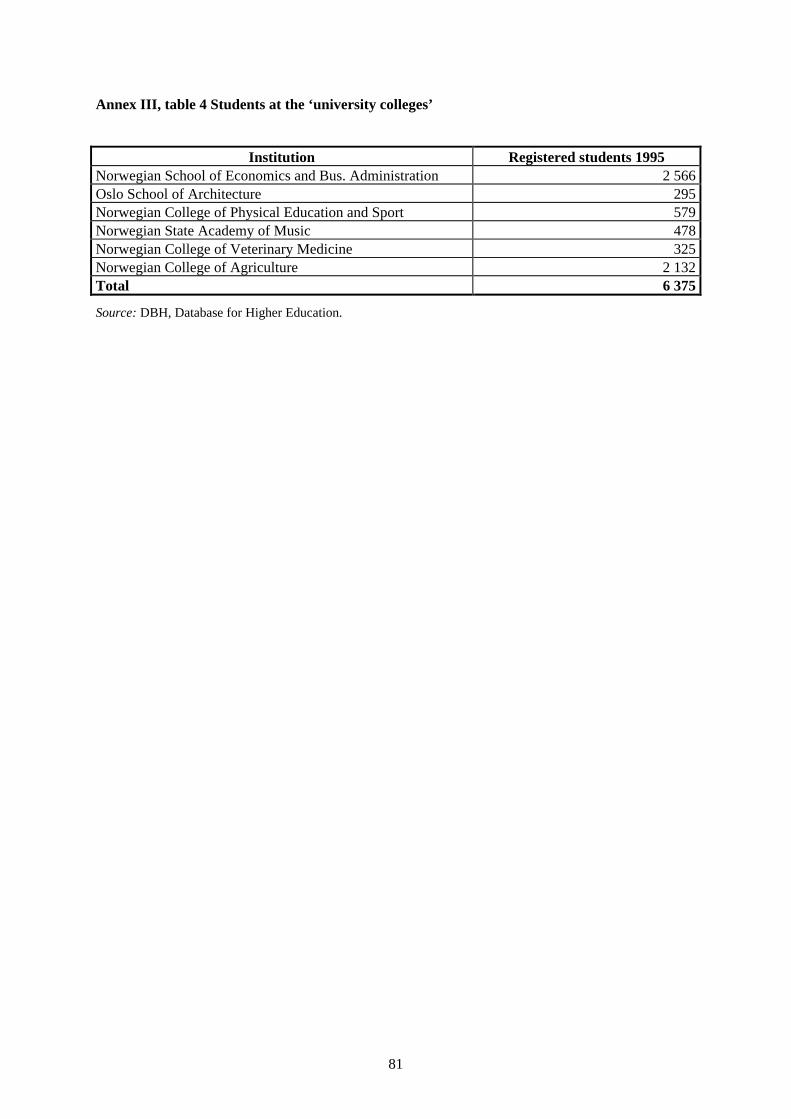
81
Annex III, table 4 Students at the ‘university colleges’
Institution Registered students 1995Norwegian School of Economics and Bus. Administration 2 566Oslo School of Architecture 295Norwegian College of Physical Education and Sport 579Norwegian State Academy of Music 478Norwegian College of Veterinary Medicine 325Norwegian College of Agriculture 2 132Total 6 375
Source:DBH, Database for Higher Education.
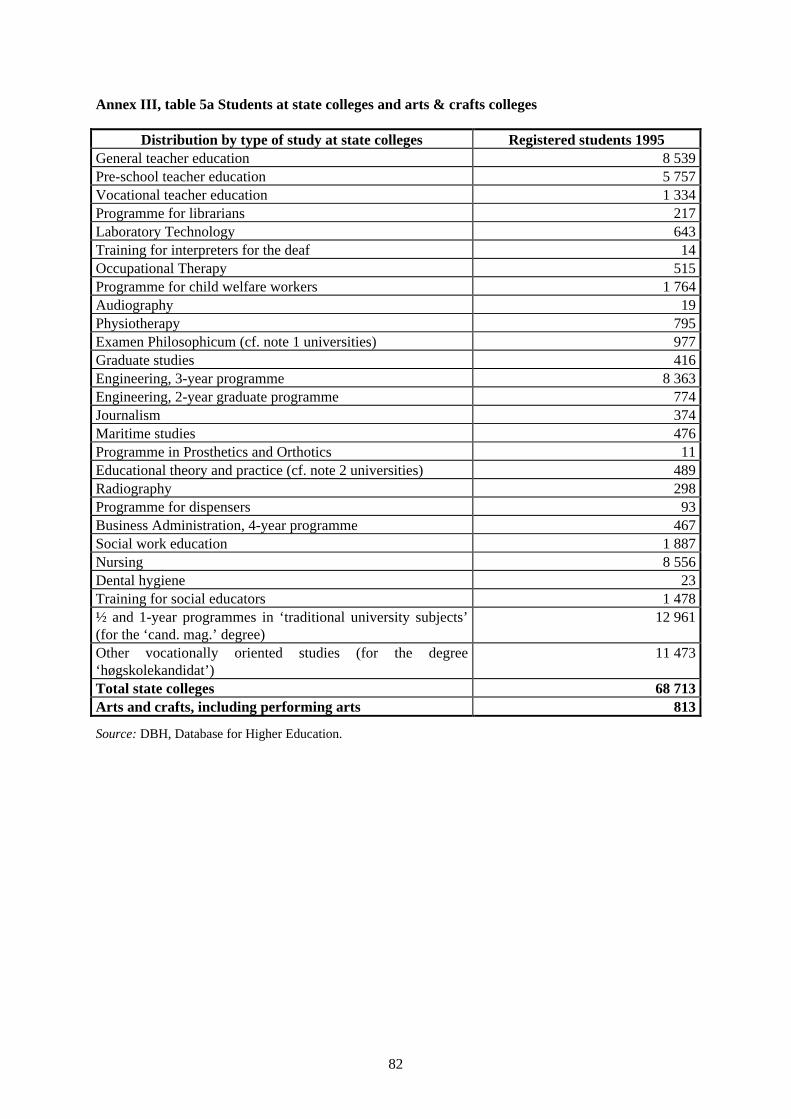
82
Annex III, table 5a Students at state colleges and arts & crafts colleges
Distribution by type of study at state colleges Registered students 1995General teacher education 8 539Pre-school teacher education 5 757Vocational teacher education 1 334Programme for librarians 217Laboratory Technology 643Training for interpreters for the deaf 14Occupational Therapy 515Programme for child welfare workers 1 764Audiography 19Physiotherapy 795Examen Philosophicum (cf. note 1 universities) 977Graduate studies 416Engineering, 3-year programme 8 363Engineering, 2-year graduate programme 774Journalism 374Maritime studies 476Programme in Prosthetics and Orthotics 11Educational theory and practice (cf. note 2 universities) 489Radiography 298Programme for dispensers 93Business Administration, 4-year programme 467Social work education 1 887Nursing 8 556Dental hygiene 23Training for social educators 1 478½ and 1-year programmes in ‘traditional university subjects’(for the ‘cand. mag.’ degree)
12 961
Other vocationally oriented studies (for the degree‘høgskolekandidat’)
11 473
Total state colleges 68 713Arts and crafts, including performing arts 813
Source:DBH, Database for Higher Education.
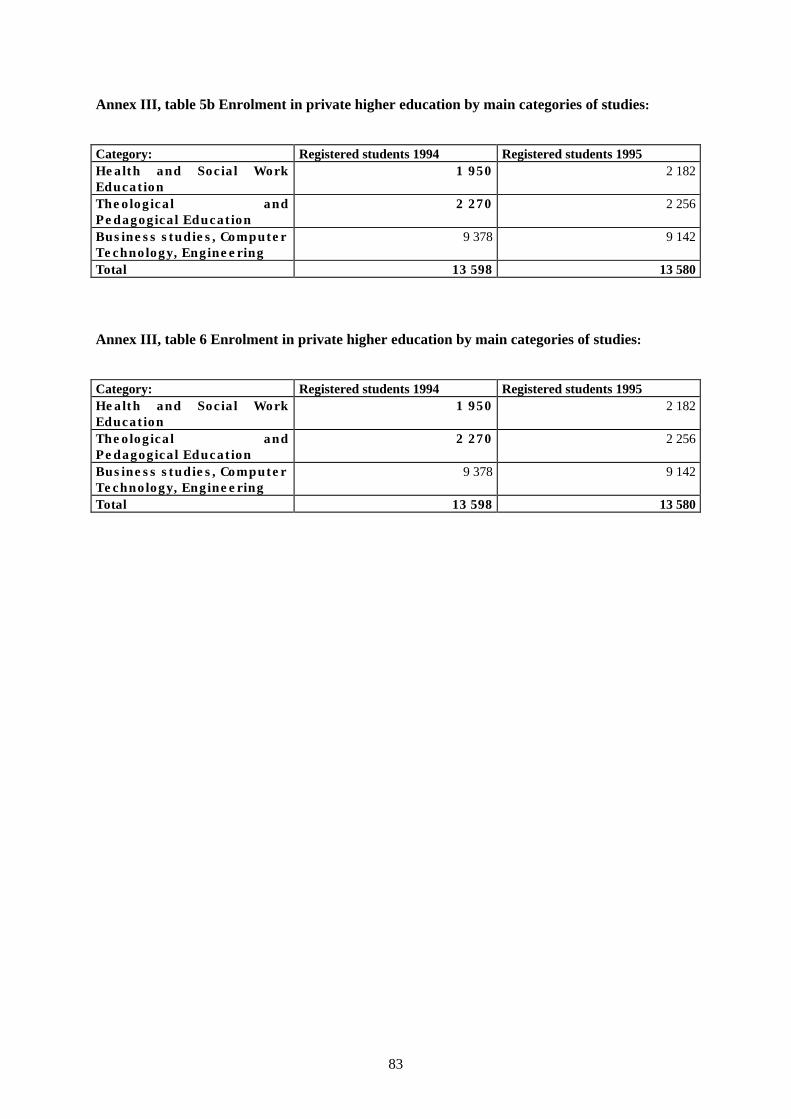
83
Annex III, table 5b Enrolment in private higher education by main categories of studies:
Category: Registered students 1994 Registered students 1995Health and Social WorkEducation
1 950 2 182
Theological andPedagogical Education
2 270 2 256
Business studies, ComputerTechnology, Engineering
9 378 9 142
Total 13 598 13 580
Annex III, table 6 Enrolment in private higher education by main categories of studies:
Category: Registered students 1994 Registered students 1995Health and Social WorkEducation
1 950 2 182
Theological andPedagogical Education
2 270 2 256
Business studies, ComputerTechnology, Engineering
9 378 9 142
Total 13 598 13 580
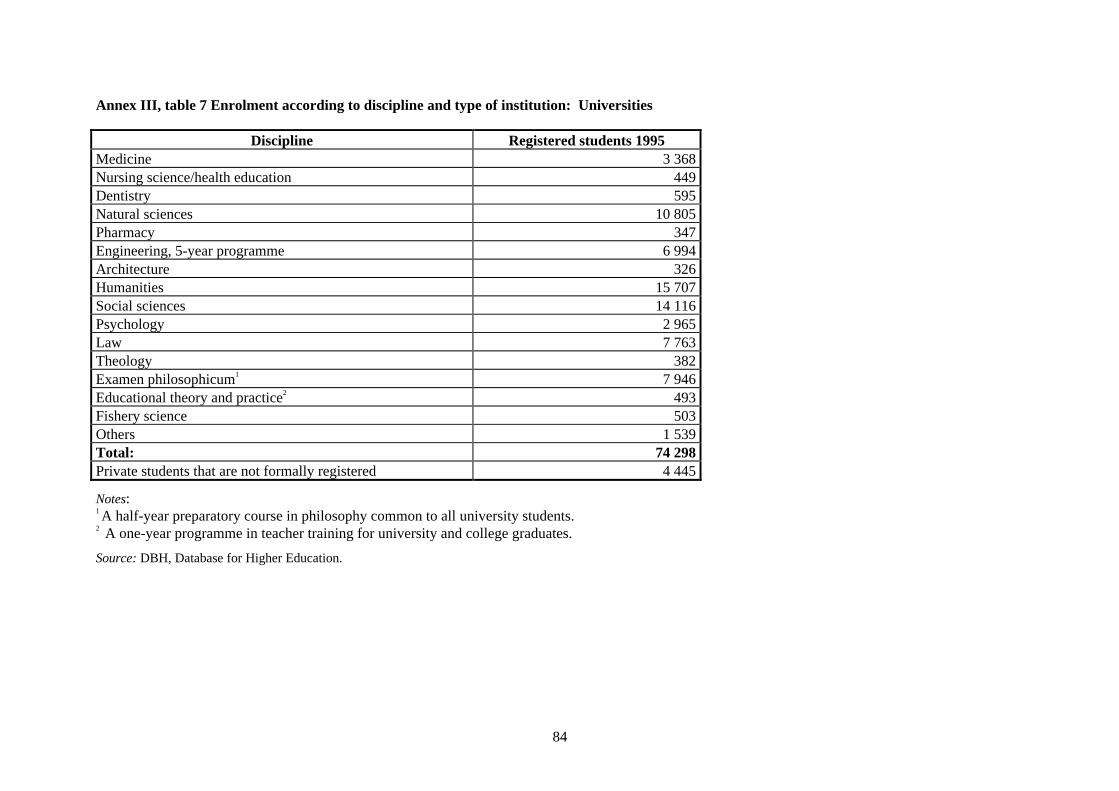
84
Annex III, table 7 Enrolment according to discipline and type of institution: Universities
Discipline Registered students 1995Medicine 3 368Nursing science/health education 449Dentistry 595Natural sciences 10 805Pharmacy 347Engineering, 5-year programme 6 994Architecture 326Humanities 15 707Social sciences 14 116Psychology 2 965Law 7 763Theology 382Examen philosophicum1 7 946Educational theory and practice2 493Fishery science 503Others 1 539Total: 74 298Private students that are not formally registered 4 445
Notes:1 A half-year preparatory course in philosophy common to all university students.2 A one-year programme in teacher training for university and college graduates.
Source:DBH, Database for Higher Education.
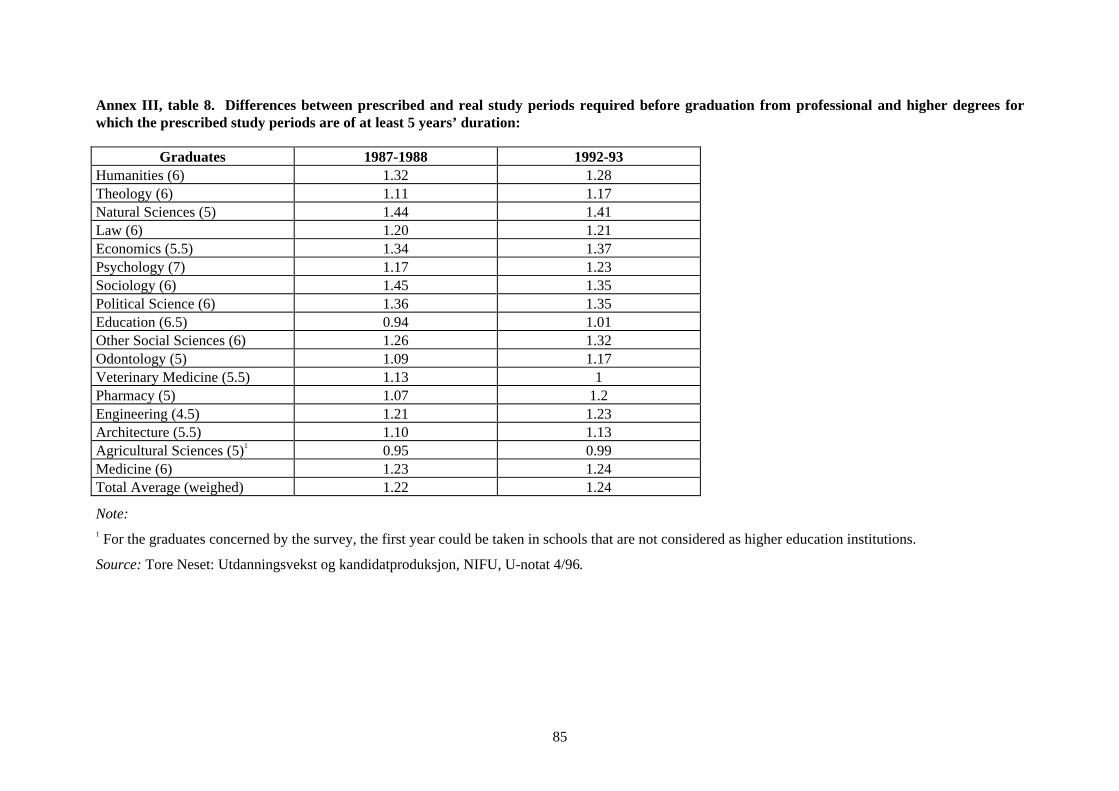
85
Annex III, table 8. Differences between prescribed and real study periods required before graduation from professional and higher degrees forwhich the prescribed study periods are of at least 5 years’ duration:
Graduates 1987-1988 1992-93Humanities (6) 1.32 1.28Theology (6) 1.11 1.17Natural Sciences (5) 1.44 1.41Law (6) 1.20 1.21Economics (5.5) 1.34 1.37Psychology (7) 1.17 1.23Sociology (6) 1.45 1.35Political Science (6) 1.36 1.35Education (6.5) 0.94 1.01Other Social Sciences (6) 1.26 1.32Odontology (5) 1.09 1.17Veterinary Medicine (5.5) 1.13 1Pharmacy (5) 1.07 1.2Engineering (4.5) 1.21 1.23Architecture (5.5) 1.10 1.13Agricultural Sciences (5)1 0.95 0.99Medicine (6) 1.23 1.24Total Average (weighed) 1.22 1.24
Note:1 For the graduates concerned by the survey, the first year could be taken in schools that are not considered as higher education institutions.
Source:Tore Neset: Utdanningsvekst og kandidatproduksjon, NIFU, U-notat 4/96.
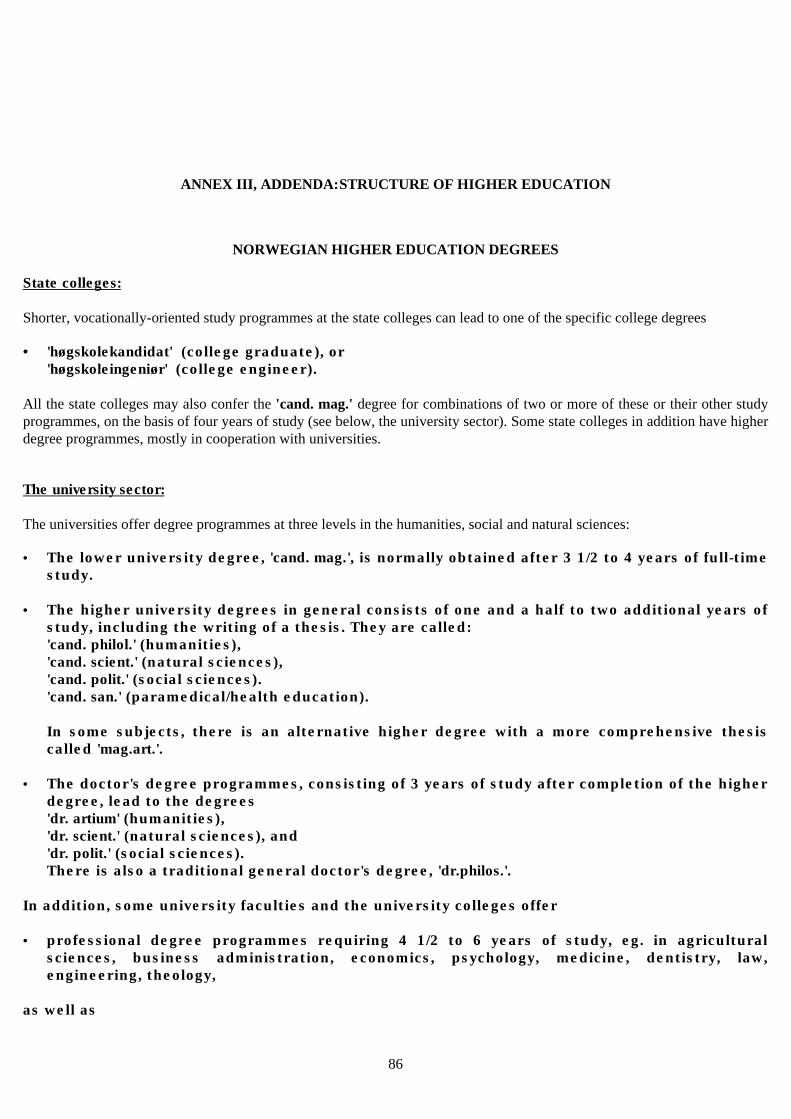
86
ANNEX III, ADDENDA:STRUCTURE OF HIGHER EDUCATION
NORWEGIAN HIGHER EDUCATION DEGREES
State colleges:
Shorter, vocationally-oriented study programmes at the state colleges can lead to one of the specific college degrees
• 'høgskolekandidat' (college graduate), or'høgskoleingeniør' (college engineer).
All the state colleges may also confer the'cand. mag.' degree for combinations of two or more of these or their other studyprogrammes, on the basis of four years of study (see below, the university sector). Some state colleges in addition have higherdegree programmes, mostly in cooperation with universities.
The university sector:
The universities offer degree programmes at three levels in the humanities, social and natural sciences:
• The lower university degree, 'cand. mag.', is normally obtained after 3 1/2 to 4 years of full-timestudy.
• The higher university degrees in general consists of one and a half to two additional years ofstudy, including the writing of a thesis. They are called:'cand. philol.' (humanities),'cand. scient.' (natural sciences),'cand. polit.' (social sciences).'cand. san.' (paramedical/health education).
In some subjects, there is an alternative higher degree with a more comprehensive thesiscalled 'mag.art.'.
• The doctor's degree programmes, consisting of 3 years of study after completion of the higherdegree, lead to the degrees'dr. artium' (humanities),'dr. scient.' (natural sciences), and'dr. polit.' (social sciences).There is also a traditional general doctor's degree, 'dr.philos.'.
In addition, some university faculties and the university colleges offer
• professional degree programmes requiring 4 1/2 to 6 years of study, eg. in agriculturalsciences, business administration, economics, psychology, medicine, dentistry, law,engineering, theology,
as well as
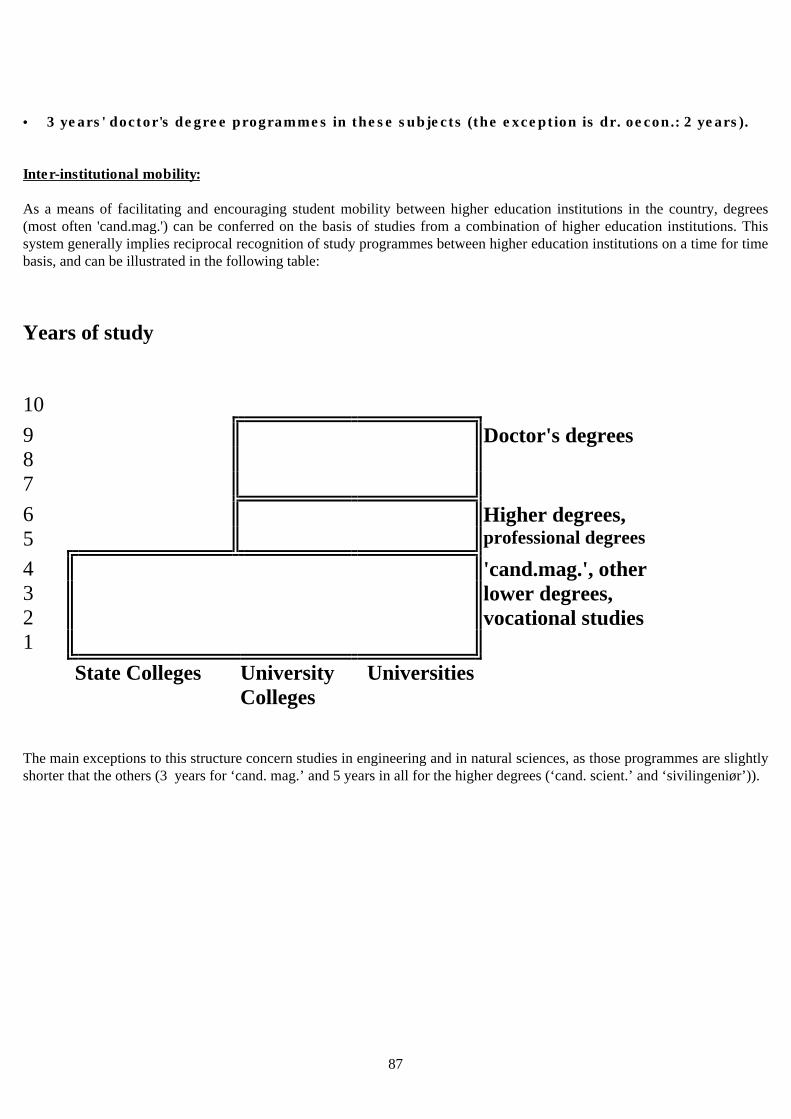
87
• 3 years' doctor's degree programmes in these subjects (the exception is dr. oecon.: 2 years).
Inter-institutional mobility:
As a means of facilitating and encouraging student mobility between higher education institutions in the country, degrees(most often 'cand.mag.') can be conferred on the basis of studies from a combination of higher education institutions. Thissystem generally implies reciprocal recognition of study programmes between higher education institutions on a time for timebasis, and can be illustrated in the following table:
Years of study
10
9 Doctor's degrees87
6 Higher degrees,5 professional degrees
4 'cand.mag.', other3 lower degrees,2 vocational studies1
State Colleges UniversityColleges
Universities
The main exceptions to this structure concern studies in engineering and in natural sciences, as those programmes are slightlyshorter that the others (3 years for ‘cand. mag.’ and 5 years in all for the higher degrees (‘cand. scient.’ and ‘sivilingeniør’)).
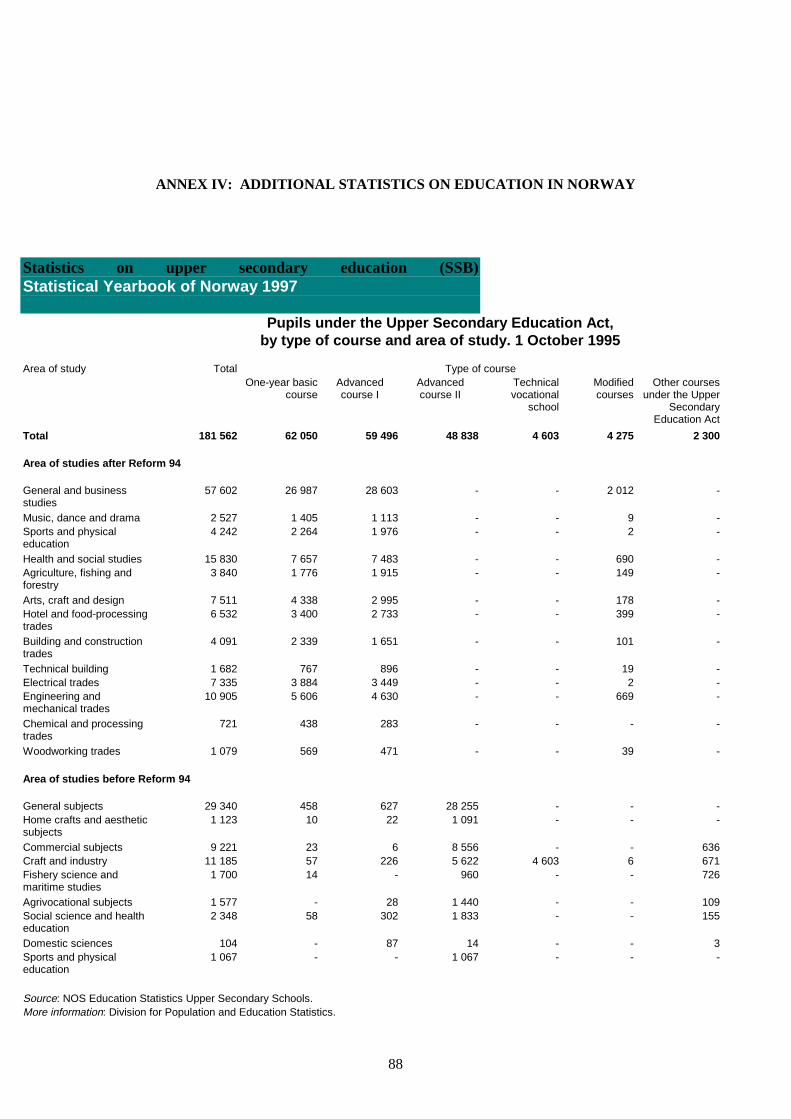
88
ANNEX IV: ADDITIONAL STATISTICS ON EDUCATION IN NORWAY
Statistics on upper secondary education (SSB)Statistical Yearbook of Norway 1997
Pupils under the Upper Secondary Education Act,by type of course and area of study. 1 October 1995
Area of study Total Type of courseOne-year basic
courseAdvancedcourse I
Advancedcourse II
Technicalvocational
school
Modifiedcourses
Other coursesunder the Upper
SecondaryEducation Act
Total 181 562 62 050 59 496 48 838 4 603 4 275 2 300
Area of studies after Reform 94
General and businessstudies
57 602 26 987 28 603 - - 2 012 -
Music, dance and drama 2 527 1 405 1 113 - - 9 -Sports and physicaleducation
4 242 2 264 1 976 - - 2 -
Health and social studies 15 830 7 657 7 483 - - 690 -Agriculture, fishing andforestry
3 840 1 776 1 915 - - 149 -
Arts, craft and design 7 511 4 338 2 995 - - 178 -Hotel and food-processingtrades
6 532 3 400 2 733 - - 399 -
Building and constructiontrades
4 091 2 339 1 651 - - 101 -
Technical building 1 682 767 896 - - 19 -Electrical trades 7 335 3 884 3 449 - - 2 -Engineering andmechanical trades
10 905 5 606 4 630 - - 669 -
Chemical and processingtrades
721 438 283 - - - -
Woodworking trades 1 079 569 471 - - 39 -
Area of studies before Reform 94
General subjects 29 340 458 627 28 255 - - -Home crafts and aestheticsubjects
1 123 10 22 1 091 - - -
Commercial subjects 9 221 23 6 8 556 - - 636Craft and industry 11 185 57 226 5 622 4 603 6 671Fishery science andmaritime studies
1 700 14 - 960 - - 726
Agrivocational subjects 1 577 - 28 1 440 - - 109Social science and healtheducation
2 348 58 302 1 833 - - 155
Domestic sciences 104 - 87 14 - - 3Sports and physicaleducation
1 067 - - 1 067 - - -
Source: NOS Education Statistics Upper Secondary Schools.More information: Division for Population and Education Statistics.
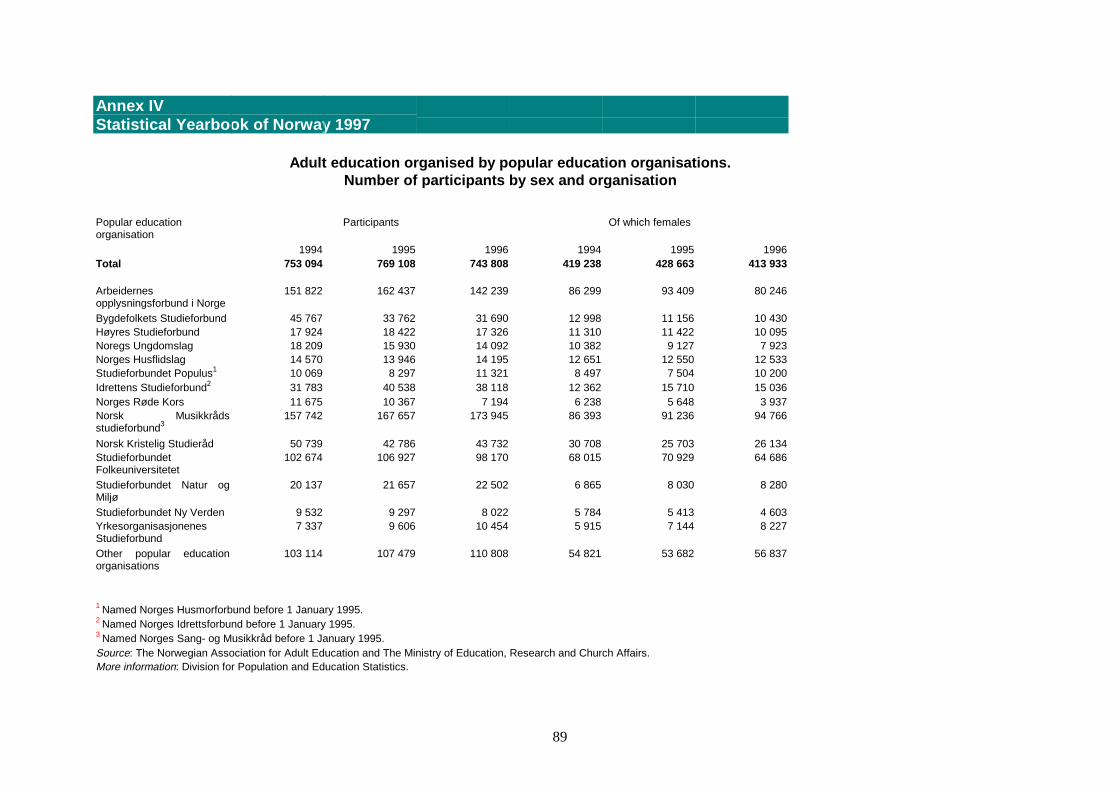
89
Annex IVStatistical Yearbook of Norway 1997
Adult education organised by popular education organisations.Number of participants by sex and organisation
Popular educationorganisation
Participants Of which females
1994 1995 1996 1994 1995 1996Total 753 094 769 108 743 808 419 238 428 663 413 933
Arbeidernesopplysningsforbund i Norge
151 822 162 437 142 239 86 299 93 409 80 246
Bygdefolkets Studieforbund 45 767 33 762 31 690 12 998 11 156 10 430Høyres Studieforbund 17 924 18 422 17 326 11 310 11 422 10 095Noregs Ungdomslag 18 209 15 930 14 092 10 382 9 127 7 923Norges Husflidslag 14 570 13 946 14 195 12 651 12 550 12 533Studieforbundet Populus1 10 069 8 297 11 321 8 497 7 504 10 200Idrettens Studieforbund2 31 783 40 538 38 118 12 362 15 710 15 036Norges Røde Kors 11 675 10 367 7 194 6 238 5 648 3 937Norsk Musikkrådsstudieforbund3
157 742 167 657 173 945 86 393 91 236 94 766
Norsk Kristelig Studieråd 50 739 42 786 43 732 30 708 25 703 26 134StudieforbundetFolkeuniversitetet
102 674 106 927 98 170 68 015 70 929 64 686
Studieforbundet Natur ogMiljø
20 137 21 657 22 502 6 865 8 030 8 280
Studieforbundet Ny Verden 9 532 9 297 8 022 5 784 5 413 4 603YrkesorganisasjonenesStudieforbund
7 337 9 606 10 454 5 915 7 144 8 227
Other popular educationorganisations
103 114 107 479 110 808 54 821 53 682 56 837
1 Named Norges Husmorforbund before 1 January 1995.2 Named Norges Idrettsforbund before 1 January 1995.3 Named Norges Sang- og Musikkråd before 1 January 1995.Source: The Norwegian Association for Adult Education and The Ministry of Education, Research and Church Affairs.More information: Division for Population and Education Statistics.
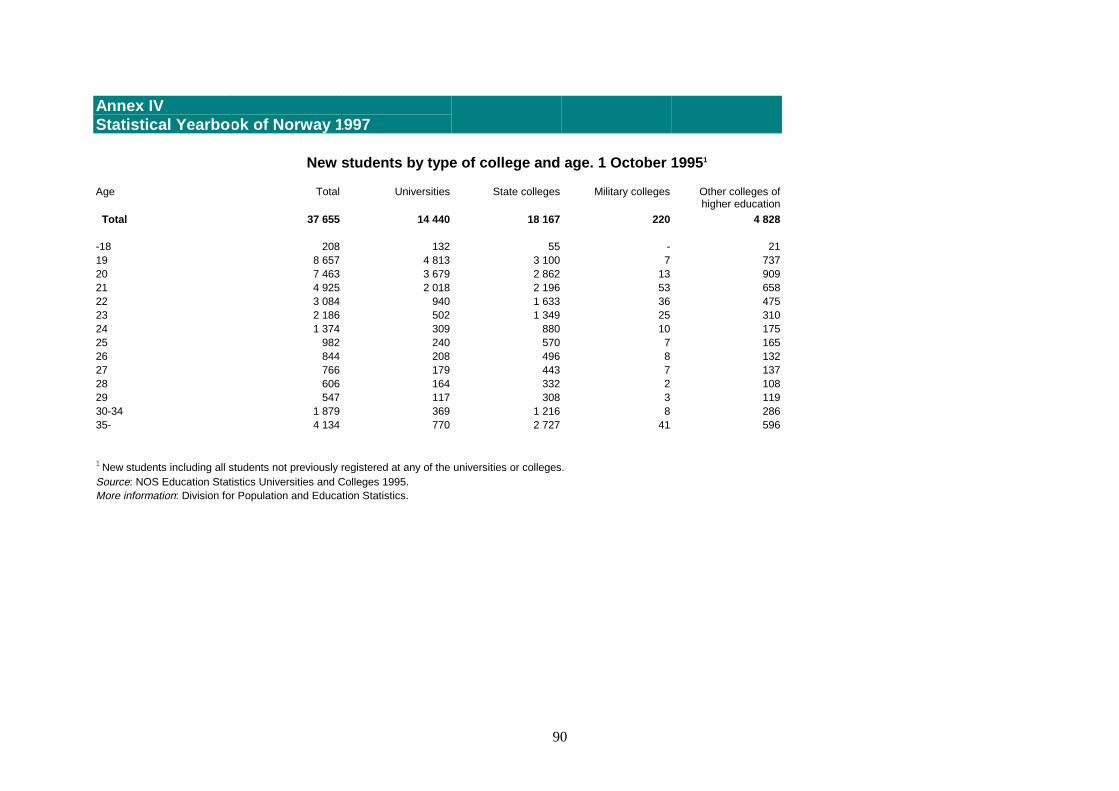
90
Annex IVStatistical Yearbook of Norway 1997
New students by type of college and age. 1 October 1995 1
Age Total Universities State colleges Military colleges Other colleges ofhigher education
Total 37 655 14 440 18 167 220 4 828
-18 208 132 55 - 2119 8 657 4 813 3 100 7 73720 7 463 3 679 2 862 13 90921 4 925 2 018 2 196 53 65822 3 084 940 1 633 36 47523 2 186 502 1 349 25 31024 1 374 309 880 10 17525 982 240 570 7 16526 844 208 496 8 13227 766 179 443 7 13728 606 164 332 2 10829 547 117 308 3 11930-34 1 879 369 1 216 8 28635- 4 134 770 2 727 41 596
1 New students including all students not previously registered at any of the universities or colleges.Source: NOS Education Statistics Universities and Colleges 1995.More information: Division for Population and Education Statistics.
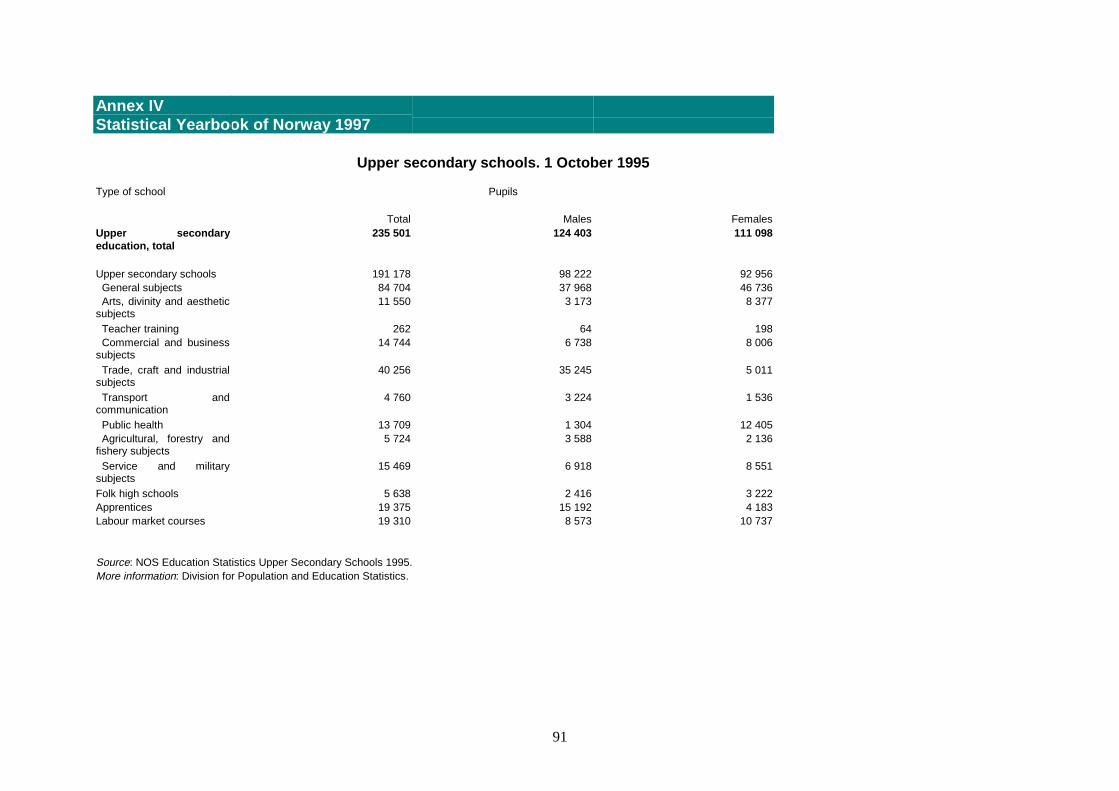
91
Annex IVStatistical Yearbook of Norway 1997
Upper secondary schools. 1 October 1995
Type of school Pupils
Total Males FemalesUpper secondaryeducation, total
235 501 124 403 111 098
Upper secondary schools 191 178 98 222 92 956General subjects 84 704 37 968 46 736Arts, divinity and aesthetic
subjects11 550 3 173 8 377
Teacher training 262 64 198Commercial and business
subjects14 744 6 738 8 006
Trade, craft and industrialsubjects
40 256 35 245 5 011
Transport andcommunication
4 760 3 224 1 536
Public health 13 709 1 304 12 405Agricultural, forestry and
fishery subjects5 724 3 588 2 136
Service and militarysubjects
15 469 6 918 8 551
Folk high schools 5 638 2 416 3 222Apprentices 19 375 15 192 4 183Labour market courses 19 310 8 573 10 737
Source: NOS Education Statistics Upper Secondary Schools 1995.More information: Division for Population and Education Statistics.
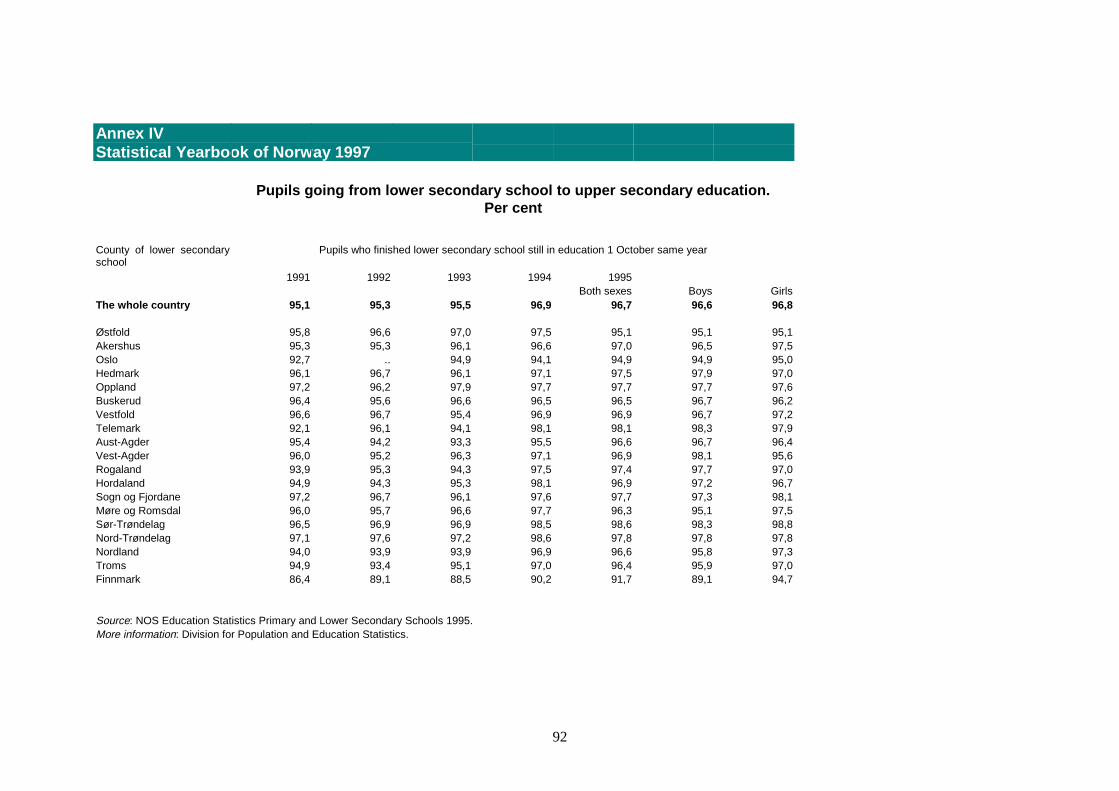
92
Annex IVStatistical Yearbook of Norway 1997
Pupils going from lower secondary school to upper secondary education.Per cent
County of lower secondaryschool
Pupils who finished lower secondary school still in education 1 October same year
1991 1992 1993 1994 1995Both sexes Boys Girls
The whole country 95,1 95,3 95,5 96,9 96,7 96,6 96,8
Østfold 95,8 96,6 97,0 97,5 95,1 95,1 95,1Akershus 95,3 95,3 96,1 96,6 97,0 96,5 97,5Oslo 92,7 .. 94,9 94,1 94,9 94,9 95,0Hedmark 96,1 96,7 96,1 97,1 97,5 97,9 97,0Oppland 97,2 96,2 97,9 97,7 97,7 97,7 97,6Buskerud 96,4 95,6 96,6 96,5 96,5 96,7 96,2Vestfold 96,6 96,7 95,4 96,9 96,9 96,7 97,2Telemark 92,1 96,1 94,1 98,1 98,1 98,3 97,9Aust-Agder 95,4 94,2 93,3 95,5 96,6 96,7 96,4Vest-Agder 96,0 95,2 96,3 97,1 96,9 98,1 95,6Rogaland 93,9 95,3 94,3 97,5 97,4 97,7 97,0Hordaland 94,9 94,3 95,3 98,1 96,9 97,2 96,7Sogn og Fjordane 97,2 96,7 96,1 97,6 97,7 97,3 98,1Møre og Romsdal 96,0 95,7 96,6 97,7 96,3 95,1 97,5Sør-Trøndelag 96,5 96,9 96,9 98,5 98,6 98,3 98,8Nord-Trøndelag 97,1 97,6 97,2 98,6 97,8 97,8 97,8Nordland 94,0 93,9 93,9 96,9 96,6 95,8 97,3Troms 94,9 93,4 95,1 97,0 96,4 95,9 97,0Finnmark 86,4 89,1 88,5 90,2 91,7 89,1 94,7
Source: NOS Education Statistics Primary and Lower Secondary Schools 1995.More information: Division for Population and Education Statistics.
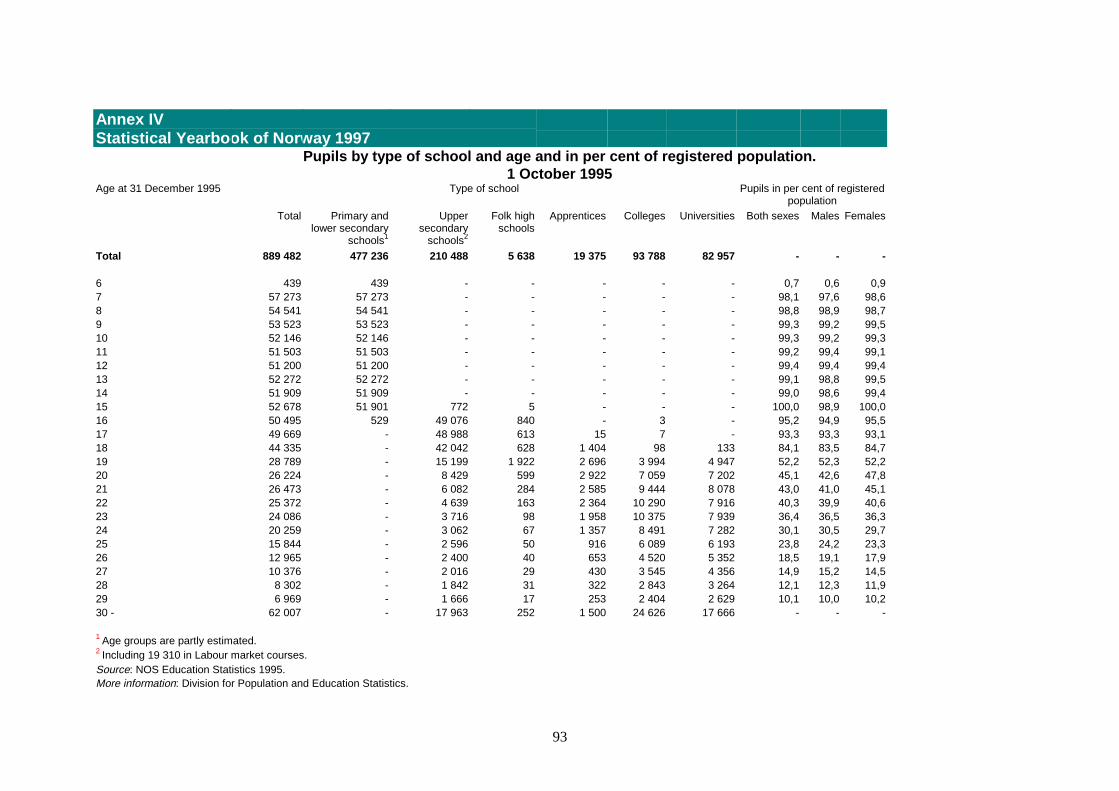
93
Annex IVStatistical Yearbook of Norway 1997
Pupils by type of school and age and in per cent of registered population.1 October 1995
Age at 31 December 1995 Type of school Pupils in per cent of registeredpopulation
Total Primary andlower secondary
schools1
Uppersecondary
schools2
Folk highschools
Apprentices Colleges Universities Both sexes Males Females
Total 889 482 477 236 210 488 5 638 19 375 93 788 82 957 - - -
6 439 439 - - - - - 0,7 0,6 0,97 57 273 57 273 - - - - - 98,1 97,6 98,68 54 541 54 541 - - - - - 98,8 98,9 98,79 53 523 53 523 - - - - - 99,3 99,2 99,510 52 146 52 146 - - - - - 99,3 99,2 99,311 51 503 51 503 - - - - - 99,2 99,4 99,112 51 200 51 200 - - - - - 99,4 99,4 99,413 52 272 52 272 - - - - - 99,1 98,8 99,514 51 909 51 909 - - - - - 99,0 98,6 99,415 52 678 51 901 772 5 - - - 100,0 98,9 100,016 50 495 529 49 076 840 - 3 - 95,2 94,9 95,517 49 669 - 48 988 613 15 7 - 93,3 93,3 93,118 44 335 - 42 042 628 1 404 98 133 84,1 83,5 84,719 28 789 - 15 199 1 922 2 696 3 994 4 947 52,2 52,3 52,220 26 224 - 8 429 599 2 922 7 059 7 202 45,1 42,6 47,821 26 473 - 6 082 284 2 585 9 444 8 078 43,0 41,0 45,122 25 372 - 4 639 163 2 364 10 290 7 916 40,3 39,9 40,623 24 086 - 3 716 98 1 958 10 375 7 939 36,4 36,5 36,324 20 259 - 3 062 67 1 357 8 491 7 282 30,1 30,5 29,725 15 844 - 2 596 50 916 6 089 6 193 23,8 24,2 23,326 12 965 - 2 400 40 653 4 520 5 352 18,5 19,1 17,927 10 376 - 2 016 29 430 3 545 4 356 14,9 15,2 14,528 8 302 - 1 842 31 322 2 843 3 264 12,1 12,3 11,929 6 969 - 1 666 17 253 2 404 2 629 10,1 10,0 10,230 - 62 007 - 17 963 252 1 500 24 626 17 666 - - -
1 Age groups are partly estimated.2 Including 19 310 in Labour market courses.Source: NOS Education Statistics 1995.More information: Division for Population and Education Statistics.
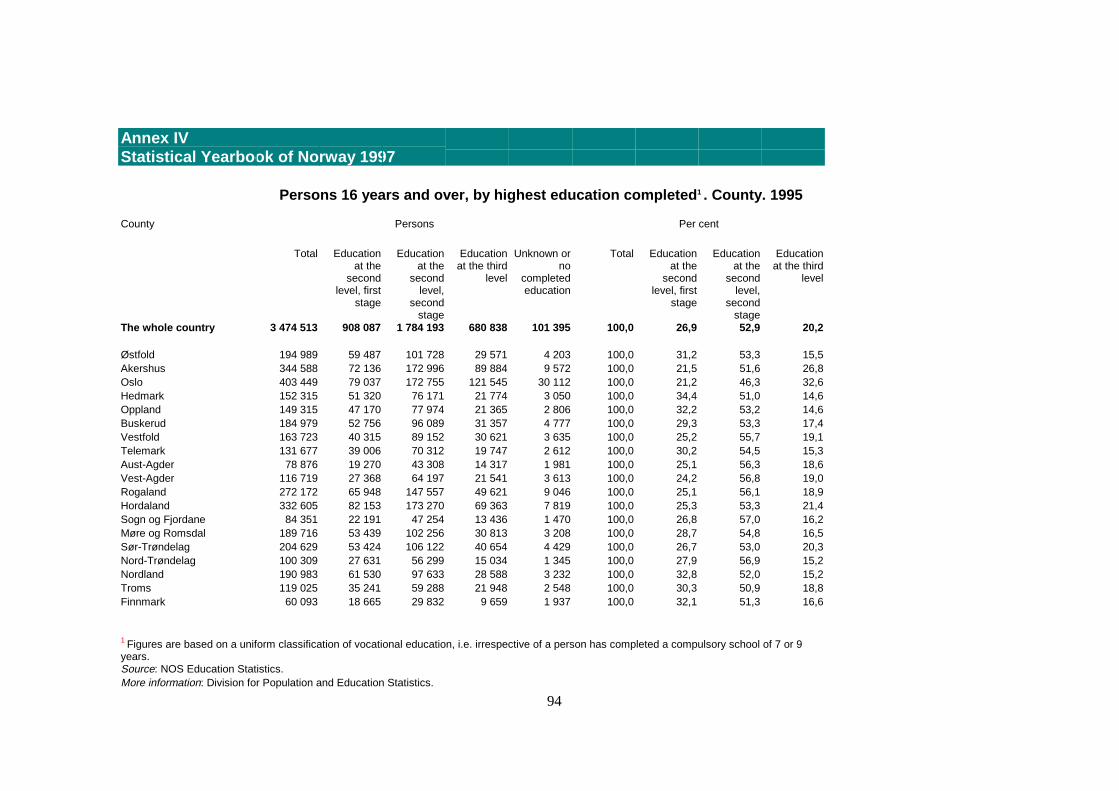
94
Annex IVStatistical Yearbook of Norway 1997
Persons 16 years and over, by highest education completed 1 . County. 1995
County Persons Per cent
Total Educationat the
secondlevel, first
stage
Educationat the
secondlevel,
secondstage
Educationat the third
level
Unknown orno
completededucation
Total Educationat the
secondlevel, first
stage
Educationat the
secondlevel,
secondstage
Educationat the third
level
The whole country 3 474 513 908 087 1 784 193 680 838 101 395 100,0 26,9 52,9 20,2
Østfold 194 989 59 487 101 728 29 571 4 203 100,0 31,2 53,3 15,5Akershus 344 588 72 136 172 996 89 884 9 572 100,0 21,5 51,6 26,8Oslo 403 449 79 037 172 755 121 545 30 112 100,0 21,2 46,3 32,6Hedmark 152 315 51 320 76 171 21 774 3 050 100,0 34,4 51,0 14,6Oppland 149 315 47 170 77 974 21 365 2 806 100,0 32,2 53,2 14,6Buskerud 184 979 52 756 96 089 31 357 4 777 100,0 29,3 53,3 17,4Vestfold 163 723 40 315 89 152 30 621 3 635 100,0 25,2 55,7 19,1Telemark 131 677 39 006 70 312 19 747 2 612 100,0 30,2 54,5 15,3Aust-Agder 78 876 19 270 43 308 14 317 1 981 100,0 25,1 56,3 18,6Vest-Agder 116 719 27 368 64 197 21 541 3 613 100,0 24,2 56,8 19,0Rogaland 272 172 65 948 147 557 49 621 9 046 100,0 25,1 56,1 18,9Hordaland 332 605 82 153 173 270 69 363 7 819 100,0 25,3 53,3 21,4Sogn og Fjordane 84 351 22 191 47 254 13 436 1 470 100,0 26,8 57,0 16,2Møre og Romsdal 189 716 53 439 102 256 30 813 3 208 100,0 28,7 54,8 16,5Sør-Trøndelag 204 629 53 424 106 122 40 654 4 429 100,0 26,7 53,0 20,3Nord-Trøndelag 100 309 27 631 56 299 15 034 1 345 100,0 27,9 56,9 15,2Nordland 190 983 61 530 97 633 28 588 3 232 100,0 32,8 52,0 15,2Troms 119 025 35 241 59 288 21 948 2 548 100,0 30,3 50,9 18,8Finnmark 60 093 18 665 29 832 9 659 1 937 100,0 32,1 51,3 16,6
1 Figures are based on a uniform classification of vocational education, i.e. irrespective of a person has completed a compulsory school of 7 or 9years.Source: NOS Education Statistics.More information: Division for Population and Education Statistics.
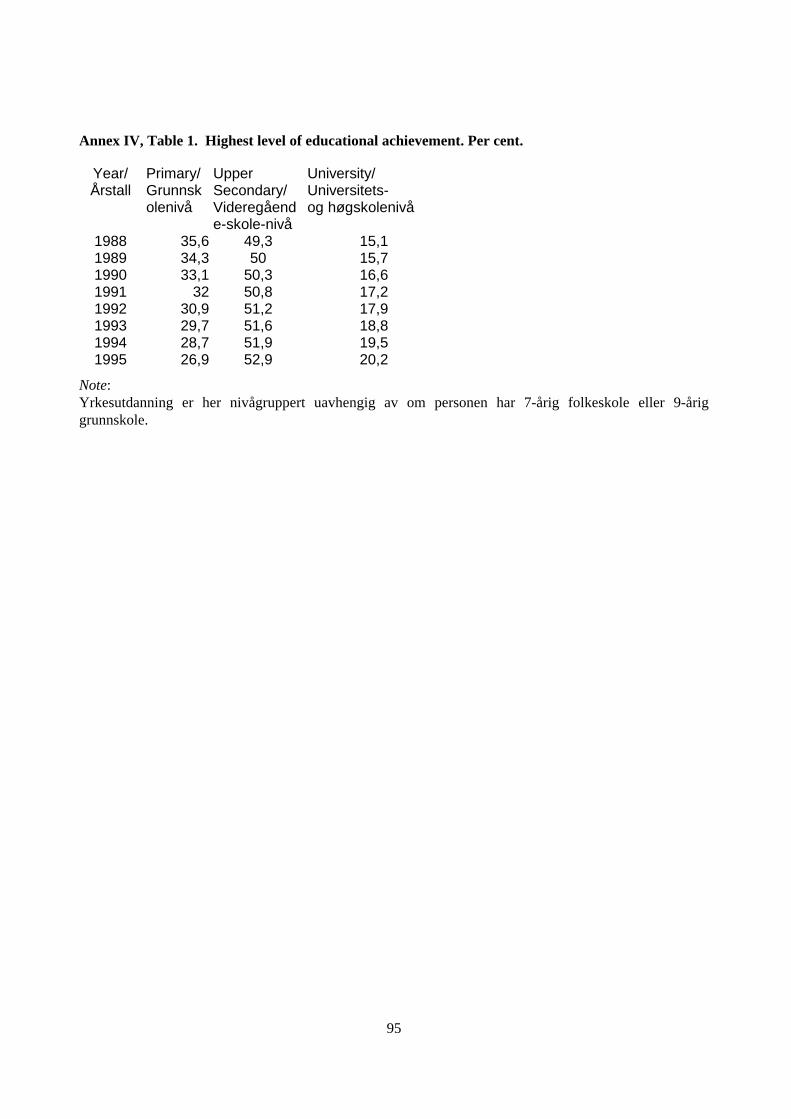
95
Annex IV, Table 1. Highest level of educational achievement. Per cent.
Year/Årstall
Primary/Grunnskolenivå
UpperSecondary/Videregående-skole-nivå
University/Universitets-og høgskolenivå
1988 35,6 49,3 15,11989 34,3 50 15,71990 33,1 50,3 16,61991 32 50,8 17,21992 30,9 51,2 17,91993 29,7 51,6 18,81994 28,7 51,9 19,51995 26,9 52,9 20,2
Note:Yrkesutdanning er her nivågruppert uavhengig av om personen har 7-årig folkeskole eller 9-åriggrunnskole.
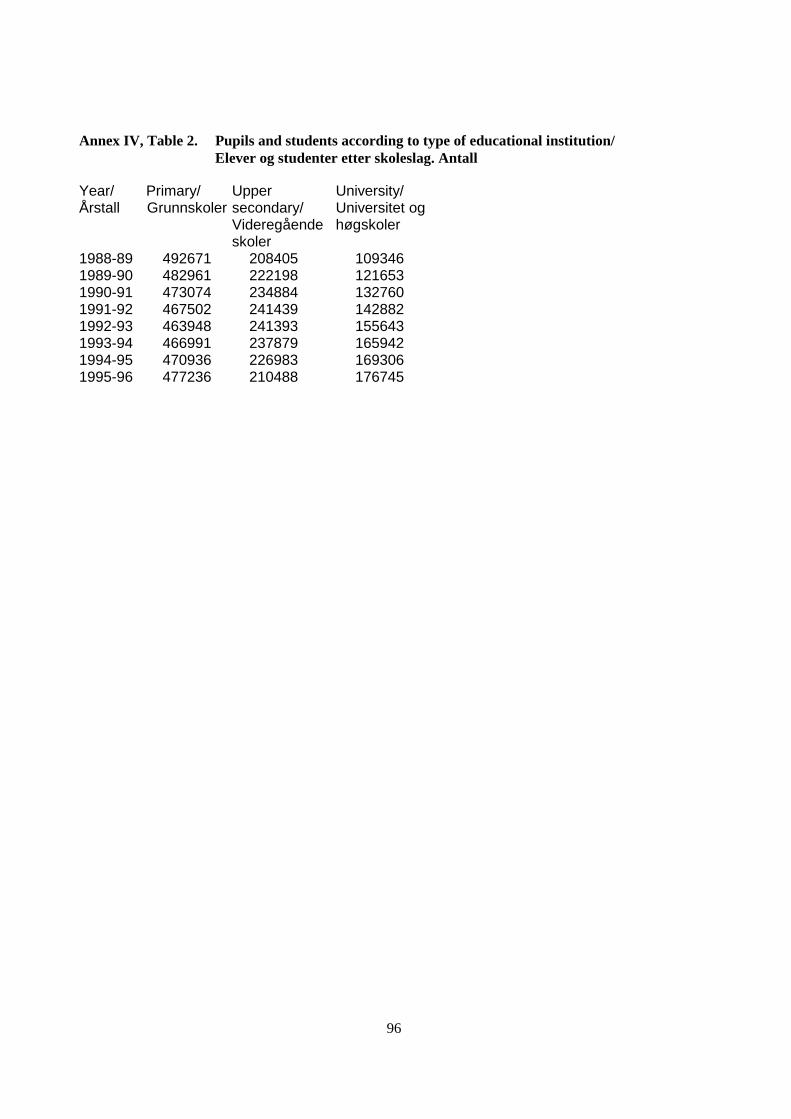
96
Annex IV, Table 2. Pupils and students according to type of educational institution/Elever og studenter etter skoleslag. Antall
Year/Årstall
Primary/Grunnskoler
Uppersecondary/Videregåendeskoler
University/Universitet oghøgskoler
1988-89 492671 208405 1093461989-90 482961 222198 1216531990-91 473074 234884 1327601991-92 467502 241439 1428821992-93 463948 241393 1556431993-94 466991 237879 1659421994-95 470936 226983 1693061995-96 477236 210488 176745
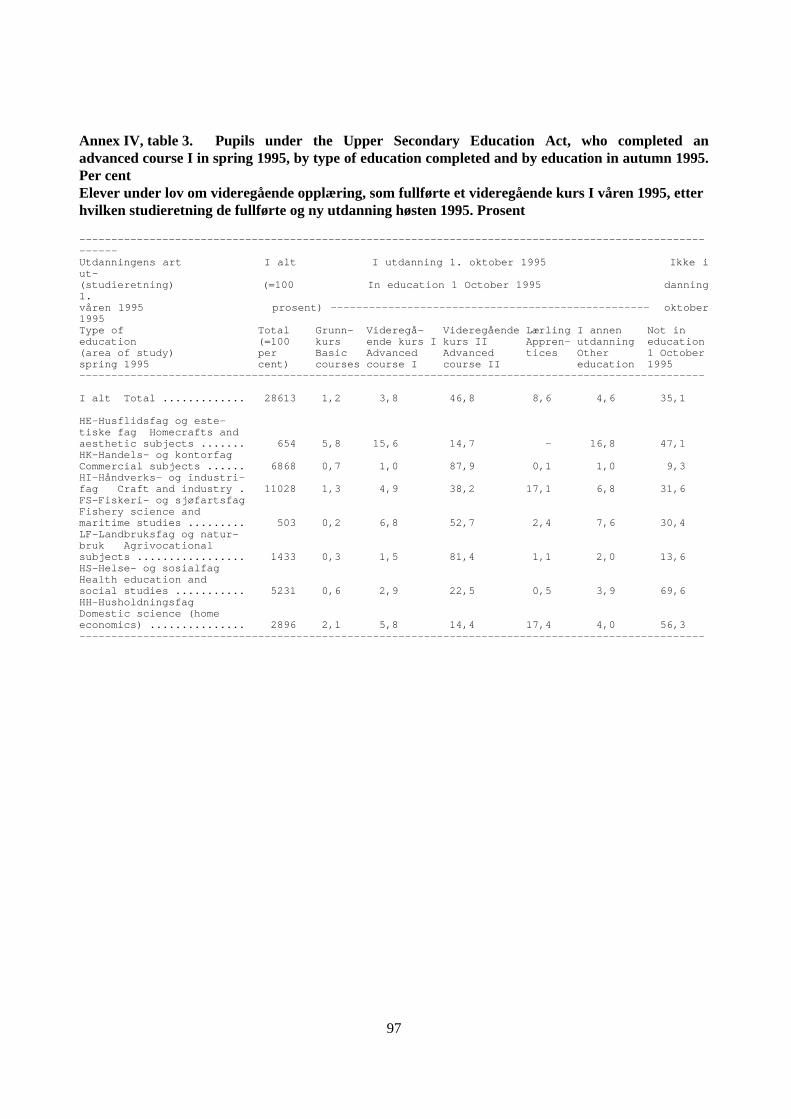
97
Annex IV, table 3. Pupils under the Upper Secondary Education Act, who completed anadvanced course I in spring 1995, by type of education completed and by education in autumn 1995.Per centElever under lov om videregående opplæring, som fullførte et videregående kurs I våren 1995, etterhvilken studieretning de fullførte og ny utdanning høsten 1995. Prosent
————————————————————————————————————————————————————————————————————————————————————————————————————————Utdanningens art I alt I utdanning 1. oktober 1995 Ikke iut-(studieretning) (=100 In education 1 October 1995 danning1.våren 1995 prosent) —————————————————————————————————————————————————— oktober1995Type of Total Grunn- Videregå- Videregående Lærling I annen Not ineducation (=100 kurs ende kurs I kurs II Appren- utdanning education(area of study) per Basic Advanced Advanced tices Other 1 Octoberspring 1995 cent) courses course I course II education 1995——————————————————————————————————————————————————————————————————————————————————————————————————
I alt Total ............. 28613 1,2 3,8 46,8 8,6 4,6 35,1
HE-Husflidsfag og este-tiske fag Homecrafts andaesthetic subjects ....... 654 5,8 15,6 14,7 - 16,8 47,1HK-Handels- og kontorfagCommercial subjects ...... 6868 0,7 1,0 87,9 0,1 1,0 9,3HI-Håndverks- og industri-fag Craft and industry . 11028 1,3 4,9 38,2 17,1 6,8 31,6FS-Fiskeri- og sjøfartsfagFishery science andmaritime studies ......... 503 0,2 6,8 52,7 2,4 7,6 30,4LF-Landbruksfag og natur-bruk Agrivocationalsubjects ................. 1433 0,3 1,5 81,4 1,1 2,0 13,6HS-Helse- og sosialfagHealth education andsocial studies ........... 5231 0,6 2,9 22,5 0,5 3,9 69,6HH-HusholdningsfagDomestic science (homeeconomics) ............... 2896 2,1 5,8 14,4 17,4 4,0 56,3——————————————————————————————————————————————————————————————————————————————————————————————————