Norway 2022 - NET
147
Energy Policy Review Norway 2022
-
Upload
khangminh22 -
Category
Documents
-
view
1 -
download
0
Transcript of Norway 2022 - NET
Energy Policy ReviewNorway 2022
The IEA examines the full spectrum of energy issues including oil, gas and coal supply and demand, renewable energy technologies, electricity markets, energy efficiency, access to energy, demand side management and much more. Through its work, the IEA advocates policies that will enhance the reliability, affordability and sustainability of energy in its 31 member countries, 10 association countries and beyond.
Please note that this publication is subject to specific restrictions that limit its use and distribution. The terms and conditions are available online at www.iea.org/t&c/
This publication and any map included herein are without prejudice to the status of or sovereignty over any territory, to the delimitation of international frontiers and boundaries and to the name of any territory, city or area.
Source: IEA. All rights reserved.International Energy Agency Website: www.iea.org
IEA member countries:
Australia Austria Belgium CanadaCzech Republic Denmark EstoniaFinland France Germany Greece HungaryIreland ItalyJapanKoreaLithuania Luxembourg Mexico Netherlands New Zealand NorwayPoland Portugal Slovak Republic Spain Sweden Switzerland Turkey United Kingdom United States
The European Commission also participates in the work of the IEA
IEA association countries:
INTERNATIONAL ENERGYAGENCY
ArgentinaBrazilChinaEgyptIndiaIndonesiaMoroccoSingaporeSouth AfricaThailand
3
FOR
EWO
RD
Foreword The International Energy Agency (IEA) has conducted in-depth peer reviews of its member countries’ energy policies since 1976. This process supports energy policy development and encourages the exchange of and learning from international best practices. By seeing what has worked – or not – in the “real world”, these reviews help to identify policies that deliver concrete results.
Since the last IEA in-depth review in 2017, Norway has remained a global pillar of energy security, providing the world with stable supplies of oil and gas produced in an environmentally responsible manner. Thanks to its ample reserves of oil and natural gas, Norway remains a significant international supplier, with close to 90% of its energy production exported.
I am grateful to Norway’s Minister of Petroleum and Energy, Terje Aasland, for his government’s leadership on energy and climate issues and support for key IEA initiatives. In particular, I commend Norway’s efforts to augment its near-term oil and gas production in response to Russia’s invasion of Ukraine, helping to stabilise global supplies, especially to its European neighbours. At the same time, Norway has advanced efforts to reduce greenhouse gas emissions, including methane, from oil and gas production, especially using electrification of offshore platforms.
Norway has updated its already ambitious climate targets with plans to reduce greenhouse gas emissions by 90-95% from 1990 levels by 2050, excluding carbon sinks. The country’s robust carbon pricing system provides a solid basis for delivering on this goal. Nonetheless, Norway has considerable work ahead to meet its ambitious climate targets. Since its electricity generation from hydropower already produces zero emissions and the country has substantially electrified its buildings sector and almost half of industry, many of the easy wins for reducing emissions have already been achieved. The remaining reductions will be more complex, challenging and costly, notably in transport and industry. Norway has an opportunity, therefore, to show the world how to undertake complex emissions reductions, as all countries will eventually face this issue.
Norway’s existing expertise can help it achieve a successful energy and climate transition. And its longstanding work supporting economic development and poverty eradication around the world, notably in Africa, puts it in a strong position to help advance clean energy transitions in emerging and developing economies. If the right policies and incentives are put in place, Norway is well placed to lead the world in decarbonising a wide range of sectors through technologies such as electric vehicles, carbon capture, utilisation and storage, and hydrogen. Norway is already a leader in carbon capture, and its impressive Longship project will further help to advance this technology for the world. Leveraging its renewables-based electricity system, Norway can further support sectoral transitions by developing detailed, long-term roadmaps backed by specific policy measures.
I sincerely hope that the recommendations proposed in this report will help Norway in its energy system transformation, resulting in clean energy progress that spreads well beyond its borders.
Dr. Fatih Birol
Executive Director
International Energy Agency
IEA.
All
right
s re
serv
ed.
5
TABL
E O
F C
ON
TEN
TS
ENERGY INSIGHTS
Foreword ........................................................................................................................... 3
1. Executive summary .................................................................................................... 9
Overview ........................................................................................................................... 9
Climate change policies .................................................................................................. 10
Energy efficiency ............................................................................................................ 11
Electricity in the energy transition ................................................................................... 11
Oil and gas sector ........................................................................................................... 12
Energy research and innovation ..................................................................................... 13
Key Recommendations: .................................................................................................. 14
2. General energy policy .............................................................................................. 15
Country overview ............................................................................................................ 15
Energy supply and demand ............................................................................................ 17
Assessment .................................................................................................................... 28
Recommendations .......................................................................................................... 33
ENERGY SYSTEM TRANSFORMATION
3. Energy and climate change ..................................................................................... 35
Overview ......................................................................................................................... 35
Energy-related CO2 emissions ........................................................................................ 36
CO2 emissions drivers and carbon intensity ................................................................... 37
Climate change targets ................................................................................................... 38
Climate change policies .................................................................................................. 39
Climate adaptation and resilience ................................................................................... 49
Assessment .................................................................................................................... 50
Recommendations .......................................................................................................... 54
4. Energy efficiency ...................................................................................................... 57
Overview ......................................................................................................................... 57
Industry ........................................................................................................................... 59
Buildings and district heating .......................................................................................... 62
Transport ........................................................................................................................ 65
Assessment .................................................................................................................... 68
Recommendations .......................................................................................................... 71
IEA.
All
right
s re
serv
ed.
TABLE OF CONTENTS
6
5. Renewable energy .................................................................................................... 73
Overview ......................................................................................................................... 73
Renewable electricity ...................................................................................................... 74
Renewable energy policies ............................................................................................. 75
Assessment .................................................................................................................... 81
Recommendations .......................................................................................................... 85
6. Energy research, development and innovation ..................................................... 87
Overview ......................................................................................................................... 87
Key actors in Norway’s energy innovation landscape ..................................................... 88
Energy innovation priorities and guiding documents ....................................................... 89
RD&D spending .............................................................................................................. 91
Monitoring, evaluation and tracking of results ................................................................. 96
Noteworthy RD&D projects ............................................................................................. 96
International collaboration ............................................................................................... 97
Assessment .................................................................................................................... 98
Recommendations ........................................................................................................ 100
ENERGY SECURITY
7. Electricity ................................................................................................................. 103
Overview ....................................................................................................................... 103
Electricity supply and demand ...................................................................................... 104
Electricity generation outlook ........................................................................................ 106
Transmission and distribution ....................................................................................... 107
Cross-border interconnections ...................................................................................... 108
Market structure and regulation .................................................................................... 110
Electricity prices ............................................................................................................ 112
Electricity security and emergency response ................................................................ 114
Assessment .................................................................................................................. 117
Recommendations ........................................................................................................ 119
8. Oil and natural gas .................................................................................................. 121
Overview ....................................................................................................................... 121
Upstream policies and regulations ................................................................................ 122
Oil and gas exports ....................................................................................................... 129
Natural gas supply and demand ................................................................................... 129
Oil products supply and demand .................................................................................. 130
Biofuels ......................................................................................................................... 132
IEA.
All
right
s re
serv
ed.

TABLE OF CONTENTS
7
TABL
E O
F C
OTE
NTS
Oil market structure ...................................................................................................... 132
Oil infrastructure ........................................................................................................... 134
Oil emergency policies .................................................................................................. 135
Assessment .................................................................................................................. 137
Recommendations: ....................................................................................................... 139
ANNEXES
ANNEX A: Review team and supporting stakeholders ................................................. 141
ANNEX B: Energy balances and key statistical data .................................................... 143
ANNEX C: Glossary and list of abbreviations ............................................................... 147
LIST OF FIGURES, TABLES AND BOXES
Figures
Figure 2.1 Map of Norway ............................................................................................. 16 Figure 2.2 Overview of energy production, supply and demand in Norway, 2020 ......... 17 Figure 2.3 Energy production by source in Norway, 2000-2020 .................................... 18 Figure 2.4 Norway’s energy import self-sufficiency, 2000-2020 .................................... 19 Figure 2.5 Total energy supply by source in Norway, 2000-2020 .................................. 19 Figure 2.6 Total final consumption by source in Norway, 2000-2020 ............................ 20 Figure 2.7 Energy demand per sector and per fuel, and electricity generation by fuel.......
in Norway in 2020 ......................................................................................... 20 Figure 3.1 Greenhouse gas emissions by sector in Norway, 2000-2019 and targets .... 36 Figure 3.2 Energy-related CO2 emissions by sector and fuel in Norway, 2000-2020 .... 36 Figure 3.3 Energy-related CO2 emissions by energy source in Norway, 2000-2020 ..... 37 Figure 3.4 Energy-related CO2 emissions and main drivers in Norway, 2000-2020 ...... 38 Figure 4.1 Energy demand and drivers in Norway, 2000-2020 ..................................... 58 Figure 4.2 Total final consumption by sector in Norway, 2000-2020 ............................. 58 Figure 4.3 Total final consumption in industry by source in Norway, 2000-2020 ........... 60 Figure 4.4 Total final consumption in the building sector by source in Norway,
2000-2020 .................................................................................................... 62 Figure 4.5 Total final consumption in transport by fuel in Norway, 2000-2020 .............. 66 Figure 4.6 Registered electric vehicles and public charging points in Norway,
2012-2021 .................................................................................................... 66 Figure 5.1 Renewable energy in total final energy consumption in Norway,
2000-2020 .................................................................................................... 73 Figure 5.2 Renewable energy by sector in Norway, 2020 ............................................. 74 Figure 5.3 Renewable energy in electricity generation in Norway, 2000-2020 .............. 75 Figure 6.1 Energy-related public RD&D budget by sector in Norway, 2009-2020 ......... 91 Figure 6.2 Energy-related public RD&D spending per GDP in IEA countries, 2020 ...... 91 Figure 6.3 Top 10 countries for selected technologies in RD&D budget per thousand
units of GDP, 2020 ....................................................................................... 92 Figure 7.1 Electricity generation by source in Norway, 2000-2020 .............................. 104 Figure 7.2 Electricity demand by sector in Norway, 2000-2020 ................................... 105
IEA.
All
right
s re
serv
ed.

TABLE OF CONTENTS
8
Figure 7.3 Norway’s electricity net trade with neighbouring countries, 2000-2020 ...... 106 Figure 7.4 Map of Norway’s cross-border electricity interconnections ......................... 109 Figure 7.5 Electricity prices for industry and households in IEA member countries, .........
2020 ........................................................................................................... 113 Figure 7.6 Electricity prices in Norway and neighbouring IEA countries, 2000-2020 ... 113 Figure 8.1 Division of responsibilities for the Norwegian upstream sector ................... 123 Figure 8.2 Map of Norway’s gas infrastructure ............................................................ 126 Figure 8.3 Oil product demand by sector in Norway, 2000-2020 ................................. 130 Figure 8.4 Oil products production in Norway, 2000-2020 ........................................... 131 Figure 8.5 Norway’s oil products net trade by country, 2000-2020 .............................. 132 Figure 8.6 Price comparison for automotive diesel in the IEA, Q4 2021 ...................... 133 Figure 8.7 Price comparison for unleaded gasoline (95 RON) in the IEA, Q4 2021 .... 133 Figure 8.8 Map of Norway’s oil infrastructure .............................................................. 134 Figure 8.9 Total industry oil stocks components in Norway, December 2021 ............. 136
Table
Table 5.1 Electricity generation capacity growth projections in Norway (MW), 2021-2030 .................................................................................................... 76
IEA.
All
right
s re
serv
ed.
9
ENER
GY
INSI
GH
TS
1. Executive summary
Overview Norway has set ambitious targets for reducing greenhouse gas (GHG) emissions and establishing a low emissions society by 2050. As an energy-rich country, Norway is in a unique starting position with respect to the energy transition. An abundance of affordable hydropower has enabled the development of energy-intensive industries and a high level of electrification of homes and businesses with limited GHG emissions. At the same time, as a major oil and gas producer and exporter, Norway will need to support an evolution of its energy sector amid a global energy transition.
Thanks to its ample reserves of oil and natural gas, Norway is a net energy exporter: in 2020, 87% of its energy production was exported. From a global perspective, Norway is the seventh-largest natural gas producer in the world, supplying 3% of global gas consumption. Norway is also a significant oil producer, accounting for 2.3% of global oil production in 2020. As a reputable and reliable producer, Norway has played a stabilising role in the world’s oil and gas supply, particularly in meeting European demand.
In addition, its extensive hydropower resources covered 92% of electricity generation, supporting an almost completely renewables-based power sector. Moreover, Norway’s energy demand is highly electrified: in 2020, electricity covered almost half of the country’s total final consumption (TFC), the highest share among IEA member countries. Norway has tremendous potential to further leverage its clean electricity system to decarbonise other sectors of the economy through additional electrification.
Nonetheless, to meet its ambitious target of being a low emissions society by 2050, Norway has considerable work ahead, especially since electricity generation is already zero emissions and the country already has substantial electrification of the buildings sector and almost half of industry, thereby also achieving low emissions in these sectors. As a result, many of the easy wins for reducing emissions have already been achieved and the remaining emissions reductions will be more complex, challenging and costly, notably in transport and industry.
Overall, Norway has many natural advantages that can help it achieve a successful energy and climate transition. In particular, it can be well-positioned to lead the world on new technologies for decarbonising hard-to-abate sectors, such as electric vehicles (EVs), carbon capture and storage (CCS), and hydrogen, if the right policies and incentives are put in place. Leveraging its renewables-based electricity system, Norway can further support its goals by developing detailed, long-term sectoral transition road maps, underpinned by specific policy measures, to lay out a well-defined pathway for sectoral change.
IEA.
All
right
s re
serv
ed.

1. EXECUTIVE SUMMARY
10
Climate change policies Norway has, through its enhanced nationally determined contribution (NDC) under the Paris Agreement, committed to reduce emissions by at least 50% and towards 55% by 2030 compared to 1990 levels. In June 2017, the Norwegian parliament adopted the Climate Change Act, which establishes by law Norway’s NDC target as well as the target of becoming a low emissions society by 2050. The target is equivalent to reducing emissions by around 90-95% from 1990 levels.
As part of its Agreement on the European Economic Area, Norway participates in the European Union’s (EU) internal energy market and, therefore, co-operates closely with the EU on energy and climate matters. Norway has an agreement with the EU to participate in EU climate legislation for the period 2021-2030, covering the EU Emissions Trading System (EU ETS); the Effort Sharing Regulation (ESR) for non-ETS emissions; and the land use, land-use change and forestry regulation (LULUCF). Under the current agreement with the EU, the EU’s Fit for 55 package will update all three regulations, which Norway plans to continue to follow domestically.
The polluter-pays principle is a cornerstone of the Norwegian policy framework on climate change. Norway was one of the first countries in the world to put in place a carbon tax, in 1991, covering the combustion of fossil fuels and the petroleum sector. Today, approximately 85% of domestic GHG emissions are either covered by the EU ETS or subject to a CO2 tax (or other GHG taxes), or both. The national CO2 tax is currently around 766 Norwegian krone per tonne of CO2 equivalent (NOK/t CO2-eq) (76 EUR/t CO2-eq) for emissions outside the EU ETS.
In January 2021, Norway’s former government presented a white paper to parliament describing an economy-wide Climate Action Plan for 2021-2030 to reduce emissions by at least 50% and towards 55% by 2030. The action plan’s main emphasis is on emissions from sectors not covered by the EU ETS, including from transport, buildings, waste and agriculture. The plan includes policies and measures aimed at cutting emissions from non-ETS sectors, which account for around half of Norway’s total emissions, by 45% by 2030 from 2005 levels. It also addresses EU ETS emissions as well as CO2 emissions and removals from LULUCF.
The main policy instruments in the Climate Action Plan are GHG taxation, regulatory measures, climate-related requirements in public procurement processes, information for the public on climate-friendly options, financial support for the development of new technologies, and initiatives to promote research and innovation. The white paper announced a gradual increase in the national carbon tax rate to 2 000 NOK/t CO2-eq (196 EUR/t CO2-eq) in 2030, which would be one of the highest levels in the OECD.
CO2 pricing levels are robust from an international perspective and can drive meaningful emissions reductions in relevant sectors. However, even such a high carbon price is unlikely to achieve the level of emissions reductions needed to meet Norway’s climate targets. The government would benefit from more detailed projections of the levels of carbon prices needed to motivate technological shifts to cut emissions, and consider supplementary incentives and support for sectors that may need them.
IEA.
All
right
s re
serv
ed.
1. EXECUTIVE SUMMARY
11
ENER
GY
INSI
GH
TS Energy efficiency
As in all countries, energy efficiency has an important role to play in Norway. In the past decade, economic growth has been decoupled from energy consumption. The government has set a target to lower the overall energy intensity of the economy by 30% in 2030 compared to 2015. However, from 2015 to 2019, energy intensity fell by only 4%.
Enova is Norway’s main provider of financial support for energy efficiency projects across various sectors, as well as projects targeted toward households and consumers.
In the industry sector, which has the highest share in TFC, from 2003 to 2018, Enova provided support to projects for energy efficiency and for the replacement of fossil fuels with renewable energy. In 2018, Enova’s focus changed to innovative measures more specifically targeting emissions reductions and the shift to a low emissions society. Since 2019, therefore, Enova’s mandate no longer directly targets energy efficiency in industry.
In the buildings sector, which accounts for 34% of TFC, Norway has a target to reduce energy use in existing buildings by 10 terawatt hours (TWh) by 2030 relative to 2015 levels. The main energy efficiency measure in the buildings sector is the adoption of building codes. Since 2010, energy performance certificates are required when buildings are built, leased or sold. The government also banned the installation of fossil fuel-based heating systems since 2016 and the use of heating oil since 2020. Most buildings nowadays have electric heating systems.
In the transport sector, which accounts for 21% of total demand, Norway is pursuing an ambitious policy on EVs. Fossil fuel cars are subject to a high registration tax on purchase as well as to a CO2 tax and road use tax on gasoline and diesel. Meanwhile, zero emissions vehicles are heavily subsidised. Support includes no value-added tax (VAT), exemption from a one-off registration tax as well as reduced toll roads, ferry and parking fees. As such, Norway had the highest share of zero-emission vehicles in both car stock (16%) and car sales (64.5%) in 2021.
Though Norway has been blessed with affordable energy for a long time and has largely decoupled economic growth and energy consumption for many years, substantial cost savings could be made by reducing consumption. Improving the efficiency of energy consumption warrants even greater attention in the current context of high electricity prices that prompted the government to issue across-the-board price reductions. These sizeable outlays could have instead focused on efficiency measures with longer-lasting results. To underpin its energy efficiency target, the government should establish a national energy efficiency strategy that includes cost-effective sectoral targets as well as policy measures to help end users lower consumption.
Electricity in the energy transition Norway has an almost entirely renewables-based electricity system, with renewable resources accounting for 98% of generation in 2020, of which hydro is the dominant source at 92%.
IEA.
All
right
s re
serv
ed.
1. EXECUTIVE SUMMARY
12
Norway is also historically a net exporter of electricity to neighbouring countries, reaching a record 20.5 TWh of net exports in 2020, making it one of the largest exporters in Europe. Norway is therefore well-integrated in the Nordic and European electricity markets.
Moreover, as electrification forms a central part of any country’s energy transition, Norway finds itself in an enviable starting position. Its energy demand is already highly electrified: in 2019, electricity covered almost half of the country’s TFC, the highest share among IEA member countries.
Still, more electrification will be needed across sectors to meet Norwegian climate targets, which will require additional renewable generation capacity, such as continued expansion of hydro capacity (including upgrades of existing plants).
The share of wind in Norway’s electricity system has increased tenfold in the last decade, accounting for 6.5% of total electricity generation in 2020, making it the second-largest electricity generation source in the country. However, Norway has faced local opposition to onshore wind power projects, based on the perceived impact on landscapes and ecology. Following a pause on new licences for onshore wind in 2019, the government announced in April 2022 that it would resume licencing for new projects where local municipalities are supportive.
The Norwegian government also has ambitions to build-out offshore wind capacity and supply chains. Norway is currently building the world’s largest floating offshore wind farm (Hywind Tampen), based on Equinor’s floating wind technology, with a total installed capacity of 88 megawatts (MW). Beyond this project, two areas have been assigned for offshore wind power development to date, one on deep waters with high-cost floating technology and one with a bottom-fixed solution. However, the government is still in the process of creating a licencing framework for offshore wind. It is working to make the licencing process more efficient, to facilitate offshore wind projects in operation before 2030. As such, offshore wind will not make much of a contribution to Norway’s power mix this decade.
The country will also benefit from expanding the national grid (or assisting Sweden in enforcing its grid) to ensure that surplus generation in the north of the country can more easily make its way south. Increased use of flexibility mechanisms to balance the grid will also be needed, and existing hydro storage capacity provides a good base.
Oil and gas sector The oil and gas sector is Norway’s largest one based on value added, revenues, investments and export value. As such, the sector plays a critical role in the Norwegian economy and in financing the Norwegian welfare state. The country’s export revenues from the petroleum industry are estimated to be over NOK 800 billion (EUR 80 billion) in 2021 and expected to double in 2022. The Government Pension Fund Global, financed by the revenues from oil and gas production, finances public pension expenditures, provides benefits to both current and future generations from petroleum revenues, and protects the country’s long-term economy from volatility in oil and gas revenues.
IEA.
All
right
s re
serv
ed.
1. EXECUTIVE SUMMARY
13
ENER
GY
INSI
GH
TS The Norwegian government remains confident that Norway can compete on a smaller
global market for oil and gas over time. With relatively low production costs and emissions intensity of upstream operations, Norway is well-positioned as a provider of oil and gas to the world market. Nonetheless, the government should plan for a scenario in which oil demand falls faster than expected as a result of many countries having net zero by 2050 targets.
Moreover, in terms of national emissions reductions, the oil and gas industry is one of the leading sources of GHG emissions in Norway, accounting for around a quarter of the country’s total emissions. The industry has ambitions to further reduce emissions in the upstream petroleum sector up to 40% by 2030 compared to 2005, and to achieve net zero emissions by 2050. While some of the planned emissions reductions will be achieved through Norway’s participation in the EU ETS, steeper emissions cuts will be needed to meet 2030 and 2050 targets, implying that the next tranche of emissions reductions in the sector to meet climate targets will be more challenging and costly. Results can come not only from the escalating carbon price, but also from additional electrification and technologies such as CCS in the longer term. However, these options need to be thoroughly and holistically assessed with an eye to not only cost competitiveness, but also the development of planned new industries – including batteries, hydrogen and data centres – that will also need to draw power from shore.
Energy research and innovation Energy technology and innovation will play an important role in Norway’s energy transition, in particular to leverage the existing strengths of its energy sector in new areas, such as CCS and hydrogen.
Building on the 2030 Climate Action Plan, in June 2021, the government presented a white paper on energy policy and long-term value creation from Norwegian energy resources, including through new industries such as hydrogen and offshore wind, strengthening the power grid, and a future-oriented oil and gas industry with low emissions from upstream activities.
Innovation in Norway’s energy sector is spearheaded by Enova, an entity owned by the Ministry of Climate and Environment. It supports new energy and climate technology in industry and transport, and the introduction of new technologies.
CCS is a priority area for Norway’s climate action, and is identified as an important measure in Norway’s NDC. The Langskip (“Longship”) project, currently under construction, is a central part of the government’s policy for CCS. The project comprises state support to two full-scale capture facilities and one storage facility in the North Sea. Langskip aims to facilitate learning and cost reductions for subsequent projects in an international perspective. The carbon tax introduced in 1991 has also been one of the key drivers of CCS on the continental shelf. In addition to several pilot projects, there are currently two large-scale CCS projects operating in Norway and one under development. As such, Norway has established itself as a leading country for CCS deployment and is home to a number of companies with CCS expertise. The technology can notably play a role in decarbonising the industry sector (such as upstream oil and gas production, cement, and waste incineration) and also facilitate the production of low-carbon hydrogen, along with offering vast CO2 storage capacity for other countries.
IEA.
All
right
s re
serv
ed.

1. EXECUTIVE SUMMARY
14
The Norwegian government also offers several R&D-related support measures for the development of low-carbon hydrogen. The government published a Hydrogen Strategy in June 2020, followed by a white paper in 2021 that assessed the entire energy sector and included a road map for hydrogen. The road map includes signposts for the production and use of hydrogen in the 2025, 2030 and 2050 horizons. An important point in the government’s vision is to develop a coherent value chain where production, distribution and use are developed in parallel.
Key recommendations The government of Norway should:
Establish national emissions reduction strategies for key sectors to 2030 and 2050 thatinclude specific targets and define supporting policy measures.
Assess various scenarios for future global oil and gas demand as part of a longer-termstrategy for transformation from oil and gas revenue dependency, includingdiversification into low-carbon energy carriers.
Consider measures to supplement carbon pricing to achieve harder to abate, costlieremissions reductions, especially in the industry sector.
Prioritise energy efficiency as a policy area, including through sectoral targets, actionplans and supporting measures, especially in the buildings and industry sectors.
Promptly advance a robust regulatory framework that provides long-term investmentsignals and supports strong deployment of offshore wind generation.
Increase ambitions to jump-start clean technologies where Norway may havecompetitive advantages and means, such as hydrogen, green shipping, carboncapture and storage, and offshore wind.
IEA.
All
right
s re
serv
ed.

15
ENER
GY
INSI
GH
TS
2. General energy policy
Key data (2020) TES: 27.4 Mtoe (hydro 44.3%; oil 31.9%; natural gas 16.6%; bioenergy and waste 7.1%; solar, wind and tide 3.1%; coal 3.0%; heat 0.4%; electricity trade -6.2%), -15.6% from 2010 to 2019, -0.9% from 2019 to 2020
TES per capita: 5.3 toe/cap, -20.6% since 2010 (IEA average: 3.8 toe/cap)
TES per GDP: 87 toe/USD million, -23.7% since 2010 (IEA average: 91 toe/USD million)
Energy production: 207.9 Mtoe (natural gas 47.2%; oil 45.8%; hydro 5.8%; bioenergy and waste 0.8%; solar, wind and tide 0.4%; heat 0.1%), -6.6% from 2010 to 2019, +7.0% from 2019 to 2020
TFC: 20.5 Mtoe (electricity 47.5%, oil 36.1%, bioenergy 6.8%, natural gas 4.3%, coal 2.1%, heat 2.3%), -0.5% from 2010 to 2019, -3.2% from 2019 to 2020
Country overview The Kingdom of Norway covers a total area of 365 000 km2, situated in Northern Europe, bordered by Finland, the Russian Federation (‘Russia’, hereafter) and Sweden. The country is dominated by mountainous terrain and has an indented coastline along the North Sea, the Norwegian Sea and the Barents Sea in the Arctic Ocean, with thousands of fjords and about 50 000 islands.
Norway’s population was 5.4 million in 2020, 10% higher than in 2010. Its total population is steadily growing, but the growth rate has slowed due to a decline in immigration over the last decade. Norway is the second-least populated country in Europe after Iceland, with 15 people per square kilometre (World Bank, 2021). Norwegian and Sami are the two official languages and its currency is the Norwegian kroner (exchange rate of NOK 0.098 per EUR 1 in 2021).
Norway is a constitutional monarchy, with a full representative parliamentary democracy. Executive power is vested formally in the king, but is exercised through the government, headed by the prime minister. Legislative power is held by the Storting (the Norwegian parliament). As a member of the European Economic Area (EEA), Norway shares internal market legislation with the EU and has therefore implemented several EU directives and regulations related to energy.
IEA.
All
right
s re
serv
ed.

2. GENERAL ENERGY POLICY
16
Figure 2.1 Map of Norway
Economy In 2020, Norway’s GDP per capita was USD 67 370, and ranked fourth in the OECD after Luxembourg, Switzerland and Ireland. The employment rate in the fourth quarter of 2021 was 77%, which is the sixth-highest among OECD countries (OECD, 2021). The Covid-19 pandemic caused GDP to fall by 0.7% in 2020; it then grew by 3.9% in 2021. OECD projections expect yearly real mainland GDP growth of 4.2% in 2022.
IEA.
All
right
s re
serv
ed.
2. GENERAL ENERGY POLICY
17
ENER
GY
INSI
GH
TS In 1990, Norway created the Government Pension Fund Global, financed by the revenues
from oil and gas production. Since 2001, a fiscal rule has guided withdrawals from the fund whereby spending must, over time, follow the expected real return of the fund. Emphasis is placed on smoothing out economic fluctuations to contribute to sound capacity utilisation and low unemployment. The framework aims to preserve the real value of the fund for the benefit of future generations. It also isolates the budget from short-term fluctuations in petroleum revenue and leaves space for fiscal policy to counteract economic downturns.
To ensure risk diversification and good financial return, the fund only invests abroad and its investments (as of the end of 2021) consist of equities (72.0%), fixed income (25.4%), real estate in a selected number of major cities (2.5%) and renewable energy infrastructure (0.1%). In addition, the fund aims to ensure sustainable investments, and environmental and social issues are taken into consideration when taking investment decisions. Parliament also took a decision in 2019 for the fund to divest from companies only focused on producing oil and gas in order to reduce oil price risk for the Norwegian economy (a previous decision divested from coal for environmental reasons). It is one of the world’s largest funds, owning around 1.3% of all the world’s listed companies (in 2021). The fund has generated an annual return of 6.6% since 1998. Each year, though the Norwegian government can spend only a small part of the fund (equivalent to expected real return), this still amounts to almost 20% of the government’s budget. At the end 2021, the fund’s market value was NOK 12.34 trillion (EUR 1.23 trillion) (NBIM, 2021).
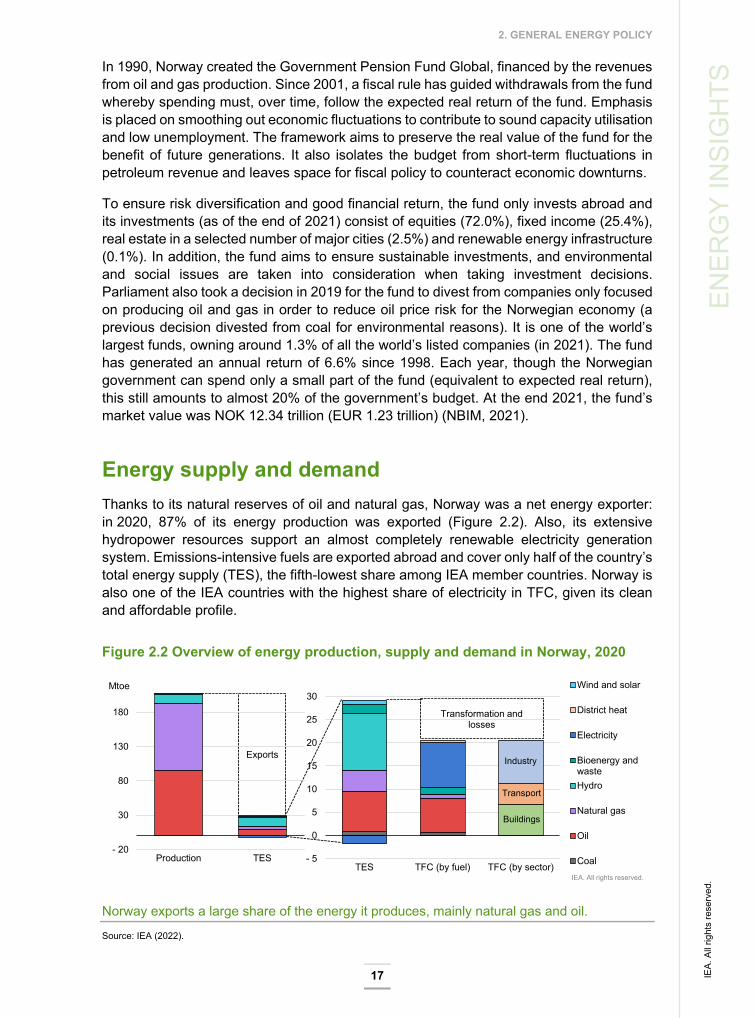
Energy supply and demand Thanks to its natural reserves of oil and natural gas, Norway was a net energy exporter: in 2020, 87% of its energy production was exported (Figure 2.2). Also, its extensive hydropower resources support an almost completely renewable electricity generation system. Emissions-intensive fuels are exported abroad and cover only half of the country’s total energy supply (TES), the fifth-lowest share among IEA member countries. Norway is also one of the IEA countries with the highest share of electricity in TFC, given its clean and affordable profile.
Figure 2.2 Overview of energy production, supply and demand in Norway, 2020
Norway exports a large share of the energy it produces, mainly natural gas and oil.
Source: IEA (2022).
- 5
0
5
10
15
20
25
30
TES TFC (by fuel) TFC (by sector)IEA. All rights reserved.
Exports
Transformation and losses
- 20
30
80
130
180
Production TES
Mtoe Wind and solar
District heat
Electricity
Bioenergy andwasteHydro
Natural gas
Oil
Coal
Transport
Industry
Buildings
IEA.
All
right
s re
serv
ed.
2. GENERAL ENERGY POLICY
18
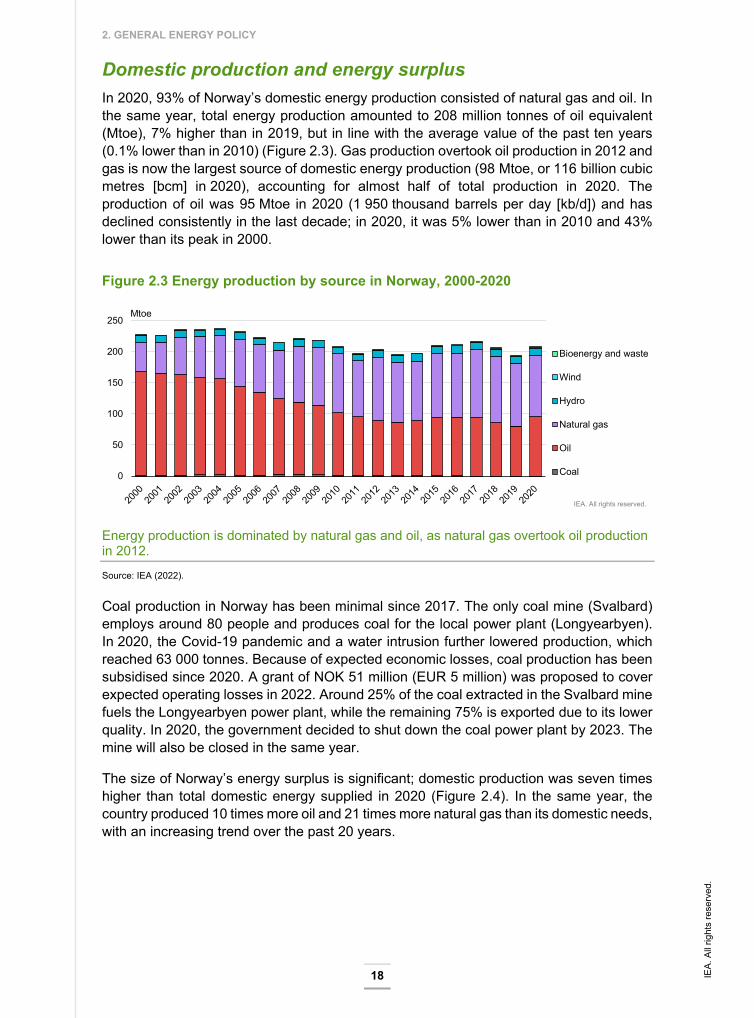
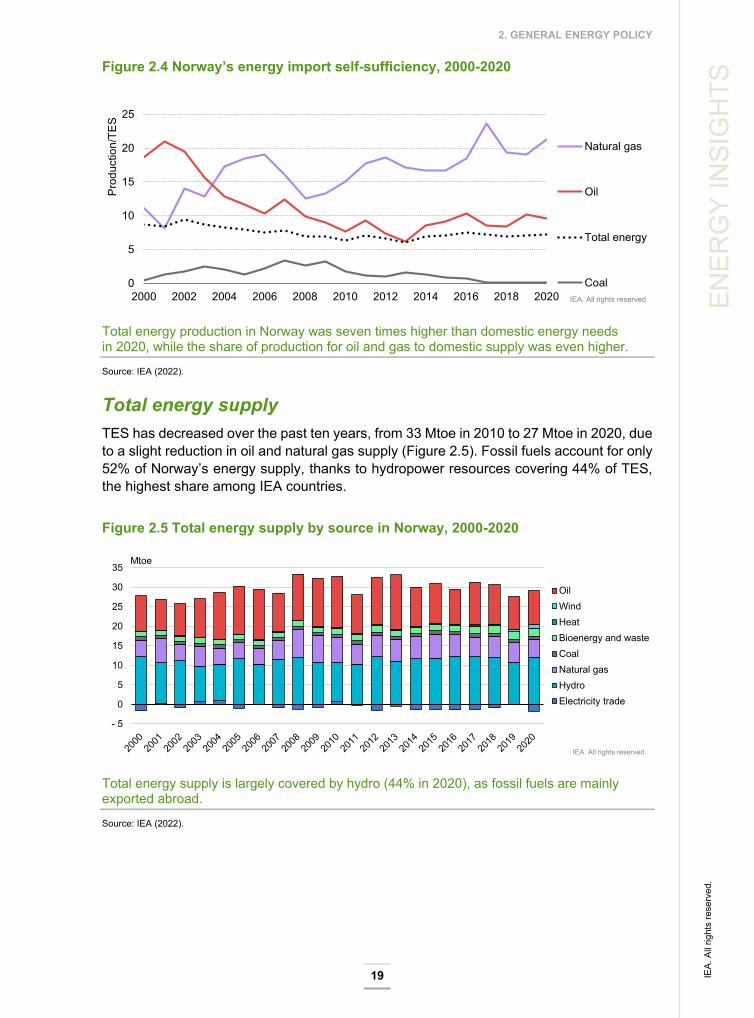
Domestic production and energy surplus In 2020, 93% of Norway’s domestic energy production consisted of natural gas and oil. In the same year, total energy production amounted to 208 million tonnes of oil equivalent (Mtoe), 7% higher than in 2019, but in line with the average value of the past ten years (0.1% lower than in 2010) (Figure 2.3). Gas production overtook oil production in 2012 and gas is now the largest source of domestic energy production (98 Mtoe, or 116 billion cubic metres [bcm] in 2020), accounting for almost half of total production in 2020. The production of oil was 95 Mtoe in 2020 (1 950 thousand barrels per day [kb/d]) and has declined consistently in the last decade; in 2020, it was 5% lower than in 2010 and 43% lower than its peak in 2000.
Figure 2.3 Energy production by source in Norway, 2000-2020
Energy production is dominated by natural gas and oil, as natural gas overtook oil production in 2012.
Source: IEA (2022).
Coal production in Norway has been minimal since 2017. The only coal mine (Svalbard) employs around 80 people and produces coal for the local power plant (Longyearbyen). In 2020, the Covid-19 pandemic and a water intrusion further lowered production, which reached 63 000 tonnes. Because of expected economic losses, coal production has been subsidised since 2020. A grant of NOK 51 million (EUR 5 million) was proposed to cover expected operating losses in 2022. Around 25% of the coal extracted in the Svalbard mine fuels the Longyearbyen power plant, while the remaining 75% is exported due to its lower quality. In 2020, the government decided to shut down the coal power plant by 2023. The mine will also be closed in the same year.
The size of Norway’s energy surplus is significant; domestic production was seven times higher than total domestic energy supplied in 2020 (Figure 2.4). In the same year, the country produced 10 times more oil and 21 times more natural gas than its domestic needs, with an increasing trend over the past 20 years.
0
50
100
150
200
250Mtoe
Bioenergy and waste
Wind
Hydro
Natural gas
Oil
Coal
IEA. All rights reserved.
IEA.
All
right
s re
serv
ed.
2. GENERAL ENERGY POLICY
19
ENER
GY
INSI
GH
TS Figure 2.4 Norway’s energy import self-sufficiency, 2000-2020
Total energy production in Norway was seven times higher than domestic energy needs in 2020, while the share of production for oil and gas to domestic supply was even higher.
Source: IEA (2022).
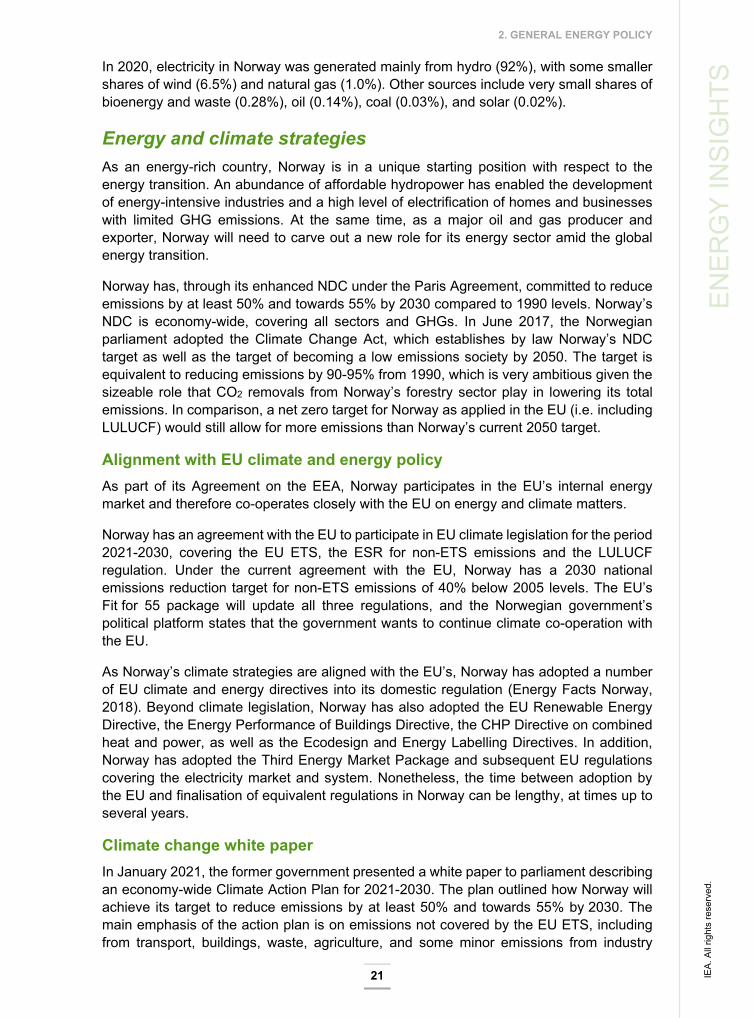
Total energy supply TES has decreased over the past ten years, from 33 Mtoe in 2010 to 27 Mtoe in 2020, due to a slight reduction in oil and natural gas supply (Figure 2.5). Fossil fuels account for only 52% of Norway’s energy supply, thanks to hydropower resources covering 44% of TES, the highest share among IEA countries.
Figure 2.5 Total energy supply by source in Norway, 2000-2020
Total energy supply is largely covered by hydro (44% in 2020), as fossil fuels are mainly exported abroad.
Source: IEA (2022).
0
5
10
15
20
25
2000 2002 2004 2006 2008 2010 2012 2014 2016 2018 2020
Natural gas
Oil
Total energy
CoalIEA. All rights reserved
Prod
uctio
n/TE
S
- 5
0
5
10
15
20
25
30
35Mtoe
OilWindHeatBioenergy and wasteCoalNatural gasHydroElectricity trade
IEA. All rights reserved.
IEA.
All
right
s re
serv
ed.

2. GENERAL ENERGY POLICY
20
Energy demand In the past 20 years, TFC has been stable at around 20 Mtoe (Figure 2.6). Norway’s energy demand is highly electrified: in 2020, electricity covered almost half (48%) of the country’s TFC, the highest share among IEA member countries, followed by oil (36%), bioenergy and waste (6.8%), natural gas (4.3%), and coal (2.1%). Electricity dominates demand in the residential sector (84%), and covers almost half of the energy demand of the industry sector (45%). Oil is mainly used in the industry and transport sectors, representing 86% in the transport sector, the second-lowest among IEA member countries (Figure 2.7). The relatively low share in transport is due to the country’s immense success in increasing the sales of EVs. Bioenergy is used in industry, buildings and transport, ranging from 5% in industry to 9% in transport. Natural gas is used mainly in the industry sector, notably for oil and gas production. Most coal consumption also comes from the industry sector, which uses around 0.6 million tonnes (Mt) of imported coal every year.
Figure 2.6 Total final consumption by source in Norway, 2000-2020
Norway’s energy demand is the most electrified among IEA countries.
Source: IEA (2022).
Figure 2.7 Energy demand per sector and per fuel, and electricity generation by fuel in Norway in 2020
The buildings and industry sectors are highly electrified, and electricity is produced almost entirely through hydropower, which in 2020 covered 92% of electricity generated.
Source: IEA (2022).
0
5
10
15
20Mtoe
District heat
Electricity
Bioenergy and waste
Natural gas
Oil
Coal
IEA. All rights reserved.
0
1
2
3
4
5
6
7
8
9
10
Industry Buildings Transport
Mto
e
Heat
Electricity
Solar
Bioenergy and waste
Natural gas
Oil
Coal
Energy demand
Bioenergy and waste, oil and solar
Natural gas
Wind
Hydro
0 20 40 60 80 100 120 140 160 TWh
Electricity generation
IEA. All rights reserved.
IEA.
All
right
s re
serv
ed.
2. GENERAL ENERGY POLICY
21
ENER
GY
INSI
GH
TS In 2020, electricity in Norway was generated mainly from hydro (92%), with some smaller
shares of wind (6.5%) and natural gas (1.0%). Other sources include very small shares of bioenergy and waste (0.28%), oil (0.14%), coal (0.03%), and solar (0.02%).
Energy and climate strategies As an energy-rich country, Norway is in a unique starting position with respect to the energy transition. An abundance of affordable hydropower has enabled the development of energy-intensive industries and a high level of electrification of homes and businesses with limited GHG emissions. At the same time, as a major oil and gas producer and exporter, Norway will need to carve out a new role for its energy sector amid the global energy transition.
Norway has, through its enhanced NDC under the Paris Agreement, committed to reduce emissions by at least 50% and towards 55% by 2030 compared to 1990 levels. Norway’s NDC is economy-wide, covering all sectors and GHGs. In June 2017, the Norwegian parliament adopted the Climate Change Act, which establishes by law Norway’s NDC target as well as the target of becoming a low emissions society by 2050. The target is equivalent to reducing emissions by 90-95% from 1990, which is very ambitious given the sizeable role that CO2 removals from Norway’s forestry sector play in lowering its total emissions. In comparison, a net zero target for Norway as applied in the EU (i.e. including LULUCF) would still allow for more emissions than Norway’s current 2050 target.
Alignment with EU climate and energy policy As part of its Agreement on the EEA, Norway participates in the EU’s internal energy market and therefore co-operates closely with the EU on energy and climate matters.
Norway has an agreement with the EU to participate in EU climate legislation for the period 2021-2030, covering the EU ETS, the ESR for non-ETS emissions and the LULUCF regulation. Under the current agreement with the EU, Norway has a 2030 national emissions reduction target for non-ETS emissions of 40% below 2005 levels. The EU’s Fit for 55 package will update all three regulations, and the Norwegian government’s political platform states that the government wants to continue climate co-operation with the EU.
As Norway’s climate strategies are aligned with the EU’s, Norway has adopted a number of EU climate and energy directives into its domestic regulation (Energy Facts Norway, 2018). Beyond climate legislation, Norway has also adopted the EU Renewable Energy Directive, the Energy Performance of Buildings Directive, the CHP Directive on combined heat and power, as well as the Ecodesign and Energy Labelling Directives. In addition, Norway has adopted the Third Energy Market Package and subsequent EU regulations covering the electricity market and system. Nonetheless, the time between adoption by the EU and finalisation of equivalent regulations in Norway can be lengthy, at times up to several years.
Climate change white paper In January 2021, the former government presented a white paper to parliament describing an economy-wide Climate Action Plan for 2021-2030. The plan outlined how Norway will achieve its target to reduce emissions by at least 50% and towards 55% by 2030. The main emphasis of the action plan is on emissions not covered by the EU ETS, including from transport, buildings, waste, agriculture, and some minor emissions from industry
IEA.
All
right
s re
serv
ed.
2. GENERAL ENERGY POLICY
22
production and the oil and gas industry. The plan includes an aim to cut emissions from non-ETS sectors, which account for around half of Norway’s total emissions, by 45% from 2005 levels by 2030. It also addresses EU ETS emissions as well as CO2 emissions and removals from LULUCF.
The main policy instruments in the Climate Action Plan are GHG taxation, regulatory measures, climate-related requirements in public procurement processes, information on climate-friendly options, financial support for the development of new technologies, and initiatives to promote research and innovation (Norway, Ministry of Climate and Environment, 2021a). On carbon pricing, the white paper announced a gradual increase in the national carbon tax rate to NOK 2 000 (EUR 196) per tonne of CO2 equivalent (t CO2-eq) in 2030, one of the highest levels in the OECD (see Chapter 3).
White paper on long-term value creation from Norway’s energy resources Building on the 2030 Climate Action Plan, in June 2021, the former government presented a white paper on energy policy and long-term value creation from Norwegian energy resources, entitled Putting Energy to Work (Norway, Ministry of Petroleum and Energy, 2021b). It outlines how Norway can use its energy resources for job creation and growth, including through new industries such as hydrogen and offshore wind, strengthening the power grid, and a future-oriented oil and gas industry with low emissions from production. The paper outlines a strategy for how renewable energy and the power grid can form the basis of further electrification of the economy and a fossil fuel phase-out.
The white paper highlights the challenges the oil and gas industry is undergoing as a result of maturing fields on the Norwegian continental shelf (NCS) and heightened attention to emissions reduction. As such, it emphasises the Norwegian government’s petroleum policy that will promote profitable long-term production of oil and gas in the context of Norway’s climate change goals, including through stable investment frameworks and support for research and development (R&D) to increase efficiency and lower emissions. In doing so, the government will continue to pursue exploration policy with regular concession rounds that ensure new areas are available to the industry. The government will also continue its acquisition of knowledge through the continued survey of petroleum resources, including in those areas that are not open to petroleum operations.
At the same time, the white paper outlines a strategy to leverage existing strengths in the Norwegian oil and gas industry to develop a range of new industries and technologies such as CCS, offshore wind and hydrogen. The white paper also introduces a road map for hydrogen that includes concrete plans for maritime hubs, industrial production and several pilot projects to develop new and cost-effective solutions and technologies in Norway.
Norway also plans to leverage its clean power system to set up new industries, such as battery production, where access to renewable energy can present an advantage. The government will attempt to promote such business activity by creating synergies and predictable investment frameworks.
The white paper also presents a strategy for electrification, building on Norway’s renewables-based power system. It highlights the need for additional generation and grid expansions, which will be balanced against the need to preserve nature and local ecosystems, both in the short and long terms.
IEA.
All
right
s re
serv
ed.

2. GENERAL ENERGY POLICY
23
ENER
GY
INSI
GH
TS In April 2022, the government presented a supplementary white paper (Meld. St. 11
[2021-2022]) to the previous government’s white paper on energy policy and long-term value creation from Norwegian energy resources (Meld. St. 36 [2020-2021]). The supplementary white paper presents an updated energy policy that aims to provide abundant and affordable access to power, to continue a stable oil and gas production on the NCS, and to contribute to lower GHG emissions. The white paper also presents policies to facilitate new green industries such as offshore wind, hydrogen and CCS (Norway, Ministry of Petroleum and Energy, 2022).
Energy efficiency Economic growth has been mostly decoupled from energy consumption in Norway. Between 2009 and 2019, Norwegian GDP grew by 16% while TFC of energy increased only by 3%. Norway’s main target for the efficient use of energy is to reduce the overall energy intensity of the economy by 30% in 2030 compared to 2015. From 2015 to 2019, energy intensity fell by only 4%.
Enova is Norway’s main provider of financial support for energy efficiency projects across various sectors, as well as for projects targeted toward households and consumers.
In the industry sector, which has the highest share in TFC (44%), from 2003 to 2018, Enova provided support to projects for energy efficiency and for replacing fossil fuels with renewable energy. In 2018, the scheme was replaced by measures more specifically targeting emissions reductions rather than energy efficiency. Between 2012 and 2018, Enova also provided support for industry to implement energy management systems. Norway is also preparing the implementation of the 2012 EU Energy Efficiency Directive, requiring mandatory energy audits for companies using more than 5 gigawatt hours (GWh) per year.
In the buildings sector, which accounts for 34% of TFC, Norway has a target to reduce the energy use in existing buildings by 10 TWh by 2030 relative to 2015 levels. The main energy efficiency measure in the buildings sector is the adoption of building codes. The regulation requires that new buildings or buildings undergoing major renovation have either a total net energy need lower than specified in the regulation or meet a set of energy requirements for individual building components. The building codes were last updated in 2016 and are currently under re-evaluation. Since 2010, energy performance certificates are also required when buildings are built, leased or sold. The government has also banned the installation of fossil fuel-based heating systems since 2016 and the use of heating oil since 2020. Most buildings have electric heating systems.
In the transport sector, which accounts for 21% of total demand, Norway is pursuing an ambitious policy on EVs, mainly through vehicle taxation. Fossil fuel cars are subject to a registration tax upon purchase. Furthermore, fossil fuel cars are subject to a CO2 tax and road use tax on gasoline and diesel. In contrast, zero-emission vehicles (ZEVs) are heavily subsidised in Norway. Support includes a reduced annual road tax; zero VAT; exemption from the one-off registration tax; as well as reduced toll road, ferry and parking fees. In addition, plug-in hybrid vehicles (PHEV) have for several years benefited from a reduced one-off registration tax. As such, Norway had the highest share of EVs globally (including both pure battery and PHEVs) in both car stock (22%) and car sales (86%) in 2021. Tax expenditures for EV incentives were around NOK 18.7 billion (EUR 1.9 billion) per year, or NOK 6 200 (EUR 620) per tonne of saved CO2. Based on progress to date, the Norwegian
IEA.
All
right
s re
serv
ed.
2. GENERAL ENERGY POLICY
24
parliament has an ambition to achieve 100% zero-emission car sales in 2025. The government also has plans in place to expand the use of electric buses, trucks and ferries.
Electricity in the energy transition Norway has an almost entirely renewables-based electricity system, with renewable resources accounting for 98% of generation in 2020, of which hydro is the dominant source at 92%. The country has an estimated 87 TWh of hydro reservoir storage capacity.
Norway is also historically a net exporter of electricity to neighbouring countries, reaching a record 20.5 TWh of net exports in 2020, making it one of the largest exporters in Europe. Norway is therefore well-integrated in the Nordic and European electricity markets.
Nonetheless, expected electrification across the economy to meet climate targets as well as the development of new industries is expected to drive up power demand significantly in the coming years. As such, Norway’s power balance (the difference between generation and consumption) is expected to shrink towards 2030.
In this regard, increased electrification will require not only new renewables generation capacity, but also expansion and strengthening of the power grid. The government expects that part of the growth in generation towards 2030 will come from new hydro capacity, some of which is already under construction, as well as refurbishments and upgrades to the country’s ageing fleet of existing hydro plants.
The share of wind in Norway’s electricity system has increased tenfold in the last decade, accounting for 6.5% of total electricity generation in 2020, making it the second-largest electricity generation source in the country. However, Norway has faced local opposition to onshore wind power projects, based on the impact on landscapes and ecology. In 2019, the former government put on hold approvals for new wind projects. In June 2020, the former government released a white paper on land-based wind power, proposing changes to current practice and imposing new licencing requirements. Some of the main measures focus on increasing local and regional involvement, better ensuring that environmental matters are taken into consideration, and introducing new deadlines to shorten the timeline of planning and building wind farms. The overall aim is to provide a reliable framework for the long-term development of onshore wind power in Norway.
In April 2022, the government announced that the licencing of new onshore wind power projects will resume in cases where the local municipality agrees. The new framework for licencing, presented under the previous government’s white paper on onshore wind (Meld. St. 28 [2019-2020]) will be used. Some of the main measures in the new framework are increased local and regional involvement, better ensuring that environmental matters are taken into consideration, and new deadlines to tighten the time span of planning and building a wind farm.
The Norwegian government also has ambitions to build- out an offshore wind capacity. Norway is currently building the world’s largest floating offshore wind farm (Hywind Tampen), based on Equinor’s floating wind technology, and with a total installed capacity of 88 MW, which will power offshore oil and gas operations. The government has granted the Hywind Tampen project NOK 2.3 billion, through Enova. Beyond this project, two areas have been assigned for offshore wind power development to date, one on deep waters with high-cost floating technology and one with a bottom-fixed solution. Auctions will be the main model for allocating offshore renewable energy acreage. To establish a
IEA.
All
right
s re
serv
ed.

2. GENERAL ENERGY POLICY
25
ENER
GY
INSI
GH
TS predictable framework, the government has started the process of identifying new areas
for offshore renewable energy production. Impact assessments will need to be carried out before any new areas can be opened. The government is still in the process of creating a licencing framework for offshore wind, with the aim for the first large-scale offshore wind projects to be completed before 2030.
Norway will also need to expand grid capacity to accommodate the growth in generation capacity, including introducing more flexibility mechanisms to handle additional generation from variable renewables. Toward this end and based on reinvestment requirements and increased electricity demand, Norway’s transmission system operator (TSO) Statnett released a Grid Development Plan 2021 that includes plans for several major new projects, amounting to NOK 60-100 billion in investments. Given that regulatory approvals for grid lines can be lengthy, extending project timelines up to ten years from planning to completion, the government nominated a public committee to recommend options to streamline and improve the licencing regime. The committee is also tasked with looking into principles for grid development when the demand is high and uncertain, as well as considering improvements in the grid connection process.
In February 2022, the government appointed an Energy Commission to map future energy demand and propose increased energy production, with the aim that Norway will continue to have surplus power production and that Norwegian industry and electricity consumers will continue to have abundant access to renewable power. The commission will also assess challenges in Norwegian energy policy towards 2030 and 2050, and how different policy choices affect the long-term development of Norwegian power supply. Overall, the Energy Commission’s mandate is linked to five overarching themes: 1) how Norway is affected by rapidly changing energy markets; 2) perspectives on the development of power consumption; 3) the potential for socio-economically profitable power production; 4) perspectives for security of supply; and 5) key conflicts of interest within the energy policy field. The Energy Commission is expected to submit its report by 15 December 2022.
Response to high electricity prices In 2021, especially in the second half of the year, prices for electricity in Norway followed the trend of sharp increases experienced across Europe. According to Statistics Norway (Statistics Norway, 2022), household net electricity prices increased by 429%, reaching a final price (including 49% taxes and charges) of NOK 1 470 (USD 164) per MWh in Q3 2021. Prices increased the most for contracts tied to spot prices (by 551%), which are used by most households. For non-energy intensive industry, prices jumped more than sixfold, while the increase for energy-intensive sectors was limited to 34%.
In late 2021 the government introduced a temporary support scheme for households aiming to alleviate high electricity prices. It offers 80% price reimbursement for monthly average electric spot prices exceeding NOK 0.7 per kilowatt hour (kWh) in the period from December 2021 to March 2022. In April 2022, the government extended the support scheme to March 2023.
Oil and gas sector Oil and gas is Norway’s largest sector based on value added, revenues, investments and export value. As such, the sector plays a critical role in the Norwegian economy and in financing the Norwegian welfare state. The country’s export revenues from the petroleum
IEA.
All
right
s re
serv
ed.

2. GENERAL ENERGY POLICY
26
industry were estimated to be over NOK 800 billion (EUR 80 billion) in 2021, and are expected to double in 2022. Since production started on the NCS in the early 1970s, petroleum activities have contributed around NOK 16 500 billion in today’s prices to Norway’s GDP, not including related service and supply industries (Norwegian Petroleum, 2022). The government estimates that it has sold 49% of its total resources – spread over the North Sea, Norwegian Sea and Barents Sea – over 50 years of oil and gas production.
One of the overarching principles of Norway’s management of its petroleum resources is that exploration, development and production must maximise value creation for society, and that revenues must accrue to the Norwegian state and therefore benefit society as a whole. Along these lines, the Norwegian state secures a large share of the value creation through taxation and through a system known as the State’s Direct Financial Interest (SDFI) in the petroleum industry.
In 1990, Norway created the Government Pension Fund Global, financed by the revenues from oil and gas production, to finance public pension expenditures, provide benefits to both current and future generations from petroleum revenues, and protect the country’s long-term economy from volatility in oil and gas revenues. Each year, the Norwegian government can spend only the equivalent of the real return on the fund, which is estimated to be around 3% per year. This amounts to almost 20% of the government’s budget. At the end of 2021, the fund’s market value was NOK 12.34 trillion (EUR 1.23 trillion), representing around EUR 228 940 per capita.
Importantly, the oil and gas industry also supports a number of other industries through its supply chains and technology spill-overs. The industry is estimated to employ around 160 000 workers, including spill-over effects (Statistics Norway, 2021). The government anticipates that Norway can continue to maintain global competitiveness in oil and gas production based on its low emissions profile, which is estimated to be around 8 kg CO2 per barrel of oil equivalent, making it among the lowest in the world. With the help of the carbon price, a long-standing ban on routine flaring and some electrification of operations, the industry has seen steady declines in GHG emissions in recent years, though steeper cuts will be needed to meet domestic 2030 and 2050 targets. The industry has ambitions to further reduce emissions in the upstream petroleum sector up to 40% by 2030 compared to 2005 and to achieve net zero emissions by 2050 (while the government’s ambition is to reduce emissions from the sector by 50-55% by 2030). An escalating carbon price will be the main policy driver for these cuts, supported by technology advancements, notably in CCS.
Given the age and maturity of Norway’s existing fields, the production outlook in the coming years indicates a steady decline. Therefore, to continue production, the industry will need to advance new discoveries as well as extract more and extend lifespans from existing fields, which the government will continue to support with new licencing rounds and an enabling upstream investment framework. Still, as the NCS is considered a mature petroleum basin, it is anticipated that oil and gas production will decline by 65% from current levels by 2050 (Statistics Norway, 2021b).
Energy research and innovation Energy technology and innovation will play an important role in Norway’s energy transition, in particular to leverage the existing strengths of its energy sector in new areas, such as CCS and hydrogen.
IEA.
All
right
s re
serv
ed.
2. GENERAL ENERGY POLICY
27
ENER
GY
INSI
GH
TS The government has set specific goals for the overall national level of R&D, where public
spending for R&D must amount to 1% of GDP, while R&D spending in the private sector is expected to make up 2% of GDP. Since 2016, the government’s spending levels have exceeded 1%, but the private sector’s spending has fallen short of 2%. The government does not set any specific targets for R&D spending levels for specific sectors, including energy.
Innovation in Norway’s energy sector is spearheaded by Enova, an entity owned by the Ministry of Climate and Environment. It supports new energy and climate technology in industry, new technology for buildings of the future, new energy and climate technology in transport, and the introduction of new technologies. Public funding for energy R&D is channelled through various energy and petroleum programmes in the Research Council of Norway (RCN). Norway is also an active participant in international R&D co-operation in the field of energy, which is a high priority and an important supplement to Norwegian national research. Norway participates primarily in co-operation activities with the EU, through the IEA and at the Nordic level.
CCS is a priority area for Norway’s climate action and is identified as an important measure in its NDC. Langskip (“Longship”), which is under construction, is a central part of the government’s policy for CCS. The project includes state aid for two full-scale capture facilities and one storage facility in the North Sea. The carbon tax introduced in 1991 is one of the key drivers of CCS. The government also adopted a CCS strategy in 2014-15. Notably, CCS has broad public acceptance in Norway. In addition to several pilot projects, there are currently two large-scale CCS projects operating in Norway and one under development. The government has assessed a theoretical potential of 80 billion tonnes of CO2 storage capacity on the NCS.
The Norwegian government also offers several R&D-related support measures for the development of green and blue hydrogen. The former government published a Hydrogen Strategy in June 2020, followed by a white paper in 2021 that assessed the entire energy sector and included a road map for hydrogen. The road map includes signposts for the production and use of hydrogen in the 2025, 2030 and 2050 timeframes. One of the strategy’s important points is to develop a coherent value chain where production, distribution and use are developed in parallel. In April 2022, the government presented a supplementary white paper to the previous government’s white paper on energy policy and long-term value creation from Norwegian energy resources, which presents an updated policy on the development of hydrogen.
Energy taxation The taxation of petroleum activities is based on rules governing ordinary business taxation. In light of the considerable return (resource rents) associated with the extraction of oil and gas, the government applies a special tax of 56% on income from petroleum extraction, in addition to the ordinary income tax of 22%. Consequently, the marginal tax rate on excess return in the petroleum sector is 78%. The excess return in hydropower production is taxed at 37% in addition to the corporate income tax (the statutory tax rate is 47.4%, but the effective tax rate is 37% due to the deduction of resource rent-related corporate income tax), resulting in a marginal tax rate of 59%.
From 2013 to 2019, the government revised tax rates. The standard corporate income tax was reduced to 22% and the surtaxes for hydropower and the petroleum industry were
IEA.
All
right
s re
serv
ed.

2. GENERAL ENERGY POLICY
28
adjusted. The tax system for hydro shifted to a cashflow-based pure rent tax in 2021; the previous government proposed in September 2021 to apply the same tax system for the petroleum sector, coming into force in January 2022.
About 85% of GHG emissions, both from energy and non-energy uses, are priced, either though the EU ETS or a tax (see Chapter 3). Most emissions from petroleum production and domestic aviation face both a CO2 tax and are part of the EU ETS.
Revenues from CO2 taxes and ETS allowances are funnelled into the state budget without any earmarking. Revenues from taxes on offshore petroleum are funnelled directly into the Government Pension Fund Global.
Environmental taxes have subsequently been introduced in a number of areas. Taxes on energy products include: a road usage tax on mineral oil, petrol, biodiesel, bioethanol, liquefied petroleum gas (LPG) and natural gas; an electricity consumption tax; a base tax on mineral oil; a lubricant oil tax; a CO2 tax on mineral products; and a sulphur tax. The taxes are based on the polluter-pays principle and are designed to reflect the social costs of energy use. For example, the CO2 tax on mineral products serves to curtail the consumption of petrol and diesel, and thereby to reduce CO2 emissions.
In addition to environmental and energy taxes, Norway also applies other taxes with environmental objectives, such as the motor vehicle registration tax.
Covid -19 response In June 2020, the Norwegian parliament enacted temporary changes to the Petroleum Tax Act to help oil and gas companies execute planned investments in light of the drop in global oil demand and prices during the first half of 2020. The decision changes rules for depreciation and uplift, as well as the treatment of tax losses, for a limited period of time.
In 2020, due to the consequences of Covid-19, the government increased the budget for petroleum and energy R&D under the Ministry of Petroleum and Energy (MPE) to ensure that activity levels in industry and at research institutes could be maintained. For the electricity sector, hydrogen and wind power were given priority. For the petroleum sector, the majority was allocated to demonstration projects, as these projects have a sizeable impact on the supply industry, which was hit particularly hard by the pandemic and the ensuing oil price decline.
Assessment Norway has set ambitious targets for reducing greenhouse gas emissions and establishing a low emissions society by 2050. As an energy-rich country, Norway is in a unique starting position with respect to the energy transition. An abundance of affordable hydropower has enabled the development of energy-intensive industries and a high level of electrification of homes and businesses with limited GHG emissions. At the same time, as a major oil and gas producer and exporter, Norway will need to prepare for a future where, due to the global energy transition, demand for its oil and gas will decline faster than the decline of its oil and gas production potential.
Thanks to its ample reserves of oil and natural gas, Norway is a net energy exporter: in 2020, 87% of its energy production was exported. In addition, its extensive hydropower
IEA.
All
right
s re
serv
ed.
2. GENERAL ENERGY POLICY
29
ENER
GY
INSI
GH
TS resources covered 92% of electricity generation. Together with a growing share of wind, it
supports an almost completely renewables-based power sector of 98%. Fossil fuels are exported abroad and cover only half of the country’s total energy supply, the fifth-lowest share among IEA member countries.
In 2020, 93% of Norway’s domestic energy production consisted of natural gas and oil. Gas production overtook oil production in 2012, and gas is now the largest source of domestic energy production (98 Mtoe, or 116 bcm in 2020), accounting for almost half of total production in 2020. Production of oil was 95 Mtoe in 2020 (1 950 kb/d) and has declined consistently in the last decade; in 2020, it was 5% lower than in 2010 and 43% lower than the peak in 2000.
Domestically, oil is mainly used in the industry and transport sectors, representing 84% of transport energy demand. The share of bioenergy ranges between 5% in industry and 11% in transport, and natural gas is used (in relatively small volumes) mainly in the industry sector. Around 0.6 Mt of imported coal is used every year in the industry sector.
Norway’s 2030 target under the Paris Agreement is to reduce emissions by at least 50% and towards 55% by 2030, compared to 1990. Through a climate co-operation agreement between Norway and the EU, Norway participates in EU climate legislation for the period 2021-30, covering the EU Emission Trading System; the Effort Sharing Regulation for non-ETS emissions; and the land use, land-use change and forestry regulation. The main emphasis of Norway’s Climate Action Plan for 2021-2030, presented in 2021 by the former government, was emissions not covered by the EU ETS, including from transport, buildings, waste, agriculture, and some minor emissions from industry production and the oil and gas industry. Under the current agreement with the EU, Norway has a 2030 national emissions reduction target for non-ETS emissions of 40% below 2005 levels.
The main policy instruments in the Climate Action Plan are GHG taxation, regulatory measures, climate-related requirements in public procurement processes, information on climate-friendly options, financial support for the development of new technologies, and initiatives to promote research and innovation. About 85% of GHG emissions are priced, either through the EU ETS or a tax. Emissions from petroleum production and domestic aviation face both a CO2 tax and are part of the EU ETS. On carbon pricing, the current government has announced a gradual increase in national taxes on non-ETS emissions to NOK 2 000 (EUR 200) per t CO2-eq in 2030, among the highest in the world. Revenues from CO2 taxes and ETS allowances are funnelled into the state budget without any earmarking. Revenues from royalties on offshore petroleum are funnelled directly into the Government Pension Fund Global.
To meet its ambitious targets, Norway has considerable work ahead, especially since electricity generation is already zero emissions (mainly from hydro power), so emissions reductions need to be found in other sectors, notably transport and industry. Emissions reductions to date do not place the country on track to meet its 2030 target through domestic reductions. In fact, Norway relied heavily on international offsets and its participation in the EU ETS to meet its 2020 target. As such, it would benefit from the development of national road maps for emissions reductions in key sectors such as industry, upstream oil and gas, buildings, and transport that include the role that energy efficiency and various technologies are expected to play in the energy transition. Such strategies will help provide the needed investment signals to support effective longer-term decarbonisation.
IEA.
All
right
s re
serv
ed.

2. GENERAL ENERGY POLICY
30
Norway’s climate strategies are well-aligned with the EU’s, and Norway has adopted a number of EU climate and energy directives into its domestic regulation. However, the time between adoption by the EU and finalisation of equivalent regulations in Norway can in some cases be lengthy. More rapid adoption would help jump-start investments in clean energy solutions for Norwegian industry.
As in all countries, energy efficiency has an important role to play in Norway. Though Norway has been blessed with affordable energy for a long time and has largely decoupled economic growth and energy consumption for many years, substantial cost savings could still be made from reducing consumption. Reducing energy consumption warrants even greater importance in the current context of high electricity prices. The government’s compensation scheme to provide temporary relief to households can mitigate the impact felt by consumers, but comes with a hefty price tag and will not be a sustainable solution over the long run. In this regard, Norway’s target to improve the overall energy intensity of the economy by 30% in 2030 compared to 2015 is commendable. To underpin this target, the government should establish a national energy efficiency strategy that includes cost-effective sectoral targets as well as policy measures to help end users’ lower consumption.
Norway’s oil and gas industry has been a mainstay of the Norwegian economy for 50 years and an immense source of revenue generation for the state and the Norwegian people. The country’s export revenues from the petroleum industry are estimated to be over NOK 800 billion (EUR 80 billion) in 2021 and expected to double in 2022. The Government Pension Fund Global, financed by the revenues from oil and gas production, finances public pension expenditures, provides benefits to both current and future generations from petroleum revenues, and protects the country’s long-term economy from volatility in oil and gas revenues. Each year, the Norwegian government can spend only a small part of the fund, but this still amounts to almost 20% of the government’s budget. At the end of 2021, the fund’s market value was NOK 12.23 trillion (EUR 1.23 trillion).
The petroleum sector remains a cornerstone of not only the Norwegian energy sector, but also Norwegian society and the economy, given its substantial revenues. Around half of oil and gas reserves have so far been extracted, and the government intends to continue production, be it in the North Sea, Norwegian Sea or Barents Sea, as long as there is global demand. The government intends to compete for oil and gas shares on the global market and will continue to offer new acreage for exploration. In the IEA’s Stated Policies Scenario from the World Energy Outlook 2021, global oil demand peaks as soon as 2035 and plateaus to 2050, whereas gas demand continues to rise. The Norwegian government remains confident that Norway can compete on a smaller global market for oil and gas, though it should plan for a scenario in which oil demand falls faster than expected as a result of many countries having net zero by 2050 targets.
At the same time, the oil and gas industry is one of the leading sources of GHG emissions in Norway, accounting for around a quarter of the country’s total emissions. There will likely be global demand for oil and gas in the years to come, even on the global pathway to net zero emissions. With relatively low production costs and emissions intensity of upstream operations, Norway is well-positioned as a provider of oil and gas to the world market, if low emissions intensity at some point becomes a valued market advantage. However, in terms of national emissions reductions, continuing current production levels also implies that the next tranche of emissions reductions in the sector to meet climate targets will be more challenging and costly. Results can come from additional electrification as well as
IEA.
All
right
s re
serv
ed.
2. GENERAL ENERGY POLICY
31
ENER
GY
INSI
GH
TS other technologies such as carbon capture in the longer term. However, these options
need to be thoroughly and holistically assessed with an eye to not only cost competitiveness, but also the development of planned new industries – including batteries, hydrogen and data centres – that will also need to draw renewable power from shore.
As electrification forms a central part of any country’s energy transition, Norway finds itself in an enviable starting position. Norway’s energy demand is already highly electrified: in 2019, electricity covered almost half (48%) of the country’s TFC, the highest share among IEA member countries. Electricity dominates demand in the residential sector (80%) and covers almost half of the energy demand of the industry sector (46%).
Still, more electrification will be needed across sectors to meet Norway’s climate targets, which will require additional renewable generation capacity, such as continued expansion of hydro capacity (including upgrades of existing plants). However, Norway will also need to find other new sources of electricity generation to support faster electricity demand growth, especially if it plans to maintain a power surplus domestically and its historical role as a net exporter of electricity in the Nordic electricity market. Plans for offshore wind will help, but given the relatively small volumes planned and long lead times, partial reliance on still-immature floating wind technology and the nascency of the industry in Norway, but remain a longer-term prospect, post-2030. In the interim, the government should support the development of onshore wind by expediting the planned reform of the licencing regime, including by ensuring robust local community engagement and support. Moreover, the country will also benefit from expanding the national grid (or assisting Sweden to enforce its grid) to ensure that surplus generation in the north of the country can more easily make its way south. Increased use of flexibility mechanisms to balance the grid will also be needed, and existing hydro storage capacity provides a good base.
As part of its efforts to reduce emissions in non-ETS sectors, transport stands out. Norway is a well-known leader on increasing the penetration of electric vehicles on its roads through a combination of fuel and (the absence of) vehicle taxation as well as non-monetary incentives that make the purchase of EVs economically attractive for drivers. Ample charging infrastructure has also helped support uptake. The generous incentives have not only resulted in Norway having the highest share of EVs (including pure battery and plug-in hybrid vehicles) in both car stock (22%) and car sales (86%) in 2021, but have also helped lower costs and advance battery technology globally. The strategy can pay off from an emissions reduction standpoint. However, transport currently accounts for nearly a quarter of Norwegian GHG emissions and the 2021 tax expenditure of the EV incentives was NOK 18.7 billion (EUR 1.9 billion) per year, or roughly NOK 6 200 (EUR 620) per tonne of estimated saved CO2. The next phase of Norway’s transportation sector transformation will be to ensure that the EV support is creating true displacement of internal combustion engines on Norwegian roads (rather than growing the vehicle fleet), while simultaneously reducing the incentives to avoid sustained budget erosion. Norway is also starting to make progress on electrifying segments beyond passenger cars, including buses, trucks and ferries.
Building on the 2030 Climate Action Plan, in June 2021, the former government also presented a white paper on energy policy and long-term value creation from Norwegian energy resources, including through new industries such as hydrogen and offshore wind, strengthening of the power grid, and a future-oriented oil and gas industry with low emissions from upstream activities. Innovation in Norway’s energy sector is spearheaded
IEA.
All
right
s re
serv
ed.
2. GENERAL ENERGY POLICY
32
by Enova, an entity owned by the Ministry of Climate and Environment. It supports new energy and climate technology in industry and transport and the introduction of new technologies.
Carbon capture and storage is a priority area for Norway’s climate action. The Norwegian government’s CCS strategy spans a wide range of activities, from research, development and demonstration to large-scale projects and international work promoting CCS. Norway has a lot of experience with CCS technologies and has been storing CO2 on the NCS since 1996. As such, it has established itself as a leader for CCS deployment and is home to a number of companies with CCS expertise. The technology can notably play a role in decarbonising industry (such as upstream oil and gas production, cement, and waste incineration) and facilitate the production of blue hydrogen, along with offering vast CO2 storage capacity for other countries. With the Longship project, Norway will develop a full-scale CCS chain. Longship includes CO2 capture from two industrial sources as well as a transport network and storage site. The storage site will be built with excess capacity to enable the storage of CO2 volumes from other European carbon capture projects. The goal is that the project will contribute to knowledge sharing and technology development in an international perspective, thereby helping to lower costs.
In light of resource rents associated with the extraction of oil and gas, the government applies a special tax on income from petroleum extraction in addition to the ordinary income tax. As such, the marginal tax rate on excess return in the petroleum sector is 78% (with the CO2 tax being fully deductible from taxable income). The effective marginal tax rate on hydropower production is 59%.
Based on the polluter-pays principle, environmental taxes have been introduced in a number of areas, including: a petrol tax, an auto diesel tax, an electricity consumption tax, a base tax on mineral oil, a lubricant oil tax, taxes on GHG emissions and a sulphur tax. In addition to environmental and energy taxes, Norway also applies other taxes with environmental objectives, such as the motor vehicle registration tax.
Overall, Norway has many natural advantages that can help it achieve a successful energy and climate transition. Leveraging its renewables-based electricity system, Norway can further support its goals by developing detailed, long-term sectoral transition road maps, underpinned by specific policy measures, which lay out a well-defined pathway for sectoral change.
IE
A. A
ll rig
hts
rese
rved
.
2. GENERAL ENERGY POLICY
33
ENER
GY
INSI
GH
TS Recommendations
The government of Norway should:
Develop a vision for how Norway can thrive as a low emissions society in 2050, including by establishing national emissions reduction strategies for key sectors to 2030 and 2050 that include specific targets and define supporting policy measures.
Consider various scenarios for future global oil and gas demand as it pursues a longer-term strategy for the transformation from oil and gas revenue dependency, including diversification into low-carbon energy carriers.
Facilitate expansion and development of low-carbon electricity generation, storage, and transmission and distribution grids to maintain Norway’s position as a key player in the Nordic electricity market.
Prioritise energy efficiency as a policy area, including through sectoral targets, action plans and supporting measures, especially in the buildings and industry sectors.
Increase its ambition to jump-start clean technologies where Norway may have competitive advantages and means, such as hydrogen, green shipping, carbon capture and storage, and offshore wind.
IEA.
All
right
s re
serv
ed.
2. GENERAL ENERGY POLICY
34
References Energy Facts Norway (2018), Key EU energy legislation (web page), https://energifaktanorge.no/en/eu-lovgivning/sentrale-direktiver-pa-energiomradet
Norway, Ministry of Petroleum and Energy (2022), An energy policy for employment, transition and security in times of uncertainty (web page), https://www.regjeringen.no/no/aktuelt/pm-tilleggsmelding/id2908251/
Norway, Ministry of Climate and Environment (2021a), Norway’s comprehensive climate action plan (web page), https://www.regjeringen.no/en/historical-archive/solbergs-government/Ministries/kld/news/2021/heilskapeleg-plan-for-a-na-klimamalet/id2827600/?expand=factbox2827687
Norway, Ministry of Petroleum and Energy (2021b), Energy for work - long-term value creation from Norwegian energy resources (web page), https://www.regjeringen.no/no/dokumenter/meld.-st.-36-20202021/id2860081/
IEA (International Energy Agency) (2022), World Energy Balances (database), https://iea.org/data-and-statistics/data-product/world-energy-balances (accessed on 18 February 2022)
NBIM (Norges Bank Investment Management) (2021), About the fund (web page), https://nbim.no
Norwegian Petroleum (2022), The government’s revenues (web page), https://norskpetroleum.no/en/economy/governments-revenues
OECD (2021), Emplyment rate (database), https://data.oecd.org/emp/employment-rate.htm (accessed on 31 May 2022)
Statistics Norway (2022), Electricity Prices (database), https://ssb.no/en/energi-og-industri/energi/statistikk/elektrisitetspriser (accessed on 11 May 2022)
Statistics Norway (2021), Over 150,000 jobs in the oil industry (web page), https://ssb.no/arbeid-og-lonn/sysselsetting/artikler/over-150-000-jobber-i-oljebransjen
Statistics Norway (2021b), Long-term Perspectives on the Norwegian Economy 2021, https://www.regjeringen.no/contentassets/91bdfca9231d45408e8107a703fee790/en-gb/pdfs/stm202020210014000engpdfs.pdf
World Bank, (2021), Population Density (database), https://data.worldbank.org/indicator/EN.POP.DNST?locations=NO&most_recent_value_desc=false (accessed on 11 May 2022)
IE
A. A
ll rig
hts
rese
rved
.

35
ENER
GY
SYST
EM T
RAN
SFO
RM
ATIO
N
3. Energy and climate change
Key data GHG emissions without LULUCF (2019):* 50.3 Mt CO2-eq, -8.9% since 2005, -2.2% since 1990
GHG emissions with LULUCF (2019):* 31.7 Mt CO2-eq, -7.4% since 2005, -19.8% since 1990
Energy-related CO2 emissions (2020):
CO₂ emissions from fuel combustion: 35 Mt CO₂, +2% since 2005, -6% from 2010 to 2019, -4% from 2019 to 2020
CO₂ emissions by fuel: oil 55.2%, natural gas 32.8%, coal 8.5%, other 3.4%
CO₂ emissions by sector: industry 58.5%, transport 34.1%, electricity and heat generation 4.6%, buildings 2.8%
CO₂ intensity per GDP: 0.08 kg CO₂/USD (IEA weighted average 0.197 kg CO₂/USD) * GHG emissions data are from UNFCCC, https://di.unfccc.int/detailed_data_by_party
Overview Through its enhanced under the Paris Agreement, Norway has committed to reduce GHG emissions by at least 50% and towards 55% by 2030 compared to 1990 levels. Norway’s NDC is economy-wide, covering all sectors and GHGs.
In June 2017, the Norwegian parliament adopted the Climate Change Act. In addition to establishing the 2030 target, the act establishes by law Norway’s target of becoming a low emissions society by 2050, which is equivalent to reducing emissions by around 90-95% from 1990 levels.
GHG emissions in the base year (1990) were 52 million tonnes of CO2 equivalent (Mt CO2-eq), excluding LULUCF. In 2019, Norway’s total GHG emissions stood at 50.35 Mt CO2-eq, a 2% reduction since 1990.
In 2019, GHG emissions from the energy sector were 36 Mt CO2-eq and accounted for 71% of total GHG emissions. Energy sector emissions include oil and gas extraction (25% of total GHG emissions), transport (24%), fuel combustion in industry (7%), buildings (6%), fugitive emissions (4%), and electricity and heat generation (3%). Emissions from industrial processes accounted for 18%, followed by the agriculture sector (9%) and waste (2%).
IEA.
All
right
s re
serv
ed.

3. ENERGY AND CLIMATE CHANGE
36
Figure 3.1 Greenhouse gas emissions by sector in Norway, 2000-2019 and targets
Norway’s GHG emissions fell by 9% from 2000 to 2019, with a sharp decline in 2019. The country’s targets are to reduce emissions by 50-55% by 2030 and 90-95% by 2050.
Notes: LULUCF = land use, land-use change and forestry. 2030 GHG emissions target data excluding LULUCF are estimated according to the emissions target in the Norway’s nationally determined contribution, and can be partly achieved with trading of emissions allowances within the European Union or other flexible mechanisms. Source: UNFCCC (2022).
Energy-related CO2 emissions In 2020, Norway’s energy-related CO2 emissions were 35 Mt CO2, 10% higher than in 2000 (Figure 3.2). There was a sharp decrease between 2018 and 2020, as emissions fell in the transport sector, also driven down by the Covid-19 pandemic in 2020. Between 2010 and 2020, energy-related CO2 emissions dropped by 9%, with significant reductions in all sectors, with the exception of industry, whose emissions increased by 2%.
Figure 3.2 Energy-related CO2 emissions by sector and fuel in Norway, 2000-2020
After peaking in 2010, Norway’s energy-related CO2 emissions were stable until 2015. Emissions steadily fell in all sectors from 2015 to 2020, except in industry.
Source: IEA (2022a).
- 30
- 20
- 10
0
10
20
30
40
50
60
1990
2000
2001
2002
2003
2004
2005
2006
2007
2008
2009
2010
2011
2012
2013
2014
2015
2016
2017
2018
2019
2030
2050
Mt C
O2-
eq Targets
Waste
Fugitive emissions
Electricity and heat generation
Agriculture
Buildings
Industry
Transport
Oil and gas extraction
LULUCF IEA. All rights reserved.
-50/55%
-90/95%
0 5
10 15 20 25 30 35 40
Mt CO₂Buildings
Electricity andheat generation
Transport
Industry
IEA. All rights reserved.
IEA.
All
right
s re
serv
ed.

3. ENERGY AND CLIMATE CHANGE
37
ENER
GY
SYST
EM T
RAN
SFO
RM
ATIO
N Domestic consumption of oil was responsible for the largest share of energy-related CO2
emissions in Norway, accounting for 55% of the total in 2020, followed by natural gas at 33%, coal at 8.5% and non-renewable waste at 3.4% (Figure 3.3). Oil emissions experienced a marked decline between 2018 and 2020, in line with a notable reduction in emissions from the transport sector. Natural gas emissions slightly dropped between 2019 and 2020, as its use in industry decreased, whereas coal and other energy sources have remained stable over the last decade.
Figure 3.3 Energy-related CO2 emissions by energy source in Norway, 2000-2020
Oil makes up the largest part of energy-related CO2 emissions in Norway, followed by natural gas and coal. Oil emissions dropped by 8% in 2020 compared to 2018.
Source: IEA (2022a).
CO2 emissions drivers and carbon intensity Over the period 2000-2020, Norway’s total energy-related CO2 emissions fluctuated, peaking in 2015 and decreasing since then. Norway has started to decouple its emissions and economic growth, as energy-related emissions increased by 10% between 2000 and 2020 while the country’s GDP increased by 35%. The decoupling is more evident since 2015, when energy-related CO2 emissions started to decline while GDP kept growing. The carbon intensity of Norway’s energy supply (CO2/TES) fluctuates, but has been on average stable since 2014.
In 2020, CO2 emissions per unit of GDP in Norway were 0.107 kilogrammes of carbon dioxide (kg CO2) per USD, which is the sixth-lowest among IEA member countries. Norway’s CO2 intensity has been historically low and has shown a gradual declining trend, which has steepened since 2015. CO2 emissions from electricity and heat generation were 10 g CO2/kWh in 2020, the lowest among IEA member countries.
0
5
10
15
20
25Mt CO₂
Oil
Natural gas
Coal
Non-renewablewaste
IEA. All rights reserved.
IEA.
All
right
s re
serv
ed.
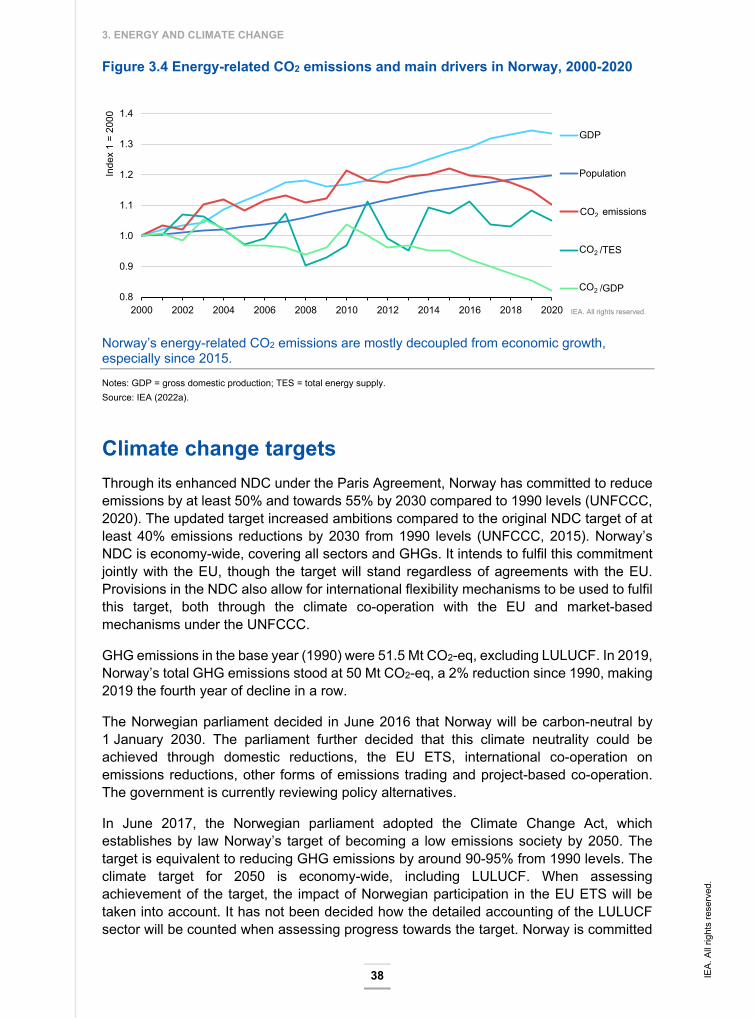
3. ENERGY AND CLIMATE CHANGE
38
Figure 3.4 Energy-related CO2 emissions and main drivers in Norway, 2000-2020
Norway’s energy-related CO2 emissions are mostly decoupled from economic growth, especially since 2015.
Notes: GDP = gross domestic production; TES = total energy supply. Source: IEA (2022a).
Climate change targets Through its enhanced NDC under the Paris Agreement, Norway has committed to reduce emissions by at least 50% and towards 55% by 2030 compared to 1990 levels (UNFCCC, 2020). The updated target increased ambitions compared to the original NDC target of at least 40% emissions reductions by 2030 from 1990 levels (UNFCCC, 2015). Norway’s NDC is economy-wide, covering all sectors and GHGs. It intends to fulfil this commitment jointly with the EU, though the target will stand regardless of agreements with the EU. Provisions in the NDC also allow for international flexibility mechanisms to be used to fulfil this target, both through the climate co-operation with the EU and market-based mechanisms under the UNFCCC.
GHG emissions in the base year (1990) were 51.5 Mt CO2-eq, excluding LULUCF. In 2019, Norway’s total GHG emissions stood at 50 Mt CO2-eq, a 2% reduction since 1990, making 2019 the fourth year of decline in a row.
The Norwegian parliament decided in June 2016 that Norway will be carbon-neutral by 1 January 2030. The parliament further decided that this climate neutrality could be achieved through domestic reductions, the EU ETS, international co-operation on emissions reductions, other forms of emissions trading and project-based co-operation. The government is currently reviewing policy alternatives.
In June 2017, the Norwegian parliament adopted the Climate Change Act, which establishes by law Norway’s target of becoming a low emissions society by 2050. The target is equivalent to reducing GHG emissions by around 90-95% from 1990 levels. The climate target for 2050 is economy-wide, including LULUCF. When assessing achievement of the target, the impact of Norwegian participation in the EU ETS will be taken into account. It has not been decided how the detailed accounting of the LULUCF sector will be counted when assessing progress towards the target. Norway is committed
0.8
0.9
1.0
1.1
1.2
1.3
1.4
2000 2002 2004 2006 2008 2010 2012 2014 2016 2018 2020
Inde
x 1
= 20
00
GDP
Population
CO2 emissions
CO2/TES
CO2/GDP
IEA. All rights reserved.
CO2
CO2
CO2
IEA.
All
right
s re
serv
ed.
3. ENERGY AND CLIMATE CHANGE
39
ENER
GY
SYST
EM T
RAN
SFO
RM
ATIO
N to not applying the full LULUCF sink, as its inclusion would require a negative emissions
target to ensure the same level of ambition as the current target.
Norway’s 2020 target was to cut GHG emissions by 30% from 1990 levels, underpinned by participation in the EU ETS and international offset mechanisms. Domestically, Norway missed its 2020 target by a large margin, relying heavily on international offsets. From 2000 to 2019, Norway’s GHG emissions fell by 9%, with a sharp decline in 2019 thanks to lower emissions in the transport, industry and electricity generation sectors. Additionally, carbon removals from the LULUCF sector accounted for 19 Mt CO2-eq in 2019.
Climate change policies EU emissions reduction policies Norway has an agreement with the EU to participate in EU climate legislation for the period 2021-2030, covering the EU ETS, the ESR for non-ETS emissions and the LULUCF regulation.
As part of its participation in the EEA, Norway has been a part of the EU ETS since 2008 on the same terms as EU member states. The EU ETS regulates emissions from industrial plants, power plants, the petroleum industry and commercial aviation within the EEA. Around half of Norway’s emissions fall under the EU ETS, making it a central component of national climate policy.
Under the current climate agreement with the EU, Norway has a legally binding 2030 target to reduce emissions in non-ETS sectors by 40% below 2005 levels and has stated an ambition to reduce its emissions by 45% through domestic measures. Non-ETS sectors include agriculture, transport, waste and buildings. Norway will apply the same rules and have the same obligations and flexibilities as EU member states, to allow for a fair and cost-efficient achievement of targets (EC, 2021).
Under the LULUCF regulation, Norway will ensure that GHG emissions from LULUCF are balanced by at least an equivalent removal of CO2 from the atmosphere in the 2021-2030 period, the so-called “no-debit” rule (EC, 2019).
The EU’s Fit for 55 package will update all three regulations (the ETS, the ESR and the LULUCF regulation). The government has stated on its political platform that it intends to continue the climate co-operation with the EU as EU policies are updated.
Climate Change Act In June 2017, the Norwegian parliament adopted a Climate Change Act, which establishes by law Norway’s emissions reduction targets for 2030 and 2050. Based on the latest update, it states that by 2030 Norway will reduce emissions by at least 50% and up to 55% from 1990 levels by 2030, and by 2050 Norway will become a low emissions society (defined as an emissions reduction of 90-95% from 1990 levels).
The purpose of the act is to promote the long-term transformation of Norway in a climate-friendly direction. The act describes a low emissions society as one where GHG emissions – on the basis of the best available scientific knowledge, global emissions trends
IEA.
All
right
s re
serv
ed.
3. ENERGY AND CLIMATE CHANGE
40
and national circumstances – have been reduced to avert the adverse impacts of global warming, as described in the Paris Agreement.
The Climate Change Act, which took effect on 1 January 2018, introduced a system of five-year reviews of Norway’s climate targets, based on the same principle as the Paris Agreement. In addition, the act introduced an annual reporting mechanism. Each year, the government must submit to the parliament updated information on status and progress toward achieving climate targets under the law, as well as on how Norway is preparing for and adapting to climate change.
Climate Action Plan 2021-2030 In January 2021 the former government presented a white paper describing a Climate Action Plan for the period 2021-2030 (Meld. St. 13 [2020-2021]). The plan outlines how Norway will achieve its climate target of reducing emissions by at least 50% and towards 55% from 1990 levels by 2030, while at the same time creating green growth.
On carbon pricing, the white paper announced a gradual increase in the taxes on non-ETS emissions to 2 000 NOK/t CO2-eq (200 EUR/t CO2-eq, 2020 value) in 2030 (see below on carbon pricing). For mainland industry covered by the EU ETS, the carbon price from the ETS will continue to be the main policy driver for emissions reductions. However, for the petroleum and domestic aviation industries, the action plan stated that the total carbon price (EU ETS allowance price plus CO2 tax) was to be increased to approximately 2 000 NOK/t CO2-eq (200 EUR/t CO2-eq) in 2030.
In non-ETS sectors, the action plan pays particular attention to transport, where the former government stated an intention to halve emissions from the sector by 2030. Measures to achieve this include the carbon tax, as well as incentives for purchasing ZEVs, with the aim that all new passenger car sales be zero emissions by 2025 and that progress extend to non-road transport and shipping. Enova supports technology development and early market introduction of zero emissions solutions in the transport sector. The government also uses public procurement to advance the development of zero emissions transport options (especially in the segments of vans, heavy trucks and buses). The white paper also notes the importance of co-ordinated transport planning through a planned National Transport Plan 2022-2023 that will provide guidance toward 2030 emissions targets in the sector (Norway, Ministry of Transport, 2021).
For other non-ETS sectors, the plan highlights the gradual phase-out of fossil fuels for energy purposes in industry by 2030 and natural gas for heating of buildings by 2025. Moreover, the increased carbon tax is expected to have a particular impact in driving decarbonisation in the industry, buildings, oil and gas, and waste incineration sectors.
The action plan also addresses emissions from the agriculture sector. The government signed a letter of intent with agricultural organisations with a target to reduce GHG emissions from the sector by 5 Mt CO2-eq over the period 2021-2030. The government will help support farmers to switch from fossil fuels to electricity, sustainable liquid biofuels and biogas for their machinery, as well as make better use of livestock manure and local fodder resources.
The Climate Action Plan also outlines a strategy to enhance Norway’s carbon sinks through measures to increase CO2 removals by forests, including tree planting, fertilisation and other forest management methods. LULUCF measures to reduce emissions also
IEA.
All
right
s re
serv
ed.
3. ENERGY AND CLIMATE CHANGE
41
ENER
GY
SYST
EM T
RAN
SFO
RM
ATIO
N include plans for reducing peatland degradation, for peatland restoration, as well as
consideration of a ban on peat extraction and a land tax.
In April 2022, the government presented a supplementary white paper (Meld. St. 11 [2021-2022]) to the previous government’s white paper on energy policy and long-term value creation from Norwegian energy resources (Meld. St. 36 [2020-2021]). The supplementary white paper presents an updated energy policy that aims to provide abundant and affordable access to power, to continue stable oil and gas production on the NCS, and to contribute to lower GHG emissions. The white paper also presents policies to facilitate new green industries, such as offshore wind, hydrogen and CCS.
Carbon pricing The polluter-pays principle is a cornerstone of the Norwegian policy framework on climate change. Norway was one of the first countries in the world to put in place a carbon tax, already in 1991, covering the combustion of fossil fuels and the petroleum sector. Today, approximately 85% of domestic GHG emissions are either covered by the EU ETS or subject to a CO2 tax (or other GHG taxes), or both. And nearly 70% of non-ETS emissions are covered by taxes on GHG emissions. Emissions of nitrous oxide and methane from agriculture constitute two-thirds of non-priced emissions. Methane from landfills is another important source of non-priced emissions. The practice of dumping biological waste on landfills has been banned, and these emissions will phase out.
Since the IEA’s last in-depth review, the national CO2 tax has increased and is currently around 766 NOK/t CO2-eq (76 EUR/t CO2-eq) for emissions outside the EU ETS. Emissions from the petroleum sector are mostly covered by the EU ETS and the current CO2 tax is about 620 NOK/t CO2-eq (62 EUR/t CO2-eq for natural gas) and 705 NOK/t CO2-eq (70 EUR/t CO2-eq) for mineral oil. Almost all emissions in the petroleum sector come from the combustion of natural gas.
The former government announced in its 2021 white paper that the CO2 tax will gradually triple the level of taxation to 2 000 NOK/t CO2-eq (200 EUR/t CO2-eq) in 2030. The current government has stated its support for this measure. According to the Climate Action Plan, emissions from the oil and gas industry and domestic aviation covered by the EU ETS was to have a total carbon price (EU ETS price + national CO2 tax) of around 2 000 NOK/t CO2-eq (200 EUR/t CO2-eq) in 2030. The announcement of the CO2 tax increase was presented to parliament as part of the white paper in January 2021. The white paper was debated and decided on in April, including the CO2 tax increase. In its first budget, the current government has started to increase the CO2 tax.
The role of low-carbon electricity in decarbonisation Norway has the highest share of electricity produced from renewable sources in Europe and the lowest carbon emissions intensity from the power sector. Hydropower accounted for 89% (33.5 gigawatts [GW]) of total installed electricity generation capacity in 2020. Norway also had 2.9 GW of installed wind capacity, and about 500 MW of natural gas at a plant that is not used on a regular basis. Hydropower capacity has increased by 4 GW since 2009, while wind capacity has increased almost sixfold from 423 MW in 2009.
Looking ahead, the increased electrification of end uses, notably industry and transport, to meet climate targets means that electricity demand will grow, requiring an additional build-out of zero emissions generation capacity. New industries such as green hydrogen,
IEA.
All
right
s re
serv
ed.
3. ENERGY AND CLIMATE CHANGE
42
data centres or battery gigafactories, and the decarbonisation of existing process industries are also expected to contribute to increased electricity demand. In its long-term analysis from 2016, the Norwegian Water Resources and Energy Directorate (NVE) estimated an increase in electricity demand in Norway from 130 TWh in 2015 to 143 TWh in 2030. In the NVE’s recent long-term analysis from 2021, it estimated demand growth to 159 TWh in 2030.
Given that nearly all electricity production comes from hydropower and wind power, and that Norway is highly electrified, renewables are not subject to special treatment or policies, but constitute a central component of the country’s domestic energy system. The NVE predicts that the bulk of new generation growth from 2021 to 2030 will come from new hydro capacity, with some growth from solar PV, though there are some uncertainties with respect to the extent of solar capacity additions given the costs associated with ground-mounted solar and grid connections.
In 2019, the former government put on hold approvals for new wind projects. Norway has faced local opposition to onshore wind power projects, based on the impact on landscapes and ecology.
In June 2020, the former government released a white paper on land-based wind power, proposing changes to the licencing requirements. Some of the main measures focused on increasing local and regional involvement, ensuring that environmental matters were more effectively taken into consideration, and introducing new deadlines to shorten the timeline for planning and building wind farms. The overall aim was to provide a reliable framework for long-term development of onshore wind power in Norway.
In April 2022, the government announced that the licencing of new onshore wind power projects, in cases where the local municipality agrees, will resume. The new framework for licencing, presented by the previous government’s white paper on onshore wind, will be applied.
Most unused wind licences either expired in 2021 or will expire in 2022. Due to the recent pause in granting new licences, it is expected that only onshore wind currently under construction will be realised by 2030.
Norway also has longer term plans for the development of offshore wind, and is currently in the process of developing a licencing framework for the technology. These include a plan to build the world’s largest floating offshore wind farm (Hywind Tampen), consisting of 11 wind turbines based on Equinor’s floating wind technology, with a total installed capacity of 88 MW. Beyond this project, two areas have been opened for offshore wind power development, one in deep waters with high-cost floating technology and one with a bottom-fixed solution. The NVE does not expect any offshore wind projects to be online before 2030, and its projections include 7 TWh of offshore wind power produced in 2040.
Norway will also need to expand grid capacity to accommodate the growth in renewables generation capacity, including introducing more flexibility mechanisms to handle additional generation from variable renewables. Toward this end, and based on the need for reinvestment and growing electricity demand, Norway’s TSO Statnett released a Grid Development Plan 2021 that includes plans for several major new projects, for an investment of NOK 60-100 billion.
IEA.
All
right
s re
serv
ed.
3. ENERGY AND CLIMATE CHANGE
43
ENER
GY
SYST
EM T
RAN
SFO
RM
ATIO
N In February 2022, the government appointed an Energy Commission to map out future
energy demand and propose increased energy production, with the aim that Norway will continue to have surplus electricity production and that Norwegian industry and electricity consumers will continue to have abundant access to renewable power. The commission will also assess the challenges facing Norwegian energy policy towards 2030 and 2050, and how different policy choices will affect the long-term development of Norway’s power supply. The Energy Commission’s mandate is linked to five overarching themes: 1) how Norway is affected by rapidly changing energy markets; 2) perspectives on the evolution of power consumption; 3) the potential for socio-economically profitable power production; 4) perspectives for security of supply; and 5) key conflicts of interest within the energy policy field. The Energy Commission is expected to submit its report by 15 December 2022.
Critical minerals Increased electrification as well as a number of clean energy applications will increase Norway’s demand for critical minerals such as lithium, cobalt, nickel, manganese and certain rare earth minerals. The NCS has sulphides and manganese crusts, containing metals and minerals that are crucial for such technologies, including batteries and wind turbines.
The government initiated an opening process for mineral activities on the NCS. The Norwegian Petroleum Directorate has been tasked by the MPE to map the most commercially interesting mineral deposits on the NCS. The Norwegian Petroleum Directorate’s assessments of sulphides so far show high contents of copper, zinc and cobalt. In addition, rare earth elements have been found in samples from manganese crusts. The content of some of these metals is high compared with deposits from other places around the world (Norwegian Petroleum Directorate, 2022).
The act relating to mineral activities on the NCS – the Seabed Minerals Act – also entered into force on 1 July 2019.
Oil and gas sector decarbonisation GHG emissions from petroleum activities originate from the combustion of natural gas and diesel in turbines, engines and boilers; flaring of natural gas for safety reasons; venting and diffuse emissions of gas; and storage and loading of crude oil. The industry’s own organisation, the Norwegian Oil and Gas Association, has a national database for reporting all releases from the industry, called the EPIM Environment Hub. All operators on the NCS report data on emissions to air and discharges to the sea directly in the EPIM Environment Hub (Norwegian Petroleum, 2021).
Norway has a number of policies in place to ensure that oil and gas companies consider environmental and climate issues during all phases of their activities, from exploration to development, operations and field cessation (Norwegian Petroleum, 2021). Emissions from oil and gas activities in Norway are regulated through the Petroleum Act, the CO2 Tax Act and the Pollution Control Act.
Norway has regulated methane emissions and controlled flaring since the 1970s. A permit under the Pollution Control Act is required for the offshore and onshore petroleum sector, issued by the Norwegian Environmental Agency. Direct emissions of methane (venting and fugitive emissions) are regulated through emissions limits set in facility-specific
IEA.
All
right
s re
serv
ed.

3. ENERGY AND CLIMATE CHANGE
44
permits. As a general requirement, the emissions limits are based on best available technology as defined nationally or in the EU, assessed individually for each facility. Flaring of natural gas is only permitted when necessary for safety reasons, based on permits issued by the MPE. Norway is also part of the Global Methane Pledge of over 100 countries announced at COP26 to reduce global methane emissions by at least 30% from 2020 levels by 2030.
The CO2 tax on petroleum sector activity on the continental shelf was introduced in 1991. It is levied on all combustion of gas, oil and diesel in petroleum operations on the continental shelf and on releases of methane directly into the atmosphere. For 2022, the tax rate is NOK 1.65 (EUR 0.16) per standard cubic metre of gas or per litre of oil or condensate. For combustion of natural gas, this is equivalent to 705 NOK/t CO2 (70 EUR/t CO2). For emissions of natural gas directly into the atmosphere, the tax rate is NOK 10.66 (EUR 1.1) per standard cubic metre, or 766 NOK/t CO2-eq (76 EUR/t CO2-eq).
The combination of the carbon tax and the EU ETS means that companies on the NCS pay approximately 1 600 NOK/t CO2 (160 EUR/t CO2) emissions in 2022, which is significantly higher than for most other businesses in Norway. It is also higher than the CO2 price paid by producers in other countries with petroleum activities (Norwegian Petroleum, 2021). As a result, Norway has among the lowest emissions intensity of oil production in the world, estimated by the government at around 8 kg CO2-eq per barrel of oil.
The government has a target for the sector to halve 2005 emissions by 2030, and to reach net zero emissions by 2050. An assessment by the MPE along with the industry found that those reductions could only be achieved by around 2035, driven by the increasing carbon price.
Electrification of oil and gas platforms is considered a key tool to achieving emissions reduction targets. All new upstream projects are required to consider electrification in their planning process, though application still depends on costs and access to grid connections. Beyond electrification, the advancement of new technologies, such as CCS, is also expected to play a role in upstream decarbonisation (see below).
Transport sector decarbonisation Norway is a large and mountainous country spanning a distance of 1 770 km from north to south. Road transport is the dominant means of transport both for short trips in cities and longer journeys. Freight relies heavily on road (52%) and sea (42%), with only 6% by rail.
Vehicle taxation is the main policy instrument for decreasing emissions in the transport sector. Fossil fuel cars are taxed through the registration tax, which contains a component that increases with estimated CO2 emissions, the CO2 tax, and the road use tax on gasoline and diesel. ZEVs, on the other hand, enjoy zero VAT; exemption from the one-off registration tax; as well as reduced toll road charges, ferry and parking fees. Electricity to EVs is not covered by the road usage tax, which is levied on liquid fuels and gas. In addition, PHEVs have for several years benefited from a reduced one-off registration tax. EVs also have special e-number plates, allowing authorities to choose local incentives such as free parking, use of bus lanes or payment of lower regional road tolls. The tax expenditure of the EV incentives were NOK 18.7 billion (EUR 1.9 billion) in 2021,
IEA.
All
right
s re
serv
ed.
3. ENERGY AND CLIMATE CHANGE
45
ENER
GY
SYST
EM T
RAN
SFO
RM
ATIO
N while the energy industry associatgion Drivkraft Norge estimates that EVs reduced
emissions of CO2-eq by around 5% in 2020.
As a result, Norway had the highest share of EVs (including both pure battery and PHEVs) in both car stock (25%) and car sales (85%) among IEA countries in 2021. In 2021, about 151 900 EVs were sold in Norway, of which 113 700 were fully battery electric and 38 200 plug-in hybrids; the total EV stock reached 585 650.
Norway also had 9 726 electric vans, 453 electric buses, 25 electric trucks and 159 fuel cell cars on the road in 2020. In the same year, almost 17 000 public electric chargers were available in the country, of which 5 300 were fast chargers. The country has 0.35 public charging points for every ten EVs. The first electric ferry was introduced in 2015 and the government aims to have 70 hybrid and electric ferries on the Norwegian coast by 2022, as well as the first offshore vessel fuelled by ammonia by 2024.
The Climate Action Plan 2021-2030 also announces a target to halve emissions from the shipping industry from 2005 to 2030, including through the establishment of low- and zero emissions criteria in public procurement of maritime transport services, commencing in 2023. The increase in the taxes on non-ETS emissions is the main policy instrument for reaching this goal. The government also plans to support county municipalities that prioritise zero-emission solutions on ferries and speedboats. Following a parliamentary decision, the government is working on a plan to establish criteria for deploying zero- and low emissions solutions for offshore vessels in petroleum production by 2023.
In addition to EVs, the government plans to build on successful decarbonisation to date in road transport driven by biofuels by expanding its quota policy to extend progress beyond road transport to include off-road diesel and shipping. Currently for road transport, fuel suppliers must fulfil a biofuels quota of 24.5% of the volume of fuels supplied, of which a minimum of 9% must be advanced biofuels. Advanced biofuels are counted at twice their volume, creating an effective blend rate of 12.25-15.5%.
The government is also exploring options for creating low emissions zones that promote sustainable transport and cleaner cities. The government set a target of zero growth in passenger transport by car in large urban areas. Long-term urban growth agreements include improving public transport, bicycle and walking alternatives, and restrictive measures for car traffic such as road tolls and parking restrictions. Under agreements between the government and local communities, funds are granted to finance public transport projects.
Technology and innovation Energy innovation also has an important role to play in meeting Norway’s climate targets, notably in decarbonising hard-to-abate sectors, such as transport (especially non-passenger and non-road transport), industry, and oil and gas production. To this end, Norway has several programmes in place to promote technology development, including for CCS and hydrogen.
Carbon capture and storage CCS is a priority area for Norway's climate action, and is identified as an essential measure in Norway's NDC. Without CCS, it will be nearly impossible for Norway to meet its targets for domestic emissions reductions. Langskip (“Longship”) which is under construction, is
IEA.
All
right
s re
serv
ed.

3. ENERGY AND CLIMATE CHANGE
46
a central part of the government’s policy for CCS. The project comprises state aid, on certain conditions, for two full-scale capture facilities and one storage facility in the North Sea. Langskip aims to facilitate learning related to regulation and simulation of CCS for subsequent projects in Europe and the rest of the world. CCS has broad public acceptance in Norway.
The carbon tax introduced in 1991 is one of the key drivers of CCS. In 2005, Gassnova was established by the Norwegian government as a state-owned enterprise with the mandate to drive investment in CCS technologies. The government also adopted a CCS strategy in 2014-2015.
In addition to several pilot projects, there are currently two large-scale CCS projects operating in Norway and one under development. Since 1996, CO2 has been captured from natural gas production at the Sleipner West reservoir (and since 2014 from the Gudrun field) and stored at the Utsira geological formation. Since 1996, up to 1 Mt CO2 per year has been separated and stored under this project. The second active, large-scale CCS project started operations in 2008, where CO2 is captured from the natural gas produced at the Snøhvit field before it is converted into liquefied natural gas (LNG) for export, and stored back in the same field. At full production, about 0.7 Mt CO2 per year is separated and stored at the Snøhvit field.
The CCS strategy adopted in 2015 initiated pre-feasibility studies for the Longship project (Longship, 2021). By spring 2020, front-end engineering design studies were completed for CO2 capture, transport and storage, and the government took a final investment decision that year to proceed with the project. The project will transport CO2 from emissions points by truck, then ship to an onshore gathering station. CO2 is then piped around 100 km offshore to the storage site where it is injected. Given that one of the challenges with CCS is the integration of complete value chains, the state is playing the role of a market maker, serving as an intermediary between capture and storage operators.
Longship initially includes CO2 capture from the Norcem’s Brevik cement factory and, in certain conditions, Fortum Oslo Varme’s waste incinerator facility, for a total of 0.8 Mt CO2 per year. Northern Lights, a joint venture company owned by Equinor, Shell and Total, is developing the CO2 transport and storage solution, and proved in February 2020 that the Troll oil and gas field was suitable for approximately 1.5 Mt CO2 storage per year. In May 2021, the Northern Lights Joint Venture announced its intention to drill a second injection well in 2022 as the first step toward increasing the capacity of Longship to 5 Mt/year.
With the approval of the national budget for 2021, the parliament agreed to the funding model and the conditions for further project development. State funding for the Longship project is estimated to be NOK 16.8 billion (EUR 1.65 billion), or about two-thirds of the total cost of the first phase. Longship is currently in the construction phase, planning to start operations in 2024.
In 2021, Norway declared two additional offshore areas as available for CO2 storage development, with a deadline to submit applications for those areas in December 2021. Two licences were awarded by the MPE on the NCS (one in the North Sea and one in the Barents Sea) in April 2022 (Norway, Ministry of Petroleum and Energy, 2022).
IEA.
All
right
s re
serv
ed.
3. ENERGY AND CLIMATE CHANGE
47
ENER
GY
SYST
EM T
RAN
SFO
RM
ATIO
N Norway is home to a number of companies with carbon capture, utilisation and storage
(CCUS)-specific or related expertise:
Equinor owns the Sleipner and Snøhvit CCUS projects. It is also involved in numerous CCUS projects in development globally. While Equinor is a publically traded company, the Norwegian state is the majority shareholder.
Northern Lights JV, a joint venture between Equinor, Shell and Total, is the promoter of the Northern Lights project.
Aker Carbon Capture, a spin-off of Aker Solutions, owns proprietary capture technology and is working to develop a business model where CO2 capture is offered as a service to small emitters. It also designs and constructs capture facilities for large emitters.
DNV is a classification society that has produced best practice guidelines for CCUS activities. It has been involved with certifying the design of numerous projects globally, and has worked with many governments on CCUS-related activities.
Horisont Energi is a Euronext listed cleantech start-up that is developing blue ammonia, blue hydrogen and CO2 storage services. It is a promoter of the Barents Blue ammonia/Polaris CCS storage project.
In addition, Gassnova jointly runs the CLIMIT programme with the RCN, which is focused on research, development and demonstration (RD&D) of CCUS technologies in Norway.
Norway also places a strong emphasis on international co-operation on CCUS, and has identified Europe as a priority area. The Norwegian government estimates that every doubling of CCUS capacity globally can bring down costs by at least 10%. Longship has been designed with significant excess transport and storage capacity. Both the commercial project promoters and the Norwegian government have suggested that this excess capacity could be used by non-Norwegian emitters. Since 2017, the Northern Lights project has been included in the (EU’s) List of Projects of Common Interest.
Hydrogen Almost all hydrogen being used today in Norway is as feedstock in chemical industries and in refineries of petroleum-based products. In these applications, hydrogen is used as part of the end-product. Currently, the most relevant direct applications for hydrogen in Norway appear to be the maritime sector, heavy goods transport and industrial processes.
The main drivers for hydrogen development are emissions reductions and value creation, with an eye to leveraging Norway’s existing competitive advantages. On the current coalition government’s political platform, an important point for hydrogen is to develop a coherent value chain where production, distribution and use are developed in parallel as there is still a need for technology development across the entire value chain.
In June 2020, the former government published the Norwegian government’s Hydrogen Strategy. The strategy highlights parts of the heavy manufacturing and transport sectors, including shipping and heavy goods transport, as the sectors most suitable for hydrogen. These are sectors in which there are currently few emissions reduction alternatives, and in which replacing fossil energy sources with renewables, batteries or bioenergy solutions will be challenging (Norway, Ministry of Petroleum and Energy and Ministry of Climate and Environment, 2020).
The government offers several R&D-related support measures for green and blue hydrogen development. The RCN, Innovation Norway and Enova contribute to developing
IEA.
All
right
s re
serv
ed.
3. ENERGY AND CLIMATE CHANGE
48
and demonstrating energy-efficient and cost-efficient methods and value chains for the production, transport, storage and use of clean hydrogen, including through joint calls for proposals in the PILOT-E scheme (see Chapter 6; Norway, Ministry of Petroleum and Energy and Ministry of Climate and Environment, 2020).
In transport, hydrogen vehicles get the same tax breaks and user benefits as battery electric vehicles. Moreover, the Zero Emissions Fund was introduced to accelerate the introduction and growth of zero emissions solutions in the commercial vehicle and vessel market. Through Enova, the government also supports the build-out of early-phase fuelling infrastructure for shipping (Norway, Ministry of Petroleum and Energy and Ministry of Climate and Environment, 2020).
The government also plans to continue work on developing regulations and standards for the use of hydrogen-based systems in new applications.
Following up on the Hydrogen Strategy, in June 2021, under the white paper Putting Energy to Work, the former government also launched a hydrogen road map. The road map outlines a plan for the establishment of a robust domestic market for the production and consumption of hydrogen in Norway by 2050. By 2050, the road map expects that hydrogen will be used as a chemical feedstock in industry where economically feasible, as fuel in shipping both in coastal waters and for longer distances, in heavy-duty road transport, and exported to create economic value domestically.
In the short term, by 2025, the hydrogen roadmap outlines plans for the establishment of five hydrogen hubs for maritime transport, one or two industrial projects with associated hydrogen production units, and five to ten pilot projects for the development and demonstration of new and cost-efficient hydrogen technologies.
In the medium term, by 2030, the road map plans for the creation of hydrogen clusters that are geographically spread and demand-driven to align with access to vessels and vehicles; projects in the industry that can be tied to a market for hydrogen in Europe and the rest of the world; hydrogen solutions as a competitive alternative to fossil fuels; and companies that are tied to the development of a market for hydrogen in Europe through exports.
Policy instruments to achieve growth in hydrogen include support for R&D efforts, including pilot and demonstration projects (notably in maritime and industry), taxes and regulations (including the increasing CO2 tax), requirements in public procurement, as well as supporting investments in infrastructure. The government will support hydrogen R&D through the RCN, Enova, Gassnova and Innovasjon Norge. Two new research centres dedicated to hydrogen and ammonia have also been established, led by SINTEF and NORCE (RCN, 2022).
Norway participates in a number of international organisations seeking to speed up the commercial breakthrough of hydrogen through the harmonisation of standards and regulations, as well as information-sharing on value chains, research partnerships and safety. These include: the Clean Energy Ministerial, Mission Innovation, the IEA Hydrogen Technology Collaboration Programme, the Carbon Leadership Forum, the European Clean Hydrogen Alliance, the European Strategic Energy Technology Plan and Horizon Europe, among others.
In April 2022, the government presented a supplementary white paper to the previous government’s white paper on energy policy and long-term value creation from Norwegian
IEA.
All
right
s re
serv
ed.
3. ENERGY AND CLIMATE CHANGE
49
ENER
GY
SYST
EM T
RAN
SFO
RM
ATIO
N energy resources. The supplementary white paper presents an updated policy on the
development of hydrogen. In this supplementary paper, the government states that it will contribute to emissions reductions in Norway with an ambition to produce hydrogen with zero or low emissions in line with national demand. The government also states that it will contribute to the development of a market for hydrogen in Europe. This includes participation in relevant international fora and initiatives, international research co-operation and bilateral co-operation with relevant countries, the development of regulation for hydrogen in Europe and in EEA countries, as well as the creation of a national market for hydrogen.
The government will also enable economically viable production of blue hydrogen. The contribution will include Gassco’s architecture function and the provision of areas for CO2 storage to stakeholders with storage needs.
Climate adaptation and resilience The Norwegian Centre for Climate Services published the Climate in Norway 2100 report in 2015. It provides a scientific basis for climate change adaptation in Norway. Several climate-related changes will affect the Norwegian energy system. Increased rainfall during spring combined with early snowmelt caused by temperature rise will increase seasonal river flow changes and widen the gap between winter and summer runoff. Overall runoff of Norway’s mainland is expected to increase by the end of the century, which is likely to have a positive effect on the country’s hydropower generation, but investments in reservoir capacity and power infrastructure may be required to fully capture the anticipated benefits. Temperature increases, leading to milder winters, will likely reduce energy demand for heating, especially in the southern part of the country. However, temperature increases and reduced runoff in summer might also lead to more intensive droughts in this period of the year. Further, strong winds combined with the sea level rise may increase the height and frequency of storm surges in Norway in the future. Storms and snowfalls have been the most common reason for electricity supply interruption in recent years.
In 2013, Norway adopted its first white paper Climate change adaptation in Norway that covered the energy sector’s adaptation and resilience, including sections that described existing and potential measures to enhance climate resilience of power supply (IEA, 2022b). Building on this, the NVE adopted the Strategy for Climate Change Adaptation 2015-2019, which emphasises that climate change adaptation must be integrated into the NVE’s different areas of work, such as licencing for hydropower installation and operation, and further encourages the acquisition of the best possible knowledge on climate change’s impacts on energy supply and demand (IEA, 2022b).
Although Norway’s energy policies recognise climate impacts on the energy sector, they focus on energy security and mitigation. Though some of the proposed measures (such as enhancing power system flexibility) could raise the energy sector’s climate resilience, most actions only target energy supply security, efficiency and renewable energy production.
Norway’s municipalities, which have overall responsibility for social development, planning and provision of services, have a major role to play with respect to climate adaptation. To this end, there are central government planning guidelines in place for climate and energy planning and climate change adaptation to ensure that municipalities use a wide range of
IEA.
All
right
s re
serv
ed.
3. ENERGY AND CLIMATE CHANGE
50
their roles and instruments in adaptation work. The Norwegian Environment Agency has developed practical guidelines to implement the guidelines.
Assessment Norway’s total greenhouse gas emissions have been relatively stable over the past two decades and have exceeded emissions in the base year (1990) of 51.5 Mt CO2-eq for most of this period. In 2019, Norway’s total GHG emissions stood at 50.3 Mt CO2-eq, a 2% decrease since 1990. Carbon removals from the LULUCF sector accounted for 18.6 Mt CO2-eq in 2019.
Norway’s 2020 target was to cut GHG emissions by 30% from 1990 levels, underpinned by domestic emissions reductions, participation in the EU Emissions Trading System as well as international offset mechanisms. Despite emissions reductions evoked by the pandemic, Norway missed its ambition to realise at least half of its emissions reductions domestically, relying to a large extent on the EU ETS and international offsets to achieve the target.
Norway is in the enviable position of having an almost fully decarbonised power sector. Having benefited from historically low electricity prices, Norway has also achieved substantial electrification of the buildings sector and almost half of industry, thereby also lowering emissions in these sectors. As a result, many of the easy wins for reducing emissions have already been achieved and the remaining emissions reductions are more complex, challenging and costly. In this regard, Norway can be well-positioned to lead the world on new technologies for decarbonising hard-to-abate sectors, such as EVs, carbon capture and storage, and hydrogen, if the right policies and incentives are put in place.
Norway must further reconcile its twin identities of being a major oil and gas producer and a leader on climate change mitigation. The country is committed to maximising the value from its petroleum reserves, but should place a greater emphasis on plans for how this might change as the world decarbonises over the next 30 years.
With its excellent starting point and considerable wealth, Norway has the potential to lead the way in how to reach net zero-equivalent emissions. The government should take the opportunity as the country recovers from the pandemic to advance a vision for Norway’s low-carbon future that seizes the economic opportunities, manages risks and demonstrates global leadership.
Through its enhanced nationally determined contribution under the Paris Agreement, Norway has committed to reduce GHG emissions by at least 50% and towards 55% by 2030 compared to 1990 levels. Its NDC is economy-wide, covering all sectors and GHGs.
Norway intends to fulfil its 2030 NDC commitment in co-operation with the EU. Provisions in the NDC also allow for international flexibility mechanisms to be used to fulfil this target.
In June 2017, the Norwegian parliament adopted the Climate Change Act, which establishes by law Norway’s target of becoming a low emissions society by 2050. The target is equivalent to reducing economy-wide emissions by 90-95% from 1990. It remains to be decided how the detailed accounting of the LULUCF sector will be taken into account when assessing progress toward the target. However, the full LULUCF sink will not be
IEA.
All
right
s re
serv
ed.
3. ENERGY AND CLIMATE CHANGE
51
ENER
GY
SYST
EM T
RAN
SFO
RM
ATIO
N counted in full, as inclusion would lead to a negative emissions target, to ensure the same
level of ambition as the current target.
In 2021, Norway published its Climate Action Plan, which sets out the former government’s strategy for achieving 2030 emissions targets, notably for non-ETS sectors, which include transport (excluding domestic air), agriculture, buildings, waste and parts of industry. Specific sectoral targets have been set for the transport and agriculture sectors, but dedicated plans for how these targets will be achieved and how they will in detail add up to the overall 2030 target is not clear.
The polluter-pays principle is a cornerstone of the Norwegian policy framework on climate change. Approximately 85% of domestic GHG emissions are either covered by the ETS or subject to a CO2 tax (or other GHG taxes), or both. In 2022, the CO2 price is around 766 NOK/t CO2-eq (76 EUR/t CO2-eq) for emissions outside the EU ETS. The former government announced in a 2021 white paper that the CO2 tax will gradually increase to 2 000 NOK/t CO2-eq (200 EUR/t CO2-eq) in 2030.
The CO2 pricing levels are robust from an international perspective and can drive meaningful emissions reductions in relevant sectors. Moreover, the recently proposed changes allow for a more even pricing level across economic sectors. However, even a carbon price of NOK 2 000 is unlikely to lower domestic emissions to the level needed to meet Norway’s climate targets. Making use of flexibility mechanisms would be one option to consider, notably if carbon prices in other countries lag behind this level. To reduce emissions as much as possible domestically, the government would benefit from more detailed projections of the levels of carbon prices needed to motivate technological shifts to cut emissions, and consider supplementary incentives and support for sectors that may need them.
Moreover, bottom-up modelling of emissions reduction pathways for various sectors, including the role that carbon prices and technology will play in achieving them, would help clarify how each sector can decarbonise and what investments are needed to get there.
The electricity sector in Norway is almost completely decarbonised, relying extensively on hydropower and a small share of onshore wind. However, going forward, electricity demand is expected to increase as more of industry and transport turn to electrification to reduce reliance on fossil fuels and meet Norway’s climate targets. New industries such as green hydrogen, data centres or battery gigafactories, as well as the decarbonisation of existing process industry, could further increase electricity demand. Therefore, given a heavy dependence on electrification as a decarbonisation strategy across sectors, Norway should holistically assess projected future demand for electricity to ensure sufficient and affordable generation and transmission capacity, along the lines of the mandate of the recently established Energy Commission.
While Norway has enjoyed a great pace of electrification in many sectors of the economy and is looking to expand this further, it should be mindful of the increased demand for critical minerals it entails. In this regard, Norway is exploring possibilities to start indigenous production of critical minerals, including from the seabed, to alleviate expected supply pressures globally.
Emissions from oil and gas production in Norway were 12.6 Mt CO2-eq in 2019, amounting to 25% of total GHG emissions. As the largest contributor to energy sector emissions, Norway’s oil and gas sector will have a crucial role to play in meeting the country’s climate
IEA.
All
right
s re
serv
ed.
3. ENERGY AND CLIMATE CHANGE
52
targets. The government has regulations in place to address emissions in the sector. Direct emissions of methane (venting and fugitive emissions) have long been regulated and flaring is only permitted when necessary for safety reasons. Norway is also part of the Global Methane Pledge of over 100 countries announced at COP26 to reduce global methane emissions by at least 30% from 2020 levels by 2030.
The CO2 tax on the petroleum sector on the continental shelf was introduced in 1991. Most of these emissions are also covered by the EU ETS, so oil companies face a total carbon price close to 1 600 NOK/t CO2 (160 EUR/t CO2) in 2022.
As a result of these policies, emissions from the sector have been steadily declining since 2015. Overall, Norway has among the lowest emissions intensity of oil production in the world, estimated by the government at around 8 kg CO2-eq per barrel of oil.
The government has a target for the sector to halve emissions by 2030 relative to 2005 levels and to reach net zero emissions by 2050. An assessment by the MPE and the industry expects to achieve those reductions only by around 2035. This is mainly expected to be driven by the rising carbon price. Electrification of oil and gas platforms will play a key role in achieving this target. New upstream projects are required to consider electrification in their planning process. But retrofitting existing platforms will depend on costs, remaining project lifetime and onshore infrastructure. The government should consider options beyond carbon pricing to incentivise electrification of new and existing platforms to speed up the decarbonisation of this sector.
Emissions from the transport sector in Norway account for 34% of total GHG emissions, the largest contributor to emissions that fall outside of the EU ETS and hence crucial to achieving Norway’s domestic climate goals. Norway has an ambition to halve emissions from transport by 2030 relative to 2005 levels. Achieving this goal will require targeted efforts that focus on policies that deliver measurable emissions reductions.
ZEVs are heavily subsidised in Norway. Support includes zero VAT; exemption from a one-off registration tax; as well as reduced toll road charges, ferry and parking fees. The tax expenditure of the EV incentives were NOK 18.7 billion (EUR 1.9 billion) in 2021. As a result, over 85% of new car sales were fully battery or plug-in hybrid electric vehicles in 2021, and they make up around 25% of the total car fleet. However, the overall impact on emissions reductions is uncertain, as it is unclear to what extent EVs are substituting conventional internal combustion engine vehicles. Drivkraft Norge estimates that EVs reduced emissions of CO2-eq by around 5% in 2020.
Government support for EVs must be coupled with investment in charging infrastructure and grid design. In particular, a more substantial network of fast-charging facilities will be necessary to achieve a shift away from internal combustion engine vehicles for longer passenger journeys and freight. Norway also has ambitious plans to expand the role of electricity in other transport segments, including maritime, rail and short-haul aviation.
Though EVs receive more popular attention, Norway has partly achieved its notable emissions reductions in transport (15% reduction in CO2 emissions over 2009-2019) by substituting fossil fuels with biofuels, through an ambitious biofuels policy. An expansion of biofuels policy and support for advanced biofuels can notably complement electrification in non-road transport in particular.
IEA.
All
right
s re
serv
ed.

3. ENERGY AND CLIMATE CHANGE
53
ENER
GY
SYST
EM T
RAN
SFO
RM
ATIO
N Carbon capture and storage is a priority for Norway’s climate action, and is identified as
an important measure in Norway's NDC. The government’s ambition is to develop a robust value chain for CCS, and has a goal to realise at least two full-scale capture facilities and one storage facility in the North Sea. The carbon tax introduced in 1991 is one of the key drivers of CCS.
Norway is undoubtedly a leading country for CCS deployment, with projects in place since the 1990s and continuous technology development since then. Norway is now making a big step forward with the Longship project that encompasses capture; collection from different sources; transport by truck, ship and pipeline; and storage in a depleted field. Although it comes with a large subsidy from the government (EUR 1.65 billion out of a total project cost for Phase 1 of EUR 2.5 billion), the project will be important for proof-of-concept for CCS technology in Europe as well as the development of a full CCS chain. The novel approach, where the state has taken a role as intermediary and market maker between capture and storage operators, can bear results. The project can also achieve sizeable economies of scale if it can be successfully expanded on a commercial basis in the longer run. CCS technology will have an important role to play in Norway for industrial sectors like cement production, waste incineration, and oil and gas production, as well as for bringing new business opportunities to the county. It can also provide invaluable technological expertise to help bring down costs and facilitate wider deployment globally.
The former government published its Hydrogen Strategy in June 2020, followed by a white paper in 2021 that assessed the entire energy sector and included a road map for hydrogen. The current government plans to further update the white paper, which is again expected to include a focus on hydrogen. An important point in the government’s vision is to develop a coherent value chain where production, distribution and use are developed in parallel. Toward this end, in addition to Enova funding for demonstration projects and carbon pricing, the government offers several R&D-related support measures for green and blue hydrogen development. Norway also participates in a number of international organisations seeking to speed up commercial breakthrough of hydrogen through the harmonisation of standards and regulations, as well as information-sharing on value chains, research partnerships and safety.
Overall, Norway is well-positioned for the development of a hydrogen industry, with suppliers covering the full value chain and significant potential for offshore wind to power the electrolysers needed. The road map for hydrogen appears clear and well-considered, with benchmarks for progress in 2025, 2030 and 2050. The focus of the plan is to create hydrogen development hubs based on existing industry and infrastructure. Building on this work, the government should also consider establishing specific production goals for hydrogen that can provide stronger investment signals. The government should also promptly clarify the role that green hydrogen will play in the economy and the level of renewables generation (including offshore wind) that will be needed for its production to provide clarity for the development of both sectors in a complementary way.
On adaptation and resilience, the climate impacts on the energy sector are well recognised in several assessments and climate policies at the national level. Nonetheless, measures to enhance the energy sector’s climate resilience proposed in the “White paper on climate change adaptation” or the Strategy for Climate Change Adaptation are not consistently integrated into energy policies, which are more focused on mitigation. The monitoring, reporting and evaluation mechanism should also be strengthened by introducing indicators to measure the adaptation target.
IEA.
All
right
s re
serv
ed.

3. ENERGY AND CLIMATE CHANGE
54
Recommendations The government of Norway should:
Clarify certain elements of its 2050 target, including how land use, land-use change and forestry is included and whether quantified limits and/or environmental stringency criteria will be applied to the use of international flexibility mechanisms.
Set out detailed pathways for how sectors will decarbonise, both to 2030 and to 2050, based on bottom-up technology modelling to understand deployment pathways, cost trajectories and infrastructure needed under different scenarios.
Building off successful projects, develop an ambitious road map for carbon capture and storage that clarifies its role across sectors in meeting Norway’s climate change targets.
Study possibilities for indigenous production of critical minerals needed for clean energy technologies to alleviate expected global supply-side pressures and add to technology breakthroughs.
IEA.
All
right
s re
serv
ed.

3. ENERGY AND CLIMATE CHANGE
55
ENER
GY
SYST
EM T
RAN
SFO
RM
ATIO
N References
EC (European Commission) (2021), Effort sharing 2021-2030: Targets and flexibilities (web page), https://ec.europa.eu/clima/eu-action/effort-sharing-member-states-emission-targets/effort-sharing-2021-2030-targets-and-flexibilities_en
EC (2019), The European Union, Iceland and Norway agree to deepen their cooperation in climate action (web page), https://ec.europa.eu/clima/news-your-voice/news/european-union-iceland-and-norway-agree-deepen-their-cooperation-climate-action-2019-10-25_en
Norway, Ministry of Petroleum and Energy, (2022), Two licenses under the carbon storage regulations awarded on the NCS (press release), https://www.regjeringen.no/en/aktuelt/two-licenses-under-the-carbon-storage-regulations-awarded-on-the-ncs/id2907318/#:~:text=Two%20licenses%20under%20the%20carbon%20storage%20regulations%20awarded%20on%20the%20NCS,-Press%20release%20%7C%20Date&text=Today%2C%20the%20Norwegian%20Ministry%20of,one%20in%20the%20Barents%20Sea.
Norway, Ministry of Transport (2021), National Transport Plan 2022-2023, https://www.regjeringen.no/contentassets/117831ad96524b9b9eaadf72d88d3704/en-gb/pdfs/stm202020210020000engpdfs.pdf
Norway, Ministry of Petroleum and Energy and Ministry of Climate and Environment (2020), The Norwegian Government’s Hydrogen Strategy, https://www.regjeringen.no/contentassets/8ffd54808d7e42e8bce81340b13b6b7d/hydrogenstrategien-engelsk.pdf
IEA (International Energy Agency) (2022a), Greenhouse Gas Emissions from Energy (database), https://www.iea.org/data-and-statistics/data-product/greenhouse-gas-emissions-from-energy (accessed on 15 February 2022)
IEA (2022b), Norway climate resilience policy indicator (web page), https://iea.org/articles/norway-climate-resilience-policy-indicator
Longship (2021), Longship – Norway’s largest climate project (web page), https://langskip.regjeringen.no/longship
Norwegian Petroleum (2021), Emissions to air (web page), https://norskpetroleum.no/en/environment-and-technology/emissions-to-air
Norwegian Petroleum Directorate (2022), Seabed minerals (web page), https://npd.no/en/facts/seabed-minerals
RCN (Research Council of Norway) (2022), Creates two new research centers on hydrogen (web page), https://forskningsradet.no/om-forskningsradet/pressekontakt/pressemeldinger/2022/oppretter-to-nye-forskningssentre-pa-hydrogen
UNFCCC (United Nations Framework Convention on Climate Change) (2022), Greenhouse Gas Inventory Data (database), https://di.unfccc.int/detailed_data_by_party (accessed on 23 February 2022)
UNFCCC (2020), Update of Norway’s Nationally Determined Contribution, https://www4.unfccc.int/sites/ndcstaging/PublishedDocuments/Norway%20First/Norway_updatedNDC_2020%20(Updated%20submission).pdf
UNFCCC (2015), Norway’s Intended Nationally Determined Contribution, https://www4.unfccc.int/sites/ndcstaging/PublishedDocuments/Norway%20First/NorwayINDC%20(Archived).pdf
IEA.
All
right
s re
serv
ed.
57
ENER
GY
SYST
EM T
RAN
SFO
RM
ATIO
N
4. Energy efficiency
Key data (2020) TFC:1 20.5 Mtoe (electricity 47.5%, oil 36.1%, bioenergy and waste 6.8%, natural gas 4.3%, coal 2.1%, heat 2.3%), -0.5% from 2000 to 2019, -3.2% from 2019 to 2020
TFC by sector: industry 45.7%, buildings 32.5%, transport 21.8%
TFC per capita: 3.82 toe/capita (IEA average* 2.9 toe/capita), -12.5% since 2010
TFC per GDP** 62.6 toe/USD million (IEA average* 65 toe/USD million), -15.5% since 2010
* Weighted average among the 30 IEA member countries in 2019.
** GDP in USD 2015 prices and PPPs (purchasing power parities).
Overview In Norway, economic growth has been decoupling from energy consumption. Between 2010 and 2019, Norwegian GDP grew by 15%, while TFC fell by 0.5% (Figure 4.1). The decoupling is also evident in a reduction of energy intensity, both in terms of TFC per GDP (-16% from 2010 to 2020 and -5% from 2015 to 2020) and TFC per capita (-12% from 2010 to 2020). Electricity consumption per capita was stable between 2009 and 2019, as increased efficiency was offset by higher demand, especially in the residential sector. Between 2019 and 2020, the Covid-19 pandemic contributed to a 3% drop in TFC.
Norway’s main target for energy efficiency is to improve the overall energy intensity of the economy by 30% in 2030 compared to 2015.
TFC in Norway was 20.5 Mtoe in 2020, and has been relatively stable over the last decade, with a low in 2009 following the financial crisis and a peak in 2010 due to the recovery and exceptionally cold weather. Industry was the largest energy-consuming sector in 2020, followed by buildings and transport.
1 Total final consumption (TFC) is the final consumption of energy (electricity, heat and fuels, such as natural gas and oil products) by end users, not including the transformation sector (e.g. power generation and refining). TFC also includes non-energy use. Non-energy use refers to fuels used as raw materials, and not used as fuel or transformed into another fuel. This typically comprises raw materials used in the chemical and petrochemical sector.
IEA.
All
right
s re
serv
ed.
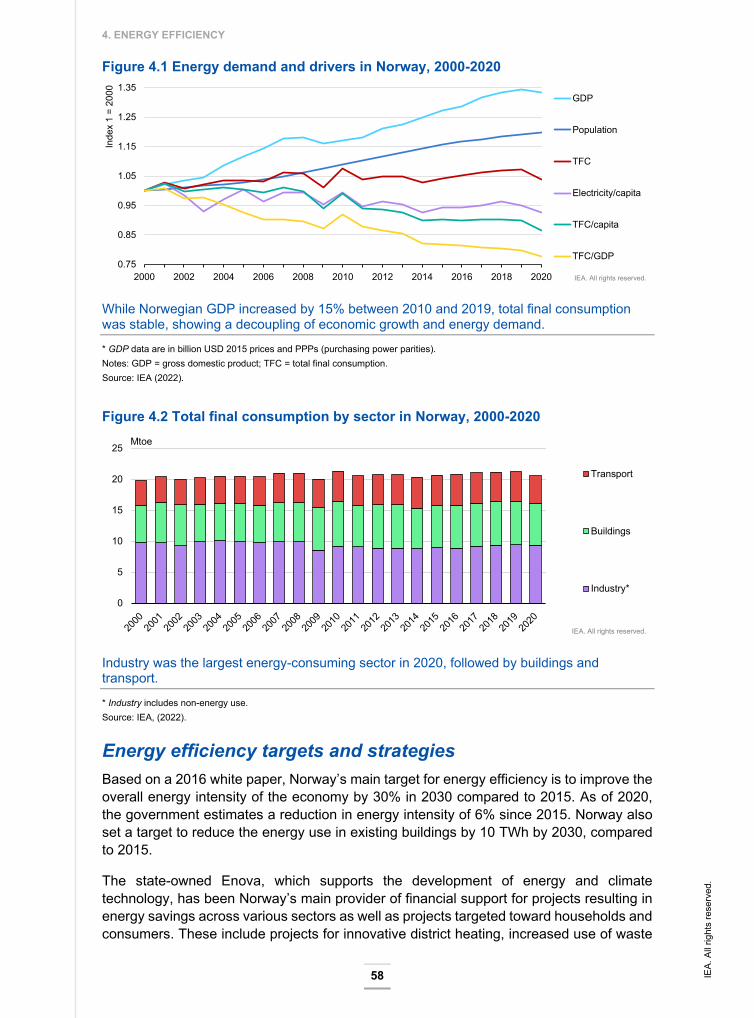
4. ENERGY EFFICIENCY
58
Figure 4.1 Energy demand and drivers in Norway, 2000-2020
While Norwegian GDP increased by 15% between 2010 and 2019, total final consumption was stable, showing a decoupling of economic growth and energy demand.
* GDP data are in billion USD 2015 prices and PPPs (purchasing power parities). Notes: GDP = gross domestic product; TFC = total final consumption. Source: IEA (2022).
Figure 4.2 Total final consumption by sector in Norway, 2000-2020
Industry was the largest energy-consuming sector in 2020, followed by buildings and transport.
* Industry includes non-energy use. Source: IEA, (2022).
Energy efficiency targets and strategies Based on a 2016 white paper, Norway’s main target for energy efficiency is to improve the overall energy intensity of the economy by 30% in 2030 compared to 2015. As of 2020, the government estimates a reduction in energy intensity of 6% since 2015. Norway also set a target to reduce the energy use in existing buildings by 10 TWh by 2030, compared to 2015.
The state-owned Enova, which supports the development of energy and climate technology, has been Norway’s main provider of financial support for projects resulting in energy savings across various sectors as well as projects targeted toward households and consumers. These include projects for innovative district heating, increased use of waste
0.75
0.85
0.95
1.05
1.15
1.25
1.35
2000 2002 2004 2006 2008 2010 2012 2014 2016 2018 2020
Inde
x 1
= 20
00 GDP
Population
TFC
Electricity/capita
TFC/capita
TFC/GDP
IEA. All rights reserved.
0
5
10
15
20
25Mtoe
Transport
Buildings
Industry*
IEA. All rights reserved.
IEA.
All
right
s re
serv
ed.
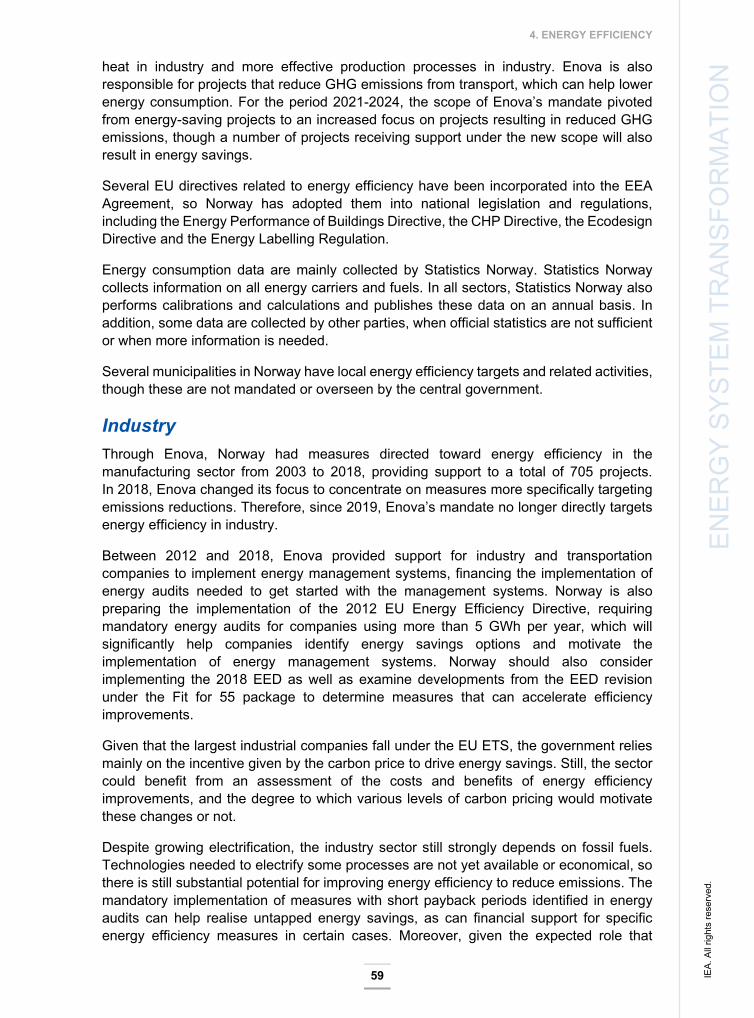
4. ENERGY EFFICIENCY
59
ENER
GY
SYST
EM T
RAN
SFO
RM
ATIO
N heat in industry and more effective production processes in industry. Enova is also
responsible for projects that reduce GHG emissions from transport, which can help lower energy consumption. For the period 2021-2024, the scope of Enova’s mandate pivoted from energy-saving projects to an increased focus on projects resulting in reduced GHG emissions, though a number of projects receiving support under the new scope will also result in energy savings.
Several EU directives related to energy efficiency have been incorporated into the EEA Agreement, so Norway has adopted them into national legislation and regulations, including the Energy Performance of Buildings Directive, the CHP Directive, the Ecodesign Directive and the Energy Labelling Regulation.
Energy consumption data are mainly collected by Statistics Norway. Statistics Norway collects information on all energy carriers and fuels. In all sectors, Statistics Norway also performs calibrations and calculations and publishes these data on an annual basis. In addition, some data are collected by other parties, when official statistics are not sufficient or when more information is needed.
Several municipalities in Norway have local energy efficiency targets and related activities, though these are not mandated or overseen by the central government.
Industry Through Enova, Norway had measures directed toward energy efficiency in the manufacturing sector from 2003 to 2018, providing support to a total of 705 projects. In 2018, Enova changed its focus to concentrate on measures more specifically targeting emissions reductions. Therefore, since 2019, Enova’s mandate no longer directly targets energy efficiency in industry.
Between 2012 and 2018, Enova provided support for industry and transportation companies to implement energy management systems, financing the implementation of energy audits needed to get started with the management systems. Norway is also preparing the implementation of the 2012 EU Energy Efficiency Directive, requiring mandatory energy audits for companies using more than 5 GWh per year, which will significantly help companies identify energy savings options and motivate the implementation of energy management systems. Norway should also consider implementing the 2018 EED as well as examine developments from the EED revision under the Fit for 55 package to determine measures that can accelerate efficiency improvements.
Given that the largest industrial companies fall under the EU ETS, the government relies mainly on the incentive given by the carbon price to drive energy savings. Still, the sector could benefit from an assessment of the costs and benefits of energy efficiency improvements, and the degree to which various levels of carbon pricing would motivate these changes or not.
Despite growing electrification, the industry sector still strongly depends on fossil fuels. Technologies needed to electrify some processes are not yet available or economical, so there is still substantial potential for improving energy efficiency to reduce emissions. The mandatory implementation of measures with short payback periods identified in energy audits can help realise untapped energy savings, as can financial support for specific energy efficiency measures in certain cases. Moreover, given the expected role that
IEA.
All
right
s re
serv
ed.

4. ENERGY EFFICIENCY
60
electricity will play in improving energy intensity and lowering emissions in the industry sector, a faster expansion and upgrading of the electricity grid would help support better outcomes.
Industry Industry is the sector with the highest TFC: in 2020, its share of energy consumption was 46%. Energy demand in industry in 2020 (9.4 Mtoe, including non-energy use) was only 2% higher than in 2010. In the same year, the main source of energy in the sector was electricity, accounting for almost half (45%) of consumption (Figure 4.3). However, the sector still strongly depends on fossil fuels, as oil, natural gas and coal satisfy 48% of energy demand.
The largest energy-consuming sector among Norwegian industries is the chemical and petrochemical sector (39%), as the country’s economy is strongly tied to oil and natural gas production and refining. Other sectors responsible for TFC are non-ferrous metals (20%), non-metallic minerals (9%), iron and steel (8%), construction (8%), paper (6%), food and tobacco (4%), and wood (3%).
The energy intensity of the industry sector fell between 1990 and 2014, partly due to a shift from energy-intensive industries to less intensive and more efficient ones. However, more recent data show an increase in energy intensity between 2014 and 2020, mainly due to increased production in energy-intensive industries and reduced production from less energy-intensive oil service industries.
Figure 4.3 Total final consumption in industry by source in Norway, 2000-2020
After a steady decline in industry energy intensity between 2004 and 2016, a growth trend took hold from 2016 onwards, mainly attributable to the metal and chemical sectors.
Note: Includes non-energy use in the chemical and petrochemical sector. Source: IEA (2022).
Policies and measures in the industry sector Due to its low energy costs from renewable energy sources, Norway has built up a strong base of energy-intensive industries, including the metals and chemicals industries. Looking ahead, the government expects continued growth in energy-intensive industries,
0 1 2 3 4 5 6 7 8 9
10 Mtoe
Heat
Electricity
Bioenergy and waste
Natural gas
Oil
Coal
IEA. All rights reserved.
IEA.
All
right
s re
serv
ed.
4. ENERGY EFFICIENCY
61
ENER
GY
SYST
EM T
RAN
SFO
RM
ATIO
N including additional metals facilities, battery factories, data storage and hydrogen
production. The government anticipates increased demand for renewables-based electricity and reduced use of fossil fuels to support industrial sector growth, which, along with improved energy efficiency, will reduce GHG emissions. For example, the new Hydro Aluminium Karmøy plant that started operations in 2018 is 15% more energy efficient compared to the world average and has the world’s lowest CO2 footprint, drawing its energy needs from hydropower. The government further expects decarbonisation of existing industry processes through electrification, as well as CCUS sites.
Norway’s largest energy-intensive industries fall under the EU ETS, where carbon price signals are expected to provide a strong motivation for achieving energy savings, given that an estimated 20-30% of input costs come from energy.
Through Enova, Norway had an ongoing energy efficiency support scheme targeting industry from 2003 to 2018, providing support to a total of 705 projects for energy efficiency and for replacing fossil fuels with renewable energy. The programme provided total financing of NOK 2.97 billion (EUR 291 million) and delivered 7.8 TWh (0.67 Mtoe) of cumulative energy saved or converted from fossil fuels to renewables. In 2018, Enova changed its focus to concentrate on innovative measures more specifically targeting emissions reductions and the shift to a low emissions society, so since 2019, Enova’s mandate no longer directly targets energy efficiency in industry. However, Enova still supports the use of waste energy through programmes targeting emissions reductions, and a number of the projects supported under the current scheme result in sizeable energy savings.
Between 2012 and 2018, Enova also provided support for industry and transportation enterprises to implement energy management systems, financing the implementation of energy audits needed to get started with the management systems. A total of 764 projects were supported with a total of NOK 360 million (EUR 35 million).
A total of 42 Norwegian enterprises covering 82 sites were certified with ISO 50001 as of 2020.
Funding for Enova comes from the Climate and Energy Fund (Norway, Ministry of Climate and Environment, 2015), which is part of the national budget; over a four-year period, the organisation has a clear picture of what its funding will be. Moreover, Enova has flexibility to apply funding from one year to another, and appears sufficiently well-funded to enact its mandate.
Enova also remains an important source of information on energy efficiency across all sectors. One example is the information platform promoting energy management targeting small and medium-sized enterprises that was introduced in 2020, Enova Kunnskap (https://www.enova.no/kunnskap).
The Forskningssenter for Miljøvennlig Energi (FME) HighEFF – the Centre for an Energy Efficient and Competitive Industry for the Future – is a collaboration project between national and international universities, research institutes, and industry partners, with public funding for the period 2017-2025. The industry partners represent Norway’s largest industry sectors including metals, oil and gas, chemicals, and food. Knowledge, technology and solutions developed within the FME HighEFF can be applied in real industrial applications to increase efficiency and reduce emissions. Some have already been advanced as spin-off projects in the industry, with co-funding from Enova.
IEA.
All
right
s re
serv
ed.

4. ENERGY EFFICIENCY
62
Norway is also preparing to implement the 2012 EU Energy Efficiency Directive (EED), requiring mandatory energy audits for companies using more than 5 GWh per year. The EU updated the EED in 2018 to include several new elements, including a headline energy efficiency target of 32.5% for 2030 (IEA, 2021). The EU is also preparing another update of the EED in line with the EU Fit for 55 package, though Norway has not yet committed to implementing these updates.
Buildings and district heating In 2020, the buildings sector accounted for 32.5% of TFC. This sector includes residential buildings (57% of buildings TFC in 2019) and service sector buildings (43%). Energy consumption in the sector has fluctuated over the last decade, depending on winter temperatures, as most energy demand from buildings is used for space heating (Figure 4.4).
The largest part of energy consumption in buildings is covered by electricity (81% in 2020), which plays an important role in both residential buildings (84% of residential buildings’ TFC) and in service sector buildings (76%) (Figure 4.4). The second-largest source of energy for buildings is bioenergy (8.6% in 2020), which is used mainly in the residential sector, where it covers 13% of TFC. While oil has been almost completely phased out from the residential sector, its use in service sector buildings has been slightly increasing in recent years and covered 10% of service sector TFC in 2020 (mostly in the defence sector). District heat supplied 6.2% of buildings’ TFC, mainly in the service sector. Energy demand in buildings increased by 7.3% between 2014 and 2019.
Figure 4.4 Total final consumption in the building sector by source in Norway, 2000-2020
Energy demand in buildings increased by 10% between 2014 and 2019. Buildings are highly electrified as electricity covers most energy consumption in the sector.
Source: IEA, (2022).
Policies and measures in the buildings sector Norway has a target to reduce the energy use in existing buildings by 10 TWh (0.86 Mtoe) by 2030, compared to 2015. The MPE is working on a plan to meet the target and to increase local electricity production in buildings. The plan will be presented in the state budget for 2023.
0
1
2
3
4
5
6
7
8Mtoe
District heat
Electricity
Natural gas
Bioenergy and waste
Oil
IEA. All rights reserved.
IEA.
All
right
s re
serv
ed.

4. ENERGY EFFICIENCY
63
ENER
GY
SYST
EM T
RAN
SFO
RM
ATIO
N In 2021, Norway’s building stock consisted of 4.2 million buildings, of which 66% were built
before 1990. The number of residential buildings was 1.6 million (2.6 million dwellings) in addition to 0.5 million cabins and other dwellings for part-time use. The total number of non-residential buildings is around 1.5 million, which includes buildings without heating.
The main energy efficiency measure in the buildings sector is the adoption of building codes. Norway’s building codes were last updated in 2017, to the passive house level, which are 20-25% stricter than previous energy efficiency requirements. The regulation requires that new buildings or buildings undergoing major renovation have either a total net energy need lower than specified in the regulation or meet a set of energy requirements for individual building components (windows, doors, roof, walls, etc.). The latter option applies only to residential buildings. Regardless of which option is chosen, all new buildings must meet minimum requirements for windows, roofs, floors, exterior walls and air tightness. The new energy requirements specify that larger buildings (more than 1 000 m2 of heated usable floor space) must have flexible heating solutions. The government is currently re-evaluating building codes; a public consultation on updated building codes was completed in September 2021, with a focus on circular principles for new buildings.
A ban on the installation of fossil fuel heating systems in new buildings came into force in 2017. As of 1 January 2020, a new regulation bans the use of mineral oil for heating buildings. The two measures are designed to promote a shift from fossil fuel heating to other heating technologies such as heat pumps, biofuels and direct electrical heating. Natural gas is still allowed in existing buildings, but is used only in a few places in Norway. New installations for natural gas heating are not permitted.
Since 2010, energy performance certificates are required when buildings and dwellings are built, leased or sold. The objective of the scheme is to provide basic information about the energy performance of buildings and possibilities for improvements. About 1.3 million certificates have been issued since 2010, covering about half of total buildings or dwellings with an obligation to be certified. The energy certification scheme is part of the follow-up to the EU Directive on Energy Performance in Buildings (Directive 2002/91/EC). Since 2016, responsibility for the energy performance certificate scheme has been transferred to Enova, to create synergies between certification and support schemes. A new version of the energy performance certificate scheme is under preparation.
Enova has managed several programmes on energy efficiency in buildings with a goal of market transformation. Enova has run a scheme targeting energy-saving projects for consumers and in households, with an annual budget of NOK 250 million (EUR 24.5 million) per year until 2020. For the period 2021-2024, the scope of the scheme has been changed to projects resulting in reduced emissions and the transition to a low emissions society. The annual budget was also increased to NOK 300 million (EUR 30 million).
Enova also runs a number of information and advisory activities targeting businesses, municipalities and households, including a free advisory service that provides guidance by telephone, chat or e-mail (Enova svarer). In addition, the National Office of Building Technology and Administration offers guidance on smart renovation of buildings. On its website, it offers in-depth advice on a number of measures, including the installation of heat pumps, retrofitting building envelopes, and changing to more energy-efficient doors and windows, among others.
IEA.
All
right
s re
serv
ed.
4. ENERGY EFFICIENCY
64
In response to the recent high energy prices, the government has provided NOK 100 million (EUR 10 million) to fund energy efficiency measures in “Municipal Social Homes” (public housing). The scheme, administered by Enova, will improve the energy performance of municipal homes, thereby lowering the electricity bills of low-income families, as well as contributing to the overall target to reduce energy use in the existing building stock.
Appliances, equipment, lighting The Ecodesign Directive 2009/125/EC was transposed into Norwegian legislation in 2011. Related regulations for different product groups are also implemented in Norway, with the exemption of ten product regulations, which are not yet incorporated into the EEA Agreement.
The Energy Labelling Regulation (EU) 2017/1369, replacing the former Energy Labelling Directive 2010/30/EU, was implemented into Norwegian legislation in 2020. It lays out a framework for mandatory energy labelling and introduces a common scale for all products, which only includes classes A-G. New delegated acts adopted under Regulation 2017/1396 are also implemented in Norwegian legislation (2021). In 2021, the NVE carried out an information campaign when the rescaled energy label for six product groups was introduced.
The NVE estimated annual energy savings of household appliances, equipment and lighting covered by ecodesign or energy labelling regulations to be 4.11 TWh (0.4 Mtoe) in 2020 and 10.18 TWh (0.9 Mtoe) in 2030.
The NVE is responsible for the market surveillance of ecodesign and energy labelling requirements. The non-compliant rate for energy labelling of products in stores was 42-45% for the period 2018-2019, while the non-compliant rate was lower for online retailers and advertisements. There are few available data on the non-compliant rate for products covered by the ecodesign regulations.
Norway participates in international co-operation, such as Nordsyn, which is a co-operation of national energy agencies in Nordic countries responsible for policy development and market surveillance of ecodesign and energy labelling.
Smart meters Smart metering, or the Advanced Metering and Management System, has been implemented in 98% of Norway’s metering points. This includes approximately 2.9 million customers, which covers up to 99.5% of national demand. There was no support scheme to deploy smart meters, but the NVE decided in 2011 that all customers must have smart meters by 2019.
The smart meters register electricity consumption every hour, and automatically send information about the consumption to the distribution system operation (DSO). The meters have two-way communication between the metering point and the DSO, through which the consumer can receive time-of-use information about consumption and prices. This information can be made available through a smartphone or an in-home display. DSOs are not obligated to provide time-of-use information services, but must enable other service providers to offer information services or demand-side response solutions to the customer.
IEA.
All
right
s re
serv
ed.
4. ENERGY EFFICIENCY
65
ENER
GY
SYST
EM T
RAN
SFO
RM
ATIO
N District heating
In 2019, 5.9 TWh (0.5 Mtoe) of district heating (DH) was delivered to customers, accounting for around 8% of energy use for heating in buildings. The sector has seen notable growth of 22% since the last IEA review in 2016. About half of DH was produced from waste and around 30% came from biofuels, while only 4.3% came from fossil gas and diesel. The majority (two-thirds) of DH production is used in service sector buildings. The government expects modest growth in DH in coming years.
There are currently 106 licence areas for DH in Norway. Many DH companies have several licences, so there are currently about 60 concessionaires. The NVE has given DH concessions for total installed capacity of 5 070 MW. Most Norwegian DH companies are owned by larger energy companies, which have both public and private ownership. Often, the same company owns both the heating plant and the main pipeline network. Municipalities have the authority to announce mandatory connection to DH infrastructure for customers in cases where the NVE has already granted a licence to a DH plant.
The government is studying how to improve the interaction between DH and electricity generation to maximise the use of existing infrastructure. In doing so, the government aims to improve interaction between the power system, the DH system and opportunities for consumer flexibility.
In addition, Enova provides support to companies that want to develop new DH infrastructure and contribute to increased innovation in the DH sector, through the District Heating Programme. A precondition for support is that projects use renewables-based fuel sources such as biofuels, waste and heat pumps. Support is also granted to co-generation projects that do not receive electricity certificates (see Chapter 5).
Transport In 2020, energy demand in the transport sector represented 22% of TFC (4.5 Mtoe). From 2010 to 2019, energy consumption in the sector slightly declined (-1%), despite a peak at 5 Mtoe in 2014 (Figure 4.5). Between 2019 and 2020, energy demand in transport dropped by 7%, due to the Covid-19 pandemic. Oil products cover 86% of transport energy demand, the second-lowest share among IEA member countries after Sweden. In 2020, diesel and gasoline accounted respectively for 65% and 15% of TFC in transport. Diesel is predominantly employed in road transport (which represents 71% of TFC for transport) and domestic navigation. The use of diesel peaked at 3.3 Mtoe in 2014 and is now falling (3.0 Mtoe in 2019 and 2.9 Mtoe in 2020).
Electricity, traditionally used mainly in rail transport, provides an increasing share of transport demand, as EVs are being used widely. In 2020, electricity provided 2.9% of road transport demand, the highest share among IEA member countries, and 3.2% of total transport demand. The share of biofuels in transport demand (9%) is the second-highest among IEA member countries after Sweden, and has almost trebled since 2010.
Norway has the highest share of EVs (including pure battery and plug-in hybrid) in both car fleet (22% in 2021) and car sales (85%) in the world. In 2021, about 151 900 EVs were sold in Norway, of which 113 700 were battery electric vehicles and 38 200 PHEVs; the total EV stock reached 585 654. Norway also had 9 726 electric vans, 453 electric buses, 25 electric trucks and 159 fuel cell cars on the road in 2020. Close to 4% of light
IEA.
All
right
s re
serv
ed.
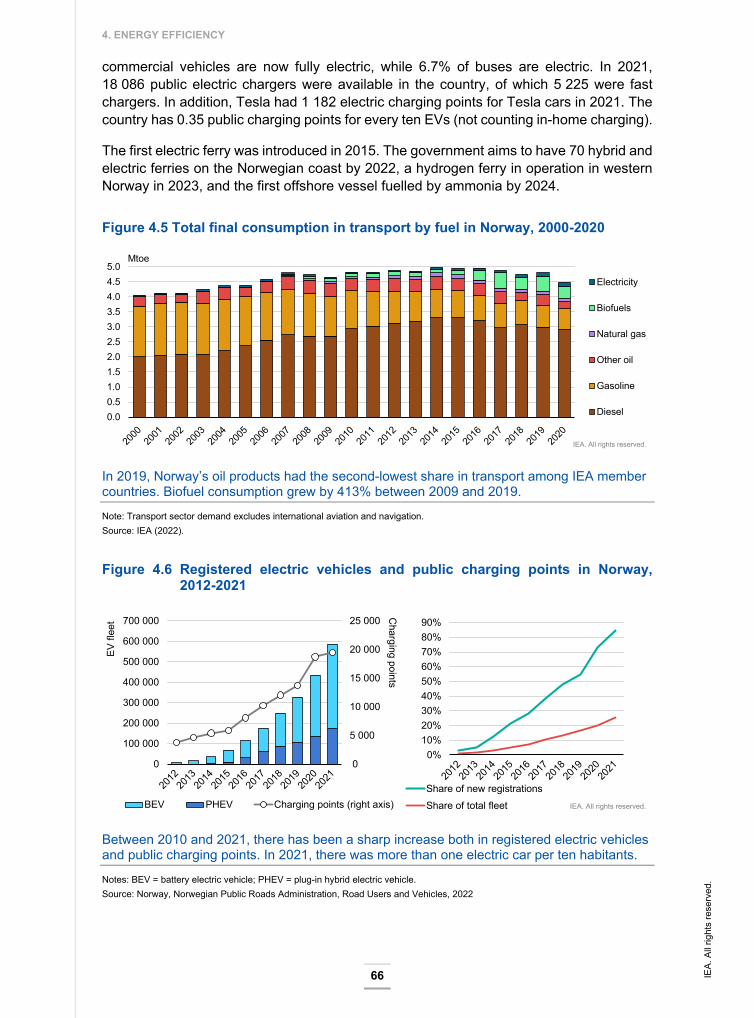
4. ENERGY EFFICIENCY
66
commercial vehicles are now fully electric, while 6.7% of buses are electric. In 2021, 18 086 public electric chargers were available in the country, of which 5 225 were fast chargers. In addition, Tesla had 1 182 electric charging points for Tesla cars in 2021. The country has 0.35 public charging points for every ten EVs (not counting in-home charging).
The first electric ferry was introduced in 2015. The government aims to have 70 hybrid and electric ferries on the Norwegian coast by 2022, a hydrogen ferry in operation in western Norway in 2023, and the first offshore vessel fuelled by ammonia by 2024.
Figure 4.5 Total final consumption in transport by fuel in Norway, 2000-2020
In 2019, Norway’s oil products had the second-lowest share in transport among IEA member countries. Biofuel consumption grew by 413% between 2009 and 2019.
Note: Transport sector demand excludes international aviation and navigation. Source: IEA (2022).
Figure 4.6 Registered electric vehicles and public charging points in Norway, 2012-2021
Between 2010 and 2021, there has been a sharp increase both in registered electric vehicles and public charging points. In 2021, there was more than one electric car per ten habitants.
Notes: BEV = battery electric vehicle; PHEV = plug-in hybrid electric vehicle. Source: Norway, Norwegian Public Roads Administration, Road Users and Vehicles, 2022
0.00.51.01.52.02.53.03.54.04.55.0
Mtoe
Electricity
Biofuels
Natural gas
Other oil
Gasoline
Diesel
IEA. All rights reserved.
0
5 000
10 000
15 000
20 000
25 000
0
100 000
200 000
300 000
400 000
500 000
600 000
700 000 Charging points
EV fl
eet
BEV PHEV Charging points (right axis) IEA. All rights reserved.
0%10%20%30%40%50%60%70%80%90%
Share of new registrationsShare of total fleet
IEA.
All
right
s re
serv
ed.
4. ENERGY EFFICIENCY
67
ENER
GY
SYST
EM T
RAN
SFO
RM
ATIO
N Policies and measures in the transport sector
Norwegian measures promoting a shift toward alternative fuels in transport are primarily implemented to reduce CO2 emissions. Nonetheless, a shift from fossil fuels to electricity in the transport sector also results in a considerable energy efficiency improvement, due to the high efficiency of electric motors compared to conventional combustion motors.
In 2012, the Norwegian parliament set a target for new passenger cars’ CO2 emissions to be lower than 85 g CO2/km in 2020. Norway reached the target in 2017, and in 2019 the average CO2 emissions for new passenger cars was 60 g CO2/km.
Norway’s well-known success with EVs is a result of incentives in place for ZEVs since the 1990s.
The Norwegian parliament has an ambition to achieve 100% zero-emission car sales in 2025. A precondition for these goals is that technological development makes zero emissions technology in transport competitive with fossil technology based on upfront costs. Based on the effect of the incentives currently in place, Norway expects to achieve its EV target through promoting a shift in consumer preferences toward EVs, without imposing an official ban on the sale of fossil fuel vehicles.
Additional government targets for road transport, contingent on cost competitiveness with internal combustion engines, include (Norway, Ministry of Transport, 2021):
All new city buses should be zero-emission or use biogas by 2025.
All new heavy vans, 75% of new long-distance buses and 50% of new trucks sold should be zero-emission by 2030.
The distribution of most goods in major city areas should be emissions-free by 2030.
Vehicle taxation is the main policy instrument for lowering emissions (and thus increasing efficiency) in the transport sector. Fossil fuel cars are subject to a registration tax and VAT on purchase. Furthermore, fossil fuel cars are subject to a CO2 tax and road use tax on gasoline and diesel. ZEVs benefit from exemptions from VAT (25%) and the registration tax (around EUR 10 000 on average). PHEVs benefit from a reduced registration tax, though this reduction is subject to stricter conditions since January 2022. The incentives amounted to NOK 18.7 billion (EUR 1.9 billion) in 2021. Exemption from the purchase tax and VAT, in particular, provide a large financial incentive for buying an EV; as a result of these incentives, the government estimates that a new Tesla has an equivalent purchase price as a new non-electric Audi or Mercedes (Norway, Ministry of Transport, 2021).
ZEVs also have special e-number plates. Moreover, the government introduced a rule that ZEVs should pay no more than half of what conventional vehicles pay for parking, boarding ferries and driving on toll roads. The rate up to the 50% level is decided by local authorities.
Enova also supports the uptake of EVs through investment support for fast-charging infrastructure and for zero emissions vehicles for commercial trials (i.e. vans, trucks). In 2020, Enova investment support to climate-friendly land and sea transport projects amounted to NOK 2 billion (EUR 0.2 billion).
Electric buses are also expected to see notable growth in Norway, as more cities adopt them. Oslo, the country’s largest municipality, aims at zero emissions public transport by 2028.
IEA.
All
right
s re
serv
ed.

4. ENERGY EFFICIENCY
68
Electromobility is also being promoted for other transport modes, including maritime (ferries, fishing boats, supply vessels), railways (around 80% of rail kilometres travelled annually are fuelled by overhead electricity lines) and aviation (where Enova can support the development of electric planes for short-haul flights).
Norway’s policy also focuses on avoiding the need for transport, and shifting it from private cars to more efficient public alternatives. To prevent car-based transport growth that contributes to GHG emissions as well as traffic and air and noise pollution, Norway has a goal of zero growth in passenger transport by car in large urban areas. The zero-growth target is underpinned by comprehensive, long-term urban planning agreements that include road, public transport, cycling, walking and land-use measures as well as restrictive measures for car traffic such as road tolls and parking restrictions. The purpose is to improve co-ordination between the state and local authorities responsible for various measures and instruments in urban areas. The solutions chosen are intended to reduce the need for car-based transport and facilitate more walking, bicycling and use of public transport. Through the agreements, state contributions include funds to finance large public transport projects.
Furthermore, Norway is taking steps to mitigate the environmental impact of public transport outside cities. For instance, new state-owned ferries are required to use low-carbon emissions technologies through procurement processes. In addition, Norway prioritises investments in the Norwegian rail network, which is a more energy-efficient alternative to road and air travel.
Assessment To date, Norway has made notable progress on decoupling economic growth from energy consumption. The energy intensity of the Norwegian economy (TFC per GDP) decreased by 13% between 2010 and 2019. While national GDP grew by 15% between 2010 and 2019, total final consumption was stable. Notably, Norway’s high degree of electrification of end uses, such as transport, has helped improve the overall energy intensity of the economy. Between 2019 and 2020, the Covid-19 pandemic contributed to a 3% drop of TFC, while GDP decreased by 0.8%.
Norway’s main target for efficient use of energy is to improve the overall energy intensity of the economy by 30% in 2030 compared to 2015. However, through 2020, the improvement from 2015 was only 5%, suggesting that additional measures are needed to meet the 2030 target.
Over the years Enova has provided financial support for energy efficiency projects across various sectors, as well as projects targeted toward households and consumers. Since 2021, Enova’s mandate now focuses on GHG reductions and technology development. The entity is well-funded with multi-year clarity on available funds and flexibility to apply it to projects.
Norway has an overall energy policy focused on reducing emissions, but should more concertedly consider the role that energy efficiency improvements can play in several sectors: the “energy efficiency first” principle. Moreover, energy efficiency can also free up electricity for other uses or for export. In particular, Norway would benefit from a national energy efficiency strategy that prioritises policies and measures based on
IEA.
All
right
s re
serv
ed.

4. ENERGY EFFICIENCY
69
ENER
GY
SYST
EM T
RAN
SFO
RM
ATIO
N cost-effectiveness. Such a strategy should also clearly define the contribution from
different end-use sectors to reach the overall energy intensity target.
With many short-term options, energy efficiency can notably play an important role in reaching Norway’s 2030 emissions reduction target. Timely and complete implementation of the EU Energy Efficiency Directive into Norwegian law would help in this regard.
Collection of data on end-use energy consumption in the buildings, industry and transport sectors is key to support policy making as well as to inform, monitor and achieve energy efficiency improvements effectively. The government of Norway should increase efforts in collecting end-use energy data and developing efficiency indicators. It can use the information to understand the main drivers of energy consumption, identify sectors with potential energy savings and tackle these with specific policy action.
Several municipalities have local energy efficiency targets and related activities, administered independently of the central government. Improved co-ordination between authorities on overall monitoring and results would help achieve more successful outcomes.
Buildings and district heating Norway has a target to reduce energy use in existing buildings by 10 TWh (0.86 Mtoe) by 2030 compared to 2015. Based on calculations by the Norwegian Water Resources and Energy Directorate, the MPE’s assessment is that Norway is on track to reach the target with current policies.
The main energy efficiency measure in the buildings sector is the adoption of building codes. The building codes were last updated in 2017 to the passive house level, which is around 20-25% stricter than previous energy efficiency requirements. A public consultation for the next update of the building codes was concluded in September 2021, with a focus on sustainable building materials and circular principles.
Since 2017, heating systems using fossil fuels can no longer be installed, and since 2020 the use of heating oil is banned. The use of natural gas is still allowed in existing boilers, but it is not widespread, and most buildings have electrical heating systems.
Though Norway’s codes for new buildings will achieve beneficial energy efficiency outcomes, a stronger push for buildings renovations could yield greater results in the country, where two-thirds of the building stock consists of older structures (built before 1990). An ambitious national target for buildings renovations along with supporting policy measures, as well as the full implementation of the EU Energy Performance of Buildings Directive, would help toward this end.
Beyond this, there are still more energy savings that Norway could achieve in its buildings sector through demand response. The 2019 move toward installing smart meters in all households will help consumers shift behaviour and conserve energy based on pricing data. Additional incentives can come from a regulatory framework for demand-side management at the household level, including exploration of a tariff structure that allows people to use their electric vehicles to support grid flexibility. Moreover, further research on behavioural change to improve the energy efficiency of households can also help drive more effective future policies and regulations.
IEA.
All
right
s re
serv
ed.

4. ENERGY EFFICIENCY
70
In previous years, Enova had programmes specifically targeting energy savings projects for households. For 2021-2024, the scope has shifted from energy savings to projects resulting in reduced GHG emissions. However, some energy efficiency measures should also be considered in their own right if they can provide cost-effective ways to reduce emissions.
The estimated energy savings in buildings in 2020 were 4.11 TWh, resulting from the implementation of the EU ecodesign and energy labelling requirements adopted by Norway under the EEA Agreement. Projected annual savings in 2030 are estimated to be 10.18 TWh. However, not all EU product regulations have been incorporated into the EEA Agreement. Norway should consider updating its legislation to cover more products, as it would contribute to further energy savings.
The government is studying how to improve the interaction between district heat and electricity generation to maximise the use of existing infrastructure, a move the IEA supports. In addition, Enova provides support to companies who want to develop new DH infrastructure and contribute to increased innovation in the DH sector, through the District Heating Programme. Support is granted for projects based on renewable energy sources and for co-generation that does not receive electricity certificates.
Transport In 2012, the Norwegian parliament set a target for new passenger cars’ CO2 emissions to be lower than 85 g CO2/km in 2020. This target was reached in 2017, and the average CO2 emissions for new passenger cars was 60 g CO2/km in 2019. The Norwegian government has an ambition to achieve 100% zero emissions car sales in 2025. Based on the effects of the incentives currently in place, Norway expects to achieve its EV target by promoting a shift in consumer preferences toward EVs, without imposing an official ban on the sale of fossil fuel vehicles.
Vehicle taxation is a key policy instrument for lowering emissions (and thus increasing efficiency) in the transport sector. Fossil fuel cars are subject to a registration tax and VAT on purchase. Fossil fuel cars are also subject to a CO2 tax and road use tax on gasoline and diesel. ZEVs benefit from VAT (25%) and registration tax exemptions. ZEVs also have special e-number plates. The government introduced a rule that ZEVs should pay no more than half of what conventional vehicles pay for parking, boarding ferries and driving on toll roads.
Norway's policy also focuses on reducing transport demand and shifting it from private cars to more efficient public alternatives. The government set a target of zero growth in passenger transport by car in large urban areas. Long-term urban growth development plans include improving public transport, bicycle and walking alternatives, and restrictive measures for car traffic such as road tolls and parking restrictions. Under agreements between the government and local communities, funds are granted to finance public transport projects.
While Norway’s growth in EV sales is unquestionably impressive, the government should ensure that the measures, which are costly for the public budget, are achieving true displacement of internal combustion engines and driving sustainable, cost-effective reductions in road transport energy consumption and emissions reductions. Moreover, generous incentives for EVs in Norway appear to be prompting people to shift from walking
IEA.
All
right
s re
serv
ed.
4. ENERGY EFFICIENCY
71
ENER
GY
SYST
EM T
RAN
SFO
RM
ATIO
N or bicycling to driving cars. The federal government should support local programmes to
encourage modal shifts and ensure that EV policy does not undermine these efforts.
Increasing the benefits of electrification in transport will require expanding its penetration to the heavy-duty and maritime segments. Norway is off to a good start with electric trucks, buses and ferries already on the roads and in waters. Given the high number of EVs and the continuous foreseen growth in all transport segments, particular attention should be given to the availability of public chargers in the country, especially fast chargers, considering the long travelling distances in Norway. Enova provides investment support for public charging infrastructure.
Recommendations The government of Norway should:
Develop a national energy efficiency strategy that prioritises policies and measures based on cost-effectiveness and defines the contribution from different end-use sectors to reach the overall energy intensity target.
Ensure that the focus of support schemes on emissions reductions does not limit implementation of energy efficiency measures, where these measures present cost-effective ways to reduce emissions in hard-to-electrify end uses.
Impose a requirement for companies to implement measures with short payback periods (five years or less) identified in energy audits.
Speed up domestic implementation of the EU Energy Efficiency and Energy Performance of Buildings Directives and regulations to provide clearer investment signals that spur more rapid energy efficiency improvements.
Ensure steady expansion of fast-charging infrastructure to support continued growth of all categories of electric vehicles throughout the country.
IEA.
All
right
s re
serv
ed.
4. ENERGY EFFICIENCY
72
References Norway, Ministry of Transport (2021), Norway is electric (web page), https://www.regjeringen.no/en/topics/transport-and-communications/veg/faktaartikler-vei-og-ts/norway-is-electric/id2677481/
Norway, Ministry of Climate and Environment (2015), ENOVA (web page), https://www.regjeringen.no/en/dep/kld/organisation/Subordinate-agencies/enova/id2599611/#:~:text=Enova's%20work%20is%20funded%20by,Renewable%20Energy%20and%20Energy%20Transition%E2%80%9D
IEA (International Energy Agency) (2022), World Energy Balances (database), https://iea.org/data-and-statistics/data-product/world-energy-balances (accessed on 18 February 2022)
IEA (2021), EU Directive 2018/2002 on Energy Efficiency (web page), https://iea.org/policies/13353-eu-directive-20182002-on-energy-efficiency
IEA.
All
right
s re
serv
ed.
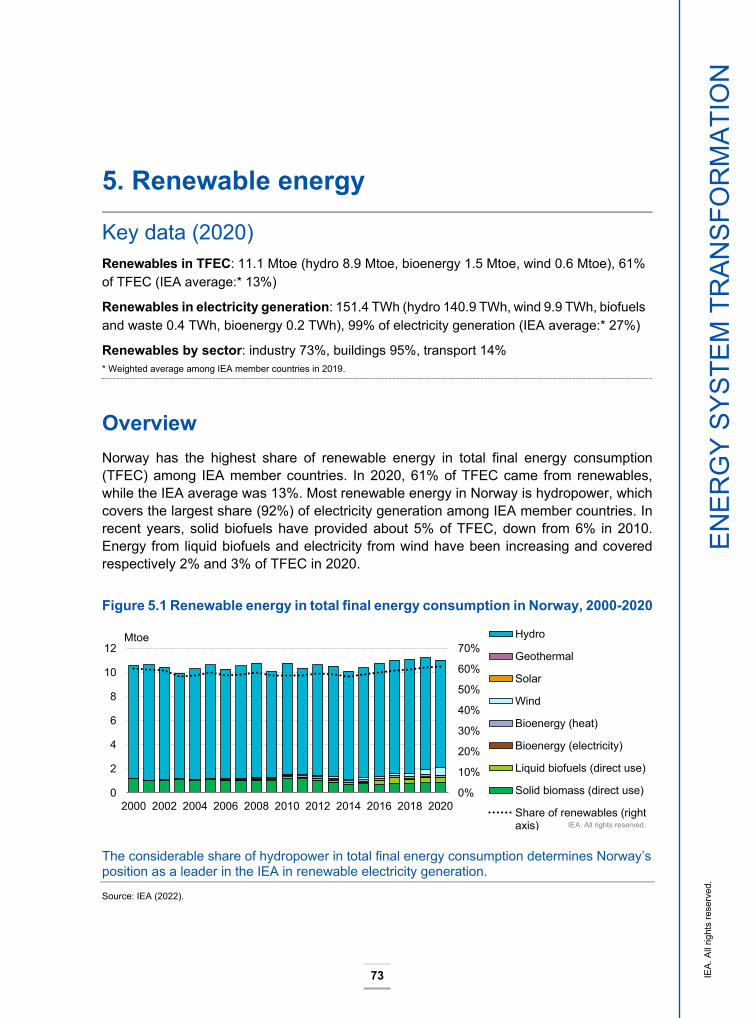
73
ENER
GY
SYST
EM T
RAN
SFO
RM
ATIO
N
5. Renewable energy
Key data (2020) Renewables in TFEC: 11.1 Mtoe (hydro 8.9 Mtoe, bioenergy 1.5 Mtoe, wind 0.6 Mtoe), 61% of TFEC (IEA average:* 13%)
Renewables in electricity generation: 151.4 TWh (hydro 140.9 TWh, wind 9.9 TWh, biofuels and waste 0.4 TWh, bioenergy 0.2 TWh), 99% of electricity generation (IEA average:* 27%)
Renewables by sector: industry 73%, buildings 95%, transport 14% * Weighted average among IEA member countries in 2019.
Overview Norway has the highest share of renewable energy in total final energy consumption (TFEC) among IEA member countries. In 2020, 61% of TFEC came from renewables, while the IEA average was 13%. Most renewable energy in Norway is hydropower, which covers the largest share (92%) of electricity generation among IEA member countries. In recent years, solid biofuels have provided about 5% of TFEC, down from 6% in 2010. Energy from liquid biofuels and electricity from wind have been increasing and covered respectively 2% and 3% of TFEC in 2020.
Figure 5.1 Renewable energy in total final energy consumption in Norway, 2000-2020
The considerable share of hydropower in total final energy consumption determines Norway’s position as a leader in the IEA in renewable electricity generation.
Source: IEA (2022).
0%
10%
20%
30%
40%
50%
60%
70%
0
2
4
6
8
10
12
2000 2002 2004 2006 2008 2010 2012 2014 2016 2018 2020
Mtoe Hydro
Geothermal
Solar
Wind
Bioenergy (heat)
Bioenergy (electricity)
Liquid biofuels (direct use)
Solid biomass (direct use)
Share of renewables (rightaxis) IEA. All rights reserved.
IEA.
All
right
s re
serv
ed.

5. RENEWABLE ENERGY
74
Thanks to the exceptionally high share of renewables in electricity and to the high level of electrification of the country, Norway has the highest shares of renewables by sector in the IEA. Renewables in 2019 provided 90% of energy demand (TFEC) in buildings, 71% in industry and 12% in transport. After renewable electricity, covering 79% of buildings TFEC, 62% of industry and 3% of transport, solid biomass provided 8% of energy in buildings and 4% in industry, and liquid biofuels had a high share (9%) of transport energy demand.
Figure 5.2 Renewable energy by sector in Norway, 2020
Renewable electricity is extensively used in Norway’s end-use sectors; no other IEA country has a higher share of renewable electricity in buildings, industry or transport.
Note: Data are not available for Australia, Finland, Greece, Italy, Luxembourg, New Zealand, Spain or Turkey. Source: IEA (2022).
Renewable electricity Out of 154 TWh of total electricity generation in Norway in 2020, 151 TWh (98%) came from renewable energy sources, of which 141 TWh (92%) came from hydro (Figure 5.3). Electricity generation from wind has increased tenfold since 2010 and amounted to almost 10 TWh in 2020. Renewable waste contributed with a minimal contribution to electricity generation, providing 210 MWh in 2020. Starting in 2018, some solar PV panels were also installed, but they generated only 30 MWh in 2020.
0%
10%
20%
30%
40%
50%
60%
70%
80%
90%
0
1
2
3
4
5
6
7
8
9
Buildings Industry Transport
Mto
e Renewable heat
Renewable electricity
Renewable waste
Liquid biofuels
Biogas
Solid biomass
Share of renewables(right axis)
IEA. All rights reserved.
IEA.
All
right
s re
serv
ed.
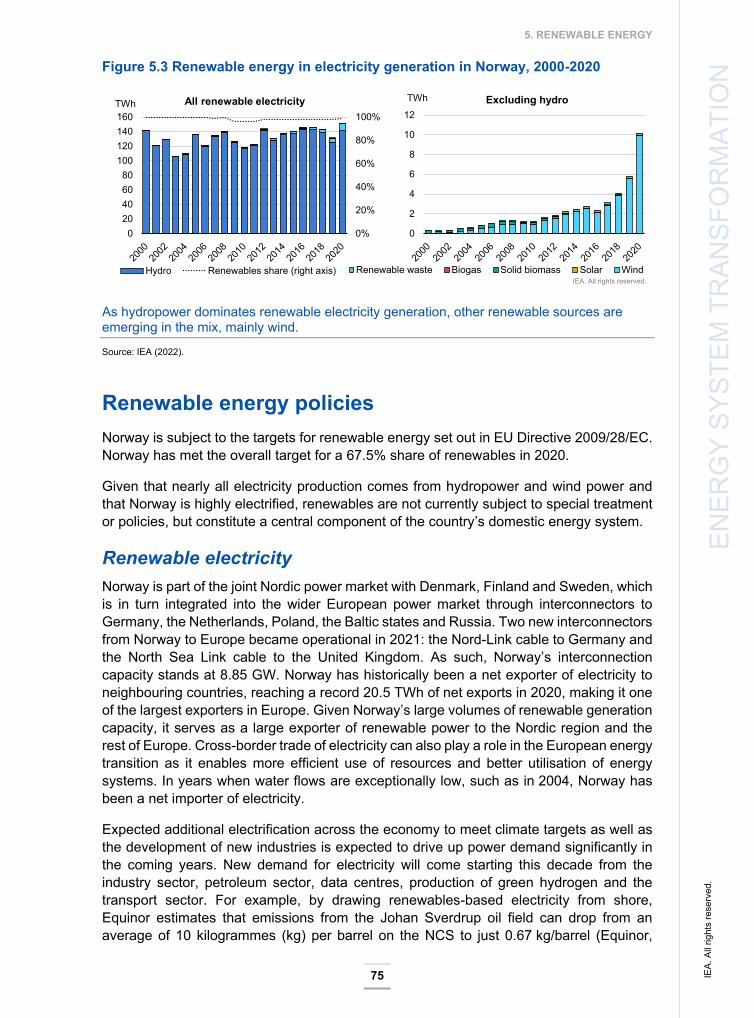
5. RENEWABLE ENERGY
75
ENER
GY
SYST
EM T
RAN
SFO
RM
ATIO
N Figure 5.3 Renewable energy in electricity generation in Norway, 2000-2020
As hydropower dominates renewable electricity generation, other renewable sources are emerging in the mix, mainly wind.
Source: IEA (2022).
Renewable energy policies Norway is subject to the targets for renewable energy set out in EU Directive 2009/28/EC. Norway has met the overall target for a 67.5% share of renewables in 2020.
Given that nearly all electricity production comes from hydropower and wind power and that Norway is highly electrified, renewables are not currently subject to special treatment or policies, but constitute a central component of the country’s domestic energy system.
Renewable electricity Norway is part of the joint Nordic power market with Denmark, Finland and Sweden, which is in turn integrated into the wider European power market through interconnectors to Germany, the Netherlands, Poland, the Baltic states and Russia. Two new interconnectors from Norway to Europe became operational in 2021: the Nord-Link cable to Germany and the North Sea Link cable to the United Kingdom. As such, Norway’s interconnection capacity stands at 8.85 GW. Norway has historically been a net exporter of electricity to neighbouring countries, reaching a record 20.5 TWh of net exports in 2020, making it one of the largest exporters in Europe. Given Norway’s large volumes of renewable generation capacity, it serves as a large exporter of renewable power to the Nordic region and the rest of Europe. Cross-border trade of electricity can also play a role in the European energy transition as it enables more efficient use of resources and better utilisation of energy systems. In years when water flows are exceptionally low, such as in 2004, Norway has been a net importer of electricity.
Expected additional electrification across the economy to meet climate targets as well as the development of new industries is expected to drive up power demand significantly in the coming years. New demand for electricity will come starting this decade from the industry sector, petroleum sector, data centres, production of green hydrogen and the transport sector. For example, by drawing renewables-based electricity from shore, Equinor estimates that emissions from the Johan Sverdrup oil field can drop from an average of 10 kilogrammes (kg) per barrel on the NCS to just 0.67 kg/barrel (Equinor,
0
2
4
6
8
10
12
TWh
Renewable waste Biogas Solid biomass Solar WindIEA. All rights reserved.
Excluding hydro
0%
20%
40%
60%
80%
100%
0 20 40 60 80
100 120 140 160TWh
Hydro Renewables share (right axis)
All renewable electricity
IEA.
All
right
s re
serv
ed.
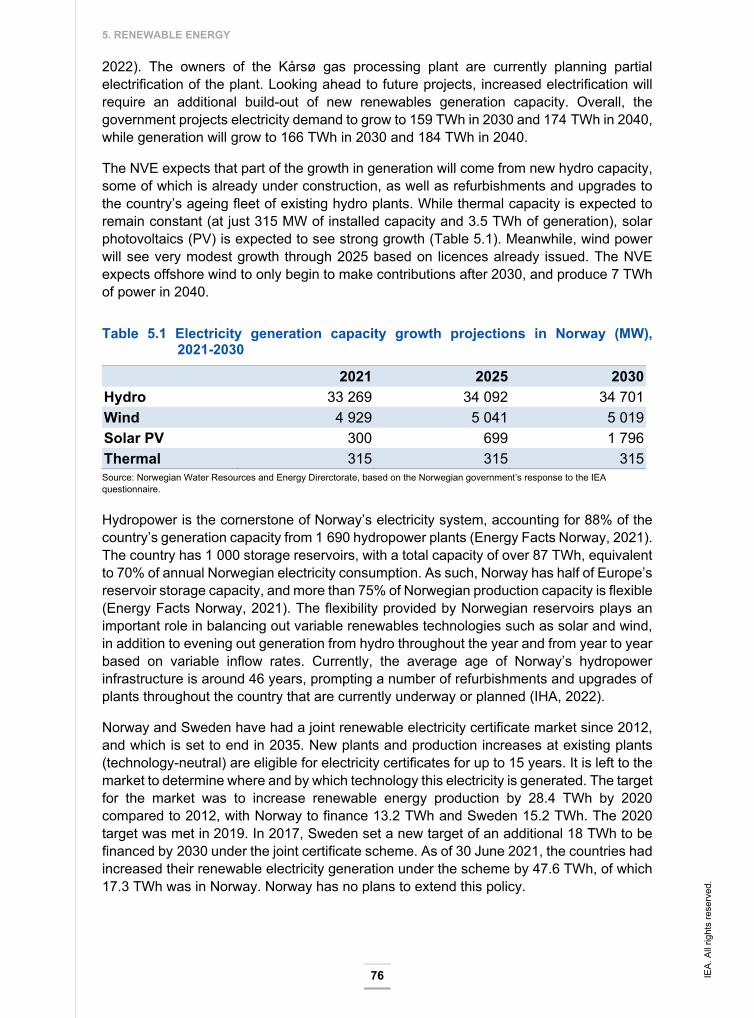
5. RENEWABLE ENERGY
76
2022). The owners of the Kårsø gas processing plant are currently planning partial electrification of the plant. Looking ahead to future projects, increased electrification will require an additional build-out of new renewables generation capacity. Overall, the government projects electricity demand to grow to 159 TWh in 2030 and 174 TWh in 2040, while generation will grow to 166 TWh in 2030 and 184 TWh in 2040.
The NVE expects that part of the growth in generation will come from new hydro capacity, some of which is already under construction, as well as refurbishments and upgrades to the country’s ageing fleet of existing hydro plants. While thermal capacity is expected to remain constant (at just 315 MW of installed capacity and 3.5 TWh of generation), solar photovoltaics (PV) is expected to see strong growth (Table 5.1). Meanwhile, wind power will see very modest growth through 2025 based on licences already issued. The NVE expects offshore wind to only begin to make contributions after 2030, and produce 7 TWh of power in 2040.
Table 5.1 Electricity generation capacity growth projections in Norway (MW), 2021-2030
2021 2025 2030
Hydro 33 269 34 092 34 701 Wind 4 929 5 041 5 019 Solar PV 300 699 1 796 Thermal 315 315 315 Source: Norwegian Water Resources and Energy Direrctorate, based on the Norwegian government’s response to the IEA questionnaire.
Hydropower is the cornerstone of Norway’s electricity system, accounting for 88% of the country’s generation capacity from 1 690 hydropower plants (Energy Facts Norway, 2021). The country has 1 000 storage reservoirs, with a total capacity of over 87 TWh, equivalent to 70% of annual Norwegian electricity consumption. As such, Norway has half of Europe’s reservoir storage capacity, and more than 75% of Norwegian production capacity is flexible (Energy Facts Norway, 2021). The flexibility provided by Norwegian reservoirs plays an important role in balancing out variable renewables technologies such as solar and wind, in addition to evening out generation from hydro throughout the year and from year to year based on variable inflow rates. Currently, the average age of Norway’s hydropower infrastructure is around 46 years, prompting a number of refurbishments and upgrades of plants throughout the country that are currently underway or planned (IHA, 2022).
Norway and Sweden have had a joint renewable electricity certificate market since 2012, and which is set to end in 2035. New plants and production increases at existing plants (technology-neutral) are eligible for electricity certificates for up to 15 years. It is left to the market to determine where and by which technology this electricity is generated. The target for the market was to increase renewable energy production by 28.4 TWh by 2020 compared to 2012, with Norway to finance 13.2 TWh and Sweden 15.2 TWh. The 2020 target was met in 2019. In 2017, Sweden set a new target of an additional 18 TWh to be financed by 2030 under the joint certificate scheme. As of 30 June 2021, the countries had increased their renewable electricity generation under the scheme by 47.6 TWh, of which 17.3 TWh was in Norway. Norway has no plans to extend this policy.
IEA.
All
right
s re
serv
ed.
5. RENEWABLE ENERGY
77
ENER
GY
SYST
EM T
RAN
SFO
RM
ATIO
N Norway has faced local opposition to onshore wind power projects, based on the perceived
impact on landscapes and ecology. In 2019, the government put on hold approvals for new wind projects. There are few remaining unrealised licences, and the government assumes that there will not be a substantial increase in onshore wind power until after 2030 due to the pause on new licences.
Some revenues from onshore wind are already directed toward local municipalities. For instance, the property tax on wind power plants is a source of revenue for host municipalities. Furthermore, an excise duty on onshore wind power plants has been adopted, but will not take effect until the European Free Trade Association Surveillance Authority has assessed the measure. It is presumed in the budget proposal that revenue from the excise duty will be distributed to host municipalities.
In June 2020, the previous government released a white paper on land-based wind power, proposing changes to current practice and imposing new licencing requirements. Some of the main measures focused on increasing local and regional involvement, better ensuring that environmental matters were taken into consideration, and introducing new deadlines to shorten the timeline for planning and building wind farms. The overall aim was to provide a reliable framework for long-term development of onshore wind power in Norway.
In April 2022, the government announced it would resume licences in municipalities that are supportive of new applications being processed. The new framework also includes:
A plan for the involvement, and early notification, of neighbours and other interests.
Ensuring that municipalities are involved at an early stage, including through early dialogue between the municipalities, developers and the NVE, as well as a written statement from the municipalities to approve processing the impact assessment that is needed to apply for a license (for plants bigger than 10 MW).
Co-ordination of grid and power production, and assessing available grid capacity at an early stage.
Clearer licencing conditions, including distances to existing buildings, maximum turbine heights and environmental values. More of the conditions that affect the project design shall be determined at an earlier stage of the process, compared to previous practice.
Involvement of Sami interests in all stages of the process.
Assessment of the total impact on the reindeer industry.
Processing and prioritisation of applications to include documentation of co-operation with the reindeer industry and agreements on compensation and mitigating measures.
Small-scale renewable energy plants (solar, wind, hydro) with total installed capacity of less than 1 MW do not require a licence. Prosumers and small-scale community projects are thus not affected by the temporary pause in licencing. Rather, smaller projects are licensed by the municipality and regulated by the Planning and Building Act.
The Norwegian government also has ambitions to build-out offshore wind capacity. In 2020, Norway opened two areas for offshore wind with a combined capacity of up to 4.5 GW. A maximum capacity of 3 GW is set at Sørlige Nordsjø II, which is expected to accommodate bottom-fixed turbines at an average water depth of 60 metres. The second area, Utsira Nord, has a maximum floating wind capacity of 1.5 GW. The government’s goal is to facilitate offshore wind through an ambitious national strategy, including a supply industry, a solid regulatory regime and the development of connecting infrastructure on
IEA.
All
right
s re
serv
ed.
5. RENEWABLE ENERGY
78
the NCS. The MPE has consulted on offshore wind guidelines relating to area allocation, licencing and applications for development, and has identified further issues to be resolved in advance of opening up the acreage. However, the government’s ambition is for the first large-scale offshore wind projects to be finished by 2030. As such, the NVE forecasts that offshore wind will not make much of a contribution to Norway’s power mix before then.
Before Utsira Nord, Norway plans to build the world’s largest floating offshore wind farm (Hywind Tampen), consisting of 11 wind turbines, based on Equinor’s floating wind technology, with a total installed capacity of 88 MW. The project is intended to provide renewable electricity for the Snorre and Gullfaks offshore field operations in the Norwegian North Sea.
On 11 May 2022, the government presented a large-scale plan for offshore wind, with a target of allocating areas for 30 GW of offshore wind capacity by 2040. This corresponds to almost as much power generation capacity as in Norway today. The government wants to facilitate large-scale offshore wind development that allows for the use of various grid solutions. Cables with two-way power flow, radials to Europe and to Norway, will be considered for each call. When choosing an offshore grid solution that involves a connection to the Norwegian power system, the technical design of the plant must ensure national interests, including security of supply and reasonable electricity prices for households, industry and businesses. Awarding licences for offshore wind in new areas will be done step by step. The government aims to carry out the next round in 2025. The overall goal is to open a total area about five to six times that of Sørlige Nordsjø II, which is about 1% of the Norwegian Sea area.
Norway will also need to expand grid capacity to accommodate the growth in generation capacity, including introducing more flexibility mechanisms to handle additional generation from variable renewables. Toward this end, Norway’s TSO Statnett has released a Grid Development Plan 2021 that includes plans for several major new projects, amounting to NOK 60-100 billion (EUR 6-10 billion) in investments. Given that regulatory approvals for grid lines can be lengthy, extending project timelines up to ten years from planning to completion, the government nominated a public committee to recommend options to streamline and improve the licencing regime.
Renewable heating and cooling In Norway, households mainly use electricity for heating. A ban on the installation of fossil fuel-based heating installations in new buildings came into force in 2016. And as of 1 January 2020, a new regulation banned the use of mineral oil for heating in new and existing buildings. The measures have helped end the use of fuel oil in heating and cooling, and motivate a switch to other heating technologies, such as heat pumps, biofuels and direct electrical heating. Natural gas is still allowed in existing buildings, but it is not commonly used. New installations for natural gas heating are not allowed.
The state-owned enterprise Enova has supported the installation of local heating plants based on the following renewable sources: woodchips, pellets, briquettes, air-to-water and liquid-to-water heat pumps, and solar thermal collectors.
Renewable transport Norway has several measures promoting the use of biofuels and the increased use of renewables in transport.
IEA.
All
right
s re
serv
ed.

5. RENEWABLE ENERGY
79
ENER
GY
SYST
EM T
RAN
SFO
RM
ATIO
N Biofuels
Biofuels feature in Norway’s Climate Action Plan 2021-2030 as a tool for reducing emissions from the transport sector. The plan calls for maintaining current volumes of biofuels in road transport by increasing the obligation, planning to introduce a non-road diesel and a shipping fuel obligation from 2022, and increasing non-road blending obligations to the same level as road transport (exploring the option to merge the obligations).
For road transport, fuel suppliers must fulfil a biofuels quota of 24.5% of the volume of fuels supplied, of which a minimum of 9% must be advanced biofuels. Advanced biofuels are counted at twice their volume, creating an effective blend rate of 15.5%. As part of the mandate, 4% of petrol supplied must contain biofuels. Only liquid biofuels can be used to meet the requirement (biogas does not count) (Norwegian Environment Agency, 2021). The programme is administered by the Norwegian Environment Agency, which is housed under the Ministry of Climate and Environment. Almost all biofuels consumed in Norway are imported.
Previously, the biofuels mandate was exceeded due to generous tax breaks, but in 2020, tax policy was changed to remove an advantage to all biofuels except for volumes used to fulfil the biofuels quota. As a result, now only mandated amounts are sold. In 2020, offal that cannot be used for animal feed was the most widely used raw material, followed by rapeseed and used frying oil. Almost all liquid biofuels used in Norway are imported from other countries, with the largest share (61%) coming from the United States (Norwegian Environment Agency, 2021).
In aviation, Norway set a quota obligation on fuel suppliers since 2020, under which they must source 0.5% of annual fuel sales from advanced biofuels. This amounted to 2.5 million litres in 2020. There is no double counting of advanced biofuels under the aviation mandate. The quota applies to both domestic and international flights, though military flights are exempt.
Biofuels used to meet Norway’s mandate must meet sustainability criteria as established under the EU Renewable Energy Directive. Advanced biofuels must be made from specific feedstocks, corresponding to the feedstock list in Parts A and B of Annex IX in the EU RES Directive. The Norwegian Environment Agency publishes a guide for obligated parties that are required to report on sustainability criteria, which is updated annually (Norwegian Environment Agency, 2021).
Looking ahead, in the first half of 2022, the government has a public consultation underway to increase the biofuels mandate. The government’s proposal is to increase the overall mandate for biofuels in road transport (effective blend rate) to 17% from 1 July 2022 and to 17% from 2023. For non-road machines (mainly transport), the proposal calls for increasing the advanced biofuels quota to either 6% or 10% from 1 July 2022. Impact assessments on a new biofuels mandate for shipping as well as 2023 and 2024 quotas for aviation are ongoing.
With respect to shipping, the government has an ambition to reduce GHG emissions from domestic shipping and fishing by 50% from 2005 levels by 2030. Its main approach is to stimulate public-private partnerships in zero- and low emissions solutions for all vessel categories using a tailor-made approach for various categories. R&D focus areas include
IEA.
All
right
s re
serv
ed.
5. RENEWABLE ENERGY
80
hydrogen, green ammonia, and ship design and infrastructure. The government is planning to propose a package for green shipping in the second half of 2022.
Norway also offers RD&D support to bioenergy. Enova provides investment subsidies for the production of biogas and biofuels and for the purchase of biogas-powered vehicles and machinery that runs on electricity or biogas. The aim of the programme is to increase sustainable production of biogas and biofuels. Innovation Norway supports small-scale production of biogas and woodchips in the agricultural sector, with grants for investments, studies or capabilities evaluations related to the production of biogas and bioenergy.
In addition to these biofuel aid schemes, a number of tax exemptions are designed to promote the use of renewable energy in the transport sector, including an exclusion for biofuels from the CO2 tax (though biofuels are subject to the road use tax), as well as substantial tax exemptions on the sale and use of EVs (see below).
Renewable electricity Norway has more electric cars per capita than any country in the world. Around 86% of all new passenger cars sold in 2021 were EVs (with 64.5% being fully battery electric), drawing from a renewables-based electricity grid. In comparison, less than 14% of new passenger cars sold in 2021 were regular internal combustion cars. Norway is a relatively small car market with about 2.9 million passenger cars. By the beginning of November 2021, 436 807 cars (15.1%) were fully electric, while 176 were fuel cell electric vehicles.
In 2021, 18 086 public electric chargers were available in the country, of which 5 225 were fast chargers. In addition, Tesla had 1 182 electric chargers for Tesla cars in 2021. The country has 0.35 public charging points for every 10 EVs.
Moreover, close to 4% of light commercial vehicles are now fully electric and nearly 14% of vans sold in 2021 were electric. Norway also has large orders for electric buses in several cities. Currently, 6.7% of city buses are electric, though 23% of new buses were electric in 2020 and 12% in 2021. In addition, approximately 80% of the railway kilometres travelled per year are powered by overhead electricity lines.
A combination of taxation rules and incentives is the main reason for the high penetration of EVs in Norway (see Chapter 4). ZEVs benefit from VAT (25%) and registration tax (around EUR 10 000 on average) exemptions. PHEVs benefit from a reduced registration tax, though this reduction is subject to stricter conditions since January 2022. Moreover, the government introduced a rule that ZEVs should pay no more than half of what conventional vehicles pay for parking, boarding ferries and driving on toll roads. The rate up to the 50% level is decided by local authorities. Estimated at almost NOK 18.7 billion in 2021 (EUR 1.9 billion), the benefits come with substantial costs.
Enova also provides investment support for fast-charging infrastructure and investment support for zero emissions vehicles for commercial use (such as vans and trucks) amounting to NOK 1 billion (EUR 0.1 billion) in 2020.
Norway also introduced the first fully electric ferry in 2015. In 2022, 70 electric and hybrid ferries will operate on the Norwegian coast, and the operation of a hydrogen ferry will start in western Norway in 2023. In 2024, the first offshore vessel fuelled by ammonia will become operational.
IEA.
All
right
s re
serv
ed.

5. RENEWABLE ENERGY
81
ENER
GY
SYST
EM T
RAN
SFO
RM
ATIO
N Looking ahead, Norway has set political targets for the transport sector. By 2025, all new
passenger cars and light vans should be zero emissions, while all new city buses should be zero emissions or use biogas. By 2030, all new heavy vans, 75% of new long-distance buses and 50% of new trucks should be zero emissions. Moreover, by 2030, there should also be near emissions-free distribution of goods in major city areas. The targets are contingent on improvements in zero emissions vehicle technologies. Norway also has an ambition to achieve zero growth in private transport by cars in cities.
Assessment Norway has the highest share of renewable energy in total final energy consumption among IEA member countries. In 2020, 61% of TFEC came from renewables, compared to the IEA average of 13%. Most renewable energy in Norway is hydropower, which covers the largest share (92%) of electricity generation among IEA member countries. Between 2015 and 2020, solid biofuels provided on average 4.2% of TFEC, down from 6.2% in 2010. Energy from liquid biofuels and electricity from wind have been increasing and covered respectively 2.2% and 3.5% of TFEC in 2020. The share of biofuels in transport demand in 2020 (9%) was the third-highest among IEA member countries after Sweden and Finland, and has increased fourfold since 2009.
Moreover, thanks to the exceptionally high share of renewables in electricity and to the high level of electrification in the country, Norway has the highest shares of renewables by sector (industry, transport, buildings) among IEA member countries.
Norway is subject to the targets for renewable energy set out in EU Directive 2009/28/EC, and met the overall target for a 67.5% share of renewables in 2020. Given that nearly all electricity production comes from hydro and wind power and that Norway is highly electrified, new renewables are not subject to special treatment or policies, but constitute a central component of the country’s domestic energy system.
Hydropower, with its combination of stability, flexibility and low production costs, has made a huge contribution to the creation and sustainability of Norway’s low-carbon economy. Norway’s power market is organised in a decentralised and flexible manner and can be deployed to balance the wider production of variable renewables. Together with high and increasing levels of interconnection and integration, Norway provides the Nordic region with a significant source of low-cost, highly flexible, renewable power.
Norway’s high share of renewable electricity and an almost fully renewable heating system mean that the country’s future efforts to increase renewable energy will be focused on more challenging, harder to abate sectors, in particular industry and transport. Additional electrification in these sectors, including offshore oil and gas platforms, will provide a significant opportunity to further increase Norway’s renewable energy share and reduce emissions in line with climate obligations.
Norway’s progress in increasing renewables in the transport sector over the past decade is notable. A mix of policies, measures and incentives in promoting the uptake of electric vehicles and the use of biofuels has delivered tangible results.
Despite Norway being a world leader in renewable energy, many of the existing strategies and policies do not include detailed annual trajectories or specific action plans, particularly beyond 2030. This approach risks creating investor uncertainty and a lack of clarity for
IEA.
All
right
s re
serv
ed.

5. RENEWABLE ENERGY
82
achieving emissions reductions, and poses challenges for monitoring and assessing progress. Norway should seek to adopt an integrated approach to developing renewables policies and underpinning measures. A lack of stakeholder visibility across policies relating to renewable energy risks missing opportunities to create synergies and could result in unintended challenges for deployment.
Renewables in electricity Out of 154 TWh of total electricity generation in Norway in 2020, 151 TWh (89%) came from renewable energy sources, of which 141 TWh came from hydro. Electricity generation from wind has increased tenfold since 2010 and amounted to almost 10 TWh in 2020. Renewable waste made a minimal contribution to electricity generation, providing 210 MWh in 2020. Starting in 2018, some solar PV panels were also installed, but they generated only 30 MWh in 2020.
Norway and Sweden have had a joint electricity certificate market since 2012, which is set to end in 2035. The 2020 target to achieve an additional 28.4 TWh from 2012 levels was met in 2019. Norway has no plans to extend this policy, as the government expects that market conditions can support a build-out of wind generation without additional policy support.
Norway has the highest share of electricity produced from renewable sources in Europe, almost completely sourced from hydropower, making it the country’s largest primary energy source. The future renewable electricity generation mix is expected to be made up primarily of hydro, wind and solar power. Even with the projected growth in electricity demand (to 164 TWh in 2030 and 184 TWh in 2040) and assumed growth in additional renewable sources (to 166 TWh in 2030 and 174 TWh in 2040), hydropower’s share of Norwegian electricity supply is likely to remain high. However, precisely how the non-hydro share of renewable power generation will be broken down and realised is not sufficiently clear under existing policies and measures.
A concerted, co-ordinated approach to the future development of the transmission system to accommodate increased renewable energy production is also recommended to complement increased renewables generation.
Norway’s rich energy history and abundant natural resources mean it is well placed to further develop and diversify its renewable energy portfolio through new industries such as green hydrogen and offshore wind. Norway should seek to harness its strong renewable electricity potential to reduce emissions and decarbonise the oil and gas sector. Electrification of some parts of the Kårstø (gas) processing plant is under consideration by the government and future electrification of offshore oil and gas production could be a significant driver for offshore wind.
Favourable wind conditions mean that Norway has substantial wind energy potential. Onshore wind power has grown considerably in recent years, with the share of wind in electricity generation increasing tenfold over the past decade, replacing thermal power production as the second-largest generation source. This is a significant and welcome achievement, thanks in part to the joint electricity market.
However, Norway has faced local opposition to onshore wind power projects on the basis of a perceived impact on landscapes and ecology. In 2019, the government put on hold approvals for new wind projects, and it is assumed that there will not be a substantial
IEA.
All
right
s re
serv
ed.
5. RENEWABLE ENERGY
83
ENER
GY
SYST
EM T
RAN
SFO
RM
ATIO
N increase in onshore wind power until after 2030. In June 2020, the previous government
released a white paper on land-based wind power, proposing changes to current practice and imposing new licencing requirements. The overall aim was to provide a reliable framework for long-term development of onshore wind power in Norway.
It will be vital to ensure that concerns over community involvement as well as delays and bottlenecks in the permitting process (including relating to grid availability and environmental aspects) are adequately addressed under the new framework. Onshore wind can generate concrete value for local communities. Enabling citizens to participate as members of a prosumer community in both the financial returns of the wind farm as well as in the overall decision-making process will contribute to raising acceptance for this technology and should be considered as part of the reform of the regulatory regime.
As a result of the hiatus of the licencing process for new onshore wind, there is broad uncertainty over the future of Norway’s onshore wind sector. Timely implementation of a new regulatory framework for onshore wind, while ensuring appropriate benefits-sharing with local communities, will help Norway expand its base of renewables generation capacity.
Norway has strong ambitions for the development of its offshore wind energy potential, despite the challenges of its relatively deep waters. As the technology matures and becomes competitive, offshore wind is expected to be a key component in Norway’s future renewable energy mix. It will be one of the primary, long-term solutions for meeting increasing demand for renewable power and enabling the energy transition in Norway and beyond. Large-scale deployment of offshore wind offers a significant advantage to Norway given its existing offshore and marine industries expertise, but clarity is required around targeted end users for this technology, including whether and how it will connect to the onshore grid.
Norway plans to build the world’s largest floating offshore wind farm (Hywind Tampen), based on Equinor’s floating wind technology. With a total installed capacity of 88 MW, it will power offshore oil and gas operations. This innovative project will serve as a pilot for further development of floating wind and future integration between gas and wind power generation systems. The government is, however, still in the process of creating a licencing framework for offshore wind. As the government’s ambition is for the first large-scale offshore wind projects to be finished by 2030, offshore wind will not make much of a contribution to the country’s power mix before then.
IEA analysis indicates that floating offshore wind will experience notable cost reductions in the coming years (IEA, 2019). However, NVE projections do not include offshore wind as part of the electricity generation mix until 2030-2040. In 2040, it is assumed that 7 TWh of offshore wind power will be produced.
Two areas have been assigned for offshore wind power development to date, one on deep waters with high-cost floating technology and one with a bottom-fixed solution. Norway should prioritise the finalisation of the offshore wind policy and regulatory framework, including the role of the transmission system operator and whether hybrid connections in the future will be permitted.
Solar PV has been increasing in Norway, but does not form a significant share of the renewable electricity generation mix yet. By the end of 2020, installed solar PV capacity connected to the grid was 142 MW and around 18 MW was installed off grid. Total annual
IEA.
All
right
s re
serv
ed.

5. RENEWABLE ENERGY
84
production in 2020 was approximately 140 GWh, which is projected to increase by 1.5 TWh out to 2030, contributing, alongside hydro and onshore and offshore wind power, to meeting future demand. A more detailed assessment of the competitiveness of solar power without subsidies in the Norwegian context would help to clarify the role that solar can play.
Norway’s commitment to ensuring a high share of RD&D budget for renewables is commendable and will contribute to its energy transition towards net zero.
Renewables in heating and cooling A ban on using fuel oil for heating in both new and existing buildings entered into force on 1 January 2020, helping to increase the use of renewables in heating. The 2016 building code already included a ban on installing new heating installations using fossil fuels. Moreover, Enova has supported the installation of local heating plants based on several renewable sources. Norway has successfully introduced and implemented a series of complementary measures to promote the use of renewables in heating, and the IEA welcomes the progress made.
Renewables in transport Norway has several measures promoting the use of renewables in transport. Measures promoting a shift towards the use of alternative fuels are primarily implemented to reduce CO2 emissions from the sector, and have resulted in an increased share of renewables in transport in recent years.
Norway has made considerable headway relative to other countries in increasing the use of renewables-based electricity in the transport sector, primarily based on incentives for EVs (see Chapter 4). No other country in the world has more electric cars per capita than Norway. Around 86% of all new passenger cars sold in 2021 were EVs, drawing from a renewables-based electricity grid. In comparison, less than 14% of new passenger cars sold in 2021 were regular internal combustion cars.
As Norway seeks to reduce some of the current incentives for EVs, efforts should be made to ensure this does not result in a significant reduction in the uptake of EVs. Ensuring adequate charging for both passenger and larger road transport vehicles will be important in safeguarding this.
By 2025, Norway’s ambition is that all new passenger cars and light vans should be zero emissions and all new city buses should be zero emissions or use biogas. By 2030, the ambition is that all new heavy vans, 75% of new long-distance buses and 50% of new trucks should be zero emissions. The targets are all ambitious and will go a long way toward significantly increasing the share of renewables in the energy mix, especially if they are accompanied by a commensurate displacement of fossil fuel vehicles. Norway should also ensure that the new demand created by electrification of transport is accompanied by sufficient growth in power generation capacity, especially in a context of competing demand from other sectors for renewable power.
Norway has already made considerable headway in increasing the share of biofuels in its transport fuel mix, driven by a biofuels quota policy. The share of biofuels in transport demand (9%) is the third-highest among IEA member countries after Sweden and Finland and has increased fourfold since 2009.
IEA.
All
right
s re
serv
ed.
5. RENEWABLE ENERGY
85
ENER
GY
SYST
EM T
RAN
SFO
RM
ATIO
N For road transport, fuel suppliers must fulfil a biofuels quota of 24.5% of fuels supplied, of
which a minimum of 9% must be advanced biofuels (with an effective blend rate of 15.5%). Advanced biofuels are counted at twice their volume. The current proposal to increase the effective blending rate from 15.5% to 17% in 2023, if adopted, will further reduce emissions in the transport sector. A new mandate of 6% or 10% for advanced biofuels in non-road transport is proposed to come into effect in July 2022.
For air traffic, fuel suppliers must meet a biofuels quota of 0.5% of fuels supplied and only advanced biofuels can be used toward the quota, with 2023 and 2024 mandate levels for aviation currently under consideration.
Norway’s ambition is to reduce emissions from domestic shipping and fishing vessels by 50% by 2030 compared to 2005. An impact assessment on a new biofuels mandate for shipping is underway, with a number of measures and programmes already in place to support increased renewables and low-carbon ammonia in the maritime shipping sector. The government is expected to propose a package for green shipping. Given the rising biofuel mandates across the transport sector, Norway should ensure appropriate production levels and/or import sources to meet growing demand.
Recommendations The government of Norway should:
Establish sectoral road maps with indicative targets, including interim targets, for renewable energy that align with projected demand growth and climate targets for 2030 and 2050; develop detailed implementation plans for achieving those targets.
Promptly develop a robust regulatory framework that provides long-term investment signals and supports strong deployment of onshore and offshore wind generation, including by addressing social acceptance issues and involving communities.
Ensure the transmission and distribution systems are equipped to cope with expanded renewable generation and new electricity demand from electric vehicles and industrial end uses.
Improve conditions for prosumers/local communities to produce and consume renewable electricity to increase public acceptance and ensure the proper functioning of the electricity market.
IEA.
All
right
s re
serv
ed.
5. RENEWABLE ENERGY
86
References Energy Facts Norway (2021), Electricity production (web page), https://energifaktanorge.no/en/norsk-energiforsyning/kraftproduksjon/#:~:text=seasons%20and%20years.-,Hydropower,of%20Norways%20total%20power%20production
Equinor (2022), Magazine (web page), https://equinor.com/magazine
IEA (International Energy Agency) (2022), World Energy Balances (database), https://iea.org/data-and-statistics/data-product/world-energy-balances (accessed on 18 February 2022)
IEA (2019), Offshore Wind Outlook 2019, https://iea.org/reports/offshore-wind-outlook-2019
IHA (International Hydropower Association) (2022), Norway country profile (web page), https://hydropower.org/country-profiles/norway
Norwegian Environment Agency (2021), Biofuels (web page), https://miljodirektoratet.no/ansvarsomrader/klima/transport/biodrivstoff
IEA.
All
right
s re
serv
ed.

87
ENER
GY
SYST
EM T
RAN
SFO
RM
ATIO
N
6. Energy research, development and innovation
Key data (2020) Total public energy RD&D expenditure: USD 400 million
Share of GDP: 0.11% of GDP (IEA average:* 0.041%)
Share of energy in total RD&D: 2.4% (IEA average: 3.7%) * Average of 21 IEA countries as data for Australia, Finland, Greece, Italy, Luxembourg, New Zealand, Spain and Turkey are not available for 2020.
Overview Norway has traditionally placed a strong focus on energy-related RD&D, and its RD&D ecosystem is characterised by a high level of government support. Funding levels have remained strong since the IEA’s last review and most RD&D programmes have been in place since then, albeit shifting focus to better direct spending toward technology innovation outcomes.
In 2020, Norway’s public budget on energy-related RD&D was USD 400 million. In the last decade, it has fluctuated at around an average of USD 380 million, or around 0.1% of the country’s GDP, the highest share among IEA member countries.
Energy efficiency RD&D projects accounted for the largest share (40%) of the public budget on energy-related RD&D in 2020, followed by renewables (20%), oil and gas (15%), and CCS (12%).
The government has set specific goals for the overall national level of RD&D, whereby public spending for RD&D must amount to 1% of GDP and private RD&D spending should make up 2% of GDP. Since 2016, the government’s spending levels have exceeded 1%, but the private sector’s spending has fallen short of 2%.
The government does not set any specific targets for RD&D spending levels for sectors, including energy. However, energy innovation is an important part of Norway’s Long-term Plan for Research and Higher Education. The long-term plan sets out ten-year objectives and priorities as well as more concrete goals over a four-year period. The plan is revised every four years to accommodate changes in the political and societal landscape. The current long-term plan was presented by the former government, and has a ten-year perspective from 2019 to 2028, specifying goals and priority areas for the four-year period 2019-22. The government will present a revised long-term plan for the period 2023-2032 to parliament in October 2022.
IEA.
All
right
s re
serv
ed.
6. ENERGY RESEARCH, DEVELOPMENT AND INNOVATION
88
Key actors in Norway’s energy innovation landscape The Ministry of Education and Research is responsible for basic research and co-ordination of the government’s general RD&D policies, while individual ministries are responsible for funding RD&D within their sector. The MPE is in charge of Norway’s policy for petroleum and energy RD&D, all of which is channelled through the RCN, which administers national petroleum and energy RD&D programmes.
The RCN is the government’s strategic and advisory body on RD&D. It has a key role in financing and following up on RD&D projects and activities as well as giving policy advice to the government. The RCN distributes close to 30% of public RD&D spending in Norway. The remaining funds go to universities, research institutes and industry. Universities and other higher education entities are principally funded by the Ministry of Education and Research, while other ministries are responsible for funding specific institutes and industrial entities that undertake research. In addition to the ministries and the RCN, industry and academia participate in designing and reviewing high-level strategic RD&D plans, in developing programmes and in individual projects. Publicly funded demonstration programmes and projects are administered by several public agencies, such as Enova and Innovation Norway.
Enova SF is an entity owned by the Ministry of Climate and Environment. It supports projects that contribute to reduced GHG emissions, energy and climate technology development (Enova, 2018). As such, Enova supports new energy and climate technology in industry and transport, new technology for buildings of the future, and the introduction of new technologies. Through its GHG reduction projects, Enova supports more efficient energy consumption and increased production of “new” renewable energy. This is done through targeted programmes and support schemes. Within the area “new technology”, support from Enova is meant to contribute to risk relief for the first user, thereby contributing to the introduction of a new technology into the market. Enova provides funding for technology development for both small- and large-scale projects. Enova, the RCN and Innovation Norway co-operate closely on promoting investments along the “innovation chain”. Enova is also member of the Energi21 strategy board (see below).
Innovation Norway is an important instrument for innovation and development of Norwegian enterprises and industry. Innovation Norway stimulates profitable business development throughout Norway and supports companies in developing their competitive advantage and to enhance innovation. The programmes and services are intended to create more successful entrepreneurs, more enterprises with capacity for growth and more innovative business clusters. Innovation Norway covers all sectors, including energy. It helps promote technology through international networking services, general business advice services and aid for third-party technology verification.
The state enterprise Gassnova contributes to developing and finding solutions to ensure that technology for the capture, transport and storage of CO2 can be implemented and become an effective climate measure. The RCN and Gassnova together administer the CLIMIT programme, through which Gassnova grants projects financial support for development, demonstration and piloting of CCS technologies. Gassnova also manages the state’s interest in the CO2 Technology Centre Mongstad, which was established to create an arena for long-term and targeted development, testing and qualification of technology for CO2 capture. Moreover, Gassnova has experience with planning full-scale CCS from the now finalised projects at Kårstø and Mongstad, and it now plays an important
IEA.
All
right
s re
serv
ed.
6. ENERGY RESEARCH, DEVELOPMENT AND INNOVATION
89
ENER
GY
SYST
EM T
RAN
SFO
RM
ATIO
N role in supporting the development of the Longship CCS project (see Chapter 3).
Gassnova also plays an important role in helping to ensure that the experience and knowledge from CCS projects in Norway benefit the entire world. Gassnova furthermore advises authorities on issues relating to CCS.
Energy innovation priorities and guiding documents Energy innovation is an important part of Norway’s Long-term Plan for Research and Higher Education (Norway, Ministry of Education and Research, 2018). Out of the five priority areas, two relate to energy innovation: 1) seas and oceans (oil and gas); and 2) climate, the environment and clean energy (energy and CCS).
The long-term plan outlines three specific plans for escalating appropriations: 1) the technology initiative; 2) RD&D on renewal and restructuring in the business sector; and 3) enhanced quality in higher education. Each category has focus areas of relevance, such as:
enabling and industrial technologies, especially basic information, communications and technology (ICT) research and ICT security
increased admission capacity for students in technology subjects
technologies that will contribute to the green shift in the economy
measures for increased commercialisation, research-based innovation and industry-oriented research.
Energy sector research policies and targets are developed by the MPE based on input from the OG21 (Oil and Gas for the 21st Century) and Energi21 strategies, with a particular view to ensure industry relevance. Input from these processes guide priorities for RD&D grants and support measures administered by the RCN, Gassnova and Enova. To supplement the advice and input from the OG21 and Energi21, the MPE also draws on information and advice from other sources, such as the RCN, the IEA, consultancies and individual RD&D players in the energy sector.
Recently, innovation policy changes have been focused on four areas: 1) reducing the time from idea to market introduction (PILOT-E scheme); 2) taking a broader value chain approach (the hydrogen road map and Longship CCS project); 3) an increased focus on cross-sectoral climate measures; and 4) enhancing value creation and environmental performance through digital technologies. The changes are expected to achieve a faster and more effective energy transition towards net zero, as well as improve the country’s competitive edge in the petroleum and energy industries.
Energi21 strategy The Energi21 strategic body is an independent advisory body established by the MPE in 2008 to provide advice to authorities on the organisation of public allocations to research, both thematically and financially. The MPE uses the Energi21 strategy as a basis for guiding its allocations to research, development, demonstration and commercialisation of new climate-friendly energy technologies (Energi21, 2021).
The 2018 Energi21 strategy identifies three objectives: 1) increased value creation on the basis of national energy resources and utilisation of energy; 2) energy restructuring with
IEA.
All
right
s re
serv
ed.
6. ENERGY RESEARCH, DEVELOPMENT AND INNOVATION
90
the development of new technology to limit energy consumption and GHG emissions while efficiently producing environmentally friendly energy; and 3) the development of internationally competitive industry and expertise in the energy sector (Energi21, 2018).
In its fourth national research strategy from 2018, the Energi21 board recommended a substantial increase in energy technology investment and efforts targeting the following key areas:
digitalised and integrated energy systems
climate-friendly energy technologies for maritime transport
solar power for an international market
offshore wind power for an international market
hydropower as the backbone of Norwegian energy supply
climate-friendly and energy-efficient industry, including CCS.
The Energi21 strategy is now under revision; a new strategy is expected in June 2022.
OG21 strategy The OG21 was established in 2001 and is organised under a board appointed by the MPE and a secretariat. The OG21 is meant to enhance value creation on the NCS and to promote the export of Norwegian oil and gas technology (Norway, Ministry of Petroleum and Energy, 2021a).
The Norwegian Petroleum Directorate estimates that less than half of the resources on the NCS have been exploited. A considerable part of the resources has yet to be discovered. One of the biggest challenges facing the petroleum sector is to develop new, efficient exploration technologies to discover new fields worth developing. Another challenge is how to enhance recovery of existing fields. At the same time, the oil and gas industry strives to reduce its environmental footprint and continuously improve safety performance. Research and technology will be crucial for both developing resources on the NCS and maintaining the international competitiveness of Norwegian companies within the industry (Norway, 2021a).
The OG21 brings together oil companies, universities, research institutes, suppliers, regulators and public bodies to develop and maintain a national petroleum technology strategy for Norway (OG21, 2021a).
In its latest report from 2021, the OG21 notes that research, technology development and innovation within eight technology areas are especially important to ensure the cost and environmental competitiveness of Norway’s petroleum sector: 1) improved sub-surface understanding; 2) cost-efficient drilling and plugging and abandonment of wells; 3) utilising existing infrastructure efficiently; 4) unmanned facilities and subsea tie-back solutions; 5) energy efficiency and cost-efficient electrification; 6) CCS; 7) world-leading health, safety and environmental performance; and 8) digitalisation (OG21, 2021b).
IEA.
All
right
s re
serv
ed.
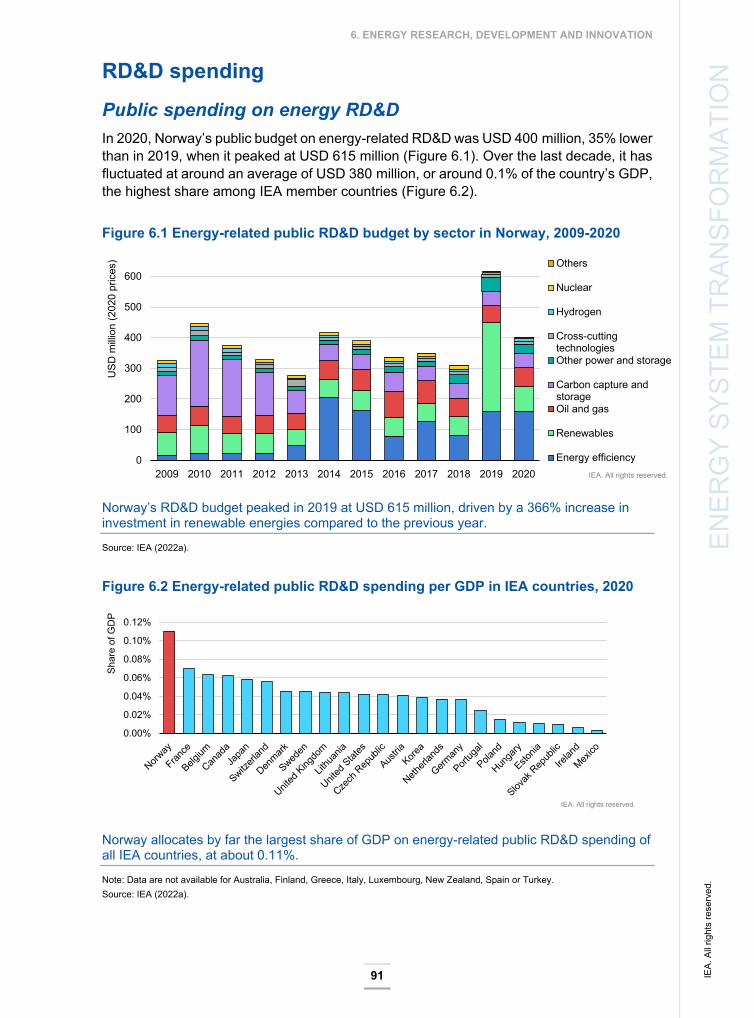
6. ENERGY RESEARCH, DEVELOPMENT AND INNOVATION
91
ENER
GY
SYST
EM T
RAN
SFO
RM
ATIO
N RD&D spending
Public spending on energy RD&D In 2020, Norway’s public budget on energy-related RD&D was USD 400 million, 35% lower than in 2019, when it peaked at USD 615 million (Figure 6.1). Over the last decade, it has fluctuated at around an average of USD 380 million, or around 0.1% of the country’s GDP, the highest share among IEA member countries (Figure 6.2).
Figure 6.1 Energy-related public RD&D budget by sector in Norway, 2009-2020
Norway’s RD&D budget peaked in 2019 at USD 615 million, driven by a 366% increase in investment in renewable energies compared to the previous year.
Source: IEA (2022a).
Figure 6.2 Energy-related public RD&D spending per GDP in IEA countries, 2020
Norway allocates by far the largest share of GDP on energy-related public RD&D spending of all IEA countries, at about 0.11%.
Note: Data are not available for Australia, Finland, Greece, Italy, Luxembourg, New Zealand, Spain or Turkey. Source: IEA (2022a).
0
100
200
300
400
500
600
2009 2010 2011 2012 2013 2014 2015 2016 2017 2018 2019 2020
USD
milli
on (2
020
pric
es) Others
Nuclear
Hydrogen
Cross-cuttingtechnologiesOther power and storage
Carbon capture andstorageOil and gas
Renewables
Energy efficiencyIEA. All rights reserved.
0.00%
0.02%
0.04%
0.06%
0.08%
0.10%
0.12%
Shar
e of
GD
P
IEA. All rights reserved.
IEA.
All
right
s re
serv
ed.

6. ENERGY RESEARCH, DEVELOPMENT AND INNOVATION
92
Energy efficiency accounted for the largest share (40%) of the public budget on energy-related RD&D in 2020. Since 2014, spending on energy efficiency has been significantly higher than in previous years. The energy efficiency budget is split between the industry (40%), transport (34%) and buildings (12%) sectors. In 2020, Norway had the highest share of energy efficiency RD&D budget with respect to GDP among IEA member countries (Figure 6.3).
The budget allocated to renewables accounted for 20% of the total in 2020. The renewables’ budget peaked in 2019, at USD 290 million, almost five times historical values, due to an investment of about USD 240 million in offshore wind technologies. In 2020, the budget for renewables RD&D dropped back to USD 81 million, mainly for biofuels (36%) and solar PV (12%). In 2020, Norway had the highest share of renewables RD&D budget with respect to GDP among IEA member countries.
The third- and fourth-largest sectors for RD&D spending were oil and gas (15%) and CCS (12%). While the budget for oil and gas RD&D fluctuated between USD 49 million in 2011 and USD 82 million in 2016, the budget for CCS significantly decreased by 78% between 2010 and 2020. Still, in 2020, Norway had the highest share of CCS RD&D budget with respect to GDP among IEA member countries.
Figure 6.3 Top 10 countries for selected technologies in RD&D budget per thousand units of GDP, 2020
Renewables, carbon capture and storage, and energy efficiency are sectors in which Norway is a leader among IEA countries in RD&D spending.
Source: IEA (2022a).
The government has set specific goals for the overall national level of RD&D: public spending for RD&D must amount to 1% of GDP and RD&D spending in the private sector should make up 2% of GDP. Since 2016, the government’s spending levels have exceeded 1%, but the private sector’s spending has fallen short of 2%.
0 0.05 0.1 0.15 0.2 0.25
CanadaGermany
JapanFranceFinland
SwedenKorea
DenmarkSwitzerland
Norway
RDD budget per thousand units of GDP0 0.1 0.2 0.3 0.4 0.5
FranceJapan
LithuaniaNetherlands
AustriaCanadaSwedenBelgiumFinlandNorway
RDD budget per thousand units of GDP
0 0.02 0.04 0.06 0.08 0.1 0.12 0.14
SwitzerlandUnited States
AustraliaFrance
United KingdomDenmark
JapanEstoniaCanadaNorway
RDD budget per thousand units of GDP0 0.01 0.02 0.03 0.04 0.05 0.06 0.07
United KingdomCzech Republic
NetherlandsCanadaNorwayAustriaFranceKorea
SwitzerlandJapan
RDD budget per thousand units of GDP
Hydrogen and fuel cells
Energy Efficiency
Renewables
Carbon Capture & Storage
IEA.
All
right
s re
serv
ed.
6. ENERGY RESEARCH, DEVELOPMENT AND INNOVATION
93
ENER
GY
SYST
EM T
RAN
SFO
RM
ATIO
N The government, as a rule, does not set any specific targets for RD&D spending levels for
specific sectors, including energy, though various ministries dedicate specific budgets for RD&D programmes in their respective sectors.
All programmes administered by the RCN have industry relevance as a selection criterion. The RD&D grants from the RCN are mainly used for projects in which private enterprises are partners or lead, accounting for about 80% of grants for the energy and petroleum sector. Projects run by and for academia represent 20% of grant volume.
To augment technology transfer, the RCN often organises joint calls across industries and sectors.
Research centres are all based on the principle of public-private partnerships. The status and funding to set up a centre is granted to an academic institution or research institute, but they are obliged to bring industry partners and technology users on board to secure additional funding and complementary expertise. The share of private funding for the centres is commonly about 25% of the total budget.
In 2020, start-ups featured strongly under Innovation Norway’s funding, with 26% of its primary lines of funding going to companies less than five years old. For start-ups in particular, support focuses on high technology and cutting-edge science and engineering. In recent years, the share of funding directed to environmental issues has grown, including renewable energy and energy systems more broadly. Innovation Norway has three main ways of supporting start-ups financially: 1) start-up grants and loans; 3) environmental technology grants; and 3) innovation contracts (IEA, 2022b).
The EU’s ninth framework programme for research and innovation, Horizon Europe, started on 1 January 2021 with a proposed total budget of EUR 94 billion. Norwegian actors can apply for funding on an equal footing with companies, public enterprises and research institutions in EU member states. As of November 2019, Norway participated in 5.2% of all Horizon 2020 projects (RCN, 2019a). The EEA and Norway Grants scheme issues calls for proposals for bilateral projects in which Norwegian partners can participate. The main applicant must be from the country in question, but there is a requirement of at least one Norwegian partner in each project. Norwegian companies, the public sector and research organisations are all relevant project partners (RCN, 2019b).
Covid-19 spending impacts In 2020, due to the consequences of the Covid-19 pandemic, the budget for petroleum and energy RD&D under the MPE was boosted to ensure that the activity level of the industry and in research institutes could be maintained. This RD&D stimulus package was administered by the RCN. For the energy sector, hydrogen and wind power were given priority. For the petroleum sector, a larger part was allocated for demonstration projects as these projects involve to a greater extent the supply industry, which was hit particularly hard both by the pandemic and the ensuing oil price decline.
Specifically, the research programme ENERGIX (see below) was granted an additional NOK 120 million (EUR 12 million), prioritising hydrogen. In addition, the new research centre FME was granted NOK 15 million (EUR 1.5 million) for eight years, bringing its total allocation to NOK 120 million (EUR 12 million). One of the centre’s main focus areas is offshore wind. For the petroleum sector, funding was increased by NOK 130 million (EUR 13 million): the research programme PETROMAKS2 was granted an additional
IEA.
All
right
s re
serv
ed.
6. ENERGY RESEARCH, DEVELOPMENT AND INNOVATION
94
NOK 50 million, while the research and demonstration programme DEMO 2000 was granted an additional NOK 80 million. The government also provided grants to Norwegian Energy Partners (Norwep) to compensate for loss of income in 2020 as well as to implement new measures for the supply industry given the challenging situation of the Covid-19 pandemic and coinciding fall in oil prices. Norwep was granted an extra NOK 20 million, bringing its total support to NOK 54 million. In addition, the Federation of Norwegian Industries was granted NOK 10 million for a project on delivery models for offshore wind.
ENERGIX programme ENERGIX is the principal Norwegian research programme on clean energy. The programme is managed by the RCN and is a key instrument in the implementation of Energi21, as well as for achieving other energy policy objectives. It provides grant-based funding for research on renewable energy, the efficient use of energy, energy systems and energy policy. The ENERGIX programme has advanced RD&D in the electrification of both maritime and ground transport, especially with the innovative PILOT-E scheme launched in 2016 (IEA, 2021).
CLIMIT programme The MPE established CLIMIT in 2005 to support the development of CCS technology for gas power plants. The scheme was expanded to include power generation based on all fossil fuels in 2008 and industrial emissions in 2010. From 2021, the scheme includes support for all possible CO2 sources. CLIMIT also funds R&D in the production of hydrogen from natural gas combined with CCS (Norway, Ministry of Petroleum and Energy, and Ministry of Climate and Environment, 2020).
CLIMIT’s primary objective is to contribute to the development of technology and solutions for CCS by providing financial support to projects that will:
develop knowledge, expertise, technology and solutions that can contribute towards cost reductions and international deployment of CCS
leverage national advantages and develop new technology and service concepts with commercial and international potential.
The programme consists of two support schemes: CLIMIT RD&D and CLIMIT Demo, run by the RCN and Gassnova, respectively. The programme is directed towards companies, research institutes and academia.
PILOT-E scheme Norway’s PILOT-E scheme is a funding scheme for the Norwegian business sector launched as a collaboration between the RCN, Innovation Norway and Enova SF. It works as a “fast-track” for technology development through the various stages of research, from idea to market (PILOT-E, 2015).
The objective of the scheme is to promote more rapid development and deployment of new, environmentally friendly energy technology products and services to help reduce emissions both in Norway and internationally. Calls for proposals under the PILOT-E scheme are targeted toward specific societal challenges, and the scheme is a good fit for larger consortia that address complex challenges ranging from research activity to
IEA.
All
right
s re
serv
ed.
6. ENERGY RESEARCH, DEVELOPMENT AND INNOVATION
95
ENER
GY
SYST
EM T
RAN
SFO
RM
ATIO
N commercial realisation. PILOT-E is designed to support participants throughout the entire
technology development pathway, from concept to market (PILOT-E, 2015).
The first call for proposals under the PILOT-E scheme was issued in 2016. Calls under the scheme have targeted the following thematic areas: zero emissions maritime transport; zero emissions land-based goods transport; the energy system of the digital age; zero emissions maritime transport 2.0; sustainable industrial processes for the future; a zero emissions hydrogen value chain; and zero emissions construction and facilities (PILOT-E, 2015).
The RCN, Innovation Norway and Enova combine multiple policy instruments and areas of expertise to provide comprehensive support to selected project consortia all along the innovation cycle. The RCN provides research grants for consortia’s projects; Innovation Norway offers innovation subsidies, development grants, risk loans and equity for companies in the consortia; and Enova provides financial support for technology development and market introduction of new climate and energy technology.
PETROMAKS 2 The PETROMAKS 2 programme is administered by the RCN, and includes both strategic basic research and competence development as well as applied research and technology development. The main goal of the programme is to contribute to increased value creation by developing and utilising Norwegian petroleum resources within an environmentally sound framework. The programme is meant to contribute to achieving goals in the industry’s own strategy for research and technology development, the OG21 (Norway, Ministry of Petroleum and Energy, 2021b).
DEMO 2000 DEMO 2000 is a research programme run by the RCN that aims to help reduce costs and risks for the industry and commercialise new technology through support for piloting and demonstration. DEMO 2000 is aimed at projects where new technology can be demonstrated through pilots and field trials, and is particularly related to the challenge of bringing research-based innovations in the Norwegian petroleum industry closer to market (Norway, Ministry of Petroleum and Energy, 2021c).
The pilot projects are usually characterised by close collaboration between supplier companies, research institutions and oil companies. Through qualification of technology for petroleum activities on the NCS, the programme will also contribute to the export of Norwegian technology (Norway, Ministry of Petroleum and Energy, 2021c).
Private spending on energy RD&D The RCN, on behalf of the MPE, collects statistics and information on oil companies’ (operators on the NCS) RD&D spending related to their upstream activities. Both the Nordic Institute for Studies of Innovation, Research and Education and Statistics Norway provide data on private RD&D spending within different energy industry categories. These sources are consulted to estimate private spending levels.
Chapter 2.6 of the white paper “Energy for work” (Meld. St. 26 [2020-2021]) provides the following as to private spending levels: oil company RD&D spending in the period of 2014-2019 varied in the range of NOK 3-4 billion (EUR 0.3-0.4 billion) annually. Related
IEA.
All
right
s re
serv
ed.

6. ENERGY RESEARCH, DEVELOPMENT AND INNOVATION
96
oil services industry spending is in the same range according to Statistics Norway. Industry sector RD&D spending on energy, including CCS, is in the range of NOK 2-3 billion (EUR 0.2-0.3 billion) annually for the period 2015-2019, according to Statistics Norway.
Monitoring, evaluation and tracking of results The RCN has the main responsibility for collecting data on energy innovation. In this regard, it plays a role in collecting data for annual reporting to the IEA on public funding levels and technology categories. In addition, the RCN provides an aggregated annual report to the Ministry of Education and Research covering all sectors as well as a supplementary annual report that addresses the respective ministries that allocate RD&D funding. The supplementary annual report is designed to meet more specific needs for sectoral information and allows the MPE to see if policy goals are met. It also contains project examples as well as statistics that allow progress to be tracked on key metrics, such as patents and start-ups.
All research centres, both for environmentally friendly energies (FME) and petroleum (PETROCENTER), are subject to mid-term evaluations after five years (the maximum running time is eight years). These evaluations are administered by the RCN but executed in collaboration with international expert teams. The reports contain information on key metrics and objectives.
Similar studies are undertaken for all programmes in the energy and petroleum portfolio, including CCS.
Lately, the government has given priority to data collection that highlights the effects and impacts of RD&D activities. In the field of energy, the RCN commissioned two reports: the Impello Report on Clean Energy (2018) and the Rystad Report on Petroleum (2020). The Rystad report found that projects supported by the RCN in the period 2008-18 triggered an increase in reserves of around 890 million barrels of oil equivalent and additional production of about 100 million barrels (University of Stavanger, 2020).
The MPE has worked with the RCN on the preparatory phase to identify key performance indicators for actual RD&D impact.
The findings of monitoring and evaluation processes are used as input to adjust policies, but also to support arguments for sustaining or increasing government RD&D funding levels in the state budget.
Noteworthy RD&D projects Hywind Tampen: Hywind Tampen is an 88 MW floating wind power project intended to provide electricity for the Snorre and Gullfaks offshore field operations in the Norwegian North Sea. Hywind Tampen will be the world’s largest floating offshore wind farm and the world’s first to power offshore oil and gas platforms. The project represents a direct transfer of technology from offshore oil and gas technologies to renewables. Hywind Tampen will be a test bed for further development of floating wind, exploring the use of new and larger turbines, installation methods, simplified moorings, concrete substructures and integration
IEA.
All
right
s re
serv
ed.

6. ENERGY RESEARCH, DEVELOPMENT AND INNOVATION
97
ENER
GY
SYST
EM T
RAN
SFO
RM
ATIO
N between gas and wind power generation systems. The floating wind farm will consist of
11 wind turbines based on one of Equinor’s floating offshore wind technologies, Hywind.
MF Hydra: In the summer of 2021, the world’s first passenger ferry with hydrogen as fuel started sailing the route Hjelmeland-Skipavik-Nesvik in Norway. The ferry is 82.4 metres long with a capacity of up to 300 passengers and 80 cars. The company, Norled, has noted that the fuel cell-powered ferry is expected to reduce its annual carbon emissions by up to 95%. Research and innovation within the maritime sector have been a long-term priority and a number of calls have been launched in recent years, particularly within the PILOT-E programme. The ENERGIX programme also finances an associated project where the overall idea is to build a full-scale national hydrogen infrastructure to secure a reliable supply chain of liquid hydrogen to maritime applications.
Aasgard Subsea: In September 2015, Aasgard became the world’s first subsea gas compression facility to commence operation. In 2020, the technology from this project became one of Equinor’s most important measures for delivering additional volumes from existing fields on the NCS. Subsea processing, and gas compression in particular, are important advances to develop fields in deep waters and harsh environments. Subsea compression with its building blocks is one of the technology areas that has received funding from both PETROMAKS and DEMO 2000.
Robotic Drilling Systems: The RCN’s petroleum programmes have supported the development of this game-changing drill-floor solution consisting of robotic technology for fully unmanned drill-floor operations. The solutions offer benefits in terms of energy savings, cost reductions and safety improvements. The Stavanger-based company Robotic Drilling Systems (RDS) started out as a company specialised in drilling automation. From 2008, it received equity funding from commercial entities in Norway, including Equinor. In 2017, the US company Nabors acquired 100% of the shares in RDS and found an industrial player that can continue to develop and sell the technology, now named Canrig, for both onshore and offshore rigs.
International collaboration Participation in international RD&D co-operation in the field of energy and petroleum is a high priority and is an important supplement to Norwegian national research. Norway participates primarily in co-operation activities within the EU, through the IEA and at the Nordic level. Norway also participates in bilateral co-operation with several countries as well as in large multinational co-operation fora. Among these are the European Strategic Energy Technology Plan (SET Plan), Horizon Europe, Nordic Energy Research, the Carbon Sequestration Leadership Forum, a bilateral memorandum of understanding between Norway and the United States, and BN21 (Brazil-Norway in the 21st Century).
Norway also regards the IEA’s technology collaboration programmes as a valuable add-on to national efforts because they foster co-operation and information exchange between scientists and RD&D policy makers within a global framework. Norway participates in 20 out of the IEA’s 38 technology collaboration programmes.
Norway was one of the first countries to join Mission Innovation back in 2015. The focus in the first five-year period has mainly been on the ambition to double public investment in research and innovation of climate-friendly energy technologies, as well as information
IEA.
All
right
s re
serv
ed.
6. ENERGY RESEARCH, DEVELOPMENT AND INNOVATION
98
exchange and co-operation between member countries. Through substantial public investment, especially in CCS technologies and offshore floating wind, the doubling target was met before the end of the initial period. Furthermore, Norway participated in some of the Innovation Challenges, though not in a leading capacity.
At the Mission Innovation Ministerial hosted by Saudi Arabia in 2020, Norway announced its intention to join the more ambitious Mission Innovation 2.0. With the new mission-oriented approach, Norway has chosen to participate in three of the missions chosen by member countries. Together with Denmark and the United States, Norway will play an active role as co-lead of the mission on zero emissions shipping with the goal for at least 5% of the global deep-sea fleet to run on zero emissions fuel by 2030. Furthermore, Norway has also decided to support the clean hydrogen mission as one of the core coalition members, and the carbon dioxide removal mission as a member.
Norway also actively participates in the Clean Energy Ministerial (CEM) as a member of the following initiatives and campaigns: International Smart Grid Action Network, Electric Vehicle Initiative, EV 30@30 Campaign, Drive to Zero, Equal by 30 Campaign, the CEM Hydrogen Initiative, and the CEM CCUS Initiative. Norway is a co-lead of the CEM CCUS Initiative.
Assessment In 2020, Norway’s public budget on energy-related research, development and demonstration was USD 400 million. Over the last decade, it has fluctuated at around an average of USD 380 million, or around 0.1% of the country’s GDP, the highest share among IEA member countries.
Energy efficiency RD&D projects accounted for the largest share (40%) of the public budget on energy-related RD&D in 2020, followed by renewables (20%), oil and gas (15%), and carbon capture and storage (12%). In 2020, Norway had the highest share of energy efficiency, renewables and CCS RD&D budget with respect to GDP among IEA member countries.
The government has set specific goals for the overall national level of RD&D, whereby public spending for RD&D must amount to 1% of GDP and private RD&D spending should make up 2% of GDP. Since 2016, the government’s spending levels have exceeded 1%, but the private sector’s spending has fallen short of 2%. The government does not set any specific targets for RD&D spending levels for sectors, including energy.
Norway’s overall public spending on energy RD&D is strong. As Norway collects data on and evaluates its RD&D projects, it should also assess whether it is getting good value for money based on costs and outcomes.
Of the five grand challenges that the government wants to address with innovation as outlined in Norway's Long-term Plan for Research and Higher Education, two are focused on energy innovation. To meet these challenges in energy, Norway has sectoral RD&D strategies that prioritise certain technology areas within the grand challenges, as reflected in the OG21 and Energi21 strategies, as well as some cross-cutting plans for ensuring the right research infrastructure and skills.
IEA.
All
right
s re
serv
ed.
6. ENERGY RESEARCH, DEVELOPMENT AND INNOVATION
99
ENER
GY
SYST
EM T
RAN
SFO
RM
ATIO
N When addressing different technology priorities, the policy toolbox has recently evolved to
include programmes such as PILOT-E and DEMO 2000, which have a more targeted focus on bringing specific technologies to market.
Participation in international RD&D co-operation in the field of energy and petroleum is a high priority and an important supplement to Norwegian national research. Norway participates primarily in co-operation activities within the EU, through the IEA (Norway participates in 20 of the IEA’s 38 technology collaboration programmes) and at the Nordic level. Norway also participates in bilateral co-operation with several countries as well as in large multinational co-operation fora.
Norway conducts its energy RD&D activities with a high degree of ambition. Government funding for energy RD&D has been at an exceptionally high level for years, although variability between years has increased. This makes Norway a leading country in public spending on energy RD&D per unit of GDP. The IEA acknowledges the strong support from the government and encourages it to maintain it at continuously high levels.
In contrast to public RD&D funding, private spending is stagnating at a lower level. However, for future-oriented concepts and technologies to be successfully implemented in the market, there needs to be a strong commitment on the part of private companies, which also bear part of the risks. The government should therefore identify and implement policies to motivate increased private investment in RD&D.
Most RD&D programmes are subject to strong competition among stakeholders and, overall, there are more submissions of high quality relative to funds available. However, there are also some important areas where more applications for funding would be welcome (e.g. energy efficiency in buildings sector). The government should therefore provide appropriate measures to encourage potential applicants to strengthen work in these crucial technology areas.
Given that the concept of RD&D support is based on the Energi21 and OG21 strategies, it is closely tied to political goals. Both strategies have recently been updated and expanded to include new topics. It was recognised that many technological issues cannot be considered in isolation. Rather, societal, market, environmental and regulatory aspects must also be considered in the future. The IEA emphasises their importance and encourages the government to reflect this integrated view in strategic RD&D planning and individual calls. It is essential to ensure that all relevant stakeholders and authorities are involved in the process to maximise the outcome of interdisciplinary research.
The OG21 strategy underlines that the export-oriented Norwegian energy sector will face major challenges in the future due to global decarbonisation efforts. The IEA shares this view. As such, interdisciplinary RD&D programmes should address the question of how the transition from fossil fuels to sustainable value chains could look for society and the economy, considering different scenarios and time horizons.
Over the past years, Norway has spent a large part of its RD&D funds on energy efficiency. However, this topic is no longer a stand-alone objective for Enova, though it still contributes to the development of technologies that make the electrical grid more flexible. The revised Energi 21 strategy, on the other hand, has explicitly included this topic. In view of the still very high energy efficiency potential in Norway, the government should ensure that the topic continues to receive appropriate attention in the relevant RD&D programmes.
IEA.
All
right
s re
serv
ed.

6. ENERGY RESEARCH, DEVELOPMENT AND INNOVATION
100
Norwegian RD&D programmes cover the entire innovation chain from basic research, applied research, pilot and demonstration to market launch. The PILOT-E scheme will enable industry to substantially shorten the time from idea to product once again. The IEA appreciates this approach. However, the government is encouraged to review the funding programmes to determine whether sufficient funds are available for all stages of innovation and whether the programmes offer the right form of support. In particular, too many good concepts are still likely to fall by the wayside in the transition from application-related research to a market-ready solution.
The Norwegian research landscape in the field of energy-related RD&D is well-positioned in terms of personnel and resources. The government supports the formation of thematic research centres (FME, PETROCENTER) and various participating technical universities and research institutions enjoy world renown in their field. At the same time, Norwegian research institutes are facing increasing competition from foreign institutes working on the same topics and attracting Norwegian researchers. To remain competitive in the long term and also be able to train enough young scientists, Norway should exploit its unique competence in certain research topics (e.g. floating offshore wind power, hydropower, carbon capture and storage, green shipping) and position itself even more strongly internationally.
Norway is well-represented in the IEA’s technology collaboration programmes and is also actively involved in the current EU Horizon Europe programme. To increase the quality and thus the success rate of submitted applications, researchers have appropriate funding instruments at their disposal. The IEA encourages the government to continue to support public and private organisations by enabling them to participate in the EU’s upcoming Clean Energy Transition Partnership and Driving Urban Transitions to a Sustainable Future initiatives.
Recommendations The government of Norway should:
Include societal, market, environmental and regulatory aspects as an integral part ofits RD&D strategy, and launch dedicated calls for interdisciplinary projects.
Ensure that the topic of energy efficiency continues to receive appropriate attention inrelevant RD&D programmes. Evaluation criteria should not only be based on reducinggreenhouse gas emissions, but also on energy saved.
Provide consistent and appropriate support for all stages of innovation, notably forcommercialisation and market opportunities abroad.
Build on the unique competencies of its RD&D institutions in specific innovation topics(e.g. floating offshore wind, hydropower, carbon capture and storage, green shipping),and aim for international leadership.
IEA.
All
right
s re
serv
ed.
6. ENERGY RESEARCH, DEVELOPMENT AND INNOVATION
101
ENER
GY
SYST
EM T
RAN
SFO
RM
ATIO
N References
Energi21 (2021), About Energi21 (web page), https://energi21.no/en
Energi21 (2018), Energi21 Strategy 2018, https://energi21.no/contentassets/c975aa7108c144fb9564fca312624639/energi21-strategy-2018.pdf
Enova (2018), About Enova (web page), https://enova.no/about-enova
Norway, Ministry of Petroleum and Energy (2021a), OG21 – Oil and gas in the 21st century (web page), https://www.regjeringen.no/en/topics/energy/energy-and-petroleum-research/og21--oil-and-gas-in-the-21st-century/id439227/#:~:text=OG21%20is%20to%20enhance%20value,strategy%20for%20oil%20and%20gas
Norway, Ministry of Petroleum and Energy, (2021b), PETROMAKS2 – large program for petroleum research (web page), https://www.regjeringen.no/en/topics/energy/energy-and-petroleum-research/petromaks2-stort-program-for-petroleumsforskning/id439228
Norway, Ministry of Petroleum and Energy, (2021c), DEMO 2000 (web page), https://www.regjeringen.no/en/topics/energy/energy-and-petroleum-research/demo-2000/id439220
Norway, Ministry of Petroleum and Energy, and Ministry of Climate and Environment (2020), The Norwegian Government’s Hydrogen Strategy, https://www.regjeringen.no/contentassets/8ffd54808d7e42e8bce81340b13b6b7d/hydrogenstrategien-engelsk.pdf
Norway, Ministry of Education and Research (2018), Long-Term Plan for Research and Higher Education 2019-2028, https://www.regjeringen.no/en/dokumenter/meld.-st.-4-20182019/id2614131/?ch=1
IEA (International Energy Agency) (2022a), Energy technology RD&D budgets (web page), https://www.iea.org/data-and-statistics/data-product/energy-technology-rd-and-d-budget-database-2
IEA (2022b), Innovation Norway (web page), https://iea.org/articles/innovation-norway
IEA (2021), ENERGIX Programme (web page), https://iea.org/policies/2311-energix-programme
OG21 (Oil and Gas for the 21st Century) (2021a), The OG21 Strategy – A new chapter (web page), https://og21.no/strategi-og-analyser/ny-og21-strategi-2021
OG21 (2021b), OG21: A New Chapter, https://og21.no/siteassets/figurer-og21-strategi-2021/og21-strategi_eng.pdf
PILOT-E (2015), Information in English (web page), https://enova.no/pilot-e/information-in-english
RCN (Research Council of Norway) (2019a), Research in Norway: Facts and Figures 2019, https://forskningsradet.no/siteassets/internasjonalt-innhold/research_in_norway_2019.pdf
RCN (2019b), International funding (web page), https://forskningsradet.no/en/apply-for-funding/international-funding
University of Stavanger (2020), Rystad: Increased value creation (web page), https://uis.no/en/rystad-increased-value-creation
IEA.
All
right
s re
serv
ed.

103
ENER
GY
SEC
UR
ITY
7. Electricity
Key data (2020) Electricity generation: 154.2 TWh (+25% since 2010), hydro 92%, wind power 6%, natural gas 1%, oil and bioenergy and waste combined 1%
Electricity net exports: 20.5 TWh
Electricity consumption: 133.7 TWh (+2% since 2010), buildings 51% (residential buildings 31%, service sector buildings 20%), industry 48%, transport 1%
Installed capacity: 38.9 GW (hydro 92%, wind 6.4%)
Overview Hydropower is a mainstay of the Norwegian electricity sector, accounting for 92% of production in 2020. A large increase in wind generation over the last decade led to an overall share of 98% zero emissions electricity generation in 2020.
Norway is also characterised by a high degree of electrification of the economy. Electricity demand in Norway has been on the rise since 2010, and is set to grow significantly in the coming decade, while Norway already has the highest per capita consumption of electricity globally. To achieve its long-term goal of climate neutrality, the government of Norway has been pursuing additional electrification of several sectors, including transport, industry and offshore hydrocarbons production. This will result in an almost 20% increase of consumption over the next decade, which is challenging as offshore wind development awaits a final regulatory framework and onshore wind generation faces permitting issues.
Norway’s electricity market is fully liberalised, but publicly owned companies are dominant players in electricity generation, wholesale supply, retail, and transmission and distribution.
Norway has historically been a net exporter of electricity, thanks to abundant interconnectivity with its neighbours and further afield. During winter peaks, the country relies on significant imports, which raises adequacy concerns for future market balancing.
Due to its high level of interconnection, Norway has been exposed to the jump in electricity prices seen across Europe in the second half 2021. The government introduced a multi-billion euro mechanism to reduce consumers’ bills in December 2021, but it is questionable whether the government can sustain this over a longer period. As Norway is divided into five pricing zones due to congestion on its transmission grid, high European prices are mostly felt in the southern, interconnected regions of the country, with prices at
IEA.
All
right
s re
serv
ed.
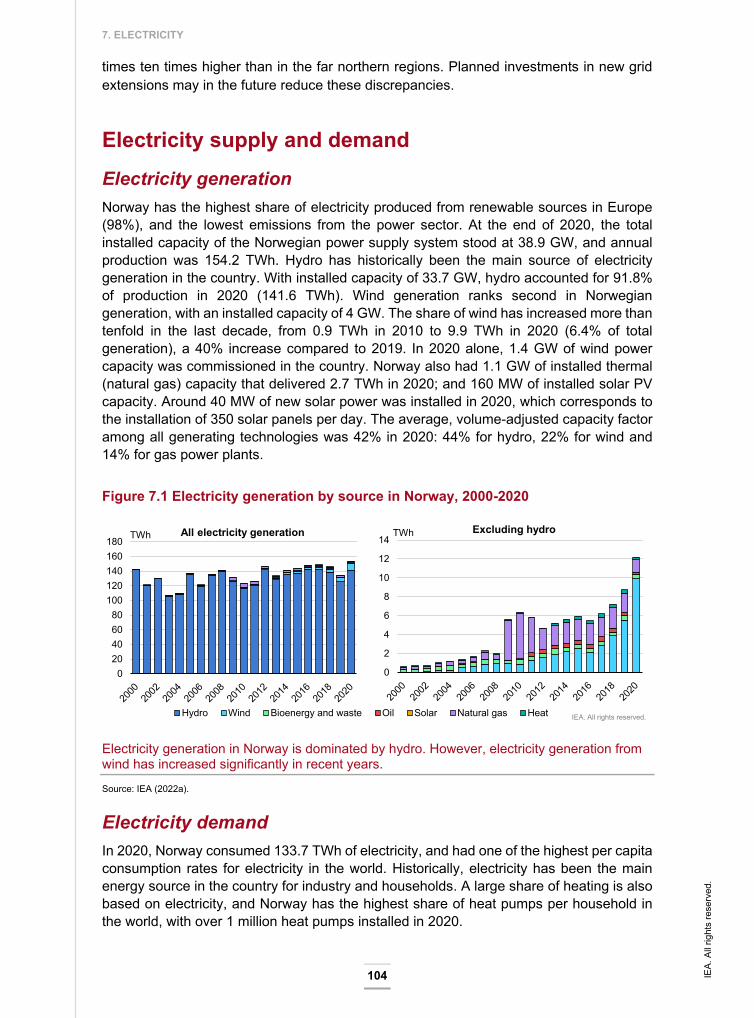
7. ELECTRICITY
104
times ten times higher than in the far northern regions. Planned investments in new grid extensions may in the future reduce these discrepancies.
Electricity supply and demand Electricity generation Norway has the highest share of electricity produced from renewable sources in Europe (98%), and the lowest emissions from the power sector. At the end of 2020, the total installed capacity of the Norwegian power supply system stood at 38.9 GW, and annual production was 154.2 TWh. Hydro has historically been the main source of electricity generation in the country. With installed capacity of 33.7 GW, hydro accounted for 91.8% of production in 2020 (141.6 TWh). Wind generation ranks second in Norwegian generation, with an installed capacity of 4 GW. The share of wind has increased more than tenfold in the last decade, from 0.9 TWh in 2010 to 9.9 TWh in 2020 (6.4% of total generation), a 40% increase compared to 2019. In 2020 alone, 1.4 GW of wind power capacity was commissioned in the country. Norway also had 1.1 GW of installed thermal (natural gas) capacity that delivered 2.7 TWh in 2020; and 160 MW of installed solar PV capacity. Around 40 MW of new solar power was installed in 2020, which corresponds to the installation of 350 solar panels per day. The average, volume-adjusted capacity factor among all generating technologies was 42% in 2020: 44% for hydro, 22% for wind and 14% for gas power plants.
Figure 7.1 Electricity generation by source in Norway, 2000-2020
Electricity generation in Norway is dominated by hydro. However, electricity generation from wind has increased significantly in recent years.
Source: IEA (2022a).
Electricity demand In 2020, Norway consumed 133.7 TWh of electricity, and had one of the highest per capita consumption rates for electricity in the world. Historically, electricity has been the main energy source in the country for industry and households. A large share of heating is also based on electricity, and Norway has the highest share of heat pumps per household in the world, with over 1 million heat pumps installed in 2020.
0 20 40 60 80
100 120 140 160180 TWh
Hydro Wind Bioenergy and waste Oil Solar Natural gas Heat
All electricity generation
0
2
4
6
8
10
12
14TWh
IEA. All rights reserved.
Excluding hydro
IEA.
All
right
s re
serv
ed.

7. ELECTRICITY
105
ENER
GY
SEC
UR
ITY The industry sector accounted for the largest share of electricity consumption, at 48%
in 2020, followed by residential buildings at 31%, services buildings at 20% and the transport sector at 1% (Figure 7.2). The shares of electricity consumption per sector have remained relatively stable over the years.
In its long-term analysis published in 2016, the Norwegian Energy Regulatory Authority (NVE-RME) estimated an increase in electricity demand in Norway from 130 TWh in 2015 to 143 TWh in 2030. However, in the NVE’s recent long-term analysis from 2021 (NVE, 2021a), it estimated much higher demand growth to 159 TWh in 2030 and 175 TWh in 2040, more than 30% over current levels.
Expected demand growth in Norway represents the largest incremental growth in electricity consumption among Nordic countries, and is mainly driven by increased electricity consumption in end-use sectors (transport, power-intensive industries, electrification of the oil and gas sector). Planned new industries such as data centres and gigafactories will also contribute to future demand growth, albeit from relatively low levels at present. The Norwegian government has been looking into possibilities for data centres and other large electricity users to offer waste heat from cooling servers to district heating systems whenever possible.
Figure 7.2 Electricity demand by sector in Norway, 2000-2020
Electricity is the main source of energy for both the industry and buildings sectors.
* Transport demand for electricity has increased from 0.6 TWh to 1.7 TWh and is barely visible at this scale.Source: IEA (2022b).
Electricity trade Norway is the largest electricity exporter in Europe with two historic years of exports: 24.97 TWh of exports in 2020 (20.5 TWh net) and 25.82 TWh of exports in 2021, up from a 10.1 TWh trade surplus in 2018. With that, already in 2020, Norway outpaced France, which has historically been the dominant electricity exporter on the continent. In 2019, exceptionally, imports were marginally greater than exports (12.353 TWh versus 12.309 TWh), as electricity generation from hydro was the lowest since 2011 due to lower water flows (Statistics Norway, 2022a). Between 2014 and 2018, net exports of electricity from Norway were stable and varied between 14.6 TWh and 16.4 TWh per year. There are wide variations in the market balance from year to year, generally due to fluctuating
0
20
40
60
80
100
120
140TWh
Transport*
Industry
Service sectorbuildings
Residentialbuildings
IEA. All rights reserved.
IEA.
All
right
s re
serv
ed.
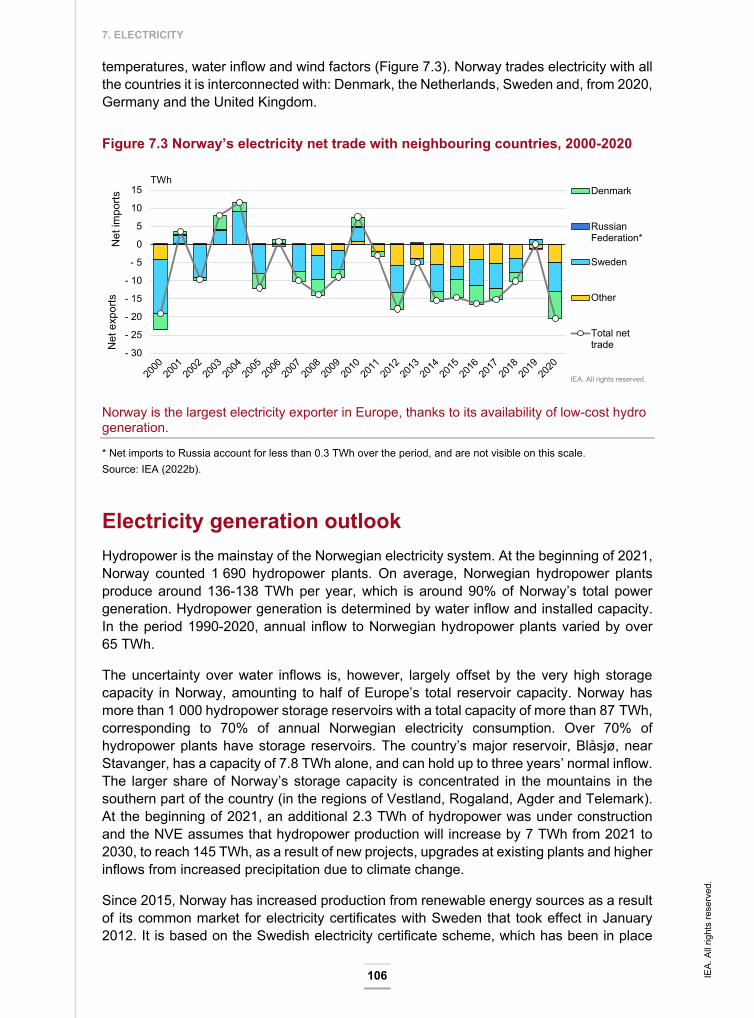
7. ELECTRICITY
106
temperatures, water inflow and wind factors (Figure 7.3). Norway trades electricity with all the countries it is interconnected with: Denmark, the Netherlands, Sweden and, from 2020, Germany and the United Kingdom.
Figure 7.3 Norway’s electricity net trade with neighbouring countries, 2000-2020
Norway is the largest electricity exporter in Europe, thanks to its availability of low-cost hydro generation.
* Net imports to Russia account for less than 0.3 TWh over the period, and are not visible on this scale. Source: IEA (2022b).
Electricity generation outlook Hydropower is the mainstay of the Norwegian electricity system. At the beginning of 2021, Norway counted 1 690 hydropower plants. On average, Norwegian hydropower plants produce around 136-138 TWh per year, which is around 90% of Norway’s total power generation. Hydropower generation is determined by water inflow and installed capacity. In the period 1990-2020, annual inflow to Norwegian hydropower plants varied by over 65 TWh.
The uncertainty over water inflows is, however, largely offset by the very high storage capacity in Norway, amounting to half of Europe’s total reservoir capacity. Norway has more than 1 000 hydropower storage reservoirs with a total capacity of more than 87 TWh, corresponding to 70% of annual Norwegian electricity consumption. Over 70% of hydropower plants have storage reservoirs. The country’s major reservoir, Blåsjø, near Stavanger, has a capacity of 7.8 TWh alone, and can hold up to three years’ normal inflow. The larger share of Norway’s storage capacity is concentrated in the mountains in the southern part of the country (in the regions of Vestland, Rogaland, Agder and Telemark). At the beginning of 2021, an additional 2.3 TWh of hydropower was under construction and the NVE assumes that hydropower production will increase by 7 TWh from 2021 to 2030, to reach 145 TWh, as a result of new projects, upgrades at existing plants and higher inflows from increased precipitation due to climate change.
Since 2015, Norway has increased production from renewable energy sources as a result of its common market for electricity certificates with Sweden that took effect in January 2012. It is based on the Swedish electricity certificate scheme, which has been in place
- 30
- 25
- 20
- 15
- 10
- 5
0
5
10
15TWh
Denmark
RussianFederation*
Sweden
Other
Total nettrade
IEA. All rights reserved.
Net
impo
rtsN
et e
xpor
ts
IEA.
All
right
s re
serv
ed.
7. ELECTRICITY
107
ENER
GY
SEC
UR
ITY since 2003. The goal of the common scheme was to increase annual renewable electricity
production in both countries by 28.4 TWh by the end of 2020. Through 2020, the scheme has contributed 45.1 TWh of new renewable production, exceeding its goal. Norway’s share was 16.6 TWh, with the largest share coming from wind power. The remaining 28.5 TWh was delivered by Sweden. While Sweden has set an additional goal of 18 TWh of renewable generation between 2020 and 2030, Norway has not set any new targets after 2020.
In recent years, onshore wind power development has increased, but the NVE assumes that there will not be an increase in onshore wind power until after 2030 as the licencing process for new wind power was suspended in April 2019 due to local opposition to projects. More recently, in April 2022, the government announced it would resume onshore wind licencing in municipalities that were supportive of installations (see Chapter 5).
Two areas in the Norwegian Sea have also been assigned for offshore wind power development, but the NVE assumes that they will not be realised before 2030. However, in February 2022, the government announced a major initiative to promote offshore wind power and to implement the first phase of wind power production in the areas of Sørlige Nordsjø II (seabed moored) and Utsira Nord (more complex floating wind turbines), with a capacity of up to 4.5 GW. The NVE was obliged to prepare a new study on the viability of large-scale offshore wind development in the area. In April 2022, the government decided to give Statnett responsibility for the overall planning of the offshore grid. The main model for awarding offshore areas is through a standard auction model for the seabed moored Sørlige Nordsjø II area, while qualitative criteria will be used in the allocation round of Utsira Nord to facilitate innovation and technological development of floating technology.
Solar PV has been primarily used as an electricity source for isolated houses, such as cabins. The NVE has estimated solar PV to further increase to 0.6 TWh in 2025 and to 1.5 TWh in 2030.
According to the NVE’s forecasts, thermal power generation will remain at low levels, mainly from smaller plants based on different types of fuels.
Transmission and distribution Statnett, owned by the MPE, is the only TSO in Norway and owns 98% of the transmission grid. The remainder is owned by 13 regional grid companies, from whom Statnett rents these parts of the grid. Statnett has been legally unbundled since 1992 and ownership has been unbundled since 2002. Statnett is a TSO in line with EU regulations. Statnett’s revenues are regulated by the NVE-RME. The NVE-RME also issues direct regulations, like the regulation on system responsibility, rules on quality of delivery, connection duties and tariffs.
Norway has a sizeable transmission network of more than 11 000 kilometres (km) due to its geographic length and the location of its hydropower stations. The country’s transmission grid is divided into four subsystems. Since 2015, Norway added 1 065 km of high-voltage lines and has several other projects ongoing to add additional high-voltage lines by 2026.
Surplus production in the north of the country that is constrained due to limited transmission capacity southwards and ample interconnections with Europe in the south
IEA.
All
right
s re
serv
ed.
7. ELECTRICITY
108
drive prices in southern Norway. Norway is divided into five bidding zones, and the lack of transmission capacity from north to south results at times in large price differences between the north and south of the country. Due to good interconnections, the prices in the south are linked to prices in continental Europe.
The previous government established a Grid Development Committee tasked with assessing options to reduce the amount of time spent on developing, case handling and building of grid infrastructure projects. The committee is also tasked with looking into economic principles for grid development when demand is very uncertain, as well as considering improvements in the grid connection process.
The Norwegian distribution network (230 volts [V] – 132 kilovolts [kV]) is classified as regional distribution (33-132 kV) and local distribution (230 V – 22 kV) for regulatory purposes. There are 86 DSOs that own and operate local distribution networks, while 68 of these also own and operate regional networks to varying extents. Municipalities and county authorities own most of the regional and distribution grids.
Legal and functional unbundling was introduced for DSOs with more than 100 000 customers in 2007. An amendment to the Energy Act in 2016 imposed legal and functional unbundling on all DSOs, irrespective of size. In 2020, it was decided to exempt DSOs with less than 10 000 customers from functional unbundling, which entered into force in March 2021. Today, all DSOs are legally unbundled and DSOs with more than 10 000 customers are also functionally unbundled. In 2020, around 8% of final customers were connected to DSOs exempt from functional unbundling.
Cross-border interconnections
Norway is part of a common synchronous area sharing the same frequency with Finland, Sweden and eastern Denmark. Additionally, it has direct interconnections to the Netherlands and Russia.
Since 2015, Norway’s total cross-border capacity increased from around 6 200 MW to 8 950 MW (export) and 9 245 MW (import). The increase was due to two new additions: NordLink to Germany and the North Sea Link to England. NordLink was operational from December 2020, with a capacity of 1 400 MW, and the North Sea Link started operations from October 2021, with a similar capacity of 1 400 MW. Apart from these, Norway has cross-border interconnections with Denmark, Finland, the Netherlands, Russia and Sweden.
IEA.
All
right
s re
serv
ed.
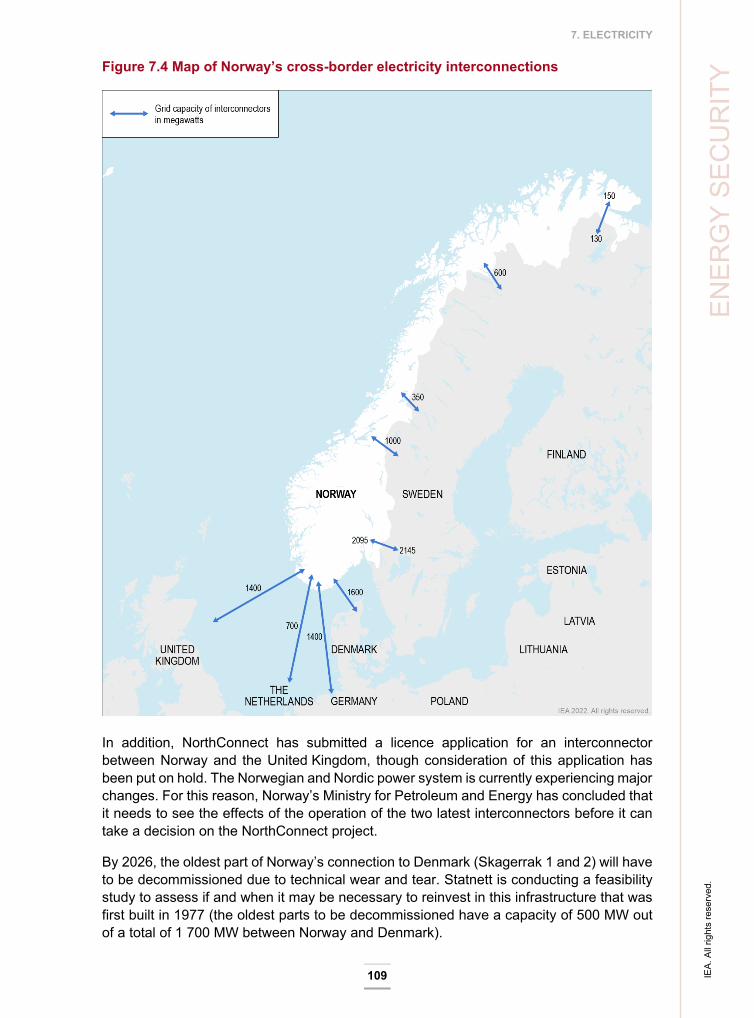
7. ELECTRICITY
109
ENER
GY
SEC
UR
ITY Figure 7.4 Map of Norway’s cross-border electricity interconnections
In addition, NorthConnect has submitted a licence application for an interconnector between Norway and the United Kingdom, though consideration of this application has been put on hold. The Norwegian and Nordic power system is currently experiencing major changes. For this reason, Norway’s Ministry for Petroleum and Energy has concluded that it needs to see the effects of the operation of the two latest interconnectors before it can take a decision on the NorthConnect project.
By 2026, the oldest part of Norway’s connection to Denmark (Skagerrak 1 and 2) will have to be decommissioned due to technical wear and tear. Statnett is conducting a feasibility study to assess if and when it may be necessary to reinvest in this infrastructure that was first built in 1977 (the oldest parts to be decommissioned have a capacity of 500 MW out of a total of 1 700 MW between Norway and Denmark).
IEA.
All
right
s re
serv
ed.

7. ELECTRICITY
110
Statnett is also considering improving the use of the capacity to Finland. The existing connection is a very long 220 kV AC line with limited capacity. Furthermore, the grid in northern Norway consists of weak 132 kV connections. Consequently, controlling and limiting the flow on the line between Finland and Norway is very difficult, and is a challenge for operations. According to Statnett’s study, the best option to improve the capacity seems to be a back-to-back high-voltage, direct current line. The capacity of such a solution could be in the range of 100-150 MW and could be implemented around 2025 at the earliest.
Due to a significant increase in domestic consumption forecasted over the coming years, Statnett’s short-term market analysis for 2021-2026 shows that the Norwegian power surplus may be reduced to 3 TWh in 2026 and trigger the need for more generation investments and more transmission capacity. At the same time, in the Nordic countries as a whole, power production capacity will continue to increase. New wind power, particularly in Sweden, helps to keep the Nordic power balance stable, even with significant power consumption growth of around 40 TWh. In Sweden, the power surplus will increase significantly from around 25 TWh today to around 40 TWh in 2026, and the surplus in northern Sweden will be as much as 60 TWh (Statnett, 2021). Cross-border trade capacity puts Norway in a position to benefit from market developments in the region, without risking supply shortages.
Statnett applies the Net Transfer Capacity Principle when calculating cross-zonal capacities, which is based on simplified, bilateral co-ordination among TSOs in the regions. Based on regulatory changes of August 2021, a new method for congestion management, using flow-based capacity allocation, will be applied in 2023.
Market structure and regulation The Norwegian Energy Act is based on the principle that electricity production and trading should be market-based. While electricity transmission and distribution is a natural monopoly, and not subject to competition, grid operations are strictly regulated by the state.
The MPE has the overall responsibility for managing power supply in Norway, for which operative responsibility is delegated to the NVE. The Energy Act and the Natural Gas Act provide for the legal independence of the NVE-RME and the Energy Appeal Body.
Norway’s power market can be divided into wholesale and end-user markets. Large volumes are bought and sold in the wholesale market by power producers, brokers, power suppliers, energy companies and large industrial customers. Power suppliers trade on behalf of small and medium-sized end users and small-scale businesses and industry.
The vast majority of generation in Norway is publicly owned by either the state or municipalities. Under the 1917 Industrial Concessions Act, the government has a “right of reversion”, which allows it to resume ownership of privately owned hydropower assets without compensation once the original 60‐year licence has expired. As a result, the act has resulted in privately developed hydropower plants gradually passing into public ownership over time.
In capacity terms, the three largest generation owners (Statkraft, Hafslund Eco Vannkraft and Sira Kvina Kraftselskap) – all publicly owned – control just under 50% of Norway’s
IEA.
All
right
s re
serv
ed.
7. ELECTRICITY
111
ENER
GY
SEC
UR
ITY installed hydro capacity and over 50% of production. Statkraft is dominant among these,
alone owning over 30% of generation capacity and producing close to 30% of net generation.
Wholesale electricity market The Norwegian physical electricity market and the European physical electricity markets are integrated. The physical wholesale energy markets are divided into three sequential markets where prices are determined: day-ahead, intraday and balancing markets.
There are two physical power exchanges in Norway, Nord Pool and EPEX SPOT, though more than 90% of the physical power trade takes place on Nord Pool. The power exchange operates two physical power markets: a day-ahead market (Elspot) and a continuous intraday market (Elbas).
Elspot is the most important market and is used as a reference when planning the operation of the grid by the TSO. Out of total electricity consumption in 2020 of 133.7 TWh, over 120 TWh (around 90%) was traded in the day-ahead market. The day-ahead market closes at noon, 12-36 hours before the physical delivery takes place. The day-ahead auction collects bids from both producers and consumers and is subject to physical constraints of cross-zonal capacity. By setting prices and volumes for each bidding zone, the auction also determines the scheduled day-ahead flows between bidding zones.
In the intraday market (Elbas), contracts are continuously traded in the period between clearance in the day-ahead market and up to one hour before the hour of operation. This allows market participants to achieve a balance through trading. The intraday market supplements the day-ahead market, for instance to correct potential imbalances accruing after the closure of the day-ahead market. Market participants can only trade between bidding zones if capacity is available.
The balancing markets are also operated by the TSO, which is responsible for balancing the system. The balancing markets consist of primary reserves, secondary reserves and tertiary reserves.
The Energy Act states that any entity engaged in physical trading, generation and/or distribution of electricity in Norway is required to hold a trading license. Through the Energy Act, the NVE-RME has been given the authority to grant such licences and has delegated power to impose supplementing terms and conditions for the licenses whenever necessary. The trading licence is a key basis for the NVE-RME’s supervision and regulation of market actors. A trading licence is required to become a balance responsible party and to trade at a power exchange. At the beginning of 2021, 646 companies received a trading licence lasting from 1 January 2021 to 31 December 2024. Electricity suppliers supplying residential customers had 163 of these licences, while 100 of the licenses were held by DSOs.
Since 1 March 2018, the regulator has been enforcing market rules regarding prohibitions of market manipulation and insider trading, as well as requirements on disclosure of insider information. A special market surveillance team has been established at the NVE-RME.
IEA.
All
right
s re
serv
ed.
7. ELECTRICITY
112
Retail electricity market Norway fully liberalised its electricity market in 1991. In a study commissioned by the European Commission and published in February 2021, the Norwegian electricity retail market was found to have the lowest barriers to entry in Europe.
End users in Norway can freely choose their power supplier among approximately 140 suppliers. Although the suppliers in the retail market offer a variety of contracts, the contracts can normally be divided into three groups: spot price, standard variable price and fixed-price contracts. Spot price contracts are based on hourly spot prices plus a mark-up. For a standard variable contract, the supplier may freely choose the price that follows the spot price and its duration, given that any price change must be announced to the customer at least 14 days in advance. Fixed-price contracts are based on an agreement to deliver electricity at a fixed price for the duration of the contract. Over 75% of customers in Norway have contracts based on a spot price, close to 22% choose a contract based on standard variable price and only 2.5% have fixed-price contracts.
The combined market share of the three largest suppliers in the household sector by metering points has been around 37% for several years. The Herfindahl-Hirschman Index for household customers is 740. The low concentration can be explained by a high number of suppliers, and indicates a competitive market structure.
Smart metering Norway is the only country in the world where an advanced metering infrastructure for hourly meter readings has been installed in all households and other measurement points. The rollout of advanced metering infrastructure devices was completed by the end of 2019. Statnett was put in charge of establishing a data hub (Elhub) that collects and processes information coming from advanced metering infrastructures (70-80 million meter readings and 150 000 market messages daily).
Since 1991, the number of residential customers with a supplier different from the incumbent supplier has increased. The Norwegian Consumer Council has established a website (www.strompris.no) where consumers can compare contracts offered by all electricity suppliers. In 2020, there were 711 000 supplier switches resulting in a switching rate of 21%. As soon as a supplier has signed a written contract with a consumer to switch supplier, the supplier can send a digital message to Elhub. This digital message includes information about the consumer’s metering point, date of supplier change, as well as other customer information needed for invoicing. If the data provided by the supplier are validated, Elhub will proceed with the change of supplier and send a confirmation to the new supplier and the previous supplier gets a notice about the terminated agreement.
Electricity prices
Norway’s industry and household electricity prices have historically been the lowest among IEA member countries (Figure 7.5). Norway’s industry price in 2020 was 16.1 USD/MWh, with a 20% tax rate, while household electricity prices reached 48.9 USD/MWh, with a tax rate of 41%. Norway’s electricity prices have consistently been the lowest when compared to its neighbouring countries in past years (Figure 7.6).
IEA.
All
right
s re
serv
ed.
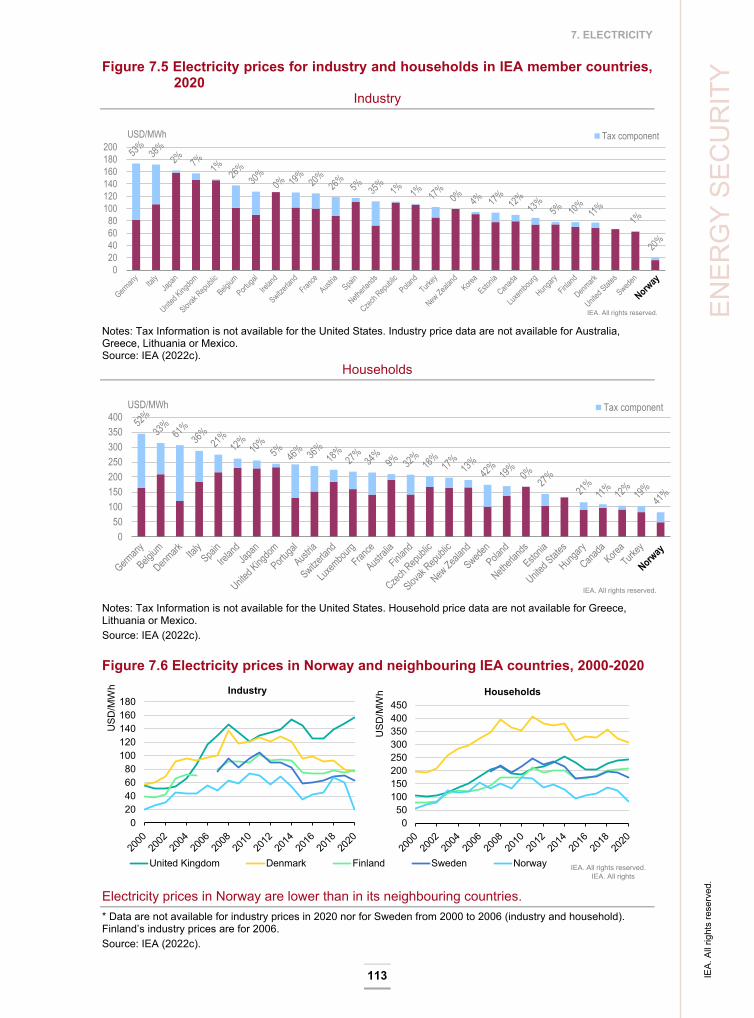
7. ELECTRICITY
113
ENER
GY
SEC
UR
ITY Figure 7.5 Electricity prices for industry and households in IEA member countries,
2020 Industry
Notes: Tax Information is not available for the United States. Industry price data are not available for Australia, Greece, Lithuania or Mexico. Source: IEA (2022c).
Households
Notes: Tax Information is not available for the United States. Household price data are not available for Greece, Lithuania or Mexico. Source: IEA (2022c).
Figure 7.6 Electricity prices in Norway and neighbouring IEA countries, 2000-2020
Electricity prices in Norway are lower than in its neighbouring countries. * Data are not available for industry prices in 2020 nor for Sweden from 2000 to 2006 (industry and household). Finland’s industry prices are for 2006. Source: IEA (2022c).
020406080
100120140160180200
USD/MWh Tax component
IEA. All rights reserved.
050
100150200250300350400
USD/MWh Tax component
IEA. All rights reserved.
0 20 40 60 80
100 120 140 160 180
USD
/MW
h
United Kingdom Denmark Finland Sweden Norway IEA. All rights reserved.
Industry
0 50
100 150 200 250 300 350 400 450
USD
/MW
h
IEA. All rights d
HouseholdsIE
A. A
ll rig
hts
rese
rved
.

7. ELECTRICITY
114
Norway’s power grid is divided into five different pricing zones. Three southern areas (around Oslo, Stavanger and Bergen), where consumption is concentrated, may at times have up to ten times higher electricity prices than in the northern part of the country. These differences are a result of high production and low demand in the north, congestion on the transmission network from north to south, and easy access of northern bidding areas to cheap wind generation from Sweden.
Typical electricity bills in Norway consist of charges for several different components: the electricity price, grid tariff, electricity tax (0.32 NOK/kWh) and VAT. In addition, there is a fee earmarked for the Energy Fund (Enova), which supports GHG emissions reductions and improved security of supply.
In the second half of 2021, prices for electricity in Norway increased sharply following similar surges across Europe. According to Statistics Norway (2022b), household net electricity prices increased by 429%, reaching a final price (including 49% taxes and charges) of 1 470 NOK/MWh (164 USD/MWh) in Q4 2021. Prices increased the most for contracts tied to spot prices (by 551%). For non-energy intensive industry, prices jumped more than sixfold, while the increase for energy-intensive sectors was 34%.
In December 2021, the government introduced a temporary support scheme for households with an initial allocation of NOK 8.7 billion (EUR 870 million) until the end of March 2022. When the average spot price over a month exceeded 0.70 NOK/kWh, the government covered 55% of the amount beyond this threshold up to a maximum of 5 000 kWh per month for households. In January, the government increased the coverage rate from 55% to 80%. In March 2022, the support scheme was extended to March 2023, and the coverage rate was raised to 90% for October, November and December 2022. This extension is estimated to cost NOK 7.4 billion (EUR 740 million). The support scheme also applies to agriculture, greenhouses and voluntary organisations, which increases the scheme’s cost by about NOK 730 million (EUR 73 million). The share paid by the state is deducted directly from the bill by the TSO or electricity provider. Additionally, the government has initiated a dialogue with the TSO to enable a deferral of payments for the most exposed customers.
Electricity security and emergency response The MPE has the overall responsibility for managing the power sector in Norway, for which certain parts are delegated to the NVE.
The legislation for security of electricity supply and emergency preparedness is outlined in Chapter 9 of the Energy Act and the Regulation on Security and Emergency Preparedness in the Power Supply System. The Energy Act requires any grid company to keep its grid in good condition and sufficiently modernised, while the Regulation on Security and Emergency Preparedness in the Power Supply System describes requirements to ensure electricity security and effective restoration in cases of outages. The NVE produces regular sector reports, analysing the current state of the electricity sector and related risks, and conducts oversight over whether grid owners comply with the regulations. In case of a crisis, the NVE would co-ordinate between government and market participants.
IEA.
All
right
s re
serv
ed.
7. ELECTRICITY
115
ENER
GY
SEC
UR
ITY Statnett is responsible for system operation and operational security as well as for
developing measures to deal with highly strained supply situations. These are known as “SAKS measures”, and their purpose is to reduce the likelihood of rationing.
While the NVE is the national competent authority on cybersecurity, the regulator (NVE-RME) is responsible for cybersecurity in the metering value chain, which includes smart metering systems and Elhub. The Metering Settlement and Billing Regulation includes detailed security requirements for smart metering systems and Elhub. As with general electricity security, grid owners and power producers are also responsible for their own cybersecurity, including the security of their supply chains.
Electricity adequacy In its analysis for 2021-2026, Statnett assumes that Norwegian power system adequacy, although strained at times, poses no risk of power rationing in the next five years.
Through legislation, however, Statnett is given an extended responsibility to continuously investigate and develop necessary measures to ensure that supply and demand are balanced at all times, especially during the winter season. The TSO can require mandatory participation in the balancing market, power production (even when not part of the balancing market) and load shedding. System protection mechanisms in the transmission network can only be installed and operated based on decisions taken by the TSO. Permanent and operational costs of the different measures undertaken by the TSO for ensuring security of supply are handled within Statnett’s revenue cap.
Statnett is preparing changes to its operational model (Nordic Balancing Model), also with the aim to prepare for expected greater shares of variable renewables on the grid. The main amendments are the switch from 60-minute to 15-minute market resolution, to change the manual processes on the operator’s side to automated system response, and a change from control based in a synchronous area to control based within each of the five bidding zones.
Statnett is expecting an increase in yearly generation from the current levels to 159 TWh in 2030, with additions from hydropower (9 TWh), onshore wind (10 TWh), and offshore wind and solar (4 TWh and 3 TWh, respectively). In response, it has developed a plan of grid investments across the country of up to NOK 100 billion (EUR 10 billion) by 2030 to handle the increased capacity with a 420 kV grid nationwide.
While flexibility in the national power system has historically been provided by abundant dispatchable hydro generation, increased consumption in some important areas (including the Oslo area) reduces the availability of this flexibility source. In the future, flexibility will have to come from the demand side to ensure system balancing.
The Norwegian electricity system does not have capacity available outside of the market (i.e. strategic reserves) ready to react when the market does not provide the necessary production to meet demand. However, for a long time Norway had a reserve market, connected to large industry consumers. Statnett is currently developing and testing a new set of products to be offered to the market that will allow for some additional demand flexibility in the system.
IEA.
All
right
s re
serv
ed.

7. ELECTRICITY
116
Risk preparedness Norway, like almost all countries in the world, must deal with the impact of climate change and related impacts on its electricity infrastructure.
Grid operators, producers and other entities that own or run power installations of significant importance to the electricity supply system participate in the Power Supply Preparedness Organisation, which is headed by the NVE. The Power Supply Preparedness Organisation is divided into districts. Each district has a district manager who is responsible for facilitating adequate co-operation for preventing and handling emergencies. The Power Supply Preparedness Organisation is also responsible for restoring power supplies in the aftermath of extraordinary occurrences.
Every second year, the DSOs and Statnett present updated regional and national network development plans. The timeframe for the network development plan is 20 years at least, and it must describe expected generation, transmission and consumption of electricity, and include conditions that are of importance for the development of the power system in the area. Specifically, the responsibility to co-ordinate long-term power system planning is delegated to the 17 biggest owners of the distribution network. Each of these is responsible for planning the distribution network in a specific area, in co-operation with other network owners and other relevant parties.
Reliability of electricity supplies The large share of hydropower production makes the Norwegian power system vulnerable to variations in water inflow and precipitation. The monitoring of security of supply is therefore closely linked to weekly monitoring of energy levels in hydropower reservoirs. Every week, water level measurements of the 489 largest hydropower reservoirs are collected – monitoring 96% of the total reservoir capacity.
The Norwegian Energy Act specifies that Statnett’s responsibilities include frequency regulation, maintaining the instantaneous balance of the power supply system, developing market-based solutions that promote efficient development and utilisation of the power supply system, and making the maximum possible use of instruments based on market principles.
Norway’s peak demand is managed through market mechanisms, where price signals in the day-ahead, intraday and balancing markets provide incentives for market participants to adjust their consumption and production.
Norway does not have electricity system reliability standards such as loss of load expectation set by legislation. Nonetheless, the TSO complies with a set of internal indicators; for instance, a 200 MW loss for 30 minutes standard is seen by the TSO as a manageable system failure. Norwegian continuity of supply is stable at close to 99.99% in years without extreme weather events and it has never dropped below 99.96% in any year since 1996. Consumers in Norway experience on average about two short interruptions and two longer interruptions per year, where the average duration is less than two minutes for short interruptions and approximately two hours for long ones. However, the security of supply varies from region to region and is generally better at higher grid levels.
IEA.
All
right
s re
serv
ed.
7. ELECTRICITY
117
ENER
GY
SEC
UR
ITY Electricity emergency response
In an emergency, Statnett is responsible for the continuous operation of the power system. The NVE heads the preparedness and emergency planning of power supply and is also the rationing authority. Regulation relating to power system operation regarding the handling of extreme situations came into force on 1 January 2005. This regulation aims to secure extreme situations and is not relevant for the normal operation of the system. Through this regulation, Statnett is given an extended responsibility to continuously investigate and develop necessary measures to ensure that there is momentary balance at all times, the energy balance during the winter season and that adequacy can be sustained during crisis situations.
According to Norwegian regulations, Statnett can develop different remedial actions within the terms of the regulation on system operation, based on the following set of terms (NVE, 2021b):
to reduce the risk of electricity rationing as much as possible
to be effective for handling extreme situations, and at the same time not influence the electricity market or investment decisions with respect to production or the network
to maintain TSO neutrality and its independent position in the power market
to contribute to a socio-economic handling of extreme situations and maintain the efficiency of the physical power market
to take into consideration the ticexisting flexibility in production, transmission and consumption.
In 2020, an amendment to the Grid and Energy Market Regulation made it possible for grid companies to give customers a non-firm connection to the grid. This non-firm connection enables the grid companies to curtail consumption on terms that are agreed upon between the parties.
Assessment Norway enjoys the largest share of zero emissions electricity in Europe at 98% of its generation. Of that, 92% came from hydropower generated from almost 1 700 plants (at 141.6 TWh in 2020). Most of the remainder was generated from onshore wind turbines, for which generation increased more than tenfold over last decade to 9.9 TWh in 2020. As such, Norway has significant potential to leverage its clean electricity system to decarbonise other sectors of the economy through electrification.
One special feature of the Norwegian hydropower system is its high storage capacity (87.2 TWh). Norway has half of Europe’s reservoir storage capacity, which corresponds to 64% of Norwegian electricity production (in 2021). Energy storage from hydropower plants with reservoirs are part of the market-based power system. Importantly, Norway’s vast hydro storage capacity can help balance production from growing variable renewables generation in the Nordic and broader European power markets. Norway has no targets for energy storage, nor any supporting measures.
With production at 154.2 TWh and consumption of 133.7 TWh in 2020, Norway has confirmed its position as a net exporter of electricity over the last decade, with a record of 20.5 TWh of net exports in 2020. However, the country is also a significant importer at
IEA.
All
right
s re
serv
ed.

7. ELECTRICITY
118
times when hydro inflows are not sufficient, benefiting especially from abundant wind generation in neighbouring countries. Norway is part of a joint Nordic power market with Denmark, Finland and Sweden with abundant interconnectors to Germany, the Netherlands, Poland, Russia, the United Kingdom and the Baltic states. However, as Nordic countries themselves experience a large deficit during winter peak demands, the need for imports during cold spells might stress the Norwegian electricity system.
Additionally, according to the TSO’s forecasts, Norwegian demand for electricity will grow quickly to 159 TWh in 2030, the largest increase among Nordic countries. The forecasted growth is in part driven by electrification of other sectors as part of decarbonisation plans as well as the emergence of new sectors such as data centres and gigafactories. As Norway’s historical trade surplus narrows, the government should give due consideration to additional generation capacity and energy efficiency, as well as expedited implementation of demand-side flexibility options, which are still in pilot phases.
Norway has great potential for generating electricity from wind, but the sector now finds itself at a standstill. Though costs for onshore wind have fallen to levels that are cost-competitive despite the termination of a certificate support scheme in 2021, the cessation of permits due to a rethink of the regulatory framework is the main cause for the stagnation of onshore wind in Norway. As projected demand growth will likely surpass the availability of hydro expansions, onshore wind should be reconsidered as a source of new renewable electricity generation. The April 2022 decision to restart permitting for onshore wind facilities will help toward this end.
Norway also has plans to develop an offshore wind industry. Although the Offshore Energy Act entered into force in 2010, the Offshore Energy Regulation only came into effect in 2021. So far, Norway has identified two possible offshore project areas and at the beginning of 2022 the government committed to accelerate offshore wind. However, lack of regulation and clarity for investors has so far delayed any final decisions, consequently setting back Norway from gaining competitive advantage in an industry that has natural synergies with other existing offshore and maritime industries. As demand for upstream oil and gas activities in Norway will decline, offshore wind may become a new business opportunity for the country’s highly skilled workforce and infrastructure.
While parts of the distribution grid in Norway have significant spare capacities (but should consider the need for increased capacity based on expected growth, especially in EV charging), the biggest strain is seen on the transmission grid, which will have to be expanded to meet higher consumption levels. To this end, Statnett prepared a Grid Development Plan 2021 with firm plans to invest up to NOK 100 billion in transmission grid development by 2030. For this to happen in a timely fashion, strong regulatory incentives, social campaigns and support from local authorities will be crucial.
Like in other energy sectors, the state plays a major role in Norway’s electricity sector. There is only one TSO, state-owned Statnett, which has been legally unbundled since 1992 and ownership unbundled since 2002. The majority of over 100 Norwegian DSOs are also publicly owned. Public ownership is also prominent for large-scale hydro production, while wind power facilities have a larger share of commercial and foreign ownership.
The internal wholesale market in Norway is divided into five bidding zones. Historically the price differences between the bidding zones have been small. Occasionally, however, extraordinary bottlenecks between price zones in the last year has resulted in significant
IEA.
All
right
s re
serv
ed.
7. ELECTRICITY
119
ENER
GY
SEC
UR
ITY differences of up to 1 000% in day-ahead prices. In particular, a surplus of production in
the north of the country that is constrained due to limited transmission capacity, European electricity prices and the weak hydrological balance in the south influence prices throughout the country. This can have a significant impact on the social acceptance of the structure and operation of the electricity market.
Norway’s industry and household electricity prices have been the lowest among its neighbouring countries in past years. Nonetheless, the recent surge in electricity prices experienced over winter 2021-2022, led by price spikes in Europe, have raised the issue of vulnerable consumers in the country.
In response, in December 2021, the government undertook a temporary support scheme to reduce final electricity bills for consumers. Although this tool is very effective at minimising the impact of high electricity prices on consumers, it is unsustainable even for Norway for longer periods and can serve as a disincentive to respond to market prices and lower or spread consumption. As such, the government should start addressing the issue of vulnerable consumers in a more targeted way, including by providing increased support for energy efficiency improvements to homes.
Norway enjoys a competitive retail market with over 100 suppliers. The government has established a free electricity comparison tool covering all contracts, which supported the ability for 620 000 out of 3.5 million customers to switch suppliers in 2020. Only 2.5% of households are supplied on fixed-price contracts, even though the prices offered are often favourable, underlining past public confidence in the electricity system with daily prices.
Norway has entirely digitalised the metering value chain in the electricity sector, with 99.5% market coverage. Elhub, operational from 2019, is a centralised, neutral data exchange tool, where all the data are readily accessible to market participants. The government and the TSO should address potential cybersecurity threats to system functioning and security of customers. Moreover, the data can be used to expand demand-side response programmes at the household level, which is still in the pilot stage.
Recommendations The government of Norway should:
Ensure a conducive environment for the development of transmission and distribution grid infrastructure to accommodate future demand and generation growth by streamlining grid permitting while addressing the needs of local communities.
Promptly introduce regulation and incentives for offshore wind and update the licencing regime for onshore wind capacities to supplement the role of hydropower in accommodating expected demand growth.
Provide incentives for introducing sector-wide demand-side flexibility with network tariffs and flexibility services aimed at changing electricity use patterns and to spread out demand.
During periods of high prices, consider applying policies that offer targeted support for vulnerable consumers, while retaining incentives for energy savings across the economy.
IEA.
All
right
s re
serv
ed.

7. ELECTRICITY
120
References IEA (International Energy Agency) (2022a), World Energy Balances (database), https://iea.org/data-and-statistics/data-product/world-energy-balances (accessed on 18 February 2022)
IEA (2022b), Electricity Information, https://iea.org/data-and-statistics/data-product/electricity-information (accessed in March 2022)
IEA (2022c), OECD Energy Prices and Taxes Quarterly (database) https://iea.org/data-and-statistics/data-product/oecd-energy-prices-and-taxes-quarterly (accessed in March 2022)
NVE (Norwegian Energy Regulatory Authority – RME) (2021b), Long-term Power Market Analysis 2021-2040, https://publikasjoner.nve.no/rapport/2021/rapport2021_29.pdf
NVE (2021b), National Report 2021, https://publikasjoner.nve.no/rme_rapport/2021/rme_rapport2021_06.pdf
Statistics Norway (2022a), Electricity (web page) https://ssb.no/en/energi-og-industri/energi/statistikk/elektrisitet
Statistics Norway (2022b), Electricity prices (web page) https://ssb.no/en/energi-og-industri/energi/statistikk/elektrisitetspriser
Statnett (2021), Increased power consumption and plans for new industry generates need for more power production (web page), https://statnett.no/en/about-statnett/news-and-press-releases/news-archive-2021/increased-power-consumption-and-plans-for-new-industry-generates-need-for-more-power-production
IEA.
All
right
s re
serv
ed.
121
ENER
GY
SEC
UR
ITY
8. Oil and natural gas
Key data (2020) Oil Net exports of crude oil:* 1 449 kb/d, -8% since 2010
Domestic production of oil products** 567 kb/d, -3% since 2010
Net exports of oil products: 303 kb/d, +32% since 2010
Share of oil: 32% total supply (TES and international bunker fuels)**, 36% TFC, 46% domestic energy production
Oil consumption by sector: 211 kb/d (domestic transport, including international bunkers 45%; industry, including non-energy consumption 42%; buildings [services and residential] 3%; energy sector, including power generation 9%)
* Exports of crude oil includes crude oil, natural gas liquids (NGLs) and feedstock.
** Domestic oil products production includes NGL that is consumed directly without being processed in refineries.
Natural gas Net exports: 111 bcm, +8% since 2010
Domestic production: 118 bcm, +7% since 2010
Share of gas: 47% of domestic energy production, 16% of TES,2 1% of electricity generation, 5% of TFC
Overview Oil and gas exploration has been a mainstay of the Norwegian economy since hydrocarbons were first exploited on the NCS in 1971. The oil and gas sector is a major source of revenues for the Norwegian state, accounting for close to 50% of the country’s total export revenues in 2021. According to the latest statistics, the combination of high production, significant global demand and high commodity prices led to a historic peak in export revenues from oil and gas in 2021, exceeding NOK 800 billion (EUR 80 billion). The oil and gas industry employs approximately 200 000 workers in the country, in large part in the Stavanger area.
As a reputable and reliable producer, Norway has played a stabilising role in the world’s oil and gas supply, particularly in meeting European demand. 2021 marked the 50-year
2 Total energy supply does not include oil used for international bunkering.
IEA.
All
right
s re
serv
ed.

8. OIL AND NATURAL GAS
122
anniversary of hydrocarbon exploitation in Norway. Since then, the country has produced 50% of its recoverable resources on the NCS, while 24% of its total resources are believed to not yet be discovered. However, before 2020, oil production had been on a downward trend for some time as a result of declining output from Norway’s ageing offshore fields. In 2020, production increased by 17% due to the commissioning of the Johan Sverdrup field. However, looking beyond 2025, the level of future investment in Norway’s oil fields remains uncertain. As the NCS is considered a mature petroleum basin, the government anticipates that oil and gas production will naturally decline by 65% from current levels by 2050.
Norway is the seventh-largest natural gas producer in the world and third-largest exporter, supplying 3% of global gas consumption. Domestic production amounted to 113 bcm in 2021, accounting for 47% of total energy production and 17% of total energy supply. After an increasing trend since 2000, production peaked in 2017 at 129 bcm. Following a slight decline in 2018-2019, gas production started rising again in 2020-2021, and is expected to continue increasing until 2024. According to forecasts from the Norwegian Petroleum Directorate, natural gas production in 2023 will reach 118 bcm.
In contrast to large upstream production, Norwegian consumption of natural gas is minimal and stood at 6.3 bcm in 2020 (1% of total final consumption of energy), most of which was reinjected into oil and gas reservoirs to sustain output pressure.
Upstream policies and regulations
Policy principles and taxation Exploration and production activities in Norway are governed by the Petroleum Act of 1996, with its subsequent amendments, and secondary legislation, notably the Petroleum Regulations. The act stipulates that the Norwegian state has property rights to subsea petroleum deposits and exclusive rights to resource management.
The main objective of Norwegian petroleum policy is to ensure the greatest possible value from oil and gas activities to Norwegian society, through efficient and responsible resource management as well as by creating an enabling environment for safe investments on the NCS. Consequently, Norway has established a division of roles and responsibilities between the state and the business sector to provide a basis for achieving the goals of the country’s petroleum policy. While the authorities regulate the sector by setting a clear, enabling and predictable overall upstream business framework, petroleum companies and other actors in the industry are responsible for operational activities.
The petroleum taxation system is set out in the Petroleum Taxation Act of 1975. The system ensures substantial revenues for Norwegian society. The tax system is based on profits, i.e. only a company’s net profit is taxable. All losses, which are notably important during field development, may be carried forward with interest. Consolidation among fields is allowed. This means that losses from one field, or exploration costs, can be written off against the company’s income from operations elsewhere on the Norwegian shelf. For companies that are not liable to pay tax, there is a system whereby companies can claim reimbursement for exploration costs as an alternative to deducting them from the tax base.
IEA.
All
right
s re
serv
ed.

8. OIL AND NATURAL GAS
123
ENER
GY
SEC
UR
ITY To ensure that value creation benefits Norwegian society, the tax rate for oil and gas
companies is set at 78%, one of the highest levels in the world. The petroleum taxation system is based on ordinary company income tax (currently 22%) and an additional special tax of 56%. As part of its neutral tax system, companies are entitled to deduct all relevant costs of operations from this tax basis, including the CO2 tax on the petroleum industry.
When the basis for ordinary tax and special tax is calculated, investments are written off using straight-line depreciation over six years from the year the expense was incurred. To calculate the taxable income base for companies, the Norwegian Petroleum Price Board (PPB) has established a Norm Price System, based on the Petroleum Taxation Act and secondary legislation (royal decrees). Under the Norm Price System, the government sets administrative prices for crude oil for tax purposes. All oil production from the country’s continental shelf is covered by the Norm Price System. The main principle for setting norm prices is that they should reflect the price that could have been achieved between independent parties and therefore can serve as a taxation base (each crude gets a specific norm price). The PPB meets every quarter to set norm prices retroactively for the previous quarter. It collects information from a variety of sources, including companies operating on the NCS. The PPB also has meetings with companies before the final norm price is set and companies may also appeal the PPB’s decisions to the MPE.
The government has recently proposed a major change to the petroleum tax system, where the special tax is transformed to a cash flow tax with immediate expensing of new investment costs. The proposal was opened to public consultation in April 2022.
Key institutions The Norwegian parliament (Storting) sets the framework for petroleum activities in Norway, partly through its legislative powers. All major development projects must be debated by the Storting.
Figure 8.1 Division of responsibilities for the Norwegian upstream sector
Source: Norsk Petroleum (2022).
IEA.
All
right
s re
serv
ed.
8. OIL AND NATURAL GAS
124
The government has decision-making and supervisory roles, which it carries out both through the Council of Ministers and through individual ministries and subordinate agencies (Figure 8.1).
The MPE, which holds a key role, is responsible for all upstream policy and regulations in Norway. The Norwegian Petroleum Directorate, established in 1972, is a subordinate agency of the MPE, located in Stavanger, the country’s upstream capital. It plays a key role in petroleum management and is an important advisory body for the MPE. The MPE and Norwegian Petroleum Directorate exercise administrative authority over petroleum exploration and production on the NCS and have powers to adopt regulations and take decisions under petroleum legislation. The MPE also supervises Gassco, the country’s gas infrastructure operator (see below).
The Ministry of Climate and Environment has general responsibility for environmental policy and environment protection. The Norwegian Environment Agency, a subordinate body of the ministry, has inspection and enforcement responsibilities under the Pollution Control Act (mainly in relation to CO2 and methane emissions control for the upstream sector).
The Ministry of Trade, Industry and Fisheries has a key role in managing the state’s ownership interests in the petroleum sector, including Equinor (former Statoil), Petoro and the SDFI (see below for details). It is also consulted as part of the procedures for awarding offshore licences. Since 2017, the ministry has also had powers in managing oil emergencies based on the 2006 Regulation relating to Petroleum Product Storing for Emergency Purposes.
The Ministry of Labour and Social Inclusion has general responsibility for the working environment and for health and safety in the upstream sector. Through its subordinate Petroleum Safety Authority, it carries responsibilities for technical and operational safety, emergency preparedness to deal with both accidents and wilful acts such as sabotage, and the working environment throughout the petroleum industry.
The Ministry of Finance is responsible for the taxation system for the petroleum sector. The Petroleum Tax Office is part of the Norwegian Tax Administration, which is subordinate to the Ministry of Finance. The main function of the Petroleum Tax Office is to ensure the correct assessment and collection of taxes. The Ministry of Finance is also responsible for managing the Government Pension Fund Global, also known as the Oil Fund, which invests and secures Norwegian petroleum revenues for future generations. The operational management over the fund has been delegated to Norges Bank (the Norwegian central bank).
Government ownership The Norwegian government has a significant direct interest (the SDFI) in petroleum production and infrastructure on the NCS. The state, though the SDFI, owns one-third of the remaining resources, 21% of oil production, 30-40% of oil infrastructure and 47% of gas infrastructure on the NCS. State ownership is typically around 20% of a licence, although in some cases the state can retain a majority interest (especially in the most promising and profitable projects).
IEA.
All
right
s re
serv
ed.
8. OIL AND NATURAL GAS
125
ENER
GY
SEC
UR
ITY Although the government holds a key role in the upstream industry in Norway, its
ownership in the oil and gas sector is realised through a model in which the state partners with other companies in pursuing upstream activities. Equinor (67% state-owned) operates as a purely commercial company in completion with other companies. At the end of 2021, a total of 37 exploration and production companies were active on the Norwegian shelf, but Equinor is by far the most active in terms of licences and operatorships as an operator of about 70% of all oil and gas production on the NCS. The government uses a special scheme to manage its stakes rather than pursue direct involvement in operations. The scheme is based on the SDFI, which is an instrument holding production assets on behalf of the government that administers a cash flow transfer system between Equinor as marketer of the SDFI oil and gas and the government.
Petoro, a 100% government-controlled agency, manages the SDFI, a portfolio of the government’s directly owned shares in exploration and production licences, and is the legal licensee for the state’s interests in production licences, fields, pipelines and onshore facilities. Petoro’s main objective is to maximise value and achieve the highest possible income from the Norwegian state’s owned portfolio on the NCS. Three principal responsibilities assigned to Petoro by the Ministry of Trade, Industry and Fisheries are:
managing the government’s holdings in offshore projects
monitoring Equinor’s sale of the petroleum produced from the SDFI, as specified in the sales and marketing instructions issued to Equinor
financial management, including accounting, for the SDFI.
The government has no plans to reduce its holdings in upstream activities in Norway.
Infrastructure The Norwegian gas transportation system comprises 8 800 km of pipelines, mostly constituting one integrated system, as well as three major gas processing plants (Kårstø, Kollsnes and Nyhamna) and six receiving terminals in Europe (two in Germany, two in the United Kingdom, and single terminals in Belgium and France) (Figure 8.2). The transport capacity of the Norwegian pipeline network is currently about 120 bcm per year and enjoys low tariffs, as most infrastructure is paid off with only running costs to cover. Hammerfest LNG, outside Hammerfest in Finnmark county, is Norway’s sole LNG export facility, built in 2007 (operated by Equinor). Hammerfest receives and processes natural gas from the Snøhvit field in the Barents Sea.
IEA.
All
right
s re
serv
ed.
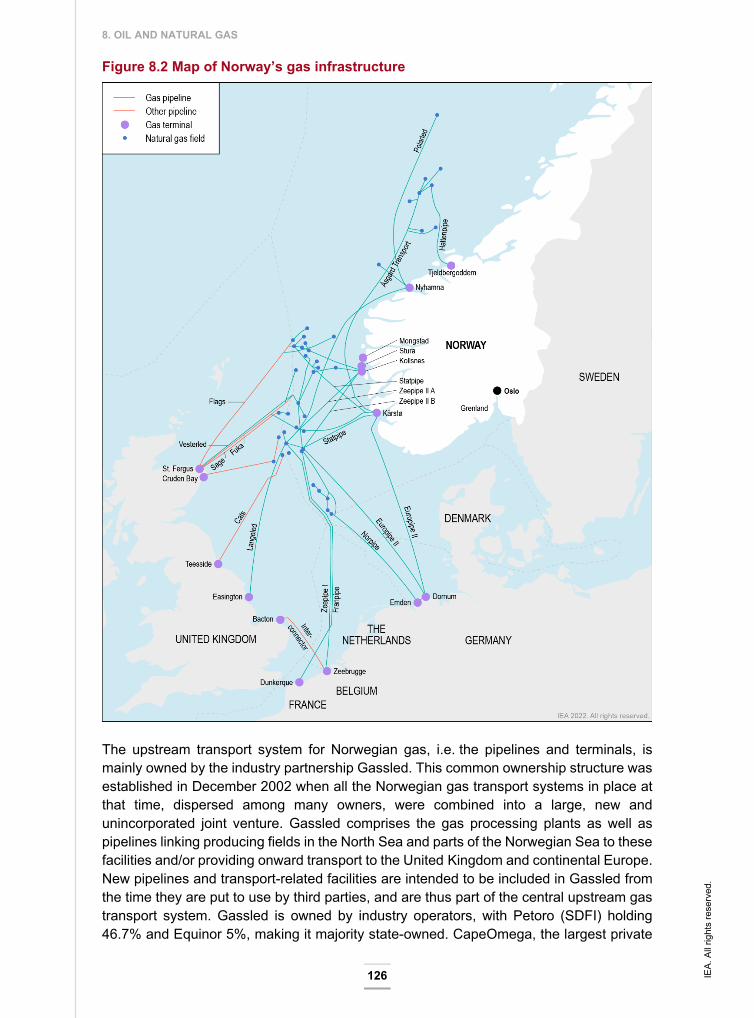
8. OIL AND NATURAL GAS
126
Figure 8.2 Map of Norway’s gas infrastructure
The upstream transport system for Norwegian gas, i.e. the pipelines and terminals, is mainly owned by the industry partnership Gassled. This common ownership structure was established in December 2002 when all the Norwegian gas transport systems in place at that time, dispersed among many owners, were combined into a large, new and unincorporated joint venture. Gassled comprises the gas processing plants as well as pipelines linking producing fields in the North Sea and parts of the Norwegian Sea to these facilities and/or providing onward transport to the United Kingdom and continental Europe. New pipelines and transport-related facilities are intended to be included in Gassled from the time they are put to use by third parties, and are thus part of the central upstream gas transport system. Gassled is owned by industry operators, with Petoro (SDFI) holding 46.7% and Equinor 5%, making it majority state-owned. CapeOmega, the largest private
IEA.
All
right
s re
serv
ed.
8. OIL AND NATURAL GAS
127
ENER
GY
SEC
UR
ITY infrastructure owner on the NCS, holds the second-biggest share of 26.32%. Gassled has
no employees and is organised through various committees with specific assignments to deliver on its tasks, being more an ownership than an operational structure.
Gassco is the operator for Gassled and other gas infrastructure, and is wholly owned by the Norwegian state. Gassco is responsible for operations (planning, monitoring, co-ordination and administration of transport from the fields to the receiving terminals), allocation of capacity and development of the transport system. Gassco’s task is to co-ordinate the processes for further development of the upstream network of gas pipelines and to assess the need for further development. The capital element in tariffs that users of the infrastructure pay also covers investment made by the owners, while Gassco itself does not make a profit or a loss from its operator’s activities. Gas transport tariffs depend on the cost of infrastructure and are governed by special regulations issued by the MPE. This ensures that the economic returns are earned from producing fields and not from the transport system, which is only to serve as an export facilitating infrastructure.
Gas companies’ access to capacity in the system is based on their needs for gas transport. To secure good resource management, transport rights can be transferred between users when needed, and Gassco is responsible for capacity management.
Norway’s upstream oil infrastructure is well developed, with an extensive network of subsea pipelines linking offshore oil fields with onshore terminals. Transport infrastructure makes up a smaller part of the value chain for oil than for gas. In many cases, oil is loaded directly onto tankers on the offshore fields (buoy-loading). For some of the larger field developments in Norway, it was considered most appropriate to build onshore oil terminals. Other fields have subsequently been connected to this infrastructure. The oil transport system is regulated according to third-party access regulation. The cost of transport is lower in relation to the product price, and buoy-loading directly onto tankers at oil fields is an alternative to using pipelines and terminals. There is not an integrated system of oil pipelines and terminals: the infrastructure is divided into four different systems connected to the terminals at Sture, Mongstad and Kårstø in Norway and Teesside in the United Kingdom. The owners and users negotiate agreements on access to oil transport infrastructure between themselves. Like negotiations on the use of infrastructure on the fields, these negotiations are governed by the regulations relating to the use of the facilities by others.
Licencing State management and control of the oil and gas industry is ensured through legislation that requires companies to obtain licences and approvals from the MPE for all phases of petroleum activities. There are two types of licencing rounds: 1) award in predefined areas (APA); and 2) numbered licencing rounds. APA licences now cover the major parts of the NCS open for petroleum activities. In 2021, the MPE issued 53 new APA licences to 28 different companies.
An area must be opened for petroleum activities before any operations are permitted. During an opening process, the authorities ensure that they have an overview of all the relevant arguments for and against petroleum activities in the area in question. In addition, the general public and the parties affected are given an opportunity to put forward their views. A resource assessment of the area is also made as part of the opening process.
IEA.
All
right
s re
serv
ed.
8. OIL AND NATURAL GAS
128
Every decision on whether or not to open new areas for petroleum activities in the country are taken by the Storting, after being preceded by a thorough debate, including public hearings of representatives of society.
The first phase is exploration, when subsea petroleum resources are mapped and proved. If commercially viable discoveries are made, activities enter a new phase, with the aim of developing the field and producing from it, at the same time ensuring sound resource management and maximising value creation. When it is no longer possible to produce profitably from a field, operations must be closed down and the installations disposed of (made safe in place or removed). In this respect, it should be noted that according to Norwegian licencing policy, all new entrants seeking to become licensees on the NCS are subject to a financial scrutiny to ascertain whether they have the required financial capabilities and adhere to their decommissioning obligations. A significant amount of decommissioning activity will have to take place on the NCS in the coming decades, which has been planned for by the government for many years and is part of licencing requirements.
The MPE awards production licences to the companies that submit the best applications on the basis of criteria that are announced in advance. The MPE also designates an operator for each project that is responsible for operational activities authorised by the licence. A production licence is valid for an initial period of up to ten years, and while extensions are possible, the initial holder of a permit cannot be sure it will be renewed as decisions are taken after assessing licensee performance in field development. Retention of a license is contingent on continued investment at sufficient levels in developing the field to ensure maximum value creation for the country. A licence can be revoked in whole or in part if the government notes that it is not being operated properly in terms of investments, reservoir viability or environmental conditions. No company is offered an exclusive production licence on an entire project and must involve a minimum of two entities, which is intended as a protection mechanism against leaving opened fields unproductive due to the problems of an individual company. A production license may comprise one or more blocks or parts of blocks. The licensees become the owner of the petroleum that is produced from their licensed acreage. All licensees on the NCS are responsible for selling the oil and gas they produce (with the exception of Equinor, which is also obliged to sell petroleum belonging to the state).
Before developing petroleum deposits, licensees must submit a plan for development and operation of a new deposit to the MPE for approval. If the project includes pipelines or onshore terminals, a separate plan for installation and operation of these must also be submitted and approved.
Environment Norwegian offshore production is considered to be among the least harmful to the environment among all producing regions in the world (Offshore Energy, 2022). Apart from very stringent environmental and decommissioning standards on the NCS, the average CO2 emissions per unit of oil equivalent produced stood at 8 kg in 2021, only comparable to the Middle East. The Norwegian upstream sector also has the highest carbon price among global producers and a decades-long regulation that natural gas flaring is only permitted when necessary for safety reasons, leading to marginal methane emissions. Still, the Norwegian parliament has asked the government, together with the industry, to
IEA.
All
right
s re
serv
ed.

8. OIL AND NATURAL GAS
129
ENER
GY
SEC
UR
ITY present a plan for reducing emissions from oil and gas production on the NCS by 50%
before 2030, compared to 2005, and work toward achieving net zero emissions by 2050. The MPE and industry foresee that achieving the 2030 target will be challenging, viewing a 35% emissions reduction as more feasible by 2030. In the near term, most of the emissions reduction potential will be achieved through electrification (with power from shore) of offshore platforms (gas turbines account for 85% of total oil and gas emissions).
In 2019, as a result of a political dispute in the parliament, the government extended a ban on drilling activities on the so-called LoVeSo area (Lofoten, Vesteralen and Senja islands) for another four years after strong social opposition. Upstream activities in the Barents Sea are also questioned by some parts of society, although no final decisions have yet been taken and Russia’s invasion on Ukraine and related energy crisis may influence future decisions.
Oil and gas exports Though Norway’s oil production covers about 2% of global oil demand, it is an important contribution to global energy security by serving as a stable and predictable supply. Russia’s 2022 invasion of Ukraine may provide an added incentive for Norway to continue delivering crude to global markets and even increase output wherever possible. Half of Norway’s oil has historically been delivered to three countries: the United Kingdom, the Netherlands and Sweden, albeit in recent years over 15% is shipped to the People’s Republic of China, notably from the Johan Sverdrup field that opened in 2019.
Norwegian production of natural gas covers approximately 3% of global demand, but Norway is the third-largest exporter of natural gas in the world, only behind Russia and Qatar. As much as 98% of Norway’s natural gas production is exported to Europe, as domestic consumption is almost non-existent. Norway’s role as a gas exporter to the EU is even more pronounced, accounting for around 25% of EU gas demand, second after Russia (30% in 2021). Yet again, in view of severe sanctions on Russia, Norwegian gas supplies to the EU may play an even stronger role. Norwegian gas arrives to the EU through receiving terminals via the pipeline system or as LNG from the Hammerfest LNG plant. Germany is the largest single destination of Norwegian gas, with volumes to the tune of 48.8 bcm delivered to the country in 2021. Total exports peaked in 2017 at 123 bcm, and decreased in the following years until 2020, to rebound to 113 bcm in 2021. They are expected to reach 118 bcm in 2023. An additional pipeline, the Baltic Pipe with a capacity of 10 bcm that will transit Denmark and connect to Poland, is scheduled to begin operation in late October 2022 and will further diversify Norwegian gas export routes.
Natural gas supply and demand Natural gas plays only a marginal role in Norway’s energy demand. Norwegian gas consumption stood at 6.3 bcm in 2020 (1% of TFEC). Demand for natural gas comes mainly from the industry sector (92%), followed by electricity and heat generation (6%), and the transport sector (2%).
IEA.
All
right
s re
serv
ed.
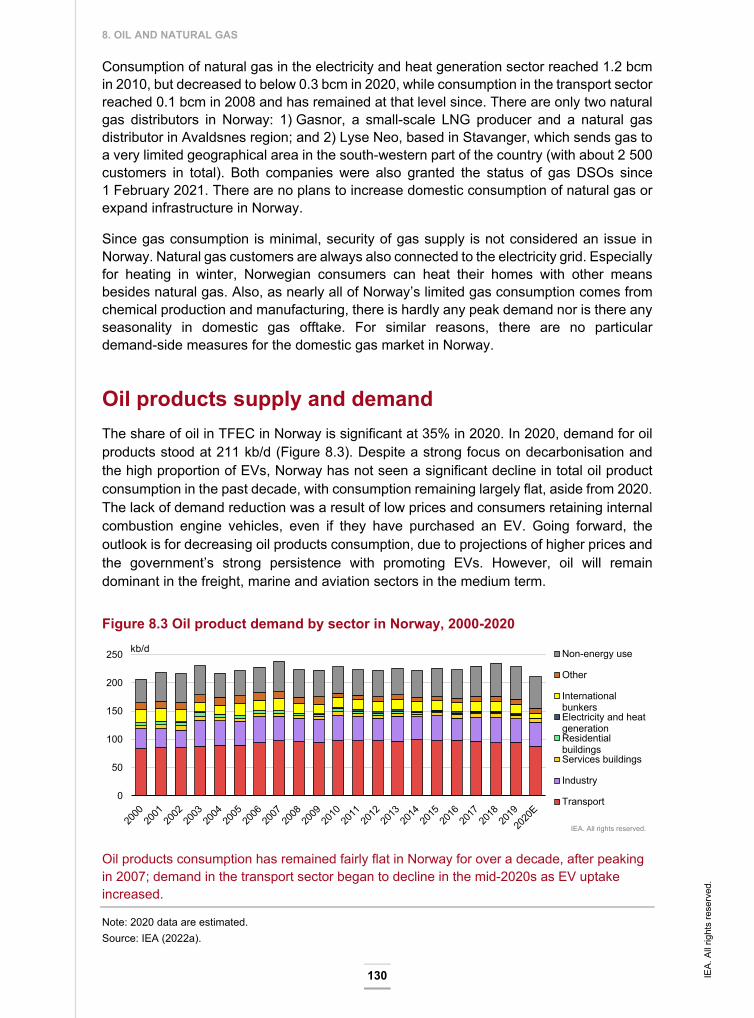
8. OIL AND NATURAL GAS
130
Consumption of natural gas in the electricity and heat generation sector reached 1.2 bcm in 2010, but decreased to below 0.3 bcm in 2020, while consumption in the transport sector reached 0.1 bcm in 2008 and has remained at that level since. There are only two natural gas distributors in Norway: 1) Gasnor, a small-scale LNG producer and a natural gas distributor in Avaldsnes region; and 2) Lyse Neo, based in Stavanger, which sends gas to a very limited geographical area in the south-western part of the country (with about 2 500 customers in total). Both companies were also granted the status of gas DSOs since 1 February 2021. There are no plans to increase domestic consumption of natural gas or expand infrastructure in Norway.
Since gas consumption is minimal, security of gas supply is not considered an issue in Norway. Natural gas customers are always also connected to the electricity grid. Especially for heating in winter, Norwegian consumers can heat their homes with other means besides natural gas. Also, as nearly all of Norway’s limited gas consumption comes from chemical production and manufacturing, there is hardly any peak demand nor is there any seasonality in domestic gas offtake. For similar reasons, there are no particular demand-side measures for the domestic gas market in Norway.
Oil products supply and demand The share of oil in TFEC in Norway is significant at 35% in 2020. In 2020, demand for oil products stood at 211 kb/d (Figure 8.3). Despite a strong focus on decarbonisation and the high proportion of EVs, Norway has not seen a significant decline in total oil product consumption in the past decade, with consumption remaining largely flat, aside from 2020. The lack of demand reduction was a result of low prices and consumers retaining internal combustion engine vehicles, even if they have purchased an EV. Going forward, the outlook is for decreasing oil products consumption, due to projections of higher prices and the government’s strong persistence with promoting EVs. However, oil will remain dominant in the freight, marine and aviation sectors in the medium term.
Figure 8.3 Oil product demand by sector in Norway, 2000-2020
Oil products consumption has remained fairly flat in Norway for over a decade, after peaking in 2007; demand in the transport sector began to decline in the mid-2020s as EV uptake increased.
Note: 2020 data are estimated. Source: IEA (2022a).
0
50
100
150
200
250 kb/d Non-energy use
Other
InternationalbunkersElectricity and heatgenerationResidentialbuildingsServices buildings
Industry
Transport
IEA. All rights reserved.
IEA.
All
right
s re
serv
ed.
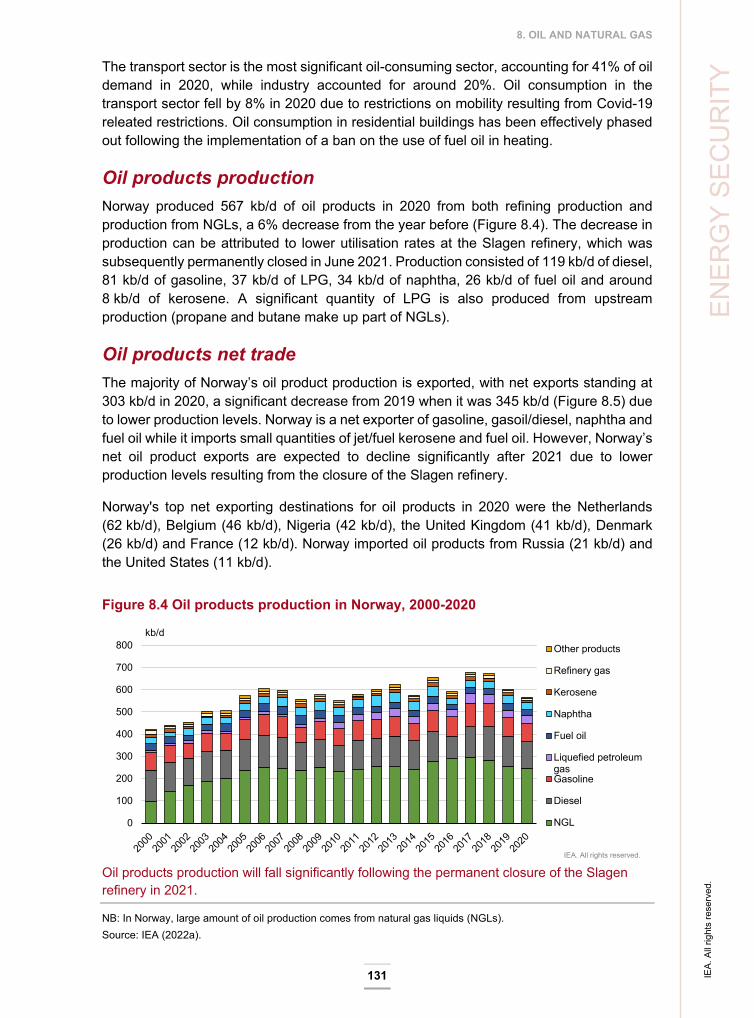
8. OIL AND NATURAL GAS
131
ENER
GY
SEC
UR
ITY The transport sector is the most significant oil-consuming sector, accounting for 41% of oil
demand in 2020, while industry accounted for around 20%. Oil consumption in the transport sector fell by 8% in 2020 due to restrictions on mobility resulting from Covid-19 releated restrictions. Oil consumption in residential buildings has been effectively phased out following the implementation of a ban on the use of fuel oil in heating.
Oil products production Norway produced 567 kb/d of oil products in 2020 from both refining production and production from NGLs, a 6% decrease from the year before (Figure 8.4). The decrease in production can be attributed to lower utilisation rates at the Slagen refinery, which was subsequently permanently closed in June 2021. Production consisted of 119 kb/d of diesel, 81 kb/d of gasoline, 37 kb/d of LPG, 34 kb/d of naphtha, 26 kb/d of fuel oil and around 8 kb/d of kerosene. A significant quantity of LPG is also produced from upstream production (propane and butane make up part of NGLs).
Oil products net trade The majority of Norway’s oil product production is exported, with net exports standing at 303 kb/d in 2020, a significant decrease from 2019 when it was 345 kb/d (Figure 8.5) due to lower production levels. Norway is a net exporter of gasoline, gasoil/diesel, naphtha and fuel oil while it imports small quantities of jet/fuel kerosene and fuel oil. However, Norway’s net oil product exports are expected to decline significantly after 2021 due to lower production levels resulting from the closure of the Slagen refinery.
Norway's top net exporting destinations for oil products in 2020 were the Netherlands (62 kb/d), Belgium (46 kb/d), Nigeria (42 kb/d), the United Kingdom (41 kb/d), Denmark (26 kb/d) and France (12 kb/d). Norway imported oil products from Russia (21 kb/d) and the United States (11 kb/d).
Figure 8.4 Oil products production in Norway, 2000-2020
Oil products production will fall significantly following the permanent closure of the Slagen refinery in 2021.
NB: In Norway, large amount of oil production comes from natural gas liquids (NGLs). Source: IEA (2022a).
0
100
200
300
400
500
600
700
800kb/d
Other products
Refinery gas
Kerosene
Naphtha
Fuel oil
Liquefied petroleumgasGasoline
Diesel
NGL
IEA. All rights reserved.
IEA.
All
right
s re
serv
ed.
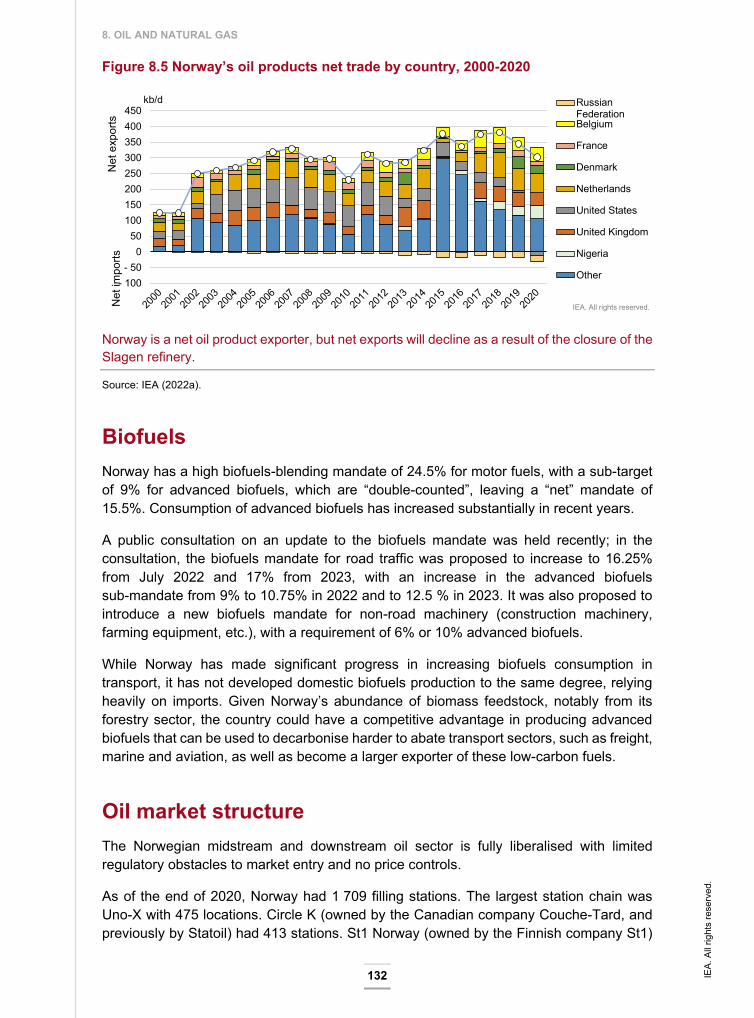
8. OIL AND NATURAL GAS
132
Figure 8.5 Norway’s oil products net trade by country, 2000-2020
Norway is a net oil product exporter, but net exports will decline as a result of the closure of the Slagen refinery.
Source: IEA (2022a).
Biofuels Norway has a high biofuels-blending mandate of 24.5% for motor fuels, with a sub-target of 9% for advanced biofuels, which are “double-counted”, leaving a “net” mandate of 15.5%. Consumption of advanced biofuels has increased substantially in recent years.
A public consultation on an update to the biofuels mandate was held recently; in the consultation, the biofuels mandate for road traffic was proposed to increase to 16.25% from July 2022 and 17% from 2023, with an increase in the advanced biofuels sub-mandate from 9% to 10.75% in 2022 and to 12.5 % in 2023. It was also proposed to introduce a new biofuels mandate for non-road machinery (construction machinery, farming equipment, etc.), with a requirement of 6% or 10% advanced biofuels.
While Norway has made significant progress in increasing biofuels consumption in transport, it has not developed domestic biofuels production to the same degree, relying heavily on imports. Given Norway’s abundance of biomass feedstock, notably from its forestry sector, the country could have a competitive advantage in producing advanced biofuels that can be used to decarbonise harder to abate transport sectors, such as freight, marine and aviation, as well as become a larger exporter of these low-carbon fuels.
Oil market structure The Norwegian midstream and downstream oil sector is fully liberalised with limited regulatory obstacles to market entry and no price controls.
As of the end of 2020, Norway had 1 709 filling stations. The largest station chain was Uno-X with 475 locations. Circle K (owned by the Canadian company Couche-Tard, and previously by Statoil) had 413 stations. St1 Norway (owned by the Finnish company St1)
- 100- 50
0 50
100 150 200 250 300 350 400 450
kb/d RussianFederationBelgium
France
Denmark
Netherlands
United States
United Kingdom
Nigeria
Other
IEA. All rights reserved.Net
impo
rtsN
et e
xpor
ts
IEA.
All
right
s re
serv
ed.

8. OIL AND NATURAL GAS
133
ENER
GY
SEC
UR
ITY had 274 stations. Esso came fourth, with 249 stations, followed by Best with 129. The four
largest companies had an 83% share of all petrol stations in the country. The number of filling stations has steadily declined over the past decades, but has been relatively stable over the last few years. Air BP and Aviation Fuelling Services Norway are the main jet fuel suppliers. Additionally, Mabanaft started supplying Oslo Gardermoen Airport in July 2020.
Prices and taxes Motor fuel prices in Norway are among the highest of IEA member countries, with a relatively high rate of taxation. Norway’s automotive diesel price is the fourth-highest among IEA member countries, at 1.9 USD/L for Q4 2021, with a tax rate of 51% (Figure 8.6). The gasoline 95 price is also fourth-highest among IEA member countries, at 2.0 USD/L, with a tax rate of 56% (Figure 8.7).
Figure 8.6 Price comparison for automotive diesel in the IEA, Q4 2021
Figure 8.7 Price comparison for unleaded gasoline (95 RON) in the IEA, Q4 2021
Motor fuel prices in Norway are among the highest in the IEA, largely due to a significant tax component.
Notes: Automotive diesel data are not available for Mexico or Sweden. Unleaded gasoline data are not available for Japan, Mexico or Sweden. Source: IEA (2022b).
0.00.51.01.52.02.53.0
USD/L Tax component
IEA. All rights reserved.
0.0
0.5
1.0
1.5
2.0
2.5
3.0USD/L Tax component
IEA. All rights reserved.
IEA.
All
right
s re
serv
ed.

8. OIL AND NATURAL GAS
134
Oil infrastructure
Figure 8.8 Map of Norway’s oil infrastructure
Oil refining There is only one operational refinery left in Norway, Equinor's 230 000 b/d Mongstad plant on the west coast. The refinery is part of a larger complex which includes the processing of NGLs, a crude oil terminal, a co-generation plant and the world’s largest technology centre for CO2 capture from flue gas. The refinery processes both domestic crude and imports, mainly from West Africa.
Various projects are being considered to reduce emissions at the Mongstad refinery, but no investment decisions have yet been taken. Due to overcapacity in the global refining sector and declining domestic demand, a reduction in the refinery’s capacity or a potential closure is possible. However, a premature closure of Mongstad would leave Norway with substantial oil product import requirements, potentially compromising the security of oil supply. As the Mongstad refinery is well-connected with other energy-related activities in the region, its continued operation could provide opportunities for the production of low-carbon fuels and other technologies needed for the energy transition, with export potential.
IEA.
All
right
s re
serv
ed.
8. OIL AND NATURAL GAS
135
ENER
GY
SEC
UR
ITY In June 2021, ExxonMobil permanently closed the 116 000 b/d Slagen refinery and plans
to convert it into a fuel import terminal.
Oil transportation An extensive network of subsea pipelines links offshore oil fields with onshore terminals. Oil infrastructure on the NCS is divided into four different systems. Pipelines from fields in the North Sea run to the Sture, Mongstad and Kårstø (condensate) terminals in Norway, and to the Teesside terminal in the United Kingdom. At the Norwegian terminals, oil is stored in rock caverns before most of it is loaded onto tankers for export. Crude oil is often loaded directly onto tankers at the offshore fields, although onshore terminals were built near some of the larger fields.
Norway’s most significant oil port by tonnage is the Mongstad oil terminal, located near Bergen/Stavanger on the west coast. The terminal is operated by Equinor and is jointly owned by Equinor and Petoro. The Mongstad terminal is linked by pipeline to offshore fields and is also connected to Norway’s only remaining refinery. Other significant oil ports include Sture (operated by Equinor, and also on the west coast close to Bergen) and Slagen (operated by Exxon, located near Tønsberg). Refined products are mainly transported by sea tankers from the Mongstad refinery to terminals around the country.
Oil storage Norway has 17 main storage facilities, located along the coastline, all owned by downstream companies. The largest storage sites are located at Mongstad, Oslo and Slagen. The total storage capacity of oil storages in Norway is 4.4 million cubic metres.
Oil emergency policies
Oil emergency organisation and decision making The oil security system in Norway is part of the national security structure, the Civil Emergency Planning, under the Prime Minister’s Office, within which separate ministries take responsibility for assuring security in their respective fields. The Ministry for Trade, Industry and Fisheries is responsible for oil contingency planning, emergency preparedness, emergency stockholding and crisis management in Norway.
The 2006 Regulation relating to Petroleum Product Storing for Emergency Purposes and the 2011 Act on Business and Industry Preparedness give the Ministry for Trade, Industry and Fisheries wide-ranging powers to prepare for and manage oil supply crises, including implementing a stock release; ordering fuel companies to deliver to specified consumers; temporarily taking operational control of fuel companies’ assets; and instructing fuel companies to provide data relating to imports, exports, storage, and the distribution of crude oil and oil products.
The national emergency strategy organisation (NESO) is comprised of representatives from the Ministry for Trade, Industry and Fisheries; the MPE; the Ministry of Foreign Affairs; the Ministry of Finance; Statistics Norway; and the Council for Fuel Preparedness, an industry advisory group. In the event of a supply emergency, the NESO can be convened within a matter of hours.
IEA.
All
right
s re
serv
ed.
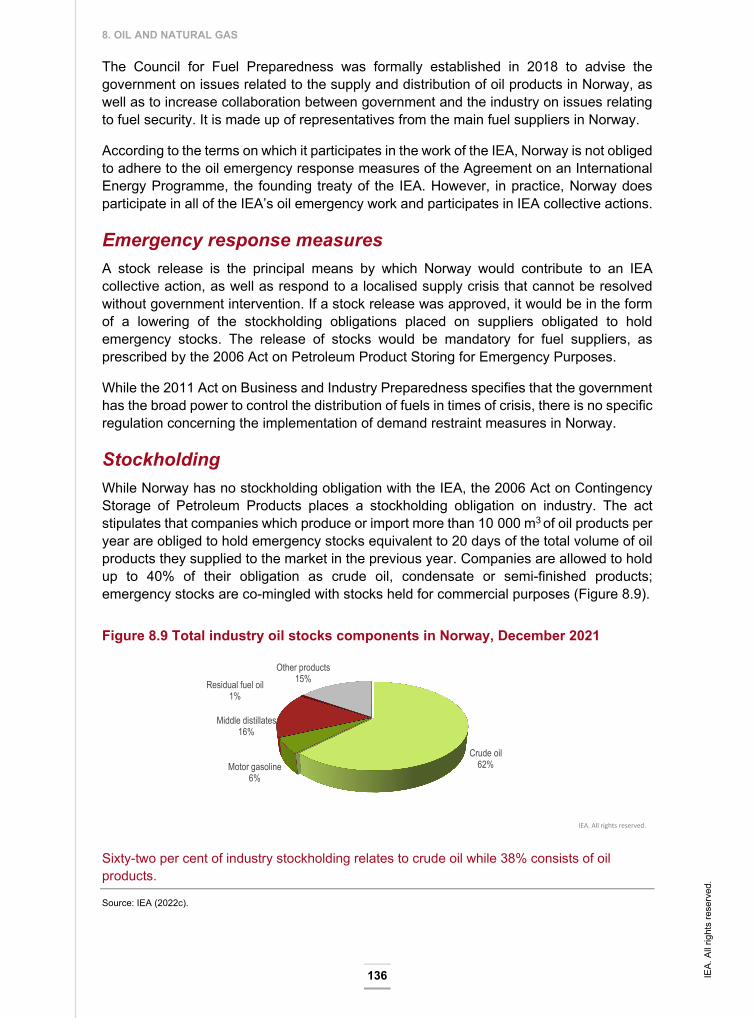
8. OIL AND NATURAL GAS
136
The Council for Fuel Preparedness was formally established in 2018 to advise the government on issues related to the supply and distribution of oil products in Norway, as well as to increase collaboration between government and the industry on issues relating to fuel security. It is made up of representatives from the main fuel suppliers in Norway.
According to the terms on which it participates in the work of the IEA, Norway is not obliged to adhere to the oil emergency response measures of the Agreement on an International Energy Programme, the founding treaty of the IEA. However, in practice, Norway does participate in all of the IEA’s oil emergency work and participates in IEA collective actions.
Emergency response measures A stock release is the principal means by which Norway would contribute to an IEA collective action, as well as respond to a localised supply crisis that cannot be resolved without government intervention. If a stock release was approved, it would be in the form of a lowering of the stockholding obligations placed on suppliers obligated to hold emergency stocks. The release of stocks would be mandatory for fuel suppliers, as prescribed by the 2006 Act on Petroleum Product Storing for Emergency Purposes.
While the 2011 Act on Business and Industry Preparedness specifies that the government has the broad power to control the distribution of fuels in times of crisis, there is no specific regulation concerning the implementation of demand restraint measures in Norway.
Stockholding
While Norway has no stockholding obligation with the IEA, the 2006 Act on Contingency Storage of Petroleum Products places a stockholding obligation on industry. The act stipulates that companies which produce or import more than 10 000 m3 of oil products per year are obliged to hold emergency stocks equivalent to 20 days of the total volume of oil products they supplied to the market in the previous year. Companies are allowed to hold up to 40% of their obligation as crude oil, condensate or semi-finished products; emergency stocks are co-mingled with stocks held for commercial purposes (Figure 8.9).
Figure 8.9 Total industry oil stocks components in Norway, December 2021
Sixty-two per cent of industry stockholding relates to crude oil while 38% consists of oil products.
Source: IEA (2022c).
Crude oil62%Motor gasoline
6%
Middle distillates16%
Residual fuel oil1%
Other products15%
IEA. All rights reserved.
IEA.
All
right
s re
serv
ed.
8. OIL AND NATURAL GAS
137
ENER
GY
SEC
UR
ITY Assessment
Norway is the seventh-largest natural gas producer in the world, supplying 3% of global gas consumption. It is also a significant oil producer, accounting for 2.3% of global oil production in 2020. As a reputable and reliable producer, Norway has played a stabilising role in the world’s oil and gas supply, particularly in meeting European demand.
On the upstream side, Norway has been a global standard-bearer in the health and safety, environmental standards, and stability of oil and gas production for decades. The established system based on a predictable regulatory framework, well-known taxation system and direct involvement of state assets in the exploration make the whole system aligned and serve the overriding goal of Norwegian policy that the society benefits as much as possible from the income generated from oil and gas production.
The government has no plans to reduce its holdings in upstream activities in Norway and the system of established management over the state’s interests in the upstream activities seems to be a model one, maximising returns to society while at the same time guaranteeing stability of returns for investors. This alignment of benefits and obligations has for a long time been a major incentive for foreign companies to compete for stakes in the Norwegian upstream industry, which is set to remain the case for the coming years. However, success in achieving this goal does not mean that the Norwegian oil and gas sector does not face challenges. The most important challenge it faces remains its future in the post-2025 outlook. The country’s commitment to a clean energy transition and net zero before 2050 pledge are new dimensions determining the future of oil and gas exploration in Norway. However, replacing the role of the oil and gas production in the domestic economy will be impossible in the short to medium term.
Decarbonising the upstream sector in Norway will present challenges, especially with very high targets set by the parliament at 50% emissions reductions by 2030 compared to 2005. The challenge is especially notable considering the NCS has the lowest CO2 emissions among all producing regions in the world. Electrification of 50% of offshore production with clean hydropower from shore by 2026 is a promising idea. However, in the context of high electricity prices and Norway’s attempts to electrify numerous other sectors that will drive increased demand for electricity, political and public opposition has grown to the offshore industry’s attempts to access onshore power, potentially hindering its attempts to decarbonise upstream operations.
The national debate on the future of extraction and the opening up of new exploration areas is a hotly debated political and social topic in Norway. The government will have to engage further to clarify its positions to society and set policies serving the public’s expectations.
Despite unparalleled government promotion of electric vehicles leading to a strong consumer uptake, oil demand in transport has not decreased much in Norway in the past decade, aside from 2020 marked by the Covid-19 outbreak. This is a result of many consumers retaining internal combustion engine vehicles, even if they have also purchased EVs. However, with Norway having the world’s highest uptake of EVs (at 85% of new car sales in 2021), domestic oil consumption in transport is inevitably set to
IEA.
All
right
s re
serv
ed.
8. OIL AND NATURAL GAS
138
decrease. With a single refinery left in the country, the government may need to address fuel supply and production of low-carbon fuels.
Reducing oil consumption in transport will also be supported by the continued promotion of biofuels. Norway has introduced a very high biofuels blending mandate at 24.5% and made significant progress in increasing biofuels consumption in transport. However, it has not developed domestic biofuels production to the same degree and relies on imports, which may lead to unnecessary dependency while the country’s potential in that regard remains untapped.
Repurposing of offshore gas infrastructure post-2030, if export levels decrease as planned, needs to be planned well ahead and involve all stakeholders, especially given Norway’s common ownership of infrastructure through the Gassled partnership. Additionally, while the oil and gas industry continues to employ a large number of highly skilled workers, as the market transitions to low-carbon energy sources, attention should be given to how to transition the personnel and make them adaptable to changing needs.
Recent events surrounding Russia’s aggression against Ukraine raise yet another set of concerns in terms of the scale and pace of clean transitions and energy security concerns are back again in mainstream discussions. Given the key role of Norway’s oil and gas exports to Europe, these arguments add to a complexity of challenges the country faces.
While challenges facing Norwegian oil and gas sector are considerable, the government has a sufficient set of tools and resources to meet them in a manner consistent with the expectations of the society. Norway shall, however, remain mindful to the expectations of the international community, for which Norway is both a guarantor of security of supply and a leader in the energy transition.
IEA.
All
right
s re
serv
ed.

8. OIL AND NATURAL GAS
139
ENER
GY
SEC
UR
ITY Recommendations
Oil The government of Norway should:
Evaluate whether the liability management framework is robust enough in light of future decommissioning activity and consider including a financial stress test and requiring security deposits as part of the framework.
Regularly review the combined fiscal regime (royalties, taxes and carbon tax) to ensure that it continues to incentivise companies to invest in emissions reduction projects.
Work alongside the offshore oil and gas industry to develop a clear strategy and binding targets for emissions reductions toward the goal of achieving net zero emissions from upstream activities on the Norwegian continental shelf.
Support worker transition by providing training and development opportunities, helping to prepare for energy transition needs.
Leverage its biomass advantage to increase domestic production of advanced biofuels to meet ambitious biofuels blending mandates and reduce oil consumption in hard-to-abate transport sectors (e.g. freight, marine, aviation), as well as for export.
Carefully monitor the longer-term competitiveness of the Mongstad refinery under the energy transition, given its role in supplying transport fuels, the integrated nature of the refinery in supporting related industries and its potential to produce low-carbon fuels.
Natural gas The government of Norway should:
Ensure that oil and gas can be sustained under environmentally stringent conditions to ensure security of supply for Europe and globally, considering changing demand due to the global supply situation (including implications of Russia’s invasion of Ukraine) and the energy transition.
Ensure that the oil and gas industry has sufficient access to decarbonisation options, particularly with regard to onshore and offshore power sources required for the electrification of offshore production.
Engage in a public debate with all stakeholders on the future of the oil and gas industry, including exploration in the northern Norwegian Sea and Barents Sea.
Plan for the future utilisation of gas infrastructure, when gas exports are projected to decline after 2030, including possible redeployment for hydrogen transport and carbon capture and storage.
IEA.
All
right
s re
serv
ed.
8. OIL AND NATURAL GAS
140
References IEA (International Energy Agency) (2022a), World Energy Balances (database), https://iea.org/data-and-statistics/data-product/world-energy-balances (accessed on 18 February 2022)
IEA (2022b), Monthly Oil Statistics (database) https://iea.org/data-and-statistics/data-product/monthly-oil-statistics (accessed in March 2022)
IEA (2022c), OECD Energy Prices and Taxes Quarterly (database) https://iea.org/data-and-statistics/data-product/oecd-energy-prices-and-taxes-quarterly (accessed in March 2022)
Norsk Petroleum (2022), Norsk Petroleum (website), https://norskpetroleum.no
Offshore Energy (2022), Norway shows lowes and Canada highest upstream carbon footprint, Rystad says, https://offshore-energy.biz/norway-shows-lowest-and-canada-highest-upstream-carbon-footprint-rystad-says
IEA.
All
right
s re
serv
ed.
141
ANN
EXES
ANNEX A: Review team and supporting stakeholders
Review criteria The Shared Goals, adopted by the IEA Ministers at their 4 June 1993 meeting in Paris, provide the
evaluation criteria for the in-depth reviews. The IEA Shared Goals are available on line.
Review team and preparation of the report The IEA’s in-depth review visit of Norway took place on line from 17 to 28 January 2022. The review team
met with government officials, energy suppliers, market participants, interest groups, consumer
associations, research institutions and other stakeholders. This report was drafted based on information
obtained in these meetings, the review team’s assessment of Norway’s energy policy, the government’s
response to the IEA energy policy questionnaire and subsequent research by the IEA. The members of
the team were:
IEA member countries Lars Georg Jensen, Denmark (team leader)
Tamaryn Napp, United Kingdom
Cristina Cardoso, Portugal
Anne-Marie Clancy, Ireland
Michael Moser, Switzerland
Rein Vaks, Estonia
Thomas Moore, United States
Dennis Trigylidas, Canada
International Energy Agency Aad van Bohemen
Divya Reddy
Milosz Karpinski
Ronan Graham
The team is grateful for the co-operation and assistance of the many people it met throughout the visit.
Thanks to their kind hospitality, openness and willingness to share information, the virtual visit was highly
informative, productive and enjoyable. The team expresses particular gratitude to the Norwegian Ministry
for Petroleum and Energy for organising the visit and for all its support throughout the review process,
especially to Monica Skog Jackson, Inger Østensen, Lisbeth Muhr, Knut Mansika and Charlotte Elvsaas.
The team is also sincerely grateful to Secretary General Andreas Eriksen and several other senior officials
from the Ministry for Petroleum and Energy for meeting with the review team.
IEA.
All
right
s re
serv
ed.
ANNEXES
142
Divya Reddy managed the review visit process and drafted the report, with the exception of Chapter 8,
which was prepared by Milosz Karpinski and Ronan Graham of the IEA.
The report was prepared under the guidance of Aad van Bohemen, Advisor to the Energy Markets and
Security Directorate. Helpful comments and updates were provided by the review team members and IEA
staff, including Simon Bennett, Toril Bosoni, Chiara D’Adamo, Paolo Frankl, Insa Handschuch,
Craig Hart, Kevin Lane, Sara Moarif and Fabian Voswinkel.
Clémence Lizé, Alessio Scanziani, Anders Caratozzolo and Eunjin Choe managed the data and prepared
the figures. Roberta Quadrelli, Erica Robin, Stève Gervais and Jungyu Park provided support on
statistics. Therese Walsh managed the editing process, Jennifer Allain copy edited the report,
Taline Shahinian and Allison Leacu managed the design process, Astrid Dumond and
Isabelle Nonain-Semelin managed the production process. Jad Mouawad and Jethro Mullen supported
the press launch.
Organisations visited Bellona CICERO DNV Drivkraft Norge Energi Norge Equinor Federation of Norwegian Industries FME Include FME NTRANS Havvindklynga Institute for Energy Technology (IFE) Landsorganisasjonen Norge (LO) Natur og Ungdom Naturvernforbundet Nelfo NordPool Norsk Industri Norwea Norwegian Ministry of Climate and Environment Norwegian Ministry of Finance Norwegian Ministry of Petroleum and Energy Norwegian Oil and Gas Norwegian Research Centre (NORCE) Norwegian University of Science and Technology (NTNU) SINTEF Statkraft University of Oslo ZERO
IEA.
All
right
s re
serv
ed.
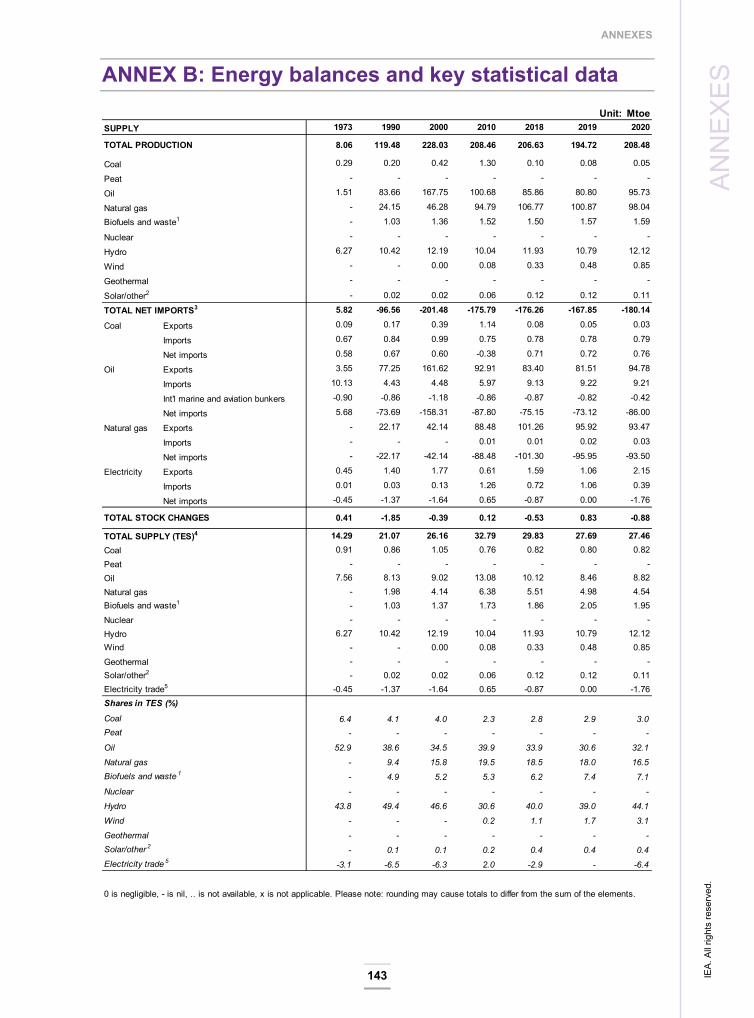
ANNEXES
143
ANN
EXES
ANNEX B: Energy balances and key statistical data
Unit: MtoeSUPPLY 1973 1990 2000 2010 2018 2019 2020
TOTAL PRODUCTION 8.06 119.48 228.03 208.46 206.63 194.72 208.48
Coal 0.29 0.20 0.42 1.30 0.10 0.08 0.05
Peat - - - - - - -
Oil 1.51 83.66 167.75 100.68 85.86 80.80 95.73
Natural gas - 24.15 46.28 94.79 106.77 100.87 98.04
Biofuels and waste1 - 1.03 1.36 1.52 1.50 1.57 1.59
Nuclear - - - - - - -
Hydro 6.27 10.42 12.19 10.04 11.93 10.79 12.12
Wind - - 0.00 0.08 0.33 0.48 0.85
Geothermal - - - - - - -
Solar/other2 - 0.02 0.02 0.06 0.12 0.12 0.11
TOTAL NET IMPORTS3 5.82 -96.56 -201.48 -175.79 -176.26 -167.85 -180.14
Coal Exports 0.09 0.17 0.39 1.14 0.08 0.05 0.03
Imports 0.67 0.84 0.99 0.75 0.78 0.78 0.79
Net imports 0.58 0.67 0.60 -0.38 0.71 0.72 0.76
Oil Exports 3.55 77.25 161.62 92.91 83.40 81.51 94.78
Imports 10.13 4.43 4.48 5.97 9.13 9.22 9.21
Int'l marine and aviation bunkers -0.90 -0.86 -1.18 -0.86 -0.87 -0.82 -0.42
Net imports 5.68 -73.69 -158.31 -87.80 -75.15 -73.12 -86.00
Natural gas Exports - 22.17 42.14 88.48 101.26 95.92 93.47
Imports - - - 0.01 0.01 0.02 0.03
Net imports - -22.17 -42.14 -88.48 -101.30 -95.95 -93.50
Electricity Exports 0.45 1.40 1.77 0.61 1.59 1.06 2.15
Imports 0.01 0.03 0.13 1.26 0.72 1.06 0.39
Net imports -0.45 -1.37 -1.64 0.65 -0.87 0.00 -1.76
TOTAL STOCK CHANGES 0.41 -1.85 -0.39 0.12 -0.53 0.83 -0.88
TOTAL SUPPLY (TES)4 14.29 21.07 26.16 32.79 29.83 27.69 27.46Coal 0.91 0.86 1.05 0.76 0.82 0.80 0.82Peat - - - - - - -Oil 7.56 8.13 9.02 13.08 10.12 8.46 8.82Natural gas - 1.98 4.14 6.38 5.51 4.98 4.54Biofuels and waste1 - 1.03 1.37 1.73 1.86 2.05 1.95Nuclear - - - - - - -Hydro 6.27 10.42 12.19 10.04 11.93 10.79 12.12Wind - - 0.00 0.08 0.33 0.48 0.85Geothermal - - - - - - -Solar/other2 - 0.02 0.02 0.06 0.12 0.12 0.11Electricity trade5 -0.45 -1.37 -1.64 0.65 -0.87 0.00 -1.76Shares in TES (%)
Coal 6.4 4.1 4.0 2.3 2.8 2.9 3.0Peat - - - - - - -
Oil 52.9 38.6 34.5 39.9 33.9 30.6 32.1
Natural gas - 9.4 15.8 19.5 18.5 18.0 16.5Biofuels and waste 1 - 4.9 5.2 5.3 6.2 7.4 7.1
Nuclear - - - - - - -
Hydro 43.8 49.4 46.6 30.6 40.0 39.0 44.1
Wind - - - 0.2 1.1 1.7 3.1
Geothermal - - - - - - -Solar/other 2 - 0.1 0.1 0.2 0.4 0.4 0.4Electricity trade 5 -3.1 -6.5 -6.3 2.0 -2.9 - -6.4
0 is negligible, - is nil, .. is not available, x is not applicable. Please note: rounding may cause totals to differ from the sum of the elements.
IEA.
All
right
s re
serv
ed.
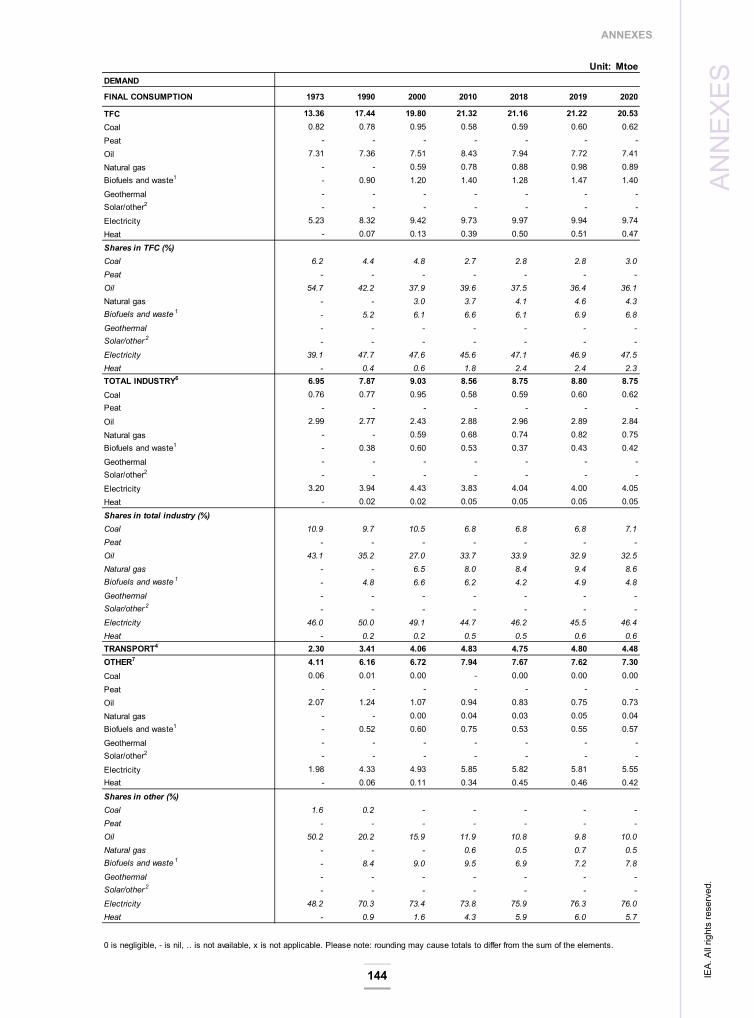
ANNEXES
144
ANN
EXES
Unit: MtoeDEMAND
FINAL CONSUMPTION 1973 1990 2000 2010 2018 2019 2020
TFC 13.36 17.44 19.80 21.32 21.16 21.22 20.53Coal 0.82 0.78 0.95 0.58 0.59 0.60 0.62Peat - - - - - - -Oil 7.31 7.36 7.51 8.43 7.94 7.72 7.41Natural gas - - 0.59 0.78 0.88 0.98 0.89Biofuels and waste1 - 0.90 1.20 1.40 1.28 1.47 1.40Geothermal - - - - - - -Solar/other2 - - - - - - -Electricity 5.23 8.32 9.42 9.73 9.97 9.94 9.74Heat - 0.07 0.13 0.39 0.50 0.51 0.47Shares in TFC (%) Coal 6.2 4.4 4.8 2.7 2.8 2.8 3.0Peat - - - - - - -Oil 54.7 42.2 37.9 39.6 37.5 36.4 36.1Natural gas - - 3.0 3.7 4.1 4.6 4.3Biofuels and waste 1 - 5.2 6.1 6.6 6.1 6.9 6.8Geothermal - - - - - - -Solar/other 2 - - - - - - -Electricity 39.1 47.7 47.6 45.6 47.1 46.9 47.5Heat - 0.4 0.6 1.8 2.4 2.4 2.3TOTAL INDUSTRY6 6.95 7.87 9.03 8.56 8.75 8.80 8.75Coal 0.76 0.77 0.95 0.58 0.59 0.60 0.62Peat - - - - - - -Oil 2.99 2.77 2.43 2.88 2.96 2.89 2.84Natural gas - - 0.59 0.68 0.74 0.82 0.75Biofuels and waste1 - 0.38 0.60 0.53 0.37 0.43 0.42Geothermal - - - - - - -Solar/other2 - - - - - - -Electricity 3.20 3.94 4.43 3.83 4.04 4.00 4.05Heat - 0.02 0.02 0.05 0.05 0.05 0.05Shares in total industry (%) Coal 10.9 9.7 10.5 6.8 6.8 6.8 7.1Peat - - - - - - -Oil 43.1 35.2 27.0 33.7 33.9 32.9 32.5Natural gas - - 6.5 8.0 8.4 9.4 8.6Biofuels and waste 1 - 4.8 6.6 6.2 4.2 4.9 4.8Geothermal - - - - - - -Solar/other 2 - - - - - - -Electricity 46.0 50.0 49.1 44.7 46.2 45.5 46.4Heat - 0.2 0.2 0.5 0.5 0.6 0.6TRANSPORT4 2.30 3.41 4.06 4.83 4.75 4.80 4.48OTHER7 4.11 6.16 6.72 7.94 7.67 7.62 7.30Coal 0.06 0.01 0.00 - 0.00 0.00 0.00Peat - - - - - - -Oil 2.07 1.24 1.07 0.94 0.83 0.75 0.73Natural gas - - 0.00 0.04 0.03 0.05 0.04Biofuels and waste1 - 0.52 0.60 0.75 0.53 0.55 0.57Geothermal - - - - - - -Solar/other2 - - - - - - -Electricity 1.98 4.33 4.93 5.85 5.82 5.81 5.55Heat - 0.06 0.11 0.34 0.45 0.46 0.42Shares in other (%) Coal 1.6 0.2 - - - - -Peat - - - - - - -Oil 50.2 20.2 15.9 11.9 10.8 9.8 10.0Natural gas - - - 0.6 0.5 0.7 0.5Biofuels and waste 1 - 8.4 9.0 9.5 6.9 7.2 7.8Geothermal - - - - - - -Solar/other 2 - - - - - - -Electricity 48.2 70.3 73.4 73.8 75.9 76.3 76.0Heat - 0.9 1.6 4.3 5.9 6.0 5.7
0 is negligible, - is nil, .. is not available, x is not applicable. Please note: rounding may cause totals to differ from the sum of the elements.
IEA.
All
right
s re
serv
ed.

ANNEXES
145
Unit: MtoeDEMAND
ENERGY TRANSFORMATION AND LOSSES 1973 1990 2000 2010 2018 2019 2020
ELECTRICITY GENERATION8
Input (Mtoe) 6.31 10.58 12.42 11.27 13.35 12.31 13.83Output (Mtoe) 6.28 10.46 12.26 10.60 12.57 11.56 13.21Output (TWh) 73.03 121.61 142.51 123.22 146.18 134.41 153.59Output shares (%)Coal - 0.1 0.1 0.1 0.1 0.1 0.1Peat - - - - - - -Oil 0.2 - - 0.1 0.3 0.3 0.1Natural gas - - 0.1 3.9 1.5 1.5 1.0Biofuels and waste 1 - 0.2 0.2 0.4 0.3 0.3 0.3Nuclear - - - - - - -Hydro 99.8 99.6 99.5 94.7 94.9 93.4 91.8Wind - - - 0.7 2.7 4.1 6.5Geothermal - - - - - - -Solar/other 2 - 0.1 - .. - - -TOTAL LOSSES 0.89 3.78 5.26 6.69 7.25 7.09 6.96of which:Electricity and heat generation9 0.03 0.06 0.06 0.38 0.42 0.38 0.29Other transformation 0.12 0.05 0.05 -0.29 -0.26 -0.21 -0.20Own use and transmission/distribution losses 0.73 3.67 5.15 6.60 7.08 6.92 6.87Statistical differences 0.05 -0.15 1.10 4.78 1.43 -0.62 -0.04
INDICATORS 1973 1990 2000 2010 2018 2019 2020
GDP (billion 2015 USD) 120.09 210.97 302.85 354.11 403.45 406.89 403.77Population (millions) 3.96 4.24 4.49 4.89 5.31 5.35 5.38TES/GDP (toe/1000 USD)10 0.12 0.10 0.09 0.09 0.07 0.07 0.07Energy production/TES 0.56 5.67 8.72 6.36 6.93 7.03 7.59Per capita TES (toe/capita) 3.61 4.97 5.83 6.71 5.62 5.18 5.10Oil supply/GDP (toe/1000 USD)10 0.06 0.04 0.03 0.04 0.03 0.02 0.02TFC/GDP (toe/1000 USD)10 0.11 0.08 0.07 0.06 0.05 0.05 0.05Per capita TFC (toe/capita) 3.37 4.11 4.41 4.36 3.98 3.97 3.82CO2 emissions from fuel combustion (MtCO2)11 23.4 27.5 31.9 38.7 37.5 36.6 35.1CO2 emissions from bunkers (MtCO2)11 2.8 2.7 3.7 2.7 2.8 2.6 1.4
GROWTH RATES (% per year) 73-90 90-00 00-10 10-17 17-18 18-19 19-20
TES 2.3 2.2 2.3 -1.2 -0.7 -7.2 -0.8Coal -0.3 2.0 -3.2 1.5 -2.9 -2.7 2.8Peat - - - - - - -Oil 0.4 1.1 3.8 -2.5 -7.9 -16.4 4.3Natural gas - 7.7 4.4 -3.5 10.6 -9.6 -8.8Biofuels and waste1 - 2.8 2.4 1.4 -2.7 10.4 -5.2Nuclear - - - - - - -Hydro 3.0 1.6 -1.9 2.9 -2.5 -9.6 12.3Wind - - 39.5 18.3 35.8 42.8 79.0Geothermal - - - - - - -Solar/other2 - 0.8 11.3 11.0 -5.5 2.1 -9.3TFC 1.6 1.3 0.7 -0.2 0.6 0.3 -3.2Electricity consumption 2.8 1.2 0.3 0.1 1.9 -0.2 -2.0Energy production 17.2 6.7 -0.9 0.6 -5.0 -5.8 7.1Net oil imports .. .. .. .. .. .. ..GDP 3.4 3.7 1.6 1.7 1.1 0.9 -0.8TES/GDP -1.0 -1.4 0.7 -2.9 -1.9 -7.8 -0.1TFC/GDP -1.7 -2.3 -0.8 -1.9 -0.6 -0.6 -2.3
0 is negligible, - is nil, .. is not available, x is not applicable. Please note: rounding may cause totals to differ from the sum of the elements.
IEA.
All
right
s re
serv
ed.
ANNEXES
146
ANN
EXES
Footnotes to energy balances and key statistical data 1 Biofuels and waste comprise solid biofuels, liquid biofuels, biogases, industrial waste and municipal
waste. Data are often based on partial surveys and may not be comparable between countries. 2 Other includes ambient heat used in heat pumps. 3 In addition to coal, oil, natural gas and electricity, total net imports also include biofuels. 4 Excludes international marine bunkers and international aviation bunkers. 5 Total supply of electricity represents net trade. A negative number in the share of TES indicates
that exports are greater than imports. 6 Industry includes non-energy use. 7 Other includes residential, commercial and public services, agriculture/forestry, fishing and other
non-specified. 8 Inputs to electricity generation include inputs to electricity, CHP and heat plants. Output refers only
to electricity generation. 9 Losses arising in the production of electricity and heat at main activity producer utilities and
autoproducers. For non-fossil-fuel electricity generation, theoretical losses are shown based on plant
efficiencies of approximately 100% for hydro, wind and solar photovoltaic. 10 Toe per thousand US dollars at 2015 prices and exchange rates. 11 “CO2 emissions from fuel combustion” have been estimated using the IPCC Tier I Sectoral
Approach methodology from the 2006 IPCC Guidelines. Emissions from international marine and aviation
bunkers are not included in national totals.
IEA.
All
right
s re
serv
ed.
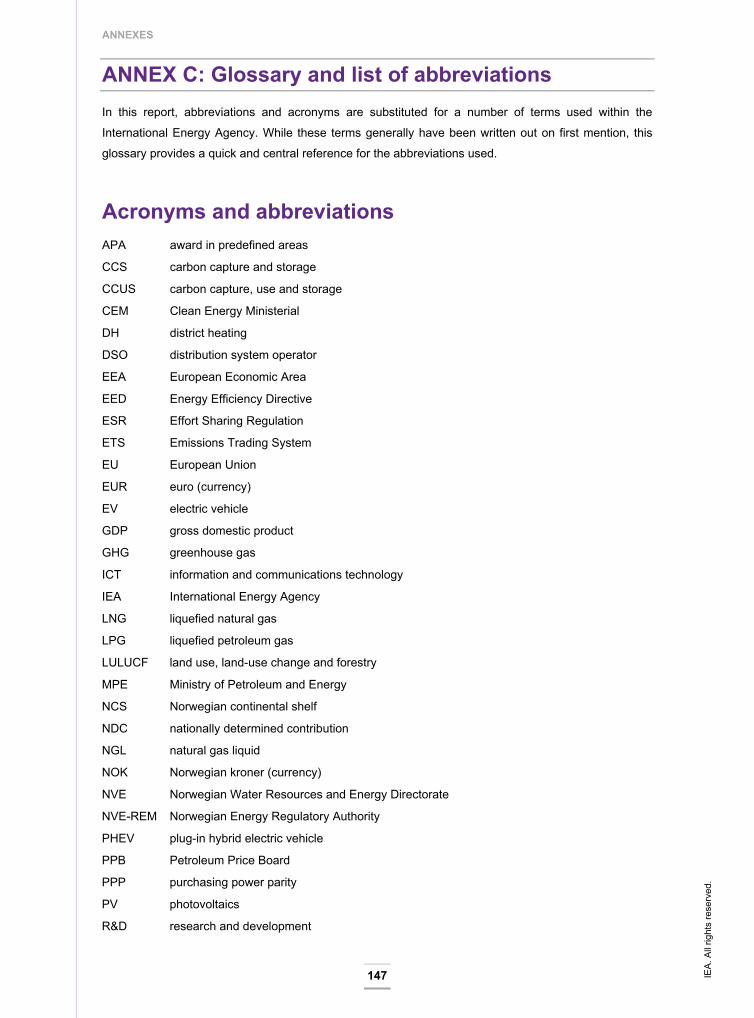
ANNEXES
147
ANNEX C: Glossary and list of abbreviations
In this report, abbreviations and acronyms are substituted for a number of terms used within the
International Energy Agency. While these terms generally have been written out on first mention, this
glossary provides a quick and central reference for the abbreviations used.
Acronyms and abbreviations APA award in predefined areas
CCS carbon capture and storage
CCUS carbon capture, use and storage
CEM Clean Energy Ministerial
DH district heating
DSO distribution system operator
EEA European Economic Area
EED Energy Efficiency Directive
ESR Effort Sharing Regulation
ETS Emissions Trading System
EU European Union
EUR euro (currency)
EV electric vehicle
GDP gross domestic product
GHG greenhouse gas
ICT information and communications technology
IEA International Energy Agency
LNG liquefied natural gas
LPG liquefied petroleum gas
LULUCF land use, land-use change and forestry
MPE Ministry of Petroleum and Energy
NCS Norwegian continental shelf
NDC nationally determined contribution
NGL natural gas liquid
NOK Norwegian kroner (currency)
NVE Norwegian Water Resources and Energy Directorate
NVE-REM Norwegian Energy Regulatory Authority
PHEV plug-in hybrid electric vehicle
PPB Petroleum Price Board
PPP purchasing power parity
PV photovoltaics
R&D research and development
IEA.
All
right
s re
serv
ed.

ANNEXES
148
ANN
EXES
RCN Research Council of Norway
RD&D research, development and demonstration
SDFI State’s Direct Financial Interest
TES total energy supply
TFC total final consumption
TFEC total final energy consumption
TSO transmission system operator
USD United States dollar (currency)
VAT value-added tax
ZEV zero-emission vehicle
Units of measure bcm billion cubic metres
g CO2 gramme of carbon dioxide
GW gigawatt
GWh gigawatt hour
kb/d thousand barrels per day
kg kilogramme
kg CO2 kilogramme of carbon dioxide
km kilometre
kV kilovolt
kWh kilowatt hour
Mt million tonnes
Mt CO2-eq million tonnes carbon dioxide equivalent
Mtoe million tonnes of oil equivalent
MW megawatt
t CO2-eq tonne carbon dioxide equivalent
toe tonne of oil equivalent
TWh terawatt hour
V volt
IEA.
All
right
s re
serv
ed.

This publication reflects the views of the IEA Secretariat but does not necessarily reflect those of individual IEA member countries. The IEA makes no representation or warranty, express or implied, in respect of the publication’s contents (including its completeness or accuracy) and shall not be responsible for any use of, or reliance on, the publication.
Unless otherwise indicated, all material presented in figures and tables is derived from IEA data and analysis.
This publication and any map included herein are without prejudice to the status of or sovereignty over any territory, to the delimitation of international frontiers and boundaries and to the name of any territory, city or area.
IEA. All rights reserved.IEA PublicationsInternational Energy AgencyWebsite: www.iea.orgContact information: www.iea.org/about/contactTypeset in France by IEA - June 2022Cover design: IEA

Norway 2022Energy Policy Review
The International Energy Agency (IEA) regularly conducts in-depth peer reviews of the energy policies of its member countries. This process supports energy policy development and encourages the exchange of international best practices and experiences.
Since the last IEA review in 2017, Norway has remained a global pillar of energy security, providing the world with stable supplies of oil and gas produced in an environmentally conscious manner. Norway has updated its already ambitious targets to reduce greenhouse gas emissions, with plans to achieve 90-95% reductions (excluding sinks) from 1990 levels by 2050.
Norway has considerable work ahead to meet these ambitious targets. Since its electricity generation produces nearly zero emissions already and the country has substantially electrified its energy demand, many of the easy wins for reducing emissions have already been achieved. The remaining reductions will be more complex, challenging and costly, notably in transport and industry.
Norway has many natural advantages to facilitate a successful energy and climate transition. In particular, it can be well-positioned to lead the world on new technologies for decarbonising hard-to-abate sectors, such as electric vehicles, carbon capture and storage, and hydrogen, if the right policies and incentives are put in place.
In this report, the IEA provides energy policy recommendations to help Norway effectively manage the transformation of its energy sector in line with its goals.