
Electricity Market Report - Jan 2022 - NET
118
January 2022 Electricity Market Report
-
Upload
khangminh22 -
Category
Documents
-
view
4 -
download
0
Transcript of Electricity Market Report - Jan 2022 - NET

January 2022Electricity Market Report


PAGE | 3
Abstract
IEA
. All
right
s res
erve
d.
Electricity Market Report – January 2022
Abstract The year 2021 placed exceptional demands on electricity markets around the world. Strong economic growth, combined with more extreme weather conditions than in 2020, including a colder than average winter, boosted global electricity demand by more than 6% – the largest increase since the recovery from the financial crisis in 2010. The fast rebound in overall energy demand strained supply chains for coal and natural gas, pushing up wholesale electricity prices. Despite the impressive growth of renewable power, electricity generation from coal and gas hit record levels. As a result, the global electricity sector’s annual carbon dioxide emissions leaped to a new all-time high after having decreased for the previous two years.
Building on our analysis of these recent events, the January 2022 edition of the IEA Electricity Market Report presents our forecasts for demand, supply and emissions in global electricity markets through 2024. While renewables are set to meet the vast majority of the increase in global electricity demand in the coming years, this trend would only result in a plateauing of emissions from electricity generation. That is insufficient for the power sector to fulfil its critical role as a leading force in the decarbonisation of economies around the world.

Electricity Market Report – January 2022
PAGE | 4
IEA
. All
right
s res
erve
d.
Table of contents
Table of contents
Executive summary ......................................................................................... 5 Global overview ............................................................................................... 7
Demand, supply and emissions ................................................................ 8 Economic recovery .................................................................................. 15 Fossil fuels ............................................................................................... 18 Wholesale prices ..................................................................................... 27 Climate protection policies and impact .................................................... 30
Regional perspective ..................................................................................... 39 Asia Pacific .............................................................................................. 40 Americas .................................................................................................. 59 Europe ..................................................................................................... 68 Eurasia .................................................................................................... 80 Middle East .............................................................................................. 87 Africa ....................................................................................................... 94
Annex ............................................................................................................ 103

Electricity Market Report – January 2022
PAGE | 5
Executive summary
IEA
. All
right
s res
erve
d.
Executive summary

PAGE | 6
Executive summary
IEA
. All
right
s res
erve
d.
Electricity Market Report – January 2022
Executive summary After small drop in 2020, global electricity demand grew by 6% in 2021. It was the largest ever annual increase in absolute terms (over 1 500 TWh) and the largest percentage rise since 2010 after the financial crisis. Around half of the global growth took place in China, where demand increased by an estimated 10%. Global electricity demand was boosted by a rapid economic recovery, combined with more extreme weather conditions than in 2020, including a colder than average winter. The industrial sector contributed the most to demand growth, followed by the commercial and services sector and then the residential sector.
Coal met more than half of the increase in global demand. Coal-fired electricity generation reached an all-time peak, growing by 9%, the fastest since 2011, propelled by the exceptional demand and coal’s cost competitiveness in some markets compared to gas. Renewables grew strongly, by 6%, despite growth being limited by unfavourable weather conditions (in particular for hydropower). Gas-fired generation grew by 2%, while nuclear increased by 3.5%, almost reaching its 2019 levels. In total, CO2 emissions from electricity rose by close to 7%, taking them to a record high.
The increased demand for fossil fuels combined with supply constraints resulted in scarcities and high energy prices. Due to particularly high prices for gas in Europe and its 20% share in the generation mix, average wholesale electricity prices in the fourth quarter of 2021 were more than four times as high as their 2015-2020 average.
During 2022-2024, we expect rapidly growing renewables to almost match moderate demand growth. We anticipate average annual electricity demand growth of 2.7%, but the Covid-19 pandemic and high energy prices add uncertainty to this. Record-breaking renewables growth (up 8% per year on average) is set to serve more than 90% of net demand growth during this period. We expect nuclear-based generation to grow by 1% annually during the same period (meeting 4% of global demand growth).
Fossil fuel generation is set to stagnate over the next three years. As a consequence of slowing electricity demand growth and significant additions of renewable power capacity, fossil fuel-based generation is seen broadly flat in the coming years. We expect coal-fired generation to fall slightly as phase-outs and declining competitiveness relative to natural gas in markets like the United States and Europe are offset by growth in China and India. Gas-fired generation is forecast to grow annually by around 1%.
Today’s policy settings are insufficient to cut emissions. In our forecast, power sector emissions remain around the same level from 2021 to 2024, whereas they need to start declining sharply to meet the IEA’s Net Zero Emissions by 2050 Scenario. This underlines the massive changes needed in terms of energy efficiency and low-carbon supply for the electricity sector to fulfil its critical role in decarbonising the broader energy system.

Electricity Market Report – January 2022
PAGE | 7
Global overview
IEA
. All
right
s res
erve
d.
Global overview

Electricity Market Report – January 2022
PAGE | 8
Global overview
IEA
. All
right
s res
erve
d.
Demand, supply and emissions

Electricity Market Report – January 2022
PAGE | 9
Global overview
IEA
. All
right
s res
erve
d.
After a strong increase in 2021, demand growth slows in the coming yearsAfter small drop in 2020, global electricity demand grew by around 6% in 2021. It was the largest ever annual increase in absolute terms (over 1 500 TWh) and the largest relative rise since the recovery from the financial crisis in 2010. A rapid economic recovery, combined with more extreme weather conditions than in 2020, including a colder than average winter, boosted demand. We estimate that the industrial sector contributed the most to demand growth, followed by the commercial and services sector and then the residential sector.
Due to the fast recovery in 2021, we have revised our expectations for electricity demand growth in 2022 down from 4% to 3%. This is similar to the average growth rate for the 10 years before the Covid-19 pandemic. Demand growth continues strongly for three major reasons. First, we expect a continued economic recovery. Second, rebound effects will continue in 2022 because health protection measures in place at times in 2021 dampened demand. And finally, the expected easing of the energy crisis, which resulted in supply shortages and prohibitively high energy prices in the fourth quarter of 2021, will support growth. However, the development of energy prices and the Covid-19 pandemic are the main uncertainties for the demand outlook. We expect a slowdown in global electricity demand growth during 2023 (2.6% increase) and 2024 (slightly above 2% increase) as rebound effects run out and energy efficiency measures start showing effects.
The majority of supply growth in the years 2021 to 2024 is expected in China, accounting for around half of the net total increase, followed by India (12%), Europe (7%) and the United States (4%).
China faced some supply difficulties at the beginning of the fourth quarter of 2021 due to coal shortages. After demand in the first three quarters of the year increased by almost 11% compared to the same period in 2020, we expect close to 10% growth for the full year. For the years 2022-2024 we expect demand growth to slow to an average of 4.5% (we refer to the compound average annual growth rate (CAAGR) when talking about average growth) due to efficiency improvements and slower economic growth.
Demand in India declined by 7% from April to May 2021 due to surging Covid-19 cases. Consumption quickly recovered in June and reached new all-time highs in July and August. Temporary coal supply shortages, peaking at the beginning of the fourth quarter of 2021, did not prevent strong annual growth overall, estimated at 10% year-on-year.
In Europe and the United States, demand in 2021 recovered to reach similar levels to those seen in 2019 before the pandemic – supported in both regions by higher weather-driven demand. For the coming years we expect slow average growth, with energy efficiency measures countering increasing electrification.

Electricity Market Report – January 2022
PAGE | 10
Global overview
IEA
. All
right
s res
erve
d.
Global demand growth is concentrated in emerging and developing Asia Global change in electricity demand, 2015-2024
IEA. All rights reserved.
Source: IEA analysis based on data from IEA (2022), Data and statistics.
-1 000
- 500
0
500
1 000
1 500
2 000
2015 2016 2017 2018 2019 2020 2021 2022 2023 2024
Cha
nge
in e
lect
ricity
dem
and
(TW
h)
China United States India Europe Others Net change

Electricity Market Report – January 2022
PAGE | 11
Global overview
IEA
. All
right
s res
erve
d.
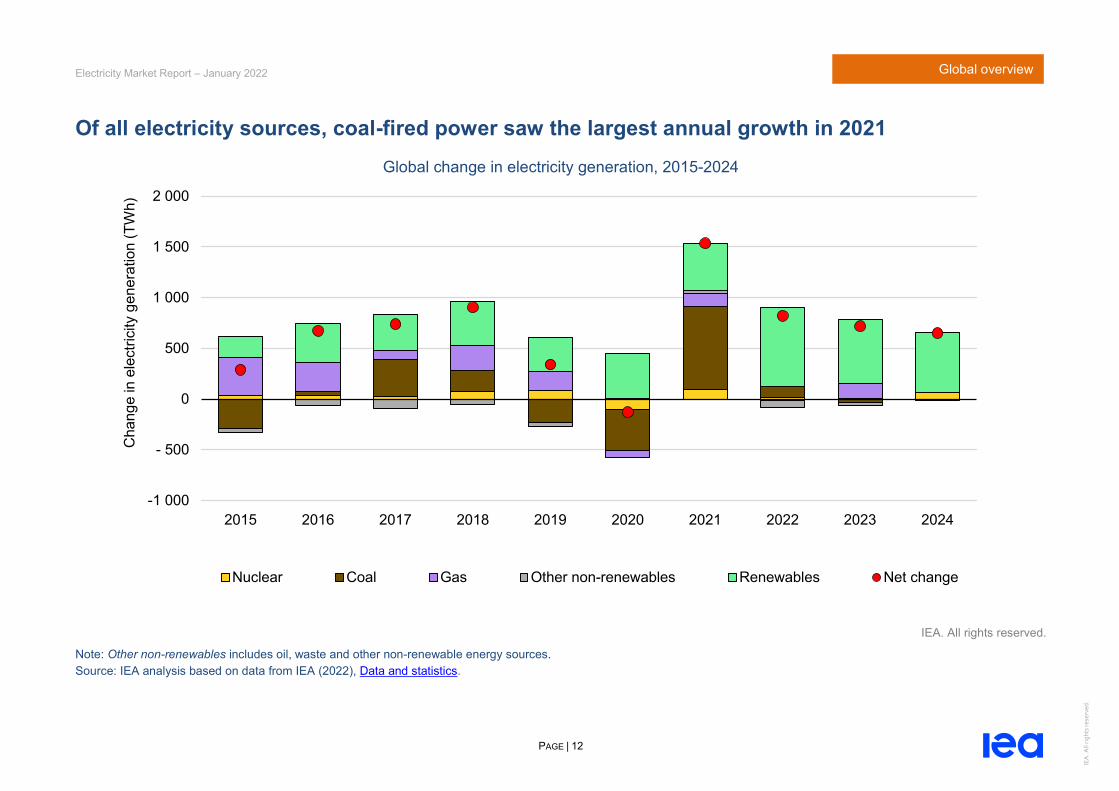
Coal came back in 2021, but renewables dominate medium-term supply growthThe year 2021 was exceptional for electricity markets due to the strong growth in electricity demand, unfavourable renewable conditions and increasing gas prices.
Total thermal electricity generation increased by almost 6% (980 TWh) in 2021, the highest growth since 2010. After declining in 2019 and 2020, coal-fired electricity generation increased by around 9% and reached a new all-time high. Coal served more than half of the additional demand in 2021, growing in absolute terms faster than renewable energy for the first time since 2013. Gas-fired electricity, hampered by high gas prices, increased globally by 2%, offsetting the decline in 2020.
Low-carbon generation increased by 5.5% (555 TWh) in 2021, with 83% of it being renewable. Despite unfavourable weather conditions, absolute growth in renewable electricity generation in 2021 was the highest ever in absolute terms (up 6%). Nuclear grew by around 3.5% to reach almost the level of 2019.
The outlook for 2022 to 2024 shows a quite different picture from that seen in 2021. Assuming weather conditions return to long-term averages, we expect renewables to be responsible for the vast majority of the supply increase in the coming years, growing on average by 8% per year. By 2024 renewable electricity could
provide more than 32% of the world’s electricity supply (from 28% in 2021).
Nuclear electricity generation is forecast to grow on average by 1% between 2022 and 2024, mostly supported by nuclear generation growth in the Asia Pacific region. In total, we expect the low-carbon share of total generation to increase to 42% (from 38% in 2021).
Although almost stagnating from 2022 to 2024 (growing on average by 0.2% annually), we expect fossil fuels still to produce 58% of total electricity generation in 2024, down from 62% in 2021.
Despite a growing number of zero emissions pledges and phase-out plans for unabated coal, we expect coal-fired electricity generation to provide 34% of global generation in 2024, down from 36% in 2021. After the steep increase in 2021, we anticipate coal-fired generation to remain flat until 2024.
After reaching around pre-pandemic 2019 generation levels in 2021, we see gas-fired electricity growing at an average 1% annual pace until 2024. The majority of this growth, however, is expected in 2023, when current forwards indicate a return of gas prices to lower levels.
Electricity Market Report – January 2022
PAGE | 12
Global overview
IEA
. All
right
s res
erve
d.
Of all electricity sources, coal-fired power saw the largest annual growth in 2021 Global change in electricity generation, 2015-2024
IEA. All rights reserved.
Note: Other non-renewables includes oil, waste and other non-renewable energy sources. Source: IEA analysis based on data from IEA (2022), Data and statistics.
-1 000
- 500
0
500
1 000
1 500
2 000
2015 2016 2017 2018 2019 2020 2021 2022 2023 2024
Cha
nge
in e
lect
ricity
gen
erat
ion
(TW
h)
Nuclear Coal Gas Other non-renewables Renewables Net change

Electricity Market Report – January 2022
PAGE | 13
Global overview
IEA
. All
right
s res
erve
d.
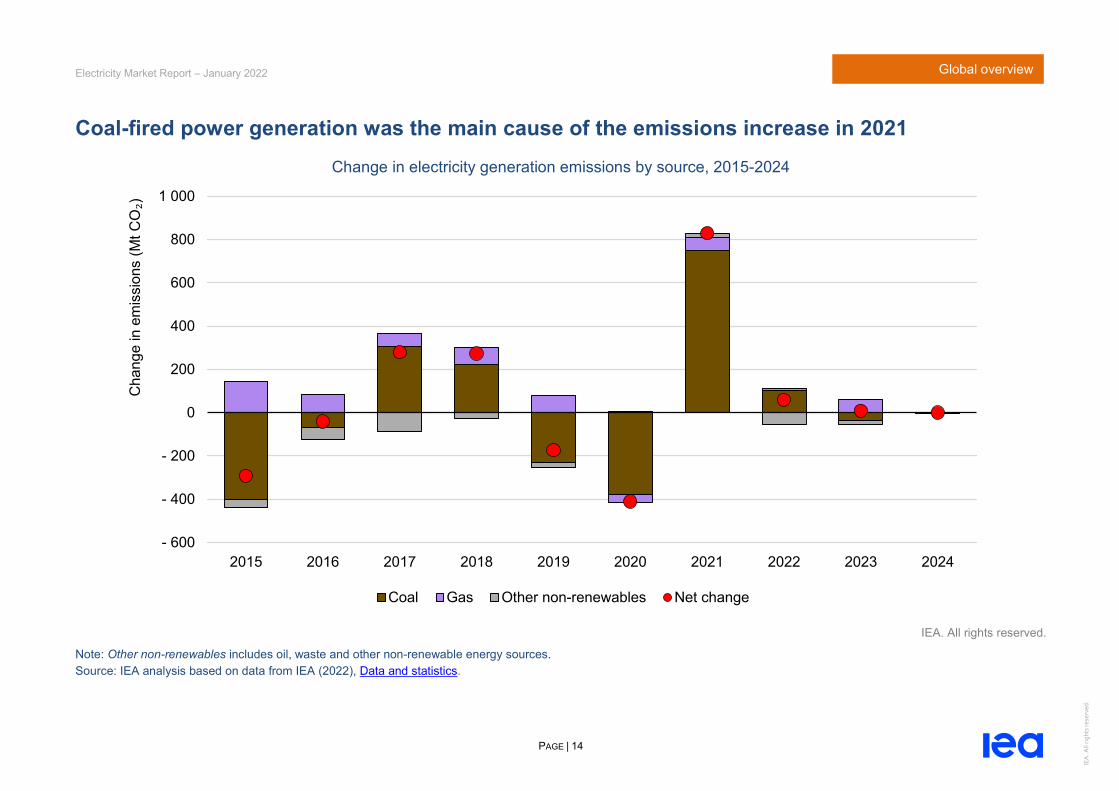
Global power system emissions jumped in 2021; expected to plateau during 2022-2024 After declining in 2019 and 2020, global electricity sector emissions grew by close to 7% and reached a new all-time peak in 2021. Coal was the main driver of this increase in 2021, accounting for over 800 Mt of CO2 emissions growth.
The slower demand growth and continued increase of low-carbon generation after 2021 limits emissions growth to significantly less than 1% annually from 2022 to 2024, as combined gas- and coal-fired generation emissions increase slowly. By 2024 emissions from power generation reach over 13 Gt of CO2.
In our forecast, power sector emissions remain around the same level from 2021 to 2024, whereas they need to start declining sharply to meet the IEA’s Net Zero Emissions by 2050 Scenario. This underlines the massive changes needed in terms of energy efficiency and low carbon supply for the electricity sector to fulfil its critical role in decarbonising the broader energy system.
The emissions intensity of global power generation grew by 1% in 2021, the first growth since 2011. We expect it to decline annually on average by 2% during 2022 to 2024, as low-carbon sources cover the majority of additional demand during that time. Although the emissions intensity between 2021 and 2024 declines in 78% of all countries, representing 95% of global consumption, the magnitude of reductions varies widely across different regions.
Regional evolution of global power system emissions intensity, 2015-2024
IEA. All rights reserved.
Source: IEA analysis based on data from IEA (2022), Data and statistics.
0
100
200
300
400
500
600
700
800
900
2015 2017 2019 2021 2023
CO₂
inte
nsity
(g C
O₂/
kWh)
Others Europe IndiaUnited States China World
Electricity Market Report – January 2022
PAGE | 14
Global overview
IEA
. All
right
s res
erve
d.
Coal-fired power generation was the main cause of the emissions increase in 2021 Change in electricity generation emissions by source, 2015-2024
IEA. All rights reserved.
Note: Other non-renewables includes oil, waste and other non-renewable energy sources. Source: IEA analysis based on data from IEA (2022), Data and statistics.
- 600
- 400
- 200
0
200
400
600
800
1 000
2015 2016 2017 2018 2019 2020 2021 2022 2023 2024
Cha
nge
in e
mis
sion
s (M
t CO₂)
Coal Gas Other non-renewables Net change

Electricity Market Report – January 2022
PAGE | 15
Global overview
IEA
. All
right
s res
erve
d.
Economic recovery

Electricity Market Report – January 2022
PAGE | 16
Global overview
IEA
. All
right
s res
erve
d.
Diverging economic recovery expected for 2021The global economy recovered significantly in 2021 after a steep decline in 2020. In October 2021, the International Monetary Fund (IMF) estimated global GDP growth of 5.9% for 2021, followed by 4.9% in 2022, 3.6% in 2023 and 3.4% in 2024. Compared with its April 2021 estimate, this corresponds to slightly lower growth for 2021 (down 0.1 percentage points) and higher growth in 2022 (up 0.5). The downward adjustment of the growth estimate for 2021 had several reasons, including Covid-19 surges in low-income countries and supply disruption in advanced economies. Varying vaccine roll-outs and fiscal support levels affect the anticipated levels of economic growth in individual countries.
High energy prices could also have impacts on macroeconomic indicators in several countries. In October the World Bank issued an alert on the near-term risks of global inflation and the adverse effect on growth, particularly for energy-importing countries. The IMF also warned that energy prices as high as in October 2021 could imply a global economic growth reduction of 0.3 percentage points in 2021 and 0.5 percentage points in 2022.
For the United States, the IMF expected 6% GDP growth in 2021, lower than the uplift assumed in the April 2021 edition of this report. The downward adjustment relates mainly to supply disruptions, decreased consumption in the third quarter and uncertainties
surrounding the national debt ceiling. For 2022, a 5.2% increase followed by on average 2% growth in 2023 to 2024 is expected.
The euro area’s economy was estimated to grow by 5% in 2021 and 4.3% in 2022 (before slowing down to below 2% in 2023 and 2024), as activity continues to rebound in parallel with the vaccine roll-out. However, supply shortages, among other factors, have necessitated downward revisions to 2021’s growth estimates for some countries, compared with the April 2021 forecast. The United Kingdom follows a similar pattern than the euro area.
China and India are still showing strong signs of recovery, with an estimated GDP increase of 8% (China) and 9.5% (India) for 2021, and above 5% (China) and above 6% (India) in the following years. However, the full economic impact of energy and supply shortages is yet to be seen. The IMF expects Japan’s GDP to return to about the 2019 level by 2022 and economic growth to decline from above 3% in 2022 to below 1% in 2024
Sub-Saharan Africa continues its economic recovery, with forecast GDP growth rates of 3.7% for 2021, 3.8% for 2022 and around 4% in 2023 and 2024, related to the positive outlook for commodity exporting countries. However, some countries are facing upward inflationary pressure related to food supply shortages.

Electricity Market Report – January 2022
PAGE | 17
Global overview
IEA
. All
right
s res
erve
d.
The economies of China and India are expected to grow strongly in the coming years GDP assumptions by country and region, 2020-2024
IEA. All rights reserved.
Notes: The bars represent annual changes in GDP relative to the previous year. The dots show accumulated changes relative to 2019. Source: Based on International Monetary Fund (October 2021), World Economic Outlook Database.
-15%
-10%
-5%
0%
5%
10%
15%
20%
25%
30%
35%
2020
2021
2022
2023
2024
2020
2021
2022
2023
2024
2020
2021
2022
2023
2024
2020
2021
2022
2023
2024
2020
2021
2022
2023
2024
2020
2021
2022
2023
2024
2020
2021
2022
2023
2024
2020
2021
2022
2023
2024
2020
2021
2022
2023
2024
UnitedStates
Euro area UnitedKingdom
Japan China India Russia Brazil South Africa
Advanced economies Emerging and developing economies
Rea
l GD
P, a
nnua
l cha
nge
(bar
s) a
nd a
ccum
ulat
ed
chan
ge re
lativ
e to
201
9 (d
ots)
GDP relative to 2019

Electricity Market Report – January 2022
PAGE | 18
Global overview
IEA
. All
right
s res
erve
d.
Fossil fuels

Electricity Market Report – January 2022
PAGE | 19
Global overview
IEA
. All
right
s res
erve
d.
Gas and coal prices surged in the second half of 2021, raising thermal generation costsNatural gas and coal prices surged to multi-year highs in the second half of 2021, caused by a tight supply–demand situation. Gas and coal demand were higher than expected, as unforeseen weather-related events contributed to higher consumption, alongside the strong economic recovery. On the supply side, both gas and coal faced constraints, including heavy maintenance and unplanned outages. The tight summer market in the northern hemisphere led to sluggish build-up of gas and coal inventories, which provided further upward pressure on prices in the second half of 2021.
In the United States, Henry Hub natural gas prices more than doubled compared to 2020 to average USD 4.6/MBtu in the second half of 2021 – their highest level for this period of the year since 2008. Total system demand (including exports) outpaced production growth, supporting gas prices. Coal prices remained more stable: fuel costs for coal-fired generation increasing by less than 6% in the second half of 2021 compared to the same period in 2020. This increased the cost-competitiveness of coal-fired generation vis-à-vis gas-fired power plants, resulting in substantial gas-to-coal switching. During the 2022-2024 period, improving supply availability is expected to put downward pressure on gas prices, with Henry Hub averaging 12% below its 2021 levels according to forward curves as
of early January 2022. Nonetheless, coal-based generation remains more competitive than gas, compared to the 2018-2020 period.
In Europe, gas prices on the TTF soared to all-time highs in the second half of 2021 as supply struggled to keep up with high demand. Coal prices followed suit, although rising less sharply. Despite record high carbon prices in both the European Union and the United Kingdom, high gas prices supported gas-to-coal switching. Forward curves as of early January 2022 suggest gas prices averaging 5% below their 2021 levels during the 2022-2024 period, improving the cost-competitiveness of gas vis-à-vis coal-fired power plants. The high gas, coal and emission allowance prices in the European Union and the United Kingdom drove up the generation costs of thermal power plants and placed upward pressure on electricity prices.
In Japan and Korea, oil-indexed LNG prices rose less strongly than in other regions in the second half of 2021, while coal prices surged to all-time highs. This improved the competitive position of gas-fired power plants. According to forward curves as of early January 2021, coal-fired power generation is set to regain its cost-competitive position over the medium term, coal prices averaging 10% below their 2021 levels during 2022-2024.

Electricity Market Report – January 2022
PAGE | 20
Global overview
IEA
. All
right
s res
erve
d.
Improving supply availability is expected to ease gas and coal prices in the medium term Fuel costs of coal- and gas-fired power plants including emission costs, 2018-2024
IEA. All rights reserved.
Notes: Coal range reflects 33-45% efficiency; gas range reflects 43-55% efficiency. Due to the large geographic areas covered in each region, costs can differ between and even within countries and should therefore be interpreted as general trends. United States: natural gas prices increased significantly (exceeding USD 15/MBtu) in February 2021 due to constraint supply. The y-axis is cut to increase the clarity of the long-term trend. Sources: United States: based on EIA (2021), STEO December 2021, price trends beyond 2021 for natural gas based on Henry Hub and for coal based on Appalachian coal. European Union: natural gas prices TTF; coal prices CIF ARA; emission costs EU ETS. Japan and Korea: natural gas prices are oil-indexed LNG prices; coal prices are Japan marker prices. Latest update: 5 January 2022.
0
5
10
15
20
25
30
35
40
45
2018
2019
2020
2021
2022
2023
2024
Coal
0
5
10
15
20
25
30
35
40
45
2018
2019
2020
2021
2022
2023
2024
Fuel
cos
ts (U
SD/M
Wh e
l)
United States
Gas
0
50
100
150
200
250
300
2018
2019
2020
2021
2022
2023
2024
Coal
0
50
100
150
200
250
300
2018
2019
2020
2021
2022
2023
2024
European Union
Gas
0 10 20 30 40 50 60 70 80 90
100
2018
2019
2020
2021
2022
2023
2024
Coal
0 10 20 30 40 50 60 70 80 90
100
2018
2019
2020
2021
2022
2023
2024
Japan and Korea
Gas
Historical Outlook Historical Outlook Historical Outlook
Electricity Market Report – January 2022
PAGE | 21
Global overview
IEA
. All
right
s res
erve
d.
Demand growth and tight coal supply led to power shortages in China and IndiaThe first half of 2021 saw multiple electricity security events, including the Texas power crisis in February, supply shortages in Japan and China, and large-scale outages in Pakistan and Chinese Taipei. Subsequently, Lebanon suffered a complete blackout in early October 2021 due to a diesel supply shortage for the country’s thermal power plants, after having suffered reduced power availability for several months.
China and India were both subject to electricity supply shortages in September and October of 2021, mainly affecting industrial consumers. The principal factors behind these shortages were rapidly growing demand and interruptions to coal supply, both domestic and international. Industrial consumption in China was further affected by power cuts initiated to meet the government’s “dual control” targets that limit the emissions intensity and energy intensity of GDP at the province level, and by the economic losses incurred by coal generators due to high fuel prices in combination with electricity price limits. Towards the end of 2021, supply issues in both countries eased.
Strong economic recovery and high temperatures boosted demand
Electricity demand in China and India increased significantly in 2021 as their economies recovered from the Covid-19 pandemic. It was further amplified by high summer temperatures.
Responding to the exceptionally rapid global economic recovery, industrial electricity demand grew strongly in both economies. For example, it grew by 12% during the first three quarters of 2021 in China. The industrial sector represents 60% of China’s electricity demand and almost 40% of India’s.
China experienced higher summer temperatures than usual, particularly in September, when the monthly cooling degree days exceeded average values for 2010-2020 by 30%. Increased cooling demand added pressure to an already stressed system.
In total, electricity demand in both countries grew by about 10% in 2021, reaching historical monthly demand peaks in July (China) and August (India).
Coal markets tightened domestically and globally
China has seen a surge in businesses purchasing diesel generators, seeking alternatives to provide the missing electricity. In India some distribution companies and industrial consumers, which had already contracted to buy power directly from generators that then shut down due to lack of coal stocks, resorted to buying electricity on the power exchange instead, at peak prices that introduced further financial stress. Additionally, since coal supply has been prioritised for power plants, industrial coal consumers have faced further limited supply and increased prices.

Electricity Market Report – January 2022
PAGE | 22
Global overview
IEA
. All
right
s res
erve
d.
The tightness on coal markets has strongly affected both China and India, which as of 2020 relied on coal for more than 60% and more than 70% of their electricity generation respectively. Domestic coal production was affected by the rainy season in 2021, when heavy rain in coal-producing provinces like Shanxi in China and a particularly heavy monsoon period in India affected both the operation of local mines and the transport of coal to power plants. Domestic production in China has been further affected by earlier mine closures.
Global factors have exacerbated the situation. High gas prices internationally have caused gas-to-coal switching in several power markets around the globe, pushing up coal demand and prices in the second half of 2021. Additionally, meteorological events such as floods in Indonesia have limited the availability of coal imports. Together, high coal prices and limited imports increased the dependency on local coal sources.
Additionally, coal stocks at power plants were not adequately built up before the monsoon season in India. This resulted in extremely low stocks, with more than 80% of India’s coal-fired power plants reaching critical levels in October, with less than a week of coal supply remaining.
High fuel prices, combined with regulated tariffs for power, led several Chinese power plants to stop operations, as electricity production was no longer profitable.
Power cuts mainly affected industrial demand
Due to the fuel shortages, power supply did not match the steep demand growth, leading to supply interruptions in China and India in September and October.
Industrial consumers faced rolling blackouts in several provinces and states of both countries. In China’s northeast, the province of Liaoning issued a level two shortage alert on several consecutive days, indicating power shortage equivalent to 10-20% of total demand. Similar shortages were registered in southern Guangdong, China’s second-largest province by electricity consumption. While supply to residential consumers was prioritised, in certain provinces such as Liaoning, shortages affected residential consumers as well.
In India, Punjab experienced rolling blackouts of up to nine hours at a time due to the shutdown of three power plants from a lack of fuel. The state of Rajasthan was forced to introduce load shedding for industrial and residential consumers even in urban areas like Jaipur and Jodhpur, with some remote areas undergoing up to 12 hours of supply disruption. Bihar experienced power cuts of more than 10 hours per day. Other states such as Gujarat, Tamil Nadu and Karnataka have also been threatened by load shedding due to insufficient generation from thermal power plants.
The supply shortage in India registered as a Category 3 event on the IEA Electricity Security Event Scale (ESES), which is based on the share of customers affected multiplied by the duration of the

Electricity Market Report – January 2022
PAGE | 23
Global overview
IEA
. All
right
s res
erve
d.
event. India’s Northern Region was the most severely affected by the supply shortage, and rated as Category 4.
Rapid responses by authorities
To alleviate shortages and stabilise power supply, in the second half of October the Chinese government authorised several previously closed coal mines to reopen and new mines to start production. It also increased coal production targets, capped coal prices and allowed greater fluctuations in wholesale electricity prices. Previously prices for coal-fired electricity were allowed neither to rise above 10% nor drop below 15% of the regional base price; this cap has been extended to 20% in both directions since mid-October, and has been completely removed for energy-intensive consumers.
Measures taken in India include: the prioritisation of coal supply for power plants over other industrial producers; publication of guidelines for efficient operation of power plants; diverting the production of coal from captive mines; establishment of a Core Management Team to ensure efficient management of coal stocks and their distribution; the blending of local and imported coal; and government appeals to reduce the use of electricity.
Electricity Security Event Scale ratings for 2021 electricity shortage events
IEA. All rights reserved.
Notes: ESES rating is based on the share of customers affected in the named region multiplied by the duration of the event. Recent supply disruptions in China are not included due to a lack of detailed data. Sources: IEA analysis based on CPPA Power Purchase Price Forecast; EIA Open Data; POSOCO; Reuters; South China Morning Post.
0.01
0.1
1
10
100
ESES
ratin
g
Chinese Taipei India Texas India (Northern Region)
Category 1< 0.1
Category 20.1 - 1
Category 3 1 - 10
Category 410 - 24
Category 5>24

Electricity Market Report – January 2022
PAGE | 24
Global overview
IEA
. All
right
s res
erve
d.
In October 2021, 80% of India’s coal-fired plants were facing critical coal storage levels Coal stock availability at power plants in India, December 2018-November 2021
IEA. All rights reserved.
Notes: We used the Central Electricity Authority definition to categorise the status of coal plant stocks: for pithead plants, critical is < 5 days of coal requirement, supercritical is < 3 days; for non-pithead plants, critical is < 7 days, supercritical is < 4 days; for non-pithead plants located more than 1 500 km from linked coal mine, critical is < 9 days, supercritical is < 5 days. Daily coal requirement is based on the higher of the requirement for the average actual consumption of the plant in the last 7 days, and the requirement for the installed capacity of the plant at 55% load factor. Source: IEA analysis based on CEA, Daily Coal Report.
0%10%20%30%40%50%60%70%80%90%100%
05
101520253035404550
12-2018 04-2019 09-2019 01-2020 06-2020 11-2020 03-2021 08-2021
Share of plants with critical/supercritical
stocks
Aver
age
rem
aini
ng c
oal s
tock
s (d
ays)
MonthRemaining coal stocks Share of plants

Electricity Market Report – January 2022
PAGE | 25
Global overview
IEA
. All
right
s res
erve
d.
High gas prices in 2021 caused fuel switching from gas to coal in the United States and EuropeCoal-fired power declined during 2017-2020 in the United States (down 36%) and Europe (down 38%) due to emissions reduction measures, more renewables and a growing cost advantage of gas over coal. In 2021 the relative increase in gas prices versus coal led to a reversal in coal’s decline, many markets experiencing fuel switching and consequently higher emissions. We estimate that US coal-fired generation grew by 19% and Europe’s by 11% compared with 2020, while US gas-fired generation fell by 3% and Europe’s grew mildly (up 4%). Although we expect this to be temporary and coal generation to fall again in the coming years as gas prices moderate, the special circumstances in 2021 offer a good opportunity to analyse generation flexibility. The ability to switch between fuels can be an indicator of the resilience of a system.
We compared the share of gas in combined gas and coal generation with the difference in generation cost, subtracting the coal generation cost from that of gas so that the cost difference reflects how much more expensive gas is than coal (or cheaper, if negative). Our focus is on four regions with relevant amounts of both coal- and gas-fired generation: the Midwest and Mid-Atlantic regions of the United States, and Germany and the Netherlands in Europe. Using weekly data for both US markets and daily data for the others, we analysed the years 2019-2021, capturing a wide range of gas prices, with low (in 2020), high (in 2021) and mid-range values (in 2019).
Our analysis shows price changes having significant effects in all regions and years. Based on a linear regression analysis, we estimated percentage point reductions in the gas share for a USD 1/MWh increase in the relative cost of gas-fired generation.
In Germany, the estimated drop in the gas-fired share of generation is 0.5 percentage points for every USD 1/MWh increase in the relative cost of gas, in the range where gas was between USD 25/MWh cheaper and USD 50/MWh more expensive than coal-fired generation. Above this range, the impact was less pronounced, potentially due to must-run generation by industrial power plants or heat production obligations of gas-fired co-generation plants.
In the Netherlands, the gas-fired share varied between 29% and 100% of combined gas and coal generation. The estimated drop in the gas share is 0.8 percentage points for every USD 1/MWh increase in the relative cost of gas in the range where gas was between USD 25/MWh cheaper and USD 50/MWh more expensive. For higher relative gas costs, the gas share dropped less.
Cost differences between gas and coal generation in the United States are smaller than in Europe and the effect of a cost change appears to be higher. A USD 1/MWh increase in the relative cost of gas saw the gas share drop on average by 0.7 percentage points (Midwest) and 1.3 percentage points (Mid-Atlantic).

Electricity Market Report – January 2022
PAGE | 26
Global overview
IEA
. All
right
s res
erve
d.
The split between gas- and coal-fired generation in Germany, the Netherlands and two US markets shows a strong correlation with the generation cost differential
Gas share of combined gas and coal generation relative to the generation cost difference (gas minus coal), 2019-2021
IEA. All rights reserved.
Notes: The gas to coal power generation cost difference is calculated for every date available by subtracting the coal-fired electricity generation cost from the gas-fired cost, including the associated carbon costs for each fuel (where appropriate). For the conversion of thermal energy to electricity, we assume an efficiency of 42% for coal-fired generators and 50% for gas. The analysis was made with data from between 1 January 2019 and 8 October 2021. Sources: Natural gas prices: TTF (for Germany and the Netherlands), Chicago Citygate gas hub (for US Midwest), TETCO-M3 gas hub (for US Mid-Atlantic); coal prices: CIF ARA (for Germany and the Netherlands), US Illinois (for US Midwest), US Northern Appalachia (for US Mid-Atlantic); emission costs: EU ETS; power generation data: ENTSO-E (2021), Transparency Platform, and EIA (2021), Open Data.
0%
20%
40%
60%
80%
100%
-50 0 50 100 150 200
Gas
sha
re in
the
gas
and
coal
gen
erat
ion
mix
Gas minus coal generation costs (USD/MWh)
Netherlands2019
2020
2021
0%
20%
40%
60%
80%
100%
-50 0 50 100 150 200
Gas
sha
re in
the
gas
and
coal
gen
erat
ion
mix
Gas minus coal generation costs (USD/MWh)
Germany2019
2020
2021
0%
20%
40%
60%
80%
100%
-10 0 10 20 30
Gas
sha
re in
the
gas
and
coal
gen
erat
ion
mix
Gas minus coal generation costs (USD/MWh)
US Midwest2019
2020
2021
0%
20%
40%
60%
80%
100%
-10 0 10 20 30
Gas
sha
re in
the
gas
and
coal
gen
erat
ion
mix
Gas minus coal generation costs (USD/MWh)
US Mid-Atlantic2019
2020
2021

Electricity Market Report – January 2022
PAGE | 27
Global overview
IEA
. All
right
s res
erve
d.
Wholesale prices

Electricity Market Report – January 2022
PAGE | 28
Global overview
IEA
. All
right
s res
erve
d.
Wholesale electricity prices continued to rise in 2021… Soaring gas and coal prices were the main driver for the rapid rise in wholesale electricity prices in many countries in 2021. Our price index for major wholesale electricity markets of major advanced economies almost doubled compared with 2020 (up 64% from the 2016-2020 average).
Wholesale prices in the fourth quarter of 2021 in France, Germany, Spain and the United Kingdom were three to more than four times higher than the fourth quarter 2016-2020 average. This was mainly caused by the steep rise in gas prices, alongside increased demand, and EU ETS prices more than doubling in 2021 compared with 2020.
The Nordic region also saw a surge, wholesale prices rising in the fourth quarter of 2021 almost three times compared with the fourth quarter average of 2016-2020, and over seven times higher than the same period in 2020. However, average prices of EUR 96/MWh in the fourth quarter of 2021 were only about half as high as in Western Europe.
Wholesale prices grew less strongly in the United States than in Europe, partly due to a smaller increase of natural gas prices. Average prices in the fourth quarter of 2021 were almost 75% above the fourth quarter average of 2016-2020.
After a supply shortage-related peak in the first quarter and a subsequent drop in the second quarter of 2021, Japan’s wholesale prices rose again in the second half of 2021. Average fourth quarter 2021 prices exceeded the 2016-2020 average by 80%.
In Australia, coal-fired generation outages and increased demand resulted in a substantial year-on-year wholesale price increase of 174% in the second quarter of 2021 (up 196% from the previous quarter). This was followed, in contrast to the other countries and regions analysed, by a price decrease of 50% from the second to the fourth quarter of 2021. The decline was supported by milder weather and increased availability of renewable energy and dispatchable generation.
The share of total generation traded in India via short-term power exchanges has increased considerably in recent years. However, at 6-7% of supply it is still significantly smaller than in more mature markets such as Europe. In the second half of 2021 prices grew by 70% year-on-year. The main cause was a coal supply shortage, as 80% of coal-fired power plants had less than one week of fuel stocks by mid-October. The need to cover the deficit in coal-fired power led to an increase in spot exchange volumes, which rose almost 50% in the August-October period compared with the previous three months.

Electricity Market Report – January 2022
PAGE | 29
Global overview
IEA
. All
right
s res
erve
d.
… and in many markets significantly exceeded levels in previous years Quarterly average wholesale prices for selected regions, 2016-2021
IEA. All rights reserved.
Notes: Price index aggregates the wholesale electricity price changes across the depicted regions. It is calculated as the demand-weighted rolling average of the respective current and previous three-quarter indexed prices of the depicted wholesale electricity markets. The prices for Australia and the United States are calculated as the demand-weighted average of all the regional markets. Sources: IEA analysis using data from RTE (France) and Red Eléctrica (Spain) – both accessed via the ENTSO-E Transparency Platform; Bundesnetzagentur (2021), SMARD.de; Elexon (2021), Electricity data summary; AEMO (2021), Aggregated price and demand data; AER (2021), Wholesale statistics; EIA (2022), Short-Term Energy Outlook January 2022; Nordpool (2021), Historical Market Data; IEX (2021), Area Prices. Latest update: 12 January 2022.
0
100
200
300
400
500
600
700
800
Q1 Q2 Q3 Q4 Q1 Q2 Q3 Q4 Q1 Q2 Q3 Q4 Q1 Q2 Q3 Q4 Q1 Q2 Q3 Q4 Q1 Q2 Q3 Q42016 2017 2018 2019 2020 2021
Inde
xed
elec
trici
ty p
rice
(Q1
2016
= 1
00)
Germany France United Kingdom Spain United StatesJapan Australia Nord Pool India Price index
Peak caused by supply disruptions due to an extreme weather event, increasing average regional prices in ERCOT to over USD 600/MWh and in SPP to over USD 250/MWh
Peak caused by a surge in demand due to an extreme cold weather event and low gas-fired generation in Japan

Electricity Market Report – January 2022
PAGE | 30
Global overview
IEA
. All
right
s res
erve
d.
Climate protection policies and impact

Electricity Market Report – January 2022
PAGE | 31
Global overview
IEA
. All
right
s res
erve
d.
The decarbonisation of the electricity sector is a central component of current climate policiesGovernments are increasingly focused on tackling the threat of climate change, making climate policies an important element shaping the electricity sector in the short, medium and long term.
One important indication of the direction set out by climate policy is each country’s nationally determined contribution (NDC) under the Paris Agreement. These lay out national targets and policies for greenhouse gas (GHG) mitigation, and are submitted every five years, most mitigation targets reported in current NDCs having a 10-year time horizon. Some NDCs include components that are conditional on receiving international technical, financial and capacity-building support. In certain cases, domestic policies are more ambitious than policies reflected in the first round of NDCs submitted by countries since 2015, while in others domestic policies appear insufficient to fulfil NDC targets.
New NDCs submitted as of 24 November 2021 include more ambitious GHG reduction objectives from countries such as the United States (target of 50-52% by 2030, vs 26-28% by 2025 previously, below 2005 levels), Japan (upgraded target of 46% below 2013 levels in 2030, vs 26% previously) and South Africa (target to keep emissions in the range of 350-420 Mt CO2-eq by 2030, vs 398-614 Mt CO2-eq previously). China also submitted an updated NDC, reflecting new climate mitigation targets announced
in 2020, such as peaking emissions before 2030 and achieving carbon neutrality before 2060, while the target to reduce emissions intensity per unit of GDP by 2030 increased from 60-65% to over 65% below the 2005 level.
The electricity sector is a central component of all NDCs. As indicated by the 2021 NDC Synthesis report of the United Nations Framework Convention on Climate Change (UNFCCC), by 12 October 2021 all the 165 latest available NDCs – representing 192 Parties – cover the electricity sector, including 116 new or updated NDCs. These NDCs covered 94% of total global GHG emissions in 2019. Of all NDCs, 86% mention targets for higher shares of renewable energy generation by 2030.
The electricity sector is also a key component of long-term decarbonisation goals, as seen in the long-term low GHG emission development strategies (LT-LEDS), which Parties are encouraged to submit under the Paris Agreement, as well as in domestic net zero legislation. Long-term strategies aim to generate certainty for investment in mitigation, including in the electricity sector. As of 24 November 2021, 45 countries and the European Union have communicated LT-LEDS to the UNFCCC, covering over 65% of global energy-related CO2 emissions in 2019. Moreover, 18 countries and the European Union have legislated to achieve a

Electricity Market Report – January 2022
PAGE | 32
Global overview
IEA
. All
right
s res
erve
d.
net zero emissions target by 2050 or earlier, covering over 15% of global energy-related CO2 emissions in 2019.
All these commitments also cover the electricity sector. Within overall net zero targets, some countries announced that their electricity sector will be net zero before or in 2030, such as Norway (already net zero), Denmark (by 2027) and Austria (by 2030). Later target dates have been set by the United States, New Zealand (both by 2035) and Germany (by 2045).
Governments are deploying a suite of policy measures to decarbonise their economies and electricity sectors in line with both medium- and long-term climate ambitions. These include specific plans to phase out unabated coal at different target dates, some in the short term (e.g. France by 2022) and others in the longer term (e.g. Germany by 2038 at the latest and Chile by 2040). They also include a range of carbon pricing measures. However, even if implemented in full, they would still be insufficient to align with the 1.5°C Paris Agreement goal.
Electricity sector CO2 emissions covered by different climate commitments and number of countries with electricity targets
IEA. All rights reserved.
Notes: Emissions are CO2 emissions from fuel combustion for electricity as a main activity and auto-producer electricity plants only. NZE = net zero emission targets that are set in law, in proposed legislation, in a policy document and in oral pledges. NDCs = nationally determined contributions. LT-LEDS = long-term low GHG emission development strategies.
0
20
40
60
80
100
120
140
160
180
200
0
1
2
3
4
5
6
7
8
9
10
Glo
bal
emis
sion
s
Late
st N
DC
s
LT-L
EDS
NZE
NZE
In la
w
Emissions covered bycommitments
Num
ber o
f cou
ntrie
s
Elec
trici
ty s
ecto
r em
issi
ons
(Gt C
O2) Total
Others
Oil
Gas
Coal
Number ofcountries with aspecific target

Electricity Market Report – January 2022
PAGE | 33
Global overview
IEA
. All
right
s res
erve
d.
New carbon pricing mechanisms have been introduced in 2021 Carbon pricing is often part of a suite of climate policies targeting clean energy transitions. It comprises carbon taxes, an emissions trading system (ETS), or hybrids of the two.
By the end of 2021 there were 65 carbon pricing instruments in place, of which six new ones, all covering the electricity sector, were introduced during the year. Particularly notable was the launch of China’s national ETS, which is the largest CO2 emissions trading scheme in the world. It initially covers China’s coal- and gas-fired power plants, representing 4.5 Gt CO2 or around 40% of China’s energy sector CO2 emissions in 2020. It is scheduled to expand to seven additional sectors over the next five years. Coal- and gas-fired power plants receive allowances based on their generation output and predetermined benchmarks, which encourages them to reduce their emissions intensity below their benchmark, for example by improving their efficiency. However, the ETS currently does not set a cap on total emissions, which could rise in absolute terms. Allowances are currently allocated for free, and have been traded at around CNY 40-60/t CO2 (around USD 8/t CO2) as of October 2021.
In 2021 the European Union put forward a wide range of reforms to its EU ETS as part of its Fit for 55 package, to align with the new 2030 EU emissions target. Reform proposals include a more aggressive decline of the emissions cap, reinforcement of the market stability reserve to strengthen resilience to future exogenous
shocks, and more targeted carbon leakage rules. They also notably proposed a carbon border adjustment mechanism (CBAM), which would subject high-carbon imports, including electricity, to a border tax. This, combined with several other factors, saw EU ETS allowance prices soar to at times levels above 80 EUR/t CO2 in the fourth quarter of 2021, reaching record highs.
In early 2021 the United Kingdom, after leaving the EU ETS, launched its emissions trading scheme, covering the power, industry and aviation sectors. It features a “transitional auction reserve price” set at GBP 22/t CO2, which functions as an allowance price floor, and has an emissions cap declining each year. As of the end of the fourth quarter of 2021, UK allowances traded at a premium relative to the EU ETS.
The third phase of the Korea ETS began in 2021, with important reforms. It covers six sectors, including heat and power. The government introduced a temporary minimum price of KRW 12 900/t CO2 (around USD 11/t CO2) on the secondary market to counteract a decline in allowance prices in 2020 and 2021 due to a surplus of allowances.
In 2021 various governments took initial steps to introduce carbon pricing instruments in their electricity sector. Ukraine announced its intention to launch an ETS in 2025, aiming to link it with the EU ETS in the future. Indonesia operated a voluntary emissions trading trial

Electricity Market Report – January 2022
PAGE | 34
Global overview
IEA
. All
right
s res
erve
d.
in its power sector from March to August 2021, and is considering a national framework for carbon pricing, potentially including an ETS alongside a carbon tax set to start in 2022. Brazil is in the process of defining mechanisms to integrate environmental benefits in the electric sector, as well as regulating the carbon trading market.
International carbon markets also received a boost in 2021 with agreement at COP26 on the framework rules for implementing Article 6 of the Paris Agreement. Article 6 covers accounting for bilateral exchange of units between countries, as well as a centralised carbon market mechanism under the UNFCCC. The latter would be a successor to the mechanism of the Kyoto Protocol, in which the electricity sector (and renewable energy in particular) was the sector that issued the most credits. It is likely that low-carbon options in the electricity sector will continue to be an important component of future international carbon markets.
Price of selected carbon pricing instruments covering the power sector (as of April 2021, average levels)
IEA. All rights reserved.
* China ETS and UK ETS were launched in 2021; their depicted prices are the results of the first auction for each scheme. All other prices are the average price over the year. Note: RGGI = Regional Greenhouse Gas Initiative (United States). Sources: World Bank Carbon Pricing Dashboard, ICAP.
0
10
20
30
40
50
60
70
Chi
na*
Euro
pean
Uni
on
Kore
a
New
Zea
land
Switz
erla
nd
Uni
ted
King
dom
*
Cal
iforn
ia
RG
GI
Qué
bec
Chi
le
Col
ombi
a
Japa
n
Sing
apor
e
Sout
h Af
rica
Briti
sh C
olum
bia
ETS Carbon tax
Car
bon
pric
e (U
SD/tC
O₂-
eq)
2020
2021

Electricity Market Report – January 2022
PAGE | 35
Global overview
IEA
. All
right
s res
erve
d.
Commitments to end the use of unabated coal are piling up Coal phase-out commitments have mushroomed across the world in recent years. Between the Paris Agreement entering into force in 2016 and the end of 2021, 21 countries using unabated coal for electricity generation had set phase-out dates before 2040. Four of these have already completed their phase-outs: Belgium (2016), Austria (2020), Sweden (2020) and Portugal (2021). Of the 17 remaining countries, 12 are from the European Union and the others are Canada, Chile, Israel, the United Kingdom and New Zealand. However, these countries accounted for only 3% of global coal power generation in 2021, and almost half of that came from Germany (phase-out if possible by 2030, at the latest by 2038).
The Powering Past Coal Alliance is a coalition established by Canada and the United Kingdom to accelerate the transition away from coal for power generation. As of December 2021, 48 national governments, representing close to 4% of estimated global coal-fired generation in 2021, 48 subnational governments and 69 organisations have joined.
During the UN Climate Change Conference COP26 in Glasgow in November 2021, a coalition of 45 countries plus the European Union, 5 subnational governments and 26 organisations signed a Global Coal to Clean Power Transition Statement, acknowledging coal power generation as the single biggest contributor to climate change. The statement includes four commitments, of which the
most relevant for coal power is to scale up technologies and policies to transition away from unabated coal power generation in the 2030s in major economies (or as soon as possible thereafter) and in the 2040s globally (or as soon as possible thereafter). The signatories included 23 countries without any pre-existing phase-out commitment, among them major coal users like Indonesia, the Philippines, Poland, South Korea, and Viet Nam. In total, the signing parties accounted for 12% of global coal-fired electricity in 2021.
In the lead-up to COP26, China, Japan, Korea and the G20 committed to end the provision of international public finance for new unabated coal power generation abroad by the end of 2021. Additionally, several banks and financial institutions made commitments at COP26 to end financing of unabated coal.
Although many of these commitments have a target year beyond our forecasting period, which ends in 2024, many regions are already showing a decreasing trend in coal-fired generation. In the European Union, due to a mix of phase-out policies and carbon pricing, coal-fired electricity halved between 2015 and 2020. Despite the increase in 2021, we expect a further drop to 40% of 2015 levels in the European Union by 2024. For Canada, we forecast coal use for power to drop by more than 80% during that time. In the United Kingdom, we anticipate coal to drop below 1% in the generation mix in 2024, down from more than 20% in 2015.

Electricity Market Report – January 2022
PAGE | 36
Global overview
IEA
. All
right
s res
erve
d.
Countries comprising almost 12% of global coal-fired generation have committed to phase-outs Global coal-fired generation share with phase-out commitments
IEA. All rights reserved.
Notes: Shares are based on estimated coal-fired generation in 2021. All countries with a share of at least 0.5% of global coal-fired electricity generation are shown individually. As the European Union signed the Global Coal to Clean Power Transition statement, we included all member countries, even if not all of them signed the statement individually. Last update: November 2021.
0%
2%
4%
6%
8%
10%
12%
Countries with fixedcoal phase-out dates
Member countries of thePowering Past Coal Alliance
Countries who signed theGlobal Coal to Clean
Power Transition Statement
Shar
e of
glo
bal c
oal-f
ired
elec
trici
ty
gene
ratio
n in
202
1
Other Global Coal to Clean PowerTransition Statement countriesOther Powering Past Coal AlliancecountriesOther countries with fixed coalphase-out datePhilippines
Kazakhstan
Viet Nam
Poland
Indonesia
Korea
Germany

Electricity Market Report – January 2022
PAGE | 37
Global overview
IEA
. All
right
s res
erve
d.
Climate change is a growing threat to electricity systems The world’s electricity markets are experiencing the growing impacts of climate change. Extreme weather events such as heatwaves, cold snaps, droughts and floods have become more frequent and intense, threatening the stability and reliability of electricity supply.
Texas in the United States experienced two major electricity crises in 2021 due to extreme temperatures. Exceptionally cold weather in February reduced gas supplies and the availability of gas-fired and other power plants, and lifted electricity demand to 20% above the expected winter peak, causing an electricity outage for four days. Four months later, Texas faced a heatwave bringing further supply problems. The Texas power grid authority had to call for demand response measures like raising thermostat set-point temperatures and avoiding the use of large appliances to ease grid strain.
Extreme patterns of precipitation pose an increasing threat to electricity markets. In July, heavy rainfall caused the worst flooding in decades in Germany, cut electricity to 200 000 households, and damaged the energy infrastructure in the west of the country. Heavy rains and mudslides in northern China hit a major coal production centre in October, complicating efforts to tackle power shortages in the country.
While some countries suffered from intense rainfall, others experienced the opposite. Brazil called for demand response
measures in September to conserve power due to near-record low water levels at crucial dams. California was forced to shut down a 750 MW hydroelectric power plant at Lake Oroville in August for the first time due to low water levels. Iran suffered from power outages due to droughts and high electricity demand in July.
Extreme weather events are likely to be more frequent in the future due to climate change, although the impacts may vary between countries. The IPCC Working Group I report projects an increase in the frequency and intensity of extreme heat, heavy precipitation and droughts in some regions, as well as a growing prevalence of intense tropical cyclones.
Since climate change is expected to raise these risks, building the climate resilience of electricity markets becomes increasingly important. Climate-resilient electricity systems support the clean energy transition by: addressing the adverse impacts of climate change on renewable energy; promoting sustainable development by ensuring reliable energy services; boosting electricity security by increasing systems’ ability to cope with climate-driven disruption; and reducing the risks associated with climate disasters.
In June 2021 the IEA released the Climate Resilience Policy Indicator, an initial measure to assess the level of climate resilience of each country by comparing the level of climate hazard it faces with its policy preparedness.

Electricity Market Report – January 2022
PAGE | 38
Global overview
IEA
. All
right
s res
erve
d.
The risk of climate hazards varies significantly between countries Aggregated level of climate hazard for IEA member and association countries
IEA. All rights reserved.
Notes: The overall assessment of climate hazard for each country is based on the aggregation of the levels in four areas (temperature, flood, drought and cyclone). Temperature refers to long-term changes in average temperatures. For each country, the average surface temperature for the period 2000-2020 is extracted from the Weather for Energy Tracker, while the level of climate hazard is assessed based on the indicators “Physical exposure to flood”, “Drought probability and historical impact” and “Physical exposure to tropical cyclone” developed by the INFORM Risk Index. If the hazard level for each area is low, it scores 0; if medium, it scores 1; if high, it scores 2. If the sum of the scores for the four climate risks is below 2, the overall assessment of climate hazard is described as low; between 2 and 4 it is medium-low; between 4 and 6 it is medium-high; and from 6 it is high. A detailed methodology of the indicator is described on the Climate Resilience Policy Indicator page. Source: IEA (2021), Climate Resilience Policy Indicator.
0
1
2
3
4
5
6
7In
dia
Mex
ico
Chi
na
Aust
ralia
Hun
gary
Indo
nesi
aSo
uth
Afric
aTh
aila
ndU
nite
d St
ates
Braz
ilJa
pan
Kore
a
Aust
riaC
zech
Rep
ublic
Esto
nia
Ger
man
yG
reec
eM
oroc
coPo
land
Portu
gal
Slov
ak R
epub
licSp
ain
Switz
erla
ndTu
rkey
Belg
ium
Can
ada
Den
mar
kFi
nlan
dFr
ance
Italy
Net
herla
nds
New
Zea
land
Swed
en
Irela
ndLu
xem
bour
gN
orw
aySi
ngap
ore
Uni
ted
King
dom
High Medium-High Medium-Low Low
Leve
l Drought
Cyclone
Flood
Temperature

Electricity Market Report – January 2022
PAGE | 39
Regional perspective
IEA
. All
right
s res
erve
d.
Regional perspective

Electricity Market Report – January 2022
PAGE | 40
Regional perspective
IEA
. All
right
s res
erve
d.
Asia Pacific

Electricity Market Report – January 2022
PAGE | 41
Regional perspective
IEA
. All
right
s res
erve
d.
Demand is growing faster than renewables – but the gap is closing Despite the economic slowdown caused by the Covid-19 pandemic reducing electricity demand growth, the Asia Pacific region nonetheless maintained positive yearly growth rates during 2019 and 2020. In 2021 we estimate demand to have grown by 8% from a low of 2% in 2020, mostly driven by China and India (both up around 10%), the largest power systems in the region.
After the rebound in 2021, most countries in the region (with the exception of Japan) are expected to see continued demand growth up to 2024, with the regional growth rate stabilising at around 4% per year on average, slightly below pre-pandemic levels but above the global average of below 3%.
Across the region, electricity demand growth is being driven by both industrial development and increased utilisation and electrification of cooling, cooking and mobility, among other end uses.
On the supply side, 2021 saw a large increase in coal-fired generation, which grew by 8% to reach over 8 000 TWh. This increase was led by significant growth in coal-fired generation in both China and India in line with economic recovery from the pandemic, despite coal shortages late in 2021.
Although coal-fired generation grew the most in absolute terms in 2021, renewables saw the highest growth rate (up 10%). This trend
is again led by China and India, but is also seen in most countries of the region and is expected to continue, reflecting ongoing renewables deployment across the region.
With slower electricity demand growth out to 2024 (on average 4% per year between 2022 and 2024), around two thirds of the net demand increase in the region is forecast to be covered by renewables, followed by coal (covering 27% of demand growth) and nuclear (7%).
Power grids in the Asia Pacific region are on average the most carbon intensive in the world, due to their reliance on fossil fuels and particularly coal. With an estimated CO2 intensity of over 580 g CO2/kWh in 2021, the region is 28% above the world average of about 460 g CO2/kWh. While the expansion of renewable energy generation in the period to 2024 means the region’s carbon intensity is expected to steadily decline at a pace close to the world’s average, this reduction is not sufficient to prevent an increase in total emissions over the period. By 2024 we expect the average carbon intensity of generation in Asia Pacific to fall to approximately 550 g CO2/kWh.

Electricity Market Report – January 2022
PAGE | 42
Regional perspective
IEA
. All
right
s res
erve
d.
Asia Pacific’s electricity demand growth stabilises after a rebound in 2021 Development of electricity demand, 2015-2024
IEA. All rights reserved.
Source: IEA analysis based on data from IEA (2022), Data and statistics.
-4%
-2%
0%
2%
4%
6%
8%
10%
12%20
15
2018
2021
2024
2015
2018
2021
2024
2015
2018
2021
2024
2015
2018
2021
2024
2015
2018
2021
2024
2015
2018
2021
2024
2015
2018
2021
2024
Asia Pacific China India Japan Korea Australia Southeast Asia
Elec
trici
ty d
eman
d gr
owth
Demand Demand forecast

Electricity Market Report – January 2022
PAGE | 43
Regional perspective
IEA
. All
right
s res
erve
d.
Renewables meet a large share of new demand, causing emissions intensity to decline, but total emissions still grow
Change in electricity generation, 2015-2024 Development of emissions intensity, 2015-2024
IEA. All rights reserved.
Note: Other non-renewables includes oil, waste and other non-renewable energy sources. Source: IEA analysis based on data from IEA (2022), Data and statistics.
- 200
0
200
400
600
800
1 000
1 20020
15
2016
2017
2018
2019
2020
2021
2022
2023
2024
Asia Pacific
Cha
nge
in e
lect
ricity
gen
erat
ion
(TW
h)
Coal GasNuclear Other non-renewablesRenewables Net change
0
100
200
300
400
500
600
700
800
900
2015 2017 2019 2021 2023C
O₂
inte
nsity
(g C
O₂/
kWh)
Asia Pacific ChinaIndia JapanKorea AustraliaSoutheast Asia

Electricity Market Report – January 2022
PAGE | 44
Regional perspective
IEA
. All
right
s res
erve
d.
China The industrial and commercial demand for power in China recovered strongly from the Covid-19 pandemic in 2021. Growth across all demand sectors is expected to resume pre-pandemic trends during 2021-2024 – slowing positive growth year-on-year. The only exception is road transport; as electrification accelerates to meet China's goal to end the sale of new internal combustion engine passenger cars by 2035, electricity demand for road transport grows significantly out to 2024, although starting from a relatively low base.
Despite a diversifying generation mix, China's electricity system remains largely coal-dominated. In 2021 coal made up 64% of power generation, followed by hydropower with a share of 16%, wind at 7% and nuclear at 5%. By 2024 we expect the share of coal in the mix to decline to 59%. Renewable energy sources are set to meet the majority of additional demand during 2022-2024 (over 70%), while coal meets 25% of the increment.
Generation capacity continues to increase in China to satisfy growing demand for electricity. Despite the phase-out of central government subsidies for onshore wind and solar PV, both technologies continue to be deployed at a rapid pace and are expected to reach a cumulative capacity of more than 930 GW by 2024, up from close to 530 GW in 2020. To accompany the
deployment of these variable renewable energy sources, China announced an ambitious target to install more than 30 GW of new non-hydro energy storage capacity by 2025, up from 3.3 GW in 2020.
Although coal consumption will be limited under the 14th five-year plan for 2021-2025, and despite the coal supply shortages in autumn 2021, new coal-fired units will continue to be built. Neither the coal shortages nor the national emissions trading scheme launched on 16 July 2021, where the price range is CNY 40-60/t CO2 (around USD 8/t CO2), are expected to contribute significantly to switching away from coal generation.
Gas units are also set to play a greater role in providing system flexibility and compensating for the variability of wind and solar generation. Therefore, the share of electricity from non-fossil sources is expected to increase only a couple of percentage points over the forecast horizon. Once policies follow through on the national pledge to be carbon-neutral by 2060, faster change in the generation mix might be achieved.
The power sector reforms initiated in 2015 introduced wholesale markets based on marginal pricing and incentivise cross-provincial power trade. Recent national initiatives are expected to further curb the need for new fossil-based power capacity.

Electricity Market Report – January 2022
PAGE | 45
Regional perspective
IEA
. All
right
s res
erve
d.
Electricity tariffs in China remain largely regulated. On-grid tariffs for industrial and commercial consumers of electricity from coal-fired generation contain a variable part that floats with the coal price. Initially, the variable element was neither allowed to rise above 10% nor drop below 15% of the regional base price. Following the coal price surges during summer 2021, this resulted in net losses for coal power plants. In October the authorities decided to allow the variable part of the tariff to float up to 20% above the price benchmark (up from 10%). China is also looking into implementing time-of-use tariffs for most retail consumers to shift demand away from peak times and limit the need for additional capacity, although the timeline for this development has not yet been announced.
Since September 2021 the two grid operators in China, State Grid Corporation of China and China Southern Power Grid, have been piloting green electricity trading in response to demand for clean electricity from corporations. Under this scheme, corporations bid an energy price and a “green premium” on the power exchanges, and establish direct contracts with renewable producers 1 month to 10 years ahead of delivery. The contracted renewable units are then given priority dispatch.
Electricity generation mix in China, 2015-2024
IEA. All rights reserved.
Note: Other non-renewables includes oil, waste and other non-renewable energy sources. Source: IEA analysis based on data from IEA (2022), Data and statistics.
0%
10%
20%
30%
40%
50%
60%
70%
80%
90%
100%
2015
2016
2017
2018
2019
2020
2021
2022
2023
2024
Gen
erat
ion
mix
Nuclear Coal Gas Other non-renewables Renewables

Electricity Market Report – January 2022
PAGE | 46
Regional perspective
IEA
. All
right
s res
erve
d.
Continued demand growth in China is supported by a slowly changing electricity mix Change in electricity generation in China, 2015-2024
IEA. All rights reserved.
Note: Other non-renewables includes oil, waste and other non-renewable energy sources. Sources: IEA analysis based on data from IEA (2022), Data and statistics.
- 200
- 100
0
100
200
300
400
500
600
700
800
2015
2016
2017
2018
2019
2020
2021
2022
2023
2024
China
Cha
nge
in e
lect
ricity
gen
erat
ion
(TW
h)
Coal Gas Nuclear Other non-renewables Renewables Net change

Electricity Market Report – January 2022
PAGE | 47
Regional perspective
IEA
. All
right
s res
erve
d.
India After a more than 2% decline in electricity demand in India during 2020 due to the Covid-19 pandemic, 2021 saw a rebound with growth of estimated 10%. This took demand to levels higher than before the pandemic, despite the outbreak of new Covid-19 variants in March-June. Over 2022-2024 we expect annual demand growth to remain above pre-pandemic levels at around 6.5% per year.
While progress towards universal electricity access in India has long been a main driver for increases in demand (rising from 76% in 2010 to 98% in 2019), we expect current and future demand levels to be driven by growth in the industrial and residential sectors. The Make in India government initiative will continue to propel electricity demand growth in the industrial sector by promoting local manufacturing. Additionally, per-capita electricity demand in India is still below the global average and therefore quality of service improvements are expected to further drive electricity demand growth through end uses such as cooking, cooling, and mobility – despite the positive impact of initiatives such as the Unlocking National Energy Efficiency Potential strategic plan. While electric mobility uptake in India is still nascent, electric vehicle numbers are expected to increase with policy support. In June 2021 the Indian government announced the extension of its Faster Adoption and Manufacturing of Electric Vehicles in India (FAME) Phase II by two years to March 2024 and the National Institution for Transforming India (NITI Aayog) released its Handbook to Guide EV Charging
Infrastructure in India in August 2021. Both initiatives aim to accelerate the adoption of electric vehicles by providing economic incentives, as well as guidelines for improving associated infrastructure.
India’s electricity mix remains largely coal-dominated. In 2021 coal made up 74% of power generation, followed by renewables with a share of 20%. By 2024 we forecast coal-fired generation to account for 70% of the electricity mix, and renewables for 22%. 2021 saw a significant increase in coal-fired generation (up 13%) after contractions in 2019 and 2020 driven by economic slowdown, a heavy monsoon season in 2019 that increased hydro generation, and the Covid-19 pandemic.
As India’s demand for electricity continues to grow, the expansion of generation capacity accelerates from 2022 onwards. While we expect 48% of new demand to be met by coal-fired generation, low-carbon sources provide about half of the additional supply. New records for renewable capacity addition are expected in 2021 and 2022, principally wind and solar PV. Consequently, renewables provide 35% of the incremental demand, with nuclear largely accounting for the balance. Driven by state and central auctions, as well as a target of 450 GW of installed renewable capacity, renewable generation is expected to increase by 30% by 2024 relative to 2021.

Electricity Market Report – January 2022
PAGE | 48
Regional perspective
IEA
. All
right
s res
erve
d.
At the COP26 in Glasgow in November 2021, India pledged to reach net zero by 2070. However, despite targets for reducing the emissions intensity of GDP and for 40% of generation capacity to be non-fossil fuelled, and despite the coal supply shortages during autumn 2021, new coal-fired plants are still being built. Coal-fired capacity is expected to continue growing in the near future. According to the draft National Electricity Policy 2021, the Ministry of Power confirms that coal will continue to provide a significant contribution to electricity generation.
As of November 2021 India had seven nuclear reactors under construction with a total gross capacity of 5.2 GW. We expect nuclear generation to see a sustained increase in the coming years, surpassing gas from 2022 as the third-largest contributor to generation, after coal and renewables.
The Indian Ministry of Power is currently studying the development of market-based economic dispatch, and presented a discussion paper on the topic for comments in June 2021. Further development of power markets, and particularly the implementation of market-based economic dispatch, can further the participation of renewable energy generation in the Indian system by introducing merit order dispatch and improved balancing from reserves being shared across states, among other improvements.
Monthly electricity supply in India, 2019-2021
IEA. All rights reserved.
Source: IEA analysis based on data from Central Electricity Authority, Ministry of Power, Government of India, National Power Portal.
0
20
40
60
80
100
120
140
160
1 2 3 4 5 6 7 8 9 10 11 12
Tota
l ele
ctric
ity s
uppl
y (T
Wh)
Month
2019 2020 2021

Electricity Market Report – January 2022
PAGE | 49
Regional perspective
IEA
. All
right
s res
erve
d.
Coal continues to be the single largest source of additional supply, but low-carbon is catching up
Change in electricity generation in India, 2015-2024
IEA. All rights reserved.
Note: Other non-renewables includes oil, waste and other non-renewable energy sources. Source: IEA analysis based on data from IEA (2022), Data and statistics.
- 100
- 50
0
50
100
150
200
2015
2016
2017
2018
2019
2020
2021
2022
2023
2024
India
Cha
nge
in e
lect
ricity
gen
erat
ion
(TW
h)
Coal Gas Nuclear Other non-renewables Renewables Net change

Electricity Market Report – January 2022
PAGE | 50
Regional perspective
IEA
. All
right
s res
erve
d.
Japan In 2021, Japan’s electricity demand returned to about the 2019 level (up 1.5%). Despite demand recovering in the industrial and commercial sectors, the impact of the pandemic continued and the recovery was limited due to an over six month long state of emergency in 2021. Japan’s electricity demand has declined over the past decade due to strong energy conservation activities and despite increasing electrification. We forecast this trend to continue during 2022-2024 with an average annual decline of less than 1%.
In 2021 gas and coal met around 70% of total electricity demand, but the contribution of renewables is rising every year. In the period to 2024 we expect coal- and gas-fired power generation to decline by about 15% and 9% respectively relative to 2021, while renewable generation is set to grow by 21%. Nuclear generation could increase even more than renewables, due to reactor restarts. This includes plants resuming operation after temporary shutdown due to anti-terrorism safety measures, as well as units restarting for the first time since the accident at the Fukushima Daiichi nuclear power plant, following the Great East Japan Earthquake of 2011. However, some uncertainty exists due to concerns over non-compliance with regulations and local opposition.
In October 2021 the Japanese government launched the sixth Strategic Energy Plan, aimed at achieving carbon neutrality by
2050. This plan includes a renewable share of 36-38% by the end of 2030, almost double the share in 2021, and nuclear generation of 20-22%, which could further accelerate the use of both sources.
Korea After growth of 1% in 2020, we estimate electricity demand in Korea to have increased by over 5% in 2021, despite higher numbers of new Covid-19 cases. We anticipate stable annual demand growth of slightly above 1% to 2024, led by the industrial sector and followed by the commercial and services sector.
We expect renewable capacity to grow strongly over the forecast period, increasing by almost 50% by 2024 compared to 2021. This expansion is led by solar PV at over 4 GW per year. Both gas- and coal-fired capacity continues to rise during the forecast period, as plants already under construction come online despite government announcements to phase out both technologies in the longer term.
Renewable electricity saw the strongest growth in 2021, rising by around 30% above 2020’s output, mostly from solar PV and biomass. From 2022 to 2024 we expect on average 15% additional total renewables output per year. Gas generation also rose in 2021 (up 22%). Nuclear generation declined by 8%, with some plants offline due to long-term maintenance. In the next three years we expect nuclear generation to grow in absolute terms to about the same extent as renewables, increasing by 5% per year on average,

Electricity Market Report – January 2022
PAGE | 51
Regional perspective
IEA
. All
right
s res
erve
d.
as four new nuclear units are scheduled to start operating. Low demand growth and the rapid expansion of low-carbon generation mean that coal-fired generation, which decreased by around 3% in 2021, continues to decline at around the same rate out to 2024.
In September 2021 the Korean parliament approved its bill on carbon neutrality and set aside KRW 12 trillion (USD 10 billion) for the state budget in 2022 to achieve GHG emission reductions. Korea has also set out two main scenarios to meet its net zero target in 2050 and announced more ambitious nationally determined contributions under the Paris Agreement ahead of COP26. Korea introduced its current emissions trading scheme in 2015, which covers over 70% of emissions including heat, power, industry, buildings, domestic aviation, waste and public services. The scheme has entered its third phase (2021-2025), in which the power sector is allocated 90% of its allowances free of charge.
Australia While Covid-19 cases in Australia were minimal in the first half of 2021, outbreaks of new variants in the second half saw a number of lockdowns in Australian states. Although cases continued to rise in late 2021, the vaccine rollout progressed steadily from March, over 60% of the population receiving two doses by October.
After falling by around 1.3% in 2020, Australian electricity demand rebounded somewhat in 2021 with close to 1% growth, but is only
expected to surpass 2019 levels in 2022. We expect slow continued growth up to 2024 at an average of around 1% per annum.
Most capacity additions in Australia during 2021 are powered by renewables, with 1.3 GW of new wind capacity and 4.7 GW of solar PV. We expect both technologies to continue growing at a similar pace up to 2024. Around 2 GW of coal-fired capacity is due to retire in the coming years: Liddell Power Station is to close its first unit (500 MW) in April 2022 and the remaining three units (1 500 MW) in April 2023. A number of new battery projects have also been announced, with what will become the world’s largest battery, a 1.2 GW facility at Kurri Kurri, to be completed in 2023. The Australian electricity market moved to five-minute settlement on 1 October 2021, which is expected to favour fast-acting resources such as batteries.
Coal-fired generation made up around 53% of electricity generation in 2021. We forecast a slow decline following capacity retirements, its share falling to around 47% by 2024. Renewable generation grew by around 18% in 2021 year-on-year, and is forecast to continue growing up to 2024 following continued capacity additions. Gas generation fell by around 16% in 2021 and is expected to decline further by around 3% per year on average up to 2024.
In October 2021 Australia announced its pledge to reach net zero carbon emissions by 2050. Additionally, at COP26 the country announced plans to reduce its emissions to 35% below 2005 levels by 2030.

Electricity Market Report – January 2022
PAGE | 52
Regional perspective
IEA
. All
right
s res
erve
d.
Electricity demand is relatively stable in Japan, Korea and Australia, with low-emission generation growing and coal gradually declining
Change in electricity generation, 2015-2024
IEA. All rights reserved.
Note: Other non-renewables includes oil, waste and other non-renewable energy sources. Source: IEA analysis based on data from IEA (2022), Data and statistics.
- 60
- 40
- 20
0
20
40
60
2015
2016
2017
2018
2019
2020
2021
2022
2023
2024
2015
2016
2017
2018
2019
2020
2021
2022
2023
2024
2015
2016
2018
2019
2020
2021
2022
2023
2024
Japan Korea Australia
Cha
nge
in e
lect
ricity
gen
erat
ion
(TW
h)
Coal Gas Nuclear Other non-renewables Renewables Net change

Electricity Market Report – January 2022
PAGE | 53
Regional perspective
IEA
. All
right
s res
erve
d.
Southeast Asia We estimate electricity demand in Southeast Asia to have grown by 3.8% in 2021 following an overall decline in 2020, despite the region continuing to be affected by the Covid-19 pandemic. Most of the demand growth was met by increased renewable generation, with gas and coal generation remaining about constant compared to 2020.
In the first quarter of 2021 many Southeast Asian countries saw electricity demand recover from the previous year’s declines, led by the industrial sector. However, in the second quarter a surge in Covid-19 cases severely affected many countries, particularly Indonesia, Malaysia, Thailand, the Philippines and Viet Nam. This delayed economic recovery and led to lower demand growth, the largest impact being in the residential and commercial sectors. From 2022 we expect a stronger recovery, with annual demand growth close to 5% in 2022-2024.
Electricity supply in Southeast Asia continues to be led by coal (around 43%), followed by gas (31%) and then renewables (25%). However, the share of both coal and gas in the mix declined in 2021 while the renewables share increased by more than two percentage points. While renewables growth is set to continue up to 2024, we expect the sum of coal- and gas-fired generation to meet around two-thirds of new demand over this period.
Change in electricity generation in Southeast Asia, 2015-2024
IEA. All rights reserved.
Note: Other non-renewables includes oil, waste and other non-renewable energy sources. Source: IEA analysis based on data from IEA (2022), Data and statistics.
- 40
- 20
0
20
40
60
80
100
2015
2016
2017
2018
2019
2020
2021
2022
2023
2024
Southeast Asia
Cha
nge
in e
lect
ricity
gen
erat
ion
(TW
h)
Coal GasNuclear Other non-renewablesRenewables Net change

Electricity Market Report – January 2022
PAGE | 54
Regional perspective
IEA
. All
right
s res
erve
d.
Indonesia The impact of Covid-19 affected Indonesia from April 2020, hampering economic growth and leading to a decline in electricity consumption. The GDP growth rate of -2.1% in 2020 was associated with a 0.8% reduction in electricity consumption year-on-year, caused by reductions in consumption in the industrial and commercial sectors. While demand began to rebound in 2021, a surge of Covid-19 cases in the third quarter delayed economic recovery, resulting in revised expectations for economic growth in 2021 of 3.5%, down from 4.5%. We expect electricity demand to have grown by 3.6% in 2021 and to grow by over 4% in 2022. Annual electricity demand growth is expected to be slightly above 4% on average in the period 2022-2024. Similar to many other ASEAN countries, the energy-intensive industrial sector is expected to grow faster than other sectors.
As of July 2021 the total generation capacity of Indonesia was 74 GW. Coal still accounts for the largest share of generation (58%). The share of renewables has remained stable (around 17%) for the last four years. The share of solar PV was around 0.1% in 2021. To reach the national renewable target of 23% in 2025, a presidential regulation on renewables is expected during 2022. It is anticipated to use feed-in tariffs and auction schemes to accelerate investment in all renewable resources. The construction of the 145 MW Cirata floating solar PV plant, one of the largest examples of floating solar PV in the world, will soon begin after reaching a financial close agreement in August 2021, with its commercial
operations expected to begin by the end of 2022. This project is viewed as a pilot for the development of hybrid floating solar PV plants in many other islands to meet the renewables target.
The government has announced a commitment to achieve net zero emissions by 2060, or sooner with financial and technological support from developed nations. Five principles were identified in achieving the target: 1) increasing the share of renewables; 2) reducing the use of fossil fuels; 3) promoting electric vehicles; 4) electrification in the residential and industrial sectors; and 5) utilising carbon capture, utilisation and storage (CCUS). PLN – the state-owned electricity company – has announced that it will build no new coal power plants after 2023, when they expect to complete all plants under their 35 GW programme and 7 GW Fast Track Programme. Nonetheless, the recent electricity supply plan (RUPTL) still expects additions of around 5 GW of coal-fired capacity from independent power producers between 2024 and 2030. As part of the commitment announced by the Ministry of Energy and Mineral Resources, no new fossil power plants are to be built beyond 2030. The first stage of coal-fired power plant retirements is due to begin in 2031.
Grids are an important flexibility resource for integrating renewables in a reliable and cost-effective manner, and interconnection and grid development are currently key challenges in Indonesia, both between islands within the nation and across borders. To this end, the Indonesian government is encouraging grid extensions within

Electricity Market Report – January 2022
PAGE | 55
Regional perspective
IEA
. All
right
s res
erve
d.
and between islands. According to Indonesia’s net zero plan, inter-island interconnection should start commercial operation in 2031.
Viet Nam After successfully limiting the pandemic’s impact in 2020, Viet Nam experienced a strong Covid-19 wave from May 2021, which prompted restrictive measures and lockdowns lasting until the autumn of 2021. These lockdowns led to large production shutdowns, especially in Ho Chi Minh City and the industrial provinces; the country’s economy was strongly affected. In September 2021 the industrial production index for the electricity and gas sector dropped by 10% year-on-year, and electricity demand in the first two weeks of the month was 15% lower than in 2020. Based on these impacts, we expect electricity demand growth in 2021 to have with 5% remained below pre-pandemic levels. From 2022 electricity demand is expected to recover further and grow by 7% every year, pushed by the withdrawal of restrictions, rising vaccination rates, urbanisation and the country’s strong manufacturing industry.
Viet Nam saw strong growth in installed solar PV capacity in 2020, with net additions of close to 11 GW. Nevertheless, the country continues to rely on coal to meet a large proportion of its electricity demand – for 2021 we estimate that 45% of electricity generation came from coal. Despite concerns over the availability of financing for coal power projects, the latest revision of the electricity
development plan (PDP8) from September 2021 increased by 3.4 GW the target for coal-fired capacity installed by 2030, compared with the February 2021 version of the document. While this revision decreased onshore wind capacity targets by 6 GW and removed offshore wind, expansion of renewable capacity remains a pillar of the country’s plan. It is therefore expected that by 2024 coal and renewables will have similar shares in the Vietnamese electricity mix (43% and 42% respectively), with gas-fired generation contributing 14% in 2024 due to LNG-to-power projects such as Thi Vai and Son My coming online.
Thailand Thailand is slowly recovering from an economic downturn and a drop in electricity consumption caused by the Covid-19 pandemic. Peak demand in 2021 increased by over 5% to 30.1 GW compared with 28.9 GW in 2020. During the first ten months of 2021 electricity demand grew by 1.4% compared with the same period in the previous year, due largely to increased demand in the industrial sector. Industry accounted for the largest share of overall electricity demand at around 45%, and industrial demand grew by 5.5% in this period, the largest growth being seen in car manufacturing, iron and steel, and rubber manufacturing. Electricity consumption in the residential increased by 2%, whereas the commercial sector consumption declined by more than 6% during the first ten months due to the strict Covid-19 containment measures, particularly during the second quarter of 2021. With the gradual reopening of

Electricity Market Report – January 2022
PAGE | 56
Regional perspective
IEA
. All
right
s res
erve
d.
economic activity, we estimate that overall demand grew in 2021 by 2%, with industry leading the rise. Similar annual growth rates of 2-3% are forecast for electricity demand in 2022-2024, led by industry and commerce.
Although natural gas has been the largest source of electricity generation in Thailand over the past decades (estimated 60% in 2021), the first ten months of 2021 saw a slight decrease in total gas-fired generation (down 1%) and its share in the electricity mix. Coal, providing 21% of total generation in 2021, declined by 4%.
At COP26 Thailand officially announced its commitment to achieve carbon neutrality by 2050, and net zero GHG emissions by 2065, with international support. This target has been accelerated from the original plan of 2060-2065 that was approved in August 2021 under the new National Energy Plan 2022. As part of this national energy target, the Electricity Generating Authority of Thailand (EGAT) has also announced the EGAT Carbon Neutrality by 2050 policy, including a goal to reach peak emissions by 2025 by focusing on transforming generation sources towards clean energy, modernising the power grid and promoting demand-side management. Under the new national plan, at least a 50% share of new generation must come from renewables. Large-scale hybrid hydro-floating solar PV power plants, batteries and CCUS have been identified as the main clean technology sources. Thailand’s first hydro-floating solar hybrid project, with 45 MW capacity and currently the world’s largest, started commercial operation in
October 2021. The plan is to increase the capacity of hydro-floating solar PV to 5.3 GW by 2037, utilising existing hydropower plants.
Philippines Varying confinement measures due to the pandemic began in the Philippines in 2020. The residential sector had the highest share of electricity demand at around 35%, and with a 12% year-on-year rise was the only sector to grow in 2020. This tempered the countrywide fall in demand to a decrease of around 5% relative to 2019. With the gradual reopening of activities, demand rebounded and in the first half of 2021 was 3.1% higher than in the same period in 2019. Demand recovery is set to continue as vaccinations are rolled out into 2022, resulting in annual growth of 5-6% until 2024.
Low reserve margins were observed in the Luzon grid during April and May 2021 (the hot and dry season). Reserve shortfalls were seen on several days due to high demand for cooling coinciding with lower hydropower availability. Electricity security has been highlighted as a concern, especially given the general elections scheduled for May 2022. The start of commercial operation of the delayed Dinginin supercritical coal power plant (1.3 GW) is expected to help alleviate this concern once both units come online, anticipated for the second quarter of 2022.
A moratorium on the endorsement of new coal power plants was passed in the fourth quarter of 2020, but about 3.15 GW of total additional coal capacity is still expected between 2021 and 2025

Electricity Market Report – January 2022
PAGE | 57
Regional perspective
IEA
. All
right
s res
erve
d.
from previous approvals. The total new generating capacity committed for the period, including coal, comes to 5.8 GW. In addition, 1.54 GW of battery storage capacity is also committed.
Market design changes to support higher shares of variable renewables continue to be implemented in the Philippines. In June 2021 five-minute intervals in the wholesale market were introduced, as well as a renewable energy option for end users. The share of wind and solar PV remains low at estimated 3% in 2021 compared with geothermal (10%) and hydro (7%), and the system is dominated by coal (54%) and gas (21%). Implementation of a reserves market was planned by the end of 2021, while demand-side bidding is to be introduced by 2024.
The major island groups of Luzon, Visayas and Mindanao will soon be connected once the Visayas-Mindanao interconnection project is completed in early 2022, thereby helping consolidate the available reserves for the country.
Singapore We estimate Singapore’s electricity demand to have topped pre-Covid-19 levels in 2021 (up 3.4% on 2020). Despite a surge in Covid-19 cases, lockdown measures have been limited compared to 2020 and the vaccination rate was already high in October 2021 (84%). We expect demand to grow above 2% until 2024, similar to the forecast by the Energy Market Authority of Singapore (EMA).
Gas-fired plants meet the vast majority of demand (95% in 2021), with gas supplied through pipelines from Malaysia and Indonesia and LNG imports. Long-term supply contracts largely insulated Singapore from the high Asian LNG spot prices. However, in 2021 the country saw wholesale electricity price surges, driven partly by maintenance affecting pipeline gas from Indonesia. Singapore started purchase inquiries in the spot market due to the expected expiry of a long-term contract with Indonesia by 2023. In addition, it announced pre-emptive supply security arrangements, including standby fuel facilities to stabilise wholesale electricity prices, and a co-operation arrangement where generation companies looking to sell excess gas must offer it first to EMA and other local generation companies.
Singapore announced its requests for proposals to secure 4 GW of low-carbon electricity imports to make up 30% of its power supply by 2035. The first 1.2 GW is expected by 2027. It has already set up a two-year trial to import 100 MW of cross-border electricity from Malaysia, starting by 2022. This will help diversify its sources of electricity and is a step towards building the ASEAN power grid.

Electricity Market Report – January 2022
PAGE | 58
Regional perspective
IEA
. All
right
s res
erve
d.
Electricity demand growth in Southeast Asia is fuelled by a mix of coal, gas and renewables Change in electricity generation, 2015-2024
IEA. All rights reserved.
Note: Other non-renewables includes oil, waste and other non-renewable energy sources. Source: IEA analysis based on data from IEA (2022), Data and statistics.
- 20
- 10
0
10
20
30
4020
15
2018
2021
2024
2015
2018
2021
2024
2015
2018
2021
2024
Indonesia Viet Nam Thailand
Cha
nge
in e
lect
ricity
gen
erat
ion
(TW
h)
Coal Gas Nuclear Other non-renewables Renewables Net change
- 6
- 4
- 2
0
2
4
6
8
10
2015
2018
2021
2024
2015
2018
2021
2024
Philippines Singapore
Cha
nge
in e
lect
ricity
gen
erat
ion
(TW
h)

Electricity Market Report – January 2022
PAGE | 59
Regional perspective
IEA
. All
right
s res
erve
d.
Americas

Electricity Market Report – January 2022
PAGE | 60
Regional perspective
IEA
. All
right
s res
erve
d.
Strong demand growth and high gas prices lead to a temporary rebound for coalCountries in the Americas region posted a strong rebound in electricity demand of 4% in 2021, following declines of 2% in 2019 and 3.0% in 2020. The growth in demand is set to moderate over the next three years, averaging close to 1% between 2022 and 2024. This is largely driven by the United States, which comprises about two-thirds of overall regional demand. We expect US demand growth to have reached 3% in 2021, slowing to less than 0.5% over the next three years. The figures in Canada are largely in line with its neighbour, while in Mexico we expect 2021 to have seen a stronger rebound in 2021 of 6%, which then moderates to 3-4% annually over the next three years.
In South America annual demand growth reached 6% in 2021, Brazil’s demand growing by over 7.5%. We estimate growth to have been above 7% in Peru and Colombia, and around 3% in Argentina and Chile.
Commercial and industrial demand were the main drivers of growth in 2021 in the Americas region, reflecting the increase in economic activity following Covid-19 lockdowns. Residential demand was steadier, growing by between 1% and 2% in 2020 and 2021 despite the reduction in overall economic activity, a further reflection of the impacts of Covid-19. Electricity demand for transport is expected to see the strongest growth between 2021 and 2024, albeit from a very small base. The increasing electrification of transport, as well as
other end uses like heating and cooling, is expected to be a main driver of electricity demand in the future, although partially offset by increasing efficiency in current forms of electricity use.
On the supply side, coal-fired generation posted a remarkable annual rise in output of 17% in 2021, after six straight years of declines, boosted by lower hydro availability due to drought and higher natural gas prices which drove gas-to-coal switching. This increase is likely to be fleeting. A return to near-normal hydro conditions in 2022 as well as increases in wind and solar capacity should reduce the demand for coal by around 7% annually over the next three years.
Renewables including hydro accounted for about 34% of annual generation in the region in 2021, the largest share of all sources, followed by gas at 32%, coal at 17%, nuclear at 14% and oil at 2.6%. By 2024 we expect renewables to account for almost 40%, its share increasing almost entirely at the expense of coal, which is expected to decline to a share of 13%.
This will drive emissions lower, both in their overall level and intensity. We expect emissions intensity to fall to 272 g CO2/kWh in 2024, down from 311 g CO2/kWh in 2021 and 404 g CO2/kWh in 2014. Overall emissions are set to decline to 1.9 billion t CO2 in 2024, from 2.1 billion t CO2 in 2021.

Electricity Market Report – January 2022
PAGE | 61
Regional perspective
IEA
. All
right
s res
erve
d.
Demand growth moderates after the rebound from Covid-19 in 2021 Development of electricity demand, 2015-2024
IEA. All rights reserved.
Source: IEA analysis based on data from IEA (2022), Data and statistics.
-6%
-4%
-2%
0%
2%
4%
6%
8%
10%
12%
14%20
15
2018
2021
2024
2015
2018
2021
2024
2015
2018
2021
2024
2015
2018
2021
2024
2015
2018
2021
2024
Americas United States Canada Mexico Brazil
Elec
trici
ty d
eman
d gr
owth
Demand Demand forecast

Electricity Market Report – January 2022
PAGE | 62
Regional perspective
IEA
. All
right
s res
erve
d.
Coal gets a boost in 2021, leading to higher emissions; renewables dominate thereafter Change in electricity generation, 2015-2024 Development of emissions intensity, 2015-2024
IEA. All rights reserved.
Note: Other non-renewables includes oil, waste and other non-renewable energy sources. Source: IEA analysis based on data from IEA (2022), Data and statistics.
- 400
- 300
- 200
- 100
0
100
200
300
40020
15
2016
2017
2018
2019
2020
2021
2022
2023
2024
Americas
Cha
nge
in e
lect
ricity
gen
erat
ion
(TW
h)
Coal GasNuclear Other non-renewablesRenewables Net change
0
100
200
300
400
500
600
2015 2017 2019 2021 2023
CO₂
inte
nsity
(g C
O₂/
kWh)
Americas United States Canada
Mexico Brazil

Electricity Market Report – January 2022
PAGE | 63
Regional perspective
IEA
. All
right
s res
erve
d.
United States Electricity security will be closely watched in the United States this winter, as the possibility of a repeat of the severe power cuts that occurred in Texas in February of 2021 cannot be discounted. A joint report issued in October on winter readiness of the power sector by the regulator FERC and reliability entity NERC strongly urged system operators to adopt winterisation recommendations to ensure reliability.
US electricity demand rose by 3% in 2021, returning to levels seen in 2019 prior to the Covid-19-related disruption in economic activity. We expect it to moderate gradually and stabilise by 2024.
Gas-fired generation declined by around 3% in 2021, driven by higher natural gas prices improving the competitiveness of coal-fired generation. The price of gas at Henry Hub, the benchmark US location, reached USD 5.5 per MBtu in October, up from USD 2.4 per MBtu for the same month in 2020 and the highest price for the month since 2008. In 2022 low electricity demand growth combined with strong renewables growth squeezes both gas and coal generation. In the latter two years of the forecast, falling natural gas prices allow gas to increase its share at the expense of coal, with renewables growth shrinking total fossil fuel generation.
Coal-fired generation is expected to have risen by 19% in 2021, the first annual increase since 2014, as it benefited from the relative
increase in the price of natural gas and strong demand growth. We expect this increase to be short-lived, however. Coal-fired generation is anticipated to fall by an average of close to 6% annually in the period 2022 to 2024.
Nuclear generation is expected to have declined by 1.5% in 2021, continuing a slight downward trend over the past five years as facilities retire, including Indian Point 3 in New York at the end of April. The commissioning of Vogtle Units 3 and 4 has been delayed until late 2022 and early 2023 respectively. Construction of these facilities commenced in 2012.
We anticipate hydroelectric power generation to have declined by 11% in 2021 compared with 2020, as long-term drought conditions prevailed in many parts of the western states. For 2022 we expect growth of 8% year-on-year as more average hydro output returns.
Most of the growth in electricity generation between 2022 and 2024 is likely to be from wind and solar PV. In 2021 wind generation increased by 11%, while solar output grew by 26%. We expect wind output to grow by an annual average of 8% between 2022 and 2024, and solar generation to grow at an average rate of 22% over the same period.

Electricity Market Report – January 2022
PAGE | 64
Regional perspective
IEA
. All
right
s res
erve
d.
Renewables growth bounces back, while coal and gas decline Change in electricity generation, 2015-2024
IEA. All rights reserved.
Note: Other non-renewables includes oil, waste and other non-renewable energy sources. Source: IEA analysis based on data from IEA (2022), Data and statistics.
- 300
- 200
- 100
0
100
200
300
2015
2016
2017
2018
2019
2020
2021
2022
2023
2024
United States
Cha
nge
in e
lect
ricity
gen
erat
ion
(TW
h)
Coal Gas Nuclear Other non-renewables Renewables Net change

Electricity Market Report – January 2022
PAGE | 65
Regional perspective
IEA
. All
right
s res
erve
d.
Canada Canada’s electricity demand rose by about 3% in 2021, offsetting the decline of 2.6% in the previous year. Economic recovery and a colder winter than in 2020 have helped boost Canadian electricity demand. Extreme heat in June 2021 saw new summer peak demand records set in western Canada. In the period 2022-2024 demand grows much more gradually, averaging 1.4% annually. Electricity exports, which jumped by about 20% in 2020, revert to historical levels in 2021 where about 10% of production is exported to the United States.
Most of the renewable capacity growth in Canada is in hydropower. Muskrat Falls, a new (824 MW, 4.9 TWh per year) hydro facility in Labrador is operational, although by the end of 2021 associated transmission facilities were still being commissioned. The Canadian and Newfoundland and Labrador governments reached an agreement in principle for the financial restructuring of the project. The Keeyask project (700 MW, 4.4 TWh per year) in Manitoba is expected to enter operation in 2022, as is the 4th unit of the La Romaine project (245 MW, 1.3 TWh per year) in Quebec. The Peace River Site C project (1 100 MW, 5.1 TWh per year) under construction in British Columbia has an expected in-service date of 2025. Wind and solar investment continues, their capacity set to reach 17 GW and 5 GW respectively in 2024.
Nuclear output is expected to fall due to additional units undergoing refurbishment. Two large nuclear units in Ontario (Darlington 3 and Bruce 6) began multi-year outages in 2020 and will not return to service until late 2023 or early 2024. A third unit, Darlington 1, will go offline in 2022 and a fourth unit, Bruce 3, in early 2023.
Coal-fired generation sees a marked decline thanks primarily to the coal phase-out in the province of Alberta, which is expected to be completed by 2023, most of the units being converted to operate on natural gas. Coal-fired generating capacity in Canada, which measured 8.8 GW in 2019, falls to 2.9 GW in 2024, coal-fired generation falling by over 80%. Natural gas-fired generation grows as a result of the coal closures and conversions and nuclear outages. Electricity trade rose in 2020, with 57 TWh of net exports to the United States. In September 2021 Hydro Quebec entered into an agreement with the State of New York for the transmission of 1 250 MW (10.4 TWh per year) of hydro and wind power from Quebec to New York City. One unusual feature of the deal is that the transmission line, known as the Champlain Hudson Power Express, will be entirely underground or underwater from the US border with Canada to its endpoint in New York City. The deal is subject to regulatory approval. Another previously approved export project, New England Clean Energy Connect, which would lead to the export of 1 200 MW (9.45 TWh per year) of power from Quebec to the state of Massachusetts via Maine, hit a roadblock in November 2021 when a referendum in Maine passed calling for a ban on the construction of the transmission lines for the project.

Electricity Market Report – January 2022
PAGE | 66
Regional perspective
IEA
. All
right
s res
erve
d.
Mexico Electricity demand recovered in Mexico in 2021, growing by more than 6% year-on-year. Most of the demand increment in 2021 was met by an increase in gas-fired generation. This was despite the widespread loss of gas-fired generation in February 2021 that led to power cuts to about 11 million users due to the unavailability of gas supplies from across the border, caused by record low temperatures in the southern United States.
In 2022 generation from renewable energy is set to grow by 17%, a higher rate than other sources, providing about 12 TWh of additional electricity compared to 2021, driven primarily by new wind and solar capacity and higher hydro availability.
In late 2021 the Mexican government announced a constitutional reform proposal to reverse the 2014 electricity market reform. Growth in renewable generation is expected to slow after 2022, while still increasing because of additional solar rooftop PV installations and increased dispatch from the country’s hydropower generation facilities. Additional government measures to increase renewable energy as part of the reform proposal include building a 1 000 MW solar PV park, a 25 MW new geothermal generation unit and repowering hydropower stations to increase capacity by 264 MW. Renewables are expected to grow very slowly in 2023 and 2024, meaning that oil-fired generation will be needed to cover the growing demand.
Brazil Similar to other countries in the region, electricity demand rebounded in 2021, rising by 7.6% year-on-year. However, the worst drought since the start of records in 1930 led to a drop in renewable generation, due mainly to a decline in hydropower. Thus, the sum of coal- and gas-fired generation rose by 31 TWh compared with 2020 (up 43%).
In order to guarantee security of supply, the Brazilian government enacted a series of special measures such as the establishing a new committee for emergency hydropower management, with powers to temporarily determine limits on use, storage and flow at the country’s hydropower plants, extending to the end of 2021.
In September 2021 Brazil’s Ministry of Energy published guidelines for additional simplified auctions of reserve generation contracts covering the period from May 2022 to December 2025. Additionally, the country’s energy regulator, ANEEL, approved a BRL 1 619/MWh (approximately USD 300/MWh) price cap on natural gas-fired generation for its October 2025 auction.
With increased rainfall in October 2021, we expect renewable generation to start rising year-on-year by 20 TWh in 2022 (up 4%) and 54 TWh in 2023 (up 10%). However, electricity prices are set to remain high throughout 2022 due to the anticipated need to limit hydropower generation and the cost of contracted gas reserves needed to maintain continuity of supply.

Electricity Market Report – January 2022
PAGE | 67
Regional perspective
IEA
. All
right
s res
erve
d.
Coal-fired generation is being replaced by renewables and gas Change in electricity generation, 2015-2024
IEA. All rights reserved.
Note: Other non-renewables includes oil, waste and other non-renewable energy sources. Source: IEA analysis based on data from IEA (2022), Data and statistics.
- 60
- 40
- 20
0
20
40
60
2015
2016
2017
2018
2019
2020
2021
2022
2023
2024
2015
2016
2017
2018
2019
2020
2021
2022
2023
2024
2015
2016
2018
2019
2020
2021
2022
2023
2024
Canada Mexico Brazil
Cha
nge
in e
lect
ricity
gen
erat
ion
(TW
h)
Coal Gas Nuclear Other non-renewables Renewables Net change

Electricity Market Report – January 2022
PAGE | 68
Regional perspective
IEA
. All
right
s res
erve
d.
Europe

Electricity Market Report – January 2022
PAGE | 69
Regional perspective
IEA
. All
right
s res
erve
d.
The comeback of fossil fuels in Europe is only temporaryAfter demand for electricity in Europe fell by 1.3% in 2019 and 4% in 2020, it increased by more than 4% in 2021 to about the pre-pandemic level of 2019. Two factors were the main drivers for the strong rebound. First, the region’s economy grew strongly, headed by the industrial sector while the commercial sector’s recovery was dampened by health protection measures. Second, colder temperatures raised heating demand – April 2021 was the coldest since 2003. During 2022 we expect demand to continue to grow, albeit at a slower pace of 1.7%, supported by continued economic recovery. A return to static demand is likely in 2023 and 2024.
The most notable development on the supply side in 2021 was the strong growth of coal-fired generation, increasing by more than 11% after a 20% decline in 2020. This was the first increase since 2012. Coal served 40% of the year’s incremental demand, followed by nuclear at 30% (growing by 6%). The main reasons for this rebound of coal are the strong growth in demand coupled with relatively low growth in renewables generation (up 1%, caused by exceptionally low wind speeds). Additionally, high natural gas prices improved the competitive position of coal-fired plants vis-à-vis gas, despite allowances under the EU emissions trading system (EU ETS) being over twice the price of those in 2020. High fuel prices resulted in record-high wholesale prices. Fourth quarter prices in France, Germany, Spain and the United Kingdom were three to more than four times higher than the fourth quarter 2016-2020 average.
We expect the period 2022 to 2024 to be characterised by strong renewables growth, which crowds out fossil fuels (declining by almost 10% during the period) and compensates for declining nuclear generation in 2022 and 2023 (down 4% over the whole period). Nuclear’s decline is related to the German nuclear phase-out and further closures in Belgium and the United Kingdom.
As gas prices are expected to be relatively high throughout 2022, coal is set to largely maintain its role during the year (declining by 3%), but is likely to decline significantly in 2023 (down 15%) and 2024 (down 13%) due to declining gas prices and slower demand growth. Gas benefits from improving competitiveness against coal in 2023, when its generation increases by 7%, but it is increasingly replaced by renewables in the medium term.
In 2021 the European Union put forward a wide range of reforms to the EU ETS as part of its Fit for 55 package. The reforms are intended to align the carbon market with the new 2030 EU emission target of reducing greenhouse gas emissions by at least 55% from 1990 levels (up from 40%). For the EU ETS, a 61% reduction in emissions by 2030 from 2005 levels is proposed (up from 43%).
After a year-on-year emissions surge of 8% in Europe in 2021 (4% higher emissions intensity), we expect a fall of 24% by 2024 compared with the pre-pandemic level of 2019 (emissions intensity down 27%).
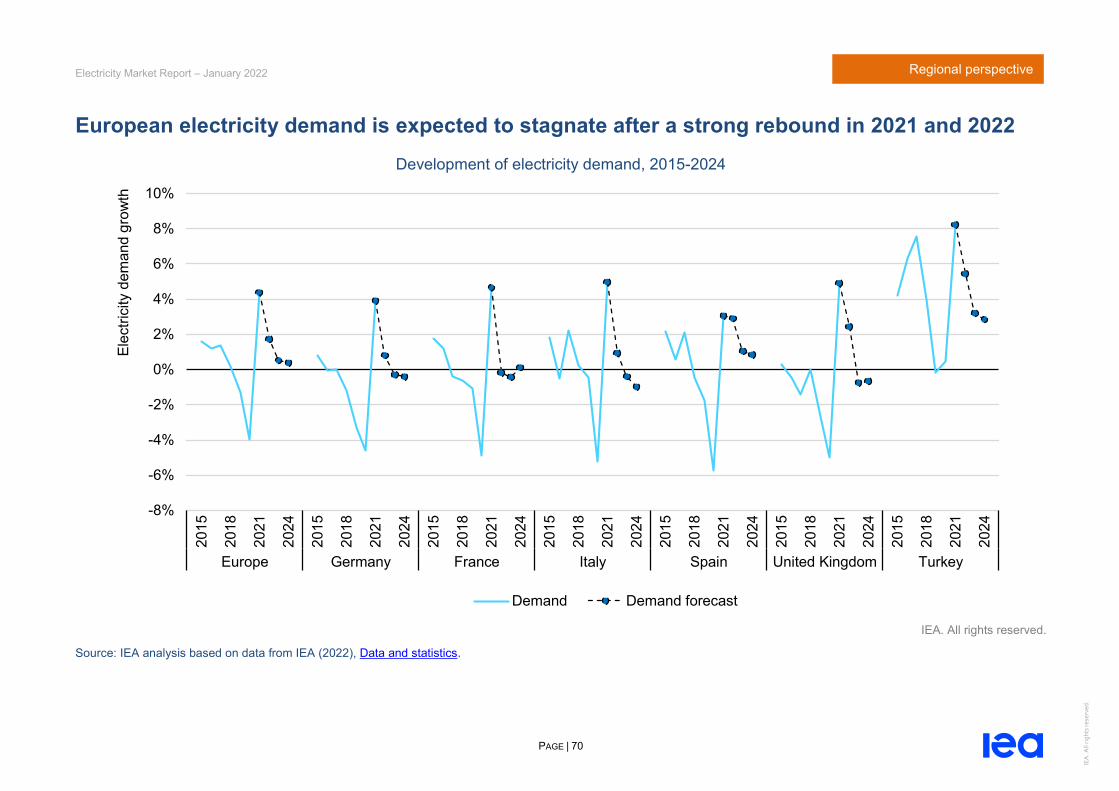
Electricity Market Report – January 2022
PAGE | 70
Regional perspective
IEA
. All
right
s res
erve
d.
European electricity demand is expected to stagnate after a strong rebound in 2021 and 2022 Development of electricity demand, 2015-2024
IEA. All rights reserved.
Source: IEA analysis based on data from IEA (2022), Data and statistics.
-8%
-6%
-4%
-2%
0%
2%
4%
6%
8%
10%20
15
2018
2021
2024
2015
2018
2021
2024
2015
2018
2021
2024
2015
2018
2021
2024
2015
2018
2021
2024
2015
2018
2021
2024
2015
2018
2021
2024
Europe Germany France Italy Spain United Kingdom Turkey
Elec
trici
ty d
eman
d gr
owth
Demand Demand forecast

Electricity Market Report – January 2022
PAGE | 71
Regional perspective
IEA
. All
right
s res
erve
d.
Electricity sector emissions and emissions intensity in Europe are expected to decline again after 2021
Change in electricity generation, 2015-2024 Development of emissions intensity, 2015-2024
IEA. All rights reserved.
Note: Other non-renewables includes oil, waste and other non-renewable energy sources. Source: IEA analysis based on data from IEA (2022), Data and statistics.
- 300
- 250
- 200
- 150
- 100
- 50
0
50
100
150
20020
15
2016
2017
2018
2019
2020
2021
2022
2023
2024
Europe
Cha
nge
in e
lect
ricity
gen
erat
ion
(TW
h)
Coal GasNuclear Other non-renewablesRenewables Net change
0
50
100
150
200
250
300
350
400
450
500
2015 2017 2019 2021 2023C
O₂
inte
nsity
(g C
O₂/
kWh)
Europe GermanyFrance ItalySpain United KingdomTurkey European Union

Electricity Market Report – January 2022
PAGE | 72
Regional perspective
IEA
. All
right
s res
erve
d.
EU ETS flexibility relieves pressure from gas markets The EU ETS puts a cap on total emissions that can be emitted by power plants, industry and the aviation sector. Each year, the number of new emission allowances decreases. Allowances can be traded and every year emitters must submit sufficient allowances to cover their annual emissions. Excess allowances can be carried forward into the next year.
Prices are determined by the long-term expectations of market participants regarding demand and supply of allowances, which are valid for more than ten years. This balance can be affected, for example, by an unexpectedly large increase in energy demand, as currently seen due to the strong economic recovery, or a tightening on the supply side as proposed in the Fit for 55 package.
For the electricity sector, the EU ETS typically regulates the balance between the generation costs of gas- and coal-fired power plants: with all other things remaining unchanged, a systematic increase in gas prices relative to coal results in gas-to-coal switching. Consequently, carbon emissions increase. But as total carbon emissions within the EU ETS are capped, the carbon price increases together with gas prices to prevent widespread fuel switching. (For the sake of clarity, we are neglecting here the Market Stability Reserve, which can influence the number of allowances in circulation.) Another way of thinking about this is that there is a fixed supply of emission allowances available within the
EU ETS. If the demand for allowances increases due to increasing coal-fired electricity generation, the price of allowances also increases to keep demand and supply in balance.
Gas prices increased strongly from the end of 2020 and in particular in the second half of 2021, more than the simultaneous increase in coal prices. Consequently, electricity market participants began gas-to-coal switching and therefore emissions surged. The EU ETS market responded by increasing the price for emission allowances, partially offsetting the growing price difference between gas and coal.
Nonetheless, higher allowance prices did not fully prevent gas-to-coal switching and the consequent increase in emissions from coal-fired electricity generation. That carbon prices did not increase yet more strongly shows a strength of the EU ETS market design: the carbon budget spans multiple years and therefore there is no fixed cap for individual years. Instead, emissions can be balanced over a longer time period. In 2021, due to the tight supply situation in gas markets (and therefore high prices), using gas instead of coal would have been very costly and economically inefficient. Instead, the EU ETS allowed for a shift from gas-fired generation to coal and thereby relieved pressure from tight gas markets. The additional emissions in 2021 have reduced the remaining allowances for the coming years. This will limit future coal use.

Electricity Market Report – January 2022
PAGE | 73
Regional perspective
IEA
. All
right
s res
erve
d.
Coal-fired generation was more competitive than gas in 2021 despite increasing EU ETS prices Gas- and coal-fired electricity generation costs, carbon prices, 2018-2021
IEA. All rights reserved.
Notes: Average monthly values. Assumed generation efficiencies are 40% for coal and 50% for gas. Sources: Natural gas prices: TTF; coal prices: CIF ARA; carbon costs: EU ETS. Latest update: 5 January 2022.
- 100
- 50
0
50
100
150
200
2018 2019 2020 2021
Gas
min
us c
oal v
aria
ble
gene
ratio
n co
sts
(EU
R/M
Wh)
C
O₂
pric
e (E
UR
/t C
O₂)
CO₂ price Gas minus coal (inc. carbon costs) Gas minus coal (exc. carbon costs)
Gas c
heap
erCo
al c
heap
er

Electricity Market Report – January 2022
PAGE | 74
Regional perspective
IEA
. All
right
s res
erve
d.
Germany After falling for eight years in a row, coal-fired electricity generation increased in Germany in 2021 (by estimated 25% compared with 2020) – but still remained 4% below the 2019 level. Three causes were responsible for this. First, electricity demand recovered by about 4% following its Covid-19-related 4.6% drop in 2020. Second, renewable generation, due to low wind speeds, declined for the first time in more than 20 years (down 4.5%). And third, high gas prices rendered coal-fired generation more competitive compared to gas.
Germany’s remaining nuclear capacity, which provided about 12% of total generation in 2021, is due to be phased out by the end of 2022. About 4.3 GW are set to be retired in two steps, at the end of 2021 and the end of 2022. We expect coal- and gas-fired generation in 2022 to remain at a similar level to 2021. Due to new capacity and an expected return to historical average wind speeds, we expect additional renewables generation (up 15%) to compensate for the decline in nuclear. Growth of around 1% could bring demand back to the pre-pandemic level of 2019.
In 2023 and 2024 we anticipate coal-fired generation to decline by one-third in total compared to 2022, enabled by four main factors. First, coal capacity is due to be retired according to the approved coal phase-out plans (down from 35 GW at the end of 2020 to 30 GW in 2022 and less than 26 GW in 2024). Second, renewables continue to grow (by 11% in total over both years). Third, according
to our model analysis, we expect Germany’s net exports to decline and the country to become a net importer of electricity for the first time since 2002. And finally, due to a continuing increase in the competitiveness of gas compared to coal, and induced fuel switching, we expect gas-fired generation to grow by 16% over the two years.
The rebound in coal-fired generation and the phase-out of nuclear capacity mean that electricity sector emissions increased in 2021 for the first time since 2013 (up 17%) and might only fall below the 2020 level again in 2024. However, potential measures by the new government entering office in December 2021 might affect the outlook for the coming years. The new coalition’s agreement includes, for example, the accelerated phase-out of coal (if possible by 2030) and the faster expansion of renewable energy.
France Electricity demand in France declined by 5% in 2020, largely driven by the contraction of economic activity, which led to an 8% decrease in GDP following the lockdown measures enforced in March 2020 and after. We expect the industrial and commercial sectors to have supported an overall recovery in power consumption of close to 5% in 2021. For 2022 to 2024, we expect demand to stagnate as efficiency gains offset increased electrification of the economy.

Electricity Market Report – January 2022
PAGE | 75
Regional perspective
IEA
. All
right
s res
erve
d.
As for electricity production, France is due to close its last coal-fired plant in 2022 and renewables will continue to experience a steady increase. While nuclear electricity generation remains the dominant source in France, its production level remains relatively stable. A number of older units undergo planned outages as part of their maintenance. The start of the new Flamanville 3 reactor is delayed and commercial operation expected not before the second half of 2023. Due to defaults detected during maintenance checks in December 2021, two nuclear plants had to be taken offline, dampening the outlook for nuclear generation in 2022. We expect renewables to accelerate their expansion and, driven by wind and solar expansion, represent 27% of the generation mix by 2024 (up from 22% in 2021). While France’s power sector CO2 emissions are already a very small share of total national CO2 emissions at 6%, and are also among the lowest in Europe, we expect them to decline by a further 25% by 2024 compared with 2021.
With a largely decarbonised power system, electrification is set to become a key factor in the decarbonisation of France’s economy. France was one of the first countries to put carbon neutrality into law in 2019, committing to achieve it by 2050. Various possible pathways, including the trade-offs between more nuclear power, renewables and energy efficiency, have been explored by RTE, the French transmission system operator. In October 2021 the French president announced that France would invest EUR 1 billion to develop small modular reactors by 2030, followed by an announcement in November to build new EPR reactors to achieve
carbon neutrality by 2050. Beyond developing the nuclear industry or renewable sources for power generation, France is now geared towards measures to enhance energy efficiency to offset the impact of electrification on final consumption.
Italy Italy’s electricity consumption dropped by around 5% year-on-year in 2020. Demand declined in particular in the second quarter (down more than 10%), as lockdowns and other restrictive measures weighed on commercial and industrial activity. We estimate that Italy’s electricity demand rose by over 5% in 2021, returning close to 2019 levels. Demand growth has been largely driven by economic recovery and higher space heating requirements amid colder than usual spring temperatures.
Strong demand recovery in 2021 coincided with limited growth in renewable electricity generation (up by 1%), leaving additional market space for thermal generation and imports. In the first half of the year, gas-fired generation rose by close to 10%, while coal-fired power output plummeted by more than 20% year-on-year. The surge in gas prices in Europe led to gas-to-coal switching in the second half of the year, with coal-fired plants increasing their output by 3%, while gas-based generation growth slowed down to 5% year-on-year.

Electricity Market Report – January 2022
PAGE | 76
Regional perspective
IEA
. All
right
s res
erve
d.
After growing by 1% in 2022, we expect Italy’s electricity demand to see declines of less than 1% in 2023 and 2024, driven by improving energy efficiency. Renewables-based electricity generation is foreseen to expand by 9% by 2024 compared with 2021 levels, and coal-fired generation is set to be phased out by 2025. Gas-fired power generation is expected to decline in 2022, but then to come back to plateau near 2021 levels in 2023 and 2024, continuing to play a key flexibility role in the country’s power system while more variable renewables are integrated into the matrix.
Spain In 2020 electricity demand in Spain fell by close to 6% year-on-year to 241 TWh. This was the largest decline seen in two decades, putting demand at 2003 levels. The economic recovery in 2021 has been weaker than previously expected, and electricity demand is set to increase by only around 3% and to remain below 2019 levels.
Renewables accounted for 43% of the electricity mix in 2020, reaching the highest share among all sources. In contrast, coal accounted for just 2%, its lowest ever share, and half of the existing 11 GW of coal-fired capacity was retired in just one week in 2020. In 2021, with growing installed wind and especially solar PV capacity, the renewable generation share reached a new all-time high of around 47%, and is expected to keep growing in the coming years.
In the transmission system, the Mallorca-Menorca islands underwater connection was completed in 2020, reinforcing security of supply in Menorca, an island with 100 000 inhabitants. On the regulation side, in July 2021 limits were extended for the Iberian wholesale day-ahead and intra-day markets to align with other European markets.
In 2021 electricity prices reached levels never seen before, pushed by higher CO2 and in particular gas prices. December’s average day-ahead price reached close to EUR 240/MWh, almost five times higher than the average December values in the previous five years. In June, when electricity prices started rising, electricity-related VAT was temporarily reduced from 21% to 10% for customers below 10 kW. In September 2021, as prices had continued to rise, the government issued a Royal Decree-Law modifying the Electricity Act, including the temporary reduction of the special tax on electricity (down to 0.5% from 5.1%) and the suspension of the tax on production (7%). Towards the end of 2021, measures were extended until April 2022. In addition, the government committed to add EUR 900 million to the previously planned EUR 1.1 billion annual cross-subsidy from CO2 auctions to the cost of the power system. Additionally, the Spanish government passed a decree to temporarily claw back so-called “windfall profits” from hydro, nuclear, PV and wind producers who were considered as unduly benefitting from high CO2 and gas prices.

Electricity Market Report – January 2022
PAGE | 77
Regional perspective
IEA
. All
right
s res
erve
d.
We expect renewable energy output to grow by around 7% annually between 2022 and 2024. Together with expected demand growth of close to 1% during the same period, we expect thermal generation to decline by 7.5% on average annually, replaced by renewables. Consequently emissions fall by almost 50% to 2024 compared with the pre-pandemic level of 2019.
United Kingdom In 2021 the United Kingdom saw a strong rebound in electricity demand (up 5%), returning to around the pre-pandemic level of 2019. Together with exceptionally low wind speeds resulting in a 14% drop in total renewable generation, this led to a 17% increase in gas-fired electricity supply and consequentially a more than 20% increase in electricity sector CO2 emissions. This was the first rise since 2012 and follows a decline in emissions of more than 70% since the year 2000.
As in other European countries, UK electricity wholesale prices increased significantly in 2021, in particular due to higher gas prices, low renewable generation and the outage of the IFA interconnector between France and the United Kingdom since September. Between 2015 and 2020 annual average day-ahead prices in Great Britain ranged between GBP 35 and GBP 58 per MWh (with a maximum monthly average of GBP 64 in March 2018). From April to December 2021 average monthly prices increased from GBP 67/MWh to GBP 226/MWh, with the December average
being more than four times higher than the average December value in the previous five years.
This also affects the UK energy price cap, which limits the price of default energy tariffs for domestic consumers. In October 2021 the cap was raised by 12-13%, and Ofgem, the responsible energy regulator, expects another significant increase in April 2022.
Higher wholesale electricity prices, combined with the price cap restricting the passing through of higher costs to customers, significantly affected energy suppliers. In the second half of 2021, 25 have exited the market.
On 1 January 2021, after the Brexit transition period ended and the United Kingdom left the EU single market, the UK emissions trading scheme (UK ETS) started to operate. Designed as a cap and trade system similar to the EU ETS, the UK ETS initially covers energy-intensive industries, power generation and aviation. The scheme is intended to make significant contributions to reaching the country’s Net Zero 2050 target. In December 2021, UK ETS emission allowances traded at GBP 74 per tonne, around 9% higher than the EU ETS.
The United Kingdom continues to pursue strong emission reduction efforts, reflected not least in significant wind capacity additions, which we expect to result in 12% annual growth in wind generation between 2022 and 2024. CO2 emissions are likely to fall significantly through to 2024. This is supported by the country’s

Electricity Market Report – January 2022
PAGE | 78
Regional perspective
IEA
. All
right
s res
erve
d.
phase-out of unabated coal, due to be completed by October 2024. Despite the expected decline in nuclear generation by an annual average of 7% between 2022 and 2024 due to the planned retirements of Hinkley Point B, Hunterston B and Hartlepool (each 1.3 GW), gas-fired generation is also set to fall by 6% on average per year during the same period.
Despite leaving the EU single market, the UK electricity system is closely connected to the continent. Current plans for Great Britain’s interconnector capacity foresee an additional 7.1 GW (currently 6 GW) until the end of 2024. The new capacity will help balance variable renewable generation and thus facilitate the further decarbonisation of the electricity system.
Turkey In contrast with the rest of Europe, Turkey’s electricity consumption did not decline in 2020, increasing slightly compared with the previous year. We estimate that electricity demand surged by over 8% in 2021, largely driven by higher economic activity.
The strong demand growth in 2021 coincided with a steep decline in hydro generation (down by almost 30%) amid severe drought. This in turn provided additional market space for thermal generation, most of which has been captured by gas-fired power plants. While coal import prices increased strongly, oil-indexed gas prices to Turkey rose only moderately in 2021. This reduced the cost
competitiveness of coal-fired power plants vis-à-vis gas-fired generation, which rose by close to 60%. Coal-based power output declined by 2% year-on-year.
Turkey’s electricity demand is expected to grow by an average rate of close to 4% per year during 2022 to 2024, more than any other major economy in Europe. Renewables generation is foreseen to increase by 13% per year on average, largely driven by improving hydro availability. The first unit at Akkuyu, the country’s first nuclear power plant, is expected to start up in 2023/24 with a capacity of 1.2 GW. Thermal generation is set to gradually decline, its share falling from around 64% in 2021 to close to 50% by 2024.

Electricity Market Report – January 2022
PAGE | 79
Regional perspective
IEA
. All
right
s res
erve
d.
Renewables replace thermal electricity generation in many European markets Change in electricity generation, 2015-2024
IEA. All rights reserved.
Note: Other non-renewables includes oil, waste and other non-renewable energy sources. Source: IEA analysis based on data from IEA (2022), Data and statistics.
- 80
- 60
- 40
- 20
0
20
40
60
2015
2018
2021
2024
2015
2018
2021
2024
2015
2018
2021
2024
2015
2018
2021
2024
2015
2018
2021
2024
2015
2018
2021
2024
Germany France Italy Spain United Kingdom Turkey
Cha
nge
in e
lect
ricity
gen
erat
ion
(TW
h)
Coal Gas Nuclear Other non-renewables Renewables Net change

Electricity Market Report – January 2022
PAGE | 80
Regional perspective
IEA
. All
right
s res
erve
d.
Eurasia

Electricity Market Report – January 2022
PAGE | 81
Regional perspective
IEA
. All
right
s res
erve
d.
Eurasia records its strongest increase in electricity demand since the demise of the Soviet Union Eurasia’s electricity consumption increased by an estimated 6% year-on-year in 2021, or over 80 TWh – its highest increase in absolute terms since the end of the Soviet Union. This more than offset the 2.2% drop experienced in 2020, when a mild winter and Covid-19-induced restrictive measures weighed on electricity consumption.
The strong rebound in 2021 was partly driven by the recovery in economic and commercial activity, with the region’s GDP increasing by 4% compared to 2020. Most of the demand growth was concentrated in the first half of the year, when electricity consumption rose by close to 7% year-on-year. Thermal generation met over 65% of the incremental demand, with gas-fired generation taking the lead. The Russian Federation (hereafter ‘Russia’) alone accounted for over 70% of the region’s consumption and consumption growth in 2021. In addition to economic recovery, the country experienced a cold and long heating season, which induced higher electricity demand.
In the medium term the region’s electricity demand growth is expected to slow to an annual average of 1.6% between 2022 and 2024, Russia accounting for 60% of the increment. Thermal generation is set to continue to dominate Eurasia’s power mix, at a share of over 62% over the forecast period. While the deployment of
renewable power generation remains slow, the commissioning of new nuclear plants, including in Belarus and Russia, is set to reduce the emissions intensity of power generation in the medium term.
Ukraine’s electricity demand increased by 5% year-on-year in 2021, following a drop of 3% in 2020. This has been largely supported by a strong increase in hydro and nuclear power output, rising by 60% and 9% respectively. In contrast, thermal generation dropped by close to 4% in 2021, as tight gas and coal markets weighed on fuel availability. At the end of October the country’s electricity system operator reported that total capacity of more than 8 GW (more than 30% of the country’s combined gas- and coal-fired capacity) was not operating mainly due to a lack of fuel but also equipment repairs. Ukraine’s gas-fired generation declined by 14% year-on-year in 2021. In our forecast the country’s electricity consumption is set to increase at an average annual rate of around 1.6% in the 2022-2024 period. This is met by higher thermal output, gas- and coal-based generation increasing on average by 3.4% and 2.3% per year respectively through the same period.
In Kazakhstan electricity consumption rose by an estimated 7% year-on-year in the first eleven months of 2021. Thermal generation was the main source of additional generation, led by a strong increase in coal-fired output, meeting over 80% of the country’s

Electricity Market Report – January 2022
PAGE | 82
Regional perspective
IEA
. All
right
s res
erve
d.
incremental electricity demand. Lower hydro output was compensated by a strong increase in wind and solar power generation, up by 60% and 30% year-on-year in the first eight months of 2021. Following the strong growth in 2021, Kazakhstan’s electricity consumption is expected to moderate at an average annual growth rate below 2% in the medium term, largely supported by expanding gas-fired power generation and renewable sources of electricity supply. Kazakhstan has a target of commissioning 3 GW of gas-fired generation capacity in the next five years. While the growing share of renewable and gas-based generation is set to reduce the power sector’s emissions intensity, coal-fired generation is set to retain its dominant position, accounting for over 65% of the generation mix in 2024.
Other markets in Central Asia also recorded strong growth in both electricity demand and generation, estimated at 7% up on 2020. In total, we expect electricity demand in Central Asia to increase at an average annual rate of 2% per year over 2022-2024. In Uzbekistan electricity demand rose by an estimated 7% year-on-year in 2021. This was primarily supported by the country’s large gas-fired power fleet. The country’s electricity demand is expected to increase on average by over 3% per year in 2022-2024, additional demand primarily being met by rapidly growing renewables (including hydro) and expanding gas-fired power generation. The construction of the
Sirdarya CCGT plant, with a capacity of 1.5 GW, started at the end of 2020 and the plant is due to be commissioned by 2024. The country has announced market reforms, with the aim of establishing a competitive wholesale market in the period between 2021 and 2025.
According to official statements, Turkmenistan’s electricity generation increased by over 10% year-on-year in the first ten months of 2021. This was partly driven by higher electricity exports to neighbouring markets, which rose by over 25% compared to 2020, including electricity deliveries to Kyrgyzstan, which started in August 2021. Turkmenistan commissioned a 432 MW gas turbine power plant in the Chardzhov district, primarily targeting its export markets, including Afghanistan, Kyrgyzstan and Uzbekistan.
In Belarus electricity consumption grew by an estimated 7% year-on-year in 2021, offsetting the decline in 2020, when demand dropped by 2.5%. The first unit of the Ostrovets nuclear power plant (1.1 GW capacity) started commercial operation in June 2021. The second unit is expected to start commercial operations in 2022. Consequently, nuclear generation meets most of the incremental demand through the forecast, its share of the power mix reaching over 35% by 2024, primarily at the expense of gas-fired power output. This is set to significantly reduce the emissions intensity of Belarus' power generation over the medium term.
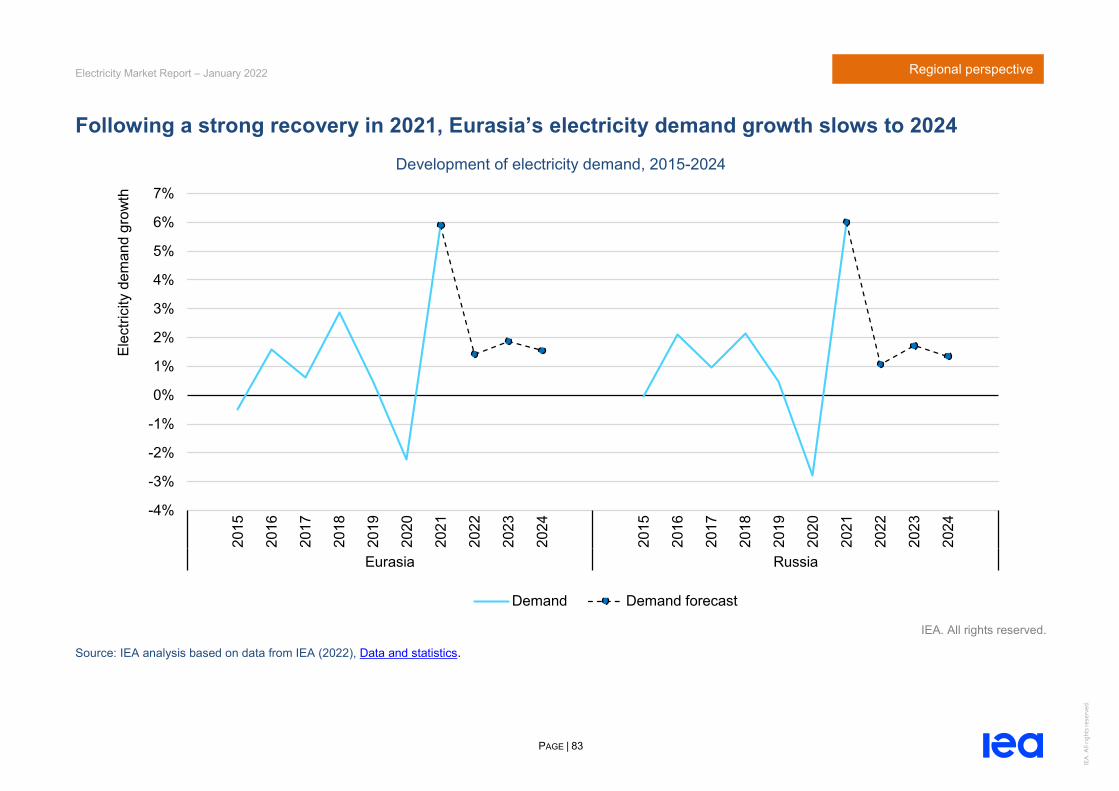
Electricity Market Report – January 2022
PAGE | 83
Regional perspective
IEA
. All
right
s res
erve
d.
Following a strong recovery in 2021, Eurasia’s electricity demand growth slows to 2024 Development of electricity demand, 2015-2024
IEA. All rights reserved.
Source: IEA analysis based on data from IEA (2022), Data and statistics.
-4%
-3%
-2%
-1%
0%
1%
2%
3%
4%
5%
6%
7%
2015
2016
2017
2018
2019
2020
2021
2022
2023
2024
2015
2016
2017
2018
2019
2020
2021
2022
2023
2024
Eurasia Russia
Elec
trici
ty d
eman
d gr
owth
Demand Demand forecast

Electricity Market Report – January 2022
PAGE | 84
Regional perspective
IEA
. All
right
s res
erve
d.
Nuclear capacity additions reduce the emissions intensity of power generation in the region Change in electricity generation, 2015-2024 Development of emissions intensity, 2015-2024
IEA. All rights reserved.
Note: Other non-renewables includes oil, waste and other non-renewable energy sources. Source: IEA analysis based on data from IEA (2022), Data and statistics.
- 60
- 40
- 20
0
20
40
60
80
10020
15
2016
2017
2018
2019
2020
2021
2022
2023
2024
Eurasia
Cha
nge
in e
lect
ricity
gen
erat
ion
(TW
h)
Coal GasNuclear Other non-renewablesRenewables Net change
0
50
100
150
200
250
300
350
400
450
2015 2017 2019 2021 2023
CO₂
inte
nsity
(g C
O₂/
kWh)
Eurasia Russia

Electricity Market Report – January 2022
PAGE | 85
Regional perspective
IEA
. All
right
s res
erve
d.
Russia: A gas-fired recoveryRussia’s electricity consumption fell by 2.8% (or 28 TWh) year-on-year in 2020. Mild winter conditions and Covid-19-induced lockdown measures weighed on electricity consumption in the first half of the year. Lower demand coincided with higher hydro (up 9%) and nuclear generation (up 3.3%). This in turn put downward pressure on thermal generation, which dived by close to 9%. Coal- and gas-fired-generation bore the brunt of the decline, while oil-fired generation increased by close to 50%, as low fuel oil prices induced gas-to-oil switching in the power sector.
We estimate that Russia’s electricity consumption increased by about 6% (or 60 TWh) in 2021, its largest annual growth in absolute terms since the fall of the Soviet Union. A recovery in industrial and commercial activity largely supported this growth; Russia’s GDP is expected to grow by around 5% in 2021. In addition, cold first-quarter and spring temperatures, as well as an early start to the 2021/22 heating season, boosted electricity demand further. Demand growth was higher in the first price zone, which covers the western part of the country, consumption increasing there by close to 7%. In the second price zone, which covers Siberia, electricity demand grew by an estimated 4% year-on-year. Russia’s growth in power generation outpaced the increase in demand, supporting higher exports, which more than doubled in the first ten months of 2021 compared to the same period in 2020. This was largely due to higher deliveries to China, Kazakhstan and the Baltic states.
Thermal generation accounted for over 80% of the net increase in electricity supply in 2021, surging by over 8% year-on-year. Most of this increase was concentrated in the first price zone. Lower hydro generation (down by 14%) was largely compensated by higher nuclear output (up by 3%), while thermal power plants met almost all the additional demand. The first price zone is largely dominated by gas-fired power generation. In addition, rising domestic coal prices supported coal-to-gas switching. According to first estimates, gas-fired generation soared by over 10% year-on-year in 2021. In contrast, thermal generation dropped by 1% in the second price zone, as strong hydro output (up by 9%) weighed on the region’s coal-fired power output.
Following strong growth in 2021, Russia’s electricity demand growth is expected to slow to an average of over 1.4% per year until 2024. The two units of the Kursk II nuclear plant (1.25 GW capacity each) are scheduled to be commissioned by 2024, replacing the four existing units (1 GW each) planned to retire from 2022. The country has undertaken a large-scale modernisation programme of its thermal fleet, with the target to refurbish over 20 GW between 2022 and 2026. According to Russia’s Market Council, this could decrease the carbon footprint of the power system by 5%.

Electricity Market Report – January 2022
PAGE | 86
Regional perspective
IEA
. All
right
s res
erve
d.
Gas-fired power generation and nuclear lead Russia’s power generation growth Change in electricity generation, 2015-2024
IEA. All rights reserved.
Note: Other non-renewables includes oil, waste and other non-renewable energy sources. Source: IEA analysis based on data from IEA (2022), Data and statistics.
- 60
- 40
- 20
0
20
40
60
80
2015
2016
2017
2018
2019
2020
2021
2022
2023
2024
Russia
Cha
nge
in e
lect
ricity
gen
erat
ion
(TW
h)
Coal Gas Nuclear Other non-renewables Renewables Net change

Electricity Market Report – January 2022
PAGE | 87
Regional perspective
IEA
. All
right
s res
erve
d.
Middle East

Electricity Market Report – January 2022
PAGE | 88
Regional perspective
IEA
. All
right
s res
erve
d.
Gas remains the dominant fuel; oil and coal are squeezed by renewables and nuclear Electricity demand in the Middle East fell slightly in 2020 as declines in Gulf Cooperation Council (GCC) countries – especially Saudi Arabia, the United Arab Emirates and Kuwait – were only partially offset by rising consumption elsewhere in the region (particularly in Iran). Some countries, including Iraq, Lebanon, Syria and Yemen, faced power shortages and were left with unmet demand. We estimate that electricity use grew by over 3.5% in 2021 and will continue at an average rate of 2% during the 2022-2024 period, due to population growth, rising demand for air conditioning and seawater desalination, and the expansion of energy-intensive industries in GCC economies in particular. The residential and commercial sectors continue to be the main engines of demand growth, accounting for over half of the rise in the forecast period. The remaining net rise is split between industry and other uses.
We expect gas – dominant in the region – to maintain a constant generation share of around 70% through to 2024. Oil-fired power is set to drop from 24% of total generation in 2021 to 21% by 2024 (led by declines in Saudi Arabia and Iran). Coal falls from 1.6% to 1.3% over the same period, as the closure of a large coal-fired plant in Israel (Orot Rabin) will more than offset production growth from the new Hassyan coal-fired plant in the United Arab Emirates.
Nuclear generation in the region more than doubled in 2021 due to the first two units of the Barakah nuclear power plant in the United
Arab Emirates coming online in April and September, and is expected to reach over six times 2020 levels by 2024 with the plant fully commissioned. Renewable power output, which is predominantly solar in the region, rose by over one-third to 40 TWh in 2021 and is set to reach around 60 TWh in 2024, over 4% of total electricity generation. The pace of additions varies widely across the region, with the biggest increments being in the United Arab Emirates, Israel and Saudi Arabia, while renewable deployment in much of the rest of the region remains slow to non-existent.
Annual power sector emissions in the Middle East fell slightly in 2021 (mainly due to growing nuclear output), but are projected to grow by 1.7% in total from 2022 to 2024 and reach over 740 Mt CO2. The United Arab Emirates and Israel both saw lower electricity-related emissions in 2021 and are on course to see a further drop of over 20% by 2024 (compared with 2021), thanks to nuclear and renewables displacing gas in the United Arab Emirates, and gas and renewables displacing coal in Israel. However, this is outweighed by rising power sector emissions elsewhere in the region, primarily driven by rapidly increasing gas-fired generation.
At the same time, the emissions intensity of power generation fell by over 2% in 2021 and is expected to decline by almost a further 4% by 2024 (compared with 2021) thanks to the falling share of coal and oil in the region’s electricity mix.

Electricity Market Report – January 2022
PAGE | 89
Regional perspective
IEA
. All
right
s res
erve
d.
Electricity demand in the Middle East is expected to stabilise in the medium term Development of electricity demand, 2015-2024
IEA. All rights reserved.
Source: IEA analysis based on data from IEA (2022), Data and statistics.
-4%
-2%
0%
2%
4%
6%
8%
10%
2015
2016
2017
2018
2019
2020
2021
2022
2023
2024
2015
2016
2017
2018
2019
2020
2021
2022
2023
2024
2015
2016
2017
2018
2019
2020
2021
2022
2023
2024
Middle East Saudi Arabia United Arab Emirates
Elec
trici
ty d
eman
d gr
owth
Demand Demand forecast

Electricity Market Report – January 2022
PAGE | 90
Regional perspective
IEA
. All
right
s res
erve
d.
Demand in the Middle East is increasingly met by cleaner sources Change in electricity generation, 2015-2024 Development of emissions intensity, 2015-2024
IEA. All rights reserved.
Note: Other non-renewables includes oil, waste and other non-renewable energy sources. Source: IEA analysis based on data from IEA (2022), Data and statistics.
- 60
- 40
- 20
0
20
40
60
80
10020
15
2016
2017
2018
2019
2020
2021
2022
2023
2024
Middle East
Cha
nge
in e
lect
ricity
gen
erat
ion
(TW
h)
Coal GasNuclear Other non-renewablesRenewables Net change
0
100
200
300
400
500
600
700
2015 2017 2019 2021 2023C
O₂
inte
nsity
(g C
O₂/
kWh)
Middle East Saudi Arabia
United Arab Emirates

Electricity Market Report – January 2022
PAGE | 91
Regional perspective
IEA
. All
right
s res
erve
d.
Saudi Arabia Saudi Arabia’s electricity demand fell by almost 1% in 2020 as Covid-19-related measures limited demand in the commercial sector and government offices, which was only partially offset by growing consumption in the residential and industrial sectors. Power demand rebounded sharply and recorded a 10% year-on-year increase in the first half of 2021 with the lifting of restrictions and normalisation of economic activity. For the full year we estimate 6.5% growth. For the period 2022-2024 we expect average growth of around 0.5% per year, driven by a growing number of grid connections and expanding industrial demand, but tempered by earlier price reforms and modest improvements in efficiency.
Total generation capacity at the end of 2019 was 80 GW, with another 9 GW scheduled to be added during 2021-2024, of which 5.6 GW are gas-fired and 3.3 GW are renewables (mostly solar). Gas-fired generation is projected to rise by 19% (21 TWh) by 2024 compared with 2021, while oil-fired output drops 12% (22 TWh) over the same period. The share of oil-fired generation in the electricity mix is projected to drop to 38% by 2024 from an estimated 43% in 2021, but remains a long way from meeting the government’s goal of eliminating oil from power generation by 2030. Renewable generation is set to expand more than four times 2021 levels and approach 7 TWh (or 1.6% of total generation) by 2024 thanks to a robust project pipeline, including a 400 MW wind farm (Dumat Al-Jandal) and 3 GW of solar capacity under development as of 2021.
United Arab Emirates In the United Arab Emirates, electricity demand dropped by 2.4% in 2020 compared with 2019 due to the negative impact of Covid-19 on economic activity. We estimate that demand recovered by less than 1% in 2021 and growth is expected to remain weak over the forecast period, averaging less than 1% per year during 2022-2024. Power consumption is hampered by the slow pace of economic recovery, higher-than-average electricity rates within the region and a slow and gradual return of expatriates (whose numbers in 2020 dropped by an estimated 5% and 8% in Abu Dhabi and Dubai, respectively, in the wake of Covid-19).
Installed generation capacity across the United Arab Emirates totalled 33 GW in 2020, of which 92% was gas-fired, 6% solar and 2% coal. The first 1.4 GW block of the 5.6 GW Barakah nuclear power plant generated some electricity in 2020, but only started commercial operations in 2021; therefore it was not counted by the national utility as available capacity in 2020. The completion of the remaining three nuclear blocks at Barakah, three additional 600 MW coal-fired units in Dubai and the addition of nearly 4 GW of solar capacity by the end of 2024 will change the UAE electricity mix considerably. The share of natural gas in the generation mix is set to drop from around 84% in 2021 to 55% by 2024. At the same time, the contributions from nuclear (from 7% to 25%), coal (from 3% to 9%) and renewables (from 6% to 11%) are all set to grow.

Electricity Market Report – January 2022
PAGE | 92
IEA
. All
right
s res
erve
d.
Regional perspective
Gas and renewables displace oil in Saudi Arabia, while nuclear and renewables displace gas in the UAE generation mix
Change in electricity generation, 2015-2024
IEA. All rights reserved.
Note: Other non-renewables includes oil, waste and other non-renewable energy sources. Source: IEA analysis based on data from IEA (2022), Data and statistics.
- 40
- 30
- 20
- 10
0
10
20
30
40
50
2015
2016
2017
2018
2019
2020
2021
2022
2023
2024
2015
2016
2017
2018
2019
2020
2021
2022
2023
2024
Saudi Arabia United Arab Emirates
Cha
nge
in e
lect
ricity
gen
erat
ion
(TW
h)
Coal Gas Nuclear Other non-renewables Renewables Net change
Electricity Market Report – January 2022
PAGE | 93
IEA
. All
right
s res
erve
d.
Regional perspective
Market trends in selected other Middle Eastern countriesKuwait’s electricity consumption is expected to grow at an average annual rate of 2% between 2022 and 2024, driven by increasing space cooling and water desalination requirements. All incremental generation growth is from gas-fired plants, enabled by the recent completion of the 30 bcm Al Zour LNG terminal. Oil-fired generation and renewable output are expected to stagnate through to 2024.
We expect Israel’s power demand to expand on average by 3.5% annually during 2022-2024, supported by population growth, increased water desalination and electrification of end uses (especially in the transport sector). Fuelled by the anticipated ramp-up of production at the Karish gas field from 2022, gas-fired generation grows by over 26% by 2024 (compared to 2021), while coal-fired generation falls by almost 70% with the phase-out of the 2.6 GW Orot Rabin plant by 2024. Renewable generation almost doubles to reach 11 TWh in 2024, led by continuing solar additions.
Iraq’s electricity consumption is expected to grow at a rapid rate of over 6% per year through to 2024, as the country progressively reduces its power deficit with the completion of at least one gas capture project (Halfaya) and several gas-fired plant revitalisation and expansion projects. Despite ambitious plans to ramp up solar generation, renewables are not expected to significantly contribute to Iraq’s power requirements in the 2022-2024 period.
Qatar’s power consumption is set to expand at an annual average rate of 3.6% during the 2022-2024 forecast period, driven by population growth, rising demand for cooling and water desalination, and the ongoing expansion of the country’s residential, commercial, industrial and transport infrastructure. Incremental generation will mainly be fuelled by gas, supported by the completion of the 2.6 GW Facility E project and the ramp-up of production at Qatar’s Barzan gas field, which is fully dedicated to the domestic market. Renewables will also generate more than 1 TWh by 2024, following the phased ramp-up of the 800 MW Al Kharsaah solar project from late 2021 to mid-2022.
Oman’s power consumption is expected to increase at an average annual rate of almost 3% during 2022-2024, driven in part by the start-up of a new 230 000 b/d export refinery at Duqm in 2022. Gas-fired generation meets around two-thirds of incremental demand. The rest is largely from renewables, which grow rapidly from a low basis to reach 1 TWh by 2024.
Bahrain, where practically all generation is gas-fired, is projected to see rapid growth in demand at an annual average of almost 5% between 2022 and 2024, the result of substantial expansion of grid-connected capacity in 2022.

Electricity Market Report – January 2022
PAGE | 94
IEA
. All
right
s res
erve
d.
Regional perspective
Africa

Electricity Market Report – January 2022
PAGE | 95
IEA
. All
right
s res
erve
d.
Regional perspective
Although slowing, electricity demand is set to continue to grow in Africa Electricity demand in Africa has rebounded after falling in 2020 due to the Covid-19 pandemic and its impact on the economy – the IMF estimated a 1.6% decline in real GDP. We estimate growth in electricity supply by 5.6% in 2021 and close to 5% in 2022. This is driven by higher GDP growth (estimated at 5%, due to an improvement in global trade and commodity prices) and increased electricity access, as well as new generation capacity, which should alleviate some of the power supply shortages seen across the region.
However, the discovery of the Covid-19 Omicron variant at the end of 2021 in South Africa (a country accounting for almost 30% of total power demand in the region) and the subsequently imposed measures to contain the spread of the new variant could significantly impact economic and consequently electricity supply growth. For the period 2022 to 2024 we expect a slowdown in annual growth in demand in Africa, falling to around 3.5% on average.
The majority of the new capacity due to come online over the coming years takes the form of a host of renewable and gas projects that are being deployed across the continent. By 2024 this results in an additional 50 TWh of electricity from renewables, reaching a 26% share of total generation, up from 23% in 2021 and achieving a similar level to coal-fired generation (declining from 28%
in 2021 to 26% in 2024). After a slight increase in coal-fired generation in 2021 and 2022 (about 1% annually), stemming from new coal units coming online in South Africa, we expect coal-fired electricity generation to remain flat in 2023 and 2024.
With around 25 TWh of additional electricity generation by 2024 (compared with 2021), we expect natural gas, the largest source of electricity supply in Africa, to have a stable market share of around 38% between 2022 and 2024. Significantly less relevant than coal and gas, oil and oil derivatives had an 8% market share in 2021; we see a slow decrease in output of below 1% annually on average in the 2022-2024 period.
The Koeberg nuclear plant in South Africa had one of its units offline for maintenance during the height of the lockdown in 2020, but increased availability meant that there was a slight increase in nuclear generation in 2021. For the coming years we expect nuclear generation to remain flat.
As renewables are set to supply the majority of net demand growth between 2022 and 2024 (more than 60%), we expect the carbon intensity of electricity generation to decline by almost 2% on average during the period, reaching about 510 g CO2 per kWh in 2024.

Electricity Market Report – January 2022
PAGE | 96
IEA
. All
right
s res
erve
d.
Regional perspective
Electricity demand in Africa is expected to continue growing at moderate rates Development of electricity demand, 2015-2024
IEA. All rights reserved.
Source: IEA analysis based on data from IEA (2022), Data and statistics.
-15%
-10%
-5%
0%
5%
10%
15%20
15
2018
2021
2024
2015
2018
2021
2024
2015
2018
2021
2024
2015
2018
2021
2024
2015
2018
2021
2024
2015
2018
2021
2024
Africa South Africa Egypt Algeria Morocco Nigeria
Elec
trici
ty d
eman
d gr
owth
Demand Demand forecast

Electricity Market Report – January 2022
PAGE | 97
IEA
. All
right
s res
erve
d.
Regional perspective
New renewable and gas generation meets the majority of demand growth in Africa Change in electricity generation, 2015-2024 Development of emissions intensity, 2015-2024
IEA. All rights reserved.
Note: Other non-renewables includes oil, waste and other non-renewable energy sources. Source: IEA analysis based on data from IEA (2022), Data and statistics.
- 40
- 30
- 20
- 10
0
10
20
30
40
50
2015
2016
2017
2018
2019
2020
2021
2022
2023
2024
Africa
Cha
nge
in e
lect
ricity
gen
erat
ion
(TW
h)
Coal GasNuclear Other non-renewablesRenewables Net change
0
100
200
300
400
500
600
700
800
900
1 000
2015 2017 2019 2021 2023
CO₂
inte
nsity
(g C
O₂/
kWh)
Africa South Africa Egypt
Algeria Morocco Nigeria

Electricity Market Report – January 2022
PAGE | 98
IEA
. All
right
s res
erve
d.
Regional perspective
South Africa Electricity demand in South Africa fell by around 5% in 2020. In the first ten months of 2021 it increased by around 3% compared with the same period in 2020. However, the discovery of the Covid-19 Omicron variant in the country at the end of November and the subsequent restrictions on international travel could have affected the recovery in demand. For 2021 we estimate a demand growth of around 2.7%.
South Africa continues to struggle with capacity shortages that have plagued the country’s electricity system since 2014, caused by declining availability of its ageing coal fleet and delays to two large new-build coal plants. The completion of these new builds at Medupi and Kusile will help address some of the capacity issues as the final units begin generating over the forecast period. The last of them is expected to come online in 2023. There are, however, concerns about their reliability. In August 2021, shortly after the final unit of the Medupi plant was commissioned, an explosion occurred which severely damaged the unit. It is not expected to be back online for over a year, rendering it unusable for an indefinite period. The commissioning of renewable generation from a previous renewable auction accounted for the balance of new generation in 2021. The remaining 929 MW of renewable projects are expected to come online by 2024.
The ongoing capacity shortages, combined with their economic impacts, have led to declining electricity demand as persistent load shedding has become the norm over recent years. South Africa is actively trying to address capacity shortages with the procurement of firm capacity as part of the Risk Management IPP Procurement Programme (RMIPPPP). The auction awarded 2 GW of capacity to a mixture of renewables collocated with batteries, and gas-fired plants. The majority was awarded to three powerships supplied with liquefied natural gas (LNG). This generation was specified to come online by 2022, but unfortunately it has already been delayed due to the postponement of the deadline for the projects’ financial close. It has been pushed back to accommodate several delays in the process, such as obtaining quotations for grid connection, generation licences and other permits. Difficulties include the failure of the three powerships to obtain the necessary environmental permits to generate electricity at three different South African ports, which are currently appealing the decision by South African environmental authorities to reject their application. This means that the capacity is only likely to come online towards the end of the forecast period.
The latest renewable auction (Bid Window 5 of the RE IPP Procurement Programme) has been concluded, the preferred bidders having been announced at the end of October 2021. The exact timing of operation is not yet certain, but it is not expected before 2024.

Electricity Market Report – January 2022
PAGE | 99
IEA
. All
right
s res
erve
d.
Regional perspective
New policy may help address capacity issues in the short term, as licensing obligations for embedded generation (i.e. demand-side generation) have been relaxed. They now allow plants that are smaller than 100 MW to connect to the grid for self-consumption and for the sale of excess power to the grid without applying for a generating licence. A number of large industrial customers have already announced plans to build plants to power their own operations in response to this evolution in policy. The broader impact of this announcement on demand remains to be seen; however, as a country with a major energy shortage, South Africa could expect to see a boost in demand as capacity issues are alleviated by projects built outside the traditional auction process.
Egypt Electricity consumption in Egypt in the first half of 2021 recovered from its 2% dip in 2020, with an estimated growth rate of close to 9% year-on-year. For 2021, we estimate a full-year demand growth of over 8%. Growth in demand for electricity has generally slowed in recent years as subsidies diminished and prices rose, as part of the Egyptian government’s objective to gradually phase out energy subsidies by 2025. The latest revision took place in July 2021, resulting in an average 13% increase in prices for various customer segments.
The country aims to become a regional electricity hub by developing a more diversified supply mix and multiplying its interconnectors
with neighbouring countries. A 3 GW interconnector project was signed with Saudi Arabia in October 2021, commissioning expected in 2024, and a memorandum of understanding was signed in the same month to build a 2 GW interconnector with Cyprus and Greece. Additional projects are under way to further increase existing cross-border capacity with Libya (from the current 240 MW to 2-3 GW), supplementing the newly commissioned interconnector with Sudan (capacity up from 80 MW to 300 MW).
The country currently relies on oil and gas for its electricity supply, with a strong ramp-up of natural gas-fired capacity over recent years (providing up to 90% of total generation). Egypt has set a target of 42% of electricity supply to come from renewable sources by 2035 as part of its Integrated Sustainable Energy Strategy, with an intermediate 20% share target by 2022. Diversification also includes the development of the country’s first nuclear power plant, the 4.8 GW El Dabaa facility, which is expected to start operations in 2026.
Algeria Algeria’s electricity consumption has grown at a strong pace in recent years due to the combination of heavily subsidised tariffs (accounting for two-thirds of production costs on average) and an ambitious electrification policy – coverage reached 98% of the population as of the end of 2019. The energy regulator, CREG, expects in its central planning scenario an average annual growth

Electricity Market Report – January 2022
PAGE | 100
IEA
. All
right
s res
erve
d.
Regional perspective
rate of electricity demand of 4.3% to 2030, compared with an average of 5.7% per year over the past decade.
Electricity supply is heavily reliant on domestic gas resources, which account for 97% of the production mix. The cost of fuel subsidies, alongside high rates of non-payment, has led to a strong increase in the national electricity company’s debt and casts a shadow over the system’s sustainability, which has been questioned by successive ministers. The development of renewable production capacity was identified as an opportunity to alleviate the cost of electricity. The country’s energy transition strategy sets an objective of 16 GW of renewable capacity by 2035, with a medium-term target of 4 GW by 2024. At the end of 2021, the Algerian Ministry of Energy Transition and Renewable Energies selected 11 sites for the installation of 1 GW of solar capacity.
Morocco The impacts of Covid-19 in 2020 saw annual demand for electricity decline by over 1.2% year-on-year, with annual peak demand falling by 1.5% relative to 2019. Both peak demand and demand volume rebounded in 2021, when we estimate demand to have grown by around 3%. Meanwhile, a heatwave in Morocco in July 2021 led to a new record in peak demand in the country (4.3% increase on 2020), attributed to intensive use of air conditioning and agricultural pumping for irrigation. Both of these end uses are expected to
continue to drive peak capacity requirements in Morocco in the coming years.
Morocco has seen major growth in renewables over the past decade, the share of renewable energy in the generation mix increasing from only 6% in 2008 to around 20% in 2020. This will only increase over the next few years, as Morocco has already stated its ambitions to expand the share of generation from renewables beyond 52% by 2030. This trend continued in 2021 with the commissioning of new wind (300 MW) and solar PV (130 MW) projects, which are estimated to increase the share of renewables to over 26%. We expect this growth to continue into the forecast period thanks to new wind, solar PV and pumped-storage hydro plant set to come online by 2024, according to the Ministry of Energy, Mines and Environment. This will help to displace coal, and later gas, from the generation mix, leading to a 36% share of renewables by 2024.
Despite the current growth in renewables, 60% of Morocco’s generation mix was still estimated to come from coal in 2021, while 11% was from gas. A long-standing contract for gas supply from Algeria to Spain, which transits through Morocco, ended in October 2021, the Algerian president Tabounne confirming that gas exports will now switch to a route that avoids Morocco, thereby cutting off Algerian gas to Morocco. Prior to this announcement, Morocco was already considering options in case of termination of Algerian supply. These include short-term options such as using LNG, and

Electricity Market Report – January 2022
PAGE | 101
IEA
. All
right
s res
erve
d.
Regional perspective
others in the medium to long term relying on the development of domestic gas production and new import infrastructure as part of the national roadmap for the development of natural gas 2021-2050.
Nigeria Access to electricity remains a major issue in Nigeria. An estimated 85 million people have no access to grid electricity, representing over 40% of the population, one of the largest energy access deficits in the world. The Nigerian electricity sector is facing operational constraints, including insufficient access to natural gas (which accounts for around 80% of electricity generation), lack of cost-reflective tariffs, inadequate metering of consumers, poor collection rates and massive debts.
The federal government of Nigeria has initiated reforms in the electricity sector to increase revenue, including a planned phase-out of tariff subsidies by 2022. Electricity tariffs quadrupled between 2015 and 2020 and another increase is expected at the end of 2021 or early in 2022 to bridge the subsidy gap, which is officially estimated at about USD 73 million per month.
Despite an installed capacity of 13 GW, comprising mainly gas and hydro capacity, the Nigerian electricity system suffers from low generation availability due to gas supply issues in combination with
bottlenecks in the transmission system. As a result, currently only about 11% of electricity demand is being supplied. In September 2021 for example, Nigeria’s peak served demand was only 3.9 GW, although the estimated peak demand was 30 GW. This was a result of peak generation capacity as of September 2021 being only 4.7 GW, which includes capacity for exports.
An ambitious electricity development plan, the Presidential Power Initiative, was launched in 2019 with Siemens and the support of the German Export Credit Agency, its objective being to raise Nigeria’s available generation capacity to 25 GW by 2025. Implementation of the project has been delayed, however, and its first phase, which targeted a series of quick actions to debottleneck current transmission capacity by 2021, was still only in its early pre-engineering stage as of the end of 2021.

Electricity Market Report – January 2022
PAGE | 102
IEA
. All
right
s res
erve
d.
Regional perspective
The development of the generation mix varies significantly between African countries Change in electricity generation, 2015-2024
IEA. All rights reserved.
Note: Other non-renewables includes oil, waste and other non-renewable energy sources. Source: IEA analysis based on data from IEA (2022), Data and statistics.
- 20
- 15
- 10
- 5
0
5
10
15
20
2015
2018
2021
2024
2015
2018
2021
2024
2015
2018
2021
2024
South Africa Egypt Algeria
Cha
nge
in e
lect
ricity
gen
erat
ion
(TW
h)
Coal Gas Nuclear Other non-renewables Renewables Net change
- 6
- 4
- 2
0
2
4
6
8
2015
2018
2021
2024
2015
2018
2021
2024
Morocco Nigeria
Cha
nge
in e
lect
ricity
gen
erat
ion
(TW
h)

Electricity Market Report – January 2022
PAGE | 103
IEA
. All
right
s res
erve
d.
Annex
Annex
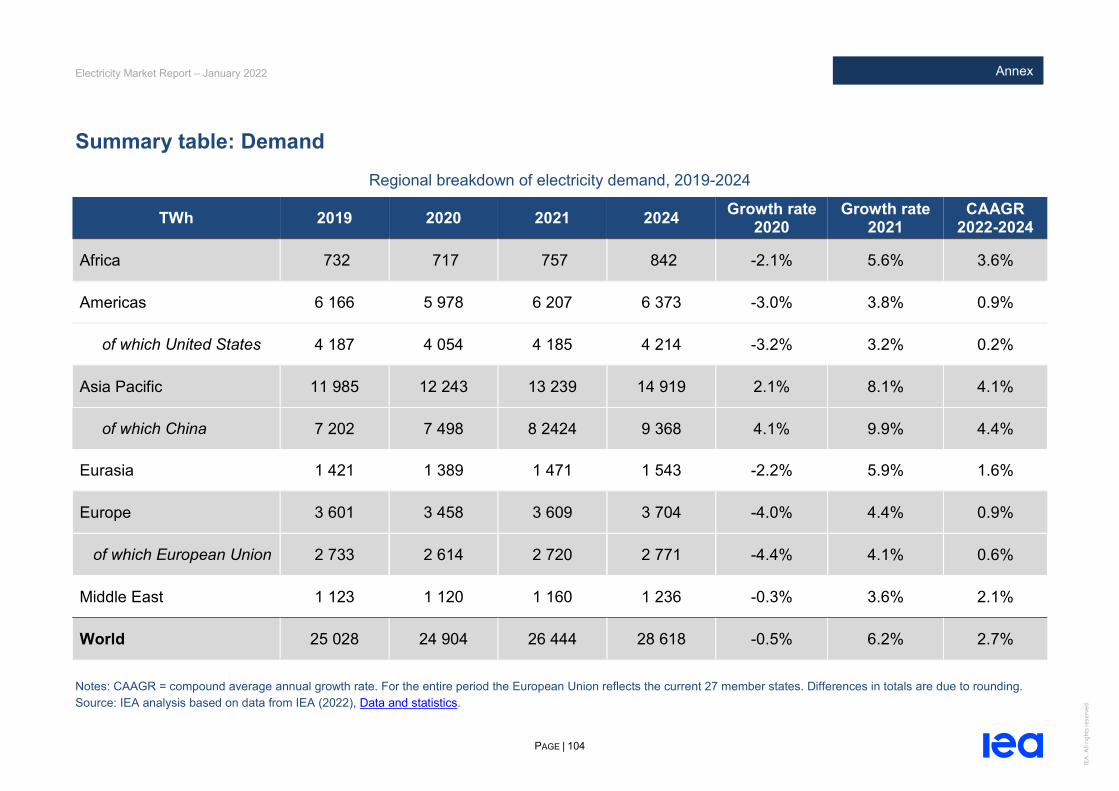
Electricity Market Report – January 2022
PAGE | 104
IEA
. All
right
s res
erve
d.
Annex
Summary table: Demand Regional breakdown of electricity demand, 2019-2024
TWh 2019 2020 2021 2024 Growth rate 2020
Growth rate 2021
CAAGR 2022-2024
Africa 732 717 757 842 -2.1% 5.6% 3.6%
Americas 6 166 5 978 6 207 6 373 -3.0% 3.8% 0.9%
of which United States 4 187 4 054 4 185 4 214 -3.2% 3.2% 0.2%
Asia Pacific 11 985 12 243 13 239 14 919 2.1% 8.1% 4.1%
of which China 7 202 7 498 8 2424 9 368 4.1% 9.9% 4.4%
Eurasia 1 421 1 389 1 471 1 543 -2.2% 5.9% 1.6%
Europe 3 601 3 458 3 609 3 704 -4.0% 4.4% 0.9%
of which European Union 2 733 2 614 2 720 2 771 -4.4% 4.1% 0.6%
Middle East 1 123 1 120 1 160 1 236 -0.3% 3.6% 2.1%
World 25 028 24 904 26 444 28 618 -0.5% 6.2% 2.7%
Notes: CAAGR = compound average annual growth rate. For the entire period the European Union reflects the current 27 member states. Differences in totals are due to rounding. Source: IEA analysis based on data from IEA (2022), Data and statistics.

PAGE | 105
IEA
. All
right
s res
erve
d.
Annex Electricity Market Report – January 2022
Summary table: Supply and emissions, world Breakdown of electricity sector supply and emissions, world, 2019-2024
TWh 2019 2020 2021 2024 Growth rate 2020
Growth rate 2021
CAAGR 2022-2024
Nuclear 2 790 2 682 2 777 2 869 -3.9% 3.5% 1.1%
Coal 9 914 9 520 10 337 10 415 -4.0% 8.6% 0.3%
Gas 6 346 6 276 6 410 6 549 -1.1% 2.1% 0.7%
Other non-renewables 980 994 1 023 915 1.4% 3.0% -3.6%
Total renewables 7 015 7 449 7 913 9 906 6.2% 6.2% 7.8%
Total generation 27 044 26 921 28 437 30 654 2.5% 5.7% 2.5%
Mt CO2 2019 2020 2021 2024 Growth rate 2020
Growth rate 2021
CAAGR 2022-2024
Total emissions 12 603 12 192 13 022 13 088 -3.3% 6.8% 0.2%
Notes: CAAGR = compound average annual growth rate. Other non-renewables includes oil, waste and other non-renewable energy sources. Differences in totals are due to rounding. Source: IEA analysis based on data from IEA (2022), Data and statistics.

PAGE | 106
IEA
. All
right
s res
erve
d.
Annex Electricity Market Report – January 2022
Summary table: Supply and emissions, Asia Pacific Breakdown of electricity sector supply and emissions, Asia Pacific, 2019-2024
TWh 2019 2020 2021 2024 Growth rate 2020
Growth rate 2021
CAAGR 2022-2024
Nuclear 647 653 694 815 1.0% 6.3% 5.5%
Coal 7 456 7 465 8 062 8 508 0.1% 8.0% 1.8%
Gas 1 484 1 487 1 511 1 556 0.2% 1.6% 1.0%
Other non-renewables 232 251 262 212 8.0% 4.4% -6.7%
Total renewables 2 969 3 187 3 516 4 642 7.3% 10.3% 9.7%
Total generation 12 787 13 042 14 044 15 733 3.9% 7.7% 3.9%
Mt CO2 2019 2020 2021 2024 Growth rate 2020
Growth rate 2021
CAAGR 2022-2024
Total emissions 7 641 7 652 8 211 8 611 0.1% 7.3% 1.6%
Notes: CAAGR = compound average annual growth rate. Other non-renewables includes oil, waste and other non-renewable energy sources. Differences in totals are due to rounding. Source: IEA analysis based on data from IEA (2022), Data and statistics.

PAGE | 107
IEA
. All
right
s res
erve
d.
Annex Electricity Market Report – January 2022
Summary table: Supply and emissions, Americas Breakdown of electricity sector supply and emissions, Americas, 2019-2024
TWh 2019 2020 2021 2024 Growth rate 2020
Growth rate 2021
CAAGR 2022-2024
Nuclear 980 957 940 926 -2.4% -1.8% -0.5%
Coal 1 205 953 1 115 906 -21.0% 17.0% -6.7%
Gas 2 153 2 170 2 150 2 132 0.8% -0.9% -0.3%
Other non-renewables 234 209 220 196 -10.9% 5.4% -3.8%
Total renewables 2 118 2 216 2 302 2 732 4.6% 3.9% 5.9%
Total generation 6 690 6 504 6 727 6 892 -2.8% 3.4% 0.8%
Mt CO2 2019 2020 2021 2024 Growth rate 2020
Growth rate 2021
CAAGR 2022-2024
Total emissions 2 188 1 935 2 091 1 877 -11.6% 8.1% -3.5%
Notes: CAAGR = compound average annual growth rate. Other non-renewables includes oil, waste and other non-renewable energy sources. Differences in totals are due to rounding. Source: IEA analysis based on data from IEA (2022), Data and statistics.

PAGE | 108
IEA
. All
right
s res
erve
d.
Annex Electricity Market Report – January 2022
Summary table: Supply and emissions, Europe Breakdown of electricity sector supply and emissions, Europe, 2019-2024
TWh 2019 2020 2021 2024 Growth rate 2020
Growth rate 2021
CAAGR 2022-2024
Nuclear 848 757 803 742 -10.7% 6.0% -2.6%
Coal 659 530 590 421 -19.5% 11.3% -10.7%
Gas 762 750 781 783 -1.6% 4.2% 0.1%
Other non-renewables 120 118 122 108 -1.5% 3.4% -4.1%
Total renewables 1 451 1 559 1 568 1 923 7.4% 0.6% 7.0%
Total generation 3 840 3 714 3 865 3 976 -3.3% 4.1% 1.0%
Mt CO2 2019 2020 2021 2024 Growth rate 2020
Growth rate 2021
CAAGR 2022-2024
Total emissions 966 837 906 735 -13.4% 8.2% -6.7%
Notes: CAAGR = compound average annual growth rate. Other non-renewables includes oil, waste and other non-renewable energy sources. Differences in totals are due to rounding. Source: IEA analysis based on data from IEA (2022), Data and statistics.

PAGE | 109
IEA
. All
right
s res
erve
d.
Annex Electricity Market Report – January 2022
Summary table: Supply and emissions, Africa Breakdown of electricity sector supply and emissions, Africa, 2019-2024
TWh 2019 2020 2021 2024 Growth rate 2020
Growth rate 2021
CAAGR 2022-2024
Nuclear 13 12 13 13 -6.6% 5.1% 0.6%
Coal 260 246 247 252 -5.3% 0.4% 0.6%
Gas 334 324 339 365 -3.0% 4.6% 2.5%
Other non-renewables 78 72 80 83 -8.5% 11.4% 1.3%
Total renewables 170 186 199 250 9.0% 7.4% 7.8%
Total generation 856 840 878 963 3.1% 4.5% 3.1%
Mt CO2 2019 2020 2021 2024 Growth rate 2020
Growth rate 2021
CAAGR 2022-2024
Total emissions 484 459 474 494 -5.2% 3.4% 1.4%
Notes: CAAGR = compound average annual growth rate. Other non-renewables includes oil, waste and other non-renewable energy sources. Differences in totals are due to rounding. Source: IEA analysis based on data from IEA (2022), Data and statistics.

PAGE | 110
IEA
. All
right
s res
erve
d.
Annex Electricity Market Report – January 2022
Summary table: Supply and emissions, Middle East Breakdown of electricity sector supply and emissions, Middle East, 2019-2024
TWh 2019 2020 2021 2024 Growth rate 2020
Growth rate 2021
CAAGR 2022-2024
Nuclear 7 7 17 43 -3.0% 139.9% 37.3%
Coal 23 23 22 19 0.3% -4.8% -4.9%
Gas 915 886 913 967 -3.1% 3.1% 1.9%
Other non-renewables 299 326 320 298 9.1% -2.0% -2.3%
Total renewables 32 30 41 62 -6.3% 36.1% 15.1%
Total generation 1 275 1 272 1 312 1 389 -0.3% 3.2% 1.9%
Mt CO2 2019 2020 2021 2024 Growth rate 2020
Growth rate 2021
CAAGR 2022-2024
Total emissions 716 727 732 744 1.5% 0.7% 0.6%
Notes: CAAGR = compound average annual growth rate. Other non-renewables includes oil, waste and other non-renewable energy sources. Differences in totals are due to rounding. Source: IEA analysis based on data from IEA (2022), Data and statistics.

PAGE | 111
IEA
. All
right
s res
erve
d.
Annex Electricity Market Report – January 2022
Summary table: Supply and emissions, Eurasia Breakdown of electricity sector supply and emissions, Eurasia, 2019-2024
TWh 2019 2020 2021 2024 Growth rate 2020
Growth rate 2021
CAAGR 2022-2024
Nuclear 294 295 310 331 0.2% 5.0% 2.2%
Coal 312 304 302 310 -2.8% -0.5% 0.9%
Gas 699 660 715 745 -5.6% 8.4% 1.4%
Other non-renewables 16 18 20 18 12.3% 7.7% -3.4%
Total renewables 274 274 287 298 -0.2% 4.7% 1.3%
Total generation 1 596 1 550 1 633 1 701 1.4% 5.3% 1.4%
Mt CO2 2019 2020 2021 2024 Growth rate 2020
Growth rate 2021
CAAGR 2022-2024
Total emissions 608 583 608 627 -4.0% 4.3% 1.0%
Notes: CAAGR = compound average annual growth rate. Other non-renewables includes oil, waste and other non-renewable energy sources. Differences in totals are due to rounding. Source: IEA analysis based on data from IEA (2022), Data and statistics.

PAGE | 112
Annex
IEA
. All
right
s res
erve
d.
Electricity Market Report – January 2022
Regional and country groupingsAfrica – Algeria, Angola, Benin, Botswana, Cameroon, Congo, Democratic Republic of the Congo, Côte d’Ivoire, Egypt, Equatorial Guinea, Eritrea, Ethiopia, Gabon, Ghana, Kenya, Libya, Mauritius, Morocco, Mozambique, Namibia, Niger, Nigeria, Senegal, South Africa, South Sudan, Sudan, United Republic of Tanzania, Togo, Tunisia, Zambia, Zimbabwe and other African countries and territories.1
Asia Pacific – Australia, Bangladesh, Brunei Darussalam, Cambodia, Chinese Taipei, India, Indonesia, Japan, Korea, Democratic People’s Republic of Korea, Lao People’s Democratic Republic, Malaysia, Mongolia, Myanmar, Nepal, New Zealand, Pakistan, People’s Republic of China,2 Philippines, Singapore, Sri Lanka, Thailand, Viet Nam and other Asian countries, territories and economies.3
Central and South America – Argentina, Bolivia, Brazil, Chile, Colombia, Costa Rica, Cuba, Curaçao, Dominican Republic, Ecuador, El Salvador, Guatemala, Haiti, Honduras, Jamaica, Nicaragua, Panama, Paraguay, Peru, Suriname, Trinidad and Tobago, Uruguay, Venezuela and other Latin American countries and territories.4
Eurasia – Armenia, Azerbaijan, Belarus, Georgia, Kazakhstan, Kyrgyzstan, Republic of Moldova, Russian Federation, Tajikistan, Turkmenistan, Ukraine and Uzbekistan.
Europe – Albania, Austria, Belgium, Bosnia and Herzegovina, Bulgaria, Croatia, Cyprus,5,6 Czech Republic, Denmark, Estonia, Finland, North Macedonia, France, Germany, Gibraltar, Greece, Hungary, Iceland, Ireland, Italy, Kosovo,7 Latvia, Lithuania, Luxembourg, Malta, Montenegro, Netherlands, Norway, Poland, Portugal, Romania, Serbia, Slovak Republic, Slovenia, Spain, Sweden, Switzerland, Turkey and United Kingdom.
European Union – Austria, Belgium, Bulgaria, Croatia, Cyprus,5,6
Czech Republic, Denmark, Estonia, Finland, France, Germany, Greece, Hungary, Ireland, Italy, Latvia, Lithuania, Luxembourg, Malta, Netherlands, Poland, Portugal, Romania, Slovak Republic, Slovenia, Spain and Sweden.
Middle East – Bahrain, Islamic Republic of Iran, Iraq, Israel, 8
Jordan, Kuwait, Lebanon, Oman, Qatar, Saudi Arabia, Syrian Arab Republic, United Arab Emirates and Yemen.
North Africa – Algeria, Egypt, Libya, Morocco and Tunisia.
North America – Canada, Mexico and United States.
Southeast Asia – Brunei Darussalam, Cambodia, Indonesia, Lao People’s Democratic Republic, Malaysia, Myanmar, Philippines, Singapore, Thailand and Viet Nam. These countries are all members of the Association of Southeast Asian Nations (ASEAN).

PAGE | 113
Annex
IEA
. All
right
s res
erve
d.
Electricity Market Report – January 2022
Advanced economies – OECD member nations, plus Bulgaria, Croatia, Cyprus, Malta and Romania.
Emerging markets and developing economies – All other countries not included in the advanced economies regional grouping.
1 Individual data are not available and are estimated in aggregate for: Burkina Faso, Burundi, Cape Verde, Central African Republic, Chad, Comoros, Djibouti, Gambia, Guinea, Guinea-Bissau, Lesotho, Liberia, Madagascar, Malawi, Mali, Mauritania, Reunion, Rwanda, Sao Tome and Principe, Seychelles, Sierra Leone, Somalia, Eswatini and Uganda.
2 Including Hong Kong.
3 Individual data are not available and are estimated in aggregate for: Afghanistan, Bhutan, Cook Islands, Fiji, French Polynesia, Kiribati, Macau (China), Maldives, New Caledonia, Palau, Papua New Guinea, Samoa, Solomon Islands, Timor-Leste, Tonga and Vanuatu.
4 Individual data are not available and are estimated in aggregate for: Anguilla, Antigua and Barbuda, Aruba, Bahamas, Barbados, Belize, Bermuda, British Virgin Islands, Cayman Islands, Dominica, Falkland Islands (Malvinas), Grenada, Guyana, Montserrat, Saba, Saint Eustatius, Saint Kitts and Nevis, Saint Lucia, Saint Pierre and Miquelon, Saint Vincent and the Grenadines, Sint Maarten, and the Turks and Caicos Islands.
5 Note by Turkey: The information in this document with reference to “Cyprus” relates to the southern part of the Island. There is no single authority representing both Turkish and Greek Cypriot people on the Island. Turkey recognises the Turkish Republic of Northern Cyprus (TRNC). Until a lasting and equitable solution is found within the context of United Nations, Turkey shall preserve its position concerning the “Cyprus issue”.
6 Note by all the European Union Member States of the OECD and the European Union: The Republic of Cyprus is recognised by all members of the United Nations with the exception of Turkey. The information in this document relates to the area under the effective control of the Government of the Republic of Cyprus.
7 The designation is without prejudice to positions on status, and is in line with the United Nations Security Council Resolution 1244/99 and the Advisory Opinion of the International Court of Justice on Kosovo’s declaration of Independence.
8 The statistical data for Israel are supplied by and under the responsibility of the relevant Israeli authorities. The use of such data by the OECD and/or the IEA is without prejudice to the status of the Golan Heights, East Jerusalem and Israeli settlements in the West Bank under the terms of international law.

Electricity Market Report – January 2022
PAGE | 114
Annex
IEA
. All
right
s res
erve
d.
Abbreviations and acronyms ASEAN Association of Southeast Asian Nations
ANEEL Brazilian Electricity Regulatory Agency
CAAGR Compound average annual growth rate. Throughout the report we refer to the CAAGR when talking about average growth.
CBAM Carbon Adjustment Border Mechanism
CCGT combined cycle gas turbine
CCUS Carbon capture, utilisation and storage
CEA Central Electricity Authority (India)
CREG Commission for Electricity and Gas Regulation (Algeria)
CO2 carbon dioxide
EGAT Electricity Generating Authority of Thailand
ERCOT Electric Reliability Council of Texas
ESES Electricity Security Event Scale
ETS emissions trading scheme
EU European Union
EU ETS European Union Emissions Trading System
FERC Federal Energy Regulatory Commission (US)
GCC Gulf Cooperation Council
GDP gross domestic product
GHG greenhouse gas
IEA International Energy Agency
IMF International Monetary Fund
IPCC Intergovernmental Panel on Climate Change
IPP independent power producer
KETS Korea Emissions Trading Scheme
LNG liquefied natural gas
LT-LEDS long-term low-emission development strategies
NDC nationally determined contribution
NERC North American Electric Reliability Corporation (US)
NZE net zero emissions
OECD Organisation for Economic Co-operation and Development
PLN Perusahaan Listrik Negara
PPA power purchase agreement
REIPPPP Renewable Energy Independent Power Producer Procurement Programme (South Africa)
RMIPPPP Risk Mitigation Independent Power Producer Procurement Programme
RUPTL Electricity Supply Business Plan (Indonesia)
PV photovoltaic

Electricity Market Report – January 2022
PAGE | 115
Annex
IEA
. All
right
s res
erve
d.
SPP Southwest Power Pool (US)
TTF Title Transfer Facility
UAE United Arab Emirates
UK United Kingdom
UK ETS UK Emissions Trading Scheme
UNFCC United Nations Framework Convention on Climate Change
US United States
VRE variable renewable energy
WB World Bank
Units of measurement Gt CO2 gigatonne of carbon dioxide
GW gigawatt
km kilometre
kWh kilowatt hour
MBtu million British thermal units
Mt CO2 million tonnes of carbon dioxide
MW megawatt
MWh megawatt hour
g CO2 gramme of carbon dioxide
t CO2-eq tonne of carbon dioxide equivalent
TWh terawatt hour

PAGE | 116
Annex
IEA
. All
right
s res
erve
d.
Electricity Market Report – January 2022
Acknowledgements, contributors and creditsThis publication has been prepared by the Gas, Coal and Power Markets (GCP) Division of the International Energy Agency (IEA). The publication was led and co-ordinated by Stefan Lorenczik, Energy Analyst for Electricity.
Stefan Lorenczik, Javier Jorquera Copier, Pablo Hevia-Koch and Zoe Hungerford are the main authors. The report also benefited from analysis, data and input from Chiara D’Adamo, Carlos Fernández Alvarez, Louis Chambeau, Jean-Baptiste Dubreuil, Keith Everhart, Danhak Gu, Julia Guyon, Craig Hart, Tetsuro Hattori, Songho Jeon, Kazuhiro Kurumi, Jinsun Lim, Luis Lopez, Akos Losz, Sara Moarif, Gergely Molnár, Luca Lo Re, Gabriel Saive, Enrique Gutierrez Tavarez, Peerapat Vithayasrichareon and Jacques Warichet.
Keisuke Sadamori, director of the IEA Energy Markets and Security (EMS) Directorate, and Peter Fraser, Head of GCP, provided expert guidance and advice.
Further IEA colleagues provided valuable input, comments and feedback, in particular Srivatsan Anand, Heymi Bahar, Paolo Frankl, Tim Gould, Pauline Henriot, César Alejandro Hernández Alva, Doyob Kim, Kazuhiro Kurumi, Kevin Lane, Brian Motherway, Fabian Voswinkel and Brent Wanner.
Timely and comprehensive data from the Energy Data Centre were fundamental to the report.
The authors would also like to thank Justin French-Brooks for skilfully editing the manuscript and the IEA Communication and Digital Office, in particular Astrid Dumond, Taline Shahinian, Isabelle Nonain-Semelin, Jad Mouawad, Jethro Mullen, Gregory Viscusi and Therese Walsh.
Several international experts provided input and/or reviewed the draft report. Their suggestions and comments were very valuable. They include: Manuel Baritaud (European Investment Bank), Brent Dixon (Idaho National Laboratory), Ganesh Doluweera (Canada Energy Regulator), Michael Hogan (The Regulatory Assistance Project), Francisco Laverón (Iberdrola), Enrique De Las Morenas Moneo (ENEL), Manabu Nabeshima (Ministry of Foreign Affairs, Japan), Emmanuel Neau (EDF R&D), Vasilis Papandreou (ACER), Enzo Sauma Santis (Pontificia Universidad Católica de Chile), Fereidoon Sioshansi (Menlo Energy Economics), Carlos Toro (Ministry of Energy of Chile), Laurens de Vries (Delft University of Technology), Matthew Wittenstein (United Nations ESCAP) and Rina Bohle Zeller (Vestas).
The individuals and organisations that contributed to this report are not responsible for any opinion or judgement it contains. Any error or omission is the sole responsibility of the IEA.
For questions and comments, please contact GCP ([email protected]).

This publication reflects the views of the IEA Secretariat but does not necessarily reflect those of individual IEA member countries. The IEA makes no representation or warranty, express or implied, in respect of the publication’s contents (including its completeness or accuracy) and shall not be responsible for any use of, or reliance on, the publication. Unless otherwise indicated, all material presented in figures and tables is derived from IEA data and analysis.
This publication and any map included herein are without prejudice to the status of or sovereignty over any territory, to the delimitation of international frontiers and boundaries and to the name of any territory, city or area.
IEA Publications International Energy Agency Website: www.iea.org Contact information: www.iea.org/about/contact
IEA. All rights reserved.
Typeset in France by IEA – January 2022Cover design: IEA