Integrated statistics - OECD iLibrary
27
OECD Framework for Statistics on the Distribution of Household Income, Consumption and Wealth © OECD 2013 145 Chapter 7 Integrated statistics This chapter provides practical guidelines on the collection of integrated data on household income, consumption and wealth. The guidelines are intended to: Improve the harmonisation of these statistics, by reducing the impact of design and measurement effects on international comparability. Assist those countries considering the establishment of household surveys that concurrently collect information on income, consumption and wealth. Identify data requirements that are needed to improve the quality of data-matching in the fields of household income, consumption and wealth.
-
Upload
khangminh22 -
Category
Documents
-
view
0 -
download
0
Transcript of Integrated statistics - OECD iLibrary
OECD Framework for Statistics on the Distribution
of Household Income, Consumption and Wealth
© OECD 2013
145
Chapter 7
Integrated statistics
This chapter provides practical guidelines on the collection of integrated data onhousehold income, consumption and wealth. The guidelines are intended to:Improve the harmonisation of these statistics, by reducing the impact of design andmeasurement effects on international comparability. Assist those countriesconsidering the establishment of household surveys that concurrently collectinformation on income, consumption and wealth. Identify data requirements thatare needed to improve the quality of data-matching in the fields of householdincome, consumption and wealth.
7. INTEGRATED STATISTICS
OECD FRAMEWORK FOR STATISTICS ON THE DISTRIBUTION OF HOUSEHOLD INCOME, CONSUMPTION AND WEALTH © OECD 2013146
IntroductionMost countries obtain household economic data using information collected from
households via a sample survey. The main advantage of survey data is that direct
control can be exercised over the data content, since it is possible to ask questions on
precisely those items on which information is sought. The first part of this chapter
covers practical guidelines for the collection of integrated statistics in household
surveys, including coincident measurement through the linking of administrative
sources to information reported by respondents in household surveys. A number of
examples of country practices are provided. The chapter then discusses ex post
integration through data-matching techniques, making recommendations for data
collection and design to improve the accuracy and consistency of integrated data sets
compiled through data-matching.
Income surveysTraditionally, micro analyses of economic well-being have generally used income data,
reflecting the relative ease with which households can report their incomes and the
relative frequency with which data on income is available from both survey and non-
survey sources. For most households, income is the most important economic resource for
meeting everyday living expenses. For these reasons, income is always collected as a
primary topic in any study of household economic well-being.
However, income collected alone has some significant limitations. It can be quite
volatile for people who are making transitions between jobs or into retirement, changing
their hours of work, moving into or out of study, increasing or reducing time spent caring
for children, or taking extended breaks from work. At these times, households may draw
on other resources to fund their consumption expenditure, such as by using savings or
incurring debt.
The 2011 Canberra Group Handbook on Household Income Statistics provides best practice
guidelines on household income measurement. The Handbook examines the key
measurement issues from the perspective of producing reliable and relevant statistics on
household income distribution. General issues such as measurement units, reference
periods, population-weighting and benchmarking are covered. Practical guidance is
provided on the collection or estimation of those income components that have known
measurement or quality concerns, such as employee income in kind; income from self-
employment (including net estimated value of goods and services produced for barter, as
well as goods produced for own consumption); property income; income from household
production of services for own consumption (including net value of housing services,
unpaid domestic services and services from household consumer durables); inter-
household transfers; and social transfers in kind.
7. INTEGRATED STATISTICS
OECD FRAMEWORK FOR STATISTICS ON THE DISTRIBUTION OF HOUSEHOLD INCOME, CONSUMPTION AND WEALTH © OECD 2013 147
The Handbook also provides information on the methodologies used and the
components included in household income data sets compiled from a wide variety of
countries in 2010. Chapter 3 of this publication discusses many of these areas and extends
the discussion where necessary to ensure that the different components of household
economic resources fit into an integrated framework for income, consumption and wealth
statistics.
Income and expenditure surveysAfter stand-alone income surveys, the next most common practice by statistical
agencies is the integrated collection of household income and expenditure data. In some
countries, the integrated collection of household income and expenditure has been
occurring for many years, e.g. Israel (Box 7.1).
Household expenditure surveys are widely used to analyse the expenditure patterns of
households across the population and to compare levels of expenditure between various
population groups. These analyses support the development, implementation and
evaluation of social and economic policies, particularly for potentially disadvantaged
groups such as pensioners, one-parent families and the unemployed. Household
expenditure data are also often used in determining the basket of goods and services that
is used to compile consumer price indexes, as well as for determining the relative
importance of each expenditure class in calculating the index.
The coincident measurement of household income and expenditure allows
comparisons of expenditure levels and patterns of expenditure at different points in the
income distribution, e.g. by income quintile. It also allows comparisons of groups by their
main source of household income, such as government pensions and allowances or wages
and salaries.
In addition, when income and expenditure information are collected together, they
can be used to impute indirect government benefits and production taxes for the purpose
of studying the effects of government policies on household income for sub-groups of the
population. In these studies, information on the composition of households and the
characteristics of their members are used to identify recipients of social transfers in kind
from government, while expenditure data are used to calculate the incidence of production
taxes paid.
While integrated income and expenditure surveys can inform on the income and
expenditure characteristics of households at different points of the respective
distributions, it should be noted that in almost all cases there will be timing differences
between the different components of income and expenditure collected. Therefore,
income and expenditure estimates for individual households or for groups of households
will not balance, and the difference between household income and expenditures cannot
be considered a measure of saving.
7. INTEGRATED STATISTICS
OECD FRAMEWORK FOR STATISTICS ON THE DISTRIBUTION OF HOUSEHOLD INCOME, CONSUMPTION AND WEALTH © OECD 2013148
Income, expenditure and wealth surveysWhen wealth data are collected in conjunction with income data, they provide more
comprehensive information about household economic well-being. In addition to the total
net worth of households, the composition of assets and liabilities can also provide valuable
insight for policy makers and analysts.
The coincident collection of housing data is a critical element in all income,
expenditure and wealth surveys.
● For income, data on housing characteristics and costs are required to calculate estimates
of net imputed rent as a measure of income accruing from the owner-occupied housing
services that the household provides to itself, as well as the value of subsidised rentals
(a component of social transfers in kind). Rental property income also provides a source
of income for many households. When estimating income attributed to real estate, it is
necessary to deduct the costs associated with real estate ownership, such as interest on
mortgages and other loans used to finance the ownership, land taxes and so on.
● For expenditure, gross imputed rent is a major item for owner-occupier households, while
rent is a major item for most non-owners.
● For wealth, home ownership is often the most significant asset of households, and the
mortgage often represents their largest liability, particularly in the period just after the
purchase of property.
Collecting information on household income, consumption and wealth
simultaneously is a challenge. However, it has been successfully undertaken by some
statistical agencies. The benefits are far-reaching, in terms of better understanding the
relationships between income, wealth and expenditure for individual households and
groups of households, and for enabling analysis that provides a more complete picture of
the economic well-being of households (Box 7.2).
Box 7.1. Integrated income and expenditure data in Israel
In Israel, integrated information on household income and expenditure has beencollected since the early 1950s in the Household Expenditure Survey. The survey wasconducted every 5 years up until 1997, when the survey frequency was increased toannually. More recently, a decision was made to invest more heavily in the HouseholdExpenditure Survey, with a significant increase in sample size from 6 000 households to10 000 households. The survey data are used extensively to:
● derive weights for the consumption basket of the consumer price index;
● calculate the poverty line and measure the standard of living and well-being of thepopulation; and
● estimate household final consumption expenditures in the national accounts.
7. INTEGRATED STATISTICS
OECD FRAMEWORK FOR STATISTICS ON THE DISTRIBUTION OF HOUSEHOLD INCOME, CONSUMPTION AND WEALTH © OECD 2013 149
Box 7.2. Approach to collecting integrated income, expenditure and wealth data in Australia
Australia has collected information on household income, expenditure and wealth since2003-04 in integrated surveys, the ABS Survey of Income and Housing (SIH) and the ABSHousehold Expenditure Survey (HES). The HES is conducted every six years while the SIHis conducted every two years. When the HES is run, it is integrated with the SIH, whichincludes a comprehensive wealth module.
A fiscal incidence study is also undertaken using output from the HES. The studyallocates to households social transfers in kind (STIK) and taxes on production to providea more complete picture of the total impact of government taxation and expenditure onhouseholds. Government expenditure designated as part of STIK is allocated to individualhouseholds either by using reported HES data on cash reimbursements received or byusing models and more general household characteristics, e.g. government schooleducation expenditure is allocated to households with school-age children. Key elementsof the SIH and HES are highlighted below.
Sample design. The SIH and HES samples are designed to produce reliable estimates forbroad aggregates for Australia and its key regions. To maximise the efficiency of the design,the HES is conducted for a subsample of SIH households. In the HES sample, all topics arecollected, i.e. income, housing, wealth, expenditure and financial stress. In the SIH sample,income, housing, and wealth data are collected. The collection of expenditure data from asubsample of households results in reduced respondent burden and survey costs. Moredetail is provided in Box 7.3.
Weighting. To ensure that the survey results are representative of the population as a whole,and to maximise the consistency of output from the SIH and HES samples, weights arecalibrated against person and household benchmarks. Households in the HES have both an“HES weight” and an “SIH weight”, i.e. households in the HES can contribute to both the HESand the SIH aggregates. In addition to the benchmarks used in the SIH (e.g. population and agestructures), HES data are benchmarked to a number of estimates produced from the SIH,including income by main household source and by region, and tenure by region.
Data collection. By aligning common data items and ensuring that all the items required forthe SIH are also collected in the HES, it is possible to include the HES sample as part of the SIHsample. Data are collected using computer-assisted personal interviews (CAPI). For eachhousehold, one household questionnaire is completed, as well as personal questionnaires foreach person aged 15 and over. The household questionnaire is used to collect information on:household demographics; dwelling characteristics; some household assets and liabilities, e.g.owner-occupied housing and rental properties; expenditure on household bills, e.g. rents,rates, loans; infrequent or irregular expenditures, e.g. repair and maintenance of dwellings,vehicles and travel. The personal questionnaire is used to collect information on income(by type), current and annual; and on personal assets, integrated with income questions, e.g.dividends from shares are collected together with the value of shares and any loans taken topurchase shares. The expenditure diary (for HES selections only) is completed by each personaged 15 and over for two weeks from the date of interview to capture regular, recurrentconsumption expenditure; shopping dockets can be attached to the diary as a record ofexpenditures. To improve HES reporting, households are visited a minimum of four times:i) the initial contact when information on the number and characteristics of people usuallyresident in the dwelling is obtained and the first week’s expenditure diaries are distributed;ii) a Diary Assistance Visit is arranged for two to four days after households receive their diariesto check that the diaries are being maintained correctly and to provide respondents with any
7. INTEGRATED STATISTICS
OECD FRAMEWORK FOR STATISTICS ON THE DISTRIBUTION OF HOUSEHOLD INCOME, CONSUMPTION AND WEALTH © OECD 2013150
Practical issuesThis section draws on the available practical guidance for income, expenditure and
wealth surveys as well as the experience of countries where this information is available.
It covers: i) frequency; ii) data collection; iii) questionnaire design; iv) maximising response
rates; and v) utilising administrative data sources.
FrequencyIn many countries, household income data are collected either annually or every two
years. As income and wealth are best collected in an integrated survey, the same frequency
is recommended for wealth, although some or all the wealth components can be omitted
for some years.
The ICLS Resolution on household income and expenditure statistics (2003) recommends
that a major sample survey of household expenditures be undertaken, preferably at
intervals not exceeding five years. However, under conditions of rapid changes in socio-
economic and political situations, in lifestyles and in the availability of different types of
goods and services, the surveys should be undertaken more frequently. For reweighting the
consumer price index, smaller-scale surveys or other sources can be used to estimate
changes in important aggregates during the interval between two large-scale surveys.
Data collection Different methods of collection may be used for different components to obtain
results of optimum quality. The most common household surveys are undertaken by
personal interview, i.e. either a face-to-face interview or a telephone interview. Face-to-
face interviews may produce data of higher quality due to generally higher response rates
Box 7.2. Approach to collecting integrated income, expenditure and wealth data in Australia (cont.)
assistance they may need; iii) a Diary Exchange Visit when the week 1 diaries are collectedand checked and the week 2 diaries are provided; iv) a last visit, when the week 2 diariesare checked and collected and any remaining interviews are completed.
Response and refusal rates. The SIH achieves response rates that are very similar to those ofother ABS household surveys, while the HES response rate is slightly lower. For the SIH, theresponse rate is over 85%, and the refusal rate about 3%. For the HES, the response rate is over75% and the refusal rate about 7%. About half of the non-response relates to dwellings deemedby interviewers as occupied, but where no household member could be contacted (a ratesimilar to that observed for other ABS surveys). The other half relates to households affectedby death/illness, or where a significant person did not respond to key questions.
Reducing the impact of non-response. Where possible, imputation is used for householdswhere there is partial non-response but sufficient information was supplied to be retained inthe sample. In these cases, imputation for partial non-response or missing items is used byimputing the missing data with a value reported by another person with similar characteristics(referred to as the “donor”). Donor records are selected by finding fully responding persons withmatching information on various characteristics (such as administrative area where peoplelive, gender, age, labour force status and income) as the person with missing information. Theimputed information is an appropriate proxy for the information that is missing and the itemis flagged to indicate that it contains imputed information.
7. INTEGRATED STATISTICS
OECD FRAMEWORK FOR STATISTICS ON THE DISTRIBUTION OF HOUSEHOLD INCOME, CONSUMPTION AND WEALTH © OECD 2013 151
and the ability of respondents to easily refer to relevant statements or documents
concerning the income questions, e.g. their pay slip or tax return.
Ideally, income and wealth data should be collected by a face-to-face personal
interview directly from each relevant household member and separately for each type of
income and each class of assets and liabilities, at a level that is as detailed as possible.
However, some wealth items, such as the value of property and other durables, and the
loans on these items, may be better collected at the household level from a person
knowledgeable about these matters.
Similarly, information on large, infrequent or irregular purchases, especially of durable
goods, and on regular expenditures such as rent and utility bills should be collected by
personal interview at the household level from a person knowledgeable about the
household’s expenditures. However, a diary collection method is preferable for those
expenditure items that are frequently purchased such as food, personal care products and
household supplies. Therefore a combination of a personal interview with a household
spokesperson along with expenditure diaries for each adult member of the household is
considered best practice for household expenditure data.
Emerging methods that may facilitate data collection include the use of the Internet,
outlet receipts and electronic equipment (hand-held computers or mobile telephones) for
real-time recording of expenditures.
Questionnaire designMost countries use computer-assisted interviewing techniques for conducting their
household surveys. This allows more complex questionnaire design and sequencing to be
undertaken, as well as edits to be developed that can highlight inconsistencies or data
reporting errors that can be checked during the interview.
Questionnaires for collecting expenditure, income and wealth data are ideally
organised into:
● A household-level questionnaire, collecting information on the characteristics of the
household such as size and composition, dwelling characteristics, certain assets and
liabilities, expenditure common to all household members (e.g. utility bills and housing
costs) and irregular or infrequent expenditures (e.g. the purchase of household
appliances or overseas holidays);
● An individual-level questionnaire, collecting information from each usual resident, aged 15
and over, on income, certain assets and liabilities, and personal characteristics; and
● A personal diary in which usual residents aged 15 and over record their expenditures over
a defined period.
When income, wealth and expenditure are collected together, it is preferable to design
the questionnaire in an integrated manner rather than to have separate “income”, “wealth”
and “expenditure” modules. Box 7.3 provides an example using bank accounts to show
how income and wealth questions can be integrated to improve data quality and to reduce
respondent burden.
7. INTEGRATED STATISTICS
OECD FRAMEWORK FOR STATISTICS ON THE DISTRIBUTION OF HOUSEHOLD INCOME, CONSUMPTION AND WEALTH © OECD 2013152
Sample designThe design of the sample and the selection of sample households should be made in
accordance with appropriate sampling techniques in order to obtain results that are as
accurate as possible with the resources available, taking into account circumstances such
as the availability of suitable sampling frames. As far as possible, the sampling method
employed should permit the calculation of sampling errors. Thorough research should be
carried out to find and clearly identify the most suitable sampling frame and to determine
the number of stages, the optimum stratification and other salient features of the sample
to be used, as well as the best procedures for selecting the sample units.
The sample size should be determined on the basis of both the accuracy required, i.e.
the magnitude of the acceptable level of the sampling error for key estimates, and the
resources available. In choosing a sample design, the objective is to ensure good
representation in terms of the size and composition of households and income/
expenditure/wealth classes. In most cases, it should be sufficient to ensure the adequate
representation of households of different sizes and compositions, of demographic and
socio-economic groups, as well as of urban and rural areas and, where relevant, of different
climatic zones within the country.
In some instances it may also be important to have adequate representation of
particular groups of interest, especially when these are small in size, e.g. recent migrant
households and high-wealth households. This may be achieved either by increasing the
overall sample size or by oversampling particular populations. Box 7.4 provides an example
from Australia where both strategies were employed in the ABS integrated surveys of
household income, expenditure and wealth.
Box 7.3. Survey questions used to collect information on income and assets in the Australian Survey on Income and Housing
The questions below illustrate how bank account assets and interest from bank accountsmight be collected together rather than in separate “income” and “wealth” modules.
● Do you currently have any bank accounts?
● (If yes) Including only your share of any joint accounts, what is your current balance?[value of assets]
● Including only your share, how much interest do you expect to receive from your bankaccounts this year? [income]
Box 7.4. Adjusting sample designs in the Australian integrated income, expenditure and wealth surveys
When the Australian Bureau of Statistics Household Expenditure Survey (HES), describedin Box 7.2, is conducted, it is integrated with the Survey of Income and Housing (SIH) andrun on a subsample of the SIH. For the 2009-10 surveys, the sample sizes were increasedfor two purposes:
● First, the SIH sample was increased by 4 200 households, located outside capital cities,to better support performance indicator reporting, especially in regard to housingaffordability and home ownership measures.
7. INTEGRATED STATISTICS
OECD FRAMEWORK FOR STATISTICS ON THE DISTRIBUTION OF HOUSEHOLD INCOME, CONSUMPTION AND WEALTH © OECD 2013 153
Maximising response ratesResponse rates and respondent burden need to be considered in designing the
approach to data collection. As low response rates may affect the representativeness of the
survey, it is recommended that countries make every effort to ensure good response rates.
A well-designed instrument and professional approach to collection can make a significant
difference to response rates.
Some surveys have made use of incentives in the form of payment of a token amount or
gifts, e.g. calculators or note pads. Some countries allow the use of substitution to replace non-
responding households, but doing this indiscriminately could negate the probability sampling.
In other institutional environments, such surveys can be mandated in legislation.
Other techniques to maximise response rates include:
● conducting face-to-face computer-assisted interviews and using highly trained
interviewers;
● using interviewers who can speak other languages;
● following-up respondents closely if there is no initial contact;
● using an introductory letter and brochure prior to contact to explain the importance of
the survey results and what they will be used for;
● providing a card in advance of the interview that lists the documents, records and
statements that will make completing the survey easier and quicker;1 and
● training interviewers to encourage respondents to obtain information from household
and personal documents where applicable, e.g. utility bills, dividend statements.
Utilising administrative data sources
In some cases, administrative data sources may be available to supplement reported
data in household surveys (see the examples for Canada in Box 7.5, and Denmark in
Box 7.6). Administrative data sources are also important for validating the reported data
Box 7.4. Adjusting sample designs in the Australian integrated income, expenditure and wealth surveys (cont.)
● Second, the HES (and consequently the SIH) included an additional 3 000 metropolitanhouseholds whose main source of income was from government pensions andallowances. A two-stage sample selection process was used to identify relevanthouseholds. First, interviewers approached randomly selected households from aseparate sample and asked the main source of household income. Second, only thosehouseholds that reported their main source of income as government pensions and/orallowances were included in the extra HES sample. The expansion of the sample wasmade to improve the quality of the Pensioner and Beneficiary Living Cost Index (PBLCI),which measures changes in the cost of living for pension and other governmentbeneficiary households. The sample increase was targeted at improving the PBLCI tomake it more representative of the spending patterns of pensioners and otherbeneficiaries, and to support analysis of the specific products that pensioners and otherbeneficiaries buy so as to assess whether an expanded range of products needed to bepriced when constructing the PBLCI.
7. INTEGRATED STATISTICS
OECD FRAMEWORK FOR STATISTICS ON THE DISTRIBUTION OF HOUSEHOLD INCOME, CONSUMPTION AND WEALTH © OECD 2013154
Box 7.5. Statistics Canada’s Survey of Financial Security
Statistics Canada provides thorough coverage of Canadian families’ income andexpenditures through annual household financial surveys. However, the measurement ofa family’s wealth is less frequent, with data collected occasionally by the Survey ofFinancial Security (SFS), which combines most aspects of wealth (income, assets anddebts) into one survey. Although the information on assets and debts is collected directlyfrom a personal interview, income data are obtained through a subsequent record linkageto administrative data. Statistics Canada has conducted the Survey of Financial Security in1999, 2005 and 2012. The 2012 SFS is built to a large extent upon the two previous versionsof the survey in order to allow comparisons of levels and trends over the years. However, afew significant improvements have been made to this latest iteration.
As in previous years, a dual-frame approach is used to oversample high-income earners,since they typically have a higher non-response rate than those in the other incomebrackets. Rather than selecting the oversample from high-income postal code areas, it isnow being selected from administrative tax records – Canada Revenue Agency’s IndividualTax File. This method allows a more efficient sample design since the “hit rate” of genuinehigh-income households is better, and the tax data’s auxiliary variables are correlated withthe survey variables of interest. The disadvantage is that the most recent tax data file isavailable only for 2009. In the 1999 SFS, the sample size was about 24 000 households. Forthe 2005 iteration, due to budget constraints, the sample was reduced to 9 000 households.Because of the difficulty in releasing reliable provincial estimates with that smaller samplesize, the 2012 survey now covers 20 000 households.
In order to reduce the response burden, two changes were incorporated. The first was toreduce the length of the previous SFS questionnaire interviews from an average of about75 minutes to 50 minutes. To reach this goal, content that had poor response was removed,content which had contributed little analytic value was taken out, and additionalsponsored content from survey stakeholders was not solicited. The second change was toenable household surveys collecting detailed income data to use “informed replacement”,i.e. the respondent is informed that their income data from tax records will be used as areplacement for answering a series of income questions, in accordance with StatisticsCanada’s Directive on Record Linkage and Directive on Informing Survey Respondents. Ifthe respondent does not refuse this replacement, a match to the Canada Revenue AgencyTax File is made to retrieve their personal income data. For the surveys that have usedinformed replacement since 2012, the refusal rate has been under 2%.
Before carrying out the match, the tax data are processed at Statistics Canada over a 4 to5 month period to obtain a comprehensive file, including annual adjustments to accountfor province-specific tax legislation and changes in national tax policy. Further, becausethe source tax files have limited information on the number and characteristics of non-filing individuals, this information must be derived. A system module creates families bylinking together filing family members and it estimates non-filing members.
The receipt of the source tax data and its processing to create the final Tax File is notalways optimum in regards to the timing of the survey processing. However, once the finalTax File is produced, the probabilistic match to the survey data can then begin as thesurvey provides the linkage variables needed to retrieve a tax record identifier. This uniqueidentifier is then used in the match to the final Tax File. A donor imputation module existsfor those cases where no match is found or where a respondent refused the taxreplacement. Imputation is an iterative process due to the various causes of the missing
7. INTEGRATED STATISTICS
OECD FRAMEWORK FOR STATISTICS ON THE DISTRIBUTION OF HOUSEHOLD INCOME, CONSUMPTION AND WEALTH © OECD 2013 155
Box 7.5. Statistics Canada’s Survey of Financial Security (cont.)
data (e.g.. identifier found but no match on the final Tax File, missing data can/cannot becalculated from other sources). From the matched or imputed personal tax information,family-level and household-level incomes are then derived. As for the tax file processingsystem, annual updates need to be incorporated into the income processing system toaccount for year-to-year tax policy changes. Through the above process, the series of27 questions on income from all sources from the previous SFS questionnaires has beeneliminated. The tax data replacement contributes over 30 income variables instead.
As in the past, information is collected for the economic family unit as a whole, withsome specific information from each family member aged 15 and older. The 2012 SFS willbe collected using a computer-assisted personal interview rather than the paper-basedpersonal interview conducted for previous SFS surveys.
Box 7.6. Integrating administrative and household survey data in Statistics Denmark
Since 1994, Statistics Denmark has conducted an extended Household Budget Survey (HBS)including the comprehensive and coincident measurement of the following main topics:
● Household economic resources, including household consumption; household income;stock of durables; pension schemes; direct taxes; taxes on imports and production; useof health, education and child care services; and government social transfers in kind.
● Other demographic information to support analysis of the data, including household sizeand composition; household income; housing conditions; level of education; and geography.
To reduce the respondent burden, questions regarding topics for which StatisticsDenmark already has usable data are not collected during the survey interview. Rather,administrative registers, the HBS and other sources are linked at the micro level to producean integrated and comprehensive income and consumption data set.
Denmark has a number of administrative registers that cover the total population, one ofwhich is the income register. Linking techniques are used to match these data with surveydata. The straightforward way to do this is to use the personal identification number (PIN code)that all persons in Denmark are given at birth or when they immigrate. However, linkinginformation on dwellings and households to the survey using the PIN code is not possible.Here addresses are the link, and administrative registers are used. The Central PopulationRegister (CPR) keeps information on both addresses and PIN codes and can be used to link theCentral Register of Buildings and Dwellings (BBR), the HBS and other administrative registers.
The single most important administrative record used is the income register, since inputfrom this covers many of the income components as well as consumption components.However, not all income, expenditure and taxes are covered in the income register, inwhich case the information is collected directly from respondents through the HBS. This isthe case of income from the hidden economy; self-employment income; income fromgoods produced for own consumption; income from financial assets; net imputed rentfrom owner-occupied housing; current transfers from relatives; social insurancepayments; inheritances; receipts from capital pensions; payment of insurance premiumsand out-of-pocket costs; payment of fines; current transfers paid, e.g. gifts and charity;fees to non-profit institutions; and consumption.
7. INTEGRATED STATISTICS
OECD FRAMEWORK FOR STATISTICS ON THE DISTRIBUTION OF HOUSEHOLD INCOME, CONSUMPTION AND WEALTH © OECD 2013156
against external information. Examples of administrative or external data sources include:
personal tax data; government payments for pensions and other benefits; other statistical
survey outputs providing measures of employee income, bank deposits and loans, etc.;
house sales and housing costs data; national accounts; and population censuses.
Whenever possible, estimates of income, expenditure and wealth should be compared
with the corresponding national accounts for the household sector. This type of
comparison is useful both for understanding the strengths and weaknesses of both data
sets, leading to opportunities to improve alignment and quality, as well as for informing
users about the conceptual and methodological differences between the different data sets
to support integrated micro and macro analyses.
Data matching to achieve ex post integrationGiven the complexity of obtaining information on income, consumption and wealth
simultaneously, often statistics on each dimension are collected through separate surveys.
In these cases, ex post integration techniques can enable the compilation of statistics on
the three dimensions of economic well-being for specific households or sub-groups, as well
as information on their joint distribution.
Box 7.6. Integrating administrative and household survey data in Statistics Denmark (cont.)
The integrated income and expenditure data are used to compile estimates of netsavings, which is considered by Statistics Denmark to be a first step towards producingestimates for wealth. Another small step has also been taken since the “net savings” arebroken down into a number of subgroups based on questions in the HBS on payment forpensions schemes and “ATP” (own and employer’s contribution); payment for private lifeinsurances, etc., and on the value of extensions to and rebuilding of the dwelling.Deduction of these saving components from “net savings” makes it possible to compile theresidual “other kinds of savings”.
The Danish HBS routinely compiles estimates of social transfers in kind, for child care,education and health, by using information collected in the HBS with rates of governmentexpenditure from public finance statistics. For example, the HBS collects information onthe number of months a child has been in day care and on the household’s own out-of-pocket expenses for this service. From public finance statistics, it is possible to deduct thetotal cost for this use. Integrating these data makes it possible to compile the indirecttransfer concerning child care for a household. Similar methods are used for educationand health services. When health services are compiled, data from the national healthregister are used instead of the HBS questionnaire, since the quantity of health servicesused by individuals is available at the micro level. These imputations are significant, sinceSTIK increase household disposable income by nearly 20%. Again, this compilation ispossible since the PIN code can be used to link data from the HBS with administrativeregisters, in this case health data.
The integrated HBS is also used to compile indirect taxes in respect of VAT, excise duty,stamp duties and real property tax. Since household consumption is collected in the HBS at avery detailed level (1 200 COICOP codes), and since VAT and excise tax rates are known for allgoods, it is straightforward to compile the tax revenue for all goods and services. Taxes ondwellings are compiled separately, primarily because users pay special attention to this tax.
7. INTEGRATED STATISTICS
OECD FRAMEWORK FOR STATISTICS ON THE DISTRIBUTION OF HOUSEHOLD INCOME, CONSUMPTION AND WEALTH © OECD 2013 157
An important distinction is between situations in which the same individuals or
households are found in each of the data sets, and those situations where this is not the case.
In the first case, individual or household records from two or more data sets are brought
together, i.e. “linked”, in a way that joins separate data records belonging to the same person
or household (also referred to as record linkage). Records may be linked by a common
identification number or address, if available, or by probabilistic record-linking techniques.
Statistical linking has particular opportunities for creating longitudinal data sets.
In the second case, statistical matching techniques are used to create data sets with
joint information on variables and units collected in different sources. Statistical matching
(also known as data fusion, data merging or synthetic matching) usually refers to model-
based techniques that generate a synthetic micro data file from two or more different
samples that have a set of variables in common (Rässler, 2002). While record linkage deals
with identical statistical units (e.g. households, individuals), statistical matching deals
with “similar” units.
The potential benefits of this approach are the complementary use and enhanced
analytical potential of existing data sources by producing estimates on the joint
distribution of variables not collected together. However, several methodological
limitations need to be taken into account for evaluating the quality of the results obtained
from matched data sets.
Methodological overview
This section aims to provide a general methodological framework on statistical
matching with an emphasis on quality assessment. It also considers conditions that can
foster statistical matching, and can be translated into recommendations for a more
efficient ex ante data collection system. The section concludes by describing some country
experiences in implementing data-matching techniques to income, consumption and
wealth records.
Matching procedures can be regarded as an imputation problem of the target variables
from a donor to a recipient survey. In Table 7.1, information on Y and Z is collected through
two different samples drawn from the same population; conversely, information on the
X variables is collected in both samples, and the individual values of this variable are
correlated with both Y and Z. The relationship between these common variables with the
specific variables observed in only one of the data sets, the donor data set, can be used to
impute to the units of the other data set, the recipient data set, the variables not directly
observed. Thus a synthetic data set is constructed with complete information on (X, Y, Z)
for all units in the recipient data set.
Traditional techniques, focused on the creation of synthetic data sets, were criticised
on the grounds that they rely on implicit assumptions. In particular, measures of
association between Y and Z, conditional on X, are assumed to be 0. This “conditional
independence assumption” (CIA) has strong implications for the quality and usability of
estimates obtained through matching (Kadane, 1978; Rodgers, 1984).
Table 7.1. Integration of data from two data sets
Sample A (donor) Sample B (recipient) Synthetic data set
X, Y X, Z X, Ŷ, Z
7. INTEGRATED STATISTICS
OECD FRAMEWORK FOR STATISTICS ON THE DISTRIBUTION OF HOUSEHOLD INCOME, CONSUMPTION AND WEALTH © OECD 2013158
When this condition holds, matching algorithms will produce complete data sets that
reflect the true joint distribution of variables that were collected in multiple sources. It will
give the same results as a perfect linkage procedure. Unfortunately, the CIA assumption
rarely holds in practice, and it cannot be tested from the data sets. When conditional
independence does not hold, and no additional information is available, the model will
have identification problems and will lead to a situation of uncertainty. In this case, artificial
data sets are used for inferences in an incorrect way, as they do not take into account prior
assumptions used for the estimation. New techniques and approaches in the field of
statistical matching take these limitations into account. A more comprehensive definition
of statistical matching refers to the identification of any structure that describes
relationships among the variables not jointly observed in the data sets, such as joint
distributions, marginal distributions or correlation matrices (D’Orazio et al., 2006).
Statistical matching: A stepwise approach
The first step in a data-matching framework is the harmonisation and integration of
multiple sources. D’Orazio et al. (2006) specify the following eight types of reconciliation
actions: harmonisation on the definition of units; harmonisation of reference period;
completion of population; harmonisation of variables; harmonisation of classifications;
adjustment for measurement errors (accuracy); adjustment for missing data; and
derivation of variables.
Second, the validity of a matching exercise depends, to a great extent, on the power of
the common variables to behave as good predictors for the variables to be estimated jointly.
Optimally, the common variables should contain all the associations shared by Y and Z.
Multivariate analysis and modelling techniques need to be implemented for the selection
of common variables.
Finally, matching techniques and related quality assessment can be undertaken. If it
can be assumed that the joint distribution of variables belongs to a family of known
probability distributions (i.e. normal multivariate, multinomial), then parametric
techniques, including the maximum likelihood principle, will usually play a fundamental
role. If no underlying family of distributions can be specified, non-parametric techniques
(hot deck) or mixed matching techniques will have to be used. (For a concise presentation
of the techniques that are more frequently employed, see D’Orazio et al., 2006.)
Quality assessment in matching
Rässler (2002) proposes a multilevel framework for the evaluation of quality in a
statistical matching procedure, based on four levels of validity for a matching procedure:
● First, the true but unknown values of the Z variable of the recipient units are reproduced.
● Second, after statistical matching, the true joint distribution of all variables is reflected
in the statistical matching file.
● Third, the correlation structure and higher moments of the variables are preserved after
statistical matching.
● Fourth, after statistical matching, at least the marginal and joint distributions of
variables in the donor sample are preserved in the statistical matching file.
The first level of quality will not usually be attained unless the common variables
determine the variables to be imputed through an exact functional relationship. The
second and third levels can be checked either through simulation studies or through the
7. INTEGRATED STATISTICS
OECD FRAMEWORK FOR STATISTICS ON THE DISTRIBUTION OF HOUSEHOLD INCOME, CONSUMPTION AND WEALTH © OECD 2013 159
use of auxiliary information. Moreover, the sensitivity of estimates to different
assumptions can be tested through uncertainty analysis techniques. In practice, by using
standard methods, marginal and joint distributions in the matched/real data sets are
derived. This is a minimum requirement of a valid statistical matching procedure, and can
be assessed by similarity tests and indexes for distributions. However, this does not
validate the estimates regarding the joint distributions of the variables that are not
collected together.
For example, suppose that the purpose of the exercise is to have joint information on
income (from source A) and consumption (from source B) based on a set of common
variables. The statistical matching procedure imputes consumption in set A, and the new
synthetic data set should preserve the marginal and joint distributions from the donor file
B. However, this is a necessary but not sufficient condition for the quality of the matched
set. The joint distribution of variables not collected together cannot be assessed through
standard methods applied to observed data sets. Two approaches are proposed by current
studies on statistical matching to take into account these limitations.
The first one focuses on uncertainty analysis techniques that assess the sensitivity of
estimated results to different assumptions (Rubin, 1980; Rässler, 2002; D’Orazio et al., 2006).
In this case, the focus is on the macro objectives (e.g. estimation of specific contingency
tables) rather than on the creation of micro data sets. When the conditional independence
assumption is not satisfied, the model remains unidentified. This implies that there is a
range of values compatible with the information in the data sets that defines the
“uncertainty space” (D Orazio et al., 2006; Rässler 2002; Rässler and Kiesl, 2009). The greater
the explanatory power of the common variables, the lower the level of uncertainty when
creating the common data set.2
The second approach explores the possibility of relaxing the conditional
independence assumption by using auxiliary information. This usually comes in one of the
following types:
● Auxiliary parametric information, obtained from proxy variables; proxy variables can
increase the explanatory power of the common variables and decrease the degree of
uncertainty, and can eliminate it completely in some cases. For example, D’Orazio et al.
(2006) use information on net monthly income by deciles to improve the results for the
estimation of the joint distribution of income and consumption variables.
● A complete data set (C) containing the variables X, Y and Z or only the variables Y and Z(incomplete information).
To overcome the conditional independence assumption, Paass (1986) suggested the
use of additional information in the form of a third data set. A great improvement in
statistical matching was achieved through the development of multiple imputation
procedures that include auxiliary information (Rubin, 1986; Raghunathan et al., 2001; Liu
and Kovacevic, 1998; Singh et al., 1993).
In conclusion, matching applied ex post needs to rely upon several steps to reconcile
sources before being applied. Once the pre-requisites of harmonisation are met, the
reference point for quality assessment is the conditional independence assumption.
Limitations inherent in statistical matching, related to the non-fulfilment of the CIA, need
7. INTEGRATED STATISTICS
OECD FRAMEWORK FOR STATISTICS ON THE DISTRIBUTION OF HOUSEHOLD INCOME, CONSUMPTION AND WEALTH © OECD 2013160
to be addressed through a measure of quality of estimates based on the matched data sets,
using several checks:
● Model diagnostics: Variables used for matching should accumulate as much explanatory
power as possible on the variables to impute, in order to approach the fulfilment of the
conditional independence assumption.
● Comparison of marginal distributions in the real/matched data sets: This can provide a
first quality measure of the matching process and of the robustness of the method used
for imputation.
● Uncertainty analysis: An assessment of uncertainty should also be included in any
matching exercise. The insight provided by the uncertainty analysis can be useful to
assess the plausibility of the conditional independence assumption, to better validate
results, but will most probably characterise a phenomenon in terms of trends or interval
estimates rather than providing punctual estimates.
● Use of auxiliary information: The existence of auxiliary information is essential for any
matching procedure in order to address the potential non-fulfilment of the CIA.
Auxiliary information can help to address the main limitations of matching techniques,
namely the reliance on implicit models.
● Multiple imputation methods: These methods have several advantages, such as reliance
on explicit models (not hidden assumptions), complex data structures and models,
incorporation of auxiliary information and use of standard tools for data analysis.
Recommendations for data collection and design
Several papers have used methods for providing joint information from multiple
independent surveys in an ex post integrated system. Ideally however, planning to enhance
the potential for matching and imputation should be taken ex ante, i.e. in the development
process for data collection. In addition to the direct coincident measurement of the
variable of interest, a number of strategies could be used ex ante to improve the usability of
the sources for data matching:
● Integrated survey models foster the application of matching techniques (Shoemaker,
1973; D’Orazio et al., 2006). First, specific designs (nested surveys) can address the
harmonisation of concepts and variables. A common questionnaire provides basic
information for all units, while modules with specific questions are answered by units in
different subsamples. Integrated designs can enhance the modelling potential for
incorporating “auxiliary” information, such as overlaps of samples, as an integrative part
of the system. The main rationale for these strategies is to relax the reliance on implicit
assumptions about the relationship between variables. Several papers showed that in
a split questionnaire, design data can be successfully imputed (Rässler, 2004;
Raghunathan and Grizzle, 1995). This approach requires that any combination of
variables on which joint distributions are to be estimated must be jointly observed in a
small subsample (to avoid estimation problems due to non-identification). This
facilitates the multiple imputation of missing information, based on good explanatory
models and without relying on the conditional independence assumption.
● Common variables between surveys could used to favour the imputation in relation to
specific objectives. Proxy variables can be used to address the non-fulfilment of the CIA.
For example, an application of statistical matching to estimate the joint distribution of
income and consumption data in Italy relied on a coarse version of income as a common
7. INTEGRATED STATISTICS
OECD FRAMEWORK FOR STATISTICS ON THE DISTRIBUTION OF HOUSEHOLD INCOME, CONSUMPTION AND WEALTH © OECD 2013 161
variable in the imputation process. Some studies have addressed the optimal ex ante
allocation of questions between the various components of the questionnaire, so as to
allow matching and imputation (Shoemaker, 1973; Raghunathan and Grizzle, 1995).
● Consider matching jointly with other options for micro-integration (linking and use of
administrative data). Statistical matching or model-based imputation is applied when
no common identifiers enable linking. However, alternative integration methods can
often complement each other. For example, synthetic data sets (e.g. SPSD in Canada,
SIPP in the United States3) can rely on both linking and matching.
Country experiences
The public benefits of integrated data sets are becoming increasingly recognised in
terms of improved research, supporting government policies, program management and
service delivery.
In official statistics in Europe, statistical matching is mainly at an experimental stage,
and many applications are undertaken in a simulation environment. The ESSnet on Data
Integration4 has pooled experts from several national statistical institutes and provided
both methodological papers and case studies in various fields. This work has built on the
previous experiences of national statistical offices, such as the work described in Box 7.7
for Italy.
Box 7.7. Integrating survey data to compile a Social Accounting Matrix in Italy
The first statistical matching experience conducted by the Italian National Institute ofStatistics (ISTAT) aimed at estimating the household module of the Social AccountingMatrix (SAM). This is a matrix where households are distinguished according to a set ofdifferent typologies such as the area of residence and the primary income source. For thesehousehold typologies, the SAM organises first, the amount of outlays (based on a detailedlist of different expenditure categories), and second, the amount of entries (categorised bycompensation of employees, self-employment income, interest income, dividends, rents).
In Italy, the two main sources for information on household resources and outlays arethe Bank of Italy Survey of Households’ Income and Wealth (SHIW) and the Istat SampleSurvey on Household Consumption (SSHC). The first studies household income andwealth according to the different household resource components. The second estimateshousehold final consumption at a very detailed level, ranging from the acquiringhousehold group to the types of products purchased.
The two surveys are independent and are organised and carried out by two differentinstitutes. Both need to be integrated in order to put together information on householdoutlays from the SSHC and on household resources from the SHIW. This integrationprocess can be carried out by using information on socio-economic characteristicsobserved in both samples. The statistical matching process consists of three steps: first,checking the consistency of the two surveys and, if necessary, harmonising them; second,defining a statistical framework that covers both sample surveys; and third, choosing anappropriate statistical matching method. The first two steps are described in Coli et al.(2005); the last step is described below in a simple way. Only total household entries andoutlays are taken into consideration, with a few common socio-economic variables.
7. INTEGRATED STATISTICS
OECD FRAMEWORK FOR STATISTICS ON THE DISTRIBUTION OF HOUSEHOLD INCOME, CONSUMPTION AND WEALTH © OECD 2013162
Box 7.7. Integrating survey data to compile a Social Accounting Matrix in Italy (cont.)
The harmonisation step
There are a number of inconsistencies between the SHIW and SSHC surveys, which needto be resolved to make the surveys comparable, and to allow integrating them through theharmonisation of the definitions of the population, the units and the variables.
The harmonisation phase consists of a “simplification” of a set of key characteristics ofthe surveys. This operation produces changes in the original variables, i.e. changes in thedefinition of the population target and in the informative power of the samples. Statisticalmatching output is greatly affected by these operations; a rule of thumb is to change aslittle as possible during the harmonisation step.
The target populations of the two surveys are Italy’s households. However, the surveysuse two different definitions of the household. The SSHC defines a household as a set ofcohabitants, linked by marriage, familiarity, affinity and adoption. The SHIW defines ahousehold as a set of people who completely or partially combine their revenues for theirnecessities. This inconsistency is difficult to resolve, because the two surveys do notcontain enough information to create an SHIW household out of one or more SSHChouseholds, or vice versa. Coli et al. (2005) consider this as a minor problem, because thetwo populations almost overlap, i.e. both the set of SHIW households inconsistent with theSSHC definition and the set of SSHC households inconsistent with the SHIW definition arevery small. Furthermore, apart from the definition, the samples did not containinconsistent households. Hence, both the SHIW and SSHC were assumed to be samplesdrawn from the same population, defined as the intersection of the two previouspopulation definitions.
For variable harmonisation, although the SHIW and SSHC investigate two differentaspects of the household economic situation, they include a large set of common variables.These variables can be clustered into three groups: socio-demographic variables, variableson household outlays and variables on household resources. The overall definition of thesevariables is usually inconsistent or, when the overall definition coincides, theircategorisation is inconsistent (number and type of states of a variable). In this case,variable harmonisation uses different strategies; first, some variables cannot beharmonised (i.e. they are not useful for the statistical matching of the two samples);second, some new variables replace the original ones, by appropriate transformations; andthird, some variables are just recoded.
The first group, the socio-demographic variables, contains the variable “head of household”.This variable is very important, because one of the socio-economic groupings of households inthe SAM consists of the households grouped according to characteristics of the head of thehousehold (e.g. age, gender, education, and work status). The justification for groupinghouseholds according to the characteristics of the household head is that these characteristicsare usually correlated with both the household’s outlays and resources. However, one surveydefines the household head as the person registered on the public archives, while the otherdefines it as the person responsible for the household budget. The two surveys do not containenough information to harmonise such definitions. Hence, the head of the household and his/her characteristics were disregarded during the matching of the two samples. Once the twosamples are matched, the characteristics of the head of the household of the SSHC weremaintained and used for the analyses. This operation hides the notion of conditionalindependence between the head of the household characteristics and the variables of theSHIW that are not common with the SSHC.
7. INTEGRATED STATISTICS
OECD FRAMEWORK FOR STATISTICS ON THE DISTRIBUTION OF HOUSEHOLD INCOME, CONSUMPTION AND WEALTH © OECD 2013 163
Box 7.7. Integrating survey data to compile a Social Accounting Matrix in Italy (cont.)
Many of the variables in the second group, the household outlay variables, describehousehold characteristics, in particular the socio-economic characteristics of differenthousehold members. These characteristics are better used if defined at the householdlevel rather than at the individual level. For instance, additional variables such as thenumber of household members meeting different criteria (age 64 or over, employed,graduate, female) have been introduced. These variables were considered during thematching process. The head of the household characteristics, previously disregarded in thematching phase, is independent of income and expenditures, given the socio-economiccharacteristics of all the components.
For the last group of variables, on household resources, the two surveys contain manyvariables based on different categorisations. The harmonisation step consists of defining acommon categorisation given by the largest categories they have in common.
Modelling the social accounting matrix
The statistical formalisation of the construction of the SAM is explained by Coli et al.(2005). The main objective is to construct a table representing the totals for differentconsumption categories (e.g. food consumption, durable goods) and different sources ofincome for many household types. Since the two surveys are carried out with two differentobjectives, the variables representing consumption in the SHIW and income in the SSHCpresent coarse categorisations. Furthermore, while consumption in the SHIW is not veryreliable, income as observed in the SSHC can be considered as a shifted distribution of theactual income, affected by under-representation. For this reason, the idea was to considerincome as observed in the SSHC as a good source of information in order to preserve asmuch as possible the relationship between consumption and income as observed in theSSHC. The idea was that income as observed in the SHIW and expenditures as observed inthe SSHC are independent, given a set of common social characteristics and a coarsenedversion of income, where only the order between income observations (rather than itsvalue) was maintained. This coarsened version of income was obtained by categorising thetwo distributions in categories ordered from the poorest to the richest household,containing an equivalent number of households in the two surveys.
Imputation method
The final step was the creation of the matched data set using imputation techniques.The data set with all the variables jointly present was created by imputing the SHIWmissing variables (completely non-observed) using values taken from the SSHC data set. Inother words, the SHIW is the recipient file and the SSHC is the donor file. The imputationwas done through the distance hot-deck stratified method, which means that the missingvalues were imputed with the conditional mean (conditional to the parameters used in thecomputation of the distance). Strata were defined using the coarsened income classes anda socio-economic variable. Inside these imputation classes, donors are chosen according todistance variables among the other common variables X. The choice of the SHIW asrecipient file and of the SSHC as donor file is due to the fact that the SSHC contains manymore observations than does the SHIW data set. This choice is justified by the goodbehaviour of non-parametric estimates in terms of asymptotic properties.
Source: Coli et al. (2005); D’Orazio et al. (2002); and Rässler (2002).
7. INTEGRATED STATISTICS
OECD FRAMEWORK FOR STATISTICS ON THE DISTRIBUTION OF HOUSEHOLD INCOME, CONSUMPTION AND WEALTH © OECD 2013164
In Australia, recognising the potential significance of the uses of integrated data sets
and the likelihood that the use of data-matching techniques for statistical purposes will
increase in the future, the government released a set of principles aimed at facilitating data
matching for statistical and research purposes within a safe and effective environment
(Australian Government, 2010). The seven key principles are:
● Strategic resource. Administrative data represents a public asset, and existing and new
data sets should be utilised to maximise statistical and research use.
● Custodian’s accountability. Agencies responsible for source data used in statistical data
integration remain individually accountable for their security and confidentiality.
● Integrator’s accountability. Accredited authorities are responsible for managing the data
integration project from start to finish, in line with the agreements made with data
custodians and the requirements specified as part of the approval process.
● Public benefit. Statistical integration should occur only where it provides significant
overall benefit to the public, i.e. where the public good outweighs the privacy imposition
and risks to confidentiality.
Box 7.8. The use of income and wealth data from administrative sources in the Netherlands
Netherlands Statistics has collected income data from administrative sources since1977. Most data stem from the tax authorities. The data collection was restricted to asample of persons and their household members. In this way, income statistics have beencompiled on a cross-sectional base for 1977, 1981 and 1985. From 1989 onwards the samplechanged into a yearly panel survey; every year, a sample of the newborn and immigrants isadded to this longitudinal panel. Wealth data from administrative sources were addedfrom 1993 onwards to this same panel, so that income and wealth statistics could beintegrated easily.
Since 2001, income and wealth data have been available yearly for the whole population.The complete data set will soon be used to compile regional income statistics. Statistics onthe national level will continue to be based on the panel sample for the time being: moredetail and the necessary imputations are easier to handle in a smaller sample.
Since complete income (and wealth) data are available, questions about income havebeen dropped in questionnaires and replaced (with informed consent) by data fromadministrative sources. Although the sample of the Budget Survey is much smaller anddoes not coincide with the longitudinal sample of the Income statistics, the use ofadministrative data has improved the quality of the integration of both statistics. Asbefore, results from the income statistics have been used as a benchmark in the weightingprocess of the Budget Survey, but now the connecting data stem from the same(administrative) source.
Statistics on the real income of population sub-groups receive substantial attention in theNetherlands. These statistics show the “dynamic” income change that people experience dueto changes in prices and in the tax burden, but also due to events such as job promotion,retirement, and changes in household composition. A longitudinal panel makes it possible tocalculate these income changes on an individual level. In general, the mean (or preferablymedian) of individual income changes differs from the change in average income.
The concept adopted in this statistic is standardised disposable household incomeadjusted for price changes as measured by the consumer price index.
7. INTEGRATED STATISTICS
OECD FRAMEWORK FOR STATISTICS ON THE DISTRIBUTION OF HOUSEHOLD INCOME, CONSUMPTION AND WEALTH © OECD 2013 165
Box 7.9. Experience of the United Kingdom with statistical matching
As part of the EU-funded 2nd Network for the Analysis of EU-SILC (NetSILC2), the UKOffice for National Statistics (ONS) is leading a project that aims to statistically matchindividual records from the EU Statistics on Income and Living Conditions (EU-SILC) surveywith those from the Household Budget Survey (HBS) in order to compare income,expenditure and material deprivation across a range of EU countries. The approach takento statistical matching draws on D’Orazio et al. (2006) and is consistent with theconclusions of the ESSNet on Data Integration.
Three different approaches to statistical matching were employed: hotdeck (non-parametric), parametric and mixed methods. Testing the validity of these matchingprocedures involved comparing the distributions of the matched variables againstobserved expenditures observed in the HBS. This was done in four ways:
● Comparing mean expenditure by expenditure decile, to analyse the consistency of thedistribution of overall expenditure for each method.
● Using estimates (based on the Hellinger Distance) of the similarity of the jointdistributions of the matching variables with expenditure (observed and imputed).
● Comparing the consistency of mean expenditure by variables used in the statisticalmatching for observed and imputed expenditure.
● Comparing the relationship between expenditure and variables in both data sets but notincluded in the model.
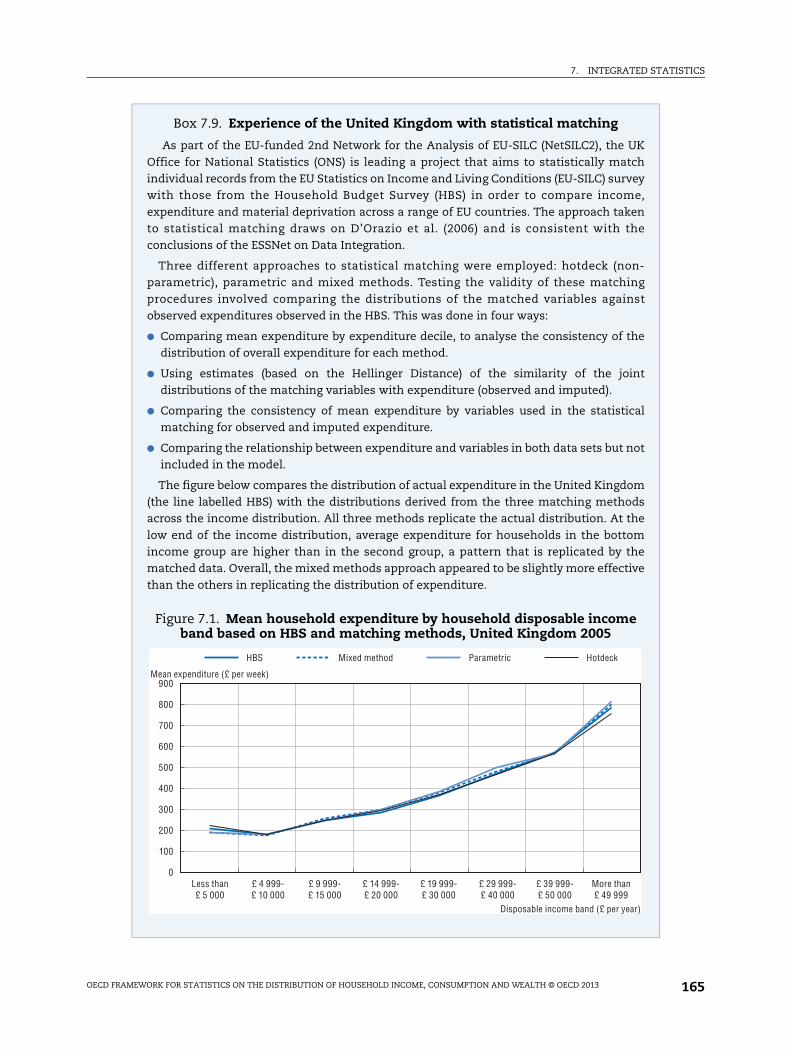
The figure below compares the distribution of actual expenditure in the United Kingdom(the line labelled HBS) with the distributions derived from the three matching methodsacross the income distribution. All three methods replicate the actual distribution. At thelow end of the income distribution, average expenditure for households in the bottomincome group are higher than in the second group, a pattern that is replicated by thematched data. Overall, the mixed methods approach appeared to be slightly more effectivethan the others in replicating the distribution of expenditure.
Figure 7.1. Mean household expenditure by household disposable income band based on HBS and matching methods, United Kingdom 2005
900
800
700
600
500
400
300
200
100
0
HBS Mixed method Parametric Hotdeck
Mean expenditure (£ per week)
Less than£ 5 000
£ 4 999-£ 10 000
£ 9 999-£ 15 000
£ 14 999-£ 20 000
£ 19 999-£ 30 000
£ 29 999-£ 40 000
£ 39 999-£ 50 000
More than£ 49 999
Disposable income band (£ per year)
7. INTEGRATED STATISTICS
OECD FRAMEWORK FOR STATISTICS ON THE DISTRIBUTION OF HOUSEHOLD INCOME, CONSUMPTION AND WEALTH © OECD 2013166
● Statistical and research purposes. Statistical integration must be used for statistical and
research purposes, other than regulatory purposes, compliance monitoring or service
delivery, to minimise the risk of privacy breaches.
● Preserving privacy and confidentiality. Policies and procedures used in data integration must
minimise any potential impact on privacy and confidentiality. For example, personal
identifiers should be removed from data sets as soon as they are no longer required to
meet the statistical integration phase of the project.
● Transparency. Statistical data integration should be conducted in an open and accountable
way to ensure that the public is aware of how government data are being used for statistical
and research purposes.
Box 7.9. Experience of the United Kingdom with statistical matching (cont.)
In order to test the plausibility of the Conditional Independence Assumption, Fréchetbounds were calculated for the contingency table between material deprivation andexpenditure. Fréchet bounds are tools for uncertainty analysis that can be used to estimatethe range of plausible values that a parameter can hold.
The experience gained from this statistical matching based on data sets that were notdesigned to be used in this way has highlighted the challenges associated with ex postmatching. In particular, the range of matching variables that was available was limited dueto a lack of harmonisation in the concepts and categories used in the two sources, whichresulted in differences in the distributions of these variables. This experience will informthe future development of EU-SILC and other surveys in order to facilitate statisticalmatching.
Box 7.10. Statistical matching in Finland
Statistics Finland conducted a household wealth survey four times between 1988 and2004. Unlike the previous three wealth surveys, the survey for 2009 was carried out usingthe so-called register method without separate data collection by interviews. This methoddraws on sample material from Statistics Finland’s income and living conditions survey,which covered 27 009 persons and 10 989 households, and numerous types of register dataand estimation methods. Using existing statistics considerably reduces the resourcesneeded for forming and editing income and background variables.
The annual income and living conditions survey gathers data on household and individualincome, as well as on other factors affecting subsistence and living conditions. The majority ofdemographic and income variables were obtained directly from the database of that survey.The sampling design and the weighting methods of the survey on income and livingconditions are also suitable for the wealth survey (probability sample stratified to over-samplehigh-income households). All the personal data from various registers can be linked to theincome distribution statistics sample using personal identity codes.
The main balance sheet variables used in the previous national wealth survey and in thewealth concept of the Eurosystem Household Finance and Consumption Survey (HFCS)could be obtained from registers, either directly or by means of estimation. In addition,price indices and other pricing models were used to appraise several variables. However,the register method cannot elicit all data to the same extent as the previous nationalwealth survey, or all the wealth data required by the HFCS.
7. INTEGRATED STATISTICS
OECD FRAMEWORK FOR STATISTICS ON THE DISTRIBUTION OF HOUSEHOLD INCOME, CONSUMPTION AND WEALTH © OECD 2013 167
Box 7.10. Statistical matching in Finland (cont.)
The detailed methodology used for the construction of balance sheet and incomevariables is as follows:
Real assets
The value of the main residence was estimated by using the data describing buildings anddwellings in the Population Information System and the data in the Tax Administration’shousing company stock register. Housing wealth values were estimated using transactionsale prices. The main residence was identified as the one reported in the survey, and itsvaluation was based on two methods. For blocks of flats, the purchase prices were linkedfrom asset transfer tax data and deflated to the 2009 value. For other dwelling types,average market prices by strata from dwelling price statistics were multiplied by self-reported floor areas. For both types of valuation, a matching dwelling and its attributeswere identified from the register sources for record linkage or to create the strata,controlling for differences e.g. in floor area.
The values of other properties (residential investment properties, secondary or holidayhomes) were estimated using data describing buildings and dwellings in StatisticsFinland’s population statistics data reserve not including the main residence. In addition,data in the housing company stock register were also used. In the Finnish wealth statistics,the sub-classes of other properties cover dwellings for own use, or rented or leased toothers (investment real estate).
The values of cars, vans and motorcycles were estimated using data in the VehicleRegister maintained by the Finnish Transport Safety Agency and the MAHTI price systemmaintained by the National Board of Customs. Based on the manufacturer’s ID andregistration of the vehicle, the Vehicle Register data were linked to the price register datamaintained by the Customs. The vehicle price data were formed from asking pricescalculated by the Customs for taxation purposes. Only cases where the person was the firstowner of a vehicle were taken into consideration.
For non-taxable vehicle categories, mopeds, motor tricycles and quadricycles,snowmobiles and trailers are included in Other vehicles. The ownership data for thesevehicles are based on the same register as the data on cars, vans and motorcycles. Thevalues of boats were formed based on price data obtained from the Boat Registeradministrated by the Local Register Office of Vaasa and websites advertising boats for sale.Buses, trucks, tractors and forestry machines were excluded from the wealth concept ofthis survey.
The values of both forest and farm land were estimated based on the forest propertyregister administrated by Statistics Finland using the average comparison value of the landby municipality. Only land areas owned by natural persons were taken into account in theforest property register. Consequently, property such as forest land owned by an estate wasexcluded from the survey.
The values of unlisted shares are included in self-employment business wealth, as nodistinction between self-employment and non-self-employment businesses can be made.The values of unlisted shares were estimated on the basis of dividend data obtained fromindividual taxation material. This method permits only the estimation of the businesswealth of those persons who received dividends from unlisted companies in the tax year2009. The value of the share was obtained by dividing the company’s net worth (assets lessliabilities) by the number of shares.
7. INTEGRATED STATISTICS
OECD FRAMEWORK FOR STATISTICS ON THE DISTRIBUTION OF HOUSEHOLD INCOME, CONSUMPTION AND WEALTH © OECD 2013168
Box 7.10. Statistical matching in Finland (cont.)
Financial assets
At the micro level, no data on household deposits or any other reliable sources fromwhich the data could be derived (e.g. interest received) are available in registers, sointerviews offer the only possibility of gathering data on these. The most recent datacollected by interviews were gathered in the Wealth Survey of 2004, so using this was theonly way to estimate deposits. The samples of the 2004 Wealth Survey and the incomedistribution statistics of 2009 cannot be record linked, because they contain completelyseparate sets of individuals. Thus, deposits for the 2009 survey were estimated usingstatistical matching, with the 2004 sample serving as the donor and the 2009 sample as therecipient.
Information on the ownership of listed shares and bonds are based on register data onbook-entry securities obtained from the Tax Administration, from which the number ofindividual shares owned by households can be identified and linked to the survey data.The values of listed shares were based on book-entry securities data and OMX price data.
Data on investments in mutual funds were obtained from the payroll and pensionsregister. Individual pension plans entitlements were estimated based on the individual taxregister using the perpetual inventory method. Individual pension plan contributions(investments) and, respectively, pension payments received from 1990 onwards, areavailable in the tax register. The values of individual pension plans were derivedcumulatively from these flow data, as well as from an annual estimate of the derived yieldearned by net investment to date (accumulated contributions less payments received).
Liabilities and income
In Finland, variables on income, liabilities and debt payments can be collected fromvarious registers. The income concept of the HFCS is marginally less detailed than in theEU-SILC, but the two statistics largely include the same concepts.
For liabilities, the HFCS distinguishes between collateralised (secured, mortgages) andnon-collateralised debt. In the Finnish wealth statistics, measurement is based on thepurpose of the loan, as available in the tax registers: housing loans, education loans, andother loans. The mapping between loans and collaterals is not one-to-one, as loans mayhave many types of collateral, including the household’s real and financial assets, personalcollateral from other households (e.g. parents) or the state (e.g. educational loans,mortgages for own home).
Debt flows are related to interest repayments, with those on business and investmentloans deducted from self-employment income and actual rents. Interest repayments onhousehold main residence mortgages are deducted only if imputed rents are included inincome (i.e. only in the national income concept). Interest repayments on consumptionloans are not deducted but considered as consumption.
Most income variables were collected directly from registers, with the exception ofregular private transfers, which are mostly collected in the EU-SILC. The main registersources are: the tax register and various registers from the Social Insurance Institution inFinland; the register for the earnings-related pension scheme of the Finnish Centre forPensions; and the social assistance registers of the National Institute for Health andWelfare.
Source: Törmälehto, Kannas and Säylä (2012).
7. INTEGRATED STATISTICS
OECD FRAMEWORK FOR STATISTICS ON THE DISTRIBUTION OF HOUSEHOLD INCOME, CONSUMPTION AND WEALTH © OECD 2013 169
SummaryThe key highlights from this chapter can be summarised as follows:
● In the past, income has been the most frequently used indicator of households’
economic well-being, since income data are relatively easy to collect and because
income is the most important economic resource for meeting everyday living expenses.
Income should, therefore, always be collected as a primary topic in any study of
household economic well-being.
● It is important to analyse income alongside other dimensions of economic well-being.
Many countries undertake integrated collections of income and expenditure data, and
some have been doing so for many years. Collecting information on household income,
consumption and wealth simultaneously is challenging, but it has been successfully
undertaken by some statistical agencies.
● Wealth data are best collected in an integrated survey with income. Many countries
collect income data either annually or every two years, and the same frequency is
therefore recommended for the collection of wealth data. Expenditure data should be
collected at least once every five years.
● Integrated data on income, consumption and wealth are best collected by interview, with
some items collected at the individual level and others (e.g. rent) at the household level.
However, personal diaries are recommended for the collection of expenditure items that
are frequently purchased such as food, personal care products and household supplies.
● Interviews are usually conducted with the aid of computer-assisted interviewing tools.
When income, wealth and expenditure are collected together, it is preferable to design
the questionnaire in an integrated manner rather than having separate modules.
● Thorough research should be carried out to find and identify the most suitable sampling
frame for surveys of income, consumption and wealth. It is necessary to determine the
number of stages, the optimum stratification and other salient features of the sample to
be used, as well as the best procedures for selection of the sample units. It may be
necessary to take specific steps to ensure adequate representation of particular groups
of interest, especially when these are small in size.
● A number of steps can be taken to maximise response while also considering response
burden.
● Administrative data sources may be available to supplement data reported in household
surveys. It may also be possible to bring together data from two or more household
surveys. Data from multiple sources are combined by data matching. If the different
sources contain information about the same individuals or households, the records can
be linked by using common identifiers, if available, or by probabilistic record-linking
techniques. If the different sources contain information about mostly or entirely
different individuals or households, records can still be matched by using statistical
matching techniques.
● Statistical matching assumes that the individuals or households in the source files are
representative of the same or very similar populations. It also depends on a number of
other assumptions that need to be borne in mind when using the technique, and it is
important to undertake relevant quality assessments.
7. INTEGRATED STATISTICS
OECD FRAMEWORK FOR STATISTICS ON THE DISTRIBUTION OF HOUSEHOLD INCOME, CONSUMPTION AND WEALTH © OECD 2013170
Notes
1. The following is a list of the types of documents that are useful to refer to during income,expenditure and wealth surveys: payslip or payment summary from employer; statement frompension fund; statements on government pension, benefit or allowance; statements fromaccounts held at banks and other financial institutions; credit card statements; statementsshowing returns on investments such as share holdings, bonds, debentures and trusts; businesstax returns for own businesses; personal income tax return; student loan liability statement;statements on loan accounts; receipts for household durables purchased in the relevant reportingperiod; invoices for land, water, sewerage and general rates; electricity and/or gas accounts;invoices for telephone accounts (including mobile phones); internet service provider and pay TVaccounts; contents and/or building insurance statement; child support/alimony paymentinformation; child care receipts/bills/statements; vehicle registration and insurance payments forthe last 12 months; school fees/receipts for the last 12 months; private health insurance paymentinformation, receipt for personal insurance payments (e.g. accident, sickness, life insurance) andstatement of entitlements in life insurance funds; and medical or health bills for the relevantreporting period.
2. One approach explored by the ESSnet on Data Integration is to build a measure of the degree ofuncertainty in the problem by using Fréchet bounds. When dealing with categorical variables,Fréchet classes are used to estimate the plausible values for the distribution of the randomvariables (Y, Z/X) compatible with the available information. Another way to estimate thesensitivity of results to different assumptions about the correlation structure is to use multipleimputed data sets, produced according to different values for the conditional association (Rässlerand Kiesl, 2009). This process is repeated with different initial values, in order to fix bounds for theunconditional parameter. An advantage of multiple imputation is that it provides point andinterval estimates under a fairly general set of conditions (Rubin, 1987). Confidence intervals arecomputed based on both between and within imputations: the variance between imputationsreflects variability due to modelling assumptions, the variance within imputations reflects samplevariability. Hence, more than one random draw should be made under each model to reflectsample variability.
3. www.census.gov/sipp/synth_data.html.
4. www.essnet-portal.eu/di/data-integration.
From:OECD Framework for Statistics on the Distributionof Household Income, Consumption and Wealth
Access the complete publication at:https://doi.org/10.1787/9789264194830-en
Please cite this chapter as:
OECD (2013), “Integrated statistics”, in OECD Framework for Statistics on the Distribution of HouseholdIncome, Consumption and Wealth, OECD Publishing, Paris.
DOI: https://doi.org/10.1787/9789264194830-10-en
This work is published under the responsibility of the Secretary-General of the OECD. The opinions expressed and argumentsemployed herein do not necessarily reflect the official views of OECD member countries.
This document and any map included herein are without prejudice to the status of or sovereignty over any territory, to thedelimitation of international frontiers and boundaries and to the name of any territory, city or area.
You can copy, download or print OECD content for your own use, and you can include excerpts from OECD publications,databases and multimedia products in your own documents, presentations, blogs, websites and teaching materials, providedthat suitable acknowledgment of OECD as source and copyright owner is given. All requests for public or commercial use andtranslation rights should be submitted to [email protected]. Requests for permission to photocopy portions of this material forpublic or commercial use shall be addressed directly to the Copyright Clearance Center (CCC) at [email protected] or theCentre français d’exploitation du droit de copie (CFC) at [email protected].