A Profile of Student Performance in Reading | OECD iLibrary
90
A Profile of Student Performance in Reading 2 PISA 2009 RESULTS: WHAT STUDENTS KNOW AND CAN DO – VOLUME I © OECD 2010 31 What can 15-year-olds do as readers? This chapter compares student performance in reading across and within countries. It discusses the PISA definition of the term reading literacy and the reading tasks associated with each PISA proficiency level. The chapter then digs deep into the reading results, showing gender differences in reading skills, and detailing the levels of student proficiency in various aspects of reading, such as students’ ability to access and retrieve, integrate and interpret, and reflect and evaluate the information they obtain through reading. It also discusses students’ ability to read and understand continuous and non-continuous texts.
-
Upload
khangminh22 -
Category
Documents
-
view
3 -
download
0
Transcript of A Profile of Student Performance in Reading | OECD iLibrary

A Profile of Student Performance
in Reading
2
PISA 2009 ReSultS: WhAt StudentS KnoW And CAn do – Volume I © OECD 2010 31
What can 15-year-olds do as readers? This chapter compares student performance in reading across and within countries. It discusses the PISA definition of the term reading literacy and the reading tasks associated with each PISA proficiency level. The chapter then digs deep into the reading results, showing gender differences in reading skills, and detailing the levels of student proficiency in various aspects of reading, such as students’ ability to access and retrieve, integrate and interpret, and reflect and evaluate the information they obtain through reading. It also discusses students’ ability to read and understand continuous and non-continuous texts.

2A PROFILE OF STUDENT PERFORMANCE IN READING
32 © OECD 2010 PISA 2009 ReSultS: WhAt StudentS KnoW And CAn do – Volume I
What do 15-year-olds around the world know and what can they do as readers? Can they find what they need in written texts, interpret and use the information, and reflect upon it critically in relation to their own experience and understanding? Can they read different kinds of texts for different purposes and in a variety of contexts, either for personal interest and satisfaction or for practical reasons? the assessment of reading in PISA 2009 sets out to answer these questions.
Since reading was the main focus of the PISA 2009 assessment, more detailed probing is possible than was the case in PISA 2003 and PISA 2006, when a relatively small amount of testing time was devoted to reading. In PISA 2009, three-and-a-half hours of test material were dedicated to assessing reading in each participating country. Reading is the first of the assessment areas to be revisited as a major focus of PISA. As such, a full review of the assessment framework and development of assessment instruments was undertaken.1 A comparison of students’ performance in reading over the period 2000 to 2009 is provided in Volume V, Learning Trends.
Box I.2.1 Reading performance and success in adult life
It is now well established that education is associated with enhanced life experience at many levels. earnings increase with each level of education completed, and the advantage increases with age (oeCd, 2010d). the non-economic returns from education in the form of better health and greater social cohesion, indicated by cultural and political participation, are regarded as important benefits alongside economic and labour-market returns. education is often also considered to contribute to quality of life in its own right.2
levels of reading literacy are more reliable predictors of economic and social well-being than is the quantity of education as measured by years at school or in post-school education. the oeCd report, The High Cost of Low Educational Performance,3 uses data from PISA and other international assessments to demonstrate that it is the quality of learning outcomes, not the length of schooling, that makes the difference.
the relationship between PISA reading literacy scores and subsequent life outcomes in Canada is also documented in the oeCd report Pathways to Success: How Knowledge and Skills at Age 15 Shape Future Lives in Canada.4 tracking Canadian students who had taken part in the PISA 2000 reading assessment, the study found that, after adjusting for background variables such as parental, school, demographic and geographic factors, proficiency on the PISA reading literacy scale was associated with a significantly higher likelihood of continuing in education, rather than making the transition to work, or inactivity, by the age of 21.
Mark in reading
% %
• Figure I.2.a •Likelihood of participation in tertiary education among 21-year-old Canadians, as associated with their PISA reading proficiency and school marks at age 151, 2
PISA reading proficiency
1. After accounting for school engagement, gender, mother tongue, place of residence, parental, education and family income. 2. The reference group for the PISA reading proficiency levels is Level 1, and for the marks in reading it is the group that obtained less than 60%.Source: OECD, 2010a.
0 5 10 15 20 250510152025
Level 5
Level 4
Level 3
Level 2
90%-100%
80%-90%
70%-80%
60%-70%
1 2 http://dx.doi.org/10.1787/888932343133

2A PROFILE OF STUDENT PERFORMANCE IN READING
PISA 2009 ReSultS: WhAt StudentS KnoW And CAn do – Volume I © OECD 2010 33
Given the broad range of life experiences with which literacy is associated, including health, well-being, and cultural and political participation, and given that the aim of PISA is to measure how well education systems are preparing young people for life, the PISA assessment was developed to represent a wide and deep conception of reading. the PISA conception of reading literacy aims to encompass the range of situations in which people read, the different forms in which written text is presented, and the variety of approaches that readers bring to texts, from the functional and finite, such as finding a particular piece of practical information, to the more expansive: reading to learn and understand other ways of doing, thinking and being.
this chapter begins by explaining how PISA measures and reports student performance in reading, and then presents the results of the assessment, showing what students know and can do as readers in different countries. this section is followed by a discussion of the results in reading by gender, examining areas of relative strength and weakness for boys and girls. While the chapter mainly reports on the assessment of reading in the print medium, it also includes a brief section on the assessment of reading digital texts.
Although PISA conceives of reading both print and digital media as a single construct, the results are reported separately in order to allow countries to observe differences in their students’ reading performance across the two media. this may prompt discussions about policy changes in resourcing, curriculum and pedagogy. Reading digital texts is different from reading printed texts in important respects: in the small amount of text visible to the reader at any moment, in the amount of text available to the reader, beyond what is immediately visible, and in its demand for using a range of unique navigation tools and features. While this volume focuses on print texts, the reading of digital texts and its relationship with print reading are presented in Volume VI, Students On Line. the term “reading” used throughout this report denotes the reading of texts printed on paper, unless otherwise specified as digital or electronic reading.
the study also found reading scores of 15-year-old students were an important predictor of earnings for both males and females.
While the Canadian study reported longitudinal data only up until the age of 21, a time when many young adults have not yet begun their careers, the benefits to human capital as measured by the PISA reading literacy scale are likely to continue into adulthood.
data from national and international surveys of adults conducted over the past 20 years both support and extend the findings shown by Canada. literacy and numeracy skills have become a currency in modern societies around the world. those with below-average skills cannot hope to earn above-average wages in an increasingly global economy. According to a growing body of data, literacy and numeracy skills influence whether or not individuals will graduate from high school and, if so, whether and where they will go on to higher education. these skills also seem to influence what individuals choose to study in higher education and their persistence in earning a degree. A university degree, along with literacy and numeracy skills, is also important in influencing the type of job individuals obtain, as well as the wages and annual income they earn. literacy and numeracy skills are not only connected with economic returns. data show that these skills are also associated with the likelihood that individuals will participate in lifelong learning, keep abreast of social and political events, and vote in national elections. other data suggest that literacy links education and health and may contribute to the disparities that have been observed in the quality of healthcare that many people receive.

2A PROFILE OF STUDENT PERFORMANCE IN READING
34 © OECD 2010 PISA 2009 ReSultS: WhAt StudentS KnoW And CAn do – Volume I
A CONTExT FOR COMPARING ThE PERFORMANCE OF COUNTRIES
Comparing reading performance, and educational performance more generally, poses numerous challenges. When teachers give a reading test in a classroom, they require students with varying abilities, attitudes and social backgrounds to respond to the same set of tasks. When educators compare the performance of schools, they give the same tests across schools that may differ significantly in the structure and sequencing of their curricula, their pedagogical emphases and instructional methods, as well as the demographic and social contexts of their student populations. Comparing the performance of education systems across countries adds further layers of complexity, because students are given tests in different languages and because the social, economic and cultural context of the countries that are being compared can be very different. however, while different students within a country may learn in different contexts according to their home background and the school that they have attended, they are subjected to common tests and exams because in adult life they will all face common challenges, having to compete for the same jobs. Similarly, in a global economy, the benchmarks for educational success are no longer national standards alone, but increasingly, the best performing education systems internationally. As difficult as international comparisons are, they are important for educators, and PISA has made significant efforts to ensure that such comparisons are valid and fair.
this section discusses countries’ reading performance in the context of important economic, demographic and social factors that can influence assessment results, so as to provide a framework for interpreting the results that are presented later in the chapter.
As shown in Volume II, Overcoming Social Background, a family’s wealth influences the educational performance of children, but that influence varies markedly across countries. Similarly, the relative prosperity of some countries allows them to spend more on education, while other countries find themselves constrained by a lower national income. It is therefore important to keep the national income of countries in mind when comparing the performance of education systems across countries. Figure I.2.1 displays the relationship between national income as measured by the per capita Gross domestic Product (GdP) and students’ average reading performance.5 the figure also shows a trend line6 that summarises the relationship between per capita GdP and mean student performance in reading among oeCd countries. the scatter plot suggests that countries with higher national incomes tend to perform better in reading. the relationship suggests that 6% of the variation between the oeCd countries’ mean scores can be predicted on the basis of their per capita GdP. Countries with higher national incomes are thus at a relative advantage, even if the chart provides no indications about the causal nature of this relationship. this should be taken into account particularly when interpreting the performance of countries with comparatively low levels of national income, such as mexico, Chile and turkey. table I.2.20 shows an “adjusted” score that would be predicted if the country had all of its present characteristics except that per capita GdP was equal to the average for oeCd countries.
While per capita GdP reflects the potential resources available for education in each country, it does not directly measure the financial resources actually invested in education. Figure I.2.2 compares countries’ actual spending per student, on average, from the age of 6 up to the age of 15, with average student performance in reading.7 the results are expressed in uSd using purchasing power parities. Figure I.2.2 shows a positive relationship between spending per student and mean reading performance among oeCd countries. As expenditure on educational institutions per student increases, so does a country’s mean performance. expenditure per student explains 9% of the variation in mean performance between countries and relatively low spending per student needs to be taken into account when interpreting the performance of countries such as turkey, mexico or Chile. At the same time, deviations from the trend line suggest that moderate spending per student cannot automatically be equated with poor performance by education systems. For example, estonia and Poland, which spend around 40 000 uSd per student, perform at the same level as norway, Switzerland and the united States, which spend over 100 000 uSd per student. Similarly, new Zealand, one of the highest performing countries in reading, spends well below the average per student.
Given the close interrelationship between a student’s performance and his or her parents’ level of education, it is also important to bear in mind the educational attainment of adult populations when comparing the performance of oeCd countries, as countries with more highly educated adults are at an advantage over countries where parents have less education. Figure I.2.3 shows the percentage of 35-44 year-olds that have attained tertiary level of education. this group roughly corresponds to the age group of parents of the 15-year-olds assessed in PISA and how this relates to reading performance.

2A PROFILE OF STUDENT PERFORMANCE IN READING
PISA 2009 ReSultS: WhAt StudentS KnoW And CAn do – Volume I © OECD 2010 35
0 5 10 15 20 25 30 35 40 45 50 55 60
Score
Rank on own preferred new PISA 2009 questions and link questions from previous cycles
GDP per capita (in thousand USD, converted using PPPs)
Percent-correct rank based onall PISA 2009 questions
• Figure I.2.1 •Reading performance and GDP
Source: OECD, PISA 2009 Database, Table I.2.21.Source: OECD, PISA 2009 Database, Table I.2.20.
Source: OECD, PISA 2009 Database, Table I.2.20. Source: OECD, PISA 2009 Database, Table I.2.20.
Source: OECD, PISA 2009 Database, Table I.2.20. Source: OECD, PISA 2009 Database, Table I.2.20.
0 5 10 15 20 25 30 35 40 45 50 55 60
550
525
500
475
450
425
400
60
50
40
30
20
10
0
• Figure I.2.3 •Reading performance and parents’ education
• Figure I.2.2 •Reading performance and spending on education
• Figure I.2.5 •Reading performance and proportion of students
from an immigrant background
• Figure I.2.4 •Reading performance and share
of socio-economically disadvantaged students
• Figure I.2.6 •Equivalence of the PISA test
across cultures and languages
Score
Cumulative expenditure(in thousand USD, converted using PPPs)
0 10 20 30 40 50 60 70
0 10 20 30 40 50 60 70
80 11090 100
550
525
500
475
450
425
400
Score550
525
500
475
450
425
400
Percentage of the populationin the age group 35-44with tertiary education
Proportion of 15-year-olds withan immigrant background
0 10 20 30 40 50 60
Score
Share of students whose PISA index of economic,social and cultural status is below -1
550
525
500
475
450
425
400
0 5 10 15 20 25 30 454035
Score
550
525
500
475
450
425
400
Countries move upin the ranking if their preferred questions were used
Countries move downin the ranking if their
preferred questions were used
y = 0.0004x + 479.77R² = 0.05909
y = 1.3609x + 451.67R² = 0.44574
y = 0.2772x + 490.6R² = 0.01264
y = -1.1306x + 510.23R² = 0.46407
y = 0.0002x + 476.8R² = 0.09086
1 2 http://dx.doi.org/10.1787/888932343133
1 2 http://dx.doi.org/10.1787/888932343133
1 2 http://dx.doi.org/10.1787/888932343133
1 2 http://dx.doi.org/10.1787/888932343133
1 2 http://dx.doi.org/10.1787/888932343133
1 2 http://dx.doi.org/10.1787/888932343133

2A PROFILE OF STUDENT PERFORMANCE IN READING
36 © OECD 2010 PISA 2009 ReSultS: WhAt StudentS KnoW And CAn do – Volume I
Socio-economic heterogeneity in student populations poses another major challenge for teachers and education systems. As shown in Volume II, Overcoming Social Background, teachers instructing socio-economically disadvantaged children are likely to face greater challenges than teachers teaching students from more advantaged social backgrounds. Similarly, countries with larger proportions of socio-economically disadvantaged children face greater challenges than countries with smaller proportions of disadvantaged students. Figure I.2.4 shows the proportion of students at the lower end of an international scale of the economic, social and cultural background of students, which is described in detail in Volume II, and how this relates to reading performance. the relationship is strong and explains 46% of the performance variation among countries. turkey and mexico, where 58% of students belong to the internationally most disadvantaged group, and Chile, Portugal, Spain, Italy and Poland, where this proportion reaches more than 20%, thus face much greater challenges than, for example, norway, Australia, Iceland, Canada and Finland, where the proportion of disadvantaged students is less than 5%.
Integrating students with an immigrant background can also be challenging, and the level of performance of students who immigrated to the country in which they were assessed can be only partially attributed to their host country’s education system. Figure I.2.5 shows the proportion of 15-year-olds with an immigrant background and how this relates to student performance.
When examining the results for individual countries as shown in table I.2.20 it is apparent that countries vary in their demographic, social and economic contexts. the last column in table I.2.20 summarises the different factors discussed above in an index.8 the index shows norway, Japan, Iceland, luxembourg, Finland and the united States with the most advantaged demographic, social and economic context and turkey, mexico and Chile with the most challenging context.
these differences need to be considered when interpreting PISA results. At the same time, the future economic and social prospects of both individuals and countries depend on the results they actually achieve, not on the performance they might have achieved under different social and economic conditions. that is why the results that are actually achieved by students, schools and countries are the focus of this volume.
even after accounting for the demographic, economic and social context of education systems, the question remains: to what extent is an international test meaningful when differences in languages and cultures lead to very different ways in which subjects such as language, mathematics or science are taught and learned across countries? It is inevitable that not all tasks on the international PISA assessments are equally appropriate in different cultural contexts and equally relevant in different curricular and instructional contexts. to gauge this, PISA asked every country to identify those tasks from the PISA tests that it considered most appropriate for an international test. Countries were advised to give an on-balance rating for each task with regard to its relevance to “preparedness for life”, authenticity and relevance for 15-year-olds. tasks given a high rating by each country are referred to as that country’s most preferred questions for PISA. PISA then scored every country on its own most preferred questions and compared the resulting performance with the performance on the entire set of PISA tasks (see Figure I.2.6). It is clear that generally, the proportion of questions answered correctly by students does not depend in significant ways on whether countries were only scored on their preferred questions or on the overall set of PISA tasks. this provides robust evidence that the results of the PISA assessments would not change markedly if countries had more influence in selecting texts that they thought might be “fairer” to their students.
Finally, when comparing student performance across countries, the extent to which student performance on international tests might be influenced by the effort that students in different countries invest in the assessment must be considered. In PISA 2003, students were asked to imagine an actual situation that was highly important to them, so that they could try their very best and invest as much effort as they could into doing well. they were then asked to report how much effort they had put into doing the PISA test compared to the situation they had just imagined and how much effort they would have invested if their marks from PISA had been counted in their school marks. the students generally answered realistically, saying that they would make more effort if the test results were to count towards their school marks but the analysis also established that the reported expenditure of effort by students was fairly stable across countries. this finding counters the claim that systematic cultural differences in the effort made by students invalidate international comparisons. the analysis also showed that within countries, effort was related to student achievement with an effect size similar to variables such as single-parent family structure, gender and socio-economic background.9

2A PROFILE OF STUDENT PERFORMANCE IN READING
PISA 2009 ReSultS: WhAt StudentS KnoW And CAn do – Volume I © OECD 2010 37
ThE PISA APPROACh TO ASSESSING STUDENT PERFORMANCE IN READING
The PISA definition of reading literacy Reading literacy includes a broad set of cognitive competencies, from basic decoding, to knowledge of words, grammar, and linguistic and textual structures and features, to knowledge about the world. It also includes metacognitive competencies: the awareness of and ability to use a variety of appropriate strategies when processing texts.
historically, the term “literacy” referred to a tool used to acquire and communicate information. this is close to the notion that the term reading literacy is intended to express in PISA: the active, purposeful and functional application of reading in a range of situations and for various purposes.
PISA 2009 defines reading literacy as:
understanding, using, reflecting on and engaging with written texts, in order to achieve one’s goals, to develop one’s knowledge and potential, and to participate in society.
the words “understanding, using, reflecting on” are readily connected with important elements of reading and cognition.
Understanding refers to the reader’s task in constructing meaning, large and small, literal and implicit, from text. this can be as basic as understanding the meaning of the words, or it can be as complex as comprehending the underlying theme of a lengthy argument or narrative. Using refers to the kind of reading that is directed toward applying the information and ideas in a text to an immediate task or goal or to reinforce or change beliefs. much reading is of this kind. In some cases, using a text in this way requires just minimal understanding, combining recognition of the meaning of the words with some elementary recognition of structure (many menus, for example). In others, it requires using both syntactic and more complex structural understanding to extract the information. In all cases, though, the reader approaches the text with a specific task in mind. In reflecting on texts readers relate what they are reading to their thoughts and experiences. they may use the text to cast new light on something in their own lives; or they may make judgements about the text itself, drawing on external frames of reference. Readers continually make these kinds of judgments in the course of approaching a text. they need to assess whether the text is appropriate for the task at hand, determining whether it will provide the information they need. they have to make judgments about the truthfulness and reliability of the content. they need to account for any biases they find in the text. And, for some texts, they must make judgments about the quality of the text, both as a crafted object and as a tool for acquiring information.
the term engaging in the definition implies the motivation to read. many people appear to read text only when some task requires them to do so. others (sometimes) also read for the pleasure it brings them and for general interest. Some read only what others – teachers, employers, governments – make necessary, while others also read things of their own choosing. that is, people differ in how engaged they are with text and how much of a role reading plays in their lives. Volume III, Learning to Learn, which looks at reading engagement in detail, shows that reading is an important correlate with the direct cognitive measures. As such, it is important to understand these differences to get a full picture of reading literacy. Reading engagement comprises a cluster of affective and behavioural characteristics that include an interest in and enjoyment of reading, a sense of control over what one reads, involvement in the social dimension of reading, and diverse and frequent reading practices.
Written texts comprises texts in a variety of formats, including continuous and non-continuous texts, and in a variety of text types, such as narrative, expository and interactive. the term written texts also comprises texts in a variety of media: hand-written, printed and digital.
until recently, most reading material was printed on paper. now, readers also need to access and use text that is displayed on a screen of some kind, whether on a computer, a PdA, an Atm, or a mobile phone. digital text opens the construct of reading to cover additional types of text and content. examples of these novel form/content combinations are: interactive texts, such as exchanges in comments sections of blogs or in e-mail response threads; multiple texts, whether displayed at the same time on a screen or linked through hypertext; and expandable texts, where a summary can be linked to more detailed information if the user chooses. While one can find examples of similar texts on paper, they are much less common in that form.

2A PROFILE OF STUDENT PERFORMANCE IN READING
38 © OECD 2010 PISA 2009 ReSultS: WhAt StudentS KnoW And CAn do – Volume I
the PISA definition of reading encompasses both printed and digital texts, acknowledging that the fundamental competency, regardless of medium, is making meaning from verbal language in its graphic form.
With the words to achieve one’s goals, to develop one’s knowledge and potential, and to participate in society, the second half of the definition is intended to capture the full scope of situations in which reading literacy plays a role. to achieve their goals, individuals have a range of needs they must address, from basic survival to personal satisfaction, to professional and career development, to participation in society. Reading is increasingly required in meeting those needs, whether simply finding one’s way while shopping, or negotiating complex bureaucracies, whose rules are commonly available only in written texts. It is also important in meeting individuals’ needs for sociability, for entertainment and leisure, for developing one’s community and for work. Reading is also required to develop one’s potential. this is obviously the case in the contexts of school and post-school education, but surveys suggest that many adults also engage in some kind of learning throughout their life, much of it self-directed and informal. typically this learning requires some use of text, and as individuals want to improve their life, whether at work or outside, they need to understand, use, and engage with printed and digital texts. the use of participate in society underlines the focus on an active role: individuals use text as a way to engage with their social surroundings, to learn about and to actively contribute to life in their community, close to home and more broadly. In this, PISA also recognises the social aspect of reading literacy, seeing it as part of the interactions between and among individuals. And of course, for many individuals, reading is essential to their participation in the labour force.
The PISA 2009 framework for assessing reading literacythe PISA framework for assessing literacy has guided the development of the assessment and also sets parameters for reporting. the PISA reading literacy assessment is built on three major characteristics: texts, aspects and situations. these characteristics are a useful means of analysing and describing the domain, even while it is recognised that the categorisation of texts and tasks is not absolute, since those elements of reading do not exist independently of one another. Figure I.2.7 shows the relationships between the major features of the framework.
All of these elements were systematically manipulated by test developers to construct the tasks that make up the test. Some elements of these framing characteristics are also used as the basis for constructing scales and subscales, and thus for reporting, whereas others ensure that reading literacy is adequately covered.
TEXTSWhat kind of text must students read?
MediumIn what form does the text appear?
• on paper• digitally
EnvironmentCan the reader change digital texts?
• Authored (reader is receptive)• Message-based (reader can change)
Text formathow is the text presented?
• Continuous texts (in sentences)• Non-continuous texts (in lists, like this one)• Mixed texts (combining these)• Multiple texts (brought together from more than one
source
Text typeWhat is the rhetorical structure of the text?
• descriptive (typically answering “what” questions)• narration (typically “when”)• exposition (typically “how”)• Argumentation (typically “why”)• direction (providing instructions)• transaction (exchanging information)
ASpEcTSWhat is the reader’s purpose and approach to the text?
• Access and retrieve information in the text• Integrate and interpret what they read • Reflect and evaluate, standing back from a text and relating it to their own experience
SiTuATionSWhat is the intended use of the text, from the author’s point of view?
• Personal: to satisfy one’s own interests• Public: Relating to wider society• Educational:used in instruction• Occupational: Related to the world of work
• Figure I.2.7 •Main features of PISA 2009 reading framework

2A PROFILE OF STUDENT PERFORMANCE IN READING
PISA 2009 ReSultS: WhAt StudentS KnoW And CAn do – Volume I © OECD 2010 39
the characteristic texts covers the range of materials that are read, and is further classified into a number of sub-categorisations: medium, environment, text format and text type. text medium – print and digital – is an important sub-categorisation in PISA, because it is used as the basis for reporting two separate reading scales. Although the PISA 2009 concept of reading encompasses reading in both print and digital media, and the framework is built to reflect this unitary conceptualisation, the skills and knowledge applied to reading in the two media are not identical. Print reading and digital reading are therefore reported on separate scales to allow countries to explore the differences in reading among their 15-year-olds. the reporting of results in this publication focuses on print reading, while Volume VI, Students On Line, explores the results of the assessment of digital reading skills. text format is also used as an organiser for reporting, building subscales for the categories continuous and non-continuous, which describe two ways in which texts are commonly structured, either in sentences and paragraphs (continuous), or in other formats such as lists, diagrams, graphs and tables (non-continuous). the other two text classifications are used to ensure an adequate coverage of the definition of reading literacy. the environment classification applies to digital texts only. It recognises the distinctive feature of a class of digital texts, including e-mails, blogs and forums, that the reader participates in constructing. this kind of text is termed message-based in PISA, and is distinguished from authored texts, where the text is written by a single author and is read as a completed artefact. Finally, the classification text type identifies categories of text that form the basis of many national and some international reading frameworks: narration, exposition, argumentation and so on. In PISA they are applied to ensure that reading texts with different rhetorical purposes are included in the assessment.
the second major characteristic, aspects, defines the cognitive approach that determines how readers engage with a text. Proficient readers have a repertoire of approaches and purposes for reading. they approach texts in order to access and retrieve information. they are able to interpret texts at the level of words, sentences and larger sections, and integrate information within texts and across multiple texts. Proficient readers reflect on texts in order to better understand and extend their own experiences, and in order to evaluate the relevance, utility and quality of the texts themselves. While all of these approaches are integral to proficient reading, the emphasis they are given in reading curricula and pedagogy across schools, systems and countries varies. In PISA 2009 the aspects access and retrieve, integrate and interpret and reflect and evaluate are used as the basis for reporting on reading, to investigate how proficiency in each of them plays out across the participating countries and subgroups of interest.10
the third characteristic used to build the PISA reading framework is situation, the range of broad contexts for which texts are produced. this characteristic plays a relatively minor role in comparison with texts and aspects, in that it does not form the basis of reporting scales. however, the specification of situations in the framework ensures coverage of the definition of reading literacy, so that an appropriate range of contexts with the concomitant sets of vocabulary and linguistic structures is included in the assessment tasks.
In the remaining part of this section the three framework characteristics of text, aspect and situation are discussed in more detail.
Characteristics of the textsPISA 2009 categorises texts by the medium through which they are communicated, the environment that establishes whether or not the reader has the potential to influence the content of the text (for digital texts only), the text format and the text type.
Mediumthe broadest distinction between texts in the PISA 2009 framework for reading literacy is the classification by medium: print or digital.
Print-medium text usually appears on paper in forms such as single sheets, brochures, magazines and books. the physical status of the printed text encourages (though it may not compel) the reader to approach the content of the text in a particular sequence. In essence, printed texts have a fixed or static existence. moreover, in real life as well as in the assessment context, the extent or amount of the text is immediately visible to the reader.
Digital-medium text for the purposes of PISA corresponds essentially to hypertext: a text or texts with navigation tools and features. Such digital texts have an unfixed, dynamic existence. In the digital medium, typically only a fraction of the available text can be seen at any one time. often the extent of text available is unknown, and a task may require reference to multiple texts. Readers use navigation tools and features such as scroll bars, buttons, menus and tabs. they also use text search functions and global content representation devices such as site maps. A major navigation tool that assists readers in finding their way around a number of texts, and one of the most distinctive features of digital texts, is the hypertext link. (An example of a hypertext link is www.pisa.oecd.org.)

2A PROFILE OF STUDENT PERFORMANCE IN READING
40 © OECD 2010 PISA 2009 ReSultS: WhAt StudentS KnoW And CAn do – Volume I
the differences between print and digital texts, such as the amount of visible text and the presence of navigation tools and features, imply an expanded set of reading skills and knowledge. digital texts make possible, and even require, non-sequential reading, with each reader constructing a “customised” text from the information encountered at the links he or she follows. Skilled readers of digital text must be familiar with navigation features and tools that do not exist in the print medium. In addition, typical digital reading activities involve the use of multiple texts, sometimes selecting from a virtually infinite pool. Gathering information on the Internet requires skimming and scanning through large amounts of material and immediately evaluating its credibility. Critical thinking, therefore, has become more important than ever in reading literacy.11
digital texts extend or emphasise some features of traditional reading, and introduce other features that are new to reading. the inclusion of digital texts in PISA allows the gathering of evidence about student competencies in understanding and using information in the digital medium. It also makes it possible to learn more about how ways of reading in the two media are similar and different in practice, and how various features of texts in the two media impact on the cognitive aspects of reading.
the sample material later in this chapter comprises seven units from the print medium (see Figures I.2.40 to I.2.46) and one from the digital medium (see Figure I.2.47).
Text environmentthe distinction by text environment, authored or message-based, refers to whether or not a digital text can be changed by the reader. texts with a fixed content are classified as authored. texts with which the reader can interact are classified as message-based.
An authored environment is one in which the reader is primarily receptive: the content cannot be modified. they are self-contained environments, controlled or published by a commercial company, a government department, an organisation or institution, or an individual. Readers use these sites mainly for obtaining information. text objects within an authored environment include home pages, sites publicising events or goods, government information sites, educational sites containing information for students, news sites and lists of search results.
A message-based environment is one in which the reader has the opportunity to add to or change the content, which is to some extent fluid and collaborative. Readers use these sites not only for obtaining information, but also as a way of communicating. text objects within a message-based environment include e-mail messages, blogs, chat rooms, web forums and reviews, and on line forms. In these texts, later entries often cannot be understood without understanding prior contributions.
While authored texts more closely resemble traditional print-based texts, message-based texts are increasingly prevalent in the digital medium, most prominently for social networking but also in public, educational and work-based contexts. Knowledge of the structures and features of texts in both environments, together with skills in negotiating them and evaluating their authority, are part of the repertoire of proficient readers.
As with many of the variables in the reading framework, the environment classifications are not strictly partitioned, and an individual text may contain elements of both. the digital reading assessment unit IWANTTOHELP, which is reproduced in the section containing sample questions at the end of this chapter (see Figure I.2.47), includes tasks that represent both authored and message-based environments. two of the questions are based on a blog, the third is based on a series of authored web pages and the fourth requires the reader to use both an e-mail message and authored web pages.
Text formatPerformance on text format subscales were already reported in PISA 2000, where groups of countries showed differential reading performance on continuous and non-continuous texts, and boys’ and girls’ results were more similar on the non-continuous texts subscale than on continuous texts subscale. these results, with their implications for policy, have prompted the inclusion of text format subscales alongside aspect subscales in the reporting of results from the PISA 2009 assessment.
Continuous texts are typically composed of sentences that are, in turn, organised into paragraphs. these may fit into even larger structures such as sections, chapters and books. Non-continuous texts are most frequently organised in matrix format, based on combinations of lists. texts in continuous and non-continuous format appear in both the print and digital media. Mixed and multiple format texts are also prevalent in both media, particularly in the digital medium. In continuous texts, organisation occurs graphically or visually by the separation of parts of the text into

2A PROFILE OF STUDENT PERFORMANCE IN READING
PISA 2009 ReSultS: WhAt StudentS KnoW And CAn do – Volume I © OECD 2010 41
paragraphs, by paragraph indentation, by the breakdown of text into a hierarchy signalled by headings that help readers to recognise the organisation of the text, and by the use of formatting features such as different font sizes, and font types such as italic and boldface. discourse markers also provide organisational information. these include sequence markers (for example, “first”, “second” and “third”), and causal connectors (for example, “therefore”, “for this reason” and “since”), which show the relationships between parts of a text. examples of texts in continuous text format in the print medium include newspaper reports, essays, novels, short stories, reviews and letters. In the digital medium the continuous text format group includes reviews, blogs and reports in prose. digital continuous texts tend to be short because of the limitations of screen size and the need for piecemeal reading, which make long texts unattractive to many online readers (although this may be changing with the increasing currency of e-books).
Non-continuous texts, also known as documents, are organised differently to continuous texts, and therefore require a different kind of reading approach. As the sentence is the smallest unit of continuous text, so all non-continuous texts can be shown to be composed of a number of lists.12 Some are single, simple lists, but most consist of several simple lists combined. examples of non-continuous texts are lists, tables, graphs, diagrams, schedules, catalogues, indexes and forms. these texts occur in both print and digital media.
Continuous and non-continuous texts require readers to apply different sets of knowledge about the text’s distinctive structures and features and somewhat different reading strategies. In everyday tasks, however, readers often need to draw on both sets of knowledge and strategies when they integrate information in different formats and across several texts. the PISA 2009 reading framework has recognised this important part of the reader’s repertoire by identifying mixed and multiple texts as separate text formats.
Mixed texts are defined in PISA as single, coherent objects consisting of a set of elements in both continuous and non-continuous formats. In well-constructed mixed texts the components (for example, a prose explanation including a graph or table) are mutually supportive through coherence and cohesion links at the local and global level. Mixed text in the print medium is a common format in magazines, reference books and reports, where authors employ a variety of representations to communicate information. In the digital medium authored web pages are typically mixed texts, with combinations of lists, paragraphs of prose and often graphics. Message-based texts such as online forms, e-mail messages and forums also combine texts that are continuous and non-continuous in format.
Multiple texts are defined as collections of texts that have been generated independently and each of which makes sense independently. they are juxtaposed for a particular occasion or may have been loosely linked together for the purposes of the assessment. the relationship between the texts may not be obvious; they may be complementary or may contradict one another. For example, a set of websites from different companies providing travel advice may or may not provide similar directions to tourists. Multiple texts may all be in one format (for example, continuous) or may include both continuous and non-continuous texts. Given the prevalent use of hypertext in PISA’s assessment of digital reading, almost all units in that medium are based on stimulus that consists of multiple texts, with the tasks requiring users to read across several texts (which may be different websites or different pages belonging to the same website), each presented in a variety of formats including prose paragraphs, menu lists, diagrams and other graphics.
the sample material at the end of this chapter includes examples representing three of the four text formats, as indicated in Figure I.2.8.13
Text format Sample questionsContinuous • THE PLAY’S THE THING – Questions 3, 4 and 7
• TELECOMMUTING – Question 7• BRUSHING YOUR TEETH – Questions 1, 2, 3 and 4• BLOOD DONATION NOTICE – Questions 8 and 9 • MISER – Questions 1, 5 and 7• IWANTTOHELP (digital reading assessment) – Question 1
Non-continuous • MOBILE PHONE SAFETY – Questions 2, 6, 9 and 11• BALLOON – Questions 3, 4, 6 and 8
Multiple • TELECOMMUTING – Question 1 • IWANTTOHELP (digital reading assessment) – Questions 2, 3 and 8
• Figure I.2.8 •Examples of tasks by text format

2A PROFILE OF STUDENT PERFORMANCE IN READING
42 © OECD 2010 PISA 2009 ReSultS: WhAt StudentS KnoW And CAn do – Volume I
Text typeAll texts in PISA are classified by text type, ascribed according to the main rhetorical purpose of the text, which was primarily used to ensure that the definition of reading literacy was adequately covered in the construction of the PISA assessment. It is not conceived of as a variable that influences the difficulty of a task.
Description refers to properties of objects in space, typically answering “what” questions. Impressionistic descriptions present information from the point of view of subjective impressions of relations, qualities, and directions in space. technical descriptions present information from the point of view of objective observations in space. examples of description include the depiction of a particular place in a travelogue or diary; a catalogue; a geographical map; and a specification of a feature, function or process in a technical manual.
Narration refers to properties of objects in time, typically answering “when” questions. narratives present change from the point of view of subjective selection and emphasis. Reports present actions and events that can be objectively verified by others. news stories enable readers to form their own independent opinion of facts and events. examples of narration include novels, short stories, plays, biographies, comic strips, and reports of events in a newspaper.
Exposition presents information as composite concepts or mental constructs, often answering “how” questions. expository essays provide an explanation of concepts, mental constructs, or conceptions from a subjective point of view. definitions explain how terms or names are interrelated with mental concepts. explications are a form of analytic exposition used to explain how a mental concept can be linked with words or terms. Summaries are a form of synthetic exposition used to explain and communicate texts in a shorter form. minutes are a record of the results of meetings or presentations. text interpretations are a form of both analytic and synthetic exposition used to explain the abstract concepts which are realised in a particular (fictional or non-fictional) text or group of texts. A scholarly essay, a diagram showing a model of memory, a graph of population trends, a concept map, and an entry in an online encyclopaedia are all examples of expositions.
Argumentation presents the relationship among concepts or propositions, often answering “why” questions. Persuasive and opinionative texts refer to opinions and points of view. Comment relates the concepts of events, objects, and ideas to a private system of thought, values, and beliefs. Scientific argumentation relates concepts of events, objects, and ideas to systems of thought and knowledge so that the resulting propositions can be verified as valid or non-valid. A letter to the editor, a poster advertisement, posts in an online forum, and web-based reviews of a book or film are examples of argumentation.
Instruction provides directions on what to do. Instructions present directions for certain behaviours in order to complete a task. Rules, regulations and statutes specify requirements for certain behaviours based on impersonal authority, such as practical validity or public authority. examples of instruction are a recipe, a series of diagrams showing a procedure for giving first aid, and guidelines for operating digital software.
Finally, the distinguishing feature of a transaction is that it exchanges information in an interaction with the reader. letters and invitations explore and maintain relationships. Surveys, questionnaires and interviews seek to collect information. examples of transactional texts are a personal letter to share family news, an e-mail exchange to plan holidays, and a text message to arrange a meeting.
Aspectthe aspects of texts are the second main organisational elements of the PISA 2009 assessment framework. they can be thought of as the mental strategies, approaches or purposes that readers use to negotiate their way into, around and between texts. PISA 2009 distinguishes between three categories – access and retrieve, integrate and interpret, reflect and evaluate.14 these three processes are the basis of subscales measuring performance in PISA, according to students’ proficiency in performing each aspect of reading. A fourth category, referred to as complex, describes those tasks that inextricably combine and depend on all three of the other processes.
In both the print and digital media, tasks classified as access and retrieve involve skills associated with finding, selecting and collecting information. on some occasions readers seek specific pieces of information from a text: What time does the train leave? Who wrote this article? Sometimes finding the needed information is relatively simple, as it is directly and plainly stated in the text. however, access and retrieve tasks are not necessarily easy ones. Several factors may contribute to making such tasks challenging. For example, sometimes more than one piece

2A PROFILE OF STUDENT PERFORMANCE IN READING
PISA 2009 ReSultS: WhAt StudentS KnoW And CAn do – Volume I © OECD 2010 43
of information is required or knowledge of text structures and features may be called upon. tasks in the print medium might require readers to use navigation features such as headings or captions to find their way to the appropriate section of the text before locating the relevant information. In the digital medium, an access and retrieve question might involve navigating across several pages of a website, or using menus, lists or tabs to locate relevant information.
the aspect integrate and interpret involves processing what is read to make internal sense of a text. Integrating tasks require the reader to understand the relations between different parts of a text. these relations include problem-solution, cause-effect, category-example, equivalency, compare-contrast, and understanding whole-part relationships. to complete such tasks, the reader has to determine what the appropriate connection is. this may be explicitly signalled, as when the text states “the cause of X is Y”, or may require an inference by the reader. the parts to be related may be near each other in the text or may be in different paragraphs or even in different texts. Interpreting refers to the process of making meaning from something that is not stated. It may involve recognising a relationship that is not explicit or it may be required at a more local level, for example, to infer (to deduce from evidence and reasoning) the connotation of a phrase or a sentence. When interpreting, a reader is identifying the underlying assumptions or implications of part or all of the text.
Reflect and evaluate tasks involve drawing on knowledge, ideas or values external to the text. In reflecting on a text, readers relate their own experience or knowledge to the text. In evaluating a text, readers make a judgment about it, either drawing on personal experience or on knowledge of the world that may be formal or content-based. Reflecting on and evaluating the content of a text requires the reader to connect information in a text to knowledge from outside sources. to do so, readers must be able to develop an understanding of what is said and intended in a text. they must then test that mental representation against what they know and believe on the basis of either prior information or information found in other texts. Reflecting on and evaluating the form of a text requires readers to stand apart from the text, to consider it objectively and to evaluate its quality and appropriateness. Knowledge of text structure, of the style typical of different kinds of texts and of register play an important role in these tasks. While the kinds of reflection and evaluation called for in the print medium assessment are also required in the digital medium, evaluation in the digital medium takes on a slightly different emphasis. Sources for online information are more varied, ranging from authoritative sources to postings with unknown or uncertain credibility. Because the source of many digital texts is obscure and because it is much easier to distribute them widely and anonymously, such judgments are especially important for digital texts. All information must be evaluated in terms of accuracy, reliability and timeliness, but this is particularly important with online material.
the three broad aspects defined so far are not conceived of as entirely separate and independent, but rather as interrelated and interdependent. Indeed from a cognitive processing perspective they can be considered to be semi-hierarchical: it is not possible to interpret or integrate information without having first retrieved it, and it is not possible to reflect on or evaluate information without having accessed the information, and very likely made some sort of interpretation. In PISA, however, while it is acknowledged that all aspects (as cognitive processes) are likely to play some role in each task, each task is designed to emphasise one or another of the aspects. Generally, the aspect classification for each PISA reading literacy task depends on the objective of the task. For example, retrieving a single piece of explicitly stated information from a web page (such as finding out the number of Internet users worldwide) would be classified as an access and retrieve task, even though it might involve a complex series of steps including the evaluation of the relevance of several results on a search result page, comparing and contrasting descriptions and deciding which of several sources is likely to be most authoritative.
A few PISA digital reading tasks are classified as complex in terms of aspect. these tasks have been designed to take advantage of the relative freedom of reading in this medium, where the arrangement and organisation given to a print text by the author’s ordering of pages, chapters or larger sections is absent, and the sequence of steps to be taken by the reader in completing a task is thus much more fluid. these tasks, which are intended to simulate the uncertainty of negotiating hyperspace, do not allow assigning the task to one of the three aspects in any meaningful way. the most salient feature of such tasks is the interaction between accessing, retrieving, interpreting, integrating and reflecting. therefore these tasks have been described as complex to represent this dynamic cognitive processing.
Figure I.2.9 shows sample tasks that represent each of the aspects. the tasks are reproduced in full at the end of this chapter.

2A PROFILE OF STUDENT PERFORMANCE IN READING
44 © OECD 2010 PISA 2009 ReSultS: WhAt StudentS KnoW And CAn do – Volume I
SituationSituation is used in PISA to define texts and their associated tasks, and refers to the contexts and uses for which the author constructed the text. While content is not used for the purpose of reporting results, by sampling texts across a variety of situations the intent is to maximise the diversity of content included in the PISA reading literacy survey. each text is assigned to one of the four situations identified in PISA – personal, public, educational and occupational – according to its supposed audience and purpose, rather than with regard to the place where the reading activity may be carried out. For example, literary texts, which are often used in classrooms, are generally not written for educational purposes, but rather for readers’ personal enjoyment and appreciation. they are therefore classified as personal. Conversely, textbooks are read both in schools and in homes, and the process and purpose probably differ little from one setting to another. Such texts are classified as educational in PISA.
the personal category relates to texts that are intended to satisfy an individual’s personal interests, both practical and intellectual. this category also includes texts that are intended to maintain or develop personal connections with other people. It includes personal letters, fiction, biography, and informational texts that are intended to be read to satisfy curiosity, as a part of leisure or recreational activities. In the digital medium it includes personal e-mails, instant messages and diary-style blogs.
the public category describes texts that relate to activities and concerns of society as a whole. the category includes official documents as well as information about public events. In general, the texts associated with this category assume a more or less anonymous contact with others; they also include forum-style blogs, news websites and public notices that are encountered both online and in print.
the content of educational texts is usually designed specifically for the purpose of instruction. Printed text books and interactive learning software are typical examples of material generated for this kind of reading. educational reading normally involves acquiring information as part of a larger learning task. the materials are often not chosen by the reader, but instead assigned by an instructor. the model tasks are those usually identified as “reading to learn”.
Occupational texts are those associated with the workplace, often texts that support the accomplishment of some immediate task. Such texts might be intended to help readers search for a job, either in a print newspaper’s classified advertisement section, or on line, or to follow workplace directions. the tasks addressing this kind of text are often referred to as “reading to do” rather than “reading to learn”. texts written for these purposes, and the tasks based on them, are classified as occupational in PISA.
Aspects required Sample questions
Access and retrieve • BRUSHING YOUR TEETH – Questions 2 and 3 • BALLOON – Question 3• MISER – Question 7• IWANTTOHELP (digital reading assessment) – Questions 1 and 2
Integrate and interpret • MOBILE PHONE SAFETY – Questions 2 and 9 • THE PLAY’S THE THING – Questions 3, 4 and 7• TELECOMMUTING – Question 1 • BRUSHING YOUR TEETH – Question 1• BALLOON – Question 8• BLOOD DONATION NOTICE – Question 8 • MISER – Questions 1and 5• IWANTTOHELP (digital reading assessment) – Question 3
Reflect and evaluate • MOBILE PHONE SAFETY – Questions 6 and 11• TELECOMMUTING – Question 7• BRUSHING YOUR TEETH – Question 4• BALLOON – Questions 4 and 6• BLOOD DONATION NOTICE – Question 9
Complex • IWANTTOHELP (digital reading assessment) – Question 8
• Figure I.2.9 •Examples of tasks by aspect

2A PROFILE OF STUDENT PERFORMANCE IN READING
PISA 2009 ReSultS: WhAt StudentS KnoW And CAn do – Volume I © OECD 2010 45
the sample material at the end of this chapter includes examples of texts representing each of the four situations, as shown in Figure I.2.10. unit names are listed rather than tasks, since in most cases all tasks in a unit are classified under the same situation: that of the stimulus text.
Situation Sample textsPersonal • THE PLAY’S THE THING
• MISERPublic • MOBILE PHONE SAFETY
• BLOOD DONATION NOTICEEducational • BRUSHING YOUR TEETH
• BALLOONOccupational • TELECOMMUTING
• IWANTTOHELP (digital reading assessment)
• Figure I.2.10 •Examples of text format by situation
How the PISA 2009 reading results are reported
How the PISA 2009 reading tests were designed, analysed and scaled the development of the PISA 2009 reading tasks was co-ordinated by an international consortium of educational research institutions contracted by participating countries through the oeCd, under the guidance of a group of reading experts from participating countries. Participating countries contributed stimulus material and questions, which were reviewed, tried out and refined iteratively over the three years leading up to the administration of the assessment in 2009. the development process involved provision for several rounds of commentary from participating countries, as well as small-scale piloting and a formal field trial in which samples of 15-year-olds from all participating countries took part. the reading expert group recommended the final selection of tasks, which included material submitted by 21 of the participating countries. the selection was made with regard to both their technical quality, assessed on the basis of their performance in the field trial, and their cultural appropriateness and interest level for 15-year-olds, as judged by participating countries. Another essential criterion for selection of the set of material as a whole was its fit to the framework described in the previous section, in order to maintain the balance across various categories of text, aspect and situation. Finally, it was ensured that the set of questions covered a range of difficulty, allowing for good measurement and a description of the reading literacy of all 15-year-old students, from the least proficient to the highly able.
over 130 print reading questions were used in PISA 2009, but each student in the sample only saw a proportion of the total pool because different sets of questions were given to different students. the reading questions selected for inclusion in PISA 2009 were organised into half-hour clusters. these, along with clusters of mathematics and science questions, were assembled into booklets containing four clusters each. each participating student was then given a two-hour assessment. As reading was the focus of the PISA 2009 assessment, every booklet included at least one cluster of reading material. the clusters were rotated so that each cluster appeared in each of the four possible positions in the booklets, and each pair of clusters appeared in at least 1 of the 13 booklets that were used in each country.
this design, similar to those used in previous PISA assessments, makes it possible to construct a single scale of reading proficiency, in which each question is associated with a particular point on the scale that indicates its difficulty, and each student’s performance is associated with a particular point on the same scale that indicates his or her estimated proficiency. A description of the modelling technique used to construct this scale can be found in PISA 2009 Technical Report (oeCd, forthcoming).
the relative difficulty of tasks in a test is estimated by considering the proportion of test takers who answer each question correctly. the relative proficiency of students taking a particular test can be estimated by considering the proportion of test questions they answer correctly. A single continuous scale shows the relationship between the difficulty of questions and the proficiency of students. By constructing a scale that shows the difficulty of each question, it is possible to locate the level of reading literacy that the question represents. By showing the proficiency of each student on the same scale, it is possible to describe the level of reading literacy that the student possesses.

2A PROFILE OF STUDENT PERFORMANCE IN READING
46 © OECD 2010 PISA 2009 ReSultS: WhAt StudentS KnoW And CAn do – Volume I
the further a student’s proficiency is located above a given question, the more likely he or she is to complete the question (and other questions of similar difficulty) successfully; the further the student’s proficiency is located below a given question, the lower the probability that the student will be able to complete the question, and other similarly difficult questions successfully.
How reading proficiency levels are defined in PISA 2009 PISA 2009 provides an overall reading literacy scale for reading texts, drawing on all the questions in the reading assessment, as well as scales for three aspects and two text formats.15 the metric for the overall reading scale is based on a mean for oeCd countries set at 500 in PISA 2000, with a standard deviation of 100. to help in interpreting what students’ scores mean in substantive terms, the scale is divided into levels, based on a set of statistical principles. descriptions are then generated, based on the tasks that are located within each level, to describe the kinds of skills and knowledge needed to complete them successfully.
For PISA 2009, the range of difficulty of tasks allows for the description of seven levels of reading proficiency: level 1b is the lowest described level, then level 1a, level 2, level 3 and so on up to level 6.
the location of student proficiency on this scale is set in relation to the particular group of questions used in the assessment, but just as the sample of students taking PISA in 2009 is drawn to represent all the 15-year-olds in the participating countries, so the individual questions used in the assessment are designed to represent the definition of reading literacy adequately. estimates of student proficiency reflect the kinds of tasks they would be expected to perform successfully. this means that students are likely to be able to complete questions successfully at or below the difficulty level associated with their own position on the scale (but they may not always do so). Conversely, they are unlikely to be able to complete questions above the difficulty level associated with their position on the scale successfully (but they may sometimes do so). Figure I.2.11 illustrates how this probabilistic model works.
• Figure I.2.11 •Relationship between questions and students on a proficiency scale
Item VI
Item V
Item IV
Item III
Item II
Item I
Items with relatively high difficulty
Items with moderate difficulty
Items with relatively low difficulty
It is expected that Student C will be unable to complete Items II to VI successfully and will also have a low probability of completing Item I successfully.
Student C, with relatively low proficiency
It is expected that Student A will be able to complete Items I to V successfullyand probably Item VI as well.
Student A, with relatively high proficiency
It is expected that Student B will be able to complete Items I, II and III successfully, will have a lower probability of completing Item IV and is unlikely to complete Items V and VI successfully.
Student B, with moderate proficiency
Reading literacy scale

2A PROFILE OF STUDENT PERFORMANCE IN READING
PISA 2009 ReSultS: WhAt StudentS KnoW And CAn do – Volume I © OECD 2010 47
• Figure I.2.12 •Summary descriptions for the seven levels of proficiency in reading
Level
Lowerscorelimit
Percentage of students able to perform tasks at each level or above (OECD average) Characteristics of tasks
6
698
0.8% of students across the OECD can perform tasks at Level 6 on the reading scale
tasks at this level typically require the reader to make multiple inferences, comparisons and contrasts that are both detailed and precise. they require demonstration of a full and detailed understanding of one or more texts and may involve integrating information from more than one text. tasks may require the reader to deal with unfamiliar ideas, in the presence of prominent competing information, and to generate abstract categories for interpretations. Reflect and evaluate tasks may require the reader to hypothesise about or critically evaluate a complex text on an unfamiliar topic, taking into account multiple criteria or perspectives, and applying sophisticated understandings from beyond the text. A salient condition for access and retrieve tasks at this level is precision of analysis and fine attention to detail that is inconspicuous in the texts.
5
626
7.6% of students across the OECD can perform tasks at least at Level 5 on the reading scale
tasks at this level that involve retrieving information require the reader to locate and organise several pieces of deeply embedded information, inferring which information in the text is relevant. Reflective tasks require critical evaluation or hypothesis, drawing on specialised knowledge. Both interpretative and reflective tasks require a full and detailed understanding of a text whose content or form is unfamiliar. For all aspects of reading, tasks at this level typically involve dealing with concepts that are contrary to expectations.
4
553
28.3% of students across the OECD can perform tasks at least at Level 4 on the reading scale
tasks at this level that involve retrieving information require the reader to locate and organise several pieces of embedded information. Some tasks at this level require interpreting the meaning of nuances of language in a section of text by taking into account the text as a whole. other interpretative tasks require understanding and applying categories in an unfamiliar context. Reflective tasks at this level require readers to use formal or public knowledge to hypothesise about or critically evaluate a text. Readers must demonstrate an accurate understanding of long or complex texts whose content or form may be unfamiliar.
3
480
57.2% of students across the OECD can perform tasks at least at Level 3 on the reading scale
tasks at this level require the reader to locate, and in some cases recognise the relationship between, several pieces of information that must meet multiple conditions. Interpretative tasks at this level require the reader to integrate several parts of a text in order to identify a main idea, understand a relationship or construe the meaning of a word or phrase. they need to take into account many features in comparing, contrasting or categorising. often the required information is not prominent or there is much competing information; or there are other obstacles in the text, such as ideas that are contrary to expectation or negatively worded. Reflective tasks at this level may require connections, comparisons, and explanations, or they may require the reader to evaluate a feature of the text. Some reflective tasks require readers to demonstrate a fine understanding of the text in relation to familiar, everyday knowledge. other tasks do not require detailed text comprehension but require the reader to draw on less common knowledge.
2
407
81.2% of students across the OECD can perform tasks at least at Level 2 on the reading scale
Some tasks at this level require the reader to locate one or more pieces of information, which may need to be inferred and may need to meet several conditions. others require recognising the main idea in a text, understanding relationships, or construing meaning within a limited part of the text when the information is not prominent and the reader must make low level inferences. tasks at this level may involve comparisons or contrasts based on a single feature in the text. typical reflective tasks at this level require readers to make a comparison or several connections between the text and outside knowledge, by drawing on personal experience and attitudes.
1a
335
94.3% of students across the OECD can perform tasks at least at Level 1a on the reading scale
tasks at this level require the reader: to locate one or more independent pieces of explicitly stated information; to recognise the main theme or author’s purpose in a text about a familiar topic; or to make a simple connection between information in the text and common, everyday knowledge. typically the required information in the text is prominent and there is little, if any, competing information. the reader is explicitly directed to consider relevant factors in the task and in the text.
1b
262
98.9% of students across the OECD can perform tasks at least at Level 1b on the reading scale
tasks at this level require the reader to locate a single piece of explicitly stated information in a prominent position in a short, syntactically simple text with a familiar context and text type, such as a narrative or a simple list. the text typically provides support to the reader, such as repetition of information, pictures or familiar symbols. there is minimal competing information. In tasks requiring interpretation the reader may need to make simple connections between adjacent pieces of information.

2A PROFILE OF STUDENT PERFORMANCE IN READING
48 © OECD 2010 PISA 2009 ReSultS: WhAt StudentS KnoW And CAn do – Volume I
Students with a proficiency within the range of level 1b are likely to be able to complete level 1b tasks successfully, but are unlikely to be able to complete tasks at higher levels. level 6 reflects tasks that present the greatest challenge in terms of reading skills and knowledge. Students with scores in this range are likely to be able to complete successfully reading tasks located at that level, as well as all the other reading tasks in PISA.
PISA applies a standard methodology for constructing proficiency scales. Based on a student’s performance on the tasks in the test, his or her score is generated and located in a specific part of the scale, thus allowing the score to be associated with a defined proficiency level. the level at which the student’s score is located is the highest level for which he or she would be expected to answer correctly most of a random selection of questions within the same level. thus, for example, in an assessment composed of tasks spread uniformly across level 3, students with a score located within level 3 would be expected to complete at least 50% of the tasks successfully. Because a level covers a range of difficulty and proficiency, success rates across the band vary. Students near the bottom of the level would be likely to succeed on just over 50% of the tasks spread uniformly across the level, while students at the top of the level would be likely to succeed on well over 70% of the same tasks.
Figure I.2.12 provides details of the nature of the reading skills, knowledge and understanding required at each level of the reading scale.
A profile of PISA reading questions For an assessment such as PISA, which is conducted every three years, it is necessary to retain a sufficient number of questions from successive surveys to establish reliable trends. other questions are publicly released after the survey to illustrate the ways in which performance was measured. At the end of this chapter, a selection of the released questions for the 2009 reading assessment is presented to illustrate the framework characteristics and the levels of proficiency described in this volume.
Level
Lowerscorelimit Questions
6698
THE PLAY’S THE THING – Question 3 (730)
5 626
4
553
MOBILE PHONE SAFETY – Question 11 (604)BALLOON – Question 3.2 (595) MOBILE PHONE SAFETY – Question 2 (561)THE PLAY’S THE THING – Question 7 (556)
3
480
MISER – Question 5 (548) TELECOMMUTING – Question 1 (537)MOBILE PHONE SAFETY – Question 6 (526)TELECOMMUTING – Question 7 (514)BALLOON – Question 4 (510)MOBILE PHONE SAFETY – Question 9 (488)
2
407
THE PLAY’S THE THING – Question 4 (474)BALLOON – Question 3.1 (449)BLOOD DONATION NOTICE – Question 8 (438)BALLOON – Question 6 (411)
1a
335
BRUSHING YOUR TEETH – Question 4 (399)MISER – Question 1 (373)BALLOON – Question 8 (370)BLOOD DONATION NOTICE – Question 9 (368) BRUSHING YOUR TEETH – Question 2 (358) BRUSHING YOUR TEETH – Question 1 (353)
1b262
MISER – Question 7 (310)BRUSHING YOUR TEETH – Question 3 (285)
note: numbers in brackets refer to the difficulty of the question. decimal points indicate questions that have a partial credit score (.1) and a full credit score (.2).
• Figure I.2.13 •Map of selected reading questions in PISA 2009, illustrating the proficiency levels

2A PROFILE OF STUDENT PERFORMANCE IN READING
PISA 2009 ReSultS: WhAt StudentS KnoW And CAn do – Volume I © OECD 2010 49
Figure I.2.13 shows a map of these questions in relation to their position on the described proficiency scale. the first column shows the proficiency level within which the task is located. the second column indicates the lowest scale score for a task, in terms of its difficulty, that would allow it to be regarded as falling within that level. the last column shows the name of the unit and the task number. It will be noticed that tasks within the same unit can represent a range of difficulties: THE PLAY’S THE THING, for example, comprises questions at levels 2, 4 and 6. thus a single unit may cover a broad section of the PISA reading difficulty range.
What students can do in reading PISA summarises student performance on a reading scale that provides an overall picture of students’ accumulated reading skills, knowledge and understanding at age 15. Results for this overall reading performance measure are presented below, covering both the average level of reading performance in each country and the distribution of reading proficiency. detailed results for the different aspects and text formats are presented in subsequent sections.
Students reaching the different levels of proficiencythis section describes performance in terms of the seven levels of reading proficiency that have been constructed for reporting reading in PISA 2009. Beyond level 5, which was the highest described level of proficiency in previous PISA reading assessments, a new level 6 has been added to describe very high levels of reading proficiency. the previous bottom level of measured proficiency, level 1, has been relabelled as level 1a. A new level, level 1b, describes students who would previously have been rated as “below level 1”, but who show proficiency in relation to a new set of tasks that is easier than those included in previous PISA assessments. these changes allow countries to know more about what kinds of tasks students with very high and very low reading proficiency are capable of. Apart from the additional levels, the meaning of being proficient at reading levels 2, 3, 4 and 5 remains the same in PISA 2009 as in previous surveys.
the distribution of student performance across these proficiency levels is shown in Figure I.2.14. Results are presented in terms of the percentage of 15-year-olds within each country reaching the seven proficiency levels described in Figure I.2.12. table I.2.1 provides figures for the percentage of students at each proficiency level on the reading scale with standard errors.
Proficiency at Level 6 (scores higher than 698 points)Students proficient at level 6 on the reading scale are highly-skilled readers. they are capable of conducting fine-grained analysis of texts, which requires detailed comprehension of both explicit information and unstated implications; and capable of reflecting on and evaluating what they read at a more general level. Since students with scale scores at this level have successfully completed almost all of the tasks presented to them in the reading assessment, they have demonstrated that they are capable of dealing with many different types of reading material: they are by implication diversified readers who can assimilate information from unfamiliar content areas presented in atypical formats, as well as being able to engage with more familiar content with typical structures and text features. Another characteristic of the most highly developed readers, as defined by PISA, is also that they can overcome preconceptions in the face of new information, even when that information is contrary to expectations. they are capable of recognising what is provided in a text, both conspicuously and more subtly, while at the same time being able to apply a critical perspective to it, drawing on sophisticated understandings from beyond the text. this combination of a capacity to absorb the new and to evaluate it is greatly valued in knowledge economies, which depend on innovation and nuanced decision making that draw on all the available evidence. the proportion of a population performing at this very high level in reading is therefore of particular interest.
Across oeCd countries, less than 1% of students (0.8%) perform at this level, but there is variation among countries. Seven countries have a significantly higher percentage of students performing at level 6 – more than twice the average: the oeCd countries new Zealand, Australia, Japan, Canada and Finland, as well as the partner countries and economies Singapore and Shanghai-China. three of these are Asian countries and three are english-speaking oeCd countries. While in these countries the majority of students perform relatively well, with less than 5% of the students performing below level 1a, two of these countries show rather wide distributions – Japan and new Zealand – and two have very small spreads of student performance – Finland and Shanghai-China. Israel, which has a mean score well below the average at 474, shows an above-average of 1% of its students (oeCd average of 0.8%) performing at level 6 as well as an above-average 12% of its students (oeCd average of 6%) not being proficient above level 1b. In contrast, some countries with relatively high overall performance did not have a strong representation of students at the highest level of reading proficiency. Among these is Korea, with a mean score of 539, the highest of any oeCd country, but with only a just above-average percentage of students reaching level 6 (1%).

2A PROFILE OF STUDENT PERFORMANCE IN READING
50 © OECD 2010 PISA 2009 ReSultS: WhAt StudentS KnoW And CAn do – Volume I
Percentage of students
Shanghai-ChinaKorea
FinlandHong Kong-China
CanadaSingapore
EstoniaJapan
AustraliaNetherlands
New ZealandMacao-China
NorwayPoland
DenmarkChinese Taipei
LiechtensteinSwitzerland
IcelandIreland
SwedenHungary
LatviaUnited States
PortugalBelgium
United KingdomGermany
SpainFrance
ItalySloveniaGreece
Slovak RepublicCroatia
Czech RepublicLithuania
TurkeyLuxembourg
IsraelRussian Federation
AustriaChile
Dubai (UAE)Serbia
MexicoRomaniaBulgaria
UruguayThailand
Trinidad and TobagoColombia
JordanMontenegro
BrazilTunisia
ArgentinaIndonesia
AlbaniaKazakhstan
QatarPeru
PanamaAzerbaijanKyrgyzstan
Countries are ranked in descending order of the percentage of students at Levels 2, 3, 4, 5 and 6.Source: OECD, PISA 2009 Database, Table I.2.1.
100 80 60 40 20 0 20 40 60 80 100
• Figure I. 2.14 •How proficient are students in reading?
Percentage of students at the different levels of reading proficiency
Level 1aLevel 1bBelow Level 1b Level 2 Level 3 Level 4 Level 5 Level 6
Shanghai-ChinaKoreaFinlandHong Kong-ChinaCanadaSingaporeEstoniaJapanAustraliaNetherlandsNew ZealandMacao-ChinaNorwayPolandDenmarkChinese TaipeiLiechtensteinSwitzerlandIcelandIrelandSwedenHungaryLatviaUnited StatesPortugalBelgiumUnited KingdomGermanySpainFranceItalySloveniaGreeceSlovak RepublicCroatiaCzech RepublicLithuaniaTurkeyLuxembourgIsraelRussian FederationAustriaChileDubai (UAE)SerbiaMexicoRomaniaBulgaria UruguayThailandTrinidad and TobagoColombiaJordanMontenegroBrazilTunisiaArgentinaIndonesiaAlbaniaKazakhstanQatarPeruPanamaAzerbaijanKyrgyzstan
Students at Level 1a or below
Students at Level 2 or above
1 2 http://dx.doi.org/10.1787/888932343133

2A PROFILE OF STUDENT PERFORMANCE IN READING
PISA 2009 ReSultS: WhAt StudentS KnoW And CAn do – Volume I © OECD 2010 51
the very small percentage of students performing at level 6 illustrates that the PISA scale is capable of distinguishing reading proficiency up to the highest level of excellence that 15-year-olds are capable of attaining. Indeed, this level of proficiency is currently quite aspirational for many: in 18 partner countries and economies less than one-tenth of one per cent of the 15-year-old population performs at this top level.
Proficiency at Level 5 (scores higher than 626 but lower than or equal to 698 points)Students proficient at level 5 on the reading literacy scale can handle texts that are unfamiliar in either form or content. they can find information in such texts, demonstrate detailed understanding, and infer which information is relevant to the task. they are also able to critically evaluate such texts and build hypotheses about them, drawing on specialised knowledge and accommodating concepts that may be contrary to expectations. An inspection of the kinds of tasks students at level 5 are capable of suggests that those who get to this level can be regarded as potential “world class” knowledge workers of tomorrow, making the proportion of a country’s students reaching this level relevant for its future economic competitiveness.
Since students proficient at level 6 can also do level 5 tasks, the following descriptions use “proficient at level 5” to mean those whose highest level of performance is either level 5 or 6. the same terminology is used to refer to the cumulative proportions at lower levels. Students performing at level 5 or 6 are frequently referred to as “top performers” in this report.
Across oeCd countries, 8% of PISA 2009 students are proficient at level 5 or higher. one country, Shanghai-China, has well over twice the average capable of level 5 tasks (19% of students). Several other countries had percentages above 12% of students at level 5 or above: the oeCd countries new Zealand, Finland, Japan, Korea, Australia, Canada as well as the partner countries and economies Singapore and hong Kong-China. All of these countries also perform well in terms of mean proficiency. Conversely, countries with lower average performance also tend to be those with the lowest percentages of students capable of succeeding with level 5 reading tasks. All of the countries with less than half of one per cent of students performing at level 5 (the oeCd country mexico as well as the partner countries Azerbaijan, Indonesia, Kyrgyzstan, Albania, tunisia, Jordan, thailand, Kazakhstan and Peru) have a mean performance below 407, the cut-score between levels 1a and 2, with the exception of mexico and thailand.
Proficiency at Level 4 (scores higher than 553 but lower than or equal to 626 points)Students proficient at level 4 on the reading literacy scale are capable of difficult reading tasks, such as locating embedded information, construing meaning from nuances of language and critically evaluating a text. tasks at this level that involve retrieving information require students to locate and organise several pieces of embedded information and some tasks require interpreting the meaning of nuances of language in a section of text by taking into account the text as a whole. other interpretative tasks require understanding and applying categories in an unfamiliar context. Reflective tasks at this level require readers to use formal or public knowledge to hypothesise about or critically evaluate a text. Readers must demonstrate an accurate understanding of long or complex texts whose content or form may be unfamiliar.
Across oeCd countries, 28% of PISA 2009 students are proficient at level 4 or higher. A ranking of countries by the percentage of students performing at levels 4 and above generally matches the ranking of countries by mean performance, but there are a number of exceptions. taking into account its mean performance (496), France, for example, has a disproportionately high percentage of students performing at these levels (32%), despite having a mean score not statistically different from the oeCd average, while in denmark, with a similar average to France, the proportion is 26%. nineteen countries have less than 10% of their population performing at level 4.
Proficiency at Level 3 (scores higher than 480 but lower than or equal to 553 points)Students proficient at level 3 on the reading literacy scale are capable of reading tasks of moderate complexity, such as locating multiple pieces of information, making links between different parts of a text, and relating it to familiar everyday knowledge. tasks at this level require students to locate, and in some cases recognise the relationship between, several pieces of information that must meet multiple conditions. Interpretative tasks at this level require students to integrate several parts of a text in order to identify a main idea, understand a relationship or construe the meaning of a word or phrase. they need to take into account many features in comparing, contrasting or categorising. often the required information is not prominent or there is much competing information; or there are other challenges in the text, such as ideas that are contrary to expectation or negatively worded. Reflective tasks at this level may require connections, comparisons, and explanations, or they may require students to evaluate a

2A PROFILE OF STUDENT PERFORMANCE IN READING
52 © OECD 2010 PISA 2009 ReSultS: WhAt StudentS KnoW And CAn do – Volume I
feature of the text. Some reflective tasks require readers to demonstrate a fine understanding of the text in relation to familiar, everyday knowledge. other tasks do not require detailed text comprehension but require the reader to draw on less common knowledge from outside of the text.
Across oeCd countries, the majority (57%) of 15-year-old students are proficient at level 3 or higher. For half of these students (29% of the total), this is the highest level reached, making level 3 the most common level of highest performance for students across oeCd countries. In four countries and economies – Shanghai-China, Korea, hong Kong-China and Finland – over three quarters of the students can do tasks at least at level 3. on the other hand, this degree of proficiency is demonstrated by fewer than half of the students in 30 countries, including the oeCd countries luxembourg, the Czech Republic, Austria, turkey, Chile and mexico.
Proficiency at Level 2 (scores higher than 407 but lower than or equal to 480 points)Students proficient at level 2 on the reading literacy scale are capable of tasks such as locating information that meets several conditions, making comparisons or contrasts around a single feature, working out what a well-defined part of a text means even when the information is not prominent, and making connections between the text and personal experience. Some tasks at this level require students to locate one or more pieces of information, which may need to be inferred and may need to meet several conditions. others require recognising the main idea in a text, understanding relationships, or construing meaning within a limited part of the text when the information is not prominent and the reader must make low level inferences. tasks at this level may involve comparisons or contrasts based on a single feature in the text. typical reflective tasks at this level require students to make a comparison or several connections between the text and outside knowledge, by drawing on personal experience and attitudes.
level 2 can be considered a baseline level of proficiency, at which students begin to demonstrate the reading literacy competencies that will enable them to participate effectively and productively in life. the follow-up of students who were assessed by PISA in 2000 as part of the Canadian Youth in transition Survey has shown that students scoring below level 2 face a disproportionately higher risk of poor post-secondary participation or low labour-market outcomes at age 19, and even more so at age 21, the latest age for which data from this longitudinal study are currently available.16 For example, of students who performed below level 2 in PISA reading in 2000, over 60% had not gone on to any post-school education by the age of 21; by contrast, more than half of the students (55%) who had performed at level 2 as their highest level were at college or university.
Across oeCd countries, more than four in five students (81%) are proficient at level 2 or higher. In Shanghai-China and Korea, only small proportions of students, 4% and 6% respectively, are not proficient at level 2. At the other extreme, in ten partner countries only a minority could perform at this level. In 18 participating countries and economies, level 2 was the most common highest level of proficiency for students, including some oeCd countries: mexico and Chile with 33%, and turkey with 32%. other countries for which level 2 had the highest percentage of students included three latin American countries (Colombia, uruguay and Argentina) and three eastern european countries (Romania, the Russian Federation and Bulgaria).
Proficiency at Level 1a (scores higher than 335 but lower than or equal to 407 points)Students proficient at level 1a on the reading literacy scale are capable of locating pieces of explicitly stated information that are rather prominent in the text, recognising a main idea in a text about a familiar topic, and recognising the connection between information in such a text and their everyday experience. tasks at this level require students to locate one or more independent pieces of explicitly stated information, recognise the main theme or author’s purpose in a text about a familiar topic, or make a simple connection between information in the text and common, everyday knowledge. typically the required information in the text is prominent and there is little, if any, competing information. Students are explicitly directed to consider relevant factors in the task and in the text.
Across oeCd countries, the great majority of 15-year-old students (94%) are proficient at level 1a or higher. however, in the five partner countries, Azerbaijan, Peru, Panama, Qatar and Kyrgyzstan, more than one in three students do not reach this level. this does not mean that they are illiterate, but it does mean that they do not display even the very limited range of reading skills needed for level 1a tasks. moreover, in a number of partner countries including Indonesia, Azerbaijan, Kazakhstan, Panama, Peru, Brazil, Albania and Qatar, level 1a is the most common highest level of proficiency.

2A PROFILE OF STUDENT PERFORMANCE IN READING
PISA 2009 ReSultS: WhAt StudentS KnoW And CAn do – Volume I © OECD 2010 53
Proficiency at Level 1b (scores higher than 262 but lower than or equal to 335 points) and below Level 1b (scores lower than or equal 262 points)Students proficient at level 1b on the reading literacy scale can find explicitly stated information in short, simple texts with a familiar style and content. they can make low-level inferences such as recognising a causal connection across two sentences even when it is not stated. tasks at this level require students to locate a single piece of explicitly stated information in a prominent position in a short, syntactically simple text with a familiar context and text type, such as a narrative or a simple list. the text typically provides support to the reader, such as repetition of information, pictures or familiar symbols. there is minimal competing information. In tasks requiring interpretation students may need to make simple connections between adjacent pieces of information.
A small percentage of students across oeCd countries – 1.1% – has scores below 262 points on the PISA scale. these students are therefore judged to have performed below level 1b. this does not mean that they are necessarily completely illiterate, but there is insufficient information on which to base a description of their reading proficiency: only two tasks were used in PISA 2009 whose difficulty matched the proficiency of students below level 1b – too few tasks on which to base any generalisations about what students performing at this level can do as readers.
the fact that just one in a hundred students across oeCd countries cannot perform tasks at level 1b demonstrates that the PISA reading scale is now able to describe accurately the performance of almost all students. looked at in another way, 6% of students do not reach level 1a, and the addition of level 1b identifies reading tasks that five out of six members of this group can do. even in the lowest performing countries, with the exception of Kyrgyzstan, this is true of at least half of students who perform below level 1a. this improved capacity of PISA to describe reading skills at a very low level complements its improved ability to describe very high reading skills, at level 6.
All countries have some students performing at level 1b, and every country except liechtenstein has some proportion – though in some cases, a small one – of students performing below level 1b. however, in Kyrgyzstan, 59% of students perform below level 1a, half of them below level 1b. In four other countries, more than one third of students perform at or below level 1b: Qatar, Panama, Peru and Azerbaijan. Clearly, finding ways to increase the general population’s literacy level in these countries is vital for their development.
Inequality of learning outcomeslooking at the distribution of performance for each country across the proficiency levels, it becomes apparent that there is wide variation, regardless of average proficiency. A lot of the narrowest gaps between high and low performers are found in Asia as in Korea and in the partner countries and economies Indonesia, thailand, macao-China, Shanghai-China and hong Kong-China. estonia, turkey and Chile, as well as the partner countries Azerbaijan, latvia and Serbia, are also the countries with comparatively narrow gaps between high and low performers. For each of these countries, the gap between the top quarter and the bottom quarter of students in reading performance is at least 15 points less than the average gap, and the gap for all of these countries is also substantially narrower than the average when comparing performance of the bottom 10% and the top 10% of students (see table I.2.3). the narrow distribution does not appear to be associated with the overall level of performance. For example, one of the top performing oeCd countries, Korea, has one of the narrowest distributions of ability, as does Chile, a country performing well below the oeCd average.
Countries exhibiting the widest distribution of performance in reading are the oeCd countries Israel, Belgium, Austria, new Zealand, luxembourg and France, as well as the partner countries and economies Qatar, Bulgaria, trinidad and tobago, dubai (uAe) and Argentina, all of which have a gap of at least 15 points between their top quarter and bottom quarter of students wider than the average gap. the difference in performance between the top and bottom quarters in these countries is in the order of, or more than, two full proficiency levels.
As with those countries with a comparatively narrow distribution of student performance, the group of countries with a wide performance range is heterogeneous in mean proficiency in reading, with new Zealand (27 points above the average) and Qatar (122 points below the average) representing the extremes. Possible explanations for the wide variation in proficiency in Belgium, Austria, new Zealand and luxembourg are the existence of an academically tracked school system (Austria and Belgium) and/or of different ethnic/language groups within the country associated with disparate socio-economic status (luxembourg and new Zealand). Volume II, Overcoming Social Background, and Volume IV, What Makes a School Successful?, examine in detail important factors underlying the performance distribution among countries.

2A PROFILE OF STUDENT PERFORMANCE IN READING
54 © OECD 2010 PISA 2009 ReSultS: WhAt StudentS KnoW And CAn do – Volume I
• Figure I.2.15 •Comparing countries’ performance in reading
Mean Comparison country Countries whose mean score is NOT statistically significantly different from that of the comparison country556 Shanghai-China 539 Korea Finland, hong Kong-China 536 Finland Korea, hong Kong-China 533 Hong Kong-China Korea, Finland 526 Singapore Canada, new Zealand, Japan 524 Canada Singapore, new Zealand, Japan 521 New Zealand Singapore, Canada, Japan, Australia 520 Japan Singapore, Canada, new Zealand, Australia, netherlands 515 Australia new Zealand, Japan, netherlands 508 Netherlands Japan, Australia, Belgium, norway, estonia, Switzerland, Poland, Iceland, united States, liechtenstein, Sweden, Germany 506 Belgium netherlands, norway, estonia, Switzerland, Poland, united States, liechtenstein 503 Norway netherlands, Belgium, estonia, Switzerland, Poland, Iceland, united States, liechtenstein, Sweden, Germany, Ireland, France 501 Estonia netherlands, Belgium, norway, Switzerland, Poland, Iceland, united States, liechtenstein, Sweden, Germany, Ireland, France, Chinese taipei,
denmark, united Kingdom, hungary 501 Switzerland netherlands, Belgium, norway, estonia, Poland, Iceland, united States, liechtenstein, Sweden, Germany, Ireland, France, Chinese taipei,
denmark, united Kingdom, hungary 500 Poland netherlands, Belgium, norway, estonia, Switzerland, Iceland, united States, liechtenstein, Sweden, Germany, Ireland, France, Chinese taipei,
denmark, united Kingdom, hungary 500 Iceland netherlands, norway, estonia, Switzerland, Poland, united States, liechtenstein, Sweden, Germany, Ireland, France, Chinese taipei, hungary 500 United States netherlands, Belgium, norway, estonia, Switzerland, Poland, Iceland, liechtenstein, Sweden, Germany, Ireland, France, Chinese taipei,
denmark, united Kingdom, hungary499 Liechtenstein netherlands, Belgium, norway, estonia, Switzerland, Poland, Iceland, united States, Sweden, Germany, Ireland, France, Chinese taipei,
denmark, united Kingdom, hungary497 Sweden netherlands, norway, estonia, Switzerland, Poland, Iceland, united States, liechtenstein, Germany, Ireland, France, Chinese taipei, denmark,
united Kingdom, hungary, Portugal497 Germany netherlands, norway, estonia, Switzerland, Poland, Iceland, united States, liechtenstein, Sweden, Ireland, France, Chinese taipei, denmark,
united Kingdom, hungary 496 Ireland norway, estonia, Switzerland, Poland, Iceland, united States, liechtenstein, Sweden, Germany, France, Chinese taipei, denmark, united
Kingdom, hungary, Portugal 496 France norway, estonia, Switzerland, Poland, Iceland, united States, liechtenstein, Sweden, Germany, Ireland, Chinese taipei, denmark, united
Kingdom, hungary, Portugal 495 Chinese Taipei estonia, Switzerland, Poland, Iceland, united States, liechtenstein, Sweden, Germany, Ireland, France, denmark, united Kingdom, hungary,
Portugal 495 Denmark estonia, Switzerland, Poland, united States, liechtenstein, Sweden, Germany, Ireland, France, Chinese taipei, united Kingdom, hungary, Portugal 494 United Kingdom estonia, Switzerland, Poland, united States, liechtenstein, Sweden, Germany, Ireland, France, Chinese taipei, denmark, hungary, Portugal 494 Hungary estonia, Switzerland, Poland, Iceland, united States, liechtenstein, Sweden, Germany, Ireland, France, Chinese taipei, denmark, united
Kingdom, Portugal 489 Portugal Sweden, Ireland, France, Chinese taipei, denmark, united Kingdom, hungary, macao-China, Italy, latvia, Slovenia, Greece 487 Macao-China Portugal, Italy, latvia, Greece 486 Italy Portugal, macao-China, latvia, Slovenia, Greece, Spain 484 Latvia Portugal, macao-China, Italy, Slovenia, Greece, Spain, Czech Republic, Slovak Republic 483 Slovenia Portugal, Italy, latvia, Greece, Spain, Czech Republic 483 Greece Portugal, macao-China, Italy, latvia, Slovenia, Spain, Czech Republic, Slovak Republic, Croatia, Israel 481 Spain Italy, latvia, Slovenia, Greece, Czech Republic, Slovak Republic, Croatia, Israel 478 Czech Republic latvia, Slovenia, Greece, Spain, Slovak Republic, Croatia, Israel, luxembourg, Austria 477 Slovak Republic latvia, Greece, Spain, Czech Republic, Croatia, Israel, luxembourg, Austria 476 Croatia Greece, Spain, Czech Republic, Slovak Republic, Israel, luxembourg, Austria, lithuania 474 Israel Greece, Spain, Czech Republic, Slovak Republic, Croatia, luxembourg, Austria, lithuania, turkey 472 Luxembourg Czech Republic, Slovak Republic, Croatia, Israel, Austria, lithuania 470 Austria Czech Republic, Slovak Republic, Croatia, Israel, luxembourg, lithuania, turkey 468 Lithuania Croatia, Israel, luxembourg, Austria, turkey 464 Turkey Israel, Austria, lithuania, dubai (uAe), Russian Federation 459 Dubai (UAE) turkey, Russian Federation 459 Russian Federation turkey, dubai (uAe) 449 Chile Serbia 442 Serbia Chile, Bulgaria 429 Bulgaria Serbia, uruguay, mexico, Romania, thailand, trinidad and tobago 426 Uruguay Bulgaria, mexico, Romania, thailand 425 Mexico Bulgaria, uruguay, Romania, thailand 424 Romania Bulgaria, uruguay, mexico, thailand, trinidad and tobago 421 Thailand Bulgaria, uruguay, mexico, Romania, trinidad and tobago, Colombia 416 Trinidad and Tobago Bulgaria, Romania, thailand, Colombia, Brazil 413 Colombia thailand, trinidad and tobago, Brazil, montenegro, Jordan 412 Brazil trinidad and tobago, Colombia, montenegro, Jordan 408 Montenegro Colombia, Brazil, Jordan, tunisia, Indonesia, Argentina 405 Jordan Colombia, Brazil, montenegro, tunisia, Indonesia, Argentina 404 Tunisia montenegro, Jordan, Indonesia, Argentina 402 Indonesia montenegro, Jordan, tunisia, Argentina 398 Argentina montenegro, Jordan, tunisia, Indonesia, Kazakhstan 390 Kazakhstan Argentina, Albania 385 Albania Kazakhstan, Panama 372 Qatar Panama, Peru 371 Panama Albania, Qatar, Peru, Azerbaijan 370 Peru Qatar, Panama, Azerbaijan 362 Azerbaijan Panama, Peru 314 Kyrgyzstan
Source: oeCd, PISA 2009 Database.12 http://dx.doi.org/10.1787/888932343133
Statistically significantly above the oeCd average not statistically significantly different from the oeCd averageStatistically significantly below the oeCd average

2A PROFILE OF STUDENT PERFORMANCE IN READING
PISA 2009 ReSultS: WhAt StudentS KnoW And CAn do – Volume I © OECD 2010 55
Average level of proficiencythe discussion in the previous section focuses on describing countries’ performance at each of the defined proficiency levels. Another way of summarising the difference in performance between countries is to consider their mean performance, both relative to each other and to the oeCd mean. For PISA 2009, the oeCd mean is 493, with a standard deviation of 93. this establishes the benchmark against which each country’s reading performance in PISA 2009 is compared.
Figure I.2.15 shows each country’s mean score, and allows readers to see for which pairs of countries the differences between the means shown are statistically similar. For each country shown on the left in the middle column, the list of countries on the right hand column shows countries whose mean scores are not sufficiently different to be distinguished with confidence.17 For all other cases, one country has a higher performance than another if it is above it in the list in the middle column, and a lower performance if it is below. For example, while Shanghai-China clearly ranks first, the performance of Korea, which comes second on the list, cannot be distinguished with confidence from Finland and hong Kong-China, which come third and fourth respectively.
Korea and Finland are the highest-performing oeCd countries, with mean scores of 539 and 536 points, respectively. the partner economy Shanghai-China is outperforming these two countries by a significant margin, with a mean score of 556. An additional group of oeCd countries and partner countries and economies perform around a quarter of a standard deviation or more above the oeCd mean: hong Kong-China (with a mean of 533), Singapore (526), Canada (524), new Zealand (521) and Japan (520). Australia is not far behind with a mean score of 515. the next seven oeCd countries and one partner economy have mean scores that can be confidently judged as significantly above the oeCd mean: the netherlands (508), Belgium (506), norway (503), estonia (501), Switzerland (501), Poland (500), Iceland (500) and liechtenstein (499). nine other oeCd countries perform at a level not significantly different from the oeCd mean: the united States, Sweden, Germany, Ireland, France, denmark, the united Kingdom, hungary and Portugal. one partner economy, Chinese taipei, is also in this category.
In comparing mean reading performance across countries, there are clear and substantial disparities. the lowest performing oeCd country, mexico, has an average score of 425 points. this means that the gap between the highest and lowest performing oeCd countries is 114 points – well over one standard deviation or the equivalent of almost three school years, on average across countries. however, the gap between the partner countries/economies is even larger, with 242 score points – over two and a half standard deviations or the equivalent of more than 6 school years – separating the mean performance of Shanghai-China (556) and Kyrgyzstan (314).
Because the figures are derived from samples, it is not possible to determine a precise rank of a country’s performance among the participating countries. It is possible, however, to determine, with confidence, a range of ranks in which the country’s performance level lies (Figure I.2.16).
Gender differences in performance on the reading scale Concern about gender differences in education in much of the 20th century focused on the disadvantage and underachievement of girls. more recently, however, the underachievement of boys in reading literacy has become the focus of policy attention. In the PISA 2009 reading assessment, girls outperform boys in every participating country by an average, across oeCd countries, of 39 PISA score points: over half a proficiency level and roughly the equivalent of an average school year’s progress (see table A1.2). Figure I.2.17 shows gender differences in reading performance for each country. tables I.2.2 and I.2.3 provide further details.
While girls outperform boys in reading in every participating country, the gap is much wider in some countries than in others. As shown in Volume III, Learning to Learn, these differences closely relate to gender differences in student attitudes and behaviours. With the exception of denmark, the northern european countries have above-average gender gaps; the most pronounced of these is in Finland, where the score difference is, at 55 points, the greatest of all oeCd countries. the gender differences in east Asian countries and economies tend to cluster just below the average, with Korea, hong Kong-China, macao-China and Chinese taipei all showing gaps of between 33 and 37 points. however, the highest performing among these countries and economies, Shanghai-China, also has a slightly wider gender gap of 40 points.
In each of the country groups described above, the country with the highest or second highest mean overall is also the country with the widest gender gap: in other words, in these countries, girls are disproportionately contributing to the country’s high reading proficiency. Strategies to improve boys’ reading proficiency would have an accentuated effect on overall achievement.

2A PROFILE OF STUDENT PERFORMANCE IN READING
56 © OECD 2010 PISA 2009 ReSultS: WhAt StudentS KnoW And CAn do – Volume I
• Figure I.2.16 •Where countries rank in reading performance
Statistically significantly above the oeCd average not statistically significantly different from the oeCd averageStatistically significantly below the oeCd average
Reading scale
Mean Score S.E.
Range of rankOECD countries All countries/economies
Upper rank Lower rank Upper rank Lower rankShanghai-China 556 (2.4) 1 1Korea 539 (3.5) 1 2 2 4Finland 536 (2.3) 1 2 2 4Hong Kong-China 533 (2.1) 3 4Singapore 526 (1.1) 5 6Canada 524 (1.5) 3 4 5 7New Zealand 521 (2.4) 3 5 6 9Japan 520 (3.5) 3 6 5 9Australia 515 (2.3) 5 7 8 10Netherlands 508 (5.1) 5 13 8 16Belgium 506 (2.3) 7 10 10 14Norway 503 (2.6) 7 14 10 18Estonia 501 (2.6) 8 17 11 21Switzerland 501 (2.4) 8 17 11 21Poland 500 (2.6) 8 17 11 22Iceland 500 (1.4) 9 16 12 19United States 500 (3.7) 8 20 11 25Liechtenstein 499 (2.8) 11 23Sweden 497 (2.9) 10 21 13 26Germany 497 (2.7) 11 21 14 26Ireland 496 (3.0) 12 22 15 27France 496 (3.4) 11 22 14 27Chinese Taipei 495 (2.6) 17 27Denmark 495 (2.1) 15 22 18 26United Kingdom 494 (2.3) 15 22 19 27Hungary 494 (3.2) 13 22 16 27Portugal 489 (3.1) 18 24 23 31Macao-China 487 (0.9) 27 30Italy 486 (1.6) 22 24 27 31Latvia 484 (3.0) 27 34Slovenia 483 (1.0) 23 26 30 33Greece 483 (4.3) 22 29 27 37Spain 481 (2.0) 24 28 30 35Czech Republic 478 (2.9) 24 29 31 37Slovak Republic 477 (2.5) 25 29 32 37Croatia 476 (2.9) 33 39Israel 474 (3.6) 26 31 33 40Luxembourg 472 (1.3) 29 31 36 39Austria 470 (2.9) 29 32 36 41Lithuania 468 (2.4) 38 41Turkey 464 (3.5) 31 32 39 43Dubai (UAE) 459 (1.1) 41 43Russian Federation 459 (3.3) 41 43Chile 449 (3.1) 33 33 44 44Serbia 442 (2.4) 45 46Bulgaria 429 (6.7) 45 50Uruguay 426 (2.6) 46 50Mexico 425 (2.0) 34 34 46 49Romania 424 (4.1) 46 50Thailand 421 (2.6) 47 51Trinidad and Tobago 416 (1.2) 50 52Colombia 413 (3.7) 50 55Brazil 412 (2.7) 51 54Montenegro 408 (1.7) 53 56Jordan 405 (3.3) 53 58Tunisia 404 (2.9) 54 58Indonesia 402 (3.7) 54 58Argentina 398 (4.6) 55 59Kazakhstan 390 (3.1) 58 60Albania 385 (4.0) 59 60Qatar 372 (0.8) 61 63Panama 371 (6.5) 61 64Peru 370 (4.0) 61 64Azerbaijan 362 (3.3) 63 64Kyrgyzstan 314 (3.2) 65 65
Source: oeCd, PISA 2009 Database.12 http://dx.doi.org/10.1787/888932343133

2A PROFILE OF STUDENT PERFORMANCE IN READING
PISA 2009 ReSultS: WhAt StudentS KnoW And CAn do – Volume I © OECD 2010 57
Score point differenceMean score
Note: All gender differences are statistically significant (see Annex A3).Countries are ranked in ascending order of the gender score point difference (girls – boys).Source: OECD, PISA 2009 Database, Table I.2.3.
250 300 350 400 450 500 550 600 0 10 20 30 40 50 60 70
• Figure I. 2.17 •Gender differences in reading performance
Mean score on the reading scale Gender difference (girls – boys)
In all countries/economies girls perform better than boysAll studentsBoys Girls
ColombiaChilePeru
AzerbaijanNetherlandsUnited States
MexicoUnited Kingdom
BelgiumBrazil
DenmarkSpain
TunisiaSingapore
LiechtensteinHong Kong-China
PanamaMacao-China
CanadaKorea
IndonesiaArgentinaAustralia
Chinese TaipeiThailandHungaryPortugal
SwitzerlandJapan
IrelandLuxembourg
SerbiaGermany
Shanghai-ChinaFranceAustria
UruguayIsrael
RomaniaKazakhstan
TurkeyIcelandEstonia
Russian FederationSweden
New ZealandItaly
GreeceNorwayLatvia
Czech RepublicPolandQatar
Dubai (UAE)Croatia
Slovak RepublicMontenegroKyrgyzstan
SloveniaFinlandJordan
Trinidad and TobagoLithuaniaBulgariaAlbania
OECD average 39 score points
1 2 http://dx.doi.org/10.1787/888932343133

2A PROFILE OF STUDENT PERFORMANCE IN READING
58 © OECD 2010 PISA 2009 ReSultS: WhAt StudentS KnoW And CAn do – Volume I
Yet there is no obvious pattern regarding gender performance among groups of countries with lower performance overall. For example, among the group of latin American countries, both the highest performing overall (Chile) and the lowest performing (Peru) have the same, relatively small, gender gap (22 points). one of the middle-ranking countries within this group, Colombia, has by far the smallest gender gap of any country, with a difference of only 9 score points between the means for girls and boys.
how large are these gender differences in terms of the average level of proficiency that boys and girls achieve? one way to think of this is to consider where most boys and girls fall in their highest level of proficiency. As can be seen in Figure I.2.18, the most common highest proficiency level for both boys and girls is level 3, but whereas almost as many boys are at level 2 as level 3, for girls, level 4 is the second most common level attained. Another way to compare performance around the middle of the reading scale is by noting that half of boys (51%) but only a third of girls (34%) fail to reach level 3, which is associated with being able to perform the kinds of tasks that are commonly demanded of young and older adults in their everyday lives. this represents a major difference in the capabilities of boys and girls at age 15.
% %
• Figure I.2.18 •How proficient are girls and boys in reading?
OECD average percentages of boys and girls who performed at the different levels of reading proficiency
Boys Girls
Source: OECD, PISA 2009 Database, Table I.2.2.
0 5 10 15 20 25 30 3505101520253035
Level 6
Level 5
Level 4
Level 3
Level 2
Level 1a
Level 1b
Below Level 1b1.8
6.6
16.6
26.0
27.0
16.8
4.8
0.5
0.5
2.6
9.5
21.9
30.9
24.7
8.8
1.2
1 2 http://dx.doi.org/10.1787/888932343133
Gender differences are also important when comparing the number of students with particularly low levels of reading proficiency. eighteen countries had more than 50% of 15-year-old boys performing below level 2 on the reading scale, but only five countries showed the same proportion of girls at that level. Across oeCd countries, only about half as many girls as boys perform below level 2, but the ratio varies according to overall country performance. In countries with generally low levels of performance in reading, the proportions of girls and boys performing below level 2 tend to be similar. For example, there are at least four-fifths of the number of girls as boys who perform below level 2 in Colombia, Kyrgyzstan, Azerbaijan, Peru and Panama, all of which have low mean reading scores overall. In these countries’ efforts to develop reading proficiency, boys and girls need to receive equal attention. In contrast, overall, the two countries/economies with the widest gender gap at low levels of performance are two of the highest performing countries and economies. In Finland and Shanghai-China, the number of girls performing below level 2 is only one-quarter that of the number of boys. these countries might consider examining the obstacles that prevent boys from achieving high proficiency in reading. Some of the differences relate closely to gender differences in attitudes and behaviour, which are discussed in Volume III.
Some of the variations in boys’ and girls’ proficiency across different aspects and text formats will emerge in the discussion of the reading subscales in the sections that follow. Such variations provide insights into the areas that reading curricula and pedagogy could focus on in an effort to close the gender gap by improving boys’ access to and engagement with different kinds of reading tasks and diverse texts. Again, some of these differences are related to gender differences in attitudes and behaviour, which are discussed in Volume III.

2A PROFILE OF STUDENT PERFORMANCE IN READING
PISA 2009 ReSultS: WhAt StudentS KnoW And CAn do – Volume I © OECD 2010 59
STUDENT PERFORMANCE IN DIFFERENT AREAS OF READING ACROSS PARTICIPATING COUNTRIES this section takes a more nuanced look at reading performance by analysing student performance at the level of the reading subscales – the aspect subscales: access and retrieve, integrate and interpret and reflect and evaluate; and the text-format subscales: continuous and non-continuous.
Aspect subscales
Student performance on the access and retrieve reading subscale About one-quarter of the questions in the pool of reading tasks in PISA 2009 were assigned to the access and retrieve subscale. As noted before, tasks classified as access and retrieve involve skills associated with finding, selecting and collecting information. Sometimes finding the required information is relatively simple, as it is directly and plainly stated in the text. however, access and retrieve tasks are not necessarily easy ones. For example, sometimes more than one piece of information is required; sometimes knowledge of text structures and features is called upon.
In assessment tasks that call for retrieving information, students usually must match information given in the question with either identically worded or synonymous information in the text, and use this to find the new information requested. easy retrieval tasks characteristically require a literal match between the words of the task and the words in the text. more difficult retrieval tasks often involve finding synonymous information, forming mental categories to identify what needs to be found, or discriminating between two similar pieces of information. different levels of proficiency can be measured by systematically varying the elements that contribute to the difficulty of the task.
• Figure I.2.19 •Summary descriptions of the seven proficiency levels on the reading subscale access and retrieve
Level
Percentage of students able to perform tasks at each level or above (OECD average) Characteristics of tasks
Examples of released access and retrieve questions
6 1.4% of students across the OECD can perform tasks at Level 6
Combine multiple pieces of independent information, from different parts of a mixed text, in an accurate and precise sequence, working in an unfamiliar context.
5 9.5% of students across the OECD can perform tasks at least at Level 5
locate and possibly combine multiple pieces of deeply embedded information, some of which may be outside the main body of the text. deal with strongly distracting competing information.
4 30.4% of students across the OECD can perform tasks at least at Level 4
locate several pieces of embedded information, each of which may need to meet multiple criteria, in a text with unfamiliar context or form. Possibly combine verbal and graphical information. deal with extensive and/or prominent competing information.
BALLOON – Question 3.2 (595)
3 57.9% of students across the OECD can perform tasks at least at Level 3
locate several pieces of information, each of which may need to meet multiple criteria. Combine pieces of information within a text. deal with competing information.
2 80.4% of students across the OECD can perform tasks at least at Level 2
locate one or more pieces of information, each of which may need to meet multiple criteria. deal with some competing information.
BALLOON –Question 3.2 (449)
1a 93.0% of students across the OECD can perform tasks at least at Level 1a
locate one or more independent pieces of explicitly stated information meeting a single criterion, by making a literal or synonymous match. the target information may not be prominent in the text but there is little or no competing information.
BRUSHING YOUR TEETH – Question 2 (358)
1b 98.0% of students across the OECD can perform tasks at least at Level 1b
locate a single piece of explicitly stated information in a prominent position in a simple text, by making a literal or synonymous match, where there is no competing information. may make simple connections between adjacent pieces of information.
MISER – Question 7 (310)
BRUSHING YOUR TEETH – Question 3 (285)
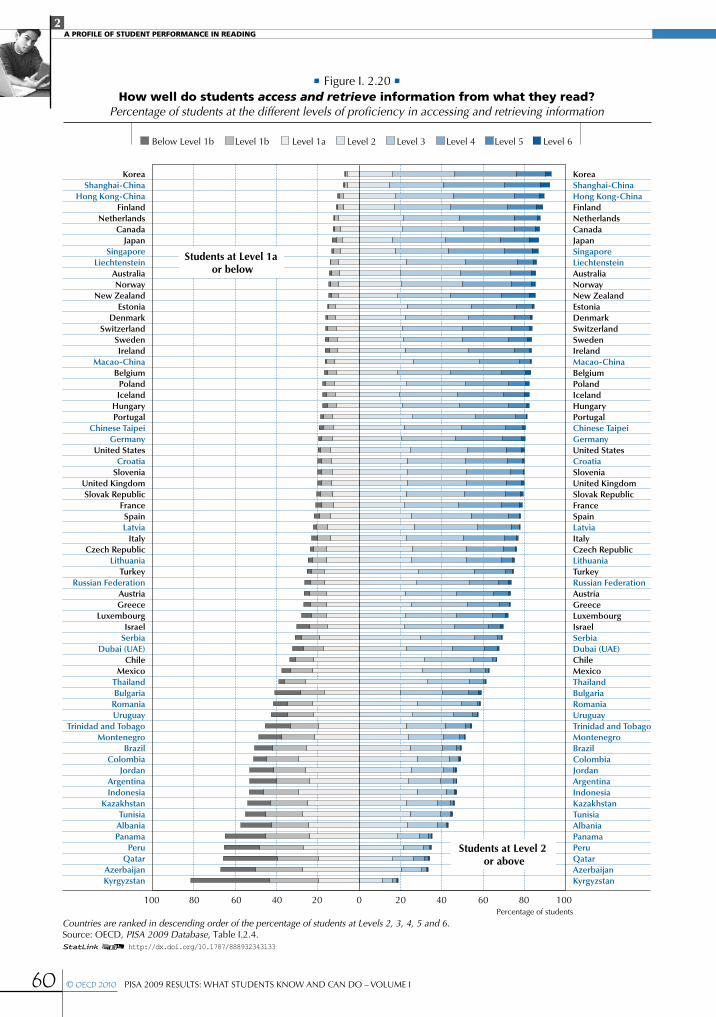
2A PROFILE OF STUDENT PERFORMANCE IN READING
60 © OECD 2010 PISA 2009 ReSultS: WhAt StudentS KnoW And CAn do – Volume I
Percentage of students
Countries are ranked in descending order of the percentage of students at Levels 2, 3, 4, 5 and 6.Source: OECD, PISA 2009 Database, Table I.2.4.
100 80 60 40 20 0 20 40 60 80 100
• Figure I. 2.20 •How well do students access and retrieve information from what they read?
Percentage of students at the different levels of proficiency in accessing and retrieving information
Students at Level 1a or below
Students at Level 2 or above
KoreaShanghai-China
Hong Kong-ChinaFinland
NetherlandsCanada
JapanSingapore
LiechtensteinAustraliaNorway
New ZealandEstonia
DenmarkSwitzerland
SwedenIreland
Macao-ChinaBelgium
PolandIceland
HungaryPortugal
Chinese TaipeiGermany
United StatesCroatia
SloveniaUnited KingdomSlovak Republic
FranceSpainLatvia
ItalyCzech Republic
LithuaniaTurkey
Russian FederationAustriaGreece
LuxembourgIsrael
SerbiaDubai (UAE)
ChileMexico
ThailandBulgaria
RomaniaUruguay
Trinidad and TobagoMontenegro
BrazilColombia
JordanArgentinaIndonesia
KazakhstanTunisia
AlbaniaPanama
PeruQatar
AzerbaijanKyrgyzstan
KoreaShanghai-ChinaHong Kong-ChinaFinlandNetherlandsCanadaJapanSingaporeLiechtensteinAustraliaNorwayNew ZealandEstoniaDenmarkSwitzerlandSwedenIrelandMacao-ChinaBelgiumPolandIcelandHungaryPortugalChinese TaipeiGermanyUnited StatesCroatiaSloveniaUnited KingdomSlovak RepublicFranceSpainLatviaItalyCzech RepublicLithuaniaTurkeyRussian FederationAustriaGreeceLuxembourgIsraelSerbiaDubai (UAE)ChileMexicoThailandBulgariaRomaniaUruguayTrinidad and TobagoMontenegroBrazilColombiaJordanArgentinaIndonesiaKazakhstanTunisiaAlbaniaPanamaPeruQatarAzerbaijanKyrgyzstan
Level 1aLevel 1bBelow Level 1b Level 2 Level 3 Level 4 Level 5 Level 6
1 2 http://dx.doi.org/10.1787/888932343133

2A PROFILE OF STUDENT PERFORMANCE IN READING
PISA 2009 ReSultS: WhAt StudentS KnoW And CAn do – Volume I © OECD 2010 61
Figure I.2.19 provides descriptions of the nature of the reading skills, knowledge and understanding required at each level of the scale for the access and retrieve aspect of reading, with the percentage of students across oeCd countries who perform at this level in PISA 2009. the right-hand column lists examples of access and retrieve questions. Figures I.2.40 to I.2.46 describe these questions and provide commentary on what they show.
Figure I.2.20 shows the percentage of students at each proficiency level on the access and retrieve subscale. details of performance by gender on this subscale are also provided in table I.2.5.
the mean score for oeCd countries on the access and retrieve subscale is 495 points, slightly higher than the mean for reading as a whole. the distribution of performance is more dispersed on the access and retrieve subscale than on the overall reading scale (the standard deviation was 101 points compared with 93 points for the overall reading scale). the higher mean and wider distribution suggest that more students performed at very high levels on the access and retrieve subscale than on the overall reading literacy scale. Five countries or economies yielded more than 3% of students at level 6: the oeCd countries Japan, Finland and new Zealand, as well as the partner countries and economies Shanghai-China and Singapore. In Shanghai-China, 17% of students also performed at level 5. Although on average countries performed more strongly on the access and retrieve subscale, the wider spread of results is evident at the lower end of the scale, in even lower performance by some countries in this aspect than in reading overall. In 13 partner countries – Kyrgyzstan, Azerbaijan, Qatar, Peru, Panama, Albania, tunisia, Kazakhstan, Indonesia, Argentina, Jordan, Colombia and Brazil – more than 50% of students performed below level 2.
Figure I.2.21 shows each country’s mean score on the access and retrieve subscale, and allows readers to see for which pairs of countries the differences between the means shown are statistically significant. For each country shown on the left in the middle column, the list of countries on the right hand column shows countries whose mean scores are not sufficiently different to be distinguished with confidence. For all other cases, one country has higher performance than another if it is above it in the list in the middle column, and lower performance if it is below it.
table I.2.6 presents the mean score, variation and gender difference for each country on this subscale. As on the overall reading scale, girls performed more strongly than boys on the access and retrieve subscale in every country except in Colombia, where the difference is not significant. the mean difference was similar to the reading scale (40 points and 39 points, respectively).
Student performance on the integrate and interpret reading subscale
As noted before, the aspect integrate and interpret involves processing what is read to make internal sense of a text. Integrating tasks require the reader to understand the relation(s) between different parts of a text. these relations include problem-solution, cause-effect, category-example, equivalency, compare-contrast, and understanding whole-part relationships. to complete such tasks, students had to determine the appropriate connection. In easier tasks this may be explicitly signalled, as when the text states “the cause of X is Y”; in more difficult tasks, an inference may be required by the reader. the parts to be related may be near each other in the text or in different paragraphs or even in different texts. Interpreting refers to the process of making meaning from something that is not stated. It may involve recognising a relationship that is not explicit or inferring, that is deducing from evidence and reasoning, the connotation of a phrase or a sentence. When interpreting, a reader is identifying the underlying assumptions or implications of part or all of the text.
With around half of the questions in the pool of PISA reading tasks assigned to the integrate and interpret subscale, it encompasses a wide spectrum both in cognitive characteristics and difficulty. the difficulty of these tasks is determined by the number of pieces of information to be integrated and the number of locations where they are found, as well as by the verbal complexity and the familiarity of the subject.
Figure I.2.22 provides details of the nature of the reading skills, knowledge and understanding required at each level of the described proficiency scale for the integrate and interpret aspect of reading, with the percentage of students across oeCd countries who performed at this level in PISA 2009. the right hand column shows examples of released integrate and interpret questions. Figures I.2.40 to I.2.46 describe these questions and comments on what they show.

2A PROFILE OF STUDENT PERFORMANCE IN READING
62 © OECD 2010 PISA 2009 ReSultS: WhAt StudentS KnoW And CAn do – Volume I
• Figure I.2.21 •Comparing countries on access and retrieve performance
Mean Comparison country Countries whose mean score is NOT statistically significantly different from that of the comparison country
549 Shanghai-China Korea542 Korea Shanghai-China532 Finland Japan, hong Kong-China530 Japan Finland, hong Kong-China, Singapore, netherlands530 Hong Kong-China Finland, Japan, Singapore, netherlands526 Singapore Japan, hong Kong-China, netherlands521 New Zealand netherlands, Canada519 Netherlands Japan, hong Kong-China, Singapore, new Zealand, Canada, Belgium, Australia, norway, liechtenstein517 Canada new Zealand, netherlands, Belgium, Australia, norway513 Belgium netherlands, Canada, Australia, norway, liechtenstein513 Australia netherlands, Canada, Belgium, norway, liechtenstein512 Norway netherlands, Canada, Belgium, Australia, liechtenstein, Iceland, Switzerland, Sweden508 Liechtenstein netherlands, Belgium, Australia, norway, Iceland, Switzerland, Sweden, estonia, denmark, hungary, Germany, Poland, Ireland 507 Iceland norway, liechtenstein, Switzerland, Sweden, estonia, denmark, hungary, Germany505 Switzerland norway, liechtenstein, Iceland, Sweden, estonia, denmark, hungary, Germany, Poland, Ireland505 Sweden norway, liechtenstein, Iceland, Switzerland, estonia, denmark, hungary, Germany, Poland, Ireland503 Estonia liechtenstein, Iceland, Switzerland, Sweden, denmark, hungary, Germany, Poland, Ireland, Chinese taipei502 Denmark liechtenstein, Iceland, Switzerland, Sweden, estonia, hungary, Germany, Poland, Ireland, Chinese taipei501 Hungary liechtenstein, Iceland, Switzerland, Sweden, estonia, denmark, Germany, Poland, Ireland, Chinese taipei, united States, France501 Germany liechtenstein, Iceland, Switzerland, Sweden, estonia, denmark, hungary, Poland, Ireland, Chinese taipei, united States, France, Croatia500 Poland liechtenstein, Switzerland, Sweden, estonia, denmark, hungary, Germany, Ireland, Chinese taipei, united States, France498 Ireland liechtenstein, Switzerland, Sweden, estonia, denmark, hungary, Germany, Poland, Chinese taipei, macao-China, united States, France, Croatia,
united Kingdom, Slovak Republic496 Chinese Taipei estonia, denmark, hungary, Germany, Poland, Ireland, macao-China, united States, France, Croatia, united Kingdom, Slovak Republic, Portugal493 Macao-China Ireland, Chinese taipei, united States, France, Croatia, united Kingdom, Slovak Republic, Portugal492 United States hungary, Germany, Poland, Ireland, Chinese taipei, macao-China, France, Croatia, united Kingdom, Slovak Republic, Slovenia, Portugal492 France hungary, Germany, Poland, Ireland, Chinese taipei, macao-China, united States, Croatia, united Kingdom, Slovak Republic, Slovenia, Portugal492 Croatia Germany, Ireland, Chinese taipei, macao-China, united States, France, united Kingdom, Slovak Republic, Slovenia, Portugal491 United Kingdom Ireland, Chinese taipei, macao-China, united States, France, Croatia, Slovak Republic, Slovenia, Portugal491 Slovak Republic Ireland, Chinese taipei, macao-China, united States, France, Croatia, united Kingdom, Slovenia, Portugal489 Slovenia united States, France, Croatia, united Kingdom, Slovak Re public, Portugal488 Portugal Chinese taipei, macao-China, united States, France, Croatia, united Kingdom, Slovak Republic, Slovenia, Italy482 Italy Portugal, Spain, Czech Republic, Austria, lithuania, latvia480 Spain Italy, Czech Republic, Austria, lithuania, latvia479 Czech Republic Italy, Spain, Austria, lithuania, latvia477 Austria Italy, Spain, Czech Republic, lithuania, latvia, luxembourg, Russian Federation, Greece, turkey476 Lithuania Italy, Spain, Czech Republic, Austria, latvia, luxembourg, Russian Federation, Greece, turkey476 Latvia Italy, Spain, Czech Republic, Austria, lithuania, luxembourg, Russian Federation, Greece, turkey471 Luxembourg Austria, lithuania, latvia, Russian Federation, Greece, turkey, Israel469 Russian Federation Austria, lithuania, latvia, luxembourg, Greece, turkey, Israel 468 Greece Austria, lithuania, latvia, luxembourg, Russian Federation, turkey, Israel467 Turkey Austria, lithuania, latvia, luxembourg, Russian Federation, Greece, Israel463 Israel luxembourg, Russian Federation, Greece, turkey, dubai (uAe)458 Dubai (UAE) Israel449 Serbia Chile444 Chile Serbia, Bulgaria433 Mexico thailand, Bulgaria, Romania431 Thailand mexico, Bulgaria, uruguay, Romania430 Bulgaria Chile, mexico, thailand, uruguay, Romania, trinidad and tobago424 Uruguay thailand, Bulgaria, Romania423 Romania mexico, thailand, Bulgaria, uruguay, trinidad and tobago413 Trinidad and Tobago Bulgaria, Romania, Brazil408 Montenegro Brazil, Colombia, Indonesia407 Brazil trinidad and tobago, montenegro, Colombia, Indonesia, Kazakhstan404 Colombia montenegro, Brazil, Indonesia, Kazakhstan, Argentina, Jordan399 Indonesia montenegro, Brazil, Colombia, Kazakhstan, Argentina, Jordan, tunisia397 Kazakhstan Brazil, Colombia, Indonesia, Argentina, Jordan, tunisia394 Argentina Colombia, Indonesia, Kazakhstan, Jordan, tunisia394 Jordan Colombia, Indonesia, Kazakhstan, Argentina, tunisia393 Tunisia Indonesia, Kazakhstan, Argentina, Jordan380 Albania Panama364 Peru Panama, Azerbaijan363 Panama Albania, Peru, Azerbaijan, Qatar361 Azerbaijan Peru, Panama, Qatar354 Qatar Panama, Azerbaijan299 Kyrgyzstan
Source: oeCd, PISA 2009 Database.12 http://dx.doi.org/10.1787/888932343133
Statistically significantly above the oeCd average not statistically significantly different from the oeCd averageStatistically significantly below the oeCd average

2A PROFILE OF STUDENT PERFORMANCE IN READING
PISA 2009 ReSultS: WhAt StudentS KnoW And CAn do – Volume I © OECD 2010 63
Figure I.2.23 shows the percentage of students at each proficiency level on the integrate and interpret subscale. details of performance by gender on this subscale are provided in table I.2.8.
Because such a large proportion – nearly 50% – of the questions in the PISA 2009 reading assessment contributed to this subscale, most of the features of the integrate and interpret subscale are similar to those of the overall reading scale. the two are virtually indistinguishable in terms of mean and spread of performance across oeCd countries: the average for the integrate and interpret subscale has a mean of 493 and standard deviation of 94, while for the overall reading scale, the figures are 493 and 93, respectively.
the spread of performance on the integrate and interpret subscale is also very close to that of the overall reading scale. Across oeCd countries, the largest percentage of students – 28% – performed at level 3 on this subscale; the figure for reading is 29%. on this subscale, in new Zealand and in the partner countries and economies Singapore and Shanghai-China, more than 3% of students performed at level 6. In several countries and economies, substantial percentages of students performed at levels 5 and 6 combined: over 10% in the oeCd countries Finland, new Zealand, Korea, Japan, Canada, Australia, Belgium, France, the netherlands and the united States, and in the partner countries and economies Shanghai-China, Singapore and hong Kong-China. the high performance in these countries was not confined to a small elite: for example, in Finland and Korea, and in partner economy Shanghai-China, the largest proportions of students – above 30% in each case – were proficient at level 4.
• Figure I.2.22 •Summary descriptions of the seven proficiency levels on the reading subscale
integrate and interpret
Level
Percentage of students able to perform tasks at each level or above (OECD average) Characteristics of tasks
Examples of released integrate and interpret questions
6 1.1% of students across the OECD can perform tasks at Level 6
make multiple inferences, comparisons and contrasts that are both detailed and precise. demonstrate a full and detailed understanding of the whole text or specific sections. may involve integrating information from more than one text. deal with unfamiliar abstract ideas, in the presence of prominent competing information. Generate abstract categories for interpretations.
THE PLAY’S THE THING – Question 3 (730)
5 8.3% of students across the OECD can perform tasks at least at Level 5
demonstrate a full and detailed understanding of a text. Construe the meaning of nuanced language. Apply criteria to examples scattered through a text, using high level inference. Generate categories to describe relationships between parts of a text. deal with ideas that are contrary to expectations.
4 28.4% of students across the OECD can perform tasks at least at Level 4
use text-based inferences to understand and apply categories in an unfamiliar context, and to construe the meaning of a section of text by taking into account the text as a whole. deal with ambiguities and ideas that are negatively worded.
MOBILE PHONE SAFETY – Question 2 (561)THE PLAY’S THE THING – Question 7 (556)
3 56.6% of students across the OECD can perform tasks at least at Level 3
Integrate several parts of a text in order to identify the main idea, understand a relationship or construe the meaning of a word or phrase. Compare, contrast or categorise taking many criteria into account. deal with competing information.
MISER – Question 5 (548)TELECOMMUTING – Question 1 (537)MOBILE PHONE SAFETY – Question 9 (488)
2 80.7% of students across the OECD can perform tasks at least at Level 2
Identify the main idea in a text, understand relationships, form or apply simple categories, or construe meaning within a limited part of the text when the information is not prominent and low-level inferences are required.
THE PLAY’S THE THING – Question 4 (474) BLOOD DONATION NOTICE – Question 8 (438)
1a94.3% of students across the OECD can perform tasks at least at Level 1a
Recognise the main theme or author’s purpose in a text about a familiar topic, when the required information in the text is prominent.
MISER – Question 1 (373)BALLOON – Question 8 (370)BRUSHING YOUR TEETH – Question 1 (353)
1b98.9% of students across the OECD can perform tasks at least at Level 1b
either recognise a simple idea that is reinforced several times in the text (possibly with picture cues), or interpret a phrase, in a short text on a familiar topic.

2A PROFILE OF STUDENT PERFORMANCE IN READING
64 © OECD 2010 PISA 2009 ReSultS: WhAt StudentS KnoW And CAn do – Volume I
Percentage of students
Countries are ranked in descending order of the percentage of students at Levels 2, 3, 4, 5 and 6.Source: OECD, PISA 2009 Database, Table I.2.7.
100 80 60 40 20 0 20 40 60 80 100
• Figure I. 2.23 •How well do students integrate and interpret what they read?
Percentage of students at the different proficiency levels in integrating and interpreting what they read
Students at Level 1a or below
Students at Level 2 or above
Shanghai-ChinaKorea
FinlandHong Kong-China
CanadaSingapore
JapanEstonia
Macao-ChinaPoland
Chinese TaipeiNew Zealand
AustraliaDenmark
NorwayNetherlands
LiechtensteinHungary
IcelandLatvia
SwitzerlandGermany
IrelandPortugalSwedenBelgium
ItalySpain
SloveniaUnited States
United KingdomCzech Republic
FranceGreece
Slovak RepublicCroatia
LithuaniaRussian Federation
LuxembourgTurkeyAustria
IsraelChile
SerbiaDubai (UAE)
BulgariaRomaniaUruguayMexico
MontenegroTrinidad and Tobago
JordanThailand
ColombiaBrazil
ArgentinaAlbaniaTunisia
IndonesiaKazakhstan
QatarPeru
PanamaAzerbaijanKyrgyzstan
Shanghai-ChinaKoreaFinlandHong Kong-ChinaCanadaSingaporeJapanEstoniaMacao-ChinaPolandChinese TaipeiNew ZealandAustraliaDenmarkNorwayNetherlandsLiechtensteinHungaryIcelandLatviaSwitzerlandGermanyIrelandPortugalSwedenBelgiumItalySpainSloveniaUnited StatesUnited KingdomCzech RepublicFranceGreeceSlovak RepublicCroatiaLithuaniaRussian FederationLuxembourgTurkeyAustriaIsraelChileSerbiaDubai (UAE)BulgariaRomaniaUruguayMexicoMontenegroTrinidad and TobagoJordanThailandColombiaBrazilArgentinaAlbaniaTunisiaIndonesiaKazakhstanQatarPeruPanamaAzerbaijanKyrgyzstan
Level 1aLevel 1bBelow Level 1b Level 2 Level 3 Level 4 Level 5 Level 6
1 2 http://dx.doi.org/10.1787/888932343133

2A PROFILE OF STUDENT PERFORMANCE IN READING
PISA 2009 ReSultS: WhAt StudentS KnoW And CAn do – Volume I © OECD 2010 65
• Figure I.2.24 •Comparing countries on integrate and interpret performance
Mean Comparison country Countries whose mean score is NOT statistically significantly different from the comparison country558 Shanghai-China541 Korea Finland 538 Finland Korea 530 Hong Kong-China 525 Singapore Canada, Japan 522 Canada Singapore, Japan, new Zealand 520 Japan Singapore, Canada, new Zealand, Australia 517 New Zealand Canada, Japan, Australia 513 Australia Japan, new Zealand, netherlands 504 Netherlands Australia, Belgium, Poland, Iceland, norway, Switzerland, Germany, estonia, Chinese taipei, liechtenstein, France, hungary, united States,
Sweden, Ireland 504 Belgium netherlands, Poland, Iceland, norway, Switzerland, Germany, estonia, Chinese taipei, liechtenstein, France, hungary, united States 503 Poland netherlands, Belgium, Iceland, norway, Switzerland, Germany, estonia, Chinese taipei, liechtenstein, France, hungary, united States 503 Iceland netherlands, Belgium, Poland, norway, Switzerland, Germany, estonia, Chinese taipei, liechtenstein, France, hungary, united States 502 Norway netherlands, Belgium, Poland, Iceland, Switzerland, Germany, estonia, Chinese taipei, liechtenstein, France, hungary, united States, Sweden 502 Switzerland netherlands, Belgium, Poland, Iceland, norway, Germany, estonia, Chinese taipei, liechtenstein, France, hungary, united States, Sweden 501 Germany netherlands, Belgium, Poland, Iceland, norway, Switzerland, estonia, Chinese taipei, liechtenstein, France, hungary, united States, Sweden, Ireland 500 Estonia netherlands, Belgium, Poland, Iceland, norway, Switzerland, Germany, Chinese taipei, liechtenstein, France, hungary, united States,
Sweden, Ireland 499 Chinese Taipei netherlands, Belgium, Poland, Iceland, norway, Switzerland, Germany, estonia, liechtenstein, France, hungary, united States, Sweden, Ireland 498 Liechtenstein netherlands, Belgium, Poland, Iceland, norway, Switzerland, Germany, estonia, Chinese taipei, France, hungary, united States, Sweden,
Ireland, denmark, united Kingdom, Italy 497 France netherlands, Belgium, Poland, Iceland, norway, Switzerland, Germany, estonia, Chinese taipei, liechtenstein, hungary, united States, Sweden,
Ireland, denmark, united Kingdom, Italy 496 Hungary netherlands, Belgium, Poland, Iceland, norway, Switzerland, Germany, estonia, Chinese taipei, liechtenstein, France, united States, Sweden,
Ireland, denmark, united Kingdom, Italy, Czech Republic495 United States netherlands, Belgium, Poland, Iceland, norway, Switzerland, Germany, estonia, Chinese taipei, liechtenstein, France, hungary, Sweden, Ireland,
denmark, united Kingdom, Italy, Slovenia, macao-China, Czech Republic, Portugal494 Sweden netherlands, norway, Switzerland, Germany, estonia, Chinese taipei, liechtenstein, France, hungary, united States, Ireland, denmark, united
Kingdom, Italy, Slovenia, macao-China, Czech Republic, Portugal494 Ireland netherlands, Germany, estonia, Chinese taipei, liechtenstein, France, hungary, united States, Sweden, denmark, united Kingdom, Italy, Slovenia,
macao-China, Czech Republic, Portugal, Greece 492 Denmark liechtenstein, France, hungary, united States, Sweden, Ireland, united Kingdom, Italy, Slovenia, macao-China, Czech Republic, Portugal, Greece 491 United Kingdom liechtenstein, France, hungary, united States, Sweden, Ireland, denmark, Italy, Slovenia, macao-China, Czech Republic, Portugal, latvia, Greece 490 Italy liechtenstein, France, hungary, united States, Sweden, Ireland, denmark, united Kingdom, Slovenia, macao-China, Czech Republic, Portugal,
latvia, Greece 489 Slovenia united States, Sweden, Ireland, denmark, united Kingdom, Italy, macao-China, Czech Republic, Portugal, latvia, Greece 488 Macao-China united States, Sweden, Ireland, denmark, united Kingdom, Italy, Slovenia, Czech Republic, Portugal, latvia, Greece 488 Czech Republic hungary, united States, Sweden, Ireland, denmark, united Kingdom, Italy, Slovenia, macao-China, Portugal, latvia, Greece, Slovak Republic 487 Portugal united States, Sweden, Ireland, denmark, united Kingdom, Italy, Slovenia, macao-China, Czech Republic, latvia, Greece, Slovak Republic, Spain 484 Latvia united Kingdom, Italy, Slovenia, macao-China, Czech Republic, Portugal, Greece, Slovak Republic, Spain 484 Greece Ireland, denmark, united Kingdom, Italy, Slovenia, macao-China, Czech Republic, Portugal, latvia, Slovak Republic, Spain 481 Slovak Republic Czech Republic, Portugal, latvia, Greece, Spain, Israel 481 Spain Portugal, latvia, Greece, Slovak Republic 475 Luxembourg Israel, Croatia, Austria 473 Israel Slovak Republic, luxembourg, Croatia, Austria, lithuania, Russian Federation 472 Croatia luxembourg, Israel, Austria, lithuania, Russian Federation 471 Austria luxembourg, Israel, Croatia, lithuania, Russian Federation 469 Lithuania Israel, Croatia, Austria, Russian Federation 467 Russian Federation Israel, Croatia, Austria, lithuania, turkey 459 Turkey Russian Federation, dubai (uAe), Chile 457 Dubai (UAE) turkey, Chile 452 Chile turkey, dubai (uAe), Serbia 445 Serbia Chile, Bulgaria 436 Bulgaria Serbia, Romania 425 Romania Bulgaria, uruguay, montenegro, trinidad and tobago, mexico, thailand 423 Uruguay Romania, montenegro, trinidad and tobago, mexico, thailand 420 Montenegro Romania, uruguay, trinidad and tobago, mexico, thailand 419 Trinidad and Tobago Romania, uruguay, montenegro, mexico, thailand, Colombia 418 Mexico Romania, uruguay, montenegro, trinidad and tobago, thailand, Colombia 416 Thailand Romania, uruguay, montenegro, trinidad and tobago, mexico, Colombia, Jordan 411 Colombia trinidad and tobago, mexico, thailand, Jordan, Brazil 410 Jordan thailand, Colombia, Brazil 406 Brazil Colombia, Jordan, Argentina 398 Argentina Brazil, Indonesia, Kazakhstan, tunisia, Albania 397 Indonesia Argentina, Kazakhstan, tunisia, Albania 397 Kazakhstan Argentina, Indonesia, tunisia, Albania 393 Tunisia Argentina, Indonesia, Kazakhstan, Albania 393 Albania Argentina, Indonesia, Kazakhstan, tunisia 379 Qatar Azerbaijan, Panama, Peru 373 Azerbaijan Qatar, Panama, Peru 372 Panama Qatar, Azerbaijan, Peru 371 Peru Qatar, Azerbaijan, Panama 327 Kyrgyzstan
Source: oeCd, PISA 2009 Database.12 http://dx.doi.org/10.1787/888932343133
Statistically significantly above the oeCd average not statistically significantly different from the oeCd averageStatistically significantly below the oeCd average

2A PROFILE OF STUDENT PERFORMANCE IN READING
66 © OECD 2010 PISA 2009 ReSultS: WhAt StudentS KnoW And CAn do – Volume I
At the other end of the proficiency range, few countries had very large numbers of students performing below the range of described levels in PISA, but there were several partner countries with more than 10% of students performing below level 1b: Kyrgyzstan, Peru, Qatar, Panama and Argentina. the modal performance of a substantial number of countries on the reading scale was at level 1a on the integrate and interpret subscale, and several partner countries showed over 30% of students performing at this level: Azerbaijan, Indonesia, thailand, tunisia, Kazakhstan and Panama.
Figure I.2.24 shows each country’s mean score on the integrate and interpret subscale, and shows for which pairs of countries the differences between the means shown are statistically significant. For each country shown on the left in the middle column, the list of countries on the right hand column shows countries whose mean scores are not sufficiently different to be distinguished with confidence. For all other cases, one country has higher performance than another if it is above it in the list in the middle column, and lower performance if it is below.
table I.2.9 presents the mean score, variation and gender difference for each country on this subscale. As on the overall reading scale, girls performed more strongly than boys in every country on the integrate and interpret subscale. there is a slightly smaller gap between girls’ and boys’ performance on this subscale (36 compared with 39). nevertheless, in 36 countries the gap was more than half of one proficiency level, and in seven of these (the oeCd countries Finland and Slovenia, and the partner countries Albania, lithuania, Bulgaria, Jordan and trinidad and tobago), it is over 50 points. the appearance of Finland in this group indicates that extreme gender inequality in performance can co-exist with high overall performance. the mean performance of boys in Finland on this subscale (513), as on the overall reading scale (508), is still well above the oeCd average. Colombia exhibits by far the smallest gender gap here as elsewhere in reading, with girls outperforming boys by only eight points.
• Figure I.2.25 •Summary descriptions of the seven proficiency levels on the reading subscale
reflect and evaluate
Level
Percentage of students able to perform tasks at each level or above (OECD average) Characteristics of tasks
Examples of released reflect and evaluate questions
6 1.2% of students across the OECD can perform tasks at Level 6
hypothesise about or critically evaluate a complex text on an unfamiliar topic, taking into account multiple criteria or perspectives, and applying sophisticated understandings from beyond the text. Generate categories for evaluating text features in terms of appropriateness for an audience.
5 8.8% of students across the OECD can perform tasks at least at Level 5
hypothesise about a text, drawing on specialised knowledge, and on deep understanding of long or complex texts that contain ideas contrary to expectations. Critically analyse and evaluate potential or real inconsistencies, either within the text or between the text and ideas outside the text.
4 29.5% of students across the OECD can perform tasks at least at Level 4
use formal or public knowledge to hypothesise about or critically evaluate a text. Show accurate understanding of long or complex texts.
MOBILE PHONE SAFETY – Question 11 (604)
3 57.7% of students across the OECD can perform tasks at least at Level 3
make connections or comparisons, give explanations, or evaluate a feature of a text. demonstrate a detailed understanding of the text in relation to familiar, everyday knowledge, or draw on less common knowledge.
MOBILE PHONE SAFETY – Question 6 (526)TELECOMMUTING – Question 7 (514)BALLOON – Question 4 (510)
2 80.7% of students across the OECD can perform tasks at least at Level 2
make a comparison or connections between the text and outside knowledge, or explain a feature of the text by drawing on personal experience or attitudes.
BALLOON – Question 6 (411)
1a93.5% of students across the OECD can perform tasks at least at Level 1a
make a simple connection between information in the text and common, everyday knowledge.
BRUSHING YOUR TEETH – Question 4 (399)BLOOD DONATION NOTICE – Question 9 (368)
1b98.4% of students across the OECD can perform tasks at least at Level 1b
there are no questions at this level in the existing reading question pool.

2A PROFILE OF STUDENT PERFORMANCE IN READING
PISA 2009 ReSultS: WhAt StudentS KnoW And CAn do – Volume I © OECD 2010 67
Student performance on the reflect and evaluate reading subscale Reflect and evaluate tasks involve engaging with a text while drawing on information, ideas or values external to the text. In reflecting on a text, readers relate their own experience or knowledge to the text. In evaluating a text, readers make a judgement about it, either drawing on personal experience or on knowledge of the world that may be formal or content-based. Reflecting on and evaluating the content of a text requires the reader to connect information in a text to knowledge from outside sources. to do so, readers must be able to understand what is said and intended in a text. they must then test that mental representation against what they know and believe on the basis of either prior information or information found in other texts. Reflecting on and evaluating the form of a text requires readers to stand apart from the text, consider it objectively and evaluate its quality and appropriateness. Knowledge of text structure, the style typical of different kinds of texts and register play an important role in these tasks.
About one-quarter of the questions in the pool of reading tasks for PISA 2009 address the reflect and evaluate aspect. the difficulty of questions with this classification is determined by several factors, including the quantity and explicitness of information to support reflection and evaluation, and the extent to which the information is common knowledge. easier tasks require the reader to relate a text dealing with a familiar topic to familiar and personal knowledge. For such tasks, the question provides a clear direction to the reader about the criterion that should form the basis of the connection. At the other end of the scale, difficult reflect and evaluate tasks, which typically relate to more complex texts on topics that are not within the reader’s immediate experience, require the reader to evaluate the structure or content of the text drawing on formal standards, or to hypothesise about some element of the text, such as why it is presented in a particular form, using criteria that are not provided. Readers need to generate their own terms of reference using internalised standards of relevance and plausibility.
Figure I.2.25 provides details of the nature of the reading skills, knowledge and understanding required at each level of the proficiency scale for the reflect and evaluate aspect of reading, along with the percentage of students across oeCd countries who perform at this level in PISA 2009. the right hand column shows examples of released reflect and evaluate questions. Figures I.2.40 to I.2.46 describe these questions and provide commentary on what they show.
Figure I.2.26 shows the percentage of students at each proficiency level on the reflect and evaluate subscale. details of performance by gender on this subscale are also provided in table I.2.11.
mean performance across oeCd countries was slightly higher on the reflect and evaluate subscale than on the overall reading scale (494 compared with 493 points), and was also slightly more dispersed (a standard deviation of 97 compared with 93). Some high performing countries on the overall reading literacy scale show particularly strong performance at the top end of the scale. In the oeCd countries, nearly 5% of students in new Zealand attained level 6 (more than the proportion reaching level 6 for any other country in any aspect of reading), and over 2% of students did so in Japan, Australia, Canada, the united States, new Zealand and Korea and in the partner countries and economies Singapore and Shanghai-China. At the other end of the scale, those countries that performed poorly overall also performed poorly on this subscale, though reflect and evaluate appears to be a particularly problematic aspect for several low-to-moderate performing countries from eastern europe: the Slovak Republic, the Czech Republic and Slovenia, and the partner countries Serbia and the Russian Federation. With mean scores on the overall reading scale between 442 and 483, these countries all have significantly lower means on the reflect and evaluate subscale, by at least 12 points, and at least 3% more students performing at or below level 1b.
Figure I.2.27 shows each country’s mean score on the reflect and evaluate subscale, and shows for which pairs of countries the differences between the means shown are statistically significant. For each country shown on the left in the middle column, the list of countries on the right hand column shows countries whose mean scores are not sufficiently different to be distinguished with confidence. For all other cases, one country has higher performance than another if it is above it in the list in the middle column, and lower performance if it is below it.
table I.2.12 presents the mean and standard deviation overall, means for boys and girls and gender difference, percentiles score, variation and gender difference for each country on this subscale. As on the overall reading scale, girls universally performed better than boys in every country on the reflect and evaluate subscale. there is a larger average gap between girls’ and boys’ performance on this subscale than on the overall reading scale (44 compared with 39). the scale also shows the largest gaps over all in countries, of up to 70 points – almost a full proficiency level. the oeCd country Slovenia and 7 partner countries have a gender gap of at least 60 points: Albania, Bulgaria, trinidad and tobago, Jordan, lithuania, Croatia and montenegro. Five of these eight countries are in southeastern europe, where there appears to be some tendency for boys to be particularly weak in reflection and evaluation relative to girls. As an example, in Bulgaria, only 24% of boys but 43% of girls achieve at least level 3.

2A PROFILE OF STUDENT PERFORMANCE IN READING
68 © OECD 2010 PISA 2009 ReSultS: WhAt StudentS KnoW And CAn do – Volume I
Percentage of students
Countries are ranked in descending order of the percentage of students at Levels 2, 3, 4, 5 and 6.Source: OECD, PISA 2009 Database, Table I.2.10.
100 80 60 40 20 0 20 40 60 80 100
• Figure I. 2.26 •How well do students reflect on and evaluate what they read?
Percentage of students at the different proficiency levels in reflecting and evaluating what they read
Students at Level 1a or below
Students at Level 2 or above
Shanghai-ChinaKorea
FinlandHong Kong-China
CanadaSingapore
NetherlandsEstonia
AustraliaNew Zealand
LatviaUnited States
JapanNorwayPoland
Chinese TaipeiSweden
LiechtensteinDenmark
United KingdomIreland
PortugalIceland
Macao-ChinaSwitzerland
BelgiumGermanyHungary
FranceSpain
GreeceItaly
IsraelTurkey
CroatiaLuxembourg
SloveniaLithuania
Slovak RepublicChile
Czech RepublicAustria
Dubai (UAE)Russian Federation
MexicoUruguay
SerbiaTunisia
RomaniaColombia
BrazilThailandBulgaria
Trinidad and TobagoJordan
IndonesiaArgentina
MontenegroAlbania
QatarPanama
KazakhstanPeru
AzerbaijanKyrgyzstan
Shanghai-ChinaKoreaFinlandHong Kong-ChinaCanadaSingaporeNetherlandsEstoniaAustraliaNew ZealandLatviaUnited StatesJapanNorwayPolandChinese TaipeiSwedenLiechtensteinDenmarkUnited KingdomIrelandPortugalIcelandMacao-ChinaSwitzerlandBelgiumGermanyHungaryFranceSpainGreeceItalyIsraelTurkeyCroatiaLuxembourgSloveniaLithuaniaSlovak RepublicChileCzech RepublicAustriaDubai (UAE)Russian FederationMexicoUruguaySerbiaTunisiaRomaniaColombiaBrazilThailandBulgariaTrinidad and TobagoJordanIndonesiaArgentinaMontenegroAlbaniaQatarPanamaKazakhstanPeruAzerbaijanKyrgyzstan
Level 1aLevel 1bBelow Level 1b Level 2 Level 3 Level 4 Level 5 Level 6
1 2 http://dx.doi.org/10.1787/888932343133

2A PROFILE OF STUDENT PERFORMANCE IN READING
PISA 2009 ReSultS: WhAt StudentS KnoW And CAn do – Volume I © OECD 2010 69
• Figure I.2.27 •Comparing countries on reflect and evaluate performance
Mean Comparison country Countries whose mean score is NOT statistically significantly different from that of the comparison country
557 Shanghai-China542 Korea hong Kong-China, Finland, Canada 540 Hong Kong-China Korea, Finland, Canada 536 Finland Korea, hong Kong-China, Canada, new Zealand 535 Canada Korea, hong Kong-China, Finland, new Zealand 531 New Zealand Finland, Canada, Singapore 529 Singapore new Zealand 523 Australia Japan 521 Japan Australia, united States, netherlands 512 United States Japan, netherlands, Belgium, norway, Ireland 510 Netherlands Japan, united States, Belgium, norway, united Kingdom, estonia, Ireland, Sweden 505 Belgium united States, netherlands, norway, united Kingdom, estonia, Ireland, Sweden, liechtenstein 505 Norway united States, netherlands, Belgium, united Kingdom, estonia, Ireland, Sweden, Poland, liechtenstein 503 United Kingdom netherlands, Belgium, norway, estonia, Ireland, Sweden, Poland, liechtenstein, Switzerland, Portugal, France 503 Estonia netherlands, Belgium, norway, united Kingdom, Ireland, Sweden, Poland, liechtenstein, Switzerland, Portugal, France 502 Ireland united States, netherlands, Belgium, norway, united Kingdom, estonia, Sweden, Poland, liechtenstein, Switzerland, Portugal, Iceland, France 502 Sweden netherlands, Belgium, norway, united Kingdom, estonia, Ireland, Poland, liechtenstein, Switzerland, Portugal, Iceland, France 498 Poland norway, united Kingdom, estonia, Ireland, Sweden, liechtenstein, Switzerland, Portugal, Iceland, France, denmark, Chinese taipei, latvia,
Germany, Greece 498 Liechtenstein Belgium, norway, united Kingdom, estonia, Ireland, Sweden, Poland, Switzerland, Portugal, Iceland, France, denmark, Chinese taipei, latvia,
Germany, Greece, hungary 497 Switzerland united Kingdom, estonia, Ireland, Sweden, Poland, liechtenstein, Portugal, Iceland, France, denmark, Chinese taipei, latvia, Germany, Greece,
hungary 496 Portugal united Kingdom, estonia, Ireland, Sweden, Poland, liechtenstein, Switzerland, Iceland, France, denmark, Chinese taipei, latvia, Germany,
Greece, hungary 496 Iceland Ireland, Sweden, Poland, liechtenstein, Switzerland, Portugal, France, denmark, Chinese taipei, latvia, Germany, Greece 495 France united Kingdom, estonia, Ireland, Sweden, Poland, liechtenstein, Switzerland, Portugal, Iceland, denmark, Chinese taipei, latvia, Germany,
Greece, hungary 493 Denmark Poland, liechtenstein, Switzerland, Portugal, Iceland, France, Chinese taipei, latvia, Germany, Greece, hungary 493 Chinese Taipei Poland, liechtenstein, Switzerland, Portugal, Iceland, France, denmark, latvia, Germany, Greece, hungary 492 Latvia Poland, liechtenstein, Switzerland, Portugal, Iceland, France, denmark, Chinese taipei, Germany, Greece, hungary, Israel 491 Germany Poland, liechtenstein, Switzerland, Portugal, Iceland, France, denmark, Chinese taipei, latvia, Greece, hungary, Israel 489 Greece Poland, liechtenstein, Switzerland, Portugal, Iceland, France, denmark, Chinese taipei, latvia, Germany, hungary, Spain, Israel, Italy, macao-China 489 Hungary liechtenstein, Switzerland, Portugal, France, denmark, Chinese taipei, latvia, Germany, Greece, Spain, Israel, Italy 483 Spain Greece, hungary, Israel, Italy, macao-China 483 Israel latvia, Germany, Greece, hungary, Spain, Italy, macao-China, turkey 482 Italy Greece, hungary, Spain, Israel, macao-China 481 Macao-China Greece, Spain, Israel, Italy 473 Turkey Israel, Croatia, luxembourg, Slovenia, Slovak Republic, dubai (uAe), Austria 471 Croatia turkey, luxembourg, Slovenia, Slovak Republic, dubai (uAe), lithuania, Austria, Czech Republic 471 Luxembourg turkey, Croatia, Slovenia, Slovak Republic 470 Slovenia turkey, Croatia, luxembourg, Slovak Republic 466 Slovak Republic turkey, Croatia, luxembourg, Slovenia, dubai (uAe), lithuania, Austria, Czech Republic 466 Dubai (UAE) turkey, Croatia, Slovak Republic, lithuania, Austria, Czech Republic 463 Lithuania Croatia, Slovak Republic, dubai (uAe), Austria, Czech Republic 463 Austria turkey, Croatia, Slovak Republic, dubai (uAe), lithuania, Czech Republic 462 Czech Republic Croatia, Slovak Republic, dubai (uAe), lithuania, Austria 452 Chile 441 Russian Federation uruguay 436 Uruguay Russian Federation, mexico, Serbia, Romania 432 Mexico uruguay, Serbia, tunisia, Romania 430 Serbia uruguay, mexico, tunisia, Romania, Brazil, Colombia, Bulgaria 427 Tunisia mexico, Serbia, Romania, Brazil, Colombia, thailand, Bulgaria 426 Romania uruguay, mexico, Serbia, tunisia, Brazil, Colombia, thailand, Bulgaria 424 Brazil Serbia, tunisia, Romania, Colombia, thailand, Bulgaria 422 Colombia Serbia, tunisia, Romania, Brazil, thailand, Bulgaria, trinidad and tobago 420 Thailand tunisia, Romania, Brazil, Colombia, Bulgaria 417 Bulgaria Serbia, tunisia, Romania, Brazil, Colombia, thailand, trinidad and tobago, Indonesia, Jordan, Argentina 413 Trinidad and Tobago Colombia, Bulgaria, Indonesia, Jordan 409 Indonesia Bulgaria, trinidad and tobago, Jordan, Argentina 407 Jordan Bulgaria, trinidad and tobago, Indonesia, Argentina 402 Argentina Bulgaria, Indonesia, Jordan 383 Montenegro Panama, Albania 377 Panama montenegro, Albania, Qatar, Kazakhstan, Peru 376 Albania montenegro, Panama, Qatar, Kazakhstan, Peru 376 Qatar Panama, Albania, Kazakhstan, Peru 373 Kazakhstan Panama, Albania, Qatar, Peru 368 Peru Panama, Albania, Qatar, Kazakhstan 335 Azerbaijan300 Kyrgyzstan
Source: oeCd, PISA 2009 Database.12 http://dx.doi.org/10.1787/888932343133
Statistically significantly above the oeCd average not statistically significantly different from the oeCd averageStatistically significantly below the oeCd average

2A PROFILE OF STUDENT PERFORMANCE IN READING
70 © OECD 2010 PISA 2009 ReSultS: WhAt StudentS KnoW And CAn do – Volume I
• Figure I.2.28 •Comparing countries on the different aspect subscales
Country performance on the subscale is between 0 to 3 score points higher than on the combined reading scaleCountry performance on the subscale is between 3 to 10 score points higher than on the combined reading scaleCountry performance on the subscale is 10 or more score points higher than on the combined reading scale
Country performance on the subscale is between 0 to 3 score points lower than on the combined reading scaleCountry performance on the subscale is between 3 to 10 score points lower than on the combined reading scaleCountry performance on the subscale is 10 or more score points lower than on the combined reading scale
Reading score Performance difference between the combined reading scale and each aspect subscale
Access and retrieve Integrate and interpret Reflect and evaluate Shanghai-China 556 -7 2 1Korea 539 2 1 3Finland 536 -4 2 0Hong Kong-China 533 -4 -3 6Singapore 526 0 -1 3Canada 524 -8 -2 11New Zealand 521 0 -4 10Japan 520 10 0 1Australia 515 -2 -2 8Netherlands 508 11 -4 2Belgium 506 7 -2 -1Norway 503 9 -1 2Estonia 501 2 -1 2Switzerland 501 5 1 -3Poland 500 0 2 -3Iceland 500 6 2 -4United States 500 -8 -5 12Liechtenstein 499 8 -2 -2Sweden 497 7 -3 5Germany 497 3 3 -6Ireland 496 2 -2 7France 496 -4 2 0Chinese Taipei 495 1 4 -2Denmark 495 7 -3 -2United Kingdom 494 -3 -4 9Hungary 494 7 2 -5Portugal 489 -1 -3 7Macao-China 487 6 2 -6Italy 486 -4 4 -4Latvia 484 -8 0 8Slovenia 483 6 6 -13Greece 483 -15 2 7Spain 481 -1 0 2Czech Republic 478 1 9 -16Slovak Republic 477 13 4 -12Croatia 476 16 -3 -5Israel 474 -11 -1 9Luxembourg 472 -2 3 -2Austria 470 7 1 -7Lithuania 468 8 0 -5Turkey 464 3 -5 8Dubai (UAE) 459 -1 -3 6Russian Federation 459 9 7 -19Chile 449 -5 3 3Serbia 442 7 3 -12Bulgaria 429 0 7 -12Uruguay 426 -1 -3 10Mexico 425 7 -7 7Romania 424 -2 0 2Thailand 421 10 -5 -1Trinidad and Tobago 416 -3 2 -3Colombia 413 -9 -2 9Brazil 412 -5 -6 12Montenegro 408 0 13 -25Jordan 405 -11 5 2Tunisia 404 -10 -10 23Indonesia 402 -3 -4 7Argentina 398 -4 -1 4Kazakhstan 390 7 6 -18Albania 385 -5 8 -9Qatar 372 -18 7 4Panama 371 -7 1 6Peru 370 -6 2 -2Azerbaijan 362 0 12 -27Kyrgyzstan 314 -15 13 -14
OECD average 493 2 0 1
Source: oeCd, PISA 2009 Database, tables I.2.3, I.2.6, I.2.9 and I.2.12.12 http://dx.doi.org/10.1787/888932343133

2A PROFILE OF STUDENT PERFORMANCE IN READING
PISA 2009 ReSultS: WhAt StudentS KnoW And CAn do – Volume I © OECD 2010 71
The relative strengths and weaknesses of countries in different aspects of reading Figure I.2.28 shows the mean performance of each participating country on the overall reading scale and compares it with its mean performance on the access and retrieve, integrate and interpret and reflect and evaluate subscales, showing the difference in points between the overall scale and each of the aspect subscales.
Some oeCd countries performed consistently across the aspect subscales, with no more than three score points separating the mean proficiencies across the three aspects. these countries were estonia, Korea, luxembourg, Poland and Spain. more typically, however, there was some variation in performance across the aspect subscales.
Some countries performed significantly lower on the reflect and evaluate subscales – by at least 10 points – than on one or more of the other two aspect subscales. In this group are the oeCd countries the Czech Republic, Slovenia, the Slovak Republic, and the partner countries Azerbaijan, montenegro, the Russian Federation, Kazakhstan, Kyrgyzstan, Serbia and Bulgaria. Students in these countries appear to be less accustomed to critically evaluating and reflecting upon what they read, and more accustomed to using texts to find and analyse information.
Conversely, distinguishable groups of countries performed better on the reflect and evaluate aspect than on one or both of the other aspects. Apart from Ireland, all english-speaking countries (Australia, Canada, new Zealand, the united Kingdom and the united States) have a mean score at least 10 points higher on the reflect and evaluate subscale than on one or both of the other subscales. the same is true of hong Kong-China. Another distinguishable group with this profile comprises several of the latin American partner countries: Brazil, Colombia, Panama and uruguay. the remaining latin American countries – the oeCd countries Chile and mexico, and the partner country Argentina – also performed comparatively well on the reflect and evaluate subscale. Students in these countries demonstrate strength in expressing views about texts and discerning their structure and purpose, but a comparative deficit in attentive and accurate information-focused reading.
In addition to comparing mean scores for each of the aspects, another way of looking at countries’ relative strength or weakness in aspects of reading is by examining their rank in each aspect. the range of ranks for each country in each aspect is listed in Figure I.2.29.
Gender disparities in the different aspects of readingFigures I.2.30a, I.2.30b and I.2.30c show the distribution of student performance on each aspect subscale for each country, marked with the mean performance of girls and boys.
While girls outperformed boys in every aspect of reading as well as on the overall reading scale, there are some variations across the aspect subscales. the smallest variation between girls and boys is on the integrate and interpret subscale (36 points) and the largest on the reflect and evaluate subscale (44 points). this relative disparity is reflected in every part of the distribution of performance on the aspect subscales.
For example, on the integrate and interpret subscale, 2% or more of girls in eight oeCd countries and three partner countries and economies performed at level 6, with the highest percentage of 4.2% in Shanghai-China, new Zealand, and Singapore. on the same aspect subscale, the only countries in which more than 2% of boys performed at level 6 are the oeCd countries new Zealand and Australia (both 2.1%) and the partner country Singapore (2.8%). these figures can be compared with the parallel results on the reflect and evaluate subscale, where the picture is similar but more pronounced. on the reflect and evaluate subscale, over 2% of girls in ten oeCd countries and three partner countries and economies attained proficiency level 6, with new Zealand yielding 6.5% at this level. only in the oeCd countries new Zealand, Japan and Australia, and in the partner country Singapore did more than 2% of boys achieve level 6 on the reflect and evaluate subscale.
At the other end of the performance spectrum, the ratio between girls’ and boys’ performance was similar across the three aspect subscales: roughly half as many girls as boys performed below level 2 on each of the aspect subscales across oeCd countries. on the access and retrieve subscale, 13.5% of girls and 25.6% of boys performed below level 2; on the integrate and interpret subscale, 13.4% of girls and 25.1% of boys; on the reflect and evaluate subscale, 12.6% of girls and 25.9% of boys performed below this level.

2A PROFILE OF STUDENT PERFORMANCE IN READING
72 © OECD 2010 PISA 2009 ReSultS: WhAt StudentS KnoW And CAn do – Volume I
• Figure I.2.29 [Part 1/3] •Where countries rank in different aspects
of reading performance
Statistically significantly above the oeCd average not statistically significantly different from the oeCd averageStatistically significantly below the oeCd average
Access and retrieve subscale
Mean Score S.E.
Range of rank
OECD countries All countries/economies
Upper rank Lower rank Upper rank Lower rankShanghai-China 549 (2.9) 1 1Korea 542 (3.6) 1 1 1 2Finland 532 (2.7) 2 3 3 5Japan 530 (3.8) 2 4 3 7Hong Kong-China 530 (2.7) 3 6Singapore 526 (1.4) 5 7New Zealand 521 (2.4) 4 6 6 9Netherlands 519 (5.1) 3 9 5 12Canada 517 (1.5) 5 8 8 11Belgium 513 (2.4) 5 9 8 13Australia 513 (2.4) 5 9 8 13Norway 512 (2.8) 6 11 9 14Liechtenstein 508 (4.0) 10 20Iceland 507 (1.6) 9 13 12 17Switzerland 505 (2.7) 9 16 12 20Sweden 505 (2.9) 9 16 13 21Estonia 503 (3.0) 10 18 13 22Denmark 502 (2.6) 11 18 14 22Hungary 501 (3.7) 10 19 13 23Germany 501 (3.5) 11 19 14 24Poland 500 (2.8) 12 19 16 24Ireland 498 (3.3) 12 20 16 26Chinese Taipei 496 (2.8) 19 28Macao-China 493 (1.2) 23 28United States 492 (3.6) 17 24 22 31France 492 (3.8) 17 24 21 31Croatia 492 (3.1) 22 31United Kingdom 491 (2.5) 19 24 23 31Slovak Republic 491 (3.0) 19 24 23 31Slovenia 489 (1.1) 20 24 27 31Portugal 488 (3.3) 19 25 24 32Italy 482 (1.8) 24 27 31 35Spain 480 (2.1) 25 28 32 36Czech Republic 479 (3.2) 25 29 32 37Austria 477 (3.2) 25 29 32 38Lithuania 476 (3.0) 32 38Latvia 476 (3.6) 32 39Luxembourg 471 (1.3) 29 31 37 40Russian Federation 469 (3.9) 37 42Greece 468 (4.4) 29 32 36 42Turkey 467 (4.1) 29 32 37 42Israel 463 (4.1) 30 32 39 43Dubai (UAE) 458 (1.4) 42 43Serbia 449 (3.1) 44 45Chile 444 (3.4) 33 33 44 46Mexico 433 (2.1) 34 34 46 48Thailand 431 (3.5) 46 49Bulgaria 430 (8.3) 45 50Uruguay 424 (2.9) 48 50Romania 423 (4.7) 47 50Trinidad and Tobago 413 (1.6) 50 52Montenegro 408 (2.3) 52 54Brazil 407 (3.3) 52 55Colombia 404 (3.7) 52 56Indonesia 399 (4.7) 53 59Kazakhstan 397 (3.7) 54 59Argentina 394 (4.8) 55 59Jordan 394 (4.0) 55 59Tunisia 393 (3.3) 55 59Albania 380 (4.7) 60 61Peru 364 (4.3) 61 63Panama 363 (7.7) 61 64Azerbaijan 361 (4.5) 61 64Qatar 354 (1.0) 63 64Kyrgyzstan 299 (4.0) 65 65
Source: oeCd, PISA 2009 Database.12 http://dx.doi.org/10.1787/888932343133

2A PROFILE OF STUDENT PERFORMANCE IN READING
PISA 2009 ReSultS: WhAt StudentS KnoW And CAn do – Volume I © OECD 2010 73
• Figure I.2.29 [Part 2/3] •Where countries rank in different aspects
of reading performance
Statistically significantly above the oeCd average not statistically significantly different from the oeCd averageStatistically significantly below the oeCd average
Integrate and interpret subscale
Mean Score S.E.
Range of rank
OECD countries All countries/economies
Upper rank Lower rank Upper rank Lower rankShanghai-China 558 (2.5) 1 1Korea 541 (3.4) 1 2 2 3Finland 538 (2.3) 1 2 2 3Hong Kong-China 530 (2.2) 4 4Singapore 525 (1.2) 5 6Canada 522 (1.5) 3 4 5 7Japan 520 (3.5) 3 6 5 9New Zealand 517 (2.4) 4 6 7 9Australia 513 (2.4) 5 7 8 10Netherlands 504 (5.4) 6 17 9 22Belgium 504 (2.5) 7 14 10 17Poland 503 (2.8) 7 15 10 19Iceland 503 (1.5) 7 13 10 17Norway 502 (2.7) 7 15 10 19Switzerland 502 (2.5) 7 15 10 19Germany 501 (2.8) 7 16 10 21Estonia 500 (2.8) 8 17 11 22Chinese Taipei 499 (2.5) 12 23Liechtenstein 498 (4.0) 10 25France 497 (3.6) 9 21 12 26Hungary 496 (3.2) 11 22 14 27United States 495 (3.7) 12 24 15 30Sweden 494 (3.0) 13 23 17 29Ireland 494 (3.0) 14 24 17 29Denmark 492 (2.1) 16 23 20 29United Kingdom 491 (2.4) 17 25 22 32Italy 490 (1.6) 19 25 24 31Slovenia 489 (1.1) 21 25 25 31Macao-China 488 (0.8) 26 31Czech Republic 488 (2.9) 19 27 24 34Portugal 487 (3.0) 20 27 25 34Latvia 484 (2.8) 28 35Greece 484 (4.0) 21 29 25 35Slovak Republic 481 (2.5) 25 28 32 36Spain 481 (2.0) 26 28 32 35Luxembourg 475 (1.1) 29 31 36 38Israel 473 (3.4) 28 31 36 41Croatia 472 (2.9) 36 41Austria 471 (2.9) 29 31 36 41Lithuania 469 (2.4) 38 41Russian Federation 467 (3.1) 38 42Turkey 459 (3.3) 32 33 41 43Dubai (UAE) 457 (1.3) 42 44Chile 452 (3.1) 32 33 43 45Serbia 445 (2.4) 45 46Bulgaria 436 (6.4) 45 47Romania 425 (4.0) 46 50Uruguay 423 (2.6) 47 51Montenegro 420 (1.6) 47 51Trinidad and Tobago 419 (1.4) 48 52Mexico 418 (2.0) 34 34 48 52Thailand 416 (2.6) 49 53Colombia 411 (3.8) 51 55Jordan 410 (3.1) 52 55Brazil 406 (2.7) 53 56Argentina 398 (4.7) 55 60Indonesia 397 (3.5) 56 60Kazakhstan 397 (3.0) 56 60Tunisia 393 (2.7) 57 60Albania 393 (3.8) 56 60Qatar 379 (0.9) 61 62Azerbaijan 373 (2.9) 62 64Panama 372 (5.9) 61 64Peru 371 (4.0) 62 64Kyrgyzstan 327 (2.9) 65 65
Source: oeCd, PISA 2009 Database.12 http://dx.doi.org/10.1787/888932343133

2A PROFILE OF STUDENT PERFORMANCE IN READING
74 © OECD 2010 PISA 2009 ReSultS: WhAt StudentS KnoW And CAn do – Volume I
• Figure I.2.29 [Part 3/3] •Where countries rank in different aspects
of reading performance
Statistically significantly above the oeCd average not statistically significantly different from the oeCd averageStatistically significantly below the oeCd average
Reflect and evaluate subscale
Mean Score S.E.
Range of rank
OECD countries All countries/economies
Upper rank Lower rank Upper rank Lower rankShanghai-China 557 (2.4) 1 1Korea 542 (3.9) 1 2 2 4Hong Kong-China 540 (2.5) 2 4Finland 536 (2.2) 1 4 3 6Canada 535 (1.6) 2 4 3 6New Zealand 531 (2.5) 3 5 4 7Singapore 529 (1.1) 6 7Australia 523 (2.5) 5 6 8 9Japan 521 (3.9) 5 7 8 10United States 512 (4.0) 6 10 9 13Netherlands 510 (5.0) 6 13 9 16Belgium 505 (2.5) 8 14 11 17Norway 505 (2.7) 8 14 11 17United Kingdom 503 (2.4) 9 16 12 19Estonia 503 (2.6) 9 16 11 19Ireland 502 (3.1) 8 16 11 20Sweden 502 (3.0) 9 17 11 20Poland 498 (2.8) 12 20 15 26Liechtenstein 498 (3.2) 14 26Switzerland 497 (2.7) 13 21 16 26Portugal 496 (3.3) 13 22 15 27Iceland 496 (1.4) 15 20 18 25France 495 (3.4) 14 23 17 29Denmark 493 (2.6) 16 23 20 29Chinese Taipei 493 (2.8) 20 29Latvia 492 (3.0) 20 29Germany 491 (2.8) 18 24 22 30Greece 489 (4.9) 16 26 20 33Hungary 489 (3.3) 19 25 23 31Spain 483 (2.2) 23 26 29 33Israel 483 (4.0) 22 27 28 34Italy 482 (1.8) 24 26 30 33Macao-China 481 (0.8) 31 33Turkey 473 (4.0) 26 30 33 39Croatia 471 (3.5) 34 40Luxembourg 471 (1.1) 27 29 34 37Slovenia 470 (1.2) 27 30 34 37Slovak Republic 466 (2.9) 28 32 36 42Dubai (UAE) 466 (1.1) 37 41Lithuania 463 (2.5) 38 42Austria 463 (3.4) 30 32 37 42Czech Republic 462 (3.1) 30 32 38 42Chile 452 (3.2) 33 33 43 43Russian Federation 441 (3.7) 44 45Uruguay 436 (2.9) 44 47Mexico 432 (1.9) 34 34 45 48Serbia 430 (2.6) 45 49Tunisia 427 (3.0) 46 51Romania 426 (4.5) 46 53Brazil 424 (2.7) 48 53Colombia 422 (4.2) 48 54Thailand 420 (2.8) 49 53Bulgaria 417 (7.1) 48 57Trinidad and Tobago 413 (1.3) 53 55Indonesia 409 (3.8) 53 57Jordan 407 (3.4) 54 57Argentina 402 (4.8) 55 57Montenegro 383 (1.9) 58 59Panama 377 (6.3) 58 63Albania 376 (4.6) 58 63Qatar 376 (1.0) 59 62Kazakhstan 373 (3.4) 59 63Peru 368 (4.2) 61 63Azerbaijan 335 (3.8) 64 64Kyrgyzstan 300 (4.0) 65 65
Source: oeCd, PISA 2009 Database.12 http://dx.doi.org/10.1787/888932343133

2A PROFILE OF STUDENT PERFORMANCE IN READING
PISA 2009 ReSultS: WhAt StudentS KnoW And CAn do – Volume I © OECD 2010 75
Score point differenceMean score
Note: Statistically significant gender differences are marked in a darker tone (see Annex A3).Countries are ranked in ascending order of the gender score point difference (girls – boys).Source: OECD, PISA 2009 Database, Table I.2.6.
250 300 350 400 450 500 550 600 0 10 20 30 40 50 60 70
• Figure I. 2.30a •Gender differences in the ability to access and retrieve information from reading
Mean score on the reading subscaleaccess and retrieve
Gender difference (girls – boys)
All studentsBoys Girls
ColombiaPeruChile
MexicoUnited StatesNetherlands
TunisiaHong Kong-China
BrazilAzerbaijan
PanamaSpain
United KingdomMacao-China
DenmarkKorea
BelgiumSingaporeArgentina
TurkeyLiechtenstein
HungaryAustriaJapan
AustraliaShanghai-China
SwitzerlandPortugalGermanyCanadaUruguay
Chinese TaipeiSerbia
RomaniaEstoniaFrance
ThailandIndonesia
ItalyLuxembourgKazakhstan
IrelandGreece
Russian FederationDubai (UAE)
IsraelNorway
New ZealandLatviaPolandIcelandSweden
Czech RepublicCroatiaJordan
Slovak RepublicSlovenia
QatarFinland
MontenegroLithuania
Trinidad and TobagoKyrgyzstan
BulgariaAlbania
OECD average 40 score points
1 2 http://dx.doi.org/10.1787/888932343133

2A PROFILE OF STUDENT PERFORMANCE IN READING
76 © OECD 2010 PISA 2009 ReSultS: WhAt StudentS KnoW And CAn do – Volume I
Score point differenceMean score
Note: All gender differences are statistically significant (see Annex A3).Countries are ranked in ascending order of the gender score point difference (girls – boys).Source: OECD, PISA 2009 Database, Table I.2.9.
250 300 350 400 450 500 550 600 0 10 20 30 40 50 60 70
• Figure I. 2.30b •Gender differences in the ability to integrate and interpret information from reading
Mean score on the reading subscaleintegrate and interpret
Gender difference (girls – boys)
In all countries/economies girls perform better than boysAll studentsBoys Girls
ColombiaChile
AzerbaijanUnited StatesNetherlands
PeruUnited Kingdom
BelgiumDenmarkMexicoSpainBrazil
SingaporeHong Kong-China
CanadaTunisia
Macao-ChinaPanamaKorea
Chinese TaipeiLiechtenstein
PortugalAustraliaArgentinaIndonesia
Shanghai-ChinaJapan
ThailandHungary
IsraelIreland
LuxembourgSwitzerland
SerbiaUruguayIcelandAustriaFrance
RomaniaSweden
GermanyGreeceTurkey
KazakhstanQatar
New ZealandNorwayEstonia
ItalyRussian Federation
LatviaCroatia
Dubai (UAE)Poland
Czech RepublicKyrgyzstan
Slovak RepublicMontenegro
SloveniaFinland
Trinidad and TobagoJordan
BulgariaLithuaniaAlbania
OECD average 36 score points
1 2 http://dx.doi.org/10.1787/888932343133

2A PROFILE OF STUDENT PERFORMANCE IN READING
PISA 2009 ReSultS: WhAt StudentS KnoW And CAn do – Volume I © OECD 2010 77
1 2 http://dx.doi.org/10.1787/888932343133
Score point differenceMean score
Note: All gender differences are statistically significant (see Annex A3).Countries are ranked in ascending order of the gender score point difference (girls – boys).Source: OECD, PISA 2009 Database, Table I.2.12.
250 300 350 400 450 500 550 600 0 10 20 30 40 50 60 70
• Figure I. 2.30c •Gender differences in the ability to reflect on and evaluate information from reading
Mean score on the reading subscalereflect and evaluate
Gender difference (girls – boys)
In all countries/economies girls perform better than boysAll studentsBoys Girls
ColombiaAzerbaijan
ChilePeru
MexicoUnited Kingdom
NetherlandsUnited States
BrazilBelgium
SpainLiechtenstein
TunisiaPanama
DenmarkSingapore
CanadaIreland
ArgentinaIndonesiaHungary
Chinese TaipeiLuxembourgMacao-China
AustraliaHong Kong-China
GermanyThailand
SwitzerlandKoreaFranceSerbia
PortugalKazakhstan
JapanRussian Federation
AustriaIsrael
UruguayEstoniaLatvia
Shanghai-ChinaNew Zealand
RomaniaIcelandSweden
ItalyTurkey
Czech RepublicNorway
KyrgyzstanPoland
Slovak RepublicDubai (UAE)
GreeceQatar
FinlandMontenegro
CroatiaLithuania
JordanSlovenia
Trinidad and TobagoBulgariaAlbania
OECD average 44 score points

2A PROFILE OF STUDENT PERFORMANCE IN READING
78 © OECD 2010 PISA 2009 ReSultS: WhAt StudentS KnoW And CAn do – Volume I
Text format subscales the reading framework identifies four text formats, continuous, non-continuous, mixed and multiple. two of these are used as the basis for building text-format subscales: continuous texts and non-continuous texts.
A little under two-thirds of the questions are classified as continuous. these are questions based on stimulus in prose (complete sentences and paragraphs), or on the prose section of texts in a format comprising a mix of continuous and non-continuous parts. A little under one-third of the questions in PISA 2009 are classified as non-continuous. these are questions based on stimulus in non-continuous format, such as tables, graphs, maps, forms and diagrams, or on the non-continuous section of a text with a mixed format. Five percent of questions are classified as mixed format. these questions require the reader to draw equally on continuous and non-continuous parts of a mixed format text. these questions have not been included in either the continuous- or non-continuous text subscales. A number of multiple texts are used as stimulus in PISA 2009, but in these cases the texts comprising each set of stimuli are all in continuous format, so the 5% of questions classified as multiple texts, where the reader is required to draw on more than one text, are included in the construction of the continuous texts subscale.
Student performance on the reading subscale continuous texts With 65% of questions from the PISA 2009 pool of reading tasks contributing to the continuous texts subscale, a wide variety of tasks and text characteristics must be accounted for in describing increasing levels of proficiency.
• Figure I.2.31 •Summary descriptions of the seven proficiency levels on the reading subscale continuous texts
Level
Percentage of students able to perform tasks at each level or above (OECD average) Characteristics of tasks
Examples of released continuous texts questions
6 1.0% of students across the OECD can perform tasks at Level 6
negotiate single or multiple texts that may be long, dense or deal with highly abstract and implicit meanings. Relate information in texts to multiple, complex or counterintuitive ideas.
THE PLAY’S THE THING – Question 3 (730)
5 8.2% of students across the OECD can perform tasks at least at Level 5
negotiate texts whose discourse structure is not obvious or clearly marked, in order to discern the relationship of specific parts of the text to the implicit theme or intention.
4 28.8% of students across the OECD can perform tasks at least at Level 4
Follow linguistic or thematic links over several paragraphs, often in the absence of clear discourse markers, in order to locate, interpret or evaluate embedded information.
THE PLAY’S THE THING – Question 7 (556)
3 57.2% of students across the OECD can perform tasks at least at Level 3
use conventions of text organisation, where present, and follow implicit or explicit logical links such as cause and effect relationships across sentences or paragraphs in order to locate, interpret or evaluate information.
MISER – Question 5 (548)TELECOMMUTING – Question 1 (537)TELECOMMUTING –Question 7 (514)
2 80.9% of students across the OECD can perform tasks at least at Level 2
Follow logical and linguistic connections within a paragraph in order to locate or interpret information; or synthesise information across texts or parts of a text in order to infer the author’s purpose.
THE PLAY’S THE THING – Question 4 (474) BLOOD DONATION NOTICE – Question 8 (438)
1a94.1% of students across the OECD can perform tasks at least at Level 1a
use redundancy, paragraph headings or common print conventions to identify the main idea of the text, or to locate information stated explicitly within a short section of text.
BRUSHING YOUR TEETH – Question 4 (399)MISER – Question 1 (373)BLOOD DONATION NOTICE – Question 9 (368)BRUSHING YOUR TEETH – Question 2 (358) BRUSHING YOUR TEETH – Question 1 (353)
1b98.7% of students across the OECD can perform tasks at least at Level 1b
Recognise information in short, syntactically simple texts that have a familiar context and text type, and include ideas that are reinforced by pictures or by repeated verbal cues.
MISER – Question 7 (310)BRUSHING YOUR TEETH – Question 3 (285)

2A PROFILE OF STUDENT PERFORMANCE IN READING
PISA 2009 ReSultS: WhAt StudentS KnoW And CAn do – Volume I © OECD 2010 79
At the lowest levels, tasks are based on short, simple texts in a familiar form, with verbal repetition and/or non-verbal support such as a picture. As tasks become more difficult, the syntactic structure of the associated texts increases in complexity, the content becomes less familiar and more abstract, and the reader is required to focus on ever larger sections of the text or on more widely scattered information. At the upper levels, tasks require the reader to extract and process information from long or dense texts in an unfamiliar format, where there are few, if any, explicit markers as to the location of the needed information, and the reader is required to construct meaning from what is implied rather than stated.
Figure I.2.31 provides descriptions of the nature of the reading skills, knowledge and understanding required at each level of the scale for the continuous texts aspect of reading, with the percentage of students across oeCd countries who perform at this level in PISA 2009. the right-hand column lists examples of released continuous texts questions. Figures I.2.40 to I.2.46 describe these questions and provide commentary on what they show.
Figure I.2.32 shows the percentage of students at each proficiency level on the continuous texts subscale. details of performance by gender on this subscale are also provided in table I.2.15.
With such a large percentage of the questions contributing to the continuous texts subscale, it is not surprising that the profile of performance by reading level is very similar to that for the overall reading scale: the difference at each level, on average, is less than 0.5 of a percentage point. Figure I.2.32 shows that across countries, there is a relatively small percentage of students who are proficient at the very highest levels of performance (for oeCd countries, on average, 7.2% and 1% at levels 5 and 6, respectively). nevertheless, more than 15% of students attain one of these levels in the oeCd country new Zealand (15.9%) and the partner countries and economies Shanghai-China (23.7%), hong Kong-China (15.4%) and Singapore (15.2%). At the other end of the spectrum, on average across oeCd countries, almost 19% of students perform below level 2, and the figure is greater than 50% in the partner countries Kyrgyzstan, Azerbaijan, Panama, Peru, Qatar, Kazakhstan, Albania, Indonesia and Argentina. this indicates that in these countries, the majority of 15-year-olds are likely to find it difficult to use continuous texts unless the texts are short and clearly sign-posted; and even with such texts, they are unlikely to be able to do more than identify a main idea or find explicitly stated information.
Figure I.2.33 shows each country’s mean score on the continuous texts subscale, and shows for which pairs of countries the differences between the means shown are statistically significant. For each country shown on the left in the middle column, the list of countries on the right hand column shows countries whose mean scores are not sufficiently different to be distinguished with confidence. For all other cases, one country has a higher performance than another if it is above it in the list in the middle column, and a lower performance if it is below.
table I.2.16 presents the mean score, variation and gender difference for each country on the continuous texts subscale. Girls outperformed boys in every country on the continuous texts subscale; indeed the gap is even slightly wider than on the overall reading scale (42 compared with 39). In 51 countries, the gap is more than half of one proficiency level (more than 36 points). the biggest gap is between boys and girls in the partner country Albania (67 points) while, as in the overall scale and the aspect subscales, the partner country Colombia has the smallest gender gap, with only 14 points separating boys and girls.
Student performance on the reading subscale non-continuous texts traditionally, reading has been associated mainly with continuous texts. In many school systems, especially in language-of-instruction classes, reading is typically confined to literature and expository prose. In other parts of the curriculum, however, proficiency in understanding and using non-continuous texts is at least equally important: for example, students need to be able to read and interpret maps and tables in the social sciences, and diagrams and graphs in the sciences. In adult life, a large part of everyday reading involves non-continuous texts, such as tax forms, timetables, graphed reports of household energy consumption, and lists of safety instructions in the workplace. Given the prevalence of non-continuous texts, a substantial proportion of tasks in the PISA 2009 pool of reading tasks – nearly 30% – are dedicated to assessing students’ proficiency in reading these kinds of texts.
All non-continuous texts can be analysed as comprising one or more lists, the easiest tasks on this subscale are based on a single, simple list and require the reader to focus on a single explicit and prominently placed piece of information. Increasing difficulty on the scale is associated with tasks based on texts with more complex list structures, such as combined lists, and those with less familiar forms of presentation. In addition, more difficult tasks require readers to integrate information from multiple parts of a document or even to translate information presented in different non-continuous formats, thus implicitly involving a deep understanding of the structures of several texts.

2A PROFILE OF STUDENT PERFORMANCE IN READING
80 © OECD 2010 PISA 2009 ReSultS: WhAt StudentS KnoW And CAn do – Volume I
Percentage of students
Countries are ranked in descending order of the percentage of students at Levels 2, 3, 4, 5 and 6.Source: OECD, PISA 2009 Database, Table I.2.14.
100 80 60 40 20 0 20 40 60 80 100
• Figure I. 2.32 •How well do students read continuous texts?
Percentage of students at the different levels of proficiency in reading continuous texts
Students at Level 1a or below
Students at Level 2 or above
Shanghai-ChinaKorea
Hong Kong-ChinaFinlandCanada
JapanSingapore
EstoniaNetherlands
PolandAustralia
New ZealandNorway
DenmarkChinese TaipeiMacao-China
HungaryIceland
LatviaPortugalSweden
LiechtensteinSwitzerland
IrelandBelgium
GermanyUnited States
SpainUnited Kingdom
ItalyFrance
GreeceSloveniaCroatia
Slovak RepublicCzech Republic
LithuaniaTurkey
IsraelLuxembourg
Russian FederationAustria
ChileDubai (UAE)
SerbiaMexico
BulgariaUruguayRomaniaThailand
JordanTrinidad and Tobago
ColombiaMontenegro
TunisiaBrazil
ArgentinaIndonesia
AlbaniaKazakhstan
QatarPeru
PanamaAzerbaijanKyrgyzstan
Shanghai-ChinaKoreaHong Kong-ChinaFinlandCanadaJapanSingaporeEstoniaNetherlandsPolandAustraliaNew ZealandNorwayDenmarkChinese TaipeiMacao-ChinaHungaryIcelandLatviaPortugalSwedenLiechtensteinSwitzerlandIrelandBelgiumGermanyUnited StatesSpainUnited KingdomItalyFranceGreeceSloveniaCroatiaSlovak RepublicCzech RepublicLithuaniaTurkeyIsraelLuxembourgRussian FederationAustriaChileDubai (UAE)SerbiaMexicoBulgariaUruguayRomaniaThailandJordanTrinidad and TobagoColombiaMontenegroTunisiaBrazilArgentinaIndonesiaAlbaniaKazakhstanQatarPeruPanamaAzerbaijanKyrgyzstan
Level 1aLevel 1bBelow Level 1b Level 2 Level 3 Level 4 Level 5 Level 6
1 2 http://dx.doi.org/10.1787/888932343133

2A PROFILE OF STUDENT PERFORMANCE IN READING
PISA 2009 ReSultS: WhAt StudentS KnoW And CAn do – Volume I © OECD 2010 81
• Figure I.2.33 •Comparing countries’ performance in reading continuous texts
Mean Comparison country Countries whose mean score is NOT statistically significantly different from that of the comparison country564 Shanghai-China538 Korea hong Kong-China, Finland 538 Hong Kong-China Korea, Finland 535 Finland Korea, hong Kong-China 524 Canada Singapore, Japan 522 Singapore Canada, Japan, new Zealand 520 Japan Canada, Singapore, new Zealand, Australia 518 New Zealand Singapore, Japan, Australia 513 Australia Japan, new Zealand, netherlands 506 Netherlands Australia, norway, Belgium, Poland, Iceland, united States, Sweden, Switzerland, estonia, hungary, Ireland, Chinese taipei, denmark, Germany 505 Norway netherlands, Belgium, Poland, Iceland, united States, Sweden 504 Belgium netherlands, norway, Poland, Iceland, united States, Sweden, Switzerland, estonia, hungary, Ireland 502 Poland netherlands, norway, Belgium, Iceland, united States, Sweden, Switzerland, estonia, hungary, Ireland, Chinese taipei, denmark, Germany,
liechtenstein 501 Iceland netherlands, norway, Belgium, Poland, united States, Sweden, Switzerland, estonia, hungary, Ireland, Chinese taipei, denmark, Germany,
liechtenstein 500 United States netherlands, norway, Belgium, Poland, Iceland, Sweden, Switzerland, estonia, hungary, Ireland, Chinese taipei, denmark, Germany,
liechtenstein, France, Portugal, united Kingdom 499 Sweden netherlands, norway, Belgium, Poland, Iceland, united States, Switzerland, estonia, hungary, Ireland, Chinese taipei, denmark, Germany,
liechtenstein, France, Portugal, united Kingdom 498 Switzerland netherlands, Belgium, Poland, Iceland, united States, Sweden, estonia, hungary, Ireland, Chinese taipei, denmark, Germany, liechtenstein,
France, Portugal, united Kingdom497 Estonia netherlands, Belgium, Poland, Iceland, united States, Sweden, Switzerland, hungary, Ireland, Chinese taipei, denmark, Germany, liechtenstein,
France, Portugal, united Kingdom497 Hungary netherlands, Belgium, Poland, Iceland, united States, Sweden, Switzerland, estonia, Ireland, Chinese taipei, denmark, Germany, liechtenstein,
France, Portugal, united Kingdom, Greece 497 Ireland netherlands, Belgium, Poland, Iceland, united States, Sweden, Switzerland, estonia, hungary, Chinese taipei, denmark, Germany, liechtenstein,
France, Portugal, united Kingdom, Greece 496 Chinese Taipei netherlands, Poland, Iceland, united States, Sweden, Switzerland, estonia, hungary, Ireland, denmark, Germany, liechtenstein, France,
Portugal, united Kingdom 496 Denmark netherlands, Poland, Iceland, united States, Sweden, Switzerland, estonia, hungary, Ireland, Chinese taipei, Germany, liechtenstein, France,
Portugal, united Kingdom 496 Germany netherlands, Poland, Iceland, united States, Sweden, Switzerland, estonia, hungary, Ireland, Chinese taipei, denmark, liechtenstein, France,
Portugal, united Kingdom, Greece495 Liechtenstein Poland, Iceland, united States, Sweden, Switzerland, estonia, hungary, Ireland, Chinese taipei, denmark, Germany, France, Portugal, united
Kingdom, Italy, Greece492 France united States, Sweden, Switzerland, estonia, hungary, Ireland, Chinese taipei, denmark, Germany, liechtenstein, Portugal, united Kingdom,
Italy, macao-China, Greece, Spain, latvia 492 Portugal united States, Sweden, Switzerland, estonia, hungary, Ireland, Chinese taipei, denmark, Germany, liechtenstein, France, united Kingdom, Italy,
macao-China, Greece, Spain, latvia 492 United Kingdom united States, Sweden, Switzerland, estonia, hungary, Ireland, Chinese taipei, denmark, Germany, liechtenstein, France, Portugal, Italy, macao-
China, Greece 489 Italy liechtenstein, France, Portugal, united Kingdom, macao-China, Greece, Spain, latvia 488 Macao-China France, Portugal, united Kingdom, Italy, Greece, Spain, latvia 487 Greece hungary, Ireland, Germany, liechtenstein, France, Portugal, united Kingdom, Italy, macao-China, Spain, Slovenia, latvia, Slovak Republic,
Czech Republic, Croatia, Israel484 Spain France, Portugal, Italy, macao-China, Greece, Slovenia, latvia, Slovak Republic, Czech Republic, Croatia, Israel 484 Slovenia Greece, Spain, latvia, Slovak Republic, Czech Republic, Israel 484 Latvia France, Portugal, Italy, macao-China, Greece, Spain, Slovenia, Slovak Republic, Czech Republic, Croatia, Israel 479 Slovak Republic Greece, Spain, Slovenia, latvia, Czech Republic, Croatia, Israel 479 Czech Republic Greece, Spain, Slovenia, latvia, Slovak Republic, Croatia, Israel 478 Croatia Greece, Spain, latvia, Slovak Republic, Czech Republic, Israel, Austria 477 Israel Greece, Spain, Slovenia, latvia, Slovak Republic, Czech Republic, Croatia, luxembourg, lithuania, Austria 471 Luxembourg Israel, lithuania, Austria, turkey 470 Lithuania Israel, luxembourg, Austria, turkey 470 Austria Croatia, Israel, luxembourg, lithuania, turkey 466 Turkey luxembourg, lithuania, Austria, dubai (uAe), Russian Federation 461 Dubai (UAE) turkey, Russian Federation 461 Russian Federation turkey, dubai (uAe), Chile 453 Chile Russian Federation 444 Serbia Bulgaria 433 Bulgaria Serbia, uruguay, mexico, Romania, thailand 429 Uruguay Bulgaria, mexico, Romania, thailand 426 Mexico Bulgaria, uruguay, Romania, thailand 423 Romania Bulgaria, uruguay, mexico, thailand, trinidad and tobago, Jordan, Colombia, Brazil 423 Thailand Bulgaria, uruguay, mexico, Romania, trinidad and tobago, Jordan, Colombia 418 Trinidad and Tobago Romania, thailand, Jordan, Colombia, Brazil 417 Jordan Romania, thailand, trinidad and tobago, Colombia, Brazil, montenegro 415 Colombia Romania, thailand, trinidad and tobago, Jordan, Brazil, montenegro, tunisia, Indonesia 414 Brazil Romania, trinidad and tobago, Jordan, Colombia, montenegro, tunisia, Indonesia 411 Montenegro Jordan, Colombia, Brazil, tunisia, Indonesia 408 Tunisia Colombia, Brazil, montenegro, Indonesia, Argentina 405 Indonesia Colombia, Brazil, montenegro, tunisia, Argentina, Kazakhstan 400 Argentina tunisia, Indonesia, Kazakhstan, Albania 399 Kazakhstan Indonesia, Argentina, Albania392 Albania Argentina, Kazakhstan375 Qatar Kazakhstan, Peru374 Peru Qatar, Panama373 Panama Qatar, Peru, Azerbaijan362 Azerbaijan Panama319 Kyrgyzstan
Source: oeCd, PISA 2009 Database.12 http://dx.doi.org/10.1787/888932343133
Statistically significantly above the oeCd average not statistically significantly different from the oeCd averageStatistically significantly below the oeCd average

2A PROFILE OF STUDENT PERFORMANCE IN READING
82 © OECD 2010 PISA 2009 ReSultS: WhAt StudentS KnoW And CAn do – Volume I
Figure I.2.34 provides descriptions of the nature of the reading skills, knowledge and understanding required at each level of the scale for the non-continuous texts aspect of reading, with the percentage of students across oeCd countries who performed at this level in PISA 2009. the right-hand column lists examples of released non-continuous texts questions. Figures I.2.40 to I.2.46 describe these questions and provide commentary on what they show.
• Figure I.2.34 •Summary descriptions of the seven proficiency levels on the reading subscale
non-continuous texts
Level
Percentage of students able to perform tasks at each level or above (OECD average) Characteristics of tasks
Examples of released non-continuous texts questions
6 1.0% of students across the OECD can perform tasks at least at Level 6
Identify and combine information from different parts of a complex document that has unfamiliar content, sometimes drawing on features that are external to the display, such as footnotes, labels and other organisers. demonstrate a full understanding of the text structure and its implications.
5 8.0% of students across the OECD can perform tasks at least at Level 5
Identify patterns among many pieces of information presented in a display that may be long and detailed, sometimes by referring to information that is in an unexpected place in the text or outside the text.
4 28.5% of students across the OECD can perform tasks at least at Level 4
Scan a long, detailed text in order to find relevant information, often with little or no assistance from organisers such as labels or special formatting, to locate several pieces of information to be compared or combined.
MOBILE PHONE SAFETY – Question 11 (604)
BALLOON – Question 3.2 (595)
MOBILE PHONE SAFETY – Question 2 (561)
3 57.3% of students across the OECD can perform tasks at least at Level 3
Consider one display in the light of a second, separate document or display, possibly in a different format, or draw conclusions by combining several pieces of graphical, verbal and numeric information.
MOBILE PHONE SAFETY – Question 6 (526)
BALLOON – Question 4 (510)
BALLOON – Question 3.1 (449)
MOBILE PHONE SAFETY – Question 9 (488)
2 80.9% of students across the OECD can perform tasks at least at Level 2
demonstrate a grasp of the underlying structure of a visual display such as a simple tree diagram or table, or combine two pieces of information from a graph or table.
BALLOON – Question 6 (411)
1a93.7% of student across the OECD can perform tasks at least at Level 1a
Focus on discrete pieces of information, usually within a single display such as a simple map, a line graph or bar graph that presents only a small amount of information in a straightforward way, and in which most of the verbal text is limited to a small number of words or phrases.
BALLOON – Question 8 (370)
1b98.5% of student across the OECD can perform tasks at least at Level 1b
Identify information in a short text with a simple list structure and a familiar format.
Figure I.2.35 shows the percentage of students at each proficiency level on the non-continuous texts subscale. details of performance by gender on this subscale are also provided in table I.2.18.
mean performance across oeCd countries is the same on the non-continuous texts subscale as on the overall reading scale (493 points), but is slightly more dispersed (a standard deviation of 95 compared with 93). For almost half of the participating countries, including most oeCd countries, the modal level is level 3. the exceptions are in the oeCd countries Finland, Korea and new Zealand, all of which have a modal level of level 4, as well as in the partner countries and economies Shanghai-China and Singapore. Among the oeCd countries, Chile, mexico and turkey are also exceptions, with more students performing at level 2 than at any other level.

2A PROFILE OF STUDENT PERFORMANCE IN READING
PISA 2009 ReSultS: WhAt StudentS KnoW And CAn do – Volume I © OECD 2010 83
Percentage of students
Countries are ranked in descending order of the percentage of students at Levels 2, 3, 4, 5 and 6.Source: OECD, PISA 2009 Database, Table I.2.17.
100 80 60 40 20 0 20 40 60 80 100
• Figure I. 2.35 •How well do students read non-continuous texts?
Percentage of students at the different levels of proficiency in reading non-continuous texts
Students at Level 1a or below
Students at Level 2 or above
KoreaShanghai-China
FinlandSingapore
Hong Kong-ChinaCanada
AustraliaNew Zealand
EstoniaNetherlands
JapanLiechtenstein
SwitzerlandNorway
Chinese TaipeiUnited States
DenmarkUnited Kingdom
IcelandSweden
Macao-ChinaIreland
BelgiumPolandFrance
PortugalLatvia
GermanyHungarySlovenia
SpainCzech Republic
GreeceCroatia
Slovak RepublicItaly
LuxembourgTurkeyAustria
LithuaniaIsrael
Dubai (UAE)Russian Federation
ChileSerbia
MexicoRomaniaThailandBulgariaUruguay
Trinidad and TobagoColombia
BrazilMontenegro
IndonesiaArgentina
JordanTunisia
AlbaniaKazakhstan
QatarPeru
PanamaAzerbaijanKyrgyzstan
KoreaShanghai-ChinaFinlandSingaporeHong Kong-ChinaCanadaAustraliaNew ZealandEstoniaNetherlandsJapanLiechtensteinSwitzerlandNorwayChinese TaipeiUnited StatesDenmarkUnited KingdomIcelandSwedenMacao-ChinaIrelandBelgiumPolandFrancePortugalLatviaGermanyHungarySloveniaSpainCzech RepublicGreeceCroatiaSlovak RepublicItalyLuxembourgTurkeyAustriaLithuaniaIsraelDubai (UAE)Russian FederationChileSerbiaMexicoRomaniaThailandBulgariaUruguayTrinidad and TobagoColombiaBrazilMontenegroIndonesiaArgentinaJordanTunisiaAlbaniaKazakhstanQatarPeruPanamaAzerbaijanKyrgyzstan
Level 1aLevel 1bBelow Level 1b Level 2 Level 3 Level 4 Level 5 Level 6
1 2 http://dx.doi.org/10.1787/888932343133

2A PROFILE OF STUDENT PERFORMANCE IN READING
84 © OECD 2010 PISA 2009 ReSultS: WhAt StudentS KnoW And CAn do – Volume I
• Figure I.2.36 •Comparing countries’ performance in reading non-continuous texts
Mean Comparison country Countries whose mean score is NOT statistically significantly different from that of the comparison country
542 Korea Shanghai-China, Singapore, Finland 539 Shanghai-China Korea, Singapore, Finland 539 Singapore Korea, Shanghai-China, Finland 535 Finland Korea, Shanghai-China, Singapore, new Zealand 532 New Zealand Finland, Canada 527 Canada new Zealand, Australia, hong Kong-China 524 Australia Canada, hong Kong-China, Japan, netherlands 522 Hong Kong-China Canada, Australia, Japan, netherlands 518 Japan Australia, hong Kong-China, netherlands, estonia, Belgium 514 Netherlands Australia, hong Kong-China, Japan, estonia, Belgium, liechtenstein, united Kingdom, Switzerland, united States 512 Estonia Japan, netherlands, Belgium, liechtenstein, united Kingdom, Switzerland 511 Belgium Japan, netherlands, estonia, liechtenstein, united Kingdom, Switzerland, united States 506 Liechtenstein netherlands, estonia, Belgium, united Kingdom, Switzerland, united States, Chinese taipei, France, Sweden 506 United Kingdom netherlands, estonia, Belgium, liechtenstein, Switzerland, united States, Chinese taipei, France 505 Switzerland netherlands, estonia, Belgium, liechtenstein, united Kingdom, united States, Chinese taipei, France, Sweden 503 United States netherlands, Belgium, liechtenstein, united Kingdom, Switzerland, Chinese taipei, Iceland, France, Sweden, norway, Germany, Ireland, Poland 500 Chinese Taipei liechtenstein, united Kingdom, Switzerland, united States, Iceland, France, Sweden, norway, Germany, Ireland, Poland 499 Iceland united States, Chinese taipei, France, Sweden, norway, Germany, Ireland, Poland 498 France liechtenstein, united Kingdom, Switzerland, united States, Chinese taipei, Iceland, Sweden, norway, Germany, Ireland, Poland, denmark 498 Sweden liechtenstein, Switzerland, united States, Chinese taipei, Iceland, France, norway, Germany, Ireland, Poland, denmark 498 Norway united States, Chinese taipei, Iceland, France, Sweden, Germany, Ireland, Poland, denmark 497 Germany united States, Chinese taipei, Iceland, France, Sweden, norway, Ireland, Poland, denmark 496 Ireland united States, Chinese taipei, Iceland, France, Sweden, norway, Germany, Poland, denmark, Portugal 496 Poland united States, Chinese taipei, Iceland, France, Sweden, norway, Germany, Ireland, denmark, Portugal, hungary 493 Denmark France, Sweden, norway, Germany, Ireland, Poland, Portugal, hungary, latvia 488 Portugal Ireland, Poland, denmark, hungary, latvia 487 Hungary Poland, denmark, Portugal, latvia, macao-China 487 Latvia denmark, Portugal, hungary, macao-China 481 Macao-China hungary, latvia, Czech Republic 476 Italy Slovenia, Czech Republic, Spain, Austria, Greece, Croatia, Slovak Republic 476 Slovenia Italy, Czech Republic, Spain, Austria, Greece, Croatia, Slovak Republic 474 Czech Republic macao-China, Italy, Slovenia, Spain, Austria, Greece, Croatia, luxembourg, Slovak Republic, Israel 473 Spain Italy, Slovenia, Czech Republic, Austria, Greece, Croatia, luxembourg, Slovak Republic, Israel 472 Austria Italy, Slovenia, Czech Republic, Spain, Greece, Croatia, luxembourg, Slovak Republic, Israel 472 Greece Italy, Slovenia, Czech Republic, Spain, Austria, Croatia, luxembourg, Slovak Republic, Israel, lithuania, turkey 472 Croatia Italy, Slovenia, Czech Republic, Spain, Austria, Greece, luxembourg, Slovak Republic, Israel 472 Luxembourg Czech Republic, Spain, Austria, Greece, Croatia, Slovak Republic, Israel 471 Slovak Republic Italy, Slovenia, Czech Republic, Spain, Austria, Greece, Croatia, luxembourg, Israel 467 Israel Czech Republic, Spain, Austria, Greece, Croatia, luxembourg, Slovak Republic, lithuania, turkey, dubai (uAe) 462 Lithuania Greece, Israel, turkey, dubai (uAe) 461 Turkey Greece, Israel, lithuania, dubai (uAe), Russian Federation 460 Dubai (UAE) Israel, lithuania, turkey, Russian Federation 452 Russian Federation turkey, dubai (uAe), Chile 444 Chile Russian Federation, Serbia 438 Serbia Chile 424 Mexico Romania, thailand, Bulgaria, uruguay 424 Romania mexico, thailand, Bulgaria, uruguay, trinidad and tobago 423 Thailand mexico, Romania, Bulgaria, uruguay 421 Bulgaria mexico, Romania, thailand, uruguay, trinidad and tobago, Colombia, Brazil 421 Uruguay mexico, Romania, thailand, Bulgaria, trinidad and tobago 417 Trinidad and Tobago Romania, Bulgaria, uruguay, Colombia 409 Colombia Bulgaria, trinidad and tobago, Brazil, Indonesia 408 Brazil Bulgaria, Colombia, Indonesia 399 Indonesia Colombia, Brazil, montenegro, tunisia, Argentina, Jordan 398 Montenegro Indonesia, tunisia, Argentina 393 Tunisia Indonesia, montenegro, Argentina, Jordan 391 Argentina Indonesia, montenegro, tunisia, Jordan 387 Jordan Indonesia, tunisia, Argentina 371 Kazakhstan Albania, Panama 366 Albania Kazakhstan, Qatar, Panama, Peru 361 Qatar Albania, Panama, Peru 359 Panama Kazakhstan, Albania, Qatar, Peru, Azerbaijan 356 Peru Albania, Qatar, Panama, Azerbaijan 351 Azerbaijan Panama, Peru 293 Kyrgyzstan
Source: oeCd, PISA 2009 Database.12 http://dx.doi.org/10.1787/888932343133
Statistically significantly above the oeCd average not statistically significantly different from the oeCd averageStatistically significantly below the oeCd average

2A PROFILE OF STUDENT PERFORMANCE IN READING
PISA 2009 ReSultS: WhAt StudentS KnoW And CAn do – Volume I © OECD 2010 85
For many of the partner countries and economies, level 2 is also the modal level, while several have more students performing at level 1a than at any other level: Albania, Argentina, Azerbaijan, Brazil, Indonesia, Kazakhstan, montenegro, Panama, Peru, Qatar and tunisia. In Kyrgyzstan, the modal level was below level 1b.
Figure I.2.36 shows each country’s mean score on the non-continuous subscale, and the statistically significant differences between them. For each country shown on the left in the middle column, the list of countries on the right hand column shows countries whose mean scores are not sufficiently different to be distinguished with confidence. For all other cases, one country has a higher performance than another if it is above it in the list in the middle column, and a lower performance if it is below.
table I.2.19 presents the mean score, variation and gender difference for each country on the non-continuous texts subscale. While girls outperform boys in every country on this subscale, the gap is generally narrower than on the overall reading scale, with an average difference of 36 points compared with 39 points. A notable group, in which the gap between boys and girls is less than 20 scale score points, includes several latin American countries: the oeCd countries Chile and mexico, and the partner countries Colombia, Peru and Brazil. the gap between boys’ and girls’ performance in Colombia is only 5 points. the only other country with a similarly small gap between boys’ and girls’ performance is the partner country Azerbaijan. A few countries are exceptions to this trend of a narrower gap between boys and girls. In the oeCd countries Belgium and the united Kingdom, as well as the partner countries Jordan and Kazakhstan, the difference in performance is greater on the non-continuous texts subscale than on the overall scale, and in the oeCd countries the netherlands, Germany, Spain and Sweden, and in the partner countries liechtenstein, the Russian Federation and Serbia, the gender differences are the same for the non-continuous texts subscale and the overall scale.
The relative strengths and weaknesses of countries in text-format subscales the PISA reading assessment was designed so that the sets of tasks based on texts in each text format covered a similar range of difficulties, question formats (selected response and constructed response) and aspects, and related to a wide variety of text types. this was intended to ensure that any differences in performance on the text-format subscales could be confidently attributed to the text format variable rather than to the effects of other variables.
Figure I.2.37 shows the differences between countries’ scores on the continuous and non-continuous texts subscales.
the average performance in continuous and non-continuous tasks is almost identical, at 494 and 493 score points, respectively. nevertheless, there is variation across countries. Some countries perform consistently across the text-format subscales, showing a similar marginal difference in performance in favour of continuous texts to the average difference of one point, or an even smaller difference than the average difference. the oeCd countries Finland, luxembourg and Ireland, and the partner countries thailand and trinidad and tobago are in the latter category. however, some variation in performance on the two text-format subscales is more common within countries.
Seventeen countries perform significantly better – by at least 10 points – on the continuous texts subscale than on the non-continuous scale, including two very high-performing partner economies, Shanghai-China and hong Kong-China, and some very low-performing partner countries, including Kyrgyzstan, Azerbaijan, Peru, Panama, Qatar, Albania and Kazakhstan. despite their apparent heterogeneity in the overall level of performance, the countries in this category may place more emphasis in their curricula on reading continuous texts, rather than reading a more diverse array of texts. there are fewer countries with substantially higher performance (by more than 10 points) on the non-continuous than on the continuous subscale.
Gender differences in the text-format subscales When compared with the overall reading scale, girls perform consistently better on the continuous subscale while the gap generally narrows somewhat between boys and girls on the non-continuous tasks. the differences in gender performance are quite marked when comparing the two subscales directly.
the previous section identified countries in which there are comparatively large differences in performance, in either direction, on the two text-format subscales. often, apparently small differences in performance overall can mask large differences between proficiency of boys and girls on the subscales within a country. For example, although the mean score difference between the two text-format subscales in the partner country Romania is less than two points, boys performed better on the non-continuous texts subscale than on the continuous by almost eight points, while girls performed worse on the non-continuous texts subscale than on the continuous texts subscale by five points.

2A PROFILE OF STUDENT PERFORMANCE IN READING
86 © OECD 2010 PISA 2009 ReSultS: WhAt StudentS KnoW And CAn do – Volume I
• Figure I.2.37 •Comparing countries on the different text format subscales
Country performance on the subscale is between 0 to 3 score points higher than on the combined reading scaleCountry performance on the subscale is between 3 to 10 score points higher than on the combined reading scaleCountry performance on the subscale is 10 or more score points higher than on the combined reading scale
Country performance on the subscale is between 0 to 3 score points lower than on the combined reading scaleCountry performance on the subscale is between 3 to 10 score points lower than on the combined reading scaleCountry performance on the subscale is 10 or more score points lower than on the combined reading scale
Reading score
Performance difference between the combined reading scale and each text format subscale
Continuous texts Non-continuous textsShanghai-China 556 8 -16Korea 539 -1 3Finland 536 -1 -1Hong Kong-China 533 5 -11Singapore 526 -4 13Canada 524 0 3New Zealand 521 -3 11Japan 520 1 -2Australia 515 -2 9Netherlands 508 -2 6Belgium 506 -2 5Norway 503 2 -6Estonia 501 -4 11Switzerland 501 -2 5Poland 500 2 -5Iceland 500 0 -1United States 500 0 3Liechtenstein 499 -5 7Sweden 497 2 0Germany 497 -2 0Ireland 496 1 1France 496 -4 3Chinese Taipei 495 1 5Denmark 495 1 -2United Kingdom 494 -3 11Hungary 494 3 -7Portugal 489 3 -1Macao-China 487 1 -6Italy 486 3 -10Latvia 484 0 3Slovenia 483 1 -7Greece 483 4 -11Spain 481 3 -9Czech Republic 478 1 -4Slovak Republic 477 2 -6Croatia 476 2 -4Israel 474 3 -7Luxembourg 472 -1 -1Austria 470 0 2Lithuania 468 2 -6Turkey 464 2 -3Dubai (UAE) 459 1 0Russian Federation 459 1 -7Chile 449 4 -6Serbia 442 2 -4Bulgaria 429 4 -8Uruguay 426 3 -5Mexico 425 1 -1Romania 424 -1 0Thailand 421 2 2Trinidad and Tobago 416 1 0Colombia 413 2 -4Brazil 412 2 -3Montenegro 408 4 -10Jordan 405 12 -18Tunisia 404 4 -11Indonesia 402 4 -3Argentina 398 2 -7Kazakhstan 390 8 -20Albania 385 7 -18Qatar 372 4 -10Panama 371 3 -12Peru 370 4 -13Azerbaijan 362 0 -11Kyrgyzstan 314 5 -21
OECD average 494 0 0
Source: oeCd, PISA 2009 Database, tables I.2.3, I.2.16 and I.2.19.12 http://dx.doi.org/10.1787/888932343133

2A PROFILE OF STUDENT PERFORMANCE IN READING
PISA 2009 ReSultS: WhAt StudentS KnoW And CAn do – Volume I © OECD 2010 87
• Figure I.2.38 •Where countries rank in reading continuous and non-continuous texts
Statistically significantly above the oeCd average not statistically significantly different from the oeCd averageStatistically significantly below the oeCd average
Continuous texts subscale Non-continuous texts subscale
Mean Score S.E.
Range of rank
Mean Score S.E.
Range of rank
OECD countriesAll countries/
economiesOECD
countriesAll countries/
economiesUpper rank
Lower rank
Upper rank
Lower rank
Upper rank
Lower rank
Upper rank
Lower rank
Shanghai-China 564 (2.5) 1 1 Korea 542 (3.6) 1 1 1 3Korea 538 (3.5) 1 2 2 4 Shanghai-China 539 (2.4) 1 4Hong Kong-China 538 (2.3) 2 4 Singapore 539 (1.1) 1 3Finland 535 (2.3) 1 2 2 4 Finland 535 (2.4) 2 3 3 5Canada 524 (1.5) 3 4 5 6 New Zealand 532 (2.3) 2 4 4 6Singapore 522 (1.1) 5 7 Canada 527 (1.6) 4 5 5 7Japan 520 (3.6) 3 5 5 8 Australia 524 (2.3) 4 6 6 9New Zealand 518 (2.4) 4 6 6 9 Hong Kong-China 522 (2.3) 7 9Australia 513 (2.5) 5 7 8 10 Japan 518 (3.5) 5 8 7 11Netherlands 506 (5.0) 5 14 8 18 Netherlands 514 (5.1) 5 10 7 14Norway 505 (2.6) 7 12 10 15 Estonia 512 (2.7) 6 10 9 13Belgium 504 (2.4) 7 12 10 15 Belgium 511 (2.2) 7 10 10 13Poland 502 (2.7) 7 15 10 19 Liechtenstein 506 (3.2) 11 18Iceland 501 (1.6) 9 15 12 19 United Kingdom 506 (2.3) 9 13 12 17United States 500 (3.7) 7 19 10 24 Switzerland 505 (2.5) 9 13 12 17Sweden 499 (3.0) 8 19 11 24 United States 503 (3.5) 9 17 12 22Switzerland 498 (2.5) 10 20 13 24 Chinese Taipei 500 (2.8) 14 23Estonia 497 (2.7) 10 20 13 25 Iceland 499 (1.5) 12 17 16 22Hungary 497 (3.3) 10 22 13 27 France 498 (3.4) 11 20 15 25Ireland 497 (3.3) 10 22 13 27 Sweden 498 (2.8) 12 20 16 25Chinese Taipei 496 (2.6) 14 26 Norway 498 (2.6) 12 19 16 25Denmark 496 (2.1) 12 21 15 25 Germany 497 (2.8) 12 20 16 25Germany 496 (2.7) 12 22 15 27 Ireland 496 (3.0) 12 20 17 26Liechtenstein 495 (3.0) 16 28 Poland 496 (2.8) 13 20 18 26France 492 (3.5) 15 25 18 31 Denmark 493 (2.3) 16 21 22 27Portugal 492 (3.2) 15 24 19 31 Portugal 488 (3.2) 20 22 24 28United Kingdom 492 (2.4) 17 24 21 30 Hungary 487 (3.3) 20 22 25 29Italy 489 (1.6) 20 24 25 30 Latvia 487 (3.4) 25 29Macao-China 488 (0.9) 27 31 Macao-China 481 (1.1) 28 30Greece 487 (4.3) 19 28 23 35 Italy 476 (1.7) 23 27 30 34Spain 484 (2.1) 23 27 28 34 Slovenia 476 (1.1) 23 26 30 33Slovenia 484 (1.1) 24 27 30 34 Czech Republic 474 (3.4) 23 30 29 38Latvia 484 (3.0) 28 36 Spain 473 (2.1) 24 30 31 38Slovak Republic 479 (2.6) 26 29 32 37 Austria 472 (3.2) 23 31 30 39Czech Republic 479 (2.9) 25 29 32 37 Greece 472 (4.3) 23 31 30 40Croatia 478 (2.9) 33 38 Croatia 472 (3.0) 31 39Israel 477 (3.6) 26 31 32 39 Luxembourg 472 (1.2) 26 30 33 38Luxembourg 471 (1.2) 29 31 37 40 Slovak Republic 471 (2.8) 24 31 31 39Lithuania 470 (2.5) 37 41 Israel 467 (3.9) 27 32 34 42Austria 470 (2.9) 29 32 37 41 Lithuania 462 (2.6) 39 42Turkey 466 (3.5) 30 32 38 43 Turkey 461 (3.8) 31 32 39 43Dubai (UAE) 461 (1.2) 41 43 Dubai (UAE) 460 (1.3) 40 42Russian Federation 461 (3.1) 41 43 Russian Federation 452 (3.9) 42 44Chile 453 (3.1) 33 33 43 44 Chile 444 (3.2) 33 33 44 45Serbia 444 (2.3) 45 46 Serbia 438 (2.9) 44 45Bulgaria 433 (6.8) 45 50 Mexico 424 (2.0) 34 34 46 49Uruguay 429 (2.7) 46 49 Romania 424 (4.5) 46 50Mexico 426 (2.0) 34 34 47 50 Thailand 423 (2.7) 46 50Romania 423 (4.0) 46 52 Bulgaria 421 (7.2) 46 52Thailand 423 (2.8) 47 51 Uruguay 421 (2.7) 47 51Trinidad and Tobago 418 (1.3) 50 53 Trinidad and Tobago 417 (1.4) 49 51Jordan 417 (3.2) 50 55 Colombia 409 (4.1) 51 54Colombia 415 (3.7) 50 56 Brazil 408 (2.8) 51 53Brazil 414 (2.8) 51 56 Indonesia 399 (4.5) 53 57Montenegro 411 (1.8) 53 56 Montenegro 398 (1.9) 54 56Tunisia 408 (2.9) 54 58 Tunisia 393 (3.3) 55 58Indonesia 405 (3.7) 55 59 Argentina 391 (5.2) 54 58Argentina 400 (4.6) 56 60 Jordan 387 (4.1) 56 58Kazakhstan 399 (3.1) 57 60 Kazakhstan 371 (3.9) 59 60Albania 392 (4.1) 59 60 Albania 366 (4.6) 59 62Qatar 375 (0.9) 61 63 Qatar 361 (0.9) 60 62Peru 374 (3.9) 61 63 Panama 359 (6.5) 60 64Panama 373 (6.7) 61 64 Peru 356 (4.4) 61 64Azerbaijan 362 (3.3) 63 64 Azerbaijan 351 (4.2) 62 64Kyrgyzstan 319 (3.2) 65 65 Kyrgyzstan 293 (3.7) 65 65
Source: oeCd, PISA 2009 Database.12 http://dx.doi.org/10.1787/888932343133

2A PROFILE OF STUDENT PERFORMANCE IN READING
88 © OECD 2010 PISA 2009 ReSultS: WhAt StudentS KnoW And CAn do – Volume I
Score point differenceMean score
Note: All gender differences are statistically significant (see Annex A3).Countries are ranked in ascending order of the gender score point difference (girls – boys).Source: OECD, PISA 2009 Database, Table I.2.16.
250 300 350 400 450 500 550 600 0 10 20 30 40 50 60 70
• Figure I. 2.39a •Gender differences in reading continuous texts
Mean score on the reading subscale continuous texts
Gender difference (girls – boys)
All studentsBoys Girls
ColombiaPeru
United StatesUnited Kingdom
NetherlandsChile
AzerbaijanBelgiumMexicoSpain
SingaporeDenmark
LiechtensteinBrazil
TunisiaPanamaCanada
Macao-ChinaKorea
Hong Kong-ChinaAustraliaIndonesia
Chinese TaipeiJapan
SwitzerlandIreland
ArgentinaGermanyPortugalFrance
HungarySerbia
ThailandLuxembourg
AustriaIsrael
Shanghai-ChinaEstonia
KazakhstanSweden
Russian FederationNew Zealand
UruguayIcelandTurkey
RomaniaLatviaItaly
GreeceNorway
Czech RepublicPoland
Slovak RepublicQatar
MontenegroCroatiaFinland
KyrgyzstanDubai (UAE)
SloveniaJordan
LithuaniaBulgaria
Trinidad and TobagoAlbania
OECD average 42 score points
In all countries/economies girls perform better than boys
1 2 http://dx.doi.org/10.1787/888932343133

2A PROFILE OF STUDENT PERFORMANCE IN READING
PISA 2009 ReSultS: WhAt StudentS KnoW And CAn do – Volume I © OECD 2010 89
1 2 http://dx.doi.org/10.1787/888932343133
Score point differenceMean score
Note: Statistically significant gender differences are marked in a darker tone (see Annex A3).Countries are ranked in ascending order of the gender score point difference (girls – boys).Source: OECD, PISA 2009 Database, Table I.2.19.
250 300 350 400 450 500 550 600 0 10 20 30 40 50 60 70
• Figure I. 2.39b •Gender differences in reading non-continuous texts
Mean score on the reading subscale non-continuous texts
Gender difference (girls – boys)
All studentsBoys Girls
ColombiaChilePeru
AzerbaijanMexicoBrazil
United StatesTunisia
NetherlandsUnited Kingdom
Hong Kong-ChinaDenmarkPanama
Macao-ChinaArgentinaSingapore
SpainBelgiumThailandUruguayHungary
LiechtensteinKorea
CanadaPortugal
LuxembourgAustralia
Shanghai-ChinaRomaniaIndonesia
TurkeyChinese Taipei
FranceSwitzerland
AustriaJapan
IrelandSerbiaIsrael
GermanyDubai (UAE)
IcelandGreeceNorwayEstonia
ItalyNew Zealand
Russian FederationCroatia
Czech RepublicKyrgyzstan
SwedenPolandLatvia
SloveniaSlovak Republic
KazakhstanMontenegro
QatarTrinidad and Tobago
FinlandLithuaniaAlbaniaBulgariaJordan
OECD average 36 score points

2A PROFILE OF STUDENT PERFORMANCE IN READING
90 © OECD 2010 PISA 2009 ReSultS: WhAt StudentS KnoW And CAn do – Volume I
thus, the gender gap in performance on the non-continuous texts subscale is less than the gap between boys and girls on the continuous texts subscale by about 13 points. other countries that show a similar pattern of performance, where boys performed better on the non-continuous texts scale than on the continuous and girls performed worse, with a difference of more than 10 points, are the oeCd country turkey and the partner countries and economies dubai (uAe), uruguay, trinidad and tobago, Brazil and thailand. In other countries in which the gap narrows substantially between boys’ and girls’ performance on the non-continuous texts subscale, compared with the gap between them on the continuous texts subscale, a different pattern is evident: here, both boys and girls performed better on the continuous texts subscale, but girls perform much better – by more than 10 points. the oeCd countries Slovenia, Chile and hungary, and the partner countries and economies Argentina, hong Kong-China, Kyrgyzstan, Croatia, tunisia and Albania fit this description. Conversely, in some countries, both boys and girls perform better on the non-continuous texts than on the continuous texts subscale. As well as the six countries named previously as performing better overall on non-continuous texts than on the continuous texts subscale (the oeCd countries estonia, new Zealand, united Kingdom and Australia, as well as the partner countries Singapore and liechtenstein), this category includes the oeCd countries the netherlands, Switzerland, Belgium, France, Korea, Canada and the united States, and the partner countries and economies Chinese taipei and latvia. In all of these countries except the united Kingdom and Belgium, boys’ results contribute more to the superior performance on the non-continuous texts subscale than do girls’ results.
In sum, boys tend to do better in handling non-continuous rather than continuous texts. this may be associated with the kinds of reading preferred by boys and girls, which is examined in Volume III. the results in Volume III show, for example, that while substantial numbers of both girls and boys do not read much for pleasure at all, among those who do, girls tend to favour longer texts, such as prose fiction and some non-fiction books, whereas boys spend more time reading newspapers and comics. how accustomed the two gender groups are to these different kinds of texts may help explain their different performance on the continuous and non-continuous texts subscales.
Examples of the PISA 2009 reading unitsthe questions are presented in the order in which they appeared within the unit in the main survey. Percentages of student responses are not provided in the tabulation of framework characteristics (as they were in the parallel material in the 2006 international report) because several of the units were only administered by some of the countries, and the comparison of percentages between questions in those units and other units might lead to a misinterpretation of task difficulty.

2A PROFILE OF STUDENT PERFORMANCE IN READING
PISA 2009 ReSultS: WhAt StudentS KnoW And CAn do – Volume I © OECD 2010 91
BRUSHING YOUR TEETH – QUESTION 1
Situation: EducationalText format: ContinuousText type: ExpositionAspect: Integrate and interpret – Form a broad understandingQuestion format: Multiple choiceDifficulty: 353 (1a)
What is this article about?A. The best way to brush your teeth.B. The best kind of toothbrush to use.C. The importance of good teeth.D. The way different people brush their teeth.
Scoring
Full Credit: the best way to brush your teeth.
Comment
This task requires the reader to recognise the main idea of a short descriptive text. The text is not only short, but about the very familiar, everyday topic of brushing one’s teeth. The language is quite idiomatic (“loads of bacteria”, “bad breath”), and the text is composed of short paragraphs and familiar syntactic structures, with a straightforward heading and a supporting illustration. All of these features combine to make the text very approachable.
The difficulty of this question is located towards bottom of Level 1a, among the easier PISA reading questions. The question stem is rather open and broad, directing the reader to look for a broad generalisation as an answer. The words of the key (“The best way to brush your teeth”) include a term that is part of the title (“brush(ing) your teeth”), and if – drawing on knowledge about the conventional structures and features of texts – there is an expectation that a title is likely to summarise a text, the reader need go no further than the title to find the key. Should confirmation be sought, the first three sentences of the body of the text also encapsulate the main idea, and it is repeated by illustration and elaboration in what little remains of this short piece. Thus the required information is both prominent and repeated in a short and simple text: all markers of relatively easy reading tasks.
do our teeth become cleaner and cleaner the longer and harder we brush them?
British researchers say no. they have actually tried out many different alternatives, and ended up with the perfect way to brush your teeth. A two minute brush, without brushing too hard, gives the best result. If you brush hard, you harm your tooth enamel and your gums without loosening food remnants or plaque.
Bente hansen, an expert on tooth brushing, says that it is a good idea to hold the toothbrush the way you hold a pen. “Start in one corner and brush your way along the whole row,” she says. “don’t forget your tongue either! It can actually contain loads of bacteria that may cause bad breath.”
• Figure I.2.40 •BRUShING yOUR TEETh
“Brushing your teeth” is an article from a norwegian magazine.
Use “Brushing Your Teeth” above to answer the questions that follow.
Level 6698
Level 5626
Level 4553
Level 3480
Level 2407
Level 1a335
Level 1b262
Below Level 1b

2A PROFILE OF STUDENT PERFORMANCE IN READING
92 © OECD 2010 PISA 2009 ReSultS: WhAt StudentS KnoW And CAn do – Volume I
BRUSHING YOUR TEETH – QUESTION 2
Situation: EducationalText format: ContinuousText type: ExpositionAspect: Access and retrieve – Retrieve informationQuestion format: Multiple choiceDifficulty: 358 (1a)
What do the British researchers recommend?A. That you brush your teeth as often as possible.B. That you do not try to brush your tongue.C. That you do not brush your teeth too hard.D. That you brush your tongue more often than your teeth.
Scoring
Full Credit: C. that you do not brush your teeth too hard.
Comment
Another question located at Level 1a, this task requires readers to retrieve a specific piece of information from the text rather than recognise a broad generalisation (as in the previous task); the question is therefore classified as access and retrieve by aspect. The task explicitly directs the reader to the second paragraph with the literal match to “British researchers”. It nevertheless requires some synthesis and some inference, to understand that the British researchers referred to at the beginning of paragraph 2 are those giving the advice throughout the paragraph, and that “gives the best results” is synonymous with “recommend”. Performance on this task showed that the distractor providing most competition for the key is the first one, “That you brush your teeth as often as possible”, presumably because it draws on a plausible misconception based on prior knowledge.
BRUSHING YOUR TEETH – QUESTION 3
Situation: EducationalText format: ContinuousText type: ExpositionAspect: Access and retrieve – Retrieve informationQuestion format: Short responseDifficulty: 285 (1b)
Why should you brush your tongue, according to Bente Hansen?................................................................................................................................................................................................................................
Scoring
Full Credit: Refers either to the bacteria oR getting rid of bad breath, oR both. Response may paraphrase or quote directly from the text.
•to get rid of bacteria.
•Your tongue can contain bacteria.
•Bacteria.
•Because you can avoid bad breath.
•Bad breath.
•to remove bacteria and therefore stop you from having bad breath. [both]
•It can actually contain loads of bacteria that may cause bad breath. [both]
•Bacteria can cause bad breath.
Level 6698
Level 5626
Level 4553
Level 3480
Level 2407
Level 1a335
Level 1b262
Below Level 1b
Level 6698
Level 5626
Level 4553
Level 3480
Level 2407
Level 1a335
Level 1b262
Below Level 1b

2A PROFILE OF STUDENT PERFORMANCE IN READING
PISA 2009 ReSultS: WhAt StudentS KnoW And CAn do – Volume I © OECD 2010 93
Comment
The wording of the question provides two terms that can be used literally to find the relevant section of the text: “Bente Hansen” and “tongue”. Moreover, the term “Bente Hansen” occurs in a prominent position at the very beginning of the last paragraph. In the same paragraph the term “tongue” occurs, giving an even more precise clue for locating the exact place in which the required information is to be found. Each of these terms occurs only once in the text, so the reader does not need to deal with any competing information when matching the question to the relevant part of the text.
With a difficulty located in the lowest described level, Level 1b, this is one of the easiest questions in the PISA 2009 reading assessment. It does nevertheless require a low level of inference, since the reader has to understand that “it” in the last sentence refers to “your tongue”. A further element that might be expected to contribute to difficulty is that the focus of the question is relatively abstract: the reader is asked to identify a cause (“Why?”). Mitigating this potential difficulty, however, is the fact that the word “cause” is explicitly used in the text (“that may cause bad breath”), providing a clear pointer to the required answer, so long as the reader infers the semantic relationship between “why” and “cause”. It is worth noting that tasks at this lowest described level of PISA reading still demand some reading skill beyond mere decoding. It follows that students described as performing at Level 1b have demonstrated that they can read with a degree of understanding, in a manner consistent with the PISA definition of reading.
BRUSHING YOUR TEETH – QUESTION 4
Situation: EducationalText format: ContinuousText type: ExpositionAspect: Reflect and evaluate – Reflect on and evaluate the form of a textQuestion format: Multiple choiceDifficulty: 399 (Level 1a)
Why is a pen mentioned in the text?A. To help you understand how to hold a toothbrush.B. Because you start in one corner with both a pen and a toothbrush.C. To show that you can brush your teeth in many different ways.D. Because you should take tooth brushing as seriously as writing.
Scoring
Full Credit: A. to help you understand how to hold a toothbrush.
Comment
The last of the tasks in this unit is located near the top of Level 1a in difficulty. Its aspect is reflect and evaluate because it requires standing back from the text and considering the intention of one part of it. Although this is a relatively abstract task in comparison with others in this unit, the wording of both the question stem and the key gives substantial support. The reference to “pen” in the stem directs the reader to the third paragraph. The wording of the key has a direct match with the wording in the relevant part of the text: “how to hold a toothbrush” and “hold the toothbrush the way …” respectively. The task requires the reader to recognises an analogy, but the analogical thinking is, again, explicitly there in the text: “hold the toothbrush the way you hold a pen”.
The familiar content and the brevity of the text help to explain why this question is relatively easy, while its somewhat abstract focus accounts for the fact that it is the most difficult of the unit.
Level 6698
Level 5626
Level 4553
Level 3480
Level 2407
Level 1a335
Level 1b262
Below Level 1b

2A PROFILE OF STUDENT PERFORMANCE IN READING
94 © OECD 2010 PISA 2009 ReSultS: WhAt StudentS KnoW And CAn do – Volume I
• Figure I.2.41 •MOBILE PhONE SAFETy
Are mobile phones dangerous?Yes No
Key points
• Conflicting reports about the health risks of mobile phones appeared in the late 1990s.
• Millions of pounds have now been invested in scientific research to investigate the effects of mobile phones.
1.Radio waves given off by mobile phones can heat up body tissue, having damaging effects.
Radio waves are not powerful enough to cause heat damage to the body.
2.magnetic fields created by mobile phones can affect the way that your body cells work.
the magnetic fields are incredibly weak, and so unlikely to affect cells in our body.
3. People who make long mobile phone calls sometimes complain of fatigue, headaches, and loss of concentration.
these effects have never been observed under laboratory conditions and may be due to other factors in modern lifestyles.
4. mobile phone users are 2.5 times more likely to develop cancer in areas of the brain adjacent to their phone ears.
Researchers admit it’s unclear this increase is linked to using mobile phones.
5. the International Agency for Research on Cancer found a link between childhood cancer and power lines. like mobile phones, power lines also emit radiation.
the radiation produced by power lines is a different kind of radiation, with much more energy than that coming from mobile phones.
6. Radio frequency waves similar to those in mobile phones altered the gene expression in nematode worms.
Worms are not humans, so there is no guarantee that our brain cells will react in the same way.
If you use a mobile phone …
Key points
• Given the immense numbers of mobile phone users, even small adverse effects on health could have major public health implications.
• In 2000, the Stewart Report (a British report) found no known health problems caused by mobile phones, but advised caution, especially among the young, until more research was carried out. A further report in 2004 backed this up.
Do Don’tKeep the calls short. don’t use your mobile phone when the
reception is weak, as the phone needs more power to communicate with the base station, and so the radio-wave emissions are higher.
Carry the mobile phone away from your body when it is on standby.
don’t buy a mobile phone with a high “SAR” value1. this means that it emits more radiation.
Buy a mobile phone with a long “talk time”. It is more efficient, and has less powerful emissions.
don’t buy protective gadgets unless they have been independently tested.
MOBILE PHONE SAFETY – QUESTION 2
Situation: PublicText format: Non-continuousText type: ExpositionAspect: Integrate and interpret – Form a broad understandingQuestion format: Multiple choiceDifficulty: 561 (Level 4)
What is the purpose of the Key points?A. To describe the dangers of using mobile phones.B. To suggest that debate about mobile phone safety is ongoing.C. To describe the precautions that people who use mobile phones should take. D. To suggest that there are no known health problems caused by mobile phones.
Level 6698
Level 5626
Level 4553
Level 3480
Level 2407
Level 1a335
Level 1b262
Below Level 1b
“Mobile Phone Safety” on the previous two pages is from a website.
Use “Mobile Phone Safety” to answer the questions that follow.
1. SAR (specific absorption rate) is a measurement of how much electromagnetic radiation is absorbed by body tissue whilst using a mobile phone.

2A PROFILE OF STUDENT PERFORMANCE IN READING
PISA 2009 ReSultS: WhAt StudentS KnoW And CAn do – Volume I © OECD 2010 95
Scoring
Full Credit: to suggest that debate about mobile phone safety is ongoing.
Comment
Classified as a form a broad understanding task within the integrate and interpret aspect, this task focuses on detecting a theme from the repetition of a particular category of information, in this case the “Key Points”, a series of four boxed snippets ranged down the left hand side of the two-page text. Tasks addressing the broad understanding category are typically fairly easy, as they tend to focus on repeated and often prominent ideas in a text. However, several features of this text and task conspire to make it comparatively difficult, at Level 4. The four short Key Points tell their own story: they are related to but do not summarise the information in the body of the two main tables, so the reader needs to focus on what appears as a peripheral part of the text structure. Moreover, while all of the boxes have the caption “Key Points” the content is diverse in terms of text type, making the task of summary more difficult. The first two Key Points give a brief history of the controversy about mobile phones, the third makes a conditional proposition, and the fourth reports an equivocal finding. The fact that ambiguity, uncertainty and opposing ideas are the content of the Key Points is likely, of itself, to make the task more difficult. Here, identifying the “purpose” (which in this context is equivalent to the main theme) means establishing a hierarchy among ideas presented in the Key Points, and choosing the one that is most general and overarching. Options A and C represent different details of the Key Points, but not a single idea that could be described as overarching. Option D lifts a clause (out of context) from the fourth Key Point. Only option B, selected by 45% of students from across the OECD countries, presents a statement that synthesises the heterogeneous elements of the Key Points.
MOBILE PHONE SAFETY – QUESTION 11
Situation: PublicText format: Non-continuousText type: ExpositionAspect: Reflect and evaluate – Reflect on and evaluate the content of a textQuestion format: Multiple choiceDifficulty: 604 (Level 4)
“It is difficult to prove that one thing has definitely caused another.”What is the relationship of this piece of information to the Point 4 Yes and No statements in the table Are mobile phones dangerous?A. It supports the Yes argument but does not prove it.B. It proves the Yes argument.C. It supports the No argument but does not prove it.D. It shows that the No argument is wrong.
Scoring
Full Credit: C. It supports the no argument but does not prove it.
Comment
This task requires the reader to recognise the relationship between a generalised statement external to the text and a pair of statements in a table. It is classified as reflect and evaluate in terms of aspect because of this external reference point. This is the most difficult task in the MOBILE PHONE SAFETY unit, right on the border of Level 4 and Level 5. The degree of difficulty is influenced by a number of factors. First, the stem statement uses abstract terminology (“It is difficult to prove that one thing has definitely caused another”). Secondly – a relatively straightforward part of the task – the reader needs to work out which of the two tables is relevant to this task (the first one) and which point to look at (Point 4). Thirdly, the reader needs to assimilate the structure of the relevant table: namely, that it presents opposing statements in its two columns; as we have already noted, contrary ideas are intrinsically more difficult to deal with than complementary ones. Then, the reader needs to discern precisely how the NO statement challenges the YES statement in a particular instance. Finally, logical relationship between the YES and NO statements in Point 4 must be matched, again at an abstracted level, with one of the options presented in the multiple-choice format of the task. With all these challenges intrinsic to the task, it is not surprising therefore that only a little over one-third of students across OECD countries gained credit for it.
Level 6698
Level 5626
Level 4553
Level 3480
Level 2407
Level 1a335
Level 1b262
Below Level 1b

2A PROFILE OF STUDENT PERFORMANCE IN READING
96 © OECD 2010 PISA 2009 ReSultS: WhAt StudentS KnoW And CAn do – Volume I
MOBILE PHONE SAFETY – QUESTION 6
Situation: PublicText format: Non-continuousText type: ExpositionAspect: Reflect and evaluate – Reflect on and evaluate the content of a text Question format: Open constructed responseDifficulty: 526 (Level 3)
Look at Point 3 in the No column of the table. In this context, what might one of these “other factors” be? Give a reason for your answer.................................................................................................................................................
Scoring
Full Credit
Identifies a factor in modern lifestyles that could be related to fatigue, headaches, or loss of concentration. the explanation may be self-evident, or explicitly stated. For example:
•not getting enough sleep. If you don’t, you will be tired.
•Being too busy. that makes you tired.
•too much homework, that makes you tired And gives you headaches.
•noise – that gives you a headache.
•Stress.
•Working late.
•exams.
•the world is just too loud.
•People don’t take time to relax anymore.
•People don’t prioritise the things that matter, so they get grumpy and sick.
•Computers.
•Pollution.
•Watching too much tV.
•drugs.
•microwave ovens.
•too much emailing.
Comment
Another task in which the reader needs to reflect on and evaluate the content of a text, this task calls on the ability to relate the text to knowledge external to the text. Readers must give an example from their own experience of a factor in modern life, other than mobile phones, that could explain “fatigue, headaches and loss of concentration”. As in the previous task, one step in completing this task successfully is to locate the relevant information using a number reference (here, “Point 3”). The reader’s subsequent steps are less complex than in the previous task, since only the YES part of Point 3 need be taken into account. In addition, the external information that needs to be drawn on is directly related to personal experience, rather than to an abstracted logical statement.
A wide range of responses earn full credit for this task. Full credit is given for producing a factor and providing an explanation as to why this might cause fatigue, headaches and loss of concentration. An example of this kind of response is “Not getting enough sleep. If you don’t, you will be fatigued.” Full credit is also given if it is considered that the explanation is implicit in the statement of the factor, in which case no explicit explanation is required. An example of this kind of response is “stress”. On the other hand, a response such as “lifestyle” is judged too vague, without a supporting explanation or elaboration, and so is given no credit.
Towards the top of Level 3, this task was successfully completed by just over half of the students in OECD countries.
Level 6698
Level 5626
Level 4553
Level 3480
Level 2407
Level 1a335
Level 1b262
Below Level 1b

2A PROFILE OF STUDENT PERFORMANCE IN READING
PISA 2009 ReSultS: WhAt StudentS KnoW And CAn do – Volume I © OECD 2010 97
MOBILE PHONE SAFETY – QUESTION 9
Situation: PublicText format: Non-continuousText type: ExpositionAspect: Integrate and interpret – Develop an interpretationQuestion format: Multiple choiceDifficulty: 488 (Level 3)
Look at the table with the heading If you use a mobile phone …
Which of these ideas is the table based on?A. There is no danger involved in using mobile phones.B. There is a proven risk involved in using mobile phones.C. There may or may not be danger involved in using mobile phones, but it is worth taking precautions.D. There may or may not be danger involved in using mobile phones, but they should not be used until we
know for sure.E. The Do instructions are for those who take the threat seriously, and the Don’t instructions are for everyone else.
Scoring
Full Credit: C. there may or may not be danger involved in using mobile phones, but it is worth taking precautions.
Comment
In this task the reader is explicitly directed to look at the second table, and to recognise its underlying assumption. In fact, the assumption isindicated in the last boxed Key Point: that in the absence of decisive evidence about the danger of mobile phones, it is advisable to take caution. The task asks readers to infer the consequences of this judgment, which can be done by checking that the table’s contents are consistent with the Key Point. Alternatively, the reader can consult only the table and draw an independent conclusion from it. Option A is incorrect since it flatly contradicts the substance of the Key Point, and is inconsistent with the import of a set of injunctions that neither embargoes nor gives carte blanche to mobile phone use. Option B is rather more plausible, but the word “proven” makes it wrong in light of the information in the Key Point that no known health problems caused by mobile phones were found in the two studies that were cited. Option C presents itself as thebest answer, consistent with both the Key Point and all the detail of the DO and DON’T columns. Option D can be dismissed as nothing more than the heading of a table that reads: “If you use a mobile phone …”, and option E sets up a specious opposition that has no support in the text. Just under two-thirds of students selected the correct response, making it the easiest of the four tasks related to this challenging stimulus.
Level 6698
Level 5626
Level 4553
Level 3480
Level 2407
Level 1a335
Level 1b262
Below Level 1b

2A PROFILE OF STUDENT PERFORMANCE IN READING
98 © OECD 2010 PISA 2009 ReSultS: WhAt StudentS KnoW And CAn do – Volume I
Use “Balloon” on the previous page to answer the questions that follow.
© MCT/Bulls
Height record for hot air balloons
the Indian pilot Vijaypat Singhania beat the height record for hot air balloons on november 26, 2005. he was the first person to fly a balloon 21 000 metres above sea level.
Record height21 000 m
Oxygenonly 4% of what is available at ground level
Temperature– 95° C
Fabricnylon
Inflation2.5 hours
Weight1 800 kg
Size453 000 m3 (normal hot air balloon 481 m3)
Gondolaheight: 2.7 mWidth: 1.3 m
Height49 m
Earlier record19 800 m
Jumbo jet10 000 m
New Delhi
Mumbai
483 km
Approximate landing area
The balloon went out towards the sea. When it met the jet stream it was taken back over the land again.
Enclosed pressure cabin with insulated windows
Aluminium construction, like airplanes
Vijaypat Singhania wore a space suit during the trip.
Side slits can be opened to let out hot air for descent.
Size of conventional hot air balloon
BALLOON – QUESTION 8
Situation: EducationalText format: Non-continuousText type: DescriptionAspect: Integrate and interpret – Form a broad understandingQuestion format: Multiple choiceDifficulty: 370 (Level 1a)
What is the main idea of this text?A. Singhania was in danger during his balloon trip.B. Singhania set a new world record.C. Singhania travelled over both sea and land.D. Singhania’s balloon was enormous.
• Figure I.2.42 •BALLOON
Level 6698
Level 5626
Level 4553
Level 3480
Level 2407
Level 1a335
Level 1b262
Below Level 1b

2A PROFILE OF STUDENT PERFORMANCE IN READING
PISA 2009 ReSultS: WhAt StudentS KnoW And CAn do – Volume I © OECD 2010 99
Scoring
Full Credit: B. Singhania set a new world record.
Comment
The main idea of this non-continuous text is stated explicitly and prominently several times, including in the title, “Height record for hot air balloon”. The prominence and repetition of the required information helps to explains its easiness: it is located in the lower half of Level 1a.
Although the main idea is explicitly stated, the question is classified as integrate and interpret, with the sub-classification forming a broad understanding, because it involves distinguishing the most significant and general from subordinate information in the text. The first option – “Singhania was in danger during his balloon trip” – is a plausible speculation, but it is not supported by anything in the text, and so cannot qualify as a main idea. The third option – “Singhania travelled over both sea and land” – accurately paraphrases information from the text, but it is a detail rather than the main idea. The fourth option – “Singhania’s balloon was enormous” – refers to a conspicuous graphic feature in the text but, again, it is subordinate to the main idea.
BALLOON – QUESTION 3
Situation: EducationalText format: Non-continuousText type: DescriptionAspect: Access and retrieve – Retrieve informationQuestion format: Short responseDifficulty: Full credit 595 (Level 4); Partial credit 449 (Level 2)
Vijaypat Singhania used technologies found in two other types of transport. Which types of transport?1. ..........................................................................................2. ..........................................................................................
Scoring
Full Credit: Refers to Both airplanes And spacecraft (in either order, can include both answers on one line). For example:
• 1. Aircraft 2. Spacecraft• 1. Airplanes 2. Space ships• 1. Air travel 2. Space travel• 1. Planes 2. Space rockets• 1. Jets 2. Rockets
Partial Credit: Refers to eItheR airplanes oR spacecraft. For example:
• Spacecraft
• Space travel
• Space rockets
• Rockets
• Aircraft
• Airplanes
• Air travel
• Jets
Level 6698
Level 5626
Level 4553
Level 3480
Level 2407
Level 1a335
Level 1b262
Below Level 1b

2A PROFILE OF STUDENT PERFORMANCE IN READING
100 © OECD 2010 PISA 2009 ReSultS: WhAt StudentS KnoW And CAn do – Volume I
Comment
In this task full credit is given for responses that lists the two required types of transport, and partial credit is given to responses that listed one type. The scoring rules reproduced above demonstrate that credit is available for several different paraphrases of the terms “airplanes” and “spacecraft”.
The partial credit score is located in the upper half of Level 2 while the full credit score is located at Level 4, illustrating the fact that access and retrieve questions can create a significant challenge. The difficulty of the task is particularly influenced by a number of features of the text. The layout, with several different kinds of graphs and multiple captions, is quite a common type of non-continuous presentation often seen in magazines and modern textbooks, but because it does not have a conventional ordered structure (unlike, for example, a table or graph), finding specific pieces of discrete information is relatively inefficient. Captions (“Fabric”, “Record height”, and so on) give some support to the reader in navigating the text, but the information specific required for this task does not have a caption, so that readers have to generate their own categorisation of the relevant information as they search. Having once found the required information, inconspicuously located at the bottom left-hand corner of the diagram, the reader needs to recognise that the “aluminium construction, like airplanes” and the “space suit” are associated with categories of transport. In order to obtain credit for this question, the response needs to refer to a form or forms of transport, rather than simply transcribing an approximate section of text. Thus “space travel” is credited, but “space suit” is not. A significant piece of competing information in the text constitutes a further difficulty: many students referred to a “jumbo jet” in their answer. Although “air travel” or “airplane” or “jet” is given credit, “jumbo jet” is deemed to refer specifically to the image and caption on the right of the diagram. This answer is not given credit as the jumbo jet in the illustration is not included in the material with reference to technology used for Singhania’s balloon.
BALLOON – QUESTION 4
Situation: EducationalText format: Non-continuousText type: DescriptionAspect: Reflect and evaluate – Reflect on and evaluate the content of a textQuestion format: Open Constructed ResponseDifficulty: 510 (Level 3)
What is the purpose of including a drawing of a jumbo jet in this text?................................................................................................................................................................................................................................................
Scoring
Full Credit: Refers explicitly or implicitly to the height of the balloon oR to the record. may refer to comparison between the jumbo jet and the balloon.
•to show how high the balloon went.
•to emphasise the fact that the balloon went really, really high.
•to show how impressive his record really was – he went higher than jumbo jets!
•As a point of reference regarding height.
•to show how impressive his record really was. [minimal]
Comment
The main idea of the text is to describe the height record set by Vijaypat Singhania in his extraordinary balloon. The diagram on the right-hand side of the graphic, which includes the jumbo jet, implicitly contributes to the “wow!” factor of the text, showing just how impressive the height achieved by Singhania was by comparing it with what we usually associate with grand height: a jumbo jet’s flight. In order to gain credit for this task, students must recognise the persuasive intent of including the illustration of the jumbo jet. For this reason the task is classified as reflect and evaluate, with the sub-category reflect on and evaluate the content of a text. At the upper end of Level 3, this question is moderately difficult.
Level 6698
Level 5626
Level 4553
Level 3480
Level 2407
Level 1a335
Level 1b262
Below Level 1b
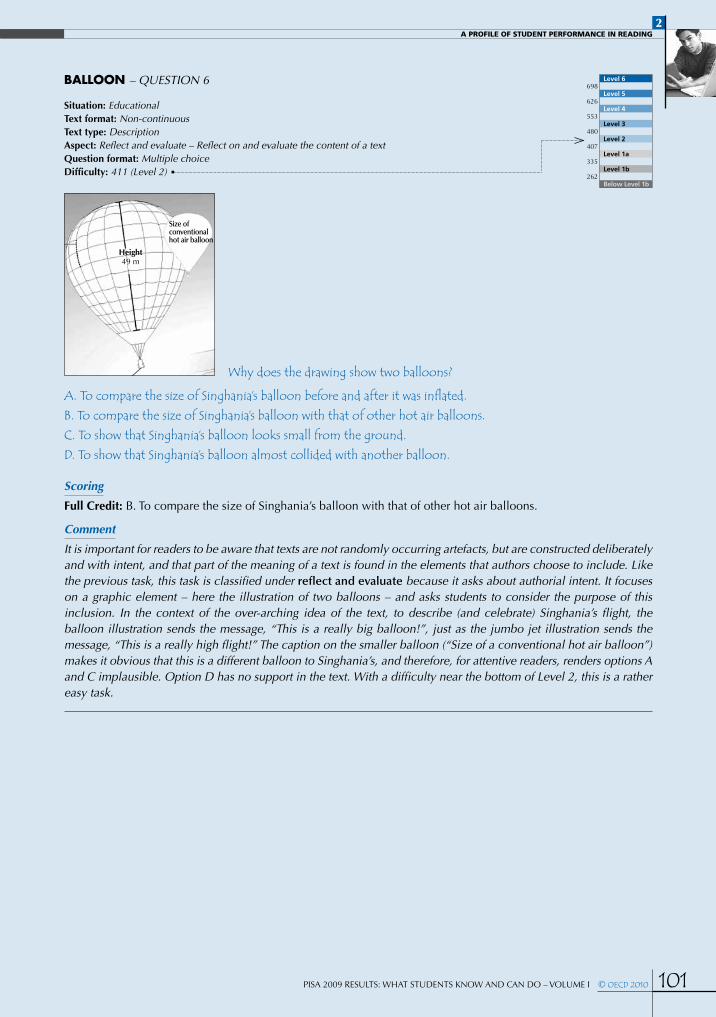
2A PROFILE OF STUDENT PERFORMANCE IN READING
PISA 2009 ReSultS: WhAt StudentS KnoW And CAn do – Volume I © OECD 2010 101
BALLOON – QUESTION 6
Situation: EducationalText format: Non-continuousText type: DescriptionAspect: Reflect and evaluate – Reflect on and evaluate the content of a textQuestion format: Multiple choiceDifficulty: 411 (Level 2)
Height49 m
Size of conventional hot air balloon
Why does the drawing show two balloons?
A. To compare the size of Singhania’s balloon before and after it was inflated.B. To compare the size of Singhania’s balloon with that of other hot air balloons.C. To show that Singhania’s balloon looks small from the ground.D. To show that Singhania’s balloon almost collided with another balloon.
Scoring
Full Credit: B. to compare the size of Singhania’s balloon with that of other hot air balloons.
Comment
It is important for readers to be aware that texts are not randomly occurring artefacts, but are constructed deliberately and with intent, and that part of the meaning of a text is found in the elements that authors choose to include. Like the previous task, this task is classified under reflect and evaluate because it asks about authorial intent. It focuses on a graphic element – here the illustration of two balloons – and asks students to consider the purpose of this inclusion. In the context of the over-arching idea of the text, to describe (and celebrate) Singhania’s flight, the balloon illustration sends the message, “This is a really big balloon!”, just as the jumbo jet illustration sends the message, “This is a really high flight!” The caption on the smaller balloon (“Size of a conventional hot air balloon”) makes it obvious that this is a different balloon to Singhania’s, and therefore, for attentive readers, renders options A and C implausible. Option D has no support in the text. With a difficulty near the bottom of Level 2, this is a rather easy task.
Level 6698
Level 5626
Level 4553
Level 3480
Level 2407
Level 1a335
Level 1b262
Below Level 1b

2A PROFILE OF STUDENT PERFORMANCE IN READING
102 © OECD 2010 PISA 2009 ReSultS: WhAt StudentS KnoW And CAn do – Volume I
Blood donation is essential.
there is no product that can fully substitute for human blood. Blood donation is thus irreplaceable and essential to save lives.
In France, each year, 500,000 patients benefit from a blood transfusion.
the instruments for taking the blood are sterile and single-use (syringe, tubes, bags).
there is no risk in giving your blood.
Blood donation
It is the best-known kind of donation, and takes from 45 minutes to 1 hour.
A 450-ml bag is taken as well as some small samples on which tests and checks will be done.– A man can give his blood five times a year, a woman three times. – donors can be from 18 to 65 years old.
An 8-week interval is compulsory between each donation.
• Figure I.2.43 •BLOOD DONATION
BLOOD DONATION NOTICE – QUESTION 8
Situation: PublicText format: ContinuousText type: ArgumentationAspect: Integrate and interpret – Develop an interpretationQuestion format: Open constructed responseDifficulty: 438 (Level 2)
An eighteen-year-old woman who has given her blood twice in the last twelve months wants to give blood again. According to “Blood Donation Notice”, on what condition will she be allowed to give blood again?......................................................................................................................................................................................................................................................................................................................................................................
Scoring
Full Credit: Identifies that enough time must have elapsed since her last donation.
•depends whether it has been 8 weeks since her last donation or not.
•She can if it has been long enough, otherwise she can’t.
Comment
At a level of difficulty around the middle of Level 2, this task asks the reader to apply the information in the text to a practical case. This is the kind of reading activity that is typically associated with such a text in everyday life, and thus meets one of PISA’s aims in answering questions about how well young people at the end of compulsory schooling are equipped to meet the challenges of their future lives.
The reader must match the case described in the question stem with four pieces of information provided in the second half of the text: the age and sex of the prospective donor, the number of times a person is allowed to give
Level 6698
Level 5626
Level 4553
Level 3480
Level 2407
Level 1a335
Level 1b262
Below Level 1b
“Blood Donation Notice” on the previous page is from a French website.
Use “Blood Donation Notice” to answer the questions that follow.

2A PROFILE OF STUDENT PERFORMANCE IN READING
PISA 2009 ReSultS: WhAt StudentS KnoW And CAn do – Volume I © OECD 2010 103
blood, and the interval required between donations. Reference to this last piece of information is needed in order to meet the task’s requirement to stipulate the “condition” under which the young woman can give blood. As evidenced in the two examples of full credit responses, students are given credit for either a specific answer that includes reference to the interval of eight weeks between donations, or for a more generalised answer, such as “She can if it has been long enough, otherwise she can’t”.
BLOOD DONATION NOTICE – QUESTION 9
Situation: PublicText format: ContinuousText type: ArgumentationAspect: Reflect and evaluate – Reflect on and evaluate the content of a textQuestion format: Multiple choiceDifficulty: 368 (Level 1a)
The text says: “The instruments for taking the blood are sterile and single-use … ”
Why does the text include this information?A. To reassure you that blood donation is safe.B. To emphasise that blood donation is essential.C. To explain the uses of your blood.D. To give details of the tests and checks.
Scoring
QueStIon Intent:
Reflect and evaluate: Reflect on and evaluate the content of a text.
Recognise the persuasive purpose of a phrase in an advertisement.
Full Credit: A. to reassure you that blood donation is safe.
Comment
To gain credit for this task, students must recognise the persuasive purpose of part of an advertisement. The task is classified as reflect and evaluate because students need to consider the wider context of what appears to be a simple statement of fact in order to recognise the underlying purpose for its inclusion.
The relative easiness of this task, which is located in the lower half of Level 1a, can be attributed to the brevity of the text and also to the fact that it deals with an everyday topic. Another characteristic of relatively easy questions exemplified here is that they typically draw on information that is consistent with common preconceptions: there is nothing contrary to expectations in the notion that people are encouraged to donate blood and reassured that donation involves no risk. Although the persuasive intent of this text is not stated explicitly in the words of the blood donation notice, the idea that it is encouraging people to donate blood and reassuring them about the safety of blood donation can be inferred from several statements. The text begins with “Blood donation is essential”, a notion that is repeated and elaborated in the second paragraph (“irreplaceable and essential”). The text also refers to the absence of risk immediately after the section of text in focus in this task, though the logical connection between the two paragraphs – evidence: conclusion – must be inferred.
Level 6698
Level 5626
Level 4553
Level 3480
Level 2407
Level 1a335
Level 1b262
Below Level 1b

2A PROFILE OF STUDENT PERFORMANCE IN READING
104 © OECD 2010 PISA 2009 ReSultS: WhAt StudentS KnoW And CAn do – Volume I
• Figure I.2.44 •MISER
MISER – QUESTION 1
Situation: PersonalText format: ContinuousText type: NarrationAspect: Integrate and interpret – Develop an interpretationQuestion format: Closed constructed responseDifficulty: 373 (Level 1a)
Read the sentences below and number them according to the sequence of events in the text.
The miser decided to turn all his money into a lump of gold.
A man stole the miser’s gold.
The miser dug a hole and hid his treasure in it.
The miser’s neighbour told him to replace the gold with a stone.
Scoring
Full Credit: All four correct: 1, 3, 2, 4 in that order.
Comment
Fables are a popular and respected text type in many cultures and they are a favourite text type in reading assessments for similar reasons: they are short, self-contained, morally instructive and have stood the test of time. While perhaps not the most common reading material for young adults in OECD countries they are nevertheless likely to be familiar from childhood, and the pithy, often acerbic observations of a fable can pleasantly surprise even a blasé 15-year-old. MISER is typical of its genre: it captures and satirises a particular human weakness in a neat economical story, executed in a single paragraph.
Since narrations are defined as referring to properties of objects in time, typically answering “when” questions, it is appropriate to include a task based on a narrative text that asks for a series of statements about the story to be put into the correct sequence. With such a short text, and with statements in the task that are closely matched with the terms of the story, this is an easy task, around the middle of Level 1a. On the other hand, the language of the text is rather formal and has some old-fashioned locutions. (Translators were asked to reproduce the fable-like style of the source versions.) This characteristic of the text is likely to have added to the difficulty of the question.
THEMiSERAndHiSgoldA fable by Aesop
A miser sold all that he had and bought a lump of gold, which he buried in a hole in the ground by the side of an old wall. he went to look at it daily. one of his workmen observed the miser’s frequent visits to the spot and decided to watch his movements. the workman soon discovered the secret of the hidden treasure, and digging down, came to the lump of gold, and stole it. the miser, on his next visit, found the hole empty and began to tear his hair and to make loud lamentations. A neighbour, seeing him overcome with grief and learning the cause, said, “Pray do not grieve so; but go and take a stone, and place it in the hole, and fancy that the gold is still lying there. It will do you quite the same service; for when the gold was there, you had it not, as you did not make the slightest use of it.”
Use the fable “The Miser and his Gold” on the previous page to answer the questions that follow.
Level 6698
Level 5626
Level 4553
Level 3480
Level 2407
Level 1a335
Level 1b262
Below Level 1b

2A PROFILE OF STUDENT PERFORMANCE IN READING
PISA 2009 ReSultS: WhAt StudentS KnoW And CAn do – Volume I © OECD 2010 105
MISER – QUESTION 7
Situation: PersonalText format: ContinuousText type: NarrationAspect: Access and retrieve – Retrieve information Question format: Short responseDifficulty: 310 (Level 1b)
How did the miser get a lump of gold?
.......................................................................................................................................................
Scoring
Full Credit: States that he sold everything he had. may paraphrase or quote directly from the text.
•he sold all he had.
•he sold all his stuff.
•he bought it. [implicit connection to selling everything he had]
Comment
This is one of the easiest tasks in PISA reading, with a difficulty in the middle of Level 1b. The reader is required to access and retrieve a piece of explicitly stated information in the opening sentence of a very short text. To gain full credit, the response can either quote directly from the text – “He sold all that he had” – or provide a paraphrase such as “He sold all his stuff”. The formal language of the text, which is likely to have added difficulty in other tasks in the unit, is unlikely to have much impact here because the required information is located at the very beginning of the text. Although this is an extremely easy question in PISA’s frame of reference, it still requires a small degree of inference, beyond the absolutely literal: the reader must infer that there is a causal connection between the first proposition (that the miser sold all he had) and the second (that he bought gold).
MISER – QUESTION 5
Situation: PersonalText format: ContinuousText type: NarrationAspect: Integrate and interpret – Develop an interpretationQuestion format: Open constructed responseDifficulty: 548 (Level 3)
Here is part of a conversation between two people who read “The Miser and his Gold”.
Speaker 1 Speaker 2
What could Speaker 2 say to support his point of view?
.......................................................................................................................................................
.......................................................................................................................................................
Level 6698
Level 5626
Level 4553
Level 3480
Level 2407
Level 1a335
Level 1b262
Below Level 1b
Level 6698
Level 5626
Level 4553
Level 3480
Level 2407
Level 1a335
Level 1b262
Below Level 1b
No he couldn’t. The stone was important in the story.
The neighbour was nasty. He could have recommended replacing the gold with something better than a stone.

2A PROFILE OF STUDENT PERFORMANCE IN READING
106 © OECD 2010 PISA 2009 ReSultS: WhAt StudentS KnoW And CAn do – Volume I
Scoring
Full Credit
Recognises that the message of the story depends on the gold being replaced by something useless or worthless.
•It needed to be replaced by something worthless to make the point.
•the stone is important in the story, because the whole point is he might as well have buried a stone for all the good the gold did him.
•If you replaced it with something better than a stone, it would miss the point because the thing buried needs to be something really useless.
•A stone is useless, but for the miser, so was the gold!
•Something better would be something he could use – he didn’t use the gold, that’s what the guy was pointing out.
•Because stones can be found anywhere. the gold and the stone are the same to the miser. [“can be found anywhere” implies that the stone is of no special value]
Comment
This task takes the form of setting up a dialogue between two imaginary readers, to represent two conflicting interpretations of the story. In fact only the second speaker’s position is consistent with the overall implication of the text, so that in providing a supporting explanation readers demonstrate that they have understood the “punch line” – the moral import – of the fable. The relative difficulty of the task, near the top of Level 3, is likely to be influenced by the fact that readers needs to do a good deal of work to generate a full credit response. First they must make sense of the neighbour’s speech in the story, which is expressed in a formal register. (As noted, translators were asked to reproduce the fable-like style.) Secondly, the relationship between the question stem and the required information is not obvious: there is little or no support in the stem (“What could Speaker 2 say to support his point of view?”) to guide the reader in interpreting the task, though the reference to the stone and the neighbour by the speakers should point the reader to the end of the fable.
As shown in examples of responses, to gain full credit, students could express,in a variety of ways, the key idea that wealth has no value unless it is used. Vague gestures at meaning, such as “the stone had a symbolic value”, are not given credit.

2A PROFILE OF STUDENT PERFORMANCE IN READING
PISA 2009 ReSultS: WhAt StudentS KnoW And CAn do – Volume I © OECD 2010 107
• Figure I.2.45 •ThE PLAy’S ThE ThING
60 who we are. Wouldn’t it be much easier to start all this by standing up and introducing ourselves? Stands up. Good evening. the three of us are guests in this castle. We have just arrived from the dining room where we had an excellent dinner and drank two bottles of champagne. my name is Sándor tuRAI, I’m a playwright, I’ve been writing plays for thirty years, that’s my profession. Full stop. Your turn.
GÁLStands up. my name is GÁl, I’m also a playwright. I write plays as well, all of them in the company of this gentleman here. We are a famous playwright duo. All playbills of good comedies and operettas read: written by GÁl and tuRAI. naturally, this is my profession as well.
GÁL and TURAITogether. And this young man …
ÁDÁMStands up. this young man is, if you allow me, Albert ÁdÁm, twenty-five years old, composer. I wrote the music for these kind gentlemen for their latest operetta. this is my first work for the stage. these two elderly angels have discovered me and now, with their help, I’d like to become famous. they got me invited to this castle. they got my dress-coat and tuxedo made. In other words, I am poor and unknown, for now. other than that I’m an orphan and my grandmother raised me. my grandmother has passed away. I am all alone in this world. I have no name, I have no money.
TURAIBut you are young.
GÁLAnd gifted.
ÁDÁMAnd I am in love with the soloist.
TURAIYou shouldn’t have added that. everyone in the audience would figure that out anyway.
They all sit down.
TURAInow wouldn’t this be the easiest way to start a play?
GÁLIf we were allowed to do this, it would be easy to write plays.
TURAItrust me, it’s not that hard. Just think of this whole thing as …
GÁLAll right, all right, all right, just don’t start talking about the theatre again. I’m fed up with it. We’ll talk tomorrow, if you wish.
65
70
75
80
85
90
95
100
105
110
115
Takes place in a castle by the beach in Italy.
FIRST ACTOrnate guest room in a very nice beachside castle. Doors on the right and left. Sitting room set in the middle of the stage: couch, table, and two armchairs. Large windows at the back. Starry night. It is dark on the stage. When the curtain goes up we hear men conversing loudly behind the door on the left. The door opens and three tuxedoed gentlemen enter. One turns the light on immediately. They walk to the centre in silence and stand around the table. They sit down together, Gál in the armchair to the left, Turai in the one on the right, Ádám on the couch in the middle. Very long, almost awkward silence. Comfortable stretches. Silence. Then:
GÁLWhy are you so deep in thought?
TURAII’m thinking about how difficult it is to begin a play. to introduce all the principal characters in the beginning, when it all starts.
ÁDÁMI suppose it must be hard.
TURAIIt is – devilishly hard. the play starts. the audience goes quiet. the actors enter the stage and the torment begins. It’s an eternity, sometimes as much as a quarter of an hour before the audience finds out who’s who and what they are all up to.
GÁLQuite a peculiar brain you’ve got. Can’t you forget your profession for a single minute?
TURAIthat cannot be done.
GÁLnot half an hour passes without you discussing theatre, actors, plays. there are other things in this world.
TURAIthere aren’t. I am a dramatist. that is my curse.
GÁLYou shouldn’t become such a slave to your profession.
TURAIIf you do not master it, you are its slave. there is no middle ground. trust me, it’s no joke starting a play well. It is one of the toughest problems of stage mechanics. Introducing your characters promptly. let’s look at this scene here, the three of us. three gentlemen in tuxedoes. Say they enter not this room in this lordly castle, but rather a stage, just when a play begins. they would have to chat about a whole lot of uninteresting topics until it came out
5
10
15
20
25
30
35
40
45
50
55
“The Play’s the Thing” is the beginning of a play by the hungarian dramatist Ferenc molnár.
Use “The Play’s the Thing” on the previous two pages to answer the questions that follow. (Note that line numbers are given in the margin of the script to help you find parts that are referred to in the questions.)

2A PROFILE OF STUDENT PERFORMANCE IN READING
108 © OECD 2010 PISA 2009 ReSultS: WhAt StudentS KnoW And CAn do – Volume I
THE PLAY’S THE THING – QUESTION 3
Situation: PersonalText format: ContinuousText type: NarrationAspect: Integrate and interpret – Develop an interpretationQuestion format: Short responseDifficulty: 730 (Level 6)
What were the characters in the play doing just before the curtain went up?.......................................................................................................................................................
Scoring
Full Credit: Refers to dinner or drinking champagne. may paraphrase or quote the text directly.
•they have just had dinner and champagne.
•“We have just arrived from the dining room where we had an excellent dinner.”[direct quotation]
•“An excellent dinner and drank two bottles of champagne.” [direct quotation]
•dinner and drinks.
•dinner.
•drank champagne.
•had dinner and drank.
•they were in the dining room.
Comment
This task illustrates several features of the most difficult tasks in PISA reading. The text is long by PISA standards, and it may be supposed that the fictional world depicted is remote from the experience of most 15-year-olds. The introduction to the unit tells students that the stimulus of THE PLAY’S THE THING is the beginning of a play by the Hungarian dramatist Ferenc Molnár, but there is no other external orientation. The setting (“a castle by the beach in Italy”) is likely to be exotic to many, and the situation is only revealed gradually through the dialogue itself. While individual pieces of vocabulary are not particularly difficult, and the tone is often chatty, the register of the language is a little mannered. Perhaps most importantly a level of unfamiliarity is introduced by the abstract theme of the discussion: a sophisticated conversation between characters about the relationship between life and art, and the challenges of writing for the theatre. The text is classified as narration because this theme is dealt with as part of the play’s narrative.
While all the tasks in this unit acquire a layer of difficulty associated with the challenges of the text, the cognitive demand of this task in particular is also attributable to the high level of interpretation required to define the meaning of the question’s terms, in relation to the text. The reader needs to be alert to the distinction between characters and actors. The question refers to what the characters (not the actors) were doing “just before the curtain went up”. This is potentially confusing since it requires recognition of a shift between the real world of a stage in a theatre, which has a curtain, and the imaginary world of Gal, Turai and Adam, who were in the dining room having dinner just before they entered the guest room (the stage setting). A question that assesses students’ capacity to distinguish between real and fictional worlds seems particularly appropriate in relation to a text whose theme is about just that, so that the complexity of the question is aligned with the content of the text.
A further level of the task’s difficulty is introduced by the fact that the required information is in an unexpected location. The question refers to the action “before the curtain went up”, which would typically lead one to search at the opening of the scene, the beginning of the extract. On the contrary, the information is actually found about half-way through the extract, when Turai reveals that he and his friends “have just arrived from the dining room”. While the scoring for the question shows that several kinds of response are acceptable, to be given full credit readers must demonstrate that they have found this inconspicuous piece of information. The need to assimilate information that is contrary to expectations – where the reader needs to give full attention to the text in defiance of preconceptions – is highly characteristic of the most demanding reading tasks in PISA.
Level 6698
Level 5626
Level 4553
Level 3480
Level 2407
Level 1a335
Level 1b262
Below Level 1b

2A PROFILE OF STUDENT PERFORMANCE IN READING
PISA 2009 ReSultS: WhAt StudentS KnoW And CAn do – Volume I © OECD 2010 109
THE PLAY’S THE THING – QUESTION 4 Situation: PersonalText format: ContinuousText type: NarrationAspect: Integrate and interpret – Develop an interpretationQuestion format: Multiple choiceDifficulty: 474 (Level 2)
“It’s an eternity, sometimes as much as a quarter of an hour … ” (lines 29-30)According to Turai, why is a quarter of an hour “an eternity”?A. It is a long time to expect an audience to sit still in a crowded theatre.B. It seems to take forever for the situation to be clarified at the beginning of a play.C. It always seems to take a long time for a dramatist to write the beginning of a play.D. It seems that time moves slowly when a significant event is happening in a play.
Scoring
Full Credit: B. It seems to take forever for the situation to be clarified at the beginning of a play.
Comment
Near the borderline between Level 2 and Level 3, this question together with the previous one illustrates the fact that questions covering a wide range of difficulties can be based on a single text.
Unlike in the previous task, the stem of this task directs the reader to the relevant section in the play, even quoting the lines, thus relieving the reader of any challenge in figuring out where the necessary information is to be found. Nevertheless, the reader needs to understand the context in which the line is uttered in order to respond successfully. In fact, the implication of “It seems to take forever for the situation to be clarified at the beginning of a play” underpins much of the rest of this extract, which enacts the solution of characters explicitly introducing themselves at the beginning of a play instead of waiting for the action to reveal who they are. Insofar as the utterance that is quoted in the stem prompts most of the rest of this extract, repetition and emphasis support the reader in integrating and interpreting the quotation. In that respect too, this task clearly differs from Question 3, in which the required information is only provided once, and is buried in an unexpected part of the text.
THE PLAY’S THE THING – QUESTION 7
Situation: PersonalText format: ContinuousText type: NarrationAspect: Integrate and interpret – Form a broad understandingQuestion format: Multiple choiceDifficulty: 556 (Level 4)
Overall, what is the dramatist Molnár doing in this extract?A. He is showing the way that each character will solve his own problems.B. He is making his characters demonstrate what an eternity in a play is like.C. He is giving an example of a typical and traditional opening scene for a play.D. He is using the characters to act out one of his own creative problems.
Scoring
Full Credit: d. he is using the characters to act out one of his own creative problems.
Comment
In this task the reader is asked to take a global perspective, form a broad understanding by integrating and interpreting the implications of the dialogue across the text. The task involves recognising the conceptual theme of a section of a play, where the theme is literary and abstract. This relatively unfamiliar territory for most 15-year-olds is likely to constitute the difficulty of the task, which is located at Level 4. A little under half of the students in OECD countries gained full credit for this task, with the others divided fairly evenly across the three distractors.
Level 6698
Level 5626
Level 4553
Level 3480
Level 2407
Level 1a335
Level 1b262
Below Level 1b
Level 6698
Level 5626
Level 4553
Level 3480
Level 2407
Level 1a335
Level 1b262
Below Level 1b

2A PROFILE OF STUDENT PERFORMANCE IN READING
110 © OECD 2010 PISA 2009 ReSultS: WhAt StudentS KnoW And CAn do – Volume I
• Figure I.2.46 •TELECOMMUTING
TELECOMMUTING – QUESTION 1
Situation: OccupationalText format: MultipleText type: ArgumentationAspect: Integrate and interpret – Form a broad understandingQuestion format: Multiple choiceDifficulty: 537 (Level 3)
What is the relationship between “The way of the future” and “Disaster in the making”?A. They use different arguments to reach the same general conclusion.B. They are written in the same style but they are about completely different topics.C. They express the same general point of view, but arrive at different conclusions.D. They express opposing points of view on the same topic.
Scoring
Full Credit: d. they express opposing points of view on the same topic.
Comment
The stimulus for the unit TELECOMMUTING is two short texts that offer contrasting opinions on telecommuting, defined in a footnote to the text as “working on a computer away from a central office”. The only addition to the originally submitted text that was made by PISA test developers was this footnote. It was assumed that the term “telecommuting” would be unfamiliar to most 15-year-olds.The footnote was included in order to avoid giving an advantage to students whose language would allow them to unpack the meaning of this compound word. For example, students tested in English may have been able to infer the meaning of the word by combining the meaning of “tele” (distant) and “commute”. By contrast, some countries in which English is not the testing language used the English term or a transliteration, which would not provide the same clues to the meaning.
The way of the future
Just imagine how wonderful it would be to “telecommute”1 to work on the electronic highway, with all your work done on a computer or by phone! no longer would you have to jam your body into crowded buses or trains or waste hours and hours travelling to and from work. You could work wherever you want to – just think of all the job opportunities this would open up!
MollyDisaster in the making
Cutting down on commuting hours and reducing the energy consumption involved is obviously a good idea. But such a goal should be accomplished by improving public transportation or by ensuring that workplaces are located near where people live. the ambitious idea that telecommuting should be part of everyone’s way of life will only lead people to become more and more self-absorbed. do we really want our sense of being part of a community to deteriorate even further?
Richard
1. “telecommuting” is a term coined by Jack nilles in the early 1970s to describe a situation in which workers work on a computer away from a central office (for example, at home) and transmit data and documents to the central office via telephone lines.
Use “Telecommuting” above to answer the questions that follow.
Level 6698
Level 5626
Level 4553
Level 3480
Level 2407
Level 1a335
Level 1b262
Below Level 1b

2A PROFILE OF STUDENT PERFORMANCE IN READING
PISA 2009 ReSultS: WhAt StudentS KnoW And CAn do – Volume I © OECD 2010 111
The purpose of each of the short texts in the stimulus is to persuade readers to a point of view, so the stimulus is classified as argumentation. Given that the purpose of the stimulus material is to discuss an issue related to working life, the text is classified as occupational in terms of situation. The two pieces that make up the stimulus are both continuous, but because they were generated independently and juxtaposed for the purpose of the assessment, the text format classification of this text is multiple.
This question requires students to recognise the relationship between the two short texts. To answer correctly, students must first form a global understanding of each of the short texts, and then identify the relationship between them: that is, that they express contrasting points of view on the same topic. A factor contributing to the difficulty of this question is the level of interpretation required to identify the position that is expressed in each text. In the first text the author’s position is signalled clearly early in the text (“Just imagine how wonderful it would be to ‘telecommute’ to work …”) and reinforced throughout. In contrast the second piece contains no direct statement of the author’s own position: instead, it is written as a series of responses to arguments that the author opposes, so understanding the position of the second author requires a greater level of interpretation than understanding the position of the first author. Once the work of interpreting the position of each author has been done, recognising that the positions are contrasting is relatively straightforward. The weakest students chose option B. These students fail to recognise that the two texts are about the same topic. Students who chose options A and C recognise that the two texts are about the same topic, but fail to identify that they express contrasting views. At Level 3, just over one-half of the students in OECD countries gained credit for this question.
TELECOMMUTING – QUESTION 7
Situation: OccupationalText format: ContinuousText type: ArgumentationAspect: Reflect and evaluate – Reflect on and evaluate the content of a textQuestion format: Open constructed responseDifficulty: 514 (Level 3)
What is one kind of work for which it would be difficult to telecommute? Give a reason for your answer.
..............................................................................................................................................................................
..............................................................................................................................................................................
..............................................................................................................................................................................
..............................................................................................................................................................................
Scoring
QueStIon Intent:
Reflect and evaluate: Reflect on and evaluate the content of a text
use prior knowledge to generate an example that fits a category described in a text
Full Credit: Identifies a kind of work and gives a plausible explanation as to why a person who does that kind of work could not telecommute. Responses muSt indicate (explicitly or implicitly) that it is necessary to be physically present for the specific work.
• Building. It’s hard to work with the wood and bricks from just anywhere.
• Sportsperson. You need to really be there to play the sport.
• Plumber. You can’t fix someone else’s sink from your home!
• digging ditches because you need to be there.
• nursing – it’s hard to check if patients are ok over the Internet.
Level 6698
Level 5626
Level 4553
Level 3480
Level 2407
Level 1a335
Level 1b262
Below Level 1b

2A PROFILE OF STUDENT PERFORMANCE IN READING
112 © OECD 2010 PISA 2009 ReSultS: WhAt StudentS KnoW And CAn do – Volume I
Comment
This question requires students to generate an example (a profession) that fits a given category. The textual information required for this question is found in the footnote definition of telecommuting. Therefore, although the stimulus is comprised of multiple texts, this question is classified as continuous in terms of text format because it only refers to one text element.
To provide an example of a job in which telecommuting would be difficult, students must link their comprehension of the text (the definition of telecommuting) with outside knowledge, since no specific profession is mentioned in the text. This question is therefore classified as reflect and evaluate, with the sub-category reflect on and evaluate the content of a text.
In order to gain credit for this question, students needed to give an example and to justify why their example fitted the given category, and the explanation needed to refer either explicitly or implicitly to the fact that the worker would need to be physically present in order to perform their job. Although the range of responses eligible for full credit was very wide, many students failed to gain credit because they did not provide an explanation at all, or they gave an explanation that did not show that they understood that the job they listed would require the worker’s physical presence. An example of the latteris, “Digging ditches because it would be hard work.” Compare this with the credited response, “Digging ditches because you need to be there.”
Nearly 60% of students gained full credit for this question.
Example of a digital reading taskone task from the PISA 2009 assessment of reading of digital texts, comprising four items, is reproduced in this section. Screen shots are used to illustrate parts of the stimulus relevant to each question. the digital version of this unit and other released tasks are available at www.pisa.oecd.org.

2A PROFILE OF STUDENT PERFORMANCE IN READING
PISA 2009 ReSultS: WhAt StudentS KnoW And CAn do – Volume I © OECD 2010 113
IWANTTOHELP – QUESTION 1
Situation: OccupationalEnvironment: Message-basedText format: ContinuousText type: DescriptionAspect: Access and retrieve – Retrieve informationQuestion format: Multiple choice
Read Maika’s blog entry for January 1. What does the entry say about Maika’s experience of volunteering?A. She has been a volunteer for many years.B. She only volunteers in order to be with her friends.C. She has done a little volunteering but would like to do more.D. She has tried volunteering but does not think it is worthwhile.
Scoring
Full Credit: C. She has done a little volunteering but would like to do more.
Comment
The first page that students see in this unit is the home page of the blog (Life Begins at 16) of a young person named Maika. This page contains two entries from the blog, for January 1 and January 6. Although this kind of text often appears on a social networking site, the specific content describes Maika’s interest in and plans for doing voluntary work, so this question (and later questions in this unit) are classified as falling within the occupational context.
Fifteen-year-old students may not have much experience of volunteering, but the concept is quite concrete, and the text is made accessible by the use of language that is relatively simple and colloquial (“Just a quick post”, “(seriously)”), and addressed directly to the audience who may be reading it (“share my New Year’s resolution with you”, “You may remember”, “has anyone else used this site?”). The page contains features typical of social networking sites, with four links available within the site (“About”, “Contact”, “Read my complete profile”, “Comments”) and one link to an external site (www.iwanttohelp.org).
• Figure I.2.47 •IWANTTOhELP
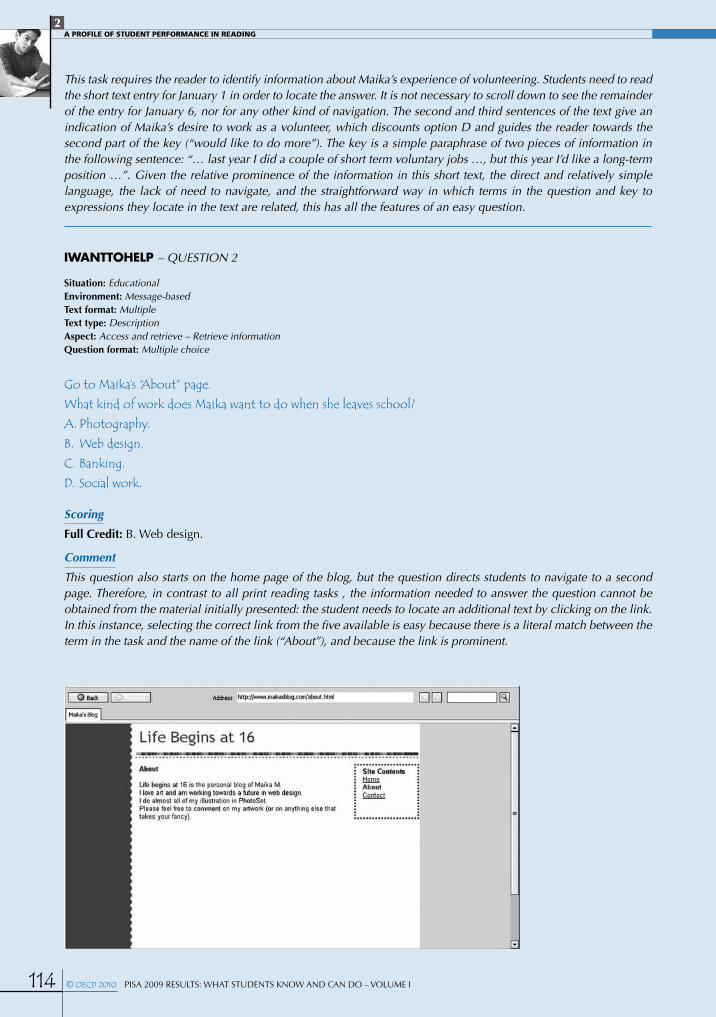
2A PROFILE OF STUDENT PERFORMANCE IN READING
114 © OECD 2010 PISA 2009 ReSultS: WhAt StudentS KnoW And CAn do – Volume I
This task requires the reader to identify information about Maika’s experience of volunteering. Students need to read the short text entry for January 1 in order to locate the answer. It is not necessary to scroll down to see the remainder of the entry for January 6, nor for any other kind of navigation. The second and third sentences of the text give an indication of Maika’s desire to work as a volunteer, which discounts option D and guides the reader towards the second part of the key (“would like to do more”). The key is a simple paraphrase of two pieces of information in the following sentence: “… last year I did a couple of short term voluntary jobs …, but this year I’d like a long-term position …”. Given the relative prominence of the information in this short text, the direct and relatively simple language, the lack of need to navigate, and the straightforward way in which terms in the question and key to expressions they locate in the text are related, this has all the features of an easy question.
IWANTTOHELP – QUESTION 2
Situation: EducationalEnvironment: Message-basedText format: MultipleText type: DescriptionAspect: Access and retrieve – Retrieve informationQuestion format: Multiple choice
Go to Maika’s “About” page. What kind of work does Maika want to do when she leaves school?A. Photography.B. Web design.C. Banking.D. Social work.
Scoring
Full Credit: B. Web design.
Comment
This question also starts on the home page of the blog, but the question directs students to navigate to a second page. Therefore, in contrast to all print reading tasks , the information needed to answer the question cannot be obtained from the material initially presented: the student needs to locate an additional text by clicking on the link. In this instance, selecting the correct link from the five available is easy because there is a literal match between the term in the task and the name of the link (“About”), and because the link is prominent.

2A PROFILE OF STUDENT PERFORMANCE IN READING
PISA 2009 ReSultS: WhAt StudentS KnoW And CAn do – Volume I © OECD 2010 115
Once students click on this link, a second text appears, hiding the first text – this is one of the strongest distinctions between print and digital texts. This new text is very brief, containing a small amount of background information about the personal life of the writer of the blog. It can be considered as dealing with information of a kind likely to be fairly familiar to most 15-year-olds. There is minor distracting information in option A, with reference to “PhotoSet” in the text, while option D is also plausible, given the information on the first text (the home page) about Maika’s expressed desire to do voluntary work and to make a difference to someone’s life. Answering this question relies on making a literal match between the key and one of the terms in the text, “web design”. The brevity of the text, its simple language, and the literal matches make this question relatively comprehensible; it appears that the need for one navigation step adds an element of difficulty, making it slightly more difficult than the previous question.
IWANTTOHELP – QUESTION 3
Situation: EducationalEnvironment: AuthoredText format: MultipleText type: ArgumentationAspect: Integrate and interpret – Form a broad understandingQuestion format: Multiple choice
Open the link that Maika refers to in her January 1 post. What is the main function of this website?A. To encourage people to buy iwanttohelp products.B. To encourage people to give money to people in need.C. To explain how you can make money by volunteering.D. To provide people with information about ways to volunteer.E. To tell people in need where they can find help.
Scoring
Full Credit: d. to provide people with information about ways to volunteer.
Comment
In this task students are required to recognise the main idea of a text, but in order to do this, they first need to find the text. In order to view the necessary text, they have to click on a link, as indicated in the task. Only one of the hyperlinks on this page occurs within the blog entry for January 1, so the direction in the task is explicit, but four other links available on the page act as distractors. Clicking on the correct link takes the reader not only to a new page, but also to an entirely new website, the home page for an organisation called iwanttohelp. This page opens in a new tab, so that it is possible for students to click on the tab “Maika’s Blog” if they wish to return to the first text, although that is not necessary for this task. The content of the new website is more abstract, employing terms that may be relatively unfamiliar to students, such as “non-profit organisation”, “opportunity” and “.org”, and is addressed to a large anonymous audience rather than operating at the personal level of a blog.

2A PROFILE OF STUDENT PERFORMANCE IN READING
116 © OECD 2010 PISA 2009 ReSultS: WhAt StudentS KnoW And CAn do – Volume I
This text is classified as argumentation because it encourages readers to take action, either by contacting other organisations (“Find an Opportunity Now”) or by making donations (“We rely on public donations”). Four links to other part of the website are available on this page, if students wish to explore the site in order to obtain a broader picture of the organisation. This however would be time consuming and inefficient. Such opportunities always exist for anyone reading material on the Internet, so one feature of reading in this environment is being able to judge when it is necessary to open new links, thus expanding the number of available texts.
In this case, in order to answer this broad understanding question, students need to read the short description of the organisation provided in the box on the left of the home page, supported by the prominent question and link above the photograph. It is not possible to make any literal matches between the task and the key: some (relatively low) level of inference is needed to recognise that this site provides information explaining how people could volunteer. The distractors all have some degree of plausibility, because of their references to the iwanttohelp site, to money and people in need, to volunteering, and to giving information about help.
This task is somewhat harder than the previous task, although it is still relatively easy. The comparative difficulty is explained by the need to navigate to the text with the required information using the correct link; the amount of potentially distracting information available through irrelevant links on the web pages; the somewhat abstract and unfamiliar information and language used; and the need for a level of inference to answer the question.
IWANTTOHELP – QUESTION 4 Situation: EducationalEnvironment: MixedText format: MultipleText type: Not specifiedAspect: ComplexQuestion format: Constructed response
Read Maika’s blog for January 1. Go to the iwanttohelp site and find an opportunity for Maika. Use the e-mail button on the “Opportunity Details” page for this opportunity to tell Maika about it. Explain in the e-mail why the opportunity is suitable for her. Then send your e-mail by clicking on the “Send” button.
Scoring
Full Credit: Selects Graphic Artist or upway Primary School and writes a message in the e-mail text box with a relevant explanation that matches maika’s criteria.
E-mail message for Graphic Artist
Refers to ongoing position or future or web design or art.•You’re a great artist and it is ongoing – you said you wanted a longer type of work right?•It’s ongoing and it would help you get experience for your future.•You are obviously interested in graphic design, and want to pursue this when you finish school, and you would also
love to volunteer. this would be a great opportunity to do both these things, and will look great on your CV too!.
oR
E-mail message for Upway Primary School
Refers to ongoing position or making a difference.•this would be a good job – ongoing and you get to help some kids.•here’s a job where you’ll really make a difference.
Partial Credit: Selects Graphic Artist or upway Primary School and writes a message in the e-mail text box with no explanation or an irrelevant explanation.
E-mail message for Graphic Artist
Gives insufficient or vague answer.•You’d like it.
Shows inaccurate comprehension of the opportunity or gives an implausible or irrelevant answer.
•You’d be working with kids a lot. [Irrelevant, not one of Maika’s criteria.]•It gives you a chance to get out and about.
oR

2A PROFILE OF STUDENT PERFORMANCE IN READING
PISA 2009 ReSultS: WhAt StudentS KnoW And CAn do – Volume I © OECD 2010 117
E-mail message for Upway Primary School
Gives insufficient or vague answer.
•You need an hour a week but it sounds like this could be what you’re looking for. [Lacks reference to job criteria, repeats part of stem.]
•You’d like it.
Shows inaccurate comprehension of the opportunity or gives an implausible or irrelevant answer.
•It gives you a chance to get out and about.
Comment
This is an example of a complex task, which involves all three aspects of reading. It also has a substantial navigation requirement. This complexity highlights a number of differences between print and digital reading tasks. The overall task requires students to construct a short e-mail message after integrating and reflecting upon information located in several texts. The text type has not been specified because the task requires the reader to integrate information from several types of text: argumentation (the iwanttohelp website), description (Maika’s blog) and transaction (the e-mail).
Beginning with an interpretation of information given on Maika’s blog, students are then required to locate a number of pages on the iwanttohelp website, to evaluate information on these pages in relation to what they have read on the blog, and to use the evaluation to send Maika a simple message. There is no single pathway for navigation, and two different texts can be used to formulate responses that receive credit. This variability is typical of navigation in the digital environment.
The task requires students to navigate from the starting page, Maika’s blog, to the Latest Opportunities page shown below. To see the whole page, scrolling is required.
This page offers four opportunities for students to evaluate on Maika’s behalf, each with links providing additional information. Students may open as many of the links as they consider necessary. The page for the Upway Primary School opportunity is shown below.

2A PROFILE OF STUDENT PERFORMANCE IN READING
118 © OECD 2010 PISA 2009 ReSultS: WhAt StudentS KnoW And CAn do – Volume I
This text is fairly short, but relatively dense, with quite complex vocabulary (“an innovative approach”, “a more diverse population”, “foster the academic development”, “academic support”). Having located the opportunities, students need to compare descriptions of the opportunities with the criteria given on Maika’s blog. They may click on the tab to re-read her entry for January 1, where she refers to wanting “a long-term position” in which she can “make a difference”. A broad understanding of the Upway Primary School text would support the evaluation that working here would fit Maika’s criteria. This interpretation is supported by expressions such as “The volunteer meets with the student … for a minimum of one year” and “through academic support, positive role modelling, and a one-to-one friendship, students will succeed”.
Some students may also use the link “Read my complete profile” or “About”, which refers to her interest in “a future in web design” and to her “artwork”. The information here supports the selection of the Graphic Artist opportunity.
Students may use the “Back” and “Forward” buttons, the links on each page and the scroll bar to navigate back and forth between descriptions of various opportunities until they have selected the one that they judge to be most suitable. In each case it is necessary to scroll down to see a full description of the opportunity.
Once students have chosen an opportunity, they need to construct an e-mail message to send to Maika. They do this by opening yet another link, “E-mail opportunity details to a friend”, in accordance with the task instructions.
The page where they do this has the e-mail address and subject lines already completed, together with the beginning of a message: “Thought you’d be interested in this volunteer opportunity because...”. To receive credit, students must select either the Graphic Artist or the Upway Primary School opportunity. Students who recommend the Graphic Artist opportunity receive full credit if they refer to the fact that this opportunity is an ongoing position; or comment that it is relevant to her future or to her interest in web design or art. Students who recommend Upway Primary School receive full credit if they refer either to the fact that this is an ongoing position or to the idea of making a difference.
Students who select one of these two opportunities but do not write a message that refers to the criteria Maika is seeking nevertheless receive partial credit for having successfully completed much of this complex task: accessing relevant information, comparing information from different texts and making a judgment about which opportunity is suitable.
In summary, in order to obtain full credit for this task, students need to go through a series of processes, involving multiple navigation steps to access a series of texts. Some of the navigation steps are made explicit in the task instructions, but readers need to make multiple evaluations of the available links to decide which ones would allow the most efficient way of completing the task. Students need to make multiple interpretations of texts, from Maika’s blog as well as various pages on the iwanttohelp website, and to compare ideas and information across these texts, in support of the reflection and evaluation that the task requires.

2A PROFILE OF STUDENT PERFORMANCE IN READING
PISA 2009 ReSultS: WhAt StudentS KnoW And CAn do – Volume I © OECD 2010 119
Notes
1. For a full description of the PISA 2009 assessment framework, see oeCd (2010c).
2. See Stiglitz, J.e., A. Sen and J.P. Fitoussi (2009).
3. See oeCd (2010b).
4. See oeCd (2010a).
5. the GdP values represent GdP per capita in 2009 at current prices, adjusted for differences in purchasing power between oeCd countries.
6. It should be borne in mind, however, that the number of countries involved in this comparison is small and that the trend line is therefore strongly affected by the particular characteristics of the countries included in this comparison.
7. Spending per student is approximated by multiplying public and private expenditure on educational institutions per student in 2009 at each level of education by the theoretical duration of education at the respective level, up to the age of 15. Cumulative expenditure for a given country is approximated as follows: let n(0), n(1) and n(2) be the typical number of years spent by a student from the age of 6 up to the age of 15 years in primary, lower secondary and upper secondary education. let E(0), E(1) and E(2) be the annual expenditure per student in uSd converted using purchasing power parities in primary, lower secondary and upper secondary education, respectively. the cumulative expenditure is then calculated by multiplying current annual expenditure E by the typical duration of study n for each level of education i using the following formula:
CE = n(i ) * E (i)2
i = 0
8. For this purpose, the respective data were standardised across countries and then averaged over the different aspects.
9. For further detail see Butler, J. and R.J. Adams (2007).
10. these three aspects also formed the basis of reporting on reading subscales in PISA 2000. the names of the aspects have been modified for PISA 2009 in order to make them applicable to the digital medium as well as to the print medium. Access and retrieve is an expanded version of retrieving information; and integrate and interpret of interpreting texts. Reflect and evaluate is synonymous with PISA 2000’s reflecting upon and evaluating texts.
11. halpern, d.F. (1989); Shetzer, h. and m. Warschauer (2000); Warschauer, m. (1999).
12. Kirsch, I. and P.B. mosenthal (1990).
13. For examples of tasks based on the fourth text format, mixed texts, see AFRICAn tReK in oeCd (2010c).
14. In PISA 2000, PISA 2003 and PISA 2006 these three broad aspects were called “Retrieving information”, “Interpreting texts” and “Reflection and evaluation”, respectively. the terms have been changed for PISA 2009 to better accommodate the aspects in relation to digital texts.
15. A separate digital reading literacy scale has also been constructed: see Volume VI, Students On Line.
16. the standard deviation is a measure for the variability of performance. As a rule of thumb, the range between the mean minus one standard deviation and the mean plus one standard deviation contains about 70% of the students. the mean plus/minus two standard deviations contains about 95% of students and the mean plus/minus three standard deviations contains 99% of students.
17. Confidence level 95%.
From:PISA 2009 Results: What Students Know and CanDoStudent Performance in Reading, Mathematics and Science(Volume I)
Access the complete publication at:https://doi.org/10.1787/9789264091450-en
Please cite this chapter as:
OECD (2010), “A Profile of Student Performance in Reading”, in PISA 2009 Results: What Students Knowand Can Do: Student Performance in Reading, Mathematics and Science (Volume I), OECD Publishing,Paris.
DOI: https://doi.org/10.1787/9789264091450-5-en
This work is published under the responsibility of the Secretary-General of the OECD. The opinions expressed and argumentsemployed herein do not necessarily reflect the official views of OECD member countries.
This document and any map included herein are without prejudice to the status of or sovereignty over any territory, to thedelimitation of international frontiers and boundaries and to the name of any territory, city or area.
You can copy, download or print OECD content for your own use, and you can include excerpts from OECD publications,databases and multimedia products in your own documents, presentations, blogs, websites and teaching materials, providedthat suitable acknowledgment of OECD as source and copyright owner is given. All requests for public or commercial use andtranslation rights should be submitted to [email protected]. Requests for permission to photocopy portions of this material forpublic or commercial use shall be addressed directly to the Copyright Clearance Center (CCC) at [email protected] or theCentre français d’exploitation du droit de copie (CFC) at [email protected].