Phasing Out Energy Subsidies in Indonesia - OECD iLibrary
26
OECD Economics Department Working Papers No. 808 Phasing Out Energy Subsidies in Indonesia Annabelle Mourougane https://dx.doi.org/10.1787/5km5xvc9c46k-en
-
Upload
khangminh22 -
Category
Documents
-
view
0 -
download
0
Transcript of Phasing Out Energy Subsidies in Indonesia - OECD iLibrary

OECD Economics Department Working Papers No. 808
Phasing Out EnergySubsidies in Indonesia
Annabelle Mourougane
https://dx.doi.org/10.1787/5km5xvc9c46k-en
Unclassified ECO/WKP(2010)64 Organisation de Coopération et de Développement Économiques Organisation for Economic Co-operation and Development 26-Oct-2010
___________________________________________________________________________________________
_____________ English - Or. English ECONOMICS DEPARTMENT
PHASING OUT ENERGY SUBSIDIES IN INDONESIA
ECONOMICS DEPARTMENT WORKING PAPER No. 808
By
Annabelle Mourougane
All OECD Economics Department Working Papers are available on the OECD Intranet website at
www.oecd.org/eco/workingpapers
JT03291149
Document complet disponible sur OLIS dans son format d'origine
Complete document available on OLIS in its original format
EC
O/W
KP
(20
10
)64
Un
classified
En
glish
- Or. E
ng
lish
ECO/WKP(2010)64
2
ABSTRACT/RESUME
Phasing out energy subsidies in Indonesia
The oil price hike in 2007-08 underlined the vulnerability of Indonesia’s energy subsidy policy to oil price
volatility. In addition to entailing significant economic and environmental costs, energy subsidies put
pressure on the public budget and benefit mostly rich households. Phasing them out would benefit both the
economy and the environment. At the same time, past experience in Indonesia and elsewhere suggests that
such a reform is likely to face stiff opposition and will therefore need to be carefully designed and
communicated. Compensation in the form of targeted cash transfers will help to shield low-income
households from attendant rise in energy prices. This Working Paper relates to the 2010 OECD Economic
Review of Indonesia (www.oecd.org/eco/surveys/Indonesia).
JEL classification codes: E6, Q2, Q4
Keywords: Indonesia; energy subsidies; biofuels
*******
Eliminer progressivement les subventions à l’énergie en l’Indonésie
La flambée des prix du pétrole de 2007-08 a montré que la politique de subventions à l’énergie de
l’Indonésie était sensible à la volatilité des prix du pétrole. En plus d’entraîner des coûts économiques et
environnementaux importants, les subventions à l’énergie pèsent sur les finances publiques et profitent
essentiellement aux ménages aisés. Leur suppression progressive aurait donc des effets positifs sur
l’économie comme sur l’environnement. Toutefois, l’expérience de l’Indonésie et d’autres pays montre
qu’une telle réforme risque de rencontrer une vive opposition et qu’il importe donc d’accorder une grande
attention à la façon dont elle est conçue et expliquée. Des mécanismes de compensation sous forme de
transferts monétaires ciblés contribueront à protéger les ménages à faible revenu de la hausse des prix de
l’énergie induite par la réforme. Ce Document de travail se rapporte à l’Étude économique de l’OCDE de
l’Indonésie 2010 (www.oecd.org/eco/etudes/Indonesie).
Classification JEL : E6, Q2, Q4
Mots clefs : Indonésie ; subventions à l’énergie ; biofuels
Copyright © OECD, 2010. All rights reserved. Application for permission to reproduce or translate
all, or part of, this material should be made to: Head of Publications Service, OECD, 2 rue
André-Pascal, 75775 PARIS CEDEX 16, France.

ECO/WKP(2010)64
3
Table of contents
Phasing out energy subsidies in Indonesia .................................................................................................. 5
Energy subsidies are large by international standards ................................................................................. 5 Energy subsidies entail significant costs .................................................................................................... 11
Economic costs ....................................................................................................................................... 11 Fiscal costs ............................................................................................................................................. 12 Social costs ............................................................................................................................................. 13 Environmental costs ............................................................................................................................... 14
Removing subsidies will enhance Indonesia’s long-term prospects .......................................................... 15 Policy considerations ................................................................................................................................. 18
Bibliography ................................................................................................................................................. 22
Boxes
1. Past reforms to energy subsidies in Indonesia ...................................................................................... 7
2. Summary of policy recommendations: Energy subsidies ................................................................... 21
Tables
1. Pass-through of international prices to domestic retail price (tax inclusive): 2004-08 ...................... 11 2. Selected studies on the impact of subsidy removal ............................................................................ 16 3. Compensating programmes for fuel subsidy elimination ................................................................... 18
Figures
1. Energy subsidies in selected countries, 2008 ........................................................................................ 7 2. Evolution of subsidies and their composition over time ....................................................................... 9 3. Retail gasoline, diesel and kerosene prices in USD, 2008 or latest available date ............................. 10 4. Share of selected sources in central government revenue, per cent .................................................... 13 5. Fuel subsidies by income, 2007 ......................................................................................................... 14 6. Effect of fuel price increase on monthly rates of inflation ................................................................. 17 7. Effect of a decrease in fuel subsidies on the differences between energy revenues and
subsidies for different levels of oil price ............................................................................................ 17

ECO/WKP(2010)64
4
ECO/WKP(2010)64
5
Phasing out energy subsidies in Indonesia
By Annabelle Mourougane1
The 2007-08 rise in oil prices renewed global interest in fuel subsidies and concerns about their fiscal
costs, notably for G20 countries, which account for over 70% of such subsidies. This is particularly
important for Indonesia, where energy subsidies touch upon each of the development challenges put
forward by the government: enhancing economic growth, reducing poverty and favouring an
environmentally friendly path to development by reducing GHG emissions and adopting cleaner sources of
energy.
This paper starts by describing the main features of the subsidy policy in Indonesia. It subsequently
details the costs associated with this policy, reviewing in turn economic, fiscal, social and environmental
burdens. Benefits of reforms, together with related political economy aspects, are then discussed. A final
section sets out policy recommendations.
Energy subsidies are large by international standards
The Indonesian energy subsidy policy has focused on consumer subsidies in the form of under-pricing
of energy, though producer subsidies in the form of tax expenditure also exist (Morgan, 2007). The central
government subsidises the price of several energy products, including gasoline, kerosene and diesel, and it
sets tariffs for electricity.2 Compensation for the revenue loss is provided to the state-owned energy
companies. It is determined administratively and is a function of the inputs used in the production process.
Subsidies were introduced in Indonesia for social considerations to make available a "basic need" at a
price affordable to the poor.3 This holds in particular for kerosene, which is the only fuel product
consumed by the low-income urban population and is second to wood as an energy source for rural
consumers. Originally, energy subsidies were available for all segments of the population, but coverage has
shrunk over the years. The number of fuel products eligible for the subsidy was reduced in 2005.
1. Senior Economist in the OECD Economics Department. This paper reports on background work for the
2010 OECD Economic Survey of Indonesia. The author is grateful for the valuable comments received on
earlier drafts from Andrew Dean, Luiz de Mello, Robert Ford, Peter Jarrett, Mauro Pisu, Ronald Steenblick
as well as for comments from, and discussions with, officials from the Indonesian government and the
World Bank Office in Jakarta. Special thanks go to Anne Legendre for statistical assistance and to
Mee-Lan Frank for editorial support.
2. The government also subsidises the cost of low-volume LPG cylinders (see Box 1), but the subsidy is
small. Volumes are also low. In addition, the state-owned railway company receives a modest amount of
subsidised fuel, but the total amount is small.
3. Another argument sometimes put forward is that kerosene subsidies help to slow the pace of deforestation.
However, there is evidence, admittedly rather old, that the elasticity of demand for firewood with respect to
the price of kerosene is very small in Java (Pitt, 1983).
ECO/WKP(2010)64
6
Since 2008, electricity subsidies are no longer available for larger industrial consumers. High-volume
household customers benefit from the subsidised rate only up to a certain threshold.4
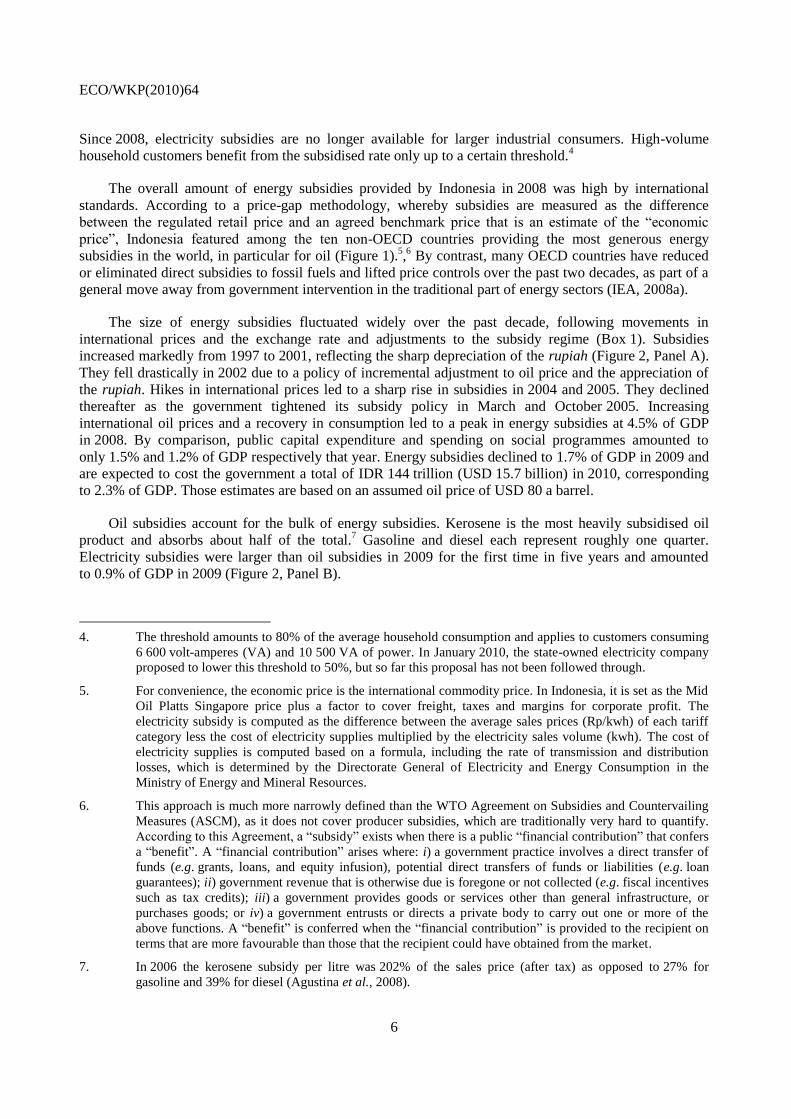
The overall amount of energy subsidies provided by Indonesia in 2008 was high by international
standards. According to a price-gap methodology, whereby subsidies are measured as the difference
between the regulated retail price and an agreed benchmark price that is an estimate of the “economic
price”, Indonesia featured among the ten non-OECD countries providing the most generous energy
subsidies in the world, in particular for oil (Figure 1).5,6 By contrast, many OECD countries have reduced
or eliminated direct subsidies to fossil fuels and lifted price controls over the past two decades, as part of a
general move away from government intervention in the traditional part of energy sectors (IEA, 2008a).
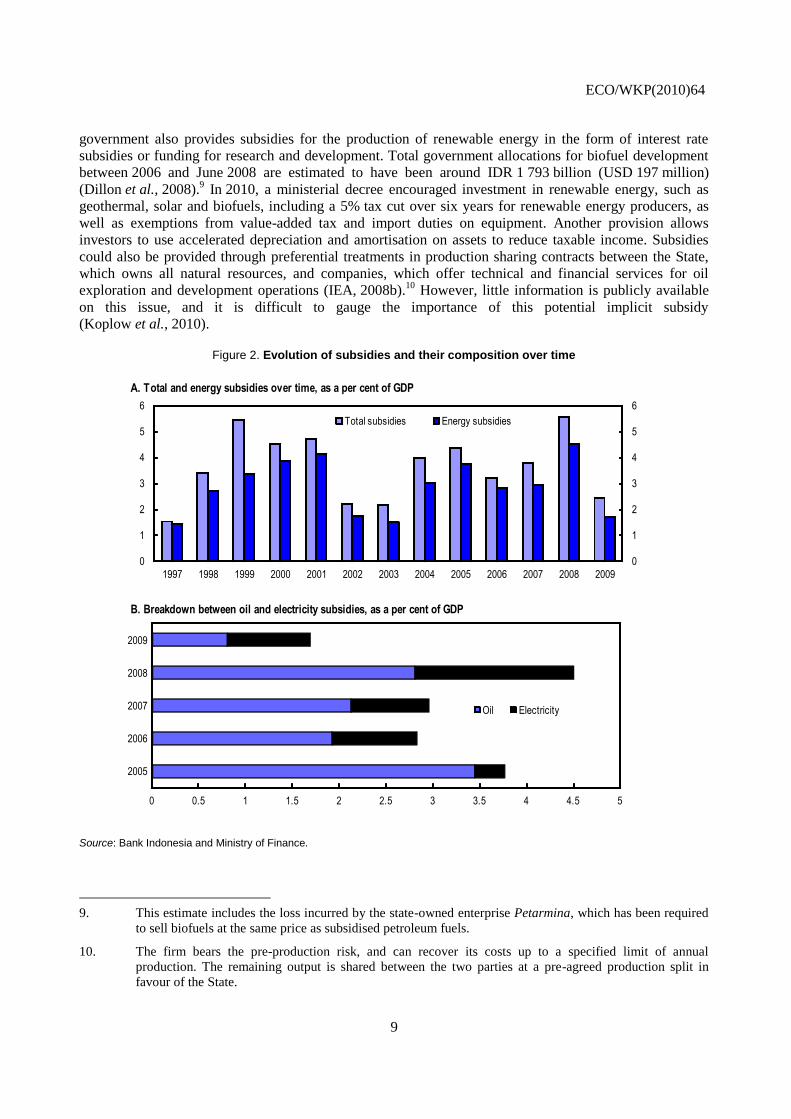
The size of energy subsidies fluctuated widely over the past decade, following movements in
international prices and the exchange rate and adjustments to the subsidy regime (Box 1). Subsidies
increased markedly from 1997 to 2001, reflecting the sharp depreciation of the rupiah (Figure 2, Panel A).
They fell drastically in 2002 due to a policy of incremental adjustment to oil price and the appreciation of
the rupiah. Hikes in international prices led to a sharp rise in subsidies in 2004 and 2005. They declined
thereafter as the government tightened its subsidy policy in March and October 2005. Increasing
international oil prices and a recovery in consumption led to a peak in energy subsidies at 4.5% of GDP
in 2008. By comparison, public capital expenditure and spending on social programmes amounted to
only 1.5% and 1.2% of GDP respectively that year. Energy subsidies declined to 1.7% of GDP in 2009 and
are expected to cost the government a total of IDR 144 trillion (USD 15.7 billion) in 2010, corresponding
to 2.3% of GDP. Those estimates are based on an assumed oil price of USD 80 a barrel.
Oil subsidies account for the bulk of energy subsidies. Kerosene is the most heavily subsidised oil
product and absorbs about half of the total.7 Gasoline and diesel each represent roughly one quarter.
Electricity subsidies were larger than oil subsidies in 2009 for the first time in five years and amounted
to 0.9% of GDP in 2009 (Figure 2, Panel B).
4. The threshold amounts to 80% of the average household consumption and applies to customers consuming
6 600 volt-amperes (VA) and 10 500 VA of power. In January 2010, the state-owned electricity company
proposed to lower this threshold to 50%, but so far this proposal has not been followed through.
5. For convenience, the economic price is the international commodity price. In Indonesia, it is set as the Mid
Oil Platts Singapore price plus a factor to cover freight, taxes and margins for corporate profit. The
electricity subsidy is computed as the difference between the average sales prices (Rp/kwh) of each tariff
category less the cost of electricity supplies multiplied by the electricity sales volume (kwh). The cost of
electricity supplies is computed based on a formula, including the rate of transmission and distribution
losses, which is determined by the Directorate General of Electricity and Energy Consumption in the
Ministry of Energy and Mineral Resources.
6. This approach is much more narrowly defined than the WTO Agreement on Subsidies and Countervailing
Measures (ASCM), as it does not cover producer subsidies, which are traditionally very hard to quantify.
According to this Agreement, a “subsidy” exists when there is a public “financial contribution” that confers
a “benefit”. A “financial contribution” arises where: i) a government practice involves a direct transfer of
funds (e.g. grants, loans, and equity infusion), potential direct transfers of funds or liabilities (e.g. loan
guarantees); ii) government revenue that is otherwise due is foregone or not collected (e.g. fiscal incentives
such as tax credits); iii) a government provides goods or services other than general infrastructure, or
purchases goods; or iv) a government entrusts or directs a private body to carry out one or more of the
above functions. A “benefit” is conferred when the “financial contribution” is provided to the recipient on
terms that are more favourable than those that the recipient could have obtained from the market.
7. In 2006 the kerosene subsidy per litre was 202% of the sales price (after tax) as opposed to 27% for
gasoline and 39% for diesel (Agustina et al., 2008).
ECO/WKP(2010)64
7
Figure 1. Energy subsidies in selected countries, 2008
Billion dollars
0 20 40 60 80 100
IranRussia
Saudi ArabiaIndia
ChinaEgy pt
VenezuelaMex ico
INDONESIAArgentina
IraqUzbekistan
UAEPakistanUkraine
Malay siaKuw aitAlgeria
South AfricaThailand
Oil Gas Coal
Source: IEA World Energy Outlook, 2010 (forthcoming), http://www.worldenergyoutlook.org/subsidies.asp
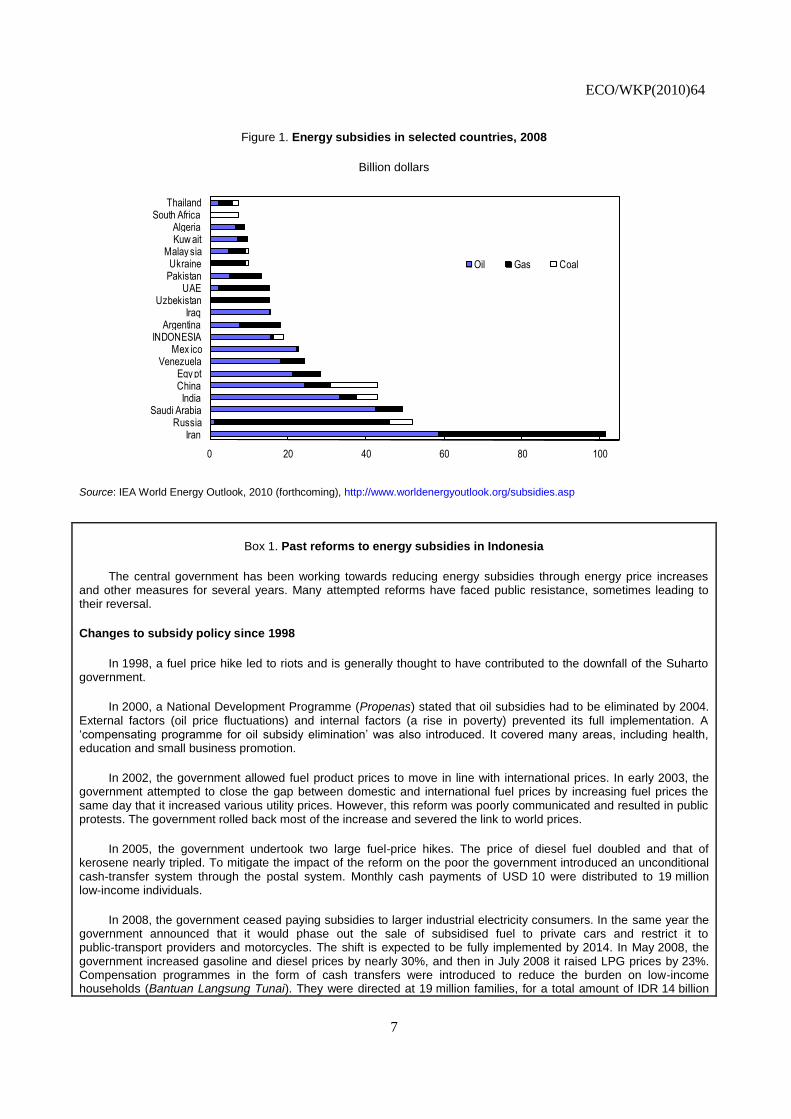
Box 1. Past reforms to energy subsidies in Indonesia
The central government has been working towards reducing energy subsidies through energy price increases and other measures for several years. Many attempted reforms have faced public resistance, sometimes leading to their reversal.
Changes to subsidy policy since 1998
In 1998, a fuel price hike led to riots and is generally thought to have contributed to the downfall of the Suharto government.
In 2000, a National Development Programme (Propenas) stated that oil subsidies had to be eliminated by 2004. External factors (oil price fluctuations) and internal factors (a rise in poverty) prevented its full implementation. A „compensating programme for oil subsidy elimination‟ was also introduced. It covered many areas, including health, education and small business promotion.
In 2002, the government allowed fuel product prices to move in line with international prices. In early 2003, the government attempted to close the gap between domestic and international fuel prices by increasing fuel prices the same day that it increased various utility prices. However, this reform was poorly communicated and resulted in public protests. The government rolled back most of the increase and severed the link to world prices.
In 2005, the government undertook two large fuel-price hikes. The price of diesel fuel doubled and that of kerosene nearly tripled. To mitigate the impact of the reform on the poor the government introduced an unconditional cash-transfer system through the postal system. Monthly cash payments of USD 10 were distributed to 19 million low-income individuals.
In 2008, the government ceased paying subsidies to larger industrial electricity consumers. In the same year the government announced that it would phase out the sale of subsidised fuel to private cars and restrict it to public-transport providers and motorcycles. The shift is expected to be fully implemented by 2014. In May 2008, the government increased gasoline and diesel prices by nearly 30%, and then in July 2008 it raised LPG prices by 23%. Compensation programmes in the form of cash transfers were introduced to reduce the burden on low-income households (Bantuan Langsung Tunai). They were directed at 19 million families, for a total amount of IDR 14 billion

ECO/WKP(2010)64
8
for the 2008 fiscal year. The government also relied on other compensation programmes (Food Sustainability Programme, distribution of rice and control of rice price, financial support for the education of children of government employees, subsidy increase for small-scale credit facilities). In December 2008, following the drop in world oil prices, the government reduced retail prices of gasoline and diesel.
In the Medium Term Development Plan, the government announced its objective to remove fossil-fuel subsidies by 2014. The 2010 State Budget explicitly allowed the government to raise domestic fuel prices if oil prices rise more than 10% above the budgeted level of USD 80 per barrel. In addition, the basic electricity tariff was raised by an average of 10% in July 2010, and by an average of 10-15% for industries. Smaller residential consumers, representing around 87% of all households, are estimated to have been shielded from the price hike (World Bank, 2010). The objective of the July increase was also to simplify commercial tariffs which previously depended on usage and supply agreement with the state-owned electricity provider by unifying them into one usage tariff for each connection capacity. A 15% increase in electricity tariff for 2011 was initially put forward in the 2011 Draft Budget. The increase has been subsequently postponed.
In June 2010, the government planned to limit fuel use for private cars with engine capacity of more than 2000 cubic centimeters. This plan was recently delayed to next year.
In September 2010, the House of representatives agreed to raise the quotas on subsidised fuel consumption in the revised 2010 State Budget. Such a move appears to be inconsistent with the authorities‟ will to curb the consumption of subsidised fuel. This suggests policy reacts asymmetrically to oil price changes. When oil price exceeds the level forecast in the State Budget, additional spending are allocated to finance energy subsidies. By contrast, when oil price is below the excess amount of subsidies initially allocated is not saved.
Changes to energy laws
Law No. 30/2007 stipulated that energy prices should be based on fair economic value and that the central government should create a subsidy fund for poor people. This law still needs implementing regulations. In 2009, a law allowed electricity suppliers to set different prices across geographic areas and classes of consumers. As of October 2010, however, that law still needed implementing regulations as well.
Programmes to lower and diversify energy consumption
In 2008, the Ministry of Energy proposed distributing a so-called “smart card” to households that would entitle the holder to purchase a limited quantity of subsidised fuel each month. This proposal was dropped around mid-year due to concerns about its technical feasibility.
Indonesia has a programme to phase out the use of kerosene, in favour of liquefied petroleum gas (LPG). LPG stoves and small LPG cylinders have been distributed, free of charge, to urban households using kerosene stoves, starting with households living around the capital. There are plans to expand this programme to other cities. The objective of this programme was also to reduce the pressure on the state budget as LPG is less subsidised than kerosene. LPG is also found to be more consistent with the nation environmental objective to move to a low-carbon environment. In 2008, 5.3 million households stopped using kerosene.
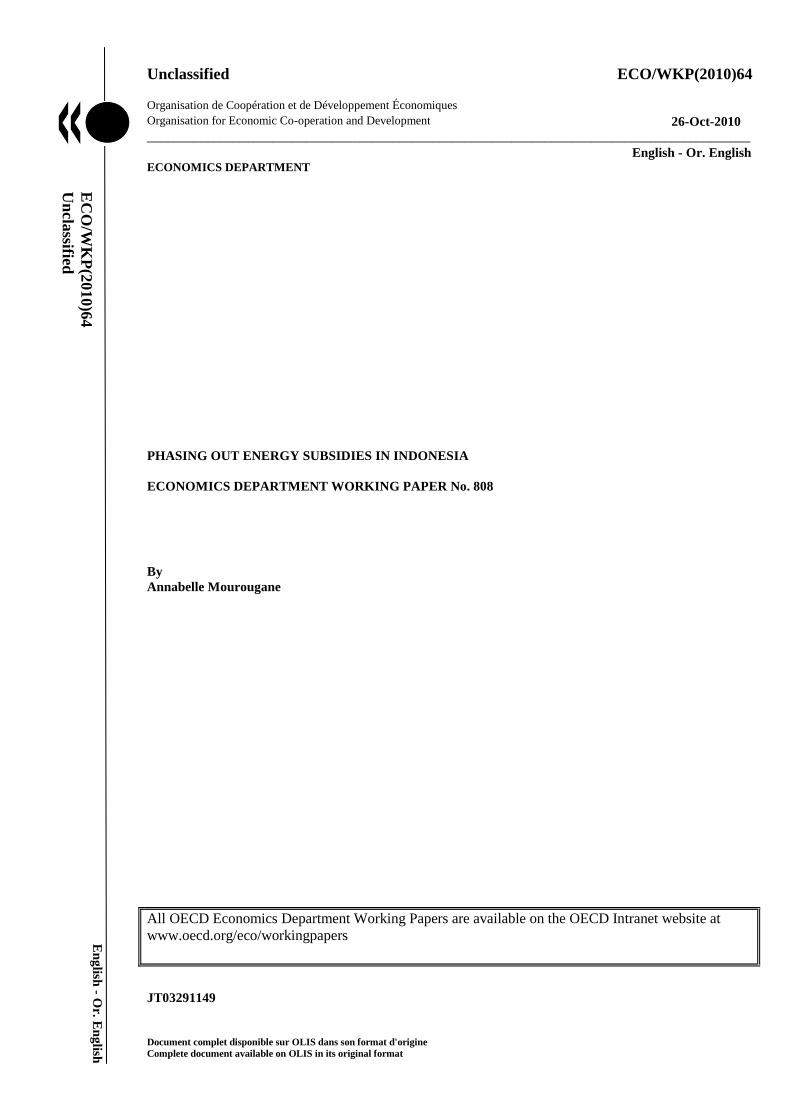
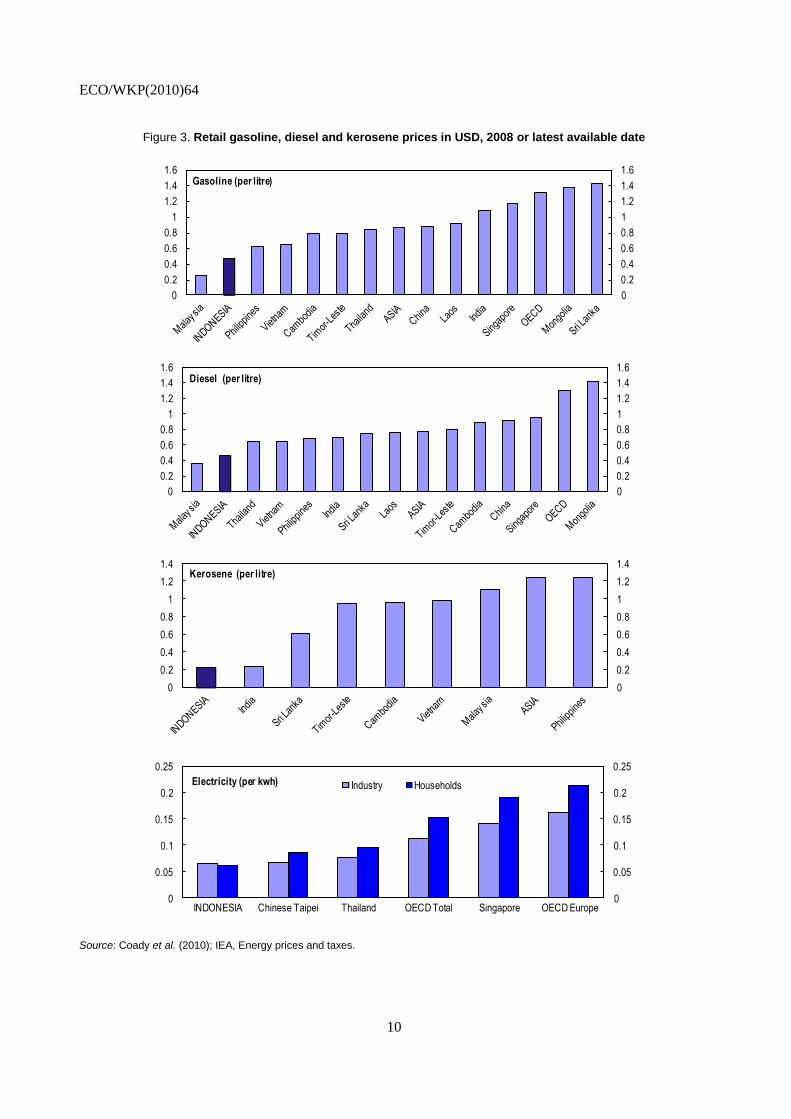
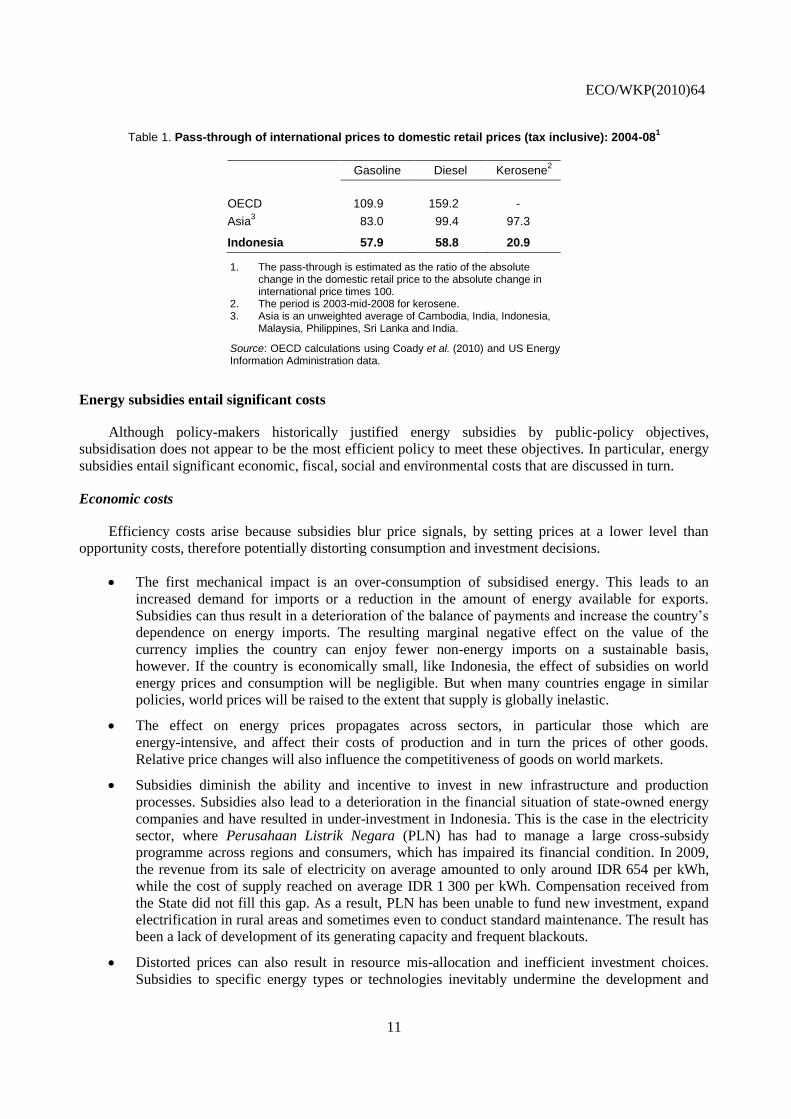
Because of these subsidies, fuel and electricity tariffs are much lower than the cost of provision and in
particular lower than in regional peers (Figure 3). In addition, subsidies smooth the volatility of
international prices by lowering the level of pass-through onto domestic retail prices. This pass-through is
estimated to be significantly smaller in Indonesia than in peer countries for all types of fuels, especially
kerosene (Table 1). The counterpart is that oil-price volatility is transferred to public finances.
In addition to the direct price subsidies, Indonesia also grants implicit subsidies through a range of tax
expenditures.8 Capital costs are subsidised through government-backed loans to Perusahaan Listrik
Negara (PLN), the state-owned electricity supplier, for the development of coal-powered generation. The
8. Tax expenditures are tax exemptions, preferential rates and other design features that differ from the
standard tax regime.
ECO/WKP(2010)64
9
government also provides subsidies for the production of renewable energy in the form of interest rate
subsidies or funding for research and development. Total government allocations for biofuel development
between 2006 and June 2008 are estimated to have been around IDR 1 793 billion (USD 197 million)
(Dillon et al., 2008).9 In 2010, a ministerial decree encouraged investment in renewable energy, such as
geothermal, solar and biofuels, including a 5% tax cut over six years for renewable energy producers, as
well as exemptions from value-added tax and import duties on equipment. Another provision allows
investors to use accelerated depreciation and amortisation on assets to reduce taxable income. Subsidies
could also be provided through preferential treatments in production sharing contracts between the State,
which owns all natural resources, and companies, which offer technical and financial services for oil
exploration and development operations (IEA, 2008b).10
However, little information is publicly available
on this issue, and it is difficult to gauge the importance of this potential implicit subsidy
(Koplow et al., 2010).
Figure 2. Evolution of subsidies and their composition over time
A. Total and energy subsidies over time, as a per cent of GDP
B. Breakdown between oil and electricity subsidies, as a per cent of GDP
0
1
2
3
4
5
6
0
1
2
3
4
5
6
1997 1998 1999 2000 2001 2002 2003 2004 2005 2006 2007 2008 2009
Total subsidies Energy subsidies
0 0.5 1 1.5 2 2.5 3 3.5 4 4.5 5
2005
2006
2007
2008
2009
Oil Electricity
Source: Bank Indonesia and Ministry of Finance.
9. This estimate includes the loss incurred by the state-owned enterprise Petarmina, which has been required
to sell biofuels at the same price as subsidised petroleum fuels.
10. The firm bears the pre-production risk, and can recover its costs up to a specified limit of annual
production. The remaining output is shared between the two parties at a pre-agreed production split in
favour of the State.
ECO/WKP(2010)64
10
Figure 3. Retail gasoline, diesel and kerosene prices in USD, 2008 or latest available date
0
0.2
0.4
0.6
0.8
1
1.2
1.4
1.6
0
0.2
0.4
0.6
0.8
1
1.2
1.4
1.6Gasoline (per litre)
0
0.2
0.4
0.6
0.8
1
1.2
1.4
1.6
0
0.2
0.4
0.6
0.8
1
1.2
1.4
1.6Diesel (per litre)
0
0.2
0.4
0.6
0.8
1
1.2
1.4
0
0.2
0.4
0.6
0.8
1
1.2
1.4Kerosene (per litre)
0
0.05
0.1
0.15
0.2
0.25
0
0.05
0.1
0.15
0.2
0.25
INDONESIA Chinese Taipei Thailand OECD Total Singapore OECD Europe
Electricity (per kwh) Industry Households
Source: Coady et al. (2010); IEA, Energy prices and taxes.
ECO/WKP(2010)64
11
Table 1. Pass-through of international prices to domestic retail prices (tax inclusive): 2004-081
Gasoline Diesel Kerosene2
OECD 109.9 159.2 -
Asia3 83.0 99.4 97.3
Indonesia 57.9 58.8 20.9
1. The pass-through is estimated as the ratio of the absolute change in the domestic retail price to the absolute change in international price times 100.
2. The period is 2003-mid-2008 for kerosene. 3. Asia is an unweighted average of Cambodia, India, Indonesia,
Malaysia, Philippines, Sri Lanka and India.
Source: OECD calculations using Coady et al. (2010) and US Energy Information Administration data.
Energy subsidies entail significant costs
Although policy-makers historically justified energy subsidies by public-policy objectives,
subsidisation does not appear to be the most efficient policy to meet these objectives. In particular, energy
subsidies entail significant economic, fiscal, social and environmental costs that are discussed in turn.
Economic costs
Efficiency costs arise because subsidies blur price signals, by setting prices at a lower level than
opportunity costs, therefore potentially distorting consumption and investment decisions.
The first mechanical impact is an over-consumption of subsidised energy. This leads to an
increased demand for imports or a reduction in the amount of energy available for exports.
Subsidies can thus result in a deterioration of the balance of payments and increase the country’s
dependence on energy imports. The resulting marginal negative effect on the value of the
currency implies the country can enjoy fewer non-energy imports on a sustainable basis,
however. If the country is economically small, like Indonesia, the effect of subsidies on world
energy prices and consumption will be negligible. But when many countries engage in similar
policies, world prices will be raised to the extent that supply is globally inelastic.
The effect on energy prices propagates across sectors, in particular those which are
energy-intensive, and affect their costs of production and in turn the prices of other goods.
Relative price changes will also influence the competitiveness of goods on world markets.
Subsidies diminish the ability and incentive to invest in new infrastructure and production
processes. Subsidies also lead to a deterioration in the financial situation of state-owned energy
companies and have resulted in under-investment in Indonesia. This is the case in the electricity
sector, where Perusahaan Listrik Negara (PLN) has had to manage a large cross-subsidy
programme across regions and consumers, which has impaired its financial condition. In 2009,
the revenue from its sale of electricity on average amounted to only around IDR 654 per kWh,
while the cost of supply reached on average IDR 1 300 per kWh. Compensation received from
the State did not fill this gap. As a result, PLN has been unable to fund new investment, expand
electrification in rural areas and sometimes even to conduct standard maintenance. The result has
been a lack of development of its generating capacity and frequent blackouts.
Distorted prices can also result in resource mis-allocation and inefficient investment choices.
Subsidies to specific energy types or technologies inevitably undermine the development and
ECO/WKP(2010)64
12
commercialisation of other sources and technologies that might ultimately become more
economically (as well as environmentally) attractive. In this way, subsidies can “lock in”
technologies to the exclusion of other, more promising ones.
Changes in energy prices can result in inter-factor substitution, whereby energy can be
substituted for capital or labour. The importance of these substitutions depends in part on the
share of energy in the total of production inputs and the substitutability of the different factor
inputs. These mechanisms are likely to have played an important role in Indonesia, as energy was
often substituted to labour in the country during episodes of increased fuel prices (Hope and
Singh, 1995). Hence removing subsidies to producers is likely to increase employment in
response to their more favourable relative prices.
Subsidies hinder competition. State-owned energy company Pertamina is currently the only
channel for fuel subsidies to flow to retail consumers. Other companies have been allowed to sell
higher-octane fuels and other products, but their penetration remains very small, as their
non-subsidised products can be more than 50% more expensive than Pertamina’s subsidised
output.
Subsidies encourage corruption and smuggling of fuel products to neighbouring countries or to
non-subsidised sectors where selling prices are higher.11
Large administrative costs are incurred
to monitor, prevent and deal with abuse.
Fiscal costs
Despite successive reductions, energy subsidies continue to weigh heavily on the budget. Indeed, the
central government compensates the state-owned oil and electricity companies in the form of transfers for
the losses they incur when the domestic price of fuel is kept below international prices. In 2008, energy
subsidies represented 22% of government expenditure (comprising central government expenditure and
transfers to regions). They fell to 9.9% in 2009 and are projected to reach 12.8 % in 2010 according to the
2010 revised State Budget. For 2011, the government has proposed to lower this ratio to 11%, with the
bulk of the decline coming from an increase in electricity tariff. The planned 2011 rise in electricity prices
has subsequently been postponed. By putting pressure on the budget, these subsidies run counter to the
ongoing efforts to allocate a rising share of budgetary resources to more beneficial uses, such as
infrastructure investment, human capital accumulation and social protection programmes.
The subsidy policy also renders the country’s public spending particularly vulnerable to global energy
movements.12
As international energy prices are procyclical, spending on subsidies tends to rise when the
global economy grows strongly and to fall during downturns. The effect of subsidies on the budget is only
partially offset by revenues from the energy sector, even though these revenues accounted for almost 15%
of the budgetary resources of the central government in 2009 (Figure 4). Indeed, over the last fifteen years,
oil and gas revenues have increased far less quickly than other sources. They are predominantly non-tax
revenues resulting from production-sharing contracts between the government and energy extractors.13
11. A typical example of fraud would be to mix subsidised household fuel with other types to use the mixture
for industrial purposes to avoid paying the unsubsidised price.
12. The central government’s budgetary position is more exposed to a rise in energy prices than those of local
governments, as it pays for all the subsidies, while receiving only part of the revenues. This vulnerability
was particularly evident in 2007-08 when oil prices surged. By contrast, regions always benefit from a rise
in oil prices through higher revenues.
13. Energy-related non-tax revenue amounted to about 15% of the total revenue collected in 2009. Income tax
revenue from the energy sector represents 6% of total revenue and grants. Additional tax revenues from the

ECO/WKP(2010)64
13
Figure 4. Share of selected sources in central government revenue, per cent
0
10
20
30
40
50
60
70
0
10
20
30
40
50
60
70
2000 2001 2002 2003 2004 2005 2006 2007 2008 2009
VAT and other domestic tax
Oil and gas sector
Note: Revenues include both tax and non-tax revenues.
Source: OECD calculations based on Ministry of Finance data.
Social costs
Energy subsidies have been introduced for social motives to make energy, a basic need, affordable to
low-income groups. Energy subsidies affect household real outcomes both directly and indirectly. The
direct effect is the gain in disposable income due to lower prices paid by households for consumption of
fuel products. The indirect effect is seen in the lower prices paid by households for other goods and
services stemming from the lower cost for fuel-based inputs of production.
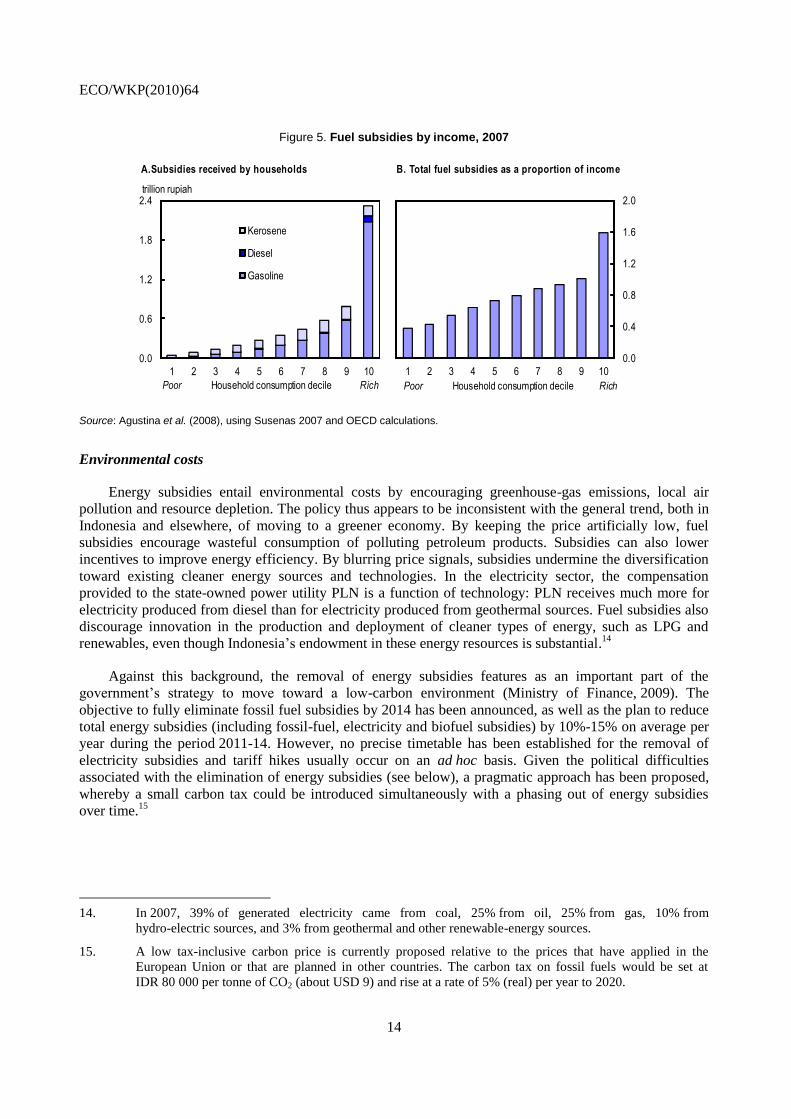
In practice, however, benefits of fuel subsidies accrue mainly to high-income groups while their cost
falls on the whole taxpaying population. As the subsidy per litre does not vary with household income,
those who consume the most also receive the largest share of the subsidy. Surveys suggest that fuel
consumption increases with income levels (Figure 5, Panel A). As a result, more than 90% of fuel
subsidies benefit the 50% of the richest households in Indonesia (Agustina et al., 2008). This is broadly in
line with official views. In May 2008, the Co-ordinating Ministry of Economic Affairs advised that the
top 40% of families receive 70% of the subsidies, while the bottom 40% benefit from only 15% of the
subsidies. Electricity subsidies also appear to benefit mostly wealthier households. In 2005, the top decile
received 44% more subsidies than the bottom decile (World Bank, 2006).
Accounting for income distribution, there is evidence that fuel subsidies are regressive. They
represent less than 0.5% of poor-household incomes, as opposed to more than 1.5% for the most affluent
incomes (Figure 5, Panel B).
sector come from a 10% VAT applied to all products and a 5% motor tax levied on the sale of gasoline and
automotive diesel fuel.
ECO/WKP(2010)64
14
Figure 5. Fuel subsidies by income, 2007
A.Subsidies received by households B. Total fuel subsidies as a proportion of income
0.0
0.6
1.2
1.8
2.4
1 2 3 4 5 6 7 8 9 10
Kerosene
Diesel
Gasoline
Poor Household consumption decile Rich
trillion rupiah
0.0
0.4
0.8
1.2
1.6
2.0
1 2 3 4 5 6 7 8 9 10
Poor Household consumption decile Rich
Source: Agustina et al. (2008), using Susenas 2007 and OECD calculations.
Environmental costs
Energy subsidies entail environmental costs by encouraging greenhouse-gas emissions, local air
pollution and resource depletion. The policy thus appears to be inconsistent with the general trend, both in
Indonesia and elsewhere, of moving to a greener economy. By keeping the price artificially low, fuel
subsidies encourage wasteful consumption of polluting petroleum products. Subsidies can also lower
incentives to improve energy efficiency. By blurring price signals, subsidies undermine the diversification
toward existing cleaner energy sources and technologies. In the electricity sector, the compensation
provided to the state-owned power utility PLN is a function of technology: PLN receives much more for
electricity produced from diesel than for electricity produced from geothermal sources. Fuel subsidies also
discourage innovation in the production and deployment of cleaner types of energy, such as LPG and
renewables, even though Indonesia’s endowment in these energy resources is substantial.14
Against this background, the removal of energy subsidies features as an important part of the
government’s strategy to move toward a low-carbon environment (Ministry of Finance, 2009). The
objective to fully eliminate fossil fuel subsidies by 2014 has been announced, as well as the plan to reduce
total energy subsidies (including fossil-fuel, electricity and biofuel subsidies) by 10%-15% on average per
year during the period 2011-14. However, no precise timetable has been established for the removal of
electricity subsidies and tariff hikes usually occur on an ad hoc basis. Given the political difficulties
associated with the elimination of energy subsidies (see below), a pragmatic approach has been proposed,
whereby a small carbon tax could be introduced simultaneously with a phasing out of energy subsidies
over time.15
14. In 2007, 39% of generated electricity came from coal, 25% from oil, 25% from gas, 10% from
hydro-electric sources, and 3% from geothermal and other renewable-energy sources.
15. A low tax-inclusive carbon price is currently proposed relative to the prices that have applied in the
European Union or that are planned in other countries. The carbon tax on fossil fuels would be set at
IDR 80 000 per tonne of CO2 (about USD 9) and rise at a rate of 5% (real) per year to 2020.
ECO/WKP(2010)64
15
Removing subsidies will enhance Indonesia’s long-term prospects
Removing energy subsidies is likely to benefit both the economy and the environment. The removal
of energy subsidies is expected to have significant general-equilibrium effects, including on energy prices,
consumption and trade. Efficiency gains are likely to benefit the economy as a whole, even though the
indirect effects of higher energy prices can lead to higher production costs. In addition, the extent of
support or protection in other parts of the economy could hinder the efficient reallocation of resources
following a removal of subsidies. Environmental policies can also influence energy choices and change the
GDP and environmental impacts of subsidy removal. Overall, estimates of reform benefits are hard to
gauge, as many factors inter-play, and their impact will vary according to national institutions and
endowments.
OECD empirical analysis suggests that a unilateral removal of subsidies would be beneficial for most
economies, including Indonesia’s, in the medium term and lead to moderate real income gains
(Burniaux et al., 2009; Table 2). These impacts depend to a large extent on whether the subsidy removal is
compensated through an increase in spending or through tax cuts. These estimated gains are also likely to
underestimate the true benefit of reforms, as they do not account for non-material gains, such as
improvement in the quality of life through better health outcomes.
The effect of a subsidy phase-out on international trade would vary across sectors. Given current
resource endowments, it is likely that Indonesia would reduce its imports of kerosene and of automotive
diesel fuel and increase its exports of natural gas.
Past experience points to a short-lived effect of an increase in energy prices on inflation (Figure 6).
Back-of-the-envelope calculations suggest that a 50% increase in energy prices could automatically boost
headline CPI inflation by a maximum of about 2-3 percentage points, reflecting the relatively small weight
of energy in the price index.16
This is a lower bound, however, as higher energy prices are likely to spread
to transport and other energy-intensive sector costs as well as to wages. The mechanical effect is
nonetheless not markedly different from was observed in the past, when about 20-40% of the rise in fuel
prices passed into headline inflation, suggesting second-round effects are small.
On the fiscal front, lowering the amount of fuel subsidies by one-fourth (this would correspond to
a 15% rise in all subsidised energy prices) is estimated to generate savings of USD 2 billion per year (0.2%
of GDP) (Agustina et al., 2008). This decrease would also lower the public account’s vulnerability to
movements in international energy prices (Figure 7). Assuming no change in subsidy policy, the amount of
fuel subsidies would exceed energy-related revenues when the oil price is above USD 110 per barrel.
Lowering fuel subsidies by one-fourth would push this threshold to USD 135 per barrel, while a two-third
decrease would insure that energy revenue are larger than subsidies even if the oil price were to reach
USD 160 per barrel.
Even if energy subsidies are regressive, removing subsidies without any compensation entails the risk
of an increase in poverty, as fuel spending represents about 5% of total spending of the poorest households.
The effects of the reform on poverty will thus depend on the extent to which low-income households are
compensated for the rise in prices and on the efficiency of such compensation policy. In the past, the
Indonesian authorities have introduced compensation programmes to mitigate the loss of purchasing
power. Lately, measures have targeted poor households (Table 3).
16. A weight of 4-5% has been used for this calculation. This range has been computed by using the weight of
“housing and housing facility” (25%) in the CPI index, the share of consumption of “housing and housing
facility” in household consumption (20% in 2008) and the share of electricity, gas and oil in “housing and
housing facility” (around 20% according to Susenas).

ECO/WKP(2010)64
16
Table 2. Selected studies on the impact of subsidy removal
Authors and method Scope Effect on GDP Effect on social
costs Effect on greenhouse-gas
emissions
Burniaux et al. (2009)
Multi-country general equilibrium model
World
In this simulation, Indonesia is included in a group also comprising Middle East, Algeria-Libya-Egypt, Venezuela
Indonesia, Middle East, Algeria-Libya-Egypt, Venezuela:
Unilateral removal:0.5% by 2050
Multilateral removal:-4.2% by 2050
Indonesia, Middle East, Algeria-Libya-Egypt, Venezuela:
Unilateral removal: -20.2% CO2 emissions by 2050 compared with BAU
Multilateral removal: -37.4% CO2 emissions by 2050 compared with BAU
Bulman et al. (2008) Indonesia Raising gasoline price by 500 rupiah per litre will reduce gasoline consumption by 2.5%. A 20% increase in the price of kerosene will lead to about 3.5% less consumption of kerosene
Adam and Lestari (2008) Regression analysis
Indonesia Increase in the price of oil correlates negatively with social welfare.
Clement et al. (2007) Multi-sectoral general equilibrium model
Indonesia Reduce real output by 2% in the short-term or no effect depending on the modelling assumptions. Aggregate price level increases by 1.1% as a result of a 25% increase in petroleum prices.
The poverty index increases modestly by 0.3-0.6%.
IEA (1999) Static partial equilibrium analysis
Eight non-OECD countries, including Indonesia
In Indonesia, gain of about 0.24% of GDP per year from subsidy removal (compared with an average of 0.73% for the average of the examined countries)
-11% CO2 emission per year from subsidy removal (compared with an average of -16% for the average of the examined countries)
Hope and Singh (1995) Case study from actual reforms in 1980s
Columbia, Ghana, Indonesia, Malaysia, Turkey and Zimbabwe
In Indonesia, energy prices were increased between 1982 and 1985 by 20 to 50% a year. GDP growth rates were higher during the times of energy-price increases, compared with the preceding two years. CPI was stable during the first three years. It is estimated that a shortfall of 18.5% in government revenues was avoided thanks to the price reforms.
The loss of income resulting from subsidy reform ranged from 1 to 3%, with urban poor being the most affected.
Note: Past studies should be used with caution as they were undertaken at a time Indonesia was an oil exporter.
Source: OECD based on Ellis (2010).

ECO/WKP(2010)64
17
Figure 6. Effect of fuel price increase on monthly rates of inflation
Per cent
-2
2
6
10
14
18
22
-2
2
6
10
14
18
22
Jan-
04
Jul-0
4
Jan-
05
Jul-0
5
Jan-
06
Jul-0
6
Jan-
07
Jul-0
7
Jan-
08
Jul-0
8
Jan-
09
Jul-0
9
Jan-
10
Jul-1
0
Fuel price increase
Housing, water, electricity, gas and fuel prices
Source: MEI, BPS, Pallone (2009).
Figure 7. Effect of a decrease in fuel subsidies on the differences between energy revenues and subsidies for different levels of oil price
-5
0
5
10
15
20
-5
0
5
10
15
20
60 70 80 90 100 110 120 130 140 150 160
$ billion$ billion
oil price in $
no change one-fourth decrease tw o-third decreasefull remov al
Note: Feed-back effects in the form of impact of rising price on household consumption are accounted for.
Source: Agustina et al. (2008) and OECD calculations.
On the environment side, the removal of energy subsidies, assuming that no other mitigation action is
implemented, would markedly lower GHG emissions in Indonesia, as higher energy prices dampen energy
use. Emission reductions could be doubled if multilateral action on removing subsidies is taken
(Burniaux et al., 2009). Alternative modelling assumptions could lead to more optimistic conclusions.
Ministry of Finance (2009) reports that a full subsidy removal could double the gains in GDP and poverty
reduction stemming from combining a USD 10 per tonne carbon tax and sales tax cuts.

ECO/WKP(2010)64
18
Table 3. Compensating programmes for fuel subsidy elimination
Measures 2000 2001-04 March 2005
October 2005
2008
Cash transfers to poor households ● ● ● ● Scholarships to finance education ● ● Health card for the poor ● ● Improving service quality in the transport sector ● Revolving funds for SMEs ● Clean water sanitation programme ● Support for elderly householders ● Empowerment programme for fisheries ● Scholarships for religious schools ●
Source: OECD based on Adam and Lestari (2008).
Policy considerations
Phasing out oil and electricity tariffs would have a number of advantages. The resulting spare
resources could be efficiently used through direct income support, for instance targeted cash transfers to
protect low-income households from attendant energy-price rises. These transfers have been found to be
more effective than subsidy policy in helping to boost incomes of the poorest segments of the population.
Increasing subsidised energy prices would also facilitate the financing of additional spending on health,
education and infrastructure (de Mello, 2010; Pisu, 2010), which are crucial to raising living standards in
the longer term.
The Indonesian government is clearly aware of these issues and has expressed its intention to reform
the system. A key to success will be to remove energy pricing from the political process. A first-best
solution would be to fully liberalise energy prices. This would free the government from the responsibility
of directly setting such prices. This solution may, however, not be feasible in the short term, as it would
require a strengthening of the regulatory framework to minimise the risk of anti-competitive behaviour
(OECD, 2010). The approach adopted by the Indonesian authorities appears to be a more realistic though
second-best approach. The government joined the G20 pledge to phase out subsidies for fossil fuels, and a
complete removal of fossil fuel subsidies has been announced for 2014. In addition, the government plans
a gradual reduction of total subsidies by 10%-15% on average per year from 2011-14. These are welcome
steps, and the authorities should stick to the planned removal timetable for fossil fuels. However, further
effort will be required to deeply reform the energy-subsidy policy. As it stands, the current commitment
could be met without making any change to electricity subsidies, which also entail significant economic,
social and fiscal costs. Electricity subsidies are also detrimental to GHG-emission reductions to the extent
that power is generated from coal-fired plants. Extending the current pledge to fully remove fossil-fuel
subsidies by 2014 to a medium-term elimination of electricity subsidies would enhance the government’s
credibility and diminish uncertainties associated with ad hoc changes in electricity tariffs.
Subsidy reform must also go hand in hand with reform to establish a more rational structure of energy
taxes. At the moment energy-related taxes are fairly small relative to total revenue collected. Greater
emphasis on energy taxes could encourage a shift toward cleaner energy sources: the introduction of a
carbon tax, as suggested in Ministry of Finance (2009), would go in the right direction. In addition to
providing incentives for pollution abatement, it would also encourage innovation for new products and
processes and reduce emission levels at a low economic cost as long as it is broad-based. Revenues from
the carbon tax could be recycled to finance programmes in priority areas.
The vulnerability of the economy to oil-price developments could be further reduced by shifting the
energy mix toward less-polluting sources of energy. The government has already taken measures to
encourage the development of renewable energy, in particular geothermal power. A conversion programme
ECO/WKP(2010)64
19
from kerosene to LPG has also been implemented, with promising results. However, it is not clear whether
the focus of current policies on certain energy sources, such as ethanol or biodiesel, is appropriate. Indeed,
there is still a debate concerning the level of full-cycle energy savings associated with particular energy
sources. When soil acidification, fertiliser use, biodiversity loss and toxicity of agricultural pesticides are
taken into account, the overall harmful environmental impacts of ethanol and biodiesel can exceed those of
petrol and mineral diesel (Doornbush and Steenblik, 2007). In the case of Indonesia, if palm oil is used for
biodiesel production and palm-oil plantations are converted from forests the net environmental impacts are
likely to be negative. The use of jatropha curcas in biodiesel production could be envisaged, but there is
currently limited evidence on its energy efficiency and environmental impacts from a life cycle point of
view.17
There may be scope, however, for biodiesel to play a useful role in supplying energy in rural
communities, where the cost of fossil fuel supply is high (Dillon et al., 2008). Given the latest available
knowledge on the development costs of biodiesel and ethanol and their life-cycle environmental impact,
current support to ethanol and biodiesel needs to be reviewed.
As reforming energy subsidies would reduce the purchasing power of the poorest households, the
authorities should introduce compensating measures that support their real incomes in more direct and
effective ways. International experience shows that transition support must be well targeted, coherent with
underlying broader policy settings of economies and carefully planned. Among all the available social
policy tools, cash transfers present advantages. They distort markets and incentives less than other
programmes, can be easily targeted and their cost is usually known with certainty. When properly
implemented, most of the cash transfer funds can be channelled to the poor.18
This would be a particularly
relevant tool for Indonesia, which already has a long tradition of targeted cash-transfer programmes, using
statistical information to identify beneficiaries. One obvious cost of this option is nonetheless that the large
informal sector may discourage individuals from registering for the programme. Regarding electricity,
another possible compensation measure would be to subsidise new connections for households that have
no access to the grid.19
This would complement the use of volume-differentiated tariffs for poor households
that are already in place.
Handling the short-run social impacts of a dismantling of subsidies is challenging and has been the
main reason for backlash against past reforms both in Indonesia and in other countries (OECD, 2006).
Indeed, while the costs of subsidies are spread widely throughout the domestic economy, their benefits are
concentrated disproportionately on certain segments of the population. The resistance to cutting subsidies
can stem from: special interests with strong links to the political system (traditional rent-seeking
behaviour); anxiety over the social consequences and dislocation from reform of subsidy programmes;
“myths” surrounding either the need for subsidies or the costs of reform; absence of a well-accepted
“justification” for reform (presumably relating to a lack of understanding of either costs of subsidies or
benefits of reform). As a result, reforming energy subsidies in practice requires strong political will to take
tough decisions that benefit society as a whole. The following approaches can help policymakers to
overcome opposition to reforms (OECD, 2006 and 2007):
17. Jatropha is a poisonous plant that can be cultivated in waste lands. Some studies have found that the
production of jatropha-based biodiesel leads to less GHG emissions than diesel (see for instance
Prueksakorn and Gheewala (2006) in the case of pilot plantations in Thailand). However, the variability of
oil yields is found to be important and depends on the use of fertilisers or irrigation process. More research
is necessary to get a good insight into the environmental sustainability of jatropha cultivation.
18. According to World Bank estimates, about 80% of the outlays under the US Food Stamps, the Brazilian
Bolsa Familia or the Lithuania Social Benefit have benefited the poorest quintile of the population.
19. The current rate of electrification is low and estimated at around 60% in 2010. The government has
announced a target to increase this ratio to 80% by 2014.
ECO/WKP(2010)64
20
Implementing reforms in a phased manner can help to soften the financial pain of those who will
lose from the change and give them time to adapt. Nonetheless, the gradual removal of subsidies
carries some drawbacks: the benefits are delayed, and the reforms run the risk of being reversed
later.
The role of transparency on subsidy objectives, impacts and costs is essential in motivating the
reform process. Politicians need to disseminate information on the economic and fiscal costs of
current subsidies in a transparent way. Indonesia appears to be more advanced than many other
countries in this regard, as it explicitly records subsidies in the budget documents. However, very
little information is currently publicly available on implicit subsidies that some firms may be
granted through preferential treatment in production-sharing contracts in the oil sector
(Koplow et al., 2010). A National Energy Council (Dewan Energi Nasional) was set up in 2009
to analyse energy-policy issues.20
Because of its composition there are reasons to believe that this
body is not fully independent from the political process, despite its wide mandate and the partly
democratic election of its governing board members. Moreover, the institution is still missing a
balanced and transparent decision-making structure (Purra, 2010).
As well, it will be important to rigorously estimate the overall benefits of subsidy reform and
communicate them to the general public. In particular, an understanding of the distribution of
costs and benefits is essential to designing the optimal path of the reform process. OECD
experience suggests that permanent and independent institutions to investigate the benefits of
reforms often carry more weight than ad hoc working groups or commissions (Tompson and
Dang, 2010). A well-known example is the Productivity Commission in Australia whose reports
significantly influence the debate on reforms. Publishing specific subsidy reports and
communicating broadly about the benefits of reforms in the media could also help raise public
awareness.21
In the case of Indonesia, these tasks could be conferred to an independent
productivity commission. Such an institution could be created as a permanent body, which would
be used subsequently to estimate the benefits of reforms in a wider range of areas.
It is also very important to consult with stakeholders in formulating reforms. Co-opting
opponents to reform in the decision making or mobilising counter-interests has been found to be
successful in overcoming opposition to reforms, when the latter comes from private stakeholders.
Policy coherence is a critical aspect of successful outcomes from subsidy reform. Indeed,
whole-of-government partnerships are crucial, given the multidisciplinary nature of such reform.
20. The Council was created by the 2007 Energy Law. It is mandated to design and formulate national energy
policies; determine a master plan on national energy and responses to energy crisis and emergency
conditions; and monitor the implementation of cross-sectoral policies on energy. The Council is composed
of members of different ministries and the industry as well as academics and is currently headed by the
former CEO of PLN. The Council is assisted by a Secretariat General headed by a Secretary General
appointed by the President. Expenses are funded by the State Budget.
21. Germany publishes bi-annual subsidy reports. Switzerland has implemented an online subsidy database.

ECO/WKP(2010)64
21
Box 2. Summary of policy recommendations: Energy subsidies
Stick to the commitment and the planned timetable to phase out fossil fuel subsidies by 2014 and extend the commitment to a medium-term removal of electricity subsidies.
Introduce a carbon tax. Revenues from the carbon tax could be recycled to finance programmes in priority areas.
Rely exclusively on targeted compensatory measures to protect low-income households from the rise in energy prices. These measures could take the form of cash transfers or subsidies to encourage connection to the electricity grid.
Review support to biodiesel and ethanol.
Mandate an independent productivity commission to investigate the size and costs of energy subsidies and the benefits of their removal, along with the associated distributional impacts, and disseminate the results broadly.
Consult with stakeholders in formulating subsidy policy reforms and ensure policy coherence by involving all the Ministries dealing with energy subsidies.
ECO/WKP(2010)64
22
Bibliography
Adam, L. and E. Lestari (2008), “Ten Years of Reforms: The Impact of an Increase in the Price of Oil on
Welfare”, Journal of Indonesian Social Sciences and Humanities, Vol. 1, pp. 121-139.
Agustina, C., J. Arze del Granado, T. Bulman, W. Fengler and M. Ikhsan (2008), “Black Hole or Black
Gold? The Impact of Oil and Gas Prices on Indonesia’s Public Finances”, World Bank Policy
Research Working Paper, No. 4718.
Bulman, T., W. Fengler and M. Ikhsan (2008), “Indonesia’s Oil Subsidy Opportunity”, Far Eastern
Economic Review, June.
Burniaux, J.M., J. Chateau, R. Dellink, R. Duval and S. Jamet (2009), “The Economics of Climate Change
Mitigation: How to Build the Necessary Global Action in a Cost-Effective Manner”, OECD
Economics Department Working Paper, No. 701.
Clement, B., H.-S. Jung and S. Gupta (2007). “Real and Distributive Effects of Petroleum Price
Liberalization: The Case of Indonesia,” Developing Economies, Vol. 45(2), pp. 220-237.
Coady, D., R. Gillingham, R. Ossowski, J. Piotrowski, S. Tareq and J.Tyson (2010), “Petroleum Product
Subsidies: Costly, Inequitable and Rising”, IMF Staff position note, February.
De Mello, L. (2010), “Enhancing the Effectiveness of Social Policies in Indonesia”, Economics Department
Working Papers, forthcoming, OECD, Paris.
Dillon, H.S., T. Laan and H. Setyaka Dillon (2008), “Biofuels: At What Cost? – Government Support for
Ethanol and Biodiesel in Indonesia”, Global Subsidies Initiative of the International Institute for
Sustainable Development, Geneva.
Doornbush, R. and R. Steenblik, (2007), “Biofuels: Is the Cure Worse than the Disease?” paper prepared
for the OECD Round Table on Sustainable Development, September, Paris.
Ellis, J. (2010), “The Effect of Fossil-Fuel Subsidy Reform: A Review of Modelling and Empirical
Studies”, Global Subsidies Initiative and International Institute for Sustainable Development
Working Paper, March.
Hope, E. and B. Singh (1995), “Energy Price Increases in Developing Countries”, World Bank Policy
Research Paper, No. 1442.
IEA (1999), World Energy Outlook, Paris.
IEA (2008a), World Energy Outlook, Paris.
IEA (2008b), Energy Policy Review of Indonesia, Paris.

ECO/WKP(2010)64
23
Koplow, D., A. Jung, M. Thöne and L. Lontoh (2010), “Mapping the Characteristics of Producer
Subsidies: A Review of Pilot Countries’, The Global Initiative Untold Billions: Fossil-Fuel
Subsidies, the Impact and the Path to Reform, August.
Ministry of Finance (2009), “Economic and Fiscal Policy Strategies for Climate Change Mitigation in
Indonesia”, Paper written in the context of the Australia Indonesia Partnership.
Morgan, T. (2007), “Energy Subsidies: Their Magnitude, How They Affect Energy Investment and
Greenhouse Gas Emissions and Prospects for Reforms”, Report for UNFCCC Secretariat Financial
and Technical Support Programme, Bonn.
OECD (2006), Subsidy Reform and Sustainable Development: Economic, Environmental and Social
Aspects, OECD publishing, Paris.
OECD (2007), Subsidy Reform and Sustainable Development: Political Economy Aspects, OECD
publishing, Paris.
OECD (2010), OECD Economic Survey of Indonesia, Paris.
Pallone, M. (2009), “Indonesia’s Oil Crisis: How Indonesia Became a Net Oil Importer”, Journal of
International Policy Solution, Winter.
Pisu, M. (2010), “Tackling the Infrastructure Challenge in Indonesia”, Economics Department Working Papers,
forthcoming, OECD, Paris.
Pitt, M. (1983), “Equity, Externalities and Energy Subsidies: The Case of Kerosene in Indonesia”, Center
for Economic Research Discussion Paper, No. 181, Washington, DC., August.
Prueksakorn, K. and S.H. Gheewala (2006), “Energy and Greenhouse Gas Implications of Biodiesel
Production from Jatropha Curcas, L.”, proceeding of the 2nd
Joint International Conference on
“Sustainable Energy and Environment (SEE 2006)”, 21-23 November, Bangkok.
Purra, M. (2010), “The Indonesian Electricity Sector: Institutional Transition, Regulatory Capacity and
Outcomes”, Center on Asia and Globalisaton, National University of Singapore, Singapore.
Tompson, W. and T. Dang (2010), “Advancing Structural Reforms in OECD Countries”, OECD
Economics Department Working Paper, No. 758.
World Bank (2006), Making the New Indonesia Work for the Poor, Washington, DC.
World Bank (2010), Indonesia Economic Quarterly: Looking Forward, World Bank Office, Jakarta.

ECO/WKP(2010)64
24
WORKING PAPERS
The full series of Economics Department Working Papers can be consulted at www.oecd.org/eco/workingpapers/
807. Implementing cost-effective policies in the United States to mitigate climate change
(October 2010) by David Carey
806. Restoring fiscal sustainability in the United States
(October 2010) by Patrick Lenain, Bob Hagemann and David Carey
805. Norway: Sustainable development: climate change and fisheries policies
(September 2010) by Paul O’Brien
804. Netherlands: How the transport system can contribute to better economic and environmental
outcomes
(September 2010) by Tomasz Koźluk
803. Public-private partnerships and investment in infrastructure
(September 2010) by Sónia Araújo and Douglas Sutherland
802. Sustaining the momentum of fiscal reform
(September 2010) by Colin Forthun and Robert Hagemann
801. The consequences of banking crises for public debt
(September 2010) by Davide Furceri and Aleksandra Zdzienicka
800. A simulation model of federal, provincial and territorial government accounts for the analysis of
fiscal-consolidation strategies in Canada
(September 2010) by Yvan Guillemette
799. Product market regulation: extending the analysis beyond OECD countries
(October 2010) by Anita Wölfl, Isabelle Wanner, Oliver Röhn, Giuseppe Nicoletti
798. Korea’s green growth strategy: mitigating climate change and developing new growth engines
(July 2010) by Randall S. Jones and Byungseo Yoo
797. Health-care reform in Korea
(July 2010) by Randall S. Jones
796. The Korean financial system: overcoming the global financial crisis and addressing remaining
problems
(July 2010) by Masahiko Tsutsumi, Randall S. Jones and Thomas F. Cargill
795. Are global imbalances sustainable? Post-crisis scenarios
(July 2010) by Luiz de Mello and Pier Carlo Padoan
794. Is there a case for carbon-based border tax adjustment? An applied general equilibrium analysis
(July 2010) by Jean-Marc Burniaux, Jean Chateau and Romain Duval
ECO/WKP(2010)64
25
793. Promoting potential growth: The role of structural reform
(July 2010) by Luiz de Mello and Pier Carlo Padoan
792. Catching-up and inflation in Europe: Balassa-Samuelson, Engel’s law and other culprits
(July 2010) by Balázs Égert
791. Do product market regulations in upstream sectors curb productivity growth? Panel data evidence
for OECD countries
(July 2010) by Renaud Bourlès, Gilbert Cette, Jimmy Lopez, Jacques Mairesse, Giuseppe Nicoletti
790. Preparing for Euro adoption in Poland
(July 2010) by Rafal Kierzenkowski
789. Gauging the impact of higher capital and oil costs on potential output
(June 2010) by Boris Cournède
788. The German banking system: lessons from the financial crisis
(June 2010) by Felix Hüfner
787. Measuring competition in Slovenian industries - estimation of mark-ups
(June 2010) by Margit Molnar
786. Enhancing financial stability through better regulation in Hungary
(June 2010) by Margit Molnar
785. Chile: Boosting productivity growth by strengthening competition, entrepreneurship and innovation
(June 2010) by Cyrille Schwellnus
784. Chile: Climbing on giants’ shoulders: better schools for all Chilean children
(June 2010) by Nicola Brandt
783. Israel: Monetary and fiscal policy
(June 2010) by Charlotte Moeser
782. Policy options for reducing poverty and raising employment rates in Israel
(June 2010) by Philip Hemmings
781. Israeli education policy: How to move ahead in reform
(June 2010) by Philip Hemmings
780. Germany’s growth potential, structural reforms and global imbalances
(June 2010) by Isabell Koske and Andreas Wörgötter
779 Energy policy and the transition to a low-carbon economy
(June 2010) by Jeremy Lawson
778 Making the Luxembourg labour market work better
(June 2010) by Jeremy Lawson
777 Coping with the job crisis and preparing for ageing: the case of Finland
(June 2010) by Henrik Braconier