Structural policy country notes - OECD iLibrary
86
143 ECONOMIC OUTLOOK FOR SOUTHEAST ASIA, CHINA AND INDIA 2020: RETHINKING EDUCATION FOR THE DIGITAL ERA © OECD 2019 Domestic structural reforms are needed to maintain robust growth. This chapter discusses the key policy areas for reform in each of the ASEAN member countries, China and India. The structural policy country notes include topics on education, SME development, social safety net, digital trade, start-up eco-system, agriculture, infrastructure, investment and urban transportation. Examples from the OECD and other countries in the region are also included where relevant. Chapter 3 Structural policy country notes The statistical data for Israel are supplied by and under the responsibility of the relevant Israeli authorities. The use of such data by the OECD is without prejudice to the status of the Golan Heights, East Jerusalem and Israeli settlements in the West Bank under the terms of international law.
-
Upload
khangminh22 -
Category
Documents
-
view
2 -
download
0
Transcript of Structural policy country notes - OECD iLibrary

143ECONOMIC OUTLOOK FOR SOUTHEAST ASIA, CHINA AND INDIA 2020: RETHINKING EDUCATION FOR THE DIGITAL ERA © OECD 2019
Domestic structural reforms are needed to maintain robust growth.
This chapter discusses the key policy areas for reform in each of
the ASEAN member countries, China and India. The structural
policy country notes include topics on education, SME development,
social safety net, digital trade, start-up eco-system, agriculture,
infrastructure, investment and urban transportation. Examples
from the OECD and other countries in the region are also included
where relevant.
Chapter 3
Structural policy country notes
The statistical data for Israel are supplied by and under the responsibility of the relevant Israeli authorities. The use of such data by the OECD is without prejudice to the status of the Golan Heights, East Jerusalem and Israeli settlements in the West Bank under the terms of international law.

145

145ECONOMIC OUTLOOK FOR SOUTHEAST ASIA, CHINA AND INDIA 2020: RETHINKING EDUCATION FOR THE DIGITAL ERA © OECD 2019
ASEAN-5

3. STRUCTURAL pOLICy COUNTRy NOTES
147146 ECONOMIC OUTLOOK FOR SOUTHEAST ASIA, CHINA AND INDIA 2020: RETHINKING EDUCATION FOR THE DIGITAL ERA © OECD 2019
Structural policy challenges discussed in previous editions of the Outlook
2014Education Widening access to education, in particular for low-income householdsDisaster management Strengthening natural-disaster management and protection infrastructureSocial security reform Accelerating reform of the pension system to improve transparency and quality
2015
Social security reform Improving access to and the quality of health services and expanding the coverage of the newly implemented health insurance scheme
Education Further improving the education system, including through greater accessibilityInequality Adequately addressing rising inequality
2016Infrastructure Improving infrastructure for maritime connectivitySocial security Reforming the national social security systemFood security Improving food security
2017Tourism Strengthening investment in tourismInfrastructure Improving connectivity and infrastructure developmentEnergy access Reducing gaps in energy access between urban and rural areas
2018 Green finance Fostering green finance2019 Financial inclusion Leveraging financial technology to bring banking services closer to the people
0 10 000 20 000 30 000 40 000 50 000
Mineral products31%
Vegetable products 16%
Machinery/electrical10%
Textiles9%
Metals8%
Others26%
Machinery/electrical
30%
Mineral products21%Metals
13%
Chemicals & alliedindustries
12%
Plastics/rubber7%
Others17%
Source: IMF.
Source: Trademap. Source: Trademap.
Composition of exports, 2018(percentage of total exports)
Composition of imports, 2018(percentage of total imports)
Indonesia
Indonesia ASEAN-10average
Emerging Asiaaverage
2013-17 (average) 2019 2020-24 (average)
GDP growth rates (percentage change)
OECD average
Emerging Asia average
ASEAN-10 average
Indonesia
GDP per capita, 2018 (PPP, current international dollar)
0 1 2 3 4 5 6 7 8
Source: OECD Development Centre.
A. Medium-term economic outlook(forecast, 2020-24 average)GDP growth (percentage change): 5.1Current account balance (% of GDP): -2.5Fiscal balance (% of GDP) (central government): -1.7
B. Basic data (in 2018)Total population: 264.2 million *Population of DKI Jakarta: 10.5 million *Nominal GDP (US dollar): 1 022.5 billion **GDP per capita at PPP: 13 229.5 (current International Dollar) **Exchange rate in the first half of 2019 (period average): 14 195.2 (IDR/USD)
Note: * Population data are year-end government estimates. ** IMF estimate.
Sources: OECD Development Centre, national sources, CEIC and IMF.

3. STRUCTURAL pOLICy COUNTRy NOTES3. STRUCTURAL pOLICy COUNTRy NOTES
147ECONOMIC OUTLOOK FOR SOUTHEAST ASIA, CHINA AND INDIA 2020: RETHINKING EDUCATION FOR THE DIGITAL ERA © OECD 2019
POLICY FOCUS
Reforming technical and vocational education and training
TVET has a key role to play in creating a skilled workforce. In light of this, TVET is an important part of Indonesia’s “Industry 4.0” strategy. Indeed, the low percentage of skilled labour in Indonesia makes it indispensable for the government to improve the country’s human capital. According to 2018 statistics, 40.7% of the workforce had completed lower or primary school education, 18.1% had finished lower secondary school, and 18% and 11% respectively were general and vocational secondary graduates. The numbers fell still further for university graduates (9.4%), and vocational tertiary graduates (2.8%). Taking into account the country’s opportunity for a so-called demographic dividend – the large proportion of the population that is now at or entering working age – the government is eager to foster more skilled and competitive human resources by increasing the number of vocational secondary school, notably in the sector of maritime, tourism, agriculture and creative industry.
However, vocational graduates still often find it difficult to integrate into labour market. Indeed, Indonesia’s TVET sector faces an important mismatch between the vocational graduates’ skills, and the demands and needs of industry. According to an OECD report from 2015, vocational secondary school graduates did not meet employers’ expectations, and their skills were often perceived to be low or very low in quality (OECD, 2015).
Another major challenge that vocational institutions face is a certain negativity towards and even stigmatisation of their courses, in that many Indonesians still see taking a vocational track in tertiary education as a second-rate option compared to the academic track (Allen, 2016). This negativity also exists among some employers, many of which still perceive graduates from vocational programmes less favourably than those graduating from academic programmes (Kadir, Nirwansyah and Bachrul, 2016). In effect, most graduates of vocational secondary schools go directly into the labour market, with less than 15% of them choosing to go on to higher institutions (OECD, 2015).
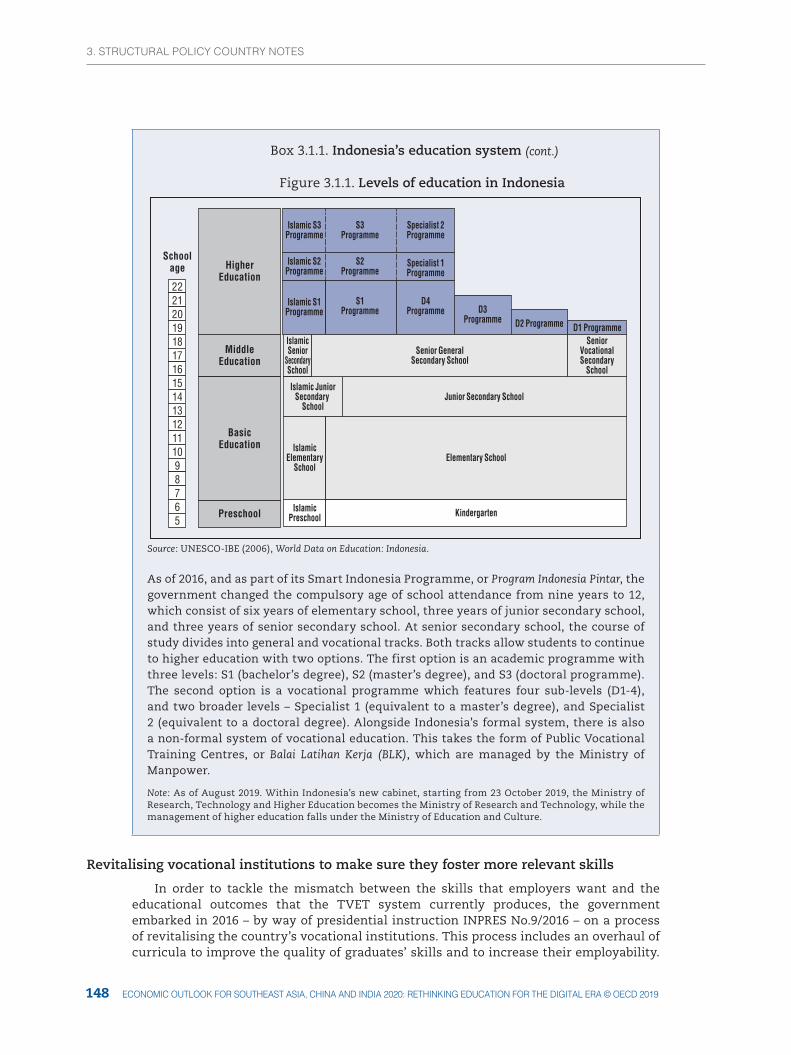
Box 3.1.1. Indonesia’s education system
The education system in Indonesia is divided into four levels: pre-school, basic education, middle education, and higher education. Three different ministries administer the education system. The Ministry of Education and Culture manages the first, second, and third levels of education. Meanwhile, the Ministry of Research, Technology and Higher Education deals with higher education*, and the Ministry of Religious Affairs manages Islamic education institutions operating at all of these levels.
3. STRUCTURAL pOLICy COUNTRy NOTES
149148 ECONOMIC OUTLOOK FOR SOUTHEAST ASIA, CHINA AND INDIA 2020: RETHINKING EDUCATION FOR THE DIGITAL ERA © OECD 2019
Box 3.1.1. Indonesia’s education system
Figure 3.1.1. Levels of education in Indonesia
2221201918171615141312111098765
Schoolage Higher
Education
MiddleEducation
BasicEducation
Preschool
Islamic S3Programme
S3Programme
S2Programme
S1Programme
Specialist 2Programme
Specialist 1Programme
D4Programme D3
Programme D2 Programme D1 Programme
Islamic S2Programme
Islamic S1Programme
IslamicSenior
SecondarySchool
Senior GeneralSecondary School
SeniorVocationalSecondary
School
Islamic JuniorSecondary
SchoolJunior Secondary School
IslamicElementary
SchoolElementary School
IslamicPreschool Kindergarten
Source: UNESCO-IBE (2006), World Data on Education: Indonesia.
As of 2016, and as part of its Smart Indonesia Programme, or Program Indonesia Pintar, the government changed the compulsory age of school attendance from nine years to 12, which consist of six years of elementary school, three years of junior secondary school, and three years of senior secondary school. At senior secondary school, the course of study divides into general and vocational tracks. Both tracks allow students to continue to higher education with two options. The first option is an academic programme with three levels: S1 (bachelor’s degree), S2 (master’s degree), and S3 (doctoral programme). The second option is a vocational programme which features four sub-levels (D1-4), and two broader levels – Specialist 1 (equivalent to a master’s degree), and Specialist 2 (equivalent to a doctoral degree). Alongside Indonesia’s formal system, there is also a non-formal system of vocational education. This takes the form of Public Vocational Training Centres, or Balai Latihan Kerja (BLK), which are managed by the Ministry of Manpower.
Note: As of August 2019. Within Indonesia’s new cabinet, starting from 23 October 2019, the Ministry of Research, Technology and Higher Education becomes the Ministry of Research and Technology, while the management of higher education falls under the Ministry of Education and Culture.
Revitalising vocational institutions to make sure they foster more relevant skills
In order to tackle the mismatch between the skills that employers want and the educational outcomes that the TVET system currently produces, the government embarked in 2016 – by way of presidential instruction INPRES No.9/2016 – on a process of revitalising the country’s vocational institutions. This process includes an overhaul of curricula to improve the quality of graduates’ skills and to increase their employability.
(cont.)

3. STRUCTURAL pOLICy COUNTRy NOTES3. STRUCTURAL pOLICy COUNTRy NOTES
149ECONOMIC OUTLOOK FOR SOUTHEAST ASIA, CHINA AND INDIA 2020: RETHINKING EDUCATION FOR THE DIGITAL ERA © OECD 2019
The policy seeks to shift TVET away from a supply-driven approach towards a demand-driven ethos that focuses more on producing graduates with the skills that industry actually wants.
In several provinces, some of Indonesia’s vocational secondary schools (Sekolah Menengah Kejuruan [SMKs]) have already carried out the revitalisation programme. In West Java and the Riau islands, for example, they have taken a number of different approaches. One of these has been to establish a so-called “teaching factory”, which applies industrial working culture at school. They have also synchronised their curricula with industry, with partner industries now deciding up to 60% of their content. Some other approaches also include facilitating the certification of graduates’ actual skills (Box 3.1.2), improving teachers’ practical skills by immersing them in industrial internships, and upgrading learning equipment and facilities. At the level of higher education, meanwhile, the process of revitalisation has focused on a range of measures, including an effort to improve the certification of skills. There has also been a push to make sure that lecturers have a balanced background, with the aim of ensuring a 50:50 ratio between academic and industrial influences, as well as initiatives to retool or retrain vocational teachers. Finally, another measure has been to implement the so-called 3-2-1 dual system, which offers students three semesters in class, two semesters in industry, and one semester working on a final assignment.
Box 3.1.2. Harmonising certification system and improving non-formal institutions
Building up the kinds of skills certification that can send a reliable signal to employers continues to pose a challenge in Indonesia. Against the backdrop of opportunity that the ASEAN Economic Community offers to Indonesia, as well as broader opportunities in the global economy, skills certification is much more of an urgent thing for TVET graduates to be able to present to employers than the vocational school diploma (Ijazah). Yet despite this glaring need, certification systems for certain skills are still under development (Ministry of Education and Culture, 2019d). Moreover, a rather large set of actors remains in charge of TVET in Indonesia, with the manpower and industry ministries both playing supervisory roles in the professional certification system, and with operational management falling either to vocational institutions or to independent bodies. Indeed, a total of 1 479 professional certification agencies are registered with the National Professional Certification Agency (BNSP). As of 2018, these agencies consist of 791 vocational secondary schools who own a licence to test and issue a competency certificate for their students.
Indonesia’s non-formal vocational institutions (BLK) also face challenges as they seek to improve. One of these challenges – as is the case in other areas of TVET in Indonesia – is finding effective and reliable ways to certify skills. Indeed, it is the BLKs themselves that manage the final assessment for participants in the training courses they offer, and they rarely refer to the national certification system or seek verification from registered independent assessors. Aside from certification, most BLKs were established in the 1980s, meaning that facilities tend now to be outdated. As with other parts of Indonesia’s TVET system, therefore, efforts are under way to revitalise them. Recently, for example, Indonesia’s central and local governments worked on a pilot project to restructure the curricula of BLKs, matching up their courses with the needs and expectations of the industries that operate in their region of the country. However, many BLKs in some regions are still offering basic skills that do not relate well to what industry actually needs.

3. STRUCTURAL pOLICy COUNTRy NOTES
151150 ECONOMIC OUTLOOK FOR SOUTHEAST ASIA, CHINA AND INDIA 2020: RETHINKING EDUCATION FOR THE DIGITAL ERA © OECD 2019
In a bid to adapt to rapid technological change and to strengthen digital literacy, the revitalisation of Indonesia’s SMKs also includes the implementation of an approach to learning that is more solidly based on ICT. Moreover, thinking-related skills such as critical thinking, creativity, innovation, problem solving, and decision making, are also being strengthened by building an entrepreneurial culture within the school environment. In addition to entrepreneurship, the government has been taking into consideration Indonesia’s regional uniqueness by encouraging students to work on the development of a locally-based industry. In turn, this approach aims to improve the competitiveness of the local comparative advantage, and to bolster sustainable prosperity at the regional level. One example of this approach can be found by examining evidence from several of the SMKs in the province of Papua, where the regional government has established local-based curricula.
The fundamental necessity of improving public-private partnerships in TVET
In addition to revitalising its vocational institutions from within, Indonesia’s government has also been emphasising the need to improve public-private partnerships (PPPs) in the TVET sector (SEA-VET, n.d.). According to the Indonesian government, 2 700 vocational secondary schools had been revitalised by 2019, out of a total of 14 064 (Ministry of Education and Culture, 2019b; 2019c). This result may be due not just to a lack of budget, but also to a lack willingness from private-sector actors to co-operate. In 2019, 3.4% of the government’s overall spending on education is allocated to vocational education. Most of the budget allocation for TVET is being spent on improving facilities and equipment. However, according to some revitalised SMKs, the allocated budget is still insufficient. This might create an obstacle for SMKs as they seek to maximise the quality of their learning facilities. According to the World Bank’s survey of Indonesian employees, indeed, the quality of the facilities in Indonesian TVET institutions constitutes a major weakness, since it is often outdated and has not kept up with the latest innovation and technology (Figure 3.1.2). Moreover, outdated technology may accentuate the mismatch between TVET institutions’ programmes and the professional environment as it actually is.
Figure 3.1.2. Main weaknesses of SMKs as perceived by employees in Indonesia
9
23
4
29
9
13
4
8
0
5
10
15
20
25
30
35
Cycle length Quality of teaching Teacher skills Quality of facilities Curriculum General skills Specific skills Relevance
%
Source: Di Gropello, Kruse and Tandon (2011), Skills for the Labor Market in Indonesia – Trends in Demand, Gaps and Supply.12 https://doi.org/10.1787/888934064221
Currently, the education ministry promotes PPPs by encouraging SMKs to initiate partnerships with the private sector. However, Indonesian SMKs face some challenges in seeking out co-operation with the private sector. Most private-sector actors in the country still perceive student involvement in industry as a disruption to their business activities (Bai and Paryono, 2019). A further complication comes from the high proportion of Indonesia’s vocational secondary schools – 75% of 14 064 institutions – that are themselves private. These private schools still have not met Indonesia’s national standards

3. STRUCTURAL pOLICy COUNTRy NOTES3. STRUCTURAL pOLICy COUNTRy NOTES
151ECONOMIC OUTLOOK FOR SOUTHEAST ASIA, CHINA AND INDIA 2020: RETHINKING EDUCATION FOR THE DIGITAL ERA © OECD 2019
of educational quality (Ministry of Education and Culture, 2019a). This perception of low-quality education at these private schools might then be one of the reasons making private industrial actors reluctant to co-operate with them.
Private-sector engagement is necessary in order to make training programmes more relevant to its needs. Aside from making changes to curricula, for example by including work placements or apprenticeships, PPPs have the potential to provide better learning facilities, and also – since TVET institutions currently rely heavily on the central government, local government, and communities – to tackle the issue of financing. Offering incentives to the private sector is one potential way to accelerate the dynamic of PPPs. Once they are involved in funding TVET, private-sector actors’ sense of engagement in improving the quality of Indonesian TVET is likely to grow. PPPs have also the potential to complement the government’s efforts to improve the quality of teaching. A key part of future improvements will be to offer training both on industrial know-how and ICT, thus making teaching more relevant, and complementing the government’s efforts to increase digital literacy.
Indonesian TVET is struggling with a shortage of qualified vocational teachers
The number of SMKs has grown rapidly between 2016 and 2018, with approximately 828 new SMKs opening their doors to students. However, the current demand for vocational teachers cannot be satisfied. Recent statistics have shown that the proportion of teachers in SMKs who hold at least a bachelor’s degree declined from 95% in 2018 to 73% in 2019 (Figure 3.1.3). As a result, there is a shortage of teachers with sufficient educational background. In a bid to produce more vocational teachers, the country’s ministry for research, technology and higher education recently held a group discussion with public university chancellors in order to develop a degree programme for vocational education. In addition to academic experience, ensuring industrial experience of TVET teachers is also necessary. Teachers’ limited, or even non-existent, professional experiences in the sector in which they specialise could mean that the skills they impart to TVET graduates lack relevance to what industry actually needs (OECD, 2015; Di Gropello, Kruse and Tandon, 2011).
Figure 3.1.3. SMK teachers’ level of education in Indonesia
5
95
27
73
0
10
20
30
40
50
60
70
80
90
100
< Bachelor's degree (%) � Bachelor's degree (%)
%
2018 2019
Source: Ministry of Education and Culture (2019c), Statistik Persekolahan SMK 2018/2019; Ministry of Education and Culture (2018), Statistik Persekolahan SMK 2017/2018.12 https://doi.org/10.1787/888934064240
Revitalisation aside, inter-agency co-ordination is crucial
Since different ministries are responsible for managing the vocational secondary, and tertiary institutions in Indonesia, different levels of achievement in revitalising these institutions have already become apparent. So while the government’s efforts to promote
≥

3. STRUCTURAL pOLICy COUNTRy NOTES
153152 ECONOMIC OUTLOOK FOR SOUTHEAST ASIA, CHINA AND INDIA 2020: RETHINKING EDUCATION FOR THE DIGITAL ERA © OECD 2019
and revitalise vocational secondary institutions seems to have made consistent progress, improvement at the level of vocational tertiary institutions is still insufficient. As of 2017, only 5.4% of Indonesia’s 4 529 tertiary institutions were vocational polytechnics, and some of them are not accredited, so their quality remains unclear (Ministry of Research, Technology and Higher Education, 2017). According to Indonesia’s ministry for research, technology, and higher education, only two polytechnics were in a good collaboration with the private sector as of 2019.
The government’s focus on producing more vocational teachers and improving the quality of their work might be the reason behind slow improvement in revitalising tertiary institutions. However, efforts are being made to speed up progress. Indeed, the research, technology and higher education ministry has recently submitted a budget proposal for upgrading vocational infrastructures, and this is expected to start making a difference as of 2020. As the vocational higher education system awaits the effects of such initiatives, its revitalisation remains at early stage.
There is scope to strengthen co-ordination between authorities in order to accelerate the revitalisation process and to render it more effective. Ministries, local government, private-sector actors, chambers of commerce, employers’ associations, and other stakeholders should sit down together to design a TVET system that can deliver higher quality. Good co-ordination is critical. This would allow for the synchronisation of authorities’ different agendas, as well as for an improvement in the communication between them.
Finally, it is necessary for Indonesia’s TVET system to allow an internationally recognised form of skills certification to take hold throughout. This will mean harmonising the certification system and distributing professional certification agencies more evenly across Indonesia. In addition, encouraging vocational institutions to seek accreditation in order to send a proper quality signal is also important, since it will make it more attractive for private-sector actors to co-operate with TVET institutions. In so doing, the government also stands to bolster its broader agenda of enhancing public-private partnerships in the Indonesian economy.
References
Allen, E.R. (2016), “Analysis of Trends and Challenges in the Indonesian Labor Market”, ADB Papers on Indonesia, No. 16, Asian Development Bank, Manila, https://www.adb.org/sites/default/files/publication/182935/ino-paper-16-2016.pdf.
Bai, B. and Paryono (2019), Vocational Education and Training in ASEAN Member States: Current Status and Future Development, Springer, Singapore.
Di Gropello, E., A. Kruse and P. Tandon (2011), Skills for the Labor Market in Indonesia – Trends in Demand, Gaps and Supply, World Bank, Washington, DC, http://documents.worldbank.org/curated/en/840381468262793742/pdf/608120PUB0Skil10Box358333B01PUBLIC1.pdf.
Kadir, S., Nirwansyah and B.A. Bachrul (2016), “Technical and Vocational Education and Training in Indonesia: Challenges and Opportunities for the Future”, Lee Kuan Yew School of Public Policy – Microsoft Case Study Series on Technical and Vocational Education and Training, Lee Kuan Yew School of Public Policy, National University of Singapore, https://lkyspp.nus.edu.sg/docs/default-source/case-studies/lkysppms_case_study__technical_and_vocational_education_and_training_in_indonesia.pdf?sfvrsn=e5c5960b_2.
Ministry of Education and Culture (2019a), “Kemendikbud Selesaikan Revitalisasi terhadap 2.000 SMK”, News, Kemendikbud, Jakarta, http://psmk.kemdikbud.go.id/konten/4240/kemendikbud-selesaikan-revitalisasi-terhadap-2000-smk.
Ministry of Education and Culture (2019b), “Pemerintah Fokus Pendidikan Kejuruan, Revitalisasi SMK Tunjukkan Dampak Positif”, Kemendikbud, Jakarta, https://www.kemdikbud.go.id/main/blog/2019/04/pemerintah-fokus-pendidikan-kejuruan-revitalisasi-smk-tunjukkan-dampak-positif.

3. STRUCTURAL pOLICy COUNTRy NOTES3. STRUCTURAL pOLICy COUNTRy NOTES
153ECONOMIC OUTLOOK FOR SOUTHEAST ASIA, CHINA AND INDIA 2020: RETHINKING EDUCATION FOR THE DIGITAL ERA © OECD 2019
Ministry of Education and Culture (2019c), Statistik Persekolahan SMK 2018/2019 (The Statistics of Vocational Senior Secondary School (VSSS) Year 2018/2019), PSDPK Kemendikbud, Jakarta, ht tp : //publ ikasi .data.kemdikbud.go.id /uploadDir/isi _ B8C0D956-74F4-41D9-8E45-5AF346DF8098_.pdf.
Ministry of Education and Culture (2019d), “Tingkatkan Kualitas SMK, Kemendikbud dan BNSP Sahkan Skema Sertifikasi KKNI Level II dan III”, Kemendikbud, Jakarta, https://www.kemdikbud.go.id/main/blog/2019/04/tingkatkan-kualitas-smk-kemendikbud-dan-bnsp-sahkan-skema-sertifikasi-kkni-level-ii-dan-iii.
Ministry of Education and Culture (2018), Statistik Persekolahan SMK 2017/2018 (The Statistics of Vocational Senior Secondary School (VSSS) Year 2017/2018), PSDPK Kemendikbud, Jakarta, ht tp : //publ ikasi .data.kemdikbud.go.id /uploadDir/isi _ B5497FED-88A5-47CD-9492-78B703B41D28_.pdf.
Ministry of Research, Technology and Higher Education (2017), “Kemenristekdikti Akan Terus Tingkatkan Kualitas dan Jumlah Perguruan Tinggi Vokasi”, Kemenristekdikti, Jakarta, https://kelembagaan.ristekdikti.go.id/index.php/2017/08/23/kemenristekdikti-akan-perbanyak-jumlah-perguruan-tinggi-vokasi/.
OECD (2015), “Initial vocational education and training in Indonesia”, in Education in Indonesia: Rising to the Challenge, OECD Publishing, Paris, https://doi.org/10.1787/9789264230750-9-en.
SEA-VET (n.d.), “Indonesia”, Country Profiles, https://sea-vet.net/indonesia.
UNESCO-IBE (2006), World Data on Education: Indonesia, UNESCO International Bureau of Education, http://www.ibe.unesco.org/fileadmin/user_upload/archive/Countries/WDE/2006/ASIA_and_the_PACIFIC/Indonesia/Indonesia.pdf.

3. STRUCTURAL pOLICy COUNTRy NOTES
155154 ECONOMIC OUTLOOK FOR SOUTHEAST ASIA, CHINA AND INDIA 2020: RETHINKING EDUCATION FOR THE DIGITAL ERA © OECD 2019
0 10 000 20 000 30 000 40 000 50 000
Machinery/electrical
48%
Mineral products18%
Plastics/rubber7%
Metals7%
Chemicals & alliedindustries
6%
Others14%
Machinery/electrical
43%
Mineral products18%
Metals10%
Chemicals & alliedindustries
8%
Plastics/rubber6%
Others15%
Malaysia ASEAN-10average
Emerging Asiaaverage
GDP growth rates (percentage change)GDP growth rates (percentage change)
Source: IMF.
Source: Trademap. Source: Trademap.
OECD average
Emerging Asia average
ASEAN-10 average
Malaysia
GDP per capita, 2018(PPP, current international dollar)
Composition of exports, 2018(percentage of total exports)
Composition of imports, 2018(percentage of total imports)
Malaysia
0 1 2 3 4 5 6 7 8
2013-17 (average) 2019 2020-24 (average)
Source: OECD Development Centre.
Structural policy challenges discussed in previous editions of the Outlook
2014Education Improving the quality of educationSME development Improving the productivity of small and medium sized enterprises (SMEs)Taxation Widening the tax base and improving tax administration and compliance
2015
Productivity Improving productivity to support sustainable economic growth and transform Malaysia into a high-income developed nation
ICT Further development of Information and Communication Technology (ICT), which is particularly important in supporting growth
Taxation and fiscal system Enhancements to fiscal stability, and a reduction in the country’s dependence on oil, including through the introduction of a goods and services tax (GST)
2016SMEs Raising the productivity of SMEsEducation Upgrading education to meet industry needsUrban green growth Promoting urban green growth
2017Housing Keeping housing affordable and ensuring a supply of affordable housingSocial safety net Enhancing the social safety net to ensure citizens’ well-being and participation
2018 Halal industry Enhancing trade growth by strengthening the Halal sector2019 Taxation Reintroducing a sales and services tax after the scrapping of the goods and services tax
A. Medium-term economic outlook(forecast, 2020-24 average)GDP growth (percentage change): 4.4Current account balance (% of GDP): 2.8Fiscal balance (% of GDP) (central government): -2.9
B. Basic data (in 2018)Total population: 32.4 million *Population of Kuala Lumpur: 1.8 million *Nominal GDP (US dollar): 354.3 billion **GDP per capita at PPP: 30 859.9 (current International Dollar) **Exchange rate in the first half of 2019 (period average): 4.1 (MYR/USD)
Note: * Population data are mid-year government projections based on 2010 Census.
** IMF estimate.Sources: OECD Development Centre, national sources, CEIC and IMF.

3. STRUCTURAL pOLICy COUNTRy NOTES3. STRUCTURAL pOLICy COUNTRy NOTES
155ECONOMIC OUTLOOK FOR SOUTHEAST ASIA, CHINA AND INDIA 2020: RETHINKING EDUCATION FOR THE DIGITAL ERA © OECD 2019
POLICY FOCUS
Developing the entrepreneurship of SMEs
Malaysia has made significant strides in improving its domestic business climate for small and medium-sized enterprises (SMEs) over the years. The growth in the output of Malaysia’s SMEs outpaced the country’s overall economic growth in every year from 2004-17 (SME Corporation Malaysia, 2018). Against a backdrop of overall improvement in Malaysia’s SME sector, the ratio of enterprises to the population aged 15-64 also jumped in the years 2010-15, which suggests an increased interest among Malaysians in starting up a business (Figure 3.2.1). Another encouraging sign has been the moderate-to-high entrepreneurial intuition and inclination of technical and vocational students in Malaysia (Dahalan et al., 2018; Ibrahim et al., 2015).
A broad set of government initiatives to support SMEs – including programmes to develop human capital and to strengthen entrepreneurship by fostering innovation – have contributed to the overall improvements that Malaysia’s SME’s have made (Box 3.2.1). There are also initiatives for SMEs to keep pace with digitalisation (e.g. skills upgrade and guidance for effective usage of business technologies); and for technology-oriented start-ups to create new products and services. Consolidating the SME programmes and their administration can yield efficiency gains and promote eveness in quality of programme delivery.
Figure 3.2.1. Proportion of enterprises per 1 000 people in Malaysia
0
5
10
15
20
25
30
35
40
45
SMEs Total enterprises
2010 2015
Note: Population coverage is from age 15 to 64.Source: OECD Development Centre based on national sources.12 https://doi.org/10.1787/888934064259
Box 3.2.1. Human capital and innovation programmes for SMEs in Malaysia
Malaysia has launched an array of programmes to help its SMEs both to shore up human capital and to adopt innovations. One such initiative has been to provide training on business skills and leadership development. Examples of this include the TERAS Enhancement and Development training at the Institut Keusahawanan Negara, a business school, as well as programmes to upgrade skills and capacities throughout Malaysia’s SMEs. There are initiatives that encourage women and youth in rural areas to take up

3. STRUCTURAL pOLICy COUNTRy NOTES
157156 ECONOMIC OUTLOOK FOR SOUTHEAST ASIA, CHINA AND INDIA 2020: RETHINKING EDUCATION FOR THE DIGITAL ERA © OECD 2019
Box 3.2.1. Human capital and innovation programmes for SMEs in Malaysia
entrepreneurship as well. Specific examples of this include the Rural Business Challenge and Inkubator Keusahawanan Wanita, a business incubator for women entrepreneurs. Among Malaysia’s other entrepreneurship initiatives are skill-development courses for school leavers and the unemployed such as the National Dual Training System and targeted efforts to engage academia such as the SME@University Programme (SME Corporation Malaysia, 2018, 2016).
Assisting technology-oriented start-ups constitute another prominent component of Malaysia’s policies to support SMEs. For a start, there are incubators and accelerator programmes that operate under the auspices of a number of the country’s government ministries. In addition to these, the Malaysian Global Innovation and Creativity Centre was unveiled in 2014. It seeks to develop a business eco-system that encourages local people to compete with their foreign counterparts in coming up with new goods and services. The National eCommerce Strategic Roadmap, and the Digital Free Trade Zone, are among other undertakings of the central government in Malaysia to help SMEs to participate in local and offshore business ventures. The state-level governments – for instance in Sabah and Sarawak – also have a number of programmes on entrepreneurship, targeting various segments of society (SME Corporation Malaysia, 2016).
The restoration of a central institution should facilitate consolidation of programmes
The restoration of Malaysia’s Ministry of Entrepreneur Development (MED) in 2018 after it was disbanded in 2009 has the potential to be a key catalyst in further enhancing the effectiveness of the country’s SME programmes. The newly-restored ministry has laid out a new National Entrepreneurship Framework (NEF), which contains 21 strategic objectives under four key policy subheadings (MED, 2018). The NEF’s objectives include fostering an innovative ecosystem for SMEs, developing alternative funding sources, creating a database of stakeholders, and boosting the implementation and administration of existing programmes.
Consolidating Malaysia’s entrepreneurship programmes and their administration under the central agency while still providing room for inter-agency collaboration has ample advantages. As it is, there are several ministries and line agencies involved in entrepreneurship programmes (SME Corporation Malaysia 2018, 2016, 2015). Moreover, a number of the programmes implemented by different offices overlap in certain areas including those that focus on innovation and the development of human capital. The process of consolidation can be done along the lines of NEF strategy objectives 8, 9 and 11, i.e. rationalising the roles and functions of entrepreneur development agencies, establishing a national entrepreneurship training council and consolidating existing entrepreneurship development funds, respectively.
Effective management of information about programmes makes it easier to monitor their outcomes
Malaysia’s creation of central systems to pool data, and to disseminate information and research about entrepreneurship, bodes well for the country in its efforts both to help SMEs to update their practices in line with the latest industry developments, and to improve the flow of information. In this regard, the launching of Entrepreneur Development One-Stop Centre is a step in the right direction. Establishment of a dedicated research agency for entrepreneurship (NEF strategy objective 17) and development of an integrated database of entrepreneurship and SMEs (NEF strategy objective 7) also carry substantial upsides.
(cont.)

3. STRUCTURAL pOLICy COUNTRy NOTES3. STRUCTURAL pOLICy COUNTRy NOTES
157ECONOMIC OUTLOOK FOR SOUTHEAST ASIA, CHINA AND INDIA 2020: RETHINKING EDUCATION FOR THE DIGITAL ERA © OECD 2019
As the management of information improves, it will be important to strengthen the framework and mechanisms for assessing how well the different measures are working. Doing this will help to make the different programmes more responsive to the needs of entrepreneurs. In this respect, the OECD’s six-step assessment framework, which draws on the experiences and policies of some developed economies, may be useful for Malaysia (OECD, 2008).
In addition, there is considerable merit in maintaining if not broadening collaborations with external stakeholders. For instance, making the contents of the forthcoming SME database accessible to various sectors such as academic institutions and private research agencies could enrich the SME policy perspectives.
Entrepreneurship programmes can be leveraged to bring informal enterprises into the formal sector
Based on the results of the enterprise survey of the World Bank in 2015, Malaysia fared well in incentivising informal enterprises to formalise their operations relative to the averages of East Asia and the Pacific and upper middle-income countries (World Bank, 2015). The share of formal-sector firms that said they were competing with informal-sector counterparts was also lower in Malaysia than the average of the two aforementioned groups. Nonetheless, the results of the same survey showed that the practices in the informal sector are still the top constraint to the business environment in the country – and by a wide margin. Unsurprisingly, small and medium-sized firms were more likely to find this to be restrictive than large firms.
The World Bank study argued that generally informal sector enterprises’ aversion to becoming part of the tax base was their most tangible concern about formalisation. However, more than the tax burden, formalisation also entails being subjected to labour, health and environmental regulations, among other laws. To this end, a clear strategic framework to formalise informal enterprises, which builds on the SME Masterplan 2012-2020, ought to be considered. A dedicated group with functions similar to the Special Task Force to Facilitate Business (PEMUDAH) that caters to concerns related to formalisation of informal businesses including dialogues for policy formulation may be worth exploring.
Concerning the cost of doing a formal business, the government’s move to lower the tax rate of SMEs (MIDA, 2018) may help reduce friction in this respect. There also remains scope to boost awareness of the digital platforms launched (e.g. e-ledger, e-registration and e-filing, etc.) as cost saving mechanisms to encourage compliance particularly among informal single proprietors and informal SMEs outside the urban centres.
Beyond cost issues, entrepreneurship programmes can be leveraged further to assist firms to navigate the process of formalisation. Mechanisms to gather information on concrete problems preventing informal firms from joining the mainstream could be established on the side. Co-ordination with relevant private institutions–say, with the banks–could be similarly harnessed to help disseminate information on formalisation gains such as lower cost of financing. Moreover, Chacaltana, Leung and Lee (2018) put forth policy options to facilitate transition using new technologies, which the Malaysian government could adjust to the local conditions. These cover the areas of business registration, tax compliance, information campaign, among others.
Persistently reaching out to informal enterprises has the capacity not just to even out the playing field for formal-sector SMEs – particularly in wholesale retail and trade – but also to bring substantial socio-economic welfare upsides. Data from 2017 show that the number of workers involved in the informal sector declined compared to 2015, yet it remained substantial at around 1.4 million, or 9.4% of total employment in Malaysia (DOSM, 2018).

3. STRUCTURAL pOLICy COUNTRy NOTES
159158 ECONOMIC OUTLOOK FOR SOUTHEAST ASIA, CHINA AND INDIA 2020: RETHINKING EDUCATION FOR THE DIGITAL ERA © OECD 2019
Harnessing entrepreneurship ought to go beyond increasing SMEs’ contribution to growth
The NEF’s first strategic objective, which sets out to increase the contribution of SMEs to gross domestic product (GDP) to over 40% by 2020, is meaningful in a macroeconomic sense. Beyond increasing the value that SMEs add to the economy, however, it also pays to set target outcomes in terms of firm-level competitiveness. Such metrics can include the distribution of economic activity by sector and firm size, firms’ survival rates, their resilience to economic shocks, and their rate of graduation to the next bracket – i.e. from micro to small, small to medium, and medium to large. Moreover, it is important to bear in mind that SMEs turning into large enterprises could result in a mathematical reduction in SMEs’ overall contribution to GDP without necessarily signalling a deterioration in conditions in the SME sector. Similarly, when large firms downscale and fall into the SME category, the contribution of the SME sector to GDP could increase without entailing an improvement of the overall situation for SMEs.
It would be beneficial if the forthcoming SME database could put together ample amounts of hard, firm-level data to make it possible to track the distribution of market shares, concentration of market power, and relative competitiveness, in markets both domestic and external. It also pays to have data that allow observers to examine the linkages between firms, the evolution of their individual performances, mergers and acquisitions, and even firm closures or failures. Measuring these aspects will be helpful over the coming years to build a holistic view of SME development and the behaviour of entrepreneurs. It should likewise provide valuable insights on how the government should proceed with its interventions and programmes.
In summary, Malaysia has made significant inroads in promoting the welfare of SMEs in the country. The restoration of the central agency for entrepreneurship could enhance further the effectiveness of the SME programmes. However, there is room to improve the depth of information on firms and the utilisation of available firm-level data to make the policies more responsive. Strengthening collaborations with external stakeholders could help generate fresh policy insights. It is also relevant to keep abreast with the issues concerning informal SMEs. In addition, the policy objectives should go beyond SMEs’ contribution to national output.
References
Chacaltana, J., V. Leung and M. Lee (2018), “New technologies and the transition to formality: The trend towards e–formality”, ILO Employment Working Paper, No. 247, International Labour Organization, Geneva, https://www.ilo.org/wcmsp5/groups/public/---ed_emp/---emp_policy/documents/publication/wcms_635996.pdf.
Dahalan, D., J.L. D’Silva, I. A. Ismail and N.A. Mohamed (2018), “Entrepreneurial Mindset Among Students of Technical and Vocational Education and Training (TVET) Institutions in Malaysia”, The Journal of Social Sciences Research, Vol. 4, Issue. 11, pp. 303-311, https://doi.org/10.32861/jssr.411.303.311.
DOSM (2018), “Informal Sector Work Force Survey Report, Malaysia 2017”, DOSM Press Release, Department of Statistics Malaysia, Kuala Lumpur, https://www.dosm.gov.my/v1/index.php?r=column/pdfPrev&id=TStvalVDc3krRG5hSHByQjczd21FZz09.
Ibrahim, W.N.A., A.R. Bakar, S. Asimiran, S. Mohamed and N.S. Zakaria (2015), “Impact of Entrepreneurship Education on the Entrepreneurial Intentions of Students in Technical and Vocational Education and Training Institutions (TVET) in Malaysia”, International Education Studies, Vol. 8, No. 12, Canadian Center of Science and Education, Beaver Creek, Ontario, https://doi.org/10.5539/ies.v8n12p141.
MED (2018), National Entrepreneurship Framework: Strategic Thrusts & Objectives, Ministry of Entrepreneur Development, Kuala Lumpur, http://www.med.gov.my/portal/document/files/

3. STRUCTURAL pOLICy COUNTRy NOTES3. STRUCTURAL pOLICy COUNTRy NOTES
159ECONOMIC OUTLOOK FOR SOUTHEAST ASIA, CHINA AND INDIA 2020: RETHINKING EDUCATION FOR THE DIGITAL ERA © OECD 2019
Booklet%20NEF.pdf.
MIDA (2018), Budget 2019, MIDA E-Newsletter, October Issue, Malaysian Investment Development Authority, Kuala Lumpur, https://www.mida.gov.my/home/administrator/system_files/modules/photo/uploads/20181112172229_MIDA%20E-Newsletter%20Oct%202018%20FA.pdf.
OECD (2008), OECD Framework for the Evaluation of SME and Entrepreneurship Policies and Programmes, OECD Publishing, Paris, https://doi.org/10.1787/9789264040090-en.
SME Corporation Malaysia (2018), SME Annual Report 2017/18–A Connected World: Digitalising SMEs, SME Corporation Malaysia, Kuala Lumpur, http://www.smecorp.gov.my/index.php/en/?option=com_content&view=article&layout=edit&id=3342.
SME Corporation Malaysia (2016), SME Annual Report 2015/16–Breaking Barriers, SME Corporation Malaysia, Kuala Lumpur, http://www.smecorp.gov.my/index.php/en/sme-annual-report-2015-16.
SME Corporation Malaysia (2015), SME Annual Report 2015/16–One Business, One Community, SME Corporation Malaysia, Kuala Lumpur, http://www.smecorp.gov.my/index.php/en/resources/2015-12-21-11-07-06/sme-annual-report/book/7-annual-report-2014/2-annual-report.
World Bank (2015), Enterprise Surveys What Business Experience: Malaysia 2015 Country Profile, Washington, DC, http://documents.worldbank.org/curated/en/855771482736800396/Enterprise-surveys-Malaysia-country-profile-2015.

3. STRUCTURAL pOLICy COUNTRy NOTES
161160 ECONOMIC OUTLOOK FOR SOUTHEAST ASIA, CHINA AND INDIA 2020: RETHINKING EDUCATION FOR THE DIGITAL ERA © OECD 2019
0
0
1
2
3
4
5
6
7
8
10 000 20 000 30 000 40 000 50 000
Machinery/electrical
67%
Vegetableproducts
5%
Transportation5%
Metals5%
Mineral products4%
Others14% Machinery/electrical
40%
Mineral products15%
Transportation12%
Metals9%
Chemicals& alliedindustries
7%
Others17%
2013-17 (average) 2019 2020-24 (average)
Philippines ASEAN-10average
Emerging Asiaaverage
GDP growth rates (percentage change)
Source: IMF.
OECD average
Emerging Asia average
ASEAN-10 average
Philippines
Source: Trademap.
Composition of exports, 2018(percentage of total exports)
Source: Trademap.
Composition of imports, 2018(percentage of total imports)
Philippines
GDP per capita, 2018(PPP, current international dollar)
Source: OECD Development Centre.
Structural policy challenges discussed in previous editions of the Outlook
2014Job creation Creating more jobs for sustainable poverty reductionDisaster-risk management Building holistic disaster-risk reduction and management capacities to reduce vulnerability to natural hazardsDevelop Mindanao Improving agricultural productivity and transport infrastructure in Mindanao
2015
Competitiveness Sustaining economic growth by stepping up the country’s global competitiveness through quality employmentFinancial system Striving to put in place a responsive, development-oriented, and inclusive financial system to serve as a
platform for efficient management and the mobilisation of resourcesSocial development Further improving social development to make sure all Filipinos benefit from equal opportunities when it comes
to having a decent job, acquiring assets, and enjoying higher living standards
2016Job creation Encouraging faster job creationInfrastructure Strengthening infrastructure and the transport sectorDisaster-risk management Improving disaster-risk management
2017Infrastructure Investing in infrastructure improvementsJob creation Targeting faster growth in the services sector to create new jobsForeign direct investment (FDI)Eliminating hurdles in a bid to attract more FDI
2018 Infrastructure Optimising infrastructure financing2019 Digitalisation Coping with the risk of job automation in the offshoring and outsourcing industry
A. Medium-term economic outlook(forecast, 2020-24 average)GDP growth (percentage change): 6.2Current account balance (% of GDP): -1.9Fiscal balance (% of GDP) (central government): -2.6
B. Basic data (in 2018)Total population: 105.8 million *Population of Metro Manila (NCR): 13.5 million *Nominal GDP (US dollar): 330.8 billion **GDP per capita at PPP: 8 935.9 (current International Dollar) **Exchange rate in the first half of 2019 (period average): 52.2 (PHP/USD)
Note: * Population data are mid-year government projections based on 2015 Census.
** IMF estimate.Sources: OECD Development Centre, national sources, CEIC and IMF.

3. STRUCTURAL pOLICy COUNTRy NOTES3. STRUCTURAL pOLICy COUNTRy NOTES
161ECONOMIC OUTLOOK FOR SOUTHEAST ASIA, CHINA AND INDIA 2020: RETHINKING EDUCATION FOR THE DIGITAL ERA © OECD 2019
POLICY FOCUS
Enhancing the outcomes of a new basic education framework
Following the passage of the base legislation in 2013, the Philippines rolled out a new framework of basic education extending from kindergarten through to a twelfth grade (K-12).1 This essentially requires children to attend kindergarten before elementary school, and has added two years at the end of the programme at senior-high school. Academic, technical-vocational-livelihood, and sports and arts are the three tracks offered. Aligning the duration of basic education in the Philippines with practices in many other countries, addressing congestion in the curriculum of core courses, and increasing the likelihood that pupils will enjoy immediate employability after high school are the programme’s main objectives.
As it is, the share of the workforce that does not have a high-school diploma has declined slightly since 2012, yet it remains high, at around 40% (Figure 3.3.1). Among non-high school graduates, the share of those who are employed may have gradually risen over the same period, in line with the general decline in national unemployment rate, but the underemployment rate stays elevated. Notably, labour informality is also widespread in the Philippines.
Figure 3.3.1. Participation of non-high school graduates in the Philippine labour force, 2012-18
95
96
97
98
38
39
40
41
42
43
44
2012 2013 2014 2015 2016 2017 2018 Q3
%%
Share of non-high school graduates in labour force (LHS) Non-high school graduates employment ratio (RHS)
Note: For 2018, data are averages for the year from the fourth quarter of 2017 to the third quarter of 2018. There is a break in the series between 2016 and 2017, when the first batch of senior-high school students enrolled. In labour force surveys, job seekers with junior-high school qualifications in the old curriculum are considered high school graduates. RHS means right hand scale. LHS means left hand scale.Source: OECD Development Centre calculations based on national labour force survey data.12 https://doi.org/10.1787/888934064278
Longstanding issues continue to undermine basic education’s credibility
The aggregate and per-student budget spending of the education department rose substantially in real terms between 2015 and 2017 (Table 3.3.1).2 Meanwhile, the spending shortfall declined from 12% in 2015 to 3% in 2017 (DepEd, 2018a). Apart from the direct support it provides, the government also involves the private sector in improving the delivery of basic education. One such initiative is the Education Service Contracting Scheme, which offers subsidies as an incentive for students to transfer to private schools, thereby helping to ease congestion at public schools. Private institutions have also been active in construction of classrooms, among other forms of assistance (LaRocque, 2008; PIA, 2016).

3. STRUCTURAL pOLICy COUNTRy NOTES
163162 ECONOMIC OUTLOOK FOR SOUTHEAST ASIA, CHINA AND INDIA 2020: RETHINKING EDUCATION FOR THE DIGITAL ERA © OECD 2019
Table 3.3.1. Budget spending of the Department of EducationYear-on-year percentage change in real terms
Year Total Personnel Maintenance and operations Capital outlays Budget spending per student enrolled in public schools
2012 6.4 5.5 5.2 25.2 4.9
2013 13.7 10.0 13.3 68.5 12.9
2014 -5.6 2.3 -6.7 -81.0 -6.2
2015 12.2 8.2 21.7 165.5 11.1
2016 18.3 9.7 52.4 111.9 18.6
2017 20.1 8.0 80.4 41.3 -
Note: Nominal data refer to the actual budgetary spending of the education department taken from the Budget of Expenditures and Sources of Financing report of the budget department.Source: OECD Development Centre calculations based on DBM (various years) and PSA (2018), 2018 Philippine Statistical Yearbook.
However, resource-related issues continue to pose a challenge for state-funded education in the Philippines, even with the increase in the government’s education budget and support from the private sector. The student-to-teacher ratio remains persistently high in many schools, and especially when calculated on a subject by subject basis. Meanwhile, the supply of learning materials, classrooms, and other necessities, remains tight (Mocon-Ciriaco, 2018). The gravity of these challenges varies from school to school, typically, determined by population density if it is an urban area and remoteness if it is a rural area. The practice of double shifts had been institutionalised to cope with this limitation (DepEd, 2004 and 2008).3
In 2016, the Philippine government rolled out a senior-high school voucher programme linked to the new K-12 approach, aiming to provide financial assistance to low-income families. Yet, the acceptability of the K-12 framework among students, communities, teachers, and administrators, though improving, can still be enhanced. Local government’s participation is vital in this respect. And although it varies greatly across local governments, their declining financial share in education as a whole following World Bank (2016) necessitates reassessment.
Aside from budgetary constraints, concerns regarding the management of resources are also a persistent problem in public schools. Institutional barriers, which prevent mid-tier officials from adopting technology-based initiatives; misalignment in the timing of budget decisions, coupled with a retention of funds in division offices; narrow use of collected information; and the limited extent of decentralisation in the system limits school officials’ discretion are some of the concerns noted (Read and Atinc, 2017).4
The quality of instruction in public schools is another sticking point. For instance, the World Bank has noted that the grasp that teachers at elementary and high schools have of the subjects they teach often falls short of their own perceptions of their teaching skills (World Bank, 2016). Moreover, teachers are expected to come up with their own professional development plans, which administrators then look at in aggregate in order to organise training. However, many of the teachers have never prepared such plan, presumably due to the weight of their workload.
Improvement in resource management and programme implementation is vital
Improving the outcomes of the K+12 programme can benefit from more transparent and responsive resource management as well as from increased execution efficiency through simplification of certain procedures and actively engaging various stakeholders.
While increases in funding for basic education from the national budget are a good sign, the basic education system still needs to broaden its sources of financing. Pointing the way in this regard, initiatives such as “adopt a school” and “adopt a student” have already

3. STRUCTURAL pOLICy COUNTRy NOTES3. STRUCTURAL pOLICy COUNTRy NOTES
163ECONOMIC OUTLOOK FOR SOUTHEAST ASIA, CHINA AND INDIA 2020: RETHINKING EDUCATION FOR THE DIGITAL ERA © OECD 2019
provided valuable help to the education system, as have philanthropic contributions. These successes notwithstanding, it is crucial to strengthen the participation of the private sector in order to support the funding needs.
Human resource-management issues cannot be overlooked. For instance, redistributing teachers between schools has been raised to ensure consistent ratios of students to teachers (World Bank, 2016). Relocating teachers, however, necessitates an attractive incentive mechanism since it would often require them to move away from family members and other local ties. Concerning the work load and the leeway for teachers to upskill while continuing at their jobs, the move to reduce the amount of forms that the teachers need to fill in is an encouraging step (DepEd, 2018b). Institutional and financial support also needs to be enhanced to facilitate professional development of teachers.
As regards fund management, there is merit in regular disclosures of fund disbursements to schools from all sub national education line agencies to increase transparency and efficiency in fund utilisation. Furthermore, ground-level experience suggests that procedures for accessing and utilising educational funds require simplification in order to encourage school administrators to tap into all of the sources of funding that are available. One way to ease delays in the procurement of necessary facilities and services for schools would be to ensure close co-operation with the Commission on Audit, while also improving the education department’s capacity to plan big-ticket purchases.
Transparent and timely releases of education indicators and other information are just as crucial. Organising a team in the education department’s central office that would hasten the flow of information down to individual schools would be beneficial for budgeting, assessment, and administrative purposes. Making some school-level data from the Learner Information System database publicly available would also help to elicit constructive external insights. The government’s open government and open data initiatives provide a workable platform to disseminate information extensively, as opposed to distributing it on request.
Involvement of multiple stakeholders in the programme appraisal would be valuable
The education department’s review of the K-12 curriculum in 2018 is a welcome development. It reassures stakeholders of the government’s commitment to making sure that the curriculum is responding well to the objectives it was set up to achieve. Getting the higher education institutions and businesses involved in the review or assessment of the review would be valuable. Discussions on the manner at which the execution of new courses could be standardised could benefit from views of external stakeholders.5
Meanwhile, the education department could utilise its division and regional offices to conduct research into the execution of courses, and into teachers’ needs in terms of professional training. This can complement or even replace the current set-up in which teachers are asked to submit their own professional-development plans. This would also mean involving division and regional supervisors directly in designing in-service training programmes though the channel for feedback and evaluation has to be available to all teachers. This can be augmented by putting in place mechanisms to share information on the execution of courses, teacher-training plans, and implementation of interventions, across divisions and regions.
Efforts to narrow the gap in the quality of instruction in schools across the country need appraisal. The education department produced guidelines in 2016 to promote school-to-school collaboration, which could serve as an instrument to reduce the disparities (DepEd, 2016). However, the implementation of these guidelines has yet to gain significant traction. Even more affluent OECD countries have taken similar initiatives in order to overcome certain limitations in resources, to improve standards, and to share

3. STRUCTURAL pOLICy COUNTRy NOTES
165164 ECONOMIC OUTLOOK FOR SOUTHEAST ASIA, CHINA AND INDIA 2020: RETHINKING EDUCATION FOR THE DIGITAL ERA © OECD 2019
learning and teaching experiences (Armstrong, 2015; Atkinson et. al., 2007). Linking resource-constrained schools and specialised science high schools, for instance, can yield substantial synergy gains. Furthermore, this can be a way of broadening the reach of high-performing teachers. Extending this approach by involving institutions of higher education is also worthy of consideration.
Meanwhile, the conditional cash transfer programme has been positively associated with school enrolment of children (World Bank, 2014). The challenge now is to leverage further these programmes in order to raise completion rates and, eventually, to increase school graduates’ success in employment. Tracking K-12 graduates is crucial in this respect, but the relevant government agencies have yet to clarify how a mechanism for doing this would work. Incorporating this kind of tracking in the quarterly survey of the labour force is one potentially viable option.
The coverage of the “open high school” initiative can be similarly expanded. First implemented in 1998, this distance-learning initiative was deemed to be a viable alternative form of secondary education to reach out to students at risk of dropping out. Enrolment in this system has risen substantially since 2008 (SEAMEO INNOTECH, 2015) and its reach could be increased further. Establishing a more systematic approach to disseminate information and having a dedicated digital platform could be helpful in this respect. Through the use of online infrastructure, the open high school initiative can also serve as a supplementary learning platform for those in the formal education system.
The memorandum of understanding in 2015 between the education department and the Philippine Chamber of Commerce and Industry to tackle the skills mismatch is an encouraging signal for the future. Another encouraging sign is the commitment of the business sector to help the K-12 programme to progress. Increasing the role of local governments in promoting basic education is a crucial next step.
Notes
1. This refers to Republic Act 10533, whose legal standing was affirmed by the Supreme Court in November 2018. The programme started in school year 2011-12 and the last phase of transition to the new system was completed in school year 2017-18.
2. Around 1.4 million pupils are estimated to have enrolled in grade 11 in school year 2016-17, or 93% of those who finished grade 10, mostly going to public schools (Mateo, 2018).
3. The Department of Education also required additional justification to process the requests for classroom construction if the school has not yet adopted the policy and directed future calculation of classroom adequacy based on the notion of double-shifts.
4. The management of basic education in the Philippines had been gradually decentralised over the years. The legal basis is provided by the 2001 Governance of Basic Education Act.
5. Employers appear cautious to take on K-12 graduates (Jobstreet.com, 2018). The Philippine Chamber of Commerce and Industry has likewise expressed scepticism regarding the adequacy of the 80-hour job immersion component of the K-12 programme (Aguinaldo, 2018). The hiring prospects of K-12 graduates have to be taken in light of the large pool of job seekers with tertiary education. In 2018, 21% of unemployed workers had higher-education degrees, with another 15.9% having studied part of the way towards such a degree.
References
Aguinaldo, C. (2018), “Business groups take stand to open jobs to K-to-12 graduates”, BusinessWorld, 21 April, Manila, https://www.bworldonline.com/business-groups-take-stand-to-open-jobs-to-k-to-12-graduates/.
Armstrong, P. (2015), Effective School Partnerships and Collaboration for School Improvement: A Review of the Evidence, United Kingdom Department of Education, Manchester, https://assets.publishing.service.gov.uk/government/uploads/system/uploads/attachment_data/file/467855/DFE-RR466_-_School_improvement_effective_school_partnerships.pdf.

3. STRUCTURAL pOLICy COUNTRy NOTES3. STRUCTURAL pOLICy COUNTRy NOTES
165ECONOMIC OUTLOOK FOR SOUTHEAST ASIA, CHINA AND INDIA 2020: RETHINKING EDUCATION FOR THE DIGITAL ERA © OECD 2019
Atkinson, M., I. Springate, F. Johnson and K. Halsey (2007), Inter-school Collaboration: A Literature Review”, NFER, Slough, https://www.nfer.ac.uk/media/1616/atp01.pdf.
DBM (various years), Budget of Expenditures and Sources of Financing Fiscal Years 2014-2019, Department of Budget and Management-Philippines, Manila, https://www.dbm.gov.ph/index.php/dbm-publications/budget-of-expenditures-and-sources-of-financing-besf.
DepEd (2018a), DepEd Reports Increased Budget Utilization, Closes Gap of Underspending in Education, Department of Education, Manila, http://www.deped.gov.ph/2018/07/12/deped-reports-increased-budget-utilization-closes-gap-of-underspending-in-education/.
DepEd (2018b), Statement on DepEd’s Review of Teachers’ Workload, Department of Education, Manila, http://www.deped.gov.ph/2018/09/04/statement-on-depeds-review-of-teachers-workload/
DepEd (2016), Guidelines on the School-to-School Partnerships for Fiscal Year 2016, Department of Education, Manila, http://www.deped.gov.ph/2016/06/23/do-44-s-2016-guidelines-on-the-school-to-school-partnerships-for-fiscal-year-2016/.
DepEd (2008), Reiterating the Policy on Double Shifting of Classes and Requiring Strict Compliance Thereto, Department of Education, Manila, http://www.deped.gov.ph/2008/07/07/do-54-s-2008-reiterating-the-policy-on-double-shifting-of-classes-and-requiring-strict-compliance-thereto/.
DepEd (2004), Adoption of Double Shift Policy in Public School to Address Classroom Shortage, Department of Education, Manila, http://www.deped.gov.ph/2004/12/13/do-62-s-2004-adoption-of-double-shift-policy-in-public-school-to-address-classroom-shortage/.
Jobstreet.com (2018), “Fresh graduate hiring shows shifts in demand and preferences”, Jobstreet.com, 27 April, Manila, https://www.jobstreet.com.ph/career-resources/fresh-graduate-hiring-shows-shifts-demand-preferences#.XBOqa2j0mUk.
LaRocque, N. (2008), Public-Private Partnerships in Basic Education: An International Review, CfBT Education Trust, Reading, UK, https://olc.worldbank.org/sites/default/files/CfBT_LaRocque_PPPs%20in%20Basic%20Education%20An%20International%20Review_0.pdf.
Mateo, J. (2018), “Senior high school results exceeded expectations–DepEd shares”, The Philippine Star, 11 May, Manila, https://www.philstar.com/headlines/2018/05/11/1814173/senior-high-school-results-exceeded-expectations-deped.
Mocon-Ciriaco, C. (2018), “Classroom, teacher shortages hound schools, but DepEd says they’re but ‘challenges’”, BusinessMirror, 4 June, Manila, https://businessmirror.com.ph/classroom-teacher-shortages-hound-schools-but-deped-says-theyre-but-challenges/.
PIA (2016), “DepEd boosts innovative strategies to achieve universal basic education”, Philippine Information Agency, 29 September, Manila, https://ppp.gov.ph/in_the_news/deped-boosts-innovative-strategies-to-achieve-universal-basic-education/.
PSA (2018), 2018 Philippine Statistical Yearbook, Philippine Statistics Authority, Manila, https://psa.gov.ph/products-and-services/publications/philippine-statistical-yearbook.
Read, L. and T.M. Atinc (2017), “Investigations into Using Data to Improve Learning: Philippines Case Study”, Global Development and Economy, The Brookings Institution, Massachusetts.
SEAMEO INNOTECH (2015), Evaluation of the Open High School Program in the Philippines, Southeast Asian Ministers of Education Organization-Regional Center for Educational Innovation and Technology, Quezon City, https://www.seameo-innotech.org/wp-content/uploads/2017/07/OHSP_2015_Dec_compressed.pdf.
World Bank (2016), Assessing Basic Education Service Delivery in the Philippines: The Philippines Public Education Expenditure Tracking and Quantitative Service Delivery Study, World Bank, Washington, DC, http://documents.worldbank.org/curated/en/507531468325807323/pdf/AUS6799-REVISED-PH-PETS-QSDS-Final-Report.pdf.
World Bank (2014), Philippines Conditional Cash Transfer Program Impact Evaluation 2012 (Report Number 75533-PH), World Bank, Manila, https://openknowledge.worldbank.org/bitstream/handle/10986/13244/755330REVISED000Revised0June0402014.pdf?sequence=8&isAllowed=y.

3. STRUCTURAL pOLICy COUNTRy NOTES
167166 ECONOMIC OUTLOOK FOR SOUTHEAST ASIA, CHINA AND INDIA 2020: RETHINKING EDUCATION FOR THE DIGITAL ERA © OECD 2019
Thailand
0 10 000 20 000 30 000 40 000 50 000
Machinery/electrical
35%
Transportation15%
Plastics/rubber14%
Chemicals & alliedindustries
6%
Vegetableproducts
6%
Others24% Machinery/
electrical33%
Mineral products19%
Metals14%
Chemicals & alliedindustries
9%
Transportation6%
Others19%
Source: IMF.
OECD average
Emerging Asia average
ASEAN-10 average
Thailand
Source: Trademap. Source: Trademap.
Composition of exports, 2018(percentage of total exports)
Composition of imports, 2018(percentage of total imports)
GDP growth rates (percentage change)
GDP per capita, 2018(PPP, current international dollar)
Source: OECD Development Centre.
0
1
2
3
4
5
6
7
8 2013-17 (average) 2019 2020-24 (average)
Thailand ASEAN-10average
Emerging Asiaaverage
Structural policy challenges discussed in previous editions of the Outlook
2014
Education Upgrade human capital by improving the national curriculum and teaching standards
Agriculture Improve agricultural productivity through modernisation and education
Green growth Improve institutional co-ordination to achieve green growth
2015
Productivity Accelerate improvements in productivity to ensure sustainable economic growth and enhance competitiveness
Environment Make further efforts in environmental management in order to support green growth
Governance Improve good governance – with particular emphasis on corruption and transparency – to reduce obstacles to growth
2016Macroeconomic performance Use macroeconomic policies to revive growth
Tourism Strengthen sustainable tourism
2017Digital economy Develop the digital economy as a new engine of growth
Human capital Develop human capital through education to make the most of the country’s economic potential
2018 Digital economy Strengthening information and communications technology (ICT) skills to develop the digital economy
2019 Eastern Economic Corridor Foster human capital development for Eastern Economic Corridor
A. Medium-term economic outlook(forecast, 2020-24 average)GDP growth (percentage change): 3.2Current account balance (% of GDP): 6.6Fiscal balance (% of GDP) (central government): -2.8
B. Basic data (in 2018)Total population: 66.4 million *Population of Bangkok: 5.7 million *Nominal GDP (US dollar): 487.2 billion **GDP per capita at PPP: 19 476.5 (current International Dollar) **Exchange rate in the first half of 2019 (period average): 31.6 (THB/USD)
Note: * Population data are year-end government estimates.
** IMF estimate.Sources: OECD Development Centre, national sources, CEIC and IMF.
3. STRUCTURAL pOLICy COUNTRy NOTES3. STRUCTURAL pOLICy COUNTRy NOTES
167ECONOMIC OUTLOOK FOR SOUTHEAST ASIA, CHINA AND INDIA 2020: RETHINKING EDUCATION FOR THE DIGITAL ERA © OECD 2019
POLICY FOCUS
Improving the social safety net to help elderly people
Changes in Thailand’s demographic trends – including a decline in its overall rates of fertility, births, and deaths – have resulted in an ageing population. Indeed, a recent projection predicted that the proportion of elderly people aged 60 and over will increase from 14.9% in 2016 to 19.1% in 2020, and will go on to rise to 32.1% in 2040 (NSO, 2017), while the median age of Thai population is 38.1 years as of 2018 (BOI, n.d.). Under its second national plan for the elderly, which runs from 2002-21, the government’s overall aim has been to promote and develop older people as valuable assets to society, and to ensure their well-being. The plan has set out a range of strategies to improve the life of the nation’s elderly citizens, including a special focus on encouraging people to prepare in advance to make sure they thrive as they grow older. This objective encompasses themes such as income security and education and lifelong learning. It also seeks to promote a social conscience towards the elderly, and respect for them as senior citizens.
Thailand’s government believes that developing and improving this social sentiment of understanding and respect towards the elderly can provide a boost to senior citizens’ physical and mental health. One example of the initiatives the government has taken in this regard is a volunteering programme for home caregivers (DOP, 2016). It involves people of all ages, in line with the government’s aim of strengthening the relationships between different generations. Moreover, the programme targets family and community members who have previously neglected or given insufficient care to the elderly. This programme operates against a backdrop in which smaller family sizes and an increase in migration among younger adults have contributed to a sharp increase in long-term care needs, particularly for very elderly people. This is especially true considering that family – in particular daughters and wives – represents the most important provider of personal-care assistance in Thai society. In addition, despite the programme’s efforts to shore up traditions of respect and care for the elderly, the perceived value to society of the elderly has been on the decline among teenagers. According to the 2011 Survey on Social and Cultural Conditions, teenagers view the elderly as old fashioned, difficult to understand, hard to please, and boring (Sasiwongsaroj and Burasit, 2019).
One way to address this challenge could be to encourage elderly’s participation in various social activities, helping them to enjoy access to lifelong learning and to prepare for better, more active ageing. A programme called “School for the Elderly”, along with other community-based learning centres, provides a platform for elderly people to share and transfer knowledge between themselves. However, learning in these contexts tends to focus mainly on health-related topics, despite there being demand for other subjects such as how to use the Internet and other information and computer technology (ICT) tools. Although the Internet has become the main channel for disseminating the kinds of information that older people are interested in – on topics such as news, events, and welfare benefits – the proportion of elderly people in Thailand who get these kinds of information from the Internet and social media remains low, at just 4% (TGRI and IPSR, 2019). Considering the likelihood that ICT will play an even more central role as time goes by, lifelong learning and education programmes for the elderly may need to adjust to the skills that technology will increasingly demand. Indeed, this presents an opportunity to improve the social integration of the elderly and to help people to extend their working lives.
In terms of income security, Thailand’s government has put in place a variety of reforms to help prevent old people falling into poverty. These efforts date back notably to 1993, when Thailand introduced its old-age allowance system (DOP, 2016). Since then,
3. STRUCTURAL pOLICy COUNTRy NOTES
169168 ECONOMIC OUTLOOK FOR SOUTHEAST ASIA, CHINA AND INDIA 2020: RETHINKING EDUCATION FOR THE DIGITAL ERA © OECD 2019
elderly people have received a monthly allowance from the government. The government pays this allowance to people over 60 years of age who were not engaged in the formal sector employment, and who do not live in a public residential facility for the elderly. The system used to be a targeted pension scheme, making use of a selection process to identify recipients. Several qualifying conditions were taken into consideration, such as the lack of an income, having no relatives able to provide support, or being abandoned (DOP, 2016). However, this tax-financed and non-contributory programme changed in 2009 into a universal pension scheme, providing income for all old people who are not covered by any other form of social protection, and especially for those who worked in the informal economy. The government also provides other social protection schemes in the form of contributory programmes, both compulsory and voluntary, which aim to ensure income security after the age of retirement.
More and more of Thailand’s senior citizens depend on the government’s old-age allowance
According to surveys of elderly people in Thailand, their three main sources of income are family transfers – notably from their children – as well as work and the old-age allowance. Indeed, a survey in 2017 showed that 40.7% of Thailand’s older people reported family transfers as their main source of income. In the same survey, 31% reported work as their main source of income, with 20% stating that it was the government’s old-age living allowance (Figure 3.4.1). Over time, however, the number of elderly people relying on family transfers and work has gradually fallen, while the number who rely on the government’s elderly allowance has been on the rise. Indeed, by 2017 it was already 1.5 times the level of 2009 (TGRI and IPSR, 2019). Over the same period, the size of the monthly old-age allowance has gradually increased. From the initial amount of 200 Baht per month given in 1993, it rose to 500 Baht per month in 2007 and since 2012 it has increased with the recipient’s age (DOP, 2016). People aged 60-69 now receive 600 Thai baht (THB), rising to THB 700 for those aged 70-79, THB 800 for people of 80-89 years, and THB 1000 for people who are 90 years old and over.
Figure 3.4.1. The main sources of income for elderly people in Thailand, 2007 and 2017
60.9
29.0
2.8 4.4 2.90.0
40.7
31.0
20.0
5.82.3 0.1
0
10
20
30
40
50
60
70
Family transfers Work Government livingallowance
Pension Saving Social security fund
%
2007 2017
Note: Family transfers include transfers from a spouse, a child, a parent, and a brother, sister, or other relative. Saving includes both interest and assets. Source: NSO (2018), Report on the 2017 Survey of the Older Persons in Thailand; NSO (2007), Report on the 2007 survey of the older persons in Thailand.12 https://doi.org/10.1787/888934064297

3. STRUCTURAL pOLICy COUNTRy NOTES3. STRUCTURAL pOLICy COUNTRy NOTES
169ECONOMIC OUTLOOK FOR SOUTHEAST ASIA, CHINA AND INDIA 2020: RETHINKING EDUCATION FOR THE DIGITAL ERA © OECD 2019
Yet despite the increase in the government’s budget for old-age allowances, the monthly amount paid to the elderly remains below the official poverty line. According to the National Economic and Social Development Council, the poverty line in 2013 – which refers to the minimum monthly cost of food and other basic needs – was THB 2 572 baht per month (TGRI and IPSR, 2016). By this yardstick, one third of Thailand’s elderly people are living below the poverty line (TGRI and IPSR, 2016). Against this backdrop, the inadequate size of public benefits may help to explain why family transfers still represent the main source of income for the majority of Thailand’s elderly people. By way of comparison, in OECD countries it is public transfers that account for the biggest share of elderly people’s incomes, accounting on average for 58% (Figure 3.4.2). Considering the pace at which Thailand’s population is ageing, the current reliance on family transfers for older people to maintain a decent life could come under strain. Against this backdrop, the government may need to increase its capacity to provide them with income security, especially when it comes to particularly vulnerable elderly people.
Figure 3.4.2. Average sources of income for older people for OECD countries, 2014 or latest available year
58.0
23.6
10.1 8.3
0
10
20
30
40
50
60
70
Public transfers Work Capital Occupational transfers
%
Note: Income from work includes both earnings (employment income) and income from self-employment. Capital income includes private pensions as well as income from the returns on non-pension savings.Source: OECD (2017), Pensions at a Glance 2017: OECD and G20 Indicators, http://dx.doi.org/10.1787/pension_glance-2017-en. 12 https://doi.org/10.1787/888934064316
Encouraging people to save helps them to lay the foundations for a better retirement
The challenge that Thailand’s government faces in ensuring an adequate safety net for retirement also extends to the country’s other types of public pensions, such as its provision of old-age insurance as part of its social security fund scheme. People who had contributed to this insurance scheme began receiving old-age pensions in 2014. Since then, however, Thailand’s social security office has taken stock of the increasing burden of liabilities that it faces due to the rapidly changing population structure, underscoring the need to ensure the ongoing stability and viability of the fund.
Aside from the desirability of increasing the government’s budget allocation for the elderly, and from the challenge it faces in managing its social security fund, a low propensity to save for retirement may also increase the financial burden that the government will have to bear. Indeed, only a small minority of older people – around 2.3% – listed savings as their main source of income in 2017 (Figure 3.4.1). According to

3. STRUCTURAL pOLICy COUNTRy NOTES
171170 ECONOMIC OUTLOOK FOR SOUTHEAST ASIA, CHINA AND INDIA 2020: RETHINKING EDUCATION FOR THE DIGITAL ERA © OECD 2019
the rules of the Thai system, formal workers have to be part of the compulsory pension scheme, but they are then free to choose whether or not to participate in the voluntary component that complements it. However, the number of participants in voluntary schemes remains relatively modest. For example, the provident fund – a voluntary pension scheme established mutually by employers and employees in 1987 – covers only 2.8 million employees in 2015 (DOP, 2016).
More can be done to boost saving among formal workers. One successful voluntary scheme to encourage saving for retirement is New Zealand’s KiwiSaver (Box 3.4.1). This scheme’s features include automatic enrolment, a “default” mechanism, and matching contributions, and these have helped it to reach a significant number of participants since its introduction in 2007. A recent report on KiwiSaver revealed that, as of 2018, 2.8 million individuals were enrolled in the scheme (FMA, 2018). Effective communication and education campaigns during the programme’s launch also contributed to its success. The scheme has also proven its ability to reach all income groups equally, meaning that no-one is left out (OECD, 2018a).
Box 3.4.1. KiwiSaver’s strategies for boosting people’s propensity to save
As a voluntary scheme, KiwiSaver offers various enrolment methods. One of these is automatic enrolment, under which new employees are automatically enrolled on their employer’s chosen scheme – or to a “default scheme” in case the employer’s chosen scheme is not available. Once they have enrolled, contributors’ savings will be locked in until they reach the age of 65. Within the default scheme, one of the nine government-appointed default providers is selected to manage the employee’s savings contributions. Different contribution rates are available at 3%, 4%, 6%, 8% or 10% of earnings, and members can easily change their contribution rate once every three months. Those who are enrolled to the default scheme make their contributions at a default rate of 3%.
The scheme’s default mechanism has simplified the choices that new employees have to make. According to a survey, KiwiSaver members reported that their main reason for joining the scheme was that it offered an easy way to save. By taking contributions from employees’ pay at source, it helps to minimise the effort required to contribute to the scheme. Moreover, in 2013, those who contributed at the 3% default contribution rate represented 58% of the members whose payment was deducted at source, meanwhile the 4% default contribution rate set in 2008 was reported to discourage people from joining the scheme (Inland Revenue, 2015). This shows that the default mechanism, in particular the one with appropriate level of default contribution rate plays an important role.
Another factor that has contributed to the success of KiwiSaver’s implementation has been the targeted communications campaign it has run. The launch campaign consisted of advertising on television, radio, online, and also in print materials such as a guide for employers and an information pack for employees. There have also been events such as seminars and trade-show presentations for employers and other professionals (OECD, 2014). The campaign has increased the level of awareness among employers, and has helped employees to make the necessary decisions. According to the survey, 81% of employers who were interviewed reported that the campaign material was straightforward and easy to understand (Inland Revenue, 2015). Among the members who responded to the survey, meanwhile, 80% reported that they had enough information to help them decide whether or not to join the scheme.

3. STRUCTURAL pOLICy COUNTRy NOTES3. STRUCTURAL pOLICy COUNTRy NOTES
171ECONOMIC OUTLOOK FOR SOUTHEAST ASIA, CHINA AND INDIA 2020: RETHINKING EDUCATION FOR THE DIGITAL ERA © OECD 2019
The conundrum of encouraging more low-income workers to save
Despite the benefits that the KiwiSaver scheme offers, and the possibility of taking breaks from paying in or of making an early withdrawal for reasons such as buying a first home, moving overseas permanently, encountering significant financial hardship, or suffering serious illness, a lower level of engagement with KiwiSaver could still be observed and it is associated with lower annual income (Inland Revenue, 2015). Affordability represents the main reason that people give for opting out of the scheme. This has underscored the conundrum of how to encourage low-income workers to start saving more. One potential answer to this problem is for the government to offer fixed nominal subsidies as an incentive for low-income earners to participate in retirement saving plans. For instance, Germany’s so-called Riester pensions offer basic nominal subsidies of 175 euros per year to individuals who contribute at least 4% of their income into the scheme (OECD, 2018b). A study of Germany’s Riester pensions have shown that the participation rates among low-income households are higher than for other types of private pension plans (Börsch-Supan, Coppola and Reil-Held, 2012).
In Thailand’s case, while formal workers have access both to the compulsory and voluntary pension schemes, most informal workers do not have any social protection for their retirement. Informal workers with social security represent only a small minority, of 10.9% (NESDC, 2018). Indeed, their low level of protection from a social-security safety net puts them at greater risk of economic and health-care insecurity. Given that Thailand’s informal workers outnumber those in the formal sector (Buddhari and Rugpenthum, 2019), the government provides retirement savings programme. One such initiative on the part of Thailand’s government has been the National Savings Fund, which began operating in 2015, and aims to encourage regular saving among working-age Thais (15-59 years old). This programme specifically targets informal workers who are not covered by any social security or any pension scheme, encouraging them to make monthly contributions, and helping them to make sure that they will enjoy income security in retirement.
After several years in operation, however, the fund’s total membership extends to just 580 000 people, which is relatively low compared to the total number of self-employed workers in Thailand (NNT, 2018). One way to increase the participation rate, especially among low-income workers, would be to offer saving incentives such as the fixed nominal subsidies mentioned above. Moreover, accompanying this measure with targeted campaigns of communication and education in order to increase people’s awareness of the importance of saving for retirement might also increase the participation rate. In addition, the co-existence of multiple schemes for informal workers makes it necessary to provide clear information on each scheme, so that future contributors can make well-informed decision. An easier procedure for workers to register – including by being more flexible about the documents they must provide – could also help boost participation. In order to improve access – including among the rural poor and commonly stigmatised groups – other helpful measures could include giving people the opportunity to register and claim in different localities, and developing a system of online registration. Mexico, for instance, has launched an application system in which people can open pensions and savings accounts online. Indeed, Mexico has also sought to make it easier to save by building a network of 7 000 convenience stores where people can make voluntary savings deposits. These practices have resulted in an average annual increase of 33% in voluntary savings balances since 2014 (OECD, 2018b).

3. STRUCTURAL pOLICy COUNTRy NOTES
173172 ECONOMIC OUTLOOK FOR SOUTHEAST ASIA, CHINA AND INDIA 2020: RETHINKING EDUCATION FOR THE DIGITAL ERA © OECD 2019
References
BOI (n.d.), “Thailand in Brief” Thailand Board of Investment, Bangkok, https://www.boi.go.th/index.php?page=demographic.
Börsch-Supan, A., M. Coppola and A. Reil-Held (2012), “Riester pensions in Germany: Design, dynamics, targetting success and crowding-in”, NBER Working Paper Series, No. 18014, National Bureau of Economic Research, http://www.nber.org/papers/w18014.
Buddhari, A. and P. Rugpenthum (2019), “A Better Understanding of Thailand’s Informal Sector”, Focused and Quick (FAQ), Issue 156, Bank of Thailand, Bangkok, https://www.bot.or.th/Thai/MonetaryPolicy/ArticleAndResearch/FAQ/FAQ_156.pdf.
DOP (2016), Thailand’s Implementation of the Madrid International Plan of Action in Ageing (MIPAA) 2002-16, The Department for Older Persons, The Ministry of Social Development and Human Security, Bangkok, http://www.dop.go.th/download/laws/law_th_20161107085250_1.pdf.
FMA (2018), KiwiSaver Annual Report, Financial Markets Authority, Wellington, https://www.fma.govt.nz/assets/Reports/KiwiSaver-Report-2018.pdf.
Inland Revenue (2015), KiwiSaver evaluation: Final summary report, New Zealand Inland Revenue, Wellington, https://www.classic.ird.govt.nz/resources/3/8/38e71a99-51cd-4971-abb7-87ee68497b23/ks-evaluation-final-summary-report.pdf.
NESDC (2018), Thailand’s Social Situation and Outlook in Q4/2018 and Overview in 2018, Office of the National Economic and Social Development Council (NESDC), Bangkok, https://www.nesdb.go.th/nesdb_en/download/Social%20Press_Eng.pdf.
NNT (2018), “National Savings Fund launches savings program for civil servants”, National News Bureau of Thailand, Bangkok, http://thainews.prd.go.th/th/news/detail/WNSOC6109110010063.
NSO (2018), Report on the 2017 Survey of the Older Persons in Thailand, National Statistical Office, http://www.nso.go.th/sites/2014en/Survey/social/domographic/OlderPersons/2017/Full%20Report_080618.pdf.
NSO (2017), Social Indicators 2017, National Statistical Office/Ministry of Digital Economy and Society, Bangkok, http://service.nso.go.th/nso/nsopublish/pubs/e-book/Indicators_Social_2560/files/assets/common/downloads/publication.pdf.
NSO (2007), “Report on the 2007 survey of the older persons in Thailand”, National Statistical Office, http://web.nso.go.th/en/survey/age/tables_older_50.pdf.
OECD (2018a), Financial Incentives and Retirement Savings, OECD Publishing, Paris, https://doi.org/10.1787/9789264306929-en.
OECD (2018b), OECD Pensions Outlook 2018, OECD Publishing, Paris, https://doi.org/10.1787/pens_outlook-2018-en.
OECD (2017), Pensions at a Glance 2017: OECD and G20 Indicators, OECD Publishing, Paris, http://dx.doi.org/10.1787/pension_glance-2017-en.
OECD (2014), OECD Pensions Outlook 2014, OECD Publishing, Paris, http://dx.doi.org/10.1787/9789264222687-en.
Sasiwongsaroj, K. and Y. Burasit, (2019), Managing Thailand’s Ageing Population, ISEAS – Yusof Ishak Institute, Singapore, https://www.iseas.edu.sg/images/pdf/ISEAS_Perspective_2019_32.pdf.
TGRI and IPSR (2019), Situation of the Thai Elderly 2017, Foundation of Thai Gerontology Research and Development Institute (TGRI) and Institute for Population and Social Research (IPSR), Bangkok, http://www.dop.go.th/download/knowledge/th1552463947-147_1.pdf.
TGRI and IPSR (2016), Situation of the Thai Elderly 2014, Foundation of Thai Gerontology Research and Development Institute and Institute for Population and Social Research, Bangkok, http://www.dop.go.th/download/knowledge/knowledge_th_20161608145327_1.pdf.

3. STRUCTURAL pOLICy COUNTRy NOTES3. STRUCTURAL pOLICy COUNTRy NOTES
173ECONOMIC OUTLOOK FOR SOUTHEAST ASIA, CHINA AND INDIA 2020: RETHINKING EDUCATION FOR THE DIGITAL ERA © OECD 2019
0 10 000 20 000 30 000 40 000 50 000
Machinery/electrical
48%
Textiles14%
Vegetable products4%
Metals4%
Plastics/rubber3%
Others27% Machinery/
electrical42%
Textiles13%
Metals10%
Chemicals & alliedindustries
7%
Plastics/rubber7%
Others21%
Source: OECD Development Centre.
Source: IMF.
OECD average
Emerging Asia average
ASEAN-10 average
Viet Nam
Source: Trademap. Source: Trademap.
Composition of exports, 2018(percentage of total exports)
Composition of imports, 2018(percentage of total imports)
Viet NamGDP growth rates (percentage change)
GDP per capita, 2018(PPP, current international dollar)
0
1
2
3
4
5
6
7
8 2013-17 (average) 2019 2020-24 (average)
Viet Nam ASEAN-10average
Emerging Asiaaverage
Structural policy challenges discussed in previous editions of the Outlook
2014
Skilled labour Increasing access to education, and strengthening Technical and Vocational Education and Training (TVET), to improve the quality of human capital
Private sector development Making it easier to access to credit, and lowering transport costs to develop the private sector
Financial sector development Restructuring the financial system to enhance the effectiveness of monetary policy
2015Policy stability Maintaining stability in key economic and social-policy areas in order to be able to implement socio-
economic strategies for the countrySkilled labour Fulfilling the as-yet-incomplete implementation of measures to develop high-tech industries and skills training
2016Infrastructure Improving infrastructure to support growthState-owned enterprises (SOEs) Reforming and restructuring SOEsSkilled labour Promoting both job creation and productivity growth
2017Skilled labour Training a skilled workforce to work in high-tech manufacturingInfrastructure Building hard and soft infrastructure to allow the country to participate as fully as possible in promising
new technologies and industries2018 State-owned enterprises (SOEs) Building momentum towards greater privatisation of state-owned enterprises (SOEs)2019 Education and training Improving access to secondary education as a driver for social equality and social mobility
A. Medium-term economic outlook(forecast, 2020-24 average)GDP growth (percentage change): 6.5Current account balance (% of GDP): 1.5Fiscal balance (% of GDP) (central government): -4.1
B. Basic data (in 2018)Total population: 94.7 million *Population of Hanoi: 7.5 million *Nominal GDP (US dollar): 241.3 billion **GDP per capita at PPP: 7 510.5 (current International Dollar) **Exchange rate in the first half of 2019 (period average): 22 970.2 (VND/USD)
Note: * Population data are year-end government estimates.
** IMF estimate.Sources: OECD Development Centre, national sources, CEIC and IMF.

3. STRUCTURAL pOLICy COUNTRy NOTES
175174 ECONOMIC OUTLOOK FOR SOUTHEAST ASIA, CHINA AND INDIA 2020: RETHINKING EDUCATION FOR THE DIGITAL ERA © OECD 2019
POLICY FOCUS
Developing the digital economy to enhance trade
While Viet Nam’s government has paid special attention to the application of digital technology – both for economic development in general, and for trade in particular – the regulations and policies that relate to digital trade have come into force largely over the past 15 years, as laws, decrees, directives, and circulars. Aside from legislative instruments of this kind, Viet Nam has also integrated its efforts to boost digital trade into its national development strategies, plans, and programmes.
Fostering a favourable environment for innovation and the digital eco-system through a wide range of legislation
As of 2005, a few laws began to craft a regulatory framework for digital trade, addressing commercial questions, electronic transactions, and intellectual property. Then, over the five years that followed, more detailed guidelines for these laws appeared, providing basic regulations covering electronic transactions, ICT applications, and both the development of these activities and the provision of safeguards. From 2011-15, the government issued a range of regulations on e-commerce. These defined businesses’ obligations, prohibited certain activities, and set out regulations for e-commerce websites. They also sought to strengthen the management role of state agencies, in areas such as internet provision, online information, and the inspection of e-commerce operations. More recently, the government demonstrated its determination to keep on developing e-commerce by approving an over-arching plan for the development of e-commerce in 2016-20.
In 2016, Viet Nam’s policies to foster a more propitious environment for innovation and to improve the digital eco-system expanded from an exclusive focus on e-commerce to integrate fully with Viet Nam’s overall vision for harnessing the so-called fourth Industrial revolution. From 2016-19, the government’s policies for fostering the kind of creative, innovative environment that can boost digital trade focused on encouraging research and development (R&D), and promoting eco-systems of entrepreneurship, innovation and creativity, as well as other digital initiatives.
Meanwhile, the government has developed a number of policies to encourage investment capital to flow into R&D, while also establishing agencies to support firms in their innovative endeavours. Thanks, for example, to Decree No. 95/2014/ND-CP, state-owned enterprises now have to invest 3-10% of their revenue into R&D. A number of new agencies for start-ups and innovation have been established, such as the National Foundation for Technology Innovation, the Hoa Lac High-tech Service Centre, the National Innovation Centre, and the National Start-up Centre. In 2017, the government formulated the Directive No. 16/CT-TTg for strengthening progress towards the 4th Industrial Revolution which focuses on the establishment and development of the digital economy and the smart industry. They are considered as key tasks in restructuring the economy as well as shifting the growth model towards improved productivity, quality, efficiency and competitiveness.
Initiatives have also been taken to improve government management capacity. In 2018, for instance, the government set up the e-Government Committee to study and propose policies to create a legal environment that will speed up the digitalisation process and the roll-out of e-government (Hinrich Foundation, CIEM and Alphabeta, 2019). However, despite the efforts, investment in science and technology remains relatively low, accounting for about 0.8% of the total state budget in 2017.
To further improve digital eco-system, some challenges will still need to be addressed. Raising awareness of digital trade among citizens, businesses, and regulatory authorities

3. STRUCTURAL pOLICy COUNTRy NOTES3. STRUCTURAL pOLICy COUNTRy NOTES
175ECONOMIC OUTLOOK FOR SOUTHEAST ASIA, CHINA AND INDIA 2020: RETHINKING EDUCATION FOR THE DIGITAL ERA © OECD 2019
is crucial. Regulatory authorities should develop direct regulations on digital trade rather than scattering the regulatory framework across various policies, while at the same time enhancing the enforcement of existing regulations that relate to digital trade. The country also needs to find ways to reduce barriers to its companies’ digital exports, promote cashless payments, accelerate ICT infrastructure development, and become more effective at training a skilled labour force in e-commerce and ICT. E-commerce enterprises in general, and trading platforms in particular, also need to win more trust from customers. Reducing the cost of logistics is also a must for digital trade in Viet Nam to become more competitive.
Unlocking the significant benefits that digital trade can bring to Viet Nam
There is broad consensus that digital trade can bring significant benefits to Viet Nam’s economy. These include the ways in which digital trade can allow its companies to open up new markets for their products and services. Moreover, digital data can help enterprises to gain a better understanding of their markets and customers. Indeed, digital trade can allow Viet Nam’s companies to unlock cost savings, to intensify their co-operation with other enterprises and partners, to participate in global supply chains, and to manage the performance of their supply chains around the world. Examples of this include using blockchain technology to check and monitor the delivery of goods, or making use of online banking services to transfer and receive payments for goods and services from anywhere in the world.
Broadly speaking, the benefits that digital trade can bring to Viet Nam’s economy fall into two categories: domestic trade and digital exports. In the first category, it is estimated that digital trade contributes VND 81 trillion a year to Viet Nam’s economy, or around USD 3.5 billion in 2017. This equates to 1.7% of the country’s gross domestic product (GDP), a similar percentage to that in other countries in the region, such as Malaysia and the Philippines. However, compared to more developed economies in the Asia-Pacific region, such as Australia’s rate of 3%, this figure is still modest.
With regard to the benefits that digital trade can bring to the export economy, it is worthy of note that digital exports already account for 2% of the total value of Viet Nam’s exports. Indeed, the total value of tangible and intangible exports supported by digital technology is estimated to be around VND 97 trillion (USD 4.3 billion). Within this, the value of digitally-enabled products is estimated at around VND 52 trillion, while digitally-enabled services account for around VND 11 trillion and indirect digital services make up VND 34 trillion. Moreover, if there were no barriers to digital trade, it is estimated that Viet Nam’s digital exports would rise to USD 28.7 billion by 2030 (Hinrich Foundation, CIEM and Alphabeta, 2019). One case study of how digital trade can help exporters comes from Topica, an educational technology company based in Ha Noi that provides online learning services and promotes its business over the Internet. Topica has grown strongly, and not just in Viet Nam but also in countries like Thailand, Singapore and the Philippines.
In order to promote export-oriented digital business still further, it will be necessary to eliminate barriers affecting the competitiveness of Viet Nam’s digital exports (Hinrich Foundation, CIEM and Alphabeta, 2019).
Accelerating the ongoing development of digital payments in Viet Nam
Viet Nam has been promoting electronic payments since 2008, and the country is experiencing a boom in this area. In addition to payment forms with already longstanding popularity, such as Visa and MasterCard, there are new forms of digital payments. These include mobile point of sale, or mPOS, Internet banking, mobile web payments, and quick response (QR) codes. Moreover, Vietnamese payment intermediaries such as MoMo,

3. STRUCTURAL pOLICy COUNTRy NOTES
177176 ECONOMIC OUTLOOK FOR SOUTHEAST ASIA, CHINA AND INDIA 2020: RETHINKING EDUCATION FOR THE DIGITAL ERA © OECD 2019
OnePay and VNPay have emerged, facilitating cashless applications. Indeed, Viet Nam has about 150 financial technology, or fintech companies (Bizhub, 2019). These fintech companies are co-operating with banks to facilitate payments. Moreover, Viet Nam has worked with the World Economic Forum (WEF) on Digital Trade project, focusing on mobile money to develop policies facilitating financial transactions through mobile phone. This diversity has created a dynamic environment for cashless payments.
Still, only 30% of Viet Nam’s adult population had a bank account in 2017, which is much lower than in some other Asian countries (Table 3.5.1). In advanced countries like Japan, Singapore and South Korea, for example, over 90% of adults have bank accounts. Moreover, the proportion of people receiving wages through the formal financial system is low in Viet Nam. In 2017, only 10% of wage recipients received their money through an account at a financial institution, compared to at least 49%, in leading Asian economies like Japan, Singapore and South Korea. This lack of formalisation restricts transparency, while also discouraging the development of non-cash transactions. In 2017, only 4% of the population over the age of 15 had owned a credit card in the preceding year. Moreover, only 21% of people had paid bills over the Internet or bought something online in the preceding year. Furthermore, only 23% of the population over the age of 15 had made or received digital payments over that period. This compared to 95% in Japan, 92% in South Korea, 68% in China, and 35% in Indonesia. Digital payments are still not popular in Viet Nam compared with other countries.
Table 3.5.1. Digital payments in Viet Nam
Account with a financial
institution (% age 15+) 2017
Received wages into a financial-
institution account (% age 15+)
Credit-card ownership
(% age 15+)
Used a debit or credit card to make a purchase over the
past year (% age 15+)
Used the internet to pay bills or to buy something online over the past year
(% age 15+)
Made or received
digital payments over the past year
(% age 15+)
China 80 22 21 42 49 68
Indonesia 48 9 2 12 11 35
Japan 98 51 68 69 48 95
Korea 95 49 64 84 76 92
Malaysia 85 28 21 39 39 70
Philippines 32 11 2 5 10 25
Singapore 98 57 49 77 57 90
Thailand 81 18 10 21 19 62
Viet Nam 30 10 4 4 21 23
Source: World Bank (2017), Global Fintech Database, https://globalfindex.worldbank.org.
Viet Nam authority is strengthening digital payments. It is in this spirit that the country organised, as of 2019, a nationwide cashless day on June 16 to encourage consumers to use cashless payment facilities. Indeed, there are signs of progress. According to the figures from the State Bank of Viet Nam in March 2019, the value of domestic payment transactions via bank cards has risen to more than VND 171 trillion, a jump of nearly 19% compared to the same period a year earlier. Notably, payments via mobile phones have now reached more than 76 million transactions, or VND 924 trillion, representing an increase of 232% compared to the same period in 2018. Moreover, 16 banks now offer payments that use QR codes, and there are now over 30 000 QR code payment points (Lee, 2019).
Looking ahead, cashless payments will continue becoming more and more popular in Viet Nam, as demand for and access to technology increase. Electronic wallets and payment intermediaries are gradually becoming familiar to consumers across Viet Nam. Moreover, several ride-sharing services and mobile network providers in Viet Nam have said they want to become payment intermediaries. Furthermore, payments via Internet

3. STRUCTURAL pOLICy COUNTRy NOTES3. STRUCTURAL pOLICy COUNTRy NOTES
177ECONOMIC OUTLOOK FOR SOUTHEAST ASIA, CHINA AND INDIA 2020: RETHINKING EDUCATION FOR THE DIGITAL ERA © OECD 2019
or mobile banking have made such inroads into a market traditionally dominated by over-the-counter payments that they now account for more than a quarter of all banking transactions in Viet Nam.
Box 3.5.1. Ride-sharing apps in Viet Nam
When BE, the ride-hailing app of Viet Nam’s transport start-up BE Group, entered the market in Viet Nam – in which a number of other app-providers were active – it decided to offer a full gamut of services. When the company rolled out its very first offering, in December 2018, it featured two main services: beBike, a motorbike ride-hailing app, and beCar, a ride-hailing for cars. Payment for BE’s services is by cash or by Visa or MasterCard. BE then develops into a platform rather than an application allowing suitable partners to operate. In 2019, BE Group released beFinancial, a mobile financial service platform. Moreover, BE Group also co-operates with the Viet Nam Prosperity Commercial Joint Stock Bank (VPbank). VPBank’s financial services are integrated into beFinance technology and fintech ecosystem including payment via cards, delivery services, and e-wallets. BE and VPBank decided to issue co-branded credit cards and debit cards. Furthermore, holders of BE-VPBank co-branded cards are entitled to consumer loans. In addition, BE drivers are able to access VPBank’s services, as well obtaining loans with preferential interest rates for purchasing cars and motorbikes. In turn, VPBank uses BE’s transport service, provides financial support for BE, and at the same time studies and deploys individual credit packages to support BE’s drivers. According to BE’s data as of May 2019, the ride-sharing app has been downloaded 4 million times with about 30 000 drivers and about 200 000 trips each day.
Another ride-sharing app, Fastgo chose to associate with Vimo e-wallet to solve payment problems for customers. The Fastgo ride-sharing app has the advantage of using technology from its parent company, so it has favourable conditions for deploying a range of new services, including payment from cards and electronic wallets. Fastgo also works with small and medium-sized enterprises to provide delivery services, thereby creating a flexible electronic payment eco-system.
Source: Vietnam Investment Review (2019), Bizhub (2019), Vietnam Prosperity Joint-Stock Commercial Bank (2019) and Nikkei Asian Review (2019).
Expanding ICT infrastructure across the economy and ensuring network security
Viet Nam’s government has sought to build up digital infrastructure by developing Internet infrastructure systems, and by promoting ICT and the application of technologies that can improve workers’ productivity. The first step in this regard was to set the goal of ensuring nationwide connection coverage. The government implemented its first coverage programme in 2005-10, with a total investment of up to 5 trillion Vietnamese dong (VND). As of 2015, it continued this push with a programme of investment of up to USD 7.3 billion to develop broadband Internet infrastructure nationwide1. Viet Nam also plans to roll out pilot 5G services in 2019 and deploy 5G commercial mobile service by 2020.
As noted above, Viet Nam offers a significant market for firms that wish to make the most of digital trade. In terms of people’s capacity to access ICT, for example, Viet Nam had just over 128 mobile-cellular telephone subscriptions per 100 inhabitants in 2017 (ITU, 2017). On average, therefore, each person has more than one mobile subscription. Moreover, 84% of mobile phones active in Viet Nam are smartphones that offer Internet access (Nielsen Viet Nam, 2017). Indeed, the habit of accessing the Internet on a mobile phone – a necessary condition for digital commercial development – is becoming more and

3. STRUCTURAL pOLICy COUNTRy NOTES
179178 ECONOMIC OUTLOOK FOR SOUTHEAST ASIA, CHINA AND INDIA 2020: RETHINKING EDUCATION FOR THE DIGITAL ERA © OECD 2019
more popular in Viet Nam. The International Telecommunication Union’s Information and Communication Technology Development Index (IDI) covers three main areas: the level of access to ICT, the level of ICT application, and the skills that are available for ICT. In 2010, Viet Nam ranked 86th out of 152 countries, featuring among the top 57% of countries. By 2017, however, the country had dropped to 108th place out of 176 countries, putting it in the top 61%. This notwithstanding, the absolute value of Viet Nam’s IDI increased from 3.41 to 4.43 (see Table 3.5.2). Viet Nam is ranked 50th out of 175 countries on the Global Cybersecurity Index (GCI) 2018 (ITU, 2019).
Table 3.5.2. ICT development index for Viet Nam and selected Asian countries
2010 2011 2015 2016 2017
Ranking IDI Ranking IDI Ranking IDI Ranking IDI Ranking IDI
China 79 3.58 78 3.88 82 5.05 81 5.19 80 5.6
Indonesia 97 3.01 95 3.19 115 3.63 115 3.86 111 4.33
Japan 8 7.57 8 7.76 11 8.47 10 8.37 10 8.43
Korea 1 8.45 1 8.56 1 8.93 1 8.84 2 8.85
Malaysia 57 4.63 58 4.82 64 5.9 61 6.22 63 6.38
Philippines 94 3.04 94 3.19 106 3.97 107 4.28 101 4.67
Singapore 10 7.47 12 7.66 19 8.08 20 7.95 18 8.05
Thailand 89 3.29 92 3.41 74 5.36 82 5.18 78 5.67
Viet Nam 86 3.41 81 3.68 102 4.28 105 4.29 108 4.43
% ranking of Viet Nam 57% 49% 61% 60% 61%
Source: ITU (2017), Global ICT Development Index 2017, International Telecommunication Union, Geneva, https://www.itu.int/net4/ITU-D/idi/2017/index.html#idi2017economycard-tab&VNM.
In addition to the expansion of infrastructure, to make sure that digital trade takes place in a safe environment, Viet Nam has also promulgated laws both on network information security and on cyber security. Under Viet Nam’s cyber security law, moreover, all enterprises that provide telecommunications or value-added digital services in the country, and that thereby collect, exploit, analyse, or process personal information or data, must establish a branch or representative office within its jurisdiction.
Improving ICT capacity of Viet Nam’s workforce and companies, and among consumers
In order for a country to develop digital trade, it also needs to have high-quality human resources. Efforts have been implemented by the government to develop human resources. In 2017, the Ministry of Education and Training and the Ministry for Labour, Invalids, and Social Affairs, developed a new education model for science, technology, engineering and mathematics (STEM). Moreover, Viet Nam’s ministry for science and technology has also been implementing – in partnership with other agencies – an important project to develop digital knowledge.
According to the Vietnam ICT White Book 2018 (Vietnam e-Commerce and Digital Economy Agency, 2018), 922 521 employees worked in IT, electronics and telecommunication in 2017. Moreover, currently, around 153 universities, 213 colleges and 237 vocational schools provide ICT education. On average, the country has over 50 000 IT, electronics and telecommunications graduates each year. However, challenges remain in the quality of human resources. Despite the large number of IT graduates, companies still have difficulties to recruit suitable employees, reflecting a mismatch between the quality of training and the actual requirements of businesses and markets.
When it comes to Viet Nam’s individual businesses, nearly 49% have their own websites and 32% of them have established relations with foreign partners over the

3. STRUCTURAL pOLICy COUNTRy NOTES3. STRUCTURAL pOLICy COUNTRy NOTES
179ECONOMIC OUTLOOK FOR SOUTHEAST ASIA, CHINA AND INDIA 2020: RETHINKING EDUCATION FOR THE DIGITAL ERA © OECD 2019
Internet (VECITA, 2016). International business platforms such as Alibaba, Amazon and Lazada are also present in Viet Nam. According to the Ministry of Industry and Trade’s department for e-commerce and the digital economy, meanwhile, 84% of Viet Nam’s enterprises chose email as their main means of making transactions in 2017. In addition, the number of enterprises using digital signatures reached 61% in 2018, nearly three times higher than in 2012, while the number of enterprises using electronic contract reached 26% in 2018 (VECOM, 2019). In 2017, the local domain name of “.vn” ranked seventh among the ten biggest registered domain names in Asia, encompassing 422 061 different names (VNNIC, 2017). Meanwhile, Viet Nam’s largest trading platform, Lazada, features over 50 000 merchants and partners and attracts over 100 million visitors every month (VECOM, 2019).
In Viet Nam’s consumer market, online shopping platforms such as Lazada, Shopee.vn, Sendo.vn, Hotdeal.vn, Zalora.vn, Tiki.vn and Adayroi.com have been proving popular too. However, businesses still need time to build trust with customers. In 2017, one of the most popular payment methods on online shopping platforms was COD (or cash on delivery), higher than electronic wallets and international payment cards. Viet Nam’s online shoppers take a keen interest in shipping and delivery, with 47% of respondents in 2017 saying this was the case. However, only 41% of respondents said they were satisfied with this aspect of the service, because of the limited capacity of logistics businesses in the country (Viet Nam e-Commerce and Digital Economy Agency, 2018). Indeed, logistics costs in Viet Nam are among the highest in the world. Viet Nam needs to address these restrictions in order to encourage the development of digital trade.
To conclude, digital trade is increasingly important to Viet Nam as it can bring significant benefits to the country’s economy through domestic trade and digital exports. However, some key challenges would need to be addressed. To further improve the digital eco-system and facilitate the development of digital trade, regulatory authorities should develop direct regulations on digital trade rather than scattered ones across various policies and at the same time enhance the enforcement of existing regulations. More efforts are also needed in finding ways to reduce barriers which affect the competitiveness of Viet Nam’s companies’ digital exports. Moreover, promoting electronic payments, expanding ICT infrastructure and ensuring network security, as well as ensuring more effective training for a skilled labour force in e-commerce and ICT are also crucial. E-commerce enterprises in general, and trading platforms in particular, also need to win more trust from customers.
Note
1. This programme was revised in 2018, under Decision No. 868 / QD-TTg.
References
A&A (2018), Global 3PL Market Size Estimates, Armstrong & Associates, Inc., https://www.3plogistics.com/3pl-market-info-resources/3pl-market-information/global-3pl-market-size-estimates/.
Bizhub (2019), “Fintech firms need clear policy to develop”, http://bizhub.vn/banking/fintech-firms-need-clear-policy-to-develop_308404.html (accessed 20 September 2019).
Hinrich Foundation, CIEM and Alphabeta (2019), The Data Revolution: How Viet Nam Can Capture the Digital Trade Opportunity at Home and Abroad, Hinrich Foundation in partnership with Central Institute for Economic Management and AlphaBeta.
ITU (2019), Global Cybersecurity Index (CGI) 2018, International Telecommunication Union, Geneva, https://www.itu.int/en/ITU-D/Cybersecurity/Pages/global-cybersecurity-index.aspx.
ITU (2017), Global ICT Development Index 2017, International Telecommunication Union, Geneva, https://www.itu.int/net4/ITU-D/idi/2017/index.html - idi2017economycard-tab&VNM.

3. STRUCTURAL pOLICy COUNTRy NOTES
181180 ECONOMIC OUTLOOK FOR SOUTHEAST ASIA, CHINA AND INDIA 2020: RETHINKING EDUCATION FOR THE DIGITAL ERA © OECD 2019
Lee, J. (2019), “Vietnam and Thailand lead drive to make Southeast Asia cashless”, Nikkei Asian Review, 18 April, https://asia.nikkei.com/Business/Business-trends/Viet Nam-and-Thailand-lead-drive-to-make-Southeast-Asia-cashless.
Ministry of Information and Communication (2019), “Vietnam to lack 400,000 IT workers by 2020”, https://english.mic.gov.vn/Pages/TinTuc/138819/VN-to-lack-400-000-IT-workers-by-2020.html (accessed 20 September 2019).
Nielsen Vietnam (2017), Vietnam Smartphone Insights Report 2017, Nielsen Vietnam, https://nielsen.com/wp-content/uploads/sites/3/2019/04/Web_Nielsen_Smartphones20Insights_EN.pdf.
Nikkei Asian Review (2019), “Vietnam’s first car-hailing app FastGo heads overseas”, https://asia.nikkei.com/Spotlight/Sharing-Economy/Vietnam-s-first-car-hailing-app-FastGo-heads-overseas (accessed 20 September 2019).
VECITA (2016), E-commerce Survey, Vietnam e-Commerce and Information Technology Agency, Ha Noi.
VECOM (2019), Vietnam E-Business Index Report 2019, Vietnam e-Commerce Association, Ha Noi.
Vietnam e-Commerce and Digital Economy Agency (2018), White Book on Vietnam’s E-commerce 2018, Vietnam e-Commerce and Digital Economy Agency, Ha Noi.
Vietnam Investment Review (2019), “BE Group and VPBank tie up to roll out payment and financial services”, https://vir.com.vn/be-group-and-vpbank-tie-up-to-roll-out-payment-and-financial-services-68170.html (accessed 20 September 2019).
Vietnam Prosperity Joint-Stock Commercial Bank (2019), “Strategic Partnership between BE GROUP and VPBank for Financial Technology Ecosystem”, https://vpbank.com.vn/bai-viet/press-releases/strategic-partnership-between-be-group-and-vpbank-financial-technology?target=en (accessed 20 September 2019).
VNNIC (2017), Internet Resources Report 2017, Vietnam Internet Network Information Center, Ha Noi.
World Bank (2017), Global Fintech Database, The World Bank, Washington, DC, https://globalfindex.worldbank.org.

3. STRUCTURAL pOLICy COUNTRy NOTES
181ECONOMIC OUTLOOK FOR SOUTHEAST ASIA, CHINA AND INDIA 2020: RETHINKING EDUCATION FOR THE DIGITAL ERA © OECD 2019
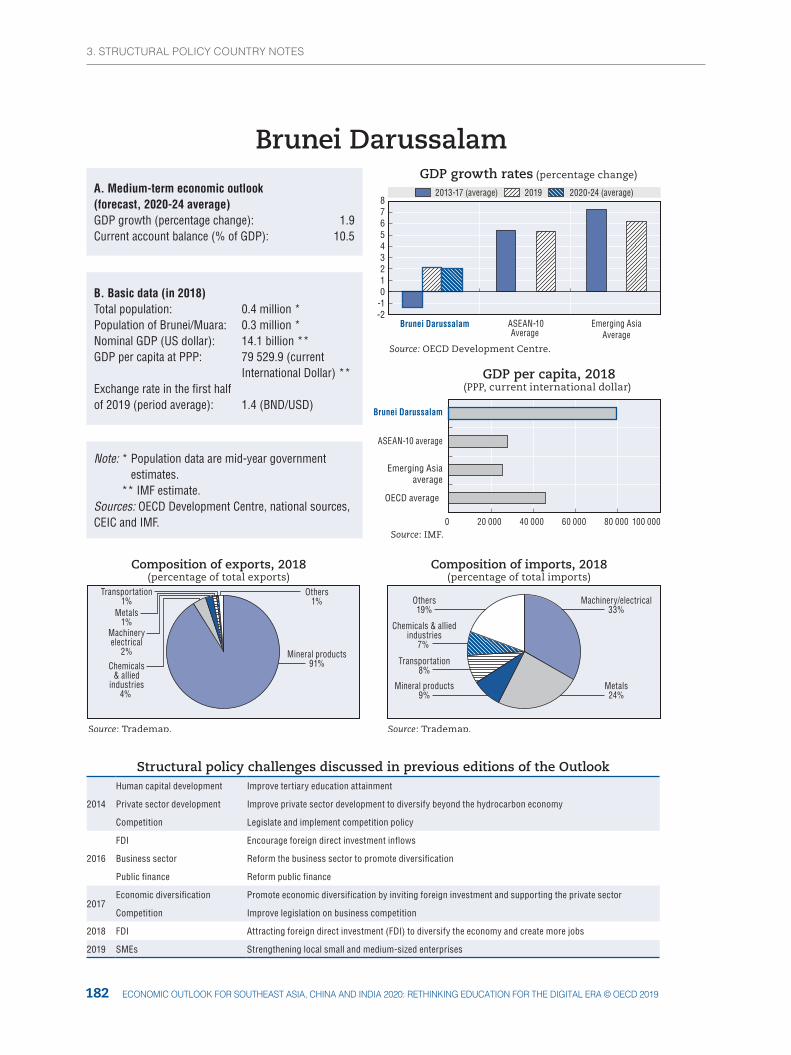
3. STRUCTURAL pOLICy COUNTRy NOTES
183182 ECONOMIC OUTLOOK FOR SOUTHEAST ASIA, CHINA AND INDIA 2020: RETHINKING EDUCATION FOR THE DIGITAL ERA © OECD 2019
Brunei Darussalam ASEAN-10Average
Emerging AsiaAverage
2013-17 (average) 2019 2020-24 (average)
Brunei DarussalamGDP growth rates (percentage change)
Source: IMF.
Source: Trademap. Source: Trademap.
Composition of exports, 2018(percentage of total exports)
Composition of imports, 2018(percentage of total imports)
0
GDP per capita, 2018(PPP, current international dollar)
20 000 40 000 60 000 80 000 100 000
-1-2
012345678
Mineral products91%Chemicals
& alliedindustries
4%
Machineryelectrical
2%
Metals1%
Transportation1%
Others1% Machinery/electrical
33%
Metals24%
Mineral products9%
Transportation8%
Chemicals & alliedindustries
7%
Others19%
Source: OECD Development Centre.
OECD average
Emerging Asiaaverage
ASEAN-10 average
Brunei Darussalam
Structural policy challenges discussed in previous editions of the Outlook
2014
Human capital development Improve tertiary education attainment
Private sector development Improve private sector development to diversify beyond the hydrocarbon economy
Competition Legislate and implement competition policy
2016
FDI Encourage foreign direct investment inflows
Business sector Reform the business sector to promote diversification
Public finance Reform public finance
2017Economic diversification Promote economic diversification by inviting foreign investment and supporting the private sector
Competition Improve legislation on business competition
2018 FDI Attracting foreign direct investment (FDI) to diversify the economy and create more jobs
2019 SMEs Strengthening local small and medium-sized enterprises
A. Medium-term economic outlook(forecast, 2020-24 average)GDP growth (percentage change): 1.9Current account balance (% of GDP): 10.5
B. Basic data (in 2018)Total population: 0.4 million *Population of Brunei/Muara: 0.3 million *Nominal GDP (US dollar): 14.1 billion **GDP per capita at PPP: 79 529.9 (current International Dollar) **Exchange rate in the first half of 2019 (period average): 1.4 (BND/USD)
Note: * Population data are mid-year government estimates.
** IMF estimate.Sources: OECD Development Centre, national sources, CEIC and IMF.

3. STRUCTURAL pOLICy COUNTRy NOTES3. STRUCTURAL pOLICy COUNTRy NOTES
183ECONOMIC OUTLOOK FOR SOUTHEAST ASIA, CHINA AND INDIA 2020: RETHINKING EDUCATION FOR THE DIGITAL ERA © OECD 2019
POLICY FOCUS
Developing an economic environment that spurs start-ups
Conscious of the degree to which Brunei Darussalam still depends largely on oil and gas exports, the government is continuing with its push for economic diversification. Given Brunei Darussalam’s particular situation – not just its relative dependency on oil and gas but also the characteristics of its population – developing a dynamic eco-system for business start-ups will help the government to achieve the strategic goals that it has set out in its national vision, “Wawasan 2035”. Under the auspices of this programme, the country aims to enhance the skills and quality of life of its people, and to build a dynamic and sustainable economy.
Brunei Darussalam possesses a range of competitive advantages for developing start-ups
For a start, the country already has a highly-educated, English-speaking population, and 19.1% of the labour force has a tertiary degree (MOFE, 2018). Although this falls short of the average level for OECD countries, Brunei Darussalam still ranks at the same level as successfully innovative economies such as France and Italy (Figure 3.6.1).
Figure 3.6.1. Share of workforce with tertiary education as highest educational attainment, 2017
0
5
10
15
20
25
30
35
40
45%
Source: OECD (2018a), “Table A1.1 - Educational attainment of 25-64 year-olds (2017): Percentage of adults with a given level of education as the highest level attained”, in The Output of Educational Institutions and the Impact of Learning; MOFE (2018), “Educational attainment and illiteracy”.12 https://doi.org/10.1787/888934064335
Another advantage Brunei could harness to develop a start-up friendly eco-system is its position within the ASEAN, which gives it access to a market of 642.1 million potential consumers (ASEAN, 2018). In addition, and given that most start-ups operate in the digital and technology sector, such services are easily scalable by their very nature. Therefore, regional integration and digitalisation provide Brunei Darussalam with an opportunity to overcome the constraints of its relatively small domestic market, which has been an important structural economic weakness for the country.
Thanks to revenues from its oil and gas sector, Brunei Darussalam disposes of a sovereign wealth fund that has 40 billion US dollars-worth of capital, and it is the Brunei Investment Agency that manages this fund (SWFI, 2017). This agency already has experience in venture capital investments, and there is scope for it to contribute to innovation programmes such as publicly-backed venture capital funds. Brunei Darussalam’s healthy banking sector, and its stable macro-economic climate, also bode well for its capacity to

3. STRUCTURAL pOLICy COUNTRy NOTES
185184 ECONOMIC OUTLOOK FOR SOUTHEAST ASIA, CHINA AND INDIA 2020: RETHINKING EDUCATION FOR THE DIGITAL ERA © OECD 2019
finance new business ventures. Indeed, the country currently ranks second in the world for the ease with which business can get credit for projects, according to the World Bank’s Doing Business report (World Bank, 2017). Moreover, Brunei Darussalam aims to become a leader in Islamic finance, which relies on equity financing in order to avoid interest payments. This represents an opportunity both for Brunei Darussalam’s start-ups, and for the Islamic financial sector in general. In this connection, it is worthy of note that the country’s finance ministry already runs a joint-venture Islamic fund with a Japanese group, although to date this has focused mostly not so much on start-ups, but on larger-scale investment opportunities in Indonesia (OECD/ERIA, 2018).
Brunei Darussalam already has an embryonic start-up eco-system on which to build
Brunei Darussalam already has its own start-up eco-system, in which a wide range of small and developing firms provide services in sectors such as e-commerce, smart farming, sports clothes, and digital learning tools. From a broader perspective, out of the 5 342 enterprises operating in Brunei Darussalam in 2015, small enterprises were the most common, representing 49.6% of the total (JPKE, 2016). However, their economic importance is still somewhat limited, as they account for only 19% of employment, and 10.2% of gross business revenue (JPKE, 2016).
In 2016, the government launched Darussalam Enterprise, a statutory body with the mission of helping to develop domestic enterprises, and with a particular view to helping small, and medium-sized enterprises (SMEs). This new body provides help to start-ups – both existing and potential ones – through initiatives such as the iCentre, a start-up incubator that offers the administrative guidance, technical support, and necessary physical infrastructure that new firms need in order to thrive. Furthermore, Darussalam Enterprise has set up a one-stop-shop called the Business Support Centre, which provides guidance and support directly to SMEs, as well as an education programme, the Industry Business Academy, which offers free classes to aspiring and existing business owners. Darussalam Enterprise also runs a start-up “boot-camp” programme, which offers a 100-day accelerator course in which entrepreneurs participate in weekly pitches and monitoring sessions, and work towards a final presentation, which they make to a panel of judges and investors.
When it comes to financing, most start-ups in Brunei Darussalam currently rely on bank funding (World Bank, 2016). Outside of the banking sector, however, there are some schemes to support lending to start-ups, such as the Micro Financing Scheme, which provides loans up to 15 000 Brunei dollars (BND) to SMEs. These loans do not require collateral, and they offer a low interest rate (OECD/ERIA, 2018). Since its launch in October 2016, this scheme has provided BND 563 000 in financing to 56 firms. Meanwhile, although venture capital financing is still rather small in Brunei Darussalam, initiatives are already in place to expand its use. For instance, the Livewire programme is a joint initiative on the part of Brunei Shell Petroleum and the national government. It rewards and supports start-ups by running the country’s Business Awards Start-Up Funding Scheme. Winners of the award receive favourable loans, ranging from BND 5 000 to BND 50 000, which are repayable over 36 months. Livewire Brunei provided BND 155 000 in funding to its laureates in 2018, and plans to scale up to BND 300 000 (Shell Livewire, 2018). Another relevant initiative here is Darussalam Enterprise’s aforementioned start-up “bootcamp”, which provides venture capital funding with the support of a Singaporean consultancy firm. This programme has so far proven successful in that it has provided a helping hand in the development of 70 companies, helping them to raise 750 000 Singapore dollars, and creating 250 jobs over three editions of the programme (Chewandi, 2018)

3. STRUCTURAL pOLICy COUNTRy NOTES3. STRUCTURAL pOLICy COUNTRy NOTES
185ECONOMIC OUTLOOK FOR SOUTHEAST ASIA, CHINA AND INDIA 2020: RETHINKING EDUCATION FOR THE DIGITAL ERA © OECD 2019
Local universities have an important role to play in fostering the knowledge that fuels innovation
Technological and scientific knowledge are crucial assets for an innovative start-up. In a knowledge-based society – and especially in the world of start-ups – knowledge composes the largest share of the value that these companies create. Moreover, holding intellectual property rights significantly improves a company’s chances of attracting venture capital funding (Breschi, Lassebie and Menon, 2018). Indeed, there is also evidence that start-ups that hold patents experience substantially higher growth in terms of employment and sales (Farre-Mensa, Hegde and Ljungqvist, 2017). As a result, the government – which is the main provider of research facilities in Brunei Darussalam, both through universities and the Brunei Research Council – has an active role to play in stimulating the production of knowledge. Indeed, universities have a key role to play in ensuring a vigorous flow of knowledge throughout the economy, and have a further mission to accomplish in working together with actors in the local economy to accelerate development.
In order to foster co-operation between universities and entrepreneurs, Brunei Darussalam’s government could finance special centres at universities to stimulate academic spin-offs. Such a programme could facilitate transfers from academic research into commercial activity. An endeavour of this kind also has the potential to anchor entrepreneurship in the minds of new graduates as a highly-desirable exit option from their academic studies (OECD, 2010). In addition to building awareness among university students about entrepreneurship, the potential tasks of a special centre like this include helping students and researchers to identify niche markets, coaching them about business planning, facilitating their access to external experts, and providing access to physical office space. Such a programme could take the form of an extension of the iCentre, with a special focus on university graduates. Alternatively, such an initiative could create a new centre, potentially through a partnership with the country’s main university. Austria has set up a similar programme of start-up centres called “AplusB”, which has won praise for the successes it has already achieved (OECD, 2018b).
Such an initiative could also help to foster awareness among students about intellectual property rights. These rights play an important role in the development of start-ups, yet SMEs tend not to make full use of the protections that intellectual property law can offer them. Indeed, they often fail to do so even in a situation where information on these rights would easily be within their reach, simply because of a lack of knowledge about the topic (OECD, 2011). Therefore, to develop awareness about intellectual property rights amongst university graduates, courses in fields like science, engineering, design, and creative arts should include some education on intellectual property rights, and on their strategic uses and implications (OECD, 2011).
Enhancing equity financing for start-ups, and boosting Islamic finance into the bargain
Venture capital is a preferable means of financing for start-ups than bank loans, as it is better suited for high-risk projects and long-term returns. The availability of venture capital funding allows companies with high levels of potential to overcome the kinds of obstacles they typically face, such as a shortage of financial resources or a lack of knowledge about business development. In addition to offering financial backing to entrepreneurs, venture capital investors help them to recruit talented managers and to formulate new strategies. They also use their own networks to garner resources for the company (Gompers and Lerner, 2004). For these reasons, firms that have the support of venture capital firms tend to take aim at more radical innovations, to be significantly faster in introducing their products to the market, and to pursue more aggressive market strategies than other start-ups (Hellmann and Puri, 2000, 2002).

3. STRUCTURAL pOLICy COUNTRy NOTES
187186 ECONOMIC OUTLOOK FOR SOUTHEAST ASIA, CHINA AND INDIA 2020: RETHINKING EDUCATION FOR THE DIGITAL ERA © OECD 2019
When it comes to providing equity financing for start-ups, governments can play an active role – as is already the case in several OECD economies, where governments are among the main venture capital investors (Breschi, Lassebie and Menon, 2018). In Europe for instance, government agencies represent 22% of venture capital funding, which makes them the largest providers of funding in the sector (BPIfrance et al., 2016). In the United States, the venture capital business has relied – especially in the past – on various government initiatives such as defence contracts, public procurement, and the Small Business Investment Companies Programme to develop. In the latter initiative, the government does not invest directly in small businesses, but it does provide loans to private investors to fund start-ups, matching their private stake with two dollars for every one dollar they invest themselves. In a similar manner, the government of Brunei Darussalam can provide support for private venture capital firms as it seeks to help them to carve out a bigger foothold in a country whose domestic market is not yet mature. As it seeks to do this, Brunei Darussalam can call on a relevant institution that it already has to hand – the Brunei Investment Agency.
Indeed, programmes in which the government and the private sector work in tandem to provide investment can often offer useful solutions. Moreover, the creation of venture funds that draw their financing partly from the government and partly from foreign private investment can help to overcome the failure of a local market to provide such services. Syndicating the investments of many smaller investors, meanwhile, and having the government cover a share of the risk, may indeed attract newcomers to the market. In this way, a government can show the way forward and demonstrate the viability of the venture capital ecosystem for private investors (BPIfrance et al., 2016). Furthermore, by offering the option to private investors to buy out its share in the medium term, the government can make sure it acts solely as a catalyst for private-sector involvement rather than threatening to crowd out the private sector. A practical example of such a programme is the “Yozma” initiative in Israel, which has won plaudits for the significant contribution it has made to the thriving Israeli venture capital industry (OECD, 2010).
Finally, adapting such a policy of support for venture capital to the setting of Brunei Darussalam would be a way to promote another of the country’s policy priorities – the further development of Islamic finance. Indeed, venture capital funding can become compatible with Sharia Law if it takes place under a contract where the fund’s depositors are shareholders, and are then entitled to a predetermined share of the profits. In this way, developing a market for venture capital in Brunei Darussalam will present opportunities both for start-ups, and for the country’s growing Islamic financial sector.
References
ASEAN (2018), ASEAN Statistical Highlights 2018, ASEAN secretariat, Jakarta, https://www.aseanstats.org/wp-content/uploads/2018/10/ASEAN-Statistical-Highlights-2018.pdf.
BPIfrance et al. (2016), Building Momentum in Venture Capital across Europe, BPIfrance, CDP, ICO, British Business Bank, KfW, https://www.bpifrance.fr/content/download/60338/549921/file/Building%20Momentum%20in%20Venture%20Capital%20across%20Europe.pdf.
Breschi, S., J. Lassebie and C. Menon (2018), “A portrait of innovative start-ups across countries”, OECD Science, Technology and Industry Working Papers, 2018/02, OECD Publishing, Paris, http://dx.doi.org/10.1787/f9ff02f4-en.
Chewandi S. (2018), “Singapore’s ‘Golden Equator Consulting’ Kickstarted Startup and Micro Business Bootcamp Programmes by Brunei’s Darussalam Enterprise”, Golden Equator Consulting, Singapore, https://www.goldenequatorconsulting.com/blog/singapores-golden-equator-consulting-kickstarted-startup-micro-business-bootcamp-programmes-bruneis-darussalam-enterprise/.
Farre-Mensa, J., D. Hegde and A. Ljungqvist (2017), “What is a Patent Worth? Evidence from the U.S. Patent ‘Lottery’”, NBER Working Papers, National Bureau of Economic Research, Cambridge, Massachusetts.

3. STRUCTURAL pOLICy COUNTRy NOTES3. STRUCTURAL pOLICy COUNTRy NOTES
187ECONOMIC OUTLOOK FOR SOUTHEAST ASIA, CHINA AND INDIA 2020: RETHINKING EDUCATION FOR THE DIGITAL ERA © OECD 2019
Gompers, P.A. and J. Lerner (2004), The Venture Capital Cycle, MIT Press, Cambridge, Massachusetts.
Hellmann, T. and M. Puri (2002), “Venture capital and the professionalization of start-up firms: Empirical evidence”, Journal of Finance, 57(1).
Hellmann, T. and M. Puri (2000), “The interaction between product market and financing strategy: The role of venture capital”, Review of Financial Studies, 13(4).
JPKE (2016), Economic Census of Enterprises (ECE) 2016, http://www.depd.gov.bn/SitePages/Statistical%20Publications.aspx.
MOFE (2018), “Educational attainment and illiteracy”, Ministry of Finance and Economics of Brunei Darussalam, http://www.depd.gov.bn/SitePages/Educational%20attainment%20and%20illiteracy.aspx.
OECD (2018a), “Table A1.1 - Educational attainment of 25-64 year-olds (2017): Percentage of adults with a given level of education as the highest level attained”, in The Output of Educational Institutions and the Impact of Learning, OECD Publishing, Paris, https://doi.org/10.1787/eag-2018-table14-en.
OECD (2018b), OECD Reviews of Innovation Policy: Austria 2018, OECD Reviews of Innovation Policy, OECD Publishing, Paris, https://doi.org/10.1787/9789264309470-en.
OECD (2011), Intellectual Assets and Innovation: The SME Dimension, OECD Studies on SMEs and Entrepreneurship, OECD Publishing, http://dx.doi.org/10.1787/9789264118263-en.
OECD (2010), SMEs, Entrepreneurship and Innovation, OECD Studies on SMEs and Entrepreneurship, OECD Publishing, Paris, https://doi.org/10.1787/9789264080355-en.
OECD/ERIA (2018), SME Policy Index: ASEAN 2018: Boosting Competitiveness and Inclusive Growth, SME Policy Index, OECD Publishing, Paris/ERIA, Jakarta, https://doi.org/10.1787/9789264305328-en.
Shell Livewire (2018), “Five start-ups receive $155k from livewire Brunei”, Shell Livewire, https://www.livewire.shell/what-is-shell-livewire/news/five-start-ups-receive-155k-dollar-from-livewire-brunei.html.
SWFI (2017), Sovereign Wealth Fund Rankings, Sovereign Wealth Fund Institute, https://www.swfinstitute.org/sovereign-wealth-fund-rankings/.
World Bank (2017), Doing Business 2018: Reforming to Create Jobs, World Bank Group, Washington, DC, https://openknowledge.worldbank.org/handle/10986/28608.
World Bank (2016), World Development Indicators, https://doi.org/10.1596/978-1-4648-0683-4.

3. STRUCTURAL pOLICy COUNTRy NOTES
189188 ECONOMIC OUTLOOK FOR SOUTHEAST ASIA, CHINA AND INDIA 2020: RETHINKING EDUCATION FOR THE DIGITAL ERA © OECD 2019
Singapore
0 20 000 40 000 60 000 80 000 100 000 120 000
Machinery/electrical
47%
Mineral products14%
Chemicals & alliedindustries
11%
Plastics/rubber
4%
Transportation3%
Others21% Machinery/
electrical44%
Mineral products25%
Chemicals & alliedindustries
7%
Transportation5%
Metals3%
Others16%
0
1
2
3
4
5
6
7
8 2013-17 (average) 2019 2020-24 (average)
Singapore ASEAN-10average
Emerging Asiaaverage
Source: OECD Development Centre.
Source: IMF.
OECD average
Emerging Asia average
ASEAN-10 average
Singapore
Source: Trademap. Source: Trademap.
Composition of exports, 2018(percentage of total exports)
Composition of imports, 2018(percentage of total imports)
GDP growth rates (percentage change)
GDP per capita, 2018(PPP, current international dollar)
Structural policy challenges discussed in previous editions of the Outlook
2014
Land use Optimise land use and allocation by incorporating a green growth strategy
SME development Raise SME productivity through well co-ordinated assistance programmes
Education Strengthen life-long learning to increase labour market flexibility
2016Ageing population Strengthen labour market and social policies for aging population
Infrastructure (land use) Leverage data to build a smart, energy-efficient city
2017Population ageing Support the older population in the labour market and strengthen their social safety net
Urban planning Pursue efficient urban planning and optimise land use
2018 Land use Optimising the use of Singapore’s limited land
2019 Education and training Enhancing strategies for lifelong learning programmes
A. Medium-term economic outlook(forecast, 2020-24 average)GDP growth (percentage change): 2.3Current account balance (% of GDP): 18.5
B. Basic data (in 2018)Total population: 5.6 million *Nominal GDP (US dollar): 361.1 billion **GDP per capita at PPP: 100 344.7 (current International Dollar) **Exchange rate in the first half of 2019 (period average): 1.4 (SGD/USD)
Note: * Population data are mid-year government estimates.
** IMF estimate.Sources: OECD Development Centre, national sources, CEIC and IMF.

3. STRUCTURAL pOLICy COUNTRy NOTES3. STRUCTURAL pOLICy COUNTRy NOTES
189ECONOMIC OUTLOOK FOR SOUTHEAST ASIA, CHINA AND INDIA 2020: RETHINKING EDUCATION FOR THE DIGITAL ERA © OECD 2019
POLICY FOCUS
Boosting investment and parental involvement in pre-schools
Education plays an important role in Singapore, and the government has invested heavily in ensuring high quality. As such, 16.6% of government spending was dedicated to education in 2015 compared to an average of 14.9% for OECD countries (UNESCO, 2018).
Pre-school programmes are important as they yield positive outcomes. This is especially true for disadvantaged children, for whom a high-quality pre-school experience tends to promote social mobility. For instance, evidence from Norway points to a USD 1.32 return on every dollar invested for children of low-income parents (Havnes and Mogstad, 2014). When it comes to academic performance, moreover, findings from the US support the view that quality pre-school education brings significant benefits to those who attend it (Cascio and Scahnzenback, 2013). Furthermore, there is evidence that education in early childhood has a highly positive effect on economic growth, with most benefits occurring in the long run when the children join the labour force (Dickens, Sawhill and Tebbs, 2006). Research has also pointed to sizeable gains in productivity, with education in early childhood contributing as much to rising productivity over the period of 1961-2008 as formal education (Delalibera and Ferreira, 2019). Together, this evidence underlines the fundamental importance of high-quality pre-school education, and the benefits it brings both to the children themselves and to the economic performance of a country. In Singapore, like in other developed countries, there is still room for improvement in the pre-school system.
Increasing spending on early childhood education and care could lower the child-to-teacher ratio
Compared to other countries with a high gross domestic product (GDP) per capita, Singapore currently invests less in early-childhood education and care (ECEC). It is worthy of note, however, that this is partly due to Singapore’s efforts to focus on private-sector provision, while investing through targeted transfers and since 2014 also through public kindergartens in ECEC services for vulnerable layers of society. Currently, the median full-day childcare fee is 856 Singapore dollars (SGD) per month, while the maximum subsidy that a family in the lowest income bracket could obtain is SGD 740. These subsidies render the government provided kindergartens virtually free of charge for the lowest earning parents. (ECDA, 2018).
Singapore’s lower levels of public funding for ECEC compared to OECD countries may help to explain the difference in child-to-teacher ratios that is also apparent. In Singapore, the set guideline for pre-schools stipulates that they should not exceed a child-to-teacher ratio of 20 to 1 in year one of kindergarten (K1) and 25 to 1 in year two (K2).
This is higher than the OECD average of 16 to 1 (Figure 3.7.1). Moreover, studies have shown that low child-to-teacher ratios are a key factor in ensuring both the quality of pre-school education and future outcomes for the children who study there (OECD, 2017; Blau and Currie, 2006). It is also worthy of note that while guidelines from Singapore’s Early Childhood Development Agency stipulate child-to-teacher ratios of 20:1 and 25:1 for years one and two of kindergarten respectively, many private operators offer much lower child-to-teacher ratios.

3. STRUCTURAL pOLICy COUNTRy NOTES
191190 ECONOMIC OUTLOOK FOR SOUTHEAST ASIA, CHINA AND INDIA 2020: RETHINKING EDUCATION FOR THE DIGITAL ERA © OECD 2019
Figure 3.7.1. Child-to-teacher ratios in early childhood education and care in 2017
0
5
10
15
20
25
30
35
Number of children per ECEC staff
Note: For France, data represent public and government-dependent private institutions only, and data on teachers are not comparable with previous years due to a new methodology introduced. For Japan, data on staff do not cover all ECEC services. Singapore data refer to the government guideline of child-to-teacher ratio at 20:1 for year one of kindergarten instead of actual ratio.Source: OECD (2019a), “Ratio of children to staff in pre-primary (ISCED 02) education (2017): Public and private institutions, calculation based on full-time equivalents”, in Access to education, participation and progress, https://doi.org/10.1787/02fe776d-en. 12 https://doi.org/10.1787/888934064354
Increasing public spending offers one clear way to reduce the child-to-teacher ratio while not affecting accessibility. In 2018, Singapore’s spending on early-childhood education and care came to around SGD 1 billion. Yet at 0.19% of Singapore’s GDP, this level falls below the average level of spending for OECD countries, which was estimated at 0.6% in 2013 (OECD, 2017; MSF, 2018a). With respect to spending per child, however, Singapore performs better by comparison, with current spending at USD 7 926 at purchasing power parity (PPP). However, this still comes in below the OECD average of USD 8 141 at PPP (MSF, 2018a; OECD, 2019b).
By way of comparison, however, Singapore tends to invest more on average in primary education than the OECD countries, for which average spending per child amounted to USD 8 631 at PPP in 2015. Singapore spent USD 9 678 at PPP per child in 2017 (MOE, 2018a; OECD, 2018a). Still, this difference is not reflected in the child-to-teacher ratio in primary schools, which was 15 to 1 in 2017, matching the OECD average of 2016 (MOE, 2018b; OECD, 2018b). However, Singapore’s excellent scores in the OECD’s Programme for International Student Assessment (PISA) rankings attest to a high degree of quality in its education system. Indeed, Singapore outperformed all other ranked countries in 2015 (OECD, 2016). In order to enhance this success further, Singapore can now seek to improve its pre-school outcomes to match those it achieves in primary and secondary education.
Under the current spending plan, which the government published in 2017 and runs through to 2023, Singapore will boost ECEC spending to SGD 1.7 billion by 2023. This will represent 0.29% of GDP according to forecasted data, meaning it will still fall short of OECD levels as a percentage of GDP. Still, the plan involves creating 40 000 extra places, and implies per-child spending of USD 9 830 at PPP. This is above the 2016 OECD average. However, it still falls below top performers such as Luxembourg (USD 17 539 in 2016), Sweden (USD 14 528), and Norway (USD 14 344) (Figure 3.7.2). Nonetheless, high level of public spending alone would not be enough and it should also be accompanied by effective measures to achieve desired outcomes and guarantee its sustainability. It is also worthy of note that occupancy rates are currently low and on the rise. As a result of this, the actual level of spending per child is likely to be lower by 2023.

3. STRUCTURAL pOLICy COUNTRy NOTES3. STRUCTURAL pOLICy COUNTRy NOTES
191ECONOMIC OUTLOOK FOR SOUTHEAST ASIA, CHINA AND INDIA 2020: RETHINKING EDUCATION FOR THE DIGITAL ERA © OECD 2019
Figure 3.7.2. Public spending on ECEC per child, 2016USD at PPP
0
2 000
4 000
6 000
8 000
10 000
12 000
14 000
16 000
18 000
20 000
Note: For Chile and Colombia, data refer to 2017 instead of 2016. For Finland, expenditures are underestimated due to the estimation method used. For Japan, data on financing do not cover all ECEC services. For Switzerland, data refer to public sources only. Source: OECD (2019b), “Financing of early childhood education and care (ISCED 0) and change in expenditure as a percentage of GDP (2012 and 2016): Public and private institutions”, in Access to education, participation and progress, https://doi.org/10.1787/eb483bd2-en.12 https://doi.org/10.1787/888934064373
The increase in ECEC spending marks government’s efforts to raise the quality, accessibility and affordability of preschools. These efforts include doubling the number of full-day preschool places from 90 000 in 2012 to almost 180 000 in 2019, making preschool more affordable - in particular for the majority of low and middle-income families, enhancing means-tested preschools subsidies for families, uplifting early childhood standards in the sector, enhancing its resources, introducing kindergartens run by the Ministry of Education and last but not least, strengthening professional development of early childhood educators. With such efforts that cover teacher, centre and curriculum dimensions, it is expected that the annual government spending on the early childhood sector will increase more than double over the next few years, from around SGD 1 billion in 2018. Nonetheless, an evaluation of outcomes across various dimensions previously mentioned would be necessary to gain insight for further improvement of the quality of ECEC service.
Fostering a high-quality home learning environment
Parents’ involvement in the provision of a good home-learning environment (HLE) is essential for their children’s development. Indeed, a wide range of research shows that increased parental involvement correlates both with better academic performance later in life and greater social inclusion. Studies have found a particular link between proficiency in English and mathematics and the frequency of opportunities for learning at home, while the quality of the HLE is also essential for improving overall outcomes for children (OECD, 2012). This is because a child’s early experiences build the architecture of the brain, and lay the foundations for their lifelong thinking skills and approach to learning. Parental interaction is, therefore, a key factor in improving educational outcomes (Hadani and Rood, 2018).
By supporting the parents of young children, early-childhood education and care can play an active role in fostering a better home-learning environment. Indeed, in Singapore in 2014, 55% of parents relied on ECEC centres for acquiring knowledge about parenting (ECDA, 2014). Parents indicated that they found the workshops that these centres offered

3. STRUCTURAL pOLICy COUNTRy NOTES
193192 ECONOMIC OUTLOOK FOR SOUTHEAST ASIA, CHINA AND INDIA 2020: RETHINKING EDUCATION FOR THE DIGITAL ERA © OECD 2019
in this regard to be very useful. First of all, ECEC providers can inspire parents to offer their children all kinds of learning situations at home, both informal and explicit. Such a “home curriculum” can involve routine activities such as cooking meals, building, shopping, and fixing things, yet it should also be complemented with cognitive tasks such as shared book reading or engaging in stimulating discussions (OECD, 2012). Activities should be oriented both towards developing literacy skills and towards science, technology, engineering and mathematics (STEM) learning. Indeed, there should be a specific focus on the latter since caregivers and parents are currently more comfortable in supporting their children’s literacy development than their progress with STEM subjects (Hadani and Rood, 2018). Finally, support in creating a high quality HLE is especially important for parents from low-income families.
Practical examples of ways to enhance the home-learning environment through ECEC services include providing activities and materials to parents to allow them to build on the work being done in the classroom. Indeed, this also allows parents to follow the academic progress of their child. Reading stories has also been recognised as a key driver for a child’s cognitive development. The OECD found that children whose parents often read to them showed markedly higher scores in PISA 2009 than students whose parents read with them infrequently or not at all, regardless of their family’s socio-economic background (OECD, 2011). In Singapore, 57% of parents read story books to their child twice a week or even daily, but 24% never read to their child or do so only once a month (ECDA, 2014).
Given the importance of parenting for a child’s school outcomes, offering parenting courses to the parents of pre-schoolers can be a good way of improving the overall quality of education. Indeed, studies indicate that providing such courses to parents has positive results on children’s later school achievements, regardless of family background or income (OECD, 2012). Furthermore, it helps to make parents feel confident in their parenting, and more secure in their interaction with their child. Several initiatives have been put in place by the government in regards to impart essential parenting skills, especially for new parents or those from low-income families who may require more support. For instance, the Moments of Life application, which was launched in 2018, includes a section on parenting resources that parents can easily access on their mobile phones. The “Embracing PArenthood” movement, a community initiative launched in 2017 by the People’s Association, also enables community partners to equip parents with young children with information on parenting. In one constituency, this led to the formation of a Parents’ Support Group, which meets quarterly to share tips about child development, infant nutrition and other parenting pointers. Other initiative that targets low-income families was also introduced back in 2016. This initiative is called KidSTART programme and it reaches out to families right from the antenatal stage. This programme helps to equip parents with child development skills and provides health and social support to families and their children in their homes, preschools and communities. Despite the fact that such parenting programmes can be offered directly at the ECEC centre, or through home visits, they do, however, require time from parents.
Building a strategic relationship between parents and ECEC services
As well as enhancing the home learning environment, ECEC policies should aim to create a constructive and supportive relationship between parents and teachers. This is because there is a positive correlation between the frequency of high-quality interactions between parents and staff and the quality of care provided in centres (OECD, 2012).

3. STRUCTURAL pOLICy COUNTRy NOTES3. STRUCTURAL pOLICy COUNTRy NOTES
193ECONOMIC OUTLOOK FOR SOUTHEAST ASIA, CHINA AND INDIA 2020: RETHINKING EDUCATION FOR THE DIGITAL ERA © OECD 2019
Possible policies for ECEC providers to promote better parent-teacher communication could include organising parent-staff meetings, sending newsletters, and setting up home visits. These different channels are beneficial as they provide extra opportunities for dialogue that go beyond the interactions parents get with teachers when they drop their children off or pick them up – which tend to focus on immediate concerns. Staff also benefit by building a better relationship with children and their families, and by obtaining a better understanding how a child’s home environment might affect school performance (Halgunseth and Peterson, 2009).
Indeed, the authority has taken some measures to strengthen partnership between parents and preschools. For instance, preschools are encouraged to build close parent-centre relationships. Individual centres retain the flexibility to do so in a way which best caters of the needs of enrolled children and their parents, including those working full-time. The Early Childhood Development Agency (ECDA) also guides preschools in developing supportive and warm environments that welcome family participation through the Good Practices Handbook for Child Care Centres.
Besides regulatory requirements, Singapore has the Singapore Preschool Accreditation Framework (SPARK) that serves as a benchmark for preschools to assess and continually raise the quality of their programmes, including through collaboration with parents. In addition, the Government has introduced initiatives that promote greater involvement of families and the community in preschools’ activities. For example, under the Start Small Dream Big (SSDB) initiative, in which the government encourages preschools to create platforms for children to give back to the community, preschools are encouraged to partner parents on their community project.
Finding time to partake in parental engagement activities may be challenging
Singaporean parents might find it hard to attend parenting courses or meetings organised by ECEC providers, as a large majority of both males and females are active participants in the labour market. Indeed, in 2015, the share of dual-career couples out of all married couples under 35 years old, was 75.9%, falling to 69.1% for those aged between 35 and 49 (MTI, 2016). This means that a large share of pre-schooler parents do not necessarily have time to attend ECEC support programmes.
Furthermore, part-time work is uncommon in Singapore, with only 10.5% of the employed labour force falling under such a contract in 2017, compared to 16.5% on average in the OECD (MSF, 2018b; OECD, 2018c). This prevents arrangements in which one of the spouses focuses more on the upbringing of children by taking a part-time job (MSF, 2018b). In addition, the average number of hours that a Singaporean worked per week came to 45.1 in 2017, underscoring the fact that most parents of pre-schoolers have very busy schedules (Department of Statistics Singapore, 2018).
However, under Singapore’s Child Development Co-Savings Act, each parent of a child under seven years old is entitled to six days a year of childcare leave (MOM, 2018). This leave is funded for the first three days by the employer, and for the second three days by the government. It allows parents to take the time to attend ECEC activities, as a couple can take a total of 12 days a year for activities related to their child. In order to support this policy further, however, awareness about the importance of parental involvement could be raised amongst young parents.

3. STRUCTURAL pOLICy COUNTRy NOTES
195194 ECONOMIC OUTLOOK FOR SOUTHEAST ASIA, CHINA AND INDIA 2020: RETHINKING EDUCATION FOR THE DIGITAL ERA © OECD 2019
References
Blau, D. and J. Currie (2006), “Preschool, daycare, and afterschool care: Who’s minding the kids?”, Handbook of the Economics of Education, Vol. 2, pp. 1163-1278, Amsterdam.
Cascio, E.U. and D.W. Schanzenbach (2013), “The impacts of expanding access to high-quality preschool education”, National Bureau of Economic Research Working Paper 19735.
Delalibera B.R. and P.C. Ferreira (2019), “Early childhood education and economic growth”, Journal of Economic Dynamics and Control, Vol. 98, pp. 82-104, https://doi.org/10.1016/j.jedc.2018.10.002.
Department of Statistics Singapore (2018), Singapore in Figures 2018, Department of Statistics Singapore, Singapore, https://www.singstat.gov.sg/-/media/files/publications/reference/sif2018.pdf.
Dickens W. T., I. Sawhill and J. Tebbs (2006), “The Effects of Investing in Early Education on Economic Growth”, The Brookings Institution, https://www.brookings.edu/wp-content/uploads/2016/06/pb153.pdf.
ECDA (2018), Quarterly Report Statistics on Child Care Services, Early Childhood Development Agency, Singapore, https://www.ecda.gov.sg/Documents/Resources/Statistics_on_child_care(STENT).pdf.
ECDA (2014), Early Childhood Parenting Landscape Study, Early Childhood Development Agency, Singapore, https://www.ecda.gov.sg/growatbeanstalk/Documents/Read%20Publications%20and%20Research/Executive%20Summary_Parenting%20Study.pdf.
Economist Intelligence Unit (2012), Starting well Benchmarking early education across the world, The Economist, London, http://graphics.eiu.com/upload/eb/lienstartingwell.pdf.
Hadani, H.S. and E. Rood (2018), “The roots of STEM success: changing early learning experiences to build lifelong thinking skills”, Center for Childhood Creativity, http://448bn62kp97s14oorg3xs7hn-wpengine.netdna-ssl.com/wp-content/uploads/sites/2/2018/02/CCC_The_Roots_of_STEM_Early_Learning.pdf.
Halgunseth, L.C. and A. Peterson (2009), “Family Engagement, Diverse Families, and Early Childhood Education Programs: An Integrated Review of the Literature”, Young Children, Vol. 64, No. 5.
Havnes, T. and M. Mogstad (2014), “Is universal child care levelling the playing field?”, Journal of Public Economics, Vol. 127, pp. 100-114.
MOE (2018a), Government Recurrent Expenditure on Education per Student, Singapore Ministry of Education, Singapore.
MOE (2018b), Pupils per Teacher in Primary and Secondary Schools, Singapore Ministry of Education, Singapore.
MOM (2018), Childcare Leave Eligibility and Entitlement, Singapore Ministry of Manpower, Singapore, https://www.mom.gov.sg/employment-practices/leave/childcare-leave/eligibility-and-entitlement.
MSF (2018a), FY2019 Expenditure Estimates, Singapore Ministry of Social and Family Development, Singapore, https://www.singaporebudget.gov.sg/docs/default-source/budget_2019/download/pdf/23-MSF-2019.pdf.
MSF (2018b), Labour Force and the Economy: Part Time Workforce, Ministry of Social and Family Development, Singapore.
MTI (2016), General Household Survey 2015, Singapore Ministry of Trade & Industry, Singapore, https://www.singstat.gov.sg/-/media/files/publications/ghs/ghs2015/ghs2015.pdf.
OECD (2019a), “Ratio of children to staff in pre-primary (ISCED 02) education (2017): Public and private institutions, calculation based on full-time equivalents”, in Access to Education, Participation and Progress, OECD Publishing, Paris, https://doi.org/10.1787/02fe776d-en.
OECD (2019b), “Financing of early childhood education and care (ISCED 0) and change in expenditure as a percentage of GDP (2012 and 2016): Public and private institutions”, in Access to Education, Participation and Progress, OECD Publishing, Paris, https://doi.org/10.1787/eb483bd2-en.
OECD (2018a), “Indicator D2 What is the student-teacher ratio and how big are classes?”, in Education at a Glance 2018: OECD Indicators, OECD Publishing, Paris, https://doi.org/10.1787/eag-2018-29-en.
OECD (2018b), “Indicator C1 How much is spent per student on educational institutions?”, in Education at a Glance 2018: OECD Indicators, OECD Publishing, Paris, https://doi.org/10.1787/eag-2018-21-en.
OECD (2018c), “Table 24 - Part-time employment as a percentage of employment”, in OECD Labour Force Statistics 2018, OECD Publishing, Paris, https://doi.org/10.1787/oecd_lfs-2018-table24-en.
OECD (2017), Starting Strong V: Transitions from Early Childhood Education and Care to Primary Education, OECD Publishing, Paris, http://dx.doi.org/10.1787/9789264276253-en.

3. STRUCTURAL pOLICy COUNTRy NOTES3. STRUCTURAL pOLICy COUNTRy NOTES
195ECONOMIC OUTLOOK FOR SOUTHEAST ASIA, CHINA AND INDIA 2020: RETHINKING EDUCATION FOR THE DIGITAL ERA © OECD 2019
OECD (2016), PISA 2015 Results (Volume I): Excellence and Equity in Education, PISA, OECD Publishing, Paris, https://doi.org/10.1787/9789264266490-en.
OECD (2012), Starting Strong III: A Quality Toolbox for Early Childhood Education and Care, OECD Publishing, http://dx.doi.org/10.1787/9789264123564-en.
OECD (2011), “What Can Parents Do to Help Their Children Succeed in School?”, PISA in Focus, No. 10, OECD Publishing, Paris, https://doi.org/10.1787/5k9h362jdgnq-en.
UNESCO (2018), “Education: Expenditure on education as % of total government expenditure”, UNESCO Institute for Statistics, Paris, http://data.uis.unesco.org/Index.aspx?queryid=183.

197

197ECONOMIC OUTLOOK FOR SOUTHEAST ASIA, CHINA AND INDIA 2020: RETHINKING EDUCATION FOR THE DIGITAL ERA © OECD 2019

3. STRUCTURAL pOLICy COUNTRy NOTES
199198 ECONOMIC OUTLOOK FOR SOUTHEAST ASIA, CHINA AND INDIA 2020: RETHINKING EDUCATION FOR THE DIGITAL ERA © OECD 2019
CambodiaGDP growth rates (percentage changes)
Source: IMF.0
Emerging Asiaaverage
OECD average
ASEAN -10 average
Cambodia
GDP per capita, 2018 (PPP, current international dollar)
Source: Trademap. Source: Trademap.
Composition of exports, 2018(percentage share of total exports)
Composition of imports, 2018(percentage share of total imports)
10 000 20 000 30 000 40 000 50 000
Textiles67%
Vegetable products4%
Transportation2%
Metals2%
Others22%
Machinery/electrical
3%
Textiles22%
Machinery/electrical
12%
Mineral products11%
Transportation7%
Chemicals & alliedindustries
4%
Others44%
0
1
2
3
4
5
6
7
8 2013-17 (average) 2019 2020-24 (average)
Cambodia ASEAN-10average
Emerging Asiaaverage
Source: OECD Development Centre.
Structural policy challenges discussed in previous editions of the Outlook
2014
Agriculture Improving the productivity of agriculture, in particular for rice production
Financial sector Improving the prudential and supervisory framework for the financial sector
Tourism Developing tourism-specific infrastructure
2016Education (TVET) Improving competitiveness by strengthening TVET
Tourism Addressing complex challenges in developing tourism
2017 Agriculture Helping the agricultural sector to move ahead
2018 Education Strengthening financial education
2019 Tourism Addressing challenges in developing ecotourism
A. Medium-term economic outlook(forecast, 2020-24 average)GDP growth (percentage change): 6.7Current account balance (% of GDP): -9.0
B. Basic data (in 2018)Total population: 15.8 million (in 2017) *Population of Phnom Penh: 1.9 million (in 2017) *Nominal GDP (US dollar): 24.5 billion **GDP per capita at PPP: 4 334.7 (current International Dollar) **Exchange rate in the first half of 2019 (period average): 4 029.3 (KHR/USD)
Note: * Population data are year-end government estimates.
** IMF estimate.Sources: OECD Development Centre, national sources, CEIC and IMF.
3. STRUCTURAL pOLICy COUNTRy NOTES3. STRUCTURAL pOLICy COUNTRy NOTES
199ECONOMIC OUTLOOK FOR SOUTHEAST ASIA, CHINA AND INDIA 2020: RETHINKING EDUCATION FOR THE DIGITAL ERA © OECD 2019
POLICY FOCUS
Improving training for MSMEs to achieve inclusive growth
Micro, small, and medium-sized enterprises (MSMEs) form the backbone of the Cambodian economy. Based on data from the country’s Ministry for Industry and Handicrafts, the overwhelming majority of companies in Cambodia are MSMEs. Furthermore, these businesses account for 70% of employment in Cambodia, and contribute 58% of the country’s gross domestic product (GDP) (Chhea, 2019). Moreover, MSMEs are more likely to be owned by Cambodians, and are more evenly distributed across the country.
Human resources are one of the main challenges that MSMEs face in Cambodia
Since the early 2000s, the Cambodian government has introduced policies and measures to facilitate and guide the development of MSMEs. In 2004, for example, it launched its so-called “Rectangular Strategy for Growth, Employment, Equity and Efficiency”. The promotion of SMEs and entrepreneurship formed an integral part of one of this strategy’s four pillars, whose focus was on development and employment in the private sector. That same year, the government also created a dedicated sub-committee for SMEs, as well as a special development framework for these companies. The goal was to identify barriers and provide solutions to help MSMEs to develop (Baily, 2008). In its National Strategic Development Plan for 2014-18, meanwhile, the Cambodian government set out a range of policies to cut red tape for MSMEs, including by making it easier, quicker, and cheaper to register a business, and by improving their access to credit (RGC, 2014). Furthermore, Cambodia’s policy framework for industrial development for 2015-25 called for the expansion and modernisation of MSMEs across the country (RGC, 2015). Even more recently, the government introduced a set of tax incentives for MSMEs that operate in specified priority sectors such as agriculture and information technology (DFDL, 2018).
The government’s supportive measures have helped MSMEs to grow, with the number of registered businesses in this category increasing every year. However, recent reports show that there is still plenty of room for improvement in comparison with other countries in ASEAN. For example, data from the World Bank have rated the business environment in Cambodia as being below average for ASEAN, especially in terms of market entry, power infrastructure, and regulatory environment (World Bank, 2018).
Human resources is one of the most pressing issues that Cambodia’s MSMEs face as they seek to develop. As is apparent from statistics from the International Labour Organisation, many MSMEs in Cambodia have difficulties in acquiring and retaining skilled workers, due to the limited size of the country’s pool of skilled labour (Figure 3.8.1). Moreover, most skilled workers prefer to work in large corporations, which usually offer better benefits than MSMEs in terms of wages, social security, and other forms of welfare (JICA, 2015). Unlike large companies – which tend to have well-established employee training programmes and can afford on-the-job training – MSMEs are more reliant on public education and training systems. Indeed, the skills shortage for medium-sized companies is most common for occupations such as plant and machine operators and assemblers, managers, service and sales workers, and technicians and associate professionals (NEA, 2016).
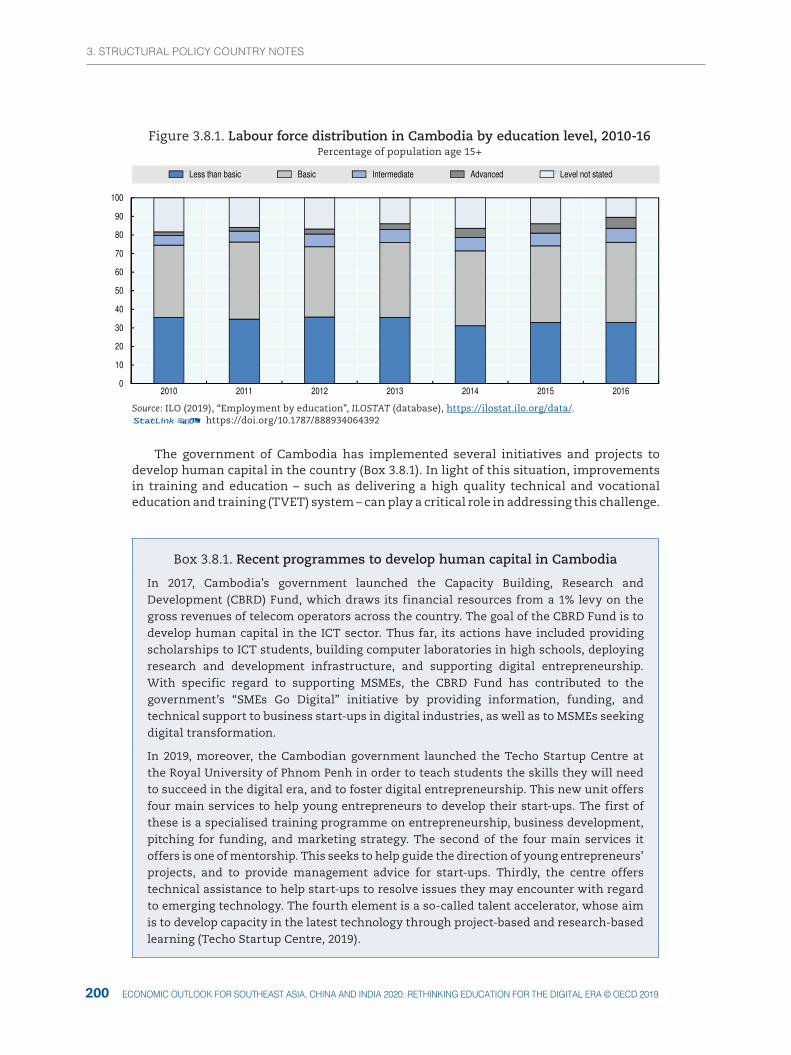
3. STRUCTURAL pOLICy COUNTRy NOTES
201200 ECONOMIC OUTLOOK FOR SOUTHEAST ASIA, CHINA AND INDIA 2020: RETHINKING EDUCATION FOR THE DIGITAL ERA © OECD 2019
Figure 3.8.1. Labour force distribution in Cambodia by education level, 2010-16Percentage of population age 15+
0
10
20
30
40
50
60
70
80
90
100
2010 2011 2012 2013 2014 2015 2016
Less than basic Basic Intermediate Advanced Level not stated
Source: ILO (2019), “Employment by education”, ILOSTAT (database), https://ilostat.ilo.org/data/.12 https://doi.org/10.1787/888934064392
The government of Cambodia has implemented several initiatives and projects to develop human capital in the country (Box 3.8.1). In light of this situation, improvements in training and education – such as delivering a high quality technical and vocational education and training (TVET) system – can play a critical role in addressing this challenge.
Box 3.8.1. Recent programmes to develop human capital in Cambodia
In 2017, Cambodia’s government launched the Capacity Building, Research and Development (CBRD) Fund, which draws its financial resources from a 1% levy on the gross revenues of telecom operators across the country. The goal of the CBRD Fund is to develop human capital in the ICT sector. Thus far, its actions have included providing scholarships to ICT students, building computer laboratories in high schools, deploying research and development infrastructure, and supporting digital entrepreneurship. With specific regard to supporting MSMEs, the CBRD Fund has contributed to the government’s “SMEs Go Digital” initiative by providing information, funding, and technical support to business start-ups in digital industries, as well as to MSMEs seeking digital transformation.
In 2019, moreover, the Cambodian government launched the Techo Startup Centre at the Royal University of Phnom Penh in order to teach students the skills they will need to succeed in the digital era, and to foster digital entrepreneurship. This new unit offers four main services to help young entrepreneurs to develop their start-ups. The first of these is a specialised training programme on entrepreneurship, business development, pitching for funding, and marketing strategy. The second of the four main services it offers is one of mentorship. This seeks to help guide the direction of young entrepreneurs’ projects, and to provide management advice for start-ups. Thirdly, the centre offers technical assistance to help start-ups to resolve issues they may encounter with regard to emerging technology. The fourth element is a so-called talent accelerator, whose aim is to develop capacity in the latest technology through project-based and research-based learning (Techo Startup Centre, 2019).

3. STRUCTURAL pOLICy COUNTRy NOTES3. STRUCTURAL pOLICy COUNTRy NOTES
201ECONOMIC OUTLOOK FOR SOUTHEAST ASIA, CHINA AND INDIA 2020: RETHINKING EDUCATION FOR THE DIGITAL ERA © OECD 2019
Box 3.8.1. Recent programmes to develop human capital in Cambodia
Furthermore, the government is currently planning to set up a skills-development fund (ASEAN, 2019). The aim of this fund is to establish a trusted financing platform outside of normal government budgetary channels to support both pre-employment training and an upgrade of skills in the existing workforce thanks to a cost-sharing initiative with the private sector. The expectation is that this will help to provide workers with timely training for the most in-demand skills. In so doing, it will help respond to the fast-changing demands of an increasingly advanced technological economy, while also raising productivity, competitiveness, and incomes among Cambodia’s MSMEs (ADB, 2018).
Improving technical and vocational education in Cambodia to assist the development of MSMEs
Technical and vocational education and training (TVET) in Cambodia features a formal system that operates in parallel to traditional education. There is also a non-formal system of TVET, in which a wide variety of stakeholders – such as private-sector firms, non-governmental organisations (NGOs), and local-government authorities – provide training programmes. These tend to be relatively short in length (UNESCO, 2015). Under the formal TVET system, students who have completed nine years of compulsory general education may then choose – at the upper-secondary level – between three years of TVET or three more years of general education. Upper-secondary TVET programmes offer training in areas including vehicle maintenance, general mechanics, computer technology, and civil engineering. For students who finish twelve years of education, it is possible to enter formal tertiary TVET programmes at technical and professional training institutions, polytechnics, and other vocational training centres or schools. Meanwhile, informal TVET training is mainly provided by provincial and vocational training centres (PTCs & VTCs), private-sector actors, and NGOs. As already noted, this latter category tends to feature short courses that last just a few months. They aim mainly to address social dislocation and poverty reduction, particularly in rural areas. Yet despite some successes, the TVET system in Cambodia requires improvements to address three main challenges: a low participation rate, poor quality, and insufficient relevance to employers’ real needs.
Compounding these challenges, there is a widespread perception in Cambodia that TVET education is a second-tier option for those who have “underperformed” academically. This deep-rooted negative perception of TVET, together with the country’s continued emphasis on higher education, has led to a low enrolment rate and a high rate of dropouts (OECD, 2016). Moreover, data from Cambodia’s Ministry for Labour and Vocational Training show that the total amount of people enrolled in TVET programmes has dropped by about 50% over the past six years (MLVT, 2019). Against this backdrop, fostering a positive image of TVET in society, and improving the quality of the programmes on offer, will be key to boosting participation.
The poor quality of TVET is a well-known problem in Cambodia, and it has contributed to the negative perception of this kind of education and to its low levels of participation and general acceptance. According to a survey of employers by Cambodia’s National Employment Agency, the preparedness for work among first-time jobseekers graduating from TVET programmes is – in eight out of ten industries covered by the study – lower than those graduating from general education (NEA, 2016). Moreover, employers perceive
(cont.)

3. STRUCTURAL pOLICy COUNTRy NOTES
203202 ECONOMIC OUTLOOK FOR SOUTHEAST ASIA, CHINA AND INDIA 2020: RETHINKING EDUCATION FOR THE DIGITAL ERA © OECD 2019
TVET alumni as lacking basic soft skills such as teamwork and self-motivation, and as having a bad attitude to work.
Limited financial resources continue to present a major obstacle as Cambodia seeks to deliver accessible and high-quality TVET products and services to students. To improve quality, the government needs to strengthen collaboration with the private sector – through public-private partnerships (PPPs), for instance. It also needs to establish a comprehensive quality-assurance framework across all aspects of TVET, to improve TVET curricula, to boost the capacity of teachers and non-teaching staff, and to upgrade training methods and infrastructure (OECD, 2016).
References
ADB (2018), Toward Adopting a Skills Development Fund for Cambodia, Asian Development Bank, Manila, https://www.adb.org/sites/default/files/publication/401746/adb-brief-090-skills-development-fund-cambodia.pdf.
ASEAN (2019), MSMEs, Key of Cambodia’s Future Economic Success, ASEAN Secretariat, Jakarta, https://asean.org/msmes-key-cambodias-future-economic-success/.
Baily, P. (2008), “Cambodian Small and Medium Sized: Enterprises: Constraints, Policies and Proposals for Their Development”, in Lim, H. (ed.), SME in Asia and Globalization, ERIA Research Project Report 2007-5, pp.1-36, http://www.eria.org/Cambodian%20Small%20and%20Medium%20sized%20Enterprises%20Constraints%20Policies%20and%20Proposals%20for%20their%20Development.pdf.
Chhea, L. (2019), The Current Situation of SME in Cambodia – MSME Financing, Ministry of Industry and Handicraft, Phnom Penh, https://www.unescap.org/sites/default/files/SME%20Financing-Chhea%20Layhy%202019.pdf.
DFDL (2018), Cambodia Tax Update: SME Tax Incentives Announced, DFDL Law Firm, Phnom Penh https://www.dfdl.com/resources/legal-and-tax-updates/cambodia-tax-update-sme-tax-incentives-announced/.
ILO (2019), “Employment by education”, ILOSTAT (database), https://ilostat.ilo.org/data/.
JICA (2015), Project for Strategic Strengthening of Small and Medium Enterprise (SME) Support System: Final Report, Japan International Cooperation Agency, Tokyo, http://open_jicareport.jica.go.jp/pdf/12245049_01.pdf.
MLVT (2019), TVET Statistics Reports 2012-18, Ministry of Labour and Vocational Training, Phnom Penh, http://www.tvetmis.com/public/english/report.php.
MLVT (2017), National Technical Vocational Education and Training Policy 2017-25, Ministry of Labour and Vocational Training, Phnom Penh, http://tvetsdp.ntb.gov.kh/2018/02/05/download/.
NEA (2016), Skills Shortages and Skills Gaps in the Cambodian Labour Market: Evidence from Employer Skills Needs Survey 2015, National Employment Agency, Ministry of Labour and Vocational Training, Phnom Penh, http://www.nea.gov.kh/images/survay/Report_Cambodia_2015.pdf.
OECD (2016), Economic Outlook for Southeast Asia, China and India 2016: Enhancing Regional Ties, OECD Publishing, Paris, http://dx.doi.org/10.1787/saeo-2016-en.
RGC (2015), Cambodia Industrial Development Policy 2015-25, Royal Government of Cambodia, http://www.mih.gov.kh/File/UploadedFiles/12_9_2016_4_29_43.pdf.
RGC (2014), National Strategic Development Plan 2014-18, Royal Government of Cambodia, Phnom Penh, http://www.cdc-crdb.gov.kh/cdc/documents/NSDP_2014-2018.pdf.
Techo Startup Centre (2019), What We Do, Techo Startup Centre, Phnom Penh, http://techostartup.center/what-we-do.
UNESCO (2015), World TVET Database: Cambodia, UNESCO-UNEVOC International Centre for Technical and Vocational Education and Training, Bonn, https://unevoc.unesco.org/wtdb/worldtvetdatabase_khm_en.pdf.
World Bank (2018), Doing Business (database), World Bank, Washington, DC, http://www.doingbusiness.org/en/data.

3. STRUCTURAL pOLICy COUNTRy NOTES3. STRUCTURAL pOLICy COUNTRy NOTES
203ECONOMIC OUTLOOK FOR SOUTHEAST ASIA, CHINA AND INDIA 2020: RETHINKING EDUCATION FOR THE DIGITAL ERA © OECD 2019
0 10 000 20 000 30 000 50 00040 000
GDP growth rates (percentage changes)
Composition of imports, 2018(percentage of total imports)
Mineral products41%
Machinery/electrical
15%
Metals11%
Vegetableproducts
7%
Textiles5%
Others21%
Machinery/electrical26%
Mineral products17%
Transportation11%
Metals10%
Chemicals & alliedindustries
9%
Others27%
0
1
2
3
4
5
6
7
8 2013-17 (average) 2019 2020-24 (average)
Lao PDR ASEAN-10average
Emerging Asiaaverage
Source: OECD Development Centre.
Source: IMF.
Source: Trademap. Source: Trademap.
Composition of exports, 2018(percentage of total exports)
Lao PDR
OECD average
Emerging Asia average
ASEAN-10 average
Lao PDR
GDP per capita, 2018 (PPP, current international dollar)
Structural policy challenges discussed in previous editions of the Outlook
2014 Poverty Reducing poverty through inclusive growth
Natural-resource management Improving national resource management, in particular in mining, to ensure environmental sustainability
Infrastructure Developing transport infrastructure to speed up rural development
2016 Natural resources Managing the boom in natural resources
Small and medium-sized enterprises (SMEs)
Fostering the development of SMEs
Tourism Promoting travel and tourism
2017 Hydro-power development Promoting small hydropower projects
Special Economic Zones (SEZs) Strengthening skills to make the most of the country’s SEZs
Tourism Boosting tourism by fully exploring opportunities in the Association of Southeast Asian Nations (ASEAN)
2018 Education Improving access to education and reducing disparities
2019 Energy Diversifying Lao PDR’s energy portfolio by developing solar power
A. Medium-term economic outlook(forecast, 2020-24 average)GDP growth (percentage change): 6.8Current account balance (% of GDP): -9.1
B. Basic data (in 2018)Total population: 6.9 million (in 2017) *Population of Vientiane: 0.9 million (in 2017) *Nominal GDP (US dollar): 18.4 billion **GDP per capita at PPP: 7 924.6 (current International Dollar) **Exchange rate in the first half of 2019 (period average): 8 583.2 (LAK/USD)
Note: * Population data are mid-year government estimates.
** IMF estimate.Sources: OECD Development Centre, national sources, CEIC and IMF.

3. STRUCTURAL pOLICy COUNTRy NOTES
205204 ECONOMIC OUTLOOK FOR SOUTHEAST ASIA, CHINA AND INDIA 2020: RETHINKING EDUCATION FOR THE DIGITAL ERA © OECD 2019
POLICY FOCUS
Promoting export-oriented organic agriculture
Over the past few decades of Lao PDR’s economic development, the industrial and services sectors have made increased contributions to growth. Yet growth in the country’s agricultural sector has been stagnant in recent years, falling below the government’s target. Still, despite expanding at a lower rate than other sectors and not living up to the goals of the government in Vientiane, agriculture still plays an important role in Lao PDR’s overall economy, employing over 65% of the country’s labour force (MPI, 2016). Moreover, agricultural products still count among the country’s top five exports (OECD, 2018). Given its existing domestic importance and its potential to make a bigger contribution to growth and exports, bolstering the development of Lao PDR’s agricultural sector will play an important role in maintaining sustainable and inclusive growth in the country. In its five-year socio-economic development plan for 2016-20, the country’s government recognised this potential, highlighting the role that an increased deployment of organic agriculture and modern technology can play in developing Lao PDR’s agriculture and forestry sectors, and in increasing agricultural production.
The rollout of organic agriculture in Lao PDR is at an early stage but has strong potential
At its core, organic agriculture avoids using synthetic inputs such as artificial fertilisers, pesticides, or herbicides. Instead, it relies on organic fertilisers such as manure and vegetable-based compost. It also uses organic methods to maximise food production, such as introducing natural predators to remove pests. Organic agricultural products have a reputation for being safer to consume, for boosting human health, and for tasting better too. Evidence from scientific research, field trials, and farm experience, also shows that organic agriculture tends to be more environmentally friendly when it comes to its impact on the use of pesticides, the boost it provides to biodiversity, and the way in which it strengthens the environment’s resilience to effects of climate change, such as drought (OECD, 2003).
Non-governmental organisations (NGOs) were the first to introduce the modern concept of organic and sustainable agriculture to Lao PDR in the 1990s. With help from foreign donors, the government’s agriculture agency subsequently introduced several initiatives to provide more systematic support for organic agriculture, such as the “Promotion of Organic Farming and Marketing in Lao PDR”, which ran from 2004-11. These initiatives have made contributions over the past decades to the proliferation of organic agricultural knowledge, to the marketing efforts of organic food and to the creation and improvement of an accompanying regulatory environment. Lao PDR’s government approved its first national organic standards in 2005. Then, in 2008, it created the Lao Certification Body, aiming to promote organic production by offering a domestic system of certification. Since 2008, certified organic agriculture in Lao PDR has been growing steadily.
Although there has been progress, the development of organic agriculture in Lao PDR is still at early stage. As of 2017, around 7 668 hectares of farmland were being used specifically for the cultivation of organic agricultural products. That accounted for just 0.32% of total farmland in Lao PDR (Figure 3.9.1). Although market-driven commercial production of organic products remains modest in Lao PDR, there is vast potential to expand the organic sector. This is because around 80% of the rural population in Lao PDR still depends on subsistence agriculture (FAO, 2019), and most of these subsistence farmers follow traditional methods of production that make little use of external and

3. STRUCTURAL pOLICy COUNTRy NOTES3. STRUCTURAL pOLICy COUNTRy NOTES
205ECONOMIC OUTLOOK FOR SOUTHEAST ASIA, CHINA AND INDIA 2020: RETHINKING EDUCATION FOR THE DIGITAL ERA © OECD 2019
synthetic inputs such as chemical fertilisers. If the necessary technical and marketing assistance is forthcoming, it is possible to turn subsistence farms organic at a relatively low extra cost.
Figure 3.9.1. Organic farming area in ASEAN, 2017
0
0.2
0.4
0.6
0.8
1
1.2
1.4
1.6
1.8
0
50 000
100 000
150 000
200 000
250 000
Cambodia Indonesia Lao PDR Malaysia Myanmar Philippines Thailand Viet Nam
%Hectares
Organic farmland (LHS) Organic share of total farmland (RHS)
Source: FiBL (2019), “Key indicators on organic agriculture worldwide”, FiBL Statistics (database), https://statistics.fibl.org/world/markets-trade-world.html. 12 https://doi.org/10.1787/888934064411
The domestic market for organic products remains limited, but global markets are booming
The development of organic agriculture faces several critical challenges in the domestic market. One of these challenges is that despite the market having grown somewhat, overall domestic demand for organic products remains relatively low in Lao PDR. A survey conducted in 2015 suggested that only 34.3% of the population bought organic products (Kousonsavath, Vagneron and Xiong, 2018). Another challenge to overcome is that only a limited number of shops dedicate themselves to stocking organic agricultural products, and even then the variety tends to be limited as organic coffee accounts for 71.8% of total organic production in the country (UNCTAD, 2012). In addition, a key challenge confronting the development of organic food in Lao PDR is that local consumers are less willing to pay a price premium for organic products than are foreign or expatriate customers. Statistics from AgroAsie, an organic shop in Vientiane, show that 95% of its customers are foreign expatriates, with the majority being Europeans and Americans. Only 5% of AgroAsie’s customers are locals (Sibounnavong et al., 2012).
Nevertheless, the popularity of organic products is on the rise around the world, and the global market for organic agriculture grew more than six-fold from 2000-17, rising to 92 billion euros from a baseline of EUR 15 billion (Willer and Lernoud, 2019). As of 2017, the biggest organic market by region in the world was North America, accounting for 46.7% of the global market, followed by Europe at 40.6% and Asia at 10.4% (Figure 3.9.2). Within Asia, Japan and South Korea are key markets for organic food. Still, growth in China has been especially notable, with the organic market there expanding from merely EUR 0.4 billion in 2007 to EUR 7.6 billion in 2017. Growth in the Indian market has also been significant, from EUR 7.8 million in 2008 to EUR 186 million in 2017 (FiBL, 2019). In light of the exciting potential of markets of organic products in Asia and beyond, the development of organic agriculture in Lao PDR could, in the medium term, benefit from ratcheting up its exports to these more mature regional and international organic markets. As it

3. STRUCTURAL pOLICy COUNTRy NOTES
207206 ECONOMIC OUTLOOK FOR SOUTHEAST ASIA, CHINA AND INDIA 2020: RETHINKING EDUCATION FOR THE DIGITAL ERA © OECD 2019
looks ahead to these opportunities, however, Lao PDR will need to address a range of key challenges in order to strengthen the competitiveness of its organic sector.
Figure 3.9.2. Global organic markets by region, 2008-17Retail sales in million Euros
0
10 000
20 000
30 000
40 000
50 000
60 000
70 000
80 000
90 000
100 000
2008 2009 2010 2011 2012 2013 2014 2015 2016 2017
Oceania Latin America North America Europe Asia Africa
Source: FiBL (2019), “Organic markets and trade”, FiBL Statistics (database), https://statistics.fibl.org/world/markets-trade-world.html.12 https://doi.org/10.1787/888934064430
Strengthening the competitiveness of organic exports from Lao PDR
Improving the quality of its organic products will be the key factor in making sure that Lao PDR succeeds in growing the international appetite for these potential exports. Indeed, while Lao PDR has already gained some experience of exporting certified organic products to Europe and rest of Asia, issues of quality and low added value have tended to hamper its overall performance as an exporter of such goods. Indeed, it will be necessary to improve standards both of quality and safety in order for organic products from Lao PDR to win acceptance and demand from foreign consumers. Developing internationally recognisable local organic brands that enjoy a proven track record of quality would help to build this kind of consumer confidence in the new markets that present opportunities for Lao PDR’s budding organic agriculture sector.
As it seeks to boost the organic sector, the government of Lao PDR also needs to strengthen co-ordination among the key stakeholders in organic agriculture and trade. These include not just organic producers, but also other businesses that are active in the supply and export chains, in addition to a range of government agencies and financial institutions (UNCTAD, 2017).
Meanwhile, drafting a framework of national regulation on organic agriculture and organic trade could help to clarify and streamline the process of organic agricultural production, processing, certification, and exportation. In addition, it will also be important to create an effective information distribution platform capable of making vital and timely information accessible to local producers and traders, so that they can learn more about organic trade and what end consumers in export markets are looking for.
In addition to addressing the quality and supply of organic products from Lao PDR, good marketing will also be necessary in order to introduce the country’s organic products to potential buyers. In this connection, the rise of e-commerce points to a promising channel to promote organic products across long distances, even as traditional methods such as bilateral agreements between governments retain great relevance when it comes to opening up new markets.

3. STRUCTURAL pOLICy COUNTRy NOTES3. STRUCTURAL pOLICy COUNTRy NOTES
207ECONOMIC OUTLOOK FOR SOUTHEAST ASIA, CHINA AND INDIA 2020: RETHINKING EDUCATION FOR THE DIGITAL ERA © OECD 2019
References
FAO (2019), “Laos at a glance”, FAO in Laos, Food and Agriculture Organization of the United Nations, http://www.fao.org/laos/fao-in-laos/laos-at-a-glance/en/.
FiBL (2019), “Key indicators on organic agriculture worldwide”, FiBL Statistics (database), https://statistics.fibl.org/world/markets-trade-world.html.
Kousonsavath, C., I. Vagneron and M. Xiong (2018), Boosting the Demand for Organic Products: The Role of Consumer Trust and Product Availability, Market and Agricultural Linking Chains in Asia, https://www.malica.org/publications/policy-brief.
MPI (2016), 8th Five-Year National Socio-Economic Development Plan (2016-20), Ministry of Planning and Investment in Lao PDR, http://www.la.one.un.org/images/publications/8th_NSEDP_2016-2020.pdf.
OECD (2018), Economic Outlook for Southeast Asia, China and India 2019: Towards Smart Urban Transportation, OECD Publishing, Paris, https://doi.org/10.1787/saeo-2019-en.
OECD (2003), Organic Agriculture: Sustainability, Markets and Policies, OECD Publishing, Paris, https://doi.org/10.1787/9789264101517-en.
Sibounnavong, P. et al. (2012), Organic Agriculture in Lao PDR, Faculty of Agriculture, National University of Lao PDR, Vientiane, http://afh-jp.com/pdf/laos.pdf.
UNCTAD (2017), 6th Lao Organic Agriculture Forum (LOAF 6): Expanding Organic Exports Through Sustainability Standards, https://unctad.org/en/pages/MeetingDetails.aspx?meetingid=1662.
UNCTAD (2012), Organic Agriculture in Lao PDR: Overview, United Nations Conference on Trade and Development, https://unctad.org/meetings/en/SessionalDocuments/DITC_TED_OA1212LOAF_OAinLao.pdf.
Willer, H. and J. Lernoud (2019), The World of Organic Agriculture: Statistics and Emerging Trends 2019, Research Institute of Organic Agriculture (FiBL), Frick, and IFOAM-Organics International, Bonn.
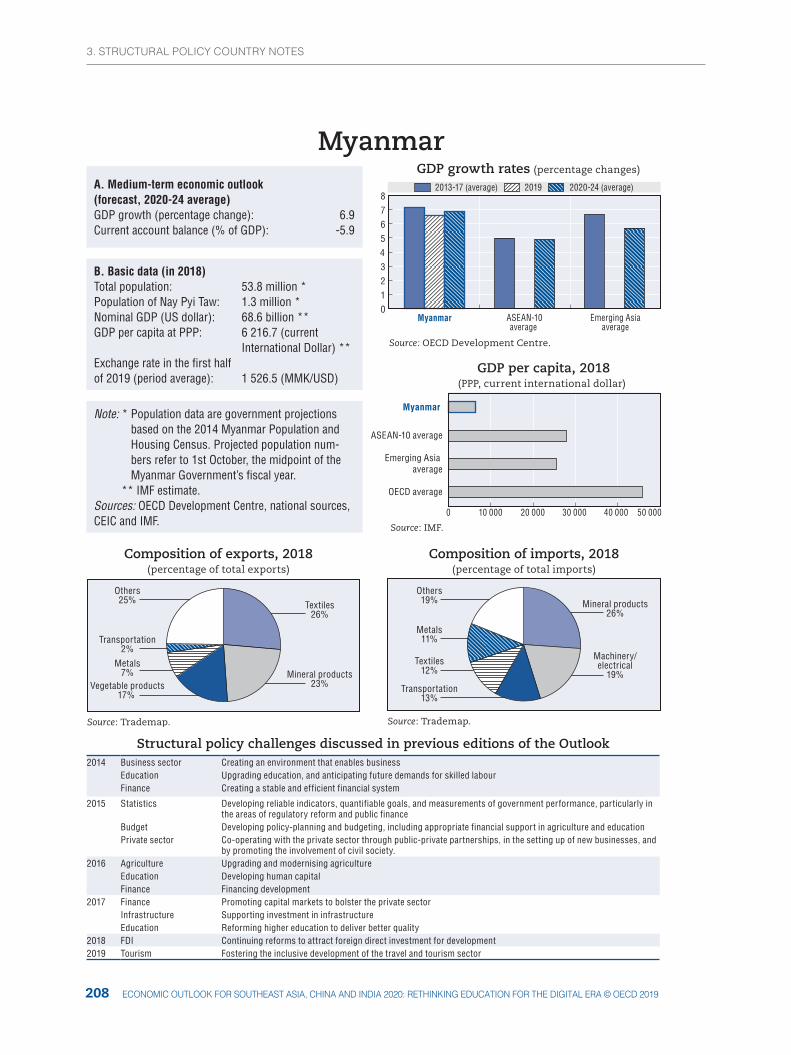
3. STRUCTURAL pOLICy COUNTRy NOTES
209208 ECONOMIC OUTLOOK FOR SOUTHEAST ASIA, CHINA AND INDIA 2020: RETHINKING EDUCATION FOR THE DIGITAL ERA © OECD 2019
0 10 000 20 000 30 000 40 000 50 000
GDP growth rates (percentage changes)
Textiles26%
Mineral products23%Vegetable products
17%
Metals7%
Transportation2%
Others25% Mineral products
26%
Machinery/electrical
19%Transportation
13%
Textiles12%
Metals11%
Others19%
0
1
2
3
4
5
6
7
8 2013-17 (average) 2019 2020-24 (average)
Myanmar ASEAN-10average
Emerging Asiaaverage
Source: IMF.
Source: Trademap. Source: Trademap.
OECD average
Emerging Asia average
ASEAN-10 average
Myanmar
Composition of exports, 2018(percentage of total exports)
Composition of imports, 2018(percentage of total imports)
Myanmar
GDP per capita, 2018(PPP, current international dollar)
Source: OECD Development Centre.
Structural policy challenges discussed in previous editions of the Outlook2014 Business sector Creating an environment that enables business
Education Upgrading education, and anticipating future demands for skilled labourFinance Creating a stable and efficient financial system
2015 Statistics Developing reliable indicators, quantifiable goals, and measurements of government performance, particularly in the areas of regulatory reform and public finance
Budget Developing policy-planning and budgeting, including appropriate financial support in agriculture and educationPrivate sector Co-operating with the private sector through public-private partnerships, in the setting up of new businesses, and
by promoting the involvement of civil society.2016 Agriculture Upgrading and modernising agriculture
Education Developing human capitalFinance Financing development
2017 Finance Promoting capital markets to bolster the private sectorInfrastructure Supporting investment in infrastructureEducation Reforming higher education to deliver better quality
2018 FDI Continuing reforms to attract foreign direct investment for development2019 Tourism Fostering the inclusive development of the travel and tourism sector
A. Medium-term economic outlook(forecast, 2020-24 average)GDP growth (percentage change): 6.9Current account balance (% of GDP): -5.9
B. Basic data (in 2018)Total population: 53.8 million *Population of Nay Pyi Taw: 1.3 million *Nominal GDP (US dollar): 68.6 billion **GDP per capita at PPP: 6 216.7 (current International Dollar) **Exchange rate in the first half of 2019 (period average): 1 526.5 (MMK/USD)
Note: * Population data are government projections based on the 2014 Myanmar Population and Housing Census. Projected population num-bers refer to 1st October, the midpoint of the Myanmar Government’s fiscal year.
** IMF estimate.Sources: OECD Development Centre, national sources, CEIC and IMF.

3. STRUCTURAL pOLICy COUNTRy NOTES3. STRUCTURAL pOLICy COUNTRy NOTES
209ECONOMIC OUTLOOK FOR SOUTHEAST ASIA, CHINA AND INDIA 2020: RETHINKING EDUCATION FOR THE DIGITAL ERA © OECD 2019
POLICY FOCUS
Unleashing the potential of the railways
Land transport – and rail-transport infrastructure in particular – have increasingly been in the spotlight in Myanmar in recent times, as the country seeks to accelerate its development and maintain strong economic growth. The rail sector has not, however, been in the news because it is playing an important role in the country’s economic development, but because it is in regrettable decline. Between 2010 and 2014, overall passenger travel by rail in Myanmar has declined by 21%, according to a study by the Asian Development Bank (ADB, 2016). Over the same period, passenger numbers on the inter-city trains of Myanma Railways (MR) declined by 36%. Indeed, road transport has become a strong competitor to these rail passenger services, despite the relatively low fares on the MR network. Nearly 75% of passengers’ journeys are short, involving distances under 150 kilometres. As a result, it is often convenient to substitute them for rides by bus or in private vehicles. Indeed, these modes of transport are frequently preferred to train rides because MR’s inter-city services have a reputation for providing a poor-quality service. This includes trains running at slow speeds, crowded and uncomfortable carriages, and frequent delays due to equipment failures and track restrictions.
Commercial freight traffic on MR’s trains has also declined. As of the 2013-14 fiscal year, MR had a market share of just 5% for freight transport overall, and just 1.5% for commercial freight traffic in particular. In fact, even though its tariffs compared favourably with highway logistics, MR’s lack of necessary operating resources led to a decline in the volume of freight traffic that uses its services. This lack of resources includes deficiencies both of rolling stock and of the kinds of locomotives that can provide traction power for dedicated freight trains on Myanmar’s two key freight corridors – Yangon-Mandalay, and Mandalay-Mytkina – which accounted for 87% of MR’s commercial freight traffic in 2013. The other major deficiencies that MR suffers from include an insufficient capacity for modern bulk handling, and an absence of container-transport services. Against this backdrop of meagre resources, both the quality of MR’s service, and the volume of traffic on its trains, have been in decline. In turn, this has prevented Myanmar’s railway system from maximising its utility, and has resulted in sub-optimal railway efficiency and financial performance.
Shifting the focus of policy goals from laying new track to sector-wide efficiency gains
As of the fiscal year of 2014, MR’s freight revenues covered only 65% of the total costs of the corresponding service in terms of operations and infrastructure. The overall cost-coverage ratio for passenger rail services, moreover, was as low as 37% (ADB, 2016). The limited extent to which revenue-generating services cover costs stems from the fact that many of the government’s investments in the rail sector have been for new tracks. Furthermore, these investments have mainly gone into expanding the tertiary network, which hosts small traffic. While expanding the network makes a contribution to gross fixed capital formation for Myanmar’s transport sector, its productivity has been low, as suggested by low cost-coverage ratios and rail track density.
There is room for improvements on efficiency of recent Myanmar’s capital investments. Indeed, the upkeep of old and ageing coaches and wagons, the cost of manual maintenance of the tracks, and the poor fuel efficiency of old locomotives, have kept operating costs high. Moreover, the poor condition of Myanmar’s railway tracks, and a lack of signaling, train-control, and communications systems, have further obstructed the quest to improve the quality of service that MR can provide, while also contributing to the ongoing decline of traffic volumes. High operating costs coupled with low revenues

3. STRUCTURAL pOLICy COUNTRy NOTES
211210 ECONOMIC OUTLOOK FOR SOUTHEAST ASIA, CHINA AND INDIA 2020: RETHINKING EDUCATION FOR THE DIGITAL ERA © OECD 2019
have resulted in an unsustainable operating ratio, nullifying the value created by the gross fixed capital formation that resulted from expansions to the network.
Against this backdrop, Myanmar’s investment priorities with regard to its rail network need to pay more attention to improve the operational performance of critical railway assets. Among these critical assets is the Yangon Circular Railway. Myanmar’s other critical railway assets include the infrastructure and rolling stock of the six out of 34 of MR’s routes. These include the Yangon-Mandalay trunk line. They also include secondary lines between Amarapura and Mytkina, Kemendine and Pyay, Pathein and Kyangin, Pyudwin and Chauk, and Naungpattaya and Mawlamyine.
As far as the railway sector is concerned, the government injected approximately USD 405 million, or around 620 billion Myanmar kyat (MMK), into capital investments in Myanmar Railways from 2009-14. It is recommended that Myanmar maintain an investment trend of around USD 100 million a year, albeit in line with modified priorities that aim for a revival of the system rather than ploughing ahead with extensive growth. Ensuring a meaningful revival of the railway sector will require the government to get the system onto a sound financial footing, making it self-sustaining by improving the efficiency of its operations and achieving an adequate ratio of cost-coverage. Making performance-oriented investments to put the railways on a sound financial footing is critical. The government needs to pave the way for efficient and consistent pricing systems. These would allow the railway system to cover its long-term marginal costs while capturing more revenue as improvements in service allow MR to charge higher prices as it competes with other forms of transport
Scenarios of railway revival point to a much better future, heralding many opportunities
Efforts to revive MR’s freight operations should seek to improve performance by prioritising the expansion of existing services, and by exploring operational efficiencies. Some other measures that can help improve performance include better allowing for the seamless transport of the containers that come off of freight ships, and a proactive marketing strategy that seeks to take MR’s services into new markets. In order to deliver such improvements, Myanmar will need to channel capital investments into priorities such as the modernisation of equipment for loading and unloading freight trains, in addition to other facilities that allow the efficient handling of freight. Priority areas for capital investment will also need to include the introduction of container train services and inter-modal facilities such as inland container depots. Furthermore, another key priority for investment will be the repowering or replacement of existing locomotives. In addition, the Mandalay to Mytkina section of railway – which shares a major portion of freight traffic with the trunk line – may also require investments in extra track capacity in order to designate a dedicated freight corridor.
The government has now started work on the Myanma Railways Transformation Plan, signalling that efforts to increase efficiency and asset utilisation on the country’s railways are now underway. Moreover, with projections for traffic volumes predicting a moderate increase, Myanmar’s transport and communication ministry has set its sights on increasing the cost-coverage ratio. Furthermore, upgrade projects on corridors that form strategic priorities under the new transformation plan are either about to commence or are under consideration for financing. The government of Myanmar is looking to provide financing for the Yangon to Mawlamyine line. In a further sign of progress, the transport and communication ministry has, since 2017, been discontinuing loss-making services on tertiary and quaternary lines.
To conclude, Myanmar’s railway sector has been weakening due to the declining numbers of passenger and freight traffic. Poor-quality service and lack of necessary operating resources are among the challenges that will need to be addressed to allow Myanmar’s railway system to maximise its utility, as well as to improve its efficiency and financial performance. Potential policy measures include focusing the country’s

3. STRUCTURAL pOLICy COUNTRy NOTES3. STRUCTURAL pOLICy COUNTRy NOTES
211ECONOMIC OUTLOOK FOR SOUTHEAST ASIA, CHINA AND INDIA 2020: RETHINKING EDUCATION FOR THE DIGITAL ERA © OECD 2019
rail network investment policy more to improve the operational performance of critical railway assets rather than expanding a tertiary network, which hosts a limited amount of traffic. It is also crucial to ensure efficient and consistent pricing systems, improve railway services, modernise equipment for efficient handling of freight, introduce container train services and inter-modal facilities, and renovate and upgrade existing locomotives.
Reference
ADB (2016), “Myanmar Transport Sector Policy Note - Summary for Decision Makers”, Asian Development Bank, Manila, https://www.adb.org/sites/default/files/publication/184794/mya-transport-policy-note-es.pdf.

213

213ECONOMIC OUTLOOK FOR SOUTHEAST ASIA, CHINA AND INDIA 2020: RETHINKING EDUCATION FOR THE DIGITAL ERA © OECD 2019

3. STRUCTURAL pOLICy COUNTRy NOTES
215214 ECONOMIC OUTLOOK FOR SOUTHEAST ASIA, CHINA AND INDIA 2020: RETHINKING EDUCATION FOR THE DIGITAL ERA © OECD 2019
0
GDP growth rates (percentage changes)
Source: OECD Development Centre.
10 000 20 000 30 000 40 000 50 000
Machinery/electrical
47%
Textiles12%
Metals8%
Chemicals & alliedindustries
6%
Transportation5%
Others22% Machinery/
electrical37%
Mineral products25%
Chemicals & alliedindustries
8%
Transportation6%
Metals6%
Others18%
0
1
2
3
4
5
6
7
8 2013-17 (average) 2019 2020-24 (average)
China ASEAN-10average
Emerging Asiaaverage
Source: IMF.
OECD average
Emerging Asia average
ASEAN-10 average
China
GDP per capita, 2018(PPP, current international dollar)
Source: Trademap. Source: Trademap.
Composition of exports, 2018(percentage of total exports)
Composition of imports, 2018(percentage of total imports)
China
Structural policy challenges discussed in previous editions of the Outlook2014 Fiscal policy Improving fiscal efficiency through institutional reform
2015 Environment Increasing clean-energy consumption in response to the serious environmental degradation that persists despite the country’s efforts to reduce pollution
Rural development Expanding rural and agricultural development to help improve equality between urban and rural areas
Education and skills Continuing with reforms and improving education in order to exploit the service sector’s potential to drive future growth
2016 Environment Strengthening environmental regulations to improve the quality of growth
Education and skills Upgrading human capital to help expand the value-added economy
Rural development Boosting rural development to ensure robust growth in incomes
2017 Capacity utilisation Working off excess capacity
Environment Upgrading the quality of the environment
2018 Connectivity and integration
Unlocking synergies with the Belt and Road Initiative
2019 Innovation Making innovation a new driver of growth
A. Medium-term economic outlook(forecast, 2020-24 average)GDP growth (percentage change): 5.6Current account balance (% of GDP): 0.1Fiscal balance (% of GDP) (central government): -4.1
B. Basic data (in 2018)Total population: 1 395.4 million *Population of Beijing: 21.5 million *Nominal GDP (US dollar): 13 407.4 billion **GDP per capita at PPP: 18 109.8 (current International Dollar) **Exchange rate in the first half of 2019 (period average): 6.8 (RMB/USD)
Note: * Population data are year-end government estimates.
** IMF estimate.Sources: OECD Development Centre, national sources, CEIC and IMF.

3. STRUCTURAL pOLICy COUNTRy NOTES3. STRUCTURAL pOLICy COUNTRy NOTES
215ECONOMIC OUTLOOK FOR SOUTHEAST ASIA, CHINA AND INDIA 2020: RETHINKING EDUCATION FOR THE DIGITAL ERA © OECD 2019
POLICY FOCUS
Allocating investment more efficiently
For many years, investment has been the main driver of China’s robust growth (OECD, 2019). A demographic dividend in the form of a large number of people entering the workforce also spurred growth, although this effect faded over time (Cai and Lu, 2015; Lu and Cai, 2014). Indeed, the working-age population has been falling since the early 2010s, both in absolute terms and as a share of the total population. China’s overall population is still growing as life expectancy has increased steadily in the past decades. Yet this population growth is expected to continue for less than a decade. China’s population will then peak and start shrinking. Moreover, the recent relaxation of the longstanding one-child policy is unlikely to stop this. Against this background, China’s future growth will hinge – alongside productivity dynamics – upon investment in productive capital.
Rebalancing from investment to consumption is advancing, with investment’s contribution to growth shrinking
As China acceded to the World Trade Organisation (WTO) and proceeded to open up its economy, investment was the engine of the double-digit growth that the country experienced in the 2000s (Figure 3.11.1). The expansion of the export sector following WTO accession in 2001 played a crucial role in this rapid investment growth. During this period, massive public investments played a big role in facilitating this economic transformation, and the government occasionally used public investment – primarily in infrastructure – to boost growth when the economy experienced negative shocks. This is what happened in 2009, when a large stimulus package of investment contributed over 8% to growth that year. Following the global financial crisis, the Chinese economy started to rebalance away from a reliance on investment and towards consumption. This “passive” rebalancing is still taking place, as the contribution of investment continues to decrease while the contribution of consumption remains broadly stable.
Figure 3.11.1. Contribution to growth 2000-18: A key role for investment in China
1.95.3 3.6 7.0 6.2
3.8 5.56.3
5.1
8.17.1 4.4
3.4 4.3 3.4 2.9 2.92.3
2.1
-5
-3
-1
1
3
5
7
9
11
13
15
2000 2001 2002 2003 2004 2005 2006 2007 2008 2009 2010 2011 2012 2013 2014 2015 2016 2017 2018
%
Consumption Investment Net exports
Source: CEIC database.12 https://doi.org/10.1787/888934064449
Consistent investment rates of 40-45% over the past decade or so boosted the capital stock and lifted the economy’s potential for growth (Figure 3.11.2). Meanwhile, very high saving rates of 45-50% supported investment, a process that was intermediated through

3. STRUCTURAL pOLICy COUNTRy NOTES
217216 ECONOMIC OUTLOOK FOR SOUTHEAST ASIA, CHINA AND INDIA 2020: RETHINKING EDUCATION FOR THE DIGITAL ERA © OECD 2019
the banking system. In addition to households – the traditional savers – non-financial enterprises were also important contributors to this high rate of saving. Over the past decade, however, the saving rate in China has fallen by around 5%, even as the investment rate has decreased by only about 2%. As the saving rate fell sharper than the investment rate, the current account surplus shrank to below 0.5% of gross domestic product (GDP) in 2018. This fall in the saving rate was mostly driven by decreasing savings in the non-financial corporate sector.
Figure 3.11.2. China’s current account balance, saving rate and investment rate, 1997-2018
-5
0
5
10
15
20
30
35
40
45
50
55
1997 1998 1999 2000 2001 2002 2003 2004 2005 2006 2007 2008 2009 2010 2011 2012 2013 2014 2015 2016 2017 2018
% of GDP% of GDP
Current account balance (RHS) Saving rate (LHS) Investment rate (LHS)
Source: CEIC database.12 https://doi.org/10.1787/888934064468
As a result of massive investment in China in recent decades, the country’s capital stock has accumulated rapidly. In 2018, it reached 2.6 times the size of China’s GDP in real terms. This is a higher level than in the United States, although lower than in Japan or Indonesia (Figure 3.11.3.A). China’s relatively low GDP per capita means that the country fares especially well by comparison to other economies when capital stock is measured against GDP per capita (Figure 3.11.3.B).
Figure 3.11.3. China’s capital stock relative to selected countries
1
1.5
2
2.5
3
3.5
4
4.5
5
Brazil ChinaIndonesia IndiaJapan United States
0
500
1 000
1 500
2 000
2 500
3 000
3 500
4 000
Brazil ChinaIndonesia IndiaJapan United States
A. Capital stock to GDP ratio in multiples B. Capital stock to GDP per capita, in million multiples
Note: Both capital stock and GDP are in national currencies, in real terms. Source: OECD Development Centre’s calculations based on the OECD Economic Projections database.12 https://doi.org/10.1787/888934064487

3. STRUCTURAL pOLICy COUNTRy NOTES3. STRUCTURAL pOLICy COUNTRy NOTES
217ECONOMIC OUTLOOK FOR SOUTHEAST ASIA, CHINA AND INDIA 2020: RETHINKING EDUCATION FOR THE DIGITAL ERA © OECD 2019
Notwithstanding China’s relatively high level of capital stock, the economy still needs investment in several areas. For example, there is a need for infrastructure upgrades in rural areas, and for better connections between suburban areas and cities. Within urban areas, meanwhile, underground structures such as water, gas and other pipes require improvements and electricity wires need to be moved under the ground. China’s industrial capital stock also needs to be upgraded to meet environmental and efficiency standards. This is also true for the country’s agricultural capital stock, in particular when it comes to irrigation systems. Furthermore – and just as China is in the process of leapfrogging ahead in IT-based industries such as mobile payments, crowdfunding, and shared services – the country’s emerging services industries require massive new investments in more sophisticated types of capital (Molnar and Wang, 2015).
Against a backdrop of slowing investment, China needs to place a greater emphasis on the efficiency of investment projects. Indeed, investment efficiency has fallen considerably in recent years, as measured by the incremental capital-output ratio. However, this can partly be attributed to the changing composition of investment. During the period in which China began to accelerate the opening up of its economy following its accession to the WTO, investment was directed mostly into the accumulation of productive capital such as infrastructure or equipment. More recently, however, the share of investment flowing into real estate has increased significantly, approaching three quarters of overall investment in 2019.
Amid falling efficiency and lower returns, and considering the fall in investment in recent years, the investment-led growth model has increasingly proved to be unsustainable. Moreover, the high investment rates that have underpinned growth in recent times have left a challenging legacy. Excessive capacity is plaguing several sectors including construction, steel, cement, aluminium, shipbuilding, flat glass, and electrical and railway equipment. At the same time, corporate debt – which has been accumulated mostly by state-owned enterprises (Molnar and Lu, 2019) – is worryingly high, standing at around 155% of GDP in early 2019. The old growth model has also had significant negative externalities. For example, carbon dioxide emissions have more than tripled in two decades, and air pollution has caused over a million premature deaths.
Allowing the market to play a greater role in the pricing of capital
As the Chinese economy embarks on a more balanced and sustainable growth path, it is important to let the market play a greater role in the allocation of resources and in the pricing of the factors of production. In recent decades, a lack of market forces in the pricing and allocation of capital has translated into a low cost of capital and led to widespread misallocation. Coupled with government officials’ longstanding focus on a single performance indicator – output growth – this has encouraged more and more investment to go into the expansion of production capacity. In the process, local officials competed to attract investment by offering cheap or free land, cheap credit, tax concessions, and other subsidies. Moreover, industrial policy guaranteed cheap credit and energy to favoured sectors, and gave a competitive edge in global markets to capital- and energy-intensive products.
Allowing the market to play a greater role in the allocation of resources and the pricing of production factors will be indispensable as China makes the transition to ensuring a higher quality of economic growth. It will entail removing implicit guarantees to public entities, and ending bail-outs. Hitherto, and owing to the implicit guarantees the state has provided to public borrowers, private businesses get crowded out of the formal market. This is especially the case for smaller companies. In turn, firms have to resort to retained earnings or informal borrowing to finance their activities. In addition, small

3. STRUCTURAL pOLICy COUNTRy NOTES
219218 ECONOMIC OUTLOOK FOR SOUTHEAST ASIA, CHINA AND INDIA 2020: RETHINKING EDUCATION FOR THE DIGITAL ERA © OECD 2019
firms’ access to credit would be enhanced if they were subject to more rigorous reporting and disclosure requirements.
Furthermore, monetary policy has repeatedly come to the rescue of corporates and other public entities by lowering interest rates and reducing reserve requirements in order to boost liquidity and support debt servicing. While this provides an opportunity for firms to re-finance their debt at a lower cost, many of them are not able to borrow to finance more investment. Indeed, falling profitability and already-high leverage curtail firms’ room to further increase their leverage.
Going forward, and as investment slows, a greater emphasis should be put on the allocation efficiency of investment. Market-based pricing of capital, greater transparency both in the investment process and with procurement contracts, and rigorous feasibility studies before investing in projects – as well evaluation studies once they have been completed – are among the steps that would work to that end.
References
Cai, F. and Y. Lu (2015), Take-off, Persistence and Sustainability: The Demographic Factor of Chinese Growth, East Asian Bureau of Economic Research, Canberra, http://www.eaber.org/system/tdf/documents/EABER Working Paper 96 Cai and Lu.pdf?file=1&type=node&id=24834&force=.
Lu, Y. and F. Cai (2014), “China’s shift from the demographic dividend to the reform dividend”, in R. Garnaut, F. Cai and S. Ligang (eds.), Deepening Reform for China’s Long-Term Growth and Development, Australian National University Press, Canberra, http://dx.doi.org/10.22459/DRCLTGD.07.2014.
Molnar, M. and J. Lu (2019), State-owned Enterprises behind China’s Corporate Debt, OECD Publishing, Paris, https://doi.org/10.1787/7c66570e-en.
Molnar, M. and W. Wang (2015), A Snapshot of China’s Service Sector, OECD Publishing, Paris, https://doi.org/10.1787/5js1j19lhbkl-en.
OECD (2019), OECD Economic Surveys: China 2019, OECD Publishing, Paris, https://doi.org/10.1787/eco_surveys-chn-2019-en.

3. STRUCTURAL pOLICy COUNTRy NOTES3. STRUCTURAL pOLICy COUNTRy NOTES
219ECONOMIC OUTLOOK FOR SOUTHEAST ASIA, CHINA AND INDIA 2020: RETHINKING EDUCATION FOR THE DIGITAL ERA © OECD 2019
0
GDP growth rates (percentage change)
10 000 20 000 30 000 40 000 50 000
Mineral products19%
Chemicals & alliedindustries
17%
Textiles14%
Machinery/electrical
12%
Metals10%
Others28%
Mineral products38%
Machinery/electrical
20%Chemicals & allied
industries10%
Metals7%
Plastics/rubber4%
Others21%
1
2
3
4
5
6
7
8
Source: OECD Development Centre.
Source: IMF.
OECD average
Emerging Asia average
ASEAN-10 average
India
Source: Trademap. Source: Trademap.
Composition of exports, 2018(percentage of total exports)
Composition of imports, 2018(percentage of total imports)
India
GDP per capita, 2018(PPP, current international dollar)
0
2013-17 (average) 2019 2020-24 (average)
India ASEAN-10average
Emerging Asiaaverage
Structural policy challenges discussed in previous editions of the Outlook2014 Education Improving teaching and national assessment systems to raise education standards
2015 Manufacturing Restoring growth to reverse the trend of slower growth (and even negative growth in 2013-14) in manufacturing over the past few years
Education Widening access to secondary education in order to meet the goal of universal secondary education by 2017
Health Strengthening the public health system. Improving access to curative and preventative healthcare facilities
Infrastructure Accelerating the development of infrastructure, especially in rural areas
2016 Financial literacy Strengthening financial-education initiatives
Education Enhancing education in terms of both access and quality
2017 FDI Encouraging foreign direct investment (FDI) and promoting the made-in-India brand
Entrepreneurship Strengthening the set of initiatives known as Startup India
2018 Innovation Fostering inclusive innovation to boost growth and development
2019 FDI Continuing FDI reforms and develop opportunities for technology transfer
A. Medium-term economic outlook(forecast, 2020-24 average)GDP growth (percentage change): 6.6Current account balance (% of GDP): -1.6Fiscal balance (% of GDP) (central government): -5.9
B. Basic data (in 2018)Total population: 1 332.0 million *Population of Delhi: 19.4 million *Nominal GDP (US dollar): 2 716.7 billion **GDP per capita at PPP: 7 873.7 (current International Dollar) **Exchange rate in the first half of 2019 (period average): 70.0 (INR/USD)
Note: * Population data are government estimates. Indian data are based on fiscal year ending in March. Population data in 2016 refer to fiscal year 2016/17 ending in March 2017.
** IMF estimate.Sources: OECD Development Centre, national sources, CEIC and IMF.

3. STRUCTURAL pOLICy COUNTRy NOTES
221220 ECONOMIC OUTLOOK FOR SOUTHEAST ASIA, CHINA AND INDIA 2020: RETHINKING EDUCATION FOR THE DIGITAL ERA © OECD 2019
POLICY FOCUS
Strengthening smart land transportation
India has been looking for smart solutions for urban transport as long-standing issues of congestion, pollution and traffic inefficiency persist despite the interventions over the years. These issues weigh on the overall quality of life, especially of those at the lower end of the income spectrum. They also have ramifications on other socio-economic issues such as urbanisation and business climate.
The focus of this country note is on the metropolitan areas of Bangalore, Delhi, Kolkata, and Mumbai. These are four of the most populated urban agglomerations in India. They are also India’s most congested cities, experiencing the slowest-moving traffic in the country (Akbar, et. al., 2018). Indeed, one estimate puts combined congestion cost (in fuel waste, productivity loss, pollution and accident) in these four cities at USD 22 billion per year (Chin, et. al., 2018). As it stands, Bangalore and Delhi are part of the central government’s so-called Smart Cities Mission, while Kolkata and Mumbai do not come under the purview of this initiative. In brief, the Smart Cities Mission aims to retrofit 100 cities to enhance citizen experience and promote sustainability through smart solutions.
India is making ever-deeper use of technology to deliver transport services
Bangalore, Delhi, Kolkata and Mumbai have embarked on a number of transport systems and IT-enabled mechanisms to address the surge in commuter demands over the years (Table 3.12.1). However, while these interventions may have helped ameliorate the conditions, there remain concerns regarding the interconnectedness of the modes of transport; sufficiency and interoperability of mechanisms; and availability of funding to maintain and advance the existing systems.
In 2016, the Bangalore Metropolitan Transport Corporation (BMTC) launched an intelligent transport system – a term whose definition and component technologies vary from one city to another. BMTC’s approach to intelligent transport includes systems for vehicle tracking, electronic ticketing, passenger information, and a data and control centre (Mukherjee, Toshniwa and Mulukutla, 2016). The local government has been making strides in introducing a multi-modal mass transport pass, and at least two expressways are under construction (BMRCL, 2019; MRTH, 2018 and Philip, 2019a). A bus rapid transit system is one mechanism that Bangalore does not have relative to other major urban agglomerations in India.
Delhi has the most sophisticated transport network of all of India’s urban agglomerations. Indeed, Delhi has the most extensive metro lines augmented by a bus rapid transit system. It also has an inter-operable public transport pass that can be used on buses, the metro system, and trains around the urban area (Kejriwal, 2019) – even before the launching of the national common mobility card in March 2019. Furthermore, the local government is gradually rolling out its intelligent traffic-management system (Shekhar, 2018). This mechanism will employ artificial intelligence solutions to lessen human involvement in traffic management, and will hasten procedures such as the issuance of traffic violation tickets by facilitating the entire process electronically.

3. STRUCTURAL pOLICy COUNTRy NOTES3. STRUCTURAL pOLICy COUNTRy NOTES
221ECONOMIC OUTLOOK FOR SOUTHEAST ASIA, CHINA AND INDIA 2020: RETHINKING EDUCATION FOR THE DIGITAL ERA © OECD 2019
Table 3.12.1. Mechanisms employed to manage the flow of road traffic
Mechanism Bangalore Delhi Kolkata Mumbai
Infrastructure
Metro lines
Bus rapid transit X
Express lanes
Bicycle lanes
Train
IT-enabled mechanisms
Road traffic control room
Automated parking management
Sensors, drones, and other traffic monitoring facilities
Electronic toll collection
Ride-sharing platforms
Public transport tracking
Note: =existent; X=non-existent. The table does not compare the safety, quality and extent of coverage of the mechanisms across cities. Information is as of 13 September 2019.Source: OECD Development Centre, based on national sources.
Meanwhile, the city of Kolkata has managed to keep abreast of road transport technology and innovation by adopting a range of approaches, from automated parking to bus tracking and electronic toll collection. The city has also established dedicated lanes for the bus rapid transit system and, in 2017, launched a fare smartcard – doing so ahead of a similar move in Delhi (Sinha, 2019; WBTC, 2018). Although it is not part of the Smart Cities Mission, Kolkata is part of West Bengal’s own Green Cities Mission (HLRN, 2018; GWB, 2018). In line with this framework, the first batch of electric buses of West Bengal Transport Corporation (WBTC) were rolled out just a few months after the publication of the relevant implementation plan (WBTC, 2019).
Elsewhere in India, the city of Mumbai has invested heavily in transport technology and infrastructure over the past decade. In 2011, the local government together with the World Bank closed the first phase of a comprehensive urban transport project that began in 2002, which explored the use of technology in the real-time management of public transport, road congestion, accidents, and other aspects of the transport network (IEG-World Bank, 2016). An intelligent transport management system that utilises machine learning is also currently in the works. The idea is to implement it first in Mumbai before it goes state-wide. Like Kolkata, however, Mumbai is not part of India’s central Smart Cities Mission (HLRN, 2018).
Across India, the use of quick response (QR) codes is one of technologies that is becoming ubiquitous. From the rickshaws and buses in Ranchi city to the car and taxi drivers of Delhi, QR codes are now being utilised both to facilitate payment and to protect passengers (Dyade and Bhande, 2017). The QR code is also being considered as a potential feature for driving licenses, thus doing away with many of the documents that a driver has to keep at the ready for possible inspections. Ride-hailing platforms and GPS tracking applications for public transport are the other commonly used innovations. Other transport and vehicle technologies are being developed and facilitated under separate programmes. These include the Electronic Stability Program, Atal Mission for Rejuvenation and Urban Transformation and National Electric Mobility Mission Plan (GrantThorton, 2016).

3. STRUCTURAL pOLICy COUNTRy NOTES
223222 ECONOMIC OUTLOOK FOR SOUTHEAST ASIA, CHINA AND INDIA 2020: RETHINKING EDUCATION FOR THE DIGITAL ERA © OECD 2019
On the implementation side, the government understands the need to progress further in co-ordinating the technology systems used in managing transportation as noted by the Planning Commission (2014). Improving the gathering and transmission of traffic data through sensors is one of these. Working towards interoperability and uniformity of systems used around the country is another – a concern that prompted the government to create a national register and state registers of driving licences and registration certificates. Standardising the toll-based payment systems and centralising different transportation data are similarly on the table. On the financing side, securing a steady stream of funds to advance the penetration of technology in transport management as well as integrating the systems is also an issue in India, especially at the local level.
Improvements in public transport capacity, staffing and rule-compliance remain crucial
Beyond matters of technology, the efficiency in deepening the absorptive capacity of public transportation options, affecting quality, coverage and reliability of service in the process cannot be overlooked. Evidently, these four urban areas have the highest public transport patronage among large cities in the country, particularly Mumbai and Kolkata, where the rate is estimated to hover around 80% in 2017 (Roychowdhury and Dubey, 2018).
In order to encourage more people to use mass transport, meanwhile, the absorptive capacity and the quality of public transport need to be addressed comprehensively. Of particular concern are delays in the procurement of new buses and train coaches due to institutional and financial frictions. In Delhi, for example, the number of operational buses is estimated to be only between 33% and 50% of the required number (PTI, 2018). In Mumbai, the government is in the process of expanding the metro lines to alleviate congestion in suburban rails, which are operating at 3 to 4 times their capacity, i.e. about 5 000 passengers competing for coach space intended for 1 750 passengers per trip (Saxena, 2019). However, delays and cost overruns hamper the progress of the projects (Bhanushali, et. al., 2018). Delays also hobbled the metro rail initiative in Kolkata (KMRC, 2016). Aside from the poor state of many units that are currently operating, the shortage in buses and metro coaches in many of India’s large urban areas leads to overcrowding. In turn, this results in safety hazards and a higher cost of capital depreciation.
In Bangalore, the increase in the capacity of the city’s metro thanks to the introduction of new six-car trains has managed to steer a significant number of people away from using private transport, and the number of people using public transport has increased (Philip, 2019b). Still, this improvement has brought with it a fresh challenge in terms of integrating different modes of transportation. This is because auto rickshaws and private vehicles have begun lining up in increasing numbers near the metro stations where they set down and pick up passengers, congesting the roads in the process.
Attracting talent is another concern as India seeks to broaden its use of intelligent transport systems. Indeed, the National Institution for Transforming India has observed that graduates of science, technology, engineering, and mathematics courses largely move away from emergent technologies, and are mostly concentrated in routine IT development, while others prefer to ply their trade overseas (NITI Aayog, 2018). The agency also noted weaknesses in quality at many institutions of higher education.
Persistent blockages in arterial roads such as illegally parked cars, street vendors, and other contraptions, constitute another pressing issue. Moving informal vendors and street-settlers, however, requires a broad approach that includes a broadly consultative clearing process, as well as relocation and livelihood plans. Financing limitations underpin many difficulties in improving the hardware capacity of public transport, not to mention that the

3. STRUCTURAL pOLICy COUNTRy NOTES3. STRUCTURAL pOLICy COUNTRy NOTES
223ECONOMIC OUTLOOK FOR SOUTHEAST ASIA, CHINA AND INDIA 2020: RETHINKING EDUCATION FOR THE DIGITAL ERA © OECD 2019
gap is substantial. Outside of the traditional funding sources including partnership with private sector, the strategy employed by Bangalore’s transport corporation of leveraging its land assets to generate revenue and pare down cost (Roychowdhury and Dubey, 2018) is an interesting example of innovative financing that can be explored in other cities. Vehicle use and ownership charges (discussed in the subsequent section) are also worth a consideration in this respect.
Unifying road management is key, and there is scope for vehicle ownership and use policies
There seems to be a consensus in India on the important role that unified metropolitan transport authorities (UMTA) and urban transport funds (UTF) can play in addressing the fragmented nature of urban-transport management in India.1 Yet despite the publication of operational guidelines (MOUD, 2016a, 2016b) and incentives – such as providing access to funds from the Jawaharlal Nehru National Urban Renewal Mission – the formation of such unifying institutions has stalled. As it is, in the absence of an autonomous and fully-fledged UMTA, governance of urban transport involves a constellation of actors including municipal police, state and city governments, metro rail corporations, transport corporations, municipal corporations, local urban-development authorities, special-purpose vehicles as with the Smart Cities Mission, and the transport ministry.
Mumbai is one of the Indian cities that does already have a fully-fledged UMTA. This is the Unified Mumbai Metropolitan Transport Authority, which was created by the government of Maharashtra in 2008. Mumbai’s UMTA is still not autonomous, although the government is moving in that direction. In Delhi, the consolidation of transport oversight has been limited to the establishment of standards and the approval of transport engineering and infrastructure projects. This consolidation has taken place within the framework of Unified Traffic and Transport Infrastructure (Planning and Engineering) Centre that the Delhi Development Authority created in 2009. Delhi’s experience indicates that creating an UMTA-style institution with relatively limited scope can be a viable solution, as long as it has the appropriate authority. In Bangalore, meanwhile, the local authorities first considered creating an UMTA in 2007, but it did not materialise. In 2018, the state government has again pledged to introduce legislation to pave the way towards creating one. As for Kolkata, the authorities have given scant indication as to whether or not the city is inclined to create a UMTA.
Aside from the concerns that can arise over how to manage the consolidation of the diverse aspects of urban transport, another relevant consideration is that vehicle ownership and road-use measures – including those envisioned in the urban development ministry’s operations document on UTFs (MOUD, 2016b) – necessitate political backing. As it appears, the appetite to enact measures relating to the supply of vehicles differs between urban areas, and depends on the kind of measure that is being proposed. Although limited in scope, Delhi pushed ahead with its vehicle-scrappage policy in 2018 while a broader policy at the national level is being finalised. Kolkata, for its part, has been a leader in parking policy design and administration as Bangalore, Delhi, and Mumbai catch up. Other common measures that the four cities have embraced are a vehicle-purchase tax, a road-use tax, and a fuel tax (Table 3.12.2). Congestion tax is another tool that is currently being considered at least in Delhi and Mumbai. On the other hand, cordon charges and quota-based right to own a vehicle, akin to Singapore’s certificate of entitlement, have yet to take serious policy traction. Beyond having a set of rules in place, enforcing these rules is also challenging. It is equally important that the users of the transport network find the penalties for violations such as illegal parking prohibitive (Roychowdhury and Nasim, 2017).

3. STRUCTURAL pOLICy COUNTRy NOTES
225224 ECONOMIC OUTLOOK FOR SOUTHEAST ASIA, CHINA AND INDIA 2020: RETHINKING EDUCATION FOR THE DIGITAL ERA © OECD 2019
Table 3.12.2. Examples of vehicle ownership and road-use charges
Policy Bangalore Delhi Kolkata Mumbai
Vehicle ownership
Licence/Right to own X X X X
Comprehensive parking policy *
Emission policy
Purchase tax and road tax
Vehicle usage
Congestion fees --- C --- C
Road use/toll fees
Cordon charges X X X X
Fuel tax
Note: =existent; C=under study/consultation; X=non-existent; *=a new policy is under consultation. Vehicle purchase tax, road tax and fuel tax vary by local governments. The Motor Vehicle Act of 1988 has broad provisions on illegal parking as well. The table does not compare the quality of administration and extent of coverage of the mechanisms across cities. Information is as of 13 September 2019.Source: OECD Development Centre compilation from national sources.
The importance of involving the private sector in transport management
Beyond the traditional framework of public-private partnerships, the private sector can be a key partner for transport authorities as they seek to find and implement smart solutions to the challenges that they and their users face. One of the ways in which the private sector can make an important contribution is by developing innovative solutions, as was the case with the tracking applications for public transport that use GPS technology. Another way in which it can help is by supporting start-ups that plan to develop innovative solutions. The private sector can also be an important partner in other ways, such as by allowing people whenever it is feasible to work and study remotely, thus reducing traffic.
Telecommuting and online learning are not new concepts in India. According to KPMG India and Google (2017), online education in India has grown rapidly in recent years, even if the courses on offer tend not to be core modules. At state-run institutions of education, the government has the opportunity to expand the offering of online courses. As regards teleworking or telecommuting, information on the prevalence of such practices in India is currently limited, but one survey does show that the demand for such arrangements does appear to be high (Randstad India, 2016). The growth in co-working spaces over recent years also suggests that businesses are open to non-traditional working arrangements. However, in order to support a development that has the potential to ease congestion on the transport network, regulatory changes may be necessary to alleviate concerns about teleworking such as the potential for workers’ productivity to fluctuate, or data security.
Next step: Use innovation fully, manage infrastructure better and keep the private sector involved
Making full use of innovations in technology is one of the three main things to bear in mind as India seeks to improve transport in its cities. As outlined above, the use of technology to improve the delivery of transport services and enhance safety is an ongoing initiative in India. A vital component in maximising the impact of these innovations will be making continual improvements in terms of administrative efficiency, as well as ensuring a consistent application of the rules of the road. It will, as touched on above, also be important to pay appropriate heed to the effects that changes will have on the informal economy. Making the most of the solutions that are available will also require substantial political will, and wide-ranging campaigns to improve awareness among

3. STRUCTURAL pOLICy COUNTRy NOTES3. STRUCTURAL pOLICy COUNTRy NOTES
225ECONOMIC OUTLOOK FOR SOUTHEAST ASIA, CHINA AND INDIA 2020: RETHINKING EDUCATION FOR THE DIGITAL ERA © OECD 2019
commuters, especially when it comes to ensuring seamless linkages between modes of transport. Considering the financing constraints faced by less wealthy agglomerations, the government should closely monitor the performance of the systems that are in place, or those that will be launched, documenting key lessons from their implementation in various contexts, and developing plans to make the systems more scalable.
Strengthening the management of road transport infrastructure is the second key point to keep in mind in seeking smarter transport arrangements. It will indeed be worthwhile for the central government to step up its material assistance and political support to urban agglomerations that face difficulties in setting up UMTAs and UTFs. In urban areas where such mechanisms are already in place, meanwhile, pushing for their institutional autonomy, and professionalising their organisation, are some of the challenges to work on. In areas where these mechanisms are still work in progress, the government may choose to begin with an entity that is more modest in scope and less legally cumbersome to put in place. This is a way to jump start the process of bringing together urban road-management functions under a single body. Similarly, local governments might benefit from implementing measures to reduce the number of vehicles on the roads in order to ease congestion. They also stand to benefit from finding alternative sources of financing.
Keeping the private sector involved is the third key point. It is clear that the private sector can play an important role in advancing the overall road-management framework, and not just through conventional public-private partnerships. Thus, it pays for the government to consult and work with private firms as it develops transport-management solutions. As also noted above, the private sector can also play a role in broadening the coverage of remote work and study arrangements whenever this is feasible.
Note
1. India’s national policy on urban transport suggested as early as 2006 that urban agglomerations with more than 1 million inhabitants should create a UMTA in order to consolidate the management of urban roads (MOUD, 2016a). The plan also recommended setting up a UTF that would come up with innovative funding sources and manage the allocation of capital.
References
Akbar, P.A., V. Couture, G. Duranton and A. Storeygard (2018), “Mobility and Congestion in Urban India”, NBER Working Paper No. 25218, JEL No. R41, National Bureau of Economic Research, Cambridge, MA, https://www.nber.org/papers/w25218.pdf.
Bhanushali, U., A. Prabhu, P. Dagli, S. Chheda and A. Vyas (2018), “Studying Project Management System for Mumbai Metro”, International Advanced Research Journal in Science, Engineering and Technology, Vol. 5, Special Issue 3, https://iarjset.com/wp-content/uploads/2018/07/ICACE-18-1.pdf.
BMRCL (2019), “Bengaluru Transit Oriented Development Policy” (Draft, February, 2019), Bangalore Metro Rail Corporation Limited, Bangalore, http://urbantransport.kar.gov.in/Draft%20Bengaluru%20ToD%20Policy%20with%20Annexure.pdf.
Chin, V., M. Jaafar, S. Subudhi, N. Shelomentsev, D. Do and I. Prawiradinata (2018), Unlocking Cities: The impact of ridesharing across India, Boston Consulting Group, Boston, http://image-src.bcg.com/Images/BCG-Unlocking-Cities-Ridesharing-India_tcm9-185213.pdf.
Dyade, M.A. and Y.V. Bhande (2017), “Use of QR code: A step towards development in India”, International Research Journal of Engineering and Technology (IRJET), Vol. 4, Issue 9, pp.1165-1168, https://www.irjet.net/archives/V4/i9/IRJET-V4I9221.pdf.
GrantThorton (2016), Smart Transportation-transforming Indian cities, New Delhi, https://www.grantthornton.in/globalassets/1.-member-firms/india/assets/pdfs/smart-transportation-report.pdf.
GWB (2018), Green City Administrative Approval 2017-18, Urban Development and Municipal Affairs Department, Government of West Bengal, Kolkata, https://www.wburbandev.gov.in/Home/adm_appv_green_2017_18.

3. STRUCTURAL pOLICy COUNTRy NOTES
227226 ECONOMIC OUTLOOK FOR SOUTHEAST ASIA, CHINA AND INDIA 2020: RETHINKING EDUCATION FOR THE DIGITAL ERA © OECD 2019
HLRN (2018), India’s Smart Cities Mission: Smart for Whom? Cities for Whom? Update 2018, Housing and Land Rights Network, New Delhi, https://www.hlrn.org.in/documents/Smart_Cities_Report_2018.pdf.
IEG-World Bank (2016), Project Performance Assessment Report: Mumbai Urban Transport Project, Independent Evaluation Group, World Bank, Washington, DC, https://ieg.worldbankgroup.org/sites/default/files/Data/reports/ppar_india_0716.pdf.
Kejriwal, K.A. (2019), “Budget Speech 2019-2020”, Directorate of Training and Technical Education, Delhi Government, http://tte.delhigovt.nic.in/wps/wcm/connect/84861b0044d0f23e9990db82911e8eeb/Budget_Speech_English_2019-20.pdf?MOD=AJPERES&lmod=-359219120.
KMRC (2016), Annual Report 2014-2015, Kolkata Metro Rail Corporation Limited, Kolkata, http://kmrc.in/admin/uploads/1415.pdf.
KPMG India and Google (2017), “Online Education in India: 2021”, https://assets.kpmg/content/dam/kpmg/in/pdf/2017/05/Online-Education-in-India-2021.pdf.
MOUD (2016a), Operations Document for Unified Metropolitan Transport Authority (UMTA), Ministry of Urban Development, Government of India, New Delhi, http://www.sutpindia.com/skin/pdf/Operations_Document_for_UMTA.pdf.
MOUD (2016b), Operations Document for Urban Transport Fund (UTF), Ministry of Urban Development, Government of India, New Delhi, http://www.sutpindia.com/skin/pdf/Operations_Document_for_UTF.pdf.
MRTH (2018), “Year-end Review: Ministry of Road Transport and Highways 2018: the Highway Construction Year”, Press Release, Ministry of Road Transport & Highways and Press Information Bureau, Delhi, https://pib.gov.in/newsite/PrintRelease.aspx?relid=186932.
Mukherjee, A., R. Toshniwa and P. Mulukutla (2016), “Enhancing Bengaluru’s public transport network: approaches and challenges”, Journal of Sustainable Urbanization, Planning and Progress, Vol.2, pp. 37–50. http://doi.org/10.18063/JSUPP.2017.01.005.
NITI Aayog (2018), National Strategy for Artificial Intelligence, National Institution for Transforming India, Delhi, http://niti.gov.in/writereaddata/files/document_publication/NationalStrategy-for-AI-Discussion-Paper.pdf.
Planning Commission (2014), India Transport Report: Moving India to 2032, National Transport Development Policy Committee-Government of India, New Delhi, http://planningcommission.nic.in/reports/genrep/NTDPC_Vol_01.pdf.
Philip, C.M. (2019a), “With new ticketing machines, BMTC all set to go cashless”, The Times of India, Gurugram, https://timesofindia.indiatimes.com/city/bengaluru/with-new-ticketing-machines-bmtc-all-set-to-go-cashless/articleshowprint/67768445.cms.
Philip, C.M. (2019b), “Namma Metro surges ahead, clocks four-crore jump in annual ridership”, The Times of India, Gurugram, https://timesofindia.indiatimes.com/city/bengaluru/namma-metro-surges-ahead-clocks-four-crore-jump-in-annual-ridership/articleshow/67631785.cms.
PTI (2018), “Delhi Cabinet likely to approve proposal for procurement of 1,000 buses tomorrow”, Financial Express, 10 May, Uttar Pradesh, https://www.financialexpress.com/india-news/delhi-cabinet-likely-to-approve-proposal-for-procurement-of-1000-buses-tomorrow/1162983/.
Randstad India (2016), 1 in 2 Indian Employees Prefer Telecommuting: Randstad Survey, Randstad India, Chennai, https://www.randstad.in/about-us/press-releases/press-releases/1-in-2-indian-employees-prefer-telecommuting-randstad-survey/.
Roychowdhury, A. and G. Dubey (2018), The Urban Commute: And how it contributes to pollution and energy consumption, Centre for Science and Environment, New Delhi, https://www.cseindia.org/the-urban-commute-8950.
Roychowdhury, A. and U. Nasim (2017), Parking Policy for Clean Air and Liveable Cities: A Guidance Framework, Centre for Science and Environment, Delhi, http://admin.indiaenvironmentportal.org.in/files/file/parking-report-dec27.pdf.
Saxena, S. (2019), “Mumbai Metro: Transforming transport in a megacity”, Asian Development Blog, Asian Development Bank, Manila, https://blogs.adb.org/blog/mumbai-metro-transforming-transport-megacity.
Shekhar, R. (2018), “Delhi: Smart traffic system hits road to reality”, The Times of India, Gurugram, https://timesofindia.indiatimes.com/city/delhi/smart-traffic-system-hits-road-to-reality/articleshow/67212110.cms.

3. STRUCTURAL pOLICy COUNTRy NOTES3. STRUCTURAL pOLICy COUNTRy NOTES
227ECONOMIC OUTLOOK FOR SOUTHEAST ASIA, CHINA AND INDIA 2020: RETHINKING EDUCATION FOR THE DIGITAL ERA © OECD 2019
Sinha, S. (2019), “BRT Governance and Challenges–A Case of Indian Cities”, Background Paper, VREF Research Synthesis Project, Governance of Metropolitan Transport, Gothenburg, http://www.vref.se/download/18.45182a5f16a84e95fac6750b/1560236439026/BRT%20Governance%20and%20Challenges%20%E2%80%93%20A%20case%20of%20Indian%20Cities.pdf.
WBTC (2019), “Inauguration of 20 Electric Buses by Hon’ble Chief Minister on 20th February, 2019 from Nabanna”, Press Release, West Bengal Transport Corporation, Kolkata, https://wbtc.co.in/wbtc-inaugurates-20-electric-buses/.
WBTC (2018), “Launching of Intelligent Transport System in WBTC”, West Bengal Transport Corporation, Kolkata, https://wbtc.co.in/smart-transport-system/.

From:Economic Outlook for Southeast Asia, China andIndia 2020Rethinking Education for the Digital Era
Access the complete publication at:https://doi.org/10.1787/1ba6cde0-en
Please cite this chapter as:
OECD (2019), “Structural policy country notes”, in Economic Outlook for Southeast Asia, China and India2020: Rethinking Education for the Digital Era, OECD Publishing, Paris.
DOI: https://doi.org/10.1787/f7cfbe57-en
This work is published under the responsibility of the Secretary-General of the OECD. The opinions expressed and argumentsemployed herein do not necessarily reflect the official views of OECD member countries.
This document, as well as any data and map included herein, are without prejudice to the status of or sovereignty over anyterritory, to the delimitation of international frontiers and boundaries and to the name of any territory, city or area. Extracts frompublications may be subject to additional disclaimers, which are set out in the complete version of the publication, available atthe link provided.
The use of this work, whether digital or print, is governed by the Terms and Conditions to be found athttp://www.oecd.org/termsandconditions.