DEVELOPMENT : FINANCIAL, TECHNICAL - OECD iLibrary
48
§ THE STRATEGY AND PROGRESS OF AID TO DEVELOPMENT : FINANCIAL, TECHNICAL AND EDUCATIONAL ASSISTANCE ^ SHARE IN SHIPPING COSTS OF OCEAN FREIGHT RATES <3>g ROLE OF PUBLIC EMPLOYMENT SERVICES IN ACTIVE MANPOWER POLICY
-
Upload
khangminh22 -
Category
Documents
-
view
0 -
download
0
Transcript of DEVELOPMENT : FINANCIAL, TECHNICAL - OECD iLibrary

§
THE STRATEGY AND PROGRESS OF AID TO
DEVELOPMENT : FINANCIAL, TECHNICALAND EDUCATIONAL ASSISTANCE ^ SHARE
IN SHIPPING COSTS OF OCEAN FREIGHT
RATES <3>g ROLE OF PUBLIC EMPLOYMENT
SERVICES IN ACTIVE MANPOWER POLICY

OECDOBSERVER
N°36 OCTOBER 1968
CONTENTS
3 THE ROLE OF PUBLIC EMPLOYMENT
SERVICES IN AN ACTIVE MAN¬
POWER POLICY
6 OCEAN FREIGHT RATES' SHARE IN
TOTAL TRANSPORT COSTS
Published bi-monthly in English and French by
THE ORGANISATION FOR ECONOMIC
CO-OPERATION AND DEVELOPMENT
EDITORIAL OFFICES
OECD Information Service, Château de la Muette.
2 rue André Pascal, F 75 Paris 16e.
10 SLOWDOWN IN THE GROWTH OFEUROPEAN TOURISM
13 DEVELOPMENT ASSISTANCE :
CHANGING NEEDS AND PROBLEMS
14 A GLOBAL STRATEGY FOR
DEVELOPMENT
by Edwin M. Martin, Chairmanof the OECD DevelopmentAssistance Committee
Individual articles not copyrighted may be reprinted provi¬ding the credit line reads "Reprinted from the OECDObserver", plus date of issue, and two voucher copies aresent to the Editor. Signed articles reprinted must bearauthor's name.
The Organisation cannot be responsible for returningunsolicited manuscripts.Signed articles express the opinions of the authors and donot necessarily represent the opinion of OECD.
Annual Subscription Rates : F 12.00, FS 12.00, DM 10.00.20s.. S 3.50.
Single copies : F 3.00, FS 3.00, DM 2.50, 4s. 6d., S 0,75.
Editor : Anker Randsholt
Assistant Editors : Peter Tewson and Jane Bussière
Production and Layout : Marc Delemme
All correspondence should be addressed to the Editor.
COVER: United Nations ; page 5: USIS; page 7: Foto Brockmoller.Bremen. FR of Germany; page 11: Vilko Zuber. Zagreb, Yugoslavia;page 12: (top) United Nations (bottom) Edwin G. Huffman - WorldBank; page 15: L. Jouan - OECD; page 21: Sabine Weiss - OECD:page 28: International Finance Corporation; page 31: Tropical ProductsInstitute, London - Central Office of Information, London, U.K.;
page 35: United Nations; page 39: USIS; page 41: (top) Road ResearchLaboratory, Harmondsworth, U.K.. (bottom) USIS; page 43: Belzeaux -Rapho; page 44: Rapho.
16 HOW MUCH PROGRESS ARE
THE DEVELOPING COUNTRIES
MAKING?
20 NEW PATTERNS IN THE AID
RELATIONSHIP
22 STATISTICS : THE FACTS
ABOUT RESOURCE FLOWS TO
DEVELOPING COUNTRIES
27 NEW APPROACHES TO PRI¬
VATE INVESTMENT
New trends in the role ofprivateforeign investment for develop¬ment
30 A "GREEN REVOLUTION" IN
THE DEVELOPING COUNTRIES?
33 THE SIGNIFICANCE OF EDUCA¬TIONAL PROGRESS
37 REGIONAL ECONOMIC DEVELOP¬MENT IN THE UNITED STATES
40 A NEW PROGRAMME FOR CO-OPE¬RATION IN ROAD RESEARCH
42 PROSPECTS FOR THE PRODUCTIONAND MARKETING OF FRUIT ANDVEGETABLES
46 NEW OECD PUBLICATIONS

THE ROLE OF PUBLICEMPLOYMENT SERVICES IN ANACTIVE MANPOWER POLICY
'The Manpower and Social Affairs Committee of OECD is taking action to help Membercountries to achieve the aim ofan active manpowerpolicy, namely thefull development andoptimum use ofhuman resources. The public Employment Service is one ofthe instrumentswhich can be used to this end. The characteristics of these services, however, differ widelyin different countries. With a view to harmonising the different concepts of a publicEmployment Service andguiding them along a progressive course the Committee appointeda Wording Party to ta^e stoc^ of the present situation. This Worlnng Party, consisting ofrepresentatives of the manpower authorities from seventeen countries, met to study variousaspects of the Employment Service (functions, organisation, financing, labour marketinformation, manpower mobility, regional economic development, etc.). Professor LouisLevine of Pennsylvania State University wrote thefinal report on this meeting.
ome knowledge of the way the employmentservice has evolved in the industrialised coun¬
tries is an indispensable preliminary to discussion ofits present role. During the Nineteenth Century localattempts were made, usually by the more progressivemunicipal authorities, to establish rudimentary pla¬cement offices. In the early years of this century theneed was felt to organise the labour market on a morecomprehensive scale, and a start was made towardestablishing national networks of labour exchanges.Massive unemployment between the two World Warschanged the emphasis : succour to the distressedbecame the first priority, unemployment insurancewas developed, and the networks of exchangeswere given the task of administering the schemes anddistributing the benefits. Thus these networks, whichare the basis of what we now call the employment ser¬vice, were founded on placement activity and paymentof unemployment compensation ; the service wasconceived primarily in term of social welfare.
Since the 1939-45 War the service has developed in
several directions. With the decline in unemployment,there was first a change of emphasis away from insu¬rance work back to the original basic activity, place¬ment. More recently there has been the adoption ofnew tasks, such as the stimulation of occupational andgeographical mobility, the study of occupation andcareer information, increasing sophistication in thetreatment of labour market data, vocational guidance
for adults, influence over the location of industry,training and rehabilitation of the handicapped, andthe extension of placement and guidance activities intosections of the population where the service had notbeen accustomed to penetrate. Underlying this evo¬lution has been a broadening of concept from thesocial to the economic : the service has become an
instrument of government for carrying out positivemanpower policy in an actively managed economy.
Professor Levine distinguishes three stages in thedevelopment of a typical employment service. First,there is the placement agency which attempts simplyto put employers and workers into contact. If this

task is performed efficiently, it benefits the economyby reducing idle time : nevertheless it is essentially ashort-term activity and one merely intermediary be¬tween factors over which the employment service has nocontrol. The next stage is the " labour market institu¬tion ", which continues to " place " people in work butuses the term in a broader sense, attempting by variousancillary functions to adapt the supply and demandto one another and thus organise the working of themarket for greater efficiency. Finally there is the" manpower agency ", which sees the operation of themarket as only one of its tasks and regards its missionas the overall management of a nation's humanresources. In most of the industrialised countries the
employment service is in the second stage ; those inthe forefront are thinking in term of stage three.
People often confuse the terms " employment ser¬vice " and" 'placement service", but in the new think¬ing this is to define the employment service by onlyone of its functions. What these functions are is in
itself a major question. A contributor to the docu¬mentation of the Working Party from France (whereorganisations which are nominally autonomous play animportant role in public manpower activities), proposedthat the service be regarded as " the ensemble ofinstitutions which in a given country contribute tothe implementation of public employment policy ".Such an institutional, rather than functional, definition
has the advantage of being applicable to countries atall stages of economic development and with differingadministrative traditions.
Other concepts of the role of the employment ser¬vice tend to make assumptions which are open to ques¬tion : that of the " labour market organisation " forexample presupposes an underlying compatability, bothqualitative and quantitative, between jobs vacant andworkers available without which there will hardly bea market to organise. Yet the divergence of supplyand demand is likely, especially in a developing coun¬try, to be a major manpower problem.
If the general mission of the employment service isto act as the executive instrument of the authorities
over the whole range of manpower policy, the nextstep is to ask through what medium, by the perform¬ance of what activities, it is to do this. The Work¬
ing Party considered in turn, under various generalheadings, the functions it does in fact perform invarious countries, though all of them in none.
A list of these would be :
Study of the labour market situation. This in¬cludes the collection and treatment of statistics, analysisof occupations in terms of their demands, and theforecasting of employment trends.
Utilisation of the above information, both collect¬
ively in planning and individually through vocationalguidance.
Placement, including special groups such as thehandicapped, the aged, new entrants to the market,high-level personnel, etc; the management of clearancesystems.
The provision of aids to placement, such as the
payment of mobility grants and assistance with hous¬ing.
Training and re-training, including rehabilitationof the disabled.
Services to employers, such as counsel on personnelmanagement and conciliation in labour disputes.
Organisation of migration, including assistance toreturned migrants.
Control of regional development; the location ofindustry.
The administration of unemployment insurance.
It is for each government to decide which of thesetasks are most worthwhile in view of the priority ofits needs and the resources at its disposal, keeping inmind the basic purpose of the employment service.The Working Party recognised, however, two importantmodifying factors. First, the public role in the man¬power field is far from exclusive. As long as mostemployers are private and workers are free to acceptor reject employment, any consideration of the tasksof the employment service must, if it is to be fruitful,avoid assuming that manpower matters are affectedonly by government actions.
Second, it has become clear that a different emphasisis placed on manpower problems in the United Statesand in Western Europe. There is in America aportion of the population which does not participatein the labour force, and a most important part ofemployment service activity there is directed towards" reaching out " to these people, in concert with othersocial agencies, to draw them into the employmentfield and hence into the main stream of society. Theessential feature of such programmes is that the initia¬tive comes from the agency, in this case the employmentservice, rather than from the public.
The report gives full treatment to this discussion onthe functions of the employment service. In hisconclusion Professor Levine selects three of them in
particular as being of special interest at this time andworthy of intensive study. These items are the pro¬vision of personnel management advice to industry,vocational guidance and counselling, and labour marketinformation. The first two he sees as an extension
of the traditional placement function, as a servicerendered to employer and applicant respectively.Labour market information, both the author and the
Working Party feel, is of paramount importance notonly in the expression of the new role of the service butalso because it has wide implications for operatingprocedures.
The Working Party, which is made up of a groupof practising experts, also considered internal organi¬sation and structure. Here also there are wide differ¬
ences between Member countries, some favouring
complete integration of the employment service withinthe civil service, others entrusting it to an independentboard of management responsible directly to theappropriate Minister, yet others advocating variousforms of compromise.
The group did not pronounce itself in favour of

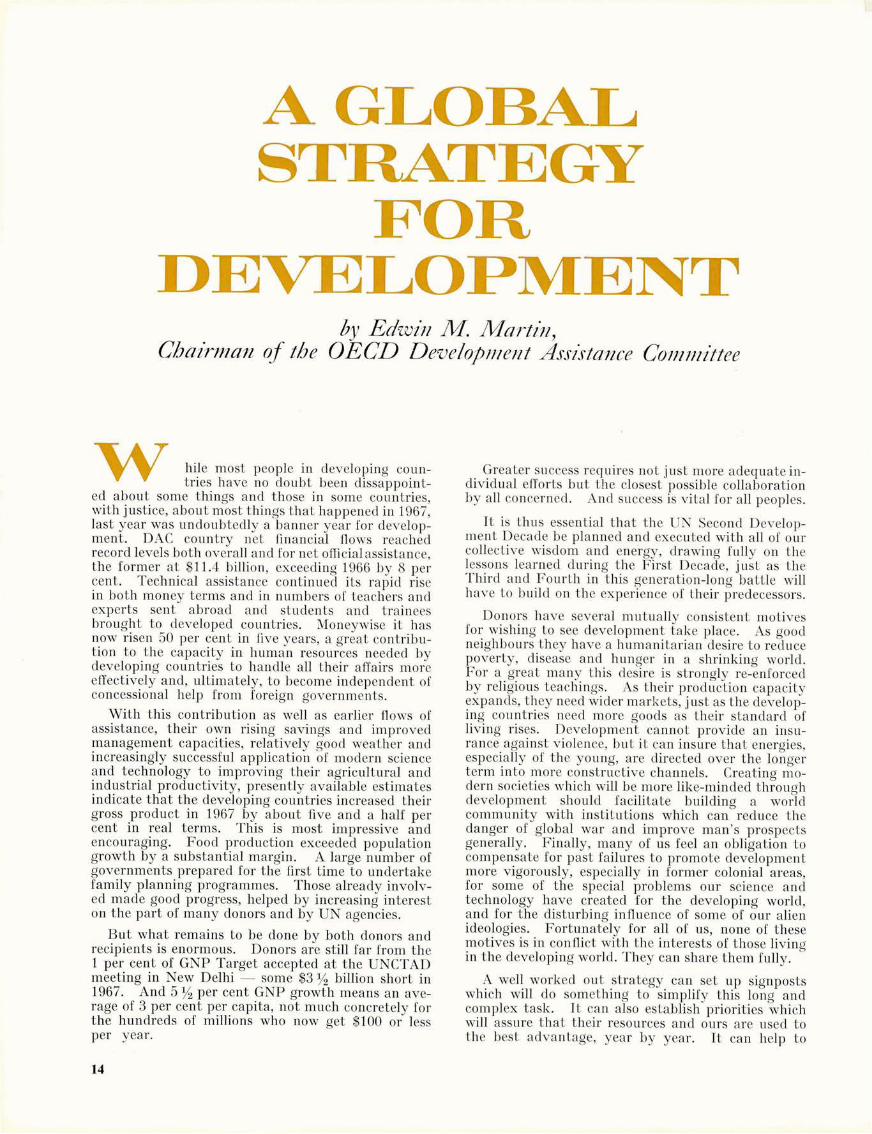
Vocational training is one of the many areas of concern of a modern employment service.
any of these structures but emphasised that it was ne¬cessary to ensure governmental supervision of policyon the one hand and desirable to provide at least aminimum of participation by the social partners onthe other. This question of structure is not merely ofacademic interest it has very practical implications.For example, a service directly under governmentcontrol may find it difficult to maintain its financialindependence in times of retrenchment in public spend¬ing; and civil service status for the staff, while pro¬viding security of tenure and ensuring impartiality,may inhibit desirable movement between the serviceand private industry.
As has been brought out before, better premisesmake a decisive contribution to the image of the ser¬vice in the eyes of the public and hence to the effect¬iveness of its impact. Banks, post offices and clinicsenjoy attractive surroundings, why should a man'swork be accorded less prestige than his money, hiscorrespondence or his health ?
Finally Professor Levine, in his conclusions, singlesout two organisational items as especially in need ofstudy along with the functional items mentionedabove. These are, first, cost-benefit techniques forevaluating the various activities of the service, andsecond, methods of recruitment and training of staff.With its traditional emphasis on the placement functionthe service has been judged, and in many countriesfinanced, on the basis of its short-term performance;he suggests that a more sophisticated evaluation is
now overdue. With regard to the second item, theWorking Party was of the opinion that adequate careerstructures, opportunity for mobility in and out of theservice, and appropriate training were all matters ofurgency.
" The rationale for a broadened conception of the
role of the public employment service in the manpowerfield ", says Professor Levine, " is found in the viewthat a national manpower policy is applicable to allhuman resources ". The nation's economic goalsare to achieve full employment of human resourcesand ensure prosperity in all sectors. The authorfeels that if the employment service is to implementa manpower policy which is an integral part of suchan overall economic policy, then it must change bothin the initiative it displays and in the scope of itsactivities.
" A review of the various papers prepared inadvance of the Working Party meeting on the em¬ployment service ", he concludes, " as well as thediscussion which took place at the meeting and thecomments which were submitted subsequently, leadsto the conclusion that, in general, basic concepts asto the role of the employment service are reasonablywell understood and accepted. What is needed thenis an action programme designed to examine in somedetail those critical elements in employment servicefunctions and activities in each country which aremost important to the conversion of the employmentservice into a manpower agency ".

OCEAN FREIGHT RATES' SHAR
Ocean freight rates account on the average for 62 per cent oftotal transport costs ofa sam¬ple ofgeneral cargo shipments between North America and Europe or vice versa. Averageinland transport costs stand at 28 per cent and average port charges, etc.,for the remaining10 per cent.
This is the conclusion ofa Pilot Study, undertaken by the Secretariat of the OECD Mari¬time Transport Committee, designed to show the share of ocean freight in total transport
The intention of the Pilot Study was toestablish orders of magnitude and rangesof variation of the share of ocean freight intotal transport costs in a sample limited
to general cargo shipments between North Americaand Western Europe; I he sample was furnished byforwarding agents, ship-owners and others possessingthe necessary information. This particular trade wasselected because of its volume and variety, its import¬ance to most OECD countries, and because it appear¬ed that the relevant information might be morereadily available than for other trades; moreover thepresent trend towards integrated container transportbetween the regions concerned provides an additionalaspect of interest.
The questionnaire asked for descriptions of generalcargo shipments carried on liners. Replies were toconcentrate on "manufactured articles, machineryand transport equipment, prepared food products,beverages, etc." - that is, on general cargo shipmentsof the type mainly exchanged between the tworegions. All respondents were requested to andapparently did choose their shipments at random, butwithin the limits determined by instructions as toroutes and types of cargo. Total transport costswere broken clown into "inland freight to loadingport", "costs incurred at port of loading", "sea-freight", "costs incurred at port of discharge","inland freight from discharge port" and "othercosts". Very limited information was obtained onthe question of insurance costs, and this had to beexcluded altogether from the study.
The sample is too small to be statistically repre¬sentative, but there are good indications that theoverall results are representative of orders of magni¬tude for the trade in question.
Average share of ocean freightin total transport costs
The term "ocean freight" should not be confoundedwith ocean transport cost. Almost all ocean ship¬ments in the sample were on "liner terms"; theseinclude the cost of loading and discharging cargo aswell as port expenses being paid by the carrier.These costs may be estimated at 40-50 per cent oftotal ocean freight .
It appears that the share of ocean freight in totaltransport cost for the general cargo trade betweenNorth America and Europe as a whole might besomewhat lower than the 62 per cent in the sample:a range of 55-60 per cent would seem to be a fairguess of a general order of magnitude. The mainreasons for this assumption are:
Ocean freight rates account on average for 62 percent of total transport cost of the sample. Averageinland transport costs are 28 per cent and "portcharges, dues and other costs" account for 10 percent.
1. AVERAGE TRANSPORT COSTS
OF ALL SHIPMENTS
Sea Freight
Dollar per Ton
Weight orMeasurement
Dollar per TonWeight
Dollar perS1000f.o.b. value (1)
41 75 33
Inland Freigh t
Dollar per1000 ton km.
Dollar per TonWeight
Dollar perS1000 f.o.b. value (1)
37 34 16
Port Charges , Dues and Other Costs
Dollar per
ShipmentDollar per Ton
WeightDollar per
$1000 f.o.b. value (1)
96 12 6
Total Transpc>rt Costs
Dollar perWeight
Ton Dollar perS1000 f.o.b. value (1)
121 55
(1) 222 shipments c nly, no information a railable for 13 shipments.

E IN TOTAL TRANSPORT COSTS
costs from inlandpoint oforigin to ultimate inlandpoint ofdestination. The study furthershows that the average ocean freight per ton shipped amounts to only about 3 per cent ofthe f.o.b. value ofthe cargo.The study was based on 23s replies to a questionnaire received through the German, UnitedKingdom and United States Delegations to OECD, and is to be published; this articlesummarises the facts andfactors it brings to the fore.
insurance costs, which are part of total transportcosts, are not included in the sample;
the average ocean freight rate in the sample ishigher than in comparable studies of larger scope.The main factors making for a higher than averageocean freight rate (volume, value) do not affect inlandfreight rates and port costs, dues and other costs tothe same extent;
the inspection of the sample suggests that loyaltyrebates on conference freight rates have not alwaysbeen deducted from ocean freight.
Subdividing the shipments of the sample into5 per cent brackets of their share of ocean freight intotal transport costs, the spread reaches from sharesof less than 10 per cent to one higher than 90 percent. There appears to be no particular concentra¬tion of shipments in the vicinity of the arithmeticalaverage of 50 per cent. However, 34 per cent of allshipments fall into the four central brackets inwhich ocean freight accounts for 40-60 per cent oftotal transport costs, 32 per cent of all shipmentshave a lower and 34 per cent a higher share.
Factors influencingthe share of ocean freight
There are large differences in sea distance betweensome of the sea routes used, e.g. between the London-New York route (3,300 miles) and the Bremen-LosAngeles run (8,000 miles). Under these circumstances,it might be expected that there would be some differ¬ence in average sea freight rates between the majorroutes. However, the sample does not reveal anysystematic differences in function of sea distance.This is probably due to the fact that only a relativelysmall part of total liner cost is a function of sea dis¬tance. The cost of loading and discharge, other portexpenses and the cost of the vessel's time spent in portare probably much more important, and differencesin these items can easily outweigh the influence ofeven large differences in sea transport distance.
The principal elements determining the share ofocean transport costs in total transport costs are theocean freight rates, the volume/weight ratio of the

2. AVERAGE TRANSPORT COSTS FOR SHIPMENTS OF DIFFERENT WEIGHT
Sea
Weight group FreightInland Port charges.Freight dues and other
costs
Total
Dollars
per
ton
Under 500 kg.
500 - 5000 kg.
Over 5000 kg.
All Shipments
174
149
64
75
119
72
28
34
163
33
8
12
456
254
100
121
Percentageof
Total
Under 500 kg.
500 - 5000 kg.
Over 5000 kg.All Shipments
38
59
64
62
26
28
28
28
36
13
8
10
100
100
100
100
Percentage
of Averageall
Shipments
Under 500 kg.
500-5000 kg.
Over 5000 kg.
All Shipments
231
199
85
100
350
211
82
100
1,360
275
67
100
377
210
83
100
Note : The average weight of shipments under 500 kg. is 191 kg.The average weight of shipments 500-5000 kg. is 2,193 kg.The average weight of shipments over 5000 kg. is 26,470 kg.
shipment, the inland transport distance and theweight of the shipment. The incidence of sea freightrates charged per "freight ton", i.e. per ton of weightor measurement (1) has been compared with I he inci¬dence of sea freight paid per ton of weight. Morethan 70 per cent of all shipments fall into a range offreight rates per freight ton of $30 to $90; about 12 percent of all shipments have rates higher than $90.
In terms of freight expenditure per ton of weight,however, the spread is considerably larger. Only 32per cent of shipments fall into a range of $30 to $90 perton of weight, while 60 per cent paid more than $90.The liner freight system penalises bulky cargo muchmore than inland transport tariffs or the various feesand other elements contributing to "port charges,dues and other costs". This tends to make for a highshare of ocean transport cost in total transport costsin the case of shipments with a high volume/weightratio.
Inland transport distance plays a role in determin¬ing the share of ocean freight in total transportcost but this effect is lessened by the usual degressionof inland transport tariffs in function of distance.
Other elements include the unit value of the ship¬ment, means of inland transport, the applicableinland transport tariff, and the incidence of thevarious elements making up "port charges, dues andother costs". The sample is not large enough topermit a detailed analysis of each of these factors,but it is possible to describe in some detail the
influence which the weight or size of the shipmentmay have on the share of sea transport cost.
(1) This double, basis of freight assessment is typical [or linershipping. Liner freight rates arc freguenllg applicable, eitherper ton of weight (metric Ion or ton of 2,240 lbs. ) or per measure¬ment ton (cubic metre or unit of 40 cubic feet), dependingon which rale basis yields the higher revenue. This is becausecargo liners are limited both in the weight and the volume ofthe cargo they can carry; the freight rate system thereforetakes account of whichever factor is the more important for theshipment concerned.
Small and large shipments
Table 2 makes a distinction between shipments ofless than 500 kg. those of 500 to 5,000 kg. and thoseof more than 5,000 kg. In the entire sample thereare 67 shipments under 500 kg. 105 of 500 to 5,000 kg.and 63 heavier than 5,000 kg. The small shipmentsof less than 500 kg. include all 21 minimum bill oflading shipments.
Total average transport costs for shipments under500 kg. are $456 per ton. This is almost four timesthe average for the entire sample. Sea freight isabout 130 per cent higher than the average, inlandfreight is three and a half times the average and costsin port and other costs are fourteen times the averagefor the whole sample. Quite generally there is adecrease of cost per ton in function of weight for allmain cost items. From the group of shipmentssmaller than 500 kg. to that heavier than 5,000 kg. thisdecrease is 63 per cent for sea freight, 77 per cent forinland freight and 95 per cent for port charges, dues,etc. The implications concerning the share of oceanfreight rates are obvious.
The share of ocean freight in total transport costsincreases from 38 per cent for shipments under 500 kg.to 64 per cent for those over 5,000 kg. For the groupsof 500-5,000 kg and over 5,000 kg, the average sharesof ocean freight are close to the average for the entiresample. The much lower share of the small ship¬ments under 500 kg, hardly influences the overallaverage.
Many cost elements contributing to "port charges,dues and other costs" are largely independent of

the size of the shipment and thus handicap thesmall shipment. Furthermore, it appears normalthat both inland and sea transport tariffs shouldprovide for a certain decrease in function of weight.Table 2 shows that in the sample this decrease isconsiderably stronger for inland transport than forocean transport. It can be assumed that this is dueto a basic difference between inland transport andliner tariffs. Inland transport rates and especiallyrailway tariffs usually provide for a decrease infunction of the size of the shipment. In linershipping, on the other hand, the same freight rateis applied regardless of the size and the only exceptionto this is the minimum bill of lading.
One shipping conference operating on the NorthAtlantic charged, in 1966, a freight minimum of $11for all ordinary general cargo and of $22 for cargovalued higher than $1000 per ton weight or measure¬ment. These figures compare with an average freightper freight ton of $41 for the entire sample. Thefreight minimum would thus apply for shipmentssmaller than about 0.5 tons. For all larger ship¬ments there would be no rate decrease with increasingweight. Beyond a certain weight (e.g. 2 tons) theliner company would in fact impose additional heavy-lift charges. Table 3 gives an example of the muchmore pronounced decrease provided by railwaystariffs, by applying the general piece goods tariff ofthe German railways to shipments of 100-2,000 kg.For larger shipments, the European railways usuallyoffer further reductions for partial or entire car¬loads. The respective 15, 20 and 25 ton tariffs ofthe German railways are given in Table 3; similartariffs exist for shipments in the 5 ton and 10 tonranges.
A graphical presentation of the share of oceantransport costs for different size shipments is givenopposite. For all three groups, there is a rather
3. EXAMPLE OF THE DECREASE
OF RAIL FREIGHT RATES
IN FUNCTION OF WEIGHT
Weight ofShipment-kg.
DM per100 kg.
Freight Rate aspercentage of rate forshipment of 100 kg.
100 (1) 12.04 100.0
500 (1) 9.16 76.1
1,000 (1) 7.47 62.0
1,500 (1) 6.27 52.1
2,000 (1) 6.22 51.7
15,000 (2) 1.93 16.0
20,000 (2) 1.84 15.3
25,000 (2) 1.75 14.5
(1) Application to different size shipments of the general piecegoods tariff of the German railways as of 15th March, 1966,distance 150 km.
(2) Car load tariff, commodity class A, of the German railways asof 15th March, 1966, distance 150 km.
Source : Calculated from "Preise Lôhne Wirtschaftsrechnungen,Re/he 7".
pronounced concentration around the average shareof ocean transport cost in total transport cost, i.e.36 per cent for the small shipments under 500 kg,53 per cent for the shipments of 500 to 5,000 kg and61 per cent for the large shipments over 5,000 kg.
SEA FREIGHT AS PART OF TOTAL
TRANSPORT COST FOR SMALL AND
LARGE SHIPMENTS
(All shipments)
Number of shipments2b
I a ithmetic avérai3e : 36 %
20
SHIPMENTS
1^ UNDER 500 kg
10
b__J
n i
O CDCM CM
CD
CO
CD CD
LOCD CD ocd r» co
V o o
CO
o O
LO
oCD
O A
2b
20 .
1b
10
Sea freight as percentage of total transport cost
Number of shipments SHIPMENTS OF 500 TOarithmetic average : 53% 5 000 kg
oCN
V
CD
CN
OCN
CD
CO
OCO
CD
o
CD
LO
Om
CD
CDI
oCD
CD
o
r^
oCO
A
1b
10
Number of shipments
P
Sea freight as percentage of total transport cost
arithmetic average : 61 %
SHIPMENTS
OVER 5 000 kg
oCM
V
CD
CN
OCN
CD
CO
O
00
CD
6
CD
LO
oLO
CD
CD
OCD
CD
r-
o
OCO
A
Sea freight as percentage of total transport cost

SLOWDOWNIN THE GROWTH
OFEUROPEANTOURISM
In 1967, for the first time since World War II, OECD Europeancountries' receipts from foreign tourism levelled off, increasing byonly 3 per cent as against an average annual rate of increase of
13 per cent over the previous six years, while the number of nightsspent by foreign tourists in these countries rose by only 1 per centover the 1966 figure. These developments are examined against thebackground of the continuous long-range growth of tourism forOECD countries as a whole in the most recent annual report ofOECD's Tourism Committee, " Tourism in OECD Member Countries
in 1967 and the Early Months of 1968 " which has just been publ¬ished.
The report also contains a detailed analysis of international touristmovements in Europe, North America and Japan, as well as betweenEuropean OECD [countries, between European OECD countries andthe United States, and between Japan and the other Member
countries. Special chapters deal with tourist receipts and expend¬iture in foreign currency and the economic importance of tourism,governmental action in the field of visas, passports, customsfacilities, tourist currency allowances, etc; tourist, transport by road,rail sea and air and tourist accommodation. The report is supplem¬ented by some 150 statistical tables which make it a comprehensivesource of information on international tourism in OECD Member
countries.
The steady expansion offoreign tourism in Euro¬pean OECD countries,which has made it one
of their most important export indus¬tries, levelled off in 1 967 for the groupas a whole: almost all the EuropeanOECD Member countries and Yugo¬slavia (1) experienced lower rates ofexpansion or even a reduction intourism in terms of such standard
measures as nights spent by forei¬gners in the country or foreign touristreceipts (see table 1). Thus, for ex¬ample, receipts stagnated for Spainand fell by 1 per cent for Portugaland 3 per cent for Italy.
The main reason for the reduced
growth in tourist receipts in 1 967 wasthe economic recession which affected
most European countries, tourismbeing extremely sensitive to a declinein economic activity. To a certainextent another factor seems to have
been the tightening of foreign travelallowances by the United Kingdomauthorities : the expenditure of Britishtourists in other European countriesfell by 11 per cent. Travel expend¬itures in OECD European countries byGermany (which are the largest of anyEuropean country) and the Nether¬lands were also substantially reduced(by 6 and 7 per cent respectively).
Stagnation or decline in foreigntourist receipts entails increasing dif¬ficulties fora number of Member coun¬
tries because tourism has assumed
considerable importance, not only as asource of foreign exchange earnings,but also as a factor in the overall
income and economic activity ofthese countries. For Europe as awhole, foreign tourism receiptsaccounted for 7 per cent of totalexports of goods and services in 1 966
(as against 4 per cent in 19b6), andfor some countries the percentage ismuch higher, in the neighbourhoodof 40 per cent for Spain, 30 per centfor Portugal, 25 per cent for Austriaand 20 per cent for Greece and Ireland.
But foreign tourism is only one partof the tourist industry's activities. Manyof the problems having to do with thedevelopment of tourism are concerned
equally with the contribution of the
people who travel or vacation within
their own country. OECD's TourismCommittee has, therefore, made an
attempt to assemble statistics on the
overall amount of economic activitycreated by tourism and to assess the
relative importance of domestic andforeign tourism. The results are notas yet strictly comparable as betweencountries; nevertheless they give anidea of the real role of tourism as a
whole in the economies of Member
countries. As table 2 shows, total
domestic and foreign tourist receiptsrepresent from 3 to b per cent ofnational income for most of the
European countries but much morefor Austria, Ireland and Switzerland.
When economic policies are form¬ulated by governments, therefore,the growing economic importance oftourism should not be neglected. Inparticular, measures to adjust balanceof payments disequilibrium should,in the field of tourism as in other
domains, be directed insofar as possi¬ble to increasing receipts rather thanrestricting expenditure abroad. Thisimplies refraining from the impositionof financial restrictions on tourists
going abroad and facilitating foreigntourism at home. The Committee cites
as examples of measures to promotetourism the case of Italy which hasrecently doubled the foreign currencyallowance for its nationals, to $1600,
the abolition of entry-visa requirementsbetween several Member countries and
various third countries, the increasingacceptance by certain European Mem-
(1) Yugoslavia is associated withthe work of the OECD and is a mem¬
ber of its Tourism Committee.
LO

Surveys carriedout in various countries show that cruises are increasing in popularity
ber countries of identity cards insteadof passports for the purpose of fron¬tier control, and the abolition ofcontrol of the international insurance
certificate or " Green Card " between
certain Member countries. The Tour¬
ism Committee expresses its regretthat no new progress has been made
since April 1967 to end the separatecollection of airport taxes which is asource of irritation to many tourists.
In view of the increasingly largevolume of tourist traffic at frontiers
and at airports, new and more imagi¬native measures should be taken bythe competent authorities to simplify
RECEIPTS AND EXPENDITURE OF OECD MEMBER
COUNTRIES ON ACCOUNT OF INTERNATIONAL TOURISM
( S million)
Austria
B. L. E. U.
Denmark
France
GermanyGreece
Iceland
Ireland
ItalyNetherlands
NorwayPortugalSpainSweden
Switzerland
TurkeyUnited Kingdom
1966
Receipts Expenditure
1967 % change 1966 1967 % change
595 615 + 3 171 219 + 28230 242 + 5 320 370 + 16201 222 + 11 187 228 + 22
1,019 1,041 + 2 994 1,097 + 10797 871 + 9 1,573 1,532 3
143 127 11 41 41
3 I 3 + 4 10 11 + 7182 197 + 8 88 83 6
1,460 1,424 3 261 298 + 14275 299 + 9 372 351 6
95 102 + 7 78 90 + 16260 258 1 82 71 13
1,132 1,127 67 78 + 2699 109 + 10 242 287 + 19
554 575 + 4 224 235 + 517 19 + 6 30 27 10
613 652 + 6 832 763 8
TOTAL EuropeanMember countries 7,685 7,883 3 5,572 5,781 + 4
Canada
JapanUnited States
780
79
1,590
1,20989
1,646
+ 55+ 13
4
836
118
2,657
813
146
3,195
3
+ 24: 20
TOTAL OECD
Member countries 10,135 10,827 7 9,183 9,935 + 8
Yugoslavia 117 150 + 78 34 52 + 66
Notes : (1) Figures exclude rec(2) Figures for Canada,
enquiries; ligures f
eipts and expeIre/and. Uniteir the other cc
nditure on accc
1 Kingdom, Uniuntries are bas
unt of internati
ted States and
ed on bank reti
mal tourist transport except for CanadaSwitzerland are based mainly on samplerns, AH ligures are rounded,
THE IMPORTANCE OF
TOURISM, FOREIGN ANDDOMESTIC, IN THE
ECONOMIES OF EUROPEAN
MEMBER COUNTRIES
Foreign % sharetourist
in nationalreceiptsas % of
income
Member country of total
and reference year total
domestic
and foreign
domestic
and foreigntourist
tourist
receiptsreceipts
Austria (1966) 83 9.5
Belgium (1966) 72 2.7
France (1964) 31 4.0
Germany (1967) 24 4.0
Ireland (1964) 90 8.7
Italy (1965) 52 5.1
Netherlands(1966) 44 3.7
Norway (1966) 33 4.9
Sweden (1966) 17 3.2
Switzerland (1966) 61 7.7
United Kingdom 31 3.1
(1966)
Yugoslavia (1966) 59 2.2
frontier control procedures and reduceinspection delays which can becomeintolerable, particularly at peak periods.
The Tourism Committee is of the
opinion that the Joint ScandinavianPassport Control Area between theScandinavian countries, which has
made possible the abolition of allidentity checks at frontiers within thearea, and the absence of such
checks between the United Kingdomand Ireland and between the Benelux
countries could serve as examples for
similar measures between othergroups
of neighbouring countries whichwould facilitate international tourism
in Europe.
Finally, one of the most crucialpresent-day problems of the touristindustry is the peak load during thesummermonths. Increased efforts by
governments and other interestedbodies to stagger holidays wouldpermit more rational use to be madeof existing tourist facilities, but de¬spite the endeavours made in somecountries to encourage people totake their main holidays in June or
September and at least one week'sholiday between October and May,the pressure on accommodation andtransport at the height of the summerseason is increasing.
II

Signature of a loan agreement between representatives of the World Bank (International Bank for1 Development) and those of a developing country is followed by vast new construction
enterprises which will help build up the country's economy.

EVELOPMENT
ASSISTANCE :
On30th -3 /st October the OECDDevelopmentAssistance Commit¬tee (DAC) will be holding itsannual High Level Meeting. This provides a uni¬que opportunity for Ministers and senior officialsresponsible for aid matters in Member countriesto ta^e stock of their own performance in provid¬ing financial and technical assistance resources to the ThirdWorld, and to review major questions for attention and actionin the immediate future.This will be the first High Level Meeting to be presided byMr. Edwin Martin, who recentlytoof^ up his duties as Chairmanof the Development AssistanceCommittee, and whose article "AGlobal Strategy for Develop¬ment ' ' introduces this series. Ernest Parsons, Director, OECD Development Depart¬ment, discusses some of the broader problems of aid-giving in "New Patterns in theAid Relationship", and Hellmutb Fitbrer, Assistant Director, describes "NewApproaches to Private Investment". "How Much Progress are the DevelopingCountries Maying?" was written by Edgar Kroller ; "Statistics : the Facts aboutResource Flows to Developing Countries" by Bevan Stein ; and"A Green Revolu¬tion in the Developing Countries?"by Christoph Beringer; all three are administra¬tors in the Development Department. Herbert Phillips, Consultant to the Department,has contributed the article on " The Significance of Educational Progress ' \In spite of the difficulties which the aid budget is experiencing in a number of DACMember countries, the general tone of these articles is not pessimistic. They ta^e careto point out some of the progress already made in the developmentfield, and to stressthat an extra effort from the aid-providing countries is now needed to exploit oppor¬tunities which already exist and which have been created by past efforts. They showthat the aid needs and development situation of the Third World are changingrapidly. Public understanding of these changes is essential if international aid is toreceive the support it deserves, not just for emergency actiott, but as a permanent andaccepted feature of the economic and political scene.
A GLOBAL
STRATEGY
FOR
DEVELOPMENTby Edwin M. Martin,
Chairman of the OECD Development Assistance Committee
hile most people in developing coun¬tries have no doubt been dissappoint-
ed about some things and those in some countries,with justice, about most things that happened in 1967,last year was undoubtedly a banner year for develop¬ment. DAC country net financial flows reachedrecord levels both overall and for net official assistance,the former at $11.4 billion, exceeding 1966 by 8 percent. Technical assistance continued its rapid risein both money terms and in numbers of teachers andexperts sent abroad and students and traineesbrought to developed countries. Moneywise it hasnow risen 50 per cent in live years, a great contribu¬tion to the capacity in human resources needed bydeveloping countries to handle all their affairs moreeffectively and, ultimately, to become independent ofconcessional help from foreign governments.
With this contribution as well as earlier flows of
assistance, their own rising savings and improvedmanagement capacities, relatively good weather andincreasingly successful application of modern scienceand technology to improving their agricultural andindustrial productivity, presently available estimatesindicate that the developing countries increased theirgross product in 1967 by about five and a half percent in real terms. This is most impressive andencouraging. Food production exceeded populationgrowth by a substantial margin. A large number ofgovernments prepared for the first time to undertakefamily planning programmes. Those already involv¬ed made good progress, helped by increasing intereston the part of many donors and by UN agencies.
But what remains to be done by both donors andrecipients is enormous. Donors are still far from the1 per cent of GNP Target accepted at the UNCTADmeeting in New Delhi some $3 y2 billion short in1967. And 5 % per cent GNP growth means an ave¬rage of 3 per cent per capita, not much concretely forthe hundreds of millions who now get $100 or lessper year.
Greater success requires not just more adequate in¬dividual efforts but the closest possible collaborationby all concerned. And success is vital for all peoples.
It is thus essential that the UN Second Develop¬ment Decade be planned and executed with all of ourcollective wisdom and energy, drawing fully on thelessons learned during the First Decade, just as theThird and Fourth in this generation-long battle willhave to build on the experience of their predecessors.
Donors have several mutually consistent motivesfor wishing to see development take place. As goodneighbours they have a humanitarian desire to reducepoverty, disease and hunger in a shrinking world.For a great many this desire is strongly re-enforcedby religious teachings. As their production capacityexpands, they need wider markets, just as the develop¬ing countries need more goods as their standard ofliving rises. Development cannot provide an insu¬rance against violence, but it can insure that energies,especially of the young, are directed over the longerterm into more constructive channels. Creating mo¬dern societies which will be more like-minded throughdevelopment should facilitate building a worldcommunity with institutions which can reduce thedanger of global war and improve man's prospectsgenerally. Finally, many of us feel an obligation tocompensate for past failures to promote developmentmore vigorously, especially in former colonial areas,for some of the special problems our science andtechnology have created for the developing world,and for the disturbing influence of some of our alienideologies. Fortunately for all of us, none of thesemotives is in conflict with the interests of those livingin the developing world. They can share them fully.
A well worked out strategy can set up signpostswhich will do something to simplify this long andcomplex task. It can also establish priorities whichwill assure that their resources and ours are used to
the best advantage, year by year. It can help to
14

insure that the contributions of donors and recipientsto the overall task work together in a mutually sup¬porting fashion. It can give concrete expression toa major task of international politics in the comingdecades a better realisation of the common interests
of the two major blocs in which the countries of theworld now tend to be divided - - those with long,reasonably successful, but still continuing develop¬ment histories, and those who have been able to
to begin the task in earnest only relatively recently.
A global strategy must convince donors of theirstake in its success and challenge them to larger finan¬cial contributions on more appropriate terms and,especially, to devote more of their best manpowerto helping developing peoples learn to apply modernscience and technology and management skills toimproving the quality of their lives, all of them.
The character of such a strategy must also reflectthe nature of the development process. It shouldrecognise the importance of more and better humanresources and of institutional reforms in developingcountries. After all it is what people, individuallyand collectively, do with " things " for the benefit of
Edwin McCammon Martin, Chairman of the OECD Deve¬lopment Assistance Committee.
people that produces development, not the " things "themselves, necessary as they are.
It must therefore contribute to a widening acqui¬sition of personal attitudes and values which are ofthe kind necessary to the creation of an effectivelyfunctioning modern society and stimulate a reform ofinstitutions to reflect these new attitudes and new
needs. A strategy should promote feelings of capa¬city to dominate one's environment and to improveone's economic and social position, a belief in thevalue of innovation, change and action, a passionatedesire for development which is strong enough tocommand sacrifices in terms of hard work and savings,an acceptance of the need for discipline and team¬work to achieve common purposes.
These are just a few of the attitudes which most ofthe members of a society must have if modernisationis to be a success. A few sentences from an official
report on the economic prospects of one of the poorerbut thus far more successful and democratic develop¬ing countries, prepared by an economic survey teamof one of the leading international agencies, illus¬trates well what is involved :
" Support for the Government's dynamic economicdevelopment policies appears to be wide-based.There is widespread willingness... to accept socio¬economic change : willingness to learn new techniques,to switch from agricultural to industrial occupations,to adopt the living pattern of industrial society, andto apply birth control. And political resistanceagainst sacrifices of development, such as increasedpublic utility charges or more stringent application oftax laws, appears to be small. Political pressure toapply large-scale consumer subsidy is not in evidence.Most impressive of all is the willingness to increasedomestic savings drastically as shown by a marginalsavings rate of 21 per cent over the last three years... "
The strategy should also reflect the fact thatdevelopment must proceed in a balanced way alongpolitical, social and cultural as well as economic linesif il is to be permanently successful.
And it should recognise the uniqueness of eachcountry, both in terms of the situation in which it is,the ambitions it has for the future and the best means
for realising them.
Two major problems in the presentation of a globalstrategy are likely to be the degree to which goalsshould be limited to those which are susceptible toquantitative measurement or should also include avariety of targets which can only be expressed quali¬tatively, and the extent to which goals can be stated inglobal or regional terms rather than left for nationaldetermination within a rather broad overall frame¬
work.
There should also be discussion about how to
adapt goals for a decade to the profound changeswhich ought to take place in such a long period ifwhat we are all doing is in fact to be effective. By 1 980 weshould be getting larger outputs for given inputs thanin 1970, and meanwhile the priority tasks for mostcountries should have changed, in some cases radically.1979 targets, if they are to be right, cannot be thesame as those for 1971.
In August of 1968, President Robert S. McNamaraof the IBBD announced that former Prime Minister
of Canada, Lester B. Pearson, had agreed to become
15

chairman of a commission of distinguished citizens toanalyse the post-war experience of both donors andrecipients in stimulating more rapid development ofthe less industrialised societies and to make suggest¬ions, particularly to donors, as to how the processmight be made even more successful in the future.This private enterprise can be a most valuable contri¬bution, not only to the education of the citizens ofdonor countries and to the improvement of the effec¬tiveness of the aid efforts of their governments, butto the UN consideration of what should be the globalstrategy for the ' 70 ' s. President McNamara andChairman Pearson have publicly expressed the desirethat the Commission work in close collaboration with
the OECD Development Assistance Committee. Iam confident that both the Committee and the OECD
staff personnel will wish to do all they can to addto the value of the Pearson Commission Report,now scheduled for completion toward the end of 1969.
Each year the peoples of the donor and recipientcountries are learning more about the problems ofdevelopment and how to solve them. They are put¬ting this new understanding into practice with goodeffect. We can look forward with confidence to a
development record in the second half of the 20thCentury of which future generations can be proud if,but only if, all realise the central importance of thetask.
HOW
MUCH PROGRESSARE
THE DEVELOPING
COUNTRIES
MAKING?
Nineteen sixty-seven was a relatively betteryear than those preceding for the deve¬
loping countries as a group. Preliminary estimatessuggest that, taken together, they recorded a growthin total output of 5.6 per cent, one of the best ratesrecorded for any year in the current United NationsDevelopment Decade and about twice as high as thatachieved in the developed countries. If this figure isconfirmed, the Development Decade target of aminimum growth rate of 5 per cent per annum willhave been met, on average, for the first eight years.
This favourable evolution is tempered by the factthat the faster growth in the output of the developingcountries in 1967 was paralleled by a rapid growth inpopulation, so that the per capita income of the deve¬loping countries grew on average by only around3 per cent. In absolute terms, the developed coun¬tries on average added about 7 times as much tothe income per head of their population as did theless-developed countries to theirs. This is a simplereminder of the low income-base on which the less-
developed countries have to build their development.
The general economic acceleration in less-developedcountries in 1967 was largely due to the increasedgrowth momentum in several large countries which
account for most of the income and population, e.g.India and Pakistan, which recorded dramatic increases
in their total output. On the other hand, year-to-year increases in total output are not a sufficientmeasure of economic progress. A number of coun¬tries with less striking growth rates neverthelessmade considerable advances in particular sectors orin their export performance. Several countries alsolaid the basis for future growth through greaterpolitical stability, improvements in developmentplanning, in the provision of the basic infrastructureor in the no less important socio-economic fields ofhealth, education and family planning.
In contrast, in a regrettably large number ofcountries and sectors, the signs of progress are stillweak or absent. Many less-developed countries stillseem to be unable to achieve an efficient mobilisation
of their own domestic resources; some have been hitby unfavourable world market conditions for theirprincipal exports; some have wasted their resourcesthrough foreign and civil wars. The indebtednesssituation has become increasingly serious for manycountries, and, in general, the requirements of mostless-developed countries for [foreign capital andtechnical assistance continue to be only partially
16

and inadequately met by official and private inflows.
Growth rates of total product, population and percapita product, per annum, of developing countriesin the main regions in 1967 and 1960-1967 are set outin Table 1.
The improvement in the growth performance in1967 over 1966 was not evenly spread over thedifferent regions. For the less-developed countriesin Europe the average growth rate in total outputdropped from 8.5 to 4.7 per cent. For Africa, itincreased from 1.8 per cent to around 3.5 per cent.In Latin America, the growth rate of 4.5 per centwas maintained. The most significant developmenttook place in Asia, where total output grew by 7.7 percent, as against 4.5 per cent in 1966.
Taking the eight-year period 1960-1967 as a whole,the average annual growth rate of the developingcountries as a group was about 5 per cent (i.e. therate suggested as a minimum for the current UnitedNations Development Decade). Africa, South Ame¬rica and South Asia were the regions which failed tomeet this goal, the rest reaching or exceeding 6 percent. Due to continued high rates of increase inpopulation, however, per capita income grew by only2.4 per cent per year.
1. GROWTH OF TOTAL PRODUCT.. POPULATION
AND PER CAPITA PRODUCT PER ANNUM OF
DEVELOPING COUNTRIES, BY REGIONS, IN 1967
AND 1960-1967
1967 1960-1967
Regions GDP Pop. Per'Cap.GDP
GDP Pop. Per'CapGDP
EUROPE 4.7 1.5 3.2 7.4 1.4 5.8
AFRICA 2.4 3.1 2.3 0.9
North of Sahara 2.7 2.2 2.6 -0.3
South of Sahara 2.4 3.7 2.3 1.4
LATIN AMERICA 4.5 3.0 1.5 4.7 2.9 1.7
North and Central 5.9 3.3 2.5 6.0 3.2 2.7
South 3.8 2.8 1.0 4.0 2.7 1.3
ASIA 7.7 2.5 5.1 5.1 2.5 2.5
Middle East 6.8 3.1 3.6 7.2 2.8 4.4
South 8.9 2.4 6.3 4.1 2.4 1.6
Far East 6.1 2.6 3.4 5.9 2.7 3.1
Total Developing
Countries 5.6 2.5 3.0 5.0 2.5 2.4
A global or even a regional analysis of the growthperformance hides important differences in the deve¬lopment of economic activity among the individualdeveloping countries. These are due to a varietyof factors including resource endowment, capitalaccumulation, weather conditions, international trade,the stage of economic development, popular commit¬ment to development and government capabilitiesfor economic management.
In 1967 there was a substantial degree of scatter inthe growth rates of total output which the individualcountries achieved, ranging from over 20 per cent perannum to an absolute decline. High growth wasoften due to a single export industry (frequentlyforeign-owned) while low growth was often due topolitical disturbance, accompanied by capital flight.
During the 1960-1967 period, 22 countries (account¬ing for 16 per cent of the total population of alldeveloping countries) obtained an annual growth rateof their total output of 6 per cent or more, 25 countries(with 31 per cent of the total population) grew be¬tween 4 and 6 per cent while 37 countries (53 per centof the total population) registered growth rates of lessthan 4 per cent on average.
Particularly good growth records over this periodaveraging 7 per cent or more per annum, were achiev¬ed by Libya, Liberia, Saudi Arabia, Spain, Greece,Yugoslavia, Nicaragua, Panama, Iran, Israel, Jordan,Syria, Taiwan, Hong-Kong, South Korea and Thai¬land, while Trinidad and Tobago, Iraq, El Salvador,Guatamala, Mexico and Peru attained growth ratesof 6-7 per cent.
In India the past slow economic growth accelera¬ted as a result of a bumper crop, backed up by amajor reform of agricultural policy. After a signifi¬cant decline in 1965 and only a moderate reco¬
in 1966, total output increased by 9.2 perin 1967, bringing the average annual growthof national income in the Sixties close to 4 per
After two years of unprecedented drought,agricultural production registered an increase of97 per cent in 1967, and total food grain product¬ion exceeded 97 million tons.
In Pakistan, the whole development strategy wasrevised at the end of 1966 with a higher prioritygiven to agriculture and quick-yielding projects.Total output rose by 8.2 per cent in 1967 - the highestrate ever recorded. Total agricultural production,and especially food production, rose substantiallyin 1967, not only due to favourable weatherconditions but also to the new agricultural strategywith more emphasis on new seeds, fertilisers andgreater freedom for the farmer to respond to marketincentives.
While it would be very unwise to infer that futurerapid progress in the Indian sub-continent is nowassured - the uncertain prospects for world trade, thedebt problem and the continuing political tensionwould alone require caution - it is encouraging to notethat the recent developments contain evidence ofstructural improvements. It is to be hoped that thepromise of these improvements will not be spoiled bytemporary climatic or political factors or by inade¬quate external economic support.
(continued on page 18)
verycent
rate
cent.
17

The Income Gap
The large disparity in the growth rates of differentdeveloping countries raises important analytical andpolicy problems. Why do countries differ so muchin their growth performance ? One clue to this issueis the relationship between growth rates and incomelevels.
There is reasonably conclusive evidence that rela¬tively richer countries more frequently record highergrowth rates since they can muster more resourcesfor savings and investment, whereas poorer countriesusually lack adequate resources to build up an effect¬ive material, social, economic and political infra¬structure, or public education and health facilities -essential prerequisites for rapid economic advance.
Table 2 shows the relationship between incomelevels and rates of growth in 1960-1966.
It should be recalled in this context, that a large,and widening, income gap exists not only betweenthe developed and the developing countries but alsowithin both of these groups. Per capita incomes varyas much as from about $450 to $4,000 among the deve¬loped and from $50 to about $1,200 among the countriesclassified as " developing ".
Variations in income among I he less-developedcountries are both cause and result of differences in
the pace and level of development. They indicatesubstantial differences in production and exportstructures, resource endowment, social and economic
institutions, income distribution and a host of quali¬tative differences among the various countries.
At one extreme there are countries (e.g. Israel,Venezuela, Argentina, Spain, Greece, Mexico) with adiversified production and export structure, richnatural resources, satisfactory levels of education andreasonably developed social and economic institutions ;at the other, there are countries (e.g. Malawi, Ethio¬pia, Upper Volta, Somalia, Burma, Rwanda, Burundi)heavily dependent on one or a few export commodi¬ties, having a large non-monetised sector in theireconomy, a low level of technical skills and under¬developed institutions. The latter group includesmost of the " least developed countries " whosespecial problems and needs were highlighted at theSecond UNCTAD in New Delhi.
The growth of total oui put depends upon I hegrowth of its main components, notably agricultureand industry. In 1 967 the most important develop¬ment was the recovery of agricultural production,after two years of stagnation caused by drought inSouth-East Asia and parts of Africa. The dramatic
INCOME LEVELS AND RATE OF GROWTH OF TOTAL OUTPUT OF SELECTED DEVELOPING COUNTRIES IN
1960-1966
Growth rate
of total output
per year; %
GDP per capitain 1965; $
Under 100 100 to under 200 200 to under 300 300 and more
7 and more Korea (South) Thailand China (Taiwan)Jordan
SyriaLiberia
Saudi Arabia
LibyaHong KongPanama
NicaraguaIsrael
Greece
SpainYugoslavia
5 to under 7 Pakistan Bolivia
NigeriaU.A.R. (Egypt)Philippines
El Salvador
IraqIran
Tunisia
Zambia
Honduras
Trinidad and TobagoMexico
Costa Rica
Chile
Guatemala
MalaysiaPeru
3 to under 5 EthiopiaUgandaMozambiqueTanzania
India
Sierra Leone
Vietnam (South)Cambodia
Sudan
Francophone Countries
TurkeyEcuador
Brazil
Paraguay
Venezuela
Jamaica
Colombia
Kuwait
Lebanon
under 3 Malawi
Indonesia
Burma
AngolaCongo (Kinshasa)Haiti
CeylonKenyaMorocco
AlgeriaDominican RepublicGhana
Rhodesia
UruguayArgentinaGuyana
IS

increase in several Asian countries reflects not onlyfavourable weather conditions but also the result of
new seed varieties used along with fertilisers. For alldeveloping countries as a group, agricultural andfood production rose by around 2.5 per cent perannum in the past years, i.e. by about the same rateas their population growth, but in 1967, 37 countries
accounting for two thirds of the total populationachieved a significant increase in their per capitafood production.
Industrial production continued to decelerate in1967, recording the lowest growth rate of the 1960's -4 per cent. This was partly due to the effects of lowagricultural output in Asia in 1965 and 1966 whichlimited agricultural inputs and caused high food prices,with a negative effect on consumer demand for indus¬trial products, as well as to disruption by militaryconflicts in some of the African and Middle-East
countries.
For most developing countries, exports provide amajor impetus to their economic growth, and almostthree-quarters of their exports are absorbed by thedeveloped, industrialised countries. Industrialisedcountries can contribute to the economic growth ofless-developed countries in two major ways: by tradeand external financing (including technical assistance).Their possibilities on both fronts, and particularlyin the field of trade, depend partly on the pace oftheir own economic growth. The higher the rate ofeconomic expansion in the industrialised countries,the higher is likely to be their import demand forproducts from less-developed countries and the largertheir capacity to provide assistance.
The aid and trade performance of developedcountries in 1967 has been influenced by their owneconomic difficulties. Structural payments disequi-libria have persisted for several of them. Thebalance-of-payments position of the United Statesand the United Kingdom worsened again in 1967.This has induced a marked slowdown in the economic
activity of the European surplus countries. Theoutput of Germany suffered an absolute decline in1967 which, in turn, dampened the import demandfrom the other countries of the Common Market.
With this unsettled situation, the developingcountries succeeded in achieving a very modestincrease in their total exports, from $41.7 billion to$43.1 billion, i.e. 3.4 per cent, compared with 7 percent in the previous year. There was only a modestincrease in Europe, Latin America, Africa and SouthAsia, whereas exports rose by 10 per cent in I heMiddle East. Among the countries that registeredsubstantial increases in exports in 1967 were (a) thepetroleum countries not involved in the Middle-Eastcrisis: Iran 47 per cent, Libya 18 per cent, SaudiArabia 9 per cent; (b) exporters of manufacturedproducts: Hong Kong 15 per cent, Israel 11 per cent,4'aiwan 18 per cent, South Korea 28 per cent (the twolatter countries also profited from a surge in demandfrom Vietnam); (c) exporters of raw materials forwhich there was rising demand, e.g. Ghana (cocoa)16 per cent, Cambodia (rice) 27 per cent, DominicanRepublic (sugar) 15 per cent. Among the countriesthat registered a reduction in exports in 1967 were (a)countries suffering as a result of political and military
disturbances, e.g. Nigeria 14 per cent, U.A.R. 6 percent, Syria 10 per cent, South Vietnam 36 per cent;(b) countries with serious structural problems, e.g.Burma 35 per cent, Indonesia 6 per cent; (c) exportersof certain primary products for which market condi¬tions had deteriorated, e.g. Argentina 8 per cent andUruguay 15 per cent (wool), Brazil 5 per cent (coffee),Malaysia 3 per cent (rubber), Zambia 5 per cent(copper).
Imports of developing countries also rose by 3.4 percent, i.e. from $46.9 billion in 1966 to $48.5 billion in1967, but this increase was considerably less than theincrease in their total output. Their import surplusgrew from $5.2 billion in 1966 to $5.4 billion in 1967.Excluding oil producers, which continued to have anexport surplus of around $ 5 billion in 1967, the tradedeficit of developing countries exceeded $10 billionin both years.
The combined gross exchange reserves of thedeveloping countries (gold, foreign exchange andIMF reserve position) continued to rise in 1967 to$13.8 billion. The increase was particularly pronoun¬ced for the developing countries in Latin America,especially Argentina ($500 million), some Asiancountries (Korea, Taiwan, Thailand), the oil produ¬cing countries and some non oil-producing MiddleEastern countries (Israel, Jordan). The increase inreserves of these countries, taken together, substan¬tially exceeded the rise in reserves of all the countriessince most of the other countries experienced a furtherdecline in their liquidity, often to precariously lowlevels.
In conclusion, it should be stressed again that thedata on growth rates of output and trade, which inmany cases are provisional, cannot adequately des¬cribe the true economic development in the less-developed countries. The story of development isessentially one of attitudes, beliefs and the will tochange outmoded patterns and structures. Manyimportant improvements have taken place whicheither defy measurement or which will take time toshow tangible results. In some countries the impactof new strategies is already discernible; in others itwill not be evident for some time. On balance, how¬
ever, a certain pace of progress - admittedly a slowone - is undeniable. To maintain and increase this
momentum, the richer countries have to make increas¬
ed and sustained efforts to match the hopes of thepeople of developing countries for better standards ofliving by achieving a better understanding of themutual interdependence within the internationalcommunity, as well as by a generous provision of theexternal ressources which are the necessary comple¬ment to the efforts of the less-developed countriesthemselves.
The growth prospects of developing countries forthe years ahead appear, on the whole, moderatelyfavourable. The breakthrough on the agriculturalfront in several large countries provides as muchreason for optimism as indications of a pronouncedupswing of economic activity and import demand inthe developed countries. If accompanied by soundpolicies, both could have a mutually reinforcingimpact on sustained advances towards a more pro¬mising pattern of the world economy.
19

NEW PATTERNS
UN
THE AID
RELATIONSHIP (1)
It is now appreciated - - at least by the pro¬fessionals if not always by the politicians -
that the transfer of resources from rich to poorcountries through what is generally called " deve¬lopment assistance " is a complex and difficultmatter. Any effort to make such assistance " effec¬tive " - and such an effort cannot be avoided if
public and parliamentary support for aid is to bebuilt up - creates a special set of relationshipsbetween donor and recipient not only in the economicfield, but also in a number of sensitive political areas.
How far should aid donors, individually or jointly,press developing countries to pursue the kinds ofpolicies without which the aid itself will be to someextent wasted ? How deep should such pressuresgo ? Through what channels should they be exer¬cised ? Should they include only immediately rele¬vant policies (such as the structure of power priceswhen a new hydroelectric plant is being financed) orshould they also include more fundamental points(such as the general efficiency of the civil service,or the scale of resources diverted to non-productivearms expenditures) ? These are obviously ques¬tions of great delicacy, calling for a special kind ofdiplomacy as well as professional understandingof the issues involved. But they cannot be avoided.
We are at present in an important transitionalstage in relations between the already developed,industrialised countries and the under-developedareas of the world. Many of the latter relativelyrecently become independent; moreover, as a group,they have for the first time become articulate andvocal in expressing their rights to a share in worldeconomic prosperity. This applies, in particular, tothe trade and aid fields : the so-called " AlgiersCharter " prepared by the underdeveloped " SeventySeven " before this year's United Nations Confer¬ence on Trade and Development at New Delhi, wasan expression of what they expect to obtain.
In international aid itself, the post-independenceperiod has been something of a disappointment sofar. Hopes that the upswing of aid volume typicalof the late '50's and early '60's would be continuedhave been realised only to a modest extent in recentyears and there are many elements of uncertaintyabout the period immediately ahead. Yet the later1960's have also been a period of rapid and signifi
cant change which may well mark a transition to anew and more satisfactory aid relationship :
the sources of bilateral (government-to-govern-ment) aid have become much more diversified, sothat many of the formerly exclusive relationshipsbetween individual developed countries and indivi¬dual developing nations are rapidly breaking down;
the scale, range and feasibility of multilateralworld aid institutions (notably the World Hankgroup and the UN family of specialised agencies)have been considerably extended;
there have been promising developments in thecreation and expansion of aid institutions servingparticular regions of the Third World.
The first element is expressed in the very existenceof the Development Assistance Committee. Mem¬bership of DAC -- currently sixteen bilateral donorswho between I hem provide over nine-tenths of allaid -- involves an acceptance of the idea of partici¬pation in a common aid effort, the pursuit of certainstandards in giving aid (notably in achieving a cer¬tain level of aid volume and an improvement in theterms on which if is made available) and a willingnessto seek common solutions to common problems.And, as the number of countries giving significantamounts of aid increases (see the statistics in thefollowing article) it must also imply a willingness tocoordinate aid programmes both as among thevarious aid sources and with the development priori¬ties of the receiving countries.
Under these conditions, it is no longer generallysufficient for DAC countries simply to respond toaid requests as they come forward : they are findingthemselves increasingly obliged to take an activeview of, first, in what fields they are in the bestposition to make a contribution and, second, howthat contribution can be fitted effectively into thetotal aid going to a given country. Amongst otherthings, they may be called upon, along with a num¬ber of other donors, to take a view of whether theywish to continue to provide certain kinds of assis¬tance to a developing country whose policies they
(1) For the phrase " the aid relationship " I amindebted to Andrzej KrassowskV s excellent study withthe same title. (Overseas Development Institute, Lon¬don, 1968;. E.P.
20

Meeting at high level of the OECD Development Assistance Committee
may feel are not likely to produce economic or socialprogress.
It is precisely here that the growing rôle of themultilateral and regional institutions is of greatimportance. Aid consortia and consultative grouparrangements, mainly tinder the leadership of theWorld Bank, now bring together regularly most ofthe aid donors assisting a group of developingcountries (including India, Pakistan and Turkey)who together absorb about one-half of the worldaid total. Such arrangements may be extended tomore developing countries (e.g. Indonesia is a pro¬bable candidate); and they may be intensified wherethey already exist for example, by the sending ofpermanent field staffs to advise on policy issues, andby closer study of the external assistance needs notonly of the developing country's economy as awhole, but also of key sectors within it. They pro¬vide, ideally, a framework for ensuring that, as faras possible, the aid donors are informed abouteconomic progress and related policies, while the aidrecipient is informed about the probable scale andshape of aid contributions : in the case of consortiaonly, this involves formal pledging of contributions.The ideal is not always realised - consultationsmay be too infrequent or inadequate and either sidemay be reluctant to put its cards squarely on thetable : but experience so far clearly suggests that theobstacles can be overcome as mutual confidence is
gradually established.
United Nations specialised agencies also have apotentially important part to play in their own fields
of interest by providing clearer guidelines for exter¬nal assistance in relation to development needs andpolicies. (Later articles on agricultural and educa¬tional aid set this out in more detail). And recentWorld Bank agreements with both FAO andUNESCO are a good example of possibly widerinter-agency arrangements which can put at thedisposal of financing bodies, seeking to identifysuitable projects for aid, the expertise of a technicalassistance agency.
There is nothing incompatible between theseapproaches to the aid relationship and the thirdaspect noted - - that of promoting regional develop¬ment institutions. On the contrary, the treatmentof aid questions in a regional context can bring innew and valuable elements. Donors are thenconfronted not by a single developing country, butby a group : particularly where smaller aid reci¬pients are concerned, the dialogue is more evenlybalanced between the two sides and sensitivities maythus be less acute. External aid may then be seenas a supplement to a mutual effort of developmentand assistance among the aid receivers. Thewillingness of the group of developing countries toco-operate among " themselves is thus of criticalimportance : but co-operation may itself be fosteredif as in the case of the Colombo Plan for SouthEast Asia the donors provide some tangibleencouragement.
It would be idle to pretend that regional approachesto development are forging ahead. But some ofthe most important pieces in a vast jigsaw of possible
2!

institutions are. now well in place. Arrangements inLatin America under the Alliance for Progress pro¬vide a regular consultative channel on developmentpolicies and problems (the CIAP), a very activeregional development bank (the Inter AmericanDevelopment Bank), and technical assistance pro¬grammes (through the Organization of AmericanStates). A key piece in South East Asia will cer¬tainly be the Asian Development Bank (1965); itremains to be seen how far the same may be said ofthe African Development Bank (1964). Apart fromthese financing institutions, there are many signsof a drawing together for economic development
purposes of various groups of countries in all thecontinents of the Third World.
It has sometimes been said that, if more aid canbe provided, there is no lack of institutions to spendit. This is a somewhat facile approach. The twoelements - - more adequate aid resources, matchedby the operational means to ensure that they areused effectively and under conditions tolerable todonors and recipients alike -- are intimately linked.An increase in aid will, over the longer run, dependheavily upon a further basic improvement in the aidrelationship.
STATISTICS :THE FACTS
ABOUT
RESOURCE
FLOWSTO
DEVELOPINGCOUNTRIES
The Member countries of
the OECD DevelopmentAssistance Committee regularlytransmit statistics on the volume,types and terms of financial andtechnical assistance they provide toless developed countries. The da¬ta cover resources supplied byboth the official and private sec¬tors. Official contributions include
grants and loans made bilaterallyto individual developing countries,as well as grants, loans and capitalsubscriptions to multilateral orga¬nisations active in the aid field.
The private sector provides resour
ces in the form of direct and
portfolio investment and the exten¬sion of export credits. Thereare also substantial grants madeby private non-profit groupsfoundations, voluntary agenciesand churches. These grants areestimated to have amounted to
over $600 million in 1967, but thedata are not very reliable and areomitted from the tables on these
pages.
This is a wide field indeed, andthis article can do no more than
summarise its broad features, in a
series of tables and charts designedmainly to appraise recent trendsand performance, and to look atsome of the implications of the aidtargets existing today or underdiscussion.
Overall trends are examined inTable 1 and Chart A. The total
" net flow" (1) of resources provid¬ed by DAC Members to the develop¬ing world in 1967 amounted to$11.3 billion. This was a record
figure, and it continues the mode¬rately rising general trend charac¬terising donor countries' perform¬ance in the 1960's.
Some of the detail of the total
net flow is also given in Table 1.The official sector typically ac¬counts for almost two-thirds of the
outflow of development assistance,;ind in 1967, these contributionsrose by $0.5 billion to a newhigh a strong performance achiev¬ed despite the difficulties in ob¬taining an expansion in new aidcommitments in certain Membercountries. Most official flows are
on a bilateral basis, but an increas¬
ing, if still relatively small, shareis now being channelled throughmultilateral agencies such as theWorld Bank Group and the UnitedNations Development Programme(although there are quite largeyear-to-year fluctuations). Al¬most one-half of the 1967 total
increase in official aid volume re¬
presented contributions to multi¬lateral agencies.
The billion of official re-
(1) This is one of the standardstatistical concepts used in DACreporting practice. It measures netdisbursements, i.e. the gross amountslent and granted less repaymentsreceived during the period on ac¬count of earlier lending.
22

A. TOTAL FINANCING FLOWS FROM DAC COUNTRIES TODEVELOPING COUNTRIES (1960-67) ( Net disbursements, Bill, dollars)
TOTAL PRIVATE
' OFFICIAL
MULTI¬
LATERAL
OFFICIAL
BILATERAL
>TOTAL
OFFICIAL
TOTAL
OFFICIAL
+
PRIVATE
1960 1961 1962 1963 1964 1965 1966 1967
1. - TOTAL FINANCING FLOWS:
THE FLOW OF FINANCIAL RESOURCES FROM DAC COUNTRIES, 1960-1967Net disbursements (1) ($ million)
1960 1961 1962 1963 1964 1965 1966 1967
TOTAL OFFICIAL,
NET 4,930 6,029 5,950 6,072 5,856 6,202 6,506 (6,985)
_zo
Bilateral 4,329 5,277 5,423 5,707 5,476 5,753 5,970 (6,218)
J_
H
O
To multilateral
agencies 601 752 527 365 380 449 536 (767)
TOTAL PRIVATE,
NET 3,182 3,212 2,577 2,545 3,292 4,261 3,975 (4,330)
__Bilateral 2,978 3,121 2,338 2,576 3,146 4,009 3,947 (4,024)
__
gH
O
To multilateral
agencies 204 91 239 146 252 28 (306)
TOTAL OFFICIAL
AND PRIVATE 8,112 9,241 8,527 8,572 9,148 1 0,462 10,482 (11,315)
(1) Gross disbursements minus repayments on earlier lending.
23

sources provided to the developingworld in 1967 represented twentytwo cents per head per week for thepopulation of DAC Member coun¬tries. Of this, 11 cents were in theform of grants, 8 cents in the formof loans. Private sector funds,(mainly direct and portfolio in¬vestment and export credits) arealso an important component ofdevelopment financing. They tendto be quite volatile, but inrecent years they have accountedfor a more important share of totalthan in the early 1960's. Likeofficial flows, most are channelled
directly to recipient countries, butan important role is now be¬ing played by private multilateralportfolio investment, which reach¬ed a new high of over $300 mil¬lion in 1967. Bond flotations bymultilateral agencies in 1967 weremainly made in the United Statesmarket, but with world interest
rates easing, a trend to wider geo¬graphical spread of placings (inclu
ding placings in less developedcountries) has become evident.
The flow? of assistance funds
may on occasion seem roundabout,and DAC Members are not the onlysource of supply although theyare the main source. The circuit
in 1967 and its components areshown in Chart B. Developingcountries received a net flow of
about $11.6 billion, or almost $7 percapita (compared with $5.5 in 1960,despite the subsequent growth intheir population). About $88 ofevery $100 represented public andprivate funds supplied bilaterallyfrom DAC Member countries. The
other main source of bilateral
funds - the group of centrallyplanned countries, accounts forsome 3 per cent. The remainderof less-developed-countries' receipts
9 per cent consisted of disbur¬sements by multilateral agencies,most of whose financing is in factderived from DAC Members.
As will be seen from Chart B,these agencies, whose disbursementsto the Third World passed the $1billion mark in 1967 for the first
time, received contributions of ap¬proximately the same amount inthat year. Historically, this balan¬ce is rather unusual. Many spec¬ial-purpose agencies are relativelynew most were founded after 1960
and the contributions they receivefrom members can only be disbursedafter the necessary commitment andproject implementation procedureshave been gone through, a processwhich may take two or three yearsor more. Thus in the early 1960's,a pipeline of multilateral fundswas built up, followed by an out¬flow of funds from multilateral
agencies to the developing worldover the years 1964/1966 which washigher than the inflow of currentcontributions to them. The stabi¬
lisation of the pipeline in 1967 withcontributions and outflows at a
new high level, together wi I h known
B. TOTAL NET FINANCING FLOWS FROM INDUSTRIALISED COUNTRIESAND MULTILATERAL AGENCIES TO LESS-DEVELOPED COUNTRIES IN 1967
NET OUTFLOWS FROM DONOR COUNTRIES : S 11,675 million
DAC MEMBERS
BILATERAL PRIVATE
S 4,024 million
BILATERAL OFFICIAL
$ 6,218 million
MULTILATERAL
$ 1,073 million
TOTAL NET RECEIPTS OF
LESS-DEVELOPED COUNTRIES
11,592 million
CENTRALLY PLANNED
COUNTRIES + OTHERS (1)MULTILATERAL: S 10 million
N\ MULTILATERAL AGENCIES //\
$ (1,083) million yy
S 4,024 million
S 6,218 million
$ (1,000) million
$ 350 million
t!i
I
BILATERAL: S 350 million (1) Finland, South Africa, New Zealand
24

commitments made by developedcountries covering the next fewyears, indicates continued growthover the medium term of the flow
of resources to the multilateral or¬
ganisations, and from them to less-developed countries.
Tt_eAidTargetDAC Member countries are well
aware of the need to maintain and
increase the flow of resources to the
less developed countries, and inJuly 1965 the Committee adopteda recommendation to its Members
" to attain and if possible exceed.... 1 per cent of national income "in the net amount of financing(public and private) supplied todeveloping countries. Between1956 and 1967, actual flows havein fact been rather close to this
level, although they have slippedbelow it in recent years (the 1967figure was 0.93 per cent).
The Second UNCTAD meetingin New Delhi early this year recom¬mended that developed countriestry to devote 1 per cent of theirgross national product to assist¬ance purposes as early as possible.DAC Members have associated
themselves with this resolution.
whose implications are currentlybeing studied by the Committee.As GNP is a substantially higherquantity than national income, theeffect of adopting this new object¬ive would be to raise target aidflows by around one quarter.This appears clearly in Chart C,which also takes a look into the
future based on forecasts of Mem¬
bers' GXP prepared by OECD.If, for example, the " 1 per cent ofGNP " target were to be achievedby DAC Member countries collect¬ively by 1975, net flows wouldhave to rise by about 8 per cent ayear between now and then with¬out counting the effect of any risein prices that the GNP forecasts
may not have allowed for. Thiswould mean a rate of increase of
net flows of assistance from DAC
Members at least twice that regis¬tered so far during the 1960's.
Efforts
of lixcl ivie IliaJ
DAC Members
Some overall data on the size
and components of individual DACMembers' assistance flows in 1967
are given in Table 2, which alsocompares figures for the threeyear periods 1965/7 and 1960/2(so as to eliminate distortions aris¬
ing from year-to-year fluctuations).The four largest programmesthe United States, France, Germa¬ny and the United Kingdom -together account for about 80 percent of the total.
(continued on page 26)
C. THE AID TARGET DAC MEMBERS COMBINED
Bill, dollars
22.0
20.0
18.0
16.0 1 % of gross national product
1 % of national income
Total financing flows (net)
956 1957 1958 1959 1960 1961 1962 1963 1964 1965 1966 1967 1975
2S

2. EFFORTS OF INDIVIDUAL DAC MEMBERS:
THE OUTFLOW OF TOTAL OFFICIAL AND PRIVATE FINANCIAL RESOURCES IN SELECTED PERIODSNet disbursements ($ million)
1960/2
Average
1965/67
Average
19 67
CountryOfficial Sector Private Sector Total
Total as %of National
Income
AUSTRALIA 67.9 151.6 167.2 15.0 182.2 0.86
AUSTRIA 19.0 48.1 38.8 9.0 47.8 0.60
BELGIUM 154.8 184.2 98.8 54.6 153.4 1.00
CANADA 113.8 229.6 213.0 39.9 252.9 0.59
DENMARK 28.6 21.4 28.0 3.2 24.8 0.27
FRANCE 1,375.5 1,320.9 831.1 512.8 1,343.9 1.64
GERMANY 704.6 869.2 549.4 593.6 1,143.0 1.26
ITALY 315.4 394.0 202.8 82.1 284.9 0.53
JAPAN 304.6 670.0 390.6 464.7 855.3 0.95
NETHERLANDS 184.4 239.9 113.5 113.5 227.0 1.24
NORWAY 14.6 28.6 15.5 14.7 30.2 0.48
PORTUGAL 40.5 49.5 46.6 31.8 78.4 2.12
SWEDEN 45.3 100.5 59.9 60.8 120.7 0.70
SWITZERLAND 176.2 135.8 3.9 117.3 121.2 0.93
UNITED KINGDOM 840.9 952.5 503.1 378.0 881.1 1.01
UNITED STATES 4,240.5 5,356.5 3,723.0 1,844.0 5,567.0 0.85
TOTAL DAC COUNTRIES 8,626.5 10,752.9 6,985.1 4,329.7 11,304.8 0.93
The United States alone provid¬ed about half the financing flowsrecorded in 1967. Yet this figureof $5.6 billion, which was a notunsubstantial increase over earlier
years, represented only 0.85 percent of US national income - be¬
low the DAC target of 1 per cent,and below the actual 1967 averageof 0.93 per cent.
Six DAC Members (Belgium,France, Germany, Netherlands,Portugal and the United Kingdom)provided a net flow of resources todeveloping countries in excess of1 per cent of their national incomein 1967. But it should also be
noted that some Member countries
which remained below the national
income target in 1967 have never¬theless been increasing their contri¬butions very significantly in recentyears. This group includes Aus¬tralia, Canada, Japan and Sweden,and together with Germany, theNetherlands and the United States,it accounts for the bulk of the in¬
crease in assistance volume in re¬
cent years. Countries whose pro¬grammes have on balance remainedstable over the past three or fouryears include Belgium, France andthe United Kingdom.
3. FINANCIAL TERMS OF AID
FINANCIAL TERMS OF OFFICIAL AID PROGRAMMES, 1967Commitments data
Grants Loans
Country Grants as
% of totalcommitments
Weighted average
Maturity
(years)
Interest
rate (%)
Grace Period
(years)
AUSTRALIA 100 (a) (a) (a)
AUSTRIA 13 6.5 5.9 0.7
BELGIUM 92 18.2 3.2 4.9
CANADA 49 30.9 3.4 4.4
DENMARK 63 24.0 0.0 6.6
FRANCE 73 15.1 3.7 (1.8) (b)
GERMANY 35 19.0 4.3 4.9
ITALY 12 8.5 4.0 1.2
JAPAN 38 16.6 4.8 4.7
NETHERLANDS 66 25.5 3.6 7.0
NORWAY 96 19.9 2.6 7.0
PORTUGAL (1) (28) (22.3) (3.6) (4.1)
SWEDEN 84 21.4 2.0 6.4
SWITZERLAND (2) 100 (a) (a) (a)
UNITED KINGDOM 57 24.1 1.1 5.5
UNITED STATES 56 28.2 3.6 6.7
Total DAC (55) (23.0) (3.6) (5.3)
(I) 1966 data. (2) Excluding loans to IBRD and IDA.(a) No bilateral loans. (b) Based on incomplete data.
26

The Financia I
Terms ofOfficial
Assistance
Official flows to developingcountries vary substantially inrespect of the financial terms atta¬ched to them. Fifty-five per cent.of total assistance commitments
by DAC Members in 1967 were inthe form of outright grants, theremainder being loans on varyingterms i.e. interest rates, maturities
and grace periods,
The DAC in July 1965 recom¬mended that Members improvethe terms of their assistance in
view of the increasingly seriousdebt problems of certain develo¬ping countries. Briefly, it proposedthat either countries' aid should
contain a high proportion (70 percent or more) of outright grants orthey should attempt to soften ahigh proportion of I heir lendingprogrammes to certain averagestandards (3 per cent interest,
25 years' maturity, 7 years' graceperiod) or better.
There has been considerable pro¬gress in this direction, although insome respects 1967 performancewas disappointing. Six countrieshave programmes whose grantcontent exceeded the recommend¬
ed proportion -- Australia (whichfollows a grants only policy in re¬spect of official funds) Belgium,France, Norway, Sweden and Swit¬zerland, the latest country toacceed to membership of the Com¬mittee. Of the remaining coun¬tries, the Netherlands was in com¬
pliance with the maturity andgrace period recommendations, andthe average maturity involved inthe Canadian and the United
States lending programmes exceed¬ed 25 years. Denmark, Swedenand the United Kingdom werecountries which at well below-ave¬
rage (sometimes zero) interest ra¬tes, although these countries didnot comply with the maturity andgrace - period provisions of theBecommendation. For DAC Mem
bers combined, as can be seen fromTable 3, grants accounted for 55per cent of official programmesaverage maturities and grace pe¬riods fell short of compliance byabout two years, and the averageinterest rate exceeded the recom¬
mended ligure by 0.6 per cent. (1 ),Thus, some further progress hasstill to be made, but it is not too
early to consider the scope forrevising the target to secure stillmore favourable average termsfor developing countries a sub¬ject which is currently under dis¬cussion in the Committee.
(\) These are commitments data,i.e. they relate lo countries declaredintentions to provide assistance.But administrative reguirements andthe long periods involved in thefruition of many projects (il maytake over 5 years to build a dam)typically result in disbursementsbeing spread over a period of severalyears following the year in whichcommitments are made - - another
example of an aid " i)ipeline ".
NEWAPPROACHES
TO PRFVATE
INVESTMENT
Newtrends in the role ofprivateforeign investment fordevelopment
Private capital flows constitute an importantsource of development finance and technicalassistance. Private foreign direct invest¬
ment, in particular, brings special kinds of skills andresources. It has contributed to opening up naturalresources and to creating broadly based manufactur¬ing industries. It is hoped also that a growingnumber of developing countries will be able to relyincreasingly on normal commercial financing flowsfor their external financial and technical needs.
Official aid and private foreign capital are comple¬mentary; both have their role to play in the develop¬ment process.
JJie statistical material presented elsewhere in thisissue (see especially tables page 23) shows the impressive
increases in various types of private capital flows inrecent years. Private capital flows, now running atan average annual rate of more than $4 billion, haveaccounted for between 30 and 40 per cent of totalfinancial flows to developing countries. They have,in fact, increased at a faster rate than official aid flows.While the United States, France and the United
Kingdom continue to be the major sources of privatecapital, recent years have seen the emergence orre-emergence of countries like Germany, Japan andItaly as important capital exporters.
A large and growing volume of privateforeign investment in developing countries will onlytake place if both the investor and the host countryfind mutual benefit in these operations. Private
27

foreign enterprise must be able to find an economicclimate and policies which permit effective operation,treatment and prospects for reasonable profits. Hostcountries, in turn, have a legitimate interest in attract¬ing private foreign investment primarily to thosesectors where it is likely to make a useful contributionto economic development. The host government andthe private foreign investor must, therefore, seek tonegotiate terms and conditions of entry and opera¬tion which strike a fair balance between the interests
of both parlies.The mutual character of the interests and responsi¬
bilities of foreign firms and host countries is increas¬ingly recognised on both sides. There are, indeed,indications of new trends in the relationship betweeninvestors and governments of less-developed countries.In recent years a growing part of private foreigninvestment has been designed to use opportunitiesfor import substitution. These investments take
place in the field of consumer goods industries orlight engineering and are more closely integrated withthe national economy than investments in extractiveindustries or plantations. Even the latter have tend¬ed to become more closely integrated into the localeconomies, and profit-sharing arrangements have un¬dergone important changes.
Governments of the newly independent countrieshave become more experienced and self-confident.They are aware of their power to control the entryand operation of foreign companies with I he wide-ranging array of policy instruments at the disposalof sovereign governments, such as company laws,licensing, fiscal measures, employment rules andexchange controls. They are thus using their bar¬gaining power fully, but at the same time they arebecoming somewhat less pre-occupied with the alle¬ged implications of private foreign investment fortheir national sovereignty and independence.
The printing and canning section of a private Venezuelan company whose modernisation is being assistedby the International Finance Corporation
28

While the conditions of entry required by severalless-developed countries have become more demand¬ing in some respects, those countries have at thesame time become increasingly aware of the benefitsthey can derive from private foreign investments andare interested to attract foreign investment on alarger scale. But host countries must understandthat private foreign investment can only operateefficiently if certain minimum operating conditionsare met.
Foreign investors, as their ventures are more fullyintegrated into the economies of developing countries,are aware of their responsibilities and have becomemore sympathetic to the objectives and problems ofless-developed countries. Many companies haveprovided valuable infrastructure facilities or haveset up training programmes for local staff, sometimesgoing well beyond their own immediate needs.
Wnat can
governments ofcapital-exporting'
countries do to
encourageprivateforeign investment?
Fundamental economic conditions, relative profitopportunities and the general " investment climate "cannot be basically changed by governments ofcapital-exporting countries. To the extent that thesefactors can be determined by governments at all, theresponsibility must, in the first place, be that of thedeveloping countries themselves. Nevertheless, pri¬vate investors have indicated that certain types ofincentives can be effectively provided only by capi¬tal-exporting countries, such as guarantees againstthe risks of expropriation and of restrictions on therepatriation of profits and capital. In addition mea¬sures to foster private foreign investment requiretechnical expertise and resources which are in scarcesupply in developing countries and where donorcountries may be able to help.
Several DAC countries have offered a range offacilities for investors in developing countries. Ger¬many, the United States, Japan and, to a lesser extent,Australia, Denmark, France and Norway providegovernment guarantees for non-commercial risks.The Netherlands, Sweden and Switzerland have such
guarantee schemes under consideration. Severalcountries especially Germany, Switzerland and theUnited States have concluded investment protectionagreements with a series of developing countries.In the World Bank a multilateral guarantee scheme istinder consideration and a Centre for the Settlement of
Investment Disputes has recently been established.A few DAC countries exempt foreign investmentincome from taxation or offer tax credits. Most DAC
countries provide various investment informationfacilities or subsidise feasibility studies. Somegovernments, as well as the World Bank Group, haveestablished, in addition to direct government lendingactivities, special financial institutions to help set up
private ventures mainly in participation with localcapital and entrepreneurs. Examples are the Inter¬national Finance Corporation, the CommonwealthDevelopment Corporation and the Deutsche Ent-wicklungsgesellschaft.
There is much more scope for imaginative co-oper¬ation between aid donors and private investors. Inmany cases the legislative authority and the aidinstruments lor this co-operation are already avail¬able. This approach requires considerable discretionand may raise difficult problems of government-private sector relations; but if there are opportunitiesfor foreign aid to play in this way a significant role indeveloping countries, they should not be lost.
Need fora closer
dialoguebetweengovernments of
capital-exportingand importingcountries and
private investors
There are important differences in attitudes andpolicies among developing countries as well as amonginvestors. Many important investment projects arenot realised because of failure to reach agreementabout mutually acceptable terms. Companies oftencomplain about certain aspects of host country poli¬cies such as uncertainty about the basic attitude ofgovernment towards private foreign investment, un¬due restrictions on repatriation of profits or on theuse of expatriate personnel, discrimination in favourof domestic (especially publicly-owned) enterprises.Host countries, in turn, complain about lack of integ¬ration into the domestic economy, excessive profitexpectations, failure to reinvest an adequate part ofthe profits, lack of interest in promoting exports,reliance on foreign supplies of raw materials and com¬ponents, as well as personnel, rather than on domesticresources. Such mutual grievances, distrust, uncer¬tainty about basic attitudes and objectives, rightsand obligations adversely affect the investment cli¬mate, impair the operating efficiency of existinginvestment and discourage new investments.
J nere is, therefore, a clear need for governments ofcapital-importing and capital-exporting countries,which are concerned with the contribution of privateforeign investment to economic development, toclarify further the economic effects of private foreigninvestment and to explore ways in which its contri¬bution could be made more effective, taking intoaccount the interests of all parties concerned.
In large measure, the economic effects of privateforeign investment will depend on the general eco¬nomic, financial, fiscal, social, commercial and otherrelevant policies. The scope for action by govern¬ments of capital-exporting countries in contributingto an improved investment climate and in creatingconditions for effective operations by private foreigninvestors is necessarily limited. These governments
29

can provide general or selective inducements forinvestments in developing countries. But the deter¬mination of the fields and the circumstances in which
foreign investment is welcome to operate is the re¬sponsibility of the host country governments them¬selves, and the specific conditions of entry and oper¬ation are set by them unilaterally or in negotiationwith potential foreign investors.
Further work is required to determine the policiesand conditions of operation which combine operatingefficiency, reasonable returns and a long-term contri¬bution to the development potential of the host coun¬try. It is essential to strengthen the broader dialoguebetween investors and host countries to establish a
better awareness and comprehension of each other'sproblems and preoccupations.
A GREEN
REVOLUTION
IN
THE DEVELOPING
COUNTRIES ?
Few topics have been more at the centre ofinternational discussion during the past three
years than the problem of the world's future foodneeds and its relation to the rapidly expanding popu¬lation in the developing countries. Two years agothe outlook seemed to be bleak. With average levelsof food consumption already far below the minimumnutritional requirements, the index of food product¬ion per capita, after stagnating at the level of 102 -103 (1957-1959=100) smce the beginning of theSixties, had fallen to 98, two percentage points belowthe level already reached ten years earlier.
In some countries, notably India, which accountsfor more than one third of the developing world'spopulation, the situation was even worse. There theindex fell from the level of 108 in 1961 to 93 in 1965
and to a disastrous 89 in 1966. Only massive food-grain imports, most of them on concessionary termsfrom the United States, Canada and Australia, couldstave off a famine of unprecedented proportions.But the problem was not only concentrated in India.A number of other important developing countries,notably Indonesia, Pakistan, the United Arab Bepub-lic, Brazil and several West African countries had
become increasingly dependent on food imports fromabroad.
Serious questions arose about the continuing abilityof developed countries to meet these bulging foodneeds. Wheat stocks in the principal exporting coun¬tries (1) declined from a somewhat embarassing 59million tons in 1961 to a more normal carry-over of 30
million tons in 1966. Bui a continuing depletion ofstocks at such a rate could not have been supported forvery long. Even if it is admitted that the developedcountries still have an enormous potential for expand¬ing acreage and production, it is doubtful that thedeveloping countries would have been in a position tosolve the financial and internal distribution problemswhich are invariably associated with such heavy de¬pendence on food supplies from outside.
During the past year a significant reversal in foodproduction trends has taken place. Favourable grow¬ing conditions, particularly abundant and timelymonsoon rains during late summer and early autumnof 1967 in the Indian subcontinent, contributed to a
sharp production increase, particularly in foodgrains.The index of per capita production for the less-deve¬loped countries as a whole rose by 6 points to 104which was, however, still only slightly above the levelachieved earlier in the decade.
Is this rebounding simply a positive variationaround a basically stagnating trend or is a real take¬off in the making? J ne answer to this question mustnot be sought primarily in the production statisticsbut rather in certain indicators of basic technologicalchange : the use of improved inputs, more productiveseeds, fertilisers, mechanical equipment and basicinstitutional changes in the rural society of the deve-
(1) The United States, Canada, Australia, Argentinaand France.
30

A scientific officer of the Tropical Products Institute, London, examines maize for insects on behalf of several African countries
loping countries. Looking at these factors, the evi¬dence is strikingly positive.
The most tangible sign that something very basicis changing is the enormous rate at which the develop¬ing countries have been increasing their fertiliserconsumption in recent years. Still far below averageconsumption levels in OECD countries, their totaluse of fertiliser rose from 2.3 million tons in 1955-1956
to 6.7 million tons in 1965-1966, an almost threefoldincrease. In India, the increase was more than six¬
fold over the same time period, from 131,000 to 807,000tons. For 1970-1971, India's fertiliser consumption
is projected to rise to 1.1 million tons, another five¬fold increase over the 1965-1966 level.
Closely linked with the greater use of fertilisers wasthe introduction on a massive scale of new seed
varieties of wheat, maize, sorghum and rice. Thesenew varieties have not only an inherently higher pro¬duction potential but also respond much better to fer¬tiliser use and often have shorter growing periods thantraditional varieties. As a result, where formerlyone or two crops could be grown, it is now possiblewhere climatic conditions are favourable to harvest
one additional crop. The rate at which farmers in
31

many developing countries are adopting these newvarieties - - introduced largely with the help of theRockefeller Foundation --is striking.
In a recently published article dealing with deve¬lopments in Asia, Lester Brown (1) provides specificfigures showing the rate at which improved varietiesare being introduced in that area. In India, the areaplanted with new varieties went up from about23,000 acres in 1965-1966 to nearly 4 million acres oneyear later. By 1970-1971, they are expected to cover40 millions acres, nearly fifteen per cent of the totalfoodgrain acreage. Pakistan imported large quanti¬ties of Mexican seed wheat which will allow that
country, after only 1 or 2 years of domestic seed repro¬duction, to cover its entire wheat acreage with theimproved varieties. Other countries, particularlyTurkey, Tunisia and the Philippines, are also intro¬ducing the new varieties on a massive scale.
One of the most interesting and important sideaspects of this development concerns the attitudes offarmers in the developing countries. In the pastthey were often described as backward, illiterate andtradition-bound. It has turned out that this holds
only as long as they are not sure that a new techniqueshown to them by the extension agent is clearly supe¬rior to their traditional methods. When they couldbe convinced that the new techniques doubled or tri¬pled their yields, substantially increasing net profits,they were eager to adopt them and, in many cases,were willing to pay premium prices for a handful ofimproved seed or a fewr bags of fertiliser.
Evidence of this profit-mindedness is also provi¬ded by the fact that over the past few years far¬mers in India and Pakistan have installed at their own
expense tens of thousands of tubewells to supplementthe water allocated to them from the old canal net¬
work. These installations not only benefit the indivi¬dual farmer, allowing him to intensify his croppingpattern and to reduce the year-to-year fluctuations inproduction, they also contribute to lower the ground-watertable, thereby reducing the incidence of water¬logging and salinity which, in the past, has had suchdisastrous effects on the qualify of soils in manyirrigated areas.
All these are hopeful signs and their importancefor the future growth possibilities of the developingcountries should not be underestimated but much
remains to be done. The long process of commercial¬ising the agricultural sector to the point where itbecomes integrally linked with other sectors of theeconomy through the marketing system, requiresaction in a number of fields. Particular attention
must be paid to the rapid development of the internalstorage and marketing network. In the absence of areasonably secure market and the assurance that themarketable surplus can in fact be sold, farmers in thedeveloping countries will have little incentive to be¬come more specialised in those crops best adapted totheir environment or to continue to adopt new product¬ion techniques which require increasingly heavy finan¬cial investments on their part.
In the absence of an effective marketing system,farmers naturally adopt " insurance-oriented " crop¬ping patterns which maximise their degree of self-sufficiency and minimise their dependence on thecommercial market. The heavy reliance on food
imports for the supply of urban centres, which was apolicy followed in a number of developing countriesin the past, has definitely retarded the commerciali¬sation of agriculture. Food prices were kept undulylow in relation to the general price level, therebyreducing incentives for the farmer to increase product¬ion; public spending on overhead facilities for thedevelopment of the domestic marketing system wasinsufficient and storage facilities, prerequisite for ameaningful price policy, were wholly inadequate.
The bitter lessons learned by developing countriesduring the past two years have changed the outlookalso in places where it can count very much, the plan¬ning ministries and the minds of political leaders.Not only is there a trend for public spending in agri¬culture and related sectors to rise, but slowly the ideais gaining in the minds of young scientists, teachersand technicians that work on promoting agricultureis not necessarily a life devoted to backwardness andstagnation. To be sure, attitudes change only gra¬dually because the " urban bias " as Lipton (2)called it in a recent article has been ingrained in theminds of the young intellectuals for decades and isnot easily overcome.
Is there scope foroutside help inagriculture?
Aid donors, too, trying to help agriculture in thedeveloping countries have learned much about howto improve their aid to that sector. The work of theOECD's Development Assistance Committee has beenintimately involved with these activities.
Following a Recommendation adopted at theOECD Development Assistance Committee's July1966 High-Level Meeting, an intensive review ofagricultural aid programmes, both bilateral andmultilateral, was conducted. The results of this
review, published recently (3), provided new and im¬portant insights about the volume of aid going to thatsector as well as experiences gained by various donorsin carrying out their programmes. Although it isdifficult a priori to determine just how much aidshould go to agriculture, the DAC review suggestedthat only 12 per cent of the aid flow, as was the caseduring the early Sixties, was probably far too littleconsidering the importance of the agricultural sectorin the economy of most developing countries.
Since the time of the review, a number of donor
countries and multilateral aid agencies have apprecia¬bly increased their aid to agriculture. In the US-AID programme, allocations, have gone up from $570million in fiscal year 1968 to an estimated $800 mil¬lion in fiscal year 1969. A big share goes for the
(1) 77ie Agricultural Revolution in Asia, ForeignAffairs Vol. 46, N° 4, July 1968.(2) Michael Lipton, " Urban Bias and Rural Plan¬ning in India " in The Crisis of fndian Planning, PaulStreeten and Michael Lipton ed. (published by OxfordUniv. Press)(3) OECD, Aid to Agriculture in Developing Coun¬tries, Paris 1968.
M

purchase of fertilisers. Food aid policy is changingsignificantly with more emphasis being accorded tocomplementary self-help efforts by the recipientcountry concerned.
Uie German Government, which for many yearshas emphasised the importance of agriculture in itsaid programme, continues to increase its aid contri¬butions to that sector. Technical assistance contri¬
butions alone increased from 26 per cent in 1966 tomore than 40 per cent in 1967, and more aid is envi¬saged for production requisites, mostly fertilisers.
In the British aid programme about 16 per centof total bilateral assistance and nearly 20 per centof technical assistance funds were spent on agricul¬ture. About 1,350 United Kingdom agriculturalexperts were stationed in developing countries in1 966. Many of them brought along valuable experiencegathered in the former colonial service.
France, concentrating its aid efforts largely on theWest African countries and Madagascar, emphasisesrural development schemes and the development ofcommercial crops and plantations. A large and im¬portant network of specialised agricultural researchinstitutes with headquarters in metropolitan Franceprovides the know-how so vital for the practicalimplementation of these schemes.
The multilateral agencies with funds largely pro¬vided by OECD countries on banking terms arecontinuously finding new ways of extending aid toagriculture. Not only capital-intensive irrigationworks but increasingly other projects, particularlyeducational facilities and rural credit institutions,
are considered for financing. The International Bankfor Reconstruction and Development, with total agri¬cultural funds of about $1.1 billion, currently hasabout $500 million in the pipeline for this purpose.
In a co-operative agreement with FAO, the Bankcontinuously develops new agricultural projectswhich are suitable for financing. A similar agree¬ment exists between FAO and the Inter-American
Development Bank, the agency which so far has com-mited the largest share (about 27 per cent) of itsfunds for agricultural development purposes.
The Asian Development Bank, since it began itsoperations about two years ago, has sent a ten-manmission to the principal Asian countries to review thesituation in the agricultural field, partly with a viewto assessing priority projects and programmes foroutside assistance. The establishment of an Agri¬cultural Development Fund is provided for in theBank's Articles of Agreement and the Bank is present¬ly working out the basic rules under which the Fundshould operate. A number of donor governments(Japan, the United States, Canada, Denmark and theNetherlands) have indicated their willingness tocontribute.
Looking back over recent developments concerningagriculture and food production, a certain cautiousoptimism regarding the future may be justified.The crucial role of agriculture is now better understoodboth by planners in the developing countries and byaid administrators. Substantial progress has beenmade in defining the actions internal policy mea¬sures, technical assistance and capital projects -which, conceived as an integrated whole, are able toget agriculture moving even where farmers are " illite¬rate " in the traditional meaning of this term. Thefarmers themselves, far from being uninterested andapathetic, are showing eagerness to adopt newmethods wherever it can be convincingly shown tothem that the new approaches are indeed superiorto old ways and provide quick increases in income.
THE SIGNIFICANCE
OF
EDUCATIONAL
The educational systems of the world havebeen expanding during the last fifteen
years at a rate never before attained. During thisperiod educational enrolments doubled and publicexpenditure on education rose on an average 6 % percent annually in the industrialised countries, and12 y2 per cent a year in the developing countries.This rate of increase was between two and four times
that of the rate of growth of national income and
between three and six times that of population growth.The cause of this rapid expansion in the industrial¬
ised countries has been the growth and better distri¬bution of income, with the accompanying increase insocial and individual aspirations and the spread ofmodern technology and the demand for higher skills.In the developing countries the same factors haveplayed an important role though the rising aspirationsof newly emergent countries and exceptionally high
33

rates of population growth have produced an un¬usually strong social, as distinct from economic, de¬mand for education.
Despite this progress, about one third of the world'schildren remain out of school and, although the worldilliteracy rate is falling, and is thought to be about37 per cent at present, the absolute number of illiter¬ates is growing and is likely to surpass 800 million by1970. This is due partly to population growth andpartly to the failure of the primary schools of the deve¬loping countries to retain the 60 per cent of thechild population they enrol sufficiently long to maketheir literacy last.
Thus, the world is in the middle of a rapid processof educational expansion characterised by a vastdifference between the amount and quality of thefacilities available as between the developed and thedeveloping countries. This can be seen from thefact that the world education budget is of the orderof 100,000 million dollars but that of the developingcountries, whose population outnumbers the deve¬loped countries by 3 to 1, accounts for only about10,000 million dollars of the total.
The older industrialised countries of fhe world
with well-established educational systems are them¬selves going through a crisis of expansion and readjust¬ment of traditional structures, but the same problemexists in even more acute form in the developing coun¬tries since the extremely rapid expansion has been ontraditional lines. Many features of their educationalsystem are out of touch with their needs as societies.An enormous challenge is thus presented to thesecountries, and to bilateral and multilateral donoragencies, to bring greater efficiency into educationand closer adjustment to social and economic needs.
The developing countries face the need to reorgan¬ise much of their education and at the same time to
expand the system as a whole to create the humanresource potential for their development. They facethis dual problem at a time when the educationalexpansion has pushed up the amount of their re¬sources spent on education close to budgetaryceilings. The issue of the cost effectiveness of edu¬cation is particularly acute in the developing coun¬tries. Since educational systems consume betweenone eighth and one fifth of the average nation's invest¬ment resources, failures in cost effectiveness in edu¬cation represent a serious drag on economic growth inany country. In the developing countries the burdenis particularly heavy since the proportion of the pro¬ductive population to total population is smaller andthe proportion of the child population greater.
Despite these difficulties, there is much evidencethat investment in education has yielded very highreturns in the past, which could no doubt be evengreater today if modern techniques of managementand modern technologies could be applied to the edu¬cation process. In his study of sources of economicgrowth in the United States, Professor Edward Denisonattributes to education 23 per cent of the growth rateand 42 per cent of the growth of product per personemployed. Other economists have calculated that therate of return on public investment in college educa¬tion in the United States was around 12 % per centover recent years, allowing for the income foregone by
students while undergoing education, which is a largesum.
Evidence for the developing countries is less easyto obtain and, since capital and technology are atlower levels of availability, the educational contribu¬tion cannot be fully exploited. Nonetheless, studies byProfessor T.W. Schultz in Latin America have suggest¬ed that in Argentina between 1912 and 1949, 62 percent of the additional output in agricultural productionwas accounted for by residual factors other than theordinary inputs. Chief among the residual factorswas education. In Brazil the equivalent percentagewas 45 and in Mexico 50.
The significance of this great educational progressfor the future is already beginning to appear but willnot be fully apparent until the Seventies. The rea¬son for this is that educational investment, althoughhighly productive, is normally of a long-term charac¬ter. Possibilities exist of switching pupils in mid¬stream and adopting " crash " programmes. Butthe broad economic impact of education is condition¬ed by the fact that children born today are the pri¬mary school pupils of 1975-1982, the potential second-level pupils of 1982 to 1986, and higher-level studentsof f 986 to 1990. They will be at the present averageage of the labour force at the beginning of the Twenty-first Century. Heavy investment in education madein one decade has its effect on production in the deca¬des that follow.
The significance of education covers the whole ofthe development of society as well as its economysince it is a major factor in nation building and socialdevelopment. The problem of nation building hasbeen acute since the granting of independence to nu¬merous ex-colonial countries, but once again time isneeded before the full effects can be realised. At
present, the tendency in the emergent nations is touse the educational system rather as the colonialpowers did in the last century. Higher and second¬ary education is still relatively an elite process inthe emergent countries ; primary education has re¬sponded to political pressures and increased greatlyquantitatively but rather ineffectively.
The social significance of educational progress canbe extremely important provided the quality andliberality of the education is assured. The relationbetween education and mobility is illustrated inAmerican context by the findings of Dr. Lewis andProfessor Anderson from their study of the socialorigin and social mobility of businessmen in the cityof Lexington. The enquiry covered all the business¬men in a city of 100,000 persons and showedthat " the most important single factor favouringbusiness success was education ". If we look at econ¬
omically underdeveloped areas we find the same kind ofevidence. A survey by Professor Collins in a backwardrural area in Jamaica showed that " for persons in lowstatus occupations, education is the main channel ofsocial mobility ". Professor Oscar Lewis' survey ofan area on the outskirts of Mexico City, where thepeople lived in conditions of poverty, showed " apositive correlation with income: those in the upperincome group of the sample have approximately oneyear more schooling than those in the upper middlegroup and about a year and a half more than in thelower middle and lower groups ". Studies show that
34

.«
Children in Bolivia study out of doors while awaiting the completion of a new school building
at the poverty level education is such a positivefactor in lifting income that even a bare modicumof extra primary education enables members of apoor community to outstrip the income of theirneighbours.
One of the great educational problems facing thewhole of the developing world is to give more meaningand effectiveness to its primary educational systemswhich at present suffer from high rates of drop-outand repetition, and curricula ill-adapted to the pupils'environment. Much of the educational expansionhas been counteracted by high drop-out rates andincreases in the number of pupils who repeat classes
rather than extending into the masses of childrenwho still remain entirely outside the school system.Possibly 40 per cent of the whole of the children in thedeveloping countries do not have the choice of enroll¬ing in school and of the 60 per cent who enrol about10 per cent effectively complete the primary course.This has led to the alarming phenomenon that, despitethe great educational expansion, the number of illi¬terates in the world is beginning to increase and isestimated to rise from a total of 740 millions in 1960
to 810 millions in 1970.
(continued on page 36)
35

WORLD
millions Adult
Population
Adult
Illiterates
Illiteracyrate
Estimated for 1 950 1,579 700 44.3%
Estimated for 1960 1,881 740 39.3%
o
CD
O*+-
"D
(a) If the 1950-1 960illiteracy rate reductionis maintained 2,335 810 34.8%
O<D
Q
XLU
(b) If the 1950-1 960illiteracy rate reductionis doubled 2,335 710 30.5%
Based on a survey by UNESCO S
Yearbook, 1965.
tatistical Office - see UNESCO Statistical
Because of the size and significance of the educa¬tional problem in the developing countries, it is notsurprising that the Member countries of the DAC havebeen increasing from year to year the proportion oftheir aid going to education, though relatively littlehas gone to primary education and to literacy. In1964" the total of official bilateral assistance was ofthe order of $ 500 millions. In 1966 it reached atotal of $600 million. In addition, some $140 millionof aid was provided by multilateral agencies and aboutanother quarter of a billion by voluntary agencies andprivate enterprises.
For the most part, such aid has been directed tothe second and third levels, at teacher training, theprovision of expatriate teachers to fill gaps in the edu¬cational system, the supporting by financial and tech¬nical assistance of new educational institutions, parti¬cularly at a higher level and, in some cases, overallassistance through budget support in the multilateralfield. The World Bank has recognised the importanceof education as an economic factor by grantingloans and IDA credits for specific educational pro¬jects amounting so far to a total of $138 millions.
Undoubtedly, the effect of this educational expan¬sion has been to make it easier for these countries to
meet their manpower needs and to attract foreigninvestment by being able to provide literate and train¬ed manpower. On the other hand, there is clearevidence that there is much waste in their presenteducational systems - as there also is in the developedcountries - and much more needs to be done to
relate education to the needs of society. In parti¬cular, attention is given to the impact of educationupon the social and cultural motivations which areat the basis of development and the building ofnational and world communities.
Dominating the question of educational expansionis the problem of cost and the diversion of resourcesfrom other uses. Since education has been expandingat 3-4 times that of national income, it is now beginningto reach budgetary ceilings set by the high unit costof education in the developing countries and theirlow per capita incomes. The prime cost of educationis overwhelmingly the salaries of teachers, and thesesalaries in the developing countries are a much higher
multiple of average income than is the case in thedeveloped countries. This means that the develo¬ping countries bear a very special burden first becausetheir unit costs are high, secondly, because theirproportion of young people is much higher than inthe developed countries owing to their higher rates ofpopulation growth and, thirdly, because of their lownational income. For this reason, aid for education
can play a special role in levering these countriesinto self-supporting economic development.
The most urgent single problem arising from whathas been called " the education explosion ", is to findenough jobs where the educational investment canbe used. This process can be aided by the betterintegration of educational plans with overall plan¬ning, and by the judicious use of labour-intensiveand educational-intensive technologies in preferenceto typical labour-saving mechanisms. But verydifficult periods of transition lie ahead since the socialdemand for education continues unabated and labour
demand is rising slower than the growth of the labourforce.
In the long run the situation adjusts itself as ishappening in the United States, for instance, whereeven higher educational qualifications are becomingexpected whether or not they are actually needed forthe job. Samuel Johnson remarked, " While learn¬ing to read and write is a distinction, thefewwho havethat distinction may be the less inclined to work;but when everybody learns to read and write, it is nolonger a distinction. A man who has a laced waist¬coat is too fine a man to work ; but if everybody hadlaced waistcoats, we should have people working inlaced waistcoats ".
This brings the problem back to educational costin the developing countries and how to find the financeto meet the immense social pressure for education.Developing countries will have to find means ofraising funds from new sources (e.g. by makingeducation and training part of the investment costsof industry as well as part of the public budget), andmay have to adopt new and untraditional forms ofeducational development, including the economic useof new technologies of education and the mass media.Otherwise it will be a very long time before there areenough laced waistcoats to go round.
It is not possible to write on the significance ofeducation in purely economic terms. Education isprobably the greatest single factor in the life of anindividual in determining his own power over hisenvironment, and his possiblities of fulfilling hispersonality to the full. Since this process of person¬ality fulfillment takes place in a social context,education plays a significant role. This applies notonly to problems of social mobility and enterprise,which have already been mentioned, but also tothe broad humanistic approaches to technologicalcivilisation which must become ever more importantas science becomes increasingly applied to problemsof human life. The ultimate significance of educationis bound to remain that of producing individualscapable both of living effectively with and contribu¬ting to the societies to which they belong, while atthe same time maintaining the primacy of the indi¬vidual personality.
36 THE OECD OBSERVER N° 36 / OCTOBER 1968

NEW ENGLAND EDR REGIONALECONOMIC
DEVELOPMENTIN THE
UNITED STATESInterspersed among the industrial complexes and mechanised farmlands that make theUnited States the country 'with the highest average per capita income in the world are areaswhich have remained outside the mainstream ofeconomic growth or been unable to maintainits i?npetus; where unemployment is high and where the physical and cultural infrastructureis in need of renovation.To study at first hand what measures are being taken to eliminate these discrepancies, theWorlnng Party of OECD's Industry Committee concernedwith the study ofregional develop¬ment policies met in Washington DC for three days of discussion with the officials of USregional programmes and then visited several projects on the spot. Their report plus thedocumentation provided by the United States Government form the basis of the followingarticle.
There has been growing concern during the1960's over the pockets of poverty whichare to be found in the United States, despitethe high overall standard of living, in areas
such as the former mining regions of the Appalachianmountains in the East, Indian reservations to the West,
migrant workers' home country along the Mexicanborder and agricultural portions of the Deep South.Recently attention has been increasingly directed toanother type of low-income area, the so-called urbanghettos at the core of the country's large cities andalso to areas which have been or still are prosperousbut which have lost or are in the process of losingtheir economic base, and as a consequence have highunemployment rates. An example is San Diegowhich, although it is in the high income state ofCalifornia, has suffered from a cutback in its main
source of employment, the aircraft industry. Inother parts of California which are enjoying rapideconomic growth, the population influx has been solarge as to exceed the availability of new jobs.
The first comprehensive legislative measures intend¬ed to combat these problems were passed during 1961and 1962 (1) and aimed at creating industry and jobsin certain economically distressed areas (quite fre¬quently a single county), at improving the skills oftheir workers and at developing infrastructure. In
1965 a Public Works and Economic DevelopmentAct was passed taking into account elements of earlierexperience. The major thrust of this law was tocreate a local environment conducive to the deve¬
lopment of private enterprise, and to this end it pro¬vided aid to eligible "redevelopment areas" (2)in the form of grants and loans for public works anddevelopment facilities; loans for industrial and commer¬cial projects; technical assistance and planning help.The law was so drafted as to take into account the
very diverse sorts of problems that might be encoun¬tered. Thus there are seven independent criteria foreligibility :
persistent and substantial (6 per cent during thepreceeding year) unemployment;
(continued on page 38)
(1) The ARA (Area Regional Assistance Act) waspassed in J 961 and the Manpower Training and De¬velopment Act in 1962. Earlier, during the 1930's,the Tennessee Valley Authority was conceived as acomprehensive regional planning effort, chiefly concern¬ed with water and power.
(2) Counties (or in a few cases labour market areas,cities or Indian reservations).
37

substantial but not persistent unemployment (suchareas are not eligible for business loans);a high rate of outmigration combined with familyincome equal to 50 per cent or less of the nationalmedian;
low family income (less than 40 per cent of thenational median);
prospects of a sudden rise in unemployment;Indian reservations;
at least one eligible area in each state.The last criteria illustrates the influence of the poli¬tical factor in the field of regional development; inofficial publications these are called the " mink 'areas.
Altogether 871 counties (out of 3,000) with some 23millions inhabitants in 1967, or about 12 per cent ofthe country's total population, meet these legislativecriteria, but there are wide discrepancies in the gravityof the problems involved. Thus unemployment inthe eligible areas ranges all the way from the thresholdlevel of 6 per cent to 31 per cent of the populationand the number of families having low incomes variesfrom 50 to 86 per cent.
The Economic Development Administration, whichis responsible for the programme, faced the problemof how to allocate its limited resources among thevarious problem areas; if the policy adopted were todistribute the available funds among the largest pos¬sible number of areas, the amount obtained by eachwould be too small for the projects funded to haveany meaningful impact. Another possibility wouldhave been to distribute the funds so as to maximise
the number of areas that could be brought up tolevels above the qualifying threshold in any one year.It was observed, however, during the first months ofoperation of the programme, that a number of countiestended to move out of the qualifying group by them¬selves when the level of national demand increased.
Such considerations, plus limited funds, have led theadministrators to adopt a strategy of " worst first " :areas furthest from the qualifying level (e.g. thosewith the most unemployment or lowest incomes) aregiven priority, the objective being to bring them upto an intermediate target. This approach too isrecognised to have disadvantages since the problemsof the poorest counties are often the most deeplyimbedded in structural weaknesses in the educa¬
tional system for example and hence the mostintractable.
Districts and Regions
Although it identifies " redevelopment areas " withcounties, the 1965 law recognises the need to takeinto account larger geographic units if effective eco¬nomic planning is to be carried out and self-sustaininggrowth attained. Hence it provides for "economicdevelopment districts " which group together adjacentcounties, at least two of which are eligible for assist¬ance, and including an economic development centre
considered to have the potential to stimulate the eco¬nomic growth of the district as a whole. Only theredevelopment areas and the economic centres arceligible for regional development funds (i.e. thosegranted by the Economic Development Administration)but all of the participating counties are expected tobenefit from the district-wide impact of developmentplanning. To date forty such districts have beencreated, covering from 5 to 1 5 counties.
Finally, on a still larger scale, legislation providesfor the designation of multi-state regions which cutacross state lines but have some sort of historic, geo¬
graphic and economic unity and are marked by suchfactors as low family income, high unemploymentor outmigration. So far four such "economic deve¬lopment regions" (EDR) have been designated (seemap) by the Secretary of Commerce in accord withthe states concerned. Each of them has its own com¬
mission consisting of the governors of the states involv¬ed plus a representative of the President of the US.
So far the only one of these commissions in whichwork has gone much beyond the planning stage isthat of the Appalachian region, formed in 1965 toinclude 19 million inhabitants in 13 states not only
those where poverty is most intense but also districtswith growth potential like the Shenandoah Valley.The region also includes one large city, Pittsburgh,which has had economic difficulties since the manu¬
facture of steel, virtually its only industry, has beenmoving nearer the final consumer. The city's workforce, its infrastructure and commercial services are
highly developed but one-sided, and outmigration hasbeen considerable. (Pittsburgh is expected to be theonly major metropolitan area in the US to show a netdecline in population when the next census is takenin 1970.)
The approach taken so far in rehabilitating theAppalachian region has concentrated on building upthe infrastructure education, health, community
development, resource conservation and particularlytransport : eighty per cent of the $467 million so farappropriated has been devoted to building a highwaysystem (2,400 miles have actually been laid) throughthe most inaccessible areas to break their isolation
and link them with the prosperous Eastern seaboardand the industrial Middle West.
At regional level the Federal contribution is limitedto help in planning and research, the funds beingprovided, for the most part, by the states themselves.Considerable importance is attached to planning atlower levels as well, and it may be noted that, in orderto get federal help, each " area " and economic deve¬lopment district must prepare an "Overall EconomicDevelopment Programme " and submit it to the Eco¬nomic Development Administration for approval.
For all of these programmes aid to the " areas ",districts and regions the total budget is $ 37 billionover the five year period for which the act is in force;during the period 1966 and 1967 only $542 millionof these funds were spent, mainly (80 per cent) forloans to public works projects, 17 per cent being used
38

Unlike the new towns of the United Kingdom which are publicly financed and - at least in recent years - have been designed to provideemployment as well as homes, those of the US are like Reston, West Virginia (above) privately developed satellite towns serving
established employment centres. Research is being carried out on experimental types of new cities.
for loans to business and 3 per cent for technicalassistance and planning grants. This amount is smallin comparison with the overall programme of federalaid to states and localities which amounts to some
$15 billion a year at current rates.As in the other countries studied by OECD's
Working Party on Regional Development Policies theneed for action is considered too urgent to await acomplete and definitive theoretical basis; regionalpolicy, as a result, is largely pragmatic in character,and there is continuing discussion on the validity ofa number of points that are central to the programme
the concept of growth centres for example and therelation between these centres and their hinterlands.
Thus at the same time as it provides assistance, regionaleconomic policy is also concerned with carrying outresearch on the bases for such action.
One project financed by the Economic DevelopmentAdministration is a study (by the University of Min¬nesota in conjunction with several federal agencies)of an experimental new city of 250,000 people atleast 100 miles away from existing metropolitan cen¬tres. Until now new towns in the US, unlike those
of the United Kingdom, have been dormitory or sa¬tellite towns rather than self-contained entities.
Sonic Problems for the Future
The political and administrative structures of theUnited States have an impact on regional policy. Ina number of European countries local authorities tendto receive financial support from the central govern¬ment on a systematic basis, while in the US, with its50 states and some 90,000 units of local government,funds are accorded by many different federal agencies
some 150 at the present time as grants-in-aid
to individual localities for specific projects. Manyof these bear on regional development manpowertraining programmes for example, and urban renewalprogrammes but the central government has fewpowers to fit these into an overall programme. Thereis often competition between states to obtain the maxi¬mum amount of federal assistance, and states may bidagainst one another, through such devices as tax-freemunicipal bond issues, to attract industry. Co-ordin¬ation of the heterogeneous federal, state and localprogrammes is one of the most urgent problems ofregional planning for the future.
Co-ordination is also a problem in metropolitanareas which arc made up on the average of onehundred separate decision-making, taxing and spend¬ing jurisdictions. In the face of the crisis in thecities the worsening situation in the slum neigh¬bourhoods, the racial tensions and the paradox ofpoverty in the midst of plenty Federal and Stategovernments are beginning to take a metropolitan-wideapproach to the provision of service and aids and tothe more adequate distribution of resources to juris¬dictions most in need; several Federal programmeshave been undertaken by the Department of Housingand Urban Development, created in 1966, includingone providing for a programme of DemonstrationCities.
Local schemes arising from the initiative of peopleliving in an area either official local bodies suchas municipalities or as in the case of Reston, WestVirginia (see photo) private financial groups areof considerable importance in the growing and moreprosperous parts of the country, but it is felt by USregional planning authorities that to be really effective,local schemes should be devised against a series ofcoherent county, district, state and regional plans, ora " general strategy " for large areas.
39

ANEW
PROGRAMMEFOR
CO-OPERATIONIN
ROAD RESEARCH
The growth of road transport during the past twenty years has beenso rapid that serious shortcomings have arisen in this sector, causingproblems of an economic, social and cultural nature. Governments
carry a heavy burden of responsibility on road traffic and transportmatters: they are called upon to take action involving legislation,
standardisation and specifications, and must bear the cost of build¬
ing, maintaining and developing the road network. For thesereasons much importance is attached to road research, whose pur¬
pose is to enable these objectives to be achieved at the lowest
possible cost.
A special Steering Committee for Road Research, set up by theOECD Council and including representatives of government services
and research organisations, met for the first time in March 1968.
The following article outlines the three-year programme drawn upby the Steering Committee and approved by the Council of OECD.
VIhe mains aims of road research
are :
to find economical ways of easingand controlling the flow of roadtraffic ;
to reduce the frequency and sever¬ity of road accidents and the eco¬nomic losses involved ;
9 to investigate the design of roadvehicles with particular attention to
safety features;
to investigate ways of influencingthe behaviour of road users ;
to determine how roads and road
structures may best be planned toprovide a safe and durable structureat the lowest cost.
In the two fields of documentation
and research the Steering Committeeintends, with the assistance of tem¬
porary groups of experts and inter¬national study meetings on specifictechnical subjects
to take stock of the results so far
obtained as regards documentation,to consider means of increasing theefficiency of the services offered inrelation to their cost and to preparefor the evolution towards a more
sophisticated scheme; and
to initiate studies on a number of
research topics, to be continued in1969. Arrangements will be madefor other groups to continue withthis work without the services of the
OECD permanent international staff.
The Steering Committee will meetin October 1968 and twice in 1969
to discuss the progress of work.
Research Groups
Under the general heading ofdesign and construction, an expert
group will carry out research intoaccelerated methods of testing road
surfaces. Methods for this purpose
have been developed in several coun¬tries and laboratories; for example,vibration tests on roads or road models,
pulsators, and circular test roads withsimulated traffic. The aim of this
group will be to study the advantages
and disadvantages of the variousmethods in use and to select those
which seem to be the most valid
economically and scientifically. The
consequences of changing propertiesof surfacing materials in the differentmethods used will be taken into
account, but research on the methods
of measuring the properties of mater¬ials will not be udertaken at this
stage.
Under the same heading, a second
group will investigate vehicle corro¬sion caused by the use of salt or
chemical products used for the remov¬al of ice and snow from roads a use
which is increasing annually. In theinterests of traffic safety it is indis¬pensable to use these means, inspite of the damage they cause toroads, bridges and vehicles, but thegroup intends to prepare a report forpublication on the extent of the corro¬sion caused to vehicles and on possi¬
ble means of preventing it. Theirtask will be eased by the fact thatinformation on this matter is alreadyavailable in some countries.
Three groups will begin work onquestions of safety. One of these willstudy the influence of vehicle design
on crash injuries, taking into accounttolerance of the human body, withthe aim of reducing the severity ofroad accidents. The exterior and inter¬
ior design of vehicles, includingwindscreens and other windows, steer¬
ing wheel and column, safety belts,etc., will be considered by the group,together with the dangers connectedwith articulated vehicles and trailers.
Other experts will study the effectsof various factors affecting visibilityand accidents during hours whenroad users depend on artificial light¬
ing on roads and vehicles, concen¬trating on the problem of which typeof vehicle lighting should be used onstreets with various levels of street
lighting. It wiil examine the possi¬bility of defining uniform rules for thechoice of vehicle lighting in urbanstreets and roads outside built-upareas.
The third " safety " group willcarry out research into driver behavi¬our, particularly on techniques for
40

A traffic experiment in progress atHarmondsworth,
selecting good and bad drivers and onthe effects of new training methods.Here again research in this field isbeing conducted in several countries.
Expert groups will consider twoaspects of traffic problems. One of
these is the choice of strategy for areatraffic control systems and of methodsof assessment. Traffic signal sys¬
tems operating under central control,using computers, have been intro¬duced in several cities in the last few
years; it is therefore important to
compare the alternatives available, and
research is needed into ways of
assessing the performance of varioussystems on a comparable basis.
Use of electronic methods to opti¬
mise the utilisation of, and safety
conditions on freeways will also bestudied. Research is needed into
ways of controlling traffic using free¬ways so as to obtain maximum flowconsistent with safe operation. Thisincludes for example control of access
ramps, control of merging, control of
speed, warning aids and so on. Elec¬tronic aids can be used for these
control purposes.
Finally, research groups includedin the programme but not serviced bythe OECD staff will study the effectsof moisture on road works, the effect
on accidents of alcohol and drugs,crash barriers, pedestrian behaviourand priority rules.
the Road Research Laboratory ofMiddlesex, UK
April 1969 to study advanced tech¬niques providing more effective data
than the single-factor research em¬ployed in the past. These new tech¬
niques include the use of statistical
methods and systems analysis for the
cost-effectiveness analysis of various
measures for improving the quality ofthe traffic flow (safety, capacity,delay and so on).
International Road
Research Documentation
(IRRD)I_I
Within the framework of its initial
programme, the OECD Steering Com
mittee for Road Research intends to
maintain the priority already accordedto the development of the decentra¬
lised scheme (IRRD) for the system¬atic exchange of information onroad research documentation and on
current research projects in Membercountries. The IRRD Operational
Committee, composed of specialistsfor three language centres (English,French and German) is responsible tothe OECD Steering Committee forRoad Research for solving all opera¬tional problems of a technical nature;
a Steering Committee representativewill ensure liaison between the two
Committees in this repect.
In 1968 and 1969, the SteeringCommittee has requested the OECD
staff to make an overall enquiry inthe participating countries in orderto prepare an analytical report on theuse of IRRD in Member countries,
the problems encountered, the solu¬
tions adopted and all the various alter¬
natives that may be envisaged for thefurther development of the IRRDscheme in the future.
Apart form direct contacts withIRRD, the Steering Committee intends
to organise three study days to beattended by all documentalists asso¬
ciated with IRRD, essentially devoted
to practical indexing exercises, infor¬mation recording and retreival. TheSteering Committee will bekeptinform-
ed of any documentation scheme
being planned or set up (in particular
in the field of transportation) so thatcompatibility with IRRD may be
arranged from the outset.
Auto-crash test at the General Motors Corporation Proving Grounds
Statistical Methods
in the Analysisof Road Accidents
A symposium will be arranged byOECD in the United Kingdom in
41

PROSPf*TS hmAMD MARKETING OF F
A/though fruits and vegetables account for a substantia/ share of agricultural production and trade,little information has been available on production and consumption trends, amounts of investment
or prospects for foreign trade. But if surpluses or shortages are to be avoided, knowledge of thesetrends is required. In order to fill the informational gap, the OECD Working Party on Fruit and Vegetablesfirst undertook country-by-country studies of all OECD Member nations (1) and is now directing its
n a great number of countries heavy investmentsare being made in production, processing and
marketing facilities for fruit and vegetables, frequently,if not always without adequate knowledge of the likelyfuture overall supply /demand situation. If producers areto have a sound basis for their investment decisione
and if professional organisations and governments areto be adequately equipped to make appropriate recom¬mendations or take corrective action in the event of an
imbalance between supply and demand, surveys are neededconcerning future market outlook over a wide geogra¬phical area. This is particularly true of products whichare of great importance in international trade becausevery often producers in exporting countries have inade¬quate knowledge of developments in importing orcompetitor countries.
OECD's Working Party on Fruit and Vegetables inattempting to meet this need has undertaken surveys ofa number of products which figure prominently in inter¬national trade and for which the required level of investmentis high, making the adjustment of supply and demandtechnically difficult or costly. For some products theinvestment involved is at the production stage. Thus
among fruit products, apples, pears, peaches and tablegrapes were singled out for examination because orchards
and vineyards are expensive to create, and because theyrequire several years to come into production and moretime before they reach full yield. As for vegetables,since they are normally planted and harvested in the sameyear, it might at first sight appear that the adjustment ofsupply and demand would present few problems. Butsome vegetables are being grown to an increasing extentin glasshouses or other permanent facilities. For otherproducts large investment may be required at the process¬ing or marketing stages. Thus, for example, withtomatoes, a highly specialised processing industry hasbeen built up in open-field producing countries and itwould be costly to shift to another type of raw materialfor processing.
The Working Party's findings on the two productsstudied first apples and tomatoes show that as faras Europe is concerned, the likely future situation givesrise to some concern. In the compilation of these reportsit became apparent that in most countries fruit and vege¬table statistics are far less complete than those for other
agricultural products. Despite this lack, however, theoverall picture emerging from the examination can beconsidered as reasonably accurate since most of theestimates made were compiled by national experts fami¬liar with the situation in their countries.
The Cast» of'Apples
There can be no doubt that apple pro¬
duction in the European OECD region is
undergoing a decisive evolution. Totalproduction of the region increased from an
averge of 6.3 millions tons in 1957-60 to7.5 millions in 1961-64, or by 1.2 million
tons, and estimates are that it will rise to
9.7 million tons by 1970, or by another
2.2 million tons. Practically the entire
production increase has taken place in the
Southern part of Europe in Mediterranean
countries, particularly Italy, but also, though
on a much smaller scale, in Spain, Turkey,
Greece, Portugal and Yugoslavia, and in
the Southern part of France. In Italy average
output rose from about 1.5 million tons in1957-60 to 2.3 million in 1961-64 and
will be at least 2.6 million tons in 1970
a certain slowing down of the expansioncan therefore be noticed. On the other
hand, the major part of the production
increase in France is occurring at present
and will continue to do so for some years to
come. At 1.9 million tons the productionestimate for 1970 is as much as 1 million
tons higher than the average output of 1 961 -1964.
In the other European countries of OECD,
which, except for the Netherlands and
Denmark, are traditional apple importers,
production as a whole fell by almost
230,000 tons between 1957-60 and
1961-64. This does not, however, mean
that there were no developments at all in
the apple-growing industry of these coun¬
tries. On the contrary, over the past decade
or so new compact commercial orchardsof dwarf and semi-dwarf trees have been
established in all countries, but, whereas in
the South this has led to a great absolute
expansion of the tree population, in theNorthern half of Europe new plantings have
generally been more than offset by the
grubbing-up of old traditional types of treesand in some countries tree numbers have
actually declined. This replacement processis far from being completed and will continue
for a long time to come, but the changes have
42
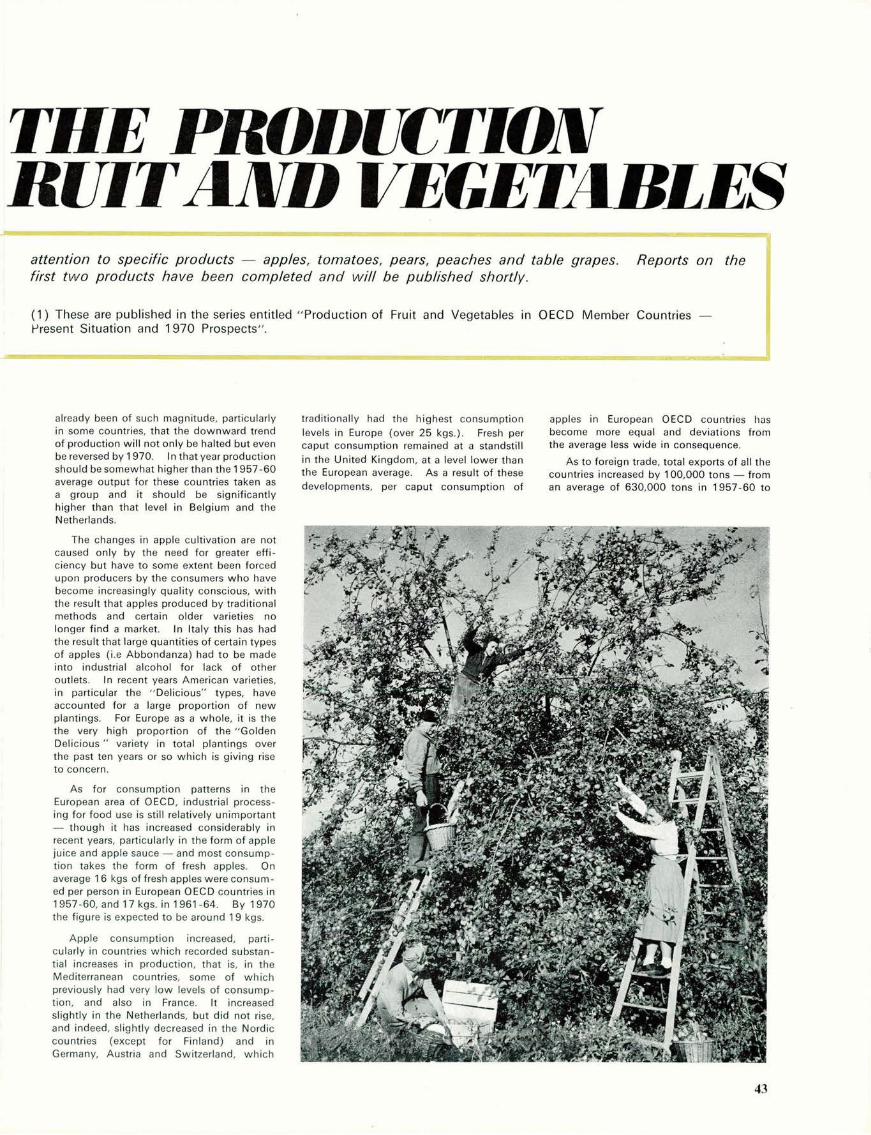
THE PRODUCTIONREITAMD VEGETABLES
attention to specific products apples, tomatoes, pears, peaches and table grapes. Reports on thefirst two products have been completed and will be published shortly.
(1) These are published in the series entitled "Production of Fruit and Vegetables in OECD Member CountriesPresent Situation and 1970 Prospects".
already been of such magnitude, particularlyin some countries, that the downward trend
of production will not only be halted but even
be reversed by 1 970. In that year production
should be somewhat higher than the 1 957-60
average output for these countries taken as
a group and it should be significantly
higher than that level in Belgium and theNetherlands.
The changes in apple cultivation are not
caused only by the need for greater effi¬
ciency but have to some extent been forced
upon producers by the consumers who have
become increasingly quality conscious, with
the result that apples produced by traditionalmethods and certain older varieties no
longer find a market. In Italy this has had
the result that large quantities of certain types
of apples (i.e Abbondanza) had to be madeinto industrial alcohol for lack of other
outlets. In recent years American varieties,
in particular the "Delicious" types, have
accounted for a large proportion of new
plantings. For Europe as a whole, it is the
the very high proportion of the "Golden
Delicious " variety in total plantings over
the past ten years or so which is giving riseto concern.
As for consumption patterns in the
European area of OECD, industrial process¬
ing for food use is still relatively unimportant
though it has increased considerably in
recent years, particularly in the form of apple
juice and apple sauce and most consump¬
tion takes the form of fresh apples. On
average 1 6 kgs of fresh apples were consum¬
ed per person in European OECD countries in
1 957-60, and 1 7 kgs. in 1 961 -64. By 1 970
the figure is expected to be around 1 9 kgs.
Apple consumption increased, parti¬
cularly in countries which recorded substan¬
tial increases in production, that is, in the
Mediterranean countries, some of which
previously had very low levels of consump¬tion, and also in France. It increased
slightly in the Netherlands, but did not rise,
and indeed, slightly decreased in the Nordic
countries (except for Finland) and in
Germany, Austria and Switzerland, which
traditionally had the highest consumption
levels in Europe (over 25 kgs.). Fresh per
caput consumption remained at a standstill
in the United Kingdom, at a level lower than
the European average. As a result of these
developments, per caput consumption of
apples in European OECD countries has
become more equal and deviations from
the average less wide in consequence.
As to foreign trade, total exports of all the
countries increased by 100,000 tons from
an average of 630,000 tons in 1957-60 to
43

730,000 tons in 1961-64 and imports by
220,000 tons (from 880,000 to 1,100,000
tons).
By 1970 the foreign trade situation isexpected to be problematic since a very highincrease in export availabilities is expected,
especially in Italy and France. If, as seemslikely, Italian consumption increases onlyslightly, export availabilities of that countrywill amount to 900,000 tons. At that level,
the distillation of apples, which acts as a
market regulator, would absorb about550,000 tons, much less than the average
recorded during 1961-64 (more than
700,000 tons), but 70-80,000 tons morethan in 1965 and 1966.
As for France which joined the ranks of
the big exporters of apples in 1966, even ifone assumes a relatively high rise in per
caput consumption (21 kgs as comparedwith 17.5 kgs on average in 1962-64) exportavailabilities of fresh apples will amount to
500,000 tons in 1970.
Export availabilities of the Netherlandswill also be significantly higher than in the
past and Greece and Turkey, which haveso far used any increases in productionalmost exclusively to raise the level of their
domestic consumption, might also have
surpluses to export.
On the other hand, import requirements
are unlikely to rise very much, in view of thelevels of consumption already achieved in
importing countries, the probable rise intheir own production and the increasingcompetitiveness of other fresh and processedfruit. The import requirements of the Euro¬
pean area of OECD may, therefore, beestimated at about 1.2 million tons in 1970,
as against export availabilities of 1.6 milliontons.
The calculated surplus of 400,000 tons
of export availabilities over import require¬ments should be compared with a figure of
380,000 tons of net imports made by the
European OECD region on average during1961-64. These imports to a considerableextent come from Southern hemisphere
countries, which have the advantage of an
inversed production season, and have inrecent years shown a tendency to increaserather than decrease.
In view of the fact that for methodological
reasons it was generally necessary to calcu¬
late export availabilities and import require¬ments for 1970 as the quantitative dif¬
ference between production and consump¬tion without taking account of qualitative
changes, it is possible that the situation asregards professional producers will be lessgloomy than is indicated by the statisticalcomparisons. Inferior produce, largelycoming from non-commercial orchards, willno longer be acceptable to consumers andthis could relieve to some extent the pressure
in a number of countries. But despite this
there can be no doubt that without corrective
measures surpluses will depress prices bothon internal and international markets, and
that producers will be faced with a difficultsituation.
The Outlook for Tomatoes
Tomatoes are one of the most important
vegetables moving in international trade.They play a considerable role in the exporteconomy of a number of supplying countriesand account for a significant part of the
fruit and vegetable import bill of quite a
few importing countries.
In tomato production, changes are taking
place comparable to those in the apple sector.Overall tomato production of the European
OECD region increased from an average of6.0 million tons in 1 957-60 to 7.3 million tons
in 1961-64 and is expected to rise to
10.1 million tons by 1970. Since in 1966
output had already reached 9.0 million tons,there can be little doubt that the forecast
expansion of production can be achieved.
Production and consumption of tomatoes
are not evenly distributed in Europe andgreat differences exist between open - fieldproducers in the South (Greece, Italy,Portugal, Spain, Turkey and Yugoslavia)and under-glass producers in the North(Denmark, Finland, Ireland, Netherlands,Norway, Sweden and the United Kingdom).The former group of countries are either
net exporters or self-sufficient as regardstheir fresh and processed tomato require¬
ments; the latter import practically their
entire processed requirements and a substan¬
tial part of their fresh tomatoes with the major
exception of the Netherlands, which are asubstantial net exporter of fresh tomatoes.The countries in the centre Austria,
Belgium, France, Germany and Switzerlandform an intermediate group, which has
certain characteristics of both the northern
and southern groups, but does not clearly
belong to either of them. France has morefeatures in common with open-field producers
in the South and is the only mixed producer
with a sizeable processing industry ; conditions
in Austria, Germany, Belgium and Switzerland
are more comparable to those in under-
glass producing countries in the North.
The six open-field producing countries
in Southern Europe are by far the most
important producer group, and their share
in total European output is increasing; it is
estimated at 87 per cent for 1970. This
predominance is to a large extent explained
by the fact that these countries have the
most favourable growing conditions for
tomatoes, which demand a comparatively
warm climate and much sunlight.
But in addition the increase in production
was greatly facilited by advances in plantbreeding and improvements in cultivationpractices, particularly the expansion of irri¬
gation. Last but not least is the greatexpansion of industrial tomato processing
in response to a rising demand for processedtomato products practically everywhere in
the world. Tomato processing industries
of significance are only found in open-fieldproducing countries, since the processingof under- glass tomatoes is generally consider¬ed to be uneconomic.
As compared with open-field producers
the production increases envisaged by theother countries of OECD Europe are very
small. The major part of the increase inmixed-producing countries will occur in
France, which is expanding irrigated product¬ion in the Bas-Rhône-Languedoc area and
also under-glass cultivation. As regards
44

under-glass producers the expansion will
be mainly concentrated in the Netherlandsand, to a smaller extent, in Belgium.
Under-glass producers of the European
OECD region have achieved a certain exten¬
sion of their production season through
changes in varieties and cultivation tech¬niques, particularly the change-over from
cold to heated glass, but are unable to producefresh market crops economically before
April /May because of a lack of luminosity.
The Netherlands, the traditional exporter of
glasshouse tomatoes, and more recently also
Belgium can, for this reason, only export
from about May onwards and are practically
the only OECD supplier of " glasshouse
type " tomatoes during the summer months.
As regards market outlets a clear distinc¬tion has to be drawn between open-field
and "glasshouse-type "tomatoes. Approxi¬
mately a quarter to one-third of the former
tomatoes are absorbed by the processing
industry, and practically the entire balance
is sold on the fresh markets of the producing
countries themselves, with only minor quan¬
tities being exported in fresh form to adjoin¬
ing mixed-producing countries. Countries
in Northern Europe generally meet their
short-falls of fresh market tomatoes by
imports from other under-glass producers
(in particular from the Netherlands) and fromthe Canary Islands and some mainland pro¬
vinces of Spain, which cultivate tomatoes
under plastic film cover and thus obtain
a tomato with characteristics very similar to
those produced under glass. They are main¬
ly harvested in winter and early spring when
no under-glass tomatoes are produced.
This pattern of trade is to a large extent
explained by differences in consumption
habits in Southern and Northern Europe.In the Latin countries the tomato is the main
vegetable consumed; it is not only used in
salads but is also cooked as a vegetable
(generally in combination with other vege¬
tables), used as an ingredient in soups and
sauces, grilled and prepared in many different
ways in the kitchen. In contrast, in the
Anglo-Saxon countries of Europe the tomato
is mostly eaten raw in salads, as sandwich
filling and as a decorative addition to meat
and vegetable dishes, which explains the
preference of these countries for " glass¬
house-type " tomatoes.
At over 30 kgs per caput, consumption in
fresh and processed form is over three times
larger in Mediterranean countries than in the
rest of Europe. This difference is, however,
exclusively due to a higher" fresh "consump¬
tion ; per caput consumption of processed
tomato products (in terms of fresh equi¬
valent) is in fact generally somewhat larger
in the mixed and under-glass producing
countries, although of course differences
exist in this respect between the various
countries of the three groups. For the
future certain increases are expected in fresh
and processed consumption in most coun¬
tries, but in general the rise will only be very
gradual.
When comparing production and con¬
sumption trends it would appear that pro¬ducers of tomatoes for the fresh market
need not view the 1 970 market situation
with too great concern. But the situation
is considerably different for processed toma¬
toes, for which 1970 export availabilities
of the European OECD region are estimatedat 2,1 50,000 tons, an increase of as much as
990,000 tons as compared with averageexports in 1961-64. Italy, the main tra¬
ditional exporter ; should more or less maintain
its past export volume of about 900,000 tons
and additional availabilities will be almost
exclusively located in countries with compa¬ratively young processing industries. Amongthese, Portugal expects export availabilities of975,000 for 1 970 and Greece of 1 30,000 tons.
Those of Spain should be of the order of
80/90,000 tons and lesser quantities maybe provided by Yugoslavia and Turkey.Exports of France, the only exporter outside
the group of open-field producing countries,should roughly correspond to imports madeby that country.
Import requirements for processed toma¬
toes for all the countries of the European OECDregion combined are estimated to reach about
880,000 tons in 1970 as compared with an
amount of 71 9,000 tons on average in 1 961 -
1 964. The expected increase of 1 60,000 tons
is by as much as 830,000 tons smaller than
the expected rise in export availabilities.
In view of the only very gradual rise of pro¬cessed tomato consumption in OECD Europeand, for that matter, in North America and
Japan, it appears to be impossible that therest of the world will be able to absorb such
an additional amount. Furthermore, it must
be considered that processed tomato pro¬duction and exports have also been expand¬ing in adjoining non-OECD countries, par¬ticularly in Bulgaria and Hungary. Unlikethe case of fresh tomatoes, therefore, itmust be concluded that the market situation
for processed tomatoes will be very problem¬atic in future and that there will be severe
competition among exporters for limitedoutlets.
Tlte NetxttfbrPlitntting uiui Co-ortiiwut1ion ofAction
The results of the examination of market prospects
for apples and tomatoes undertaken by the OECD Work¬ing Party on Fruit and Vegetables underline the need forstudies of this nature. They should be prepared for allmajor products and the results should be disseminatedwidely, particulary in exporting countries so that producersare familiarised with evolving changes on domestic andforeign markets.
In fact, forecasts should be made for longer periods
ahead as regards demand trends and an approximateco-ordination of production intentions should be achievedbetween producers of exporting and importing countries.Only in this way will it be possible to avoid burdensomesurpluses and losses of investment resources detrimentalto producers and also, for that matter, shortages harmfulto consumers' interests.
In those cases in which the examination of the medium-
term outlook (approximately five years for orchard crops)reveals an impending imbalance between supply anddemand, corrective action should be taken and should
be co-ordinated between governments and producerorganisations in individual countries and also between
countries. Measures to stimulate production should beintroduced whenever a shortage is threatening to arise andaction to limit supplies and to expand outlets should betaken to solve or alleviate an impending surplus situation.
Measures should be adopted to prevailing circumstancesand existing possibilities should be examined for each
individual product. Such an appraisal was made by theOECD Working Party on Fruit and Vegetables for apples,for which the already existing production potential ishigher than projected demand. The Working Partyconcluded that the withdrawal of financial assistance for
the establishment of new orchards and the payment ofuprooting premiums or similar measures (aiming inparticular at uneconomic orchards and outmoded varie¬
ties) to achieve a reduction of the production potentialare probably the most effective means to alleviate futuresurplus problems. The Working Party was, however,of the opinion that conditions and the possibilities forsolutions differ between countries and that therefore
possibilities for limiting supplies at the marketing stageand for expanding outlets should also be examined and
corresponding action be taken where necessary andfeasible.
45

NEW OECD PUBLICATIONS
GAPS IN TECHNOLOGY BETWEEN MEMBER
COUNTRIES ; GENERAL REPORT (1968)
46 pages 9 s. . 1.20 F 5 SF 5 DM 4.20
At the Second Ministerial Meeting on Science held at the OECDin 1966, the Ministers invited the Organisation to carry out detailedstudies of the "technological gaps" as preparatory work for their futurediscussions. Subsequently, a Working Group on Gaps in Techno¬logy was set up by the Committee for Science Policy to prepare aseries of studies on the basis of which a thorough diagnosis of theproblem of technological gaps could be presented to the Ministersfor Science. This included studies in a number of industrial sectors,
conducted by groups of experts working in close liaison with theOrganisation's Staff, as well as an analytical report by the Staffwhich marshals all the available statistical evidence on : (a)differences between Member countries in research and develop¬
ment and educational efforts; (b) differences in performance inoriginating and diffusing technological innovations in the economy;and (c) the effect of these differences on technological and economicexchanges between Member countries.
The result of these studies and the conclusions reached by theOECD Committee for Science Policy are summarised in this GeneralReport.
GAPS IN TECHNOLOGY : Scientific instruments
and electronic components
192 pages, bilingual £ 1 1 s. $ 3 F 12 SF 12 DM 10
CATALOGUE OF SOCIAL AND ECONOMIC DEVE¬
LOPMENT INSTITUTES AND PROGRAMMES :
RESEARCH
412 pages £7 7/5. $ 4.50 F 18 SF 18 DM 15
OIL STATISTICS, 1967 : Supply and Disposal
158 pages, bilingual £ 7 6 s. $ 3.80 F 15 SF 15 DM 12.50
THE ELECTRICITY SUPPLY INDUSTRY : 18th
Enquiry
Achievements 1965-66, Forecasts 1967-1972
104-pages, bilingual 14 s. S 2 F 8 SF 8 DM 6.60
STUDY ON TEACHERS : NETHERLANDS/ETUDESUR LES ENSEIGNANTS : PORTUGAL
304 pages £ 1 14 s. $ 5 F 20 SF 20 DM 16.60
STUDY ON TEACHERS : SWEDEN, AUSTRIA/
ÉTUDE SUR LES ENSEIGNANTS : GRÈCE
384 pages £ 1 14 s. $ 5 F 20 SF 20 DM 16.60
STUDY ON TEACHERS : DENMARK/ÉTUDE SURLES ENSEIGNANTS : ITALIE, LUXEMBOURG
432 pages £ 1 14 s. $ 5 F 20 SF 20 DM 16.60
OCEAN FREIGHT RATES AS PART OF TOTAL
TRANSPORT COSTS
40 pages 9 s. $ 1.20 F 5 SF 5 DM 4.20
46
INTERNATIONAL DIRECTORY OF BIOLOGICAL DE¬
TERIORATION RESEARCH
Second edition
670 pages £3 5 s. $ 9.50 F 38 SF38 DM 31.50
TOURISM IN OECD MEMBER COUNTRIES, 1968
796" pages £ 7 6 s. $ 3.80 F 15 SF 15 DM 12.50
SECOND INTERNATIONAL SYMPOSIUM ON
THEORY AND PRACTICE IN TRANSPORT ECO¬
NOMICS DEUXIÈME SYMPOSIUM INTERNA¬
TIONAL SUR LA TH ÉORIE ET LA PRATIQUE DANS
L'ÉCONOMIE DESTRANSPORTS ZWEITES INTER
NATIONALES SYMPOSIUM UBER THEORIE UND
PRAXIS IN DER VERKEHRSWIRTSCHAFT
556 pages £ 5 5 s. 9.50 F 38 SF38 DM 31.50
THE CEMENT INDUSTRY, 1967 : Statistics 1967,Trends 1968.
40 pages, bilingual 10 s. $ 1.50 F 6 SF 6 DM 5
PRODUCTION OF FRUIT AND VEGETABLES IN
OECD MEMBER COUNTRIES :
Present situation and 1970 Prospects : GREECE,JAPAN.
140 pages
Each issue 12 s.6 d. % 2 F 8 SF 8 DM 6.60
Complete series ... £4 8 s. S 15 F 60 SF 60 DM 50
ECONOMICSURVEYS : 1967-1 968 Series :TURKEY,
July 1968 :
54 pages
Each issue 5 s. 6d. S 0.80 F 3 SF 3 DM 2.50
Subscription £3 12 s. $10 F 42 SF 42 DM 35
THE NON-FERROUS METALS INDUSTRY, 1967
76 pages, bilingual 16 s. 2.30 F 9 SF 9 DM 7.50
NATIONAL ACCOUNTS OF LESS-DEVELOPED
COUNTRIES, 1950-1966
232 pages, bilingual £ 1 16 s. $ 5.20 F 21 SF 21 DM 17.50
TO APPEAR SHORTLY
21st SURVEY OF ELECTRIC POWER EQUIPMENT
THE PUBLIC EMPLOYMENT SERVICE IN SOCIAL
AND ECONOMIC POLICY
THE PULP AND PAPER INDUSTRY, 1967-1968

WHERE TO OBTAIN OECD PUBLICATIONS
ARGENTINA
Editorial Sudamericana S.A..
Humberto 1° 545 Buenos Aires.
AUSTRALIA
B.C.N. Agencies Pty.178 Collins Street.
Melbourne, 3000.
Ltd.
AUSTRIA
Gerold & Co., Graben 31, Wien 1.Sub-Agent :Buchhandlung Jos. A. Kienreich,Sackstrasse 6, Graz.
BELGIUM
Standaard Wetenschappelijke,Uitgeverij.Belgiëlei, 147Anvers.
Librairie des Sciences,
76-78 Coudenberg, Bruxelles.
CANADA
Queen's Printer -L'Imprimeur de la Reine,Ottawa.
DENMARK
Munksgaard Boghandel, Ltd.,
Nôrregade 6, Kôbenhavn K.
FINLAND
Akateeminen Kirjakauppa,Keskuskatu 2, Helsinki.
FORMOSA
Books and Scientific Supplies Services,Ltd., P.O.B. 83, Tapei, Taiwan.
FRANCE
OECD Publications Office,2, rue André-Pascal, Paris (16e).Principaux sous-dépositaires :Paris : Presses Universitaires de France,49, bd Saint-Michel (5e).Sciences Politiques (Lib.),30, rue Saint-Guillaume (7e).Aix-en-provence : Librairie de
l'Université.
Grenoble : Arthaud.
Strasbourg : Berger-Levrault.
GREECE
Librairie Kauffmann,28, rue du Stade, Athènes 132.
Librairie Internationale Jean Mihalopoulos33 rue Sainte-Sophie, Thessaloniki
GERMANY
Deutscher Bundes-Verlag, GmbH.Postfach 9380, 53 Bonn.
Sub-Agents : Berlin 62 : Elwert & Meurer.Munchen : Huebcr.
Hamburg : Reuter-Klôckner;
und in den massgebenden BuchhandlungenDeutschlands.
ICELAND
Sn Jônsson & Co. h. f.Hafnarstraeti 9,P.O. Box 1131 - Reykjavik.
INDIA
International Book House Ltd.,
9 Ash Lane,
Mahatma Gandhi Road, Bombay 1.Oxford Book and Stationery Co. :Scindia House, New Delhi.17 Park Street, Calcutta.
IRELAND
Eason & Son,40-41 Lower O'Connell Street, Dublin.
ISRAEL
Emanuel Brown,
35 Allenby Road,and 48 Nahlath Benjamin St., Tel-Aviv.
ITALY
Rapprcsentanza esclusivaLibreria Commissionaria Sansoni
Via La Marmora 45, 50 121 Firenze.
Via Paolo Mercuri 19/B, 00 193 Roma.Sub-dcpositari :
Libreria HoepliVia Hoepli 5, 20 121 Milano.Libreria Lattes
Via Garibaldi 3, 10 122 Torino.La diffusione délie edizioni OECD è
inoltre assicurata dalle migliori librerienelle città più importanti.
JAPAN
Maruzen Company Ltd.,6 Tori-Nichome Nilionbashi, Tokyo.
KENYA
New Era Associates, Ghale House,
Government Road,P.B. 6854, Nairobi.
LEBANON
Redico, Immeuble Edison,
Rue Bliss, B.P. 5641,Beyrouth.
LUXEMBOURG
Librairie Paul Bruck, 22, Grand'Rue,Luxembourg.
MALTA
Labour Book Shop,Workers' Memorial Building,Old Bakery Street, Valletta.
MOROCCO
Éditions La Porte " Aux Belles Images ",281, avenue Mohammed-V, Rabat.
THE NETHERLANDS
W.P. Van Stockum & Zoon.
Buitenhof 36, Den Haag.
NEW ZEALAND
Wellington, Government Printing Office.20, Molesworth Street (Private Bag), andGovernment Bookshops atAuckland (P.O.B. 5344).Christchurch (P.O.B. 1721).
Dunedin (P.O.B. 1104).
NORWAY
A/S Bokhjornet, Akersgt. 41, Oslo 1.
PAKISTAN
Mirza Book Agency,
65, Shahrah Quaid-e-Azam, Lahore 3.
PORTUGAL
Livraria Portugal,Rua do Carmo 70, Lisboa.
SOUTH AFRICA
Van Schaik's Book Store Ltd.,Church Street, Pretoria.
SPAIN
Mundi Prensa, Castellô 37, Madrid.
Libreria Bastinos de José Bosch, Pelayo 52,Barcelona 1 .
SWEDEN
Fritzes, Kungl. Hovbokhandel,
Fredsgatan 2, Stockholm 16.
SWITZERLAND
Librairie Payot,
6, rue Grenus, 1211, Genève 11et à Lausanne, Neuchatel, Vevey,Montreux, Berne, Bale et Zurich.
TURKEY
Librairie Hachette,469 Istiklal Caddesi, Beyoglu, Istanbul,and 12 Ziya Gôkalp Caddesi, Ankara.
UNITED KINGDOM and
CROWN COLONIES
H. M. Stationery Office,P.O. Box 569, London S.E.l.
Branches at : Edinburgh, Birmingham,
Bristol, Manchester, Cardiff, Belfast.
UNITED STATES
OECD PUBLICATIONS CENTER,Suite 1305,1750 Pennsylvania Ave, N.W.Washington, d.c. 20,006.
VENEZUELA
Libreria del Este,
Avda F. Miranda 52, Edificio Galipan,Caracas
YUGOSLAVIA
Jugoslovenska Knjiga, TerazijeP.O.B. 36, Beograd.
27,
Orders and inquiries from countries where sales agents have not yet been appointed may be sent to OECD, Publications Office,2 rue André-Pascal, F 75, Paris 16e
Director : Maurice Jacomet Printed in France - imprimerie Blanchard. 6. avenue Descanes - 92 - Le Plessis-Robinscr

I Ui\->Austria
BelgiumCanadaDenmark
France
GermanyGreece
Iceland
Ireland
ItalyJapanLuxembourgNetherlands £NorwayPortugalSpainSwedenSwitzerland
Turkey IUnited KingdomUnited States