Household income - OECD iLibrary
22
OECD Framework for Statistics on the Distribution of Household Income, Consumption and Wealth © OECD 2013 79 Chapter 4 Household income In the context of the ICW Framework, household income is a flow that enables consumption and contributes to changes in household wealth or net worth. As an important element in the measurement of economic well-being, standards and guidelines have been provided to assist countries in the collection, compilation and dissemination of household income statistics. The most recent of these, the 2011 Canberra Group Handbook, Second Edition, has been incorporated into the ICW Framework, and forms the basis for this chapter.
-
Upload
khangminh22 -
Category
Documents
-
view
5 -
download
0
Transcript of Household income - OECD iLibrary

OECD Framework for Statistics on the Distribution
of Household Income, Consumption and Wealth
© OECD 2013
79
Chapter 4
Household income
In the context of the ICW Framework, household income is a flow that enablesconsumption and contributes to changes in household wealth or net worth. As animportant element in the measurement of economic well-being, standards andguidelines have been provided to assist countries in the collection, compilation anddissemination of household income statistics. The most recent of these, the 2011Canberra Group Handbook, Second Edition, has been incorporated into the ICWFramework, and forms the basis for this chapter.

4. HOUSEHOLD INCOME
OECD FRAMEWORK FOR STATISTICS ON THE DISTRIBUTION OF HOUSEHOLD INCOME, CONSUMPTION AND WEALTH © OECD 201380
Policy context and usesMicro-level data on income at the household level supply information about the
distribution of income across members of a society. Economic analysts and policy makers
require information on income distributions for many reasons. One is to understand the
relationship between patterns of income distribution and the way in which societies are
organised. Differences in institutions and policies affect income distributions, and their
effects are better understood through comparison with earlier years, and with other
countries. Monitoring changes in sources of income and income distribution for particular
subpopulations is important for assessing the economic well-being of individuals and of
society as a whole.
Measuring household income is necessary to assess the effect of both universal
and targeted actions (such as welfare, taxation and other fiscal policies) on different
socio-economic groups. It is important to understand the implications of fiscal and
monetary policies for the economic well-being of particular groups within the
population, and how they might increase or reduce inequality in the distribution of
resources. The tax and transfer system is a primary mechanism by which economic
resources are redistributed. It is important to understand the factors that might cause
an increase in the number of low-income earners, such as rising unemployment or
population ageing, or how this might be affected by different policies.
Additionally, there is an interest in how different patterns of income distribution
influence household well-being and people’s ability to acquire the goods and services to
satisfy their needs and wants, including through studies of poverty and social exclusion
and research on consumer behaviour. In order to design effective programs, policy makers
must know the characteristics and circumstances of low-income households, of those
considered to be at risk of poverty, and of those in greatest need of financial support.
Comparing income distributions with earlier years, or with other countries, informs policy
designs to ensure that people have sufficient incomes in their working lives and in
retirement to maintain an adequate standard of living. One important goal of public policy
is to prevent the economic hardship that may lead to a range of social problems, such as
poor health and education outcomes, increased crime rates and lower rates of community
participation, or dependence on assistance from government and charitable organisations.
Of particular policy interest and concern is the impact on children in affected families and
the geographic distribution of hardship.
Most data on income distributions refer to only one point in time. These data measure a
cross-section of the population and give a picture of the distribution of income in one period.
Assessing how incomes change at the household level requires more complex data
collection that follows the same individuals or households for longer periods of time. The
collection of longitudinal data from household surveys is not as common as cross-sectional
data, due to the extra cost and complexity and issues with data quality. A central goal of
longitudinal data is the measurement of change at the individual level. To understand the

4. HOUSEHOLD INCOME
OECD FRAMEWORK FOR STATISTICS ON THE DISTRIBUTION OF HOUSEHOLD INCOME, CONSUMPTION AND WEALTH © OECD 2013 81
processes involved in life histories, data need to be collected at key transition points from the
same individuals over an extended period. For example, poor educational attainment in
children may be attributed in part to low parental aspiration. A cross-sectional survey could
establish only a correlation between parents’ aspirations and children’s educational
attainment, with no basis on which to establish either cause or effect. Longitudinal data can
give insight into to the nature of some of the “cause and effect” relationships involved.
Producers of income distribution statistics therefore have to make choices about what
data need to be collected, what types of statistics to estimate, and how to summarise
information on income distributions. Guidance on the collection, analysis and
dissemination of income data are described in several sources. Household income
statistics should be internationally comparable and consistent with related economic and
social statistics.
International standards at the micro and macro levels Household income measurement has two main traditions: the macro approach,
having its roots in national accounts and in particular the accounting-based standards laid
out in the UN System of National Accounts (SNA) and the micro approach, having its roots
in microeconomics and particularly the study of poverty and inequality and their effect on
different socio-economic groups within society. SNA data are sectoral aggregates compiled
from many sources and presented within the broader national accounting framework. The
data show how the household sector relates to the corporate and government sectors and
to the rest of the world.
The conceptual definition of income at the household level presented in the Canberra
Group Handbook is generally consistent, with the definition of income used in the System of
National Accounts (SNA).1 However, despite the conceptual similarities, the different
purposes of the statistics to be compiled result in some different treatments. Some income
items that are treated differently are income from self-employment, income from the
rental of dwellings, royalties and rental income from non-residential property (factories,
shops, etc.), and the production of services by household members for their own final
consumption (other than the services provided by owner-occupied dwellings), which have
traditionally been excluded from measured production in the SNA.
National accounts provide information about the overall performance of the whole
economy and aggregate outcomes for households. However, they do not inform our
understanding of the distribution of these resources across households or between
subgroups of the population. In addition the per-capita measures in the national accounts
do not take account of the way in which household needs vary on the basis of household
composition or the age of household members. Understanding the distributional
dimensions of economic well-being requires the measurement of concepts at the
household level.
Income concepts and definitionsThe conceptual definition of household income for micro statistics adopted in the ICW
Framework is as follows: Household income consists of all receipts, whether monetary or
in-kind (goods and services), that are received by the household or by individual members
of the household at annual or more frequent intervals, but excludes windfall gains and
other such irregular and typically one-time receipts. Household income receipts are

4. HOUSEHOLD INCOME
OECD FRAMEWORK FOR STATISTICS ON THE DISTRIBUTION OF HOUSEHOLD INCOME, CONSUMPTION AND WEALTH © OECD 201382
available for current consumption and do not reduce the net worth of the household
through a reduction of its cash, the disposal of its other financial or non-financial assets or
an increase in its liabilities. Household income covers: i) income from employment (both
paid and self-employment); ii) property income; iii) income from the production of
household services for own consumption; iv) current transfers received (other than social
transfers in kind); and v) social transfers in kind.
The conceptual definition determines what, in principle, should be included in a
comprehensive measure of household income. The classification of income components
presented below is a summary of the detailed ICW Framework presented in Annex A. The
elements listed in Table 4.1 are described in the sections that follow. Relevant background
material for many elements was provided in Chapter 3.
Income from employment
Income from employment comprises receipts for participation in economic activities
in a strictly employment-related capacity. It consists of payments, in cash or in kind,
received by individuals, for themselves or in respect of their family members, as a result of
their current or former involvement in paid jobs or self-employment. Income from
employment consists of:
● Employee income received in cash (monetary) or in kind (as goods and services). Employee
income includes direct wages and salaries for time worked and work done, commission
and piece-work payments, tips and gratuities, directors’ fees, shares offered as part of
employee remuneration, profit-sharing bonuses and other forms of profit-related pay,
remuneration from an employer for time not worked such as annual leave, holidays or
other paid leave (but not pay while absent on sickness, disability or maternity leave if
paid by the employer rather than by a social assistance or social insurance scheme), free
or subsidised goods and services from an employer, severance and termination pay
(except lump-sum retirement payments, which are treated as capital transfers), and
employers’ social insurance contributions.
● Income from self-employment, i.e. income received by individuals over a given reference
period as a result of their involvement in self-employment jobs. Net income from self-
employment includes the profit or loss that accrues to owners of, or partners in,
unincorporated enterprises who work in these enterprises. It also includes the estimated
value of goods produced for barter as well as of the goods produced for own consumption,
less expenses. The basis for the measurement of income from self-employment in
household income statistics is the concept of “net” income, i.e. the value of gross output
less operating costs and after adjustment for depreciation of assets used in production.
Property income
Property income is the flow of receipts that arise from the ownership of assets (return
for use of assets) that are provided to others for their use. They include returns from
financial assets (e.g. interest earned on deposits, dividends from share holdings), receipts
from investment in unincorporated enterprises in which the investor does not work
(sometimes known as “sleeping” or “silent” partners), and annuities and other regular
payments from life insurance funds and private pension funds that are excluded from
social insurance. Property income also includes rents and other payments received for the
use of non-financial assets, both unproduced assets (i.e. natural resources), such as land,
and produced assets, such as houses, other buildings, plant, equipments, and patented or

4. HOUSEHOLD INCOME
OECD FRAMEWORK FOR STATISTICS ON THE DISTRIBUTION OF HOUSEHOLD INCOME, CONSUMPTION AND WEALTH © OECD 2013 83
copyright material. All property income should be recorded net of any expenses incurred in
earning it.
Income from the household production of services for own consumption
Income from the household production of services for own consumption includes
services produced within the household for the household’s own consumption rather than
for the market. These include services from owner-occupied dwellings and from consumer
Table 4.1. Income components
CODE ELEMENT
I1 Income from employment
I1.1 Employee income
I1.1.1 Cash wages and salaries
I1.1.2 Cash commission and piece-work payments
I1.1.3 Cash tips and gratuities
I1.1.4 Directors’ fees
I1.1.5 Shares offered as part of employee remuneration
I1.1.6 Profit-sharing bonuses and other forms of profit-related pay
I1.1.7 Other cash bonuses
I1.1.8 Free or subsidised goods and services from employers
I1.1.9 Severance and termination pay
I1.1.10 Employers’ social insurance contributions
I1.2 Income from self-employment
I1.2.1 Profit/loss from own unincorporated enterprise
I1.2.2 Goods and services produced for barter, less cost of inputs
I1.2.3 Goods produced for own use, less cost of inputs
I2 Property income
I2.1 Income from financial assets, net of expenses
I2.2 Rent from real estate other than owner-occupied dwellings, net of expenses
I2.3 Royalties and other income from other non-financial assets, net of expenses
I3 Income from household production of services for own consumption
I3.1 Net value of housing services provided by owner-occupied dwellings
I3.2 Value of unpaid domestic services
I3.3 Net value of services from household consumer durables
I4 Current transfers received, excluding STIK
I4.1 Pensions and other cash benefits from social security
I4.2 Pensions and other benefits from employment-related social insurance
I4.3 Social assistance benefits in cash from government
I4.4 Current transfers received from other households
I4.5 Current transfers in cash received from non-profit organisations
I4.6 Other current transfers received, excluding social transfers in kind
Income from production (sum of I1 and I3)
Primary income (sum of I1, I2 and I3)
IT Total income (sum of I1 to I4)
E2 Current transfers paid
E2.1 Direct taxes (net of refunds)
E2.2 Compulsory fees and fines
E2.3 Employee and employers’ social insurance contributions
E2.4 Current transfers paid to other households
E2.5 Current transfers paid to non-profit organisations
E2.6 Other current transfers paid
ID Disposable income (IT less E2)
I5 Social transfers in kind (STIK)
IAD Adjusted disposable income (ID plus I5)

4. HOUSEHOLD INCOME
OECD FRAMEWORK FOR STATISTICS ON THE DISTRIBUTION OF HOUSEHOLD INCOME, CONSUMPTION AND WEALTH © OECD 201384
durables owned as well as own-produced domestic services. They are valued net of the
expenses that go into their production. The production of services by household members
for their own final consumption, other than the services provided by owner-occupied
dwellings, has traditionally been excluded from measured production in the SNA.
Imputed rent is the net estimated value of housing services provided by owner-
occupied dwellings. Imputed rent is included in income on a net basis, i.e. the imputed
value of the services received less the value of the housing costs incurred by the household
in their role as a landlord. Estimates of imputed rent should be presented separately so that
data are available to support different types of analysis. Where statistics on household
income and household expenditure are to be analysed jointly, rent imputations should be
produced in a consistent manner. In the SNA, net rental income from owner-occupied
housing (imputed value of housing services less operating costs) is a component of gross
operating surplus in the household income account.
Unpaid domestic services, or home production, include the estimated value of own-
produced domestic services such as cooking, housekeeping, minor repairs and child care.
Only the value of the labour is included here.
Income from services of household consumer durables, such as cars, washing
machines and refrigerators, refers to the imputed value of the flow of services provided by
these items, less expenses incurred in providing them.
Current transfers received
Transfers are receipts for which the recipient does not give anything to the donor in
direct return. Transfers can consist of cash or goods or services. Transfers may be made
between households, between households and the government, between households and
corporations, or between households and charities, both within or outside the country.
Current transfers received directly affect the level of disposable income and the
consumption of goods and services. They consist of all transfers that are not transfers of
capital but also exclude social transfers in kind made by governments and charities.
Capital transfers tend to be large, irregular and infrequent receipts such as inheritances or
lump-sum retirement payments. Current transfers tend to be small and are often made
frequently and regularly. In concept, all current transfers received in cash and as goods or
services are regarded as income. Current transfers include the following items:
● Social security pensions, insurance benefits and allowances generated from general
government-sponsored social insurance schemes (compulsory/legal schemes) such as
pensions (including overseas pensions), unemployment and sickness benefits.2 Only
cash benefits are included, since in-kind benefits are part of social transfers in kind
(STIK).
● Pensions and other insurance benefits from employer-sponsored social insurance schemes
(both funded and unfunded).
● Social assistance benefits in cash from governments (universal or means-tested) that
provide the same benefits as social security schemes, but which are not provided for
under such schemes.
● Current transfers from other households in the form of family support payments (such
as alimony, child and parental support), regular receipts from inheritances and trust
funds, regular gifts, financial support or transfers in kind of goods or services

4. HOUSEHOLD INCOME
OECD FRAMEWORK FOR STATISTICS ON THE DISTRIBUTION OF HOUSEHOLD INCOME, CONSUMPTION AND WEALTH © OECD 2013 85
(e.g. housing or child care services). The category also includes any other cash payments
or provision of goods and services intended to support the current consumption of the
recipient.
● Current cash transfers from non-profit institutions (e.g. charities, trade unions and
religious bodies) in the form of gifts and financial support, such as scholarships, union
strike pay, union sickness benefits and relief payments. Regular payments and any other
payments intended to support the consumption of the recipient are also included here.
● Other current transfers received include current transfers from corporate entities
(unless they qualify as negative consumption expenditure) and from inheritances and
trust funds.
Income from production
This concept is the sum of income from employment (I1) and income from household
production of services for own consumption (I3).
Primary income
Primary income adds property income (I2) to income from production.
Total income
Total income is defined as the sum of current transfers received (I4) and primary
income.
Current transfers paid
This category includes payments such as direct taxes, fees or fines paid, employer and
employee contributions to social insurance schemes, current transfers to non-profit
organisations, and current transfers to other households, such as child support or alimony
payments. These payments are current expenditures by the household that do not directly
support the current consumption of the household.
Disposable income
Disposable income refers to total income (IT) minus current transfers paid (E2).
Social transfers in kind
Social transfers in kind (STIK) are defined as goods and services provided by
government and non-profit institutions that benefit individuals but are provided free or at
subsidised prices, e.g. food, housing, education and health care.
Adjusted disposable income
This is the sum of disposable income (ID) plus social transfers in kind (I5).
Exclusions from income
Household income excludes several types of receipts. These include receipts that
are large and not received on a regular ongoing basis, and changes in the value of assets
over time.
● Windfall gains and other such irregular and one-time receipts include large lottery prizes, large
gambling winnings, non-life insurance claims, inheritances, lump-sum retirement

4. HOUSEHOLD INCOME
OECD FRAMEWORK FOR STATISTICS ON THE DISTRIBUTION OF HOUSEHOLD INCOME, CONSUMPTION AND WEALTH © OECD 201386
benefits, life insurance claims (except annuities), windfall gains and legal/injury
compensation (except those in lieu of foregone earnings). Transactions that represent a
rearrangement of household assets are also excluded, including the sale of assets
(exchange of a non-cash asset for a cash asset), the taking of a loan (receipt of extra cash
in exchange for a new liability), or the receipt of funds lent to others (receipt of extra cash
in exchange for a reduction in a financial asset). Withdrawals from savings are also
excluded from income. For analytical and other purposes, data may be collected on
receipts that are excluded from the concept of income to provide a broader
understanding of the economic circumstances of households, especially in the broader
conceptual framework described here.
● Capital transfers received include the acquisition of assets without payment by the
receiver. These transfers differ from current transfers received in terms of the pattern of
receipt. Rather than being small amounts usually received on a regular basis, as in the
case of current transfers, these are large, one-time receipts. These distinctions are based
on the probable response by households’ consumption to such receipts, the assumption
being that households will not consider the entire capital transfer as available for
current consumption. In practice, it may be difficult to classify transfers received
properly as either current or capital transfers.
● Holding gains or losses refer to changes in the value of financial and non-financial assets
and liabilities over a reference period due to changing asset prices. A holding gain, the
result of an increase in the value of assets or a reduction in the value of liabilities,
increases the net worth of the owner while a holding loss has the opposite effect. All
holding gains and losses are excluded from income, whether they are realised (if the
owner sells the asset) or unrealised. Instead they are included in the wealth element,
Other flows contributing to changes in net worth.
Specific issues and treatments in the ICW Framework
Some of the components of income listed above overlap with concepts of
consumption or wealth. Within a framework that includes all three elements, it is
important to understand the relationships between these components. As described in
Chapter 3, households receive economic resources as income. These resources are added
to the stock of wealth to be spent for consumption or saved for future periods. While
Chapter 3 provided general principles for categorisation, it noted that it is sometimes
necessary to define the boundaries between income, consumption and wealth more
precisely. Often these boundaries will vary depending on the specific research question
being investigated. This section discusses some income components that overlap with
concepts of wealth (interest payments) or of consumption (inter-household transfers,
home production for own consumption, and social transfers in kind).
Interest payments as expenses
Income from various sources, including self-employment, property and household
production of services for own consumption, is defined as net income, i.e. gross income
less expenses. Expenses include any interest payments made on loans taken to finance the
purchase, operation or renovation of the income-producing assets involved. Such loans
include loans taken out to purchase or renovate an owner-occupied dwelling, to purchase
or operate an unincorporated business, to purchase shares or other financial assets, or to
purchase consumer durables. Interest payments on loans taken to finance consumption,

4. HOUSEHOLD INCOME
OECD FRAMEWORK FOR STATISTICS ON THE DISTRIBUTION OF HOUSEHOLD INCOME, CONSUMPTION AND WEALTH © OECD 2013 87
Box 4.1. A more detailed classification of income components: The Dutch experience
The classification of income components used in Dutch income statistics aims to showhow income is formed (primary income) and how it is redistributed (secondary income).Published versions of the whole classification contain almost 60 income components,excluding subtotals. Some aspects of this detailed classification are presented below.
Classification of current transfers
The system of redistribution of income has been pictured in much detail. At the firstlevel (Scheme 1), a distinction is made between transfers received from incomeinsurance (5), tax-financed general social assistance (at free disposal, 6), cash transfersthat are tied to specific consumption items such as rent (housing benefits) or studycosts(7), and other current transfers (8).
The main subdivision of income insurance is by function rather than by scheme. Thefollowing functions have been distinguished: insurance against loss of income due tounemployment (5.1 and 11.1), sickness (5.2 and 11.2), disability (5.3 and 11.3) andretirement and surviving relatives (5.4 and 11.4).
At a more detailed level, both benefits and premiums are subdivided by scheme. So, forinstance, pension premiums are subdivided into contributions paid by employees and byemployers (11.4.1), private insurance (11.4.2) and national insurance (11.4.3). In practice,application of the full classification scheme will show empty rows: in most countriesinsurance against loss of income through unemployment, for instance, is possible throughsocial insurance only.
A detailed classification of the redistribution through income insurance offers threeadvantages. First, the difference between benefits received and premiums paid can beanalysed on a detailed level. Second, a picture of the role of social, private and nationalinsurance can be shown as well as how this mix changes over time. Finally, cross-countrycomparisons can be made with respect to how countries differ in their system ofredistribution of income, how they finance their pensions, and so on.
Contributions to health insurance
In Scheme 1, contributions to health insurance are classified separately fromcontributions to income insurance, because of their different character. Health insurancepays out compensation for medical expenses, whereas income insurance provides for a(regular) income flow. However, contributions to health cost insurance (social and nationalschemes) are treated as an income transaction, as they are obligatory and redistributeincome (premiums are income-related). In the Netherlands, up to 2005 lower incomes fellunder social health insurance, while higher incomes had to enter into a private healthinsurance. For the sake of comparability of both income and spending between populationsgroups (e.g. by level of income), contributions to private health insurance are treated as acurrent transfer paid and not as a spending item. In fact, a private premium corresponding tothe coverage of social insurance against health costs has been imputed as an income transferpaid, whereas the difference with the actual premium paid by households is recorded as aspending on health services. Treating contributions to private health cost insurance as anincome transaction avoids the need to use consumer price indices (and equivalence scales)tailored to different population groups. Scheme 2 shows another advantage: the majorreform of health insurance introduced in the Netherlands in 2006 had only limited effect ontotal contributions, as these also cover premia for private insurance.
4. HOUSEHOLD INCOME
OECD FRAMEWORK FOR STATISTICS ON THE DISTRIBUTION OF HOUSEHOLD INCOME, CONSUMPTION AND WEALTH © OECD 201388
Box 4.1. A more detailed classification of income components: The Dutch experience (cont.)
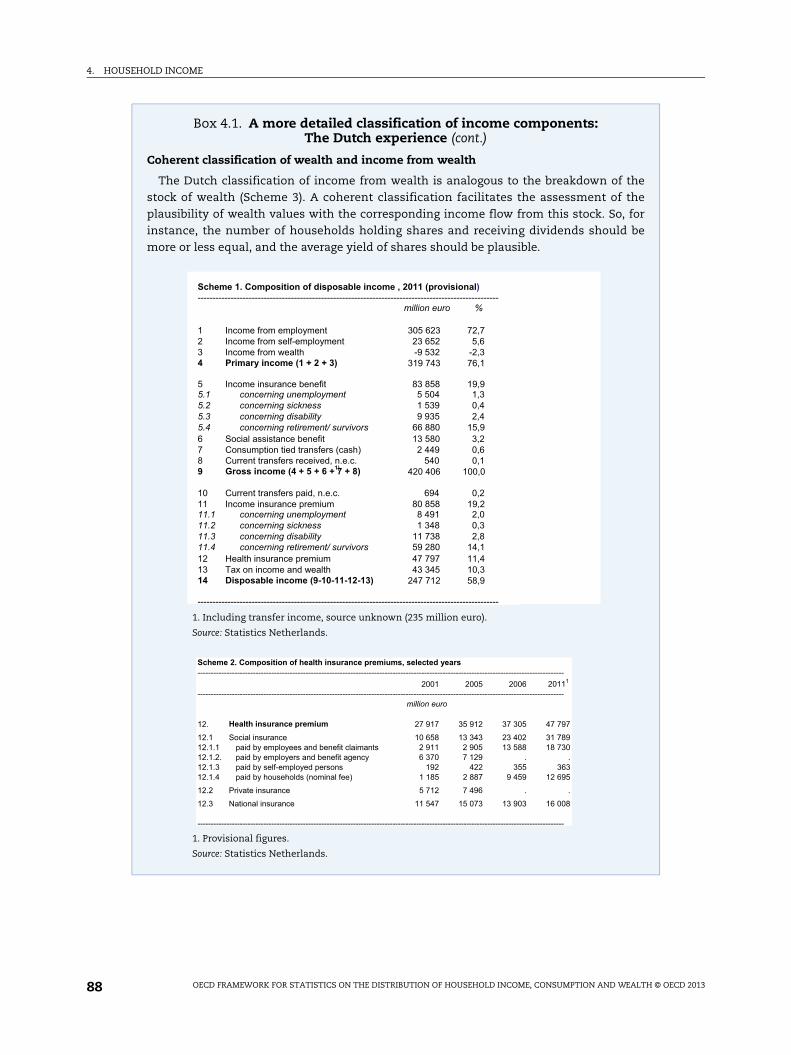
Coherent classification of wealth and income from wealth
The Dutch classification of income from wealth is analogous to the breakdown of thestock of wealth (Scheme 3). A coherent classification facilitates the assessment of theplausibility of wealth values with the corresponding income flow from this stock. So, forinstance, the number of households holding shares and receiving dividends should bemore or less equal, and the average yield of shares should be plausible.
1. Including transfer income, source unknown (235 million euro).
Source: Statistics Netherlands.
1. Provisional figures.
Source: Statistics Netherlands.
Scheme 1. Composition of disposable income , 2011 (provisional)----------------------------------------------------------------------------------------------------
million euro %
1 Income from employment 305 623 72,72 Income from self-employment 23 652 5,63 Income from wealth -9 532 -2,34 Primary income (1 + 2 + 3) 319 743 76,1
5 Income insurance benefit 83 858 19,95.1 concerning unemployment 5 504 1,35.2 concerning sickness 1 539 0,45.3 concerning disability 9 935 2,45.4 concerning retirement/ survivors 66 880 15,96 Social assistance benefit 13 580 3,27 Consumption tied transfers (cash) 2 449 0,68 Current transfers received, n.e.c. 540 0,19 Gross income (4 + 5 + 6 + 7 + 8) 1) 420 406 100,0
10 Current transfers paid, n.e.c. 694 0,211 Income insurance premium 80 858 19,211.1 concerning unemployment 8 491 2,011.2 concerning sickness 1 348 0,311.3 concerning disability 11 738 2,811.4 concerning retirement/ survivors 59 280 14,112 Health insurance premium 47 797 11,413 Tax on income and wealth 43 345 10,314 Disposable income (9-10-11-12-13) 247 712 58,9
----------------------------------------------------------------------------------------------------
Scheme 2. Composition of health insurance premiums, selected years-------------------------------------------------------------------------------------------------------------------------------------------
2001 2005 2006 20111 -------------------------------------------------------------------------------------------------------------------------------------------
million euro
12. Health insurance premium 27 917 35 912 37 305 47 797 12.1 Social insurance 10 658 13 343 23 402 31 789 12.1.1 paid by employees and benefit claimants 2 911 2 905 13 588 18 730 12.1.2. paid by employers and benefit agency 6 370 7 129 . . 12.1.3 paid by self-employed persons 192 422 355 363 12.1.4 paid by households (nominal fee) 1 185 2 887 9 459 12 695 12.2 Private insurance 5 712 7 496 . . 12.3 National insurance 11 547 15 073 13 903 16 008 -------------------------------------------------------------------------------------------------------------------------------------------

4. HOUSEHOLD INCOME
OECD FRAMEWORK FOR STATISTICS ON THE DISTRIBUTION OF HOUSEHOLD INCOME, CONSUMPTION AND WEALTH © OECD 2013 89
education loans and the like are included not as expenses to be deducted in deriving
income, but in the expenditure item of interest on consumer credit.
It is important to note that it is the purpose of a loan that determines how interest
payments on the loan are allocated, not the collateral or security used. For example, a
mortgage on a principal residence may primarily be used to fund the purchase of the
dwelling, in which case interest payments on the mortgage are an expense to be deducted
when deriving net imputed rent for the dwelling. But if the mortgage is primarily used to
fund the purchase of an unincorporated business, the interest payments are an expense to
be deducted when deriving self-employment income. If the mortgage was used primarily
to fund consumption, such as the cost of a major holiday or of education, the interest
payments are not deducted as an expense for any income item, but are included as interest
on consumer credit. Conversely, if a loan is used to help purchase the principal dwelling
but that loan has some other asset as collateral, or even has no collateral at all, interest
payments on the loan are an expense to be deducted when deriving net imputed rent for
the dwelling.
Income from life insurance, annuities and private pension funds
Receipts from certain types of life insurance, annuities and private pension funds are
more or less regular and ongoing and are an important source of finance for the day-to-day
living expenses of the recipients and are treated as income in the international standards.
Those receipts therefore have the characteristics of income from the perspective of the
recipients. However, they often represent the run-down of an asset held by the recipient
with the financial institution making the payment. This conflict is resolved in the ICW
Framework by treating the receipt as income and then having an adjustment to the value
of wealth that records the decrease in wealth due to the dissaving that has actually taken
place. By including such receipts as income, any analysis of income in isolation from
Box 4.1. A more detailed classification of income components: The Dutch experience (cont.)
1. Provisional results for respectively 1-1-2011 and 2011.2. Imputed revenues of owner-occupied dwellings are treated here in the same way as e.g. revenues from
other real estate.3. The revenues of entrepreneurial property are included in the (mixed) income from self-employement.
Source: Statistics Netherlands.
Scheme 3: Coherence between the wealth and income from wealth 1
billion euros billion euros
1. NET WEALTH (1.1 - 1.2) 1 196 3. INCOME FROM WEALTH (3.1 -3.2) -9 532
1.1 PROPERTY 1 953 3.1 INCOME FROM PROPERTY 24 7221.1.1 Financial assets 568 3.1.1 Income from financial assets 12 6351.1.1.1 Bank accounts, saving accounts 291 3.1.1.1 Interest received from bank accounts 6 4541.1.1.2 Bonds 28 3.1.1.2 Income from bonds 1 0001.1.1.3 Shares 249 3.1.1.3 Dividends 5 1811.1.2 Real estate 1 327 3.1.2 Income from real estate 11 8711.1.2.1 Owner-occupiers: value of the home 1 157 3.1.2.1 Imputed rent 2) 11 0261.1.2.2 Real estate, other 171 3.1.2.2 Income from real estate, other 8451.1.3 Moveable property 32 3.1.3 Income from moveable property 2161.1.4 Entrepreneurial property 3) 26
1.2 DEBTS 756 3.2 INTEREST PAID 34 2541.2.1 Mortgage loan 652 3.2.1 Interest paid on mortgage loans 32 2741.2.2 Debts, other 104 3.2.2 Interest paid, other 1 980
----------------------------------------------------------------------------------------------------------------------------------------------------------------------

4. HOUSEHOLD INCOME
OECD FRAMEWORK FOR STATISTICS ON THE DISTRIBUTION OF HOUSEHOLD INCOME, CONSUMPTION AND WEALTH © OECD 201390
consumption or wealth data is likely to provide a more representative indication of the
standard of living of the recipients of such payments.
Inter-household transfers
Inter-household transfers include current transfers between private households
during the income reference period, in the form of family support payments (such as
alimony, child and parental support), regular gifts, and other financial support or transfer
in kind of goods likely to support the current consumption of the recipient. Inter-
household transfers are:
● Given without an expectation of repayment, similar to any current transfer.
● Given with the aim of supporting current consumption; this is related to the
classification of a specific economic flow between households as income received (when
money, goods or services are used immediately or in the short-term) or as an increment
of wealth (when saved or comprising a capital item such as a consumer durable).
● Often made regularly, i.e. anticipated or relied upon by the recipient household.
It is convenient that data collection on inter-household transfers distinguishes
between regular and large irregular economic flows and their use by the household
recipient. Regular inter-household transfers include regular alimonies, child and parental
support payments, either voluntary or compulsory. Inter-household transfers can be
donated either by family members or by any other person not living in the recipient
household. They also include transfers by a household donor residing out of the country
(remittances) when used for immediate or short-run consumption.
While regular inter-household transfers are included as income, such transfers in kind
are also considered as consumption by the recipient household. As an example, food
received as a transfer from another household should be included in a measure of food
consumed by that household.
Home production for own consumption
Home production for own consumption refers to the goods or services that are
produced within the household for the household’s own consumption, rather than for the
market or for barter. It includes both the household production of goods for own
consumption, whose estimated value less expenses is included in the self-employment
income, and the household production of services for own consumption. Home production
for own consumption is an example of a non-monetary component that is included both
on the income side, increasing the level of household resources, and on the consumption
expenditure side, contributing to household well-being.3
Household production of goods for own consumption includes the production of self-
consumed food products, such as dairy products, poultry, vegetables, fruits, beverages,
other natural products like wood, as well as handicraft products such as the products of
beadwork, needlework or weaving. Also included are withdrawals from stocks of goods
purchased by the household’s unincorporated enterprises such as food, magazines or
cigarettes. The relevance of these non-remunerative activities for income estimation
purposes depends on their estimated value, which corresponds to the market value of the
goods produced less any expenses incurred in their production (or purchase of goods that
are not transformed), which can be significant for specific products and groups of
households.

4. HOUSEHOLD INCOME
OECD FRAMEWORK FOR STATISTICS ON THE DISTRIBUTION OF HOUSEHOLD INCOME, CONSUMPTION AND WEALTH © OECD 2013 91
The household production of services for own consumption includes the value of
housing services provided by owner-occupied dwellings net of expenses, the value of
services provided by household consumer durables net of expenses, and unpaid domestic
services. The ownership of a dwelling implies an acquisition that, in accordance with the
SNA, is classified as capital formation, while the dwelling produces an accommodation
service consumed over time, whose price is estimated by the imputation of a rental. In this
case, the value to impute shall be the equivalent market rent that would be paid for a
dwelling similar to the one occupied, less any minor repair or refurbishment expenditure
that the owner-occupied household undertakes, less the interest expenses of any loans
taken to finance the purchase of the dwelling or any capital expenditure on it. The running
costs of utilities like electricity, water or heating are not regarded as expenses in the
production of housing services but as consumption expenditure. Major repairs are treated
as capital formation and excluded.
This procedure aims at harmonising the evaluation of housing consumption
expenditure and of the well-being gained by the owner-occupiers and tenants. Imputed
rents are an example of a non-monetary component included both on the income side,
increasing the level of household resources, and on the consumption expenditure side,
contributing to the household’s well-being.4
There are several methods for estimating gross imputed rent: i) the regression/
stratification method based on actual rents; ii) the user cost method, based on the estimation
of the cost incurred for homeownership by foregoing the opportunity to invest in financial
assets from which real income flows are created in the form of income from interest and
dividends; iii) the self-assessment method; and iv) the administrative assessment method,
generally for fiscal purposes such as establishing property tax liabilities. If relevant data are
available, the regression/stratification method is likely to provide estimates that allow the
most relevant comparisons of economic well-being between home owners and non-home
owners, while ensuring coherence with SNA estimates.5
Both unpaid domestic services and household consumer durable services are
excluded from the SNA production boundary, and also from the scope of the data
collections by the EU Statistics on Income and Living Conditions (SILC) and the Household
Budget Survey (HBS). Unpaid domestic services include the estimated value of own-
produced domestic services such as housekeeping, the preparation and serving of meals,
the care of children and of sick, infirm or old people, the transportation of household
members or their goods, and the cleaning, servicing and minor repair of household durable
goods. The importance of these services was emphasised by the Stiglitz-Sen-Fitoussi
Commission and included in the list of recommendations for broadening the income
measures to include non-market activities. Household consumer durables services refer to
the imputed value of services provided by household-owned cars, washing machines,
refrigerators, clothes, etc.
Social transfers in kind
Social transfers in kind (STIK) are non-monetary transfers that a person receives
usually from the government and sometimes from a non-profit organisation as goods or
services, such as food vouchers, or as reductions in the price of these goods and services,
such as in the case of payments for education and health care service. Sometimes the
purpose of these transfers is to supply social welfare to disadvantaged populations in the

4. HOUSEHOLD INCOME
OECD FRAMEWORK FOR STATISTICS ON THE DISTRIBUTION OF HOUSEHOLD INCOME, CONSUMPTION AND WEALTH © OECD 201392
country; in other cases, they are available to the whole population as part of a country’s
universal provision of medical or education services.
These goods and services are provided to individuals and are different from collective
or public services that government provides to all citizens, such as security and law and
order. Box 4.2 describes the UK experience in this field.
Social transfers in kind are very important to welfare analysis in measuring poverty and
the economic well-being of households and individuals. The ambition in income statistics is to
value these transfers at the micro level (households or individuals), to measure them on a
regular basis and to include them as a component of total household income. In addition, such
transfers would also be counted as consumption for the receiving household.
Data collectionMost income distribution statistics rely on data collected in household surveys,
although administrative sources such as personal income registers and tax and/or social
benefit records are used in some countries.
Income surveys
Income data are usually collected through sample surveys, either from specially
designed household income surveys or from multi-topic surveys where income data are
collected alongside data on, for example, household consumption or labour-force
Box 4.2. Valuing social trends in kind in the United Kingdom
The Office for National Statistics in the UK produces estimates of the value of variousSocial Transfers in Kind (STIK) as part of its Effects of Taxes and Benefits on Householdspublication, which is based on data from the Living Costs & Food (LCF) survey, a surveymeasuring both household income and expenditure. Social transfers in kind currentlyincorporated in this analysis include state health and education spending, housingsubsidies and public transport subsidies. It does not include other items of governmentexpenditure, such as capital expenditure and expenditure on defence and on themaintenance of law and order, for which there is no clear conceptual basis for allocation.
The methodology used for estimating these STIK varies according to the data that isavailable. For example, estimates of the benefit from education are derived by making useof published statistics on the cost per pupil/student in various types of educationestablishments (e.g. nurseries, primary and secondary schools, universities) and thenumber of people in the household recorded on the LCF as receiving each kind of stateeducation. Estimates of the value of travel subsidies received by households are calculatedbased on recorded expenditure on bus and rail travel for each household.
The LCF does not contain data on individuals’ use of health services, so a differentapproach is needed to estimate the value of these social transfers in kind. The currentmethod uses data on the average cost of providing the various types of health care:hospital inpatient/outpatient care, general practitioner consultations, pharmaceuticalservices, and so on. Each individual in the LCF is allocated a benefit from the NationalHealth Service according to the estimated average use made of these various types ofhealth service by people of the same age and gender, and according to the total cost ofproviding those services. The benefit from maternity services is assigned separately tothose households containing children under the age of 12 months. No allowance is madefor the use of private health care services

4. HOUSEHOLD INCOME
OECD FRAMEWORK FOR STATISTICS ON THE DISTRIBUTION OF HOUSEHOLD INCOME, CONSUMPTION AND WEALTH © OECD 2013 93
participation. Household surveys generally collect information from the usual residents of
private dwellings. The design of the sample and the selection of sample households should
be made following appropriate sampling techniques in order to obtain results that are as
precise as possible, within the resources that are available. The sampling method used
should also permit the calculation of sampling errors.
Income data should be collected directly from each relevant household member and
separately for each income component. Although proxy interviewing may sometimes be
necessary to obtain income data for absent household members, the quality of such data
is lower than in the case of data collected from individual members of the household.
Household surveys are constrained by the information that respondents are able to
provide with reasonable accuracy during the course of an interview. This means that
people must have knowledge of the income they are being asked to report and must be able
to recall the information with a reasonable degree of accuracy, which may influence the
accounting period used as well as the questions asked. The questions also must appear
relevant to the respondent.
Income data from registers
For countries where suitable administrative data exists, and where there is a legal
basis to use them for statistical purposes, income data from registers may be used to
substitute for survey data. Nearly a third of all countries participating in the European
Union’s Statistics on Income and Living Conditions (EU-SILC) collect at least some of their
income data from registers. Outside Europe, Canada also collects some income data from
registers.
Register-based statistics may provide total or near-total population coverage and can
be used to produce more detailed statistics for small areas or population groups. They can
also produce statistics for longitudinal analyses. Register data result in lower respondent
burden and are generally a less costly means of producing statistics, with fewer resources
needed to collect, impute or edit the collected data.
Compared to income data collected in surveys, register data are not subject to
sampling and non-response errors. They may, however, suffer from under-coverage or
missing data, e.g. due to tax evasion or low compliance. They may also be limited by the
definitions and administrative practice of the authorities responsible for the register,
which may change over time.
The most common way of using income data from registers is by combining them with
survey data. Some income components are obtained from the registers, while other
income components are collected through an interview. The use of register data alongside
survey data may improve the quality of income estimates, which are often under-reported
in household surveys, and also reduce interview times and respondent burden. However,
compilers of income data should be aware of some of the shortcomings of such data. In
some countries register data on income may be incomplete and may be available only for
people who file their taxes, which may exclude a significant proportion of the population.
In addition, tax data will not include income earned from informal work or private income
support from other households, which in some countries may be substantial.

4. HOUSEHOLD INCOME
OECD FRAMEWORK FOR STATISTICS ON THE DISTRIBUTION OF HOUSEHOLD INCOME, CONSUMPTION AND WEALTH © OECD 201394
Key statistical and measurement issuesAs noted, most income statistics are based on household surveys, though
administrative sources are used in some countries. Each source has its advantages and
drawbacks that should be considered, depending on the purpose and application. Since
income is a flow variable, it should be measured over a specified reference period of time.
Choices may also be made about the unit for which income information is collected and
analysed as well as how the income is to be compared across units of different sizes, in
different places, and across time in order to make relevant and meaningful comparisons.
Reference periods
It is necessary to decide the length of the accounting period to which the collected
data refer. The international standards state that household income statistics should relate
to a full year to take into account seasonal variations in incomes.
Measurement units
It is important to differentiate between the data collection unit and the data analysis
unit. For data collection, the choice of unit will depend on the design of the survey (or the
nature of the system through which administrative data are available). Most surveys collect
information on the income streams of all members in the household.
Equivalence scales
The needs of a household rise with each additional member but, due to economies of
scale in consumption, not in a proportional way. Various calibrations, or equivalence
scales, have been devised to make adjustments to the actual incomes of households in a
way that recognises differences in the needs of individuals and the economies that flow
from sharing resources. They also typically recognise that children have fewer needs than
adults. Atkinson et al. (1995) review a variety of equivalence scales. Chapter 8 discusses the
use of equivalence scales in more detail.
Measurement errors
Income statistics are subject to two types of error: non-sampling and sampling error.
Non-sampling error occurs in any data collection, whether the estimates are derived from
a sample or from a complete collection such as a register or a census. Sources of non-
sampling error include non-response, constraints on the recording process limit that does
not allow for real values, errors in reporting by respondents or in the recording of answers,
and errors in coding and processing the data. Household survey estimates are based on a
sample of possible observations and are subject to sampling variability. The sampling error
is a measure of the variability that occurs by chance because a sample, rather than the
entire population, is surveyed.
Population weighting
When income data are collected using a survey, weighting is the process used to adjust
results from the sample to infer information for the total population. To do this, a “weight”
is allocated to each sample unit, e.g. a person or a household. The weight is a value that
indicates how many population units are represented by the sample unit. The first step in
calculating weights for each unit is to assign an initial weight, which is the inverse of the
probability of being selected in the survey. For example, if the probability of a household

4. HOUSEHOLD INCOME
OECD FRAMEWORK FOR STATISTICS ON THE DISTRIBUTION OF HOUSEHOLD INCOME, CONSUMPTION AND WEALTH © OECD 2013 95
being selected in the survey was 1 in 600, then the household would have an initial weight
of 600 (that is, it represents 600 households).
Household income weights can be multiplied by the number of people in each unit to
derive “person weights”. By applying these “person weights” to equivalised household
income, estimates of the distribution of income amongst all persons can be made. Thus a
six-person unit “counts” six times as much as a one-person unit. Person weighting
produces an estimate of the overall distribution of equivalised income among individuals
in the population, assuming that all household incomes are pooled.
This distribution reflects the assumption that household income is shared equally
between all members of the household, and does not reflect the direct receipt of income by
individuals. Because many household members receive no money income, e.g. younger
children, such an assumption is hard to avoid in practice. One implication from the use of
person weights is that the sum of equivalised income across all persons will differ from the
total unadjusted income measured in the survey.
Adjusting for price differences
Household income data are often compared for different types of households, or for
different geographic areas, at a particular time period, or for the same group of households
in different time periods. For comparisons over time, income data should be adjusted for
price changes to obtain data that are comparable in real terms, i.e. in terms of purchasing
power. Similarly, when comparing incomes across geographical areas or for different types
of households in the same time period, adjustment for differences in price levels should be
made in order to allow comparisons of real income levels in terms of purchasing power. If
no adjustment for price differences is made, the validity of comparing income distribution
results is undermined. The need to adjust for price differences increases with the
magnitude of those differences. Hence, when comparing income data in periods of high
inflation or over longer periods of time, the need to adjust for price changes increases.
Similarly, when there are large price variations between regions, the need to adjust for
differences in price levels becomes more important. Chapter 6 of the Canberra Handbook
discusses adjustments for price differences in detail.
Summary measures of income level
A range of summary measures can be used for analysing income data. Summary
measures of income level include counts, means and medians. The Canberra Handbook
describes many of the measures such as frequency distributions, quantile measures,
Lorenz curves and Gini coefficients.
Analysts are often interested in income data for particular population subgroups.
When presenting income distribution statistics, it is often useful to categorise households
according to characteristics such as household size and composition and features like age
and gender, marital status, number of dependent children, dependency ratio (i.e. the ratio
of those outside the working age to those within), number of income earners and main
source of income. Other groups vary by housing status (e.g. home owners, renters on the
market or of subsidised housing), and physical location (e.g. urban and non-urban areas,
region).
Other analyses focus on comparing income distributions over time. Economists and
social policy analysts are increasingly focusing on long-run trends in income distribution.

4. HOUSEHOLD INCOME
OECD FRAMEWORK FOR STATISTICS ON THE DISTRIBUTION OF HOUSEHOLD INCOME, CONSUMPTION AND WEALTH © OECD 201396
The availability of 20 to 40 years or more of estimates in many nations is making it possible
for analysts to study the determinants and consequences of long periods of distributional
change, for example the relationship between income inequality and GDP growth. The
future will bring more uses of such data, and the policy discussions of national
governments and international bodies may be heavily influenced by such trends and
analyses. For this debate to be well-informed, high standards must be set for the
compilation of time-series data on income distributions.
The longer the time frame, the more likely is the occurrence of non-random
differences. Data producers need to review and make improvements to their collection
concepts and survey methods over time, and it is not always possible to fully quantify the
impact of some of the changes made. However, it is important that data producers and
users are aware of these problems, and for the producer to be as consistent as possible, to
provide overlapping observations when changes are implemented, and to provide
historical data on changes in time series.
It is much more complicated when comparing time series data across countries
because, in principle, there is a double (spatial and temporal) consistency constraint.
Double international harmonisation across countries and over time is the ideal solution.
However, it is difficult to achieve complete harmonisation across nations in practice, even
when it is a clear objective from the outset.
Dissemination and analysisResults from the analysis of income distribution data should be made available in
different formats and tailored for different audiences. A key issue for the dissemination of
income statistics is to prioritise robustness statements and to highlight issues that users
need to be aware of. Because income statistics are complex, they are not self-explanatory.
Hence, it is important to provide direct guidance for their correct interpretation.
Comprehensive and easily accessible metadata should always be disseminated. A detailed
methodological report should be prepared that includes full details of the procedures used
as well as the lessons learned and conclusions.
As much as possible, without breaching the confidentiality of the information
collected, public use files (anonymised micro data sets) should be made available. They
should always be accompanied by clear and comprehensive documentation on all aspects
of data collection and derivations. In particular, if top coding (restricting the maximum
value disseminated for a variable) is used to protect the confidentiality of information, the
details should be documented and the values should be identified, e.g. by flag variables
indicating the percentage of imputed information.
Concise and clear definitions of the income concepts and measures used should be
provided in reports. These may include a glossary of terms, illustrative calculations for
model households – particularly for press releases or for releases aimed at a broader
audience – and, for income-based poverty statistics, a clear definition of the criteria for
determining whether someone is at risk of poverty. Ideally, algorithms should be made
available as metadata.
There should be basic information about data sources – whether data are taken from
a census, administrative data, a sample survey, or a combination of sources. If the data are
from a combination of sources, a description of how the data from the multiple sources are
used to produce the estimates being disseminated should be provided. If comparative data

4. HOUSEHOLD INCOME
OECD FRAMEWORK FOR STATISTICS ON THE DISTRIBUTION OF HOUSEHOLD INCOME, CONSUMPTION AND WEALTH © OECD 2013 97
are presented, it is important to acknowledge whether they were obtained by means of
input-harmonised surveys (such as the ECHP), output-harmonised statistics (such as EU-
SILC), ex post harmonised data (such as in the LIS), or on the basis of standard tabulations
(such as the detailed data questionnaires used by the OECD).
A clear description of the reasons why the survey was conducted should also be
provided. For administrative data, this would be a description of the reason why the
administrative data are collected and how these data are used for statistical purposes. A
general description of the content areas or modules, including links to questionnaire, file
layout, data dictionary, statistical units, reference period(s), who is included and excluded
in the survey population, sample size and design should also be provided.
When disseminating income data, users should be informed of the quality of the
data being presented, including information about sampling errors. As a minimum, the
relative standard error, i.e. the standard error expressed as a percentage of the estimate
for which it is calculated, should be provided for the key variables being disseminated.
While it is recommended that estimates for which the relative standard error exceeds a
certain limit should not be published, the thresholds for suppression should be based on
the professional’s judgment of the “fitness for use” of the estimates. If there is
information available on the type of response errors that may have occurred in a survey,
this should be provided in the documentation accompanying the dissemination of the
results.
In surveys, non-response errors occur because some sample units do not respond to
the survey. Response rates should be provided to users, including any information available
on the units who did not respond (e.g. if specific geographic areas or age groups had higher
non-response rates) and, in the case of time-series data, whether the non-response pattern
is different now than in the past. For a correct interpretation of response rates, it is useful
to provide information on whether substitutions were allowed. For each income aggregate,
the number of incomplete units and the percentage of the income amount that was
imputed should be specified.
Income statistics can be particularly affected by the presence or absence of extreme
values. An explanation of any procedures applied to the data to account for extreme values
should be included in the documentation. At a minimum, users should be informed that
the results may include extreme values and that some estimates may be influenced by the
presence or absence of these extremes.
When time-series data are being disseminated, it is important to inform users of any
changes to the data that may have affected the data for the time period covered. For
example, if the data source is tax records, it is important to provide users with information
about any changes in the tax systems that might affect the data. In the case of a survey, if
there were changes to the way in which the data were collected over the period or in survey
concepts, these changes should be described in the documentation accompanying the
release of the data. Ideally, data in a time series will be adjusted to ensure the data are
comparable over time, but often it is not possible to quantify the precise effect of these
changes.

4. HOUSEHOLD INCOME
OECD FRAMEWORK FOR STATISTICS ON THE DISTRIBUTION OF HOUSEHOLD INCOME, CONSUMPTION AND WEALTH © OECD 201398
SummaryThe key highlights from this chapter can be summarised as follows:
● In the context of the ICW Framework, household income is a flow variable that enables
consumption and contributes to changes in household wealth or net worth.
● Household income measurement has two main traditions: the macro approach, which
has its roots in national accounts, and the micro approach, which has its roots in
microeconomics, the study of poverty and inequality and their effect on different socio-
economic groups within society.
● Micro-level data on income at the household level supply information about the
distribution of income across members of a society. There are many reasons that
economic analysts and policy makers require information on income distributions,
including evaluating the effect of policies on the well-being of particular groups within
the population.
● The conceptual definition of household income for micro statistics adopted in the ICW
Framework is that it consists of all receipts, whether monetary or in kind (goods and
services), that are received by the household or by individual members of the household
at annual or more frequent intervals.
● The classification of income components used here is that applied in the Canberra Group
Handbook, Second Edition, in both structure and level of detail.
● Some components of income overlap with concepts of consumption or wealth. Within a
framework that includes all three elements, it is important to understand the
relationships between these components.
● Most income distribution statistics rely on data collected in household surveys, although
administrative sources are used in some countries. Examples are personal income
registers and tax and/or social benefit records.
● Since income is a flow variable, it should be measured over a specified reference period
of time. Choices may also be made about the unit for which income information is
collected and analysed as well as how the income is to be made comparable across units
of different sizes, in different places, and across time in order to make relevant and
meaningful comparisons.
● A range of summary measures can be used for analysing income data. Summary
measures of income level include counts, means and medians. Measures of income
dispersion that describe the income distribution include frequency distributions,
quantile measures, Lorenz curves and Gini coefficients.
● A key issue for the dissemination of income statistics is to prioritise robustness
statements and to highlight issues that users need to be aware of. Because income
statistics are complex, they are not self-explanatory, so direct guidance for their correct
interpretation should be provided.
Notes
1. The SNA defines disposable household income, in concept, as: “... the maximum amount that ahousehold or other unit can afford to spend on consumption goods or services during the accountingperiod without having to finance its expenditures by reducing its cash, by disposing of other financialor non-financial assets or by increasing its liabilities” (SNA 2008, 8.25).

4. HOUSEHOLD INCOME
OECD FRAMEWORK FOR STATISTICS ON THE DISTRIBUTION OF HOUSEHOLD INCOME, CONSUMPTION AND WEALTH © OECD 2013 99
2. See Annex C for a more detailed explanation of social assistance, social insurance, pensions andsimilar concepts.
3. In the SNA, from the expenditure perspective, goods and services retained by the household for ownfinal consumption are part of final consumption expenditure. From the production perspective, theSNA production boundary excludes all household production of services for own final use exceptservices from owner-occupied dwellings. Household production of goods for own consumption is partof the self-employment income component and, as such, part of mixed income.
4. In the SNA, income from imputed rent (imputed value of housing services less operating costs) isa component of gross operating surplus in the household income account.
5. 95/309/EC, Euratom: Commission Decision of 18 July 1995.

From:OECD Framework for Statistics on the Distributionof Household Income, Consumption and Wealth
Access the complete publication at:https://doi.org/10.1787/9789264194830-en
Please cite this chapter as:
OECD (2013), “Household income”, in OECD Framework for Statistics on the Distribution of HouseholdIncome, Consumption and Wealth, OECD Publishing, Paris.
DOI: https://doi.org/10.1787/9789264194830-7-en
This work is published under the responsibility of the Secretary-General of the OECD. The opinions expressed and argumentsemployed herein do not necessarily reflect the official views of OECD member countries.
This document and any map included herein are without prejudice to the status of or sovereignty over any territory, to thedelimitation of international frontiers and boundaries and to the name of any territory, city or area.
You can copy, download or print OECD content for your own use, and you can include excerpts from OECD publications,databases and multimedia products in your own documents, presentations, blogs, websites and teaching materials, providedthat suitable acknowledgment of OECD as source and copyright owner is given. All requests for public or commercial use andtranslation rights should be submitted to [email protected]. Requests for permission to photocopy portions of this material forpublic or commercial use shall be addressed directly to the Copyright Clearance Center (CCC) at [email protected] or theCentre français d’exploitation du droit de copie (CFC) at [email protected].