Data Cleaning Procedures - OECD iLibrary
18
157 © OECD 2005 PISA 2003 Technical Report 11 Data Cleaning Procedures
-
Upload
khangminh22 -
Category
Documents
-
view
0 -
download
0
Transcript of Data Cleaning Procedures - OECD iLibrary
157© OECD 2005 PISA 2003 Technical Report
11
Data Cleaning Procedures

158
Dat
a C
lean
ing
Pro
cedu
res
© OECD 2005 PISA 2003 Technical Report
711
This chapter presents the data cleaning steps implemented during the main survey of PISA 2003.
DATA CLEANING AT THE NATIONAL CENTRE
National project managers (NPMs) were required to submit their national data in KeyQuest, the generic data entry package developed by consortium staff and pre-configured to include the data entry forms, referred to later as instruments: the achievement test booklets 1 to 13 (together making up the cognitive data); the Une Heure (UH) booklet; multiple-coding sheets; School Questionnaire and Student Questionnaire instruments with and without the two international options (the Information Communication Technology (ICT) questionnaire and the Educational Career questionnaires); the study programme table (SPT); the list of schools; and the student tracking forms.
The data were verified at several points starting at the time of data entry. Validation rules (or range checks) were specified for each variable defined in KeyQuest, and a datum was only accepted if it satisfied that validation rule.1 To prevent duplicate records, a set of variables assigned to an instrument were identified as primary keys. For the student test booklets, the stratum, school and student identifications were the primary keys.
Countries were requested to enter data into the student tracking form module before starting to enter data for tests or context questionnaires. This module, or instrument, contained the complete student identification, as it should have appeared on the booklet and the questionnaire that the student received at the testing session. When configured, KeyQuest instruments designed for student data were linked with the student tracking form so that warning messages appeared when data operators tried to enter invalid student identifiers or student identifiers that did not match a record in the form.
After the data entry process was completed, NPMs were required to implement some of the checking procedures implemented in KeyQuest before submitting data to the consortium, and to rectify any integrity errors. These included inconsistencies between: the list of schools and the School Questionnaire; the student tracking form and achievement test booklets; the student tracking form and the Student Questionnaire; the achievement test booklets; and the Student Questionnaire. Also, in the multiple-coding data they checked in order to detect instances of other than four duplicate coders per booklet.
NPMs were required to submit a questionnaire adaptation spreadsheet with their data, describing all changes they had made to variables of the questionnaire, including the additions or deletions of variables or response categories, and changes to the meaning of response categories. NPMs were also required to propose recoding rules where the national data did not match the international data.
DATA CLEANING AT THE INTERNATIONAL CENTRE
Data cleaning organisation
Data cleaning was a major component of the PISA 2003 quality control and assurance programme. It was of prime importance that the consortium detected all anomalies and inconsistencies in submitted data, and that no errors were introduced during the cleaning and analysis phases. To reach these high quality requirements, the consortium implemented dual independent processing.
Two data analysts developed the PISA 2003 data cleaning procedures independently from each other, one using the statistical software package SAS®, the other using SPSS®. At each step, the procedures were
Dat
a C
lean
ing
Pro
cedu
res
159© OECD 2005 PISA 2003 Technical Report
11
considered complete only when their application to a fictitious database and to the first two PISA databases received from countries produced identical results and files.
Three data-cleaning teams, each consisting of two data analysts, shared the work of producing the cleaned national databases. A team leader was nominated within each team and was the only individual to communicate with the national centres.
DATA CLEANING PROCEDURES
Because of the potential impact of PISA results and the scrutiny to which the data were likely to be put, it was essential that no dubious records remained in the data files. During cleaning, as many anomalies and inconsistencies as possible were identified, and through a process of extensive discussion between each national centre and the consortium’s data processing centre at ACER, an effort was made to correct and resolve all data issues. When no adequate solution was found, the contradictory data records were deleted.2
Unresolved inconsistencies in student and school identifications led to the deletion of records in the database. Unsolved systematic errors for a particular item were replaced by not applicable codes. For instance, if countries reported a mistranslation or misprint in the national version of a cognitive booklet, data for these variables were recoded as not applicable and were not used in the analyses. Finally, errors or inconsistencies for particular students and particular variables were replaced by not applicable codes.
National adaptations to the database
When data arrived at the consortium, the first step was to check the consistency of the database structure with the international database structure. An automated procedure was developed for this purpose. For each instrument the procedure identified deleted variables, added variables and modified variables – that is, variables for which the validation rules had been changed. This report was then compared with the information provided by the NPM in the questionnaire adaptation spreadsheet. Once all inconsistencies were resolved, the submitted data were recoded where necessary to fit the international structure. All additional or modified variables were set aside in a separate file so that countries could use these data for their own purposes, but they were not included in the international database.
Verifying the student tracking form and the list of schools
The student tracking form and the list of schools were central instruments because they contained the information used in computing weight, exclusion, and participation rates. The student tracking form contained all student identifiers, inclusion and participation codes, the booklet number assigned and some demographic data. The list of schools contained, among other variables, the PISA population size, the grade population size and the sample size.
These forms were submitted electronically. The data quality in these two forms and their consistency with the booklets and Student Questionnaire data were verified for:
• Consistency of inclusion codes and participation codes with the data in the test booklets and questionnaires;
• Consistency of the sampling information in the list of schools (i.e. target population size and the sample size) with the student tracking form;

160
Dat
a C
lean
ing
Pro
cedu
res
© OECD 2005 PISA 2003 Technical Report
711
• Accordance with required international procedures of within-school student sampling;
• Consistency of demographic information in the student tracking form (grade, date of birth and gender) with that in the booklets or questionnaires; and
• Consistency of students’ study programme code as listed on the student tracking form with codes in the student questionnaire and the study programme table.
Verifying the reliability data
Cleaning procedures were implemented to check the following components of the multiple-coding design (see Chapter 6):
• Number of records in the reliability files;
• Number of records in the reliability files and the corresponding booklets;
• Marker identification consistency;
• Marker design;
• Selection of the booklets for multiple coding; and
• Extreme inconsistencies in the marks given by different markers (see Chapter 14).3
Verifying the context questionnaire data
The Student Questionnaire and School Questionnaire data underwent further checks after the recoding of the national adaptations. Invalid or suspicious student and school data were reported to and discussed with countries. Four types of consistency checks were done:
• Non-valid sums: For example, question SCQ04 in the School Questionnaire requested the school principal to provide information as a percentage. The sum of the values had to be 100.
• Implausible values: Consistency checks across variables within instruments combined with the information of two or more questions to detect suspicious data. These checks included:
Computing ratios like numbers of students (SCQ02) and numbers of teachers (SCQ18), numbers of computers (SCQ09) and numbers of students (SCQ02). Outlying ratios were identified and countries were requested to check the validity of the numbers.
Comparing the mother’s completed education level in terms of the International Standard Classification of Education (ISCED, OECD, 1999b) categories for ISCED 3A (STQ11) and ISCED 5A or higher (STQ12). If the mother did not complete a certain ISCED level, she could not have completed 5A; and
Comparing the father’s completed education level similarly.
• Outliers: All approximately normally distributed numeric answers from the School Questionnaire were standardised, and outlier values (±3 standard deviations) were returned to national centres for checking.4
• Missing data confusion: Possible confusions between 8, 9, 98, 99, 998, 999, 90, 900 when they are valid codes and missing or invalid values were encountered during the data cleaning. Therefore, for all numerical variables, values close to the missing codes were returned to countries for verification.

Dat
a C
lean
ing
Pro
cedu
res
161© OECD 2005 PISA 2003 Technical Report
11
PREPARING FILES FOR ANALYSIS
For each PISA participating country, several files were prepared for use in the analysis:
• A raw cognitive file with all student responses to all items for the four domains before coding;
• A processed cognitive file with all student responses to all items for the four domains after coding;
• A student file with all data from the Student Questionnaire and the two international options;
• A school file with data from the School Questionnaire (one set of responses per school);
• Weighting files – two files with information from the student tracking form and the list of schools file necessary to compute the weights; and
• Reliability files – nine files with recoded student answers and nine files with scores, were prepared to facilitate the reliability analyses.
Processed cognitive fi le
For a number of items in the PISA test booklets, a student’s score on the item was determined by combining two or more of their responses. Most recoding required combining two answers into one or summarising the information from the complex multiple-choice items.
In the PISA test material, some of the open-ended mathematics and science items were coded with two digits, while all other items were coded with a single-digit mark. ConQuest, the software used to scale the cognitive data, requires items of the same length. To minimise the size of the data file, the double-digit items were recoded into one-digit variables using the first digit. All data produced through scoring, combining or recoding have a T added to their variable label.
For items omitted by students, embedded missing and non-reached missing items were differentiated. All consecutive missing values clustered at the end of each booklet were replaced by a non-reached code (r), except for the first value of the missing series. Embedded and non-reached missing items were then treated differently in the scaling.
Non-reached items for students who were reported to have left the session earlier than expected were considered not applicable in all analyses.
The Student Questionnaire
The student questionnaire file includes the data collected from the student questionnaire and the international options. If a country did not participate in the international options, not applicable codes were used for the omitted variables.
Father’s occupation, mother’s occupation and the student’s expected occupation at age 30, which were each originally coded using ISCO, were transformed into the International Socio-Economic Index of Occupational Status (ISEI) (Ganzeboom et al., 1992).
Question EC07 regarding school marks was provided in three formats: nominal, ordinal and numerical. The nominal option was used if the country provided data collected with question EC07b – that is, above or at the pass mark and below the pass mark. Data collected through question EC07a were coded into EC07b according to the pass marks provided by national centres. Some countries submitted data for EC07a

162
Dat
a C
lean
ing
Pro
cedu
res
© OECD 2005 PISA 2003 Technical Report
711
with ranges of 1-5, or 1-7 etc., while others reported student marks on a scale with maximum scores of 20 or 100. These data were recoded in categorical format if fewer than eight categories were provided (1-7) or in percentages if more than seven categories were provided.
Calculator use and effort variables from the cognitive booklets were added to the student questionnaire file. The school level variable SC07Q01 (instructional school weeks per school year for each study programme) was linked to the Student Questionnaire by their programme code.
The School Questionnaire
No modifications other than the correction of data errors, the addition of the country three-digit codes and the computation of school indices were made to the School Questionnaire file. All participating schools, i.e. any school for which at least one PISA-eligible student was assessed, have a record in the international database, regardless of whether or not they returned the School Questionnaire.
The weighting fi les
The weighting files contained the information from the student tracking form and from the list of schools. In addition, the following variables were computed and included in the weighting files.
• For each student, a participation indicator was computed. If the student participated in the cognitive session of the original or follow-up sessions, then the student is considered a participant. If the student only attended the student questionnaire session, then the student was not considered a participant.
• For each student, a scorable variable was computed. All eligible students who attended a test session are considered as scorable. Further, if a student only attended the Student Questionnaire session and provided data for the father’s or mother’s occupation questions, then the student was also considered scorable. Therefore, an indicator was also computed to determine whether the student answered the father’s or mother’s occupation questions.
A few countries submitted data with a grade national option. Therefore, two eligibility variables – PISA-eligible and grade-eligible – were also included in the student tracking form. These new variables were also used to select the records that were included in the international database, and therefore in the cognitive file and Student Questionnaire file. To be included in the international database, the student had to be both PISA-eligible and scorable. PISA students reported in the student tracking form as not eligible, no longer at school, excluded for physical, mental, or linguistic reasons, or absent, as well as students who had refused to participate in the assessment, were not included in the international database.
All non-PISA students, i.e. students assessed in a few countries for a national or international grade sample option, were excluded from the international database. When countries submitted such data to the consortium it was processed and the results and clean data were returned separately to the national centres.
The reliability fi les
One file was created for each domain and test booklet. The data from the reliability booklets were merged with those in the test booklets so that each student selected for the multiple-coding process appears four times in these files.
Dat
a C
lean
ing
Pro
cedu
res
163© OECD 2005 PISA 2003 Technical Report
11
Notes
1 National centres could modify the configuration of the variables, giving a range of values that was sometimes reduced or extended from the one originally specified by the Consortium.
2 Record deletion was strenuously avoided as it decreased the participation rate.
3 For example, some markers reported a missing value while others reported non-zero scores.
4 The questions checked in this manner were school size (SCQ02), instructional time (SCQ07), number of computers (SCQ09), number of teachers (SCQ18 and SCQ19), number of hours per week spent on homework (STQ29), class size (STQ36) and school marks (ECQ07).

Rea
ders
’ G
uide
13© OECD 2005 PISA 2003 Technical Report
READER’S GUIDE
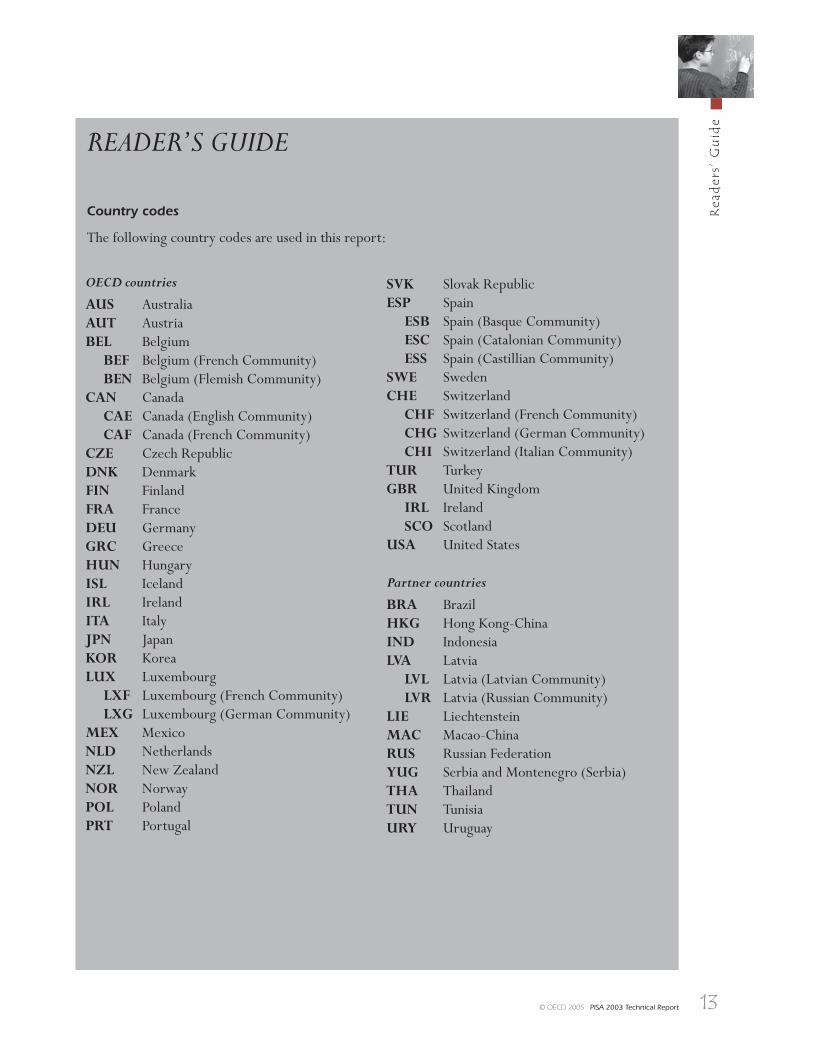
Country codes
The following country codes are used in this report:
OECD countries
AUS Australia AUT AustriaBEL Belgium BEF Belgium (French Community) BEN Belgium (Flemish Community)CAN Canada CAE Canada (English Community) CAF Canada (French Community)CZE Czech RepublicDNK Denmark FIN FinlandFRA FranceDEU GermanyGRC GreeceHUN HungaryISL IcelandIRL IrelandITA ItalyJPN Japan KOR KoreaLUX Luxembourg LXF Luxembourg (French Community) LXG Luxembourg (German Community)MEX MexicoNLD NetherlandsNZL New ZealandNOR NorwayPOL PolandPRT Portugal
SVK Slovak RepublicESP Spain ESB Spain (Basque Community) ESC Spain (Catalonian Community) ESS Spain (Castillian Community)SWE SwedenCHE Switzerland CHF Switzerland (French Community) CHG Switzerland (German Community) CHI Switzerland (Italian Community)TUR TurkeyGBR United Kingdom IRL Ireland SCO Scotland USA United States
Partner countries
BRA BrazilHKG Hong Kong-ChinaIND IndonesiaLVA Latvia LVL Latvia (Latvian Community) LVR Latvia (Russian Community)LIE LiechtensteinMAC Macao-ChinaRUS Russian FederationYUG Serbia and Montenegro (Serbia)THA ThailandTUN TunisiaURY Uruguay

14
Rea
ders
’ G
uide
© OECD 2005 PISA 2003 Technical Report
List of abbreviations
The following abbreviations are used in this report:
NDP National Desired PopulationNEP National Enrolled PopulationNFI Normed Fit IndexNIER National Institute for Educational
Research, JapanNNFI Non-Normed Fit IndexNPM National Project ManagerOECD Organisation for Economic
Cooperation and DevelopmentPISA Programme for International Student
AssessmentPPS Probability Proportional to SizePGB PISA Governing BoardPQM PISA Quality MonitorPSU Primary Sampling UnitsQAS Questionnaire Adaptations
SpreadsheetRMSEA Root Mean Square Error of
ApproximationRN Random NumberSC School Co-ordinatorSD Standard DeviationSEM Structural Equation ModellingSMEG Subject Matter Expert GroupSPT Study Programme TableTA Test AdministratorTAG Technical Advisory GroupTCS Target Cluster SizeTIMSS Third International Mathematics and
Science StudyTIMSS-R Third International Mathematics and
Science Study – RepeatVENR Enrolment for very small schoolsWLE Weighted Likelihood Estimates
ACER Australian Council for Educational Research
AGFI Adjusted Goodness-of-Fit IndexBRR Balanced Repeated ReplicationCFA Confirmatory Factor AnalysisCFI Comparative Fit IndexCITO National Institute for Educational
Measurement, The NetherlandsCIVED Civic Education StudyDIF Differential Item FunctioningESCS Economic, Social and Cultural StatusENR Enrolment of 15-year-oldsETS Educational Testing ServiceIAEP International Assessment of
Educational ProgressI Sampling IntervalICR Inter-Country Coder Reliability
StudyICT Information Communication
TechnologyIEA International Association for
the Evaluation of Educational Achievement
INES OECD Indicators of Education Systems
IRT Item Response TheoryISCED International Standard Classification
of EducationISCO International Standard Classification
of OccupationsISEI International Socio-Economic IndexMENR Enrolment for moderately small
schoolMOS Measure of sizeNCQM National Centre Quality Monitor

Ref
eren
ces
329© OECD 2005 PISA 2003 Technical Report
ReferencesAdams, R.J., Wilson, M.R. and W. Wang (1997), “The multidimensional random coefficients multinomial logit model”, Applied Psychological Measurement 21, pp. 1-24.
Aiken, L. R. (1974), “Two scales of attitudes toward mathematics,” Journal for Research in Mathematics Education 5, National Council of Teachers of Mathematics, Reston, pp. 67-71.
Andersen, Erling B. (1997), “The Rating Scale Model”, in van der Linden, W. J. and R.K. Hambleton (eds.), Handbook of Modern Item Response Theory, Springer, New York/Berlin/Heidelberg.
Bandura, A. (1986), Social Foundations of Thought and Action: A Social Cognitive Theory, Prentice Hall, Englewood Cliffs, N.J.
Baumert, J. and O. Köller (1998), “Interest Research in Secondary Level I : An Overview”, in L. Hoffmann, A. Krapp, K.A. Renninger & J. Baumert (eds.), Interest and Learning, IPN, Kiel.
Beaton, A.E. (1987), Implementing the New Design: The NAEP 1983-84 Technical Report (Report No. 15-TR-20), Educational Testing Service, Princeton, N.J.
Bryk, A. S. and S.W. Raudenbush (1992), Hierarchical Linear Models: Applications and Data Analysis Methods, SAGE Publications, Newbury Park.
Bollen, K.A. and S.J. Long (eds.) (1993), Testing Structural Equation Models, SAGE publications, Newbury Park.
Branden, N. (1994), Six Pillars of Self-Esteem. Bantam, New York.
Brennan, R.L. (1992), Elements of Generalizability Theory, American College Testing Program, Iowa City.
Buchmann, C. (2000), Measuring Family Background in International Studies of Educational Achievement: Conceptual Issues and Methodological Challenges, paper presented at a symposium convened by the Board on International Comparative Studies in Education of the National Academy of Sciences/National Research Council on 1 November, in Washington, D.C.
Cochran, W.G. (1977), Sampling Techniques (3rd edition), Wiley, New York.
Cronbach, L.J., G.C. Gleser, H. Nanda and N. Rajaratnam (1972), The Dependability of Behavioral Measurements: Theory of Generalizability for Scores and Profi les, Wiley and Sons, New York.
Eccles, J.S. (1994), “Understanding Women’s Educational and Occupational choice: Applying the Eccles et al. Model of Achievement-Related Choices”, Psychology of Women Quarterly 18, Society for the Psychology of Women, Washington, D.C., pp. 585-609.

330
Ref
eren
ces
© OECD 2005 PISA 2003 Technical Report
Eccles, J.S. and A. Wigfield (1995), “In the mind of the achiever: The structure of adolescents’ academic achievement-related beliefs and self-perceptions”, Personality and Social Psychology Bulletin 21, Sage Publications, Thousand Oaks, pp. 215-225.
Ganzeboom, H.B.G., P.M. de Graaf and D.J. Treiman (1992), “A standard international socio-economic index of occupational status”, Social Science Research 21, Elsevier, pp.1-56.
Gifi, A. (1990), Nonlinear Multivariate Analysis, Wiley, New York.
Greenacre, M.J. (1984), Theory and Applications of Correspondence Analysis, Academic Press, London.
Grisay, A. (2003), “Translation procedures in OECD/PISA 2000 international assessment”, Language Testing 20, Holder Arnold Journals, pp.225-240.
Gustafsson, J.E and P.A. Stahl (2000), STREAMS User’s Guide, Version 2.5 for Windows, MultivariateWare, Mölndal, Sweden.
Hacket, G. and N. Betz. (1989), “An Exploration of the mathematics Efficacy/mathematics Performance Correspondence”, Journal of Research in Mathematics Education 20, National Council of Teachers of Mathematics, Reston, pp. 261-273.
Harvey-Beavis, A. (2002), “Student and Questionnaire Development” in OECD, PISA 2000 Technical Report, OECD, Paris.
Hatcher, L. (1994), A Step-by-Step Approach to Using the SAS System for Factor Analysis and Structural Equation Modeling, SAS Institute Inc., Cary.
International Labour Organisation (1990), International Standard Classifi cation of Occupations: ISCO-88, International Labour Office, Geneva.
Jöreskog, K.G. and Dag Sörbom (1993), LISREL 8 User’s Reference Guide, Scientific Software International, Chicago.
Judkins, D.R. (1990), “Fay’s Method for Variance Estimation”, Journal of Offi cial Statistics 6, Statistics Sweden, Stockholm, pp. 223-239.
Kaplan, D. (2000), Structural Equation Modeling: Foundation and Extensions, SAGE Publications, Thousand Oaks.
Keyfitz, N. (1951), “Sampling with probabilities proportionate to science: Adjustment for changes in probabilities”, Journal of the American Statistical Association 46, American Statistical Association, Alexandria, pp.105-109.
Lepper, M. R. (1988), “Motivational considerations in the study of instruction”, Cognition and Instruction 5, Lawrence Erlbaum Associates, Mahwah, pp. 289-309.
Ma, X. (1999), “A Meta-Analysis of the Relationship Between Anxiety Toward mathematics and Achievement in mathematics”, Journal for Research in Mathematics Education 30, National Council of Teachers of Mathematics, Reston, pp. 520-540.

Ref
eren
ces
331© OECD 2005 PISA 2003 Technical Report
Macaskill, G., R.J. Adams and M.L. Wu (1998), “Scaling methodology and procedures for the mathematics and science literacy, advanced mathematics and physics scales”, in M. Martin and D.L. Kelly (eds.) Third International Mathematics and Science Study, Technical Report Volume 3: Implementation and Analysis, Center for the Study of Testing, Evaluation and Educational Policy, Boston College, Chestnut Hill.
Marsh, H. W. (1990), Self-Description Questionnaire (SDQ) II: A theoretical and Empirical Basis for the Measurement Of Multiple Dimensions of Adolescent Self-Concept: An Interim Test Manual and a Research Monograph, The Psychological Corporation, San Antonio.
Marsh, H. W. (1994), “Confirmatory factor analysis models of factorial invariance: A multifaceted approach” Structural Equation Modeling 1, Lawrence Erlbaum Associates, Mahwah, pp. 5-34.
Marsh, H. W. (1999), Evaluation of the Big-Two-Factor Theory of Motivation Orientation: Higher-order Factor Models and Age-related Changes, paper presented at the 31.62 Symposium, Multiple Dimensions of Academic Self-Concept, Frames of Reference, Transitions, and International Perspectives: Studies From the SELF Research Centre. Sydney: University of Western Sydney.
Masters, G. N. and B. D. Wright (1997), “The Partial Credit Model”, in W. J. van der Linden and R.K. Hambleton (eds.), Handbook of Modern Item Response Theory, Springer, New York/Berlin/Heidelberg.
Meece, J., A. Wigfield and J. Eccles (1990), “Predictors of Maths Anxiety and its Influence on Young Adolescents’ Course Enrolment and Performance in Mathematics”, Journal of Educational Psychology 82, American Psychological Association, Washington, D.C., pp. 60-70.
Middleton, J.A. and P.A. Spanias (1999), “Findings, Generalizations, and Criticisms of the Research”, Journal for Research in Mathematics Education 30, National Council of Teachers of Mathematics, Reston, pp. 65-88.
Mislevy, R.J. (1991), “Randomization-based inference about latent variable from complex samples”, Psychometrika 56, Psychometric Society, Greensboro, pp. 177-196.
Mislevy, R.J. and K.M. Sheehan (1987), “Marginal estimation procedures”, in A.E. Beaton (ed.), The NAEP 1983-1984 Technical Report (Report No. 15-TR-20), Educational Testing Service, Princeton, N.J.
Mislevy, R.J. and K.M. Sheehan (1980), “Information matrices in latent-variable models”, Journal of Educational Statistics 14.4, American Educational Research Association and American Statistical Association, Washington, D.C., and Alexandria, pp. 335-350.
Mislevy, R.J., A.E. Beaton, B. Kaplan and K.M. Sheehan. (1992), “Estimating population characteristics form sparse matrix samples of item responses”, Journal of Educational Measurement 29, National Council on Measurement in Education, Washington, D.C., pp. 133-161.
Multon, K. D., S. D. Brown and R.W. Lent (1991), “Relation of self-efficacy beliefs to academic outcomes: A meta-analytic investigation”, Journal of Counselling Psychology 38, American Psychological Association, Washington, D.C., pp. 30-38.
Muthén, B. O., S. H. C. du Toit and D. Spisic (1997), “Robust inference using weighted least squares and quadratic estimating equations in latent variable modeling with categorical outcomes”, Psychometrika, Psychometric Society, Greensboro.

332
Ref
eren
ces
© OECD 2005 PISA 2003 Technical Report
Muthen, L. and B. Muthen (2003), Mplus User’s Guide Version 3.1, Muthen & Muthen, Los Angeles.
Nishisato, S. (1980), Analysis of Categorical Data: Dual Scaling and its Applications, University of Toronto Press, Toronto.
OECD (Organisation for Economic Co-Operation and Development) (1999), Classifying Educational Programmes: Manual for ISCED-97 Implementation in OECD Countries, OECD, Paris.
OECD (2001), Knowledge and Skills for Life: First Results from PISA 2000, OECD, Paris.
OECD (2002), PISA 2000 Technical Report, OECD, Paris.
OECD (2003), Student Engagement at School: A Sense of Belonging and Participation: Results from PISA 2000, OECD, Paris.
OECD (2004a), The PISA 2003 Assessment Framework: Mathematics, Reading, Science and Problem Solving Knowledge and Skills, OCED, Paris.
OECD (2004b), Learning for Tomorrow’s World – First Results from PISA 2003, OECD, Paris.
OECD (2004c), Problem Solving for Tomorrow’s World – First Measures of Cross-Curricular Competencies from PISA 2003, OECD, Paris.
OECD (2005a), PISA 2003 Data Analysis Manual: SAS® Users, OECD, Paris.
OECD (2005b), PISA 2003 Data Analysis Manual: SPSS® Users, OECD, Paris.
Owens L. and J. Barnes (1992), Learning Preference Scales, Australian Council for Educational Research, Hawthorn.
Rasch, G. (1960), Probabilistic models for some intelligence and attainment tests, Nielsen and Lydiche, Copenhagen.
Rust, K. (1985), “Variance estimation for complex estimators in sample surveys”, Journal of Offi cial Statistics 1, Statistics Sweden, Stockholm, pp. 381-397.
Rust, K. and J.N.K. Rao (1996), “Variance estimation for complex surveys using replication techniques”, Statistical Methods in Medical Research 5, Holder Arnold Journals, pp. 283-310.
Sändal, C.E., B. Swensson and J. Wretman (1992), Model Assisted Survey Sampling, Springer-Verlag, New York.
Schaffer, E. C., P. S. Nesselrodt and S. Stringfield (1994), “The Contribution of Classroom Observation to School Effectiveness Research” in Reynolds et. al. (eds.), Advances in School Effectiveness Research and Practice, Pergamon, Oxford/New York/Tokyo.
Schulz, W. (2003), Validating Questionnaire Constructs in International Studies. Two Examples from PISA 2000, paper presented at the Annual Meeting of the American Educational Research Association (AERA) in Chicago, 21-25 April.

Ref
eren
ces
333© OECD 2005 PISA 2003 Technical Report
Schulz, W. (2004), “Mapping Student Scores to Item Responses”, in W. Schulz and H. Sibberns (eds.), IEA Civic Education Study. Technical Report, IEA, Amsterdam.
Sirotnik, K. (1970), “An analysis of variance framework for matrix sampling”, Educational and Psychological Measurement 30, SAGE Publications, pp. 891-908.
Slavin, R. E. (1983), “When does cooperative learning increase student achievement?” Psychological Bulletin 94, American Psychological Association, Washington, D.C., pp. 429-445.
Statistical Solutions (1992), BMDP Statistical Software, Statistical Solutions, Los Angeles.
Teddlie, C. and D. Reynolds (2000) (eds.), The International Handbook of School Effectiveness Research, Falmer Press, London/New York.
Thorndike, R.L. (1973), Reading Comprehension Education in Fifteen Countries: An Empirical Study, Almquist & Wiksell, Stockholm.
Travers, K. J., R.A. Garden and M. Rosier (1989), “Introduction to the Study”, in D.A. Robitaille and R.A. Garden (eds.), The IEA Study of Mathematics II: Contexts and Outcomes of School Mathematics Curricula, Pergamon Press, Oxford.
Travers, K. J. and I. Westbury (1989), The IEA Study of Mathematics I: Analysis of Mathematics Curricula, Pergamon Press, Oxford.
Verhelst, N. (2004), “Generalizability Theory”, in Council of Europe, Reference Supplement to the Preliminary Pilot version of the Manual for Relating Language Examinations to the Common European Framework of Reference for Languages: Learning, Teaching, Assessment, (Section E), Council of Europe (DGIV/EDU/LANG (2004) 13), Strasbourg.
Warm, T. A. (1989), “Weighted Likelihood Estimation of Ability in Item Response Theory”, Psychometrika 54, Psychometric Society, Greensboro, pp. 427-45.
Wigfield, A., J. S. Eccles and D. Rodriguez (1998), “The development of children’s motivation in school contexts”, in P. D. Pearson. and A. Iran-Nejad (eds.), Review of Research in Education 23, American Educational Research Association, Washington D.C., pp. 73-118.
Wilson, M. (1994), “Comparing Attitude Across Different Cultures: Two Quantitative Approaches to Construct Validity”, in M. Wilson (ed.), Objective Measurement II: Theory into Practice, Ablex, Norwood, pp. 271-292.
Wolter, K.M. (1985), Introduction to Variance Estimation, Springer-Verlag, New York.
Wu, M.L., R.J. Adams and M.R. Wilson (1997), ConQuest: Multi-Aspect Test Software [computer program], Australian Council for Education Research, Camberwell.
Zimmerman, B.J. and D.H. Schunk (eds.) (1989), Self-Regulated Learning and Academic Achievement. Theory, Research and Practice, Springer, New York.
Tabl
e o
f C
on
ten
ts
5© OECD 2005 PISA 2003 Technical Report
Table of Contents
Foreword ............................................................................................................ 3
Chapter 1. The Programme for International Student Assessment: An overview ........................ 7
Reader’s Guide ...........................................................................................................13
Chapter 2. Test design and test development ..................................................................15
Chapter 3. The development of the PISA context questionnaires ..........................................33
Chapter 4. Sample design .........................................................................................45
Chapter 5. Translation and cultural appropriateness of the test and survey material ...................67
Chapter 6. Field operations .......................................................................................81
Chapter 7. Monitoring the quality of PISA ................................................................... 101
Chapter 8. Survey weighting and the calculation of sampling variance .................................. 107
Chapter 9. Scaling PISA cognitive data ........................................................................ 119
Chapter 10. Coding reliability studies .......................................................................... 135
Chapter 11. Data cleaning procedures .......................................................................... 157
Chapter 12. Sampling outcomes ................................................................................. 165
Chapter 13. Scaling outcomes ................................................................................... 185
Chapter 14. Outcomes of coder reliability studies ........................................................... 217
Chapter 15. Data adjudication ................................................................................... 235
Chapter 16. Proficiency scale construction .................................................................... 249
Chapter 17. Scaling procedures and construct validation of context questionnaire data ............... 271
Chapter 18. International database .............................................................................. 321
References ......................................................................................................... 329

6
Tabl
e o
f C
on
ten
ts
© OECD 2005 PISA 2003 Technical Report
Appendix 1. Sampling forms ..................................................................................... 335
Appendix 2. PISA consortium and consultants ................................................................ 349
Appendix 3. Country means and ranks by booklet ............................................................ 353
Appendix 4. Item submission guidelines for mathematics – PISA 2003 ................................... 359
Appendix 5. Item review guidelines ............................................................................. 379
Appendix 6. ISCED adaptations for partner countries ....................................................... 383
Appendix 7. Fictitious example of study programme table (SPT) .......................................... 389
Appendix 8. Fictitious example of questionnaire adaptation spreadsheet (QAS) ........................ 391
Appendix 9. Summary of quality monitoring outcomes ..................................................... 393
Appendix 10. Contrast coding for PISA 2003 conditioning variables ....................................... 401
Appendix 11. Scale reliabilities by country ...................................................................... 409
Appendix 12. Details of the mathematics items used in PISA 2003 ......................................... 411
Appendix 13. Details of the reading items used in PISA 2003 ................................................ 415
Appendix 14. Details of the science items used in PISA 2003 ................................................ 417
Appendix 15. Details of the problem-solving items used in PISA 2003 ..................................... 419
Appendix 16. Levels of parental education converted into years of schooling ............................. 421
Appendix 17. Student listing form ................................................................................ 423

From:PISA 2003 Technical Report
Access the complete publication at:https://doi.org/10.1787/9789264010543-en
Please cite this chapter as:
OECD (2006), “Data Cleaning Procedures”, in PISA 2003 Technical Report, OECD Publishing, Paris.
DOI: https://doi.org/10.1787/9789264010543-12-en
This work is published under the responsibility of the Secretary-General of the OECD. The opinions expressed and argumentsemployed herein do not necessarily reflect the official views of OECD member countries.
This document and any map included herein are without prejudice to the status of or sovereignty over any territory, to thedelimitation of international frontiers and boundaries and to the name of any territory, city or area.
You can copy, download or print OECD content for your own use, and you can include excerpts from OECD publications,databases and multimedia products in your own documents, presentations, blogs, websites and teaching materials, providedthat suitable acknowledgment of OECD as source and copyright owner is given. All requests for public or commercial use andtranslation rights should be submitted to [email protected]. Requests for permission to photocopy portions of this material forpublic or commercial use shall be addressed directly to the Copyright Clearance Center (CCC) at [email protected] or theCentre français d’exploitation du droit de copie (CFC) at [email protected].