Entrepreneurship at a Glance 2013 - OECD iLibrary
108
Entrepreneurship at a Glance 2013
-
Upload
khangminh22 -
Category
Documents
-
view
0 -
download
0
Transcript of Entrepreneurship at a Glance 2013 - OECD iLibrary

Entrepreneurship at a Glance 2013
Consult this publication on line at http://dx.doi.org/10.1787/entrepreneur_aag-2013-en.
This work is published on the OECD iLibrary, which gathers all OECD books, periodicals and statistical databases.Visit www.oecd-ilibrary.org for more information.
Entrep
reneu
rship
at a Glance 2013
2013
Entrepreneurship at a Glance 2013Entrepreneurship at a Glance, a product of the OECD-Eurostat Entrepreneurship Indicators Programme, presents an original collection of indicators for measuring the state of entrepreneurship, along with key facts and explanations of the policy context. This third issue features a special chapter on the profile of the entrepreneur, as well as longer time series and breakdowns by sector for the main indicators.
Contents
Executive summary
Recent developments in entrepreneurship
Structural indicators on enterprise population
Enterprise birth, death and survival
Enterprise growth and employment creation
The profile of the entrepreneur
Determinants of entrepreneurship: Selected indicators
isbn 978-92-64-18385-8 30 2013 01 1 P -:HSTCQE=V]X]Z]:
302013011cov.indd 1 01-Jul-2013 3:21:13 PM


Entrepreneurshipat a Glance
2013

This work is published on the responsibility of the Secretary-General of the OECD. The
opinions expressed and arguments employed herein do not necessarily reflect the official
views of the Organisation or of the governments of its member countries.
This document and any map included herein are without prejudice to the status of or
sovereignty over any territory, to the delimitation of international frontiers and boundaries
and to the name of any territory, city or area.
ISBN 978-92-64-18385-8 (print)ISBN 978-92-64-19178-5 (HTML)
Periodical: Entrepreneurship at a GlanceISSN 2226-6933 (print)ISSN 2226-6941 (online)
The statistical data for Israel are supplied by and under the responsibility of the relevant Israeli authorities. The useof such data by the OECD is without prejudice to the status of the Golan Heights, East Jerusalem and Israelisettlements in the West Bank under the terms of international law.
Photo credits: Cover: © Jacques Ferrier architectures/image Ferrier Production. “Concept Office, immeuble de bureauxprototype à haute qualité environnementale conçu par Jacques Ferrier Architectures en partenariat avec EDF”.Chapters : © Philippe Mairesse / Devizu.
Corrigenda to OECD publications may be found on line at: www.oecd.org/publishing/corrigenda.
© OECD 2013
You can copy, download or print OECD content for your own use, and you can include excerpts from OECD publications, databases and
multimedia products in your own documents, presentations, blogs, websites and teaching materials, provided that suitable
acknowledgment of the source and copyright owner is given. All requests for public or commercial use and translation rights should be
submitted to [email protected]. Requests for permission to photocopy portions of this material for public or commercial use shall be
addressed directly to the Copyright Clearance Center (CCC) at [email protected] or the Centre français d'exploitation du droit de copie
(CFC) at [email protected].
Please cite this publication as:OECD (2013), Entrepreneurship at a Glance, OECD Publishing.http://dx.doi.org/10.1787/entrepreneur_aag-2013-en

FOREWORD
Foreword
Entrepreneurship at a Glance presents key indicators on entrepreneurship. Until recently, most
entrepreneurship research relied on ad hoc data compilations developed to support specific projects
and virtually no official statistics on the subject existed. The collection of harmonised indicators
presented in this publication is the result of the OECD-Eurostat Entrepreneurship Indicators
Programme (EIP). The programme, started in 2006, is the first attempt to compile and publish
international data on entrepreneurship from official government statistical sources. Indeed, to meet
the challenge of providing new entrepreneurship indicators, while minimising costs for national
statistical offices and burden on business, the programme focuses attention on exploiting existing
sources of data instead of developing new business surveys. Statistical business registers form the
basis for the compilation of the key EIP indicators, such as enterprise birth and death rates.
Informing policy design through the development of policy-relevant indicators is at the core of
the EIP programme, and much attention is paid to responding to information needs. In particular, the
global financial crisis has highlighted the need for more timely information on the situation of small
businesses. To that purpose, Entrepreneurship at a Glance henceforth features an opening section
on recent trends in entrepreneurship, discussing new data on firm creations and bankruptcies, based
on different national sources and non-harmonised definitions; for this reason, a different
nomenclature is used for these data: “creations” instead of “births”, and “bankruptcies” instead of
“deaths”. The publication also includes new information on trends and characteristics of
entrepreneurs, based on self-employment data. Finally, this issue presents longer time series for the
main indicators, to provide a temporal perspective; more breakdowns by sector, to illustrate the
diversity of patterns; and simple correlations between indicators, to assist the interpretation of
results.
The publication was prepared under the co-ordination of Mariarosa Lunati in the Trade and
Competitiveness Statistics Division of the OECD Statistics Directorate with contributions by Mario
Piacentini, Blandine Serve, Gueram Sargsyan, Young-tae Son and Bernice Bray. The publication
benefited from comments by Nadim Ahmad and Elif Koksal-Oudot. Particular thanks go to Manfred
Schmiemann, Aleksandra Stawinska and Elisaveta Ushilova of Eurostat and to experts in National
Statistical Offices who contributed data and time to produce the original indicators for Australia,
Austria, Belgium, Brazil, Bulgaria, Canada, the Czech Republic, Denmark, Estonia, Finland, France,
Germany, Hungary, Israel, Italy, Japan, Korea, Latvia, Lithuania, Luxembourg, Mexico, the
Netherlands, New Zealand, Norway, Poland, Portugal, Romania, the Russian Federation, the Slovak
Republic, Slovenia, Spain, Sweden, Switzerland and the United States.
ENTREPRENEURSHIP AT A GLANCE 2013 © OECD 2013 3


TABLE OF CONTENTS
Table of contents
Executive summary . . . . . . . . . . . . . . . . . . . . . . . . . . . . . . . . . . . . . . . . . . . . . . . . . . . . . . . . . 7
Reader’s guide . . . . . . . . . . . . . . . . . . . . . . . . . . . . . . . . . . . . . . . . . . . . . . . . . . . . . . . . . . . . . 9
Chapter 1. Recent developments in entrepreneurship . . . . . . . . . . . . . . . . . . . . . . . . . . . . 15
New enterprise creations. . . . . . . . . . . . . . . . . . . . . . . . . . . . . . . . . . . . . . . . . . . . . . . . . 16
Bankruptcies . . . . . . . . . . . . . . . . . . . . . . . . . . . . . . . . . . . . . . . . . . . . . . . . . . . . . . . . . . . 18
Self-employment rates. . . . . . . . . . . . . . . . . . . . . . . . . . . . . . . . . . . . . . . . . . . . . . . . . . . 20
Chapter 2. Structural indicators on enterprise population . . . . . . . . . . . . . . . . . . . . . . . . 23
Enterprises by size class . . . . . . . . . . . . . . . . . . . . . . . . . . . . . . . . . . . . . . . . . . . . . . . . . 24
Employment by size class . . . . . . . . . . . . . . . . . . . . . . . . . . . . . . . . . . . . . . . . . . . . . . . . 28
Value added by size class. . . . . . . . . . . . . . . . . . . . . . . . . . . . . . . . . . . . . . . . . . . . . . . . . 32
Productivity by enterprise size class . . . . . . . . . . . . . . . . . . . . . . . . . . . . . . . . . . . . . . . 34
Exports by enterprise size class . . . . . . . . . . . . . . . . . . . . . . . . . . . . . . . . . . . . . . . . . . . 36
Chapter 3. Enterprise birth, death and survival . . . . . . . . . . . . . . . . . . . . . . . . . . . . . . . . . . 39
Birth rate of employer enterprises . . . . . . . . . . . . . . . . . . . . . . . . . . . . . . . . . . . . . . . . . 40
Death rate of employer enterprises . . . . . . . . . . . . . . . . . . . . . . . . . . . . . . . . . . . . . . . . 44
Churn rate of employer enterprises . . . . . . . . . . . . . . . . . . . . . . . . . . . . . . . . . . . . . . . . 48
Survival rate of employer enterprises . . . . . . . . . . . . . . . . . . . . . . . . . . . . . . . . . . . . . . 50
Chapter 4. Enterprise growth and employment creation . . . . . . . . . . . . . . . . . . . . . . . . . . 55
Employment creation and destruction by employer enterprise births and deaths 56
Employment creation and destruction in surviving enterprises . . . . . . . . . . . . . . . . 58
High-growth enterprises rate . . . . . . . . . . . . . . . . . . . . . . . . . . . . . . . . . . . . . . . . . . . . . 60
Gazelles rate . . . . . . . . . . . . . . . . . . . . . . . . . . . . . . . . . . . . . . . . . . . . . . . . . . . . . . . . . . . 62
Chapter 5. The profile of the entrepreneur . . . . . . . . . . . . . . . . . . . . . . . . . . . . . . . . . . . . . . 65
Gender differences in self-employment rates . . . . . . . . . . . . . . . . . . . . . . . . . . . . . . . 66
Self-employment among the youth and seniors . . . . . . . . . . . . . . . . . . . . . . . . . . . . . 70
Self-employment rates of migrants . . . . . . . . . . . . . . . . . . . . . . . . . . . . . . . . . . . . . . . . 72
Earnings from self-employment. . . . . . . . . . . . . . . . . . . . . . . . . . . . . . . . . . . . . . . . . . . 76
Preferences and feasibility of self-employment. . . . . . . . . . . . . . . . . . . . . . . . . . . . . . 78
Chapter 6. Determinants of entrepreneurship: selected indicators . . . . . . . . . . . . . . . . . 81
Culture: The role of entrepreneurship education. . . . . . . . . . . . . . . . . . . . . . . . . . . . . 82
Culture: Attitude toward failure . . . . . . . . . . . . . . . . . . . . . . . . . . . . . . . . . . . . . . . . . . . 84
Access to finance: Venture capital . . . . . . . . . . . . . . . . . . . . . . . . . . . . . . . . . . . . . . . . . 88
Annex A. Sources of data on timely indicators of entrepreneurship. . . . . . . . . . . . . . . . 93
Annex B. List of indicators of entrepreneurial determinants . . . . . . . . . . . . . . . . . . . . . . 96
Annex C. International comparability of venture capital data . . . . . . . . . . . . . . . . . . . . . 101
ENTREPRENEURSHIP AT A GLANCE 2013 © OECD 2013 5

Look for the StatLinks2at the bottom of the tables or graphs in this book.
To download the matching Excel® spreadsheet, just type the link into your
Internet browser, starting with the http://dx.doi.org prefix, or click on the link from
the e-book edition.
Follow OECD Publications on:
This book has... StatLinks2A service that delivers Excel files from the printed page! ®
http://twitter.com/OECD_Pubs
http://www.facebook.com/OECDPublications
http://www.linkedin.com/groups/OECD-Publications-4645871
http://www.youtube.com/oecdilibrary
http://www.oecd.org/oecddirect/ OECD
Alerts

Entrepreneurship at a Glance 2013
© OECD 2013
Executive summary
The global financial and economic crisis has increased attention on entrepreneurship.
Entrepreneurship and entrepreneurs have long been recognised as important sources of
innovation, and thereby also of growth and employment. The recent crisis, characterised
by tighter credit restrictions, has arguably hampered new start-ups and impeded growth in
existing start-ups as well as their ability to survive in tough market conditions. The
significant rise in business closures, especially of micro and small enterprises, in recent
years, bears stark witness to these difficult conditions and highlights the need for statistics
on entrepreneurship that can support policy makers. Entrepreneurship at a Glance contains a
wide range of internationally comparable measures of entrepreneurship designed to meet
this need.
Start-up rates remain below the pre-crisis levels in many countries, particularly in the Euro
area. There are tentative signs of improvements in some economies, notably Australia and
the United Kingdom, but these are, to varying degrees, mirrored by higher failure rates.
Moreover, a not insignificant factor behind the pick-up in start-ups has been an increase in
own-account workers, which may indicate adjustment strategies rather than
entrepreneurialism.
Fewer enterprises had stellar growth during the crisis. The share of high-growth enterprises
fell to between 2.0% and 4.0% in 2010, consistently below levels seen (between 3.5% and
6.0%) in 2006 in virtually all OECD countries.
But attitudes toward business failures have become more positive. The crisis appears to have
raised awareness of the importance of entrepreneurs to growth and employment but also
appears to have removed the stigma associated with failure. Increasingly, the public at
large recognise the importance that entrepreneurs who fail should be given a “second
chance”.
Young people are more optimistic about the possibility of setting up a business in the nearfuture, even though the actual rate of entrepreneurship among the youth is, on average, a
low 4.0%.
Gender differences remain important. Women consistently rate self-employment as being
less feasible than men; self-employed women earn 35% on average less than men across
countries and the gaps are wider than those observed in wage employment, which are of
15% on average.
Entrepreneurialism in the education curriculum counts. Perceptions of the role that school
education has in helping develop a sense of entrepreneurial spirit vary significantly across
countries. In Brazil, Norway and Portugal more than 75% of adults acknowledge the role
played by school education, while in Japan less than 20% do. In many countries however,
7

EXECUTIVE SUMMARY
the perception of school education as fostering entrepreneurial spirit is sensibly higher
than its perceived role in giving enabling skills to run a business.
Entrepreneurship is a complex phenomenon. The set of cross-country comparable
indicators proposed by Entrepreneurship at a Glance sheds light on different aspects and
determinants of entrepreneurial activities and enables evidence-based policy making in
this field.
ENTREPRENEURSHIP AT A GLANCE 2013 © OECD 20138

READER’S GUIDE
Reader’s guide
This publication presents indicators of entrepreneurship collected by the OECD-Eurostat
Entrepreneurship Indicators Programme (EIP). Started in 2006, the programme develops
multiple measures of entrepreneurship and its determinants according to a simplified
conceptual framework that distinguishes between the manifestation of entrepreneurship,
the factors that influence it, and the impacts of entrepreneurship on the economy and
society. A set of indicators of entrepreneurial performance is proposed for understanding
and comparing the amount and type of entrepreneurship which take place in different
countries. This approach reflects the idea that analysts should not focus only on enterprise
creation or any other single measure to study entrepreneurship: entrepreneurs and
entrepreneurial forces can be found in many existing businesses and understanding the
dynamism these actors exert on the economy is as important as understanding the
dynamics of start-ups.
The indicators of entrepreneurial performance, computed by National Statistical
Offices, are presented for the following countries: Australia, Austria, Belgium, Brazil,
Bulgaria, Canada, the Czech Republic, Denmark, Estonia, Finland, Hungary, Israel, Italy,
Korea, Latvia, Lithuania, Luxembourg, Mexico, the Netherlands, New Zealand, Norway,
Portugal, Romania, the Slovak Republic, Slovenia, Spain, Sweden, Switzerland and the
United States.
A selection of indicators of determinants of entrepreneurship is also included in the
publication: the choice of the indicators was based on their novelty, i.e. they were recently
produced and or/updated by their producers.
Each indicator is preceded by a short text that explains what is measured and provides
the policy context. A detailed description of the definition and explanations of the
comparability of the indicator across countries are also included.
IndicatorsThe set of indicators that are part of the EIP framework have not all reached the same
degree of development. Some of them are well established components of regular data
collections, while others are only developed in a restricted number of countries and their
harmonised definition forms the object of discussion and further work. The indicators
presented in this publication reflect this diversity:
A) New enterprise creations
B) Bankruptcies
ENTREPRENEURSHIP AT A GLANCE 2013 © OECD 2013 9

READER’S GUIDE
C) Self-employment
D) Enterprises by size class
E) Employment by enterprise size class
F) Value added by enterprise size class
G) Productivity by enterprise size class
H) Exports by enterprise size class
I) Birth rate of employer enterprises
J) Death rate of employer enterprises
K) Churn rate of employer enterprises
L) Survival rate of employer enterprises
M) Employment creation and destruction by employer enterprise births and deaths
N) Employment creation and destruction in surviving enterprises
O) High-growth enterprises rate
P) Gazelles rate
Q) Gender differences in self-employment rates
R) Self-employment among youths and seniors
S) Self-employment rates of migrants
T) Earnings from self-employment
U) Preferences and feasibility for self-employment
V) Culture: The role of entrepreneurial education
W) Culture: Attitude toward failure
X) Access to finance: Venture capital
Indicators A and B are drawn from the OECD Timely Indicators of Entrepreneurship (TIE)
Database. Annex A provides the list of sources that are used to compile the database.
For indicators D, E, F, and I to P the source is the OECD Structural and Demographic
Business Statistics (SDBS) Database. Indicators D to F refer to Structural Business Statistics,
while indicators I to P, i.e. the core indicators of entrepreneurial performance, consist of
Business Demography statistics computed from business registers, except for Mexico
where the Economic Census (2009) was used. The Eurostat-OECD Manual on Business
Demography Statistics developed by the EIP provides the definitions and methodology to
compute Business Demography indicators. Indicator G originates from the OECD
Productivity Database, and indicator H from the OECD Trade by Enterprise Characteristics (TEC)
Database. SDBS and TEC data are collected annually via harmonised questionnaires
completed by National Statistical Offices.
ENTREPRENEURSHIP AT A GLANCE 2013 © OECD 201310

READER’S GUIDE
The indicators on self-employment come from Labour Force Surveys (indicators C, Q
to S), Surveys on Income (indicator T) and an opinion survey on entrepreneurship
conducted by the European Commission (indicator U).
The remaining indicators (V, W, X) represent a selection of determinants of
entrepreneurship. The data sources for each indicator are described in more detail in the
relevant section,
Size-class breakdownStructural Business Statistics indicators usually focus on five size classes based on the
number of persons employed, where the data across countries and variables can be most
closely aligned: 1-9, 10-19, 20-49, 50-249, 250+. Not all country information fits perfectly
into this classification however, and any divergence from these target size classes is
reported in each chapter.
For Business Demography data, the collection breakdown is 1-4, 5-9, 10+ employees to
reflect the fact that a vast majority of newly created enterprises are micro enterprises.
Activity breakdownTotal economy denotes the business economy, covering manufacturing, services and
construction.
For Business Demography and Structural Business Statistics:
● For simplicity the publication refers throughout to manufacturing. In actual fact the
reference covers a broader grouping of industries than those typically identified as
manufacturing. Unless otherwise specified therefore, Manufacturing comprises: Mining
and quarrying; Manufacturing; Electricity, gas, steam and air conditioning supply; Water
supply, sewerage, waste management and remediation activities.
● Services comprise: Wholesale and retail trade, repair of motor vehicles and motorcycles;
Transportation and storage; Accommodation and food service activities; Information
and communication; Real estate activities; Professional, scientific and technical
activities; Administrative and support service activities.
In addition, for Business Demography, services include financial and insurance
activities; and exclude activities of holding companies (ISIC Revision 4 Sector 642), with the
exception of Israel, Korea and the United States; for Structural Business Statistics, the
entire section of financial and insurance activities is excluded from services, except for
Canada and Korea.
For Korea, the sector Sewerage, waste management, materials recovery and
remediation activities is included in the aggregate for services.
Data for Israel, Mexico and the United States are compiled according to ISIC Revision
3. Data for Austria, New Zealand and Slovenia are compiled according to ISIC Revision 4.
For other countries data after 2007 are compiled in ISIC Revision 4 and data for 2007 and
before are compiled in ISIC Revision 3.
ENTREPRENEURSHIP AT A GLANCE 2013 © OECD 2013 11

READER’S GUIDE
EIP FrameworkEntrepreneurship is defined by the EIP as the phenomenon associated with
entrepreneurial activity, which is the enterprising human action in pursuit of the
generation of value, through the creation or expansion of economic activity, by identifying
and exploiting new products, processes or markets. In this sense, entrepreneurship is a
phenomenon that manifests itself throughout the economy and in many different forms
with many different outcomes, and these outcomes are not always related to the creation
of financial wealth; for example, they may be related to increasing employment, tackling
inequalities, or indeed, increasingly, environmental issues. The challenge of the EIP is to
improve the understanding of these multiple manifestations. The programme recognises
that no single indicator can ever adequately cover entrepreneurship, and it has therefore
developed a set of measures that each captures a different aspect or type of
entrepreneurship; these measures are referred to as EIP indicators of entrepreneurial
performance. There are currently some 20 performance indicators covered in the EIP.
The EIP takes a comprehensive approach to the measurement of entrepreneurship by
looking not only at the manifestation of the entrepreneurial phenomenon but also at the
factors that influence it. These factors range from the market conditions to the regulatory
framework, to the culture or the conditions of access to finance. While some areas of
determinants lend themselves more readily to measurement (for instance, the existence
and restrictiveness of anti-trust laws or the administrative costs of setting-up a new
business in a country), for other determinants the difficulty resides in finding suitable
measures (e.g. venture capital and angel capital) and/or in comprehending the exact
nature of their relationship with entrepreneurship (e.g. culture). An important objective of
the EIP in this instance is to contribute to and advance research on the less understood and
less measurable determinants of entrepreneurship. Annex B presents a comprehensive list
of indicators of determinants and the corresponding data sources.
ENTREPRENEURSHIP AT A GLANCE 2013 © OECD 201312

READER’S GUIDE
ation
growth
duction
sing rmalr
s
all firms
all firms
firms
ct
Regulatory framework
Market conditions Access to financeKnowledge creation
and diffusionEntrepreneurial
capabilitiesCulture Firm based Job cre
Administrative burdens for entry
Anti-trust lawsAccess to debt
financingR&D investment
Training and experience
Risk attitude in society
Employmentbased
Economic
Administrative burdens for growth
Competition Business angelsUniversity/industry
interface
Business and entrepreneurship education (skills)
Attitudes towards entrepreneurs
Wealth Poverty re
Formalithe info
secto
of entrepreneurs
Bankruptcy regulations
Access to the domestic market
Access to VCTechnological co-operation
between firms
Entrepreneurship infrastructure
Desire for businessownership
Entrepreneurship education(mindset)
Safety, health and environmental
regulations
Access to foreign markets
Access to other types of equity
Technologydiffusion
Immigration
Product regulation
Degree of public involvement
Labour market regulation
Public procurement
Court and legal framework
Social and health security
Income taxes; wealth/bequest taxes
Business and capital taxes
Patent system; standards
Stock marketsBroadband
access
Firms Employment Wealth
Employer enterprise birth rates Share of high growth firms (by employment)
Share of high growth firms(by turnover)
Employer enterprise death rates Share of gazelles (employment) Share of gazelles (by turnover)
Business churn Ownership rate start-ups Value added, young or small firm
Net business population growth business population Productivity contribution, young or sm
Survival rates at 3 and 5 years Employment in 3 and 5 year old firms Innovation performance, young or sm
Proportion of 3 and 5 year old firms Average firm size after 3 and 5 years Export performance, young or small
Ownership rates
DeterminantsEntrepreneurial
performanceImpa
ENTREPRENEURSHIP AT A GLANCE 2013 © OECD 2013 13


ENTREPRENEURSHIP AT A GLANCE 2013
1. RECENT DEVELOPMENTSIN ENTREPRENEURSHIP
New enterprise creations
Bankruptcies
Self-employment rates
© OECD 2013 15

1. RECENT DEVELOPMENTS IN ENTREPRENEURSHIP
New enterprise creations
Key facts
– Diverging patterns of business start-up rates haveemerged across OECD economies five years after theonset of the financial crisis.
– Start-up rates remain below pre-crisis levels in mostEuro area economies and particularly in Spain, but tenta-tive signs of a stabilisation are emerging.
– In France start-up rates were boosted in 2009 and 2010 bynew legislation supporting auto-entrepreneurs.
Relevance
The global crisis has heightened interest in entrepreneur-ship as an essential element to foster economic recoveryand employment growth. In order to analyse the impacts ofeconomic cycles on new firm creation, policy makers andanalysts need as up-to-date as possible data. The short-term indicators presented in this section are an attempt torespond to this need.
Comparability
Since a single source is used, rather than the multiplesources used for national business registers, the populationof enterprises is often incomplete. Depending on the coun-try, the chosen single source may not cover certain legalforms of enterprises (e.g. sole proprietor) or sectors of activ-ity (e.g. education) or enterprises below a certain turnoveror employment threshold.
The concepts of enterprise “creation” reflected in the dataseries differ across countries. The concept of enterprisebirth is more restrictive than the concept of creation as itrefers to a legal entity that appears for the first time withno other enterprise involved in the creation process. Itexcludes firm creations resulting from mergers or changesof name, type of activity or ownership.
Some sources only cover specific types of enterprises: datafor Australia exclude non-incorporated companies; data forSpain exclude natural persons and sole proprietors; datafor the United States only refer to establishments withemployees.
Because of the comparability issues described above inter-national comparisons of data from the Timely Indicators ofEntrepreneurship Database should focus on changes in levelsrather than levels per se.
Notes
In France a new individual enterprise status (régime del’autoentrepreneur) was implemented in January 2009.
The trend-cycle reflects the combined long-term (trend) andmedium-to-long-term (cycle) movements in the originalseries (see http://stats.oecd.org/glossary/detail.asp?ID=6693).
Source/Online database
OECD Timely Indicators of Entrepreneurship (TIE) Database.
For further reading
Eurostat (2010), Estimation of recent business demographydata, DOC.06/EN/EUROSTAT/G2/BD/JUN10.
OECD (2010), “Measuring Entrepreneurship”, OECD StatisticsBrief, No. 15, www.oecd.org/dataoecd/50/56/46413155.pdf.
OECD (2011), Entrepreneurship at a Glance 2011, Chapter 1,OECD Publishing, Paris, http://dx.doi.org/10.1787/9789264097711-en.
UN (2008), International Standard Industrial Classificationof All Economic Activities (ISIC), Revision 4, 2008, UnitedNations, New York, http://unstats.un.org/unsd/cr/registry/isic-4.asp.
Definitions
The Timely Indicators of Entrepreneurship Database usesdata based on national definitions only. When possi-ble, adjustments are made to get as close as possibleto the Eurostat-OECD Manual on Business DemographyStatistics standard definitions (for example by remov-ing agriculture, excluding public companies and inac-tive companies, etc.).
Sources and definitions for enterprise entries used inthe Timely Indicators of Entrepreneurship Database aredescribed in Table A.1, Annex A.
Some of the national sources selected for the timelyindicators use the concept of enterprise birth, whileothers use the broader concept of enterprise creation.
An enterprise creation refers to the emergence of anew production unit. This can be either due to a realbirth of the unit, or due to other creations by a merger,break-up, split-off or discontinuity point according tothe continuity rules.
ENTREPRENEURSHIP AT A GLANCE 2013 © OECD 201316

1. RECENT DEVELOPMENTS IN ENTREPRENEURSHIP
New enterprise creations
Figure 1.1. New enterprise creations, selected countriesTrend-cycle average 2007 = 100
1 2 http://dx.doi.org/10.1787/888932828127
50
60
70
80
90
100
110
120
130
140
Australia Belgium Denmark Finland Germany Italy
90110
130150
170
190
France
110
120
130
140
Norway Netherlands Russian Federation Spain Sweden United Kingdom United States
50
60
70
80
90
100
110
120
ENTREPRENEURSHIP AT A GLANCE 2013 © OECD 2013 17

1. RECENT DEVELOPMENTS IN ENTREPRENEURSHIP
Bankruptcies
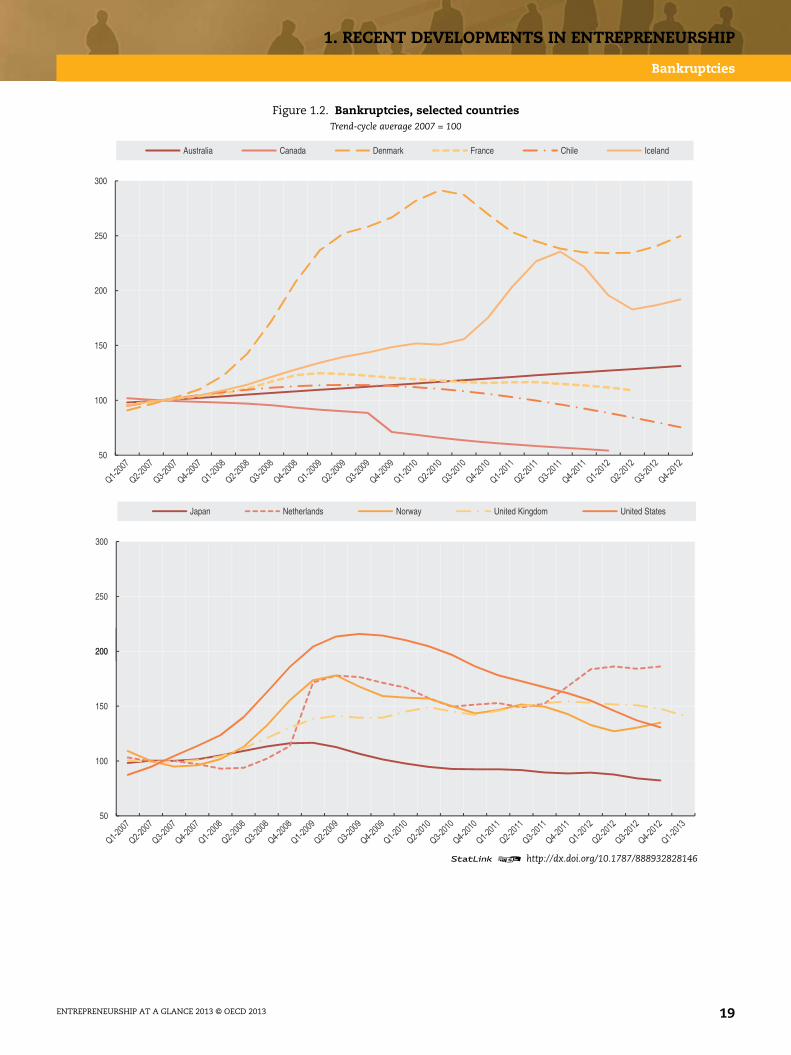
Key facts
– Data on bankruptcies are less comparable across coun-tries and more affected by national legislation.
– Data for Australia and the United Kingdom are broadlyconsistent with higher levels of business entry and exitrates, with bankruptcies edging slightly higher in recentyears. Bankruptcy rates for Denmark and the UnitedStates are significantly below the highs reached at theheight of the crisis but recent data for Denmark is begin-ning to point upward again.
Relevance
The recent global crisis has heightened interest in entre-preneurship as an essential element to foster economicrecovery and employment growth. In order to analyse theimpacts of economic cycles on new firm creation policyand also on failures, policy makers and analysts need asup-to-date as possible data. The short-term indicators pre-sented in this section respond to this need.
Comparability
Because bankruptcy laws differ across countries, the con-cept of enterprise “failure” reflected in the data differsacross countries. In some countries a declaration of bank-ruptcy means that the enterprise must stop trading imme-diately. In other countries, enterprises can declarethemselves as bankrupt but are able to continue tradingwith receivers in operational control. This results in thewinding-up of the enterprise as it goes into liquidation butsometimes the enterprise is able to continue operating,albeit with more restrictive operations and under newmanagement. This means that some enterprises on busi-ness registers, may be active but also bankrupt, making itvery difficult to use a strict concept of deaths based onbankruptcy, particularly as some nominally bankrupt com-panies may recover.
On the other hand, firm closures can be due to differentreasons, and only some consist of liquidations followingbankruptcy. The financial literature has highlighted thatcountries differ in terms of the probabilities of firms beinginvolved in bankruptcy or other insolvency procedures, andalso in the final results of these procedures. The proportionof bankruptcy procedures that end up in actual liquidationsof the companies, and not in reorganisations, varies acrosscountries depending on the bankruptcy code.
Because of the comparability issues described above inter-national comparisons of data from the Timely Indicators ofEntrepreneurship Database should focus on changes in levelsrather than levels per se.
Notes
The trend-cycle reflects the combined long-term (trend) andmedium-to-long-term (cycle) movements in the originalseries (see http://stats.oecd.org/glossary/detail.asp?ID=6693).
Source/Online database
OECD Timely Indicators of Entrepreneurship (TIE) Database.
For further reading
Eurostat (2010), Estimation of recent business demographydata, DOC.06/EN/EUROSTAT/G2/BD/JUN10.
OECD (2010), “Measuring Entrepreneurship”, OECD StatisticsBrief, No. 15, www.oecd.org/dataoecd/50/56/46413155.pdf.
OECD (2011), Entrepreneurship at a Glance 2011, Chapter 1,OECD Publishing, Paris, http://dx.doi.org/10.1787/9789264097711-en.
UN (2008), International Standard Industrial Classificationof All Economic Activities (ISIC), Revision 4, 2008, UnitedNations, New York, http://unstats.un.org/unsd/cr/registry/isic-4.asp.
Definitions
The Timely Indicators of Entrepreneurship Database usesdata based on national definitions only. When possi-ble, adjustments are made to get as close as possibleto the Eurostat-OECD Manual on Business DemographyStatistics standard definitions (for example by remov-ing agriculture and public companies, exclude inac-tive companies, etc.).
Bankruptcy is used as an alternative indicator for theenterprise deaths measure recorded elsewhere in thispublication.
Bankruptcy generally refers to the initiation of legalproceedings (insolvency) when an enterprise cannotguarantee the reimbursement of its debt. The firmmay continue to live.
Sources for bankruptcies used in the Timely Indicatorsof Entrepreneurship Database are described in Table A.2,Annex A.
ENTREPRENEURSHIP AT A GLANCE 2013 © OECD 201318
1. RECENT DEVELOPMENTS IN ENTREPRENEURSHIP
Bankruptcies
Figure 1.2. Bankruptcies, selected countriesTrend-cycle average 2007 = 100
1 2 http://dx.doi.org/10.1787/888932828146
50
100
150
200
250
300
Australia Canada Denmark France Chile Iceland
200
250
300
Japan Netherlands Norway United Kingdom United States
50
100
150
200
ENTREPRENEURSHIP AT A GLANCE 2013 © OECD 2013 19

1. RECENT DEVELOPMENTS IN ENTREPRENEURSHIP
Self-employment rates
Key facts
– Since the start of the economic crisis, the number of self-employed followed very different trends across OECDcountries. Considering the level in 2007 as benchmark,the number of self-employed increased in Canada,France, Germany and the United Kingdom, while itdecreased in Korea, Italy, Spain and the United States.
Relevance
Self-employment data are a relevant source of informationon trends in business ownership. A key advantage of self-employment data is their timeliness; they are derived fromsurveys conducted quarterly or monthly on representativesamples of the population in working age (Labour ForceSurveys), and provide accurate data very soon after the col-lection (often less than a month). The data can also be usedto assess trends in different types of self-employment jobs,for example distinguishing the self-employed with andwithout employees.
Comparability
The main comparability issue relates to the classificationof the incorporated self-employed. While in official statis-tics for most OECD countries, the self-employed who incor-porate their businesses are counted as self-employed, insome countries they are counted as employees (for exam-ple, Japan, New Zealand and Norway). In the United States,official statistics generally publish data including only theunincorporated self-employed, but the data source (Cur-rent Population Surveys) also provide information on theself-employed who incorporated their businesses. Forimproving international comparability, data for the UnitedStates in Figure 1.3 refer to both the incorporated and theunincorporated self-employed.
Sources/Online databases
OECD estimates based on:
– Current Population Survey (United States).
– Eurostat Labour Force Surveys, 2000-12.
– Labour Force Survey (Canada).
For further reading
Hipple, S. (2010), “Self-employment in the United States”,Monthly Labor Review, September.
OECD (2012), Closing the Gender Gap. Act Now, OECDPublishing, Paris, www.oecd-ilibrary.org/social-issues-migration-health/close-the-gender-gap-now_9789264179370-en.
OECD (2000), OECD Employment Outlook, OECD Publishing,Paris, www.oecd-ilibrary.org/social-issues-migration-health/oecd-employment-outlook-2000_empl_outlook-2000-en.
Definitions
The number of self-employed is the number of individualswho report their status as “self-employed” in popula-tion or labour force surveys.
Self-employment jobs are those “jobs where the remu-neration is directly dependent upon the profits (or thepotential for profits) derived from the goods and ser-vices produced (where own consumption is conside-red to be part of profits). The incumbents make theoperational decisions affecting the enterprise, ordelegate such decisions while retaining responsibilityfor the welfare of the enterprise” (15th Conference ofLabour Statisticians, January 1993). The definitiontherefore includes both unincorporated and incorpo-rated businesses and as such differs from the defini-tions used in the System of National Accounts whichclassifies self employed owners of incorporated busi-nesses and quasi-corporations as employees.
It should be noted that not all the self-employed are“entrepreneurs”. Self-employment statistics includefor example, craft-workers and farmers.
ENTREPRENEURSHIP AT A GLANCE 2013 © OECD 201320

1. RECENT DEVELOPMENTS IN ENTREPRENEURSHIP
Self-employment rates
Figure 1.3. Number of self-employment jobsNumber of jobs, trend-cycle average 2007 = 100
1 2 http://dx.doi.org/10.1787/888932828165
80
85
90
95
100
105
110
Canada France Germany Italy
100
105
110
Korea Spain Sweden United Kingdom United States
80
85
90
95
100
ENTREPRENEURSHIP AT A GLANCE 2013 © OECD 2013 21


ENTREPRENEURSHIP AT A GLANCE 2013
2. STRUCTURAL INDICATORSON ENTERPRISE POPULATION
Enterprises by size class
Employment by size class
Value added by size class
Productivity by enterprise size class
Exports by enterprise size class
© OECD 2013 23

2. STRUCTURAL INDICATORS ON ENTERPRISE POPULATION
Enterprises by size class
Key facts
– In all countries most business are micro-enterprises, i.e.firms with less than ten persons employed; between 70%and 95% of all firms are micro-enterprises.
– In half of OECD countries, micro-enterprises account onaverage for more than 90% of total enterprises, with thehighest proportion of micro-enterprises being found inthe services sector.
– Generally, the larger the economy the greater the num-ber of enterprises and the higher the proportion of largerenterprises. Italy, and to a lesser extent Spain have dis-proportionately more businesses per unit of GDP thanother large European economies, such as France,Germany and the United Kingdom, or resource richcountries such as Canada and the Russian Federation.
Relevance
Small businesses can be important drivers of growth andinnovation. At the same time, larger businesses typicallyhave competitive advantages through, for example, econo-mies of scale, cheaper credit and direct access to globalvalue chains, compared to smaller enterprises. Size mat-ters therefore when formulating policy.
Comparability
All countries present information using the enterprise asthe statistical unit except Japan, Korea and Mexico whichuse establishments. As most enterprises in these countriesconsist of only one establishment, comparability issues arenot expected to be significant in relation to the total popu-lation of businesses but comparisons relating to the pro-portion of smaller firms will be upward biased, compared
to other countries, whilst comparisons relating to the pro-portion of larger firms will be downward biased.
The number of persons employed corresponds to the totalnumber of persons who work for the observation unit(inclusive of working proprietors, partners working regu-larly in the unit and unpaid family workers). For the UnitedStates, the number of non-employer firms from the Nonemployer Statistics Database was added to the number ofemployer firms from the Statistics of U.S. Businesses, so toobtain the total number of firms with 1 to 9 personsemployed.
The size-class breakdown 1-9, 10-19, 20-49, 50-249, 250+provides for the best comparability given the varying datacollection practices across countries. Some countries usedifferent conventions: the size class “1-9” refers to “1-10”for Mexico; “1-19” for Australia and Turkey; the size class“10-19” refers to “10-29” for Japan and “10-49” for Korea; thesize class “20-49” refers to “20-199” for Australia, “30-49” forJapan, “50-99” for Korea, “11-50” for Mexico, and “20-99” forthe United States; the size class “50-249” refers to “100-299”for Korea, “50-299” for Japan, “51-250” for Mexico and“100-499” for the United States; finally, the size class “250+”refers to “200+” for Australia, “300+” for Korea and Japan,“251+” for Mexico and “500+” for the United States.
Australian data refer to the fiscal year (1st July -30th June).
For New Zealand and the Russian Federation data refer toemployees.
Sources/Online databases
OECD Structural and Demographic Business Statistics (SDBS)Database, http://dx.doi.org/10.1787/sdbs-data-en.
Nonemployer Statistics, United States Census Bureau,www.census.gov/econ/nonemployer/overview.htm.
Statistics of U.S. Businesses (SUSB), United States CensusBureau, www.census.gov/econ/susb/.
For further reading
OECD (2010), Structural and Demographic Business Statistics,OECD Publishing, Paris, http://dx.doi.org/10.1787/9789264072886-en.
Ahmad N. (2007), The OECD’s Business Statistics Databaseand Publication, Paper presented at the StructuralBusiness Statistics Expert Meeting, Paris, 10-11 May2007, www.oecd.org/dataoecd/59/34/38516035.pdf.
Information on data for Israel: http://dx.doi.org/10.1787/888932315602.
Definitions
An enterprise is defined as the smallest combinationof legal units that is an organisational unit producinggoods or services, which benefits from a certaindegree of autonomy in decision-making, especiallyfor the allocation of its current resources. An enter-prise carries out one or more activities at one or morelocations.
The basis for size classification is the total number ofpersons employed, which includes the self-employed.
ENTREPRENEURSHIP AT A GLANCE 2013 © OECD 201324

2. STRUCTURAL INDICATORS ON ENTERPRISE POPULATION
Enterprises by size class
Figure 2.1. Enterprises by size classPercentage, 2010 or latest available year
1 2 http://dx.doi.org/10.1787/888932828184
Figure 2.2. Number of enterprises and GDP2010 or latest available year
1 2 http://dx.doi.org/10.1787/888932828203
0
10
20
30
40
50
60
70
80
90
100
1-9 10-19 20-49 50-249 250+
Australia
Belgium
Canada (2009)
France
Germany
Italy
Korea
Mexico (2008)
Netherlands
Poland
PortugalRussian Federation
SpainTurkey (2009)
United Kingdom
0
1 000
2 000
3 000
4 000
5 000
6 000
0 500 1 000 1 500 2 000 2 500 3 000 3 500
Thou
sand
s of
firm
s
GDP, millions US dollars
United States
12 000
13 000
14 000
15 000
16 000
12 000 13 000 14 000 15 000
ENTREPRENEURSHIP AT A GLANCE 2013 © OECD 2013 25

2. STRUCTURAL INDICATORS ON ENTERPRISE POPULATION
Enterprises by size class
Figure 2.3. Enterprises by size class, manufacturingPercentage, 2010 or latest available year
1 2 http://dx.doi.org/10.1787/888932828222
Figure 2.4. Enterprises by size class, servicesPercentage, 2010 or latest available year
1 2 http://dx.doi.org/10.1787/888932828241
Figure 2.5. Enterprises by size class, constructionPercentage, 2010 or latest available year
1 2 http://dx.doi.org/10.1787/888932828260
0
10
20
30
40
50
60
70
80
90
100%
1-9 10-19 20-49 50-249 250+
0
10
20
30
40
50
60
70
80
90
100%
1-9 10-19 20-49 50-249 250+
0
10
20
30
40
50
60
70
80
90
100%
1-9 10-19 20-49 50-249 250+
ENTREPRENEURSHIP AT A GLANCE 2013 © OECD 201326

2. STRUCTURAL INDICATORS ON ENTERPRISE POPULATION
Enterprises by size class
Table 2.1. Enterprises by size class and sectorPercentage, 2010 or latest available year
Manufacturing Services Construction
Country 1-9 10-19 20-49 50-249 250+ 1-9 10-19 20-49 50-249 250+ 1-9 10-19 20-49 50-249 250+
Australia 90.3 – 8.9 – 0.8 95.9 – 3.8 – 0.3
Austria 74.4 10.9 7.9 5.1 1.6 90.8 5.3 2.6 1.1 0.2 81.2 10.8 5.9 1.9 2.1
Belgium 83.1 7.0 5.9 3.3 0.8 95.2 2.5 1.5 0.7 0.1 94.7 3.1 1.7 0.5 0.6
Brazil 63.1 18.1 11.5 6.1 1.3 85.9 8.4 3.8 1.5 0.3 76.0 10.3 7.9 4.7 1.0
Bulgaria 74.5 9.9 8.6 5.8 1.2 93.1 4.0 1.9 0.9 0.2
Canada 68.1 14.2 11.1 5.9 0.6 80.7 10.3 6.2 2.5 0.3 86.6 7.9 4.1 1.3 0.1
Czech Republic 92.3 3.0 2.4 1.8 0.5 96.8 1.8 0.9 0.4 0.1 96.6 1.9 1.1 > 0.1 > 0.1
Denmark 80.2 8.2 6.7 4.1 0.9 92.3 4.0 2.4 1.1 0.2 90.6 5.8 2.7 0.8 0.9
Estonia 72.5 9.9 10.0 6.6 1.0 91.9 4.4 2.4 1.2 0.1 89.9 5.7 3.1 1.2 1.3
Finland 82.6 7.4 5.6 3.5 0.9 93.8 3.3 1.8 0.8 0.2 93.3 4.1 1.9 0.5 0.6
France 86.5 5.5 4.7 2.6 0.7 95.2 2.5 1.5 0.6 0.1 94.8 3.0 1.7 > 0.1 > 0.1
Germany 61.6 20.7 7.8 8.0 2.0 85.8 7.7 4.3 1.9 0.3 83.6 10.8 4.2 1.3 1.4
Hungary 85.2 6.4 4.4 3.3 0.8 96.5 2.1 0.9 0.4 0.1 94.7 3.5 1.3 > 0.1 > 0.1
Ireland 48.0 22.0 15.8 11.1 3.1 90.4 5.3 2.6 1.5 0.2 96.0 2.6 1.0 > 0.1 > 0.1
Israel (2009) 70.8 12.1 9.4 6.5 1.2 85.1 7.9 4.7 2.0 0.4
Italy 82.0 10.5 5.0 2.1 0.3 96.4 2.3 0.8 0.4 0.1 95.1 3.6 1.1 > 0.1 > 0.1
Japan (2009) 75.6 17.6 3.2 3.2 0.3 80.0 14.8 2.6 2.2 0.1
Korea 84.5 12.8 1.5 0.9 0.2 98.4 1.3 0.1 0.0 0.1 93.1 6.5 > 0.1 > 0.1 > 0.1
Latvia 76.2 9.7 8.0 5.3 0.7 92.7 3.8 2.3 1.0 0.2 84.1 8.3 4.7 2.7 2.8
Lithuania 76.9 8.6 7.6 5.9 0.9 88.9 6.1 3.3 1.5 0.2 87.3 6.3 3.9 2.2 2.5
Luxembourg 65.7 11.3 11.0 9.3 2.7 91.4 4.1 2.6 1.4 0.5 72.5 13.5 9.3 4.2 4.7
Mexico (2008) 95.5 – 4.4 0.1 > 0.1 95.0 – 4.2 0.7 0.1
Netherlands 82.7 6.9 5.5 4.1 0.8 94.9 2.5 1.5 0.8 0.2 94.9 2.7 1.6 0.7 0.8
New Zealand 70.2 14.7 9.5 4.6 1.0 80.1 11.6 5.4 2.5 0.4 88.0 7.7 3.3 0.9 > 0.1
Norway 80.4 8.1 6.8 3.9 0.8 94.5 3.0 1.6 0.7 0.1 92.2 4.8 2.3 0.6 0.7
Poland 87.0 3.9 4.3 3.8 0.9 97.1 1.3 0.9 0.6 0.1 96.1 1.6 1.4 0.8 0.9
Portugal 82.0 8.7 6.0 3.0 0.4 97.3 1.5 0.8 0.3 0.1 92.6 4.6 2.0 0.6 0.7
Romania 72.5 10.6 9.2 6.1 1.6 91.9 4.3 2.4 1.2 0.2 85.9 7.2 4.6 2.0 2.3
Russian Federation 54.0 14.8 14.7 12.1 4.4 76.9 11.1 7.6 3.9 0.5
Slovak Republic 93.3 3.1 1.7 1.5 0.4 96.3 2.5 0.6 0.5 0.1 97.8 1.4 0.5 > 0.1 > 0.1
Slovenia 87.4 5.1 3.5 3.3 0.7 95.7 2.5 1.2 0.5 0.1 93.2 4.1 1.9 0.7 0.8
Spain 82.9 8.3 5.9 2.4 0.4 95.2 2.7 1.4 0.6 0.1 92.9 4.5 2.0 0.6 0.6
Sweden 87.4 5.4 3.9 2.6 0.7 96.0 2.1 1.2 0.5 0.1 94.3 3.4 1.8 > 0.1 0.5
Switzerland 55.5 19.3 14.0 9.2 2.0 73.3 15.8 7.4 3.0 0.5 64.4 20.2 11.3 3.8 4.2
Turkey (2009) 94.6 – 3.1 1.9 0.4 99.2 – 0.5 0.3 0.1
United Kingdom 75.9 10.4 7.6 5.0 1.1 90.4 5.2 2.7 1.4 0.3
United States 91.6 3.5 3.3 0.9 0.6 94.1 2.8 2.3 0.5 0.3 89.5 5.9 3.9 0.6 0.1
1 2 http://dx.doi.org/10.1787/888932829742
ENTREPRENEURSHIP AT A GLANCE 2013 © OECD 2013 27

2. STRUCTURAL INDICATORS ON ENTERPRISE POPULATION
Employment by size class
Key facts
– There are significant variations across countries in thedistribution of employment among enterprises of diffe-rent sizes: in Greece, Italy, Mexico, Portugal and Spainmore than 40% of employment is in enterprises with lessthan ten persons, while in Germany, New Zealand,Switzerland and the United Kingdom the share is lessthan 20%.
– Micro-enterprises (less than 10 persons employed) inconstruction and services account on average for around30% of total employment in their sectors, while in man-ufacturing the contribution is only 15%.
– Employment in manufacturing is dominated by thelargest firms (those with more than 250 employees): theyemploy more than 40% of people working in the sector,despite accounting for less than 1% of all manufacturingfirms.
Relevance
Although the share of employment in small enterprises istypically small, many studies show that they are importantdrivers of employment growth. Information on employ-ment by size-class can be useful therefore in assessing theunderlying potential that exists within an economy togenerate employment growth.
Comparability
All countries present information using the enterprise asthe statistical unit except Japan and Mexico, which useestablishments. Data for all countries refer to the numberof persons employed, with the exception of New Zealand,the Russian Federation and the United States which usenumber of employees and therefore exclude the working-pro-prietors with no employees.
The size-class breakdown 1-9, 10-19, 20-49, 50-249, 250+provides for the best comparability given the varying datacollection practices across countries. Some countries usedifferent conventions: the size class “1-9” refers to “1-10”for Mexico, and “1-19” for Australia and Turkey; the sizeclass “10-19” refers to “10-29” for Japan; the size class“20-49” refers to “20-199” for Australia, “30-49” for Japan,“11-50” for Mexico, “20-99” for the United States; the sizeclass “50-249” refers to “50-299” for Japan, “51-250” forMexico and “100-499” for the United States; finally, the sizeclass “250+” refers to “200+” for Australia, “300+” for Japan,“251+” for Mexico and “500+” for the United States.
Australian data refer to the fiscal year (1st July -30th June).
Source/Online database
OECD Structural and Demographic Business Statistics (SDBS)Database, http://dx.doi.org/10.1787/sdbs-data-en.
For further reading
OECD (2010), Structural and Demographic Business Statistics,OECD Publishing, Paris, http://dx.doi.org/10.1787/9789264072886-en.
Ahmad N. (2007), The OECD’s Business Statistics Databaseand Publication, Paper presented at the StructuralBusiness Statistics Expert Meeting, Paris, 10-11 May2007, www.oecd.org/dataoecd/59/34/38516035.pdf.
Information on data for Israel: http://dx.doi.org/10.1787/888932315602.
Definitions
The number of persons employed concept includes allpersons who worked for the concerned unit duringthe reference year.
Total employment excludes directors of incorporatedenterprises and members of shareholders’ commit-tees who are paid solely for their attendance at meet-ings, labour force made available to the concernedunit by other units and charged for, persons carryingout repair and maintenance work in the unit on thebehalf of other units, and home workers. It alsoexcludes persons on indefinite leave, military leave orthose whose only remuneration from the enterpriseis by way of a pension.
ENTREPRENEURSHIP AT A GLANCE 2013 © OECD 201328

2. STRUCTURAL INDICATORS ON ENTERPRISE POPULATION
Employment by size class
Figure 2.6. Employment by enterprise size classPercentage, 2010 or latest available year
1 2 http://dx.doi.org/10.1787/888932828279
Table 2.2. Number of persons employed by enterprise size class2010 or latest available year
1-9 10-19 20-49 50-249 250+ Total
Australia 2 584 127 – 1 661 368 – 2 358 621 6 604 115
Austria 650 694 279 438 331 957 481 810 813 383 2 557 282
Belgium 864 178 224 301 312 419 416 153 832 110 2 649 161
Brazil 1 779 291 1 773 368 2 368 190 3 884 749 8 846 245 18 651 843
Bulgaria 580 293 194 264 262 492 420 392 470 494 1 927 935
Czech Republic 1 096 986 286 260 365 214 670 664 1 041 015 3 460 139
Denmark 241 375 106 164 145 111 223 269 368 920 1 084 839
Finland 356 233 128 988 164 419 238 206 530 350 1 418 196
Germany 4 794 818 2 727 783 3 070 960 5 121 257 9 217 567 24 932 385
Greece (2007) 1 513 452 213 860 241 815 276 970 353 931 2 600 028
Hungary 887 282 226 077 237 631 401 037 685 235 2 437 262
Israel (2009) 396 226 257 889 597 382 975 826 378 444 2 605 767
Italy 7 166 368 1 750 805 1 515 082 1 870 930 3 006 611 15 309 796
Japan (2009) 11 758 419 11 322 099 4 729 586 10 642 397 5 711 923 44 164 424
Latvia 157 478 61 620 78 632 123 703 118 723 540 156
Lithuania 193 252 85 327 115 487 190 920 190 217 775 203
Luxembourg 43 557 23 185 33 374 57 140 74 972 232 228
Mexico (2008) 10 847 170 738 328 4 360 272 4 315 095 6 859 924 27 120 789
New Zealand 209 670 132 790 145 240 229 265 332 850 2 557 282
Poland 3 025 091 393 186 698 409 1 608 893 2 646 801 8 372 380
Portugal 1 357 276 326 015 383 712 518 286 671 775 3 257 064
Romania 885 711 330 976 458 929 777 551 1 260 056 3 713 223
Russian Federation 157 088 234 944 644 452 4 234 316 12 717 755 17 988 555
Slovak Republic 559 194 148 927 112 549 234 800 415 968 1 471 438
Slovenia 191 945 51 198 62 832 126 633 172 117 604 725
Spain 4 832 688 1 188 320 1 375 814 1 651 414 2 940 914 11 989 150
Sweden 745 282 273 754 347 079 524 204 1 000 489 2 890 808
Switzerland 461 926 332 160 374 797 556 013 835 118 2 560 014
Turkey (2009) 2 580 470 663 310 1 316 874 2 069 109 6 629 763
United Kingdom 3 043 757 1 426 126 1 954 485 2 939 554 8 374 955 17 738 877
United States 8 491 267 5 965 694 13 339 600 10 325 133 37 779 367 75 901 061
1 2 http://dx.doi.org/10.1787/888932829761
0
10
20
30
40
50
60
70
80
90
100
1-9 10-19 20-49 50-249 250+
ENTREPRENEURSHIP AT A GLANCE 2013 © OECD 2013 29

2. STRUCTURAL INDICATORS ON ENTERPRISE POPULATION
Employment by size class
Figure 2.7. Employment by enterprise size class, manufacturingPercentage, 2010 or latest available year
1 2 http://dx.doi.org/10.1787/888932828298
Figure 2.8. Employment by enterprise size class, servicesPercentage, 2010 or latest available year
1 2 http://dx.doi.org/10.1787/888932828317
Figure 2.9. Employment by enterprise size class, constructionPercentage, 2010 or latest available year
1 2 http://dx.doi.org/10.1787/888932828336
0
10
20
30
40
50
60
70
80
90
100
1-9 10-19 20-49 50-249 250+
0
10
20
30
40
50
60
70
80
90
100
1-9 10-19 20-49 50-249 250+
0
10
20
30
40
50
60
70
80
90
100
1-9 10-19 20-49 50-249 250+
ENTREPRENEURSHIP AT A GLANCE 2013 © OECD 201330

2. STRUCTURAL INDICATORS ON ENTERPRISE POPULATION
Employment by size class
Table 2.3. Persons employed by enterprise size class and sectorPercentage, 2010 or latest available year
Manufacturing Services Construction
1-9 10-19 20-49 50-249 250+ 1-9 10-19 20-49 50-249 250+ 1-9 10-19 20-49 50-249 250+
Australia 23.7 – 29.6 – 46.7 39.6 – 24.7 – 35.7 59.8 – 21.2 – 19.0
Austria 9.6 6.7 11.0 25.4 47.2 34.1 11.5 12.7 16.7 24.9 26.3 16.4 20.3 19.8 17.2
Belgium 12.8 6.8 13.2 24.4 42.7 33.4 7.0 9.8 13.6 36.3 49.2 12.1 15.1 15.1 8.5
Brazil 6.7 8.2 12.6 21.5 51.0 14.0 11.5 12.7 18.2 43.6 5.0 7.2 13.6 27.0 47.2
Bulgaria 10.3 7.1 13.8 30.7 38.2 35.4 10.4 11.1 16.1 27.0
Czech Republic 15.4 5.6 10.0 26.7 42.4 44.0 10.4 11.5 18.5 15.6 49.3 10.6 12.9 15.3 11.9
Denmark 10.5 7.0 12.8 26.5 43.1 24.3 9.6 12.8 19.0 34.4 39.2 16.5 17.2 14.4 12.7
Estonia 13.3 8.5 17.8 37.0 23.4 36.9 11.5 10.6 20.8 20.3 43.1 14.3 17.1 18.3 7.2
Finland 10.8 6.2 11.2 23.3 48.4 31.3 7.6 10.4 16.2 34.5 41.2 13.8 13.8 11.7 19.4
France 15.3 6.0 11.1 21.3 46.3 28.0 7.4 10.1 13.7 40.7 48.3 11.8 14.4 10.6 14.9
Germany 7.1 8.5 7.7 24.6 52.1 22.7 10.7 13.3 19.3 34.0 36.1 21.1 18.4 16.5 7.9
Greece (2007) 58.2 8.2 9.3 10.7 13.6
Hungary 12.9 6.7 10.4 26.1 43.8 44.2 8.6 8.4 12.2 26.5 54.0 14.9 12.4 12.7 6.0
Ireland 6.4 7.7 12.5 30.0 43.3 32.9 11.5 11.7 19.2 24.6 36.5 19.3 18.4 17.3 8.6
Israel (2009) 9.8 7.3 12.5 28.3 42.1 22.8 10.7 14.3 19.2 33.0
Italy 23.6 14.4 15.5 21.4 25.1 49.3 8.6 7.1 10.2 24.8 64.3 15.3 10.2 6.9 3.3
Japan (2009) 21.8 22.2 9.6 26.0 20.5 29.1 27.4 11.3 9.2 23.0
Latvia 13.1 9.0 16.7 34.3 26.8 33.4 10.0 13.1 17.5 26.0 27.1 14.5 18.0 32.4 8.0
Lithuania 10.1 7.9 15.4 38.8 27.8 29.7 12.3 14.2 19.9 24.0 20.9 12.7 17.5 31.2 17.7
Mexico (2008) 25.4 9.3 – 15.9 49.3 46.7 17.8 15.8 19.7
Netherlands 17.7 8.0 13.3 29.6 31.4 29.1 7.5 9.8 17.1 36.4 39.4 10.5 13.5 18.1 18.5
New Zealand 12.9 10.2 14.7 24.2 38.0 22.1 13.4 13.5 21.2 29.7 37.8 15.7 14.5 12.6 19.4
Norway 9.6 7.1 13.4 25.4 44.5 27.8 10.3 11.7 18.4 31.8 37.2 16.3 17.5 14.9 14.2
Poland 14.4 3.8 8.7 27.1 45.9 42.0 4.1 6.2 13.8 33.9 50.2 6.3 10.4 19.9 13.1
Portugal 19.6 12.2 19.0 29.7 19.5 47.4 6.9 7.6 11.2 26.9 44.0 14.4 14.4 14.0 13.2
Romania 7.8 5.7 11.3 25.7 49.5 28.4 8.5 11.0 17.9 34.1 25.1 11.8 17.1 24.7 21.4
Russian Federation 0.3 0.6 1.7 17.3 80.1 1.6 2.2 5.8 28.6 61.9
Slovak Republic 18.8 6.7 7.5 24.1 42.9 41.6 9.7 5.1 14.3 29.3 61.2 9.9 8.1 12.7 8.0
Slovenia 14.8 5.9 9.2 30.7 39.4 48.8 9.7 6.4 14.2 21.0 44.9 13.2 13.9 16.7 11.2
Spain 20.1 10.6 17.0 22.7 29.5 40.6 8.2 9.1 13.0 29.1 50.5 14.2 13.8 11.7 9.8
Sweden 12.0 6.7 10.7 23.1 47.5 27.8 9.3 11.6 17.2 34.1 39.5 13.4 15.2 11.8 20.1
Switzerland 8.8 7.7 13.7 29.9 40.0 21.7 15.2 14.0 18.2 30.9 23.1 17.4 22.7 25.0 11.8
United Kingdom 8.7 6.6 12.5 26.3 45.9 18.2 7.9 10.7 15.9 47.3 34.8 12.1 14.9 16.6 21.6
United States 7.7 6.6 17.9 16.9 50.9 10.9 7.6 12.6 16.7 52.2 25.6 15.2 27.3 16.4 15.5
1 2 http://dx.doi.org/10.1787/888932829780
ENTREPRENEURSHIP AT A GLANCE 2013 © OECD 2013 31

2. STRUCTURAL INDICATORS ON ENTERPRISE POPULATION
Value added by size class
Key facts
– In most countries, enterprises with more than 250 per-sons employed account for a considerable part of thevalue added of the business sector – 40% on average –despite less than 2% of businesses.
– The share of value-added created by large enterprisesvaries significantly across countries with over 50% inBrazil and the United Kingdom and around 25% inGreece.
– Micro-enterprises contribute around 20% of value addedin most economies, with the share ranging from as littleas 4% in Japan to nearly 40% in Greece.
Relevance
There are significant differences in entrepreneurship andproductivity performance across countries. Part of theexplanation for these differences relates to enterprise size.Larger enterprises for example have typically higher pro-ductivity levels than smaller enterprises. Measures of valueadded broken down by size class therefore provide impor-tant insights into structural factors that drive growth,employment and entrepreneurial value.
Comparability
Data refer to value added at factor costs in EU countriesand value added at basic prices for other countries.
The size-class breakdown 1-9, 10-19, 20-49, 50-249, 250+persons employed provides for the best comparabilitygiven the varying data collection practices across countries.Some countries use different conventions: for Australia, thesize class “1-9” refers to “1-19”, “20-49” refers to “20-199”,“250+” refers to “200+”; for Israel, “50-249” refers to “50+”;for Japan “1-9” refers to “4-9 ; for Korea “1-9” refers to “5-9”;for Mexico “1-9” refers to “1-10”, “10-19” refers to “11-20”,“20-49” refers to “21-50”, “50-249” refers to “51-250”, “250+”refers to “251+”; for Turkey the size class “1-9” refers to “1-19”.
Data cover the market economy, excluding financial inter-mediation. Only manufacturing is covered for Japan.
Source/Online database
OECD Structural and Demographic Business Statistics (SDBS)Database, http://dx.doi.org/10.1787/sdbs-data-en.
For further reading
OECD (2010), Structural and Demographic Business Statistics,OECD Publishing, Paris, http://dx.doi.org/10.1787/9789264072886-en.
Information on data for Israel: http://dx.doi.org/10.1787/888932315602.
Definitions
Value added corresponds to the difference betweenproduction and intermediate consumption, wheretotal intermediate consumption is valued at purchas-ers’ prices. Depending on the valuation of productionand on the treatment applied to indirect taxes andsubsidies of production, the valuation of value addedis either at basic prices, producers’ prices or factorcosts.
Data in this section present the value added in eachenterprise size class (defined by the number of per-sons employed) as a percentage of the value added ofall enterprises.
ENTREPRENEURSHIP AT A GLANCE 2013 © OECD 201332

2. STRUCTURAL INDICATORS ON ENTERPRISE POPULATION
Value added by size class
Figure 2.10. Value added by enterprise size classPercentage, 2010 or latest available year
1 2 http://dx.doi.org/10.1787/888932828355
Table 2.4. Value added by enterprise size classPercentage, 2010 or latest available year
1-9 10-19 20-49 50-249 250+
Australia (2009) 30.18 – 22.66 – 47.16Austria 18.58 8.60 12.08 21.72 39.02Belgium 21.92 7.20 11.76 19.63 39.48Brazil 10.58 5.84 8.44 15.90 59.24Bulgaria 16.48 8.10 11.81 23.76 39.86Czech Republic 20.14 5.72 9.40 20.58 44.16Denmark (2009) 23.35 9.91 13.93 20.28 32.53Finland 20.59 7.63 10.87 17.67 43.26France 26.18 6.71 10.08 14.97 42.05Germany (2009) 15.86 7.48 8.66 19.85 48.15Greece (2007) 37.29 9.20 12.64 15.92 24.95Hungary 19.30 7.56 8.71 18.73 45.70Ireland (2009) 16.83 7.69 13.77 21.50 40.20Israel 23.07 6.31 10.52 60.10Italy 29.59 10.20 10.95 16.30 32.96Japan (2007) 3.98 5.97 11.36 28.01 50.68Korea (2006) 5.40 7.45 12.26 20.22 54.68Latvia 19.01 8.76 14.01 25.91 32.30Lithuania 11.59 8.78 13.85 29.20 36.58Luxembourg 22.77 8.16 10.58 24.13 34.37Mexico (2003) 17.85 6.16 8.65 20.94 46.39Norway (2009) 36.73 5.58 8.15 16.27 33.27Poland 15.91 4.29 8.87 21.50 49.42Portugal 24.09 9.15 12.62 22.32 31.83Slovak Republic 25.50 10.47 7.84 17.22 38.97Slovenia 20.63 8.15 11.39 22.54 37.29Spain 26.57 9.20 11.83 17.02 35.39Sweden 21.00 7.26 10.72 18.29 42.73Switzerland 12.19 9.25 12.58 24.85 41.13Turkey (2009) 26.37 – 8.54 19.69 45.39United Kingdom 18.20 6.63 8.76 16.38 50.03
1 2 http://dx.doi.org/10.1787/888932829799
0
10
20
30
40
50
60
70
80
90
100
1-9 10-19 20-49 50-249 250+
ENTREPRENEURSHIP AT A GLANCE 2013 © OECD 2013 33

2. STRUCTURAL INDICATORS ON ENTERPRISE POPULATION
Productivity by enterprise size class
Key facts
– Enterprise size matters for productivity. In most coun-tries there is evidence of increasing returns to scale.Larger firms are on average more productive thansmaller ones and this generally holds for all industries.
– Structural differences in the industrial composition ofeconomies impact on the relative performance of largeand small firms across countries. In countries with largeindustrial sectors and relatively low income per capitafor example large firms are, on average, 2-3 times as pro-ductive as smaller firms. In countries with large servicessectors however and relatively high income per capitasmall firms are often more productive than large firms.This reflects the importance of focusing on sectoral com-parisons in addition to total economy.
Relevance
Productivity reflects the efficiency with which resourcesare allocated within an economy. Resource reallocation, inturn, is driven by firm dynamics, i.e. the entry of new firmsand the exit of the least productive firms. To the extent thatlarge firms can exploit increasing returns to scale, produc-tivity should increase with firm size. Moreover, new, typi-cally small firms are often found to spur aggregateproductivity growth as they enter with new technologiesand stimulate productivity enhancing changes byincumbents.
Comparability
The value added estimates presented for size classes arebased on Structural Business Statistics and will not usuallyalign with estimates produced in the National Accounts.The latter include a number of adjustments to reflect busi-nesses and activities that may not be measured in struc-tural business statistics, such as adjustments to reflect theNon-Observed Economy.
For productivity analysis the theoretically preferable mea-sure for labour input is total hours worked rather thanemployment but these data are not typically available byindustry and size class. While over the medium term,employment can provide an indication for trends in hoursworked, in the short run, differences can arise, which candistort cross-country comparability.
The size-class breakdown, based on persons employed (1-9,10-19, 20-49, 50-249, 250+), provides for the best compara-bility given the varying data collection practices acrosscountries. Some countries use different conventions. ForAustralia, the class “50-249” refers to “20-199” and the class“250+” refers to “200+”.
Sources/Online databases
OECD Structural and Demographic Business Statistics (SDBS)Database, www.oecd.org/std/industry-services.
OECD Productivity Database, www.oecd.org/statistics/productivity.
For further reading
OECD (2012), OECD Compendium of Productivity Indicators2012, OECD Publishing, Paris, http://dx.doi.org/10.1787/9789264188846-en.
OECD (2001), Measuring Productivity. OECD Manual, OECDPublishing, Paris, www.oecd.org/std/productivity-stats/2352458.pdf.
Definitions
The labour productivity estimates shown in Figure 2.11are based on value added per employee.
For the definition of “Total economy”, see Reader’sGuide.
ENTREPRENEURSHIP AT A GLANCE 2013 © OECD 201334

2. STRUCTURAL INDICATORS ON ENTERPRISE POPULATION
Productivity by enterprise size class
Figure 2.11. Productivity level by enterprise size class, total economyThousands of US dollars per employee, 2010
1 2 http://dx.doi.org/10.1787/888932828374
Table 2.5. Productivity level by enterprise size class and sector, total economyThousands of US dollars per employee, 2010
Total Industry Manufacturing Services
1-9 10-19 20-49 50-249 250+ 1-9 10-19 20-49 50-249 250+ 1-9 10-19 20-49 50-249 250+
Poland 11.57 24.00 27.96 29.41 41.09 11.05 18.81 21.45 26.24 48.29 15.01 28.83 35.92 35.61 34.05
Hungary 13.30 20.45 22.40 28.55 40.77 14.35 18.85 21.94 27.73 58.73 16.24 25.13 24.14 29.12 27.04
Portugal 18.30 28.93 33.91 44.41 48.86 25.84 24.63 29.85 39.99 81.76 18.61 32.00 41.60 52.10 39.36
Slovak Republic 19.01 29.30 29.02 30.57 39.05 15.23 24.09 22.04 31.99 46.82 24.61 31.49 33.31 30.57 33.13
Estonia 19.49 21.76 27.25 31.15 31.08 19.28 22.04 26.39 29.73 33.20 23.05 23.07 32.33 35.68 31.97
Slovenia 25.09 37.14 42.33 41.55 50.58 26.65 39.40 37.35 40.65 57.23 26.31 37.00 49.12 44.22 56.06
Spain 34.70 48.83 54.26 65.02 75.95 38.34 54.48 64.57 77.56 125.16 35.94 46.64 51.04 56.17 62.11
Italy 36.56 51.57 63.97 77.15 97.07 37.90 53.16 66.91 88.25 120.02 40.91 49.60 60.78 60.99 87.08
Germany 41.63 37.50 39.00 68.40 50.21 42.83 51.40 56.37 68.34 104.08 68.06 49.43 52.96 60.26 64.49
Austria 57.22 61.67 72.97 90.36 96.17 64.38 65.75 76.84 95.99 136.29 61.72 60.08 70.73 92.08 82.10
Belgium 59.26 75.01 87.97 110.23 110.86 92.72 83.36 86.45 106.47 159.60 57.83 70.77 89.60 112.11 78.40
Switzerland 62.95 66.41 80.08 106.62 117.47 84.96 90.57 116.09 129.77 198.56 77.48 65.40 101.05 112.89 140.12
Finland 64.77 66.26 74.07 83.11 91.41 71.13 71.74 79.95 93.24 126.62 73.44 64.50 80.19 77.20 74.72
Sweden 68.15 64.14 74.73 84.38 103.29 64.75 67.92 78.00 91.54 152.83 84.54 62.62 72.93 81.60 75.02
France 68.95 110.24 110.13 73.86 86.67 60.53 64.98 69.90 77.31 110.87 80.52 68.39 69.59 75.78 80.45
Australia 70.74 82.62 121.10 95.90 126.51 239.23 61.46 67.01 82.89
United Kingdom 73.24 56.96 54.90 68.28 73.20 83.82 64.40 59.82 82.95 151.50 74.68 59.07 52.49 62.76 67.71
Luxembourg 124.50 83.84 75.51 100.58 109.20 71.75 142.20 162.74 149.68 95.32 92.12 94.22 76.57
Ireland 60.44 72.59 82.70 155.95 378.01 46.16 50.84 65.77 52.26 70.87
Denmark 153.61 87.66 94.60 107.29 159.97 103.18 73.99 81.74 91.65 117.66
Norway 1996.44 141.21 131.28 222.52 247.59 169.89 90.37 99.31 117.56 111.82
1 2 http://dx.doi.org/10.1787/888932829818
0
20
40
60
80
100
120
140
1-9 10-19 20-49 50-249 250+
ENTREPRENEURSHIP AT A GLANCE 2013 © OECD 2013 35

2. STRUCTURAL INDICATORS ON ENTERPRISE POPULATION
Exports by enterprise size class
Key facts
– In the majority of countries, more than 50% of totalexports are accounted for by enterprises with 250employees or more. The share of exports provided by thesmallest firms (micro enterprises) varies from 3% (inNorway) to 17% (in Denmark).
– Most enterprises are not exporters: in all countries, fewerthan 10% of firms are exporters. The propensity to exportincreases with enterprise size. Across countries, lessthan 5% of micro-enterprises are exporters while typi-cally half of large enterprises export.
– The average value of export per firm increases withenterprise size; Canada, Germany and the United Stateshave the highest average values.
Relevance
Companies are increasingly engaging in global value chainsto generate growth by specialising in specific tasks. Develo-ping policies that allow smaller companies to engage eitherdirectly or indirectly into global value chains is high on thepolicy agenda.
Comparability
Trade statistics by enterprise characteristics are developedby linking firms identified in trade registers to the samefirms in business registers.
In European countries the enterprise is used as the statisti-cal unit, while the establishment is used in Canada and theUnited States.
For EU member states, data on intra-EU and extra-EU exportsare treated separately, owing to different data collection sys-tems and thresholds. For Figure 2.12, total exports are com-piled by adding intra-EU and extra-EU exports.
Some differences may also arise due to the way in whichcountries compile international merchandise trade statis-tics. The general trade system, used by Canada, Czech Repu-blic, Denmark, Estonia, Norway, Slovenia, United Kingdomand the United States, is recommended by the Interna-tional Merchandise Trade Statistics (IMTS) manual andincludes all goods that cross the national frontier includinggoods that are imported into and exported from custom-bonded warehouses and free zones. The general trade systemis in use “when the statistical territory of a country coin-cides with its economic territory so that imports include allgoods entering the economic territory of a compiling coun-try and exports include all goods leaving the economic ter-ritory of a compiling country”. The special trade system isrecommended by Eurostat and covers goods that cross thecustoms frontier plus goods that are imported into andexported from custom-bonded areas. The special trade sys-tem is in use when the statistical territory comprises only aparticular part of the economic territory.
Data are presented by enterprise size classes of employees.
Data cover ISIC Revision 4 sectors: industry, wholesale,retail trade and repair, and other services. For Israel andNorway data are in ISIC Revision 3.
Source/Online database
OECD Trade by Enterprise Characteristics Database (TEC).
For further reading
Eurostat (2007) , “External Trade by Enterpr iseCharacteristics”, Luxembourg.
OECD (2011), “Selling to Foreign Markets: a Portrait of OECDExporters”, Statistics Brief No. 16, www.oecd.org/std/47014723.pdf.
OECD (2010), Structural and Demographic Business Statistics,OECD Publishing, Paris, http://dx.doi.org/10.1787/9789264072886-en.
United Nations (2011), International Merchandise TradeStatistics: Concept and Definitions 2010 (IMTS 2010), http://unstats.un .org/unsd/ t rade/EG- IMTS/IMTS%202010%20%28English%29.pdf.
Definitions
Exports refer to the outward flows of goods subtractedfrom the stock of material resources of a country.Goods simply being transported through a country(goods in transit) or temporarily admitted or with-drawn (except for goods for inward or outward pro-cessing) do not add to or subtract from the stock ofmaterial resources of a country and are not includedin the international merchandise trade statistics(International Merchandise Trade Statistics: Concept andDefinitions 2010, United Nations).
Figure 2.12 shows the merchandise exports of enter-prises in each size class as a percentage of exports ofall enterprises. For EU countries the population of thenumerator and denominator refers only to enter-prises exporting extra-EU.
Figure 2.13 presents the value (in million US dollar) ofexports divided by exporting enterprises, by sizeclass.
ENTREPRENEURSHIP AT A GLANCE 2013 © OECD 201336

2. STRUCTURAL INDICATORS ON ENTERPRISE POPULATION
Exports by enterprise size class
Figure 2.12. Exports by enterprise size classPercentage of exports of all exporting enterprises, values in US dollars, 2010 or latest available year
1 2 http://dx.doi.org/10.1787/888932828393
Figure 2.13. Average value of exports per firm, by enterprise size classIn million US dollar, 2010 or latest available year
1 2 http://dx.doi.org/10.1787/888932828412
0
10
20
30
40
50
60
70
80
90
100%
0-9 10-49 50-249 250+ Unknown
0
5
10
15
20
25
30
0- 9 10- 49 50+ TOTAL
ENTREPRENEURSHIP AT A GLANCE 2013 © OECD 2013 37


ENTREPRENEURSHIP AT A GLANCE 2013
3. ENTERPRISE BIRTH, DEATHAND SURVIVAL
Birth rate of employer enterprises
Death rate of employer enterprises
Churn rate of employer enterprises
Survival rate of employer enterprises
© OECD 2013 39

3. ENTERPRISE BIRTH, DEATH AND SURVIVAL
Birth rate of employer enterprises
Key facts
– Birth rates of employer enterprises (i.e. firms with atleast one employee) are higher in the services sectorthan in manufacturing. Newly created firms typicallyemploy one to four employees, while few start with morethan ten employees.
– The effects of the global crisis are noticeable: between2007 and 2010 birth rates decreased in all countrieswhere data are available.
Relevance
The birth of new enterprises is a key indicator of businessdynamism. It reflects an important dimension of entrepre-neurship in a country, namely the capacity to start upentirely new businesses. Furthermore, the birth ofemployer enterprises is a different phenomenon comparedto that of non-employer firms. The former are economi-cally more relevant and more closely related to the notionof entrepreneurship as a driver of job creation andinnovation.
Comparability
“Employer” indicators are found to be more relevant forinternational comparisons than indicators covering allenterprises, as the latter are sensitive to the coverage of
business registers. In many countries, the main sources ofdata used in business registers are administrative tax andemployment registers, meaning that often only businessesabove a certain turnover and/or employment threshold arecaptured. An economy with relatively high thresholdswould therefore be expected to have lower birth statisticsthan similar economies with lower thresholds. An addi-tional complication relates to changes in thresholds overtime. Monetary-based thresholds change over time inresponse to factors such as inflation and fiscal policy, bothof which can be expected to affect comparisons of birthrates across countries and over time. The use of the one-employee threshold improves comparability, as it excludesvery small units, which are the most subject to thresholdvariations.
The concept of employer enterprise birth is not howeverwithout problems. Many countries have sizeable popula-tions of self-employed. If a country creates incentives forthe self-employed to become employees of their own com-pany, the total number of employer enterprise births willincrease. This can distort comparisons over time andacross countries, even if from an economic and entrepre-neurial perspective little has changed.
Data presented refer to the whole population of employerenterprises, with the exception of Canada, for which datafor 2007 and earlier years refer to employer enterpriseswith less than 250 employees.
For Australia and Mexico, enterprise births and indicatorsderived from them do not take into account the transitionof enterprises from 0 employee to 1 or more employee sta-tus, i.e. the transition of a non-employer enterprise to thestatus of employer firm is not considered as an “employerenterprise birth”.
Sources/Online databases
OECD Structural and Demographic Business Statistics (SDBS)Database, http://dx.doi.org/10.1787/sdbs-data-en.
Counts of Australian Businesses, including Entries and Exits.8165.0, http://dx.doi.org/10.1787/sdbs-data-en.
For further reading
Ahmad, N. (2006), “A Proposed Framework For BusinessDemography Statistics”, OECD Statistics Working Papers,2006/3, http://dx.doi.org/10.1787/145777872685.
Eurostat/OECD (2007), Eurostat-OECD Manual on BusinessDemography Statistics, OECD Publishing, www.oecd.org/std/39974460.pdf.
OECD (2010), Structural and Demographic Business Statistics,OECD Publishing, Paris, http://dx.doi.org/10.1787/9789264072886-en.
Information on data for Israel: http://dx.doi.org/10.1787/888932315602.
Definitions
An employer enterprise birth refers to the birth of anenterprise with at least one employee. The populationof employer enterprise births consists first of “new”enterprise births, i.e. new enterprises reporting atleast one employee in the birth year; and second ofenterprises that existed before the year underconsideration but were at that time below the thresh-old of one employee, and that reported one or moreemployees in the current, i.e. birth, year.
Employer enterprise births do not include entries intothe population due to: mergers, break-ups, split-offsor restructuring of a set of enterprises. They alsoexclude entries into a sub-population resulting onlyfrom a change of activity.
The employer enterprise birth rate corresponds to thenumber of births of employer enterprises as a percentageof the population of active enterprises with at leastone employee.
For the definition of “Total economy”, see Reader’sGuide.
ENTREPRENEURSHIP AT A GLANCE 2013 © OECD 201340

3. ENTERPRISE BIRTH, DEATH AND SURVIVAL
Birth rate of employer enterprises
Figure 3.1. Employer enterprise birth rate, total economyPercentage
1 2 http://dx.doi.org/10.1787/888932828431
0
2
4
6
8
10
12
14
16
18
20
France Hungary Israel Italy Korea Latvia Lithuania Luxembourg Mexico Netherlands
2005 2006 2007 2008 2009 2010 2011
21
0
2
4
6
8
10
12
14
16
18
20
Australia Austria Belgium Brazil Bulgaria Canada Czech Republic Denmark Estonia Finland
2005 2006 2007 2008 2009 2010
0
2
France Hungary Israel Italy Korea Latvia Lithuania Luxembourg Mexico Netherlands
0
2
4
6
8
10
12
14
16
18
20
New Zealand Norway Portugal Romania Slovak Republic Slovenia Spain Sweden Switzerland United States
2005 2006 2007 2008 2009 2010 2011
ENTREPRENEURSHIP AT A GLANCE 2013 © OECD 2013 41

3. ENTERPRISE BIRTH, DEATH AND SURVIVAL
Birth rate of employer enterprises
Figure 3.2. Employer enterprise birth rate by sectorPercentage, 2010 or latest available year
1 2 http://dx.doi.org/10.1787/888932828450
Figure 3.3. Employer enterprise birth rate by size class, manufacturingPercentage, 2010 or latest available year
1 2 http://dx.doi.org/10.1787/888932828469
Figure 3.4. Employer enterprise birth rate by size class, servicesPercentage, 2010 or latest available year
1 2 http://dx.doi.org/10.1787/888932828488
0
5
10
15
20
25
Manufacturing Services
0
5
10
15
20
25
1-4 5-9 10+
0
5
10
15
20
25
1-4 5-9 10+
ENTREPRENEURSHIP AT A GLANCE 2013 © OECD 201342

3. ENTERPRISE BIRTH, DEATH AND SURVIVAL
Birth rate of employer enterprises
Figure 3.5. Employer enterprise births by legal form,manufacturing
Percentage, 2010 or latest available year
1 2 http://dx.doi.org/10.1787/888932828507
Figure 3.7. Employer enterprise births by legal form,services
Percentage, 2010 or latest available year
1 2 http://dx.doi.org/10.1787/888932828545
0
10
20
30
40
50
60
70
80
90
100
Limited liability Partnership Sole proprietorship
0
10
20
30
40
50
60
70
80
90
100
Limited liability Partnership Sole proprietorship
Figure 3.6. Employer enterprise birth rates by legalform, manufacturing
Percentage, 2010 or latest available year
1 2 http://dx.doi.org/10.1787/888932828526
Figure 3.8. Employer enterprise birth rates by legalform, services
Percentage, 2010 or latest available year
1 2 http://dx.doi.org/10.1787/888932828564
0
2
4
6
8
10
12
14
16
18
20
Limited liability Partnership Sole proprietorship
26
0
2
4
6
8
10
12
14
16
18
20
Limited liability Partnership Sole proprietorship
40
ENTREPRENEURSHIP AT A GLANCE 2013 © OECD 2013 43

3. ENTERPRISE BIRTH, DEATH AND SURVIVAL
Death rate of employer enterprises
Key facts
– In all countries, the death rates of employer enterprisesin the services sector are consistently higher than thecorresponding rates in the manufacturing sector.
– In several countries, the death rate of employer enter-prises increased in 2007 at the beginning of the globalcrisis and continued increasing in 2008 and 2009.
– Very small firms, with one to four employees, have thehighest death rates.
Relevance
The death of enterprises is an integral part of the pheno-menon of entrepreneurship. Knowing the percentage offirms that die in a given year and comparing it over timeand across countries is of high interest to policy makers tounderstand, for example, the process of creative destruc-tion and the impact of economic cycles.
Comparability
Compared to data on births of employer enterprises, thereis an additional time lag in data collection of enterprisedeaths linked to the process of confirming the event: it hasto be checked that the enterprise has not been reactivated
(or had no employees) in the two years following its death.Hence, information on death rates presented in this publi-cation refers mainly to 2009, and not to 2010 as for all otherindicators.
“Employer” indicators are found to be more relevant forinternational comparisons than indicators covering allenterprises, as the latter are sensitive to the coverage ofbusiness registers. In many countries, the main sources ofdata used in business registers are administrative tax andemployment registers, meaning that often only businessesabove a certain turnover and/or employment threshold arecaptured. An additional complication in this regard relatesto changes in thresholds over time. Monetary based thres-holds change over time in response to factors such as infla-tion and fiscal policy, both of which can be expected toaffect comparisons of death rates across countries and overtime. The use of the one-employee threshold improvescomparability, as it excludes very small units, which are themost subject to threshold variations.
Data presented refer to the whole population of employerenterprises, with the exception of Canada, for which datafor 2007 and earlier years refer to employer enterpriseswith less than 250 employees.
For Australia, enterprise deaths and indicators derivedfrom them do not take into account the transition of enter-prises from one or more employees to zero employees sta-tus, i.e. the transition of an employer firm to the status of anon-employer enterprise is not considered as an “employerenterprise death”.
Source/Online database
OECD Structural and Demographic Business Statistics (SDBS)Database, http://dx.doi.org/10.1787/sdbs-data-en.
For further reading
Ahmad, N. (2006), “A Proposed Framework For BusinessDemography Statistics”, OECD Statistics Working Papers,2006/3, OECD Publishing, Paris, http://dx.doi.org/10.1787/145777872685.
Eurostat/OECD (2007), Eurostat-OECD Manual on BusinessDemography Statistics, OECD Publishing, www.oecd.org/std/39974460.pdf.
OECD (2010), Structural and Demographic Business Statistics,OECD Publishing, Paris, http://dx.doi.org/10.1787/9789264072886-en.
Information on data for Israel: http://dx.doi.org/10.1787/888932315602.
Definitions
An employer enterprise death occurs either at the deathof an enterprise with at least one employee in theyear of death or when an enterprise shrinks to belowthe threshold of one employee for at least two years.
Deaths do not include exits from the population dueto mergers, take-overs, break-ups and restructuringof a set of enterprises. They also exclude exits from asub-population resulting only from a change ofactivity.
The employer enterprise death rate corresponds to thenumber of deaths of employer enterprises as a percentageof the population of active enterprises with at leastone employee.
For the definition of “Total economy”, see Reader’sGuide.
ENTREPRENEURSHIP AT A GLANCE 2013 © OECD 201344

3. ENTERPRISE BIRTH, DEATH AND SURVIVAL
Death rate of employer enterprises
Figure 3.9. Employer enterprise death rate, total economyPercentage
1 2 http://dx.doi.org/10.1787/888932828583
0
2
4
6
8
10
12
14
16
18
20
Australia Austria Belgium Brazil Bulgaria Canada Czech Republic Denmark Estonia
2005 2006 2007 2008 2009 2010
0
2
4
6
8
10
12
14
16
18
Finland France Hungary Israel Italy Korea Latvia Lithuania Luxembourg
2005 2006 2007 2008 2009
0
2
Finland France Hungary Israel Italy Korea Latvia Lithuania Luxembourg
0
2
4
6
8
10
12
14
16
18
20
Netherlands New Zealand Norway Portugal Romania Slovak Republic Slovenia Spain United States
2005 2006 2007 2008 2009 2010
ENTREPRENEURSHIP AT A GLANCE 2013 © OECD 2013 45

3. ENTERPRISE BIRTH, DEATH AND SURVIVAL
Death rate of employer enterprises
Figure 3.10. Employer enterprise death rates by sectorPercentage, 2010 or latest available year
1 2 http://dx.doi.org/10.1787/888932828602
Figure 3.11. Employer enterprise death rate by size class, manufacturingPercentage, 2010 or latest available year
1 2 http://dx.doi.org/10.1787/888932828621
Figure 3.12. Employer enterprise death rate by size class, servicesPercentage, 2010 or latest available year
1 2 http://dx.doi.org/10.1787/888932828640
0
2
4
6
8
10
12
14
16
18
20
Manufacturing Services
0
5
10
15
20
25
1-4 5-9 10+
0
5
10
15
20
25
1-4 5-9 10+
ENTREPRENEURSHIP AT A GLANCE 2013 © OECD 201346

3. ENTERPRISE BIRTH, DEATH AND SURVIVAL
Death rate of employer enterprises
Figure 3.13. Employer enterprise deaths by legalform, manufacturing
Percentage, 2010 or latest available year
1 2 http://dx.doi.org/10.1787/888932828659
Figure 3.15. Employer enterprise deaths by legalform, services
Percentage, 2010 or latest available year
1 2 http://dx.doi.org/10.1787/888932828697
0
10
20
30
40
50
60
70
80
90
100
Limited liability Partnership Sole proprietorship
0
10
20
30
40
50
60
70
80
90
100
Limited liability Partnership Sole proprietorship
Figure 3.14. Employer enterprise death rates by legalform, manufacturing
Percentage, 2009
1 2 http://dx.doi.org/10.1787/888932828678
Figure 3.16. Employer enterprise death rates by legalform, servicesPercentage, 2009
1 2 http://dx.doi.org/10.1787/888932828716
0
2
4
6
8
10
12
14
16
18
20
Limited liability Partnership Sole proprietorship
0
2
4
6
8
10
12
14
16
18
20
Limited liability Partnership Sole proprietorship
ENTREPRENEURSHIP AT A GLANCE 2013 © OECD 2013 47

3. ENTERPRISE BIRTH, DEATH AND SURVIVAL
Churn rate of employer enterprises
Key facts
– Churn rates of employer enterprises are higher in theservices sector than in manufacturing, reflecting moresignificant business dynamics in services.
– Churn rates are relatively similar across countries andover time, ranging from 10% to 20% in manufacturingand from 15% to 25% in services. Only a few countriesshow much lower (Belgium, Israel) or much higher(Australia, Korea and Hungary) churn rates. Portugal sawa significant drop in churn rates in services and manu-facturing from 2007 to 2010.
Relevance
The churn rate, i.e. the sum of birth and death rates ofenterprises, indicates how frequently new firms are cre-ated and how often existing enterprises close down. Inmost economies, the number of births and deaths of enter-prises is a sizeable proportion of the total number of firms.The indicator reflects a country’s degree of “creativedestruction”, and it is of high interest for analysing, forexample, the contribution of firm churning to aggregateproductivity growth.
Comparability
Employer enterprise birth and death data used in the com-pilation of the employer enterprise churn rate follow thedefinition given in the Eurostat-OECD Manual on BusinessDemography Statistics (2007).
As shown in previous sections, “employer” indicators pro-vide the basis for a higher degree of international compara-bility than indicators based on all enterprises, as the latterare sensitive to the coverage of, and thresholds used in,business registers.
Data presented refer to the whole population of employerenterprises, with the exception of Canada, for which datafor 2007 and earlier years refer to employer enterpriseswith less than 250 employees.
For Australia, enterprise births and deaths and indicatorsderived from them do not take into account the transitionof enterprises from zero employees to one or more emplo-yees status or vice versa, i.e. the transition of a non-employer enterprises to the status of employer firm is notconsidered as an “employer enterprise birth”, and the tran-sition of an employer firm to the status of a non-employerenterprise is not considered as an “employer enterprisedeath”.
Source/Online database
OECD Structural and Demographic Business Statistics (SDBS)Database, http://dx.doi.org/10.1787/sdbs-data-en.
For further reading
Ahmad, N. (2006), “A Proposed Framework For BusinessDemography Statistics”, OECD Statistics Working Papers,2006/3, OECD Publishing, Paris, http://dx.doi.org/10.1787/145777872685.
OECD (2010), Structural and Demographic Business Statistics,OECD Publishing, Paris, http://dx.doi.org/10.1787/9789264072886-en.
Eurostat/OECD (2007), Eurostat-OECD Manual on BusinessDemography Stat ist ics , OECD Publishing, Paris ,www.oecd.org/std/39974460.pdf.
Scarpetta, S. et al. (2002), “The role of policy andinstitutions for productivity and firm dynamics:evidence from micro and industry data”, OECD EconomicDepartment Working Papers, No. 329, http://dx.doi.org/10.1787/547061627926.
Information on data for Israel: http://dx.doi.org/10.1787/888932315602.
Definitions
The employer enterprise churn rate is compiled as thesum of the employer enterprise birth rate and theemployer enterprise death rate.
The employer enterprise churn rate does not includeentries and exits into the population due to mergers,break-ups or restructuring of a set of enterprises. Itdoes not include: exits due to take-overs; entries dueto split-offs; and entries and exits into a sub-popula-tion resulting only from a change of activity.
There is a time lag in the employer enterprise churnrate compilation, linked to the process of confirma-tion of employer enterprise deaths.
For the definition of “Total economy”, see Reader’sGuide.
ENTREPRENEURSHIP AT A GLANCE 2013 © OECD 201348

3. ENTERPRISE BIRTH, DEATH AND SURVIVAL
Churn rate of employer enterprises
Figure 3.17. Employer enterprise churn rate, manufacturingPercentage
1 2 http://dx.doi.org/10.1787/888932828735
Figure 3.18. Employer enterprise churn rate, servicesPercentage
1 2 http://dx.doi.org/10.1787/888932828754
0
5
10
15
20
25
30
2010 2006
0
5
10
15
20
25
30
35
40
2010 2006
ENTREPRENEURSHIP AT A GLANCE 2013 © OECD 2013 49

3. ENTERPRISE BIRTH, DEATH AND SURVIVAL
Survival rate of employer enterprises
Key facts
– The survival rates of employer enterprises in the manu-facturing sector are typically higher than in the servicessector and the difference typically persists in every yearafter birth; Canada and the Slovak Republic are excep-tions, with almost identical survival rates in the twosectors.
– On average, survival rates after one year are 85% to 90%in manufacturing and a little lower in services, with onlymarginal improvements in the conditional probability ofsurvival in the second and third year.
– Young enterprises represent a larger share of the totalpopulation of enterprises in the services sector than inthe manufacturing sector, reflecting the higher birth rateof service sector enterprises.
Relevance
Observing the post-entry performance of firms is as impor-tant as analysing their birth rate. Very high failure rates forexample can act as a disincentive to both budding entre-preneurs as well as potential creditors, which could stymielong term growth and innovation.
Comparability
Employer enterprise survival data in this publication followthe definition from the Eurostat-OECD Manual on BusinessDemography Statistics (2007).
Data presented refer to the whole population of employerenterprises, with the exception of Canada, for which datafor 2007 and earlier years refer to employer enterpriseswith less than 250 employees.
For Australia and Mexico, enterprise births and deaths andindicators derived from them do not take into account thetransition of enterprises from zero employees to one ormore employees status or vice versa, i.e. the transition of anon-employer enterprises to the status of employer firm isnot considered as an “employer enterprise birth”, and thetransition of an employer firm to the status of a non-employer enterprise is not considered as an “employerenterprise death”.
Source/Online database
OECD Structural and Demographic Business Statistics (SDBS)Database, http://dx.doi.org/10.1787/sdbs-data-en.
For further reading
Ahmad, N. (2006), “A Proposed Framework for BusinessDemography Statistics”, OECD Statistics Working Papers,2006/3, OECD Publishing, Paris, http://dx.doi.org/10.1787/145777872685.
Eurostat/OECD (2007), Eurostat-OECD Manual on BusinessDemography Stat ist ics , OECD Publishing, Paris ,www.oecd.org/std/39974460.pdf.
OECD (2010), Structural and Demographic Business Statistics,OECD Publishing, Paris, http://dx.doi.org/10.1787/9789264072886-en.
Information on data for Israel: http://dx.doi.org/10.1787/888932315602.
Definitions
The number of n-year survival enterprises for a par-ticular year t refers to the number of enterpriseswhich had at least one employee for the first time inyear t-n and remained active in year t.
An enterprise is also considered to have survived ifthe linked legal unit(s) has (have) ceased to be active,but their activity has been taken over by a new legalunit set up specifically to take over the factors of pro-duction of that enterprise (survival by takeover). Thisdefinition of survival excludes cases in which enter-prises merge or are taken over by an existing enter-prise in year t-n.
The survival of an enterprise is an event that shouldalways be observed between two consecutive years.For instance, an enterprise born in year t-2 should beconsidered as having survived to t only if it had atleast one employee also in year t-1, and so forth.
The employer enterprise survival rate measures the num-ber of enterprises of a specific birth cohort that havesurvived over different years. The n-year survival ratefor a reference year t is calculated as the number ofn-year survival enterprises as a percentage of allenterprises that reported at least one employee forthe first time in year t-n.
The share of n-year-old employer enterprises for a particu-lar year t refers to the number of n-year survivalenterprises as a percentage of the total employerenterprise population in year t.
For the definition of “Total economy”, see Reader’s Guide.
ENTREPRENEURSHIP AT A GLANCE 2013 © OECD 201350

3. ENTERPRISE BIRTH, DEATH AND SURVIVAL
Survival rate of employer enterprises
Figure 3.19. Share of young enterprises, manufacturingPercentage, 2010 or latest available year
1 2 http://dx.doi.org/10.1787/888932828773
Figure 3.20. Share of young enterprises, servicesPercentage, 2010 or latest available year
1 2 http://dx.doi.org/10.1787/888932828792
0
2
4
6
8
10
12
1 year old enterprises'share of the business population 2 year old enterprises'share of the business population3 year old enterprises'share of the business population
0
2
4
6
8
10
12
1 year old enterprises'share of the business population 2 year old enterprises'share of the business population3 year old enterprises'share of the business population
ENTREPRENEURSHIP AT A GLANCE 2013 © OECD 2013 51

3. ENTERPRISE BIRTH, DEATH AND SURVIVAL
Survival rate of employer enterprises
Figure 3.21. Enterprise survival ratesPercentage, 2006 cohort
1 2 http://dx.doi.org/10.1787/888932828811
40
50
60
70
80
90
100
2006 Cohort 1 Year 2 Years 3 Years 4 Years
Austria CanadaCzech Republic EstoniaFinland Hungary
Manufacturing (%)
40
50
60
70
80
90
100
Israel Italy KoreaLatvia Lithuania LuxembourgNetherlands New Zealand
40
50
60
70
80
90
100
Israel Italy KoreaLatvia Lithuania LuxembourgNetherlands New Zealand
40
50
60
70
80
90
100
2006 Cohort 1 Year 2 Years 3 Years 4 Year
Austria CanadaCzech Republic EstoniaFinland Hungary
Services (%)
402006 Cohort 1 Year 2 Years 3 Years 4 Years
402006 Cohort 1 Year 2 Years 3 Years 4 Yea
40
50
60
70
80
90
100
2006 Cohort 1 Year 2 Years 3 Years 4 Years
Portugal Romania SlovakiaSlovenia Spain SwitzerlandUnited States
40
50
60
70
80
90
100
2006 Cohort 1 Year 2 Years 3 Years 4 Yea
Portugal Romania SlovakiaSlovenia Spain SwitzerlandUnited States
ENTREPRENEURSHIP AT A GLANCE 2013 © OECD 201352

3. ENTERPRISE BIRTH, DEATH AND SURVIVAL
Survival rate of employer enterprises
Figure 3.22. Survival rates of different cohort of enterprises, total economyPercentage
1 2 http://dx.doi.org/10.1787/888932828830
30
40
50
60
70
80
90
100
Year of birth 1 year 2 year 3 year 4 year 5 year
Australia 2004 Australia 2005 Australia 2006
30
40
50
60
70
80
90
100
Spain 2004 Spain 2005 Spain 2006
30
40
50
60
70
80
90
100
Year of birth 1 year 2 year 3 year 4 year 5 year
Israel 2005 Israel 2006
30
40
50
60
70
80
90
100
New Zealand 2004 New Zealand 2005New Zealand 2006
30
40
50
60
70
80
90
100
Year of birth 1 year 2 year 3 year 4 year 5 year
Hungary 2004 Hungary 2005 Hungary 2006
30
40
50
60
70
80
90
100
Year of birth 1 year 2 year 3 year 4 year 5 year
Italy 2004 Italy 2005 Italy 2006
30
40
50
Year of birth 1 year 2 year 3 year 4 year 5 year
30
40
50
60
70
80
90
100
Year of birth 1 year 2 year 3 year 4 year 5 year
Switzerland 2004 Switzerland 2005
Switzerland 2006
30
40
50
Year of birth 1 year 2 year 3 year 4 year 5 year
30
40
50
60
70
80
90
100
Year of birth 1 year 2 year 3 year 4 year 5 year
United States 2004 United States 2005United States 2006
ENTREPRENEURSHIP AT A GLANCE 2013 © OECD 2013 53


ENTREPRENEURSHIP AT A GLANCE 2013
4. ENTERPRISE GROWTH AND EMPLOYMENTCREATION
Employment creation and destruction by employer enterprisebirths and deaths
Employment creation and destruction in surviving enterprises
High-growth enterprises rate
Gazelles rate
© OECD 2013 55
4. ENTERPRISE GROWTH AND EMPLOYMENT CREATION
Employment creation and destruction by employer enterprise births and deaths
Key Facts
– There are important differences across countries in theextent to which the birth and death of employer enter-prises affect the creation and destruction of jobs in theeconomy. In all countries however, the level of employ-ment churning is quite stable over the years covered, andconsistently higher in services than in the manufactu-ring sector; only in the Slovak Republic are significantvariations of the level of employment churningobserved. As expected, employment creation was gene-rally lower in 2009 and 2010 compared to 2006.
Relevance
The observation of the employment created by enterprisebirths or destroyed by enterprise deaths provides an indica-tion of how enterprise business demography contributes tooverall employment changes in the economy. Many studieshave shown the contribution that small and large firmsmake to net employment growth. Research in the UnitedStates has recently highlighted that the age of enterprisescould be more relevant than their size in determining theireventual contribution to employment growth.
Comparability
Data presented refer to the whole population of employerenterprises.
Data for Austria, New Zealand and Slovenia are compiledaccording to ISIC Revision 4. For other countries data after2007 are compiled in ISIC Revision 4 and data for 2007 andbefore are compiled in ISIC Revision 3.
Source/Online database
OECD Structural and Demographic Business Statistics (SDBS)Database, http://dx.doi.org/10.1787/sdbs-data-en.
For further reading
Ahmad, N. (2006), “A Proposed Framework for BusinessDemography Statistics”, OECD Statistics Working Papers,2006/3, OECD Publishing, Paris, http://dx.doi.org/10.1787/145777872685.
Bravo-Biosca, A., C. Criscuolo and C. Menon (2013), “WhatDrives the Dynamics of Business Growth ?”, OECDScience, Technology and Industry Policy Papers, No. 1, OECDPublishing, http://dx.doi.org/10.1787/5k486qtttq46-en.
Eurostat/OECD (2007), Eurostat-OECD Manual on BusinessDemography Statistics, OECD Publishing, Paris, http://dx.doi.org/10.1787/9789264072886-en.
Haltiwanger, J., R.S. Jarmin and J. Miranda (2010), “Whocreates jobs? Small vs. Large vs. Young”, DiscussionPapers , US Census Bureau, www.nber.org/papers/w16300.pdf?new_window=1.
Information on data for Israel: http://dx.doi.org/10.1787/888932315602.
Definitions
The employment creation by births is measured as theemployment share of employer enterprise births. It iscalculated as the number of persons employed in thereference period t in employer enterprises newly bornin t divided by the number of persons employed in t inthe population of employer enterprises.
The employment destruction by deaths is measured asthe employment share of employer enterprise deaths.It is calculated as the number of persons employed inthe reference period t in exiting employer enterprisesdivided by the number of persons employed in t in thepopulation of employer enterprises.
For the definition of “Total economy”, see Reader’sGuide.
ENTREPRENEURSHIP AT A GLANCE 2013 © OECD 201356

4. ENTERPRISE GROWTH AND EMPLOYMENT CREATION
Employment creation and destruction by employer enterprise births and deaths
Figure 4.1. Employment creation by employerenterprise births by sector
Percentage, 2010 or latest available year
1 2 http://dx.doi.org/10.1787/888932828849
Figure 4.3. Employment creation by employer enterprisebirths, total economy
Percentage
1 2 http://dx.doi.org/10.1787/888932828887
0 1 2 3 4 5 6
Luxembourg
Slovenia (2009)
Austria
Estonia (2009)
New Zealand
Czech Republic
Spain
Hungary
Italy
Lithuania (2009)
Portugal
Romania
France (2009)
Manufacturing Services
0 1 2 3 4 5 6 7
Belgium (2006, 07)Norway
Latvia (2006, 07)Slovenia (2006, 07, 09)
LuxembourgSwedenAustria
Lithuania (2006, 07, 09)Finland (2006, 07)
Netherlands (2006, 07)Denmark
Slovak Republic (2006, 07)Bulgaria
RomaniaEstonia (2006, 08, 09)
New ZealandHungary
Czech RepublicItaly
SpainPortugal
France (2008, 09)
2006 2008 2010
Figure 4.2. Employment destruction by employerenterprise deaths by sector
Percentage, 2010 or latest available year
1 2 http://dx.doi.org/10.1787/888932828868
Figure 4.4. Employment destruction by employerenterprise deaths, total economy
Percentage
1 2 http://dx.doi.org/10.1787/888932828906
0 1 2 3 4 5 6
Luxembourg
Romania
Austria
Slovenia (2009)
Czech Republic (2009)
New Zealand
Lithuania (2009)
Spain
Hungary
Estonia (2009)
Italy
France (2009)
Portugal
Manufacturing Services
8.1
0 1 2 3 4 5 6 7
Belgium (2006, 07)
Norway (2005)
Latvia (2005, 06)
Lithuania (2006, 07, 09)
Bulgaria (2005)
Romania
Luxembourg
Netherlands
Austria
Czech Republic (2006, 08, 09)
Italy
Estonia (2006, 08, 09)
Finland (2005, 06)
Spain
New Zealand
Slovak Republic (2005, 06)
Hungary
Portugal
Slovenia (2008, 09)
France (2008, 09)
2006 2008 2010
ENTREPRENEURSHIP AT A GLANCE 2013 © OECD 2013 57

4. ENTERPRISE GROWTH AND EMPLOYMENT CREATION
Employment creation and destruction in surviving enterprises
Key Facts
– Young enterprises account from 5 to 10% of total employ-ment. Their contribution to employment decreased from2008 to 2010.
– Employment creation is driven by the establishment ofnew enterprises, rather than by the growth of enter-prises during their first years of activity. In most of thecountries with available data, enterprises that survivedfor two years did not increase their contribution to totalemployment with respect to their year of birth.
Relevance
The comparison of the employment share of one-year(two-year) old enterprises in their year of birth with theiremployment share after one year (two years) of existence,provides an indication of how rapidly the young survivingenterprises are increasing their number of personsemployed beyond the initial level and contributing to over-all employment changes in the economy.
Comparability
Data presented refer to the whole population of employerenterprises.
Source/Online database
OECD Structural and Demographic Business Statistics (SDBS)Database, http://dx.doi.org/10.1787/sdbs-data-en.
For further reading
Ahmad, N. (2006), “A Proposed Framework for BusinessDemography Statistics”, OECD Statistics Working Papers,2006/3, OECD Publishing, Paris, http://dx.doi.org/10.1787/145777872685.
Bravo-Biosca, A., C. Criscuolo and C. Menon (2013), “WhatDrives the Dynamics of Business Growth ?”, OECDScience, Technology and Industry Policy Papers, No. 1, OECDPublishing, http://dx.doi.org/10.1787/5k486qtttq46-en.
Eurostat/OECD (2007), Eurostat-OECD Manual on BusinessDemography Statistics, OECD Publishing, Paris, http://dx.doi.org/10.1787/9789264072886-en.
Haltiwanger, J., R.S. Jarmin and J. Miranda (2010), “Whocreates jobs? Small vs. Large vs. Young”, DiscussionPapers , US Census Bureau, www.nber.org/papers/w16300.pdf?new_window=1.
Definitions
The employment share of young enterprises refers to thenumber of persons employed by employer enterprisesthat have existed for up to three years (they have sur-vived three years), divided by the total number of per-sons employed.
The employment in the first (second) survival year refersto the number of persons employed in employerenterprises surviving one (two) years, divided by thetotal number of persons employed.
For the definition of “Total economy”, see Reader’sGuide.
ENTREPRENEURSHIP AT A GLANCE 2013 © OECD 201358

4. ENTERPRISE GROWTH AND EMPLOYMENT CREATION
Employment creation and destruction in surviving enterprises
Figure 4.5. Employment share of young enterprises, 2008 and 2010As a percentage of employment in the total economy
1 2 http://dx.doi.org/10.1787/888932828925
Figure 4.6. Employment share in year of birth, 1st and 2nd survival year, 2010As a percentage of employment in the total economy
1 2 http://dx.doi.org/10.1787/888932828944
0
2
4
6
8
10
12
14
16
Austria Luxembourg New Zealand Czech Republic Spain Portugal Romania Italy Hungary Slovenia
Share of employment in young enterprises 2010 Share of employment in young enterprises 2008
0
0.5
1
1.5
2
2.5
3
3.5
4
4.5
5
Employment in year of birth Employment in the 1st survival year Employment in the 2nd survival year
5.96.1
ENTREPRENEURSHIP AT A GLANCE 2013 © OECD 2013 59

4. ENTERPRISE GROWTH AND EMPLOYMENT CREATION
High-growth enterprises rate
Key Facts
– High-growth enterprises represent on average a smallshare of the total enterprise population. Typically, whenmeasured on the basis of employment growth, the shareranges between 2% and 4% for most countries. Measuresbased on turnover are generally twice as high, with therate of high growth manufacturing enterprises in Koreareaching 15%. For both measures, the shares of high-growth enterprises were lower compared to 2006 inalmost all countries.
– In all countries the prevalence of high growth firms inthe service sector (measured by employment) was higherthan in manufacturing. This was also typically the casefor measures based on turnover.
Relevance
High-growth enterprises are firms that by their extraordi-nary growth make the largest contribution to net jobcreation, despite typically representing a small proportionof the business population. Understanding the characteris-tics of high-growth firms is of high interest to policy makers.
Comparability
A size threshold of ten employees at the start of any obser-vation period was set to avoid the small size class bias thatthe above definition of high growth inevitably contains.The optimal threshold in terms of i) firm size at startii) growth rate and iii) growth (observation) period needs tobalance two competing criteria: the first is to provide asdetailed and as meaningful information as possible, andthe second is to maximise information that can be
disclosed, i.e. that satisfies confidentiality rules and allowsproducing the indicators at as detailed an industry level aspossible, and by standard (employment) size classes.
Setting the employment thresholds too low, for example, willreduce disclosure problems but at the same time result in dis-proportionate numbers of small enterprises appearing in thestatistics. If the threshold is too high, however, disclosureproblems increase, particularly for smaller economies, withsignificantly fewer large companies than larger economies. Itis clear that an absolute threshold will affect countries andindustries differently, depending on their size.
The size threshold of ten or more employees holds for boththe turnover and employment measures. The advantage isthat the initial population is the same, regardless ofwhether growth is measured in employment or turnover.Moreover, it would be difficult to apply a consistent turn-over threshold across all countries because of exchangerates, inflation, etc.
Data presented refer to the whole population of employerenterprises, with the exception of Canada, for which datafor 2007 and earlier years refer to employer enterpriseswith less than 250 employees.
Data for Israel and the United States are compiled accord-ing to ISIC Revision 3. Data for Austria, New Zealand andSlovenia are compiled according to ISIC Revision 4. Forother countries data after 2007 are compiled in ISIC Revi-sion 4 and data for 2007 and before are compiled in ISICRevision 3.
Source/Online database
OECD Structural and Demographic Business Statistics (SDBS)Database.
For further reading
Ahmad, N. and D. Rude Petersen (2007), High-GrowthEnterprises and Gazelles – Preliminary and SummarySensitivity Analysis, OECD-FORA, Paris, www.oecd.org/document/31/0,3746,en_2825_499554_39151327_1_1_1_1,00.html.
Ahmad, N. and E. Gonnard (2007), “High-growth Enterprisesand Gazelles”, paper prepared for the InternationalConsortium on Entrepreneurship (ICE), Copenhagen,Denmark. http://ice.foranet.dk/upload/highgrowth.pdf.
Eurostat/OECD (2007), Eurostat-OECD Manual on BusinessDemography Statistics, OECD Publishing, Paris, http://dx.doi.org/10.1787/9789264072886-en.
OECD(2007), The OECD Entrepreneurship IndicatorsProgramme: Workshop on the Measurement of High-growth Enterprises, 19 November 2007, Paris.
OECD (2010), Structural and Demographic Business Statistics,OECD Publishing, Paris, http://dx.doi.org/10.1787/9789264072886-en.
Information on data for Israel: http://dx.doi.org/10.1787/888932315602.
Definitions
High-growth enterprises, as measured by employ-ment (or by turnover), are enterprises with averageannualised growth in employees (or in turnover)greater than 20% a year, over a three-year period, andwith ten or more employees at the beginning of theobservation period.
Medium-growth enterprises, as measured by employ-ment, are enterprises with average annualisedgrowth in employees between 10% and 20% a year,over a three-year period, and with ten or moreemployees at the beginning of the observation period.
The rate of high-growth enterprises and rate of medium-growth enterprises measure, respectively, the numberof high-growth enterprises and the number ofmedium-growth enterprises as a percentage of thepopulation of enterprises with ten or more employ-ees.
For the definition of “Total economy”, see Reader’sGuide.
ENTREPRENEURSHIP AT A GLANCE 2013 © OECD 201360

4. ENTERPRISE GROWTH AND EMPLOYMENT CREATION
High-growth enterprises rate
Figure 4.7. High-growth enterprises rate, measured by employment growthMeasured by employment growth, 2010 or latest available year
1 2 http://dx.doi.org/10.1787/888932828963
Figure 4.8. Medium-growth enterprises rate, measured by employment growthMeasured by employment growth, 2010 or latest available year
1 2 http://dx.doi.org/10.1787/888932828982
Figure 4.9. High-growth enterprises rate, measured by turnover growthMeasured by turnover growth, 2010 or latest available year
1 2 http://dx.doi.org/10.1787/888932829001
0
1
2
3
4
5
6
7
8
9
Man
ufac
turin
g
Serv
ices
Man
ufac
turin
g
Serv
ices
Man
ufac
turin
g
Serv
ices
Man
ufac
turin
g
Serv
ices
Man
ufac
turin
g
Serv
ices
Man
ufac
turin
g
Serv
ices
Man
ufac
turin
g
Serv
ices
Man
ufac
turin
g
Serv
ices
Man
ufac
turin
g
Serv
ices
Man
ufac
turin
g
Serv
ices
Man
ufac
turin
g
Serv
ices
Man
ufac
turin
g
Serv
ices
Man
ufac
turin
g
Serv
ices
Man
ufac
turin
g
Serv
ices
Man
ufac
turin
g
Serv
ices
Man
ufac
turin
g
Serv
ices
Romania Spain Italy New Zealand (2007,2010)
Slovenia (2006,2009)
Portugal (2007,2010)
Luxembourg (2007,2010)
Canada (2007, 2009)
United States Czech Republic Hungary Sweden (2006, 2008)
Estonia Israel (2008,2010)
France (2009) Brazil (2006, 2009)
2010 2006
0
2
4
6
8
10
12
Romania Spain Italy Luxembourg Portugal Estonia (2009) Czech Republic
Hungary Slovenia (2009)
New Zealand France (2009)
Manufacturing Services
0
5
10
15
20
25
Man
ufac
turin
g
Serv
ices
Man
ufac
turin
g
Serv
ices
Man
ufac
turin
g
Serv
ices
Man
ufac
turin
g
Serv
ices
Man
ufac
turin
g
Serv
ices
Man
ufac
turin
g
Serv
ices
Man
ufac
turin
g
Serv
ices
Man
ufac
turin
g
Serv
ices
Man
ufac
turin
g
Serv
ices
Man
ufac
turin
g
Serv
ices
Man
ufac
turin
g
Serv
ices
Romania Italy Luxembourg (2007,2010)
Canada (2007,2009)
Portugal Slovenia (2006,2009)
Hungary Estonia (2006,2010) Czech Republic (2007,2010)
Sweden (2007) Korea
2010 2006
ENTREPRENEURSHIP AT A GLANCE 2013 © OECD 2013 61

4. ENTERPRISE GROWTH AND EMPLOYMENT CREATION
Gazelles rate
Key Facts
– In a majority of countries, less than 1% of firms with tenor more employees are gazelles when the growth mea-sure is based on employment. The share is slightlyhigher for gazelles as measured by turnover growth.
– In all countries the prevalence of high growth firms inthe service sector (measured by employment and turn-over) was higher than in manufacturing.
Relevance
Gazelles represent the young enterprises among the popu-lation of high-growth enterprises. Their role in job creationis of particular interest to policy makers.
Comparability
Data presented refer to the whole population of employerenterprises, with the exception of Canada, for which datafor 2007 and earlier years refer to employer enterpriseswith less than 250 employees.
Employment data are based on the number of personsemployed, with the exception of Israel, where the numberof employees is used.
Source/Online database
OECD Structural and Demographic Business Statistics (SDBS)Database, http://dx.doi.org/10.1787/sdbs-data-en.
For further reading
Ahmad, N. and D. Rude Petersen (2007), “High-GrowthEnterprises and Gazelles – Preliminary and SummarySensitivity Analysis”, OECD-FORA, Paris.
Ahmad, N. and E. Gonnard, (2007), “High-growthEnterprises and Gazelles”, paper prepared for theInternational Consortium on Entrepreneurship (ICE),Copenhagen, Denmark, http://ice.foranet.dk/upload/highgrowth.pdf.
Eurostat/OECD (2007), Eurostat-OECD Manual on BusinessDemography Statistics, OECD Publishing, Paris, http://dx.doi.org/10.1787/9789264072886-en.
OECD (2010), Structural and Demographic Business Statistics,OECD Publishing, Paris, http://dx.doi.org/10.1787/9789264072886-en.
OECD (2007), The OECD Entrepreneurship IndicatorsProgramme: Workshop on the Measurement of High-growth Enterprises , 19 November 2007, Paris ,www.oecd.org/document/31/ 0,3746,en_2825_499554_39151327_1_1_1_1,00.html.
Information on data for Israel: http://dx.doi.org/10.1787/888932315602.
Definitions
Gazelles form a subset of the group of high-growthenterprises; they are high-growth enterprises bornfive years or less before the end of the three-yearobservation period.
Gazelles are enterprises that have been employers fora period of up to five years, with average annualisedgrowth in employees (or in turnover) greater than 20%a year over a three-year period and with ten or moreemployees at the beginning of the observation period.
Young medium-growth enterprises, as measured byemployment, are enterprises that have been employ-ers for a period of up to five years, with averageannualised growth in employees between 10% and20% per year over a three-year period and with ten ormore employees at the beginning of the observationperiod.
The rate of gazelles and the rate of young medium-growthenterprises measure respectively the number ofgazelles and the number of young medium-growthenterprises as a percentage of the population ofenterprises with ten or more employees.
For the definition of “Total economy”, see Reader’sGuide.
ENTREPRENEURSHIP AT A GLANCE 2013 © OECD 201362

4. ENTERPRISE GROWTH AND EMPLOYMENT CREATION
Gazelles rate
Figure 4.10. Gazelles rateMeasured by employment growth, 2010 or latest available year
1 2 http://dx.doi.org/10.1787/888932829020
Figure 4.11. Young medium-growth enterprises rateMeasured by employment growth, 2010 or latest available year
1 2 http://dx.doi.org/10.1787/888932829039
Figure 4.12. Gazelles rateMeasured by turnover growth, 2010 or latest available year
1 2 http://dx.doi.org/10.1787/888932829058
0.0
0.2
0.4
0.6
0.8
1.0
1.2
Man
ufac
turin
g
Serv
ices
Man
ufac
turin
g
Serv
ices
Man
ufac
turin
g
Serv
ices
Man
ufac
turin
g
Serv
ices
Man
ufac
turin
g
Serv
ices
Man
ufac
turin
g
Serv
ices
Man
ufac
turin
g
Serv
ices
Man
ufac
turin
g
Serv
ices
Man
ufac
turin
g
Serv
ices
Man
ufac
turin
g
Serv
ices
Man
ufac
turin
g
Serv
ices
Man
ufac
turin
g
Serv
ices
Man
ufac
turin
g
Serv
ices
Man
ufac
turin
g
Serv
ices
Man
ufac
turin
g
Serv
ices
Man
ufac
turin
g
Serv
ices
United States Spain Italy New Zealand (2007,2010)
Sweden (2007)
Luxembourg (2007,2010)
Slovenia (2009)
Hungary Romania Portugal Israel Canada (2009) France Estonia (2006, 2009)
Czech Republic
(2006,2010)
Brazil (2009)
2010 2006
3.3
0.0
0.2
0.4
0.6
0.8
1.0
1.2
1.4
Romania Italy Spain Slovenia (2009)
France (2009) Hungary Portugal Luxembourg (2008)
Czech Republic
New Zealand Estonia (2009)
Israel
Manufacturing Services
2
0.0
0.2
0.4
0.6
0.8
1.0
1.2
1.4
1.6
1.8
2.0
Man
ufac
turin
g
Serv
ices
Man
ufac
turin
g
Serv
ices
Man
ufac
turin
g
Serv
ices
Man
ufac
turin
g
Serv
ices
Man
ufac
turin
g
Serv
ices
Man
ufac
turin
g
Serv
ices
Man
ufac
turin
g
Serv
ices
Man
ufac
turin
g
Serv
ices
Man
ufac
turin
g
Serv
ices
Man
ufac
turin
g
Serv
ices
Italy Luxembourg (2007,2010) Sweden (2007,2008) Slovenia (2009) Hungary Romania Estonia (2006,2009) Canada (2009) Portugal Czech Republic (2007,2010)
2010 2006
ENTREPRENEURSHIP AT A GLANCE 2013 © OECD 2013 63


ENTREPRENEURSHIP AT A GLANCE 2013
5. THE PROFILE OF THE ENTREPRENEUR
Gender differences in self-employment rates
Self-employment among the youth and seniors
Self-employment rates of migrants
Earnings from self-employment
Preferences and feasibility of self-employment
© OECD 2013 65

5. THE PROFILE OF THE ENTREPRENEUR
Gender differences in self-employment rates
Key facts
– Three times as many men as women are self-employedwith employees. Recent data indicate a small closing of thisgap, despite the general decline in the population of self-employed with employees since the beginning of the crisis.
– Own-account employment levels rose during the crisisboth for men and for women. When coupled with fallingemployee numbers however, the likelihood is that push(adjustment strategies) rather than pull factors are thedriving force.
– In all OECD economies self-employed women are morelikely than men to work in the service sector. Eighty percent of self-employed women work in the services sectorcompared to sixty percent for men.
Relevance
Women entrepreneurship is increasingly recognised as akey source of employment creation and innovation. How-ever, gender differences in entrepreneurship are difficult tomeasure and this complicates the evaluation of supportpolicies for women entrepreneurs. Given their availabilityon a timely and short-term basis, self-employment data arealso highly relevant to monitor how women’s entrepre-neurship responds to the economic cycle.
Comparability
The main comparability issue relates to the classificationof “self-employed” owners of incorporated businesses.Some countries, for example Japan, New Zealand, Norwayand the United States, include only the self-employedowners of unincorporated businesses, following the 2008SNA. This is not universally the case, partly determined bythe availability of statistics. As such to improve interna-tional comparability, the number of incorporated employ-ers and own-account workers in the United States has beenestimated in this section, using information from the Con-tingent and Alternative Work Arrangements Surveys.
Manufacturing and construction activities include sectorsclassified as Manufacturing; Electricity, gas, steam and airconditioning supply; Water supply, sewerage, waste mana-gement and remediation activities; and Construction. Ser-vice activities include all the other activities excludingForestry, Agriculture, Mining, Public Administration andEducation.
The OECD average is calculated as the unweighted averageof OECD countries.
Sources/Online databases
OECD estimates based on:
– Current Population Survey.
– Economically Active Population Survey (Korea).
– Encuesta Nacional del Empleo (Chile).
– Encuesta National de Empleo (Mexico).
– Eurostat Labour Force Surveys, 2000-11.
– Labour Force Survey (Canada).
– Labour Force Survey (Israel).
– Labour Force Survey (Japan).
– Labour Force Survey (South Africa).
– National Household Sample Survey (Brazil).
Information on data for Israel: http://dx.doi.org/10.1787/888932315602.
For further reading
Hipple, S. (2010), “Self-employment in the United States”,Monthly Labor Review, September.
OECD (2012), Closing the Gender Gap. Act Now, OECDPublishing, Paris, www.oecd-ilibrary.org/social-issues-migration-health/close-the-gender-gap-now_9789264179370-en.
OECD (2000), OECD Employment Outlook, OECD Publishing,Paris, www.oecd-ilibrary.org/social-issues-migration-health/oecd-employment-outlook-2000_empl_outlook-2000-en.
Definitions
The number of women employers is given by the numberof women who report their status as “self-employedwith employees” in population surveys. The number ofwomen own-account workers is given by the number ofwomen who report their status as “self-employedwithout employees”. The share of women employers andthe share of women own-account workers are given inrelation to the total number of employed women.
Self-employment jobs are defined in this section asthose “jobs where the remuneration is directly depen-dent upon the profits (or the potential for profits)derived from the goods and services produced (whereown consumption is considered to be part of profits).The incumbents make the operational decisionsaffecting the enterprise, or delegate such decisionswhile retaining responsibility for the welfare of theenterprise” (15th Conference of Labour Statisticians,January 1993). The definition therefore includes bothunincorporated and incorporated businesses and assuch differs from the definitions used in the Systemof National Accounts. It should be noted that all theself-employed are entrepreneurs.
ENTREPRENEURSHIP AT A GLANCE 2013 © OECD 201366

5. THE PROFILE OF THE ENTREPRENEUR
Gender differences in self-employment rates
Figure 5.1. Share of self-employed men and womenPercentage, 2011
1 2 http://dx.doi.org/10.1787/888932829077
Figure 5.2. Share of men and women employersPercentage, 2011
1 2 http://dx.doi.org/10.1787/888932829096
Figure 5.3. Share of men and women own-account workersPercentage, 2011
1 2 http://dx.doi.org/10.1787/888932829115
0
5
10
15
20
25
30
35
40
Women Men%
0
1
2
3
4
5
6
7
8
9
10
Women Men%
10.1
0
5
10
15
20
25
30
Women Men
ENTREPRENEURSHIP AT A GLANCE 2013 © OECD 2013 67

5. THE PROFILE OF THE ENTREPRENEUR
Gender differences in self-employment rates
Figure 5.4. Trends in employers and own-account workers, EU27Thousands
1 2 http://dx.doi.org/10.1787/888932829134
6 400
6 600
6 800
7 000
7 200
7 400
7 600
7 800
14 600
14 800
15 000
15 200
15 400
15 600
15 800
Self-
empl
oyed
per
sons
with
em
ploy
ees
(em
ploy
ers)
Self-
empl
oyed
per
sons
with
out e
mpl
oyee
s
Self-employed persons without employees (own-account workers) Self-employed persons with employees (employers)
Men
2 250
2 300
2 350
2 400
2 450
2 500
7 100
7 200
7 300
7 400
7 500
7 600
7 700
7 800
Self-
empl
oyed
per
sons
with
em
ploy
ees
(em
ploy
ers)
Self-
empl
oyed
per
sons
with
out e
mpl
oyee
s
Self-employed persons without employees (own-account workers) Self-employed persons with employees (employers)
Women
6 400
6 600
14 600
Self-
e
ENTREPRENEURSHIP AT A GLANCE 2013 © OECD 201368

5. THE PROFILE OF THE ENTREPRENEUR
Gender differences in self-employment rates
Figure 5.5. Self-employed whose activity is in manufacturing and constructionPercentage, 2010
1 2 http://dx.doi.org/10.1787/888932829153
Figure 5.6. Self-employed whose activity is in servicesPercentage, 2010
1 2 http://dx.doi.org/10.1787/888932829172
0
10
20
30
40
50
60
Women Men
0
10
20
30
40
50
60
70
80
90
100
Women Men
ENTREPRENEURSHIP AT A GLANCE 2013 © OECD 2013 69

5. THE PROFILE OF THE ENTREPRENEUR
Self-employment among the youth and seniors
Key facts
– People under the age of 25 have relatively low self-employment rates: 4% on average in the OECD area andnever above 11%.
– Self-employment is an important source of revenues forindividuals aged 65 or older.
– Most of the self-employed aged 65 or older have beenrunning the same business for more than ten years.
Relevance
Increasing self-employment rates in the youth and seniorpopulation groups can form an important policy target todeal with two key economic issues: high youth unemploy-ment and the demographic challenges posed by an ageingpopulation.
Comparability
Self-employment rates for the youth are close to zero inseveral countries, and differences across these countriescannot be evaluated. Tenure is measured in months in theEuropean and Canadian surveys but in years in the surveyof the United States (Current Population Survey). Given thelow numbers of sampled self-employed youths andseniors, values are averaged over three years for all coun-tries to increase statistical precision. This process isrepeated for tenure measures except for the United Stateswhere only observations for 2010 are available from a bian-nual supplement. Comparability issues can be generated bythe different treatment of incorporated self-employed, whoare considered employees in Japan, New Zealand, Norwayand the United States. As the young are less likely to haveincorporated their business, youth self-employment ratesmay be lower in countries that restrict the self-employed tothose owning unincorporated businesses.
Sources/Online databases
OECD estimates based on:
– Current Population Survey (United States), 2009-11.
– Eurostat Labour Force Surveys, 2009-11.
– Labour Force Survey (Canada), 2009-11.
– Encuesta National de Empleo (Mexico).
– Labour Force Survey (Israel), 2009-11.
– Labour Force Survey (Japan), 2009-11.
Information on data for Israel: http://dx.doi.org/10.1787/888932315602.
For further reading
Hipple, S. (2010), “Self-employment in the United States”,Monthly Labor Review, September.
OECD (2012), “Policy Brief on Youth Entrepreneurship”,www.oecd.org/regional/leed/Youth%20Policy%20Brief.pdf.
Definitions
The self-employment rate for the youth is the share ofemployed people aged 15 to 24 who are self-employedand not working in agriculture.
The self-employment rate for seniors is the share ofemployed people 65 years and above who are self-employed and not working in agriculture.
Senior self-employment tenure is the length of time theperson aged 65 or over has been self-employed, asdefined above.
ENTREPRENEURSHIP AT A GLANCE 2013 © OECD 201370

5. THE PROFILE OF THE ENTREPRENEUR
Self-employment among the youth and seniors
Figure 5.7. Self-employment rates for the youth and seniorsPercentage, average 2009-11
1 2 http://dx.doi.org/10.1787/888932829191
Figure 5.8. Self-employment tenure of seniorsPercentage, average 2009-11
1 2 http://dx.doi.org/10.1787/888932829210
0
10
20
30
40
50
60
70
80
90
Seniors Youths
0
10
20
30
40
50
60
70
80
90
100
<2 years 2 -10 years >10 years
ENTREPRENEURSHIP AT A GLANCE 2013 © OECD 2013 71

5. THE PROFILE OF THE ENTREPRENEUR
Self-employment rates of migrants
Key facts
– In OECD countries, around 13% of foreign-born workersare self-employed. Migrants represent around 12% of theself-employed not working in agriculture, a percentagethat changed little between 2005 and 2010. There arehowever very large differences across countries. While inseveral OECD countries, including Finland, Germany,Sweden and the United States, the rates of self-employ-ment are similar for natives and migrants, in other coun-tries such as the Czech Republic and Poland, the self-employment rates of immigrants are much higher thanthose of natives.
– In about two-thirds of the economies where informationis available, self-employed immigrants typically have ahigher level of educational attainment than self-employed natives.
– There is only scarce information on differences in busi-ness performance by migrant status of the owner.Available data provide important insights. For instance,in France, data suggest that enterprises funded by immi-grants have significantly lower survival rates than enter-prises funded by native-born. In the United States,immigrants with Asian origin own businesses that havehigher sales than non-immigrants, while Hispanic immi-grants are over-represented among owners of businesseswith low levels of receipts.
Relevance
Immigrants bring diverse entrepreneurial skills to host coun-tries, working in a wide range of occupations and sectors,
including innovative areas.Thanks to their transnational ties,immigrant entrepreneurs can also contribute to expandingtrade between the host country and their countries of ori-gin. Self-employment data provide relevant information ontrends and characteristics of immigrant entrepreneurs.
Comparability
All the statistics are obtained from labour force surveys.Given the small number of foreign-born self-employed inthe samples of countries with lower rates of immigration,the statistics are presented as averages of the estimates forthree consecutive years (2009 to 2011). Producing estimatesbased on three years of data increases the statistical preci-sion but at the cost of a loss in timeliness. The main com-parability issue relates to the treatment of incorporatedself-employed, that are not always included in the countsof self-employed. For the United States, the data refer onlyto the unincorporated self-employed. Small businesses inthe United States include all business units owned by self-employed with 10 employees or less, and not with less than10 employees as is the case in other countries. Finally, thecountry coverage is limited by the fact that labour forcesurveys do not always include or disseminate informationon the country of birth.
Sources/Online databases
OECD estimates based on:
– Current Population Survey (United States).
– Eurostat Labour Force Surveys (2000-11).
– Labour Force Survey (Israel).
Fairlie R. (2012), “Immigrant Entrepreneurs and Small Busi-ness Owners, and their access to financial capital”, Reportfor the Small Business Administration”, www.sba.gov/sites/default/files/rs396tot.pdf.
Système d'information sur les nouvelles enterprises (SINE)public-use microdata, INSEE.
Information on data for Israel: http://dx.doi.org/10.1787/888932315602.
For further reading
OECD (2010), Open for Business. Migrant Entrepreneurship inOECD countries, OECD Publishing, Paris, www.oecd-ilibrary.org/social-issues-migration-health/open-for-business_9789264095830-en.
OECD (2010), “Entrepreneurship and Migrants”, Report bythe OECD Working Party on SMEs and Entrepreneurship,OECD, www.oecd.org/industry/smes/45068866.pdf.
Definitions
The self-employment rate by place of birth indicates theshare of the employed native-born and foreign-bornindividuals who work as self-employed and are notworking in agriculture. The population includes allindividuals aged 15 or above.
The percentage of self-employed who are foreign-born showsthe share of self-employed individuals not working inagriculture who are foreign born.
The share of owners of small businesses, by place of birthindicates the percentage of native-born and foreign-born who own a business with less than ten employees.
Tertiary educated among the self-employed by place of birthindicates the share of foreign-born and native bornself-employed in non-agricultural sectors whoattained an education level equal to level 5 or higherof the International Standard Classification of Educa-tion (ISCED). ISCED level 5 corresponds to the firstlevel of tertiary education.
ENTREPRENEURSHIP AT A GLANCE 2013 © OECD 201372

5. THE PROFILE OF THE ENTREPRENEUR
Self-employment rates of migrants
Figure 5.9. Self-employment rate by place of birthPercentage, average 2009-11
1 2 http://dx.doi.org/10.1787/888932829229
Figure 5.10. Self-employed who are foreign-bornPercentage
1 2 http://dx.doi.org/10.1787/888932829248
0
5
10
15
20
25
30
35
Native-born Foreign-born
0
5
10
15
20
25
30
35
40
45
50
2009-2011 2004-2006
ENTREPRENEURSHIP AT A GLANCE 2013 © OECD 2013 73

5. THE PROFILE OF THE ENTREPRENEUR
Self-employment rates of migrants
Figure 5.11. Tertiary educated among the self-employed by place of birthPercentage, average 2009-11
1 2 http://dx.doi.org/10.1787/888932829267
Figure 5.12. Share of owners of small businesses, by place of birthPercentage, average 2009-11
1 2 http://dx.doi.org/10.1787/888932829286
0
10
20
30
40
50
60
70
80
Native-born Foreign-born
0
10
20
30
40
50
60
70
80
90
100
Foreign-born Native-born
ENTREPRENEURSHIP AT A GLANCE 2013 © OECD 201374

5. THE PROFILE OF THE ENTREPRENEUR
Self-employment rates of migrants
Figure 5.13. Survival rates by nationality of the owner, FrancePercentage, average 2006-09
1 2 http://dx.doi.org/10.1787/888932829305
Figure 5.14. Sales/receipts by ethnic origin of the business owners in the United StatesPercentage, 2009
1 2 http://dx.doi.org/10.1787/888932829324
0
0.1
0.2
0.3
0.4
0.5
0.6
0.7
0.8
0.9
1
1 year 2 years 3 years
France Other EU Other country
0
5
10
15
20
25
less than 5000 9999 24999 49999 99999 249999 499999 999999 1000000
Non-immigrants Hispanic immigrants Asian immigrants
ENTREPRENEURSHIP AT A GLANCE 2013 © OECD 2013 75

5. THE PROFILE OF THE ENTREPRENEUR
Earnings from self-employment
Key facts
– Earnings from self-employment are more unequally dis-tributed than earnings from salaried employment. High-earners in self-employment (those at the 8th decile ofthe earnings distribution) earn 13 times the income oflow-earners (those at the 2nd decile of the distribution).
– Self-employed women earn significantly less than menacross countries. The gaps in mean earnings from self-employment are substantial everywhere (35% onaverage) and wider than those observed in wage employ-ment (15% on average).
Relevance
The fear of low or erratic earnings is one of the main rea-sons why many people do not become entrepreneurs.While entrepreneurship is a pathway to wealth for highlysuccessful individuals, many self-employed struggle withrelatively low incomes. Low incomes mean lower opportu-nities to accumulate savings, and thus a higher likelihoodof falling into poverty if the business fails. Studying the dis-tribution of self-employment earnings and differencesamong socio-economic groups is thus very relevant toassess the economic contribution of entrepreneurship andthe well-being of individuals who choose this career path.
Comparability
There are still methodological hurdles that hamper thecomparability of earnings statistics across countries andperiods. In fact, the self-employed often have accountingpractices which make it difficult for them to provide accu-rate responses to survey questions on earnings. Moreover,their financial and accounting framework does not relatewell to the one statisticians use in constructing nationalaccounts or household income analysis (Eurostat, 2011).
Comparisons between self-employment and wage employ-ment earnings (Figure 5.15) are likely to be affected by theway self-employment earnings are measured. Gapsbetween self-employment and wage employment earningswould be in fact lower if the measure of self-employmentearnings included equity invested in the firm. This is notthe current practice. The country coverage is limited by thefact that some countries only record self-employmentearnings for those with positive earnings, censoring at zerothe losses from self-employment.
Sources/Online databases
Estimates based on:
– European Union Statistics on Income and Living Condi-tions (EU-SILC), 2010 wave.
– American Community Survey, 2010 wave.
– New Zealand Income Survey, 2010.
– Survey of Labour and Income Dynamics (Canada), 2010.
For further reading
Hamilton B.H, (2000), “Does Entrepreneurship Pay? AnEmpirical Analysis of the Returns to Self-Employment”,Journal of Political Economy, University of Chicago Press,vol. 108(3), pp. 604-631, June.
OECD (2012), Closing the Gender Gap. Act Now, OECDPublishing, Paris, www.oecd-ilibrary.org/social-issues-migration-health/close-the-gender-gap-now_9789264179370-en.
Definitions
Inequality in self-employment earnings is defined as theratio of the gross (pre-tax) earnings of the self-employed individual at the 8th decile of the earningsdistribution and the earnings of the self-employedindividual at the 2nd decile of the distribution. Thesame definition is applied to inequality in wage-employment earnings. The estimates are restricted toindividuals whose primary activity is self-employ-ment and do not consider earnings from secondarywork activities. The earnings figures only refer to theunincorporated self-employed and both positive(benefits) and negative (losses) earnings are includedin the computation. The same definition is applied toearnings from wage employment. It should be notedthat the estimates refer to total earnings, and not toearnings per hour worked: the more unequal distribu-tion of self-employment earnings is partly explainedby the higher inequality in hours worked among theself-employed.
The gender gap in self-employment earnings is defined asthe difference between male and female average self-employment incomes divided by the male averageself-employment income. Both positive (benefits) andnegative (losses) earnings are included in the compu-tation of the averages.
ENTREPRENEURSHIP AT A GLANCE 2013 © OECD 201376

5. THE PROFILE OF THE ENTREPRENEUR
Earnings from self-employment
Figure 5.15. Inequality in wage and self-employment earningsPercentage, 2010
1 2 http://dx.doi.org/10.1787/888932829343
Figure 5.16. Gender gap in self-employment earningsPercentage
1 2 http://dx.doi.org/10.1787/888932829362
0
5
10
15
20
25
30
35
Inequality in wage earnings Inequality in self employment earnings
0
10
20
30
40
50
60
70
2010 2005
ENTREPRENEURSHIP AT A GLANCE 2013 © OECD 2013 77

5. THE PROFILE OF THE ENTREPRENEUR
Preferences and feasibility of self-employment
Key facts
– Very different attitudes towards self-employment can beobserved across countries and across time, with amarked decrease in preferences for self-employmentover the last three years.
– Women consistently rate self-employment as being lessfeasible than men do.
– Young people are more optimistic about the possibility ofsetting up a business in the near future, even though theactual rate of entrepreneurship among the young is par-ticularly low.
Relevance
Stimulating entrepreneurship requires a good understand-ing of the reasons leading people to become self-employed.Self-reported information on preferences for self-employ-ment, and on the feasibility of starting a business, can helppolicy-makers assess changes in the business environ-ment. These data also help understand whether particularsocio-economic groups perceive stronger difficulties whenthinking about an entrepreneurial career. Attitudestowards entrepreneurship can be shaped by different typesof policies, including entrepreneurial education, mediacampaigns and mentorship programmes.
Comparability
Data are drawn from the Flash Eurobarometer on Entrepre-neurship, which is a general survey of the adult populationconducted periodically for the European CommissionDirectorate-General Enterprise and Industry. The survey is
meant to gather information about peoples’ entrepreneu-rial mindset and gain insights on how these differ acrosscountries. It examines the motivation, choices, experiencesand obstacles linked to entrepreneurship; the survey con-siders self-employed and business owners as entrepreneurs.
The 2012 survey covered 40 countries: the EU27, Brazil,China, Croatia, Iceland, India, Israel, Japan, Korea, Norway,the Russian Federation, Switzerland, Turkey and the UnitedStates. The size of the target sample was of 1000 individu-als in each country, apart from the United States where3000 individuals were interviewed.
The interpretation of the results is subject to caution: asthe samples are relatively small, marginal differencesobserved across countries and gender might be the resultof sampling errors and not necessarily differences in theunderlying population. Interviews were conducted via tele-phone, both on fixed lines and mobile phones, except forIndia where the interviews were conducted face-to-face.The phone numbers are selected based on a randomisationprocedure, with stratification by region and level of urban-isation. For all countries surveyed, a national weightingprocedure was derived based on data on gender, age, regionand size of locality from national statistical offices. Finally,a possible issue for comparability is the different share ofnon-respondents in different countries.
Sources/Online databases
European Commission, Eurobarometer Survey on Entrepre-neurship, http://ec.europa.eu/enterprise/policies/sme/facts-fig-ures-analysis/eurobarometer/.
Information on data for Israel: http://dx.doi.org/10.1787/888932315602.
For further reading
European Commission (2013), Entrepreneurship in the EU andbeyond – Flash Eurobarometer 354, Report, http://ec.europa.eu/public_opinion/flash/fl_354_en.pdf.
OECD (2012), Closing the Gender Gap. Act Now, OECDPublishing, Paris, www.oecd-ilibrary.org/social-issues-m i g r a t i o n - h e a l t h / c l o s e - t h e - g e n d e r- g a p - n o w _9789264179370-en.
OECD (2004), Women Entrepreneurship. Issues and Policies, 2ndOECD Conference of Ministers Responsible for Small andMedium-Sized Enterprises (SMEs), www.oecd.org/cfe/smes/31919215.pdf.
Definitions
Preferences for self-employment shows the percentage ofindividuals declaring they would prefer to be self-employed if they were free to choose between self-employment and wage employment.
Feasibility of self-employment indicates the percentageof individuals declaring that, regardless of prefer-ences, it would be feasible for them to become self-employed within the next five years.
Both indicators cover a population aged 15 years andabove.
ENTREPRENEURSHIP AT A GLANCE 2013 © OECD 201378
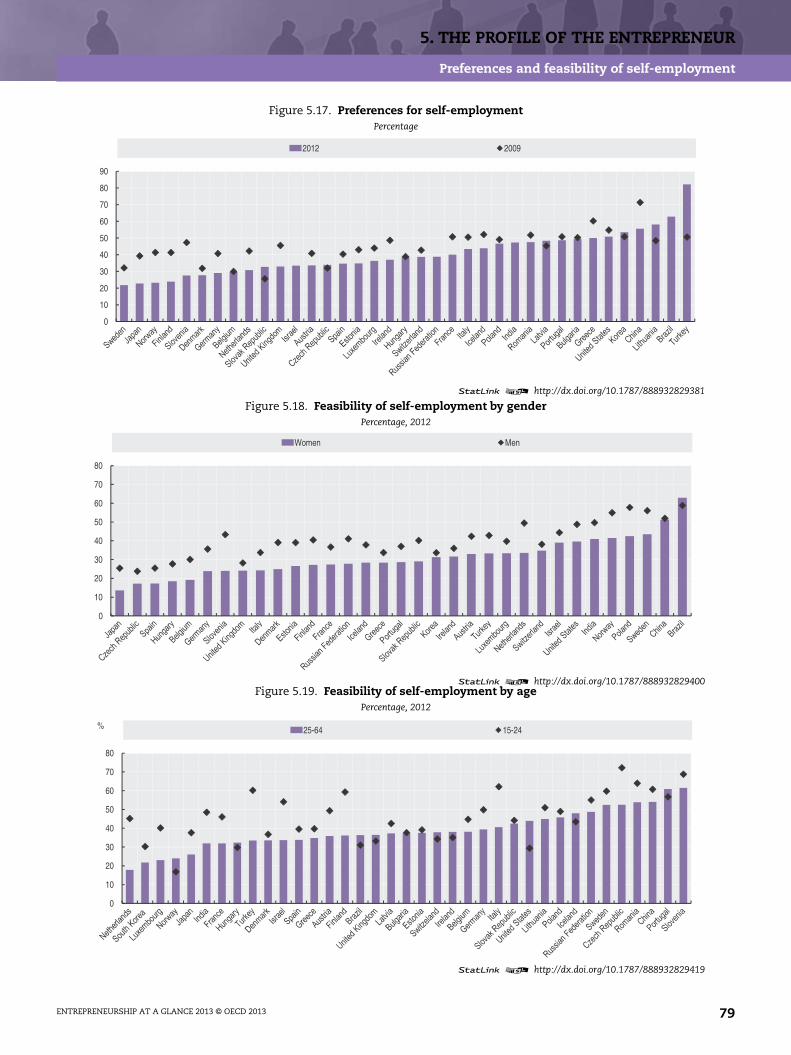
5. THE PROFILE OF THE ENTREPRENEUR
Preferences and feasibility of self-employment
Figure 5.17. Preferences for self-employmentPercentage
1 2 http://dx.doi.org/10.1787/888932829381
Figure 5.18. Feasibility of self-employment by genderPercentage, 2012
1 2 http://dx.doi.org/10.1787/888932829400Figure 5.19. Feasibility of self-employment by age
Percentage, 2012
1 2 http://dx.doi.org/10.1787/888932829419
0
10
20
30
40
50
60
70
80
90
2012 2009
0
10
20
30
40
50
60
70
80
Women Men
0
10
20
30
40
50
60
70
80
25-64 15-24%
ENTREPRENEURSHIP AT A GLANCE 2013 © OECD 2013 79


ENTREPRENEURSHIP AT A GLANCE 2013
6. DETERMINANTS OF ENTREPRENEURSHIP:SELECTED INDICATORS
Culture: The role of entrepreneurship education
Culture: Attitude toward failure
Access to finance: Venture capital
© OECD 2013 81

6. DETERMINANTS OF ENTREPRENEURSHIP: SELECTED INDICATORS
Culture: The role of entrepreneurship education
Key facts
– There are significant cross-country differences in people’sperceptions of the role that “school education” has inhelping them to develop a sense of initiative and an entre-preneurial spirit. In Brazil, Norway and Portugal more than75% of adults acknowledge the role played by school educa-tion, while in Japan this share is less than 20%.
– In Israel, Japan and the United Kingdom, 60% of peopleconsider that not only did school education not help indeveloping their sense of initiative, but it did not providethem with the skills and know-how needed to start up abusiness. In many countries however, there is a distinc-tion between the appreciation of the role of education infostering entrepreneurial spirit and its role in givingpractical competencies that enable someone to run abusiness.
– The opinions on the role that school had in forming aview on the role of entrepreneurs in society are also verydiverse from one country to the other. Interestingly, theperceived image of entrepreneurs does not appear to berelated to people’s assessment on the role that educationhad in forming a view on entrepreneurs in society.
Relevance
The entrepreneurial culture of a country affects the atti-tude that individuals have towards entrepreneurship, thelikelihood of choosing entrepreneurship as a career, theambition to succeed, to start again after a failure, or thesupport provided to family and relatives planning to set upa business. All these aspects play a role, although there isscarce empirical evidence on their relative importanceacross countries. This section provides examples of indica-tors developed to measure certain aspects of the entrepre-neurial culture related to the image of entrepreneurs andthe role of school education in forming this culture.
Comparability
Data are drawn from the Flash Eurobarometer on Entrepre-neurship, which is a general survey of the adult populationconducted periodically for the European CommissionDirectorate-General Enterprise and Industry; see Chapter 5,“Preferences and feasibility of self-employment”.
Sources/Online databases
European Commission, Eurobarometer Survey on Entrepre-neurship, http://ec.europa.eu/enterprise/policies/sme/facts-fig-ures-analysis/eurobarometer/.
Information on data for Israel: http://dx.doi.org/10.1787/888932315602.
For further reading
European Commission (2013), Entrepreneurship in the EU andbeyond – Flash Eurobarometer 354, Report, http://ec.europa.eu/public_opinion/flash/fl_354_en.pdf.
Definitions
The indicators presented in this section are the following:
• “My school education is helping/has helped me todevelop my sense of initiative and a sort of entre-preneurial attitude”, where respondents indicatewhether they totally agree, tend to agree, disagreeor totally disagree with the statement (Figure 6.1);
• “My school education is giving/has given me skillsand know-how to enable me to run a business”where respondents indicate whether they totallyagree, tend to agree, disagree or totally disagreewith the statement (Figure 6.2);
• “My school education helped me to better under-stand the role of entrepreneurs in society”, whererespondents indicate whether they totally agree,tend to agree, disagree or totally disagree with thestatement (Figure 6.3); and...
• “What is your opinion about entrepreneurs (self-employed, business owners)”, where respondentschoose among broadly favourable, neutral orbroadly unfavourable (Figure 6.3).
ENTREPRENEURSHIP AT A GLANCE 2013 © OECD 201382

6. DETERMINANTS OF ENTREPRENEURSHIP: SELECTED INDICATORS
Culture: The role of entrepreneurship education
Figure 6.1. School helped to develop a sense of initiative and a sort of entrepreneurial attitudePercentage, 2012
1 2 http://dx.doi.org/10.1787/888932829438
Figure 6.2. School education provided enabling skills and know-how to run a businessPercentage, 2012
1 2 http://dx.doi.org/10.1787/888932829457
Figure 6.3. Entrepreneurship education and the image of entrepreneursPercentages, 2012
1 2 http://dx.doi.org/10.1787/888932829476
0
10
20
30
40
50
60
70
80
90
100
Don't know / No answer Total 'disagree' Total 'agree'
0
10
20
30
40
50
60
70
80
90
100
Don't know / No answer Total 'disagree' Total 'agree'
Austria
Brazil
China
Czech Republic
Denmark
EstoniaFinland
France
Germany
Greece
Hungary
Iceland
India
IrelandIsrael
Italy
Japan
Korea
LuxembourgNetherlands
Norway
PolandPortugal
Russian Federation
Slovak Republic
Slovenia
Spain
Sweden
Switzerland
Turkey
United Kingdom
United States
20
30
40
50
60
70
80
90
20 30 40 50 60 70 80 90
Broa
dly
favo
rabl
e im
age
of e
ntre
pren
eurs
School helped in understanding the role of entrepreneurs in society
ENTREPRENEURSHIP AT A GLANCE 2013 © OECD 2013 83

6. DETERMINANTS OF ENTREPRENEURSHIP: SELECTED INDICATORS
Culture: Attitude toward failure
Key facts
– Among people who do not regard entrepreneurship as afeasible career option in the immediate future, the fearof failure is not the major discouraging factor. Only 5%on average cite the risk of failure and its legal and socialconsequences, with percentages slightly above 10% inIndia and the Slovak Republic and as little as 1% in Japan,where entrepreneurship rates are traditionally low.
– Conversely, if individuals were to start a business, thefear of failure is the most important barrier. Also, theperceived fear of failure as a major obstacle for starting abusiness shows some correlation with the time andcosts of bankruptcy procedures: high costs and lengthy
procedures tend to be associated with large shares of peo-ple who see the possibility of failure as the major risk.
– In most countries, a large majority of adults believe thatentrepreneurs who fail should be given a “secondchance”. The ratio is around or above 90% in Brazil,China, Greece, Ireland, Korea, Spain and Sweden, andexceeds 80% in several other countries including theRussian Federation and the United States. Comparinganswers in 2012 with those provided in 2009 suggeststhat in many countries the positive attitudes relating toa ’second chance’ might have been reinforced by therecent financial crisis, i.e. people have become moresympathetic towards difficulties faced by entrepreneurs.
Relevance
In recent decades, governments’ strategies to encourageentrepreneurship have generally included training pro-grammes on setting up and growing new businesses. Avariety of courses on entrepreneurship are also offered byuniversities and business schools; these courses typicallyprovide guidance on the key steps and factors needed tostart a new business. Some aspects of the entrepreneurialprocess, however, are difficult to address within these pro-grammes. Attitude of individuals towards business failureis one of these, as it reflects a combination of personalcharacteristics, societal values, and the underlying busi-ness environment.
Comparability
Except for insolvency data, all the other data come from theEuropean Commission Eurobarometer Survey on Entrepre-neurship Database; see Chapter 5, “Preferences and feasibil-ity of self-employment”.
The data on resolving insolvency come from the World BankDoing Business Database. To increase comparability, severalassumptions are used on the reference business; theseinclude: the business is a limited liability company; islocated in the largest business city of the economy; hasdowntown real estate, where it runs a hotel, as its majorasset; has 201 employees and 50 suppliers, each of which isowed money for the last delivery; is 100% domesticallyowned; has a 10-year loan agreement with a domestic bankand a mortgage.
Sources/Online databases
European Commission, Eurobarometer Survey on Entrepre-neurship, http://ec.europa.eu/enterprise/policies/sme/facts-figures-analysis/eurobarometer/.
World Bank Doing Business Database, www.doingbusiness.org/data.
Information on data for Israel: http://dx.doi.org/10.1787/888932315602.
Definitions
The indicators presented in this section are the fol-lowing:
• Why would it not be feasible for you to be self-employed within the next five years?, where respon-dents can provide multiple answers choosingfrom a list (Figure 6.4). Respondents only includepeople who consider that it is not feasible forthem to become self-employed in the next fiveyears.
• If you were to start a business today, which are thetwo risks you would be most afraid of?, whererespondents can indicate a maximum of twoanswers: a)“the possibility of going bankrupt”,b)“the risk of losing your property/home”,c)“irregular/not guaranteed income”, d)“lack ofjob security”, e)“the possibility of suffering a per-sonal failure”, and f)“the need to devote toomuch energy or time to it” (Figure 6.5). As theitems a, b, and c consistently received the highestscores in all countries, Figure 6.5 focuses onthem. Exceptions are Bulgaria, where the thirdhighest score is d and not c; Italy where c and dreceived the same score; India, where d shouldreplace a; and Korea, where e should replace a.
• Resolving insolvency: The recovery rate is recordedas cents on the dollar recouped by creditorsthrough reorganisation, liquidation or debtenforcement ( forec losure) proceedings(Figure 6.6).
• Resolving insolvency: Time for creditors to recovertheir credit is recorded in calendar years. Theperiod of time measured is from the company’sdefault until the payment of some or all of themoney owed to the bank (Figure 6.7).
• People who have started their own business and havefailed should be given a second chance, whererespondents indicate whether they totally agree,tend to agree, disagree or totally disagree withthe statement (Figure 6.8).
ENTREPRENEURSHIP AT A GLANCE 2013 © OECD 201384

6. DETERMINANTS OF ENTREPRENEURSHIP: SELECTED INDICATORS
Culture: Attitude toward failure
Figure 6.4. Why it is not feasible to become a self-employed in the next five years?Percentage, 2012
1 2 http://dx.doi.org/10.1787/888932829495
0
10
20
30
40
50
60
70
80
Risk of failure Current economic climate is not good Not enough skillsNo business idea Family commitments Not enough capitalBurden of red tape Don't Know Other
0
10
20
30
40
50
60
70
80
0
0
10
20
30
40
50
60
70
80
ENTREPRENEURSHIP AT A GLANCE 2013 © OECD 2013 85

6. DETERMINANTS OF ENTREPRENEURSHIP: SELECTED INDICATORS
Culture: Attitude toward failure
Figure 6.5. If you were to start a business today, which are the two risks you would be most afraid of?Percentage, 2012
1 2 http://dx.doi.org/10.1787/888932829514
0
10
20
30
40
50
60
Hungary Iceland India Ireland Israel Italy Japan Korea Luxembourg Netherlands Norway
The possibility of going bankrupt The risk of losing your property/home Irregular/not guaranteed income
0
10
20
30
40
50
60
Austria Belgium Brazil China Czech Republic
Denmark Estonia Finland France Germany Greece
The possibility of going bankrupt The risk of losing your property/home Irregular/not guaranteed income
0Hungary Iceland India Ireland Israel Italy Japan Korea Luxembourg Netherlands Norway
0
10
20
30
40
50
60
Poland Portugal Russian Federation
Slovak Republic
Slovenia Spain Sweden Switzerland Turkey United Kingdom
United States
The possibility of going bankrupt The risk of losing your property/home Irregular/not guaranteed income
ENTREPRENEURSHIP AT A GLANCE 2013 © OECD 201386

6. DETERMINANTS OF ENTREPRENEURSHIP: SELECTED INDICATORS
Culture: Attitude toward failure
Figure 6.6. Fear of failure and recovery rate in insolvency proceduresPercentages, 2012
1 2 http://dx.doi.org/10.1787/888932829533
Figure 6.7. Fear of failure and time of insolvency proceduresPercentage, 2012
1 2 http://dx.doi.org/10.1787/888932829552
Figure 6.8. Entrepreneurs who failed should have a second chancePercentage, 2012
1 2 http://dx.doi.org/10.1787/888932829571
Austria
Belgium
Brazil China
Czech Republic Denmark
Estonia
Finland
France
Germany
Greece
Hungary
Iceland
IrelandIsrael
Italy
Japan
Korea
Luxembourg
Netherlands
NorwayPoland
PortugalRussian Federation
Slovak Republic
Spain
Sweden
Turkey
United Kingdom
United States
20
25
30
35
40
45
50
55
0 10 20 30 40 50 60 70 80 90 100
The
poss
ibilit
y of
goi
ng b
ankr
upt
Recovery rate (cents on the dollar)
Austria
Belgium
Brazil China
Czech RepublicDenmark
Estonia
Finland
France
Germany
Greece
Hungary
Iceland
Ireland
Israel
Italy
Japan
Korea
Luxembourg
Netherlands
NorwayPoland
Portugal
Russian Federation
Slovak Republic
Slovenia
Spain
Sweden
Switzerland
TurkeyUnited Kingdom
United States
20
25
30
35
40
45
50
55
0.0 0.5 1.0 1.5 2.0 2.5 3.0 3.5 4.0 4.5
The
poss
ibilit
y of
goi
ng b
ankr
upt
Time (years)
0
10
20
30
40
50
60
70
80
90
100
Don't know / No answer Total 'disagree' Total 'agree'
ENTREPRENEURSHIP AT A GLANCE 2013 © OECD 2013 87

6. DETERMINANTS OF ENTREPRENEURSHIP: SELECTED INDICATORS
Access to finance: Venture capital
Key facts
– In the majority of countries for which data are available,venture capital investments represent a very small per-centage of GDP, e.g. often less than 0.03%. Exceptions areIsrael and the United States, where the venture capitalindustry is more mature and represents 0.5% and 0.2% ofGDP respectively.
– The crisis has severely affected the venture capitalindustry. In 2012, in most countries the level of venturecapital investments was around 60% 2007 levels. InIreland and Luxembourg however investments made in2012 exceeded pre-crisis levels.
– In 2012, in the United States, 40% of venture capitalinvestments were in the life sciences sector, while inEurope this share was 30%. Investments predominantlytarget companies in their start-up phase, followed bylater-stage ventures; and only a very small number ofcompanies are backed by ventur capital.
Relevance
Venture capital is a form of equity financing particularlyimportant for young companies with innovation andgrowth potential but untested business models and notrack record; it replaces and/or complements traditionalbank finance. The development of the venture capitalindustry is considered as part of the framework conditionsto stimulate innovative entrepreneurship.
Comparability
There are no standard international definitions of venturecapital nor of the breakdown of venture capital invest-ments by stage of development. In addition the methodo-logy for data collection differs across countries.
Data on venture capital are drawn mainly from national orregional venture capital associations that produce them, insome cases with the support of commercial data providers,except in Australia, where the Australian Bureau of Statis-tics collects and publishes statistics on venture capital.
The statistics presented correspond to the aggregation ofinvestment data according to the location of the portfoliocompanies (i.e. the investee companies), regardless of thelocation of the private equity firms. Exceptions areAustralia, Korea and Japan where data refer to the locationof the investing venture capital firms.
In the OECD Entrepreneurship Financing Database venturecapital is made up of the sum of early stage (including pre-seed, seed, start-up and other early stage) and later stageventure capital. As there are no harmonised definitions ofventure capital stages across venture capital associationsand other data providers, original data have been re-aggregated to fit the OECD classification of venture capitalby stages; see Annex C. Korea, New Zealand, the RussianFederation and South Africa do not provide breakdowns ofventure capital by stage that would allow meaningful inter-national comparisons.
Data on venture capital investments by sector are also theresult of a reclassification of original data into five sectors,namely: Computer and consumer electronics; Communica-tions; Life science; Industrial/energy; and Others.
In Figure 6.15, percentages for the United States relate to thenumber of investment deals in 2011 by development stage.
Annex C presents correspondence tables between originaldata and OECD harmonised data for venture capital invest-ments by stage and sector. Readers should be aware that inthe field of venture capital measurement the margin forimprovements of international comparability is important.
Sources/Online databases
OECD Entrepreneurship Financing Database, drawing from:
– Australian Bureau of Statistics, Venture Capital and LaterStage Private Equity, www.abs.gov.au/ausstats/[email protected]/mf/5678.0.
– CVCA, Thomson Reuters data, www.cvca.ca/resources/sta-tistics/.
– EVCA,www.evca.eu/knowledgecenter/statisticsdetail.aspx?id=6392.
– KVCA, http://eng.kvca.or.kr/sub04/sub0403.jsp.
– NVCA, Thomson Reuters data, www.nvca.org/.
– NZVCA, www.nzvca.co.nz/.
– PwC MoneyTree (Israel), www.pwc.com/il/en/venture-capi-tal-israel/moneytree-home.jhtml.
– RVCA, www.rvca.ru/eng/.
– SAVCA / KPMG, www.savca.co.za/kpmgsurvey/default.aspx.
– VEC, www.vec.or.jp/.
Information on data for Israel: http://dx.doi.org/10.1787/888932315602.
Definitions
Venture capital is a subset of private equity (i.e. equitycapital provided to enterprises not quoted on a stockmarket) and refers to equity investments made tosupport the pre-launch, launch and early stage devel-opment phases of a business (Source: EVCA, EuropeanPrivate Equity and Venture Capital Association).
Venture capital backed companies (portfolio companies)are new or young enterprises that are (partially ortotally) financed by venture capital.
The venture capital backed companies rate is computedas the number of enterprises that received venturecapital in year t over 1000 active enterprises in year t.
Nordic countries include Denmark, Finland, Norwayand Sweden (Figure 6.13).
ENTREPRENEURSHIP AT A GLANCE 2013 © OECD 201388

6. DETERMINANTS OF ENTREPRENEURSHIP: SELECTED INDICATORS
Access to finance: Venture capital
Figure 6.9. Venture capital investments as a percentage of GDP (US dollars)Percentage, 2012
1 2 http://dx.doi.org/10.1787/888932829590
Figure 6.10. Trends in venture capital investmentsIndex 2007 = 100
1 2 http://dx.doi.org/10.1787/888932829609
Table 6.1. Venture capital investments by countryMillion US dollars, 2012
Estonia (2011) 1.8 Italy 91.7 Australia 331.3
Slovenia (2011) 2.5 Finland 101.6 Korea 606.9
Czech Republic 6.7 Denmark 101.7 Germany 706.2
Russian Federation (2011) 9.3 South Africa (2011) 109.6 France 710.5
Poland 11.7 Ireland 113.5 Israel 867.0
Greece (2011) 13.7 Belgium 115.9 United Kingdom 929.1
Luxembourg 14.2 Norway 143.4 Canada 1470.1
Portugal 20.4 Spain 148.1 Japan 1553.6
New Zealand (2011) 28.9 Switzerland 209.5 United States 26652.4
Austria 43.5 Netherlands 226.5
Hungary 82.6 Sweden 285.6
1 2 http://dx.doi.org/10.1787/888932829837
0.000.020.040.060.080.100.120.140.160.180.20
Total Later stage venture Seed/start-up/early stage
0.50
0
20
40
60
80
100
120
140
160
180
2012 2009
ENTREPRENEURSHIP AT A GLANCE 2013 © OECD 2013 89

6. DETERMINANTS OF ENTREPRENEURSHIP: SELECTED INDICATORS
Access to finance: Venture capital
Figure 6.11. Venture capital investments by sector,United StatesPercentage, 2012
1 2 http://dx.doi.org/10.1787/888932829628
Life sciences,38.7
Computer and consumer
electronics, 25.8
Industrial/ Energy,
10.5
Other, 8.0
Communications,17.1
Figure 6.12. Venture capital investments by sector,Europe
Percentage, 2012
1 2 http://dx.doi.org/10.1787/888932829647
Life sciences, 28.4
Computer and consumer
electronics, 19.0
18.2
Industrial/Energy,
13.5
Other, 20.0
Communications,
Figure 6.13. Venture capital investments by sector, selected European countriesPercentage, 2012
1 2 http://dx.doi.org/10.1787/888932829666
Figure 6.14. Venture capital investments by sectorMillion US dollars, 2012
1 2 http://dx.doi.org/10.1787/888932829685
0
5
10
15
20
25
30
35
France Germany UK Nordic countries
0
2 000
4 000
6 000
8 000
10 000
12 000
Life sciences Computer & consumer electronics Communications Industrial/Energy Other
United States Europe
ENTREPRENEURSHIP AT A GLANCE 2013 © OECD 201390

6. DETERMINANTS OF ENTREPRENEURSHIP: SELECTED INDICATORS
Access to finance: Venture capital
Figure 6.15. Venture capital backed companies by development stagePercentage, 2012
1 2 http://dx.doi.org/10.1787/888932829704
Figure 6.16. Venture capital backed companies ratePer 1000 enterprises, 2010
1 2 http://dx.doi.org/10.1787/888932829723
0
10
20
30
40
50
60
70
80
90
Seed Start-up Later stage venture
0
0.1
0.2
0.3
0.4
0.5
0.6
0.7
0.8
0.9
1 1.6
ENTREPRENEURSHIP AT A GLANCE 2013 © OECD 2013 91


Entrepreneurship at a Glance 2013
© OECD 2013
age
activitypublicfor the
ises are
data on
ANNEX A
Sources of data on timely indicators of entrepreneurship
This Annex presents the sources and definitions used to develop the OECD Timely
Indicators of Entrepreneurship; two separate tables refer to enterprise creations and
bankruptcies respectively.
The OECD Timely Indicators of Entrepreneurship Database is available on http://
dotstat.oecd.org/Index.aspx.
Table A.1. National sources and definitions of enterprise creations
Sources and definitions of enterprise creations
Australia Source: Australian Securities and Investments Commission (ASIC).New company registrations.Monthly data.Incorporated companies only.www.asic.gov.au/asic/ASIC.NSF/byHeadline/Insolvencies%2C%20teminations%20%26%20new%20reg%20stats%20portal%20p
Belgium Source: SPF, DGSIE Dynamique de la population des entreprises.Primo-assujetissement à la TVA.Monthly data.Number of fist VAT subjection (declaration of taxable companies that acquire the status od subject to VAT for the first time).www.statbel.fgov.be
Denmark Source: Statistics Denmark.Quarterly data.Central Business Register www.cvr.dk .
Finland Source: Statistics Finland.Quarterly data.These statistics are derived from data in Statistics Finland’s Business Register. They cover those enterprises engaged in businessthat are liable to pay value-added tax or act as employers. Excluded are foundations, housing companies, voluntary associations,authorities and religious communities. The statistics cover enterprises of the state but not those of municipalities. Data are providednumber of enterprise openings. http://pxweb2.stat.fi/Database/StatFin/Yri/aly/aly_fi.asp
France Source: INSEE, sirene.Monthly data.Number of births. A birth amounts to the creation of a combination of production factors with the restriction that no other enterprinvolved in the event. Both employer and non-employer enterprises are covered.Excluding data on agriculture.www.insee.fr/fr/themes/indicateur.asp?id=41
Germany Source: Statistiches Bundesamt – Destatis.Monthly data.Number of new establishments (main offices and secondary establishments). Small units and auxiliary activities are not included.Transformation, take-over and change in ownership are excluded. New enterprises coming from abroad are also removed from thebirth.All activities are taken into account.https://www.destatis.de/DE/ZahlenFakten/GesamtwirtschaftUmwelt/UnternehmenHandwerk/UnternehmenHandwerk.html;jsessionid=097D062C21371DA040D380D3C14D01CC.cae2
93

ANNEX A
radual
uded).having
g, split-
strationenters
forcluded.
uptcyo has
Italy Source: InfoCamere, Movimprese – Registre d’entreprises des chambres de commerce italiennes.Quarterly data.Number of entries (iscritte).All legal forms and all activities are taken into accounts.www.infocamere.it/movimprese.htm
Netherlands Source: Centraal Bureau voor de Statistiek (CBS) – Registre d’’entreprises.Quarterly data.Number of establishment births (i.e. excluding mergers, take-over, change of name, change of legal form, change of ownership, gchange of activities, nationalisation).Data are only available for Industry, trade and market services. Items A,B,E,J,K70,K73,L,M,N,O91,O92 are excluded.http://statline.cbs.nl.
Norway Source: Statistics Norway.Quarterly data.Number of newly established enterprises.Excluding primary industries.http://statbank.ssb.no/statistikkbanken/
Russian Federation Source: Rosstat.Monthly data.Number of newly registered organisations.www.gks.ru
Spain Source: Instituto Nacional de Estadistica de Espana (INE). The Mercantile Companies (MC)Monthly dataNumber of entries.The Mercantile Companies register includes information on incorporated enterprises (natural persons or sole proprietors are exclCreated mercantile companies” may not be active and dissolved mercantile companies might be removed from the register withoutever been active.www.ine.es/jaxi/menu.do?type=pcaxis&path=%2Ft30%2Fp151&file=inebase&L=1
Sweden Source: Sweden agency for growth analysis.Quarterly data.Number of new businesses.www.tillvaxtanalys.se
United Kingdom Source: Companies House.Monthly data.New registrations (number of entries).All limited companies in England, Wales, Northern Ireland and Scotland are registered at Companies House.Entries reflect the appearance of a new enterprise within the economy, whatever the demographic event, be that a merger, renaminoff etc or birthwww.companieshouse.gov.uk/about/businessRegisterStat.shtml
United States Source: Bureau of Labor Statistics (BLS) – Business Employment Dynamics (BED).Quarterly data.Number of establishments with at least one employee.www.bls.gov/bdm/
Table A.2. National sources and definitions of bankruptcies
Sources and definitions of bankruptcies
Australia Source: Australian Securities and Investments Commission (ASIC).Monthly data.Insolvency statistics – Companies entering external administration.The statistics on companies entering external administration show the number of companies entering into a form of external adminifor the first time. ASIC advises that a company will be included only once in these statistics, regardless of whether it subsequentlyinto another form of external administration. The only exception occurs where a company is taken out of external administration,example as the result of a court order, and at a later date re-enters external administration. Members voluntary windings up are exMay include provisional data.www.asic.gov.au/
Canada Source: Office of the Superintendent of Bankruptcy Canada.Monthly data.A business bankruptcy is defined as the state of a business that has made an assignment in bankruptcy or against whom a bankrorder has been made. A business is defined as any commercial entity or organisation other than an individual, or an individual whincurred 50 percent or more of total liabilities as a result of operating a business. http://osb.ic.gc.ca
Table A.1. National sources and definitions of enterprise creations (cont.)
Sources and definitions of enterprise creations
ENTREPRENEURSHIP AT A GLANCE 2013 © OECD 201394

ANNEX A
Oficial).
s isses andrprises
ofidation.
rtment
d under
ed.
Chile Source: Superintendencia de Quiebras Ministerio de la Justicia.Monthly data.Number of bankruptcies according to the Law 18.175 declared by the xxx of justice and published into the official bulletin (Diariowww.squiebras.gob.cl
Denmark Source Statistics Denmark.Registry-based method from January 2009 onwards, simple count method before. The number of announcements of bankruptciecounted excluding units from the Faroe Islands and Greenland. When using the simple count method, bankruptcies of both enterpriindividuals (personal bankruptcies) were counted. After the implementation of the registry-based method, only bankruptcies of enteare counted, i.e. bankruptcies associated with a CVR-number.www.statbank.dk
France Source: BODACC (bulletin officiel d'annonces civiles et commerciales) data processed by INSEE.Monthly data.Business failures.A business failure is defined as the opening of insolvency proceedings. The statistics on business failures cover both the openinginsolvency proceedings and direct liquidations. They do not reflect the outcome of the proceedings: continuation, take-over or liquwww.insee.fr
Iceland Source: Statistics Iceland.Monthly data.Insolvencies of Icelandic enterprises by field of activity, including personal.www.statice.is
Japan source: Japan Small Business Research Institute (JSBRI).Monthly data.Number of Bankruptcies.Statistics are from the Ministry of Economy, Trade and Industry Small and Medium Enterprise Agency Business Environment DepaPlanning Division Research Office.Bankruptcy is considered when it involves more than 10 million US dollars of the total liabilities of the concerned company. Includethe definition of bankruptcy are: defaults on due payments, legal and corporate reorganisations, special liquidations company.www.jsbri.or.jp
Netherlands Source: Centraal Bureau voor de Statistiek (CBS).Quarterly data.Number of bankruptcies pronounced by Dutch courts.Excluding individuals without a sole proprietorship.www.cbs.nl/
Norway Source: Statistics Norway.Frequency: quarterlyGross valuehttp://statbank.ssb.no
United Kingdom Source: Companies House.Monthly data.Incorporated companies only.Total insolvencies. Including compulsory liquidations, creditors’ voluntary liquidations, and administrative orders converted to CrExcluding members’ voluntary liquidations.www.companieshouse.gov.uk/
United States Source:United States Courts.Quarterly data.Statistics on bankruptcy petition filings – total business filings (Chapters 7, 11 and 13).www.uscourts.gov/
Table A.2. National sources and definitions of bankruptcies (cont.)
Sources and definitions of bankruptcies
ENTREPRENEURSHIP AT A GLANCE 2013 © OECD 2013 95

ANNEX B
ANNEX B
List of indicators of entrepreneurial determinants
This Annex presents a comprehensive list of indicators of entrepreneurial
determinants. The list draws from past work conducted by FORA (Ministry of Economic and
Business Affairs, Division for Research and Analysis, Denmark) for the annual report
“Quality Assessment of Entrepreneurship Indicators, which was discontinued in 2012.
Indicators are classified into the six categories of determinants set by the OECD-Eurostat
Entrepreneurship Indicators Programme: 1. Regulatory Framework; 2. Market Conditions; 3.
Access to Finance; 4; Creation and Diffusion of Knowledge; 5. Entrepreneurial Capabilities;
6. Entrepreneurial Culture. For each indicator, a short description and the source of data are
provided.
While many critical factors affecting entrepreneurship are covered by the indicators
presented in the table, the list should not be considered as exhaustive. On the one side, the
selection of indicators reflects the current availability of data, meaning that important
indicators may be missing, for instance in the determinant area access to finance, just
because no source of international data was found. On the other side, empirical research
on entrepreneurship is still young, especially on topics such as the relationship between
culture and entrepreneurship, with the result that appropriate indicators are yet to be
identified.
Table B.1. Indicators of entrepreneurial determinants and data sources
Category of determinants Definition Data sources
1. REGULATORY FRAMEWORK
Administrative burdens (entry and growth)
Burden of government regulation Survey responses to the question: Complying with administrativerequirements (permits, regulations, reporting) issued by the government inyour country is (1 = burdensome, 7 = not burdensome).
World Economic Forum,GlobalCompetitiveness Report
Costs required for starting a business The official cost of each procedure in percentage of Gross National Income(GNI) per capita based on formal legislation and standard assumptionsabout business and procedure.
World Bank, Doing Business
Minimum capital required for starting abusiness
The paid-in minimum of capital requirement that the entrepreneur needs todeposit in a bank before registration of the business starts.
World Bank, Doing Business
Number of days for starting a business The average time spent during each enterprise start-up procedure. World Bank, Doing Business
Number of procedures for starting abusiness
All generic procedures that are officially required for an entrepreneur tostart an industrial or commercial business.
World Bank, Doing Business
Procedures time and costs to build awarehouse
Corresponds to an average of three measurements: 1) Average time spentduring each procedure, 2) Official cost of each procedure and 3) Number ofprocedures to build a warehouse.
World Bank, Doing Business
Registering property Corresponds to an average of three measurements: 1) Number ofprocedures legally required to register property, 2) Time spent incompleting the procedures and 3) Registering property costs.
World Bank, Doing Business
ENTREPRENEURSHIP AT A GLANCE 2013 © OECD 201396

ANNEX B
pant)
ck
Time it takes to prepare, file and pay thecorporate income tax, vat and socialcontributions
Time is measured in hours per year. World Bank, Doing Business
Bankruptcy Regulations
Actual cost to close a business The cost is measured in per cent of estate, based on a standard businessclosure.
World Bank, Doing Business
Actual time to close a business Time is recorded in calendar years. The indicator is based on a standardbusiness closure.
World Bank, Doing Business
Bankruptcy recovery rate The recovery rate estimates how many cents on the dollar claimants –creditors, tax authorities and employees – recover from an insolvent firm.
World Bank, Doing Business
Court and Legal Framework
Enforcing contracts – Cost in % of claim Cost is recorded as a percentage of the claim, assumed to be equivalent to200% of income per capita. No bribes are recorded. Three types of costsare recorded: court costs, enforcement costs and average attorney fees.
World Bank, Doing Business
Enforcing contracts – number of procedures A procedure is defined as any interaction between the parties, or betweenthem and the judge or court officer. This includes steps to file the case,steps for trial and judgment and steps necessary to enforce the judgment.
World Bank, Doing Business
Enforcing contracts – Time Time is recorded in calendar days, counted from the moment the plaintifffiles the lawsuit in court until payment. This includes both the days whenactions take place and the waiting periods between.
World Bank, Doing Business
Difficulty of firing The index measures whether laws or other regulations have implications forthe difficulties of firing a standard worker in a standard company, based onfact-based (yes/no) questions, remodelled into a 0-100 index.
World Bank, Doing Business
Difficulty of hiring The index measures whether laws or other regulations have implications forthe difficulties of hiring a standard worker in a standard company, based onfact-based (yes/no) questions, remodelled into a 0-100 index.
World Bank, Doing Business
Ease of hiring foreign labour Survey responses to the question: Labour regulation in your country(1 = prevents your company from employing foreign labor, 7 = does notprevent your company from employing foreign labor).
World Economic Forum, GlobalCompetitiveness Report
Rigidity of hours index The indicator is an index with five components: i) whether night work isrestricted; ii) whether weekend work is allowed; iii) whether the work weekconsists of five and a half days or more; iv) whether the workday can extendto 12 hours or more (including overtime); and v) whether the annual paidvacation days are 21 days or less.
World Bank, Doing Business
Social and Health Security
Public expenditure on unemploymentsupport
Public expenditure on unemployment per unemployed in USD, currentPPPs. Public expenditure includes both partly, full public pay and any otherprogramme expenditures the public has.
OECD, Public expenditure and particistocks on Labour Market Policy (LMP
Public health care coverage The share of the population eligible for a defined set of health care goodsand services under public programmes.
OECD Health data
Income taxes; Wealth/Bequest Taxes
Average income tax plus social contributions The average rate of taxation in percentage of the gross wage. The indicatoris based on a standard case: single (without children) with high income.
OECD Revenue Statistics
Highest marginal income tax plus socialcontributions
The highest rate of taxation in percentage of the gross wage. The indicatoris based on a standard case: single (without children) with high income.
OECD Revenue Statistics
Revenue from bequest tax The revenue from bequest tax as a per cent of GDP on a 3 year movingaverage.on a standard case: single (without children) with high income.
OECD Revenue Statistics
Revenue from net wealth tax The revenue from net wealth tax as a per cent of GDP on a 3 year movingaverage.
OECD Revenue Statistics
Business and Capital Taxes
SME tax rates OECD Revenue Statistics
Taxation of corporate income revenue The revenue from corporate income tax as percentage of GDP on a threeyear moving average.
OECD Revenue Statistics
Taxation of dividends – top marginal tax rate OECD Tax Database
Taxation of Stock Options The average tax wedge for purchased and newly listed stocks. Averageincomes are used.
OECD, The Taxation of Employee StoOptions – Tax Policy Study No. 11
Patent System; Standards
Intellectual property rights Survey responses to the question: intellectual property protection in theworld (1 = is weak or nonexistent, 7 = is equal to the world’s moststringent).
World Economic Forum, GlobalCompetitiveness Report
Table B.1. Indicators of entrepreneurial determinants and data sources (cont.)
Category of determinants Definition Data sources
ENTREPRENEURSHIP AT A GLANCE 2013 © OECD 2013 97

ANNEX B
ts and
k
k
icators,national
n OECD
base,
enture
iationciation
ciation
l and
Property rights Survey responses to the question: property rights, including over financialassets (1 = are poorly defined and not protected by law, 7 = are clearlydefined and well protected by law).
World Economic Forum, GlobalCompetitiveness Report
2. MARKET CONDITIONS
Access to Foreign Markets
Export burdens An average of three measurements: 1) Number of all documents required toexport goods, 2) Number of signatures required to export goods, 3) Timenecessary to comply with all procedures required to export goods.
World Bank, Doing Business
Import burdens An average of three measurements: 1) Number of all documents required toimport goods, 2) Number of signatures required to import goods, 3) Timenecessary to comply with all procedures required to import goods.
World Bank, Doing Business
Degree of Public Involvement
Government enterprises and investment Data is composed of the number, composition, and share of outputsupplied by State-Operated Enterprises (SOEs) and government investmentas a share of total investment.
IMF, World Bank, UN National AccounWorld Economic Forum
Licensing restrictions Zero-to-10 ratings are constructed for 1) the time cost (measured innumber of calendar days required to obtain a license) and 2) the monetarycost of obtaining the license (measured as a share of per-capita income).These two ratings are then averaged to arrive at the final rating.
World Bank
Price controls The indicator measures the extent to which prices are determined by themarket or by government involvement.
IMD World Competitiveness Yearboo
Private Demand
Buyer sophistication Survey responses to: purchasing decisions are (1 = based solely on thelowest price, 7 = based on a sophisticated analysis of performance).
World Economic Forum, GlobalCompetitiveness Report
3. ACCESS TO FINANCE
Access to Debt Financing
Country credit rating The indicator is based on an assessment by the Institutional InvestorMagazine Ranking.
IMD World Competitiveness Yearboo
Domestic credit to private sector The indicator refers to financial resources provided to the private sector –such as through loans, purchases of non-equity securities, and tradecredits and other accounts receivable – that establish a claim forrepayment.
Published in World Development IndWorld Bank. Data are from IMF’s InterFinancial Statistics
Ease of access to loans Survey responses to: how easy it is to obtain a bank loan in your countrywith only a good business plan and no collateral (1 = impossible, 7 = easy).
World Economic Forum, GlobalCompetitiveness Report
Interest rate spread The lending rate minus deposit rate based on an average of annual rates foreach country.
IMF, International Financial Statistics
Legal rights index The degree to which collateral and bankruptcy laws facilitate lending.Higher scores indicating that collateral and bankruptcy laws are betterdesigned to expand access to credit.
World Bank, Doing Business
Share of SME loans in business loans Financing SMEs and Entrepreneurs. AScoreboard
Access to Venture Capital
Venture Capital Availability Survey responses to: entrepreneurs with innovative but risky projects cangenerally find venture capital in your country (1 = not true, 7 = true).
World Economic Forum, GlobalCompetitiveness Report
Venture Capital Private equity investments in young businesses with innovation and growthpotential
OECD Entrepreneurship Finance Databased on:ABS: Australian Bureau of StatisticsEVCA: European Private Equity and VCapital AssociationVEC: Venture Enterprise CenterKVCA: Korean Venture Capital AssocNVCA: National Venture Capital AssoNZVCA: New Zealand Venture CapitalAssociationRVCA: Russian Venture Capital AssoThomson ReutersSAVCA: South African Venture CapitaPrivate Equity Association
Stock Markets
Capitalisation of primary stock market The capitalisation of the primary stock market (the value of the issuedshares on the market) relative to GDP.
World Federation of Exchange
Table B.1. Indicators of entrepreneurial determinants and data sources (cont.)
Category of determinants Definition Data sources
ENTREPRENEURSHIP AT A GLANCE 2013 © OECD 201398

ANNEX B
ing
tics
tics
tics
tics
tics
tics
tics
tics
ation
ation
cs
M)
M)
k
Investor protection The main indicators include: transparency of transactions (Extent ofDisclosure Index), liability for self-dealing (Extent of Director LiabilityIndex), shareholders’ ability to sue officers and directors for misconduct(Ease of Shareholder Suit Index), strength of Investor Protection Index (theaverage of the three index).
World Bank, Doing Business
Market capitalisation of newly listedcompanies
The market capitalisation (total number of new shares issued multiplied bytheir value on the first day of quotation) of newly listed domestic sharesrelative to GDP.
World Federation of Exchange EmergMarket Database
4. CREATION AND DIFFUSION OF KNOWLEDGE
R&D Activity
Business Expenditure on R&D – BERD OECD Science and Technology Statis
Government Expenditure on R&D – GERD OECD Science and Technology Statis
Higher Education Expenditure on R&D –HERD
OECD Science and Technology Statis
International Co-operation Between PatentApplications at PCT
The indicator measures international co-operation between patentapplications under the Patent Co-operation Treaty (PCT). The measure iscalculated as a percentage of total patents (by application date).
OECD Science and Technology Statis
Patents Awarded Based on InventorsResidence
Number of patents awarded to inventors based on their residence. Theindicator is a sum of patents awarded by the European Patent Office (EPO)and US Patent and Trademark Office (USPTO).
OECD Science and Technology Statis
Private Funding of R&D Activity Total private founded R&D investments, independent of where the foundingis spent. The indicator is measured as a percentage of GDP.
OECD Science and Technology Statis
Public Funding of R&D Activity Total public funding of R&D – as a percentage of GDP. OECD Science and Technology Statis
Transfer of Non-commercial Knowledge
Research in Higher Education SectorFinanced by Business
R&D expenditure performed at higher education and funded by business,measured as a percentage of total research expenditure.
OECD Science and Technology Statis
Share of Patents Owned by Universities The percentage of patents owned by universities. Only countries/economieswith more than 300 patents are included.
OECD Patent Database
Universities or other Public ResearchOrganizations as Source of Innovation
The share of innovative enterprises that states universities or other PROs asan important source of innovation.
Eurostat, European Community InnovSurvey (CIS)
University/Industry Research Collaboration Survey responses to: the level of collaboration between business anduniversities in R&D. (1 for minimal or nonexistent to 7 for intensive andongoing).
World Economic Forum, GlobalCompetitiveness Report
Co-operation Among Firms
SMEs Stating Co-operation as the Source ofInnovation
The share of innovative small and medium sized enterprises (SMEs) statingany type of co-operation as the source of innovation.
Eurostat, European Community InnovSurvey (CIS)
Technology availability and take-up
Turnover from e-Commerce Total internet sales over the last calendar year, excluding VAT, as apercentage of total turnover.
Eurostat, Information Society Statisti
Enterprises Using e-Government The share of enterprises using any eGovernment services. The measure isbased on all firms with 10 employees or more, excluding the financialsector.
Information Society Statistics
ICT expenditure Expenditure for ICT equipment, software and services as a percentage ofGDP.
European Information TechnologyObservatory (EITO)
ICT expenditure in Communications Expenditure for telecommunications equipment and carrier services as apercentage of GDP.
European Information TechnologyObservatory (EITO)
5. ENTREPRENEURIAL CAPABILITIES
Business and Entrepreneurship education
International Students in Tertiary Education The share of international students in total tertiary enrolments. OECD Education at a Glance
Population with Tertiary Education The share of persons between 25-34 of age with tertiary-type B educationor tertiary-type A education and advanced research programmes.
OECD Education at a Glance
Quality of Management Schools Survey responses to: the quality of management schools across Countriesis (limited or of poor quality for 1, to amongst the best in the World for 7).
World Economic Forum, GlobalCompetitiveness Report
Received training in starting a businessduring school
The percentage of the population aged 18-64 that received training –voluntary or compulsory – in starting a business during school.
Global Entrepreneurship Monitor (GE2008 Executive Report
Received Training in Starting a BusinessAfter School
the percentage of the population aged 18-64 that received training –voluntary or compulsory – in starting a business after school.
Global Entrepreneurship Monitor (GE2008 Executive Report
Immigration
Inflows of foreign labour Inflows of foreign workers as a percentage of the total labor force. OECD International Migration Outloo
Table B.1. Indicators of entrepreneurial determinants and data sources (cont.)
Category of determinants Definition Data sources
ENTREPRENEURSHIP AT A GLANCE 2013 © OECD 2013 99

ANNEX B
ions inrants in
k
k
rometer
M)
M)
k.
rometer
M)
M)
rometer
rometer
rometer
rometer
Migrants with Tertiary Education The share of highly skilled migrants as a percentage of total migrants. OECD, A profile of immigrant populatthe 21st century. Database on immigOECD countries (DIOC)
Self-employment by Place of Birth The share of self-employment by foreign-born persons. Self-employment ismeasured as a percentage of total employment.
OECD International Migration Outloo
Stocks of foreign labour The stock of foreign workers as a percentage of the total labor force. OECD International Migration Outloo
6. ENTREPRENEURSHIP CULTURE
Desirability of Becoming Self-Employed Survey responses to: desire to become self-employed within the next 5years. This question is asked only to non-self-employed individuals.
European Commission, Flash Euroba
Entrepreneurial Intention The percentage of 18-64 population (individuals involved in any stage ofentrepreneurial activity excluded) who intend to start a business withinthree years.
Global Entrepreneurship Monitor (GE
Entrepreneurial Motivation The percentage of early stage entrepreneurs who were motivated by eithera) a desire for independence or b) a desire to increase their income.
Global Entrepreneurship Monitor (GE2007 Executive Report
Entrepreneurship among Managers How senior executives rank the level of entrepreneurship of businessmanagers in the given country from a scale of 0 to 10.
IMD World Competitiveness Yearboo
The image of the entrepreneurs Survey responses. European Commission, Flash Euroba
Fear of Failure The percentage of non-entrepreneurially active adult population aged 18-64that sees good opportunities to start a business, where fear of failure wouldprevent starting a business.
Global Entrepreneurship Monitor (GE
Good Conditions to Start a Business The percentage of non-entrepreneurially active adult population aged 18-64that sees good opportunities for starting a business in the next 6 months.
Global Entrepreneurship Monitor (GE
Image of entrepreneurs Survey responses to: image of entrepreneurs according to their status insociety. Entrepreneurs are ranked against civil servants and managers.
European Commission, Flash Euroba
Risk for Business Failure Survey responses to: being willing to start a business if a risk exists that itmight fail.
European Commission, Flash Euroba
The Wish to Own one’s Own Business Survey responses. European Commission, Flash Euroba
Self-Employment Preference Survey responses to: preferences towards being self employed or being anemployee.
European Commission, Flash Euroba
Table B.1. Indicators of entrepreneurial determinants and data sources (cont.)
Category of determinants Definition Data sources
ENTREPRENEURSHIP AT A GLANCE 2013 © OECD 2013100

ANNEX C
ANNEX C
International comparability of venture capital data
Aggregate data on venture capital provide useful information on trends in the venture
capital industry. These data are typically compiled by national or regional Private Equity
and Venture Capital Associations, often with the support of commercial data providers.
The quality and availability of aggregate data on venture capital have improved
considerably in recent years; however, international comparisons remain complicated
because of two main problems.
The first difficulty comes from the lack of a standard international definition of venture
capital. While there is a general understanding, the definition of the types of investments
included in venture capital varies across countries and regions. In some cases, differences
are purely linguistic; in others, they are more substantive.
The second problem relates to the diverse methodologies employed by data compilers. The
completeness and representativeness of venture capital statistics with respect to the
venture capital industry of a country will differ depending on how data were collected.
The following tables illustrate differences concerning respectively: the definition of
private equity and venture capital (Table C.1); the breakdown of venture capital by stage
(Table C.2); the breakdown of venture capital by sector (Table C.3); and the methods of data
collection (Table C.4).
ENTREPRENEURSHIP AT A GLANCE 2013 © OECD 2013 101

ANNEX C
tments
uses onand
capitalt with aent
m
ly bying a
nd
etc. toll and
OECD
Pre-seed/Seed
Start-up/Other earlystage
Laterstageventure
OtherPrivateEquity
Table C.1. Definitions of private equity and venture capital
Source Private equity (PE) Venture capital (VC)
European Private Equity andVenture Capital Association(EVCA)
PE is equity capital provided to enterprises not quoted on a stockmarket.
VC is a subset of private equity and refers to equity invesmade to support the pre-launch, launch and early stagedevelopment phases of a business.
National Venture CapitalAssociation – United States(NVCA)
PE is equity investment in non-public companies, usually definedas being made up of venture capital funds. Real estate, oil andgas, and other such partnership are sometimes included in thedefinition.
VC is a segment of the private equity industry which focinvesting in new companies with high growth potentialaccompanying high risk.
Australian Bureau of Statistics(ABS)
(Later Stage) PE is an investment in companies in later stages ofdevelopment, as well as investment in underperformingcompanies. These companies are still being established, the risksare still high and investors have a divestment strategy with theintended return on investment mainly in the form of capital gains(rather than long-term investment involving regular incomestreams).
VC is a high risk private equity capital for typically new,innovative or fast growing unlisted companies. A ventureinvestment is usually a short to medium-term investmendivestment strategy with the intended return on investmmainly in the form of capital gains (rather than long-terinvestment involving regular income streams).
Canada’s Private Equity andVenture Capital Association(CVCA)
The generic term for the private market reflecting all forms ofequity or quasi-equity investment. In a mature private equityuniverse, there are generally three distinct market segments:Buyout Capital, Mezzanine Capital and Venture Capital.
A specialised form of private equity, characterised chiefhigh-risk investment in new or young companies followgrowth path.
Korean Venture CapitalAssociation (KVCA)
PE means an equity investment method with fund raised by lessthan 49 Limited Partners. It takes a majority stake of companyinvested, improves its value and then obtains capital gain byselling stock.
Company/Fund investing in early-stage, high-potential agrowth companies.
Venture Enterprise Center -Japan(VEC)
PE is an investment method by which investors are involved inthe management and governance of enterprises for theimprovement of its value by providing those enterprises, indifferent developing stages and business environments, withnecessary funds.
Funds provided via shares, convertible bonds, warrantsventure businesses, which are closed (non-public) smamedium size enterprises with growth potential.
Table C.2. Breakdown of venture capital by stage, selected VC associations and OECD
EVCA NVCAPwC MoneyTree – Israel
ABS –Australia
CVCA VEC KVCA NZVCA RVCA SAVCA
Private equity
Venturecapital
Pre-seed
Seed Seed Seed/Start-up
Seed Seed Seed Early (< 1) Seed/ Start-up
Seed/Start-up
Seed
Start-up
Early stage Start-up
Start-up Early stage
Early (< 3)
Start-up andearly stageOtherearly
stage
Earlystage/Expansionstage
Otherearlystage
ExpansionEarly stageExpansion
Otherearlystages
Later-stageventure
Expansion/ Laterstage
LaterStage
Earlyexpansion
Expansion Later Expansion
OtherPrivateEquity
Growth/Rescue/TurnaroundReplacement,Buyout
Buy-outsandmezzaninecapital
LateExpansion,Turnaround, LBO/MBO/MBI
Acquisition/Buyout,Turnaround, Otherstage
Later (> 3)
TurnaroundExpansion Expansion and
development
Mid-marketPE, BuyoutPE
Restructuring Replacement,
BuyoutLater stage
Note:CVCA includes Expansion in Other Private Equity. NZVCA includes Turnaround in Venture capital.NZVCA: New Zealand Venture Capital Association.RVCA: Russian Venture Capital Association.SAVCA: South African Venture Capital and Private Equity Association.
ENTREPRENEURSHIP AT A GLANCE 2013 © OECD 2013102

ANNEX C
Table C.3. Breakdown of venture capital by sector, Europe and United States
OECD classification United States – NVCA Europe – EVCA
Computer and consumer electronics
SoftwareSemiconductorsElectronics/InstrumentationNetworking and EquipmentComputers and Peripherals
Computer and consumer electronics
CommunicationsMedia and EntertainmentIT ServicesTelecommunications
Communications
Life sciencesMedical Devices and EquipmentHealthcare Services
Life sciences
Industrial/EnergyIndustrial/Energy Energy and environment
Chemicals and materials
Other
Consumer Products and ServicesRetailing/DistributionBusiness Products and ServicesFinancial ServicesOther
Consumer goods and retailConsumer servicesBusiness and industrial productsBusiness and industrial servicesFinancial servicesAgricultureReal estateConstructionTransportationUnknown
ENTREPRENEURSHIP AT A GLANCE 2013 © OECD 2013 103

ANNEX C
Table C.4. Methods for collecting data on venture capital
ABS Census of VC and later stage PE funds domiciled in Australia and identified by the Australian Bureau ofStatistics. Investments by non-resident funds in Australian investee companies are out of scope of thesurvey; however funds sourced from non-residents and Australian funds investing in non-residentcompanies are in scope.
CVCA Quarterly surveys of PE fund managers active in the Canadian industry, conducted by ThomsonReuters. Coverage of the industry is claimed to be very high.
EVCA Census of European PE and VC firms identified by EVCA and partner associations. Firms are surveyedon a quarterly basis; firms that did not provide quarterly surveys are invited to fill in an annualquestionnaire, available on the PEREP website (PEREP Analytics is a non-commercial pan-Europeanprivate equity Database with its own staff and resources). Throughout the data-collection period,PEREP analysts and co-operating national PE and VC associations contact non-respondents toencourage participation in the survey. Information is complemented by data from public sources (e.g.press, media, websites of PE and VC firms or their portfolio companies); data are included if complyingwith rules defining the qualifying players, the transaction date, the relevant amounts and the qualitativeparameters. Two independent public sources are usually required before information is added to thedatabase.
KVCA Census of registered Korean VC firms (for registration, the capital of a VC firm should exceed 5000won). By law, VC firms report their activities monthly.
NVCA MoneyTree™ Report: Quarterly study of venture capital investment activity in the United States,produced by NVCA in co-operation with PricewaterhouseCoopers (PwC). The report includes theinvestment activity (in investee companies domiciled in the United States) of professional venturecapital firms with or without a US office, Small Business Investment Companies (SBICs), corporate VC,institutions, investment banks and similar entities whose primary activity is financial investing. Angel,incubator and similar investments that are part of a VC round are included if they involve cash forequity and not buyout or services in kind. Data are primarily obtained from a quarterly survey ofventure capital practitioners conducted by Thomson Reuters. Information is augmented by otherresearch techniques including other public and private sources. All data are subject to verification withthe venture capital firms and/or the investee companies.
NZVCA Survey of VC and PE participants in the New Zealand market performed by NZVCA and Ernst & Young,including firms from both New Zealand and Australia (the 2011 sample consisted of 21 respondents).Also included is any publicly announced information (e.g. S&P Capital IQ; New Zealand VentureInvestment Fund’s Young Company Finance publication). NZVCA and Ernst & Young acknowledge thata small number of industry participants elect not to participate in the survey.
Israel/PwC The MoneyTree™ Report: Quarterly study by PwC Israel; see above NVCA.
RVCA Survey of PE and VC funds active in the Russian market (the 2011 sample consisted of more than 100respondents). RVCA considers that the total figures collected adequately reflect the Russian markettrends.
SAVCA Survey of PE industry participants, conducted by KPMG and SAVCA (the 2011 sample consisted of 63respondents; information from 8 additions PE firms was added drawing from alternative sources).Investments are included if there are made in South Africa, regardless of where they are managedfrom. Investments in private equity from corporates, banks and development financing institutions arecovered.
VEC Survey of VC investors identified by VEC.
ENTREPRENEURSHIP AT A GLANCE 2013 © OECD 2013104

ORGANISATION FOR ECONOMIC CO-OPERATIONAND DEVELOPMENT
The OECD is a unique forum where governments work together to address the economic, social and
environmental challenges of globalisation. The OECD is also at the forefront of efforts to understand and
to help governments respond to new developments and concerns, such as corporate governance, the
information economy and the challenges of an ageing population. The Organisation provides a setting
where governments can compare policy experiences, seek answers to common problems, identify good
practice and work to co-ordinate domestic and international policies.
The OECD member countries are: Australia, Austria, Belgium, Canada, Chile, the Czech Republic,
Denmark, Estonia, Finland, France, Germany, Greece, Hungary, Iceland, Ireland, Israel, Italy, Japan, Korea,
Luxembourg, Mexico, the Netherlands, New Zealand, Norway, Poland, Portugal, the Slovak Republic, Slovenia,
Spain, Sweden, Switzerland, Turkey, the United Kingdom and the United States. The European Union takes
part in the work of the OECD.
OECD Publishing disseminates widely the results of the Organisation’s statistics gathering and
research on economic, social and environmental issues, as well as the conventions, guidelines and
standards agreed by its members.
OECD PUBLISHING, 2, rue André-Pascal, 75775 PARIS CEDEX 16
(30 2013 01 1 P) ISBN 978-92-64-18385-8 – No. 60665 2013

Entrepreneurship at a Glance 2013
Consult this publication on line at http://dx.doi.org/10.1787/entrepreneur_aag-2013-en.
This work is published on the OECD iLibrary, which gathers all OECD books, periodicals and statistical databases.Visit www.oecd-ilibrary.org for more information.
Entrep
reneu
rship
at a Glance 2013
2013
Entrepreneurship at a Glance 2013Entrepreneurship at a Glance, a product of the OECD-Eurostat Entrepreneurship Indicators Programme, presents an original collection of indicators for measuring the state of entrepreneurship, along with key facts and explanations of the policy context. This third issue features a special chapter on the profile of the entrepreneur, as well as longer time series and breakdowns by sector for the main indicators.
Contents
Executive summary
Recent developments in entrepreneurship
Structural indicators on enterprise population
Enterprise birth, death and survival
Enterprise growth and employment creation
The profile of the entrepreneur
Determinants of entrepreneurship: Selected indicators
isbn 978-92-64-18385-8 30 2013 01 1 P -:HSTCQE=V]X]Z]:
302013011cov.indd 1 01-Jul-2013 3:21:13 PM