Targeting Agricultural Electricity Subsidies in Haryana
39
Anjali Viswamohanan Shruti Sharma Michaël Aklin Tom Moerenhout April 2022 © 2022 International Institute for Sustainable Development | IISD.org /gsi Targeting Agricultural Electricity Subsidies in Haryana GSI REPORT
-
Upload
khangminh22 -
Category
Documents
-
view
0 -
download
0
Transcript of Targeting Agricultural Electricity Subsidies in Haryana

Anjali Viswamohanan Shruti Sharma Michaël Aklin Tom Moerenhout
April 2022© 2022 International Institute for Sustainable Development | IISD.org /gsi
Targeting Agricultural Electricity Subsidies in HaryanaGSI REPORT

IISD.org/gsi ii
Targeting Agricultural Electricity Subsidies in Haryana
© 2022 International Institute for Sustainable Development Published by the International Institute for Sustainable Development
This publication is licensed under a Creative Commons Attribution-NonCommercial-ShareAlike 4.0 International License.
International Institute for Sustainable Development
The International Institute for Sustainable Development (IISD) is an award-winning independent think tank working to accelerate solutions for a stable climate, sustainable resource management, and fair economies. Our work inspires better decisions and sparks meaningful action to help people and the planet thrive. We shine a light on what can be achieved when governments, businesses, non-profits, and communities come together. IISD’s staff of more than 120 people, plus over 150 associates and consultants, come from across the globe and from many disciplines. With offices in Winnipeg, Geneva, Ottawa, and Toronto, our work affects lives in nearly 100 countries.
IISD is a registered charitable organization in Canada and has 501(c)(3) status in the United States. IISD receives core operating support from the Province of Manitoba and project funding from governments inside and outside Canada, United Nations agencies, foundations, the private sector, and individuals.
Global Subsidies Initiative
The IISD Global Subsidies Initiative (GSI) supports international processes, national governments and civil society organizations to align subsidies with sustainable development. GSI does this by promoting transparency on the nature and size of subsidies; evaluating the economic, social and environmental impacts of subsidies; and, where necessary, advising on how inefficient and wasteful subsidies can best be reformed. GSI is headquartered in Geneva, Switzerland, and works with partners located around the world. Its principal funders have included the governments of Denmark, Finland, New Zealand, Norway, Sweden, Switzerland and the United Kingdom, as well as the KR Foundation.
Targeting Agricultural Electricity Subsidies in Haryana
April 2022
Photo: PradeepGaurs / Shutterstock
Written by Anjali Viswamohanan, Shruti Sharma, Michaël Aklin, Tom Moerenhout
Head Office
111 Lombard Avenue, Suite 325Winnipeg, ManitobaCanada R3B 0T4
Tel: +1 (204) 958-7700Website: www.iisd.orgTwitter: @IISD_news
Global Subsidies Initiative
International Environment House 2, 7–9 chemin de Balexert 1219 Châtelaine Geneva, Switzerland Canada R3B 0T4
Tel: +1 (204) 958-7700 Website: www.iisd.org/gsi Twitter: @globalsubsidies
IISD.org/gsi iii
Targeting Agricultural Electricity Subsidies in Haryana
AcknowledgementsThe authors would like to thank a number of individuals who contributed to this project, including, on project design: Christopher Beaton, from the International Institute for Sustainable Development, Johannes Urpelainen, from the Initiative for Sustainable Energy Policy, Johns Hopkins University, Mandvi Singh and Nilanjan Ghose, from the Deutsche Gesellschaft für Internationale Zusammenarbeit GmbH, and Siddharth Goel, Anas Rahman, and Swasti Raizada, from the International Institute for Sustainable Development; for research inputs: Shalu Agrawal, from the Council on Energy Environment and Water, and G. Mini, from TERI; for contributing to data collection: Tatheer Fatima and Bhartendu Trivedi, from Morsel Research and Development; and on data quality control: Sonakshi Saluja, from the Initiative for Sustainable Energy Policy, Johns Hopkins University.
We would also like to thank the peer reviewers who patiently read through our draft analysis in depth, provided critical comments, and offered crucial and highly relevant suggestions. This includes the following individuals and institutions:
• Siddharth Arora, Shakti Sustainable Energy Foundation
• Bigsna Gill, Sustain Plus Energy Foundation
• Shilp Verma and Neha Durga, International Water Management Institute
• Meena Nair, Public Affairs Centre
• Pavithra Ramesh, Citizen Consumer and Civic Action Group
• Prajnasish Swain, PricewaterhouseCoopers
• Sarada Prasanna Das, Centre for Policy Research
We are grateful to GIZ India (Indo German Energy Program – Promotion of Solar Water Pumps), who supported the survey that underlies this report as part of their project.
We would also like to thank the governments of Denmark and Sweden for their generous support of this publication. The opinions expressed and the arguments employed in this paper do not necessarily reflect those of the peer reviewers and funders, nor should they be attributed to them.

IISD.org/gsi iv
Targeting Agricultural Electricity Subsidies in Haryana
Executive Summary
Why Explore Agricultural Electricity Subsidy Targeting?In fiscal year 2019, state government transfers to subsidize electricity consumption amounted to INR 110,391 crore (USD 15.6 billion), while cross-subsidies amounted to at least another INR 75,027 crore (USD 10.2 billion) (Aggarwal et al., 2020). These subsidies contribute to the poor financial performance of electricity distribution companies (DISCOMs) that in turn entrenches inefficiencies (Aggarwal et al., 2020). Nationally, agricultural consumers were allocated 75% of direct tariff subsidies, and this price support is vital for low-income farmers, but, at the same time, DISCOMs have been struggling financially. Tariffs are too low to cover costs, and the gap is not fully compensated by state subsidy payments and cross-subsidies. Meeting low-income farmers’ irrigation needs is essential to supporting their livelihoods as well as transitioning to a more sustainable energy mix. This has given rise to discussions about the potential for “subsidy targeting”: focusing subsidy benefits on those most in need.
This report seeks to promote a discussion on targeting electricity subsidies to poor farmers using robust survey data from 1,600 farmers in Haryana on agricultural electricity consumption, irrigation expenditure, and their household assets. We (1) assess the distribution of existing agricultural electricity subsidies and (2) recommend strategies for improving targeting.
Distribution of Existing Agricultural Electricity Subsidies in Haryana
Table ES1. Share (%) of total electricity subsidies received by different wealth quintiles
Note: The distribution of benefits above is illustrated across “quintiles”: equally sized groups made up of exactly 20% of the rural population, ordered by relative wealth levels. Quintile one is made up of the poorest farmers and quintile five of the wealthiest farmers. The data above define “wealth” using a wealth index: a score for farmers based on non-electric assets and socio-economic status.Source: Survey data and authors’ analysis.

IISD.org/gsi v
Targeting Agricultural Electricity Subsidies in Haryana
Haryana currently subsidizes electricity for all agricultural consumers, and this report found that the distribution of existing subsidies is regressive, namely because
• The wealthiest two quintiles of farmers in Haryana received 50% of the subsidies, and the poorest two quintiles received 30% of the subsidies.
RecommendationsImproved subsidy targeting can allow for subsidies to be better clustered on small and marginal farmers and at the same time reduce the fiscal stress on Haryana’s DISCOMs and the state government. But any reform must be undertaken with care to mitigate the impacts of electricity prices on poor farmers. This report makes the following recommendations to improve the targeting of agricultural electricity subsidies:
• This report reviews the Pradhan Mantri Kisan Urja Suraksha evam Utthaan Mahabhiyan scheme and recommends that the scheme be used to support reforms of agricultural electricity subsidy. Targeting small and marginal farmers under the Pradhan Mantri Kisan Urja Suraksha evam Utthaan Mahabhiyan scheme and providing them financial assistance to transition to solar-powered irrigation helps low-income farmers reduce their irrigation costs. It will also reduce the state’s burden of electricity subsidies.
• DISCOMs should consider decreasing the level of subsidy for agricultural consumers who use more power so they are required to pay higher tariffs by moving away from flat-rate tariffs and introducing slab-based tariffs. This will address a part of DISCOMs’ financial issues and be a fairer distribution of subsidy benefits.
• Identify low-income farmers in coordination with state agencies: identifying poor farmers will help target electricity subsidies more effectively. Haryana DISCOMs can closely coordinate with different government agencies that maintain registries on poor households accessing different welfare schemes or land records of farmers to create their own registry of low-income farmers.

IISD.org/gsi vi
Targeting Agricultural Electricity Subsidies in Haryana
Table of Contents
1.0 Introduction .................................................................................................................................................................... 1
2.0 Context: Electricity subsidies in Haryana ....................................................................................................... 2
2.1 Tariff for Agricultural Consumers ................................................................................................................................... 5
2.2 Estimating Agricultural Electricity Consumption in Haryana ................................................................ 5
2.3 Reforms Undertaken for Agricultural Electricity Subsidy .........................................................................6
3.0 Methodology ...................................................................................................................................................................8
3.1 Survey Design .................................................................................................................................................................................8
3.2 Approach for Estimating Electricity Subsidy Benefits .................................................................................9
3.3. Categorizing Farmers Into Groups by Relative Levels of Wealth ........................................................9
3.3.1 Farmers Disaggregated by Landholding Size .......................................................................................10
3.3.2 Wealth Index Approach ..........................................................................................................................................10
3.3.3 Comparing the Approaches ................................................................................................................................12
4.0 Targeting of Agricultural Electricity Subsidies in Haryana .................................................................14
4.1 Subsidy Incidence Through Size of Landholding ............................................................................................ 14
4.2 Subsidy Incidence Through Wealth Index ............................................................................................................. 16
5.0 How Can Agricultural Electricity Subsidies Be Better Targeted? .....................................................18
5.1 Deploying the PM-KUSUM Scheme Can Limit the Consumption of Agricultural Electricity Subsidies ..................................................................................................................................................................... 18
5.2 Metering and Tariff Structure .......................................................................................................................................20
5.3 Accurately Identifying Low-Income Farmers ................................................................................................... 22
6.0 Conclusions and Recommendations ................................................................................................................23
Recommendations ........................................................................................................................................................................... 24

IISD.org/gsi vii
Targeting Agricultural Electricity Subsidies in Haryana
List of Figures
Figure 1. Reduction of AT&C losses from FY 2016 to FY 2021 ................................................................................. 3
Figure 2. Distribution of different land-size owners among wealth quintiles ............................................12
Figure 3. Ration card ownership among wealth quintiles ..........................................................................................13
Figure 4. Electricity subsidies received in INR per month per farmer by landholding size ........................................................................................................................................................................................... 14
Figure 5. Electricity subsidies received in INR per month per electric pump owners by land size .......................................................................................................................................................................................................15
Figure 6. Distribution of agricultural pumps among farmers segregated by land-size holdings ...............................................................................................................................................................................15
Figure 7. Electricity subsidies received in INR per month by different wealth quintiles ................... 16
Figure 8. Share (%) of total electricity subsidies received by different wealth quintiles ............... 16
Figure 9. Electricity subsidies in INR per month for electric pump owners, by wealth quintiles ..................................................................................................................................................................................... 17
Figure 10. Distribution of agricultural pumps among farmers, segregated by wealth indices .........................................................................................................................................................................................19
Figure 11. Extent of electricity metering among farmers surveyed in Haryana .......................................21
List of Tables
Table ES1. Share (%) of total electricity subsidies received by different wealth quintiles.............. iv
Table 1. Revenue sources as a share of total expenses in FY 2016 and FY 2019 for Haryana ....... 2
Table 2. Sales and revenue mix in FY 2019 for states with high agricultural yield in FY 2016–2017 ...........................................................................................................................................................................................4
Table 3. Categorization of farmers by landholding sizes in Haryana .............................................................10
Table 4. Inter-quintile ranges: Monthly expenditure ranges for the wealth index in different quintiles (INR) ................................................................................................................................................................................................11
Table 5. Distribution of the types of agricultural pumps among pump owners in Haryana ....................................................................................................................................................................................................... 18
Table 6. Summary of results .............................................................................................................................................................. 23
Table A1. Number of selected villages in Haryana, by district ..............................................................................30
List of Boxes
Box 1. Main types of subsidies for electricity in India ..................................................................................................... 5

IISD.org/gsi viii
Targeting Agricultural Electricity Subsidies in Haryana
Abbreviations and AcronymsAT&C aggregate technical and commercial
BPL below poverty line
CEA Central Electricity Authority
COVID-19 novel coronavirus disease
DBT Direct Benefit Transfer
DISCOM (electricity) distribution company
FY fiscal year
UDAY Ujwal DISCOM Assurance Yojana
T&D transmission and distribution

IISD.org/gsi 1
Targeting Agricultural Electricity Subsidies in Haryana
1.0 IntroductionIndia has for decades been trying to bring financial viability to its state electricity distribution companies (DISCOMs). Several reform and bailout schemes have been announced in the past, most recently in the 2021 budget, where the Ministry of Finance proposed a revamped reforms-based, result-linked power distribution sector scheme, with an outlay of INR 3,05,984 crore (USD 41.2 billion)1 over 5 years (Press Information Bureau, 2021).
In most states in India, DISCOMs sell subsidized electricity to certain consumers— that is, at a price below the cost of supply. Most often, but not always, this is focused on residential and agricultural consumers. Subsidies come in several forms, such as direct tariff subsidies, cross-subsidies, other indirect subsidies, or grants and bailouts. Subsidized tariffs contribute to the immense financial burden of DISCOMs. Direct tariff subsidies from state governments are highly costly and make up the largest portion of India’s quantified support for energy (Aggarwal et al., 2020), at INR 110,391 crore (USD 15.6 billion) in fiscal year (FY) 2019, with cross-subsidies worth at least another INR 75,027 crore (USD 10.2 billion). They contribute to poor financial performance that in turn entrenches inefficiencies.
This paper focuses on agricultural electricity subsidies. Nationally, agricultural consumers were allocated 75% of direct tariff subsidies, followed by domestic consumers at 20% (Aggarwal et al., 2020). In several Indian states, all agricultural consumers are provided with subsidized or free electricity. Reducing subsidy expenditure is highly challenging: will farmers still be able to afford the energy required for crop irrigation, and if not, how will they be able to maintain their livelihoods? At the same time, maintaining high-cost subsidies undermines the quality of the electricity supply.
There is, however, one option that can both rationalize costs and maintain support for the poor: subsidy “targeting,” where subsidy benefits are clustered on a narrower subset of beneficiaries. This accounts for the fact that farmers are not a homogeneous group—some farmers are relatively better off than others, and may not need as much support, or in some cases may not need any support at all. As described in Sharma et al. (2019), this approach has its costs and benefits, but it is a key policy option at the current time, given the high and increasing cost of consumption subsidies.
This report aims to promote a discussion on the targeting of agricultural electricity subsidies using robust survey data from 1,600 farmers in the state of Haryana collected in March 2021. The report analyzes options for improving targeting and also recommends best practices for DISCOM reporting, as poor reporting practices hamper reform efforts. It is the fourth in a series that examines how electricity subsidies can be better targeted in India, including
• How to Target Electricity and LPG Subsidies in India: Step 1. Identifying policy options
• How to Target Residential Electricity Subsidies in India: Step 2. Evaluating policy options in the State of Jharkhand
• Unpacking India’s Electricity Subsidies: Reporting, transparency, and efficacy
1 Exchange rates in this report for respective financial years are taken from https://data.oecd.org/conversion/exchange-rates.htm

IISD.org/gsi 2
Targeting Agricultural Electricity Subsidies in Haryana
2.0 Context: Electricity subsidies in HaryanaAs in most states in India, the two publicly owned electricity DISCOMs in Haryana, Dakshin Haryana Bijli Vitran Nigam (DHBVN) and Uttar Haryana Bijli Vitran Nigam (UHBVN), sell electricity at a subsidized price to households and agricultural consumers. Its main objective is to make electricity affordable for these consumers. Haryana recorded a total subsidy for electricity at INR 7,698 crore (USD 1 billion) for FY 2020, 89% of which went to the agricultural sector (Aggarwal et al., 2020). Haryana is an agriculture-focused state, producing 6.2% of India’s food grains in FY 2017, and with 61% of rural households in Haryana engaged in agriculture in 2019 (National Statistical Office, 2021).
Since the introduction of the Ujjwal DISCOM Assurance Yojana (UDAY) in 2015,2 Haryana’s DISCOMs have transitioned from losing money in FY 2016 to making profits in FY 2019, when they reached a revenue surplus of 1% (see Table 1). A primary focus of the UDAY scheme was to increase revenue recovery from sales and address inefficiencies in metering, billing, and collection.
Table 1. Revenue sources as a share of total expenses in FY 2016 and FY 2019 for Haryana
FY 2016 FY 2019
Revenue from tariff/sales 73% 76%
Other income/grants 2% 2%
Subsidy received 22% 23%
Gap -3% 0%
Surplus 0% 1%
Source: Aggarwal et al., 2020.
During the same period, Haryana also recorded a reduction in aggregate technical and commercial (AT&C) losses of 11.19% (Aggarwal et al., 2020). Under the UDAY scheme, Haryana DISCOMs were required to reduce AT&C losses to 15% up to FY 2018/19 to use the Government of India grant under the scheme, but only DHBVN could achieve the target in FY 2020, as shown in Figure 1.
2 The UDAY scheme aimed to improve DISCOMs’ operational and financial performance by incentivizing them to undertake specified activities within the timelines prescribed by the scheme. The improvements in operational performance would be measured by indicators on AT&C losses and a reduction in the gap between the average cost of supply and the average revenue realized (Ministry of Power, 2015).

IISD.org/gsi 3
Targeting Agricultural Electricity Subsidies in Haryana
Figure 1. Reduction of AT&C losses from FY 2016 to FY 2021
Source: Haryana Electricity Regulatory Commission, 2020, 2021a.
Box 1. Main types of subsidies for electricity in India
1. Direct tariff subsidies: These are mostly made up of annual payments from state governments to state DISCOMs to help cover the cost of selling electricity at low prices.
2. Cross-subsidies: These are when the DISCOM charges some consumers (often commercial and industrial users) higher prices to help cover subsidized prices for others.
3. Other indirect subsidies: In addition to cross-subsidies, the central and state governments may provide other indirect assistance, such as loans to DISCOMs at below-market rates.
4. Grants and bailouts: Any costs that are not covered by sales or subsidies will accrue over time as losses. Such losses don’t just derive from pricing—they can result from all sorts of DISCOM challenges, such as inefficient power purchase planning and procurement or poor billing and collection. In the short term, they are paid through inadequate investment in infrastructure, which compromises the quality of supply and can further entrench inefficiencies. In the medium term, subsidies in the form of capital grants may be provided to help DISCOMs build infrastructure, while losses are typically addressed by large bailout packages every few years.
Source: Aggarwal et al., 2020.
Despite improving DISCOM financial sustainability, there is definite scope for the improvement of revenue recovery from agriculture. Haryana is an agriculturally dominant Indian state where sales of electricity to the sector are in the range of 22% of total sales.

IISD.org/gsi 4
Targeting Agricultural Electricity Subsidies in Haryana
However, only 1.74% of revenue is generated from this category of consumers. Further, Haryana DISCOMs’ performance improvements have occurred while keeping the value of subsidies nearly constant between FY 2016 (INR 7,044 crore [USD 1.07 billion]) and FY 2019 (INR 7,140 crore [USD 1.06 billion]). Because of unmetered consumption by agricultural consumers and poor reporting practices, this estimated value of subsidies is not even fully certain (Aggarwal et al., 2020; Mallik et al., 2020), particularly when taking into account the many different forms in which electricity subsidies are usually paid for in India (see Box 1). As a result, it is not clear if the subsidy payments from the state government to the DISCOMs are actually in line with the costs of selling below-cost electricity to agriculture.
Table 2. Sales and revenue mix in FY 2019 for states with high agricultural yield in FY 2016–2017
State
Agricultural sales (million
units)
Agricultural sales (% of
state's sales mix)
% of revenue recovered from
agriculture sales % recovery
Maharashtra 33,857 30.34 5.58 18.39
Karnataka 22,611 38.76 0.66 1.70
Rajasthan 21,509 34.3 4.04 11.78
Madhya Pradesh
20,698 41.15 6.11 14.85
Uttar Pradesh 16,104 4.78 3.62 75.73
Andhra Pradesh
15,170 27.8 3.78 13.60
Haryana 9,956 21.67 1.74 8.03
West Bengal 1,514 24.35 3.17 13.02
Bihar 727 3.62 3.06 84.53
Punjab 11,226 23.66 0 0.00
Source: Aggarwal et al., 2020; Directorate of Economics and Statistics, 2018.
Compared to other states in India with a similar or higher agricultural sales mix, Haryana ranks poorly in its relative ability to recover revenues from sales to agricultural consumers. From Table 2, it is clear that Uttar Pradesh, Bihar, Madhya Pradesh, Maharashtra, Rajasthan, Andhra Pradesh, and West Bengal were all better performers in FY 2019.

IISD.org/gsi 5
Targeting Agricultural Electricity Subsidies in Haryana
2.1 Tariff for Agricultural ConsumersWhere agricultural electricity consumption is unmetered (called a flat-rate tariff), prices are mostly set on the basis of the capacity (horsepower) of the irrigation pump used by the consumer, known as the “basic horsepower” or BHP; and where it is metered, it is priced on the basis of per-unit energy consumed (Sharma et al., 2015).
In Haryana in FY 2020, metered agricultural consumers are charged a subsidized tariff rate between INR 8 and INR 10 (USD 0.11–0.14) per kWh, with the exact rate determined by the power of the motor pump used; while unmetered consumers pay a fixed charge of INR 12–INR 15 per BHP per month (USD 0.17–0.21), with the exact rate also determined by the power of the motor pump (Haryana Electricity Regulatory Commission, 2021b). To put these rates in perspective, we may note that the Haryana Electricity Regulatory Commission calculated that the average subsidy for electricity consumed by the agricultural sector in FY 2020 amounted to INR 7.06 (USD 0.09) per kWh (Haryana Electricity Regulatory Commission, 2021a).
Agriculture consumers are not billed as per the 2016 National Tariff Policy, which states that tariffs should remain in the range of +/- 20% of the average cost of supply of power. For FY 2019/20, the average cost of supply to agriculture is INR 7.41 (USD 0.1) per unit, and the subsidy is INR 7.06 (USD 0.1) per unit pump (Haryana Electricity Regulatory Commission, 2021b), implying that the tariff is over 95% of the average cost of supply. Metering is also in a poor state, particularly in rural areas, according to data presented by the UDAY portal, which shows that distribution transformer metering is 7% at the rural level and 66% at the urban level (Aggarwal et al., 2020). The high share of unmetered consumption drives up costs. Groundwater tables in Haryana are stressed: in 2017, 128 blocks were tested, and 78 (61%) of them were over-exploited and 16% were semi-exploited (Central Ground Water Board, 2019). The lack of a relationship between electricity price and consumption incentivizes excessive groundwater extraction and reliance on water-intensive crops, further stressing the groundwater table (Ramaswami, 2019).
States in India are at different stages of tariff structure reforms. Haryana, along with most other states, implements a single-part tariff for agricultural electricity consumers: that is, the tariff contains a single charge and does not differentiate between a fixed and variable charge (Uttar Pradesh Electricity Regulatory Commission, 2016).
2.2 Estimating Agricultural Electricity Consumption in HaryanaIn the face of the largely unmetered consumption of agricultural electricity, Haryana’s DISCOMs have to resort to proxy methods to estimate agricultural consumption. This estimation is crucial, as it forms the basis of the subsidy payment that is transferred to them by the state government.
Before 2011, unmetered consumption was estimated on the basis of the average load factor of the metered consumption. Projections were made on trends in growth in load factor, average connected load in the past, and supply hours to metered and unmetered consumers

IISD.org/gsi 6
Targeting Agricultural Electricity Subsidies in Haryana
(Dharmadhikary et al., 2018). As per this methodology, DISCOMs arrived at estimates for agricultural electricity consumption and transmission and distribution (T&D) losses after aggregating metered sales to all categories of consumers. This system can enable poor governance because it is difficult to determine how much electricity has been consumed and how much has been lost as a result of technical inefficiencies and theft. As noted by Mallik et al. (2020) and Dharmadhikary et al. (2018), some DISCOMs in India have disguised some level of T&D losses and theft as agricultural electricity consumption so they can request larger subsidy payments that shore up their finances.
Haryana DISCOMs stated completion of 100% feeder segregation in 2010, and, since then, the sale for agricultural category consumption has been taken as per the Haryana Electricity Regulatory Commission-approved methodology of consumption, after 16% losses over the data from the agriculture feeders (UHBVN & DHBVN, n.d.). However, there have also been issues recorded with the adoption of the feeder-based method in estimating agricultural consumption (Nehra, 2014). In many states, it resulted in a sudden drop in the levels of agricultural electricity sales, along with a simultaneous increase in AT&C losses—in one of Haryana’s DISCOMs, UHBVN, estimated sales fell by 34% (Dharmadhikary et al., 2018). As a result, the DISCOM took on more financial losses, as most are not compensated for distribution losses beyond a certain threshold.
2.3 Reforms Undertaken for Agricultural Electricity Subsidy Central government measures such as the Deen Dayal Upadhyaya Gram Jyoti Yojana encourage investment in feeder segregation for agricultural electricity consumers. Feeder segregation helps with load management and the management of agricultural electricity consumption (Regy et al., 2021). This measure has been adopted by states, including Haryana, for a large percentage of agricultural electricity consumers.
Another major strategy to help manage electricity subsidies is the solarization of agricultural power, such as through the Pradhan Mantri Kisan Urja Suraksha evam Utthaan Mahabhiyan (PM-KUSUM) scheme, which supports both stand-alone solar pumps and the creation of small power plants at the feeder level in agricultural areas. It is less costly to power irrigation through solar than it is to subsidize conventional grid electricity, so this can reduce DISCOMs’ net power procurement costs. Haryana provides a 75% subsidy for solar water pumps, with the dual objective of sustainable irrigation and climate change mitigation (Gupta, 2021). Haryana is among the leading states to install solar water pumps: the state installed 14,418 pumps against a target of 15,000 pumps in FY 2020/21, and has a target of installing 22,000 in FY 2021/22 (“Haryana Adjudged,” 2021). A quantified impact of these solarization of agriculture schemes in reducing the burden on the grid is yet to be ascertained.
State governments have been experimenting with various schemes to improve the efficiency of agricultural subsidies. In 2018, the state of Punjab implemented the Pani Bachao Paise Kamao (Save Water, Earn Money) scheme where farmers are incentivized to save power and thereby water consumption through the use of monetary incentives (Pradhan Mantri Yojana, 2021). Farmers who voluntarily enrol for this scheme are provided with automated meters to
IISD.org/gsi 7
Targeting Agricultural Electricity Subsidies in Haryana
track consumption. This scheme, developed by the Abdul Latif Jameel Poverty Action Lab and the World Bank, has been recommended for implementation in other states, as well.
Further, the Smart Meter National Programme, which primarily aims at reducing commercial losses for DISCOMs through the replacement of conventional meters with smart meters, was made operational in Haryana in 2010 (Energy Efficiency Services Limited, 2021). Recent data from the Smart Meter National Programme portal shows that close to 0.25 million smart meters have been installed in Haryana to date, against a target of 1 million. This has resulted in an increase in DISCOM revenue by 5.38%. However, research suggests that smart meters are not a prerequisite for the reduction of AT&C losses, citing the examples of Delhi, Mumbai, Ahmedabad, Kolkata, and Gujarat DISCOMs, all of which operate with ordinary electronic meters and have reduced AT&C losses to below 15% (Nirula, 2019).
A major revamp of the electricity sector in India is planned under the Electricity (Amendment) Bill, 2021, which is slated to be introduced in the Parliament in 2022. The proposed amendments would drop the introduction of the Direct Benefit Transfer (DBT) system for electricity subsidies. Under the DBT system, state governments would have paid a fixed amount directly to consumers, who then would have had to pay the full electricity bill amount to DISCOMs. DBT would have both addressed the issue of high subsidy costs due to poor targeting and helped DISCOMs deal with the issue of financial burden due to frequent delays in subsidy payments from the state governments. However, dropping DBT may introduce complications, as many state governments had begun piloting DBT for agricultural consumers, and this change in policy stance leaves them unclear on the future direction of this policy.
IISD.org/gsi 8
Targeting Agricultural Electricity Subsidies in Haryana
3.0 MethodologyIn order to better understand the efficiency of existing agricultural electricity subsidies in Haryana, this study conducted a large-scale survey among farmers so that up-to-date and robust data could compare agricultural electricity subsidies with various farmers’ well-being.
3.1 Survey DesignThe survey was designed to be representative of the state-level rural population. We drew a representative sample of 1,600 farmers from adult landholders in Haryana via stratified random sampling. A self-weighted sample was created by randomly selecting villages from all 22 districts3 of Haryana. In total, 200 villages were selected, and eight farmers were selected from each village, bringing the total sample to 1,600.
The number of villages selected per district is based on the population share of a given district. For instance, a district that has 4% of Haryana’s rural population will have eight villages that are selected (4% of 200 villages = 8). This number of villages per district is listed in Appendix A. Further, within each district, the number of villages randomly selected is based on their population size. For instance, within a district, a village that has 2% of the population of the district has a 2% chance of being selected.
The survey aimed to interview eight farmers per village. We could identify no up-to-date sampling frame of farmers, so respondents were randomly selected from the electoral roll. To account for non-farmers and non-respondents, we randomly selected 20 respondents from the electoral roll of each selected village, which were then randomly ranked. From this list, eight respondents were interviewed if they were identified as farmers by the Gram Panchayat. This listing was done for each village. Contact details of respondents were obtained from the Gram Panchayat. The average length of each interview was 25 minutes.
If a village could not be contacted because the Gram Panchayat could not be reached, we then selected a village from the backup list for a given district. This backup list of villages for each district is generated using the same principles regarding the size of the population in the village, as described above. The questionnaire was piloted three times to check for errors. The final dataset was also reviewed thoroughly for any data inaccuracies.
The survey had built-in screening questions so only farmers were interviewed. Farmer interviewees could either be landowners or farmers who were tenants but in charge of irrigation decisions. The survey was conducted toward the end of the first year of the COVID-19 pandemic, from February to April 2021. To protect the health of enumerators and interviewees, it was conducted by telephone. It was implemented in Hindi by Morsel Research and Development India, a Lucknow-based research company.
3 The district of Charkhi Dadri was created after the 2011 census. We thus had to recode census data to ensure that all 22 districts would be included (and not only 21 districts, as per the census).

IISD.org/gsi 9
Targeting Agricultural Electricity Subsidies in Haryana
3.2 Approach for Estimating Electricity Subsidy BenefitsThe survey asked farmers to share information that is required to estimate agricultural electricity subsidy benefits: landholding size, number of electric pumps owned, horsepower of electric pumps, average number of irrigation days in each cropping cycle (rabi and kharif), average running hours of the electric pump on each irrigation day, and metering and average annual payment for agricultural electricity. Electricity consumption is a particularly important metric and one where there is a significant risk that the farmer may not report data accurately, most likely because of poor recollection. The survey addressed this by verifying the average pumping hours reported in the survey with the minor-irrigation census. We observed that our sample closely matches data from the census. This was the only proxy available in the absence of bills and meters: 45% of farmers reported having meters, out of which 11% were functional.
In the absence of bills and metered consumption, the study used a proxy measure to estimate annual agricultural electricity consumption. The following formula was applied for each cropping cycle:
Wattage of electric pump × number of appliances × average daily hours of use
This data was then summed for the two cropping cycles—kharif and rabi—to arrive at an estimate of the annual electricity consumption. Annual agricultural electricity subsidy per farmer was then estimated by multiplying annual electricity consumption by the per-unit subsidy. In FY 2020, the subsidy per unit was INR 7.06 (USD 0.09) (Haryana Electricity Regulatory Commission, 2021a). This study has focused on per capita subsidy for farmers and results shown in the next chapter show per capita subsidy irrespective of pump ownership. Ninety-two per cent of the 1,600 surveyed farmers were landowners and the remaining, tenant farmers. It was unclear if tenant farmers could make decisions on pump ownership, so this study shows results for only landowners.
3.3. Categorizing Farmers Into Groups by Relative Levels of WealthIn order to examine the distribution of subsidies to poorer and richer farmers, this study categorized them according to their relative levels of wealth. There is no one accepted way to define richer or poorer farmers, as they are also interlinked with household wealth levels, and the definitions that are adopted can have a significant influence on the analysis. For this reason, the study chose to compare relative wealth levels through two different approaches: (1) government’s definition of categorizing farmers through landholding size—large, medium, small, and marginal; and (2) through a “wealth index” approach, where quintiles are established based on a multi-criteria wealth score, including reported farm revenue, number of people employed on the farm, consumption of subsidized food grains, PM-KISAN beneficiary status, and ownership of non-irrigation assets like motorbikes and refrigerators.

IISD.org/gsi 10
Targeting Agricultural Electricity Subsidies in Haryana
3.3.1 Farmers Disaggregated by Landholding Size
This approach divides the sample according to landholding size, as defined in the agricultural census (Press Information Bureau, 2019). Farm incomes are lowest among small and marginal farmers (National Statistical Office, 2021), and these make up the majority of farmers, at 54% of the sample (see Table 3).
Our survey data finds that in Haryana, 92% of farmers own their land, and 8% rent land. Among the farmers that own the land, we identified a lower number of marginal farmers and a higher number of small and semi-medium-sized farmers as compared to the agriculture census, as shown in Table 3, suggesting the sample may not be perfectly representative of the population. This may be because marginal and small farmers find it difficult to segregate owned area from operated area, that is, land owned by these farmers versus where they are hired as wage labourers. Many marginal and small landowners seek employment as wage labourers to supplement their monthly incomes (Rampal, 2021). This can explain why many marginal and small farmers may be reporting higher land sizes, and the subsequent drop in their numbers noted in this survey compared to the agricultural census.
Table 3. Categorization of farmers by landholding sizes in Haryana
Marginal Small Semi-MediumMedium and Large
Size (in hectares) < 1 1 - 2 2 - 4 > 4
Agricultural Census (2015-16)
49% 19% 17% 15%
Survey Data 24% 30% 28% 18%
Source: Authors’ analysis; Agriculture Census Division, 2019.
3.3.2 Wealth Index Approach
The wealth index attempts to take a broader review of what makes farmers worse or better off, accounting for factors such as non-irrigation assets and socio-economic status.
The wealth index was established by drawing on the variables used to identify poverty by India’s national socio-economic caste census (SECC), 2011, supplemented by some additional variables chosen by the authors. The list of variables comprises non-irrigation assets like bikes, cars, and refrigerators, consumption of subsidized grains obtained through ration cards, enrolment in the National Rural Employment Guarantee Scheme, farm revenue, number of rooms in the house, number of people employed on the farm, and whether the farmer is a beneficiary of the PM-KISAN scheme. Only genuinely poor farmers are assumed to access subsidized food grains and draw wages under the National Rural Employment Guarantee Scheme, making these two variables strong identifiers of poverty and hence included in addition to the SECC variables.
We combine these variables using factor analysis. The output of factor analysis is a variable that has a mean of zero and a standard deviation of one. A higher score means that the farmer

IISD.org/gsi 11
Targeting Agricultural Electricity Subsidies in Haryana
is wealthier compared to others in the dataset. Farmers were then divided into five categories based on their wealth index. These quintiles are all of equal size (i.e., they contain the same number of farmers).
Table 4. Inter-quintile ranges: Monthly expenditure ranges for the wealth index in different quintiles (INR)
QuintilesMonthly
expenditure rangeAverage
Expenditure
1 1,200–80,000 13,243
2 500–150,000 12,609
3 1,500–150,000 13,000
4 2,000–100,000 13,805
5 2,500–100,000 17,102
Note: The INR figures in the table depict typical expenditure levels for each wealth quintile. These ranges represent the expenditure level at the 25th and 75th percentile (i.e., the inter-quartile range). Inter-quartile ranges represent the range in which 50% of the respondents are located and therefore remove outliers. These ranges can be overlapping across wealth quintiles.Source: Authors’ analysis.
Table 4 shows the average reported monthly expenditure ranges for households in each wealth quintile. It can be noted that in some instances, the lowest average monthly expenditure is not reported in the lowest quintile, and the higher average is not reported in the highest quintile. This reflects the extent to which the wealth index assigns relative levels of well-being that go beyond simply reported monthly expenditure, which is generally regarded as an indicator that is hard to reliably source through survey questions. Overall, we see a general trend of increasing monthly expenditure among the wealthier quintiles.
As per the 2011 SECC, 40% of Haryana’s rural population is below the poverty line (Rural Development Department, n.d.). Accounting for inflation, the official projected average monthly rural household expenditure in 2020 would have been INR 16,566 (USD 233.7).4 The average reported monthly household expenditure for surveyed households was INR 13,956 (USD 188). The official projected household expenditure is substantially higher than that observed in this survey, suggesting either a bias in the sample toward lower-income households or that respondents under-reported their expenditure. For FY 2012, Haryana’s rural poverty line was marked at a monthly rural household consumption expenditure of INR
4 This is calculated based on the official FY 2012 rural household expenditure, which was INR 10,880 (USD 2,271) (based on an average household size of five [Office of the Registrar General & Census Commissioner, India, 2011] and monthly per capita rural household expenditure of INR 2,176 [USD 45.4] [Ministry of Statistics and Programme Implementation, 2013]), using a rural Consumer Price Index (CPI) of 92.8 for FY 2012 and 141.3 for FY 2019 (Reserve Bank of India, 2019). These values were used in the following formula to arrive at FY 2019 household expenditure = (household expenditure in FY 2012 × CPI in FY 2019) ÷ CPI in FY 2012.

IISD.org/gsi 12
Targeting Agricultural Electricity Subsidies in Haryana
5,075 (USD 105.90),5 with 11% of the population below poverty line (BPL) (Reserve Bank of India, 2018). Based on these poverty estimates and expenditure data, the lowest two quintiles capture the majority of the population that is defined as poor by state definitions.
In 2021, the national government adopted a multidimensional poverty index that scores individuals across different indicators on health, education, and standard of living (NITI Aayog, 2021). This index is based on the government’s 2015–16 survey data and finds that 15% of Haryana’s rural population is poor. The new multidimensional poverty assessment approach does not use household expenditure as a metric and therefore cannot be directly compared to the wealth index used in this report.
3.3.3 Comparing the Approaches
Figure 2 shows the distribution of different land-size owners among the five wealth quintiles identified above. We find that landholding sizes appear to be correlated to wealth, since the number of farmers with marginal and small-sized landholdings decreases in wealthier quintiles. Also, the number of farmers with medium- and large-sized landholdings is highest in the wealthiest quintile.
This study did not consider using ration cards as a means of targeting because households with some kind of poverty ration card still make up the majority of even the wealthiest quintile. Figure 3 shows the distribution of ration cards among wealth quintiles. If ration cards are poorly correlated with poverty and therefore visible in high numbers in wealthier quintiles, this could be a compelling reason to consider alternative approaches to assessing subsidy targeting.
Figure 2. Distribution of different land-size owners among wealth quintiles
Source: Authors’ analysis.
5 Poverty line per capita FY 2012 in Haryana is INR 1015 (USD 21.18) per month in rural areas (Reserve Bank of India, 2018), and average household size is 5.4 (Office of the Registrar General & Census Commissioner, India, 2011). This gives a poverty line for a household at INR 5,075 per month (USD 105.90) for FY 2012.

IISD.org/gsi 13
Targeting Agricultural Electricity Subsidies in Haryana
Figure 3. Ration card ownership among wealth quintiles
Note: Refer to Table 3 for definitions of farmer classification of marginal, small, semi-medium, medium, and large.
Ration card classifications are Above Poverty Line (APL), BPL, Antyodaya Yojana, and Priority Households (PH).6
Source: Authors’ analysis.
6 India’s targeted public distribution system has different types of ration cards—such as BPL, Antyodaya Yojana, and PH—that each entitles beneficiaries to different quantities of subsidized food grains and fuel. In 2019 both BPL and PH were entitled to 3 kg of subsidized rice per month in urban areas and 5 kg of subsidized rice per month in rural areas of Jharkhand (Government of Jharkhand, n.d.-b). This entitlement for AAY ration cards, seen as the poorest of the poor, is 21 kg in urban areas and 35 kg in rural areas of Jharkhand (Government of Jharkhand, n.d.-b). APL ration card holders are not entitled to subsidized food or fuel.

IISD.org/gsi 14
Targeting Agricultural Electricity Subsidies in Haryana
4.0 Targeting of Agricultural Electricity Subsidies in Haryana
4.1 Subsidy Incidence Through Size of LandholdingFifty-four per cent of the sample is made up of small and marginal farmers. As shown in Figure 4, small and marginal farmers receive the lowest subsidy benefits (INR 647 [USD 8.71] and INR 696 [USD 9.37] per month, respectively) when compared to other, larger landowners (INR 950 [USD 12.79] per month for semi-medium and 788 [USD 10.61] per month for large landowners). This suggests that the subsidy distribution is regressive and that there is a correlation between landholding sizes and electricity subsidies. It is striking, however, that semi-medium farmers received the largest share of subsidy, substantially higher than even medium and large farmers. One possible reason for semi-medium farmers receiving the highest subsidy is their participation in groundwater markets, in which they sell water to small and marginal farmers. A survey of farmers in Haryana (Singh et al., 2020) found that 52% of the marginal and small farmers are buying groundwater and that there is a correlation between landholding size and participation in groundwater markets—as landholding size increases, buying behaviour decreases. That study (Singh et al., 2020) also found 38% of large farmers were observed to not participate as sellers because a majority of them did not have access to water after irrigating their own land. This may explain why semi-medium farmers with large tube wells may have excess groundwater to sell to small and marginal farmers. This would increase the semi-medium farmers’ electricity consumption and consequently their electricity subsidy compared to medium and large farmers, who may not have surplus water available to sell.
Figure 4. Electricity subsidies received in INR per month per farmer by landholding size
Source: Authors’ analysis.

IISD.org/gsi 15
Targeting Agricultural Electricity Subsidies in Haryana
Pump size is also an important metric influencing subsidy distribution, and therefore subsidy distribution appears less regressive when it is examined for the subset of electric pump owners only. Figure 5 shows that the mean monthly subsidy per farmer is lowest for marginal farmers and highest for semi-medium farmers. This may be because, as Figure 6 shows, many marginal and small farmers do not own pumps, and removing such farmers from the sample reduces the regressive nature of subsidy distribution.
Figure 5. Electricity subsidies received in INR per month per electric pump owners by land size
Source: Authors’ analysis.
Figure 6. Distribution of agricultural pumps among farmers segregated by land-size holdings
Source: Authors’ analysis.

IISD.org/gsi 16
Targeting Agricultural Electricity Subsidies in Haryana
4.2 Subsidy Incidence Through Wealth IndexAs with the landholding size approach, the wealth index approach also finds electricity subsidies are regressively distributed. Figure 7 shows that subsidies are highest for farmers in the top two wealthiest quintiles and lowest for farmers in the bottom two wealth quintiles. Well-off farmers in quintiles four and five receive an average subsidy of INR 900 per month, while farmers in wealth quintiles one and two receive an average subsidy of INR 625 (USD 8.42) per month. Figure 8 illustrates that the wealthiest two quintiles of farmers in Haryana received 50% of the subsidies, and the poorest two quintiles received 30% of the subsidies.
Figure 7. Electricity subsidies received in INR per month by different wealth quintiles
Source: Authors’ analysis.
Figure 8. Share (%) of total electricity subsidies received by different wealth quintiles
Source: Authors’ analysis.
IISD.org/gsi 17
Targeting Agricultural Electricity Subsidies in Haryana
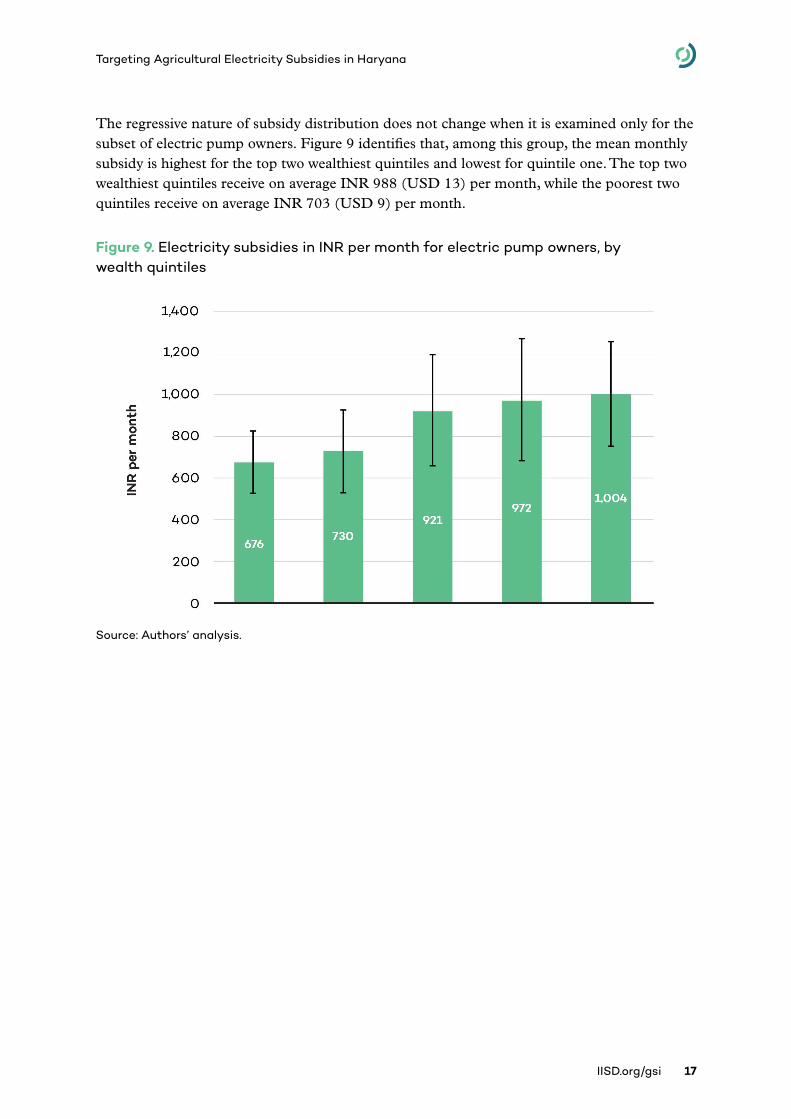
The regressive nature of subsidy distribution does not change when it is examined only for the subset of electric pump owners. Figure 9 identifies that, among this group, the mean monthly subsidy is highest for the top two wealthiest quintiles and lowest for quintile one. The top two wealthiest quintiles receive on average INR 988 (USD 13) per month, while the poorest two quintiles receive on average INR 703 (USD 9) per month.
Figure 9. Electricity subsidies in INR per month for electric pump owners, by wealth quintiles
Source: Authors’ analysis.

IISD.org/gsi 18
Targeting Agricultural Electricity Subsidies in Haryana
5.0 How Can Agricultural Electricity Subsidies Be Better Targeted?This study finds that agricultural electricity subsidy distribution in Haryana is regressive, with a larger share of subsidies benefiting non-poor farmers. Improved subsidy targeting can allow for subsidies to be better clustered on small and marginal farmers as well as reducing the fiscal stress on Haryana’s DISCOMs and the state government. But any reform must be undertaken with care to mitigate the impacts of electricity prices on poor farmers.
This analysis reviews whether the PM-KUSUM scheme can support reforms of agricultural electricity subsidies and help improve the targeting of subsidies to marginal and small farmers.
5.1 Deploying the PM-KUSUM Scheme Can Limit the Consumption of Agricultural Electricity Subsidies The Indian Government has identified solar pumps as an effective tool in enabling the uptake of distributed renewable energy solutions in the agricultural sector, keeping in mind its large power demand. The central government, through the Jawaharlal Nehru National Solar Mission in 2014, set a target for installing a total of 1 million solar pumps by 2022. Thereafter, in 2019, the PM-KUSUM scheme was launched with three key components:
1. Installation of 10,000 MW of solar power capacity on barren land
2. Installation of 2 million stand-alone solar-powered agriculture pumps
3. Deployment of 750,000 solarized grid-connected pumps and 750,000 pumps under feeder solarization.
Table 5. Distribution of the types of agricultural pumps among pump owners in Haryana
Solar Diesel Electric
% of farmers 4% 34% 62%
# of farmers 37 352 642
Note: Pump ownership is only shown for 1,473 farmers who are landowners and not tenants; 439 landowners did not have pumps and may have been benefiting from surface water irrigation schemes, like canal water.Source: Authors’ analysis.
The number of farmers in Haryana who applied for the scheme remains low (Gupta, 2021). Our survey on the distribution of various types of agricultural pumps among pump owners, such as electric, diesel, and solar, revealed that only 4% of farmers had adopted solar, while a majority of the pump owners in the sample used electric pumps (62%), followed by diesel pumps (34%) (see Table 5). There is no recent government data to compare these findings, but government data from 2013–14 reveal similar trends, where the largest pump users

IISD.org/gsi 19
Targeting Agricultural Electricity Subsidies in Haryana
were using electric pumps (87%), followed by diesel (Department of Water Resources, River Development and Ganga Rejuvenation, 2017). Hence, it is important to study the challenges experienced by state governments in implementing PM-KUSUM and also to examine farmers’ views on the technology.
Figure 10. Distribution of agricultural pumps among farmers, segregated by wealth indices
Source: Authors’ analysis.
Results show that the uptake of solar pumps does not appear correlated with wealth or landholding since a few farmers in all wealth quintiles and among all landholding sizes use solar pumps (see Figure 10). The results show that the current distribution of electricity subsidies is not well-targeted to poor farmers, suggesting a significant opportunity to target solar pumps among poor farmers under component B of the PM-KUSUM scheme. This is because a large proportion of farmers in the lowest quintile (50%) do not own any kind of pumps, indicating that there is scope to expand the implementation of component B of the PM-KUSUM scheme to cover these farmers. Targeting less-well-off farmers who currently use electric pumps with financial support to adopt solar, perhaps under component C after studying water extraction trends, and asking them to replace their agriculture grid consumption with solar pumps, or through feeder-level solarization, may likely reduce the state’s recurring electricity subsidies burden. Targeting less-well-off farmers who use diesel pumps will not result in electricity subsidy savings, but it will help make irrigation more affordable for those farmers, as diesel pumps involve high fuel costs, and the assistance will have the greatest improvement in well-being for farmers at the lower end of the wealth spectrum. The farmers that own diesel pumps in lower wealth quintiles can therefore be targeted under component B of the PM-KUSUM scheme, as well. However, adequate consideration must be given to groundwater levels when targeting farmers for installation of stand-alone and off-grid solar pumps. If groundwater levels fall significantly, a solar pump’s water output can decline substantially, resulting in a stranded asset. This can be addressed by implementing the scheme in a sustainable way, including coordination between water–

IISD.org/gsi 20
Targeting Agricultural Electricity Subsidies in Haryana
energy–food policies, linking solar pump and water efficiency infrastructure and conducting appropriate monitoring and evaluation (Goel et al., 2021).
There is a need to spread awareness about the scheme and its benefits among farmers. Among landowners, only around 17% of surveyed farmers had heard of the PM-KUSUM scheme, and this share remained unchanged even among the sub-sample of 63% of farmers that had already heard of solar pumps. We also confirmed strong interest in the scheme. After providing explanations regarding the details of the PM-KUSUM scheme, around 73% of farmers said they would be likely to participate in it. Among the farmers in Haryana that are keen on buying a solar pump, most of the interested farmers lie in the marginal-sized landholding category.
Communicating the benefits of the PM-KUSUM scheme to farmers can also help speed adoption. Eighty-three per cent of farmers surveyed in Haryana found increased reliability and guaranteed pumping during daylight hours as the most appealing element of the PM-KUSUM scheme. Sixty-one per cent found a solar pump appealing because it would be cheaper than their existing pump costs, and 27% liked the idea of selling electricity back to the grid. On the other hand, the least appealing element of PM-KUSUM was strongly centred around farmers not knowing the scheme well enough, and 12% thought that it would be too costly.
Overall, if the deployment of the PM-KUSUM scheme is accelerated, targeting should also be employed to ensure that it focuses benefits on small and marginal farmers. This can be achieved through eligibility criteria, such as reserving a share of a pump for low-income farmers, relaxing land ownership rules to encourage tenant and women farmers to participate, and prioritizing the scheme’s access in areas that lack access to irrigation (Goel et al., 2021). This can help save low-income farmers irrigation costs and reduce the consumption of highly subsidized agricultural electricity.
5.2 Metering and Tariff Structure Metering to monitor the electricity consumption of consumers is typically a prerequisite for initiating subsidy reform, as an accurate assessment of subsidy consumption feeds into any subsidy reform strategy. It is also a prerequisite for installing grid-connected solar pumps that allow farmers to sell excess electricity back to the grid. However, given the politically sensitive nature of electricity subsidies, particularly agricultural electricity, metering can be challenging to execute for state governments and DISCOMs. Furthermore, under the revamped distribution sector scheme announced in the 2021 budget the installation of prepaid smart meters is being targeted to help reduce distribution losses. However, the agricultural sector is not being considered for metering under this scheme owing to “the scattered nature of agriculture connections and their remoteness from habitation as well as their proposed solarization under the PM-KUSUM scheme” (Ministry of Power, 2021c). The scheme instead targets feeder segregation and solarization.
Further, in comparison to other states in India, Haryana has been slow in setting up rural metering in particular, with only 7% of the rural consumers having metered connections (Ministry of Power 2021a) compared to the national rural metering use, which stands at 66%

IISD.org/gsi 21
Targeting Agricultural Electricity Subsidies in Haryana
(Ministry of Power 2021b). Yet, we observe that metering differs among farmer sub-groups, and this may present an opportunity for DISCOMs to push for metering among progressive farmer sub-groups and also complete feeder metering to better account for agricultural electricity consumption. The metering of feeders also helps increase accountability for T&D losses and their reduction. The Haryana Electricity Regulatory Commission can take the lead in setting phased metering targets for DISCOMs.
Through our survey, we have identified the extent of metering among various groups of farmers, categorized by landholding sizes. As seen in Figure 11, the metering of electricity consumption is relatively more prevalent among farmers with medium and large landholding sizes as compared to the other categories.
Monitoring consumption followed by a tariff revision can yield savings to DISCOMs and state governments. Tariff revisions can decrease the level of subsidy for agricultural consumers who use more power so they are required to pay higher tariffs. This will address some of the DISCOMs’ financial issues that arise due to the existing capless provision of subsidized electricity for agricultural consumers. It will also help curb the issue of the indiscriminate usage of groundwater for agriculture.
Figure 11. Extent of electricity metering among farmers surveyed in Haryana
Source: Authors’ analysis.
Yet, metering alone will not reform agricultural electricity subsidies, and in the face of low metering levels, other parameters, such as feeder segregation, become important to separate agricultural electricity supply from other consumers, with an aim to monitor agricultural electricity consumption. Haryana has done well in feeder segregation, completing 100% segregation, while nationally, feeder segregation has reached only 86% (Ministry of Power, 2016).

IISD.org/gsi 22
Targeting Agricultural Electricity Subsidies in Haryana
5.3 Accurately Identifying Low-Income Farmers Identifying low-income farmers is complex and dynamic, and it requires up-to-date databases with different variables on assets and socio-economic status. This report created a wealth index to better analyze subsidy targeting. Rather than wasting resources on collecting this information for creating a wealth index, DISCOMs can closely coordinate with different government agencies that maintain digital registries on poor households accessing different welfare schemes—like landholding size, the purchase of subsidized grains available with the civil supplies department, or access to jobs via NREGA, available with the department for rural development. This will help DISCOMs understand linkages between energy and poverty and finally be able to create their own registry of poor farmers or use a government agency’s registry that closely matches its criteria of identification.
The government can also integrate planning and targeting by merging databases of several existing agricultural schemes where subsidized inputs (such as fertilizer, farming and irrigation equipment, and others) are provided to low-income farmers. Understanding the efficiency of these datasets in targeting low-income farmers and then making them available to DISCOMS can also accurately identify low-income farmers. DISCOMs can test the interventions recommended here to understand what works best in accurately identifying low-income farmers without compromising energy access and affordability.

IISD.org/gsi 23
Targeting Agricultural Electricity Subsidies in Haryana
6.0 Conclusions and RecommendationsAs in most states in India, electricity for agriculture is heavily subsidized in Haryana, resulting in a heavy subsidy burden on state governments and negative impacts on DISCOMs’ financial sustainability. We explored “subsidy targeting” by analyzing the distribution of existing agricultural electricity subsidies across poorer and richer farmers, to examine whether there is a good basis of evidence for better targeting. As there is no one accepted way to define richer or poorer farmers, the study compares relative wealth levels through two different approaches: (1) landholding size, and (2) a wealth index—a multi-criteria score based on ownership of non-irrigation assets and socio-economic status. The study finds that a larger share of subsidy benefits is going to better-off farmers.
Main findings:
1. Subsidy distribution is regressive, with wealthier farmers receiving more subsidy than poor farmers.
Table 6. Summary of results
Landholding size approach A marginal farmer received an INR 647 (USD 8.7) subsidy per month compared to a medium and large farmer, who received INR 788 (USD 10.60) per month.
Wealth index approach The wealthiest farmers received INR 968 (USD 13) per month compared to the poorest farmers, who received an INR 598 (USD 8) subsidy per month.
The wealthiest two quintiles of farmers in Haryana received 50% of the subsidies, and the poorest two quintiles received 30% of the subsidies.
Source: Authors’ analysis.
2. Poor DISCOM reporting practices on subsidies make any reform in this area difficult.
Haryana fares well in terms of reporting, as per our previous study (Aggarwal et al., 2020). Haryana does consumer category-specific reporting in the tariff order, as recommended by the National Tariff Policy, (Government of India, 2016). In terms of the method followed for agricultural consumption, we found that the DISCOMs in Haryana follow the regulatory norms on estimations and calculations. However, in the absence of feeder metering, there are criticisms of the feeder-based method used in estimating agricultural electricity regarding accurate subsidy assessments.
3. Electric pumps are more popular among well-off farmers in Haryana.
Our survey finds that 53% of the farmers in the highest wealth quintile use electric pumps, while both electric and diesel pumps are popular among farmers in the lower wealth quintiles. Poor farmers, who mostly use diesel pump sets, can benefit from adopting solar pumps, as it will bring down their irrigation costs, but this will not create electricity subsidy savings.

IISD.org/gsi 24
Targeting Agricultural Electricity Subsidies in Haryana
RecommendationsReforming agricultural electricity subsidies for any state in India is extremely challenging both politically and technically. This suggests any initiatives to reform agricultural electricity subsidy must be undertaken with care to mitigate impacts on farmers, particularly small and marginal farmers.
Based on the findings from electricity subsidy distribution described above, this report highlights focus areas where improvements by DISCOMS can set the stage for initiating reforms for agricultural electricity subsidies.
1. Target poor farmers under the PM-KUSUM scheme to transition to solar pumps. Targeting small and marginal farmers to transition to solar helps save them irrigation costs. Further, the number of small and marginal farmers without pumps is highest in the lower wealth quintiles. These farmers could be targeted for installation of stand-alone solar pumps under component B of the PM-KUSUM scheme. There are several impediments preventing farmers in Haryana from making the switch to solar pumps on their own, such as lack of awareness and farmers’ preference for using pumps of larger capacity than those being promoted under the PM-KUSUM scheme.
2. For large agricultural landowners, increase the level of metering to better track electricity consumption. While executing metering is politically challenging, the lack of meters to ascertain the actual level of electricity consumption inevitably affects DISCOMs’ financial performance. Metering would also play a major role in ensuring better targeting of consumers and is a requirement for prosumers that want to use a solar pump and sell excess electricity back to the grid. There is an opportunity to meter larger landowners and track their higher consumption. There are some interventions that can be tested to initiate metering, such as communication strategies designed to address the apprehensions of farmers with respect to metering or using the DBT to compensate farmers directly with agricultural electricity.
3. Introduce slab-based rates for agricultural electricity consumers and decrease the level of subsidy for agricultural consumers who use more power so they are required to pay higher tariffs. This will address an aspect of DISCOMs’ financial issues that arise due to the existing capless provision of subsidized electricity for agricultural consumers. It will also help curb the issue of indiscriminate usage of groundwater for agriculture.
4. Identify poor farmers through coordination with other state agencies. Identifying poor farmers will also help in targeting electricity subsidies more effectively. However, such identification is a complex and dynamic process, and it requires up-to-date databases with different variables on assets and socio-economic status. This report created a wealth index to better analyze subsidy targeting. Rather than wasting resources on collecting this information for creating a wealth index, Haryana DISCOMs can closely coordinate with different government agencies that maintain registries on poor households accessing different welfare schemes—like the purchase of subsidized grains available with the civil supplies department, landholding size available with the revenue department. This will help the DISCOMs understand

IISD.org/gsi 25
Targeting Agricultural Electricity Subsidies in Haryana
linkages between energy and poverty and finally create their own registry of poor farmers or use a government agency’s registry that closely matches its criteria of identification.
Recommendations for other states and the central government to better target agricultural electricity subsidies:
• Map the knowledge gap: The approach that has been followed in this study could easily be adapted to other state contexts in order to identify appropriate state-specific solutions. State governments require a dedicated research effort to understand how effectively electricity subsidies are targeted at the poor. Further, governments should routinely repeat this exercise to reduce the time gap between the availability of data and subsidy policy design. Part of the problem is the lack of recent high-quality data on agricultural electricity consumption and welfare. For DISCOMs, a cost-effective method could be to conduct telephone surveys several times per year using a simplified version of the questionnaire employed by this study. This can also be solved if the Ministry of Statistics and Programme Implementation includes a detailed energy consumption survey through both the census and the National Sample Survey Office and routinely makes this data available. Lastly, collecting data to analyze targeting could be made a criterion for scoring DISCOM performance by the Ministry of Power and state-level regulators.
• Test targeting interventions: State governments and DISCOMs should invest in testing the different interventions analyzed in this study to understand which can best target subsidies without compromising energy access and affordability.
• Future research: This research focused on subsidy incidence, and the chosen sample size carefully matched this basic question. However, the research did not model changes in the agricultural electricity tariff and their impacts on farmers and DISCOMs. It also did not explore the attitudes of farmers to changing policies and the political strategies for introducing electricity reforms in the agriculture sector. Future research focusing on questions on electricity consumption and affordability and bringing in farmers’ perspectives could help identify specific strategies for framing interventions. The questionnaire and dataset from this report will be published in the future so researchers can benefit from this knowledge and adapt it further.

IISD.org/gsi 26
Targeting Agricultural Electricity Subsidies in Haryana
ReferencesAggarwal, P., Viswamohanan, A., Narayanaswamy, D., & Sharma, S. (2020). Unpacking
India’s electricity subsidies: Reporting, transparency, and efficacy. International Institute for Sustainable Development–Council on Energy, Environment and Water. https://www.iisd.org/publications/india-electricity-subsidies
Agriculture Census Division. (2019). Agriculture census 2015–16. Government of India, Ministry of Agriculture and Farmers Welfare, Department of Agriculture, Co-operation and Farmers Welfare. https://agcensus.nic.in/document/agcen1516/T1_ac_2015_16.pdf
Central Ground Water Board. (2019). National compilation on dynamic ground water resources of India, 2017. Government of India, Ministry of Jal Shakti, Department of Water Resources, RD & GR. http://cgwb.gov.in/GW-Assessment/GWRA-2017-National-Compilation.pdf
Department of Water Resources, River Development and Ganga Rejuvenation. (2017). 5th census of minor irrigation schemes (Report). Government of India, Ministry of Jal Shakti. http://jalshakti-dowr.gov.in/sites/default/files/5th-MICensusReport_0.pdf
Dharmadhikary, S., Bhalerao, R., Dabadge, A., & Nhalur, S. (2018). Understanding the electricity, water and agriculture linkages: Vol 1. Annexure. Prayas (Energy Group). https://www.prayaspune.org/peg/publications/item/395-understanding-the-electricity-water-and-agriculture-linkages.html
Directorate of Economics and Statistics. (2018). Pocket book of agricultural statistics 2017. Government of India, Ministry of Agriculture and Farmers Welfare, Department of Agriculture, Cooperation and Farmers Welfare. https://agricoop.nic.in/sites/default/files/pocketbook_0.pdf
Energy Efficiency Services Limited. (2021). Smart Meter National Programme. Ministry of Power, Government of India. https://eeslindia.org/en/smart-meters/
Goel, S., Murali, R., Rahman, A., Swain, P., Viswanathan, B., Agrawal, S., Beaton, C., Govindan, M., Jain, A., & Palit, D. (2021). Implementing solar irrigation sustainably: A guidebook for state policy-makers on maximizing the social and environmental benefits from solar pump schemes. International Institute for Sustainable Development. https://www.iisd.org/system/files/2021-12/implementing-solar-irrigation-sustainably.pdf
Government of India. (2016). National tariff policy. Government of India. https://cercind.gov.in/2018/whatsnew/Tariff_Policy-Resolution_Dated_28012016.pdf
Government of Jharkhand. (n.d.-a). Eliminating poverty creating jobs and strengthening social programs. https://niti.gov.in/writereaddata/files/Jharkhand%20presentation.pdf
Government of Jharkhand. (n.d.-b). Jharkhand Government PDS system policy temps. Jharkhand Civil Supplies Department. https://aahar.jharkhand.gov.in/policy_temps/searchPolicyFilter
Gupta, S. (2021). Sustainable deployment of solar water pumps: A case study of Rewari, Haryana. ISPP Policy Review. https://policyreview.in/sustainable-deployment-of-solar-water-pumps-a-case-study-of-rewari-haryana/

IISD.org/gsi 27
Targeting Agricultural Electricity Subsidies in Haryana
Haryana adjudged first in country in installation of solar pumps. (2021, September 12). The Pioneer. https://www.dailypioneer.com/2021/state-editions/haryana-adjudged-first-in-country-in-installation-of-solar-pumps.html
Haryana Electricity Regulatory Commission. (2020). Commission’s Order in Case No. HERC/PRO – 59 of 2019 & HERC/PRO – 60 of 2019. https://herc.gov.in/WriteReadData/Orders/O20200601.pdf
Haryana Electricity Regulatory Commission. (2021a). Commission’s Order on HERC/PRO – 77 of 2020 and HERC/PRO – 78 of 2020. https://herc.gov.in/WriteReadData/Orders/O20210330a.pdf
Haryana Electricity Regulatory Commission. (2021b). Distribution & retail supply tariff approved by the Commission for the FY 2021–22. https://herc.gov.in/WriteReadData/Pdf/DR20210401.pdf
Mallik, E. V., Hanumanth Raju, G. V., & Garg, R. (2020). Assessment of IP set consumption in agricultural feeders. International Journal of Advanced Research in Electrical, Electronics and Instrumentation Engineering, 9(5), 955–960. https://cstep.in/drupal/sites/default/files/2021-02/Article.PDF
Ministry of Power. (2015, November 20). UDAY (Ujwal DISCOM Assurance Yojana) scheme for operational and financial turnaround of power distribution companies (DISCOMs) [Memorandum]. Government of India. https://powermin.gov.in/pdf/Uday_Ujjawal_Scheme_for_Operational_and_financial_Turnaround_of_power_distribution_companies.pdf
Ministry of Power. (2016). Feeder segregation. UDAY portal. Government of India. https://www.uday.gov.in/national_parameter_dashboard.php?id=8
Ministry of Power. (2021a). Haryana dashboard. UDAY portal. Government of India. https://uday.gov.in/state.php?id=6
Ministry of Power. (2021b). National dashboard. UDAY portal. Government of India. https://uday.gov.in/home.php#0
Ministry of Power. (2021c, July 20). Revamped distribution sector scheme: A reforms-based and results-linked scheme [Memorandum]. Government of India. https://powermin.gov.in/sites/default/files/uploads/OM_Revamped_Distribution_Sector_Scheme.pdf
Ministry of Statistics and Programme Implementation. (2013). Key indicators of household consumer expenditure in India. Tables and reports. National Sample Survey Office. http://microdata.gov.in/nada43/index.php/catalog/126
National Statistical Office. (2021). Situation assessment of agricultural households and land and livestock holdings of households in rural India: NSS 77th Round (January–December 2019). Government of India, Ministry of Statistics and Programme Implementation. https://ruralindiaonline.org/bn/library/resource/situation-assessment-of-agricultural-households-and-land-and-livestock-holdings-of-households-in-rural-india/

IISD.org/gsi 28
Targeting Agricultural Electricity Subsidies in Haryana
Nehra, K. (2014). Evaluation study on “To review the unreasonable increasing trend of power subsidies being provided to agriculture sector.” Government of Haryana, Department of Economic and Statistical Analysis, Centre for Research in Rural and Industrial Development. https://esaharyana.gov.in/document/evaluation-study-on-to-review-the-unreasonable-increasing-trend-of-power-subsidies-being-provided-to-agriculture-sector/
Nirula, A. (2019). India’s power distribution sector: An assessment of financial and operational sustainability [Discussion note]. Brookings India. https://think-asia.org/handle/11540/11277
NITI Aayog. (2021). National multidimensional poverty index: Baseline report. NITI Aayog, Oxford Poverty and Human Development Initiative, & United Nations Development Programme. https://www.niti.gov.in/sites/default/files/2021-11/National_MPI_India-11242021.pdf
Office of the Registrar General & Census Commissioner, India. (2011). HH–01: Normal households by household size. Government of India, Ministry of Home Affairs. https://censusindia.gov.in/2011census/hh-series/hh01.html
Pradhan Mantri Yojana (Ed.). (2021). Pani Bachao Paise Kamao Scheme in Punjab. https://www.pradhanmantriyojana.co.in/pani-bachao-paise-kamao-scheme-punjab-earn-money-save-water/
Press Information Bureau. (2019). Categorisation of farmers. Government of India, Ministry of Agriculture and Farmers Welfare. https://pib.gov.in/Pressreleaseshare.aspx?PRID=1562687
Press Information Bureau. (2021). Rs 3,05,984 crore scheme to be launched for a revamped reforms-based result-linked power distribution sector. Government of India, Ministry of Finance. https://pib.gov.in/Pressreleaseshare.aspx?PRID=1693898
Ramaswami, B. (2019). Agricultural subsidies – Study prepared for XV Finance Commission: Final report. Indian Statistical Institute. http://fincomindia.nic.in/writereaddata/html_en_files/fincom15/StudyReports/Agricultural%20subsidies.pdf
Rampal, N. (2021, October 6). India’s small & marginal farmers have essentially become wage labourers, data shows. The Print. https://theprint.in/economy/indias-small-marginal-farmers-have-essentially-become-wage-labourers-data-shows/745390/
Regy, P., Sarwal, R., Stranger, C., Fitzgerald, G., Ningthoujam, J., Gupta, A., & Singh, N. (2021). Turning around the power distribution sector: Learnings and best practices from reforms. NITI Aayog, RMI, and RMI India. https://www.niti.gov.in/sites/default/files/2021-08/Electricity-Distribution-Report_030821.pdf
Reserve Bank of India. (2018). Table 156: Number and percentage of population below poverty line. https://www.rbi.org.in/scripts/PublicationsView.aspx?id=18621
Reserve Bank of India. (2021). Table 38: Consumer price index – Annual average. https://www.rbi.org.in/Scripts/PublicationsView.aspx?id=20443
http://fincomindia.nic.in/writereaddata/html_en_files/fincom15/StudyReports/Agricultural%20subsidies

IISD.org/gsi 29
Targeting Agricultural Electricity Subsidies in Haryana
Rural Development Department. (n.d.). Number of rural BPL households in Haryana. Government of Haryana. http://haryanarural.gov.in/sites/default/files/documents/BPLnote.pdf
Sharma, S., Moerenhout, T., Beaton, C., & Jain, P. (2019). How to target electricity and LPG subsidies in India: Step 1. Identifying policy options. International Institute for Sustainable Development. https://www.iisd.org/publications/how-target-electricity-and-lpg-subsidies-india-step-1
Sharma, S., Moerenhout, T., & Tripathi, S. (2015). Rationalizing energy subsidies in agriculture: A scoping study of agricultural subsidies in Haryana, India. International Institute for Sustainable Development. https://www.iisd.org/publications/rationalizing-energy-subsidies-agriculture-scoping-study-agricultural-subsidies
Singh, O., Kasana, A., & Sharma, T. (2020). Groundwater irrigation market patterns and practices over an agriculturally developed province of north-west India. GeoJournal, 85(3), 703–29. https://link.springer.com/article/10.1007/s10708-019-09992-2
Uttar Haryana Bijli Vitran Nigam & Dakshin Haryana Bijli Vitran Nigam. (n.d.). Fuel surcharge adjustment. https://uhbvn.org.in/staticContent/documents/FSA_2nd_Quarter.pdf
Uttar Pradesh Electricity Regulatory Commission. (2016). Paper on the implementation of single part tariff. https://www.uperc.org/App_File/In-HousePaperontheimplementationofSinglePartTariff-WEB-pdf122017111818AM.pdf

IISD.org/gsi 30
Targeting Agricultural Electricity Subsidies in Haryana
Appendix A
Table A1. Number of selected villages in Haryana, by district
District Rural population Share of rural popNumber of villages
Ambala 629,886 0.04 8
Bhiwani 867,184 0.05 11
Charkhi Dadri 445,939 0.03 5
Faridabad 370,878 0.02 4
Fatehabad 762,423 0.05 9
Gurgaon 471,646 0.03 6
Hisar 1,185,469 0.07 14
Jhajjar 717,935 0.04 9
Jind 1,028,569 0.06 12
Kaithal 838,293 0.05 10
Karnal 1,047,494 0.06 13
Kurukshetra 685,430 0.04 8
Mahendragarh 789,233 0.05 10
Mewat 965,690 0.06 12
Palwal 806,164 0.05 10
Panchkula 245,753 0.01 3
Panipat 646,504 0.04 8
Rewari 666,902 0.04 8
Rohtak 616,615 0.04 7
Sirsa 973,134 0.06 12
Sonipat 997,167 0.06 12
Yamunanagar 738,628 0.04 9
Sum 16,496,936 1.00 200
Source: Office of the Registrar General & Census Commissioner, India, 2011.

©2022 The International Institute for Sustainable Development Published by the International Institute for Sustainable Development
Head Office
111 Lombard Avenue, Suite 325 Winnipeg, Manitoba Canada R3B 0T4
Tel: +1 (204) 958-7700 Website: www.iisd.org Twitter: @IISD_news
Global Subsidies Initiative
International Environment House 2 9 chemin de Balexert, 1219 Châtelaine Geneva, Switzerland
Tel: +41 22 917-8683 Website: www.iisd.org/gsi Twitter: @globalsubsidies