Performance Plan Norway - Luftfartstilsynet
66
Performance Plan Norway Third Reference Period (2020-2024) Status: Date of issue: Draft performance plan (Article 12) 15.11.2019
-
Upload
khangminh22 -
Category
Documents
-
view
3 -
download
0
Transcript of Performance Plan Norway - Luftfartstilsynet

Performance Plan
Norway
Third Reference Period (2020-2024)
Status:
Date of issue:
Draft performance plan (Article 12)
15.11.2019

2

Table of Content
1 INTRODUCTION
1.1 THE SITUATION
1.2 TRAFFIC FORECASTS
1.3 STAKEHOLDER CONSULTATION
1.4 LIST OF AIRPORTS SUBJECT TO THE PERFORMANCE AND CHARGING REGULATION
1.5 SERVICES UNDER MARKET CONDITIONS
1.6 FAB PROCESS
1.7 SIMPLIFIED CHARGING SCHEME
2 INVESTMENTS
3 PERFORMANCE TARGETS AT LOCAL LEVEL
3.1 SAFETY TARGETS
3.1.1 Safety KPI #1: Level of Effectiveness of Safety Management achieved by ANSPs
3.2 ENVIRONMENT TARGETS
3.2.1 Environment KPI #1: Horizontal en route flight efficiency (KEA)
3.3 CAPACITY TARGETS
3.3.1 Capacity KPI #1: En route ATFM delay per flight
3.3.2 Capacity KPI #2: Terminal and airport ANS ATFM arrival delay per flight
3.4 COST-EFFICIENCY TARGETS
3.4.1 Cost efficiency KPI #1: Determined unit cost (DUC) for en route ANS
3.4.2 Cost efficiency KPI #2: Determined unit cost (DUC) for terminal ANS
3.4.3 Pension assumptions
3.4.4 Interest rate assumptions for loans financing the provision of air navigation services
3.4.5 Restructuring costs
3.5 ADDITIONAL KPIS / TARGETS
3.6 INTERDEPENDENCIES AND TRADE-OFFS
4 CROSS-BORDER INITIATIVES AND SESAR IMPLEMENTATION
4.1 CROSS-BORDER INITIATIVES AND SYNERGIES
4.1.1 Planned or implemented cross-border initiatives at the level of ANSPs
4.1.2 Investment synergies achieved at FAB level or through other cross-border initiatives
4.2 DEPLOYMENT OF SESAR COMMON PROJECT
4.3 CHANGE MANAGEMENT
5 TRAFFIC RISK SHARING ARRANGEMENTS AND INCENTIVE SCHEMES
5.1 TRAFFIC RISK SHARING PARAMETERS
5.2 CAPACITY INCENTIVE SCHEMES
5.2.1 Capacity incentive scheme - Enroute
5.2.2 Capacity incentive scheme - Terminal
5.3 OPTIONAL INCENTIVES
6 IMPLEMENTATION OF THE PERFORMANCE PLAN
6.1 MONITORING OF THE IMPLEMENTATION PLAN
6.2 NON-COMPLIANCE WITH TARGETS DURING THE REFERENCE PERIOD
7 ANNEXES
ANNEX A. REPORTING TABLES & ADDITIONAL INFORMATION (EN-ROUTE)
ANNEX B. REPORTING TABLES & ADDITIONAL INFORMATION (TERMINAL)
ANNEX C. CONSULTATION
ANNEX D. LOCAL TRAFFIC FORECASTS
ANNEX E. INVESTMENTS
ANNEX F. BASELINE VALUES (COST-EFFICIENCY)
ANNEX G. PARAMETERS FOR THE TRAFFIC RISK SHARING
ANNEX H. RESTRUCTURING MEASURES AND COSTS
3

ANNEX I. PARAMETERS FOR THE MANDATORY CAPACITY INCENTIVES
ANNEX J. OPTIONAL KPIs AND TARGETS
ANNEX K. OPTIONAL INCENTIVE SCHEMES
ANNEX L. JUSTIFICATION FOR SIMPLIFIED CHARGING SCHEME
ANNEX M. COST ALLOCATION
ANNEX N. CROSS-BORDER INITIATIVES
ANNEX O. JUSTIFICATIONS FOR THE LOCAL SAFETY TARGETS
ANNEX P. JUSTIFICATIONS FOR THE LOCAL ENVIRONMENT TARGETS
ANNEX Q. JUSTIFICATIONS FOR THE LOCAL CAPACITY TARGETS
ANNEX R. JUSTIFICATIONS FOR THE LOCAL COST-EFFICIENCY TARGETS
ANNEX S. INTERDEPENDENCIES
ANNEX T. OTHER MATERIAL
ANNEX Z. CORRECTIVE MEASURES*
* Only as per Article 15(6) of the Regulation
4

1.1 The situation
1.1.1 - List of ANSPs and geographical coverage of services
1.1.2 - Other entities in the scope of the Performance and Charging Regulation as per Article 1(2) last para.
1.1.3 - Charging zones (see also 1.4-List of Airports)
1.1.4 - Other general information relevant to the plan
1.2 - Traffic Forecasts
1.2.1 - En route
1.2.2 - Terminal
1.3 - Stakeholder consultation
1.3.1 - Overall outcome of the consultation of stakeholders on the performance plan
1.3.2 - Specific consultation requirements of ANSPs and airspace users on the performance plan
1.3.3 - Consultation of stakeholder groups on the performance plan
1.4 - List of airports subject to the performance and charging Regulation
1.4.1 - Airports as per Article 1(3) (IFR movements ≥ 80 000)
1.4.2 Other airports added on a voluntary basis as per Article 1(4)
1.5 - Services under market conditions
1.6 - Process followed to develop and adopt a FAB Performance Plan
1.7 - Establishment and application of a simplified charging scheme
1.7.1 - Scope of the simplified charging scheme
1.7.2 - Conditions for the application of the simplified charging scheme
Annexes of relevance to this section
ANNEX C. CONSULTATION
ANNEX D. LOCAL TRAFFIC FORECASTS
ANNEX L. JUSTIFICATION FOR SIMPLIFIED CHARGING SCHEME
SECTION 1: INTRODUCTION
6

1 - INTRODUCTION
NSA(s) responsible for drawing up the
Performance Plan
1.1.1 - List of ANSPs and geographical coverage and services
Number of ANSPs
ANSP name Services
Avinor Flysikring AS (Avinor ANS) En-Route ATS
Avinor AS Terminal ATS
Cross-border arrangements for the provision of ANS services
6
ANSP Name
Avinor Flysikring AS
Avinor Flysikring AS
Avinor Flysikring AS
Avinor Flysikring AS
Avinor Flysikring AS
Avinor Flysikring AS
3
ANSP Name
NATS
LFV
Saerco
1.1.2 - Other entities in the scope of the Performance and Charging Regulation as per Article 1(2) last para.
Number of other entities
Entity name Domain of activity
The Civil Aviation Authority of
Norway (CAA-N)National regulator
The Norwegian Meteorological
Institute (MET)
Norwegian MET
provider
EurocontrolIntergovernmental
Agency
1.1.3 - Charging zones (see also 1.4-List of Airports)
En-route 1
En-route charging zone 1
Terminal 1
Terminal charging zone 1
1.1 - The situation
Civil Aviation Authority Norway
Geographical scope
Norway
Norway
Description and scope of the cross-border arrangement
ANSPs established in another Member State providing services in one or more of the State's FIRs
Description and scope of the cross-border arrangement
Number CB arrangements where ANSPs from another State provide services in the State
Kirkenes TMA West and Centre are within Finnish airspace (see 4.1.1, initiative 1).
North Sea Helicopters - Scottish FIR (see 4.1.1, initiative 2).
North Sea Helicopters - Norway FIR (see 4.1.1, initiative 3).
Sweden FIR/Norway FIR (see 4.1.1, initiative 4).
Finland FIR/Norway FIR (see 4.1.1, initiative 5).
Free Route Airspace (see 4.1.1, initiative 6)
2
ANSPs providing services in the FIR of another State
Number CB arrangements where ANSPs provide services in an other State
Number of terminal charging zones
Norway - TCZ
3
Number of en-route charging zones
Norway
Rationale for inclusion in the Performance Plan
The CAA-N is the competent authority (NSA) in Norway.
The Norwegian Meteorological Institute is the designated MET provider in Norway.
Norway is a member of Eurocontrol and the determined cost stemming from the
Eurocontrol International Convention is a part of the cost base.
North Sea Helicopters - Norway FIR (see 4.1.1, initiativ 3).
Sweden FIR/Norway FIR (see 4.1.1, initiative 4).
TWR and APP services at Kristiansand airport Kjevik (from 01.03.2020)
7

1.1.4 - Other general information relevant to the plan
Additional comments
Avinor Flysikring AS (Avinor ANS) is the designated provider of ATC-services in Norway. Avinor ANS is a subsidiary company of Avinor AS, which is the
owner of the major airports in Norway. Both companies are limited liability companies (“AS”). All the shares of Avinor AS are owned by the State,
and administered by the Ministry of Transport (the Ministry).
Avinor Flysikring AS (Avinor ANS) is identified in the performance plan as the service provider for ATC-services in the en route charging zone. Avinor
AS is identified as the service provider for ATC-services in the terminal charging zone. The latter solution may not seem logical, but it is related to the
fact that Avinor AS as airport owner purchases ATC-services from Avinor ANS in the terminal charging zone, related to their airports, in addition to
Avinor AS being an actual provider of CNS-services. All figures reported by Avinor AS in relation to ATC-services in the terminal charging zone are
based on the actual costs of Avinor ANS to deliver ATC-services (i.e.: figures are not based on contractual costs).
The Norwegian Meteorological Institute (MET) is designated as the national service provider of meteorological air navigation services. MET delivers
its services through contractual relations with Avinor ANS and Avinor AS. These contracts regulate the level and quality of service provision, as well
as the costs. The MET cost base is as such an integral part of the cost bases for Avinor ANS and Avinor AS, categorized solely as operating costs. The
cost efficiency target of MET (for RP2) is set through the Ministry’s designation of MET as a national service provider. The Ministry has not yet set a
cost efficiency target for MET for RP3.
The Spanish service provider SAERCO has, through a tender process, been awarded a contract to provide ATC-services on two airports not directly a
part of the performance scheme. The service provision will commence in spring 2020. This will for one of the airports (Kristiansand airport, Kjevik)
have an effect on the part of the “approach”-services that is allocated to the en route charging zone. The cost allocation model chosen for the
performance plan includes the Kjevik approach cost allocated to the en route cost base.
8

En route Charging zone 1
En route traffic forecast
Local Forecast 2017A 2018A 2019 2020 2021 2022 2023 2024
CAGR
2019-2024
IFR movements (thousands) 591 594 -
IFR movements (yearly variation in %) 0,6%
En route service units (thousands) 2 527 2 522 2 427 2 462 2 484 2 519 2 549 2 583 1,3%
En route service units (yearly variation in %) -0,2% -3,8% 1,4% 0,9% 1,4% 1,2% 1,3%
Terminal Charging zone 1
Terminal traffic forecast
Local Forecast 2017A 2018A 2019 2020 2021 2022 2023 2024
CAGR
2019-2024
IFR movements (thousands) 214,5 215,7 -
IFR movements (yearly variation in %) 0,6%
Terminal service units (thousands) 246,2 252,6 262,0 267,1 269,4 272,4 274,7 277,5 1,2%
Terminal service units (yearly variation in %) 2,6% 3,7% 1,9% 0,9% 1,1% 0,8% 1,0%
Specific local factors justifying not using the STATFOR base forecasts
(provide justification below or refer to Annex D for more detailed explanation)
The Terminal service units are based on STATFOR base forecast from October 2019 for the period 2019-2024 including offshore traffic for the airports.
Ref. ANNEX D. LOCAL TRAFFIC FORECASTS
NOTE: Section 1.3 (Stakeholder Consultation) should include details on the consultation with airspace users' representatives and ANSPs concerned on the
rationale for not using the STATFOR base forecasts.
1.2 - Traffic Forecasts
Local forecast
Norway
1.2.1 - En route
Specific local factors justifying not using the STATFOR base forecasts
(provide justification below or refer to Annex D for more detailed explanation)
The En Route service units are based on STATFOR base forecast from October 2019 for the period 2019-2024 using model 3, taking into consideration the
ratios M3/M2 published by the CRCO for November 2017 to May 2019.
Ref. ANNEX D. LOCAL TRAFFIC FORECASTS
NOTE: Section 1.3 (Stakeholder Consultation) should include details on the consultation with airspace users' representatives and ANSPs concerned on the
rationale for not using the STATFOR base forecasts.
1.2.2 - Terminal
Norway - TCZ
Local forecast
9

1.3.1 - Overall outcome of the consultation of stakeholders on the performance plan
1.3 - Stakeholder consultation
Description of main points raised by stakeholders and explanation of how they were taken into account in developing the performance plan
Traffic forecasts
NHO Luftfart (NHO) asked whether STATFOR forecasts will be used in the Performance Plan (PP).
Avinor Flysikring AS (AFS) commented that there might be presented local forecasts that may be used in the PP, but they were aware that these
forecasts will have to be discussed and justified.
Concerning offshore traffic, Avinor AS (Avinor) mentioned that growth in traffic is larger than in other traffic, but that this has a low total impact.
Result: CAA is proposing local forecasts in the performance plan. These have been put forward by AFS, and has been consulted with the airspace
users.
Investments
NHO asked if the WACC will be discussed, and which WACC that would be the basis for RP3. Avinor confirmed that their figures is based on the new
WACC calculated in January 2019. IATA asked for the beta and the other factors that the WACC is based on. CAA said that they will get this
information from Avinor AS, and send it too IATA.
NHO asked about the time frame for investments. AFS will make an update on this in September, but expects it not to be very different from the
current.
SAS asked whether ATM system implementation delay might occur, since AFS is dependent on other partners in this project. AFS answered that this
is possible, but that AUs will be consulted if this happens.
Result: CAA proposes use of a WACC as recommended by Avinor/AFS based on Deloitte report (see point 1.3.3).
National targets
Safety (no comments)
Environment (no comments)
Capacity – En Route
AFS commented on the interdependencies with costs, and that PRB has suggested that one should consider a higher delay and at the same time
offer capacity (by lending out ATCOs) to the rest of Europe. AFS does not have any stated preferences but choose to leave the question to the
NSA/airspace users.
Cost efficiency
CAA pointed out some central issues:
- Low traffic increase in RP3 (1.1 %).
- Transition to new ATM-system with a need for double staffing generating restructuring costs (both en route and terminal).
- Change of allocation key for combined towers.
Pension Scheme
Ministry asked what might change these costs in the future. AFS replied that essential factors are mortal rate, interest rate, risk assessment.
Restructuring costs
AFS claimed that investment in new ATM system is considered as restructuring costs.
Airspace users were sceptical and their opinion was that the cost details have to be presented and analysed before any possible justification of
restructuring costs.
AFS replied that they have no CEF-funding, and that the risk is therefore entirely on them as an ANSP.
The CAA pointed out that investments in future ATM-system (FAS) also gives more flexibility regarding use of ATCOs, and is essential for the
implementation of PCP-requirements.
Result: CAA have analysed figures and AFS’ rationale for justification of restructuring costs (Annex H), and propose to accept relevant costs as
restructuring costs.
Cross border initiatives
No new initiatives in RP3.
Incentive schemes
CAA presented current proposal for national pivot value regarding en route delay stronger than reference value for delay set by NM: 0.08 min/flight.
The national proposal is to give no bonus, but penalty starting from delay above the treshold of 0.11 min/flight. The penalty will consist of a
reduction of up to 2 % of the revenues from traffic. AFS did not see the reasoning for the proposal of giving no bonus. They claimed that they
performed better in RP2 because the incentive (bonus) was established. AFS wants a symmetrical solution. For the airspace users, the most
important issue is to achieve the delay-target, not necessarily performing better.
CAA proposed a modulated target regarding terminal delay, excluding e.g. weather as a delay cause.
Result: CAA proposes a non-symmetrical incentive scheme for capacity, with no bonus and penalty of up to 2 % of the cost base. Incentive scheme
for traffic risk will be the “default solution” in the regulation. No incentive scheme for environment.
Changes in the allocation key for approach costs
CAA presented the draft proposal from the Ministry on change in the allocation key in the APP-sector, from 50/50 to 80/20. CAA explained the
rationale for the proposal. They added that the proposal includes a suggestion to include these costs in RP3.
Participants pointed out the importance of a final decision on this matter in close future.
Result: The performance plan is based on a change on allocation of approach-costs between the en route and the terminal from 50/50 to 80/20.
TWR/APP services under market condition
CAA presented the challenges with tendering of the TWR/APP services, at this stage concerning Kristiansand airport, Kjevik.
Avinor’s view is that recovery of the en route part of the approach costs should go through the en route cost base. If these costs should be recovered
through f. ex. other commercial revenue, Avinor would have less incentive to put the services to market conditions.
Ministry´s view is that the costs must be included in the en route cost base.
CAA will probably follow the Swedish model.
Result: Recovery of the en route part of the approach costs at airports with services under market conditions, will go through the en route cost base.
10

Traffic forecasts
NHO Luftfart (NHO) asked whether STATFOR forecasts will be used in the Performance Plan (PP).
Avinor Flysikring AS (AFS) commented that there might be presented local forecasts that may be used in the PP, but they were aware that these
forecasts will have to be discussed and justified.
Concerning offshore traffic, Avinor AS (Avinor) mentioned that growth in traffic is larger than in other traffic, but that this has a low total impact.
Result: CAA is proposing local forecasts in the performance plan. These have been put forward by AFS, and has been consulted with the airspace
users.
Investments
NHO asked if the WACC will be discussed, and which WACC that would be the basis for RP3. Avinor confirmed that their figures is based on the new
WACC calculated in January 2019. IATA asked for the beta and the other factors that the WACC is based on. CAA said that they will get this
information from Avinor AS, and send it too IATA.
NHO asked about the time frame for investments. AFS will make an update on this in September, but expects it not to be very different from the
current.
SAS asked whether ATM system implementation delay might occur, since AFS is dependent on other partners in this project. AFS answered that this
is possible, but that AUs will be consulted if this happens.
Result: CAA proposes use of a WACC as recommended by Avinor/AFS based on Deloitte report (see point 1.3.3).
National targets
Safety (no comments)
Environment (no comments)
Capacity – En Route
AFS commented on the interdependencies with costs, and that PRB has suggested that one should consider a higher delay and at the same time
offer capacity (by lending out ATCOs) to the rest of Europe. AFS does not have any stated preferences but choose to leave the question to the
NSA/airspace users.
Cost efficiency
CAA pointed out some central issues:
- Low traffic increase in RP3 (1.1 %).
- Transition to new ATM-system with a need for double staffing generating restructuring costs (both en route and terminal).
- Change of allocation key for combined towers.
Pension Scheme
Ministry asked what might change these costs in the future. AFS replied that essential factors are mortal rate, interest rate, risk assessment.
Restructuring costs
AFS claimed that investment in new ATM system is considered as restructuring costs.
Airspace users were sceptical and their opinion was that the cost details have to be presented and analysed before any possible justification of
restructuring costs.
AFS replied that they have no CEF-funding, and that the risk is therefore entirely on them as an ANSP.
The CAA pointed out that investments in future ATM-system (FAS) also gives more flexibility regarding use of ATCOs, and is essential for the
implementation of PCP-requirements.
Result: CAA have analysed figures and AFS’ rationale for justification of restructuring costs (Annex H), and propose to accept relevant costs as
restructuring costs.
Cross border initiatives
No new initiatives in RP3.
Incentive schemes
CAA presented current proposal for national pivot value regarding en route delay stronger than reference value for delay set by NM: 0.08 min/flight.
The national proposal is to give no bonus, but penalty starting from delay above the treshold of 0.11 min/flight. The penalty will consist of a
reduction of up to 2 % of the revenues from traffic. AFS did not see the reasoning for the proposal of giving no bonus. They claimed that they
performed better in RP2 because the incentive (bonus) was established. AFS wants a symmetrical solution. For the airspace users, the most
important issue is to achieve the delay-target, not necessarily performing better.
CAA proposed a modulated target regarding terminal delay, excluding e.g. weather as a delay cause.
Result: CAA proposes a non-symmetrical incentive scheme for capacity, with no bonus and penalty of up to 2 % of the cost base. Incentive scheme
for traffic risk will be the “default solution” in the regulation. No incentive scheme for environment.
Changes in the allocation key for approach costs
CAA presented the draft proposal from the Ministry on change in the allocation key in the APP-sector, from 50/50 to 80/20. CAA explained the
rationale for the proposal. They added that the proposal includes a suggestion to include these costs in RP3.
Participants pointed out the importance of a final decision on this matter in close future.
Result: The performance plan is based on a change on allocation of approach-costs between the en route and the terminal from 50/50 to 80/20.
TWR/APP services under market condition
CAA presented the challenges with tendering of the TWR/APP services, at this stage concerning Kristiansand airport, Kjevik.
Avinor’s view is that recovery of the en route part of the approach costs should go through the en route cost base. If these costs should be recovered
through f. ex. other commercial revenue, Avinor would have less incentive to put the services to market conditions.
Ministry´s view is that the costs must be included in the en route cost base.
CAA will probably follow the Swedish model.
Result: Recovery of the en route part of the approach costs at airports with services under market conditions, will go through the en route cost base.
11
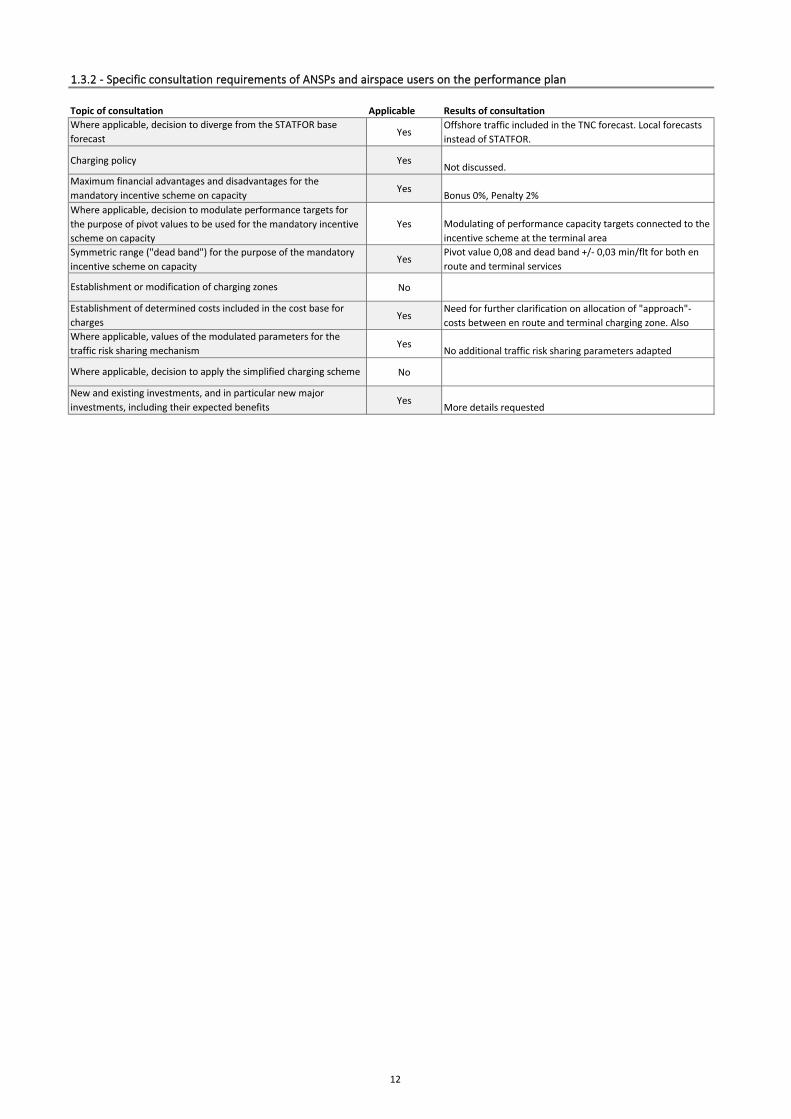
1.3.2 - Specific consultation requirements of ANSPs and airspace users on the performance plan
Topic of consultation Applicable Results of consultation
YesOffshore traffic included in the TNC forecast. Local forecasts
instead of STATFOR.
Charging policy YesNot discussed.
YesBonus 0%, Penalty 2%
Yes Modulating of performance capacity targets connected to the
incentive scheme at the terminal area
YesPivot value 0,08 and dead band +/- 0,03 min/flt for both en
route and terminal services
No
YesNeed for further clarification on allocation of "approach"-
costs between en route and terminal charging zone. Also
YesNo additional traffic risk sharing parameters adapted
No
YesMore details requested
Symmetric range ("dead band") for the purpose of the mandatory
incentive scheme on capacity
Establishment or modification of charging zones
Where applicable, values of the modulated parameters for the
traffic risk sharing mechanism
Where applicable, decision to apply the simplified charging scheme
New and existing investments, and in particular new major
investments, including their expected benefits
Establishment of determined costs included in the cost base for
charges
Maximum financial advantages and disadvantages for the
mandatory incentive scheme on capacity
Where applicable, decision to diverge from the STATFOR base
forecast
Where applicable, decision to modulate performance targets for
the purpose of pivot values to be used for the mandatory incentive
scheme on capacity
12

1.3.3 - Consultation of stakeholder groups on the performance plan
Stakeholder group composition
Dates of main meetings / correspondence
Actions agreed upon
Points of disagreement and reasons
#1 - ANSPs
Avinor AS, Avinor Flysikring AS (ANS) AS, The Norwegian Meteorological Institute (MET)
- 22.03.2019,
- 08.05.2019
- continous dialogue with Avinor AS and AFAS from September to mid-November
Further work on specifying different costs elements, traffic forecast with local adjustments etc.
- AFAS is opposed to the CAA's proposal on incentive scheme. They want a symmetrical scheme, where
they also may receive a bonus for delivering less delays than the target/pivot value.
- Avinor AS and AFAS are opposed to any reduction in the WACC, compared to their own analysis,
conducted by Deloitte.
- AFS is of the opinion that a local traffic forecast should be used, instead of STATFOR. This relates in
particular to STATFOR not taking into consideration the change in allocation key of costs in the approach-
sector, between en route and terminal, from 50/50 to 80/20.
- AFS considers that there are many uncertainties in relation to their expected income and costs during
RP3, and that a major cut in the unit rate level will seriously jeopardize their ability to deliver good
services through RP3.
Main issues discussed
Topics 22.03.2019 (Except MET)
- Capacity targets
- Cost efficiency
- Traffic development
- Investments
- MET costs
- Incentive schemes (bonus, penalty, pivot, dead band)
Topics 08.05.2019 (Except MET)
-Cost reduction measures
-Gains from FAS implementation during RP4
-Simulate different capacity targets
-restructuring costs
Topics 20.05.2019 (Only MET)
-Investment and projections of total operating costs associated with MET services in RP3.
-Meteorological Institute and special challenges with the performance regime.
Topics in the continous dialogue (Except MET)
- Traffic forecasts
- WACC
- Level of cost reduction
- Incentive scheme for capacity: bonus and pivot value
13

In addition Avinor and AFS have been participating in all meetings described in 1.3.3, #2
Additional comments
Final outcome of the consultation
CAPACITY: CAA considers that AFS’ starting point should be to deliver the capacity that ensures continuity
of traffic without significant interruptions. This entails an incentive system that is primarily intended to
secure a resource allocation that takes care of this, i.e. that it must have an economic impact for the ANSP
if they do not deliver the agreed capacity. Based on the experience from RP2 it is our view that under
normal operational circumstances, the target (0,08 min/flt) should be well achievable without significant
effort.
On the basis of feedback from airspace users, it is also the CAA’s opinion that the additional costs of delay
beyond the threshold value (pivot) are far greater in a global perspective than the savings of providing a
significant overcapacity. CAA has therefore considered an incentive scheme in the third reference period
that does not provide any bonus for delivering overcapacity beyond the target (pivot value), while in case
of delay beyond the target (pivot including a dead band), a balanced penalty of 2 per cent of the traffic
revenues is allocated the airspace users in latest within year n + 2.
TRAFFIC FORECASTS: CAA has considered using a local traffic forecast, since there has been a significant
change in traffic expectations since STATFOR February was released. Due to the delayed submission of
the performance plan, CAA has been able to use the STATFOR October forecast. This forecast is closer to
the figures of the considered local forecast than STATFOR February was. CAA’s view is that there is major
uncertainty involved as to the development of traffic in the Norwegian en route sector. We consider that
STATFOR October is the most updated forecast, also constituting a “compromise” between STATFOR
February and a local forecast presented by AFS.
WACC: Based on a letter from the Ministry of Transport, the cost of capital (WACC) is adjusted to 4,16 %
for en route services and 4,83 % for the terminal services in PR3. The decision made by the Ministry is
based on a letter received from the Norwegian Aviation Industries (NHO) where it is referred for
calculation made by IATA in September 2019.
GENERAL COST REDUCTION: There is a political ambition of a non-increase in the development of the unit
rate for the en route sector. Given that we present a performance plan with deduction of “restructuring
costs” from the cost base, the CAA’s view is that the service provider should accept cost reducing
measures assuring that there is no actual increase in the unit rate.
14

Stakeholder group composition
Dates of main meetings / correspondence
Actions agreed upon
Points of disagreement and reasons
Final outcome of the consultation
#2 - Airspace Users
Scandinavian Airlines System (SAS), Norwegian Air Shuttle (NAS), Widerøes Flyveselskap AS, Federation of
Norwegian Aviation Industries (NHO), Norwegian Air Sports Federation (NLF), International Air Transport
Association (IATA)
08.02.2019, 02.04.2019 and 23.08.2019
Described issues above from 23/8
Topics 08.02.2019
- New regulation
- National road selection for RP3
- Discussion / input from national stakeholders
Topics 02.04.2019
- Summary from SSC71 EU-wide targets
- Targets and forecasts RP2 & RP3
- Presentations Goal RP3
Topics 23.08.2019
Performance plan template
1. Introduction
2. Investments
3. PERFORMANCE TARGETS (Safety, Environment, Capacity, Cost efficiency)
4. Cross-Boarder and SESAR
5. Traffic RS & Incentives
6. Implementation
Main issues discussed
Report from Deloitte initiated by Avinor regarding calculation of a new WACC in RP3. Hereof
disagreement around the peer group, beta value, risk free rate and the cost of debt. Level of restrucuring
costs and justification on the benefit (CBA) of investments in a new ATM system.
NHO pointed out that there has been a lack of discussions in the consultation process on which airports to
be covered by the performance plan.
IATA was concerned about doublecharging of investments extending from RP2 into RP3.
Avinor has seen a need for an updated cost of capital (WACC) ahead of the reference period 3. This
formed the basis for a new analysis conducted by the consulting firm Deloitte. In accordance with the
information the CAA holds, the WACC is assessed by Deloitte without any guidance from Avinor with
regard to the assessment of individual parameters or level, nor are there any methodological changes in
the model used compared with the calculation performed by Deloitte. The assessment of WACC is based
on the annual accounts figures and other collected and documented figures as of 31.12.2018. The
consulted WACC for use in RP3 was set to 6.4% for en route services and 7,2 % for the terminal services.
Based on letter from the Ministry of Transport from October 2019, the cost of capital (WACC) is adjusted
to 4,16 % for en route services and 4,83 % for the terminal services in PR3. The decision made by the
Ministry is based on a letter received from the Norwegian Aviation Industries (NHO) referring to a
calculation made by IATA in September 2019.
The CAA has previously consulted on which airports will be included in the performance plan but has not
received input from the stakeholder (NHO) at this issue until late in the process.
The ANSP has confimed that underspending of investements in RP2 are beeing deducted in RP3. The NSA
will monitor this closely in RP3.
Additional comments
PRB and IATA participated only in the stakeholder consultation meeting 23. August 2019.
15

Stakeholder group composition
Dates of main meetings / correspondence
Main issues discussed
Actions agreed upon
Points of disagreement and reasons
Final outcome of the consultation
Stakeholder group composition
Dates of main meetings / correspondence
Main issues discussed
Actions agreed upon
Points of disagreement and reasons
Final outcome of the consultation
Stakeholder group composition
Dates of main meetings / correspondence
Main issues discussed
Actions agreed upon
Points of disagreement and reasons
Final outcome of the consultation
#3 - Professional staff representative bodies
Additional comments
#4 - Airport operators
Avinor AS, Torp Sandefjord Lufthavn (Sandefjord Lufthavn AS)
The airport operators have been participating in all consultation meetings described in 1.3.3., #2.
Additional comments
Additional comments
#5 - Airport coordinator
16

Stakeholder group composition
Dates of main meetings / correspondence
Main issues discussed
Actions agreed upon
Points of disagreement and reasons
Final outcome of the consultation
Ministry of Transport have been participating in all consultation meetings described in 1.3.3., #2.
#6 - Other (specify)
Norwegian Ministry of Transport, Team PRB Support
Ministry of Transport have been participating in all consultation meetings described in 1.3.3., #2. Team
PRB Support only in the meeting 23. August 2019.
Topics 23.08.2019
Performance plan template
1. Introduction
2. Investments
3. PERFORMANCE TARGETS (Safety, Environment, Capacity, Cost efficiency)
4. Cross-Boarder and SESAR
5. Traffic RS & Incentives
6. Implementation
Additional comments
17

1.4 - List of airports subject to the performance and charging Regulation
1.4.1 - Airports as per Article 1(3) (IFR movements ≥ 80 000)
ICAO code Airport name Charging Zone 2016 2017 2018 Average
ENGM Oslo/Gardermoen Norway - TCZ 245 093 251 193 257 474 251 253
ENBR Bergen/Flesland Norway - TCZ 87 144 83 653 85 443 85 413
1.4.2 Other airports added on a voluntary basis as per Article 1(4)
Number of airports
ICAO code Airport name Charging Zone
ENZV Stavanger/Sola Norway - TCZ
ENVA Trondheim/Vaernes Norway - TCZ
Additional comments
The geographical scope of the the terminal charging zone remains unchanged from RP2, i.e. one charging zone subject to the performance and
charging regulation in RP3 consisting of the airports Gardermoen (ENGM), Bergen (ENBR), Stavanger (ENZV) and Trondheim (ENVA).
IFR air transport movements
2
Additional information
IFR movements ≥ 70 000
IFR movements ≥ 50 000
18

1.5 - Services under market conditions
Number of services under market conditions 0
19

1.6 - Process followed to develop and adopt a FAB Performance Plan
Not applicable
Description of the process
20

1.7 - Establishment and application of a simplified charging scheme
Is the State intending to establish and apply a simplified charging scheme for any charging zone/ANSP?No
21

2.1 - Investments - Avinor Flysikring AS (Avinor ANS)
2.1.1 - Summary of investments
2.1.2 - Detail of new major investments
2.1.3 - Other new and existing investments
2.2 - Investments - Avinor AS
2.2.1 - Summary of investments
2.2.2 - Detail of new major investments
2.2.3 - Other new and existing investments
Annexes of relevance to this section
ANNEX E. INVESTMENTS
NOTE: The requirements as per Annex II, 2.2.(c) are addressed in item 4.1.2
SECTION 2: INVESTMENTS
22

2.1 - Investments - Avinor Flysikring AS (Avinor ANS)
2.1.1 - Summary of investments
2020 2021 2022 2023 2024 Enroute Terminal
1 SKYCOM 138 300 000 138 300 000 740 480 3 265 600 5 703 360 14 973 280 14 973 280 15 100 % 01.09.2023
2 FAS ACC (TWR/APP) 190 043 621 76 017 449 462 779 1 041 254 1 812 553 2 583 852 6 322 326 15 100 % 01.08.2024
328 343 621 214 317 449 1 203 259 4 306 854 7 515 913 17 557 132 21 295 606
440 747 927 327 493 340 0 0 2 114 276 9 749 160 13 623 723
132 165 637 137 354 791 156 186 578 149 593 508 204 787 897
769 091 549 541 810 789 133 368 896 141 661 645 165 816 766 176 899 800 239 707 226
2.1.2 - Detail of new major investments
No
Network
Local
Non-performance
Safety
Environment
Capacity
Cost Efficiency
No
No
Replacement
investment
Master Plan (non-
PCP)
Allocation (%)*
* The total % enroute+terminal should be equal to 100%.
Value of the
assets allocated
to ANS in the
scope of the PP
#
Sub-total of new major investments
above (1)
Sub-total other new investments (2)
Sub-total existing investments (3)
Total new and existing investments
(1) + (2) + (3)
If investment in ATM system, type?
Description of the asset
Results of the consultation of airspace users'
representatives
NOTE: Section 1.3 (Stakeholder Consultation) should include details on the consultation with airspace users' representatives on new major investments.
Implementation of VoIP based Voice Communication System for Norway ACC, replacing existing 3 old local VCS systems.
SKYCOM is an enabler for benefit realisation and performance improvement of future ATM system (FAS) for Norway ACC e.g. dynamic sectorisation
Consultation with airspace users not done.
Name of new major investment 1 SKYCOM Total value of the asset NOK 138 300 000
Joint investment / partnership
Investment in ATM systems
The investment is mandated by a SES Regulation (i.e.
PCP/Interoperability)?
Level of impact of the investmentLow
Low
High, enabler for ATM system performance improvements
Quantitative impact per KPA
2Number of new major investments
Planned date of
entry into
operation
Name of new major investment
(i.e. above 5 M€)
Total value of the asset
(capex or contractual
leasing)
Determined costs of investment (i.e. depreciation, cost of capital and cost of leasing) (in
national currency)Lifecycle
(Amortisation
period in years)
If investment in ATM system, Reference to European
ATM Master Plan / PCP
23

No
Network
Local
Non-performance
Safety
Environment
Capacity
Cost Efficiency
Yes
YesReplacement
investment
PCP
2.1.3 - Other new and existing investments
The investment is mandated by a SES Regulation (i.e.
PCP/Interoperability)?
Level of impact of the investmentLow
Moderate
Quantitative impact per KPA
Name of new major investment 2 FAS ACC (TWR/APP) Total value of the asset NOK 190 043 621
Other new investments are mainly replacement and upgrade of COM/SUR/NAV-equipment. Annex E provides a more detailed overview. As presented in Annex E the sum
of investments consists of a number of smaller projects within the categories NAV, SUR and COM. When planning 5-6 years ahead, the uncertainty of both which
investments actually will be made and also the cost of a possible investment is high. The investment level is based on an evaluation of equipment in operation and the
time frame for upgrade/replacement, considering many factors, but most importantly regulatory requirements and cost efficiency. The investment projects in Avinor ANS
are managed on a portfolio basis.
Please see Annex E for more detailed information.
Existing investments are described in the Performance Plan for RP2.
Description and justification of the costs nature and benefits of
other new and existing investments in fixed assets planned over
the reference period
If investment in ATM system, type?
If investment in ATM system, Reference to European
ATM Master Plan / PCP
Joint investment / partnership
Investment in ATM systems
Description of the assetiTEC client positions to support Towers and Approaches with ATM-functionality, based on new iTEC ATM system. The client working positions will be
connected to a shared data centre, supporting both ACC, APP and (limited) TWR functions.
Results of the consultation of airspace users'
representativesNo consultation with airspace users related to TWR functionality.
24

2.2 - Investments - Avinor AS
2.2.1 - Summary of investments
2020 2021 2022 2023 2024 Enroute Terminal
1 New ATM system OSL, NeTSO 547 000 000 547 000 000 1 508 563 5 393 043 10 343 819 15 293 823 40 745 061 20 100 % 01.08.2024
2 Terminal area radar OSL 41 583 940 41 583 940 1 036 953 3 893 894 3 937 063 3 836 638 3 736 213 20 100 % 02.05.2021
588 583 940 588 583 940 2 545 515 9 286 938 14 280 883 19 130 461 44 481 274
54 318 713 53 523 275 52 966 469 52 188 616 52 132 870
588 583 940 588 583 940 56 864 228 62 810 212 67 247 352 71 319 077 96 614 144
2.2.2 - Detail of new major investments
Yes
No
Yes
New system
Click to select
Joint investment / partnership
Investment in ATM systems
If investment in ATM system, type?
If investment in ATM system, Reference to European IR (EU) 716/2014
Number of new major investments
#Name of new major investment
(i.e. above 5 M€)
Total value of the asset
(capex or contractual
leasing value)
Value of the
assets allocated to
ANS in the scope
of the PP
2
NOK 547 000 000
Description of the asset
Investment in new TWR ATM-system to replace existing system at Gardermoen TWR. The total investment cost is based on a feasibility study based on
input from several system suppliers. The investment is expected to increase safety, capacity and cost-efficiency of service provision at Oslo airport and
implement legal requirements as mandated by IR (EU) 716/2014. The NeTSO project is at the moment in a pre-project phase and a planned investment
decision by the Avinor AS board is expected in autumn 2020.
The investment is mandated by a SES Regulation (i.e.
PCP/Interoperability)? Ref. to the Regulation and, if funded
through Union assistance programmes, ref. to the relevant
Sub-total existing investments (3)
Total new and existing investments (1)
+ (2) + (3)
* The total % enroute+terminal should be equal to 100%.
NOTE: Section 1.3 (Stakeholder Consultation) should include details on the consultation with airspace users' representatives on new major investments.
Name of new major investment 1 New ATM system OSL, NeTSO Total value of the asset
IR (EU) 716/2014
Determined costs of investment (i.e. depreciation, cost of capital and cost of leasing) (in
national currency)Lifecycle
(Amortisation
period in years)
Allocation (%)* Planned date of
entry into
operation
Sub-total of new major investments
above (1)
Sub-total other new investments (2)
Benefits for airspace users and results of the consultation of
airspace users' representativesIncreased capacity, safety and cost-efficiency in service provision.
25

No
Network
Local
Non-performance
Safety
Environment
Capacity
Cost Efficiency
No
No
Replacement
investment
Master Plan (non-
PCP)
2.2.3 - Other new and existing investments
Description and justification of the costs nature and benefits of
other new and existing investments in fixed assets planned over
the reference period
If investment in ATM system, type?
If investment in ATM system, Reference to European
ATM Master Plan / PCP
Joint investment / partnership
Investment in ATM systems
The investment is mandated by a SES Regulation (i.e.
PCP/Interoperability)?
Level of impact of the investment
Low
High
Quantitative impact per KPA
Name of new major investment 2 Terminal area radar OSL Total value of the asset NOK 41 583 940
Description of the asset
The replacement of Gardermoen Terminal Area Radar (TAR) will provide ATC necessary system support to enable and ensure safe and efficient
management of air traffic flows into OSL, providing 3NM or less separation between arriving aircraft. The new Gardermoen TAR shall consist of both
MSSR and PSR to ensure safety and security and will meet future regulatory requirements for standardization, capacity and provide redundancy to avoid
delays for airspace users.
Results of the consultation of airspace users' representatives Consultation with airspace users not done.
26

3.1 - Safety targets
3.1.1 - Safety KPI #1: Level of Effectiveness of Safety Management achieved by ANSPs
3.2 - Environment targets
3.2.1 - Environment KPI #1: Horizontal en route flight efficiency (KEA)
3.3 - Capacity targets
3.3.1 - Capacity KPI #1: En route ATFM delay per flight
3.3.2 - Capacity KPI #2: Terminal and airport ANS ATFM arrival delay per flight
3.4 - Cost efficiency targets
3.4.1 - Cost efficiency KPI #1: Determined unit cost (DUC) for en route ANS
En Route Charging Zone #x
3.4.2 - Cost efficiency KPI #2: Determined unit cost (DUC) for terminal ANS
Terminal Charging Zone #x
3.4.3 - Pension assumptions
3.4.4 - Interest rate assumptions for loans financing the provision of air navigation services
3.4.5 - Restructuring costs
3.5 - Additional KPIs / Targets
3.6 - Description of KPAs interdependencies and trade-offs including the assumptions used to assess those trade-offs
3.6.1 - Interdependencies and trade-offs between safety and other KPAs
3.6.2 - Interdependencies and trade-offs between capacity and environment
3.6.3 - Interdependencies and trade-offs between cost-efficiency and capacity
3.6.4 - Other interdependencies and trade-offs
Annexes of relevance to this section
ANNEX A. REPORTING TABLES & ADDITIONAL INFORMATION (EN-ROUTE)
ANNEX B. REPORTING TABLES & ADDITIONAL INFORMATION (TERMINAL)
ANNEX F. BASELINE VALUES (COST-EFFICIENCY)
ANNEX H. RESTRUCTURING MEASURES AND COSTS
ANNEX M. COST ALLOCATION
ANNEX J. OPTIONAL KPIs AND TARGETS
ANNEX O. JUSTIFICATIONS FOR THE LOCAL SAFETY TARGETS
ANNEX P. JUSTIFICATIONS FOR THE LOCAL ENVIRONMENT TARGETS
ANNEX Q. JUSTIFICATIONS FOR THE LOCAL CAPACITY TARGETS
ANNEX R. JUSTIFICATIONS FOR THE LOCAL COST-EFFICIENCY TARGETS
SECTION 3: PERFORMANCE TARGETS AND MEASURES FOR THEIR ACHIEVEMENT
27

3.1 - Safety targets
3.1.1 - Safety KPI #1: Level of Effectiveness of Safety Management achieved by ANSPs
a) Safety national performance targets
b) Detailed justifications in case of inconsistency between local and Union-wide safety targets
c) Main measures put in place to achieve the safety performance targets
Annexes of relevance to this section
ANNEX O. JUSTIFICATIONS FOR THE LOCAL SAFETY TARGETS
SECTION 3.1: SAFETY KPA
28
3 - PERFORMANCE TARGETS AT LOCAL LEVEL
3.1 - Safety targets
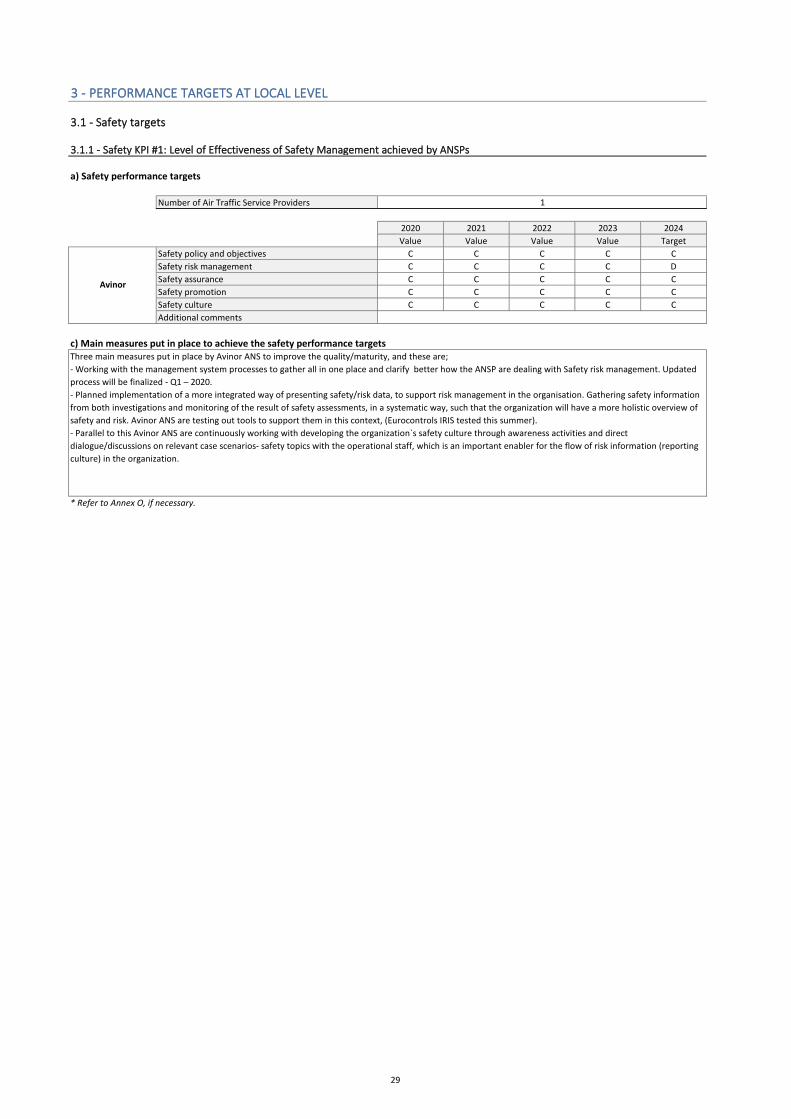
3.1.1 - Safety KPI #1: Level of Effectiveness of Safety Management achieved by ANSPs
a) Safety performance targets
Number of Air Traffic Service Providers
2020 2021 2022 2023 2024
Value Value Value Value Target
Safety policy and objectives C C C C C
Safety risk management C C C C D
Safety assurance C C C C C
Safety promotion C C C C C
Safety culture C C C C C
Additional comments
c) Main measures put in place to achieve the safety performance targets
* Refer to Annex O, if necessary.
1
Three main measures put in place by Avinor ANS to improve the quality/maturity, and these are;
- Working with the management system processes to gather all in one place and clarify better how the ANSP are dealing with Safety risk management. Updated
process will be finalized - Q1 – 2020.
- Planned implementation of a more integrated way of presenting safety/risk data, to support risk management in the organisation. Gathering safety information
from both investigations and monitoring of the result of safety assessments, in a systematic way, such that the organization will have a more holistic overview of
safety and risk. Avinor ANS are testing out tools to support them in this context, (Eurocontrols IRIS tested this summer).
- Parallel to this Avinor ANS are continuously working with developing the organization`s safety culture through awareness activities and direct
dialogue/discussions on relevant case scenarios- safety topics with the operational staff, which is an important enabler for the flow of risk information (reporting
culture) in the organization.
Avinor
29

3.2 - Environment targets
3.2.1 - Environment KPI #1: Horizontal en route flight efficiency (KEA)
a) Environment national performance targets
b) Detailed justifications in case of inconsistency between national targets and national reference values
c) Main measures put in place to achieve the environment performance targets
Annexes of relevance to this section
ANNEX P. JUSTIFICATIONS FOR THE LOCAL ENVIRONMENT TARGETS
SECTION 3.2: ENVIRONMENT KPA
30

3.2 - Environment targets
3.2.1 - Environment KPI #1: Horizontal en route flight efficiency (KEA)
a) National environment performance targets
2020 2021 2022 2023 2024
Target Target Target Target Target
1.43% 1.43% 1.42% 1.42% 1.42%
1.43% 1.43% 1.42% 1.42% 1.42%
b) Detailed justifications in case of inconsistency between national targets and national reference values
* Refer to Annex P, if necessary.
c) Main measures put in place to achieve the environment performance targets
* Refer to Annex P, if necessary.
Norway has implemented Free Route Airspace in Norwegian airspace and it is up to the airlines to file a flight plan according to their needs. In that
respect the national ANSP has little influence regarding the environment performance target, but they claim to strive to offer direct routings to flights
within their area of responsibility.
No inconsistency between national targets and national reference values
National reference values
National targets
31

3.3 - Capacity targets
3.3.1 - Capacity KPI #1: En route ATFM delay per flight
a) Capacity national performance targets
b) Detailed justifications in case of inconsistency between national targets and national reference values
c) Main measures put in place to achieve the target for en-route ATFM delay per flight
d) ATCO planning
3.3.2 - Capacity KPI #2: Terminal and airport ANS ATFM arrival delay per flight
a) Capacity national performance targets
b) Contribution to the improvement of the European ATM network performance
c) Main measures put in place to achieve the target for terminal and airport ANS ATFM arrival delay per flight
Annexes of relevance to this section
ANNEX Q. JUSTIFICATIONS FOR THE LOCAL CAPACITY TARGETS
SECTION 3.3: CAPACITY KPA
32

3.3 - Capacity targets
3.3.1 - Capacity KPI #1: En route ATFM delay per flight
a) National capacity performance targets
2020 2021 2022 2023 2024
Target Target Target Target Target
National reference values 0,18 0,16 0,13 0,11 0,11
National targets 0,08 0,08 0,08 0,08 0,08
b) Detailed justifications in case of inconsistency between national targets and national reference values
* Refer to Annex Q, if necessary.
c) Main measures put in place to achieve the target for en-route ATFM delay per flight
* Refer to Annex Q, if necessary.
d) ATCO planning
Actual
Bodo (ENBD ACC) 2018 2019 2020 2021 2022 2023 2024
Number of additional ATCOs in OPS planned to start
working in the OPS room (FTEs)1,8 2,7 2,7 1,8
Number of ATCOs in OPS planned to stop working in the
OPS room (FTEs)3,6 0,9 1,8 0,9 0,9 0,9
Number of ATCOs in OPS planned to be operational at
year-end (FTEs)42 40,2 42 42,9 43,8 42,9 42
Actual
Oslo (ENOSE ACC) 2018 2019 2020 2021 2022 2023 2024
Number of additional ATCOs in OPS planned to start
working in the OPS room (FTEs)5 5 4 4 0 0
Number of ATCOs in OPS planned to stop working in the
OPS room (FTEs)3 3 3 3 3 3
Number of ATCOs in OPS planned to be operational at
year-end (FTEs)103 105 107 108 109 106 103
Actual
Stavanger (ENOSW ACC) 2018 2019 2020 2021 2022 2023 2024
Number of additional ATCOs in OPS planned to start
working in the OPS room (FTEs)1,6 3,2 3,2 0 0
Number of ATCOs in OPS planned to stop working in the
OPS room (FTEs)1,6 2,4 0,8 0,8 0,8 1,6
Number of ATCOs in OPS planned to be operational at
year-end (FTEs)30 28,4 27,6 30 32,4 31,6 30
Planning
Norway has been developing ATC capacity over years, and is in position to provide more capacity than the national reference values.
The cost optimum capacity for en route delay per flight for Avinor ANS is between 0,18 min/flt. and 0,11 min/flt., but for the airspace users this would
be unacceptable. This view is based on the fact that a large portion of the overall traffic is transition flights with little leeway in terms of delays. Based
on consultation meetings with the airspace users and Avinor ANS during spring 2019 the en route delay is set to 0,08 min./flt. for each year in RP3.
Avinor ANS has over the last years been increasing capacity, in order to being able to shift to new technology without major operational consequences
for the airspace users.
If targets are not met during the reference period the State can initiate follow up measures and corrective actions in place.
Additional comments
ATCOs in ACC-operation including supervisors in OPS only. ATCO FTEs allocated to oceanic and offshore operations are not included (reported as "Other
ANS" in ACE).
Planning
Planning
33
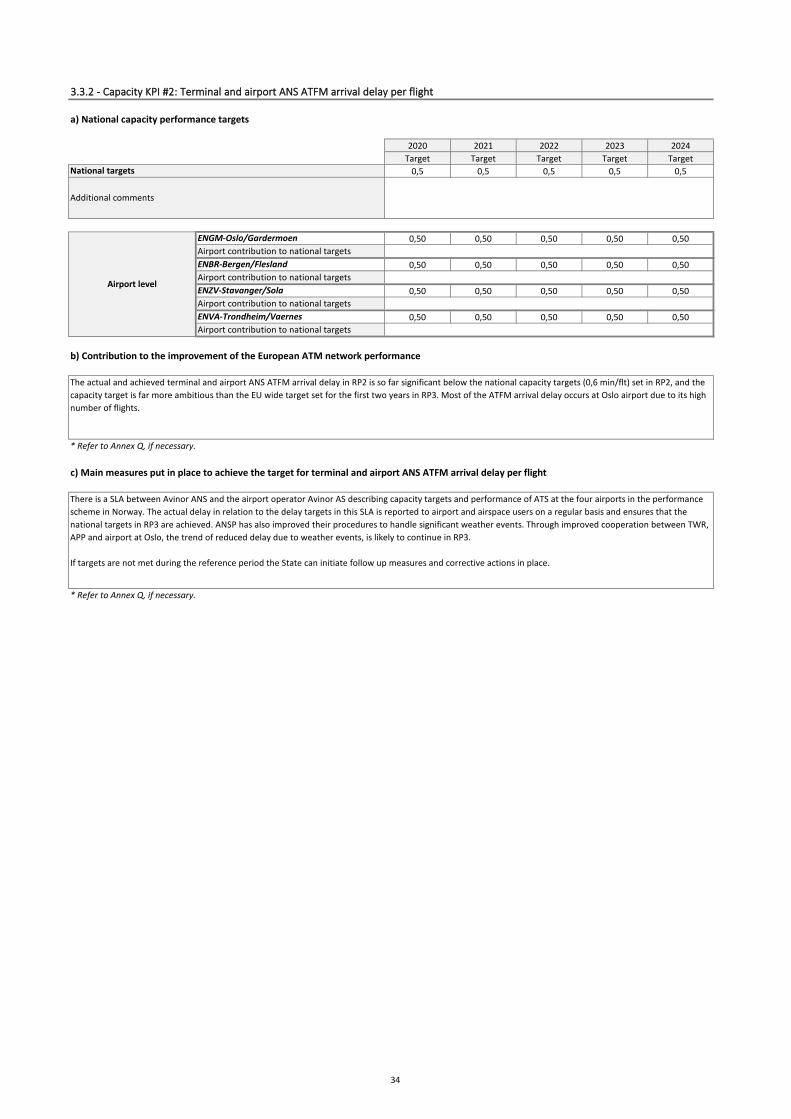
3.3.2 - Capacity KPI #2: Terminal and airport ANS ATFM arrival delay per flight
a) National capacity performance targets
2020 2021 2022 2023 2024
Target Target Target Target Target
0,5 0,5 0,5 0,5 0,5
0,50 0,50 0,50 0,50 0,50
0,50 0,50 0,50 0,50 0,50
0,50 0,50 0,50 0,50 0,50
0,50 0,50 0,50 0,50 0,50
b) Contribution to the improvement of the European ATM network performance
* Refer to Annex Q, if necessary.
c) Main measures put in place to achieve the target for terminal and airport ANS ATFM arrival delay per flight
* Refer to Annex Q, if necessary.
The actual and achieved terminal and airport ANS ATFM arrival delay in RP2 is so far significant below the national capacity targets (0,6 min/flt) set in RP2, and the
capacity target is far more ambitious than the EU wide target set for the first two years in RP3. Most of the ATFM arrival delay occurs at Oslo airport due to its high
number of flights.
There is a SLA between Avinor ANS and the airport operator Avinor AS describing capacity targets and performance of ATS at the four airports in the performance
scheme in Norway. The actual delay in relation to the delay targets in this SLA is reported to airport and airspace users on a regular basis and ensures that the
national targets in RP3 are achieved. ANSP has also improved their procedures to handle significant weather events. Through improved cooperation between TWR,
APP and airport at Oslo, the trend of reduced delay due to weather events, is likely to continue in RP3.
If targets are not met during the reference period the State can initiate follow up measures and corrective actions in place.
Airport level
ENGM-Oslo/Gardermoen
ENBR-Bergen/Flesland
ENZV-Stavanger/Sola
ENVA-Trondheim/Vaernes
National targets
Additional comments
Airport contribution to national targets
Airport contribution to national targets
Airport contribution to national targets
Airport contribution to national targets
34
3.4 - Cost efficiency targets
3.4.1 - Cost efficiency KPI #1: Determined unit cost (DUC) for en route ANS
En Route Charging Zone #x
3.4.2 - Cost efficiency KPI #2: Determined unit cost (DUC) for terminal ANS
Terminal Charging Zone #x
3.4.3 - Pension assumptions
3.4.3.1 Total pension costs
3.4.3.2 Assumptions for the "State" pension scheme
3.4.3.3 Assumptions for the occupational "Defined contributions" pension scheme
3.4.3.4 Assumptions for the occupational "Defined benefits" pension scheme
3.4.4 - Interest rate assumptions for loans financing the provision of air navigation services
3.4.5 - Restructuring costs
3.4.5.1 Restructuring costs from previous reference periods to be recovered in RP3
3.4.5.2 Restructuring costs planned for RP3
Annexes of relevance to this section
ANNEX A. REPORTING TABLES & ADDITIONAL INFORMATION (EN-ROUTE)
ANNEX B. REPORTING TABLES & ADDITIONAL INFORMATION (TERMINAL)
ANNEX F. BASELINE VALUES (COST-EFFICIENCY)
ANNEX H. RESTRUCTURING MEASURES AND COSTS
ANNEX M. COST ALLOCATION
ANNEX R. JUSTIFICATIONS FOR THE LOCAL COST-EFFICIENCY TARGETS
NOTE: The following requirements as per Annex II, 3.3 are addressed in the Annexes A and B:
SECTION 3.4: COST-EFFICIENCY KPA
a) Baseline value for the determined costs and the determined unit costs (in real terms and in national currency)
b) Cost-efficiency performance targets
c) Description and justification of the methodology used to estimate the baseline values
d) Justification for the level of the baseline value for the determined costs in comparison with the latest available actual costs
e) Description and justification of the consistency between local and Union-wide cost-efficiency targets
f) Main measures put in place to achieve the targets for determined unit cost (DUC) for en route ANS
a) Baseline value for the determined costs and the determined unit costs (in real terms and in national currency)
b) Cost-efficiency performance targets
c) Description and justification of the methodology used to estimate the baseline values
Point 3.3 (f) on assumptions for pension costs and interest on debt for other entities, inflation forecast and adjustments beyong IFRS;
Point 3.3 (g) on adjustments to the unit rates carried over from previous reference periods;
Point 3.3 (h) on costs exempt from cost-sharing;
Point 3.3 (k) reporting tables and additional informations.
d) Justification for the level of the baseline value for the determined costs in comparison with the latest available actual costs
e) Description and justification of the contribution of the the local targets to the performance of the European ATM network
f) Main measures put in place to achieve the targets for determined unit cost (DUC) for terminal ANS
Point 3.3 (d) on cost-allocation;
Point 3.3 (e) on the return on equity and cost of capital;
35

3.4 - Cost efficiency targets
3.4.1 - Cost efficiency KPI #1: Determined unit cost (DUC) for en route ANS
En Route Charging Zone #1 - Norway
a) Baseline value for the determined costs and the determined unit costs (in real terms and in national currency)
0 0 0 0
2019 baseline value for the determined costs (in real terms and in national currency) 1 146 806 907
2019 latest available service units forecast (actual route flown, see point 1.2 of Annex VIII) 2 427 000
2019 baseline value for the determined unit costs (in real terms and in national currency) 472,52
b) Cost-efficiency performance targets
En route charging zone Baseline 2014 Baseline 2019 RP3 Performance Plan (determined 2020-2024) CAGR CAGR
Name of the CZ 2014 B 2019 B 2020 D 2021 D 2022 D 2023 D 2024 D 2014A-2024D 2019B-2024D
Total en route costs in nominal terms (in national currency) 1 197 294 858 1 266 404 409 1 315 750 709 1 324 133 483 1 325 009 981
Total en route costs in real terms (in national currency at 2017 prices) 1 008 316 271 1 146 806 907 1 135 225 168 1 182 671 239 1 210 614 092 1 200 358 752 1 191 032 560 1,7% 0,8%
YoY variation -1,0% 4,2% 2,4% -0,8% -0,8%
Total en route Service Units (TSU) 2 220 734 2 427 000 2 462 000 2 484 000 2 519 000 2 549 000 2 583 000 1,5% 1,3%
YoY variation 1,4% 0,9% 1,4% 1,2% 1,3%
Real en route unit costs (in national currency at 2017 prices) 454,05 472,52 461,10 476,12 480,59 470,91 461,10 0,2% -0,5%
YoY variation -2,4% 3,3% 0,9% -2,0% -2,1%
Real en route unit costs (in EUR2017) 1 48,68 50,66 49,43 51,04 51,52 50,49 49,43 0,2% -0,5%
YoY variation -2,4% 3,3% 0,9% -2,0% -2,1%
National currency NOK1 Average exchange rate 2017 (1 EUR=) 9,32776
36

c) Description and justification of the methodology used to estimate the baseline values
* Refer to Annex F, if necessary.
d) Justification for the level of the baseline value for the determined costs in comparison with the latest available actual costs
* Refer to Annex F, if necessary.
Based on the latest cost forecast in origin by 1. June 2019, last adjusted in September, adding the additional costs, described in 3.4.1.d), in 2017-values.
The En Route service units is based on STATFOR base forecast from October 2019 for the period 2019-2024 using model 3, taking into consideration the ratios M3/M2 published by the CRCO for November 2017 to May 2019
Baseline costs 2019B and onwards have been adjusted with three different changes affecting the figures in the third reference period. These are described below in this section; the rationale behind, the change that has been made and
what implications this will have on the cost base in the third reference period. Cost detail for the adjustment of 2019B are provided in ANNEX F. BASELINE VALUES
First, baseline is adjusted with changes made in the cost base due to change an the internal allocation key for APP cost of combined towers (TWR/APP). An external audit (PWC) have been conducted to evaluate the allocation key in
respect of the RP3 Performance Plan which resulted in a recommedation for the new allocation key for combined towers. This changes the baseline cost of 19,8 MNOK (2019-prices). The previous allocation key was based on historical
data on time used in the different services (TWR/APP) in the combined towers. The new allocation key is based on the opening time on sectors in the combined towers.
Second, on basis of a public hearing note sent to the stakeholders in the spring of 2019, the Ministry of Transport proposes two possible changes in aviation charges. One of the changes affecting the performance area is moving costs
related to the approach services from the cost base for the terminal services, both covered by the performance and charging regulation (TNC - OSL/BGO/SVG/TRD) and from other airports outside the regulations, to the cost base for the
en-route services. The change is supposed to reduce the cost of Norwegian airports somewhat and increase the cost of flying in the upper airspace accordingly.
The rationale for the change is that, according to studies, Norway (Avinor ANS) allocates a lower proportion of the approach costs to the en route service than the majority of EU Member States.
The Ministry has ended up proposing a re-adjustment from APP 50/50 to APP 80/20 distribution, meaning 80 per cent to the cost base for the en-route services and 20 per cent to the cost base for the terminal services TNC
(OSL/BGO/SVG/TRD) and airports outside the regulations.
The proposal is based on a shift in the basis for allocation, from ATCO composite hours (50/50) to a distance based allocation key (80/20). CAA Norway considers that such a change is compatible with the wording of the Performance and
Charging Regulation. The basis for the proposed new calculation method is that the approach segment is provided at 80 km from the airport (average horizontal extent of the TMA). For larger/smaller TMAs, the distribution according to
this model would give slightly different distribution keys for the individual airports than 80/20, while the larger TMAs of course also weigh heavier than many of the smaller ones which also have significantly less traffic. The approach
segment is calculated from 5-80 km. Of the approach cost (15 km/75 km) 20% is considered allocated terminal ANS, while (60 km/75 km) 80% is considered allocated en-route ANS. On this basis we have concluded that the new APP
allocation key increases the baseline costs (2019B) of 128,3 MNOK (2019-prices).
Third, Avinor ANS provides en-route- and approach services for all military activity. Such costs, which among other incurred by separation of civilian/military traffic as a consequence of military activity in its own allocated areas, cf. the
FUA regulations, is today covered by Avinor AS through commercial income based on invoices from Avinor Flysikring AS (ANSP) according to the national regulations. The Ministry of Transport proposes these costs covered through the
en route cost base in RP3. On this basis we have concluded that costs derived from military activities increases the baseline costs (2019B) of 32,5 MNOK (2019-prices).
37
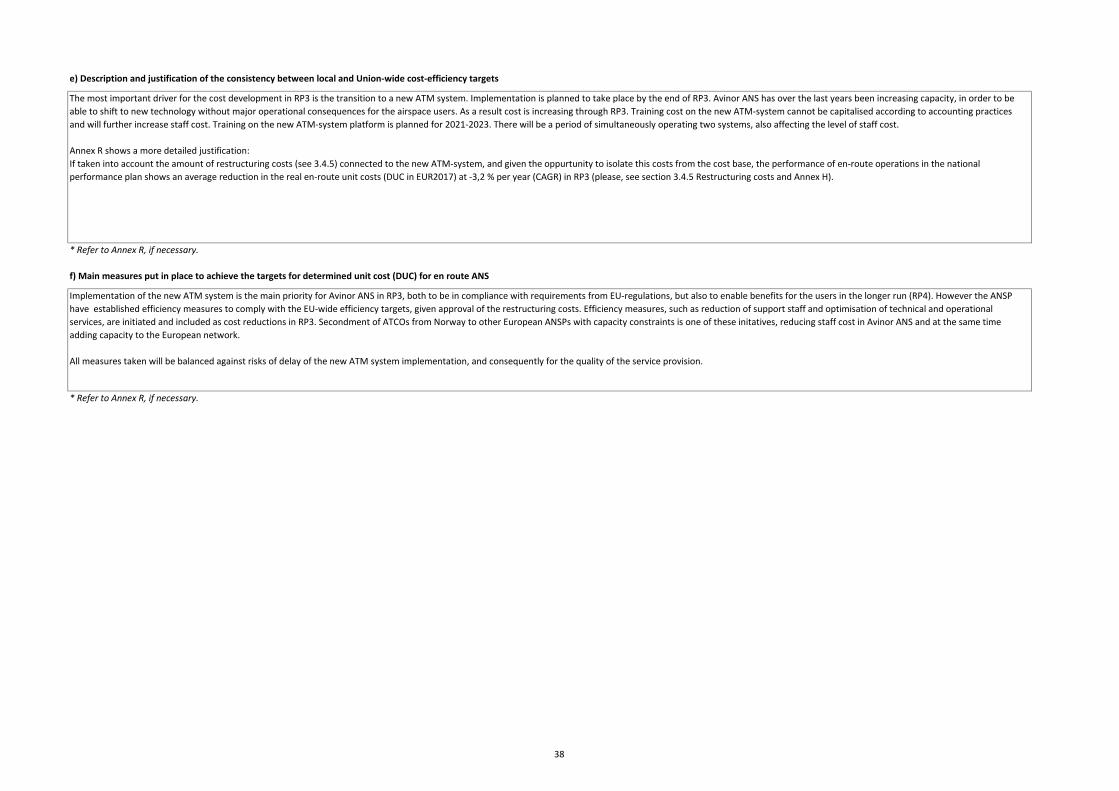
e) Description and justification of the consistency between local and Union-wide cost-efficiency targets
* Refer to Annex R, if necessary.
f) Main measures put in place to achieve the targets for determined unit cost (DUC) for en route ANS
* Refer to Annex R, if necessary.
The most important driver for the cost development in RP3 is the transition to a new ATM system. Implementation is planned to take place by the end of RP3. Avinor ANS has over the last years been increasing capacity, in order to be
able to shift to new technology without major operational consequences for the airspace users. As a result cost is increasing through RP3. Training cost on the new ATM-system cannot be capitalised according to accounting practices
and will further increase staff cost. Training on the new ATM-system platform is planned for 2021-2023. There will be a period of simultaneously operating two systems, also affecting the level of staff cost.
Annex R shows a more detailed justification:
If taken into account the amount of restructuring costs (see 3.4.5) connected to the new ATM-system, and given the oppurtunity to isolate this costs from the cost base, the performance of en-route operations in the national
performance plan shows an average reduction in the real en-route unit costs (DUC in EUR2017) at -3,2 % per year (CAGR) in RP3 (please, see section 3.4.5 Restructuring costs and Annex H).
Implementation of the new ATM system is the main priority for Avinor ANS in RP3, both to be in compliance with requirements from EU-regulations, but also to enable benefits for the users in the longer run (RP4). However the ANSP
have established efficiency measures to comply with the EU-wide efficiency targets, given approval of the restructuring costs. Efficiency measures, such as reduction of support staff and optimisation of technical and operational
services, are initiated and included as cost reductions in RP3. Secondment of ATCOs from Norway to other European ANSPs with capacity constraints is one of these initatives, reducing staff cost in Avinor ANS and at the same time
adding capacity to the European network.
All measures taken will be balanced against risks of delay of the new ATM system implementation, and consequently for the quality of the service provision.
38

3.4.2 - Cost efficiency KPI #2: Determined unit cost (DUC) for terminal ANS
Terminal Charging Zone #1 - Norway - TCZ
a) Baseline value for the determined costs and the determined unit costs (in real terms and in national currency)
0 0 0 0
2019 baseline value for the determined costs (in real terms and in national currency) 455 093 976
2019 latest available service units forecast 262 008
2019 baseline value for the determined unit costs (in real terms and in national currency) 1 736,95
b) Cost-efficiency performance targets
Terminal charging zone Baseline 2019 RP3 Performance Plan (determined 2020-2024) CAGR
Name of the CZ 2019 B 2020 D 2021 D 2022 D 2023 D 2024 D 2019B-2024D
Total terminal costs in nominal terms (in national currency) 432 865 128 443 973 323 454 899 130 471 521 651 513 576 677
Total terminal costs in real terms (in national currency at 2017 prices) 455 093 976 409 190 064 413 507 185 416 943 662 425 279 874 458 187 316 0,1%
YoY variation -10,1% 1,1% 0,8% 2,0% 7,7%
Total terminal Service Units (TNSU) 262 008 267 073 269 403 272 406 274 710 277 515 1,2%
YoY variation 1,9% 0,9% 1,1% 0,8% 1,0%
Real terminal unit costs (in national currency at 2017 prices) 1 736,95 1 532,13 1 534,90 1 530,60 1 548,11 1 651,04 -1,0%
YoY variation -11,8% 0,2% -0,3% 1,1% 6,6%
Real terminal unit costs (in EUR2017) 1 186,21 164,25 164,55 164,09 165,97 177,00 -1,0%
YoY variation -11,8% 0,2% -0,3% 1,1% 6,6%
National currency NOK1 Average exchange rate 2017 (1 EUR=) 9,33
c) Description and justification of the methodology used to estimate the baseline values
* Refer to Annex F, if necessary.
Based on the latest cost forecast in origin by 1. June 2019, last adjusted in September. The terminal service units are based on STATFOR base forecast from October 2019 for the period 2019-2024
including offshore traffic for the airports.
39

d) Justification for the level of the baseline value for the determined costs in comparison with the latest available actual costs
* Refer to Annex F, if necessary.
Baseline costs 2019B and onwards have been adjusted with two different changes affecting the figures in the third reference period. These are described below in this section, the rationale behind, the
change that has been made and which implications this will have on the cost base in the third reference period. Cost detail for the adjustment of 2019B are provided in ANNEX F. BASELINE VALUES
First, baseline is adjusted with changes made in the cost base due to change the internal allocation key for tower cost of combined towers (TWR/APP) from 60/40 to 50/50. External consultants (PWC)
have evaluated the allocation key in respect of the RP3 Performance Plan and concluded that the new allocation key for combined towers decreases the baseline cost for terminal services in the period
2019B-2024D. The previous allocation key was based on historical data on time used in the different services (TWR/APP) in the combined towers. The new allocation key is based on the opening time on
sectors in the combined towers.
Second, on basis of a public hearing note sent to the stakeholders in the spring of 2019, the Ministry of Transport proposes two possible changes in aviation charges. One of the changes affecting the
performance area is moving costs related to the approach services from the cost base for the terminal services, both covered by the performance and charging regulation (TNC - OSL/BGO/SVG/TRD) and
from other airports outside the regulations, to the cost base for the en-route services. The change is supposed to reduce the cost of Norwegian airports somewhat and increase the cost of flying in the
upper airspace accordingly.
The rationale for the change is that, according to studies, Norway (Avinor ANS) allocates a lower proportion of the approach costs to the en route service than the majority of EU Member States.
The Ministry has ended up proposing a re-adjustment from APP 50/50 to APP 80/20 distribution, meaning 80 per cent to the cost base for the en-route services and 20 per cent to the cost base for the
terminal services TNC (OSL/BGO/SVG/TRD) and airports outside the regulations.
The proposal is based on a shift in the basis for allocation, from ATCO composite hours (50/50) to a distance based allocation key (80/20). CAA Norway considers that such a change is compatible with the
wording of the Performance and Charging Regulation. The basis for the proposed new calculation method is that the approach segment is provided at 80 km from the airport (average horizontal extent of
the TMA). For larger/smaller TMAs, the distribution according to this model would give slightly different distribution keys for the individual airports than 80/20, while the larger TMAs of course also weigh
heavier than many of the smaller ones which also have significantly less traffic. The approach segment is calculated from 5-80 km. Of the approach cost (15 km/75 km) 20% is considered allocated
terminal ANS, while (60 km/75 km) 80% is considered allocated en-route ANS. On the basis we have concluded that the new APP allocation key increases the baseline costs (2019B) of 128,3 MNOK (2019-
prices).
In total this leads to;
- Værnes, 50% is allocated first to TNC, the remaining 50% is allocated 20% to TNC and 80% to ENR
- Bergen and Stavanger, 60% is still allocated to TWR and 40% to APP. Of these 40%, 20% are allocated to TNC and 80% to ENR
- Gardermoen TWR, 100% of TWR is allocated to TNC, since only TWR is delivered from Gardermoen. For 100% of the total cost of the Oslo APP, 20% is allocated to TNC and 80% to ENR
On the basis of the above described changes in the allocation keys the basline costs for terminal services is decreasing with 58,8 MNOK in 2019B (in real terms).
The average reduction in the real terminal unit costs (DUC in EUR2017) is -1,0% per year (CAGR) in RP3 (2019B-2024D).
40
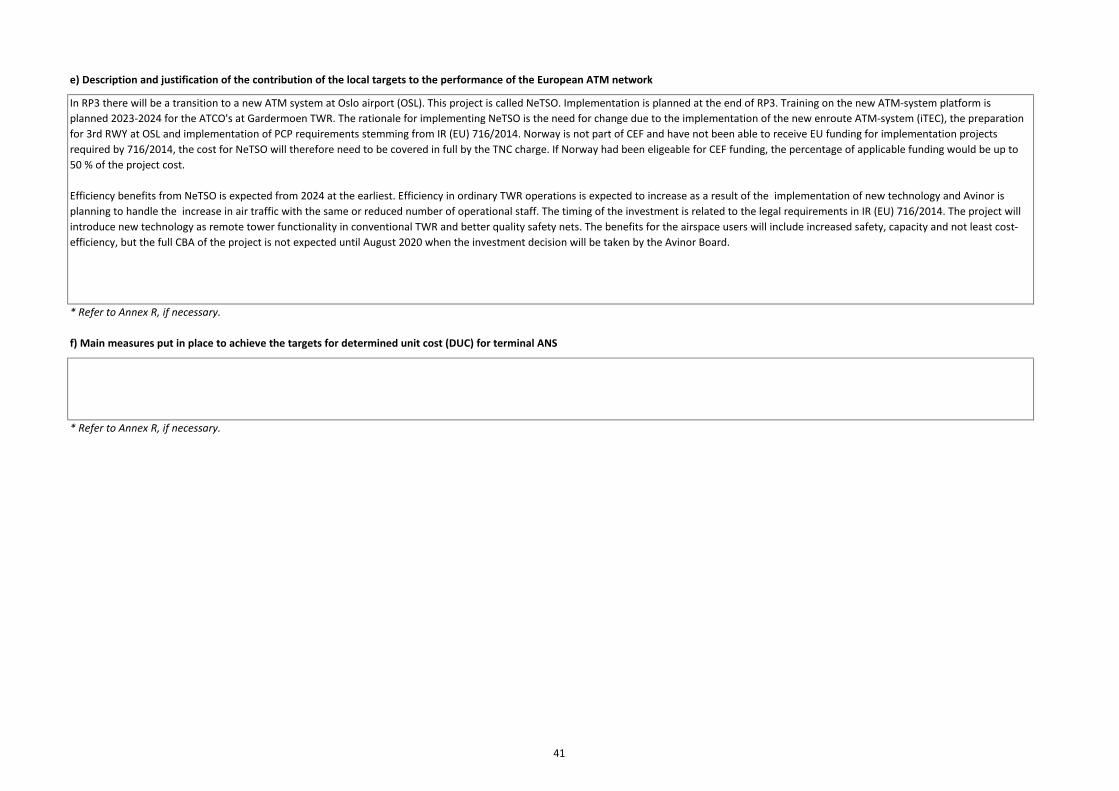
e) Description and justification of the contribution of the local targets to the performance of the European ATM network
* Refer to Annex R, if necessary.
f) Main measures put in place to achieve the targets for determined unit cost (DUC) for terminal ANS
* Refer to Annex R, if necessary.
In RP3 there will be a transition to a new ATM system at Oslo airport (OSL). This project is called NeTSO. Implementation is planned at the end of RP3. Training on the new ATM-system platform is
planned 2023-2024 for the ATCO's at Gardermoen TWR. The rationale for implementing NeTSO is the need for change due to the implementation of the new enroute ATM-system (iTEC), the preparation
for 3rd RWY at OSL and implementation of PCP requirements stemming from IR (EU) 716/2014. Norway is not part of CEF and have not been able to receive EU funding for implementation projects
required by 716/2014, the cost for NeTSO will therefore need to be covered in full by the TNC charge. If Norway had been eligeable for CEF funding, the percentage of applicable funding would be up to
50 % of the project cost.
Efficiency benefits from NeTSO is expected from 2024 at the earliest. Efficiency in ordinary TWR operations is expected to increase as a result of the implementation of new technology and Avinor is
planning to handle the increase in air traffic with the same or reduced number of operational staff. The timing of the investment is related to the legal requirements in IR (EU) 716/2014. The project will
introduce new technology as remote tower functionality in conventional TWR and better quality safety nets. The benefits for the airspace users will include increased safety, capacity and not least cost-
efficiency, but the full CBA of the project is not expected until August 2020 when the investment decision will be taken by the Avinor Board.
41

3.4.3 - Pension assumptions
3.4.3.1 Total pension costs (in nominal terms in '000 national currency)
2020D 2021D 2022D 2023D 2024D
220 178 223 930 227 728 231 573 235 724
En-route activity 105 508 107 306 109 126 110 968 112 958
Terminal activity 49 650 50 496 51 353 52 220 53 156
65 020 66 128 67 249 68 385 69 611
3.4.3.2 Assumptions for the "State" pension scheme (in nominal terms in '000 national currency)
2020D 2021D 2022D 2023D 2024D
3.4.3.3 Assumptions for the occupational "Defined contributions" pension scheme (in nominal terms in '000 national currency)
2020D 2021D 2022D 2023D 2024D
700 841 720 114 739 917 760 265 781 172
122 845 126 223 129 694 133 261 136 925
778 778 778 778 778
Other activities
Pension costs
Description of the assumptions underlying the calculations of pension costs comprised in the determined costs
In determined cost this allocation key for En-Route activity is estimated to 47,9%, which is the total number of employees contributint to the En-Route services
in percentage of total employees in Avinor ANS. The allocation key for Terminal activity in Avinor ANS is 22,3%, based on the same assumptions.
Total pension costs
Description of the assumptions underlying the calculations of pension costs comprised in the determined costs
The payroll tax is calculated as a flat rate on the Calculation base, with 14,1 %, and is therefore variable with the level of personnel cost. The calculation base is
salaries and other benefits, contribution to employer pension plans and refunds of sick pay.
Avinor Flysikring AS (Avinor ANS)
Number of employees the employer contributes for in this scheme
The payroll tax is a fixed rate, which is determined by the Norwegian Parliament on a yearly basis. Historically the rate is rarely subject to significant changes.
Employer % contribution rate to this scheme
Total pension costs in respect of this scheme
<Staff category name>
Total pensionable payroll to which this scheme applies
Number of employees the employer contributes for in this scheme
Description on the relevant national pension regulations and pension accounting regulations on which the assumptions are based, as well as information
whether changes of those regulations are to be expected during RP3
Description on the relevant national pension regulations and pension accounting regulations on which the assumptions are based, as well as information
whether changes of those regulations are to be expected during RP3
All Norwegian Citizens are members of the National Insurance Scheme and entitled to withdraw a retirement pension after the age of 62. The retirement
pension is funded through the National Insurance scheme. Employers are obligated to contribute to the National Insurance scheme through a payroll tax based
on as percentage of personnel cost. The percentage is differentiated based on geographical criteria. For Avinor Flysikring AS the rate is at present 14,1 %.
SelectAre there different contribution rates for different staff categories? If yes, how many?
Are there different contribution rates for different staff categories? If yes, how many? No
<Staff category name>
Total pensionable payroll to which this scheme applies
Employer % contribution rate to this scheme
Total pension costs in respect of this scheme
Describe the actions taken ex-ante to manage the cost-risk (cost increase) associated with this item, as well as the actions taken to limit the impact of the
unforeseen change on the costs to be passed on to airspace users
Describe the actions taken ex-ante to manage the cost-risk (cost increase) associated with this item, as well as the actions taken to limit the impact of the
unforeseen change on the costs to be passed on to airspace users
This defined contribution pension plan is based on fixed rates and is therefore more predictable than the defined benefit plan.
As per 01.01.2019 all employees under the age of 53 years have been transferred to the new defined contribution plan. The pension plan is financed with 7 %
premium on pensionable salary between 0 and 7,1 G (G: Public pension base rate), and 20 % on pensionable salary between 7,1 and 12 G. The employees
contributes 1,5% of the premium. For employees over the age limit for automatic transferal to the defined contribution plan, a process based on voluntary
transferal is to be carried out in 2019. All new employees from 01.01.19 will be included in the defined contribution plan, as the defined benefit plan is closed for
new members. The Group will also, as from 1 January 2019, be affiliated with the private early retirement scheme (AFP) for employees that have transitioned to
the new pension scheme. This scheme is funded and expensed through yearly premiums – at present 2,5% of pensionable income.
42

3.4.3.4 Assumptions for the occupational "Defined benefits" pension scheme (in nominal terms in '000 national currency)
2020D 2021D 2022D 2023D 2024D
241 333 247 970 254 789 261 796 268 995
0 0 0 0 0
97 333 97 707 98 034 98 312 98 799
269 269 269 269 269
Description of the assumptions underlying the calculations of pension costs comprised in the determined costs
In determined cost this allocation key for En-Route activity is estimated to 47,9%, which is the total number of employees contributing to the En-Route services
in percentage of total employees in Avinor ANS. The allocation key for Terminal activity in Avinor ANS is 22,3%, based on the same assumptions.
As a consequence of the volatility of the pension costs, the pension defined pension plan is closed effectively for new members as of 01.01.19. All employees not
turned 53 years before the aforementioned date have been transferred to the new defined contribution plan.
Is the occupational "Defined benefits" pension scheme funded? No
Does the ANSP assume liability for meeting future obligations for the occupational "Defined benefits" scheme? Yes
Describe the actions taken ex-ante to manage the cost-risk (cost increase) associated with this item, as well as the actions taken to limit the impact of the
unforeseen change on the costs to be passed on to airspace users
Where, in the Reporting Tables, some occupational "defined benefits" costs (e.g. interest expense related to pensions) are reported in other cost item(s) than
staff costs, the cost item(s) should be indicated here below along with corresponding explanations.
The interest expenses related to pensions are reported as staff costs.
Description on the relevant national pension regulations and pension accounting regulations on which the assumptions are based, as well as information
whether changes of those regulations are to be expected during RP3
Total pensionable payroll to which this scheme applies
Employer % contribution rate to this scheme
Total pension costs in respect of this scheme
Number of employees the employer contributes for in this scheme
The defined benefit scheme is closed for new members. As of 01.01.19, all personnel not 53 years or more, have been transferred to the defined contribution
plan. The defined benefit plan is managed by Statens Pensjonskasse (the Norwegian Public Service Pension Fund/SPK) and is part of the public occupational
pension scheme . The pension plan defines an amount of pension the employee will receive on retirement, dependent on factors such as years of service and
compensation. The pension plan includes pension benefits in accordance with the act relating to the Norwegian Public Service Fund (SPK). This includes special-
age pensions and an early retirement scheme.
For those who have left the defined benefit scheme, a new scheme has been established relating to special-age pensions.
A new Act on public occupational pension schemes will come into force from 2020. In addition, new regulations have been adopted for the coordination of
public occupational pension schemes and the National Insurance Scheme. This will have effect on the accounts for 2019.
43
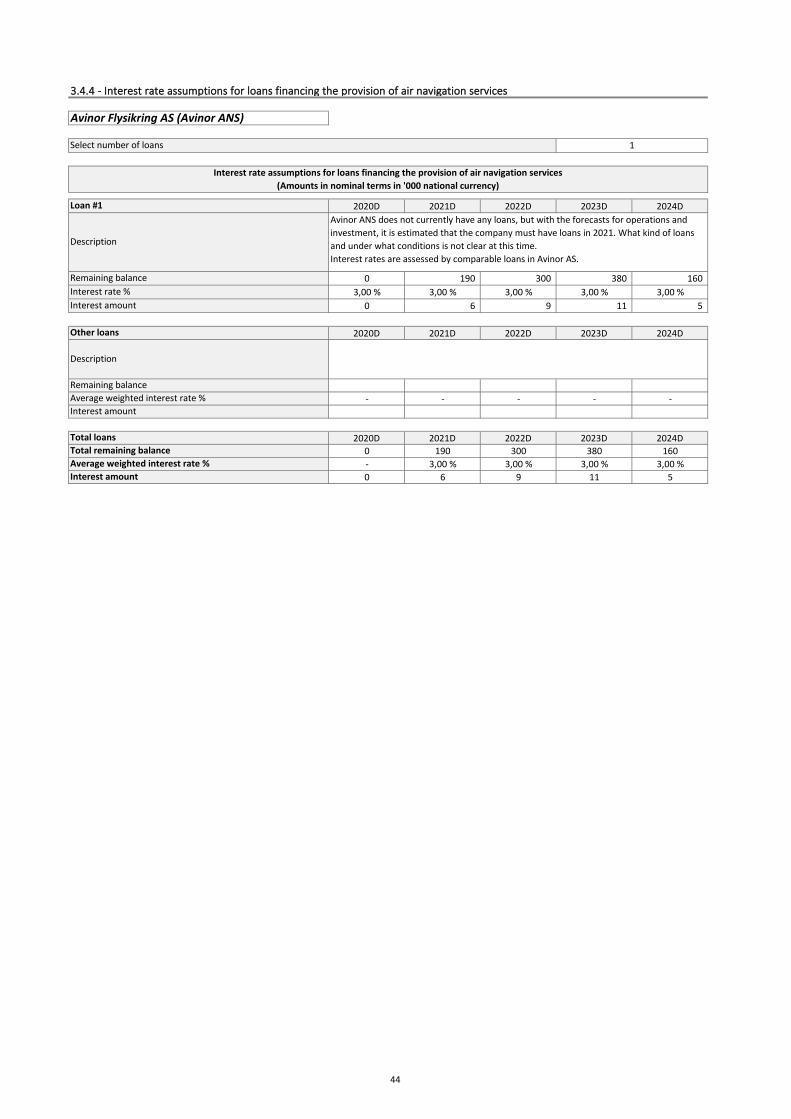
3.4.4 - Interest rate assumptions for loans financing the provision of air navigation services
2020D 2021D 2022D 2023D 2024D
0 190 300 380 160
3,00 % 3,00 % 3,00 % 3,00 % 3,00 %
0 6 9 11 5
2020D 2021D 2022D 2023D 2024D
- - - - -
2020D 2021D 2022D 2023D 2024D
0 190 300 380 160
- 3,00 % 3,00 % 3,00 % 3,00 %
0 6 9 11 5
Interest amount
Avinor Flysikring AS (Avinor ANS)
Select number of loans 1
Loan #1
Remaining balance
Interest rate %
Interest rate assumptions for loans financing the provision of air navigation services
(Amounts in nominal terms in '000 national currency)
Description
Avinor ANS does not currently have any loans, but with the forecasts for operations and
investment, it is estimated that the company must have loans in 2021. What kind of loans
and under what conditions is not clear at this time.
Interest rates are assessed by comparable loans in Avinor AS.
Total remaining balance
Average weighted interest rate %
Interest amount
Total loans
Other loans
Description
Remaining balance
Average weighted interest rate %
Interest amount
44

3.4.5 - Restructuring costs
3.4.5.1 Restructuring costs from previous reference periods to be recovered in RP3
3.4.5.2 Restructuring costs planned for RP3
a) Overall description of the restructuring measures planned for RP3
b) Detailed information on the restructuring measures planned for RP3
2020D 2021D 2022D 2023D 2024D
69 115 735 91 737 318 112 926 875 122 497 153 179 601 109
2020D 2021D 2022D 2023D 2024D
69 115 735 91 737 318 112 926 875 122 497 153 179 601 109
Restructuring costs foreseen for RP3? Yes
If yes, number of charging zones concerned 1
The most important driver for the cost development in RP3 is the transition to a new ATM system. Implementation is planned by the end of RP3. Avinor ANS has
over the last years been increasing capacity, in order to being able to shift to new technology without major operational consequences for the airspace users. As a
result cost is increasing through RP3. Training cost on the new ATM-system cannot be capitalised according to accounting practices and will further increase staff
cost. Training on the new ATM-system platform is planned 2021-2023. There will be a period of simultaneously operating two systems, also affecting the level of
staff cost.
Cost related to the implementation of the new ATM-system is by Avinor ANS considered to be restructuring cost, as defined in Annex iv to regulation 2019/317.
Efficiency benefits from the new ATM-system is expected from the end of RP3 at the earliest. Productivity in ordinary operations is expected to increase further
through RP3, as Avinor ANS is planning to handle the expected increase in traffic with the same number of operational staff.
NoRestructuring costs from previous reference periods approved by the European Commission?
Total restructuring costs by measures
Avinor Flysikring AS (Avinor ANS)
Description and justification of the restructuring measure
Demonstration that the restructuring measure will deliver a net financial benefit to airspace users at the latest in the next reference period
1Number of restructuring measures
Measure #1
Associated restructuring costs
45
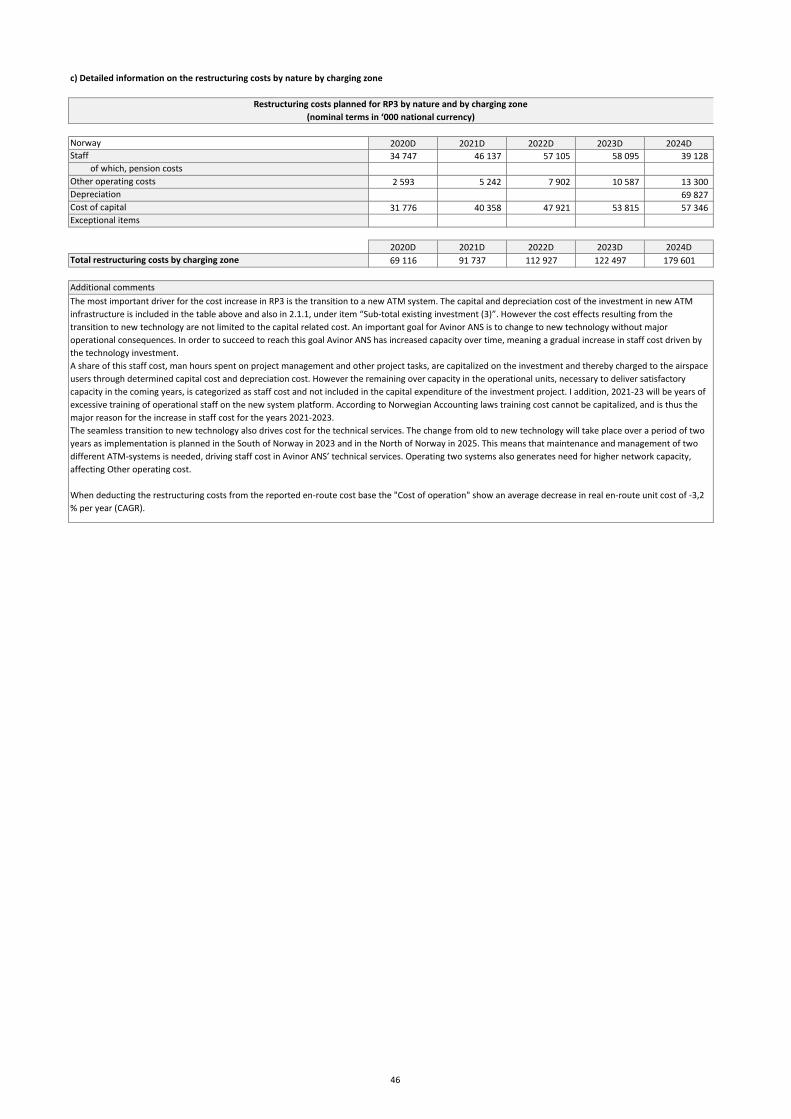
c) Detailed information on the restructuring costs by nature by charging zone
2020D 2021D 2022D 2023D 2024D
34 747 46 137 57 105 58 095 39 128
2 593 5 242 7 902 10 587 13 300
69 827
31 776 40 358 47 921 53 815 57 346
2020D 2021D 2022D 2023D 2024D
69 116 91 737 112 927 122 497 179 601
Restructuring costs planned for RP3 by nature and by charging zone
(nominal terms in ‘000 national currency)
Norway
Staff
of which, pension costs
Other operating costs
Depreciation
Cost of capital
Exceptional items
Additional comments
The most important driver for the cost increase in RP3 is the transition to a new ATM system. The capital and depreciation cost of the investment in new ATM
infrastructure is included in the table above and also in 2.1.1, under item “Sub-total existing investment (3)”. However the cost effects resulting from the
transition to new technology are not limited to the capital related cost. An important goal for Avinor ANS is to change to new technology without major
operational consequences. In order to succeed to reach this goal Avinor ANS has increased capacity over time, meaning a gradual increase in staff cost driven by
the technology investment.
A share of this staff cost, man hours spent on project management and other project tasks, are capitalized on the investment and thereby charged to the airspace
users through determined capital cost and depreciation cost. However the remaining over capacity in the operational units, necessary to deliver satisfactory
capacity in the coming years, is categorized as staff cost and not included in the capital expenditure of the investment project. I addition, 2021-23 will be years of
excessive training of operational staff on the new system platform. According to Norwegian Accounting laws training cost cannot be capitalized, and is thus the
major reason for the increase in staff cost for the years 2021-2023.
The seamless transition to new technology also drives cost for the technical services. The change from old to new technology will take place over a period of two
years as implementation is planned in the South of Norway in 2023 and in the North of Norway in 2025. This means that maintenance and management of two
different ATM-systems is needed, driving staff cost in Avinor ANS’ technical services. Operating two systems also generates need for higher network capacity,
affecting Other operating cost.
When deducting the restructuring costs from the reported en-route cost base the "Cost of operation" show an average decrease in real en-route unit cost of -3,2
% per year (CAGR).
Total restructuring costs by charging zone
46

3.5 Additional KPIs / Targets
Annexes of relevance to this section
ANNEX J. OPTIONAL KPIs AND TARGETS
SECTION 3.5: ADDITIONAL KPIS / TARGETS
47

3.6 - Description of KPAs interdependencies and trade-offs including the assumptions used to assess those trade-offs
3.6.1 - Interdependencies and trade-offs between safety and other KPAs
3.6.2 - Interdependencies and trade-offs between capacity and environment
3.6.3 - Interdependencies and trade-offs between cost-efficiency and capacity
3.6.4 - Other interdependencies and trade-offs
SECTION 3.6: DESCRIPTION OF KPAS INTERDEPENDENCIES AND TRADE-OFFS INCLUDING THE
ASSUMPTIONS USED TO ASSESS THOSE TRADE-OFFS
48

3.6 - Description of KPAs interdependencies and trade-offs including the assumptions used to assess those trade-
offs
3.6.1 - Interdependencies and trade-offs between safety and other KPAs
a) Do the measures to reach the targets in the different KPAs require changes in the ANSP functional system that have safety implications? If
yes, which mitigation measures are put in place?
Measures to reach the targets in the different KPAs requires no changes in the ANSP functional system that have safety implications.
b) What are the main assumptions used to assess the interdependencies between safety and other KPAs?
There are not established any additional indicators for this purpose
c) What metrics, other than those indicators described in the Regulation, are you monitoring during RP3 to ensure targets in the KPAs of
capacity , environment, and cost-efficiency are not degrading safety?
There are not established any additional indicators for this purpose
d) Do targets allow trade-offs in operational decision making to managing resource shortfalls in order to preserve safety performance? Do
targets restrict the release of staff for safety activities, such as training?
First question: Yes, second question: No
e) Has the State reviewed the ANSP financial and personnel resources that are needed to support safe ATC service provision through safety
promotion, safety improvement, safety assurance and safety risk management after changes introduced to achieve targets in other KPAs?
Please, explain.
Yes, ref. section 4.3 - Change management
3.6.2 - Interdependencies and trade-offs between capacity and environment
N/A
3.6.3 - Interdependencies and trade-offs between cost-efficiency and capacity
Feedback from the operators based on consultations has been that an en route capacity level as proposed by NM is unacceptable. On this basis
more capacity could be provided given that a surplus of ATCOs is maintained during the implementation phase of the new ATM-system.
3.6.4 - Other interdependencies and trade-offs
N/A
49

4.1 - Cross-border initiatives and synergies
4.1.1 - Planned or implemented cross-border initiatives at the level of ANSPs
4.1.2 - Investment synergies achieved at FAB level or through other cross-border initiatives
4.2 - Deployment of SESAR Common Projects
4.3 - Change management
Annexes of relevance to this section
ANNEX N. CROSS-BORDER INITIATIVES
SECTION 4: CROSS-BORDER INITIATIVES AND SESAR IMPLEMENTATION
50

4.1.1 - Planned or implemented cross-border initiatives at the level of ANSPs
Number of cross-border initiatives 6
Name Kirkenes TMA
DescriptionKirkenes TMA West and Centre are within Finnish airspace, but controlled by Kirkenes TWR/APP.
Expected performance benefitsAll approach procedures are now within controlled airspace, which ensures and increases the level of safety
for all flights in and out of Kirkenes airport.
Name North Sea Helicopters - Scottish FIR
Description
The provision of ATS in a defined area in Scottish FIR has been delegated to Avinor ANS. The purpose is to
reduce the need for frequency changes for helicopters on their way to and from oil/gas platforms inside that
area.
Expected performance benefits
Name North Sea Helicopters - Norway FIR
Description
The provision of ATS in a defined area in Norway FIR has been delegated to NATS. The purpose is to reduce
the need for frequency changes for helicopters on their way to and from oil/gas platforms inside that area.
Expected performance benefits
Name Sweden FIR/Norway FIR
Description
The provision of ATS in several defined areas along the border of Norway FIR and Sweden FIR, have been
delegated to either LFV or Avinor ANS. The purpose is to reduce the need for frequency changes for flights
north to south or vice versa within those defined areas.
Expected performance benefits
Name Finland FIR/Norway FIR
Description
The provision of ATS in two areas (Halti and Manto) in the northern part om Finland FIR has been delegated
to Avinor ANS. The purpose is to reduce the need for frequency changes for flights crossing the border for
short periods of the flight.
Expected performance benefits
Name Free Route Airspace
DescriptionAvinor ANS has implemented cross border free route airspace within NEFAB and NUAC. The purpose is to
provide shortest possible trajectories to all flights within the area.
Expected performance benefits
4.1.2 - Investment synergies achieved at FAB level or through other cross-border initiatives
4.1 - Cross-border initiatives and synergies
Initiative #1
Initiative #2
Initiative #3
Initiative #4
Initiative #5
Initiative #6
Avinor ANS procured, financed and established a radar nearby Kirkenes airport in Northern Norway. Surveillence information from that radar is made
available for ANS Finland free of charge.
Details of synergies in terms of common infrastructure and common procurement
Additional comments
51

PCP ATM Functionality (AF) / Sub
functionality (s-AF)Recent and expected progress
Oslo GardermoenBasic AMAN and AMAN Horizon extension into remote upstream - Oslo, Stavanger and Bodo ACCs is
implemented. No plans for implementation towards Stockholm ACC and Copenhagen ACC yet.
Oslo Gardermoen Implemented.
Oslo GardermoenPre-requisites except initial AOP are implemented. A possibility study for implementation of DMAN is in
progress.
Oslo Gardermoen ASMGCS level 2 is implemented. No DMAN available yet.
Oslo Gardermoen TBS functionality closely linked with new iTec system
Oslo Gardermoen Planned implemented in new TWR ATM-system at Oslo. Project is called NeTSO.
Oslo Gardermoen Planned implemented in new TWR ATM-system at Oslo. Project is called NeTSO.
s-AF3.1 Airspace management and
advanced flexible use of airspace
Status: "Planned" (with new ATM system - 20.04.2023) respectively "Already implemented".
LARA is in use, but not integrated to NM B2B. Dynamic airspace configurations will be handled through
iTEC Airspace Capacity Management tool (iACM).
s-AF3.2 Free route
Status: "Already implemented".
Cross border FRA is already supported, but capabilities will be enhanced when the new ATM system is
in service by 20.04.2023.
s-AF4.1 Enhanced short-term
ATFCM measures
Status: STAM phase 1 Not Applicable, STAM phase 2 "Planned".
Considering NM platform or alternatively iTEC iACM (see s-AF 3.1) for this purpose.
s-AF4.2 Collaborative NOP
Status: "Planned" for all capabilities except the AOP/NOP information sharing ("No plan"), pending an
initiative from customer Avinor AS (Oslo Airport).
s-AF4.3 Calculated take-offtTime to
target times for ATFCM purposes
The requirements under 4.3.1 are N/A (as they apply to NM and AU).
For 4.3.2 the Avinor ANS status is "No plan" as no industrialized SESAR solution is known at this time.
s-AF4.4 Automated support for
traffic complexity assessment
Status: "Planned".
NM solutions only or alternatively local deployment of the common iTEC Airspace Capacity
Management (iACM) tool is under consideration.
s-AF5.1 Common infrastructure
components
PENS 1 already implemented.
NewPENS integration is "In Progress", milestones 1, 2 and 3 (ref SDM Monitoring Exercise) have been
completed.
s-AF5.2 SWIM technical
infrastructure and profiles
Status: "No plan".
No formal start of transformation at this time (June 2019), only prestudies, competence building and
talks to industrial players.
s-AF5.3 Aeronautical information
exchange
Status: "No plan".
No formal start of transformation at this time (June 2019). It should be noted that Avinor AS, the
mother company of Avinor ANS, is the owner of the technical capabilities, which are under upgrade
due to the PCP and the ADQ IR.
s-AF5.4 Meteorological information
exchange
Status: "No plan".
No formal start of transformation at this time (June 2019). Talks to the Norwegian designated MET
provider on future SWIM based integration will be initiated this fall.
s-AF5.5 Cooperative network
information exchange
Status: "No plan".
No formal start of transformation at this time (June 2019).
s-AF5.5.6 Flight information
exchange
Status: "No plan".
Avinor ANS will industrialize the required capabilities through the iTEC collaboration and deploy
according to the updated European roadmap (being part of Cluster #3).
AF6 - Initial Trajectory Information
Sharing
General status: "Planned".
ATN B1 based services will be provided in conjunction with the new ATM system starting service
(20.04.2023). Network and A/G services will be tendered and contracted within 2019. Such service level
agreement with a CSP will also cater for Multi Frequency support.
AF5 - Initial SWIM
4.2 - Deployment of SESAR Common Projects
AF3 - Flexible Airspace Management and Free Route
AF4 - Network Collaborative Management
AF1 - Extended AMAN and PBN in high density TMA
s-AF1.1 AMAN extended to en-route airspace
s-AF1.2 Enhanced TMA using RNP-based operations
AF2 - Airport Integration and Throughput
s-AF2.1 DMAN synchronised with predeparture sequencing
s-AF2.2 DMAN integrating surface management constraints
s-AF2.3 Time-based separation for final approach
s-AF2.4 Automated assistance to controller for surface movement planning and routing
s-AF2.5 Airport safety nets
52
4.3 - Change management
Change management practices and transition plans for the entry into service of major airspace changes or for ATM system improvements, aimed
at minimising any negative impact on the network performance
State level:
As the Competent Authority, the Norwegian Civil Aviation Authority is obliged to supervise safety-related changes to functional systems that are
planned for ATM systems as defined in Article 9 of Regulation (EC) 1034/2011 and from 2. January 2020 (EC) 2017/373.
Major Airspace Changes are in addition required to be notified in accordance with a process described in national regulation BSL G 4-1.
CAA has approved the ANSPs change management procedures and they are required to notify all planned safety related changes to the CAA-
Norway a minimum of 4 weeks before entry into service. Major Airspace Changes are required to be notified as soon as they have been formally
decided by the ANSP management. Received notification regarding planned safety-related changes to ATM functional systems as well as Major
Airspace Changes are assessed and reviewed in accordance with CAA-Norway’s change management procedures, developed in accordance with
regulation requirements and Eurocontrol GM/EASA AMC and GM.
System interoperability requirements are set out in Regulation (EC) 552/2004. Received interoperability documentation associated with planned
safety-related functional changes are assessed in accordance with CAA-Norway’s procedures, working methods and national/international
regulations.
ANSP level:
Planned implementation of new ATM-system in 2023-2025 based on the iTEC alliance. High level transition concept in place. Human change
management activities, training program and all associated transition activities are planned in close collaboration between the system integration
project and the operational environment. All plans are designed to minimize any negative effect on the network performance, and will be closely
coordinated with the Network Manager in due time before finalized.
53

5.1 - Traffic risk sharing parameters
5.1.1 Traffic risk sharing - En route charging zones
5.1.2 Traffic risk sharing - Terminal charging zones
5.2 - Capacity incentive schemes
5.2.1 - Capacity incentive scheme - Enroute
5.2.1.1 Parameters for the calculation of financial advantages or disadvantages - Enroute
5.2.1.2 Rationale and justification - Enroute
5.2.2 - Capacity incentive scheme - Terminal
5.2.2.1 Parameters for the calculation of financial advantages or disadvantages - Terminal
5.2.2.2 Rationale and justification - Terminal
5.3 - Optional incentives
Annexes of relevance to this section
ANNEX G. PARAMETERS FOR THE TRAFFIC RISK SHARING
ANNEX I. PARAMETERS FOR THE MANDATORY CAPACITY INCENTIVES
ANNEX K. OPTIONAL INCENTIVE SCHEMES
SECTION 5: TRAFFIC RISK SHARING ARRANGEMENTS AND INCENTIVE SCHEMES
54

5.1 - Traffic risk sharing
5.1.1 Traffic risk sharing - En route charging zones
Norway no
Dead band Risk sharing band% loss to be
recovered
Max. charged if
SUs 10% < plan
% additional
revenue returned
Min. returned if
SUs 10% > plan
Standard parameters ±2,00% ±10,0% 70,0% 5,6% 70,0% 5,6%
5.1.2 Traffic risk sharing - Terminal charging zones
Norway - TCZ no
Dead band Risk sharing band% loss to be
recovered
Max. charged if
SUs 10% < plan
% additional
revenue returned
Min. returned if
SUs 10% > plan
Standard parameters ±2,00% ±10,0% 70,0% 5,6% 70,0% 5,6%
Traffic risk-sharing parameters adapted?
Traffic risk-sharing parameters adapted?
Service units lower than plan Service units higher than plan
Service units lower than plan Service units higher than plan
55

5.2.1 - Capacity incentive scheme - Enroute
5.2.1.1 Parameters for the calculation of financial advantages or disadvantages - Enroute
Enroute Expressed in
fraction of min
% of DC
% of DC
fixed
2020 2021 2022 2023 2024
0,18 0,16 0,13 0,11 0,11
±0,050 ±0,050 ±0,050 ±0,050 ±0,050
0,18 0,16 0,13 0,11 0,11
0,08 0,08 0,08 0,08 0,08
[0,05-0,11] [0,05-0,11] [0,05-0,11] [0,05-0,11] [0,05-0,11]
[0,03-0,05] [0,03-0,05] [0,03-0,05] [0,03-0,05] [0,03-0,05]
[0,11-0,13] [0,11-0,13] [0,11-0,13] [0,11-0,13] [0,11-0,13]
5.2.1.2 Rationale and justification - Enroute
** Refer to Annex I, if necessary.
5.2 - Capacity incentive schemes
Avinor Flysikring AS (Avinor ANS)
NOP reference values (mins of ATFM delay per flight)
Performance Plan targets (mins of ATFM delay per flight)
Bonus range
Value
±0,030 min
0,00 %
2,00 %
Dead band Δ
Max bonus (≤2%)
Max penalty (≥ Max bonus)
The pivot values for RP3 are
Pivot values for RP3 (mins of ATFM delay per flight)
Alert threshold (Δ Ref. value in fraction of min)
If the pivot values are different that the values in the NOP, explain rationale for the difference and method of calculation**
Financial advantages / disadvantages
Dead band range
Penalty range
The cost optimum capacity for en route delay per flight for the ANSP is between 0,18 min/flt. and 0,11 min/flt., but for the airspace users this would be unacceptable. This view is
based on the fact that a large portion of the overall traffic is transition flights with little leeway in terms of delays. Based on consultation meetings with the airspace users and the
ANSP during spring 2019 the en route delay is set to 0,08 min./flt. for each year in RP3.
This incentive scheme has been set to encourage the ANSP to perform on targets in the area of capacity no more no less, while at the same time a less demanding capacity target
than achieved in RP2 has a positive impact in the area of cost-efficiency.
Avinor ANS starting point is to deliver the capacity that ensures continuity of traffic without significant interruptions. This entails an incentive system that is primarily intended to
secure a resource allocation that takes care of this, ie that it must have an economic impact for the ANSP if they do not deliver the agreed capacity. Based on the experience from
RP2 it is our view that under normal operational circumstances, the target (0,08 min/flt) should be well achievable without significant effort.
On the basis of feedback from airspace users, it is also our opinion that the additional costs of delay beyond the threshold value (pivot) are far higher in a global perspective than
the savings of providing a significant overcapacity. We have therefore considered an incentive scheme in the third reference period that does not provide any bonus for delivering
overcapacity beyond the target (pivot value), while in case of delay beyond the target (pivot including a dead band), a balanced penalty of 2 per cent of the traffic revenues is
allocated the airspace users latest within year n + 2 .
+0,00% Max. Bonus
-2,00% Max. Penalty
0,1300,030 0,050 0,110
Pivot: 0,080
y = -1x+0,11
y = 0x+0
→ Dead band ←
Δ of determined costs in year 2020
Enroute ATFM
Application of the en route incentive scheme in year 2020(before any revision of the NOP reference values)
56

5.2.2 - Capacity incentive scheme - Terminal
5.2.2.1 Parameters for the calculation of financial advantages or disadvantages - Terminal
Terminal Expressed in
fraction of min
%
% of DC
% of DC
modulated
2020 2021 2022 2023 2024
0,5 0,5 0,5 0,5 0,5
±0,040 ±0,040 ±0,040 ±0,040 ±0,040
0,08 0,08 0,08 0,08 0,08
[0,05-0,11] [0,05-0,11] [0,05-0,11] [0,05-0,11] [0,05-0,11]
[0,04-0,05] [0,04-0,05] [0,04-0,05] [0,04-0,05] [0,04-0,05]
[0,11-0,12] [0,11-0,12] [0,11-0,12] [0,11-0,12] [0,11-0,12]
5.2.2.2 Rationale and justification - Terminal
** Refer to Annex I, if necessary.
No
Yes
** Refer to Annex I, if necessary.
Bonus/penalty range Δ (in fraction of min)
During RP2, the delay is only limited to events with codes C, R, S, T, M and P in the ATFCM User Manual in the range between 0.01 min / flt and 0.11 min / flt.
Based on this rationale, a balanced capacity target at 0,08 min/flt in RP3 has a positive impact in the area of cost-effectiveness, and still contributes to the continuity of the
network without any major disruptions.
Based on the experience from RP2 it is our view that under normal operational circumstances, the target (0,08 min/flt) should be well achievable without significant effort.
On the basis of feedback from airspace users, it is also our opinion that the additional costs of delay beyond the threshold value (pivot) are far higher in a global perspective than
the savings of providing a significant overcapacity. We have therefore considered an incentive scheme in the third reference period that does not provide any bonus for delivering
overcapacity beyond the target (pivot value), while in case of delay beyond the target (pivot including a dead band), a balanced penalty of 2 per cent of the traffic revenues is
allocated the airspace users latest within year n + 2 .
Value
Dead band Δ ±0,030 min
Bonus/penalty range (% of pivot value) ±50%
Max bonus 0,00 %
Max penalty 2,00 %
The pivot values for RP3 are
Performance Plan targets (mins of ATFM delay per flight)
Pivot values for RP3 (mins of ATFM delay per flight)*
Dead band range
Bonus range
b) The scope of the incentives is limited to delay causes related to ATC capacity, ATC routing, ATC staffing, ATC equipment, airspace management and special
events with the codes C, R, S, T, M and P of the ATFCM user manual. If yes, provide below a justification for this decision and an explanation of how the pivot
values are calculated.
Explain how the bonus and penalties are going to be apportioned between the different terminal charging zones and ANSPs providing services in each of them**
There is only one terminal charging zone that falls within the geographical scope of the performance plan and incentive scheme, which consists of the airports ENGM, ENBR, ENZV
and ENVA. There will not be calculated nor paid any bonus to the service provider during the reference period.
This incentive scheme has been set to encourage the ANSP to perform on targets in the area of capacity no more no less, while at the same time a less demanding capacity target
than achieved in RP2 has a positive impact in the area of cost-efficiency
Penalty range
Financial advantages / disadvantages
Indicate which of the principles below will be applied for the modulation of the pivot values for the whole RP3:
a) The pivot value for year n is modulated in order to enable significant and unforeseen changes in traffic to be taken into account and is based on the
principles explained below:**
* When modulation applies, these figures are only indicative as they will be updated annually on the basis of the methodology described in 5.2.1.2.a below. The pivot values for
year n have to be notified to the EC by 1 January n.
+0,00% Max. Bonus
-2,00% Max. Penalty
0,1200,040 0,050 0,110
Pivot: 0,080
y = -2x+0,22
y = 0x0
→ Dead band ←
Δ of determined costs in year 2020
Terminal ATFM
Application of the terminal incentive scheme
*Only C, R, S, T, M, P causes
57

6.1 Monitoring of the implementation plan
6.2 Non-compliance with targets during the reference period
SECTION 6: IMPLEMENTATION OF THE PERFORMANCE PLAN
58

6 - IMPLEMENTATION OF THE PERFORMANCE PLAN
6.1 Monitoring of the implementation plan
6.2 Non-compliance with targets during the reference period
Description of the processes put in place by the NSA to monitor the implementation of the Performance Plan including the yearly monitoring
of all KPIs and PIs defined in Annex I of the Regulation and a description of the data sources
Description of the processes put in place and measures to be applied by the NSA to address the situation where targets are not reached
during the reference period
NSA can propose corrective actions if targets are not met accordingly. Article 13 of the national regulation on the establishment and the
implementation of the Single European Sky, states that the adopted performance plans are binding for legal persons and the authorities as far
as the performance plans themselves contain such obligations. If deemed necessary in order to ensure compliance with those obligations, the
CAA/NSA may order compliance and impose fines, with regard to the Civil Aviation Act articles 13 a-3, 13 a-4 and 13 a-5 first paragraph no 6.
The NSA requests all information from ANSPs as necessary to monitor performance. The NSA monitors the situation on a yearly basis, collects
information from ANSPs and from other sources (e.g. PRB Dashboard). The Civil Aviation Act article 13 a-1, paragraph 1 no 2 subparagraph e,
gives the aviation authorities grounds to demand information from ANSPs which is necessary for the authorities to obtain in order for them to
perform their duties in relation to the Act.
59

7 - ANNEXES
ANNEX A. REPORTING TABLES & ADDITIONAL INFORMATION (EN-ROUTE)
ANNEX A.x - En route Charging Zone #x
ANNEX B. REPORTING TABLES & ADDITIONAL INFORMATION (TERMINAL)
ANNEX B.x - Terminal Charging Zone #x
ANNEX C. CONSULTATION
ANNEX D. LOCAL TRAFFIC FORECASTS
ANNEX E. INVESTMENTS
ANNEX F. BASELINE VALUES (COST-EFFICIENCY)
ANNEX G. PARAMETERS FOR THE TRAFFIC RISK SHARING
ANNEX H. RESTRUCTURING MEASURES AND COSTS
ANNEX I. PARAMETERS FOR THE MANDATORY CAPACITY INCENTIVES
ANNEX J. OPTIONAL KPIs AND TARGETS
ANNEX K. OPTIONAL INCENTIVE SCHEMES
ANNEX L. JUSTIFICATION FOR SIMPLIFIED CHARGING SCHEME
ANNEX M. COST ALLOCATION
ANNEX N. CROSS-BORDER INITIATIVES
ANNEX O. JUSTIFICATIONS FOR THE LOCAL SAFETY TARGETS
ANNEX P. JUSTIFICATIONS FOR THE LOCAL ENVIRONMENT TARGETS
ANNEX Q. JUSTIFICATIONS FOR THE LOCAL CAPACITY TARGETS
ANNEX R. JUSTIFICATIONS FOR THE LOCAL COST-EFFICIENCY TARGETS
ANNEX S. INTERDEPENDENCIES
ANNEX T. OTHER MATERIAL
ANNEX Z. CORRECTIVE MEASURES*
* Only as per Article 15(6) of the Regulation
60

ANNEX A. REPORTING TABLES & ADDITIONAL INFORMATION (EN-ROUTE)
PRINTRef. see separate annex to the national performance plan RP3 named ANNEX A. ENROUTE REPORTING TABLES PP
RP3 and ANNEX A. ENROUTE ADDITIONAL INFORMATION PP RP3
61

ANNEX B. REPORTING TABLES & ADDITIONAL INFORMATION (TERMINAL)PRINT
Ref. see separate annex to the national performance plan RP3 named ANNEX B. TERMINAL REPORTING TABLES PP
RP3 and ANNEX B. TERMINAL ADDITIONAL INFORMATION PP RP3
62

ANNEX D. LOCAL TRAFFIC FORECASTSPRINT
En Route
Terminal
Traffic forecast October 2019 (in KSU)
2019 2020 2021 2022 2023 2024
Eurocontrol Statfor base Oct. 2019 256,30 261,30 263,50 266,60 269,00 271,90
Avinor Offshore Oct. 2019 5,71 5,77 5,90 5,81 5,71 5,62
262,0 267,1 269,4 272,4 274,7 277,5
The En Route service units are based on STATFOR base forecast from October 2019 for the period 2019-2024 using model
3, taking into consideration the ratios M3/M2 published by the CRCO for November 2017 to May 2019.
63

ANNEX E. INVESTMENTSPRINT
Specification of other new investments
Investment (in MNOK) 2020 2021 2022 2023 2024
Sub-total
other new
investments
ATM-Systems General - - 28 27 - 55
Buildings General - - 8 43 8 59
Communication General - - 8 44 17 68
Fremtidige investeringer - - - 17 65 82
MET General - - 3 3 6
Mobility General - - 4 11 4 19
Other type of project - - 8 21 7 36
Surveillance General - - 10 81 25 116
Total value of the assets - - 68 247 125 441
Value of the assets allocated to ANS in the scope of the PP (EnRoute) - - 51 184 93 327
64

ANNEX F. BASELINE VALUES (COST-EFFICIENCY)PRINT
Norway
Currency: NOK
Avinor Flysikring AS (Avinor ANS)
Specification of cost elements
En Route
1. Revision of the internal allocation key for combined towers (TWR/APP) 19 800 000
2. Change in allocation key for APP between EnRoute and Terminal 128 278 562
3. Costs incurred as a consequence of military activity 32 500 000
Total cost elements adj. (in national currency at 2019 prices) 180 578 562
Inflation index 2019 105,0
Total cost elements adj. (in national currency at 2017 prices) 172 050 041
Total en route costs in real terms (in national currency at 2017 prices) 974 756 866
2019 baseline value for the determined costs (in real terms and in national currency) 1 146 806 907
Norway
Currency: NOK
Avinor AS
Specification of cost elements
Terminal
1. Revision of the internal allocation key for combined towers (TWR/APP) (2 800 000)
2. Change in allocation key for APP between EnRoute and Terminal (58 935 770)
Total cost elements adj. (in national currency at 2019 prices) (61 735 770)
Inflation index 2019 105,0
Total cost elements adj. (in national currency at 2017 prices) (58 820 060)
Total en route costs in real terms (in national currency at 2017 prices) 513 914 036
2019 baseline value for the determined costs (in real terms and in national currency) 455 093 976
65

ANNEX H. RESTRUCTURING MEASURES AND COSTS
Ref. see separate annex to the national performance plan RP3 named ANNEX H. RESTRUCTURING MEASURES AND
COSTS.pdf. The content of this annex is provided the CAA directly from Avinor ANS, on the CAA’s request . The CAA has
thoroughly analysed the content, and supports all the essential facts and elements.
66