Norway High Speed Rail Assessment Study: Phase III ...
101
Norway High Speed Rail Assessment Study: Phase III Economic and Financial Analysis Final Report 25 January 2012 Atkins in collaboration with:
-
Upload
khangminh22 -
Category
Documents
-
view
0 -
download
0
Transcript of Norway High Speed Rail Assessment Study: Phase III ...

Norway High Speed Rail Assessment Study: Phase III Economic and Financial Analysis Final Report
25 January 2012
Atkins in collaboration with:

Norway HSR Assessment Study - Phase III Economic and Financial Analysis, Final Report
Atkins Norway HSR Assessment Study - Phase III: Economic & Financial Analysis, Final Report
Notice
This document and its contents have been prepared and are intended solely for Jernbaneverket‟s information and use in relation to the Norway High Speed Rail Study – Phase III.
Atkins assumes no responsibility to any other party in respect of or arising out of or in connection with this document and/or its contents.
This document has 101 pages including the cover.
Document history
Job number: 5101627 Document ref: Economic and Financial Appraisal Final Report
Revision Purpose description Originated Checked Reviewed Authorised Date
Rev 1.0 Phase III Economic and Financial Analysis: Final Report
TM AJC JT / AJC WL 25/01/12
Client signoff
Client Jernbaneverket
Project Norway HSR Assessment Study - Phase III
Document title Norway HSR Assessment Study - Phase III: Economic and Financial Analysis, Final Report
Job no. 5101627
Copy no.
Document reference
Economic and Financial Analysis Final Report

Norway HSR Assessment Study - Phase III Economic and Financial Analysis, Final Report
Atkins Norway HSR Assessment Study - Phase III: Economic & Financial Analysis, Final Report
Table of contents
Chapter Pages
1. Introduction 7 1.1. Background 7 1.2. Structure of this Report 7 1.3. Reference Reports 8
2. Alternatives considered and key assumptions 9 2.1. HSR Corridors and Route Alternatives 9 2.2. Infrastructure Scenarios 10 2.3. Specific C/D Scenario Alternatives Considered for Technical Analysis 10 2.4. HSR Passenger Service Scenarios 12 2.5. The Reference Situation 12 2.6. Assumed Timescales 13
3. Appraisal Frameworks 14 3.1. Introduction 14 3.2. Option Appraisal 14 3.3. Appraisal Frameworks 15 3.4. Appraisal Methodology 16 3.5. Key Assumptions 21 3.6. Impacts Excluded 23 3.7. Summary 23
4. Core Economic Appraisal Results 24 4.1. Introduction 24 4.2. Overview of Results for All Corridors 24 4.3. North Corridor 30 4.4. West Corridor 31 4.5. South Corridor 34 4.6. East Corridor 35 4.7. Conclusions 37
5. Economic Appraisal Sensitivity Tests 40 5.1. Introduction 40 5.2. Inter-City Scenarios 40 5.3. Discount Rate and Assessment Period Tests 42 5.4. Optimism Bias and Real Cost Growth Tests 43 5.5. Wider Economic Impacts and Competitive Response Tests 44 5.6. Conclusions 45
6. Financial Appraisal Core Results 46 6.1. Introduction 46 6.2. Description of Analysis Presented 46 6.3. Overview of Results for All Corridors 47 6.4. North Corridor 48 6.5. West Corridor 49 6.6. South Corridor 50 6.7. East Corridor 51 6.8. Conclusions 51
7. Financial Appraisal - Sensitivity Tests 53 7.1. Introduction 53 7.2. Inter-City Scenarios 53

Norway HSR Assessment Study - Phase III Economic and Financial Analysis, Final Report
Atkins Norway HSR Assessment Study - Phase III: Economic & Financial Analysis, Final Report
7.3. Discount Rate Test 55 7.4. Appraisal Period Test 56 7.5. Real Cost Growth Test 57 7.6. Conclusions 59
8. Scenario B – Financial and Economic Appraisal Results 60 8.1. Introduction and Description of Scenario B Alternatives 60 8.2. Economic Appraisal 60 8.3. Financial Appraisal 63 8.4. Conclusions 65
9. Summary and Conclusions 66 9.1. Appraisal Framework 66 9.2. Economic Appraisal 66 9.3. Financial Appraisal 67 9.4. Analysis of Scenario B Alternatives 68 9.5. Additional Considerations 68
Appendix A. Differences between ‘Standard’ and ‘Alternative/Extended’ Appraisal Frameworks 69 A.1. Overview 69
Appendix B. ‘Rule of Half’ and ‘Logsum’ Appraisal Approaches 74 B.1. Overview 74 B.2. „Rule of Half‟ Approach 74 B.3. „Logsum‟ Approach 75
Appendix C. Values of Time in Standard and Alternative Frameworks 79 C.1. Comparison of Values of Time 79
Appendix D. Estimated Freight Impacts by Corridor 82 D.1. Overview 82
Appendix E. Estimated CO2 Impacts by Alternative 83 E.1. Overview 83
Appendix F. Financial Model Assumptions 86 F.1. Ernst & Young Note 86
Appendix G. Economic Appraisal Assumptions 96 G.1. Overview 96
Appendix H. Economic Appraisal Sensitivity Results by Alternative 98 H.1. Overview 98
Tables Table 1. HSR Alternatives considered for Detailed Technical Analysis 11 Table 2. HSR Alternatives considered for Sensitivity Testing of Demand & Revenue 12 Table 3. Indicative Construction Timelines for HSR Alternatives analysed 13 Table 4. Scenario C and D Headline Capital and Life-cycle costs (BnNOK, Q4 2011 prices,
undiscounted) 20 Table 5. Scenario B Headline Capital and Life-cycle costs (BnNOK, Q4 2011 prices) 21 Table 6. Summary of Key Assumptions/Parameters 22 Table 7. Economic Appraisal Results by Alternative for PSS1 and PSS2, Standard Framework, NPV,
MnNOK, 2009 prices, 25 year appraisal period 38 Table 8. Economic Appraisal Results by Alternative for PSS1 and PSS2, Alternative Framework,
NPV, MnNOK, 2009 prices, 40 year appraisal period 39 Table 9. Financial Appraisal Results by Alternative for PSS1 and PSS2, Alternative Appraisal
Framework, NPV, MnNOK, 2009 prices, 25 year appraisal period 52 Table 10. Scenario B Summary of Specification 60

Norway HSR Assessment Study - Phase III Economic and Financial Analysis, Final Report
Atkins Norway HSR Assessment Study - Phase III: Economic & Financial Analysis, Final Report
Table 11. Economic Appraisal Results by Alternative, Standard Appraisal and „Revised Alternative Framework, (NPV, MnNOK, 2009 prices 25 and 40 year appraisal periods). 62
Table 12. Financial Appraisal Results, Alternative Framework, NPV, MnNOK, 2009 prices 25 year appraisal period. 64
Table 13. Revisions made to Standard Framework to produce Alternative Framework 70 Table 14. Comparison of Values of Time by Source (Kroner/Hour,2009 and 2010 prices as identified) 79 Table 15. Summary of Key Assumptions/Parameters 96
Figures Figure 1. HSR Corridors and Route Alternatives 9 Figure 2. User Benefits, Revenue and Third Party Impacts, Standard Framework (NPV, MnNOK, 2009
prices, 2015 base, 25 year appraisal period) 25 Figure 3. User Benefits, Revenue and Third Party Impacts, Alternative Framework (NPV, MnNOK,
2009 prices, 2015 base, 40 year appraisal period) 25 Figure 4. Economic Appraisal Results, Standard Framework (NPV, MnNOK, 2009 prices, 2015 base,
25 year appraisal period) 28 Figure 5. Economic Appraisal Results, Alternative Framework (NPV, MnNOK, 2009 prices, 2015 base,
40 year appraisal period) 29 Figure 6. User Benefits, Revenue and Third Party Impacts: PSS1 and PSS2, Alternative Framework
(NPV, MnNOK, 2009 prices, 2015 base) 30 Figure 7. Economic Appraisal Results: PSS1 and PSS2, Alternative Framework (NPV, MnNOK, 2009
prices, 2015 base) 30 Figure 8. User Benefits, Revenue and Third Party Impacts: PSS1 and PSS2, Alternative Framework
(NPV, MnNOK, 2009 prices, 2015 base) 32 Figure 9. Economic Appraisal Results: PSS1 and PSS2, Alternative Framework (NPV, MnNOK, 2009
prices, 2015 base) 32 Figure 10. User Benefits, Revenue and Third Party Impacts: PSS1 and PSS2, Alternative Framework
(NPV, MnNOK, 2009 prices, 2015 base) 34 Figure 11. Economic Appraisal Results: PSS1 and PSS2, Alternative Framework (NPV, MnNOK, 2009
prices, 2015 base) 34 Figure 12. User Benefits, Revenue and Third Party Impacts: PSS1 and PSS2, Alternative Framework
(NPV, MnNOK, 2009 prices, 2015 base) 36 Figure 13. Economic Appraisal Results: PSS1 and PSS2, Alternative Framework (NPV, MnNOK, 2009
prices, 2015 base) 36 Figure 14. Economic Appraisal Results, Additional IC Trips, Alternative Assessment Framework (NPV,
MnNOK, 2009 prices, 2015 base, 40 year appraisal period) 41 Figure 15. Economic Appraisal Results, Early Inter-City Improvements, Alternative Assessment
Framework (NPV, MnNOK, 2009 prices, 2015 base, 40 year appraisal period) 42 Figure 16. Economic Appraisal Results for Discount Rate and Appraisal Period Sensitivity Tests,
Alternative Assessment Framework, PSS1 (NPV, MnNOK, 2009 prices, 2015 base, 25, 40 or 60 year appraisal period) 42
Figure 17. Economic Appraisal Results for Optimism Bias and Real Cost Growth Sensitivity Tests, Alternative Assessment Framework (NPV, MnNOK, 2009 prices, 2015 base, 40 year appraisal period) 43
Figure 18. Economic Appraisal Results for Wider Impacts and Competitive Response Sensitivity Tests, Alternative Assessment Framework (NPV, MnNOK, 2009 prices, 2015 base, 40 year appraisal period) 44
Figure 19. Financial Appraisal Results, PSS1 (NPV, MnNOK, 2009 prices, 2015 base, 25 year appraisal period) 47
Figure 20. Financial Appraisal Results, PSS2 (NPV, MnNOK, 2009 prices, 2015 base, 25 year appraisal period) 47
Figure 21. North Corridor Alternatives: Financial Appraisal Results: PSS1 and PSS2 (NPV, MnNOK, 2009 prices, 2015 base, 25 year appraisal period) 48
Figure 22. West Corridor Alternatives: Financial Appraisal Results: PSS1 and PSS2 (NPV, MnNOK, 2009 prices, 2015 base) 49

Norway HSR Assessment Study - Phase III Economic and Financial Analysis, Final Report
Atkins Norway HSR Assessment Study - Phase III: Economic & Financial Analysis, Final Report
Figure 23. South Corridor Alternatives: Financial Appraisal Results: PSS1 and PSS2 (NPV, MnNOK, 2009 prices, 2015 base) 50
Figure 24. East Corridor Alternatives: Financial Appraisal Results: PSS1 and PSS2 (NPV, MnNOK, 2009 prices, 2015 base) 51
Figure 25. Financial Appraisal Results for IC scenarios (MnNOK, 2009 prices, 2015 base, 25 year appraisal period) 53
Figure 26. Financial Appraisal Results for IC scenarios (MnNOK, 2009 prices, 2015 base, 25 year appraisal period) 54
Figure 27. Financial Appraisal Results, PSS1, 2% Discount Rate (NPV, MnNOK, 2009 prices, 2015 base, 25 year appraisal period) 55
Figure 28. Financial Appraisal Results, PSS2, 2% Discount Rate (NPV, MnNOK, 2009 prices, 2015 base, 25 year appraisal period) 55
Figure 29. Financial Appraisal Results, PSS1, (NPV, MnNOK, 2009 prices, 2015 base, 40 year appraisal period) 56
Figure 30. Financial Appraisal Results, PSS2, (NPV, MnNOK, 2009 prices, 2015 base, 40 year appraisal period) 57
Figure 31. Financial Appraisal Results, PSS1, without real cost growth (NPV, MnNOK, 2009 prices, 2015 base, 25 year appraisal period) 58
Figure 32. Financial Appraisal Results, PSS2, without real cost growth (NPV, MnNOK, 2009 prices, 2015 base, 25 year appraisal period) 58
Figure 33. Economic Appraisal Results (NPV, MnNOK, 2009 prices, 2015 base, 25 and 40 year appraisal period) 62
Figure 34. Financial Appraisal Results (NPV, MnNOK, 2009 prices, 2015 base, 25 year appraisal period) 64
Figure 35. Economic Appraisal Results for Discount Rate Sensitivity Tests, Alternative Assessment Framework, PSS1 (NPV, MnNOK, 2009 prices, 2015 base, 40 year appraisal period) 99
Figure 36. Economic Appraisal Results for Appraisal Period Sensitivity Tests, Alternative Assessment Framework, PSS1 (NPV, MnNOK, 2009 prices, 2015 base, 25, 40 or 60 year appraisal period) 100
Figure 37. Economic Appraisal Results for or Optimism Bias and Real Cost Growth Sensitivity Tests, Alternative Assessment Framework, PSS1 (NPV, MnNOK, 2009 prices, 2015 base, 40 year appraisal period) 101
Figure 38. Economic Appraisal Results for or Wider Impact and Competitive Response Sensitivity Tests, Alternative Assessment Framework, PSS1 (NPV, MnNOK, 2009 prices, 2015 base, 40 year appraisal period) 102
Norway HSR Assessment Study - Phase III Economic and Financial Analysis, Final Report
Atkins Norway HSR Assessment Study - Phase III: Economic & Financial Analysis, Final Report 7
1. Introduction
1.1. Background Jernbaneverket (JBV) has been mandated by the Norwegian Ministry of Transport and Communications to assess the issue of High Speed Rail (HSR) lines in Norway. There is a National Transport Plan covering the period from 2010-2019 which includes relatively minor enhancements to the railway network. The ministry wishes to understand if going beyond this and implementing a step change in rail service provision in the form of higher speed concepts could “contribute to obtaining socio-economically efficient and sustainable solutions for a future transport system with increased transport capacity, efficiency and accessibility”.
Previous studies have been carried out looking into HSR in Norway and there are various conflicting views. The aim of this study is to provide a transparent, robust and evidence based assessment of the costs and benefits of HSR to support investment decisions.
The Norway HSR Assessment Study has been divided into three phases.
In Phase I, which was completed in July 2010, the knowledge base that already existed in Norway was collated, including outputs from previous studies. This included the studies that already were conducted for the National Rail Administration and the Ministry of Transport and Communication, but also publicly available studies conducted by various stakeholders, such as Norsk Bane AS, Høyhastighetsringen AS and Coinco North.
The objective of Phase II was to identify a common basis to be used to assess a range of possible interventions on the main rail corridors in Norway, including links to Sweden. The work in Phase II used and enhanced existing information, models and data. New tools were created where existing tools were not suitable for assessing high speed rail. Phase II was completed in March 2011.
In Phase III the tools and guiding principles established in Phase II were to be used to test scenarios and alternatives on the different corridors. This will provide assessments of alternatives and enable recommendations for development and investment strategies in each corridor.
This report is a component of the Phase III work and details the economic and financial appraisal undertaken by Atkins, supported by its study partners Faithful + Gould, Ernst & Young and Significance.
1.2. Structure of this Report The remainder of this report provides a description of the economic and financial appraisal process used in the Phase III work, including a description of the framework used and its derivation, and the key results of the appraisal process, including sensitivity testing.
It is structured as follows:
Chapter 2 provides context, summarising the HSR alternatives that have been the focus of the technical analysis undertaken;
Chapter 3 then summarises the appraisal frameworks applied for the study, their derivation and the underlying calculations, assumptions and inputs;
Chapter 4 summarises the output of the economic appraisal for Scenario C/D alternatives;
Chapter 5 presents results from sensitivity analysis undertaken for the Scenario C/D economic appraisal;
Chapter 6 then summarises the output of the financial appraisal for Scenario C/D alternatives;
Chapter 7 presents results from sensitivity analysis undertaken for the Scenario C/D financial appraisal;
Chapter 8 summarises both the financial and economic appraisal for the alternative „Scenario B‟ existing line upgrade alternatives; and
Chapter 9 provides an overall Summary and Conclusions
Norway HSR Assessment Study - Phase III Economic and Financial Analysis, Final Report
Atkins Norway HSR Assessment Study - Phase III: Economic & Financial Analysis, Final Report 8
1.3. Reference Reports A summary of the key results and conclusions from this report can be found in the separate Phase III summary report (Phase III, Journey Time Analysis, Market Demand and Revenue Analysis, Estimation and Assessment of Investment Costs, Economic and Financial Analysis, Summary Report, January 2012) which provides a summary of all the technical analyses undertaken for the study by Atkins and its study partners Faithful + Gould, Ernst & Young and Significance.
The results in this report also draw on information from a number of other Phase III technical work streams. These are summarised in the following detailed technical reports which should be viewed as reference documents for this report:
Norway HSR Assessment Study Phase III: Journey Time Analysis, Final Report, January 2012; Atkins
Norway HSR Assessment Study Phase III: Model Development, Final Report, January 2012; Atkins
Norway HSR Assessment Study Phase III: Market, Demand and Revenue Analysis, Final Report, January 2012; Atkins
Norway HSR Assessment Study Phase III: Market, Demand and Revenue Analysis – Potential for HSR Feeder Networks, Supplementary Report, January 2012; Atkins
Norway HSR Assessment Study Phase III: Freight Market Analysis, Final Report, January 2012; Atkins
Norway HSR Assessment Study Phase III: Estimation and Assessment of Investment Costs, Final Report, January 2012; Atkins / Faithful + Gould and
Norwegian High Speed Railway Project, Phase 3, Final report Version 2 - Environmental analysis – Climate, 03.02.2012, Asplan Viak AS, MISA AS

Norway HSR Assessment Study - Phase III Economic and Financial Analysis, Final Report
Atkins Norway HSR Assessment Study - Phase III: Economic & Financial Analysis, Final Report 9
2. Alternatives considered and key assumptions
2.1. HSR Corridors and Route Alternatives In Phase III of the study HSR has been considered with respect to a number of potential corridors and associated routes. Figure 1 below presents the corridors and routes:
Figure 1. HSR Corridors and Route Alternatives
The Phase III alignment studies are divided into four corridors and each of those corridors contains one or more „routes‟ that are being considered:
Corridor North: Oslo – Trondheim - Route: Oslo – Trondheim only; and
Corridor West: Oslo – Bergen / Bergen – Stavanger; - Route: Bergen – Stavanger - Route: Oslo – Bergen - Route: Oslo – Stavanger (not via Kristiansand);
Corridor South: Oslo – Kristiansand – Stavanger; - Route: Oslo – Kristiansand – Stavanger only
Hamar
Lillehammer
Kristiansand
Stavanger
Haugesund
Bergen
Trondheim
Oslo
Sarpsborg
Porsgrunn/Skien
Sandnes
Geilo
Arendal
Voss
Stord
Odda
Værnes
Gjøvik
Gardermoen
Mandal
Egersund
Hønefoss
Oppdal
Tynset
Otta
KongsbergSki
Drammen
Lillestrøm
Tønsberg
Kongsvinger
ElverumParkway
Moss
FredrikstadHalden
Myrdal
Torp
LegendCategory 1 StationCategory 2 Station
Note some stations can only be served by 250 kph alignment

Norway HSR Assessment Study - Phase III Economic and Financial Analysis, Final Report
Atkins Norway HSR Assessment Study - Phase III: Economic & Financial Analysis, Final Report 10
Corridor East: Oslo – Gothenburg / Oslo – Stockholm; - Route: Oslo – Gothenburg - Route: Oslo – Stockholm.
As shown in Figure 1 for some corridors more than one potential alignment route might be considered. For example, from Oslo to Bergen three different alignments could be considered – the Hallingdal alignment (via Hønefoss), the Numedal alignment (via Drammen then north to Geilo) and the Haukeli alignment (the „Y-shaped‟ network which heads more directly west from Drammen via Bø, also serving Stavanger). Some potential alignments could only be considered with the construction of a completely new high speed track as they are currently not served by existing railway lines.
2.2. Infrastructure Scenarios Four scenarios were initially considered on each of the corridors for Phase II testing:
Scenario A – a continuation of the current railway policy and planned improvements, with relatively minor works undertaken (the reference case to which the other upgrades listed below are compared);
Scenario B – a more offensive development of the current infrastructure;
Scenario C – major upgrades to the current infrastructure achieving high-speed concepts; and
Scenario D – building of new separate HSR lines.
As part of the alignment work in Phase III, new scenarios were developed and existing scenarios were adapted.
Scenario B was defined as a uniform 20% reduction in travel time, maintaining the current stopping pattern and remaining single track outside of the Inter-City (IC) area;
Scenario D was sub-categorised into two options: - D1: For mixed passenger and freight traffic, design speed 330kph, gradient 12.5%, double track - D2: For passenger traffic only, design speed 330kph, relaxed gradient restrictions, double track
Scenario 2* is a new scenario which represents an upgrade of existing lines to double track with a 250kph design speed;
Scenario C is defined as a combination of Scenarios D1, D2 and 2*.
On the basis of the above classification, a number of specific route options were specified, considered and then shortlisted to provide a manageable set of representative alternatives which have been the primary focus for technical analysis. These fall into two categories:
HSR alternatives reflecting one of or a combination of D1, D2 (330kph) and/or 2* (250kph);
Scenario B alternatives to HSR.
It should be noted that the primary focus for technical engineering feasibility and development of alternatives has related to HSR alternatives and, as a consequence, the scope to undertake a detailed analysis and assessment of these has been greater than for Scenario B alternatives. This is reflected in this report, where the primary focus is on the presentation of results for the HSR alternatives, with Scenario B alternatives being summarised within Chapter 8.
2.3. Specific C/D Scenario Alternatives Considered for Technical Analysis
JBV have prepared a report that presents the HSR alternatives to be considered for analysis – (Høyhastighetsutredningen 2010-12: Vedlegg B - Fastsettelse av alternativer for analyse, 2012-01-22, Railconsult AS). This identifies alternatives for detailed appraisal and assessment and additional alternatives to be understood as a sensitivity alternative to the detailed appraisal alternatives. A summary description of the detailed appraisal HSR alternatives is provided in Table 1 below.

Norway HSR Assessment Study - Phase III Economic and Financial Analysis, Final Report
Atkins Norway HSR Assessment Study - Phase III: Economic & Financial Analysis, Final Report 11
Table 1. HSR Alternatives considered for Detailed Technical Analysis
Corridor Alternatives Ref
HSR Alternative Description
North
G3:Y 250 kph Oslo – Trondheim / Vaernes via Gudsbrandsdalen serving Gardermoen, Hamar, Lillehammer, Otta and, Oppdal
Ø2:P 330 kph Oslo – Trondheim / Vaernes via Østerdalen serving Gardermoen, Elverum Parkway and Tynset
West N1:Q 250 kph Oslo – Bergen via Numedal serving Drammen, Kongsberg, Geilo, Myrdal and Voss
HA2:P 330 kph Oslo – Bergen via Hallingdal serving Hønefoss, Geilo and Voss
H1:P 330 kph Oslo – Bergen via Haukeli serving Drammen, Kongsberg and Odda
330 kph Oslo – Stavanger via Haukeli serving Drammen, Kongsberg, Odda and Haugesund
330 kph Bergen – Stavanger via Roldal serving Haugesund
BS1:P 330 kph Bergen – Stavanger via coastal route serving Haugesund and Stord
South S8:Q 250 kph Oslo – Stavanger via Vestfold serving Drammen, Tønsberg, Torp, Porsgrunn, Arendal, Kristiansand, Mandal, Egersund and Sandnes
S2:P 330 kph Oslo – Stavanger via direct route serving Drammen, Porsgrunn, Arendal, Kristiansand, Mandal, Egersund and Sandnes
East ST5:U 250 kph Oslo – Stockholm via Ski serving Ski, Karlstad, Örebro and Västerås
ST3:R 330 kph Oslo – Stockholm via Lillestrøm serving Lillestrøm, Karlstad, Örebro and Västerås
GO3:Q 250 kph Oslo – Gothenburg via Ski serving Ski, Moss, Fredrikstad, Sarpsborg, Halden and Trollhättan
GO1:S 330 kph Oslo – Gothenburg via direct route serving Sarpsborg, Halden and T Trollhättan
The identification and choice of stops per HSR alternative is explained in the report “Norway HSR Assessment Study, Phase III: Journey Time Analysis”, Final Report, January 2011. Details of the engineering alignments associated with the above HSR alternatives were developed and reported in detail by each of the four corridor alignment design teams in their Phase III Reports:
High Speed Rail Assessment 2012-2012: Phase 3 – Corridor West, 25.11.2011, SWECO
High Speed Rail Assessment Phase III – South Corridor: Part 1 – technical basis and proposed alignments, 2011-11-25, Multiconsult/WSP
Norwegian High Speed Railway Assessment, Phase 3 corridor east: Corridor specific analysis main report, 2011-11-25, Norconsult
High Speed Rail Assessment Project, Corridor North Oslo – Trondheim: Delivery 2 – Phase 3 Alignment study, 2011-11-25, Rambøll
A summary description of the sensitivity HSR alternatives is provided in Table 2 below. These are presented for
information only as the Sensitivity Alternatives have not been subject to economic or financial appraisal.

Norway HSR Assessment Study - Phase III Economic and Financial Analysis, Final Report
Atkins Norway HSR Assessment Study - Phase III: Economic & Financial Analysis, Final Report 12
Table 2. HSR Alternatives considered for Sensitivity Testing of Demand & Revenue
Corridor Option Ref HSR Option Description
North
G1:P 330 kph Oslo – Trondheim / Vaernes via Gudsbrandsdalen serving Gardermoen, Gjøvik, Lillehammer, Otta and Oppdal
West HA1:Q 250 kph Oslo – Bergen via Hallingdal serving Hønefoss, Geilo, Myrdal and Voss
N4:P 330 kph Oslo – Bergen via Numedal serving Drammen, Kongsberg, Geilo and Voss
South S8:T 250 kph Oslo – Stavanger via Vestfold serving Drammen, Tønsberg, Torp, Porsgrunn, Arendal, Kristiansand, Mandal, Egersund and Sandnes
S3:Z 330 kph Oslo – Stavanger via direct route serving Drammen, Porsgrunn, Arendal, Kristiansand, Mandal, Egersund and Sandnes
S4:P 330 kph Oslo – Stavanger via direct route serving Drammen, Porsgrunn, Arendal, Kristiansand, Mandal, Egersund and Sandnes
East ST1:Q 250 kph Oslo – Stockholm via Kongsvinger serving Lillestrøm, Kongsvinger, Karlstad, Örebro and Västerås
ST2:R 330 kph Oslo – Stockholm via Lillestrøm serving Lillestrøm, Karlstad, Örebro and Västerås
2.4. HSR Passenger Service Scenarios Critical to the technical analysis of the implications of HSR are the assumptions made with respect to the type of HSR service that would operate.
At this early stage in project development there is inevitably a great deal of uncertainty as to the service that might be delivered and operated and consequently it is essential to establish a reasonable basis for “testing” the impact of HSR. To this end, two HSR Passenger Service Scenarios were established, reflecting somewhat different rationales for HSR service provision:
HSR Passenger Service Scenario 1 (PSS1): In this scenario the provision of HSR services is specified with the capture of demand and market share in mind. It is assumed that an hourly core HSR service that serves all the larger and significant towns and cities on the alignment is provided (approximately 18 trains a day in each direction), supplemented by an additional hourly limited stop, and hence faster, morning and afternoon peak period service targeting the end-to-end market (4 trains a day in each direction in the morning and afternoon). In this scenario it is assumed that rail fares are approximately 60% of air fares, reflecting the current pricing of rail services compared with air services.
HSR Passenger Service Scenario 2 (PSS2): In this scenario the provision of HSR services is specified with the delivery of commercial operational performance in mind – securing revenue while keeping the associated costs for service delivery down. In this instance it is assumed that only the hourly core HSR service is provided (18 trains a day), reducing the cost of service delivery, while the rail fare is assumed to be higher than in PSS1, equivalent to the competing air fare.
It is fully recognised that each of these scenarios represents a simplification of what might be delivered as an HSR service, and the potential range of service and fare levels that might be offered in practice. However, in order to undertake comparative analysis of a large number of alternatives within the study timescale, and given the detail at which the available tools allow for alternatives to be considered, they provide a reasonable basis and range of service offer for assessment, consistent with this stage of study.
2.5. The Reference Situation In order to undertake an assessment of the potential impact of introducing HSR it is necessary to establish a “Reference Case” against which impacts of a „Test Case‟ can be assessed and quantified. The Reference Case is constructed through reference to the provision of transport infrastructure that would be built without HSR, the services that would be in place, the nature of the market for travel, and the way in which these are assumed to change over time. In the case of this study, the following assumptions have been adopted for the Reference Case:

Norway HSR Assessment Study - Phase III Economic and Financial Analysis, Final Report
Atkins Norway HSR Assessment Study - Phase III: Economic & Financial Analysis, Final Report 13
The provision of transport infrastructure and services across all modes reflects the current situation plus improvements into the future for which a commitment to delivery is in place. No consequential changes to the provision of infrastructure or services are assumed in response to the introduction of HSR infrastructure and services;
The underlying demand for travel in Norway in future is as assumed to be as per the NTM5 model which adopts Norwegian Government assumptions on population growth over time. Where necessary, NTM5 has been supplemented by additional data such as information on travel in Sweden and cross border travel secured through JBV. Forecasts for inflation and GDP growth are per Norwegian Government guidance and are adopted as appropriate.
2.6. Assumed Timescales The start date for construction, as advised by JBV, is assumed to be 2017. Indicative construction time-scales for the purposes of alternative comparison and appraisal have been derived for each of the HSR alternatives. These assume a best-case multi-contractor delivery route allowing for concurrent programmes of construction of different sections of route – consequently these may differ from any timescales reported in alignment design reports. The indicative construction timescales and the resulting assumed start year of HSR operation is shown in Table 3 below.
Table 3. Indicative Construction Timelines for HSR Alternatives analysed
Corridor Alt. Ref HSR Alternative Description Indicative Construction Period
Indicative 1
st Year of
Operation
North
G3:Y 250 kph Oslo – Trondheim / Vaernes via Gudsbrandsdalen 10 years 2027
Ø2:P 330 kph Oslo – Trondheim / Vaernes via Osterdalen 8.5 years 2025
West N1:Q 250 kph Oslo – Bergen via Numedal 7 years 2024
HA2:P 330 kph Oslo – Bergen via Hallingdal 7 years 2024
H1:P 330 kph Oslo – Bergen via Haukeli
330 kph Oslo – Stavanger via Haukeli
330 kph Bergen – Stavanger via Roldal
10 years 2027
BS1:P 330 kph Bergen – Stavanger via coastal route 6 years 2023
South S8:Q 250 kph Oslo – Stavanger via Vestfold 9 years 2026
S2:P 330 kph Oslo – Stavanger via direct route 9 years 2026
East ST5:U 250 kph Oslo – Stockholm via Ski 7 years 2024
ST3:R 330 kph Oslo – Stockholm via Lillestrøm 7 years 2024
GO3:Q 250 kph Oslo – Gothenburg via Ski 5 years 2022
GO1:S 330 kph Oslo – Gothenburg via direct route 5 years 2022

Norway HSR Assessment Study - Phase III Economic and Financial Analysis, Final Report
Atkins Norway HSR Assessment Study - Phase III: Economic & Financial Analysis, Final Report 14
3. Appraisal Frameworks
3.1. Introduction This Chapter introduces both the scope and purpose of option appraisal and the frameworks used to structure the economic and financial appraisal of the alternatives considered in this report.
3.2. Option Appraisal Option appraisal is intended to compare the relative scale of likely scheme costs and benefits on a standard basis over an identified lifetime, to allow consistent comparisons of the performance of alternatives.
Appraisal can be undertaken from a number of perspectives. The results presented in this report relate to socio-economic and financial appraisal, each of which is described further below.
3.2.1. Socio-economic Appraisal Socio-economic appraisal identifies the likely impacts of a transport scheme on society through time and compares their net value with the forecast cost of constructing, operating and maintaining the scheme.
The aim is to reflect all significant impacts in a robust, consistent manner and to compare the value of costs and benefits, to identify a net impact on society. These outputs can then be used to inform comparisons of the relative performance of different options and decisions on whether to invest in implementing a given option.
Where possible, the impacts considered are attributed a monetary value, for instance using values of time to convert time elements of costs (i.e. the value in NOK that people attribute to each minute saved on a journey). However, non-monetised impacts are also typically captured to ensure that the full range of impacts is considered in any investment decisions. Impacts that cannot be assigned a monetary value are assessed qualitatively either by assignment of scores to indicate performance or by providing commentary on the impact.
The impacts captured in socio-economic appraisal include effects on transport providers, the public sector, transport users and third parties and can be broadly grouped into the four categories of:
Economy; including:
construction costs (including risk allowances, costs of financing through taxation and an allowance for residual values of assets);
ongoing operating, maintenance and renewal costs;
revenue;
journey improvements for users (including journey time savings, changes in fares, improvements in journey quality for passengers and freight users);
Environment – impact on the physical (natural and built) environment. These impacts are typically externalities, i.e. affecting third parties rather than those using the transport scheme directly;
Safety – impact on transport accident numbers and severity, typically also treated as an externality;
Social distribution/equity – the extent to which impacts are distributed evenly between different geographical areas and social groups.
The economic appraisals presented in this report focus on those impacts falling in the above categories that can be attributed a monetary value. Other impacts are considered in other elements of the Phase III work, in particular the reports produced by the alignment design teams (as referenced in Chapter 2).
The scale of each impact considered is estimated across an identified appraisal period and then converted to a monetary value to provide a common basis for comparison of impacts across alternatives. Values are considered on a discounted basis to account for „social time preference‟ i.e. the fact that society tends to discount costs and benefits in later years, attributing them a lower value than equivalent costs and benefits in the near future.

Norway HSR Assessment Study - Phase III Economic and Financial Analysis, Final Report
Atkins Norway HSR Assessment Study - Phase III: Economic & Financial Analysis, Final Report 15
3.2.2. Financial Appraisal Socio-economic appraisal as described above is useful in the consideration of the life time impact of each alternative across society. Financial appraisal takes an alternative, more focussed perspective, concentrating on the comparative scale of monetary costs and benefits (revenue) generated by the scheme during operation. It is intended to help to identify the extent to which each option could be considered commercially viable once the costs of construction are committed.
3.3. Appraisal Frameworks Appraisal frameworks provide the structure for the appraisal, setting out the impacts to be considered and the way in which they should be addressed and measured, helping to ensure coverage is sufficiently wide and that there is consistency between appraisals for different alternatives.
The analysis presented below has made use of two frameworks as defined in the Phase II Economic and Financial Analysis Report. (Norway HSR Assessment Study: Contract 6: Financial & Economic Analysis: Subject 4: Economic Analysis: Final Report, February 201)
„Standard Framework‟ – consistent with JBV guidance (NB the „Standard‟ Framework was termed the „Core‟ Framework in the Phase II work but has been renamed for Phase III to avoid confusion with the term „Core‟ Alternatives)
„Alternative/Extended‟ Framework – building on the „Standard‟ Framework to increase relevance for HSR appraisal.
Each framework is described in more detail below, including explanations of the revisions incorporated in the Alternative Framework and the reasons for them.
3.3.1. Standard Framework The Standard Framework follows the JBV guidance as set out in Metodehåndbok JD 205 Samfunnsokonomiske analyser for jernbanen, versjon 3.0 juli 2011. It therefore, meets the HSR mandate‟s requirement to apply the Norwegian assessment methodology for the study. The only addition to the calculations required to enable the alternatives to be assessed was associated with the consideration of HSR as a new transport mode (i.e. demonstrating different characteristics, including speed and comfort, relative to existing modes). As the JBV guidance is primarily intended for smaller scale, conventional rail schemes it does not include guidance for the treatment of HSR. In particular it does not include a value of time for the mode and does not provide guidance on the treatment of „new mode‟ benefits in the „rule of half‟ calculations.
As described in the Phase II Economic and Financial Analysis Report (Norway HSR Assessment Study: Contract 6: Financial & Economic Analysis: Subject 4: Economic Analysis: Final Report, February 2011), there is no ideal approach to dealing with this „new mode‟ issue in the „rule of half‟ approach to calculating the benefits for transport users that is widely used in economic assessment, including in the JBV spreadsheet. The approach adopted in the Standard Framework is the most appropriate of the options available for the model structure used for the study and involves combining the trip and travel cost information for HSR with the equivalent information for air (or rail for journeys where air is not an option). This creates average trip and cost information that represents a combined mode of „High Speed travel‟ (or „rail travel‟ for journeys without an air option). As the Stated Preference survey revealed that people associate HSR closely with air, the JBV standard air value of time is applied to HSR travel costs in these calculations.
3.3.2. Alternative/Extended Framework The „Alternative/Extended‟ Framework was developed in Phase II of the study to build on the „Standard‟ approach in recognition of the extra requirements for the appraisal of HSR schemes; beyond the needs for the appraisal of the smaller, conventional rail schemes typically covered by the JBV guidance. The revisions reflect the likely range of impacts of HSR and an international review of best practice in economic assessment and are a combination of revisions to the central case and additional sensitivity tests.
The key changes include:

Norway HSR Assessment Study - Phase III Economic and Financial Analysis, Final Report
Atkins Norway HSR Assessment Study - Phase III: Economic & Financial Analysis, Final Report 16
Extension of the assessment period to 40 years from the 25 year period used in the Standard Framework, to capture scheme impacts over a longer time period, in keeping with the scale of the alternatives and in line with international practice;
Application of an uplift for real growth in construction costs, using a rate of 1.9% above standard inflation until 2025 on the basis of recent trends;
Revised treatment of benefits for the new mode and associated treatment of values of time (applicable to Scenarios C/D). A „logsum‟ approach is used which calculates changes in benefits to transport users directly from the changes in travel costs and patterns in the model, providing consistency between the model and appraisal process. This approach makes use of values of time derived from the Stated Preference survey used to establish the parameters underpinning the model. Further details are provided below and in Appendices B and C;
An allowance for fast rail freight impacts
An allowance for potential wider economic impacts, using sensitivity tests to provide an illustration of the possible scale of impact, as detailed impacts cannot yet be calculated in the absence of necessary local research and data.
Four other revisions were recommended in the Phase II review but have not been taken directly through to the Alternative Framework; because either they have been superseded by changes in study scope or they are captured in other strands of work as follows:
Application of real growth in benefits in line with GDP growth – JBV issued an update to their guidance in July 2011 which includes the application of real growth to time savings, environmental and accident benefits. This therefore now forms part of the Standard Framework and is not required as a revision in the Alternative Framework.
Demand sensitivity testing – the specification of sensitivity tests relating specifically to forecast levels of demand was superseded by other tests specified during the course of Phase III, for instance Passenger Service Scenarios 1 and 2. The demand sensitivity tests have therefore not been incorporated specifically;
Incorporation of mandate indicators on capacity and passability – revised guidance on the requirements of the mandate identified that these indicators were not needed;
Enhanced treatment of non-monetised impacts – this recommendation was superseded by the Methodology for Environmental Assessment set out by Asplan Viak and partners (Final Report for JBV, March 2011). Assessments of these issues were undertaken by the alignment consultants and so were not required in the economic appraisal.
3.4. Appraisal Methodology
3.4.1. Links to Other Technical Analysis The appraisal process underpinning both frameworks relies on the following inputs from other aspects of the Phase III technical work:
Outputs from the Financial Model – costs and income associated with infrastructure construction, maintenance and operation and service operation (including fleet) by year over a 25 year and 40 year period. In turn the Financial Model relies on:
Information on capital and life cycle costs, risks and timings from the Cost Model over a 25 year period and 40 year period;
HSR Revenue by year from the Mode Choice Model;
Assumptions (detailed further below);
Information from the Cost Model on asset lives (to inform the calculation of residual values) and optimism bias estimates by corridor that are consistent with the quantified risk assessments
Matrices of travel costs and demand from the Mode Choice Model (used to forecast trips > 100km as described in the Phase III Model Development Report - Norway HSR Assessment Study Phase III: Model Development, Final Report, January 2012). These provide details of the number of trips and costs of travelling between each identified origin and destination in the transport model for each mode modelled (HSR, air, rail, coach and car) for each modelled year (2024, 2043 and 2060), with and without the HSR alternative in place (for the Reference and Test Scenarios);

Norway HSR Assessment Study - Phase III Economic and Financial Analysis, Final Report
Atkins Norway HSR Assessment Study - Phase III: Economic & Financial Analysis, Final Report 17
Details of numbers and origins and destinations of additional forecast HSR trips and associated person kilometres for trips < 100km forecast using the Gravity Model (used to forecast trips <100km as described in the Phase III Model Development report)
Estimates of freight benefits by corridor from the freight modelling – providing details of estimated reductions in transport and logistics costs that would be caused by introducing high speed freight. The estimate was made by Significance using the Norwegian National Freight Model and is described further below;
Estimates of CO2 emissions impacts of each alternative from the environmental team (Norwegian High Speed Railway Project, Phase 3, Final report Version 2 - Environmental analysis – Climate, 03.02.2012, Asplan Viak AS, MISA AS ), providing details of the net change in CO2 emissions p.a. from construction and over a 60 year life time, accounting for construction and ongoing maintenance and operations (including mode transfer of passengers) .
3.4.2. Calculations The estimation of the impacts of each HSR alternative depends on a number of calculations. These are undertaken in a series of spreadsheets leading to a version of the September 2011 JBV appraisal spreadsheet (released in association with the JBV guidance, Metodehåndbok JD 205, Samfunnsokonomiske analyser for jernbanen, versjon 3.0 juli 2011) adapted to meet the requirements of the HSR appraisal and are described below, grouped by key impact.
3.4.2.1. User Benefits
Transport user benefits are calculated from a comparison of travel costs and conditions in the Test Case, which includes the alternative under consideration, and a Reference Case scenario, which excludes the alternative but is otherwise identical. Two approaches to valuing these impacts for trips forecast in the Mode Choice Model are used in the appraisal frameworks:
„Rule of half‟ approach; and
„Logsum‟ approach
The different level of data availability for trips from the Gravity Model requires the use of a third approach, based on volumes of travel.
Each of these three approaches is described in more detail below.
3.4.2.1.1. ‘Rule of Half’ Approach
The Standard Framework converts the elements of journey costs (such as walking and waiting) to monetary values using generalised values of time (NOK/minute) and time weights provided in the JBV guidance and then applies the „rule of half‟ approach to calculate user benefits.
This approach compares costs for each mode in the Test and Reference Case scenarios (with and without alternative) and assumes that those using the mode in both the Reference and Test Cases receive all of the benefit of any change in travel costs, whilst new trips on a mode in the Test Case (either switching from other modes or wholly new trips) receive half of the benefit, on average. This approach relies on assumptions, including that the changes in travel costs between Reference and Test Case are small and that travel costs for each mode exist in the Reference and Test Cases. Further detail of the approach is provided in Appendix B.
The requirement for Reference Case travel costs for this approach leads to difficulties where new modes such as HSR are introduced which exist in the Test case but not the Reference Case. As described above, there is no ideal solution to this issue but the approach adopted for the Standard Framework was to combine air and HSR as a single „high speed travel mode‟ (or classic rail and HSR as a single „rail mode‟ for journeys where air was not an option) and use the parameters identified for air in the JBV spreadsheet
3.4.2.1.2. ‘Logsum’ Approach
The second approach to valuing user benefits (applied in the Alternative Framework) uses the valuation of journey costs directly as applied in the demand forecasting model (based on the Stated Preference survey) and then applies the „logsum‟ approach to calculating benefits. This compares the costs faced across all transport users represented in the model in the Test Case with those faced in the Reference Case.
Norway HSR Assessment Study - Phase III Economic and Financial Analysis, Final Report
Atkins Norway HSR Assessment Study - Phase III: Economic & Financial Analysis, Final Report 18
Conversion of non monetary costs to monetary values in this case is on the basis of the values of time implicit in the Stated Preference survey rather than the standard values set out in the JBV guidance. The values are broadly similar but inevitably there are some differences in results from different studies and samples. The results from this study relate to mode choice in the particular context of choice between existing modes and HSR and are therefore focused on the particular travel choices underpinning this study whereas the national figures are derived from a more generic survey, reflecting the wider usage of the values. Appendix C provides a comparison of the two sets of values of time and discussion of the differences.
The advantages of the „logsum‟ approach include the fact that the costs used are directly consistent with those used in the transport model and that it overcomes the problem of comparison of Test and Reference Case costs for new modes as travellers by all modes are considered together in the calculation.
It is important to note that the „logsum‟ approach is only applicable in logit type models such as the HSR Mode Choice Model. It therefore could not be applied for appraising Scenario B alternatives which were modelled using NTM5 rather than the HSR mode choice model. The „rule of half‟ approach was therefore applied for all assessments for these alternatives.
3.4.2.1.3. Gravity Model Estimates
The above approaches are only applicable for the trips calculated using the Mode Choice Model, for which details of travel demand and costs for each mode are available. As described in the Model Development Report (Norway HSR Assessment Study Phase III: Model Development, Final Report, January 2012), the Mode Choice Model (MCM) was established to forecast long distance trips and therefore most trips of under 100km were forecast using an additional Gravity Model which forecast estimated HSR demand on the basis of HSR travel costs between stations and the size of the surrounding urban areas. Information on travel costs and demand for other modes was therefore not available for these trips, making both the „rule of half‟ and „logsum‟ approaches impossible for the calculation of user benefits.
For these trips, an appropriate „benefit per HSR person kilometre‟ was derived from relevant Mode Choice Model trips and applied to the additional HSR person kilometres forecast using the Gravity Model. The „relevant MCM trips‟ were taken to be relatively short trips (< 200km) between the stations represented in the Gravity Model that were also represented in the Mode Choice Model.
The total user benefit forecast for the „relevant trips‟ using the „rule of half‟ or „logsum‟ approach was divided by the number of person kilometres travelled on the relevant trips, providing the average benefit per person kilometre to be applied to the Gravity Model person kilometres.
Separate rates were derived for each alternative for each forecast year, purpose and benefit component (for the „rule of half‟ calculations). The estimated benefits accounted for less than 10% of total benefits on all but the East corridor scenarios where they contributed between 20% and 30% for Stockholm alternatives and over 60% for Gothenburg alternatives.
As discussed, the Gravity Model only contained detail on estimated volume of travel by HSR. Estimates of the impacts of the forecast increase in HSR trips on reductions in person kilometres on other modes (due to mode switch) were made on the basis of JBV default assumptions. These provide estimates of the proportion of new trips on a rail scheme that are either generated (wholly new trips, 25%) or switched from other modes. These proportions were applied in conjunction with details of the nature of competing modes for each station to station journey considered (i.e. the presence or absence of coach or conventional rail alternatives). For the purposes of this assessment, the proportion switching from conventional rail was assumed to match the proportion identified in the guidance as switching from coach (15%), where relevant.
3.4.2.1.4. Conversion to NPV
In all cases, once estimates of the monetary value of user benefits had been identified by forecast year, they were converted to a NPV across the appraisal period through four additional steps:
Estimation of benefits in non modelled years – interpolated from the modelled years on the basis of a steady rate of growth in benefits between years;
Application of real growth in benefits, in line with GDP growth, assuming business benefits grow in line with GDP growth and non-business benefits grow at 80% of the rate of GDP growth;

Norway HSR Assessment Study - Phase III Economic and Financial Analysis, Final Report
Atkins Norway HSR Assessment Study - Phase III: Economic & Financial Analysis, Final Report 19
Application of a demand ramp up period – assuming that behaviour does not change instantly on introduction of an HSR alternative and therefore, over the first five years, benefits and revenue will grow from 80% of the forecast total in opening year, to 85% in the subsequent year, 90% in the third year, 95% in the fourth year and 100% in the fifth year;
Application of a discount factor, to discount benefits to a 2015 base (in line with JBV guidance). The central rate used is 4.5%.
3.4.2.2. Freight
Freight benefits were estimated by Significance using the Norwegian National Freight model on the basis of considering the impact of introducing 120kph lines and freight services on the total costs of transporting current freight levels in current economic conditions. Appendix D provides a summary of the estimated scale of impact by corridor and more detail on the assessment is provided in the Phase III Freight Analysis Report (Norway HSR Assessment Study Phase III: Freight Market Analysis, Final Report, January 2012).
It is noted that the estimate is likely to be conservative as it was based on current conditions only, without an allowance for future growth in demand or changes in relative costs of different modes (for instance changes in fuel prices). However, the value of the benefits estimated is assumed to grow in real terms through time, in line with GDP growth.
The freight benefits are converted to the NPV required for the appraisal by applying steps 2 to 4 above i.e. application of real growth in line with GDP, application of a ramp up period and a discount factor.
3.4.2.3. Third Party Impacts
The Phase III Environmental workstream produced an estimate of the net impact of each Scenario C/D HSR alternative on CO2 emissions for each year of a 60 year appraisal period (Norwegian High Speed Railway Project, Phase 3, Final report Version 2 - Environmental analysis – Climate, 03.02.2012, Asplan Viak AS, MISA AS). The estimates account for emissions associated with construction, renewals and operations (including mode shift from other modes as forecast by the Mode Choice Model for PSS1 for each alternative). Appendix E provides a summary of the results provided.
Simple adjustments to the estimated emissions impact associated with mode switch were made to account for the additional impacts of trips forecast using the Gravity Model and the impact of the change to PSS2. This involved comparing the change in person and vehicle kilometres for each mode with the level in the PSS1 Mode Choice Model assessment to identify a percentage difference. The forecast emissions changes calculated for PSS1 MCM for each non HSR mode were then factored by the identified difference to give the revised total change in emissions, accounting for Gravity Model trips and, where relevant, the impact of PSS2.
The change in HSR operational emissions associated with the switch to PSS2 was estimated by multiplying the operational emissions by the estimated percentage reduction in train kilometres associated with the change in service scenario.
These figures were then converted into monetary values using the price per tonne of CO2 set out in the JBV guidance (320 NOK per tonne until 2030 and 800 NOK beyond).
Noise, local air quality and accident impacts were all calculated using default rates within the JBV spreadsheet which link the level of impact to vehicle kilometres of travel. In the absence of more detailed information, HSR rates were assumed to equate to those for electric conventional trains. This is an area which would benefit from further development at later stages of appraisal, for instance building on the work undertaken during Phase III by Poyry on the safety impacts of selected alternatives (High Speed Rail Assessment, Phase 3, Report – Risk and Safety Analysis, 18.01.12, Pöyry)
As with user benefits, the forecast monetary values of third party impacts by forecast year were converted to the NPV required in the appraisal through four additional steps
Interpolation of impacts between modelled years;
Application of real growth factors (80% of GDP for environmental effects);
Application of ramp up factors; and
Application of discount factor.

Norway HSR Assessment Study - Phase III Economic and Financial Analysis, Final Report
Atkins Norway HSR Assessment Study - Phase III: Economic & Financial Analysis, Final Report 20
3.4.2.4. Revenue
The revenue for each mode in the Reference and Test Case was derived by multiplying the Mode Choice Model forecasts of demand between each origin and destination by the estimated fare for the journey. Subtracting the Reference Case revenue from the Test Case revenue then gave the estimated impact of the alternative on revenue associated with trips forecast using the Mode Choice Model.
The impact of the trips forecast in the Gravity Model was then accounted for by:
Identifying an average fare per person kilometre for the alternative for each mode and purpose from the Mode Choice Model (by dividing total revenue by total person kilometres); and
Multiplying the estimated change in person kilometres for each mode from the Gravity Model by the appropriate fare rate.
As for the other benefits, forecast impacts by model year were converted into the required NPV for the appraisal through three additional steps:
Interpolation of impacts between modelled years;
Application of ramp up factors; and
Application of discount factor.
3.4.2.5. Costs
The costs used in the appraisal were based largely on the output from the Financial Model which provided capital and life cycle costs on a year by year basis over both a 25 year and 40 year appraisal period. These were in turn based on the output costs by alternative provided from the Cost Model, as summarised for Scenarios C/D and B in Tables 4 and 5 below. For the 60 year appraisal period sensitivity test, it was assumed that ongoing life-cycle costs (operating, maintenance and renewals) would continue at the same average annual rate over 60 years as over 40 years.
Table 4. Scenario C and D Headline Capital and Life-cycle costs (BnNOK, Q4 2011 prices, undiscounted)
Corridor Alternative Ref. Capital Cost (BnNOK)
LCC 25 Year Costs (BnNOK)
LCC 40 Year Costs (BnNOK)
North G3:Y (250kph) 185.49 54.38 115.88
Ø2:P (330kph) 145.36 47.52 99.38
West N1:Q (250kph) 158.89 43.26 95.22
HA2:P (330kph) 167.80 41.41 91.16
H1:P (330kph) 262.05 76.93 163.04
BS1:P (330kph) 114.71 29.23 64.86
South S8:Q (250kph) 218.88 59.55 133.06
S2:P (330kph) 222.06 56.90 128.66
East ST5:U (250kph) 129.33 29.10 55.52
ST3:R (330kph) 114.24 25.72 50.09
GO3:Q (250kph) 66.32 44.96 91.98
GO1:S (330) 69.02 43.82 87.77

Norway HSR Assessment Study - Phase III Economic and Financial Analysis, Final Report
Atkins Norway HSR Assessment Study - Phase III: Economic & Financial Analysis, Final Report 21
Table 5. Scenario B Headline Capital and Life-cycle costs (BnNOK, Q4 2011 prices)
Scenario B Corridor Capital Cost (Bn NoK)
LCC 25 Year Costs (BnNOK)
LCC 40 Year Costs (BnNOK)
North (Trondheim) 63.12 16.26 37.56
West (Bergen) 35.46 7.43 19.04
South (Stavanger) 52.75 11.55 28.09
East (Stockholm) 7.25 4.22 8.00
These inputs were converted to the NPV required for the appraisal through the following stages:
Application of real growth in construction (and renewal) costs at a rate of 1.9% above standard inflation until 2025 (in the Alternative Framework only);
Application of discount factor;
Application of an allowance for the cost to the economy of the taxation required to finance the scheme through public sector funding (identified as 20% of the NPV of construction costs and any ongoing subsidy, offset by an allowance for the increase in tax receipts associated with business journey cost savings generated by the scheme);
Inclusion of an allowance for the residual value of the assets at the end of the appraisal period. In line with JBV guidance, this was calculated using the assumption of linear depreciation in value across an asset‟s life. For the 25 and 40 year appraisal periods, calculations were undertaken on an asset by asset basis, accounting for asset life and renewal regime. For simplicity, for the 60 year appraisal period sensitivity test, it was assumed that the value of residuals would decline at the same annual rate between 2043 and 2060 as between 2024 and 2043.
3.5. Key Assumptions The calculations described above require the input of a number of parameters and assumptions to convert the forecast impacts of each alternative into the required monetary values. Where possible, values have been taken from Norwegian national guidance, JBV guidance or from the Stated Preference survey undertaken to support the model development for this study.
A summary of key numerical assumptions and their sources is provided in Table 6 below, with supporting additional detail in Appendices F (the Technical Note provided by Ernst and Young to describe the Financial Model) and G.
Further assumptions on the delivery of the alternatives include the assumptions that the alternatives would all be entirely government funded and financed from tax revenue, that rolling stock would be leased and the system would be managed and operated by the public sector, without a franchise or infrastructure charging regime.
As in the demand forecasting process, it has also been assumed that there is no change in the provision of infrastructure or services for other modes in response to the introduction of HSR.
The construction start date for each alternative was assumed to be 2017 with operations starting between 2022 and 2027, depending on the forecast construction period for each alternative (as set out in Chapter 2).

Norway HSR Assessment Study - Phase III Economic and Financial Analysis, Final Report
Atkins Norway HSR Assessment Study - Phase III: Economic & Financial Analysis, Final Report 22
Table 6. Summary of Key Assumptions/Parameters
Assumption/ Parameter Standard Framework Value
Alternative Framework Value
Sensitivity Test Values
Source
Discounted Assessment
Appraisal Period (years) 25 40 25 and 60 (for Alternative Framework)
25 years – JBV/Norwegian guidance
40 years/sensitivity tests – Phase II international review
Discount Rate 4.5% 4.5% 2% and 5.5% JBV/Norwegian Guidance
Price Base 2009 2009 N/A JBV Guidance
Appraisal Base 2015 2015 N/A JBV Guidance
Conversion of third party impacts to monetary values
Cost/tonne of CO2 emissions
320 NOK to 2030
800 NOK beyond 2030
320 NOK to 2030
800 NOK beyond 2030
N/A JBV/Norwegian Guidance
Value of accidents/vehicle km
JBV guidance JBV guidance N/A JBV guidance – see Appendix G
Value of local air quality impacts/vehicle km
JBV guidance JBV guidance N/A JBV guidance – see Appendix G
Value of noise impacts/vehicle km
JBV guidance JBV guidance N/A JBV guidance – see Appendix G
Real growth in benefits
GDP Growth 1.6% p.a. 1.6% p.a. N/A JBV guidance
Growth in business user benefits
100% GDP growth rate
100% GDP growth rate
N/A JBV guidance
Growth in non business user benefits
80% GDP growth rate
80% GDP growth rate
N/A JBV guidance
Growth in environmental/accident impacts
80% GDP growth rate
80% GDP growth rate
N/A JBV guidance
Costs
Real growth in costs above standard inflation
N/A 1.9% p.a. to 2025
0% Standard Framework – JBV guidance
Alternative Framework -
Ernst and Young analysis of recent trends. See Appendix F.
Additional cost of financing through taxation
20% NPV of public sector costs
20% NPV of public sector costs
N/A JBV guidance
Additional tax received as proportion of additional business user benefits
9% of benefits 9% of benefits N/A JBV guidance

Norway HSR Assessment Study - Phase III Economic and Financial Analysis, Final Report
Atkins Norway HSR Assessment Study - Phase III: Economic & Financial Analysis, Final Report 23
3.6. Impacts Excluded For clarity, it is worth noting that a number of impacts are excluded from the appraisals presented in this report, largely reflecting availability of data and/or the stage of the study. In particular these include:
Detailed calculation of intermediate and shorter distance (<100km) HSR demand related benefits - an approximate approach based on the Gravity Model described in the Model Development Report (Norway HSR Assessment Study Phase III: Model Development, Final Report, January 2012) has been used for Phase III;
Detailed assessment of the response of other operators and consideration of consequential / residual network changes. It was beyond the practical scope of the study to address these complex issues in appropriate detail for the large number of alternatives being considered in Phase III;
Detailed calculation of accident, noise and local air quality impacts - the necessary data was not available to enable a detailed assessment for each corridor and alternative so the JBV default approach of linking impacts to change in vehicle kilometres was used for this phase to ensure consistency between alternatives;
Detailed calculation of Wider Economic Impacts – full calculations require detailed local and national economic data which is not currently available for Norway. These impacts have therefore been represented through indicative allowances in sensitivity tests;
HSR freight market benefits based on future year forecasts - specifying and revising Norway Freight Model for future years was beyond the practical scope of the study in this phase;
Impacts during construction - assessing these impacts would require detail of construction phasing and design which is not available at this stage;
Impact of adopting any alternative funding and delivery structures – no specification of likely alternatives was available to be tested at this stage.
However the majority of impacts have been captured in the appraisal and the results provide a sound basis for undertaking the comparative assessments of alternatives required at this stage.
3.7. Summary Option appraisal provides a structured approach for comparing the costs and impacts of alternatives on a consistent basis. The analysis presented in this report focuses on economic appraisal (looking at those costs and benefits of the alternative across society that can be allocated a monetary value) and financial appraisal (comparing the direct monetary income and outgoings associated with the alternative once operational).
Two frameworks have been used to structure the appraisal. The Standard Framework meets the mandated need for the study to be consistent with Norwegian guidance and the Alternative Framework extends the Standard Framework to increase its relevance for HSR assessment, on the basis of research undertaken during Phase II. Both Frameworks rely on a number of inputs, calculations and assumptions/parameters, as summarised above.

Norway HSR Assessment Study - Phase III Economic and Financial Analysis, Final Report
Atkins Norway HSR Assessment Study - Phase III: Economic & Financial Analysis, Final Report 24
4. Core Economic Appraisal Results
4.1. Introduction This chapter presents the Standard and Alternative/Extended Framework economic appraisal results for the core Scenario C/D alternatives for both service scenario PSS1 and PSS2.
The first section presents a summary of results across all corridors, drawing out common patterns and impacts. The subsequent sections then provide more detailed comments and comparisons for the alternatives within each corridor before a final concluding summary.
When interpreting the results it is important to recognise that the study has focussed on undertaking a consistent appraisal to understand the comparative performance of a large number of alternatives across several corridors. The aim is therefore to indicate the level of economic and financial performance that might be delivered by HSR in Norway „in principle‟, rather than determining the absolute economic and financial performance in detail, which would not be practical at this stage.
Consequently, the alternatives have not yet been optimised for economic or financial return (in terms of issues such as service frequencies and stopping patterns). The assessments therefore provide a basis for the consistent comparison of alternatives, as intended, but there is likely to be significant scope to reduce costs and improve benefits and financial return with more detailed alternative development at a later stage.
Unless otherwise stated, results are in MnNOK and in net present value (NPV) terms, discounted to 2015 and in 2009 prices (in line with JBV guidance (Metodehåndbok JD 205, Samfunnsokonomiske analyser for jernbanen, versjon 3.0 juli 2011)).
4.2. Overview of Results for All Corridors
4.2.1. User Benefits, Revenue and Third Party Impacts The key benefits associated with the introduction of HSR are the improvements in journey alternatives and costs for passengers (including time and quality) and the revenue received by the operator (although this is offset by losses in revenue for other modes as passengers switch away to HSR). Impacts on third parties can be either positive or negative, depending particularly on the scale of impact on CO2 emissions (as discussed further in the Phase III Climate Report (Norwegian High Speed Railway Project, Phase 3, Final report Version 2 - Environmental analysis – Climate, 03.02.2012, Asplan Viak AS, MISA AS)
Figures 2 and 3 summarise the scale of these impacts for all HSR alternatives across all corridors, under service scenarios PSS1 and PSS2, appraised using the Standard and Alternative Frameworks respectively. The „Net Benefit‟ indicator diamond in each column identifies the net effect of the four other impacts presented for each scenario. The first column in each pair for each alternative refers to PSS1 (with peak services and fares at 60% of air fares) and the second to PSS2 (without peak services and with fares at 100% of air fares).

Norway HSR Assessment Study - Phase III Economic and Financial Analysis, Final Report
Atkins Norway HSR Assessment Study - Phase III: Economic & Financial Analysis, Final Report 25
Figure 2. User Benefits, Revenue and Third Party Impacts, Standard Framework (NPV, MnNOK, 2009 prices, 2015 base, 25 year appraisal period)
Figure 3. User Benefits, Revenue and Third Party Impacts, Alternative Framework (NPV, MnNOK, 2009 prices, 2015 base, 40 year appraisal period)
-40000
-20000
0
20000
40000
60000
80000
100000
N_
G3
Y_1 2
N_
O2
P_
1 2
W_
N1
Q_
1 2
W_
HA
2P
_1 2
W_
H1
P_
1 2
W_
BS1
P_
1 2
S_S8
Q_
1 2
S_S2
P_
1 2
E_ST
5U
_1 2
E_ST
3R
_1 2
E_G
O3
Q_
1 2
E_G
O1
S_1 2
NP
V M
illio
n N
OK
, 20
09
Pri
ces,
25
ye
ar a
pp
rais
al
pe
rio
d Other Mode Revenue
HSR Revenue
Third Party Impacts
User Benefits
Net Benefit
North G3Y Oslo – Trondheim (Hamar & Gudbrandsdalen) South S8Q Oslo – Stavanger (via Vestfold)
O2P Oslo – Trondheim (Østerdalen) S2P Oslo – Stavanger (direct)
West N1Q Oslo – Bergen (Numedal) East ST5U Oslo – Stockholm (via Ski)
Ha2P Oslo – Bergen (Hallingdal) ST3R Oslo – Stockholm (via Lillestrøm)
H1P Oslo–Bergen (Haukeli)/Oslo–Stavanger/Bergen–Stavanger GO3Q Oslo – Gothenburg (via Moss)
BS1P Bergen – Stavanger (coastal route) GO1S Oslo – Gothenburg (direct)
-40000
-20000
0
20000
40000
60000
80000
100000
120000
N_
G3
Y_1 2
N_
O2
P_
1 2
W_
N1
Q_
1 2
W_
HA
2P
_1 2
W_
H1
P_
1 2
W_
BS1
P_
1 2
S_S8
Q_
1 2
S_S2
P_
1 2
E_ST
5U
_1 2
E_ST
3R
_1 2
E_G
O3
Q_
1 2
E_G
O1
S_1 2
NP
V M
illio
n N
OK
, 20
09
Pri
ces,
40
ye
ar a
pp
rais
al
pe
rio
d Other Mode Revenue
HSR Revenue
Third Party Impacts
User Benefits
Net Benefit

Norway HSR Assessment Study - Phase III Economic and Financial Analysis, Final Report
Atkins Norway HSR Assessment Study - Phase III: Economic & Financial Analysis, Final Report 26
4.2.1.1. Variation in benefits
The graphs show considerable variation between the alternatives that produce the lowest and highest levels of benefits. H1:P generates net benefits almost five times as great as those generated by BS1:P (70 BnNOK relative to 15 BnNOK, over 40 years in PSS1, Alternative Framework). However, H1:P is not directly comparable with the other alternatives as it has a „Y‟ shape enabling it to serve three routes rather than one.
The net impacts of most of the single route alternatives in the North, West, South and Stockholm East corridors are more consistent, with net benefits ranging between just under 40 BnNOK and 50 BnNOK (NPV, 40 years, Alternative Framework). The Gothenburg East corridor net benefits are however about 25% lower at just under 30 BnNOK.
4.2.1.2. Source of benefits
In all alternatives, user benefits are the most significant contributors to total benefits. HSR revenue levels are also significant but the gains are typically largely offset by reductions in revenue on other modes (particularly air). These losses equate to between 70% and 80% of the HSR revenue gains in PSS1. The higher fares and associated revenue in PSS2 mean that the proportion offset is reduced to around 50% and less for most alternatives. This improves the financial performance of the alternatives, as discussed further in Chapter 6.
Net third party impacts (accounting for CO2 emissions, accidents, noise and local air quality effects) are only a marginal contributor to the overall economic appraisal in all alternatives.
The estimated freight impacts are included in the user benefit total but only account for a small proportion of the total, ranging from 5% for the West corridor alternatives to Bergen and 2% to 3% on the South corridor alternatives to negligible for the East corridor As outlined in Chapter 3, these estimates are likely to be an underestimate, particularly because of their focus on current economic conditions. However they highlight the fact that freight will not be a dominant source of benefits for any of the alternatives considered.
4.2.1.3. Influences on user benefits
The scale of personal travel user benefits generated by each alternative depends on both;
The scale of travel demand on the route and consequently the scale of potential HSR market; and
The scale of door to door journey cost advantage that HSR offers for the route served compared to the alternatives available (by air, car, conventional rail or coach). Benefits typically result from a trade off of losses on some journey elements and gains on others. For instance, those switching from air often experience an increase in in-vehicle time that is more than offset by other improvements in journey costs such as improved wait time and/or access/egress time and reduced fares. The balance might be different for some of the shorter movements, for instance trading off an increase in access/egress time for shorter in-vehicle times (for example, if switching from conventional rail).
These factors vary between the corridors and alternatives, leading to the variation in benefits shown in the Figures 2 and 3.
Similarly, levels of revenue generated depend on passenger numbers and fares paid. The patterns and levels of benefits experienced for each alternative are therefore strongly influenced by the patterns of demand described in the Phase III Demand Report (Norway HSR Assessment Study Phase III: Market, Demand and Revenue Analysis, Final Report, January 2012), with the greatest benefits and revenue typically seen on the routes with the greatest levels of longer distance demand, such as Ø2:P.
Average benefits experienced per HSR passenger are broadly consistent between alternatives, ranging between 280 and 330 NOK per trips (in 2024, 2009 prices) for most alternatives in PSS1. The Gothenburg alternatives experience lower than average benefits per trip (approximately 220 NOK per trip), reflecting the shorter length of these alternatives which leads to limited scope for journey improvements.
BS1:P delivers the greatest benefit per passenger (360 NOK in PSS1). However, the limited levels of demand on the route result in limited total levels of user benefits and revenue (the lowest levels across all the alternatives).
Similarly, the relatively limited demand for the routes in the East corridor (particularly to Gothenburg), combine with the relatively low benefits per trip to produce low overall levels of total benefit accrued.

Norway HSR Assessment Study - Phase III Economic and Financial Analysis, Final Report
Atkins Norway HSR Assessment Study - Phase III: Economic & Financial Analysis, Final Report 27
The high levels of demand for the H1:P alternative mean that it delivers the greatest total benefits of all the alternatives. However, it is not directly comparable with the other alternatives as it is a „Y‟ shaped scheme rather than a single line, with two branches allowing services between three large urban areas (Oslo – Bergen, Oslo – Stavanger and Bergen – Stavanger).
Across all alternatives, the majority of benefits are accrued by business trips which typically account for just over 50% of demand but around 70% of private user benefits, reflecting the greater monetary valuation attributed to business trips (particularly a higher valuation of time savings).
In general the greatest benefits are experienced on longer distance trips, particularly those travelling the whole length of the route. The balance of benefits between end to end journeys and intermediate journeys varies between alternatives, reflecting the characteristics of the corridor and pattern of stops served, as discussed further below.
PSS2 reduces user benefits for each alternative by about 30%. This reflects the reduction in journey benefits caused by reduced service frequency and increased fares which reduce the level of demand and reduce the average benefit per passenger by about 5% on average. The reduction in demand in each alternative is particularly focussed on non-business trips.
However, despite the reduced patronage, the increased fares associated with PSS2 lead to revenue levels that are over 15% greater than PSS1 across the alternatives, improving the alternatives‟ financial performance, as discussed further in Chapter 6.
4.2.1.4. Comparison of Assessment Frameworks
The results from the Standard and Alternative/Extended Frameworks shown in Figures 2 and 3 illustrate similar patterns in terms of the relative performance of the different alternatives.
The scale of benefits is greater in the Alternative Framework for all alternatives. This mainly reflects the longer appraisal period (40 years rather than 25 years), which increases benefits through two key influences:
The longer time span for benefits to accrue;
Increased value of benefits in later years, due to demand growth which leads to increased passenger numbers as well as assumed real growth in time and environmental benefits, in line with GDP growth, balanced by the increased impact of discounting in later years.
However, the difference between the user benefits forecast in the Standard and Alternative Frameworks also reflects the difference between the „rule of half‟ and „logsum‟ approaches to user benefit calculations. The results show that there is greater variation between alternatives and between Service Scenarios in the Standard Framework results.
As described in Chapter 3, the Alternative Framework has been devised specifically for this study and is therefore able to use the „logsum‟ approach which draws directly on transport costs as represented in the Mode Choice Model when calculating user benefits. This means that it can make use of the specific form of model used, rather than using the approximations implicit in the „rule of half‟ (described in Chapter 3) and the generalised estimates of the relative value of different elements of journey costs (such as waiting and walking time) as specified in the Standard Framework.
The use of different journey costs in the modelling and appraisal processes (as in the Standard Framework) can lead to inconsistencies in the travel patterns modelled and appraised, leading to counter intuitive results such as the large variation in user benefits between PSS1 and PSS2 for some alternatives and the presence of slight negative user benefits for alternative BS1:P in Figure 2.
These negative impacts can not be a realistic reflection of the effect of BS1:P as it is specified as only bringing improvements to transport users, without causing disbenefits to any existing users. They therefore reflect the inconsistencies between the modelling and appraisal approach in the Standard Framework which mean that passengers can be represented as choosing an alternative that appears lower cost than the Reference Case when considered in terms of the costs used in the Mode Choice Model but is more expensive when considered in terms of the cost valuations used for appraisal.

Norway HSR Assessment Study - Phase III Economic and Financial Analysis, Final Report
Atkins Norway HSR Assessment Study - Phase III: Economic & Financial Analysis, Final Report 28
For instance, the Mode Choice Model (and underpinning Stated Preference survey results) differentiates less between the perceived „cost‟ of access/egress time and in vehicle time and more between wait time and in-vehicle time than the Standard Framework assumptions (in which each minute of access/egress time is assumed to be perceived as the equivalent of 1.4 minutes of in vehicle time and each minute of wait time below 30 minutes to be perceived as 1.04 minutes of in vehicle time).
In alternatives such as BS1:P, where passengers select HSR on the basis of factors including increased access/egress time but reduced wait time, their change is valued as a reduced journey cost in the modelling (and Alternative Framework appraisal). However, it can be valued as a disbenefit in the Standard Framework in certain circumstances as the value of the increase in access/egress time is accentuated and the relative value of the wait time saving is decreased by the different valuations applied in appraisal.
For these reasons, the Alternative Framework is preferred as a means of comparing the impacts of the alternatives and is the main focus for the corridor specific analysis below.
4.2.2. Overall Economic Appraisal Results The overall economic appraisal of each alternative combines the benefits outlined above with the costs of construction, operation, maintenance and renewal (including the cost of financing the scheme through taxation).
Figures 4 and 5 below show the results of the economic appraisal for each alternative, under scenarios PSS1 and PSS2, using the Standard and Alternative Frameworks respectively. They follow the same format as the graphs presented above, with the first column for each alternative representing PSS1 and the second representing PSS2. The user benefits and third party impacts shown in Figures 2 and 3 above have been combined in a single entry and the revenue has been combined with the costs of construction and operation to provide a net impact on the public sector. The indicator diamond in each column shows the net effect of all the impacts and represents the Net Present Value (NPV) of each alternative. The detailed data underlying the graphs is provided in Tables 7 and 8 at the end of the Chapter.
Figure 4. Economic Appraisal Results, Standard Framework (NPV, MnNOK, 2009 prices, 2015 base, 25 year appraisal period)
-250000
-200000
-150000
-100000
-50000
0
50000
100000
N_
G3
Y_1 2
N_
O2
P_
1 2
W_
N1
Q_
1 2
W_
HA
2P
_1 2
W_
H1
P_
1 2
W_
BS1
P_
1 2
S_S8
Q_
1 2
S_S2
P_
1 2
E_ST
5U
_1 2
E_ST
3R
_1 2
E_G
O3
Q_
1 2
E_G
O1
S_1 2
NP
V M
illio
n N
OK
, 20
09
Pri
ces,
25
ye
ar a
pp
rais
al
pe
rio
d
NPV Public Sector/Operator Impacts
NPV User Benefits and Third Party Impacts
Overall NPV

Norway HSR Assessment Study - Phase III Economic and Financial Analysis, Final Report
Atkins Norway HSR Assessment Study - Phase III: Economic & Financial Analysis, Final Report 29
Figure 5. Economic Appraisal Results, Alternative Framework (NPV, MnNOK, 2009 prices, 2015 base, 40 year appraisal period)
Again the patterns of results and relative performance of alternatives are similar for both appraisal frameworks, although the 40 year appraisal period increases the value of both costs and benefits.
The increase in benefits reflects the additional years of benefits and their increase in scale in later years as outlined above. The greater scale of costs in the Alternative Framework period, also reflects two key influences:
The longer time span for operating, maintenance and particularly renewal costs, adding 15% to 20% to the PVC. The cost of renewals increases disproportionately with the increase in appraisal period, because a significant proportion of the capital infrastructure will require renewal between the 25
th and
40th year of operation; and
The inclusion of real growth in capital costs above standard inflation in the Alternative Framework (but not the Standard Framework). As described in Chapter 3 this reflects the trend for construction costs to exceed standard inflation and adds about 20% to construction and renewal costs.
In all cases, the lifetime costs of the alternatives exceed the monetised benefits accrued over the appraisal period. Total costs are typically five to ten times greater than benefits in the Alternative Framework (and over ten times as great in the Standard Framework).
Consequently, all alternatives generate a negative NPV, with negative values exceeding -100 BnNOK for all alternatives except those in the East corridor. These net effects reflect the combination of; firstly the scale and physical challenge of the alternatives and the associated substantial construction costs and secondly the relatively limited scope for benefit generation from the available market. This limited scope is a consequence of the fact that the population served is generally dispersed and already relatively well served by existing modes (particularly air), meaning that the provision of HSR does not reduce journey costs and times substantially.
In line with these factors, the key influence on overall NPV for the alternatives is the scale of cost, as the value of benefits is typically less than 20% of the value of costs. Consequently, H1:P has the largest negative NPV (approximately -250 BnNOK, 2009 prices, Alternative Framework), reflecting the fact that it is the longest and most expensive alternative by a significant extent (consisting of two branches). Similarly, the relatively small negative NPVs associated with the Gothenburg corridor alternatives (less than -70 BnNOK, NPV 2009 prices) reflect their smaller scale and limited need for structures along the route.
-350000
-300000
-250000
-200000
-150000
-100000
-50000
0
50000
100000
N_
G3
Y_1 2
N_
O2
P_
1 2
W_
N1
Q_
1 2
W_
HA
2P
_1 2
W_
H1
P_
1 2
W_
BS1
P_
1 2
S_S8
Q_
1 2
S_S2
P_
1 2
E_ST
5U
_1 2
E_ST
3R
_1 2
E_G
O3
Q_
1 2
E_G
O1
S_1 2
NP
V M
illio
n N
OK
, 20
09
Pri
ces,
40
ye
ar a
pp
rais
al
pe
rio
d
NPV Public Sector/Operator Impacts
NPV User Benefits and Third Party Impacts
Overall NPV

Norway HSR Assessment Study - Phase III Economic and Financial Analysis, Final Report
Atkins Norway HSR Assessment Study - Phase III: Economic & Financial Analysis, Final Report 30
In all cases there is very little difference between the NPVs for PSS1 and PSS2. Whilst user benefits are decreased by the reduced service and increased fares in PSS2 (relative to PSS1), revenue levels are increased and the two effects balance very closely across the alternatives leading to almost no change in NPV as shown above in Figure 5.
4.3. North Corridor
4.3.1. Alternatives Considered As described in Chapter 2, two alternatives have been considered in detail for the North Corridor:
G3:Y - which leaves the existing line just north of Gardermoen Airport and follows the existing rail corridor via Hamar and Gudbrandsdalen to Trondheim and Værnes Airport. Designed for 330 kph rail passenger and freight traffic between Gardermoen and Trondheim; and
Ø2:P – which also leaves the existing route 60km north of Gardermoen, via a new station near Elverum, before continuing along the Østerdalen to Trondheim and Værnes Airport. Designed for 330 kph rail passenger and freight traffic for the majority of the route between Gardermoen and Trondheim.
Figures 6 and 7 summarise the user benefits, revenue and third party impacts and overall economic appraisal results for these alternatives under scenarios PSS1 and PSS2, based on the Alternative Framework calculations.
Figure 6. User Benefits, Revenue and Third Party Impacts: PSS1 and PSS2, Alternative Framework (NPV, MnNOK, 2009 prices, 2015 base)
Figure 7. Economic Appraisal Results: PSS1 and PSS2, Alternative Framework (NPV, MnNOK, 2009 prices, 2015 base)
4.3.2. User Benefits, Revenue and Third Party Impacts The figures show that under PSS1, G3:Y delivers net benefits of nearly 40 BnNOK (NPV,2009 prices),whilst the equivalent figure for Ø2:P is 30% greater at nearly 50 BnNOK (NPV, 2009 prices).
In both cases the net benefits delivered under PSS2 are about 10% smaller than those delivered in PSS1, reflecting the impact of the reduced service provision and increased fares in PSS2.
User benefits account for about 85% of total benefits in PSS1 in each alternative. Although HSR revenue gains are significant, they are mainly offset by the revenue losses experienced by other modes as passengers switch to HSR, equating to 75% of HSR gains in PSS1.
-40000
-20000
0
20000
40000
60000
80000
100000
G3Y
_1 2
O2
P_1
2
NP
V M
nN
OK
, 2
00
9 P
rice
s,
40
yr
app
rais
al Other Mode Revenue HSR Revenue
Third Party Impacts User BenefitsNet Benefit
-250000
-200000
-150000
-100000
-50000
0
50000
100000
150000G
3Y_
1 2
O2
P_
1 2
NP
V M
nN
OK
, 2
00
9 P
rice
s, 4
0 y
r ap
pra
isal
NPV Public Sector/Operator Impacts
NPV User Benefits and Third Party Impacts
Overall NPV

Norway HSR Assessment Study - Phase III Economic and Financial Analysis, Final Report
Atkins Norway HSR Assessment Study - Phase III: Economic & Financial Analysis, Final Report 31
The increase in fares and reduction in services in PSS2 changes the balance of benefits, with user benefits accounting for about 65% of the total. HSR revenue accounts for a higher percentage than in PSS1 because the higher fares mean that the decrease in revenue on other modes only offsets about 50% of HSR revenue gain.
Freight (shown as part of user benefits in the graphs) accounts for less than 1% of total benefits for both alternatives.
Third party impacts are also negligible, particularly in G3:Y where the large CO2 emissions of construction are not quite offset by savings during operation over the 40 year period. Ø2:P achieves a slight decrease in emissions over the time frame.
Short trips of under 100km forecast by the Gravity Model also contribute very little to the benefits generated by either alternative (less than 5%).The difference between the alternatives is influenced by the fact that Ø2:P provides a more direct route to Trondheim (including one less intermediate stop than G3:Y) providing a shorter end to end journey time and greater benefits for the long distance trips between Trondheim and Oslo. Consequently, Ø2:P attracts more long distance trips so that, although HSR demand levels are similar for the two alternatives, Ø2:P results in approximately 10% more person kilometres.
The dominance of longer trips contributes both to greater revenue generation, with Ø2:P generating over 15% more revenue than G3:Y, contributing to the greater overall benefits, and to greater average benefits per trip for Ø2:P. The average value for Ø2:P is 330 NOK per HSR trip PSS1 and 310 NOK per HSR trip in PSS2. The equivalent G3:Y figures are about 15% lower at 285 NOK and 270 NOK per trip respectively (all 2024, 2009 prices/values).
The longer trips are also reflected in the location of the benefits accrued. Although in both alternatives over 55% of benefits are derived from end to end journeys, the figure is nearly 70% for Ø2:P.
4.3.3. Overall Economic Appraisal Figure 7 above shows that, when the benefits are combined with costs to produce the overall economic appraisal, Ø2:P performs the more strongly of the two alternatives. For both PSS1 and PSS2, the scale of the negative NPV is nearly 30% smaller for Ø2:P than it is for G3:Y.
This net effect is the result of the generation of greater benefits, as discussed above, and lower construction and renewal costs (more than 20% lower than G3:Y costs), reflecting the fact that the route is about 10% shorter and has less requirement for structures than G3:Y.
4.4. West Corridor
4.4.1. Alternatives Considered Four alternatives have been assessed in detail for the West Corridor, as described in Chapter 2:
Alternative N1:Q – which leaves the existing line at Drammen and follows the Numedal to Geilo, with this section designed for 330 kph rail passenger and freight traffic. The line from Geilo to Bergen predominantly follows the existing route and is designed for 250 kph traffic;
Alternative HA2:P - which involves a new direct line between Sandvika and Hønefoss before following the existing rail corridor to Bergen. It is designed for 330 kph rail passenger and freight traffic between Oslo and Geilo, and 330 kph rail passenger traffic only from Geilo to Bergen;
Alternative H1:P - which involves a Y-shaped network linking Oslo with both Bergen and Stavanger with two branches joining at Røldal, enabling services between Oslo – Bergen, Oslo – Stavanger and Bergen – Stavanger. The whole network is designed for 330 kph rail passenger and freight traffic, with the exception of Haugesund – Stavanger which is for passenger traffic only; and
Alternative BS1:P - which follows an alternative alignment between Stavanger and Bergen along the coast via the towns of Haugesund and Leirvik (Stord), and is designed for 330 kph rail passenger traffic.
Figures 8 and 9 summarise the user benefits, revenue and third party impacts and overall economic appraisal results for these alternatives under scenarios PSS1 and PSS2, based on the Alternative Framework calculations.

Norway HSR Assessment Study - Phase III Economic and Financial Analysis, Final Report
Atkins Norway HSR Assessment Study - Phase III: Economic & Financial Analysis, Final Report 32
Figure 8. User Benefits, Revenue and Third Party Impacts: PSS1 and PSS2, Alternative Framework (NPV, MnNOK, 2009 prices, 2015 base)
Figure 9. Economic Appraisal Results: PSS1 and PSS2, Alternative Framework (NPV, MnNOK, 2009 prices, 2015 base)
4.4.2. User Benefits, Revenue and Third Party Impacts
4.4.2.1. Variation in benefits
The figures show there is considerable variation in the scale of benefit delivered by the four alternatives, varying between approximately 70 BnNOK for H1:P and 15 BnNOK for BS1:P, with HA2:P and N1:Q lying between, each with net benefits of just over 40 BnNOK. H1:P and BS1:P deliver the highest and lowest levels of benefit across all of the alternatives in all corridors respectively.
In all cases the total net benefits delivered under PSS2 are about 5% -10% smaller than those delivered in PSS1, reflecting the reduced service provision and increased fares in PSS2.
To a large extent the variation in estimated benefits reflects considerable differences in the nature of the alternatives. Whilst N1:Q and HA2:P are broadly comparable, providing different routes to Bergen, BS1:P is a relatively short coastal section between Bergen and Stavanger and H1:P is „Y shaped‟ and serves three corridors, Oslo to Bergen, Oslo to Stavanger and Bergen to Stavanger.
4.4.2.2. Oslo to Bergen Single Line Alternatives (N1:Q and HA2:P)
The overall performance of N1:Q and HA2:P is very similar. HA2:P provides a more direct route with only three stops between Oslo and Bergen, compared to five in N1:Q. Consequently, demand and benefits are more focussed on end to end journeys along the whole route which account for over 50% of trips in HA2:P compared to approximately 40% in N1:Q. The equivalent figures for benefits are approximately 70% and 50% respectively.
As the HA2:P trips are longer on average, the average benefit per HSR trip is also over 10% greater (320 NOK per trip compared to 285 NOK per trip in 2024, 2009 prices, PSS1). However, total demand is 10% to 15% lower as HA2:P does not attract the movements between and to and from the intermediate large towns of Drammen and Kongsberg which account for a significant proportion of demand and therefore benefits in N1:Q.
The net effect is that total benefits are very similar for the two alternatives, with HA2:P generating total benefits that are less than 3% greater than N1:Q.
-40000
-20000
0
20000
40000
60000
80000
100000
120000
140000N
1Q
_1 2
HA
2P
_1 2
H1
P_
1 2
BS1
P_
1 2
NP
V M
nN
OK
, 2
00
9 P
rice
s,
40
yr
app
rais
al p
eri
od Other Mode Revenue HSR Revenue
Third Party Impacts User BenefitsNet Benefit
-350000
-300000
-250000
-200000
-150000
-100000
-50000
0
50000
100000
150000
N1
Q_
1 2
HA
2P
_1 2
H1
P_
1 2
BS
1P
_1 2
NP
V M
nN
OK
, 2
00
9 P
rice
s, 4
0 y
r a
pp
rais
al
pe
rio
d NPV Public Sector/Operator ImpactsNPV User Benefits and Third Party Impacts
Overall NPV
Norway HSR Assessment Study - Phase III Economic and Financial Analysis, Final Report
Atkins Norway HSR Assessment Study - Phase III: Economic & Financial Analysis, Final Report 33
Freight impacts contribute less than 5% to total benefits for each alternative and net third party impacts are negligible. The trips of under 100 km that are forecast using the Gravity Model also contribute less than 5% to total benefits for both alternatives.
PSS2 has a similar impact on both relative to PSS1, reducing demand, particularly for non-business trips, by about 30% and reducing the average benefit per trip (due to the increase in fares and reduction in service). In each case total user benefits are reduced by about 30% relative to PSS1 and total benefit (including revenue and third party effects) is reduced by 5% to 10%. The impact is slightly greater on the intermediate movements which are more dominant in N1:Q and therefore the differential between HA2:P and N1:Q benefits is slightly greater in PSS2, but the difference is still only 5%
4.4.2.3. H1:P and BS1:P
The total benefits delivered by H1:P are over 75% greater than those delivered by N1:Q and HA2:P (under the Alternative Framework) reflecting the fact that the alternative serves three corridors, linking three large urban areas: Oslo, Bergen and Stavanger. The average benefit per trip is similar to that for HA2:P (nearly 330 NOK per HSR trip, 2024, 2009 prices) but demand is about 80% greater, leading to the increase in overall benefits.
Benefits are again focussed on trips between termini (Oslo, Bergen and Stavanger) which account for about 70% of demand and 75% of benefits.
Gravity Model trips of under 100 km and freight impacts again contribute less than 5% to total benefits for this alternative. The scale of net third party impacts is small but negative reflecting the fact that the carbon emissions associated with construction of this large alternative are not offset by operational savings and the scale of switch from air generates an estimated increase in accidents.
Alternative BS1:P delivers the greatest benefit per individual long distance HSR trip of all alternatives (360 NOK/trip, 2024, 2009 prices). However, the limited market served by the relatively short coastal route leads to limited total demand which is less than 35% of that for HA2:P. The result is that benefits are only approximately 40% of those for HA2:P.
Demand and benefits for these alternatives are more focussed on business trips than for other alternatives, as they account for over 65% of demand and 85% of benefits.
Also in contrast to other alternatives, the under 100 km trips forecast by the Gravity Model have a significant impact on benefits in BS1:P, adding about 20%, particularly due to trips between Haugesund and Stavanger.
4.4.3. Overall Economic Appraisal Figure 9 shows that when the benefits discussed are combined with costs to provide the overall economic appraisal for the alternatives, the variation between alternatives is again evident. The scale of negative NPV varies between -145 BnNOK for BS1:P and -250 BnNOK for H1:P.
As described above, the key influence on the NPV for each alternative is the scale of cost as the value of benefits its typically less than 20% of the value of the costs. Consequently, BS1:P delivers the least negative NPV and H1:P the most negative NPV, despite delivering the lowest and highest levels of benefits respectively, because of the relative scale and cost of construction.
The performance of the two Oslo to Bergen alternatives (N1:Q and HA2:P) remains very similar when considered from the full economic perspective because scheme costs as well as user benefits are very similar for the two alternatives (within 3%). Consequently, their NPVs are within 3% of each other in both PSS1 and PSS2, with N1:Q performing marginally better.
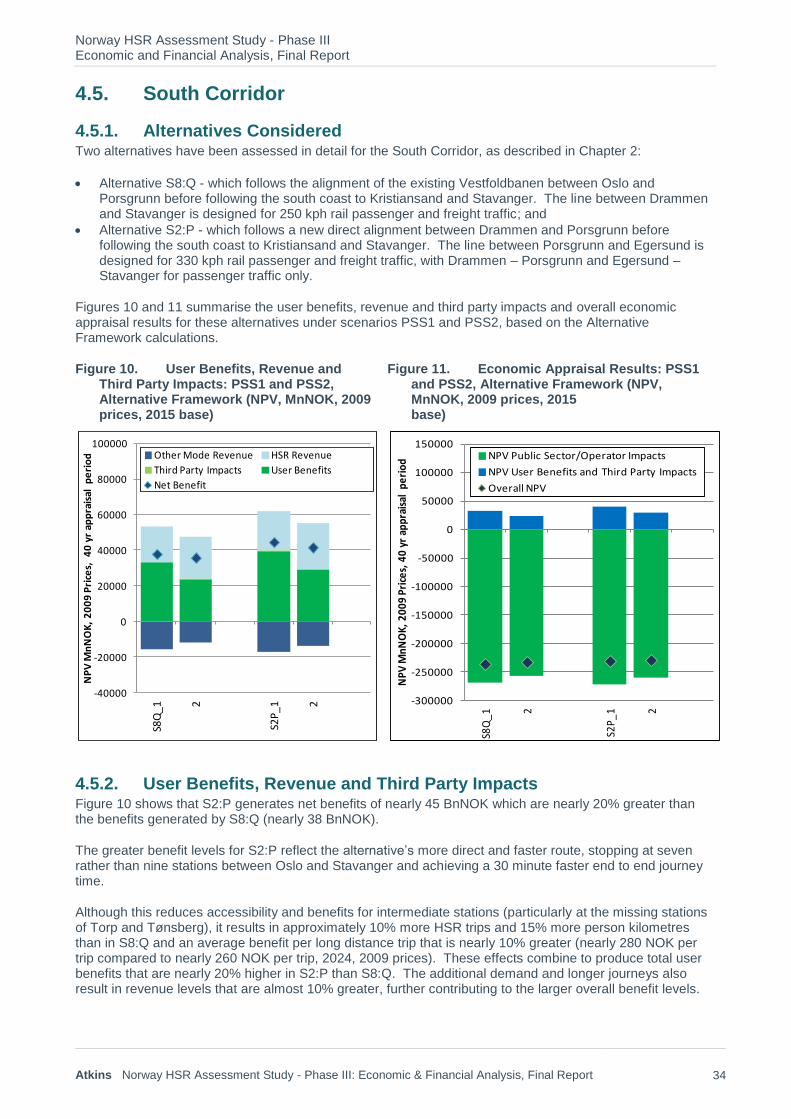
Norway HSR Assessment Study - Phase III Economic and Financial Analysis, Final Report
Atkins Norway HSR Assessment Study - Phase III: Economic & Financial Analysis, Final Report 34
4.5. South Corridor
4.5.1. Alternatives Considered Two alternatives have been assessed in detail for the South Corridor, as described in Chapter 2:
Alternative S8:Q - which follows the alignment of the existing Vestfoldbanen between Oslo and Porsgrunn before following the south coast to Kristiansand and Stavanger. The line between Drammen and Stavanger is designed for 250 kph rail passenger and freight traffic; and
Alternative S2:P - which follows a new direct alignment between Drammen and Porsgrunn before following the south coast to Kristiansand and Stavanger. The line between Porsgrunn and Egersund is designed for 330 kph rail passenger and freight traffic, with Drammen – Porsgrunn and Egersund – Stavanger for passenger traffic only.
Figures 10 and 11 summarise the user benefits, revenue and third party impacts and overall economic appraisal results for these alternatives under scenarios PSS1 and PSS2, based on the Alternative Framework calculations.
Figure 10. User Benefits, Revenue and Third Party Impacts: PSS1 and PSS2, Alternative Framework (NPV, MnNOK, 2009 prices, 2015 base)
Figure 11. Economic Appraisal Results: PSS1 and PSS2, Alternative Framework (NPV, MnNOK, 2009 prices, 2015 base)
4.5.2. User Benefits, Revenue and Third Party Impacts Figure 10 shows that S2:P generates net benefits of nearly 45 BnNOK which are nearly 20% greater than the benefits generated by S8:Q (nearly 38 BnNOK).
The greater benefit levels for S2:P reflect the alternative‟s more direct and faster route, stopping at seven rather than nine stations between Oslo and Stavanger and achieving a 30 minute faster end to end journey time.
Although this reduces accessibility and benefits for intermediate stations (particularly at the missing stations of Torp and Tønsberg), it results in approximately 10% more HSR trips and 15% more person kilometres than in S8:Q and an average benefit per long distance trip that is nearly 10% greater (nearly 280 NOK per trip compared to nearly 260 NOK per trip, 2024, 2009 prices). These effects combine to produce total user benefits that are nearly 20% higher in S2:P than S8:Q. The additional demand and longer journeys also result in revenue levels that are almost 10% greater, further contributing to the larger overall benefit levels.
-40000
-20000
0
20000
40000
60000
80000
100000
S8Q
_1 2
S2P
_1 2
NP
V M
nN
OK
, 2
00
9 P
rice
s,
40
yr
app
rais
al p
eri
od Other Mode Revenue HSR Revenue
Third Party Impacts User Benefits
Net Benefit
-300000
-250000
-200000
-150000
-100000
-50000
0
50000
100000
150000
S8Q
_1
2
S2P
_1 2
NP
V M
nN
OK
, 2
00
9 P
rice
s, 4
0 y
r ap
pra
isal
pe
rio
d NPV Public Sector/Operator Impacts
NPV User Benefits and Third Party Impacts
Overall NPV

Norway HSR Assessment Study - Phase III Economic and Financial Analysis, Final Report
Atkins Norway HSR Assessment Study - Phase III: Economic & Financial Analysis, Final Report 35
The characteristics of the corridor and the route stops mean that journeys to, from and between intermediate stations make a larger contribution to total benefits in both these alternatives than those in the North and West corridors. In both cases journeys between the termini stations account for less than 20% of demand and less than 40% of benefits.
The shorter, under 100 km trips forecast using the Gravity Model contribute between 5% and 10% of total benefits in both alternatives, particularly due to trips between Arendal and Kristiansand.
The impact of PSS2 relative to PSS1 is similar for both alternatives to the impact shown in other corridors. Benefits per trip are reduced by about 5% and demand by approximately 30% (particularly non-business demand) and therefore total user benefits are reduced by approximately 25% to 30%. However, the increased fares result in an increase in revenue generation of over 15%, despite the reduction in demand. The scale of the reduction in user benefits slightly exceeds the net increase in revenue, leading to a slight decrease in the total value of benefits generated by each alternative of about 5%.
4.5.3. Overall Economic Appraisal Figure 11 shows that, when the benefits are combined with costs to provide the full economic appraisal for the alternatives, the NPVs for the South corridor alternatives vary between -238 BnNOK for S8:Q (PSS1) and -231 BnNOK for S2:P (PSS1 and PSS2).
As for the other corridors, PSS2 makes very little difference to the overall NPV, with the effects of increased revenue and decreased user benefit virtually offsetting each other.
The scale of public sector impact for S8:Q and S2:P is very similar (within 1%) and therefore S2:P has a slightly stronger economic performance overall as a result of the higher levels of user benefit it generates, as described above.
4.6. East Corridor
4.6.1. Alternatives Considered Four alternatives have been assessed in detail for the East Corridor, as described in Chapter 2:
Alternative ST5:U - which follows the existing Eastern Østfold Line via Ski and Mysen, before following a new alignment between Mysen and Arvika in Sweden. The majority of the route is designed for 250 kph rail passenger and freight traffic;
Alternative ST3:R – which follows a new alignment between Lillestrøm and Arvika before following existing rail routes to Stockholm. The line between Lillestrøm and Arvika is designed for 330 kph rail passenger traffic, with the remainder of the route designed for 250 kph rail passenger and freight traffic;
Alternative GO3:Q – which is principally an upgrade of the existing Western Østfold Line between Oslo and Gothenburg and is designed for 250 kph rail passenger and freight traffic; and
Alternative GO1:S - which follows a new direct alignment between Ski and the Swedish border before following the existing alignment to Gothenburg. The line within Norway is designed for 330 kph rail passenger and freight traffic.
Figures 12 and 13 summarise the user benefits, revenue and third party impacts and overall economic appraisal results for these alternatives under scenarios PSS1 and PSS2, based on the Alternative Framework calculations.
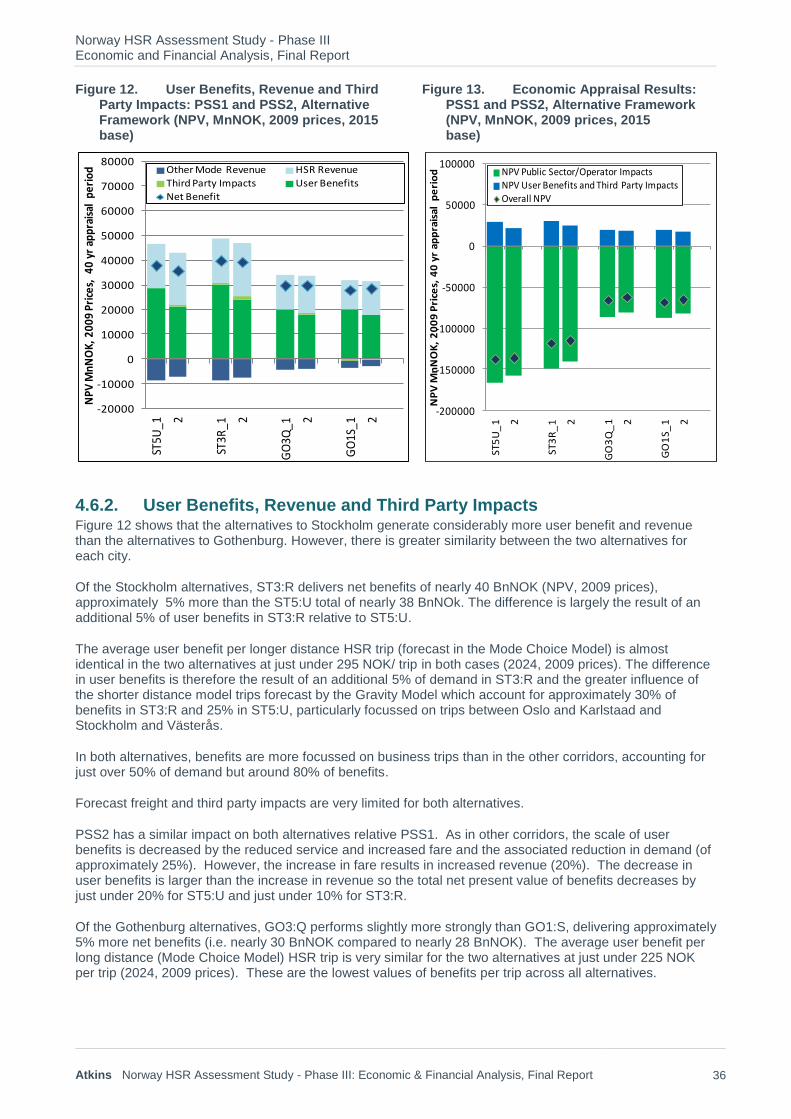
Norway HSR Assessment Study - Phase III Economic and Financial Analysis, Final Report
Atkins Norway HSR Assessment Study - Phase III: Economic & Financial Analysis, Final Report 36
Figure 12. User Benefits, Revenue and Third Party Impacts: PSS1 and PSS2, Alternative Framework (NPV, MnNOK, 2009 prices, 2015 base)
Figure 13. Economic Appraisal Results: PSS1 and PSS2, Alternative Framework (NPV, MnNOK, 2009 prices, 2015 base)
4.6.2. User Benefits, Revenue and Third Party Impacts Figure 12 shows that the alternatives to Stockholm generate considerably more user benefit and revenue than the alternatives to Gothenburg. However, there is greater similarity between the two alternatives for each city.
Of the Stockholm alternatives, ST3:R delivers net benefits of nearly 40 BnNOK (NPV, 2009 prices), approximately 5% more than the ST5:U total of nearly 38 BnNOk. The difference is largely the result of an additional 5% of user benefits in ST3:R relative to ST5:U.
The average user benefit per longer distance HSR trip (forecast in the Mode Choice Model) is almost identical in the two alternatives at just under 295 NOK/ trip in both cases (2024, 2009 prices). The difference in user benefits is therefore the result of an additional 5% of demand in ST3:R and the greater influence of the shorter distance model trips forecast by the Gravity Model which account for approximately 30% of benefits in ST3:R and 25% in ST5:U, particularly focussed on trips between Oslo and Karlstaad and Stockholm and Västerås.
In both alternatives, benefits are more focussed on business trips than in the other corridors, accounting for just over 50% of demand but around 80% of benefits.
Forecast freight and third party impacts are very limited for both alternatives.
PSS2 has a similar impact on both alternatives relative PSS1. As in other corridors, the scale of user benefits is decreased by the reduced service and increased fare and the associated reduction in demand (of approximately 25%). However, the increase in fare results in increased revenue (20%). The decrease in user benefits is larger than the increase in revenue so the total net present value of benefits decreases by just under 20% for ST5:U and just under 10% for ST3:R.
Of the Gothenburg alternatives, GO3:Q performs slightly more strongly than GO1:S, delivering approximately 5% more net benefits (i.e. nearly 30 BnNOK compared to nearly 28 BnNOK). The average user benefit per long distance (Mode Choice Model) HSR trip is very similar for the two alternatives at just under 225 NOK per trip (2024, 2009 prices). These are the lowest values of benefits per trip across all alternatives.
-20000
-10000
0
10000
20000
30000
40000
50000
60000
70000
80000ST
5U_1 2
ST3R
_1
2
GO
3Q_1
2
GO
1S_1 2
NPV
MnN
OK,
200
9 Pr
ices
, 40
yr
appr
aisa
l pe
riod Other Mode Revenue HSR Revenue
Third Party Impacts User Benefits
Net Benefit
-200000
-150000
-100000
-50000
0
50000
100000
ST5
U_
1 2
ST3
R_
1 2
GO
3Q
_1 2
GO
1S_
1 2
NP
V M
nN
OK
, 2
00
9 P
rice
s, 4
0 y
r ap
pra
isal
pe
rio
d NPV Public Sector/Operator ImpactsNPV User Benefits and Third Party Impacts
Overall NPV

Norway HSR Assessment Study - Phase III Economic and Financial Analysis, Final Report
Atkins Norway HSR Assessment Study - Phase III: Economic & Financial Analysis, Final Report 37
Although GO1:S has an estimated 20% additional longer distance trips (forecast through the Mode Choice Model) relative to GO3:Q, it has approximately 30% less shorter distance trips (as forecast through the Gravity Model) and therefore approximately 20% less demand overall. Approximately 80% of the forecast trips and over 65% of benefits for GO3:Q are associated with demand forecast through the Gravity Model, particularly trips between Oslo and Sarpsbog and Fredrikstad. The equivalent balance for GO1:S is approximately 70% of demand and 60% of benefits. The service does not serve Fredrikstad but journeys between Oslo and Sarpsborg again dominate.
The net balance of these varying influences of different forecast levels of long and short distance trips and benefits per trips for the two alternatives is virtually identical total levels of user benefits for the two alternatives over the appraisal period.
Forecast freight impacts are also very similar (and small) for both alternatives. The difference in net benefit is therefore largely the result of GO3:Q producing nearly 10% additional net revenue and generating positive third party impacts. In turn these third party benefits are the result of a slightly positive impact on accidents and less negative net impact on CO2 emissions over the 40 year appraisal period, reflecting a larger mode switch from car than in GO1:S.
As with the Stockholm alternatives, benefits on business trips are more dominant for these alternatives than on other corridors, accounting for nearly two–thirds of trips and over 80% of benefits (over 85% for GO3:Q).
The impact of PSS2 relative to PSS1 is also similar to the Stockholm alternatives, causing a slight reduction in the total net present value of benefits; of just under 20% for GO3:Q and under 10% for GO1:S
4.6.3. Overall Economic Appraisal Figure 13 shows that, when the benefits are combined with the costs to produce the overall economic appraisal, there is again a marked difference between the Stockholm and Gothenburg alternatives. This reflects the fact that NPV is most strongly influenced by costs and the Gothenburg alternatives are considerably shorter and less expensive than the Stockholm alternatives and therefore generate less negative NPVs despite generating fewer benefits.
Of the two Stockholm alternatives ST3:R still performs the most strongly from this perspective, as the higher levels of benefit described above are combined with lower construction and renewal costs (more than10% lower than ST5:U) resulting in a reduction in the scale of the negative NPV of 15% relative to ST5:U.
For the Gothenburg alternatives, GO3:Q again performs slightly more strongly than GO1:S as the slightly higher benefits outlined above are combined with slightly lower costs (a balance of lower construction costs and renewals and higher operating/maintenance costs) to produce a 3% reduction in the scale of the negative NPV relative to GO1:S.
4.7. Conclusions The economic analysis has confirmed that the use of the Alternative Framework better captures and represents the behavioural response and associated benefits of introducing HSR services than the Standard Framework, as intended. It is therefore recommended that the Alternative Framework be adopted as the primary basis for assessment looking forward.
Examining the economic performance of the HSR alternatives, the appraisal results presented above (and summarised in Tables 7 and 8 below) suggest that the alternatives with the strongest economic performance by corridor are Ø2:P in the North, H1:P in the West, (or marginally N1:Q, if single route alternatives are considered), S2:P (marginally) in the South and ST3:R on the Stockholm corridor and GO3:Q on the Gothenburg corridor in the East.
A number of the alternatives have the potential to generate significant user benefits and revenue, particularly those providing significant time savings on long distance routes with relatively high levels of demand. The present value of user benefits over 40 years range from 15Bn NOK (BS1:P) to nearly 70 BnNOK (H1:P) (2009 prices, Alternative Framework, PSS1), noting that H1:P is not directly comparable with the other alternatives as it is „Y shaped‟ and serves three routes rather than one.

Norway HSR Assessment Study - Phase III Economic and Financial Analysis, Final Report
Atkins Norway HSR Assessment Study - Phase III: Economic & Financial Analysis, Final Report 38
However, each alternative (particularly the long distance ones identified) involves significant and challenging construction work which will be costly, as detailed further in the Phase III Cost Report (Norway HSR Assessment Study Phase III: Estimation and Assessment of Investment Costs, Final Report, January 2012). Consequently, monetised benefits do not offset costs across the appraisal time period for any of the alternatives considered and each one generates a significant negative NPV, ranging from -66 BnNOK (BS1:P) to -252 BnNOK (H1:P) over a 40 year appraisal period (2009 prices, Alternative Framework, PSS1).
These findings on overall economic performance reflect the relatively small scale of market available in Norway from which benefits and additional net revenue can be derived relative to the overall investment costs which are commensurate with the delivery of HSR schemes elsewhere aimed at serving more sizable populations and densities. Much of the market is also already relatively well served by existing modes (particularly air) meaning that the provision of HSR does not reduce journey costs and times substantially. Consequently, the resulting negative NPVs are to be expected.
The next Chapter describes sensitivity analysis to identify the extent to which changes in certain key inputs and assumptions could change the balance between costs and benefits and therefore overall economic performance from the results described above.
Table 7. Economic Appraisal Results by Alternative for PSS1 and PSS2, Standard Framework, NPV, MnNOK, 2009 prices, 25 year appraisal period
North West South East
G3Y O2P N1Q HA2P H1P BS1P S8Q S2P ST5U ST3R GO3Q GO1S
1) PSS1
a) User Benefits 14,182 26,065 9,328 13,805 25,323 977- 9,750 18,725 25,451 29,132 4,553 16,005
b) Third Party Effects 266- 1,370 261 227 2,575- 835- 506- 68- 65- 263 1- 689-
c) Net Public Sector/Op. Effects 156,080- 126,551- 146,759- 151,153- 217,400- 107,575- 187,962- 188,589- 119,739- 107,135- 63,928- 63,860-
d) NPV (a+b+c) 142,165- 99,116- 137,170- 137,120- 194,652- 109,386- 178,718- 169,933- 94,353- 77,740- 59,376- 48,544-
e) Costs (included in b)
Construction/Renewals 119,695- 95,536- 112,491- 116,993- 169,624- 81,739- 145,176- 147,207- 89,144- 78,807- 48,100- 50,142-
Operating/Maintenance 13,008 12,709 11,870 11,142 19,862 7,270 14,991 13,911 12,644 12,562 9,566 8,072
Cost of Taxation 28,224- 21,935- 26,707- 27,067- 38,948- 19,899- 33,980- 33,800- 18,674- 16,082- 11,098- 10,469-
f) Revenue (included in b)
HSR 15,060 17,551 16,038 16,703 28,087 4,735 15,778 16,948 13,590 13,813 10,694 9,050
Other 11,573- 13,097- 12,515- 12,699- 21,549- 4,222- 11,853- 13,311- 6,583- 6,802- 3,331- 2,362-
2) PSS2
a) User Benefits 2,579 10,823 498 4,341 4,039 1,438- 602 7,663 15,370 22,235 625 12,257
b) Third Party Effects 655- 644 227- 148- 2,341- 617- 746- 415- 357 620 430 369-
c) Net Public Sector/Op. Effects 147,722- 117,154- 137,868- 142,844- 202,373- 104,080- 179,010- 179,702- 113,756- 100,735- 59,999- 60,230-
d) NPV (a+b+c) 145,798- 105,687- 137,598- 138,651- 200,675- 106,134- 179,154- 172,454- 98,029- 77,879- 58,944- 48,342-
e) Costs (included in b)
Construction/Renewals 119,695- 95,536- 112,491- 116,993- 169,624- 81,739- 145,176- 147,207- 89,144- 78,807- 48,100- 50,142-
Operating/Maintenance 11,208 10,901 9,799 9,801 16,105 6,123 12,442 12,032 10,555 10,486 7,295 6,579
Cost of Taxation 27,280- 21,003- 25,549- 26,036- 37,468- 19,304- 32,917- 32,816- 18,371- 15,417- 10,708- 10,110-
f) Revenue (included in b)
HSR 17,732 21,482 18,199 19,497 32,970 5,853 17,927 19,707 16,087 16,394 11,611 10,532
Other 8,885- 10,617- 9,262- 9,770- 16,951- 3,634- 8,879- 10,281- 5,589- 5,824- 3,038- 2,125-

Norway HSR Assessment Study - Phase III Economic and Financial Analysis, Final Report
Atkins Norway HSR Assessment Study - Phase III: Economic & Financial Analysis, Final Report 39
Table 8. Economic Appraisal Results by Alternative for PSS1 and PSS2, Alternative Framework, NPV, MnNOK, 2009 prices, 40 year appraisal period
North West South East
G3Y O2P N1Q HA2P H1P BS1P S8Q S2P ST5U ST3R GO3Q GO1S
1) PSS1
a) User Benefits 34,255 41,896 35,525 36,307 64,619 14,765 33,051 39,483 28,620 30,027 19,921 20,006
(Av. user benefit/HSR trip, NOK) 285 332 284 321 327 363 258 278 294 293 223 224
b) Third Party Effects 103 2,305 766 728 2,743- 900- 204- 465 215 678 222 761-
c) Net Public Sector/Operator Effects225,135- 180,989- 205,609- 210,121- 313,643- 150,242- 269,877- 271,856- 166,117- 148,549- 85,782- 87,261-
d) NPV (a+b+c) 190,777- 136,788- 169,318- 173,085- 251,768- 136,377- 237,029- 231,908- 137,281- 117,844- 65,639- 68,016-
e) Costs (included in b)
Construction/Renewals 139,779- 109,623- 126,025- 131,907- 198,903- 90,415- 166,871- 169,390- 99,913- 87,997- 52,869- 55,306-
Operating/Maintenance 16,873 16,383 15,453 14,543 25,677 9,518 19,518 18,187 16,280 16,123 12,157 10,308
Cost of Taxation 36,706- 28,627- 33,279- 33,927- 49,991- 24,718- 44,205- 44,222- 26,424- 23,339- 13,257- 13,582-
f) Revenue (included in b)
HSR 19,525 23,049 20,732 21,665 36,510 6,072 20,469 21,960 17,670 17,986 13,881 11,717
Other 15,151- 17,262- 16,205- 16,514- 28,221- 5,430- 15,442- 17,365- 8,579- 8,867- 4,309- 3,046-
2) PSS2
a) User Benefits 23,994 29,814 24,897 26,187 45,946 10,784 23,832 29,122 21,105 24,152 17,715 17,893
b) Third Party Effects 405- 1,328 122 228 2,432- 608- 517- 22 789 1,171 816 339-
c) Net Public Sector/Operator Effects213,993- 168,601- 194,134- 199,219- 293,464- 146,086- 258,087- 260,066- 157,648- 139,884- 80,521- 82,348-
d) NPV (a+b+c) 190,403- 137,459- 169,115- 172,805- 249,950- 135,911- 234,772- 230,921- 135,753- 114,562- 61,990- 64,794-
e) Costs (included in b)
Construction/Renewals 139,779- 109,623- 126,025- 131,907- 198,903- 90,415- 166,871- 169,390- 99,913- 87,997- 52,869- 55,306-
Operating/Maintenance 14,683 14,179 12,921 12,920 21,089 8,102 16,394 15,898 13,718 13,578 9,348 8,469
Cost of Taxation 35,306- 27,117- 31,878- 32,588- 47,589- 24,266- 42,704- 42,776- 25,389- 22,181- 12,521- 12,892-
f) Revenue (included in b)
HSR 23,402 28,295 23,914 25,689 43,540 7,578 23,658 25,942 21,173 21,599 15,165 13,741
Other 11,788- 14,138- 12,149- 12,860- 22,441- 4,705- 11,732- 13,580- 7,333- 7,640- 3,945- 2,756-

Norway HSR Assessment Study - Phase III Economic and Financial Analysis, Final Report
Atkins Norway HSR Assessment Study - Phase III: Economic & Financial Analysis, Final Report 40
5. Economic Appraisal Sensitivity Tests
5.1. Introduction This Chapter presents the results of sensitivity analysis undertaken to test the extent to which variations in key assumptions would alter the economic appraisal results presented in the previous Chapter and is intended to provide a better understanding of the key influences on the results.
For simplicity, all sensitivity tests are presented for the Alternative Framework and PSS1 and, apart from the Inter-City scenarios, only for three core alternatives, identified by JBV as representative of the range of alternatives:
G3:Y: Oslo to Trondheim in the North corridor (via Hamar and Gudbrandsdalen);
HA2:P: Oslo to Bergen in the West corridor (via Hallingdal); and
S:IC: S8:Q Oslo to Stavanger in the South corridor (via Vestfold) assuming that the Inter-City improvements are implemented before HSR construction.
These tests can be considered representative, the scale and nature of impacts of the equivalent sensitivity tests on other alternatives would be similar. Appendix H presents the results of key tests for all twelve core alternatives, under PSS1, as supporting information.
The sensitivity analysis focussed on the following issues:
Inter-City Scenarios – testing the potential for Inter-City improvements to impact on the economic appraisal for HSR alternatives;
Discount rate – testing rates of 2% and 5.5%;
Assessment period – testing 25 and 60 years;
Optimism bias – adding an allowance (around 40%, but variable by corridor) to reflect the systematic tendency for scheme costs to be underestimated at an early stage;
Real cost growth – testing the assumption of no real growth in construction costs above inflation;
Wider economic impacts – adding an indicative allowance to illustrate the potential impact of wider economic impacts (which cannot currently be quantified) should they equate to 15% or 30% of conventional user benefits; and
Competitive response – testing the second „end point‟ of the range of economic impact of the potential responses of operators of other (non HSR) modes to the introduction of HSR.
Further detail on the specification and results of each test are provided in the following sections.
5.2. Inter-City Scenarios A key area of sensitivity in the impacts of three of the HSR alternatives (S8:Q on the South Corridor, G3:Y on the North Corridor and GO3:Q on the East Corridor) is their potential interaction with alternatives to improve Inter-City services on the routes out of Oslo (a 250kph upgrade between Drammen and Porsgrunn on the South corridor, Oslo and Lillehammer on the North Corridor and Ski and approach to Halden on the East corridor).
These potential Inter-City (IC) improvements are the subject of a separate study, due to report early in 2012 and some results have been shared between the studies as they have progressed in parallel.
The IC interface and its impact on economic and financial appraisal has been examined in two ways:
Indicatively capturing the additional benefits to IC services of the improvement in capacity and journey times that HSR alternatives could offer, as forecast by the IC Study; and
Understanding the implications for HSR alternatives of a scenario where the IC project delivers infrastructure that could be used by HSR.

Norway HSR Assessment Study - Phase III Economic and Financial Analysis, Final Report
Atkins Norway HSR Assessment Study - Phase III: Economic & Financial Analysis, Final Report 41
5.2.1.1. Capture of potential additional IC service impacts of HSR infrastructure improvements
Additional IC services could make significant use of the infrastructure provided by the relevant HSR alternatives, adding to the benefits experienced on longer high speed trips as estimated using the Mode Choice Mode and Gravity Model.
Figure 14 provides an indication of the potential impact of including these benefits on the overall economic appraisal results for the affected HSR alternatives. The additional benefit included in these figures is based on results from the IC study which provided estimated annual user benefits and operator impacts for the affected services along the corridors to Halden, Lillehammer and Porsgrunn in 2025.
It is noted that these estimates are intended to provide an indication of the potential scale of impact only. They should be treated with caution and not used for detailed comparison as they are based on the combination of results from two separate models with the potential for issues such as double-counting as well as different approaches to modelling and economic appraisal. Additionally, the estimated benefits were provided for the year of 2025 only and so have been converted to approximated benefits across the appraisal period using the JBV economic guidance spreadsheet and default assumptions.
Figure 14. Economic Appraisal Results, Additional IC Trips, Alternative Assessment Framework (NPV, MnNOK, 2009 prices, 2015 base, 40 year appraisal period)
The graphs indicate that the use of High Speed infrastructure for IC service provision could improve the economic case for the relevant alternative, increasing user benefits by an estimated 15% in each case. Revenue could also be increased, by around 10% in the estimates presented, although about 60% to 80% of the increase would be offset by increased operating costs for the additional IC services.
The overall estimated effect of the consideration of additional impacts associated with IC services is to reduce the negative scale of the NPV by the order of 5 BnNOK for each alternative.
5.2.1.2. Impact of IC Project delivering HSR usable infrastructure in advance
The IC Project could impact on the economic case for HSR Alternatives should it provide infrastructure that is also required for HSR alternatives. In this case, if the IC project was completed first, it would reduce the construction costs associated with any relevant HSR alternative subsequently commissioned, by reducing the need for new infrastructure. It would also cause a slight delay in construction timetables and may cause a slight reduction in benefits and revenue relative to a route designed specifically for HSR.
Figure 15 below shows the impact of this possible scenario for each relevant alternative, assuming that it delays opening of the HSR alternative by up to 2 years. A reduction of 5% has also been applied to account for possible user benefit and revenue reduction, although analysis using the forecast model suggests that this is a very prudent assumption and the impact is likely to be smaller.
-300000
-250000
-200000
-150000
-100000
-50000
0
50000
N_G3Y N_IC S_S8Q S_IC E_GO3Q E_IC
NP
V M
n N
OK
, 20
09
Pri
ces,
40
ye
ar a
pp
rais
al p
eri
od
NPV Public Sector/Operator Impacts
NPV User Benefits and Third Party Impacts
Overall NPV

Norway HSR Assessment Study - Phase III Economic and Financial Analysis, Final Report
Atkins Norway HSR Assessment Study - Phase III: Economic & Financial Analysis, Final Report 42
Figure 15. Economic Appraisal Results, Early Inter-City Improvements, Alternative Assessment Framework (NPV, MnNOK, 2009 prices, 2015 base, 40 year appraisal period)
The comparisons show that the reductions in cost associated with the separate construction of an IC alternative are significant, reducing the scale of the negative NPV by around 50 BnNOK (2009 NPV) for the North and South alternatives (25% and 20% respectively) and 20 BnNOK for the East alternative (35%).
5.3. Discount Rate and Assessment Period Tests Figure 16 shows the impacts on the overall economic appraisal of the discount rate and appraisal period sensitivity tests, assessing the impact of discount rates of 2% and 5.5% and appraisal periods of 25 years and 60 years.
Figure 16. Economic Appraisal Results for Discount Rate and Appraisal Period Sensitivity Tests, Alternative Assessment Framework, PSS1 (NPV, MnNOK, 2009 prices, 2015 base, 25, 40 or 60 year appraisal period)
The graph shows that, as expected, reduced discount rates increase both costs and benefits whilst the increased discount rate has the opposite effect. For instance, the use of the 2% rate approximately doubles
-300000
-250000
-200000
-150000
-100000
-50000
0
50000
N_G3Y N_IC S_S8Q S_IC E_GO3Q E_IC
NP
V ,
Mn
NO
K, 2
00
9 P
rice
s, 4
0 y
ear
ap
pra
isa
l pe
rio
d
NPV Public Sector/Operator Impacts
NPV User Benefits and Third Party Impacts
Overall NPV
-400000
-350000
-300000
-250000
-200000
-150000
-100000
-50000
0
50000
100000
N_G
3Y
_C
2.0
%
5.5
%
25 y
r
60 y
r
W_H
A2P
_C
2.0
%
5.5
%
25 y
r
60 y
r
S_IC
_C
2.0
%
5.5
%
25 y
r
60 y
r
NP
V, M
n N
OK
, 2009 p
rices, vari
ab
le a
pp
rais
al p
eri
od
NPV Public Sector/Operator Impacts
NPV User Benefits and Third Party Impacts
NPV

Norway HSR Assessment Study - Phase III Economic and Financial Analysis, Final Report
Atkins Norway HSR Assessment Study - Phase III: Economic & Financial Analysis, Final Report 43
user benefits and third party impacts but also adds 20% to 30% to the negative public sector impacts. Given the relative scale of the impacts, the increased costs more than offset the improvement in user benefits to cause an increase in the negative value of the NPV (of around 10% across the alternatives).
The 5.5% discount rate reduces benefits by about 25% and costs by less than 10%. The opposing impacts are therefore more finely balanced but the decrease in costs slightly exceeds the decrease in benefits, causing a reduction in the negative value of the NPV of around 5% across the alternatives shown.
Similarly, the appraisal period tests either reduce or increase both costs and benefits simultaneously. The net effect on NPV is therefore limited. The 25 year period reduces costs by just over 10% and benefits by about 35% relative to the 40 year period. Given the relative scale of costs and benefits, the absolute scale of the cost reduction is larger than the benefit reduction, leading to decrease in the scale of the negative NPV of between 6% and 8% across the alternatives shown.
The 60 year period increases costs by less than 5% and benefits by 35%. The absolute increases are therefore more closely balanced but the increase in benefits slightly outweighs the increase in costs, reducing the negative value of the NPV by between 1% and 3% across the alternatives shown.
Appendix H shows the equivalent results for the other core alternatives, showing that the impacts are similar in each case and that none of the tests significantly alters the results of the economic appraisal or the comparison between alternatives.
5.4. Optimism Bias and Real Cost Growth Tests Figure 17 shows the impacts on the overall economic appraisal of the two sensitivity tests which impact on costs only, i.e. the inclusion of an optimism bias allowance and the assumption of no real growth in construction costs above standard inflation.
Figure 17. Economic Appraisal Results for Optimism Bias and Real Cost Growth Sensitivity Tests, Alternative Assessment Framework (NPV, MnNOK, 2009 prices, 2015 base, 40 year appraisal period)
The optimism bias allowance significantly increases costs without any offsetting impact on benefits. Consequently, it leads directly to a significant increase in the scale of the negative NPV in each alternative (of about 35%).
-400000
-350000
-300000
-250000
-200000
-150000
-100000
-50000
0
50000
100000
N_G
3Y
_C
OB
No R
eal G
row
th
W_H
A2P
_C
OB
No R
eal G
row
th
S_IC
_C
OB
No R
eal G
row
th
NP
V, M
n N
OK
, 2009 p
rices, vari
ab
le a
pp
rais
al p
eri
od
NPV Public Sector/Operator Impacts
NPV User Benefits and Third Party Impacts
NPV

Norway HSR Assessment Study - Phase III Economic and Financial Analysis, Final Report
Atkins Norway HSR Assessment Study - Phase III: Economic & Financial Analysis, Final Report 44
In contrast, the assumption in no real growth in construction costs above inflation leads to a reduction in costs (construction costs, renewals and the costs of taxation required for financing). Consequently the scale of the negative NPV for each alternative reduces. For the alternatives presented above, the scale of the reduction varies between 23% and 26%.
Appendix H provides the equivalent analysis across all core alternatives for PSS1, showing that there is a similar pattern of impacts across the alternatives, with reductions in the scale of the negative NPV varying between 20% and 27%.
5.5. Wider Economic Impacts and Competitive Response Tests Figure 18 presents the results of the final sets of tests, assessing the potential impact of the inclusion of wider economic impacts and alternative views on the impact of the introduction of HSR on competing modes.
Figure 18. Economic Appraisal Results for Wider Impacts and Competitive Response Sensitivity Tests, Alternative Assessment Framework (NPV, MnNOK, 2009 prices, 2015 base, 40 year appraisal period)
The two wider economic impacts tests increase the value of user benefits and therefore reduce the scale of the negative NPV for each alternative. However, as the scale of user benefits is relatively limited compared to the overall impacts of the scheme, the net effect on the NPV is also limited (with reductions of up to approximately 5% across the alternatives tested).
It should be stressed that these are intended as indicative tests only. As described the Phase II Economic and Financial Analysis Final Report, (Norway HSR Assessment Study: Contract 6: Financial & Economic Analysis: Subject 4: Economic Analysis: Final Report, February 2011), the identification of wider economic benefits is a complex and contested subject and detailed quantification of benefits would be reliant on extensive research into the local economic structures and conditions around the stations served by each route. It is also important to note that the scale of wider impacts achieved would be likely to vary considerably by alternative, reflecting varied economic conditions and structures in the corridors affected.
The competitive response of the operators of other modes to the introduction of HSR is likely to be a significant influence on the net effect of the alternatives. However, it is difficult to identify the possible impact accurately due to the variety and complexity of possible responses. Representation of a realistic new equilibrium transport provision across all modes with HSR in place would involve a detailed process of consultation with involved parties and iterative representations of potential scenarios.
-350000
-300000
-250000
-200000
-150000
-100000
-50000
0
50000
100000
N_G
3Y
_C
15%
WI
30%
WI
Com
p R
esp
W_H
A2P
_C
15%
WI
30%
WI
Com
p R
esp
S_IC
_C
15%
WI
30%
WI
Com
p R
esp
NP
V, M
n N
OK
, 2009 p
rices, 40 y
ear
ap
pra
isal
peri
od
NPV Public Sector/Operator Impacts
NPV User Benefits and Third Party Impacts
NPV

Norway HSR Assessment Study - Phase III Economic and Financial Analysis, Final Report
Atkins Norway HSR Assessment Study - Phase III: Economic & Financial Analysis, Final Report 45
The approach adopted here is therefore to identify the range within which the value of impacts of competitive response would be likely to fall, to help assess the likely significance of the issue. The core assessments presented in Chapter 4 assume that operators would accept all revenue losses associated with changes in travel behaviour after the introduction of HSR without reducing costs (and therefore without impacting on services for remaining users). This was adopted as a straightforward, internally consistent and transparent assumption. However, it is conservative.
The other, optimistic end point, tested here as the sensitivity test, is the hypothetical assumption that the operators are able to take measures to reduce their costs to match their revenue loss without impacting on the services and costs for remaining passengers (for instance flying smaller planes on the same routes). The economic impact of the actual response is likely to be between these two extremes with a different distribution of impacts between transport users and operators.
The results of the sensitivity test shown in Figure 18 suggest that a more optimistic assumption on competitive response could lead to a moderate improvement in the NPVs for the alternatives. In the test shown, the scale of the negative NPV for all of the alternatives presented is reduced by around 10%. Appendix H presents the equivalent results for all core alternatives under PSS1, showing that the reduction varies between 5% and 15% across the alternatives.
As discussed, this test is intended to provide an estimate of the upper bound of the possible positive impact of competitive response on the alternatives‟ NPVs. The final impact would fall somewhere below 10% for the alternatives shown in Figure 18 and would be the net effect of changes in costs, revenues and user benefits on other modes and on HSR, reflecting adjustments to service provision.
For instance, the final equilibrium position is likely to involve a reduction in service on other modes. This would imply that the overall effect would be the net effect of reductions in revenue and costs on the other modes, reductions in user benefits for those currently using those modes (facing a reduced service) and increases in revenue for HSR which would now appear relatively more attractive than the other modes, attracting more passengers. One implication of this would be improved financial performance for HSR relative to the core assessments presented in the next Chapter.
5.6. Conclusions As outlined in the previous Chapter, the forecast negative net lifetime economic performance for the HSR alternatives reflects the relatively small scale of market available in Norway from which benefits and additional net revenue can be derived, relative to the large overall investment costs which are commensurate with the delivery of HSR schemes elsewhere aimed at serving more sizable populations and densities. Scope to generate benefits is also limited by the fact that much of the market is already relatively well served by existing modes (particularly air) so that the provision of HSR does not reduce journey costs and times substantially.
The sensitivity analysis presented above indicates that there are some areas in which changes in assumptions would improve the balance between costs and benefits. In particular these include the consideration of additional benefits (wider economic impacts or interactions with Inter-City improvements), an alternative view on real cost growth and an alternative view on competitive response.
The consequential impacts of introducing HSR have not been examined in detail at this stage and the equilibrium transport provision once HSR has been implemented is still to be determined. This could improve the case for HSR. However the sensitivity test on the possible range of impact of competitive response shows that, whilst a more efficient solution could achieve a moderate improvement in NPV, it would not alter the fundamental overall negative economic NPV position, given the scale of investment costs.
Other assumptions could worsen the balance between costs and benefits, in particular the inclusion of optimism bias on costs. Overall, costs continue to significantly exceed benefits for each of the alternatives, even with more optimistic assumptions in the areas considered.
However, the results presented in the economic appraisal do suggest that there might be scope for HSR
alternatives to more than offset the ongoing costs of maintaining and operating infrastructure and services if
the up-front capital investment costs are excluded. Examining this issue is the focus of the financial
appraisal presented in the next two Chapters.

Norway HSR Assessment Study - Phase III Economic and Financial Analysis, Final Report
Atkins Norway HSR Assessment Study - Phase III: Economic & Financial Analysis, Final Report 46
6. Financial Appraisal Core Results
6.1. Introduction This Chapter presents the results of the financial appraisal results for the core Scenario C/D alternatives for both PSS1 and PSS2.
As discussed in Chapter 3, the economic appraisal results described in the previous Chapters are useful in the consideration of the life time impact of each alternative across society. However, it is also valuable to consider each alternative from the perspective of financial performance. This considers the extent to which the ongoing financial costs of the alternative are covered by the revenue generated by the scheme and is intended to provide an indication of whether the alternative could be commercially viable once construction costs have been committed.
The scope of the ongoing costs that should be considered in the comparison of revenue and costs could be defined in several ways. At the minimum level, costs could be considered to be the service and infrastructure operating and maintenance costs, including rolling stock costs but excluding capital renewals. A second, wider definition would also include renewals in the costs considered.
A further more comprehensive definition could also consider the wider impacts on the economy of the need to raise funding for the scheme through taxation (with the associated impact on the efficiency of the economy). The Norwegian economic assessment guidance suggests that this cost of taxation should be considered to be the equivalent of a further 20% of the public sector costs over the appraisal lifetime. Taken to the furthest extent, this analysis would therefore include the full taxation costs of financing the initial construction of the scheme and any ongoing subsidies required in the definition of the costs to be covered by revenue in the comparison.
An alternative perspective would focus only on financing public sector costs/subsidies after construction, treating the costs of financing construction as sunk costs, along with the construction costs themselves. In this approach any alternatives able to support their own operating, maintenance and renewals costs would not require public subsidy and so would not incur ongoing costs associated with tax financing (as costs would be fully covered by revenue raised). For those alternatives not able to cover full costs, the cost of taxation would add 20% to any costs not covered by revenue.
Indirect, economy wide effects of this nature are not normally included in financial appraisal which typically focuses on direct costs of running a rail system as experienced by the operator (i.e. the first two definitions of cost outlined above). However, analysis relating to the wider definition (full lifetime taxation costs) is also presented below for completeness.
6.2. Description of Analysis Presented The following sections present the „net revenue‟ generated by the alternatives when comparing incoming HSR revenue with each of the three definitions of cost outlined above, under PSS1 and PSS2 respectively.
The first section presents a summary of results across all corridors, drawing out common patterns and impacts. The subsequent sections then provide more detailed comments and comparisons for the alternatives within each corridor before a final concluding summary.
As outlined in Chapter 4, when interpreting the results it is important to recognise that the study at this stage has focussed on undertaking a consistent appraisal to understand the comparative performance of a large number of alternatives across several corridors. The aim is therefore to indicate the level of economic and financial performance that might be delivered by HSR in Norway „in principle‟, rather than determining the absolute economic and financial performance in detail, which would not be practical at this stage.
Consequently, the alternatives have not yet been optimised for economic or financial return (in terms of issues such as service frequencies and stopping patterns). The assessments therefore provide a basis for the consistent comparison of alternatives, as intended, but there is likely to be significant scope to reduce costs and improve benefits and financial return with more detailed alternative development at a later stage.

Norway HSR Assessment Study - Phase III Economic and Financial Analysis, Final Report
Atkins Norway HSR Assessment Study - Phase III: Economic & Financial Analysis, Final Report 47
Results are presented for a 4.5% discount rate and 25 year lifetime, in line with current Norwegian guidance and, unless otherwise stated, are in MnNOK and in net present value terms, discounted to 2015 and in 2009 prices (in line with JBV guidance (Metodehåndbok JD 205, Samfunnsokonomiske analyser for jernbanen, versjon 3.0 juli 2011)).
6.3. Overview of Results for All Corridors Figures 19 and 20 present the summary financial appraisal information for all alternatives under PSS1 and PSS2 respectively. The first column in the group for each alternative shows the total HSR revenue generated by the alternative to provide a sense of scale. The following columns then present the „net revenue‟ generated by the alternatives when comparing incoming HSR revenue with each of the three definitions of cost outlined above. More detailed data underlying the results is provided in Table 9 at the end of the Chapter.
Figure 19. Financial Appraisal Results, PSS1 (NPV, MnNOK, 2009 prices, 2015 base, 25 year appraisal period)
Figure 20. Financial Appraisal Results, PSS2 (NPV, MnNOK, 2009 prices, 2015 base, 25 year appraisal period)
-60000
-40000
-20000
0
20000
40000
G3Y O2P N1Q HA2P H1P BS1P S8Q S2P ST5U ST3R GO3Q GO1S
NPV
, Mn
NO
K, 2
009
pric
es, 2
5 Ye
ar a
ppra
isal
per
iod
Total Revenue
Revenue - Infrastructure & Service Operating/Maintenance Costs
Revenue - Infrastructure & Service Operating/Maintenance Costs & Renewals
Revenue - Infrastructure
& Service Operating/Maintenance Costs, Renewals & Cost of Taxation
-60000
-40000
-20000
0
20000
40000
G3Y O2P N1Q HA2P H1P BS1P S8Q S2P ST5U ST3R GO3Q GO1S
NPV
Mn
NO
K, 2
009
pric
es, 2
5 Ye
ar a
ppra
isal
per
iod Total Revenue
Revenue - Infrastructure & Service Operating/Maintenance Costs
Revenue - Infrastructure & Service Operating/Maintenance Costs & Renewals
Revenue - Infrastructure & Service Operating/Maintenance Costs, Renewals & Cost
of Taxation

Norway HSR Assessment Study - Phase III Economic and Financial Analysis, Final Report
Atkins Norway HSR Assessment Study - Phase III: Economic & Financial Analysis, Final Report 48
The figures show that the revenue generated by each of the alternatives is sufficient to more than cover the associated service and infrastructure operating and maintenance costs in PSS1 and PSS2. This indicates that there is a strong likelihood that HSR services on most routes could operate as commercial and financially sustainable operations if costs of infrastructure implementation, renewal and capital financing are excluded, particularly when the service specification is commercially oriented (PSS2). The best performing alternatives serving a single route in this respect by corridor are Ø2:P in the North, HA2:P in the West, S2:P in the South and ST3:R in the East. H1:P in the West performs best overall but this reflects the fact it combines delivery of three service routes in a single large HSR scheme and so is not directly compatible with the other alternatives.
In PSS1, none of the alternatives can completely cover the full cost of capital renewals over a 25 year life time, or cover the costs of the taxation required to fund the substantial construction costs of each scheme. PSS2 is specified to perform more effectively financially and proxy a more commercially oriented service operation, and this is evident in the fact that alternatives Ø2:P in the North corridor, H1:P and HA2:P in the West corridor are able to cover renewal costs in this scenario. Several other alternatives are also sufficiently close to covering costs that further optimisation to balance revenues against ongoing costs is likely to make it possible.
Despite the improved performance, all alternatives continue to fall well short of covering the costs caused by the taxation required to fund the full cost of schemes even in PSS2. However, if cost of taxation considered is limited to financing public sector costs after construction, Ø2:P, H1:P and HA2:P will incur no taxation costs as they are able to cover ongoing operating, maintenance and renewals from revenue (without need for taxation). For the other alternatives, tax financing costs would add 20% to the costs not covered by revenue (i.e. the costs below the axis in the graphs for the with renewals column).
6.4. North Corridor The financial appraisal results for the two North corridor alternatives are summarised in Figure 21 below.
Figure 21. North Corridor Alternatives: Financial Appraisal Results: PSS1 and PSS2 (NPV, MnNOK, 2009 prices, 2015 base, 25 year appraisal period)
The graph shows that, of the two alternatives in the corridor, Ø2:P demonstrates the stronger financial performance, as it generates higher revenue levels (over 15% greater than those generated by G3:Y) and has lower ongoing costs. Renewal costs in particular are 15% lower than those associated with G3:Y, reflecting the fact that the route is about 10% shorter and has fewer structures than G3:Y.
Both alternatives generate sufficient revenue to cover infrastructure and service operating and maintenance costs. Whilst neither can fully cover ongoing renewals costs over 25 years under PSS1, the increased
-50000
-40000
-30000
-20000
-10000
0
10000
20000
30000
G3Y
_1 2
O2P
_1
2
NP
V, M
n N
OK
, 2
00
9 p
rice
s, 2
5 Y
ear
ap
pra
isal
pe
rio
d
Total Revenue
Revenue - Infrastructure & Service Operating/Maintenance
Costs
Revenue - Infrastructure & Service Operating/Maintenance
Costs & Renewals
Revenue - Infrastructure & Service Operating/Maintenance
Costs, Renewals & Cost of Taxation

Norway HSR Assessment Study - Phase III Economic and Financial Analysis, Final Report
Atkins Norway HSR Assessment Study - Phase III: Economic & Financial Analysis, Final Report 49
revenue generation associated with PSS2 leads to Ø2:P being able to cover its renewal costs and G3:Y to be able to cover all but 30% of the total.
Both alternatives fall some way short of being able to also cover the costs of raising the funding for the alternative through taxation, if full lifetime costs are considered. However, if only post construction public sector costs are considered, Ø2:P will not incur any ongoing taxation costs as its able to fully cover its costs through revenue (without need for subsidy and associated taxation).
6.5. West Corridor The financial appraisal results for the four West corridor alternatives are summarised in Figure 22 below.
Figure 22. West Corridor Alternatives: Financial Appraisal Results: PSS1 and PSS2 (NPV, MnNOK, 2009 prices, 2015 base)
The graph shows that, as in the economic appraisal, there is considerable variation in the financial performance of the four alternatives in the West corridor. Again, to a large extent this reflects considerable differences in the nature of the alternatives. Whilst N1:Q and HA2:P are broadly comparable, providing different routes to Bergen, BS1:P is a relatively short coastal section between Bergen and Stavanger and H1:P serves three corridors, Oslo to Bergen, Oslo to Stavanger and Bergen to Stavanger.
Of the two alternatives serving Bergen only, HA2:P performs slightly better as it generates slightly more revenue (4% more than N1:Q) and has slightly lower operating and maintenance costs (7% lower than N1:Q) Nonetheless, like N1:Q, it is unable to completely cover renewal costs in PSS1. The greater revenue generation resulting from PSS2 leads to both alternatives being able to just cover renewal costs, with HA2:P making a slight surplus.
H1:P is different to all other alternatives in all corridors as it is a Y-shaped network, linking three large urban areas (Oslo, Bergen and Stavanger). Consequently it generates more demand and revenue than any of the other alternatives. Operating and maintenance costs and renewals are however not proportionately higher (partly because of the long section of shared route between Oslo and Røldal). Consequently, this alternative demonstrates a strong financial performance and, with the increased revenue generation of PSS2, is able to comfortably cover operating, maintenance costs and renewals.
BS1:P is again different to the other alternatives in that it is a shorter, coastal route without a direct link to Oslo. As discussed in Chapter 5, the market it serves is relatively limited and therefore revenue generation is low. Consequently it shows the weakest financial performance of all the alternatives and, even with the increased revenue generation of PSS2, does not quite cover operating and maintenance costs (excluding renewals).
-60000
-50000
-40000
-30000
-20000
-10000
0
10000
20000
30000
40000
N1
Q_1
2
HA
2P
_1 2
H1
P_
1 2
BS1
P_1 2
NP
V, M
n N
OK
, 2
00
9 p
rice
s, 2
5 Y
ear
ap
pra
isal
pe
rio
d
Total Revenue
Revenue - Infrastructure & Service Operating/Maintenance Costs
Revenue - Infrastructure & Service Operating/Maintenance Costs
& Renewals
Revenue - Infrastructure & Service Operating/Maintenance
Costs, Renewals & Cost of Taxation

Norway HSR Assessment Study - Phase III Economic and Financial Analysis, Final Report
Atkins Norway HSR Assessment Study - Phase III: Economic & Financial Analysis, Final Report 50
None of the alternatives can cover the costs of taxation of full financing of scheme construction and operation. However under PSS2, HA2:P, and H1:P (and virtually N1:Q) would not incur any ongoing tax financing costs after construction as they are able to cover all costs with revenue (without need for taxation).
6.6. South Corridor The financial appraisal results for the two South corridor alternatives are summarised in Figure 23 below.
Figure 23. South Corridor Alternatives: Financial Appraisal Results: PSS1 and PSS2 (NPV, MnNOK, 2009 prices, 2015 base)
Consistent with the economic appraisal, the financial performance of the two alternatives is relatively similar. However S2:P performs more strongly as it generates more revenue (7% greater than S8:Q) and has lower operating and maintenance costs (8% lower than S8:Q).
Both alternatives are able to cover operating and maintenance costs but not renewals under both PSS1 and PSS2. However, the increased revenue generation associated with PSS2 leads to S2:P being able to cover all but 30% of renewal costs and S8:Q to be able to cover approximately half of its renewal costs.
As for the other corridors, neither alternative comes close to being able to cover the costs associated with taxation for full lifetime scheme financing under either PSS1 or PSS2.
-60000
-50000
-40000
-30000
-20000
-10000
0
10000
20000
30000
S8Q
_1 2
S2P_
1 2
NP
V, M
n N
OK
, 2
00
9 p
rice
s, 2
5 Y
ear
ap
pra
isal
pe
rio
d Total Revenue
Revenue - Infrastructure & Service Operating/Maintenance Costs
Revenue - Infrastructure & Service Operating/Maintenance Costs & Renewals
Revenue - Infrastructure & Service Operating/Maintenance Costs, Renewals & Cost of Taxation

Norway HSR Assessment Study - Phase III Economic and Financial Analysis, Final Report
Atkins Norway HSR Assessment Study - Phase III: Economic & Financial Analysis, Final Report 51
6.7. East Corridor The financial appraisal results for the four East corridor alternatives are summarised in Figure 24 below.
Figure 24. East Corridor Alternatives: Financial Appraisal Results: PSS1 and PSS2 (NPV, MnNOK, 2009 prices, 2015 base)
Consistent with the economic appraisal, there are clear differences between the performance of the Gothenburg and Stockholm alternatives.
The Stockholm alternatives generate more revenue but also have higher ongoing costs. Consequently, although both are able to cover operating and maintenance costs under both PSS1 and PSS2, neither alternative is able to completely cover renewals under either PSS1 or PSS2. Of the two alternatives, ST3:R has the stronger performance, as in the economic appraisal. This reflects the fact that it generates slightly more revenue (2% more than ST5:U) and has slightly lower ongoing costs (3% less than ST5:U).
Of the Gothenburg alternatives, again as in the economic appraisal, GO3:Q performs the most strongly of the two alternatives reflecting a balance between the fact that it generates more revenue (18% more than GO1:S) but has higher ongoing costs (10 % greater than GO1:S). The revenue generated by the alternative virtually covers the complete cost of renewals under PSS2.
As for the other corridors, none of the four alternatives comes close to being able to cover the costs associated with taxation for full lifetime scheme financing under either PSS1 or PSS2, although ongoing taxation costs associated with post construction subsidy would be very limited for the Gothenburg alternatives under PSS2.
6.8. Conclusions The results presented above and summarised in Table 9 below show that each of the alternatives generates sufficient revenue to more than cover the associated service and infrastructure operating and maintenance costs under PSS1 and PSS2. This indicates that there is a strong likelihood that HSR services on most routes could operate as commercial and financially sustainable operations if costs of infrastructure implementation, renewal and capital financing are excluded, particularly when service specification is commercially oriented (PSS2).
In PSS1 none of the alternatives can completely cover the full cost of capital renewals over a 25 year life time. However, under PSS2 alternatives Ø2:P, H1:P and HA2:P are able to cover renewal costs. Several other alternatives (such as N1:Q) are also sufficiently close that further optimisation to balance revenues against ongoing costs is likely to make it possible.
However, despite the improved performance in PSS2, all alternatives continue to fall well short of covering the costs caused by the taxation required for financing, if full life time scheme costs are considered.
-40000
-30000
-20000
-10000
0
10000
20000
ST5
U_
1 2
ST3R
_1 2
GO
3Q_1 2
GO
1S_
1 2
NP
V, M
n N
OK
, 2
00
9 p
rice
s, 2
5 Y
ear
ap
pra
isal
pe
rio
d
Total Revenue
Revenue - Infrastructure & Service Operating/Maintenance
Costs
Revenue - Infrastructure & Service Operating/Maintenance
Costs & Renewals
Revenue - Infrastructure & Service Operating/Maintenance
Costs, Renewals & Cost of Taxation

Norway HSR Assessment Study - Phase III Economic and Financial Analysis, Final Report
Atkins Norway HSR Assessment Study - Phase III: Economic & Financial Analysis, Final Report 52
However, if the cost of taxation considered is limited to financing ongoing public sector costs after construction, Ø2:P , H1:P and HA2:P will incur no taxation costs as they are able to cover ongoing operating, maintenance and renewals from revenue (without need for taxation). For the other alternatives tax financing costs would add 20% to the costs not covered by revenue (i.e. below the axis in the graphs).
Across the corridors, the appraisal results suggest that the alternatives with the strongest financial performance by corridor largely match those with the strongest economic performance i.e. Ø2:P in the North, H1:P in the West, S2:P (marginally) in the South and ST3:R on the Stockholm corridor and GO3:Q on the Gothenburg corridor in the East. For single route alternatives in the West Corridor, HA2:P has marginally stronger financial performance than N1:Q, whereas N1:Q is slightly stronger in economic terms. However, the performance of the two alternatives is very similar from both perspectives.
As noted above, the focus of this stage of appraisal has been consistent, comparative assessments of a number of alternatives. Consequently, the alternatives have not been optimised and there is likely to be scope to improve financial performance through detailed balancing of service provision and associated costs and revenue. The comparison between PSS2 and PSS1 provides an indication of the type of change that might be achieved through more detailed analysis, noting that improved financial performance is often achieved at the expense of some wider socio-economic benefits.
The appraisals presented are also reliant on a number of input parameters and assumptions as described in Chapter 3. The next Chapter presents sensitivity analysis to assess the extent to which changes in some of the key values could change the financial appraisals presented above.
Table 9. Financial Appraisal Results by Alternative for PSS1 and PSS2, Alternative Appraisal Framework, NPV, MnNOK, 2009 prices, 25 year appraisal period
North West South East
G3Y O2P N1Q HA2P H1P BS1P S8Q S2P ST5U ST3R GO3Q GO1S
1) PSS1
Revenue
a) Revenue 15,060 17,551 16,038 16,703 28,087 4,735 15,778 16,948 13,590 13,813 10,694 9,050
Ongoing Costs
b) Operating/Maintenance Costs 13,008 12,709 11,870 11,142 19,862 7,270 14,991 13,911 12,644 12,562 9,566 8,072
c) Renewals 9,386 8,061 8,620 8,656 12,107 6,725 10,370 10,626 7,995 7,512 4,468 4,542
d) Cost of Taxation for Scheme Funding 34,607 27,160 31,254 32,076 47,648 23,035 41,344 41,529 24,967 22,123 12,793 13,139
Net Revenue
a- b 2,052 4,842 4,168 5,560 8,226 2,535- 787 3,037 946 1,251 1,128 978
a - (b + c) 7,334- 3,219- 4,452- 3,096- 3,881- 9,260- 9,583- 7,589- 7,049- 6,261- 3,341- 3,564-
a - (b + c + d) 41,941- 30,379- 35,706- 35,172- 51,529- 32,296- 50,927- 49,118- 32,017- 28,384- 16,134- 16,703-
2) PSS2
Revenue
a) Revenue 17,732 21,482 18,199 19,497 32,970 5,853 17,927 19,707 16,087 16,394 11,611 10,532
Ongoing Costs
b) Operating/Maintenance Costs 11,208 10,901 9,799 9,801 16,105 6,123 12,442 12,032 10,555 10,486 7,295 6,579
c) Renewals 9,386 8,061 8,620 8,656 12,107 6,725 10,370 10,626 7,995 7,512 4,468 4,542
d) Cost of Taxation for Scheme Funding 33,507 25,928 30,137 31,023 45,744 22,660 40,158 40,387 24,149 21,218 12,203 12,595
Net Revenue
a- b 6,523 10,581 8,400 9,696 16,865 270- 5,485 7,675 5,532 5,908 4,316 3,952
a - (b + c) 2,863- 2,520 220- 1,040 4,758 6,995- 4,885- 2,951- 2,464- 1,604- 153- 589-
a - (b + c + d) 36,370- 23,408- 30,357- 29,983- 40,986- 29,655- 45,043- 43,338- 26,612- 22,822- 12,356- 13,184-

Norway HSR Assessment Study - Phase III Economic and Financial Analysis, Final Report
Atkins Norway HSR Assessment Study - Phase III: Economic & Financial Analysis, Final Report 53
7. Financial Appraisal - Sensitivity Tests
7.1. Introduction This Chapter describes the results of sensitivity analysis which tests the impact of variations in a number of key assumptions on the financial performance of alternatives presented in the previous Chapter and is intended to provide a better understanding of the key influences on the results.
The analysis has focussed on the following issues:
Inter-City scenarios– testing the potential for Inter-City improvements to impact on the financial appraisal for HSR alternatives;
Discount rate– testing a rate of 2%;
Appraisal period – testing a 40 year period;
Rate of real growth of costs– testing the assumption of no real growth in renewals costs above inflation.
Further detail on the specification and results of each test are provided in the following sections.
7.2. Inter-City Scenarios The interaction with possible Inter-City (IC) improvements described in Chapter 5 for the economic appraisal also has the potential to influence the financial performance of the relevant HSR alternatives (S8:Q on the South Corridor, G3:Y on the North Corridor and GO3:Q on the East Corridor) through potential cost and revenue changes associated with:
Additional IC services running to take advantage of the improvement in capacity and journey times offered by the HSR alternatives; and
The IC project delivering infrastructure required for HSR.
7.2.1. Additional IC Services Figure 25 below presents the financial appraisal for the three relevant alternatives on the assumption that IC services make use of the HSR infrastructure. Results are presented for both PSS1 and PSS2, using a 4.5% discount rate and 25 year appraisal period and are presented alongside the equivalent core alternative in each case.
Figure 25. Financial Appraisal Results for IC scenarios (MnNOK, 2009 prices, 2015 base, 25 year appraisal period)
-60000
-40000
-20000
0
20000
PSS1
_N_G
3Y
N_I
C
PSS2
_N_G
3Y
N_I
C
PSS1
_S_S
8Q
N_I
C
PSS2
_S_S
8Q
N_I
C
PSS1
_E_G
O3Q
N_I
C
PSS2
_E_G
O3Q
N_I
CNPV
, Mn
NO
K, 2
009
pric
es, 2
5 Ye
ar a
ppra
isal
per
iod Total Revenue
Revenue - Infrastructure & Service Operating/Maintenance Costs
Revenue - Infrastructure & Service Operating/Maintenance Costs & Renewals
Revenue - Infrastructure
& Service
Operating/Maintenance Costs, Renewals & Cost
of Taxation

Norway HSR Assessment Study - Phase III Economic and Financial Analysis, Final Report
Atkins Norway HSR Assessment Study - Phase III: Economic & Financial Analysis, Final Report 54
The addition of IC services influences the financial appraisal through the addition of operating costs and revenue associated with the services. In all three corridors, the additional revenue associated with the extra IC services exceeds the associated additional operating costs (based on the information provided by the IC study, as outlined in Chapter 5). Consequently, the consideration of these trips improves the financial performance of each of the three alternatives. However, the improvement is relatively slight compared to total costs and is not large enough to change the picture of financial performance substantially or to allow the alternatives (apart from GO3:Q under PSS2) to cover the costs of renewals..
7.2.2. IC Delivery of HSR Infrastructure Figure 26 shows the equivalent results for the scenarios assuming that IC schemes are built on each corridor in advance of the relevant main HSR alternative.
Figure 26. Financial Appraisal Results for IC scenarios (MnNOK, 2009 prices, 2015 base, 25 year appraisal period)
These scenarios result in a significant reduction in initial costs incurred for the HSR alternative and therefore also in the ongoing renewal and maintenance costs and associated cost of taxation. However, in each case the cost remains two to four times as great as total revenue generated. Additionally, the delayed start of the operations and the assumed 5% reduction in total revenue (to reflect an assumed slight loss in patronage relative to the core alternative a described in Chapter 5), reduces revenue by over 10% relative to the core alternative in each case. Overall therefore these scenarios slightly worsen the financial performance of the relevant alternatives, under current assumptions.
-60000
-40000
-20000
0
20000
N_G3Y N_IC S_S8Q S_IC E_GO3Q E_IC
NPV
, Mn
NO
K, 2
009
pric
es, 2
5 Ye
ar a
ppra
isal
per
iod
Total Revenue
Revenue - Infrastructure & Service Operating/Maintenance Costs
Revenue - Infrastructure & Service Operating/Maintenance Costs & Renewals
Revenue - Infrastructure
& Service
Operating/Maintenance Costs, Renewals & Cost of
Taxation

Norway HSR Assessment Study - Phase III Economic and Financial Analysis, Final Report
Atkins Norway HSR Assessment Study - Phase III: Economic & Financial Analysis, Final Report 55
7.3. Discount Rate Test The 4.5% discount rate adopted for socio-economic appraisal might not necessarily be considered the most appropriate from the perspective of financial appraisal. The following Figures 27 and 28 therefore summarise the financial appraisal for all the alternatives under PSS1 and PSS2, using a lower discount rate of 2%.
Figure 27. Financial Appraisal Results, PSS1, 2% Discount Rate (NPV, MnNOK, 2009 prices, 2015 base, 25 year appraisal period)
Figure 28. Financial Appraisal Results, PSS2, 2% Discount Rate (NPV, MnNOK, 2009 prices, 2015 base, 25 year appraisal period)
The graphs show that ,as the costs and revenue considered in the financial appraisal are relatively evenly distributed over the appraisal period, the change in discount rates has a relatively balanced impact on each

Norway HSR Assessment Study - Phase III Economic and Financial Analysis, Final Report
Atkins Norway HSR Assessment Study - Phase III: Economic & Financial Analysis, Final Report 56
and therefore a relatively small impact on the overall pattern of results and performance of the alternatives. The only alternatives that are able to cover renewals remain Ø2:P, H1:P and HA2:P in PSS2.
7.4. Appraisal Period Test The analysis presented above all uses a 25 year appraisal period, in line with current guidance and the fact that financial appraisal typically focuses on relatively short time periods because of the greater uncertainty in forecasts for later years.
However, the use of a different appraisal periods could alter the picture, particularly because of the different levels of expenditure required on renewals over different time periods. For instance, although both revenues and costs would increase with a 40 year period, there would be a particular increase in the renewal costs as much of the capital infrastructure for the alternatives would require renewal between the 25
th and 40
th year of
operation.
The following Figures 29 and 30 summarise the financial appraisal for all the alternatives under PSS1 and PSS2, using a 40 year appraisal period.
Figure 29. Financial Appraisal Results, PSS1, (NPV, MnNOK, 2009 prices, 2015 base, 40 year appraisal period)
-80000
-60000
-40000
-20000
0
20000
40000
60000
G3Y O2P N1Q HA2P H1P BS1P S8Q S2P ST5U ST3R GO3Q GO1S
NPV
, Mn
NO
K, 2
009
pric
es, 4
0 Ye
ar a
ppra
isal
per
iod
Total Revenue
Revenue - Infrastructure & Service Operating/Maintenance Costs
Revenue - Infrastructure & Service Operating/Maintenance Costs & Renewals
Revenue - Infrastructure & Service
Operating/Maintenance Costs, Renewals & Cost
of Taxation
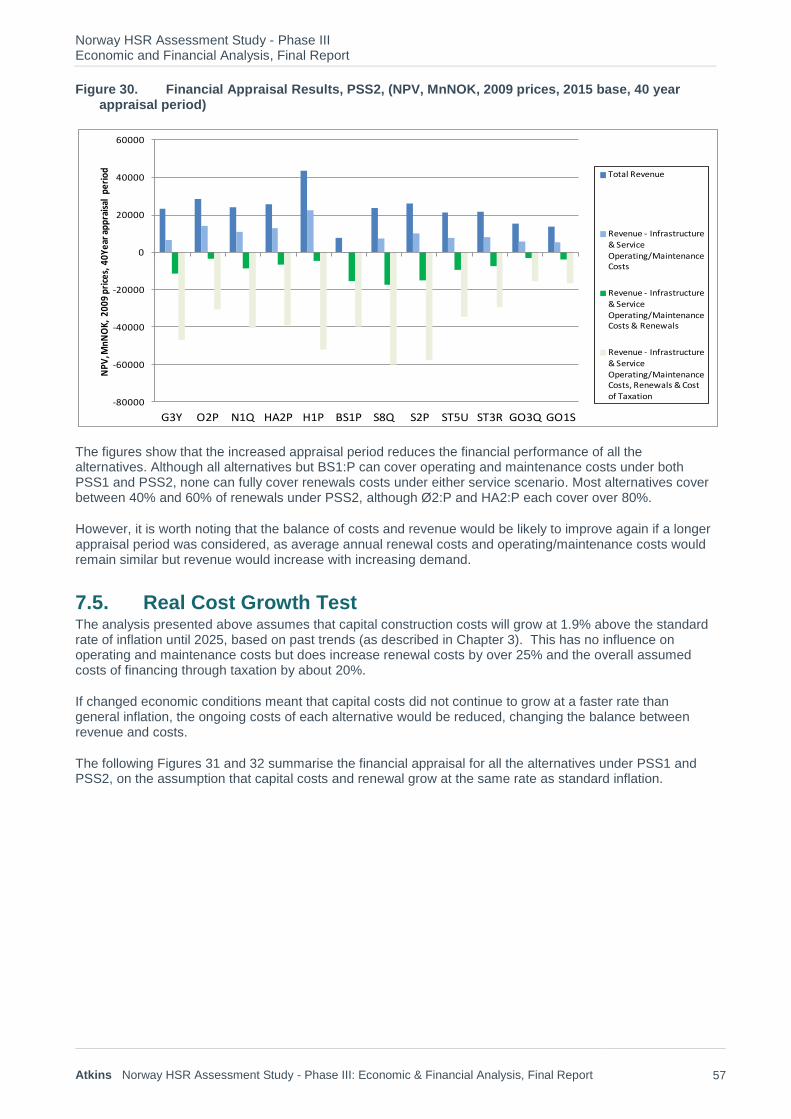
Norway HSR Assessment Study - Phase III Economic and Financial Analysis, Final Report
Atkins Norway HSR Assessment Study - Phase III: Economic & Financial Analysis, Final Report 57
Figure 30. Financial Appraisal Results, PSS2, (NPV, MnNOK, 2009 prices, 2015 base, 40 year appraisal period)
The figures show that the increased appraisal period reduces the financial performance of all the alternatives. Although all alternatives but BS1:P can cover operating and maintenance costs under both PSS1 and PSS2, none can fully cover renewals costs under either service scenario. Most alternatives cover between 40% and 60% of renewals under PSS2, although Ø2:P and HA2:P each cover over 80%.
However, it is worth noting that the balance of costs and revenue would be likely to improve again if a longer appraisal period was considered, as average annual renewal costs and operating/maintenance costs would remain similar but revenue would increase with increasing demand.
7.5. Real Cost Growth Test The analysis presented above assumes that capital construction costs will grow at 1.9% above the standard rate of inflation until 2025, based on past trends (as described in Chapter 3). This has no influence on operating and maintenance costs but does increase renewal costs by over 25% and the overall assumed costs of financing through taxation by about 20%.
If changed economic conditions meant that capital costs did not continue to grow at a faster rate than general inflation, the ongoing costs of each alternative would be reduced, changing the balance between revenue and costs.
The following Figures 31 and 32 summarise the financial appraisal for all the alternatives under PSS1 and PSS2, on the assumption that capital costs and renewal grow at the same rate as standard inflation.
-80000
-60000
-40000
-20000
0
20000
40000
60000
G3Y O2P N1Q HA2P H1P BS1P S8Q S2P ST5U ST3R GO3Q GO1S
NPV
, MnN
OK,
200
9 pr
ices
, 40Y
ear a
ppra
isal
per
iod Total Revenue
Revenue - Infrastructure & Service Operating/Maintenance Costs
Revenue - Infrastructure & Service Operating/Maintenance Costs & Renewals
Revenue - Infrastructure
& Service Operating/Maintenance Costs, Renewals & Cost of Taxation

Norway HSR Assessment Study - Phase III Economic and Financial Analysis, Final Report
Atkins Norway HSR Assessment Study - Phase III: Economic & Financial Analysis, Final Report 58
Figure 31. Financial Appraisal Results, PSS1, without real cost growth (NPV, MnNOK, 2009 prices, 2015 base, 25 year appraisal period)
Figure 32. Financial Appraisal Results, PSS2, without real cost growth (NPV, MnNOK, 2009 prices, 2015 base, 25 year appraisal period)
The figures show that the assumption made on future real capital cost growth has a significant impact on the financial performance of the alternatives. If construction/renewal costs are assumed to grow in line with standard inflation and no real growth is assumed, Ø2:P, H1:P and HA2:P come close to covering their renewals under PSS1. Under PSS2, BS1:P and S8:Q are the only alternatives that do not cover renewals costs and several cover them comfortably.
-60000
-40000
-20000
0
20000
G3Y O2P N1Q HA2P H1P BS1P S8Q S2P ST5U ST3R GO3Q GO1S
NPV
, Mn
NO
K, 2
009
pric
es, 2
5 Ye
ar a
ppra
isal
per
iod
Total Revenue
Revenue - Infrastructure & Service Operating/Maintenance Costs
Revenue - Infrastructure & Service Operating/Maintenance Costs & Renewals
Revenue - Infrastructure
& Service Operating/Maintenance Costs, Renewals & Cost of Taxation
-60000
-40000
-20000
0
20000
40000
G3Y O2P N1Q HA2P H1P BS1P S8Q S2P ST5U ST3R GO3Q GO1S
NP
V M
n N
OK
, 20
09
pri
ces,
25
Ye
ar a
pp
rais
al p
eri
od Total Revenue
Revenue - Infrastructure & Service Operating/Maintenance Costs
Revenue - Infrastructure & Service Operating/Maintenance Costs & Renewals
Revenue - Infrastructure & Service Operating/Maintenance Costs, Renewals & Cost
of Taxation

Norway HSR Assessment Study - Phase III Economic and Financial Analysis, Final Report
Atkins Norway HSR Assessment Study - Phase III: Economic & Financial Analysis, Final Report 59
7.6. Conclusions The sensitivity tests have shown that the financial performance of the alternatives is sensitive to a number of key assumptions.
Consideration of the balance between revenue and costs over a 40 year appraisal period decreases the ability of alternatives to meet renewal costs, as much of the capital infrastructure for the alternatives would require renewal between the 25
th and 40
th year of operation. However, consideration of a longer period
could improve the balance of costs and revenues again as revenue would increase with increased demand.
Using a lower discount rate, assuming a reduced rate of real capital cost growth above inflation and considering the impact of additional trips on the IC infrastructure could also all help improve performance in terms of the number of alternatives covering or nearly covering service and infrastructure maintenance and operating costs and ongoing renewals.
Also, as discussed in Chapter 5, the final equilibrium position of transport provision on competing modes after HSR implementation is also likely to improve the financial position of HSR as it is likely to reduce the attractiveness of other modes (as they reduce service provision), increasing patronage on HSR.
Finally, as highlighted in Chapter 6 there would also be scope to improve financial performance through detailed optimisation of alternatives. This would include detailed, iterative balancing of service provision and associated costs and revenue as alternatives develop beyond the current stage of comparison of a large range of alternatives and are considered in more detail.

Norway HSR Assessment Study - Phase III Economic and Financial Analysis, Final Report
Atkins Norway HSR Assessment Study - Phase III: Economic & Financial Analysis, Final Report 60
8. Scenario B – Financial and Economic Appraisal Results
8.1. Introduction and Description of Scenario B Alternatives As discussed in Chapter 2, the mandate given to JBV for investigation of HSR in Norway has required that the upgrade of existing lines as an alternative be examined. It is recognised that this does not deliver a high speed rail offer but would indicate the scope to secure benefits in the HSR corridors via existing lines.
For the purposes of this study, Scenario B was conceptually defined by JBV as:
„Delivery of a uniform 20% reduction in travel time, maintaining the current stopping pattern and remaining single track outside of the Inter-City (IC) area’
In order to undertake an analysis of the performance of Scenario B, a clear specification of what this would involve was required. JBV‟s alignment design teams each examined possible options for delivery of Scenario B and provided high level specifications to Atkins and F+G, covering each route per corridor, and reflecting the sections of route where the journey time improvement would be secured. This is summarised in Table 10 below.
Table 10. Scenario B Summary of Specification
Corridor Route Section(s) of route where journey time improvement is secured
% Journey Time Assumption
North Oslo-Trondheim Gardermoen-Oppdal 20% reduction in total end-to-end time West Oslo-Bergen Hønefoss-Bergen
South Oslo - Kristiansand -Stavanger Drammen-Sandnes
East Oslo - Stockholm Lillestrøm-Kongsvinger 20% reduction in Olso-Charlottenburg time: equates to a 5% reduction in Oslo-Stockholm time
The exceptional Scenario B alternative is clearly the East corridor alternative between Oslo and Stockholm where the specification aims only to achieve a 20% reduction in journey time between Oslo and Charlottenburg. Norconsult, the alignment consultants for this corridor advised that insufficient information was available to determine a specification for Scenario B improvements on Swedish sections of route and consequently the specification only aimed to deliver the reduction in journey time within Norway. This should be borne in mind when considering the results presented in this Chapter.
8.2. Economic Appraisal The remainder of this Chapter summarises the key results from the economic and financial appraisal of the implementation of Scenario B in the four corridors.
8.2.1. Key Assumptions The Scenario B alternatives have been appraised using the Standard and Alternative Frameworks described in Chapter 3 for Scenarios C/D as far as possible. However, as described in Chapter 3, a revision to the calculation of user benefits was required because the travel demand impacts of the alternatives have been forecast using NTM 5 rather than the HSR demand forecasting model.
NTM5 is considered the more appropriate modelling tool for these alternatives as Scenario B represents a relatively small improvement to the existing reference case rail network, which is best represented in NTM5, rather than the step change in transport provision provided by Scenarios C/D. However, the „logsum‟

Norway HSR Assessment Study - Phase III Economic and Financial Analysis, Final Report
Atkins Norway HSR Assessment Study - Phase III: Economic & Financial Analysis, Final Report 61
approach to calculating user benefits in the Alternative Framework for Scenarios C/D relies on the use of the HSR Mode Choice Model as the calculation is dependent on the particular structure of the model and the use of costs and parameters from it, including the values of time derived through the Stated Preference survey. The use of NTM 5 therefore prevented the use of the „logsum‟ calculation for the appraisal of the Scenario B tests.
Consequently, a ‟40 year‟ assessment was undertaken alongside the Standard Framework which applied all the other assumptions included in the Alternative Framework (including the extended appraisal period and application of real growth in costs) but used the Standard Framework approach to calculating user benefits. This followed the approach set out in JBV guidance (i.e. using the „rule of half‟), valuing rail time benefits at the standard rail value of time.
This variation in approach means that the benefits calculated for the Scenario B alternatives are not directly comparable with those calculated for the Alternative Framework for Scenarios C/D. However, they provide an appropriate basis for identifying the relative scale of impacts, allowing comparison between the Scenario B alternatives and against the relevant Scenario C/D alternatives.
NTM5 is intended as a strategic model and therefore includes only long distance trips (over 100 km). As no gravity model of the type used to estimate short distance trips for scenarios C/D is available for Scenario B, the user benefits presented in the core tests represent only the benefits experienced by long distance journeys, understating the total benefits likely to be accrued. A sensitivity test has therefore been run to make an indicative allowance for shorter trips and is presented alongside the core tests below. It estimates impacts on the assumption that the number of trips of less than 100 km would be broadly equal to the number over 100 km and that on average each would accrue half of the average benefit experienced on the longer trips.
A final, more minor difference between the appraisals for Scenario B and those for Scenarios C/D is the fact that the environmental consultants did not undertake the detailed assessment of the lifecycle of CO2 emissions impacts of the Scenario B alternatives that would equate to those that they undertook for Scenario C/D. In the absence of this more detailed data, the default JBV approach is used for Scenario B, using standard emissions rates per vehicle kilometre (omitting the construction impacts included in the Scenario C/D appraisal).
8.2.2. Economic Appraisal Results Figure 33 below summarises the overall economic appraisal results for each alternative as derived using both the Standard Framework and revised Alternative Framework, labelled the 40 year assessment. The „user benefits and third party impacts‟ entry for each alternative shows the net effect of the alternatives on transport users (particularly journey time savings) and on third parties (particularly environmental effects caused by any mode shift).
The „public sector/operator impacts entry‟ shows the combined effect of the construction costs and ongoing increases in maintenance, operating and renewal costs associated with the improvements undertaken to achieve the journey time reductions, along with the impact on the economy of the taxation required to fund the investment. The indicator diamond in each column shows the net effect of all of the impacts and equates to the Net Present Value (NPV) of the alternative.

Norway HSR Assessment Study - Phase III Economic and Financial Analysis, Final Report
Atkins Norway HSR Assessment Study - Phase III: Economic & Financial Analysis, Final Report 62
Figure 33. Economic Appraisal Results (NPV, MnNOK, 2009 prices, 2015 base, 25 and 40 year appraisal period)
Table 11 below shows the data underlying the results in Figure 33 in more detail.
Table 11. Economic Appraisal Results by Alternative, Standard Appraisal and ‘Revised Alternative Framework, (NPV, MnNOK, 2009 prices 25 and 40 year appraisal periods).
Figure 33 and Table 11 show that the lifetime costs of each alternative considerably outweigh the monetised benefits that they generate, with each alternative generating a negative NPV over both the 25 and 40 year appraisal period and both with and without the additional allowance for short trips. The values of the 40 year NPVs range from -12 BnNOK for Stockholm, through -42 BnNOK for Bergen, -67 BnNOK for Stavanger to the most negative value of -80Bn NOK for Trondheim (all 2009 prices).
The scale of each NPV depends primarily on the scale of public sector costs. Benefits are worth less than 5% of the costs in all alternatives and therefore have only a limited impact on the final outcome. As the
-90000
-80000
-70000
-60000
-50000
-40000
-30000
-20000
-10000
0
10000
Tro
nd
he
im_
25
yr
40
yr
Be
rge
n_
25
yr
40
yr
Stav
ange
r_2
5yr
40
yr
Sto
ckh
olm
_2
5yr
40
yr
Tro
nd
he
im_
S_2
5yr
40
yr
Be
rge
n_
S_2
5yr
40
yr
Stav
ange
r_S_
25
yr
40
yr
Sto
ckh
olm
_S_
25
yr
40
yr
NP
V M
nN
OK
, 2
00
9 P
rice
s, 2
5 a
nd
40
ye
ar a
pp
rais
al
pe
rio
d
NPV Public Sector/Operator Impacts
NPV User Benefits and Third Party Impacts
Overall NPV
Core Assessment Revenue and Benefits + 50%
Core Assessment Revenue & Benefits + 50%
Trondheim Bergen Stavanger Stockholm Trondheim Bergen Stavanger Stockholm
1) Standard Framework - 25 year period
a) User Benefits 1,476 1,482 681 3 2,213 2,223 1,022 4
b) Third Party Effects 251 185 93 0 376 278 139 1
c) Net Public Sector/Op. Effects 58,776- 30,626- 48,531- 8,970- 58,297- 30,266- 48,366- 8,969-
d) NPV (a+b+c) 57,050- 28,958- 47,757- 8,967- 55,708- 27,765- 47,205- 8,965-
e) Costs (included in b)
Construction/Renewals 44,652- 24,488- 37,814- 5,294- 44,652- 24,488- 37,814- 5,294-
Operating/Maintenance 3,922 1,697 2,910 1,514 3,922 1,697 2,910 1,514
Cost of Taxation 10,669- 5,662- 8,827- 1,554- 10,581- 5,591- 8,795- 1,554-
f) Revenue (included in b)
HSR 1,250 985 439 1 1,875 1,477 659 1
Other 376- 340- 140- 0- 564- 510- 209- 1-
2) 'Revised Alternative Framework' - 40 year period
a) User Benefits 2,098 2,118 982 4 3,147 3,177 1,473 6
b) Third Party Effects 353 262 132 0 529 393 198 1
c) Net Public Sector/Operator Effects 83,053- 44,289- 68,434- 11,986- 82,415- 43,806- 68,211- 11,986-
d) NPV (a+b+c) 80,602- 41,909- 67,320- 11,982- 78,738- 40,236- 66,541- 11,980-
e) Costs (included in b)
Construction/Renewals 48,878- 26,572- 41,690- 5,560- 48,878- 26,572- 41,690- 5,560-
Operating/Maintenance 5,176 2,295 3,858 1,919 5,176 2,295 3,858 1,919
Cost of Taxation 14,120- 7,554- 11,649- 2,015- 14,002- 7,458- 11,606- 2,015-
f) Revenue (included in b)
HSR 1,654 1,309 588 1 2,481 1,964 882 2
Other 491- 445- 184- 0- 736- 667- 276- 1-

Norway HSR Assessment Study - Phase III Economic and Financial Analysis, Final Report
Atkins Norway HSR Assessment Study - Phase III: Economic & Financial Analysis, Final Report 63
Stockholm route costs the least, it has the least negative NPV, despite having negligible forecast benefits (as the alternative is only specified to achieve a 20% reduction on the journey time within Norway, equating to only a 5% reduction over the full journey length).
Similarly, the Trondheim route is the most expensive and therefore has the most negative NPV despite generating the greatest user benefits/third party effects (2.5 BnNOK, with the allowance for short trips).
The costs reflect the considerable and challenging construction and engineering upgrade works, required to achieve the 20% journey time savings for each corridor. As outlined in the Phase III Cost Report (Norway HSR Assessment Study Phase III: Estimation and Assessment of Investment Costs, Final Report, January 2012), costs vary according to environmental, geographical and topographical features as well as route length even when considering upgrade works, rather than new build.
The scale of the investment required means that the lifetime public sector costs associated with the alternatives are in the order of 20% to 35% of the costs associated with the most comparable HSR routes (for all but the Stockholm route which only covers a small proportion of the length of the equivalent HSR route). However, the transport improvements achieved as a result are considerably smaller, promoting less change in travel and consequently affecting a smaller market.
The average journey time/cost savings per affected journey (taken as all rail trips in the affected corridor) are between approximately 10% and 25% of the average benefits per HSR passenger in the HSR alternatives, at approximately 20 NOK per trip for Stavanger, 60 NOK for Trondheim and over 80 NOK for Bergen (with negligible benefits for the Stockholm corridor) (all 2024, 2009 prices). The scale of benefit per trip to a large extent reflects the average length of the trips accruing the benefits. On the Bergen corridor over 65% of benefits are accrued on end to end trips, whereas for the Trondheim corridor the figure is closer to 30% to 35% and for the Stavanger corridor is between 20% and 25%. In all three corridors the majority of the remaining benefits is focussed on trips to and from the route termini rather than between intermediate stations.
The total benefits generated by each alternative are the result of both the average benefit experienced per trip and the size of the market affected. Therefore as the market on the Bergen corridor is less than three-quarters of that on the Trondheim corridor, the total benefits for the two are very similar, despite the difference in per trip benefit.
8.3. Financial Appraisal Financial appraisal of the alternatives considers the extent to which the ongoing costs of each upgrade are covered by the revenue it generates. One aim is to identify whether the alternatives could be considered a viable commercial concern once the initial costs of improvement and construction have been committed.
As discussed in Chapter 6, the costs to be considered in the comparison can be defined in various ways. Generally they are considered as the ongoing direct costs of operating the system i.e. the operating and maintenance costs for the infrastructure and services associated with the improvement. A wider definition would also include the ongoing capital renewals required to maintain the system.
It is also possible, although less usual, to consider the indirect costs of the negative economic impact of the taxation required to fund the scheme as part of the ongoing costs. As for Scenarios C/D in Chapters 6 and 7, this interpretation is also included in the analysis below for completeness.
Figure 34 shows the „net revenue‟ generated by each Scenario B alternative when comparing the increase in incoming rail revenue with each of the three definitions of cost outlined. The first column in each group shows the total increase in revenue generated by the alternative to provide a sense of scale. The first group of columns shows the core results and the second group shows the results in the sensitivity test outlined above where an indicative 50% increase in revenue is included to allow for the possible impacts on short distance trips that are not captured by NTM5.
Table 12 presents the figures underlying both sets of results in more detail.
Results are presented for a 4.5% discount rate and 25 year lifetime, in line with current Norwegian guidance.

Norway HSR Assessment Study - Phase III Economic and Financial Analysis, Final Report
Atkins Norway HSR Assessment Study - Phase III: Economic & Financial Analysis, Final Report 64
Figure 34. Financial Appraisal Results (NPV, MnNOK, 2009 prices, 2015 base, 25 year appraisal period)
Table 12. Financial Appraisal Results, Alternative Framework, NPV, MnNOK, 2009 prices 25 year appraisal period.
Figure 34 again demonstrates the balance between the relatively high costs of achieving and maintaining the Scenario B upgrades relative to the small journey improvements achieved and the limited market benefiting from the improvements. In contrast to the Scenario C/D HSR alternatives, none of the Scenario B alternatives are able to cover the ongoing infrastructure and service operating and maintenance costs of the improvement, even if renewals are excluded. Even with the illustrative 50% increase in revenue to allow for possible patronage from shorter trips, only the West (Oslo-Bergen) Scenario B alternative is close to covering its ongoing maintenance and operating costs, but not the additional costs of renewals.
The cost of taxation is, on average, over 10 times as great as the incoming revenue over the 25 year period
across all the alternatives.
-20000
-15000
-10000
-5000
0
5000
Tro
nd
he
im
Be
rge
n
Stav
ange
r
Sto
ckh
olm
Tro
nd
he
im-R
ev
+ 5
0%
Be
rge
n-R
ev
+ 5
0%
Stav
ange
r-R
ev
+ 5
0%
Sto
ckh
olm
-Re
v +
50%
NP
V, M
n N
OK
, 2
00
9 p
rice
s, 2
5 Y
ear
ap
pra
isal
pe
rio
d Total Revenue
Revenue - Infrastructure
& Service
Operating/Maintenance Costs
Revenue - Infrastructure & Service
Operating/Maintenance Costs & Renewals
Revenue - Infrastructure & Service Operating/Maintenance Costs, Renewals & Cost
of Taxation
Core Assessment Revenue + 50%
Trondheim Bergen Stavanger Stockholm Trondheim Bergen Stavanger Stockholm
Revenue
a) Revenue 1,250 985 439 1 1,875 1,477 659 1
Ongoing Costs
b) Operating/Maintenance Costs 3,922 1,697 2,910 1,514 3,922 1,697 2,910 1,514
c) Renewals 3,795 1,900 2,505 640 3,795 1,900 2,505 640
d) Cost of Taxation for Scheme Funding 12,933 6,904 10,680 1,802 12,855 6,846 10,653 1,802
Net Revenue - - - - - - - -
a- b 2,672- 712- 2,471- 1,513- 2,047- 220- 2,251- 1,513-
a - (b + c) 6,467- 2,613- 4,975- 2,153- 5,842- 2,120- 4,756- 2,153-
a - (b + c + d) 19,400- 9,517- 15,655- 3,955- 18,697- 8,967- 15,409- 3,954-
Norway HSR Assessment Study - Phase III Economic and Financial Analysis, Final Report
Atkins Norway HSR Assessment Study - Phase III: Economic & Financial Analysis, Final Report 65
8.4. Conclusions The Scenario B alternatives provide journey time improvements to those directly affected by the scheme. However the characteristics of the corridors and existing routes mean that the cost of achieving and maintaining the journey time improvements is still substantial, particularly in the North corridor.
In combination with the limited market directly affected by the improvements and the relatively modest scale of benefits achieved, this means that the costs of the scenarios outweigh the benefits in both lifetime economic terms and on an ongoing financial basis.
The financial performance in particular is significantly weaker than the HSR alternatives with little scope for any of the alternatives to cover their renewal costs.

Norway HSR Assessment Study - Phase III Economic and Financial Analysis, Final Report
Atkins Norway HSR Assessment Study - Phase III: Economic & Financial Analysis, Final Report 66
9. Summary and Conclusions
9.1. Appraisal Framework Economic and financial appraisal is a valuable tool for comparing the performance of different alternatives and the analysis presented in this report provides a good basis for comparative evaluation of the twelve HSR alternatives and four Scenario B alternatives across four corridors, identified by JBV for detailed appraisal. It is nevertheless important to recognise that findings at this stage will have a degree of uncertainty attached to them, given the relatively early stage of development of alternatives. Outputs are geared towards identification and understanding of the comparative, rather than absolute, performance of alternatives
The analysis undertaken has confirmed that, of the two frameworks used to structure the appraisal presented, the Alternative Framework better captures and represents the behavioural response and associated benefits of introducing HSR services. It is recommended that the Alternative Framework be adopted as the primary basis for assessment looking forward.
9.2. Economic Appraisal The appraisal has shown that a number of the HSR alternatives considered have the potential to generate considerable user benefits and revenue, particularly those providing significant time savings across longer distance routes.
There is considerable variation between some alternatives in terms of benefits. For example, the net PV of benefits (combined user benefits, net revenue, freight impacts and third party impacts) generated by H1:P is approximately 70 BnNOK (over 40 years in PSS1, Alternative Framework, 2009 prices) which is nearly five times as large as the 15 BnNOK forecast to be generated by BS1:P, reflecting the fact that H1:P is a „‟Y-shaped” alternative serving three routes and therefore not directly comparable with the other alternatives. However, the net impacts of most of the other single route alternatives in the North, West, South and Stockholm East corridors are relatively similar, with net benefits ranging between just under 40 BnNOK and 50 BnNOK (NPV, 40 years, Alternative Framework). The net benefits of the Gothenburg corridor alternatives are about 25% lower at just under 30 BnNOK.
In all alternatives, user benefits are the most significant element of the total benefits. HSR revenue levels are also significant; however, the gains are typically largely offset by reductions in revenue on other modes (particularly air). These losses equate to between 70% and 80% of the HSR revenue gains in PSS1. The higher fares and associated revenue in PSS2 mean that this proportion is reduced to around 50% and less for nearly all alternatives, improving the financial performance of the alternatives.
Third party impacts (primarily carbon) are only marginal to the overall economic appraisal. Freight impacts also have a very small impact.
The scale of user benefits varies between alternatives in response to both the scale of door to door journey cost advantage that HSR offers on that route and the market size available. Both these factors vary considerably between corridors and alternatives leading to the variations in benefits estimated.
By corridor, the alternatives with the strongest economic performance are Ø2:P in the North, H1:P in the West, (or marginally N1:Q, if single route alternatives are considered), S2:P (marginally) in the South and ST3:R on the Stockholm corridor and GO3:Q on the Gothenburg corridor in the East.
Although monetised benefits generated are significant, given the large scale of investment costs involved , they do not offset total costs across the appraisal time period for any of the alternatives considered and hence all have negative NPVs that range between -66 BnNOK (BS1:P) and -252 BnNOK (H1:P) (2009 prices, Alternative Framework, PSS1).
Sensitivity analysis indicates some areas in which changes would improve the balance between costs and benefits, such as the consideration of additional benefits (wider economic impacts or interactions with Inter-City improvements), altered assumptions on real construction cost growth and an alternative view on competitive response. However, investment costs continue to significantly exceed benefits for each of the alternatives, even with more optimistic assumptions in these areas.
Norway HSR Assessment Study - Phase III Economic and Financial Analysis, Final Report
Atkins Norway HSR Assessment Study - Phase III: Economic & Financial Analysis, Final Report 67
The negative economic performance of the alternatives reflects the relatively small market in Norway from which benefits and additional net revenue can be derived relative to the overall high investment costs which are commensurate with the delivery of HSR schemes elsewhere aimed at serving more sizable populations and densities. The relatively low proposed service utilisation (1tph-2tph) compared with other European HSR schemes (typically 8tph-12tph) means that assets would be relatively underused, reducing the scope to generate benefits and weakening economic performance. Performance is also weakened by the fact that the existing transport provision available in the reference case is reasonably good, particularly for end-to-end journeys by air. This limits the scope to secure journey cost benefits through the introduction of HSR. Consequently, the resulting negative NPVs are to be expected.
It is noted that consequential impacts of introducing HSR have not been examined in detail at this stage and that the response of air and coach operations to the implementation of HSR is uncertain. The response could achieve a moderate improvement in the case for HSR, as indicated by the competitive response sensitivity test. However, given the scale of investment costs currently estimated, it would be unlikely to alter the overall negative economic NPV position of HSR alternatives.
9.3. Financial Appraisal The financial appraisal shows that the revenue generated by each of the HSR alternatives is sufficient to cover the associated service and infrastructure operating and maintenance costs. This indicates that there is a strong likelihood of HSR services on most routes being able to operate as commercial and financially sustainable operations, if costs of infrastructure implementation, renewal and capital financing are excluded, particularly when service specification is commercially oriented (PSS2). The best performing alternatives serving a single route are Ø2:P in the North, HA2:P in the West, S2:P in the South and ST3:R in the East. H1:P in the West does perform more strongly but this alternative is exceptional in combining the delivery of three service routes in a single larger HSR scheme.
With the PSS1 service specification, none of the alternatives can completely cover the full cost of capital renewals over a 25 year life time, or cover the costs of the taxation required to fund the substantial construction costs of each scheme. The improved financial performance of PSS2 (higher rail fares generating increased revenue, coupled to reduced train service costs) means that three alternatives, Ø2:P in the North corridor and HA2:P and H1:P in the West corridor are able to also cover their renewals over a 25 year time frame under this scenario. Several other alternatives are sufficiently close to covering their costs to suggest that it would be possible with further optimisation to balance revenues against ongoing costs.
A particularly wide definition of ongoing costs would also include the costs of the decreased efficiency of the economy caused by the additional taxation required to fund each alternative. Given the scale of construction costs, this is a very large cost and therefore none of the alternatives are able to come close to covering it through ongoing revenues (in PSS1 or PSS2).
An alternative perspective on the cost of taxation would focus only on taxation associated with financing public sector costs/subsidies after construction, treating the costs of financing construction as sunk costs, along with construction costs themselves. In this approach any alternatives able to fund their own operating and maintenance costs and renewals from revenue would not require public subsidy and so would not incur ongoing costs associated with tax financing (as costs would be fully covered by revenue raised). For those alternatives not able to cover full costs, the cost of taxation would add 20% to any costs not covered by revenue.
However, in general, such economy wide, indirect considerations are not usually included in financial appraisals which typically focus on direct costs associated with rail operations
Consideration of the balance between revenue and costs over a 40 year appraisal period decreases the ability of alternatives to meet these direct costs, as much of the capital infrastructure for the alternatives would require renewal between the 25
th and 40
th year of operation. However, consideration of an even
longer period could improve the balance of costs and revenues again as revenue would increase with increased demand.
Using an alternative discount rate for the analysis and considering additional trips on the Inter-City infrastructure would also improve the financial performance of the alternatives, as would a reduced rate of real growth in construction/renewal costs above standard inflation.

Norway HSR Assessment Study - Phase III Economic and Financial Analysis, Final Report
Atkins Norway HSR Assessment Study - Phase III: Economic & Financial Analysis, Final Report 68
Additionally, as noted above, the focus of this stage of appraisal has been consistent, comparative assessments of a number of alternatives. Consequently, the alternatives have not been optimised and there is likely to be scope to improve financial performance through detailed balancing of service provision and associated costs and revenue. The comparison between PSS2 and PSS1 provides an indication of the type of change that might be achieved through more detailed analysis, noting that improved financial performance is often achieved at the expense of some wider socio-economic benefits
Finally, the financial appraisal could also alter significantly if the opportunity for consequential cost/subsidy savings relating to other operations with HSR‟s introduction could be considered as offsetting ongoing costs. The future of the wider rail network and the financial implications in the context of HSR is therefore an area of worthy further investigation. As discussed in Chapter 5, the final equilibrium position of transport provision on competing modes after HSR implementation is also likely to improve the financial position of HSR as it is likely to reduce the attractiveness of other modes (as they reduce service provision), increasing patronage on HSR.
9.4. Analysis of Scenario B Alternatives The economic appraisal shows that the lifetime costs of each Scenario B alternative considerably outweigh the monetised benefits that they generate, with each alternative generating a negative NPV over both 25 and 40 year appraisal periods. The values of the 40 year NPVs range from -12 BnNOK for Stockholm, to -42 BnNOK for Bergen, -67 BnNOk for Stavanger to the highest value of -80 BnNOK for Trondheim (all 2009 prices).
These results reflect the fact that, although the Scenario B alternatives provide journey time improvements to those directly affected by the scheme, the characteristics of the corridors and existing routes mean that the cost of achieving and maintaining the journey time improvements is still substantial, particularly in the North corridor. In combination with the limited market directly affected by the improvements and the relatively modest scale of benefits achieved, this means that the costs of the alternatives outweigh the benefits in lifetime economic terms.
Financial appraisal of Scenario B alternatives also reflects the balance between the relatively high costs of achieving and maintaining the upgrades relative to the small journey improvements achieved and the market benefiting from the improvements. In contrast to the Scenario C/D HSR alternatives, none of the Scenario B alternatives are able to cover the ongoing infrastructure and service operating and maintenance costs of the improvement, even if renewals are excluded. Even with an illustrative 50% increase in revenue to allow for possible patronage from shorter trips, only the West (Oslo-Bergen) Scenario B alternative can almost cover its ongoing maintenance and operating costs, but not the additional costs of renewals.
9.5. Additional Considerations The fit with the Inter-City project offers potential to enhance the business case of both projects and the opportunity exists now at a marginal cost to optimise this fit, through, for example, the adoption of 250 kph as a speed standard (rather than 200 kph). It is recommended that examination of this opportunity be mandated at the earliest juncture and a strategy be produced detailing how the projects can be optimised.
The Inter-City project and the opportunity to phase in different high speed corridors, presents different network opportunities and potentially an improved business case by, for example, allowing high speed passengers from Trondheim to connect with Inter-City services to Vestfold. Examination of these opportunities would be worthwhile. In addition the use of the existing line and the handling of the existing services will have a significant impact on the business case.
Further consideration should be given to dedicated HSR links to Gardermoen Airport, particularly with respect to South and West alternatives, as this will offer the potential for significant additional demand and revenue, possibly enhancing the economic and financial performance.
Alternative structures for procurement and delivery of HSR in Norway could have significant implications for scheme costs, risk and financial outcomes and there is scope to examine and better understand the feasibility of HSR delivery in this respect.

Norway HSR Assessment Study - Phase III Economic and Financial Analysis, Final Report
Atkins Norway HSR Assessment Study - Phase III: Economic & Financial Analysis, Final Report 69
Appendix A. Differences between ‘Standard’ and ‘Alternative/Extended’ Appraisal Frameworks
A.1. Overview The table below outlines the changes made in the Alternative/Extended Framework relative to the Standard Framework and the reasons behind them.

Norway HSR Assessment Study - Phase III Economic and Financial Analysis, Final Report
Atkins Norway HSR Assessment Study - Phase III: Economic & Financial Analysis, Final Report 70
Table 13. Revisions made to Standard Framework to produce Alternative Framework
Revision Represented in: Description Reason Comments/Issues
Central Case
Sensitivity Test
1 Treatment of benefits for new modes
Y Y Use of the „logsum‟ approach to calculate transport user benefits for the Core Assessment (rather than the „rule of half‟ approach used in the JBV/ Standard Framework).
This approach is applicable for discrete choice models such as the HSR mode choice model and allows user benefits to be calculated directly from the model functions through the comparison of the generalised costs of travel faced by passengers across all modes (by purpose) with and without the HSR alternatives
The approach overcomes the issue of the new mode and allows an accurate estimation of user benefits, avoiding the approximations required for the „rule of half‟ approach.
However, the approach does not allow disagregation of benefits between modes (as the „rule of half‟ does) and is not applicable for scenarios modelled using NTM5 (rather than the HSR demand model). Therefore a „rule of half‟ assessment will also be undertaken as a sensitivity test for each alternative.
HSR is a „new mode‟ which does not exist without the alternative and has characteristics (such as travel speed, cost and comfort) which differ from those for existing modes.
The standard „rule of half‟ approach is therefore not appropriate (as it relies on comparing travel costs for each transport mode with and without the scheme).
The „logsum‟ approach allows user benefits to be calculated directly from the Mode Choice Model without the need for approximation, overcoming the new mode issue and using valuations that are consistent with the demand forecasting model.
The values of time derived from the stated preference survey differ from those in standard JBV guidance (see Appendix C).
The „logsum‟ approach will only be applicable for scenarios tested using the HSR demand forecasting model. Scenarios tested using NTM5 (i.e. B) will not include a new mode of HSR (as schemes are upgrades of existing rail only), meaning that the „logsum‟ approach would not be applicable and the „rule of half‟ approach would have to be used
The difference between the „logsum‟ and standard „rule of half‟ assessments for scenarios with HSR demand could be significant due to the scale of the approximation in the „rule of half‟ approach and variations in values of time.
2 Account for values of time for HSR
Y Y Use of the values of time derived from the Stated Preference survey for the study – including a HSR
As HSR is a „new mode‟, the rail values of time in standard guidance are likely to not be applicable for
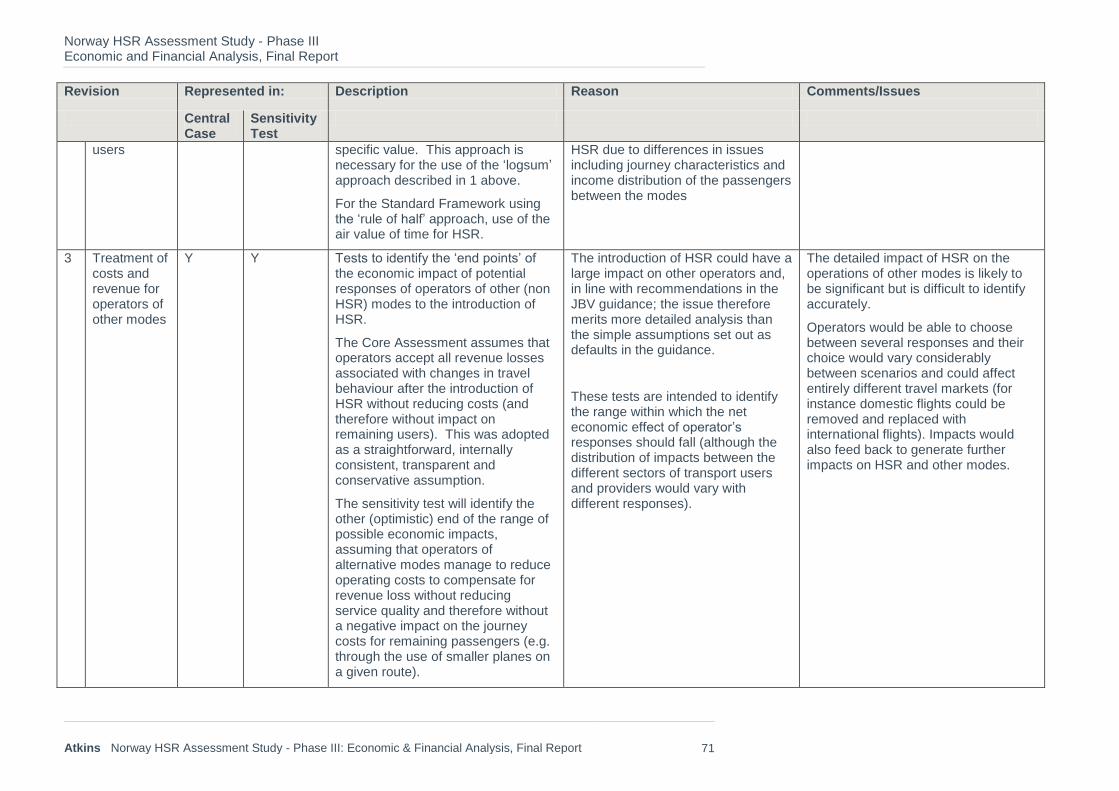
Norway HSR Assessment Study - Phase III Economic and Financial Analysis, Final Report
Atkins Norway HSR Assessment Study - Phase III: Economic & Financial Analysis, Final Report 71
Revision Represented in: Description Reason Comments/Issues
Central Case
Sensitivity Test
users specific value. This approach is necessary for the use of the „logsum‟ approach described in 1 above.
For the Standard Framework using the „rule of half‟ approach, use of the air value of time for HSR.
HSR due to differences in issues including journey characteristics and income distribution of the passengers between the modes
3 Treatment of costs and revenue for operators of other modes
Y Y Tests to identify the „end points‟ of the economic impact of potential responses of operators of other (non HSR) modes to the introduction of HSR.
The Core Assessment assumes that operators accept all revenue losses associated with changes in travel behaviour after the introduction of HSR without reducing costs (and therefore without impact on remaining users). This was adopted as a straightforward, internally consistent, transparent and conservative assumption.
The sensitivity test will identify the other (optimistic) end of the range of possible economic impacts, assuming that operators of alternative modes manage to reduce operating costs to compensate for revenue loss without reducing service quality and therefore without a negative impact on the journey costs for remaining passengers (e.g. through the use of smaller planes on a given route).
The introduction of HSR could have a large impact on other operators and, in line with recommendations in the JBV guidance; the issue therefore merits more detailed analysis than the simple assumptions set out as defaults in the guidance.
These tests are intended to identify the range within which the net economic effect of operator‟s responses should fall (although the distribution of impacts between the different sectors of transport users and providers would vary with different responses).
The detailed impact of HSR on the operations of other modes is likely to be significant but is difficult to identify accurately.
Operators would be able to choose between several responses and their choice would vary considerably between scenarios and could affect entirely different travel markets (for instance domestic flights could be removed and replaced with international flights). Impacts would also feed back to generate further impacts on HSR and other modes.

Norway HSR Assessment Study - Phase III Economic and Financial Analysis, Final Report
Atkins Norway HSR Assessment Study - Phase III: Economic & Financial Analysis, Final Report 72
Revision Represented in: Description Reason Comments/Issues
Central Case
Sensitivity Test
4 Include allowance for real growth in construction costs
Y Additional allowance on construction and renewal costs to reflect the extent to which construction cost inflation is forecast to vary from standard inflation over the construction time period
Historically, construction cost inflation has typically varied from the standard rate in the economy
Appropriate assumptions have been agreed between Ernst and Young and JBV.
The Phase II Economic and Financial Analysis Final Report also included the recommendation to include real growth above inflation in values of time, accident and environmental benefits. These changes were also suggested by a review of the JBV appraisal approach and have since been included in the guidance (09 29 Merklin September 2011.xls) and so are now included in the Standard Framework
5 Treatment of wider economic impacts
Y Illustrative sensitivity tests to assess the impact of a 15% and 30% uplift on conventional benefits to represent the scale of wider impacts.
Supported by qualitative comments on potential impacts.
The consideration of wider economic impacts was raised in the study mandate and is the subject of interest internationally.
The sensitivity tests must be considered as illustrative values only, no relevant local empirical data exists to support derivation of locally specific uplifts.
6 Addition of fast rail freight impacts
Y Inclusion of appropriate estimates of economic impacts on freight from the corridor assessments undertaken by Significance
The results illustrate the scale of impact but are based on the impact given current rather than future levels of demand and economic conditions.
7 Inclusion of optimism bias allowance for construction
Y Allowance added to construction costs as a sensitivity test to reflect the tendency to underestimate scheme costs. The starting point is 66% for each corridor, based on a review of international literature,
International evidence suggests that there is typically a significant difference between actual and forecast costs for large transport schemes, including HSR.

Norway HSR Assessment Study - Phase III Economic and Financial Analysis, Final Report
Atkins Norway HSR Assessment Study - Phase III: Economic & Financial Analysis, Final Report 73
Revision Represented in: Description Reason Comments/Issues
Central Case
Sensitivity Test
costs including UK Treasury guidance. Adjustments have been made for each corridor to reflect the risk assessment.
8 Adoption of longer assessment period
Y Y Assessment of costs and benefits of HSR over a 40 year assessment period with sensitivity tests for 25 years and 60 years.
A longer assessment time period will provide a better reflection of the impact of a project of this size and better reflects international best practice

Norway HSR Assessment Study - Phase III Economic and Financial Analysis, Final Report
Atkins Norway HSR Assessment Study - Phase III: Economic & Financial Analysis, Final Report 74
Appendix B. ‘Rule of Half’ and ‘Logsum’ Appraisal Approaches
B.1. Overview
Changes in transport user costs and benefits can be expressed as a change in the user‟s „consumer surplus‟. In the context of travel, consumer surplus is defined as the benefit that a consumer enjoys as a result of making a journey, in excess of the costs of making the journey that he or she perceives. Across all travellers, the change in consumer surplus is the difference between the change in the total benefit enjoyed and the change in the costs perceived. The user benefits generated by transport schemes are changes in consumer surplus and, as outlined in Chapter 3, are calculated in different ways in the Standard and Alternative Frameworks, which use the „rule of half‟ and „logsum‟ approaches respectively.
B.2. ‘Rule of Half’ Approach
B.2.1. Overview of Approach With relatively small changes in travel costs between the Reference and Test Case, the convention is to attribute half of the changes in costs to any trips lost or gained.
This convention is known as the „rule of half‟ and assumes implicitly that there is a linear relationship between the cost of travel and demand. If this is not the case and the demand curve is convex to the origin, then the „rule of half‟ will tend to overstate the benefits. Conversely, if the demand curve is concave to the origin, the „rule of half‟ will tend to under estimate the benefits.
The above figure shows the user time-savings of, for example, reduced rail journey times on a route. The increase in the supply of rail is represented by the supply curve shifting out from S0 to S1. The time cost of a trip falls from P0 to P1 which leads to an increase in the demand for rail trips, from T0 to T1. The time savings for consumers is the area defined above by the „rule of a half‟ (shaded grey on the above diagram).

Norway HSR Assessment Study - Phase III Economic and Financial Analysis, Final Report
Atkins Norway HSR Assessment Study - Phase III: Economic & Financial Analysis, Final Report 75
The time savings for existing users are given by the rectangle P0P1T0, (i.e. (P0 - P1)( T0)) ,whilst the benefits for users who switch are given by the triangle 0.5*(P0 - P1)(T1 - T0). This gives a total increase in consumer surplus of
(P0 - P1)( T0) + 0.5*(P0 - P1)(T1 - T0).
which can be simplified to
0.5*(T1+ T0) *(P0 - P1)
These calculation principles are used in the Standard Framework, in conjunction with JBV standard values of time and relative weightings of different cost component to estimate total time, charge and vehicle operating cost benefits experienced by users of the transport system.
B.2.2. Limitations of Approach The calculations are undertaken by mode. Therefore, as outlined in Chapter 3, this approach can not be implemented directly where a new mode is introduced in the Test scenario (and therefore does not have Reference Case costs for comparison with the Test costs).
The approach is also based on a number of assumptions about the nature of change in travel supply and demand. A fundamental assumption made is that there is a linear relationship between the cost of travel and demand. As outlined above, if this is not the case the approach may either overestimate benefits (if the curve is convex to the origin) or underestimate them (if it is concave to the origin). The linear assumption is generally considered reasonable if cost changes between the Reference and Test Case are small. However, the scope for inaccuracy increases along with the scale of change.
Although not directly a feature of the „rule of half‟ approach, its application in the Standard Framework includes the use of standard generalised values of time and relative cost component weightings and definitions of journey costs. The definitions, weights and values do not necessarily match those used in the model used to test the scheme being appraised and this can therefore introduce inconsistency to the appraisal.
For instance, the Standard Framework approach defines a rail travel cost as being the combination of access/egress, wait, delay and in-vehicle time and fare. The HSR Mode Choice Model also includes additional elements relating to issues such as the percentage of time spent in tunnels, the ability to make a return journey in a day and perceived service quality which are not captured in the Standard approach.
The MCM (and underpinning Stated Preference survey results) differentiates less between the perceived „cost‟ of access/egress time and in-vehicle time and more between wait time and in-vehicle time than the Standard Framework assumptions (in which each minute of access/egress time is assumed to be perceived as the equivalent of 1.4 minutes of in-vehicle time and each minute of wait time until 30 minutes to be perceived as 1.04 minutes of in-vehicle time).
Therefore, in alternatives where passengers select HSR on the basis of factors including increased access/egress time but reduced wait time, their change is valued as a reduced journey cost in the modelling (and Alternative Framework appraisal). However, it can be valued as a disbenefit in the Standard Framework in certain circumstances because the value of the increase in access/egress time is accentuated and the relative value of the wait time saving is decreased by the valuations applied.
B.3. ‘Logsum’ Approach
B.3.1. Overview of Approach The „logsum‟ approach is applicable for discrete choice models such as the HSR Mode Choice Model and allows consumer surplus or user benefits to be calculated directly from the model functions through the comparison of the generalised costs of travel faced by passengers across all modes (by purpose) in the Reference and Test Cases.
The approach overcomes the issue of the new mode and allows an accurate, direct estimation of user benefits, avoiding the approximations required for the „rule of half‟ approach. It also uses costs that are
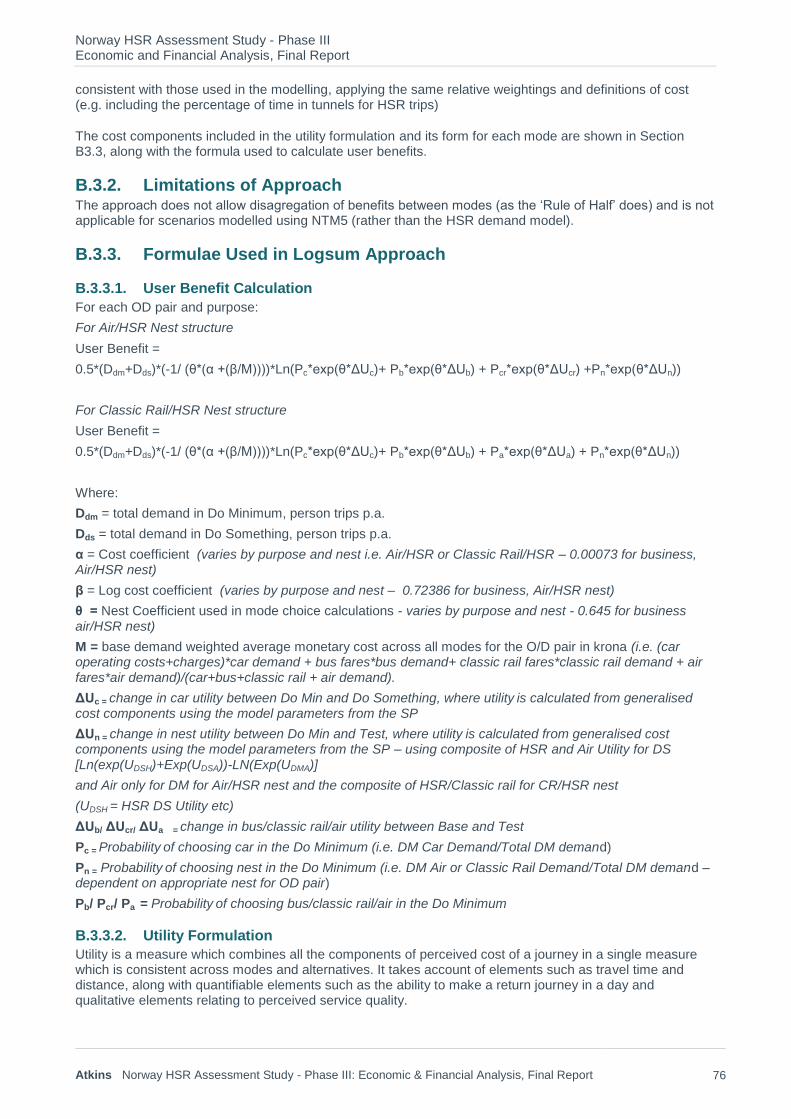
Norway HSR Assessment Study - Phase III Economic and Financial Analysis, Final Report
Atkins Norway HSR Assessment Study - Phase III: Economic & Financial Analysis, Final Report 76
consistent with those used in the modelling, applying the same relative weightings and definitions of cost (e.g. including the percentage of time in tunnels for HSR trips)
The cost components included in the utility formulation and its form for each mode are shown in Section B3.3, along with the formula used to calculate user benefits.
B.3.2. Limitations of Approach The approach does not allow disagregation of benefits between modes (as the „Rule of Half‟ does) and is not applicable for scenarios modelled using NTM5 (rather than the HSR demand model).
B.3.3. Formulae Used in Logsum Approach
B.3.3.1. User Benefit Calculation
For each OD pair and purpose:
For Air/HSR Nest structure
User Benefit =
0.5*(Ddm+Dds)*(-1/ (θ*(α +(β/M))))*Ln(Pc*exp(θ*ΔUc)+ Pb*exp(θ*ΔUb) + Pcr*exp(θ*ΔUcr) +Pn*exp(θ*ΔUn))
For Classic Rail/HSR Nest structure
User Benefit =
0.5*(Ddm+Dds)*(-1/ (θ*(α +(β/M))))*Ln(Pc*exp(θ*ΔUc)+ Pb*exp(θ*ΔUb) + Pa*exp(θ*ΔUa) + Pn*exp(θ*ΔUn))
Where:
Ddm = total demand in Do Minimum, person trips p.a.
Dds = total demand in Do Something, person trips p.a.
α = Cost coefficient (varies by purpose and nest i.e. Air/HSR or Classic Rail/HSR – 0.00073 for business, Air/HSR nest)
β = Log cost coefficient (varies by purpose and nest – 0.72386 for business, Air/HSR nest)
θ = Nest Coefficient used in mode choice calculations - varies by purpose and nest - 0.645 for business air/HSR nest)
M = base demand weighted average monetary cost across all modes for the O/D pair in krona (i.e. (car operating costs+charges)*car demand + bus fares*bus demand+ classic rail fares*classic rail demand + air fares*air demand)/(car+bus+classic rail + air demand).
ΔUc = change in car utility between Do Min and Do Something, where utility is calculated from generalised cost components using the model parameters from the SP
ΔUn = change in nest utility between Do Min and Test, where utility is calculated from generalised cost components using the model parameters from the SP – using composite of HSR and Air Utility for DS
[Ln(exp(UDSH)+Exp(UDSA))-LN(Exp(UDMA)]
and Air only for DM for Air/HSR nest and the composite of HSR/Classic rail for CR/HSR nest
(UDSH = HSR DS Utility etc)
ΔUb/ ΔUcr/ ΔUa = change in bus/classic rail/air utility between Base and Test
Pc = Probability of choosing car in the Do Minimum (i.e. DM Car Demand/Total DM demand)
Pn = Probability of choosing nest in the Do Minimum (i.e. DM Air or Classic Rail Demand/Total DM demand – dependent on appropriate nest for OD pair)
Pb/ Pcr/ Pa = Probability of choosing bus/classic rail/air in the Do Minimum
B.3.3.2. Utility Formulation
Utility is a measure which combines all the components of perceived cost of a journey in a single measure which is consistent across modes and alternatives. It takes account of elements such as travel time and distance, along with quantifiable elements such as the ability to make a return journey in a day and qualitative elements relating to perceived service quality.

Norway HSR Assessment Study - Phase III Economic and Financial Analysis, Final Report
Atkins Norway HSR Assessment Study - Phase III: Economic & Financial Analysis, Final Report 77
Each cost component is weighted by a coefficient derived from the Stated Preference survey (as detailed in the Model Development Report (“Norway HSR Assessment Study Phase III: Model Development”, Final Report, January 2012.) The coefficients vary according to traveller‟s characteristics and therefore vary between business and non-business purposes,
The formulae below set out the formulation of utility used in the model (and Alternative Framework appraisal) for each mode, identifying the cost components considered. The Model Development Report provides details of the coefficients for each mode and purpose and further details on the calculation of utility.
B.3.3.3. High Speed Rail
= + + + + + +
+ + +
Where:
is the high speed rail utility
C is the total cost of the journey
is the cost coefficient
is the log cost coefficient
T is the time spent in the train
is the in-vehicle time cost coefficient for high speed rail
A is the access\egress time from the ultimate origin/destination from/to the rail stations
is the access\egress time coefficent
W is the time spent waiting
is the wait time coefficent
U is the % of time spend in tunnels
is the tunnel coefficient
S is the number of high speed services in each day
is the frequency coefficient
I is the number of interchanges required
is the interchange coefficient
β is the coefficient applied if a return journey can be made within 6 hours
is the alternate specific constant of HSR compared to air
B.3.3.4. Air
= + + +
+
Where:
is the air utility
C is the total cost of the journey
is the cost coefficient
is the log cost coefficient
T is the time spent travelling door-to-door
is the door-to-door travel time co-efficient for air
S is the number of flights per day
is the frequency coefficient
is the coefficient applied if a return journey can be made within 6 hours
B.3.3.5. Classic Rail
= + + + + + +
+ + +
Where:
is the classic rail utility
C is the total cost of the journey

Norway HSR Assessment Study - Phase III Economic and Financial Analysis, Final Report
Atkins Norway HSR Assessment Study - Phase III: Economic & Financial Analysis, Final Report 78
β is the cost coefficient
β is the log cost coefficient
T is the time spent in the train
β is the in-vehicle time cost coefficient for classic rail
A is the access\egress time from the ultimate origin/destination from/to the rail stations
β is the access\egress time coefficent
W is the time spent waiting
β
is the wait time coefficent
S is the number of classic rail services in each day
β is the frequency coefficient
I is the number of interchanges required
β is the interchange coefficient
β is the coefficient applied if a return journey can be made within 6 hours
B.3.3.6. Bus
= + + + + + +
+ + +
Where:
is the bus utility
C is the total cost of the journey
is the cost coefficient
is the log cost coefficient
T is the time spent in the bus
is the in-vehicle time cost coefficient for the bus
A is the access\egress time from the ultimate origin/destination
is the access\egress time coefficent
W is the time spent waiting
is the wait time coefficent
S is the number of bus services in each day
is the frequency coefficient
I is the number of interchanges required
is the interchange coefficient
is the coefficient applied if a return journey can be made within 6 hours
B.3.3.7. Car
= + +
Where:
is the car utility
C is the total cost of the car journey, accounting for occupancy
β is the cost coefficient
β is the log cost coefficient
T is the time spent in the car
β is the in-vehicle time cost coefficient for car travel
β is the coefficient applied if a return journey can be made within 6 hours
The model considers the level of service (or utility). In the context of mode choice the convention is to reinterpret the utility as a „generalised cost‟. The method to convert the utility into a generalised cost in minutes is given by dividing the utility by both the nest coefficient θ and the marginal utility of time.

Norway HSR Assessment Study - Phase III Economic and Financial Analysis, Final Report
Atkins Norway HSR Assessment Study - Phase III: Economic & Financial Analysis, Final Report 79
Appendix C. Values of Time in Standard and Alternative Frameworks
C.1. Comparison of Values of Time Table 14 below compares the values of time implied by the Stated Preference (SP) survey undertaken for this study (as used in the Alternative Framework) with the most recent values in the Norwegian standard appraisal guidance (as used in the Standard Framework).
Table 14. Comparison of Values of Time by Source (Kroner/Hour,2009 and 2010 prices as identified)
Source Purpose Measure Air Car Rail Bus HSR
Current HSR Study (2010 prices) (Alternative Framework)
Work Mean 376 135 305 188 325
Median 387 131 288 143 321
Non-work Mean 207 29 138 92 119
Median 206 29 124 63 116
Handbook 140 (2009 prices)
All 303 172 94 80 n/a JBV Assessment Spreadsheet (2010 TØI and Sweco study) (2009 prices) (values for trips >50km) (Standard Framework)
(S
Work 445 380 380 380 n/a
Non-work 180 130 63 52 n/a
A number of factors in relation are relevant in consideration of the figures presented above, relating to:
Calculation of values of time;
Influences on values of time;
Differences between values from different sources.
C.1.1.1. Calculation of Values of Time
The SP values of time are based on the relative weighting attributed by respondents to different components of travel cost for each mode and purpose. The responses to the survey are used to fit a “model‟ of the way in which travellers perceive the cost of travelling by each mode under consideration. A wide range of factors that could potentially influence people‟s perception of travel cost (including for example in-vehicle time and the proportion of time spent in tunnels) are considered in the survey and regression analysis is used to identify which factors have a significant impact on people‟s view of overall travel cost and their relative importance.
In a simple example, the regression analysis might identify that fares (F), in-vehicle time (I), wait time (W), access time (A) and percentage of time in tunnels (T) are the only significant influences on passengers‟ views of the overall cost (or “disutility”) of travelling by HSR for business travel, producing a model that identifies the cost of travel as:
Total cost = a.F+b.I+c.W+d.A+e.T
The relative values of the different coefficients (a, b, c, d and e) provide information on the relative weighting given to each component and therefore the comparison of a and b would give an indication of the monetary value of in-vehicle time for HSR whilst comparison of b, c and d would provide detail of the relative weighting attributed to different types of time use (in-vehicle time, wait time and access time).

Norway HSR Assessment Study - Phase III Economic and Financial Analysis, Final Report
Atkins Norway HSR Assessment Study - Phase III: Economic & Financial Analysis, Final Report 80
The non-work JBV values of time were estimated using a similar willingness to pay survey, but sampling a more diverse population rather than focussing particularly on those likely to switch to HSR.
The work JBV values of time were based on the estimated productivity of those travelling if they were able to use the time to work rather than travel, based on wage rates. This approach typically produces higher values of time than the SP approach used to derive the study values.
The SP survey values were estimated by income band. The values shown above for each journey purpose represent averages weighted according to the proportions of trips on each mode that are undertaken by travellers within each of the income bands (based on data for long distance travel from the Norwegian National Travel Survey).
C.1.1.2. Influences on Values of Time
The values reflect the valuation attributed to each hour of time saved on a journey. They are therefore influenced by a number of factors including:
The quality of the travel environment – passengers are likely to value an hour saved from travelling in an uncomfortable environment more highly than an hour travelling in a high quality, comfortable environment (this also relates to the controversial issue of the extent to which people are able to use their time when travelling);
The extent to which people are willing to pay to have more time available for other uses (rather than travelling). This varies by category of traveller, particularly in relation to income; and
The length of the journey.
The variations between values of time (VOT) by mode shown above are the net effect of these (and other) factors. For instance, the variations in VOT between conventional and High Speed rail reflect the opposing influences of differing travel environments and characteristics of passengers. High Speed Rail is likely to provide a higher quality travelling environment, tending to decrease the value of time saved but it is likely attract people (particularly those on higher incomes) who attribute a higher value to their time in general (and therefore choose faster modes).
C.1.1.3. Differences between Values
Differences in VOT results between studies and samples are inevitable. The SP results relate to mode choice in the particular context of choice between existing modes and HSR, reflecting the focus of the study, whereas the national figures are derived from a more generic survey, reflecting the wider usage of the values. The survey also focused on trips over 100km whereas the national values relate to trips over 50km. Trip length influences the composition of those using a given mode and the extent to which they value changes in travel time.
Nonetheless, the car values of time from the stated preference study appear low, relative to the standard national values.
A similar, although less marked effect has been observed in the results of the SP survey for the UK Long Distance Rail model (http://www.rand.org/content/dam/rand/pubs/technical_reports/2011/RAND_TR899.pdf)
The results have been analysed in detail and the analysis suggests that the sample of respondents providing the car values showed no particular bias (in terms of issues with potential influence on VOT such as group size).
The low values are therefore likely to be the result of two key influences:
Journey length – car is typically slower than other modes (particularly air and HSR) over the long journeys considered by the study. Those selecting car as an option in the questionnaire are therefore likely to value their time at a low level relative to monetary costs, for car to be considered a viable option. Additionally they may value other characteristics of car use at a particularly high level which would reduce the relative value of time in formulations of car costs. The key example here is the need for the car at the journey destination. This is reflected in the „going on holiday‟ parameter considered in the formulation of car costs. The flexibility of having the car available on holiday would be perceived as a considerable benefit (e.g. allowing transport of several passengers and large loads providing flexibility at the destination). These benefits relative to other modes would offset additional journey times associated with driving and therefore reduce the relative value of time in driver‟s estimation of cost. Analysis of the
Norway HSR Assessment Study - Phase III Economic and Financial Analysis, Final Report
Atkins Norway HSR Assessment Study - Phase III: Economic & Financial Analysis, Final Report 81
survey responses shows that a significant proportion (44%) of respondents surveyed about car-HSR choices were making a trip on holiday, which will have had a strong influence on the results.
The structure of the survey process. Respondents were only asked about car journeys if they had not made an air, rail or bus journey on the route in question recently. This will have tended to reinforce the issue described above, meaning that the responses on car journeys are likely to have been drawn disproportionately from habitual car users. These respondents are likely to have either relatively low values of time in general (to consider slower car journeys as an option) or value another characteristic of car use to a particularly high degree (such as the flexibility on holiday described above or a particular enjoyment of driving). This would decrease the relative value of time in the estimation of car costs and may mean that they are unwilling to consider other options in the SP survey. A relatively large percentage of car users in the sample (nearly one-third) were so called „non traders‟ in the SP experiments. This means that they always chose the car option whatever the relative balance of cost between car and the alternatives, resulting in an overall lowering of the value of time (as respondents appear not to value any time savings offered by HSR, with little sensitivity to incremental changes in car journey time).
The car values of time are therefore to an extent a product of the nature of the journeys considered and the structure of the survey process. They are therefore probably not representative of the values that drivers would attribute to time savings associated with a scheme such as a road improvement. However, although this may raise some uncertainty over the car values of time quoted, it should not undermine confidence in the model and appraisal results because:
The structure of the model means that the car values of time do not influence model results or appraisal results in most scenarios. The model only considers changes in car costs (not absolute costs) and, as decongestion effects are not reflected in the model, car costs do not change between the Reference Case and with HSR/Test scenarios;
The values of time for HSR, Air and conventional rail which do influence model and appraisal results are less influenced by the filtering process within the survey that affects the car results. The values of time will therefore be a more representative indication of values across the full sample, rather than for a filtered sub-group that is likely to show particular characteristics as is the case for the car values.

Norway HSR Assessment Study - Phase III Economic and Financial Analysis, Final Report
Atkins Norway HSR Assessment Study - Phase III: Economic & Financial Analysis, Final Report 82
Appendix D. Estimated Freight Impacts by Corridor
D.1. Overview The following table provides a summary of the estimated net impact on the cost of transporting current freight volumes of the introduction of freight rail services at 120kph in each corridor. The assessments are based on the assumption of current economic conditions and are described further in the Phase III Freight Analysis Report (Norway HSR Assessment Study Phase III: Freight Market Analysis, Final Report, January 2012)
The numbers refer to all freight for all commodities and all transport in/to/from Norway. Logistic costs, represent total cost savings including transport costs and costs such as inventory and capital costs.
Corridor Logistic costs (000 NOK)
Transport costs (000 NOK)
Oslo-Stockholm -613 -308
Oslo-Gothenburg 449 309
Oslo-Stavanger -5,763 -4,445
Oslo-Bergen -10,421 -9,963
Oslo-Trondheim -2,073 -1,380
Bergen-Stavanger 12 12
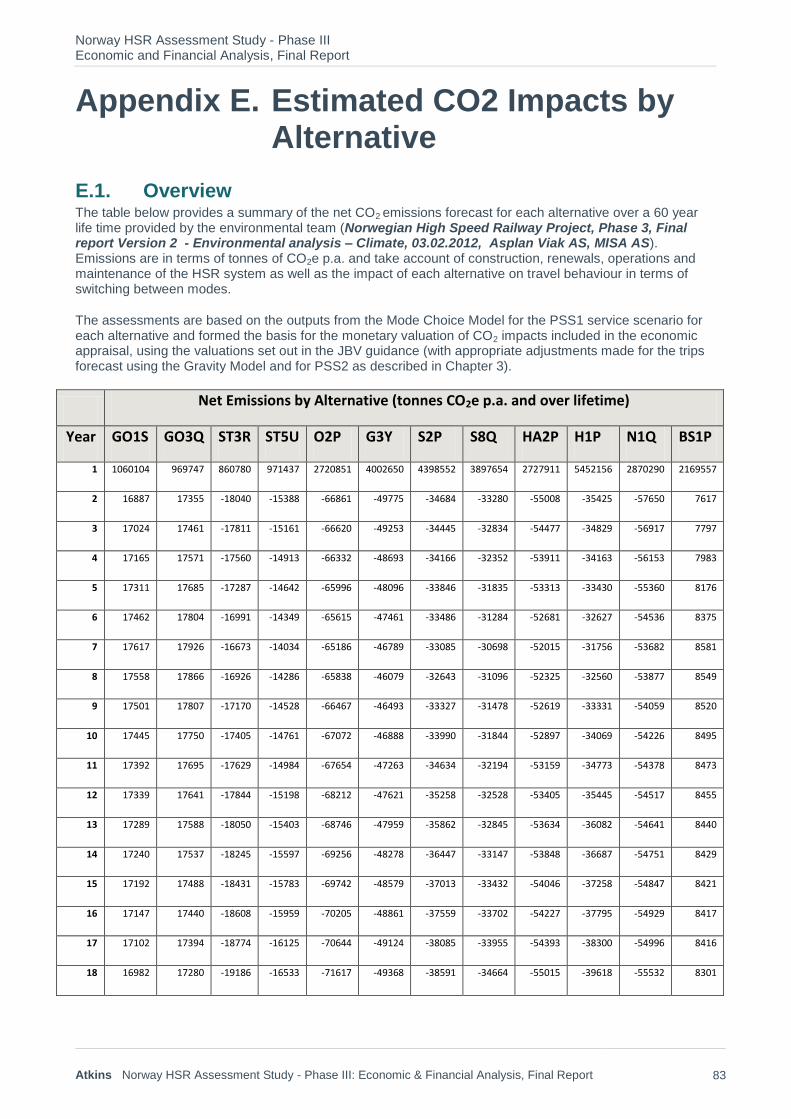
Norway HSR Assessment Study - Phase III Economic and Financial Analysis, Final Report
Atkins Norway HSR Assessment Study - Phase III: Economic & Financial Analysis, Final Report 83
Appendix E. Estimated CO2 Impacts by Alternative
E.1. Overview The table below provides a summary of the net CO2 emissions forecast for each alternative over a 60 year life time provided by the environmental team (Norwegian High Speed Railway Project, Phase 3, Final report Version 2 - Environmental analysis – Climate, 03.02.2012, Asplan Viak AS, MISA AS). Emissions are in terms of tonnes of CO2e p.a. and take account of construction, renewals, operations and maintenance of the HSR system as well as the impact of each alternative on travel behaviour in terms of switching between modes.
The assessments are based on the outputs from the Mode Choice Model for the PSS1 service scenario for each alternative and formed the basis for the monetary valuation of CO2 impacts included in the economic appraisal, using the valuations set out in the JBV guidance (with appropriate adjustments made for the trips forecast using the Gravity Model and for PSS2 as described in Chapter 3).
Net Emissions by Alternative (tonnes CO2e p.a. and over lifetime)
Year GO1S GO3Q ST3R ST5U O2P G3Y S2P S8Q HA2P H1P N1Q BS1P
1 1060104 969747 860780 971437 2720851 4002650 4398552 3897654 2727911 5452156 2870290 2169557
2 16887 17355 -18040 -15388 -66861 -49775 -34684 -33280 -55008 -35425 -57650 7617
3 17024 17461 -17811 -15161 -66620 -49253 -34445 -32834 -54477 -34829 -56917 7797
4 17165 17571 -17560 -14913 -66332 -48693 -34166 -32352 -53911 -34163 -56153 7983
5 17311 17685 -17287 -14642 -65996 -48096 -33846 -31835 -53313 -33430 -55360 8176
6 17462 17804 -16991 -14349 -65615 -47461 -33486 -31284 -52681 -32627 -54536 8375
7 17617 17926 -16673 -14034 -65186 -46789 -33085 -30698 -52015 -31756 -53682 8581
8 17558 17866 -16926 -14286 -65838 -46079 -32643 -31096 -52325 -32560 -53877 8549
9 17501 17807 -17170 -14528 -66467 -46493 -33327 -31478 -52619 -33331 -54059 8520
10 17445 17750 -17405 -14761 -67072 -46888 -33990 -31844 -52897 -34069 -54226 8495
11 17392 17695 -17629 -14984 -67654 -47263 -34634 -32194 -53159 -34773 -54378 8473
12 17339 17641 -17844 -15198 -68212 -47621 -35258 -32528 -53405 -35445 -54517 8455
13 17289 17588 -18050 -15403 -68746 -47959 -35862 -32845 -53634 -36082 -54641 8440
14 17240 17537 -18245 -15597 -69256 -48278 -36447 -33147 -53848 -36687 -54751 8429
15 17192 17488 -18431 -15783 -69742 -48579 -37013 -33432 -54046 -37258 -54847 8421
16 17147 17440 -18608 -15959 -70205 -48861 -37559 -33702 -54227 -37795 -54929 8417
17 17102 17394 -18774 -16125 -70644 -49124 -38085 -33955 -54393 -38300 -54996 8416
18 16982 17280 -19186 -16533 -71617 -49368 -38591 -34664 -55015 -39618 -55532 8301
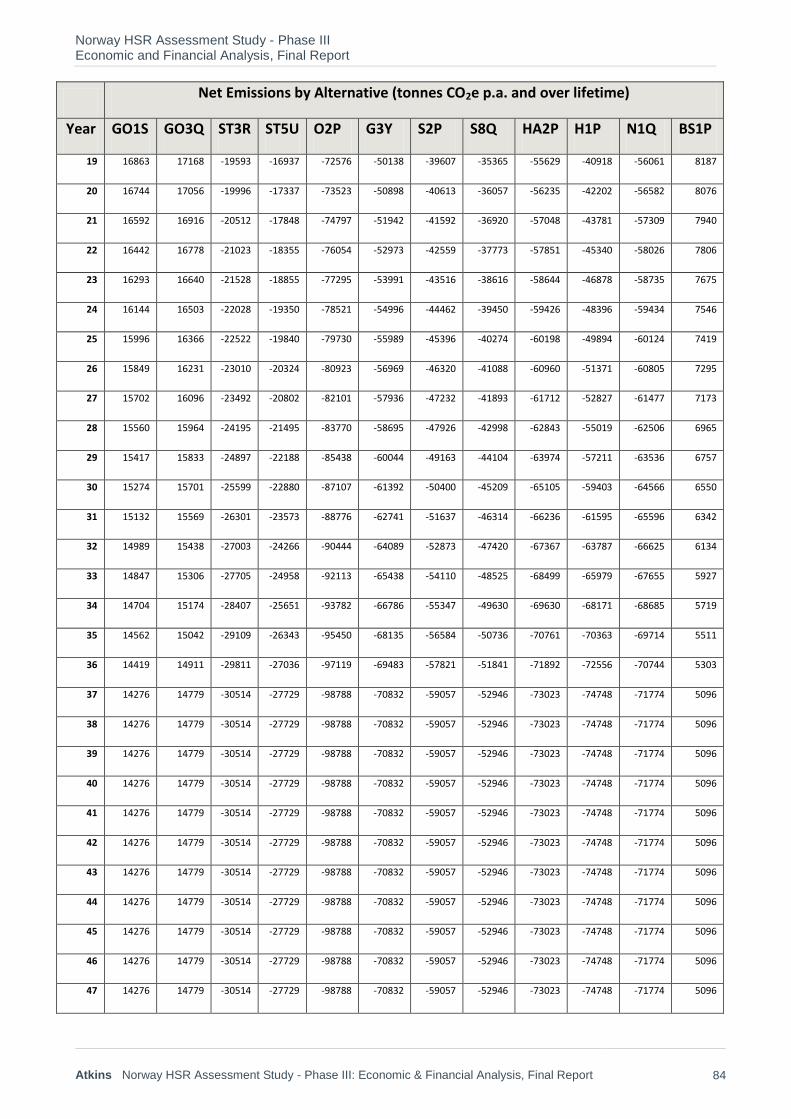
Norway HSR Assessment Study - Phase III Economic and Financial Analysis, Final Report
Atkins Norway HSR Assessment Study - Phase III: Economic & Financial Analysis, Final Report 84
Net Emissions by Alternative (tonnes CO2e p.a. and over lifetime)
Year GO1S GO3Q ST3R ST5U O2P G3Y S2P S8Q HA2P H1P N1Q BS1P
19 16863 17168 -19593 -16937 -72576 -50138 -39607 -35365 -55629 -40918 -56061 8187
20 16744 17056 -19996 -17337 -73523 -50898 -40613 -36057 -56235 -42202 -56582 8076
21 16592 16916 -20512 -17848 -74797 -51942 -41592 -36920 -57048 -43781 -57309 7940
22 16442 16778 -21023 -18355 -76054 -52973 -42559 -37773 -57851 -45340 -58026 7806
23 16293 16640 -21528 -18855 -77295 -53991 -43516 -38616 -58644 -46878 -58735 7675
24 16144 16503 -22028 -19350 -78521 -54996 -44462 -39450 -59426 -48396 -59434 7546
25 15996 16366 -22522 -19840 -79730 -55989 -45396 -40274 -60198 -49894 -60124 7419
26 15849 16231 -23010 -20324 -80923 -56969 -46320 -41088 -60960 -51371 -60805 7295
27 15702 16096 -23492 -20802 -82101 -57936 -47232 -41893 -61712 -52827 -61477 7173
28 15560 15964 -24195 -21495 -83770 -58695 -47926 -42998 -62843 -55019 -62506 6965
29 15417 15833 -24897 -22188 -85438 -60044 -49163 -44104 -63974 -57211 -63536 6757
30 15274 15701 -25599 -22880 -87107 -61392 -50400 -45209 -65105 -59403 -64566 6550
31 15132 15569 -26301 -23573 -88776 -62741 -51637 -46314 -66236 -61595 -65596 6342
32 14989 15438 -27003 -24266 -90444 -64089 -52873 -47420 -67367 -63787 -66625 6134
33 14847 15306 -27705 -24958 -92113 -65438 -54110 -48525 -68499 -65979 -67655 5927
34 14704 15174 -28407 -25651 -93782 -66786 -55347 -49630 -69630 -68171 -68685 5719
35 14562 15042 -29109 -26343 -95450 -68135 -56584 -50736 -70761 -70363 -69714 5511
36 14419 14911 -29811 -27036 -97119 -69483 -57821 -51841 -71892 -72556 -70744 5303
37 14276 14779 -30514 -27729 -98788 -70832 -59057 -52946 -73023 -74748 -71774 5096
38 14276 14779 -30514 -27729 -98788 -70832 -59057 -52946 -73023 -74748 -71774 5096
39 14276 14779 -30514 -27729 -98788 -70832 -59057 -52946 -73023 -74748 -71774 5096
40 14276 14779 -30514 -27729 -98788 -70832 -59057 -52946 -73023 -74748 -71774 5096
41 14276 14779 -30514 -27729 -98788 -70832 -59057 -52946 -73023 -74748 -71774 5096
42 14276 14779 -30514 -27729 -98788 -70832 -59057 -52946 -73023 -74748 -71774 5096
43 14276 14779 -30514 -27729 -98788 -70832 -59057 -52946 -73023 -74748 -71774 5096
44 14276 14779 -30514 -27729 -98788 -70832 -59057 -52946 -73023 -74748 -71774 5096
45 14276 14779 -30514 -27729 -98788 -70832 -59057 -52946 -73023 -74748 -71774 5096
46 14276 14779 -30514 -27729 -98788 -70832 -59057 -52946 -73023 -74748 -71774 5096
47 14276 14779 -30514 -27729 -98788 -70832 -59057 -52946 -73023 -74748 -71774 5096

Norway HSR Assessment Study - Phase III Economic and Financial Analysis, Final Report
Atkins Norway HSR Assessment Study - Phase III: Economic & Financial Analysis, Final Report 85
Net Emissions by Alternative (tonnes CO2e p.a. and over lifetime)
Year GO1S GO3Q ST3R ST5U O2P G3Y S2P S8Q HA2P H1P N1Q BS1P
48 14276 14779 -30514 -27729 -98788 -70832 -59057 -52946 -73023 -74748 -71774 5096
49 14276 14779 -30514 -27729 -98788 -70832 -59057 -52946 -73023 -74748 -71774 5096
50 14276 14779 -30514 -27729 -98788 -70832 -59057 -52946 -73023 -74748 -71774 5096
51 14276 14779 -30514 -27729 -98788 -70832 -59057 -52946 -73023 -74748 -71774 5096
52 14276 14779 -30514 -27729 -98788 -70832 -59057 -52946 -73023 -74748 -71774 5096
53 14276 14779 -30514 -27729 -98788 -70832 -59057 -52946 -73023 -74748 -71774 5096
54 14276 14779 -30514 -27729 -98788 -70832 -59057 -52946 -73023 -74748 -71774 5096
55 14276 14779 -30514 -27729 -98788 -70832 -59057 -52946 -73023 -74748 -71774 5096
56 14276 14779 -30514 -27729 -98788 -70832 -59057 -52946 -73023 -74748 -71774 5096
57 14276 14779 -30514 -27729 -98788 -70832 -59057 -52946 -73023 -74748 -71774 5096
58 14276 14779 -30514 -27729 -98788 -70832 -59057 -52946 -73023 -74748 -71774 5096
59 14276 14779 -30514 -27729 -98788 -70832 -59057 -52946 -73023 -74748 -71774 5096
60 14276 14779 -30514 -27729 -98788 -70832 -59057 -52946 -73023 -74748 -71774 5096
Total 1977917 1912424 -
610908 -
339734 -
2311641 423468 1516897 1299563 -
1069629 2064374 -915513 2557624

Norway HSR Assessment Study - Phase III Economic and Financial Analysis, Final Report
Atkins Norway HSR Assessment Study - Phase III: Economic & Financial Analysis, Final Report 86
Appendix F. Financial Model Assumptions
F.1. Ernst & Young Note The following Technical Note produced by Ernst & Young sets out the key functions and assumptions within the Financial Model.

87
Jernbaneverket Norwegian High Speed Railway project
Paper outlining the EY financial modelling methodology and assumptions
13 January 2012

88

Contents
Ernst & Young i
Ernst & Young LLP 1 More London Place London SE1 2AF Tel: 020 7951 2000 Fax: 020 7951 1345 www.ey.com/uk
Private and confidential Adil Chaudhrey Atkins Euston Tower 286 Euston Road London NW1 3AT
13 January 2012
Dear Adil,
Jernbaneverket Norwegian High Speed Railway project – Paper outlining the EY financial modelling methodology and assumptions
In accordance with our contract, we have completed the financial modelling required for Phase III of the project and have produced a paper detailing the methodology followed and assumptions applied.
Purpose of our note and restrictions on its use
This paper was prepared on your instructions solely for Atkins (and ultimate client Jernbaneverket (JBV)) for the inclusion in the main project report produced by Atkins. This paper should not be viewed as a standalone document as it does not contain the usual contents of a document of this nature, nor should it be relied upon for any other purpose. Because others may seek to use it for different purposes, this paper should not be quoted, referred to or shown to any other parties without our prior consent in writing. In carrying out our work and preparing our paper, we have worked solely on the instructions of Atkins and JBV‟s and solely for your purposes.
Scope of our work
The scope of work of Ernst & Young LLP (EY) is defined in our engagement letter. Our work in connection with this Report is of a different nature to that of an audit. The analysis has been prepared by EY and relies on data input from Atkins and Faithful+Gould (F+G). Whilst EY is responsible for the results of our analysis, EY are not responsible for the data inputs from Atkins and F+G – EY have not sought to verify the accuracy of the data or the information and explanations provided.
If you would like to clarify any aspect of this review or discuss other related matters then please do not hesitate to contact us.
Yours faithfully
Manish Gupta Partner Ernst & Young LLP
Introduction
The UK firm Ernst & Young LLP is a limited liability partnership registered in England and Wales with registered number OC300001 and is a member firm of Ernst & Young Global Limited. A list of members‟ names is available for inspection at 1 More London Place, London SE1 2AF, the firm‟s principal place of business
and registered office.
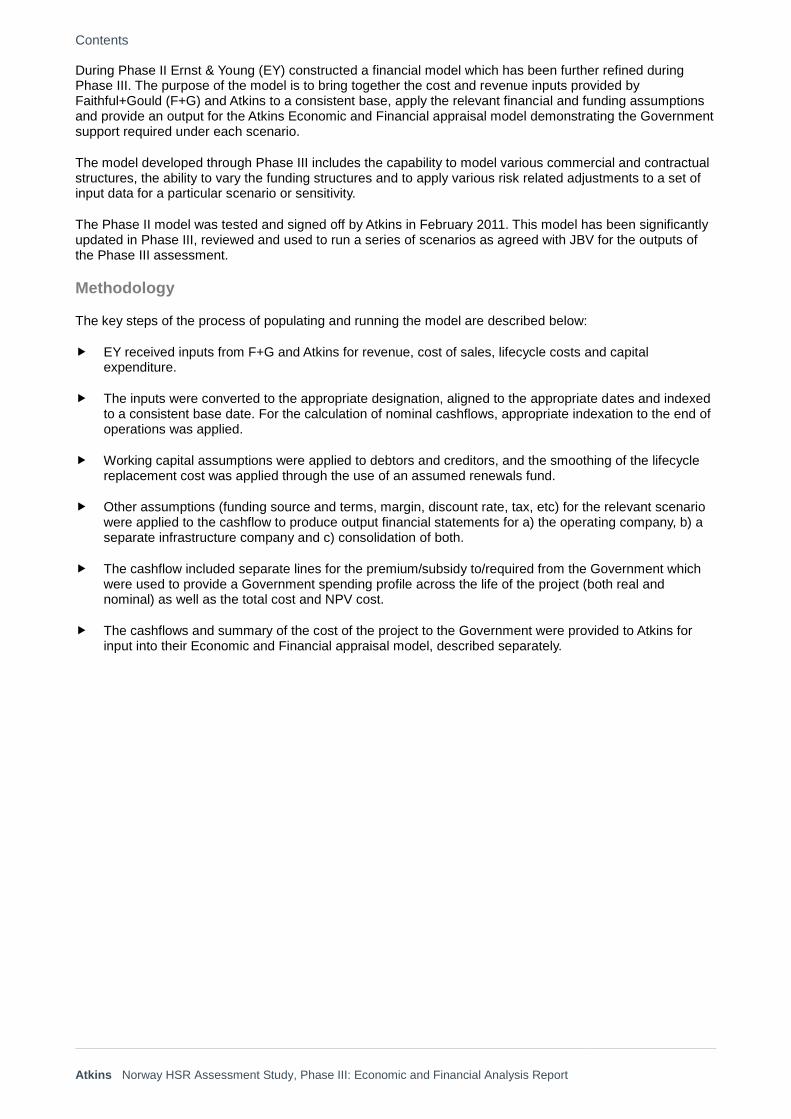
Contents
Atkins Norway HSR Assessment Study, Phase III: Economic and Financial Analysis Report
During Phase II Ernst & Young (EY) constructed a financial model which has been further refined during Phase III. The purpose of the model is to bring together the cost and revenue inputs provided by Faithful+Gould (F+G) and Atkins to a consistent base, apply the relevant financial and funding assumptions and provide an output for the Atkins Economic and Financial appraisal model demonstrating the Government support required under each scenario.
The model developed through Phase III includes the capability to model various commercial and contractual structures, the ability to vary the funding structures and to apply various risk related adjustments to a set of input data for a particular scenario or sensitivity.
The Phase II model was tested and signed off by Atkins in February 2011. This model has been significantly updated in Phase III, reviewed and used to run a series of scenarios as agreed with JBV for the outputs of the Phase III assessment.
Methodology
The key steps of the process of populating and running the model are described below:
EY received inputs from F+G and Atkins for revenue, cost of sales, lifecycle costs and capital expenditure.
The inputs were converted to the appropriate designation, aligned to the appropriate dates and indexed to a consistent base date. For the calculation of nominal cashflows, appropriate indexation to the end of operations was applied.
Working capital assumptions were applied to debtors and creditors, and the smoothing of the lifecycle replacement cost was applied through the use of an assumed renewals fund.
Other assumptions (funding source and terms, margin, discount rate, tax, etc) for the relevant scenario were applied to the cashflow to produce output financial statements for a) the operating company, b) a separate infrastructure company and c) consolidation of both.
The cashflow included separate lines for the premium/subsidy to/required from the Government which were used to provide a Government spending profile across the life of the project (both real and nominal) as well as the total cost and NPV cost.
The cashflows and summary of the cost of the project to the Government were provided to Atkins for input into their Economic and Financial appraisal model, described separately.

Contents
Atkins Norway HSR Assessment Study, Phase III: Economic and Financial Analysis Report
Assumptions
As part of the Phase III work, we have completed an assessment of the appropriate assumptions to use for the financial modelling of the scenarios. EY previously prepared a note which set out our proposed assumptions which were agreed with JBV on the 29 September 2011. The following table details the assumption, source and rationale for each assumption used during the financial modelling.
Subject Assumption
Operating structure JBV provided guidance on the assumed operating structure, which was that of an infrastructure company (InfraCo) responsible for the Design, Construction and Maintenance (DCM) of the railway and a separate train operating company (OpCo).
Ownership & Funding Both the InfraCo and OpCo are assumed to be state owned with the infrastructure company being part of JBV and non profit making. The companies are assumed to be funded on a yearly cash basis by the government, with a resulting annual government subsidy or premium.
Timing The physical construction of the railway is assumed to begin in 2017 with costs in relation to feasibility analysis, option selection, development and detailed design forecast to commence 2 years (sometimes 1 year) in advance of construction. Following the construction period, which varies for each route and for different sensitivities, operations are modelled to begin immediately and continue for either 25 years or 40 years.
Inflation The model provides inflation adjusted (nominal) or unadjusted (real) outputs with the real outputs being provided in 2009 prices. We have assumed inflation of 2.2% being the 2006 and 2010 average of the forecast Norwegian CPI, as provided by JBV from the Norwegian Ministry of Transport and Communication. An additional inflationary adjustment for construction prices of 1.9% has been assumed for capex using an average across the same time period from the same source.
Track Access Charge We assume no Track Access Charge (TAC) as both the infrastructure and operations are assumed to be state owned and any TAC would simply be a transfer of funds and would have no net effect on the cost to Government.
Other revenue Revenue is assumed to be supplemented by „other revenue‟, assumed to be 6.1%
1 of ticket revenue which accounts for the
revenue generated by station facilities including car parking and retail.
Capital Expenditure The capital expenditure (capex) is assumed to be with a third party contractor undertaking the construction which is reflected in the input capex costs.
1 Benchmarked from other EY rail projects including; National Express, South Western Rail, HS1 and Virgin
West Coast Main Line.

Contents
Atkins Norway HSR Assessment Study, Phase III: Economic and Financial Analysis Report
Subject Assumption
Lifecycle replacement The lifecycle replacement costs to replace components following completion of their useful life are assumed to be smoothed over the operation period. It is assumed that equal annual cashflows build a „renewals fund‟ from which drawdowns are made as required to replace components. The use of this approach has no effect on total cost to the Government but assists with providing a flattened cost profile over the life of the operations rather than large variations in cost from one year to the next, with spikes of cost every 5 or 10 years when replacements are required.
Other lifecycle costs The other elements of the lifecycle costs which are not smoothed include planned and reactive maintenance, station staffing costs, operational energy costs, costs of sale and rolling stock lease costs.
Working Capital For the purpose of working capital adjustments, we have assumed 5 debtor days and 30 creditor days which takes the form of an annual adjustment in the cashflow following the commencement of operations.
Tax We have assumed a corporate tax rate of 28% in line with other Norwegian Rail projects (e.g. Gardermoen Line).
Discount rate In line with publicly available guidance and advice from JBV and the Norwegian Ministry of Finance we have assumed a real discount rate of 4.5% (6.8% nominal discount rate) for calculation of net present value (NPV).
Ernst & Young LLP
Assurance | Tax | Transaction | Advisory
www.ey.com/uk
The UK firm Ernst & Young LLP is a limited liability partnership registered in England and Wales with registered number OC300001 and is a member firm of Ernst & Young Global Limited
Ernst & Young LLP, 1 More London Place, London, SE1 2AF.

Contents
Atkins Norway HSR Assessment Study, Phase III: Economic and Financial Analysis Report
© Ernst & Young LLP 2012. Published in the UK. All rights reserved.

Norway HSR Assessment Study - Phase III Economic and Financial Appraisal Final Report
Atkins Norway HSR Assessment Study, Phase III: Economic and Financial Analysis Report 96
Appendix G. Economic Appraisal Assumptions
G.1. Overview The table below provides additional detail on the Economic Appraisal assumptions to support the table presented in Chapter 3.
Table 15. Summary of Key Assumptions/Parameters
Assumption/ Parameter Standard Framework
Alternative Framework
Sensitivity Test Values
Source
Discounted Assessment
Appraisal Period (years) 25 40 25 and 60 (for Alternative Framework)
25 years – JBV/Norwegian guidance
40 years/sensitivity tests – Phase II international review
Discount Rate 4.5% 4.5% 2% and 5.5% JBV/Norwegian Guidance
Price Base 2009 2009 N/A JBV Guidance
Appraisal Base 2015 2015 N/A JBV Guidance
Ramp up of Demand (% of forecast demand)
Opening year 80% 80% N/A Assumption/Judgement
Year 2 85% 85% N/A Assumption/Judgement
Year 3 90% 90% N/A Assumption/Judgement
Year 4 95% 95% N/A Assumption/Judgement
Year 5 100% 100% N/A Assumption/Judgement
Conversion of third party impacts to monetary values
Cost/tonne of CO2 emissions 320 NOK to 2030
800 NOK beyond 2030
320 NOK to 2030
800 NOK beyond 2030
N/A JBV/Norwegian Guidance
Value of accidents
NOK/vehicle/person km
JBV guidance JBV guidance N/A JBV guidance
Transferred from Bus 0.600 0.600 N/A JBV guidance
Transferred from Car 0.590 0.590 N/A JBV guidance
Transferred from Air 1.77 1.77 N/A JBV guidance
Value of local air quality impacts: NOK/vehicle km
JBV guidance JBV guidance N/A JBV guidance
Diesel Rail 0.306 0.306 N/A JBV guidance
Electric Rail 0 0 N/A JBV guidance
HSR 0 0 N/A JBV guidance
Transferred from Bus 0.251 0.251 N/A JBV guidance
Transferred from Car 0.012 0.012 N/A JBV guidance
Transferred from Air 1.379 1.379 N/A JBV guidance
Value of noise impacts NOK/vehicle/person km
JBV guidance JBV guidance N/A JBV guidance
Diesel Rail 1.373 1.373 N/A JBV guidance
Electric Rail 1.373 1.373 N/A JBV guidance

Norway HSR Assessment Study - Phase III Economic and Financial Appraisal Final Report
Atkins Norway HSR Assessment Study, Phase III: Economic and Financial Analysis Report 97
HSR 1.373 1.373 N/A JBV guidance
Transferred from Bus 0.709 0.709 N/A JBV guidance
Transferred from Car 0.095 0.095 N/A JBV guidance
Transferred from Air 0.00 0.00 N/A JBV guidance
Cost of Car Operation
Business NOK/km 2.37 2.37 N/A JBV guidance
Non-Business NOK/km 2.04 2.04 N/A JBV guidance
Real growth in benefits
GDP Growth 1.4% 1.4% N/A JBV guidance
Growth in business user benefits
100% GDP growth rate
100% GDP growth rate
N/A JBV guidance
Growth in non business user benefits
80% GDP growth rate
80% GDP growth rate
N/A JBV guidance
Growth in environmental/accident impacts
80% GDP growth rate
80% GDP growth rate
N/A JBV guidance
Costs
Real growth in costs above standard inflation
N/A 1.9% p.a. to 2025
0% Standard Framework – JBV guidance
Alternative Framework -
Ernst and Young analysis of recent trends. See Appendix F.
Additional cost of financing through taxation
20% NPV of public sector costs
20% NPV of public sector costs
N/A JBV guidance
Additional tax received as proportion of additional business user benefits
9% of benefits 9% of benefits N/A JBV guidance

Norway HSR Assessment Study - Phase III Economic and Financial Appraisal Final Report
Atkins Norway HSR Assessment Study, Phase III: Economic and Financial Analysis Report 98
Appendix H. Economic Appraisal Sensitivity Results by Alternative
H.1. Overview The following graphs provide supporting information to the reporting of economic appraisal sensitivity tests in Chapter 5. They summarise the impacts of each of the relevant tests on the economic appraisal results for all twelve core tests, under service scenario PSS1, assessed using the Alternative Framework.
The first column in each group on each graph is the central result for that core alternative. The subsequent columns then show the summary economic appraisal results for the sensitivity tests, showing the NPV of user benefits and third party impacts and public sector/operator impacts as separate entries with the diamond indicators on each column showing the net effect of the other entries i.e .representing the NPV of the alternative in that scenario).
In each case the results show that that the results for the indicative tests presented in Chapter 5 are representative of the results across all tests.
The codes on the graph axes refer to the following sensitivity tests:
2.0% - assessment using 2% discount rate (rather than 4.5%)
3.5% - assessment using 3.5% discount rate (rather than 4.5%)
5.5% - assessment using 5.5% discount rate (rather than 4.5%)
25 yr– assessment using 25 year appraisal period (rather than 40 years)
60 yr – assessment using 60 year appraisal period (rather than 40 years)
OB – assessment including corridor specific optimism bias uplift on construction costs (40% to 42%)
NoReal – assessment assuming no real growth in construction costs above standard inflation (rather than 1.9% to 2025)
15%WI – assessment including indicative allowance for wider impacts of 15% of conventional user benefits
30%WI – assessment including indicative allowance for wider impacts of 30% of conventional user benefits
CompResp – assessment testing the second, optimistic „end point‟ of the range of economic impact of the potential responses of operators of other (non HSR) modes to the introduction of HSR (described further in Chapter 5).

Norway HSR Assessment Study - Phase III Economic and Financial Appraisal Final Report
Atkins Norway HSR Assessment Study, Phase III: Economic and Financial Analysis Report 99
Figure 35. Economic Appraisal Results for Discount Rate Sensitivity Tests, Alternative Assessment Framework, PSS1 (NPV, MnNOK, 2009 prices, 2015 base, 40 year appraisal period)
-500000
-400000
-300000
-200000
-100000
0
100000
200000
N_G
3Y_C
2.0%
3.5%
5.5%
N_O
2P_C
2.0%
3.5%
5.5%
W_N
1Q_C
2.0%
3.5%
5.5%
W_
HA
2P
_C
2.0%
3.5%
5.5%
W_H
1P_C
2.0%
3.5%
5.5%
W_B
S1P
_C2.
0%3.
5%5.
5%
S_S8
Q_C
2.0%
3.5%
5.5%
S_S2
P_C
2.0%
3.5%
5.5%
E_ST
5U
_C2.
0%3.
5%5.
5%
E_ST
3R
_C2.
0%3.
5%5.
5%
E_G
O3
Q_C
2.0%
3.5%
5.5%
E_G
O1
S_C
2.0%
3.5%
5.5%
NP
V M
nN
OK
, 2
00
9 p
rice
s, 4
0 y
ear
ap
pra
isal
pe
rio
d
NPV Public Sector/Operator Impacts
NPV User Benefits and Third Party Impacts
NPV

Norway HSR Assessment Study - Phase III Economic and Financial Appraisal Final Report
Atkins Norway HSR Assessment Study, Phase III: Economic and Financial Analysis Report 100
Figure 36. Economic Appraisal Results for Appraisal Period Sensitivity Tests, Alternative Assessment Framework, PSS1 (NPV, MnNOK, 2009 prices, 2015 base, 25, 40 or 60 year appraisal period)
-400000
-350000
-300000
-250000
-200000
-150000
-100000
-50000
0
50000
100000N
_G3Y
_C
25 y
r
60 y
r
N_O
2P_C
25 y
r
60 y
r
W_N
1Q_C
25 y
r
60 y
r
W_H
A2
P_C
25 y
r
60 y
r
W_H
1P_C
25 y
r
60 y
r
W_
BS
1P
_C
25 y
r
60 y
r
S_S
8Q_C
25 y
r
60 y
r
S_S2
P_C
25 y
r
60 y
r
E_ST
5U
_C
25 y
r
60 y
r
E_
ST
3R
_C
25 y
r
60 y
r
E_
GO
3Q
_C
25 y
r
60 y
r
E_G
O1
S_C
25 y
r
60 y
r
NP
V, M
nN
OK
, 2
00
9 p
rice
s, v
aria
ble
ap
pra
isal
pe
rio
d
NPV Public Sector/Operator Impacts
NPV User Benefits and Third Party Impacts
NPV

Norway HSR Assessment Study - Phase III Economic and Financial Appraisal Final Report
Atkins Norway HSR Assessment Study, Phase III: Economic and Financial Analysis Report 101
Figure 37. Economic Appraisal Results for or Optimism Bias and Real Cost Growth Sensitivity Tests, Alternative Assessment Framework, PSS1 (NPV, MnNOK, 2009 prices, 2015 base, 40 year appraisal period)
-500000
-400000
-300000
-200000
-100000
0
100000N
_G3
Y_C
OB
No
Re
al G
row
th
N_
O2
P_
C
OB
No
Re
al G
row
th
W_
N1
Q_
C
OB
No
Re
al G
row
th
W_H
A2
P_C O
B
No
Rea
l Gro
wth
W_H
1P_C OB
No
Re
al G
row
th
W_B
S1P_
C
OB
No
Re
al G
row
th
S_S
8Q_C O
B
No
Re
al G
row
th
S_S2
P_C
OB
No
Rea
l Gro
wth
E_S
T5U
_C OB
No
Re
al G
row
th
E_S
T3R
_C OB
No
Re
al G
row
th
E_G
O3Q
_C OB
No
Rea
l Gro
wth
E_G
O1
S_C
OB
No
Rea
l Gro
wth
NP
V M
nN
OK
, 2
00
9 p
rice
s, 4
0 y
ear
ap
pra
isal
pe
rio
d
NPV Public Sector/Operator Impacts
NPV User Benefits and Third Party Impacts
NPV

Norway HSR Assessment Study - Phase III Economic and Financial Appraisal Final Report
Atkins Norway HSR Assessment Study, Phase III: Economic and Financial Analysis Report 102
Figure 38. Economic Appraisal Results for or Wider Impact and Competitive Response Sensitivity Tests, Alternative Assessment Framework, PSS1 (NPV, MnNOK, 2009 prices, 2015 base, 40 year appraisal period)
-350000
-300000
-250000
-200000
-150000
-100000
-50000
0
50000
100000N
_G
3Y
_C
15%
WI
30%
WI
Co
mp
Res
p
N_
O2
P_
C15
% W
I30
% W
IC
om
p R
esp
W_N
1Q_C
15%
WI
30%
WI
Co
mp
Res
p
W_H
A2P
_C15
% W
I30
% W
IC
om
p R
esp
W_
H1
P_
C15
% W
I30
% W
IC
om
p R
esp
W_B
S1P_
C15
% W
I30
% W
IC
om
p R
esp
S_S8
Q_C
15%
WI
30%
WI
Co
mp
Re
sp
S_S2
P_C
15%
WI
30%
WI
Co
mp
Re
sp
E_ST
5U_C
15%
WI
30%
WI
Co
mp
Re
sp
E_ST
3R
_C15
% W
I30
% W
IC
om
p R
esp
E_G
O3
Q_C
15%
WI
30%
WI
Co
mp
Re
sp
E_G
O1S
_C15
% W
I30
% W
IC
om
p R
esp
NP
V M
nN
OK
, 2
00
9 p
rice
s, 4
0 y
ear
ap
pra
isal
pe
rio
d
NPV Public Sector/Operator ImpactsNPV User Benefits and Third Party ImpactsNPV

© Atkins Ltd except where stated otherwise. The Atkins logo, „Carbon Critical Design‟ and the strapline „Plan Design Enable‟ are trademarks of Atkins Ltd.
Adil Chaudhrey Atkins Highways & Transportation Euston Tower, 286 Euston Road, London, NW1 3AT. UK Email: [email protected] Direct Line: +44 (0)20 7121 2385 Mobile: +44 (0)7803 245017 | Fax: +44 (0)20 7121 2333 Web: www.atkinsglobal.com