The successes and failures of a key transportation link: accessibility effects of Taiwan’s...
21
Ann Reg Sci (2012) 48:203–223 DOI 10.1007/s00168-010-0405-5 ORIGINAL PAPER The successes and failures of a key transportation link: accessibility effects of Taiwan’s high-speed rail David Emanuel Andersson · Oliver F. Shyr · Angel Lee Received: 12 April 2009 / Accepted: 14 August 2010 / Published online: 27 August 2010 © Springer-Verlag 2010 Abstract Taiwan does not only have a high population density; its population exhibits a strong preference for high-density downtown living. Rich Taiwanese thus live downtown, not in the suburbs. In addition, the expected negative relationship between accessibility and the spaciousness of housing is weak or non-existent in Taiwan’s metropolitan areas. Taiwan should therefore be highly suited to rail trans- portation investments. In 2007, a new high-speed railroad was inaugurated, connecting seven metropolitan areas. Hedonic estimates show that high-speed rail accessibility has a substantial impact on house prices in at least four of the regions. Interregional downtown-to-downtown commuting time seems to be the most important determinant of success in generating a station-centered price-distance gradient. Neighborhoods around HSR stations in suburban locations are not likely to spawn residential commu- nities for commuters, since most Taiwanese prefer downtown residential locations. JEL Classification O18 · R11 · R23 · R49 1 Introduction High-speed rail is a type of transportation infrastructure that until recently was con- fined to Japan and parts of Western Europe. The most substantial investments in this technology after 2000 have however occurred in Asia outside of Japan, particularly D. E. Andersson (B ) Institute of Public Affairs Management, National Sun Yat-sen University, 70 Lianhai Road, Kaohsiung 80424, Taiwan e-mail: [email protected] O. F. Shyr · A. Lee Department of Urban Planning, National Cheng-kung University, Tainan, Taiwan 123
Transcript of The successes and failures of a key transportation link: accessibility effects of Taiwan’s...

Ann Reg Sci (2012) 48:203–223DOI 10.1007/s00168-010-0405-5
ORIGINAL PAPER
The successes and failures of a key transportation link:accessibility effects of Taiwan’s high-speed rail
David Emanuel Andersson · Oliver F. Shyr ·Angel Lee
Received: 12 April 2009 / Accepted: 14 August 2010 / Published online: 27 August 2010© Springer-Verlag 2010
Abstract Taiwan does not only have a high population density; its populationexhibits a strong preference for high-density downtown living. Rich Taiwanese thuslive downtown, not in the suburbs. In addition, the expected negative relationshipbetween accessibility and the spaciousness of housing is weak or non-existent inTaiwan’s metropolitan areas. Taiwan should therefore be highly suited to rail trans-portation investments. In 2007, a new high-speed railroad was inaugurated, connectingseven metropolitan areas. Hedonic estimates show that high-speed rail accessibilityhas a substantial impact on house prices in at least four of the regions. Interregionaldowntown-to-downtown commuting time seems to be the most important determinantof success in generating a station-centered price-distance gradient. Neighborhoodsaround HSR stations in suburban locations are not likely to spawn residential commu-nities for commuters, since most Taiwanese prefer downtown residential locations.
JEL Classification O18 · R11 · R23 · R49
1 Introduction
High-speed rail is a type of transportation infrastructure that until recently was con-fined to Japan and parts of Western Europe. The most substantial investments in thistechnology after 2000 have however occurred in Asia outside of Japan, particularly
D. E. Andersson (B)Institute of Public Affairs Management, National Sun Yat-sen University, 70 Lianhai Road,Kaohsiung 80424, Taiwane-mail: [email protected]
O. F. Shyr · A. LeeDepartment of Urban Planning, National Cheng-kung University, Tainan, Taiwan
123

204 D. E. Andersson et al.
Fig. 1 Taiwan’s high-speed rail
in mainland China, South Korea, and Taiwan. It is likely that China will havethe world’s most comprehensive high-speed rail network after all current invest-ment projects have been completed, which include linkages between Beijing andShanghai as well as between Wuhan and Guangzhou. It is in Taiwan, however,that the longest high-speed track is being used at the time of writing; Taiwan’shigh-speed railroad traverses the 345 km between Taipei and Kaohsiung in about90 min.
Taiwan’s high-speed rail (HSR) was inaugurated in early 2007, and consists of eightstations in seven metropolitan regions (see Fig. 1). It runs parallel to the pre-existing
123

The successes and failures of a key transportation link 205
west-coast railroad line. The old line encompasses many more stations as well as afew more peripheral stations in the extreme north and south of the island. This is inaddition to the old east-coast line and several spur lines. The new 90- min Taipei–Kaohsiung HSR service has thus been added to a regular long-distance service thattakes about 4.5 h.
When the Japanese colonial government invested in the old railroad network in theearly twentieth century, it resulted in restructured urban land use patterns. Regionalaccessibility and land value maxima shifted from ports and harbors to emerging down-towns around urban stations. Later, as motorized transportation became increasinglyimportant in the 1970s and 1980s, Taiwan’s downtown areas moved again, this timein the direction of new business developments along recently constructed arterialroads.
The new HSR line has primarily relied on imported technology and hardware fromJapan’s Shinkansen line, supplemented with a European (TGV and ICE) traffic man-agement system. With an investment cost of approximately US$15 billion, it set a newrecord as the world’s most expensive build–operate–transfer project. The cost corre-sponds to as much as 5% of Taiwan’s annual gross domestic product. In America, 5%of GDP would amount to about $700 billion—it is as if the US government wouldhave decided to spend almost the entire 2009 stimulus package on railroad infrastruc-ture.
The HSR stations in the Taipei metropolitan area (Taipei and Banciao) areco-located with major railroad stations and transit interchanges, but the other fivestations are situated near suburban railroad (TRA) stations or on suburban greenfieldor brownfield land. Two of these new station locations (Taoyuan and Tainan) wouldseem to defy economic common sense. It is likely that the locations of these twostations were determined as the direct outcome of political bargaining among var-ious local interest groups. While the locations were justified as key assets for newtown development, there has so far been less interest in developing these areas than indowntown redevelopment.
On the other hand, there has been a reshuffling of the relative accessibility of urbanneighborhoods, with the exception of Taipei. The new time distances between severalof the metropolitan regions are in many cases short enough to enable the integrationof previously separated housing and labor markets. Several of these regions are nowaccessible from one another in <50 min (one way), which a host of empirical stud-ies indicate as a threshold associated with a sudden drop in commuting frequencies(Andersson and Andersson 2008). The Taipei metropolitan area—as conventionallydefined1—is now within commuting reach from (or to) the Taoyuan and Hsinchuareas, while Kaohsiung is within the reach of Tainan. Taiwan’s third largest metro-politan area, Taichung, has for the same reason become a feasible choice for dailycommuters from Hsinchu, Chiayi, and Tainan.
Table 1 provides an overview of time distances by rail before and after the com-pletion of the HSR (road time distances are usually longer than time distances by
1 Taiwan’s national statistical bureau defines a metropolitan area as an economically and socially integratedarea. For a suburban township to be included in the metropolitan area, it must be <25 km from the outerlimits of the core city and at least 1.5% of its population must commute to the aforementioned core city.
123

206 D. E. Andersson et al.
Table 1 Examples of time distances by high-speed rail and conventional rail ( min)
Regional combinations High-speed rail (HSR) Conventional rail (TRA)
Taipei–Kaohsiung (Zuoying) 96 280
Taipei–Taoyuan 22 28
Taipei–Hsinchu 34 65
Taipei–Taichung 52 135
Taoyuan–Hsinchu 22 36
Taoyuan–Taichung 38 102
Hsinchu–Taichung 26 65
Hsinchu–Chiayi 52 134
Taichung–Chiayi 26 70
Taichung–Tainan 43 115
Chiayi–Tainan 19 42
Chiayi-Kaohsiung 34 75
Tainan–Kaohsiung (Zuoying) 17 33
Sources HSR and TRA schedules (2009)
Table 2 Metropolitan area populations and access time in minutes from CBD to HSR stations
HSR station Metropolitan areapopulation(million)
Access time toCBD (car)
Access time toCBD (publictransportation)
Taipei 6.7 0 0
Banciao 6.7 − −Taoyuan 1.9 20 30
Hsinchu 0.8 20 30
Taichung 2.3 25 15
Chiayi 0.3 30 40
Tainan 1.2 30 40
Zuoying (Kaohsiung) 2.7 20 15
Source National Statistics, Republic of China (Taiwan) (2008)
conventional rail, due to Taiwan’s congested road network). Table 2 gives popula-tion figures for these metropolitan areas as well as the time distance from the centralbusiness district to the HSR station by means of public and private transportation.
Official delimitations of metropolitan areas usually employ historical observationsof commuter flows between outlying areas and an urban core with greater daytimethan residential population. Typically, a peripheral area is included in a metropoli-tan region as long as the proportion of core-bound commuters exceeds a specific butarbitrary threshold. There are however other ways of defining a metropolitan region;a more forward-looking way is to measure how far away a regional center impactsland values by making it more expensive than in genuinely rural areas. Should such animpact be present it would imply that market participants expect center accessibility
123

The successes and failures of a key transportation link 207
to be a valued attribute among participants in various property markets—an indicationof functional economic integration.
Using land prices for the delimitation of urban regions takes account of two factorsthat commuter flow analysis is incapable of addressing: market expectations as well asa weighting of market participants according to their economic importance (i.e. prop-erty developers and high-income professionals have more “dollar votes” than peoplewith less impact on the regional economy).
In this study, we estimate the impact of HSR accessibility on residential prop-erty prices in all of the seven official metropolitan regions that have direct HSRaccess. It should however be noted that the location of the Taipei HSR station isassociated with serious confounding factors. In Taipei, the HSR station coincideswith the conventional railroad station, the main transit interchange for subways andbuses, and the old central business district. Taipei’s downtown area reaches its high-est daytime population densities around two nodes: the combined HSR/transit inter-change with Taipei’s second tallest skyscraper as well as in the vicinity of Taipei101 (the tallest building) and the World Trade Center further east (the new CBD).The HSR station is thus located at the heart of the old CBD, which today representsthe western end point of a CBD corridor that terminates at Taipei 101. Estimatesof HSR accessibility in the Taipei region are therefore inherently uncertain, sincethe same neighborhood hosts the HSR station, the main commuter rail station, themain transit interchange, and one of the two main spatial concentrations of businessservices.
We interpret HSR accessibility as a proxy for the time distance to the cores of theother urban regions that present feasible commuting opportunities. These cores shouldbe especially attractive if they offer better work and leisure opportunities than in thesource region. We use the most popular method for estimating accessibility effects onurban land prices, which is called hedonic price estimation.
2 Rail accessibility and house prices
Most hedonic studies of the effect of rail accessibility on housing prices have analyzedlocal transit networks. Studies of the effects of long-distance rail accessibility arerelatively rare. This is because commuting costs affect housing prices, which tend tobe influenced by accessibility in intraregional transit networks. Conversely, the per-centage of commuting trips using intercity rail links is often quite low. The feasibilityof using intercity railroad lines for daily commuting depends on development densitiesand time distances. This implies that rail-based intercity commuting is limited to aspecific type of spatial structure. Examples include high-density urban corridors suchas the Randstad and Kansai conurbations, which in many ways resemble Taiwan’swest coast.
There is a small number of recent studies that goes beyond urban transit, althoughin most cases the spatial extension is minor. Armstrong and Rodriguez (2006) analyzea slightly more extensive rail network than in most hedonic studies. They estimatedaccessibility benefits of rail services in eastern Massachusetts, including multimodalaccessibility to commuter rail stations and distance from the rail right-of-way.
123

208 D. E. Andersson et al.
The results were inconclusive, except that proximity to commuter rail right-of-wayproduced a significant negative effect on property values, which probably reflectsnegative externalities such as noise.
Bowes and Ihlanfeldt (2001) suggest that railroad station accessibility should affectproperty values since such access reduces commuting costs. This should help attractretail activity from localities further away from stations, other things being equal.Possibly countering these positive effects are negative externalities such as noise andbetter access for criminals. Their results—from Georgia in the United States—suggestthat stations that are located sufficiently far away from the urban core tend to attractnew residential development.
The most comprehensive studies of rail networks have been conducted in theNetherlands in a number of theoretical and empirical studies by Debrezion et al.(2006a,b). Unlike other authors, they have adopted a multiregional perspective thatextends to the Netherlands as a whole. Debrezion et al. (2006a) use a hedonic pricingmodel to analyze the impact of the railroad network on house prices in the Nether-lands. They use several access variables, including station accessibility, train servicefrequency and track proximity. Among other findings, they estimated that housing inclose proximity to railroad stations command market prices that are about 25% moreexpensive than equivalent housing at a distance of 15 km or more. A problem withtheir approach is that they analyzed the Netherlands as a whole rather than just theRandstad conurbation; the use of several spatially segmented markets in the same hedo-nic price function is associated with biased estimates of attribute effects (Palmquist1991).
Studies of the regional enlargement of the Stockholm region in Sweden show thatthe radius of the price-distance gradient increased as a result of improved rail acces-sibility. Residential property prices in Uppsala could be partly explained by theirtime distance from downtown Stockholm after the introduction of a frequent 45-mincommuter train service with discounted fares for daily commuters (Andersson andAndersson 2008).
With sufficiently good information flows, improved accessibility will be capitalizedin land values in conjunction with the initial investment decision. The normal case ishowever imperfectly informed markets, due to uncertainties regarding the credibilityof decisions as well as future impacts of investments on the economy as a whole. Theoverall effect is therefore likely to be gradually incorporated into house prices, withdistinct price effects that correspond to the sequence of relevant events: station loca-tion decisions; the commencement of construction; the opening of the line; and thecumulative experience from consuming transportation services. The first three effectsshould have been fully incorporated in the land value observations that we analyze inthis paper, while the service experience component may have been capitalized in landvalues to a limited extent. It is however important to bear in mind that the long-termimpacts of investments in high-speed rail must remain uncertain, since the demand forrail transportation is affected by a multitude of factors, including tax policies, possibleshifts in consumer preferences, and changes to the spatial distribution of workplacesand leisure activities. Analyses of long-term impacts can therefore only be under-taken ex post, after a new transportation link has been in operation for a decade ormore.
123

The successes and failures of a key transportation link 209
Yu and Wong (2005) studied a temporal sequence in their analysis of the land priceeffects from a proposed tunnel project in Hong Kong. Their results show that expec-tations of improved accessibility had been capitalized in house prices to a substantialextent well before the completion of the tunnel. They suggest that such expectationeffects may enable governments to fund infrastructure investments by selling land inareas with contingent accessibility benefits.
A related topic is the spatial structure of infrastructural impacts. This is particu-larly relevant in the present context, since some of Taiwan’s high-speed rail stationsare in remote suburban locations. Sasaki et al. (1997) argue that market activity willnot lead to a spatial dispersion of economic activities when an extensive network isimplemented. They point out that the stock effect of existing lines favors previouslydeveloped regions, implying that new lines in remote regions improves the accessibil-ity of central regions as well.
Sasaki et al. (1997) however do not take the possible spatial differentiation of trans-action costs into account. If such cost heterogeneity is included, it is still possible thatthe reinforcement of pre-existing agglomeration economies does not materialize. Forexample, a property developer with substantial land holdings around stations could insome cases still bring about a more dispersed spatial distribution of economic activities,since unified land ownership is associated with low transaction costs. The transactioncost savings may therefore offset the lack of established (sunk-cost) agglomerationeconomies in the peripheral area, if it is the case that the traditional downtown areashave more dispersed land ownership (with attendant high transaction costs associatedwith redevelopment efforts).
In general, accessibility in road and rail networks tends to have a significant effecton housing and other real estate prices. However, such an effect is not self-evident inthe case of Taiwan’s high-speed rail. The accessibility effects may be minor, owing tothe peripheral locations of some of the HSR stations, in contrast to the conventionalrailroad (TRA) with its downtown stations. As a result, only 1.5% out of a sample of1,713 HSR passengers reported using the line for daily commuting in a 2007 surveyconducted by the Ministry of Transportation and Communications. True, this may bedue to the fact that this was the first year of operation, as well as to the absence ofdiscounted fares for regular commuters. Given the location of the HSR stations relativeto the TRA stations, we should expect most of this limited commuting to involve tripsbetween Taipei and Hsinchu (the survey does not provide information about passengerorigins and destinations).
On the other hand, according to a report prepared by the Bureau of Railway Admin-istration, commuters accounted for 73% of all railway trips between 1996 and 2000.Despite the recent diversion of passengers to new mass rapid transit systems in Taipeiand Kaohsiung, commuters still accounted for more than 60% of all regular railroadtrips over the last decade. In other words, the high-speed rail line has so far not playeda major role in the daily commuting activities between most of Taiwan’s metropolitanareas. Therefore, our research question mainly implies a test of whether high-speedrail accessibility affects housing markets as a result of expectations of future urbanrestructuring, as well as possibly the indirect effect of higher bids near HSR stationsin the market for commercial real estate.
123

210 D. E. Andersson et al.
3 Hedonic prices
Hedonic price theory is associated with the introduction of the term in a paper byRosen (1974), using ideas that had already been introduced by a number of econo-mists in the 1960s (see, for example, Lancaster 1966). Rosen uses a utility-maximizingapproach to derive implicit attribute prices for multi-attribute goods under conditionsof perfect competition, where each attribute has a unique implicit price in equilibrium.Perfect competition, however, rests on assumptions of perfect information, which isnot normally approximated in markets for housing or other real estate.
Perfect competition is however not a necessary assumption for empirical hedonicprice studies. Barzel (1989) approaches multi-attribute goods in a more dynamic way,by building on the insights of property rights theorists such as Demsetz (1967). Websterand Lai (2003) extend Barzel’s theory to spatial economics in a way that explicitlytakes dynamic processes and imperfect information into account. From such a dynamicstandpoint, empirical hedonic price models do not produce stable estimates of equilib-rium prices, but rather snapshots of transitional conditions. For example, a discoveryof two centers with a metropolitan impact does not necessarily invalidate the commonmonocentric assumption; it could be a transitional stage where a declining and anemerging center both impact the willingness to pay of market participants for a finitetime period—a reflection of asymmetric and imperfect information among buyers andsellers.
In general, hedonic price models aim at disentangling the attributes of a good fromone another for the purpose of estimating implicit prices. In housing models, the priceor rent is a function of various attributes, typically divided into structural and locationattributes. Location attributes can be further subdivided into general accessibility andlocalized neighborhood effects.
Regression techniques make it possible to estimate the implicit price for each attri-bute. Linear models are usually avoided, since the assumption of constant marginalimplicit prices is untenable unless there are constant returns to scale in production orcostless repackaging of two or more bundles. The most common non-linear modelsinclude log-linear, semi-log, and Box–Cox-transformed functions.2 The log-linear andsemi-log functions are pre-specified functions, while Box–Cox functions uses an itera-tive procedure that maximizes the log-likelihood of the function within a pre-specifiedfamily of functions. Such maximization ensures a more desirable distribution of theerror term than with less flexible estimation techniques.
In this study, we use the log-linear functional form, which is both compatible withthe underlying economic theory and relatively simple. The log-linear function has theadditional interpretive advantage that the estimated coefficients correspond to aver-age attribute elasticities. All pre-specified functional forms—including the log-linearfunction—have the advantage of allowing direct comparisons of quantitative attributeeffects across markets.
2 The simple left-hand-side Box–Cox transformation is Xλ1 = β1 +β2 X2 +· · ·+βi Xi +· · ·+βk Xk . The
simple both-side Box–Cox transformation is Xλ1 = β1 + β2 Xλ
2 + · · · + βi Xλi + · · · + βk Xλ
k ; where Xλi =
(Xλi − 1)/λ for λ �= 0 and Xλ
i = lnXi for λi = 0.
123

The successes and failures of a key transportation link 211
On the other hand, it is often advisable to compare the results of different func-tional forms in order to identify non-robust estimates. For this reason, we estimatedsemi-log functions for all regions as well as simple left-hand-side and simple both-sideBox–Cox functions for the Hsinchu and Tainan regions (the simple both-side Box–Cox estimates for these two regions are shown as Table A1 in the Appendix). Thelog-linear models exhibited higher coefficients of determination and closer-to-normaldistributions of residuals than the corresponding semi-log functions in all cases, butthe qualitative effects of the variables were remarkably robust3 across all estimatedfunctional forms, with the exception of HSR station accessibility in the Tainan regionand the “height” variable in all but one region. The Box–Cox functional forms forHsinchu and Tainan yielded similar qualitative conclusions as the log-linear model.Indeed, the both-side model for Hsinchu converged with λ = 0.01, which is virtuallyidentical with the log-linear model (defined as λ = 0).4 Even though the Box–Coxtransformation parameter was significantly different from the log-linear model in thecase of Tainan, this had little impact on the estimated effects of most variables, andthe overall conclusions remained the same.
4 Taiwan’s metropolitan areas
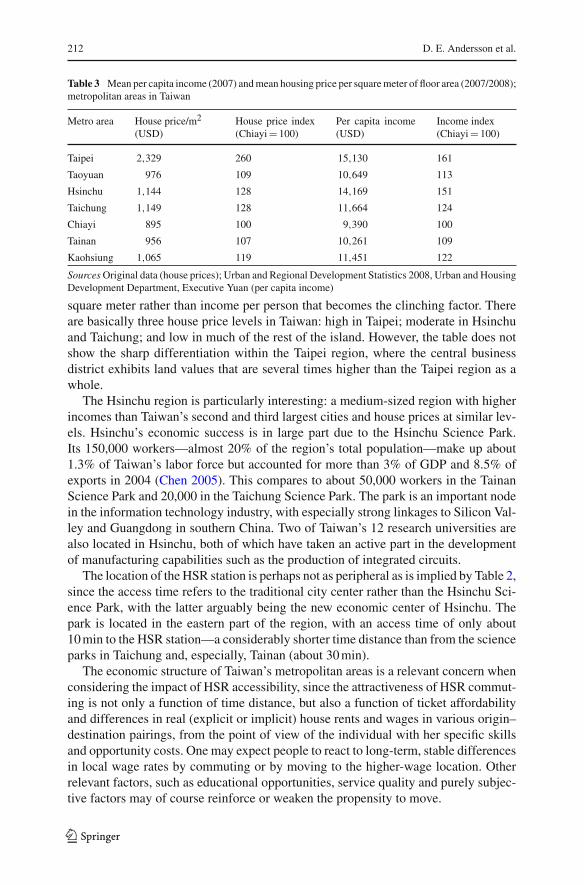
Taiwan’s seven metropolitan areas reflect the process of economic development asit has manifested itself on the island. One driving force has been the core of theTaipei metropolitan area, which specializes in the production of knowledge servicesin fields such as finance, marketing, trade, entertainment, and basic research. Theother important driving force is the development and manufacture of high technologyproducts—both producer and consumer goods—which is centered on Taiwan’s threescience parks in Hsinchu, Taichung, and Tainan. To some extent there are also somehigh-value-added economic activities in the major metropolitan areas of Kaohsiungand Taichung, particularly in logistics (Kaohsiung) and higher education (Taichung).But most Taiwanese still work in traditional family firms that make standardized goodsor engage in personal services such as retailing. The traditional economy is particularlyevident in the southern half of the island, which has been under cost-cutting pressurein recent years due to the increasing availability of low-cost labor in mainland China.
Table 3 shows average nominal per capita income and average house price persquare meter in each of the seven metropolitan regions. Taipei and Hsinchu residents(Hsinchu is the home of Taiwan’s oldest and largest science park) have incomes thatare on average between 20 and 60% higher than in the other five regions. House pricesreflect these differences to some extent, the difference being that it is income per
3 The main attribute effects tend to be similar across functional forms, while many of the less impor-tant attributes tend to produce different quantitative and qualitative conclusions depending on the choiceof functional form and the specification of independent variables (see Butler 1982). Our results indicatethat among the statistically significant effects that were identified using the log-linear model, the onlyquestionable qualitative result is the HSR station accessibility effect in the Tainan region.4 For Tainan, the corresponding λ = 0.168. For both Hsinchu and Tainan, the simple left-hand-side modelwas associated with lower log likelihood than the simple both-side model. The semi-log function is a specialcase of the simple left-hand-side model.
123
212 D. E. Andersson et al.
Table 3 Mean per capita income (2007) and mean housing price per square meter of floor area (2007/2008);metropolitan areas in Taiwan
Metro area House price/m2
(USD)House price index(Chiayi = 100)
Per capita income(USD)
Income index(Chiayi = 100)
Taipei 2,329 260 15,130 161
Taoyuan 976 109 10,649 113
Hsinchu 1,144 128 14,169 151
Taichung 1,149 128 11,664 124
Chiayi 895 100 9,390 100
Tainan 956 107 10,261 109
Kaohsiung 1,065 119 11,451 122
Sources Original data (house prices); Urban and Regional Development Statistics 2008, Urban and HousingDevelopment Department, Executive Yuan (per capita income)
square meter rather than income per person that becomes the clinching factor. Thereare basically three house price levels in Taiwan: high in Taipei; moderate in Hsinchuand Taichung; and low in much of the rest of the island. However, the table does notshow the sharp differentiation within the Taipei region, where the central businessdistrict exhibits land values that are several times higher than the Taipei region as awhole.
The Hsinchu region is particularly interesting: a medium-sized region with higherincomes than Taiwan’s second and third largest cities and house prices at similar lev-els. Hsinchu’s economic success is in large part due to the Hsinchu Science Park.Its 150,000 workers—almost 20% of the region’s total population—make up about1.3% of Taiwan’s labor force but accounted for more than 3% of GDP and 8.5% ofexports in 2004 (Chen 2005). This compares to about 50,000 workers in the TainanScience Park and 20,000 in the Taichung Science Park. The park is an important nodein the information technology industry, with especially strong linkages to Silicon Val-ley and Guangdong in southern China. Two of Taiwan’s 12 research universities arealso located in Hsinchu, both of which have taken an active part in the developmentof manufacturing capabilities such as the production of integrated circuits.
The location of the HSR station is perhaps not as peripheral as is implied by Table 2,since the access time refers to the traditional city center rather than the Hsinchu Sci-ence Park, with the latter arguably being the new economic center of Hsinchu. Thepark is located in the eastern part of the region, with an access time of only about10 min to the HSR station—a considerably shorter time distance than from the scienceparks in Taichung and, especially, Tainan (about 30 min).
The economic structure of Taiwan’s metropolitan areas is a relevant concern whenconsidering the impact of HSR accessibility, since the attractiveness of HSR commut-ing is not only a function of time distance, but also a function of ticket affordabilityand differences in real (explicit or implicit) house rents and wages in various origin–destination pairings, from the point of view of the individual with her specific skillsand opportunity costs. One may expect people to react to long-term, stable differencesin local wage rates by commuting or by moving to the higher-wage location. Otherrelevant factors, such as educational opportunities, service quality and purely subjec-tive factors may of course reinforce or weaken the propensity to move.
123

The successes and failures of a key transportation link 213
Table 4 The centrality priorityof the Taiwanese—simplecorrelations betweenaccessibility (CBD and HSR)and the floor area andneighborhood educationattributes, Taiwan, 2007/2008
Source Original data* One-tailed p< 0.05;** one-tailed p< 0.01
Region Correlation:accessibility andfloor area
Correlation:accessibility andeducation
Taipei (new CBD) 0.10∗∗ −0.77∗∗Taipei (old CBD/HSR) 0.19∗∗ −0.54∗∗Taoyuan CBD −0.02 −0.35∗∗Taoyuan HSR 0.00 −0.02
Hsinchu new CBD 0.04 −0.40∗∗Hsinchu old CBD −0.02 −0.77∗∗Hsinchu HSR −0.04 −0.12∗∗Taichung CBD −0.18∗∗ −0.70∗∗Taichung HSR −0.10∗∗ −0.36∗∗Chiayi CBD 0.02 −0.73∗∗Chiayi HSR −0.04 0.35∗∗Tainan CBD −0.03 −0.75∗∗Tainan HSR −0.02 0.16∗∗Kaohsiung CBD 0.12∗∗ −0.26∗∗Kaohsiung HSR −0.04 −0.13∗∗
The decision problem is universal, but there are two very important cultural pecu-liarities that distinguish Taiwan’s housing market from most western ones. The first isan unusually strong preference for owner-occupied housing which inhibits—at leastto some extent—interregional mobility. More than 88% of the population lived inowner-occupied housing in 2007 (Urban and Regional Development Statistics 2008).
Second, richer and more educated Taiwanese tend to prefer to live in downtownareas. One way of expressing this is that the average income elasticity of demand forcenter accessibility is greater than the average income elasticity of demand for spacesuch as larger floor areas or lots. As a consequence, Taiwan’s housing does not vary aswidely in terms of lot sizes and floor areas as most other countries. As Table 4 shows,there is no systematic tendency for less accessible dwellings to have larger floor areasoutside of the two largest metropolitan areas (Taipei and Kaohsiung). Even in the caseof Taipei, it is noteworthy that distance from the new CBD only accounts for 1% of thevariability in floor areas. In the third largest city (Taichung), there is even a significant(and highly unexpected) negative correlation.
The key factor here is arguably the strong positive association between accessibilityand education (and, as it turns out, income). In all seven cities, there are substantial andstatistically significant negative correlations between the percentage of neighborhoodresidents with a college education and the distance to the center, which incidentallyalso explains why Taiwanese associate the inner cities with better-than-average schoolsand a greater variety of shopping and entertainment options. In the case of Taipei, thismeans that almost all households with high incomes (and high levels of education)live in condominiums, and that there is an almost total absence of detached dwell-ings, even in the most peripheral suburbs. The markets for owner-occupied housingin the five smallest of the seven metropolitan regions almost exclusively consist of
123

214 D. E. Andersson et al.
townhouses, and in these regions average floor areas tend to be similar in all parts ofthe region. At the urban-to-rural periphery, this has the effect of juxtaposing standard-ized townhouses with farms. Such areas tend to have the lowest mean incomes andthe lowest education levels.
5 Description of the data
The sample of transaction prices and structural characteristics was obtained from theDepartment of Land Administration of the Central Government, and encompasses5,745 residential property transactions in the five smaller metropolitan areas thatoccurred in 2007, and a further 10,368 transactions that occurred in 2008 in the Taipeiand Kaohsiung regions. The education data are for 2004 and were obtained from theMinistry of Finance. The neighborhoods correspond to districts (qu) in the core citiesand to townships in the rest of the metropolitan areas. A suggested income variablewas unfortunately unavailable for districts, but the correlation between average incomeand the percentage of residents with at least 2 years of college education ranged from0.93 to 0.96 in suburban townships, so the education variable is in effect also a proxyfor income. The distance measurements are proxies5 for house-specific access to theHSR station, the city center, and the science park, respectively. The distance data cor-respond to the shortest route for motor vehicles according to a popular GIS programthat covers the entire road network of Taiwan; PaPaGo R12.
The neighborhood attributes “commercial zone” and “residential zone” refer toTaiwanese zoning regulations, which are more flexible than in many other jurisdic-tions. Taiwan’s cities have retained a mixed-use character since “residential zones”allow commercial use on the first and second floors of apartment houses and town-houses. “Commercial zones” allow for some residential use on higher floors. Forexample, downtown residential zones are often used for high-rise apartment blockswith high-value commercial use such as banks and luxury retailing on the first twofloors. Moreover, land use regulations tend to be somewhat haphazardly enforcedcompared with European or North American cities (Bernstein 2007).
The hedonic analysis makes use of sales prices rather than rents, which accounts formost transactions involving residential property. In addition, sales prices reflect expec-tations of future developments, and should therefore—unlike rents—reflect potentiallong-term future benefits of new or planned infrastructure investments. Table 5 is alist of all variables which specifies measurement units as well as the abbreviationsthat are used in Tables 6 and 7. Table 6 gives the means and standard deviations of theoriginal untransformed variables.
The functions for the Taipei and Kaohsiung metropolitan regions include threeadditional independent variables that reflect differences in urban scale. First, although
5 We use the distance to the (old) Taoyuan, Hsinchu, Chiayi, and Tainan railroad stations as our “distanceto CBD” measure. In Taichung, the distance refers to the new CBD several kilometers to the west of therailroad station. All accessibility variables measure distances from the center of the “city block” in whichthe housing unit is located to the facility in question (i.e. city center, HSR station, science park). A cityblock is generally smaller than 5,000 m2. Exact locations of property transactions are unavailable since theidentity of the transacting parties is confidential.
123

The successes and failures of a key transportation link 215
Table 5 List of variables with units of measurement and abbreviations
Variable Unit of measurement Abbreviation
Dependent variable
Transaction price 10,000 New Taiwan PRICEdollars
Structural attributes
Indoor floor area m2 FLOOR
Size of owned lot m2 LOT
Age of dwelling Years AGE
Height of dwelling Number of stories HEIGHT
Combined shop/dwelling use Yes=1; No=0 SHOP
Faces main street Yes=1; No=0 MAIN
Condominium dummy (Taipei; Kaohsiung) Yes=1; No=0 CONDO
Neighborhood attributes
Road width m WIDTH
Dwelling in commercial zone Yes=1; No=0 CZONE
Dwelling in residential zone Yes=1; No=0 RZONE
Neighborhood education level Share with at least2 years ofcollege indistrict ortownship
EDU
City dummy (Taipei; Kaohsiung) Yes=1; No=0 CITY
Accessibility attributes
Distance to main commercial center km CBD1(for Taipei: Taipei 101)
Distance to central Chung Li (Taoyuan) km CBD2
Distance to Taipei 101 (Taoyuan) km TAIPEI
Distance to science park (Hsinchu; Taichung; Tainan) km PARK
Distance to MRT station (Taipei; Kaohsiung) km MRT
Distance to high-speed rail station (for Taipei: HSR/old CBD) km HSR
apartments make up a negligible part of the market for owner-occupied housing inthe five smallest regions (there are no apartments in those samples), they make up asmuch as 90% of all non-rental housing in Taipei and 20% in Kaohsiung. The small butsignificant positive correlations between the floor area and distance-to-CBD variablesin those two cities mainly reflect the absence of townhouses within the central businessdistrict and adjoining neighborhoods.
Second, Taipei and Kaohsiung are the only cities in Taiwan with rapid transit sys-tems. A variable that measures the distance to the nearest transit station is therefore alsoincluded for the two largest regions. The final difference is that local government percapita expenditures are much higher in Taipei City and Kaohsiung City, which reflectstheir special political status. Since the taxes for those expenditures are levied at thenational level, a “city” dummy variable is included to account for a possibly superiorprovision—relative to tax costs—of streets, parks, and other territorial public goods.
123

216 D. E. Andersson et al.
Table 6 Descriptive statistics: means (standard deviations)
Variable Taipei Taoyuan Hsinchu Taichung Chiayi Tainan Kaohsiung
PRICE 7.9 (7.5) 5.0 (3.3) 7.0 (4.5) 7.2 (3.9) 4.9 (2.7) 5.6 (4.0) 5.7 (4.8)
Structural attributes
FLOOR 106.0 (62.9) 156.6 (73.4) 185.4 (91.3) 189.0 (82.5) 166.9 (76.1) 177.5 (126.2) 167.3 (96.4)
LOT 30.6 (43.6) 91.1 (39.6) 104.5 (82.2) 99.6 (45.6) 99.1 (53.0) 95.1 (39.1) 82.7 (105.5)
AGE 21.4 (10.9) 18.8 (12.7) 15.8 (12.2) 16.4 (13.0) 15.5 (12.7) 16.8 (12.5) 17.5 (13.5)
HEIGHT 7.2 (4.3) 2.9 (1.1) 3.1 (1.1) 3.2 (1.0) 3.0 (1.0) 3.2 (1.1) 4.4 (3.5)
SHOP 0.01 (0.1) 0.02 (0.2) 0.03 (0.2) 0.2 (.2) 0.1 (0.2) 0.1 (0.4) 0.1 (0.3)
MAIN 0.4 (0.5) 0.3 (0.5) 0.3 (0.5) 0.4 (0.5) 0.4 (0.5) 0.3 (0.5) 0.6 (0.5)
CONDO 0.9 (0.2) 0.2 (0.4)
Neighborhood attributes
WIDTH 18.3 (11.1) 13.6 (6.4) 14.8 (7.3) 15.5 (8.1) 17.6 (10.8) 15.6 (7.3) 17.6 (10.2)
CZONE 0.2 (0.4) 0.04 (0.2) 0.03 (0.2) 0.06 (0.2) 0.05 (0.2) 0.1 (0.3) 0.2 (0.4)
RZONE 0.8 (0.4) 0.6 (0.5) 0.7 (0.5) 0.8 (0.4) 0.8 (0.4) 0.9 (0.3) 0.8 (0.4)
EDU 0.4 (0.1) 0.3 (0.1) 0.2 (0.1) 0.4 (0.2) 0.4 (0.2) 0.3 (0.1) 0.3 (0.05)
CITY 0.6 (0.5) 0.6 (0.5)
Accessibility attributes
CBD1 12.8 (8.4) 10.1 (7.8) 7.3 (6.4) 8.6 (7.2) 4.2 (3.2) 6.1 (4.4) 10.7 (8.3)
CBD2 9.2 (5.4)
TAIPEI 43.6 (7.7)
PARK 8.6 (4.5) 12.9 (5.7) 17.0 (4.5)
MRT 1.5 (1.9) 3.8 (5.2)
HSR 11.9 (9.0) 15.2 (6.4) 11.5 (4.1) 12.5 (4.5) 16.7 (4.8) 16.7 (6.1) 12.8 (7.3)
Source Original data
6 Does high-speed rail remold urban spatial structures?
Using the abbreviations of Table 5, we apply the following Eq. 1 as our hedonic pricefunction:
ln(PRICE) = b0 + b1ln(FLOOR) + b2ln(LOT) + b3ln(AGE) + b4ln(HEIGHT)
+ b5(SHOP) + b6(MAIN) + b7(CONDO) + b8ln(WIDTH)
+ b9(CZONE) + b10(RZONE) + b11ln(EDU) + b12(CITY)
+ b13ln(CBD1) + b14ln(CBD2) + b15ln(TAIPEI) + b16ln(PARK)
+ b17(M RT ) + b18ln(H S R) + e (1)
Table 7 shows that most structural and neighborhood variables have the expectedsigns. This implies that the lot size, floor area, building height, main street location, roadwidth, commercial use, commercial or residential zoning, and education variables allhave positive impacts on property prices, while the age-of-building and condominium(i.e. multifamily apartment building) variables have negative impacts. The impact of
123

The successes and failures of a key transportation link 217
Tabl
e7
Log
-lin
ear
hedo
nic
pric
efu
nctio
ns:e
stim
ated
β-c
oeffi
cien
ts(t
-val
ues)
Var
iabl
eTa
ipei
Taoy
uan
Hsi
nchu
Taic
hung
Chi
ayi
Tain
anK
aohs
iung
Con
stan
t−1
.15
−1.6
80.
76−0
.58
−0.5
91.
560.
81
Stru
ctur
alat
trib
utes
FLO
OR
0.94
**(4
7.45
)0.
64**
(20.
22)
0.53
**(1
9.59
)0.
44**
(15.
46)
0.62
**(1
4.71
)0.
55**
(26.
87)
0.63
**(3
0.48
)
LO
T0.
11**
(6.6
0)0.
39**
(14.
66)
0.44
**(2
1.25
)0.
50**
(24.
10)
0.33
**(9
.75)
0.47
**(1
9.45
)0.
33**
(19.
16)
AG
E−0
.08*
*(−
13.6
0)−0
.04*
*(−
5.86
)−0
.04*
*(−
5.69
)−0
.08*
*(−
14.2
8)−0
.08*
*(−
10.6
0)−0
.12*
*(−
19.7
2)−0
.08*
*(−
19.6
9)
HE
IGH
T0.
07**
(4.1
3)0.
04(1
.24)
0.59
(1.4
0)0.
09**
(2.4
8)0.
01(0
.13)
0.04
(0.9
2)0.
09**
(3.6
4)
SHO
P0.
41**
(6.7
5)0.
20**
(4.4
2)0.
13**
(2.8
6)0.
06**
(3.8
5)0.
16**
(3.7
0)0.
14**
(6.4
9)0.
22**
(14.
58)
MA
IN−0
.01
(−0.
59)
0.17
**(1
1.08
)0.
11**
(6.7
0)0.
13**
(9.7
3)0.
22**
(11.
80)
0.19
**(1
1.73
)0.
08**
(8.1
4)
CO
ND
O−0
.09*
*(−
3.12
)−0
.16*
*(−
6.45
)
Nei
ghbo
rhoo
dat
trib
utes
WID
TH
0.04
**(4
.05)
0.03
*(1
.96)
0.05
**(2
.99)
0.10
**(7
.54)
0.06
**(3
.59)
0.10
**(6
.31)
0.08
**(7
.73)
CZ
ON
E0.
13**
(3.6
1)0.
54**
(13.
96)
0.61
**(1
3.51
)0.
36**
(11.
35)
0.23
**(3
.80)
0.33
**(6
.49)
0.37
**(1
2.87
)
RZ
ON
E0.
12**
(3.6
8)0.
33**
(21.
72)
0.28
**(1
6.33
)0.
24**
(12.
12)
0.23
**(7
.30)
0.23
**(5
.75)
0.23
**(9
.44)
ED
U0.
86**
(20.
36)
0.73
**(1
4.61
)0.
16**
(3.8
7)0.
48**
(9.4
4)0.
38**
(4.7
6)0.
45**
(10.
42)
0.31
**(9
.56)
CIT
Y0.
41**
(23.
59)
−0.0
2*(−
1.74
)
Acc
essi
bili
tyat
trib
utes
CB
D1
−0.1
0**
(−8.
29)
−0.0
1(−
1.28
)−0
.06*
*(−
4.08
)−0
.11*
*(−
8.18
)−0
.14*
*(−
6.09
)−0
.11*
*(−
6.97
)−0
.11*
*(−
12.6
6)
CB
D2
−0.0
05(−
0.48
)
TAIP
EI
− 0.0
02(−
0.04
)
PAR
K−0
.09*
*(−
5.47
)−0
.03*
(−1.
79)
−0.0
8**
(−3.
55)
MR
T−0
.06*
*(−
9.36
)−0
.06*
*(−
9.45
)
HSR
−0.1
8**
(−19
.54)
−0.0
1(−
0.48
)−0
.18*
*(−
8.99
)−0
.09*
*(−
5.80
)−0
.08*
*(−
3.40
)−0
.04*
(−1.
95)
−0.1
8**
(−19
.47)
123

218 D. E. Andersson et al.
Tabl
e7
cont
inue
d
Var
iabl
eTa
ipei
Taoy
uan
Hsi
nchu
Taic
hung
Chi
ayi
Tain
anK
aohs
iung
Fun
ctio
nst
atis
tics
N7,
369
1,18
084
61,
486
683
1,55
02,
999
Adj
uste
dR
20.
830.
840.
850.
820.
830.
800.
85
Est
imat
esar
eba
sed
ontr
unca
ted
sam
ples
that
excl
ude
obse
rvat
ions
that
are
mor
eth
anth
ree
stan
dard
devi
atio
nsfr
omth
elo
gari
thm
ofth
em
ean
(thi
sdo
esno
tapp
lyto
dum
my
vari
able
s)*
One
-tai
led
p<
0.05
**O
ne-t
aile
dp
<0.
01
123

The successes and failures of a key transportation link 219
the CITY variable differs between Taipei and Kaohsiung. We should expect a positiveimpact, owing to greater public expenditures in the two main special municipalitiesthat are not wholly accounted for by greater tax contributions by residents in the twocities. But the expected positive impact on property values is only present in Taipei,which might imply that Taipei’s municipal government is more responsive to resi-dents’ preferences than Kaohsiung’s. Generally speaking, however, all structural andneighborhood variables—except height in four of the models, the width of the roadin Taoyuan, and a Kaohsiung City location—are significant at the 99% significancelevel. The estimated accessibility effects are more variable and point to the relativeimportance of the downtown, HSR, and science park nodes in the seven regions. TheMRT (distance to nearest transit station) variable is a more general accessibility mea-sure, and as such exhibits highly significant and almost identical negative distanceelasticities in both Taipei and Kaohsiung.
In Hsinchu, the distance to the HSR station has a greater impact on house pricesthan either the science park or the old downtown area. The estimated HSR accessibil-ity effect testifies to the economic importance of the Hsinchu–Taipei linkage for theHsinchu Science Park. All three distance effects are however substantial and statis-tically significant. The estimated hedonic price function lends support to the notionthat Hsinchu’s downtown and science park nodes have been transformed into outlyingsub-centers in an enlarged northern metropolitan region. We may interpret HSR acces-sibility as a proxy for accessibility to Taipei’s as well as Taichung’s central businessdistricts. Since the new high-speed rail link has resulted in a substantial reduction ofthe time distance between Hsinchu and two of Taiwan’s three largest cities, it seemsthat high-speed rail investments are expected to contribute to urban enlargement pro-cesses. In the Taiwanese case, such enlargement processes may even result in partiallyoverlapping metropolitan areas.
In Kaohsiung, the estimated HSR accessibility effect is also greater than the acces-sibility effect associated with the new CBD (Sanduo). While it is possible that thereis some confounding due to the co-location of a commuter rail station with the HSR,this is likely to be a minor effect. Apparently, interregional accessibility has a greaterimpact on housing prices in the Kaohsiung region than does intraregional accessibility.It could reflect the importance of regular business trips to Taipei among high-incomeKaohsiung professionals, but at this point the available information does not allow usto draw any firm conclusions.
The effect of HSR accessibility within Taipei is—as mentioned above—inherentlyuncertain. What we can say is that the HSR station is located at a point with very goodintraregional as well as interregional accessibility, but that its marginal contributionto overall accessibility remains uncertain. The Taipei HSR station also offers directaccess to all rapid transit lines, the main commuter rail line, and major albeit old officebuildings, shopping areas, and hotels.
HSR station accessibility is also associated with a clear but somewhat flatter price-distance gradient in Taichung and Chiayi. In these two cases we can be quite certainthat there are no important confounding factors, since both stations are in suburbangreenfield locations. The price effect should thus reflect the dramatic reduction oftime distances to other metropolitan areas. It is now possible to live in Taichung andwork in the Hsinchu Science Park or in downtown Taipei, which are the areas with
123

220 D. E. Andersson et al.
Taiwan’s best-paying employment opportunities. Chiayi represents a classic exampleof a low-wage, low-cost area from which it has now become feasible to commute toTaichung, which has a wage level that is about 25% higher. In addition, Chiayi hasin recent years suffered from negative population growth and net job losses, whichmeans that for many Chiayi residents, commuting may be the only option should theywish to keep their current residential location.
In the Taoyuan and Tainan regions, HSR accessibility has at most a minor effect onresidential property prices. While in Tainan the traditional downtown area has retainedits position, Taoyuan has maintained its unusual character of having two small down-towns for which few people express a willingness to pay. Taoyuan remains an atypicallarge metropolitan area that hosts a seemingly random landscape of residential devel-opments and largely blue-collar industrial zones.
The small or negligible HSR accessibility effects in Taoyuan and Tainan reflecttwo mutually reinforcing factors that are present in both regions: exceptionally lowintraregional accessibility of its HSR station and the lack of any real accessibilityimprovements. Center-to-center commuting by conventional train from Taoyuan toTaipei and from Tainan to Kaohsiung imposes lower money and time costs than HSRcommuting. It is only in a few suburbs that the HSR has effected real improvements incommuting opportunities. Those suburbs are however likely to be considered unattrac-tive by the most likely HSR commuters: professionals in knowledge services. In theTaiwanese case, such professionals tend to prefer—and have the necessary purchasingpower to buy—condominiums in downtown neighborhoods.
Another way of looking at the spatial orientation of the five cities is by com-paring and ranking estimated price-distance elasticities. Table 8 shows that six reg-ular downtown areas (exact node in order of importance: Chiayi Railway Station;Taichung World Trade Center; Tainan Railway Station; Kaohsiung Sanduo ShoppingDistrict; Taipei 101; Hsinchu Railway Station), four non-downtown HSR stations(Hsinchu; Zuoying/Kaohsiung; Taichung; Chiayi), and two science parks (in Hsin-chu and Tainan) have substantial and highly significant impacts on sales prices intheir respective housing markets. Moreover, there is an additional important node thatencompasses HSR, transit and business functions around the Taipei Railway Station.We can also infer that none of the seven regions exhibits an unambiguously mono-centric character. All of the new nodes emerged from large-scale infrastructure invest-ments—first in science parks and later in high-speed rail. It remains to be seen whetherunambiguous accessibility maxima will emerge in any of Taiwan’s seven major cities.It also remains to be seen how many functional regions Taiwan will consist of in thefuture. But a likely scenario is the integration of the three northernmost regions intoa single functional urban region. That process seems to be well under way, wherethe knowledge nodes of downtown Taipei and the Hsinchu Science Park seem to beleading the way (probably including some daily HSR commuters as early as 2007).
7 Final remarks
The choice to commute is decided by whether the difference in real income—whiletaking account of the opportunity cost of not living in the destination community—is
123

The successes and failures of a key transportation link 221
Table 8 Ranking of nodes according to hedonic estimates of mean price-distance elasticity; metropolitanregions in Taiwan, 2007/2008
Node Region Price-distance elasticity
Hsinchu HSR Station Hsinchu −0.18**
Zuoying HSR Station Kaohsiung −0.18**
Taipei HSR Station/old CBD Taipei −0.18**
Chiayi CBD Chiayi −0.14**
Taichung CBD Taichung −0.11**
Tainan CBD Tainan −0.11**
Kaohsiung CBD Kaohsiung −0.11**
Taipei new CBD Taipei −0.10**
Taichung HSR Station Taichung −0.09**
Hsinchu Science Park (new CBD) Hsinchu −0.09**
Tainan Science Park Tainan −0.08**
Chiayi HSR Station Chiayi −0.08**
Hsinchu old CBD Hsinchu −0.06**
Tainan HSR Station Tainan −0.04*
Taichung Science Park Taichung −0.03*
Taoyuan CBD Taoyuan −0.01
Taoyuan HSR Station Taoyuan −0.01
Chungli CBD Taoyuan −0.005
Taipei city CBD Taoyuan −0.002
Source Original dataHSR station nodes are given in bold* One-tailed p < 0.05** One-tailed p < 0.01
at least as great as the cost of traveling to and from work. For example, assumethat a Taipei resident who is also a high-technology professional prefers the Taipeito the Hsinchu residential package. Perhaps he prefers Taipei’s cultural amenities orperhaps he lives rent-free with his parents. He would then need to be offered a salary inHsinchu that compensates for the total transportation cost, assuming that he has otherjob offers in Taipei. The total monthly transportation cost in the HSR case amounts tothe sum of the direct cost (NT$12,000 or about US$360) and the subjective time cost(i.e. at least 33 h of traveling per month). Since certain occupations (e.g. electronicengineers) are associated with much higher salaries in the Hsinchu Science Park thanelsewhere in Taiwan, it is likely that some Taipei residents will find jobs in Hsinchu thatpay substantially more than an additional NT$12,000/month, if we make the realisticassumption that train commuting is not their highest-valued leisure activity.
On the other hand, certain occupations (for example in financial services) are con-centrated in Taipei’s central business district. Some people in financial services andother such activities may be compensated by the additional consumption opportunitiesthat become available due to lower housing costs in Hsinchu, to the extent that the paydifferential is greater than the money and time costs associated with commuting.
123

222 D. E. Andersson et al.
While similar considerations would seem to apply for commuters from Tainan toKaohsiung or Taoyuan to Taipei, there is an important difference. While Kaohsiung andTainan as well as Taipei and Taoyuan would seem to be ideal pairings for economicintegration, there are two features that inhibit the process. First, Taiwanese peopletend to move into downtown areas as their incomes go up, thereby deviating from theWestern tendency to look for larger houses and lots in increasingly inaccessible loca-tions. Consequently, most Taiwanese do not consider the suburban neighborhoodsaround HSR stations as being attractive residential locations. With rising incomes,Taiwanese typically first move to core-city neighborhoods and only later do they con-sider more spacious accommodations.
Second, the location of the stations relative to both downtown Tainan and downtownTaoyuan result in downtown-to-downtown commuting times to the nearest larger citiesthat are longer than with conventional commuter rail. The locations of the Taoyuanand Tainan HSR stations have thus not provided any additional incentives for urbanenlargement processes beyond what was already available prior to their existence.
Appendix
See Table A1.
Table A1 Box–Cox hedonicprice functions; Hsinchu andTainan metropolitan areas
Variable Hsinchu BSBox–Cox:estimate (t-value)
Tainan BSBox–Cox:estimate (t-value)
Constant 0.76 2.13Structural attributes
FLOOR 0.53** (14.32) 0.65** (21.53)
LOT 0.45** (13.46) 0.63** (14.30)
AGE −0.04** (−5.37) −0.18** (−12.78)
HEIGHT 0.12** (3.47)
SHOP 0.14** (2.76) 0.20** (6.56)
MAIN 0.11** (6.26) 0.25** (10.59)
Neighborhood attributes
WIDTH 0.05** (2.97) 0.12** (6.47)
CZONE 0.61** (9.40) 0.40** (6.11)
RZONE 0.28** (11.68) 0.25** (4.91)
EDU 0.16** (3.83) 0.739** (7.66)
Accessibility attributes
CBD1 −0.06** (−4.03) −0.17** (−6.69)
HSR −0.18** (−6.85) −0.05* (−1.93)
PARK −0.09** (−5.22) −0.06** (−3.03)
Function statistics
λ 0.001 0.168
Log likelihood −1375.7 −2453.7
N 846 1,550
123

The successes and failures of a key transportation link 223
References
Andersson DE, Andersson ÅE (2008) Requirements for the region’s economic development. In: Nationalatlas of Sweden: the Stockholm-Mälaren region. Kartförlaget, Gävle, pp 98–131
Armstrong RJ, Rodriguez DA (2006) An evaluation of the accessibility benefits of commuter rail in easternMassachusetts using spatial hedonic price functions. Transportation 33:21–43
Barzel Y (1989) Economic analysis of property rights. Cambridge University Press, CambridgeBernstein A (2007) Why “Taiwan is too democratic”: legitimation, administration, and political participation
in Taipei. Dissertation, University of ChicagoBowes DR, Ihlanfeldt KR (2001) Identifying the impacts of rail transit stations on residential property
values. J Urban Econ 50:1–25Butler RV (1982) The specification of housing indexes for urban housing. Land Econ 58:96–108Chen JR (2005) China’s way of economic transition. Trans Stud Rev 12:315–333Debrezion G, Pels E, Rietveld P (2006a) The impact of rail transport on real estate prices: an empirical
analysis of the Dutch housing market. Tinbergen Inst Disc Papers 06-031/3Debrezion G, Pels E, Rietveld P (2006b) The impact of railway stations on residential and commercial
property values: a meta analysis. J Real Estate Finance Econ 35:161–180Demsetz H (1967) Towards a theory of property rights. Am Econ Rev 57:347–359Lancaster K (1966) A new approach to consumer theory. J Pol Econ 74:132–157Palmquist RB (1991) Hedonic methods. In: Braden JB, Kolstad CD (eds) Measuring the demand for envi-
ronmental quality. Elsevier, AmsterdamRosen S (1974) Hedonic prices and implicit markets: product differentiation in pure competition. J Pol
Econ 82:34–55Sasaki K, Ohashi T, Ando A (1997) High-speed rail transit impact on regional systems: does the Shinkansen
contribute to dispersion?. Ann Reg Sci 33:77–98Webster C, Lai LWC (2003) Property rights, planning and markets: managing spontaneous cities. Edward
Elgar, CheltenhamYu CY, Wong SK (2005) The effect of expected transport improvements on housing prices. Urban Stud
42:113–125
123