Transport Accessibility and Tourism Development Prospects ...
GÉZA TÓTHa�– LÓRÁNT DÁVIDb�– LÁSZLÓ VASAc�
Transportation and accessibility at European level
Abstract
This study investigates the multiple and complex relationship between transport and tourism by various methods. Features of the relationship between the transport distance and tourism intensity will be identified and the connections between the accessibility of European regions and their tourism will be analysed.
Keywords: tourism flows, accessibility, modelling
Introduction
The relationship between tourism and transport has been the focal point of studies for a long period of time (Hall 2010). However, relevant studies often discuss the possibilities of the disabled in tourism exclusively (Carda–Colea–Humphreya 2006, Apec 2003, European Communities 2004).
This paper covers questions as to whether such a relationship between the two activities can be measured at all, along with those regarding the closeness and strength of the relationship if it exists. It is also relevant to study if such a relationship is observable in general or with detectable significant spatial disparities, which is the particular subject this paper intends to investigate.
According to our initial hypothesis, although tourism performance is greatly impacted by the level of services provided by transport, related spatial disparities also play a significant role in forming it.
Objectives
Prior to its launch, the research intended to focus on a general investigation into the relationship between transport distance and tourism using the example of European regions, as well as studying the role of distance and accessibility as relevant to the topic and in order to clarify the significance and spatial aspects.
Initially, it is important to state that the study is intended to explore the relationship between tourism and transport in general, along with an approach by which the spatial movements of individuals including tourists become more comprehendible. The authors agree with Hall’s opinion that “there is a lack of vertical theoretical integration within broader perspectives of mobility” (Hall 2008, p. 15).
a�Hungarian Central Statistical Office, 1024 Budapest, Keleti Károly u. 5-7., Hungary, E-mail: [email protected] b�Károly Róbert College, 3200 Gyöngyös, Mátrai u. 36, Hungary, E-mail: [email protected] c�Szent István University, 2103 Gödöllő Páter Károly út 1, Hungary, E-mail: [email protected]
REGIONAL STATISTICS, 2013, VOL. 3: 79–97
80 GÉZA TÓTH – LÓRÁNT DÁVID – LÁSZLÓ VASA
Obviously, we also acknowledge the demand for studies of this kind; however, we raise the question as to whether it is possible to develop a spatial model for tourism movements. Regarding this, Hall (2005) argues that if the physics analogue is maintained, the spatial form of human mobility can be measured by applying the classic Newtonian physics and within that, the number of journeys can be described and forecasted with confidence on the macro-level; whereas on the micro-level, individual human behaviour can be likened to that analysed by quantum physics in which a higher uncertainty is observed for individuals’ travels. Nevertheless, a relationship between physical paradigms and community tourism attitudes exists (Hall–Page 2009). Before launching the study, the interrelationship between transport and tourism needs to be clarified; a review on the most relevant approaches is given below.
Literature review
The role of transport is manifested in connecting tourism demand and supply and in the internal features of supply, i.e. the destination to be accessed. Transport is one of the primary preconditions for tourism, it is a key element that links tourists to the possible destinations. Although the connection between tourism and transport has been widely examined previously (Page 2005, Prideaux 2000), there are still significant gaps in this research topic (Chew 1987, Gunn 1994, Hall 1991, Inskeep 1991, Page 1994 and 1999; Robbins–Thompson, 2007). As pointed out by Knowles (1993), in many cases researchers took transport into account as a passive element in tourism, not as an integral part of tourism activities. Though the tourism product to be consumed by tourists, i.e. the set of services (accommodation, catering, entertainment and other services), based on attractions accordant with the motivation of tourists, also includes transport.
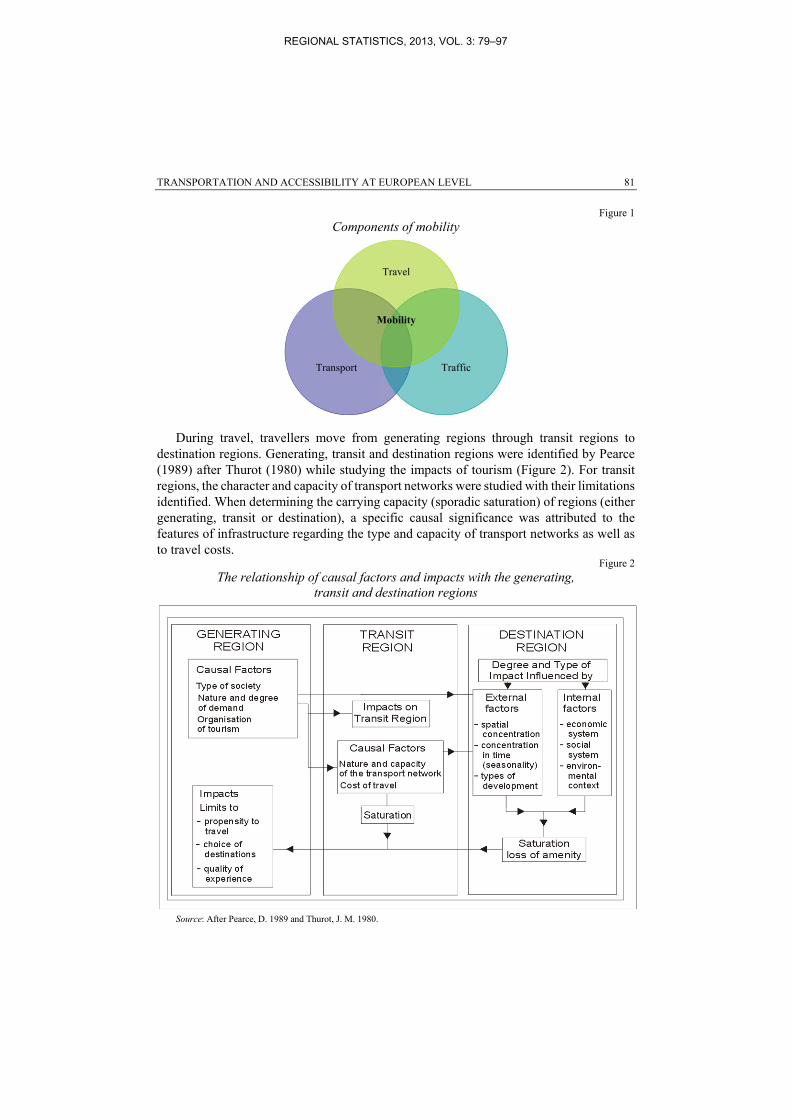
It is important to emphasise that in the case of tourism, the demand for motion or mobility is among mankind’s fundamental needs (Figure 1). Demand for travel is the extent of travel requisites defined or influenced by travel fees (Jászberényi-Pálfalvi 2009). In the tourism sector, three important definitions are used collaterally to describe related activities. Traffic is a change of locations usually accomplished by suitable technical appliances. For transport, the owners of vehicles expedite people or subjects by their own appliances. Travel is an activity when an individual goes somewhere, and in this sense, it is a synonym for transport although it has various meanings i.e. the movement of people or subjects (Jászberényi–Pálfalvi 2009).
REGIONAL STATISTICS, 2013, VOL. 3: 79–97
TRANSPORTATION AND ACCESSIBILITY AT EUROPEAN LEVEL 81
Figure 1
Components of mobility
During travel, travellers move from generating regions through transit regions to destination regions. Generating, transit and destination regions were identified by Pearce (1989) after Thurot (1980) while studying the impacts of tourism (Figure 2). For transit regions, the character and capacity of transport networks were studied with their limitations identified. When determining the carrying capacity (sporadic saturation) of regions (either generating, transit or destination), a specific causal significance was attributed to the features of infrastructure regarding the type and capacity of transport networks as well as to travel costs.
Figure 2
The relationship of causal factors and impacts with the generating, transit and destination regions
Source: After Pearce, D. 1989 and Thurot, J. M. 1980.
Travel
Mobility
Transport Traffic
REGIONAL STATISTICS, 2013, VOL. 3: 79–97
82 GÉZA TÓTH – LÓRÁNT DÁVID – LÁSZLÓ VASA
At the interface of transport and tourism, Hall and Page (1999) identified four fields to be studied: the link between the source market and host destination; mobility provision and access within the destination; mobility provision and access within an area with a relevant tourist attraction; and the advancement of journeys along a recreation route itself also representing a tourism experience. Our study, in this respect, can be classified into the first field.
As presented by Hall (1999) and relevant to this specific field, linking the generation and destination regions is not primarily accomplished for tourism purposes. As also pointed out, a rather limited amount of research has been conducted on how travellers’ opinions, on a given destination to be accessed, are influenced by the time, cost and type of travel required.
One of the methodologically most complicated issues of studying the connection between transport and tourism is how to separate tourism movements from transport capacities. There are several branches of transport that are used both by residents and tourists by choice, thus distinguishing such functions appears rather complicated.
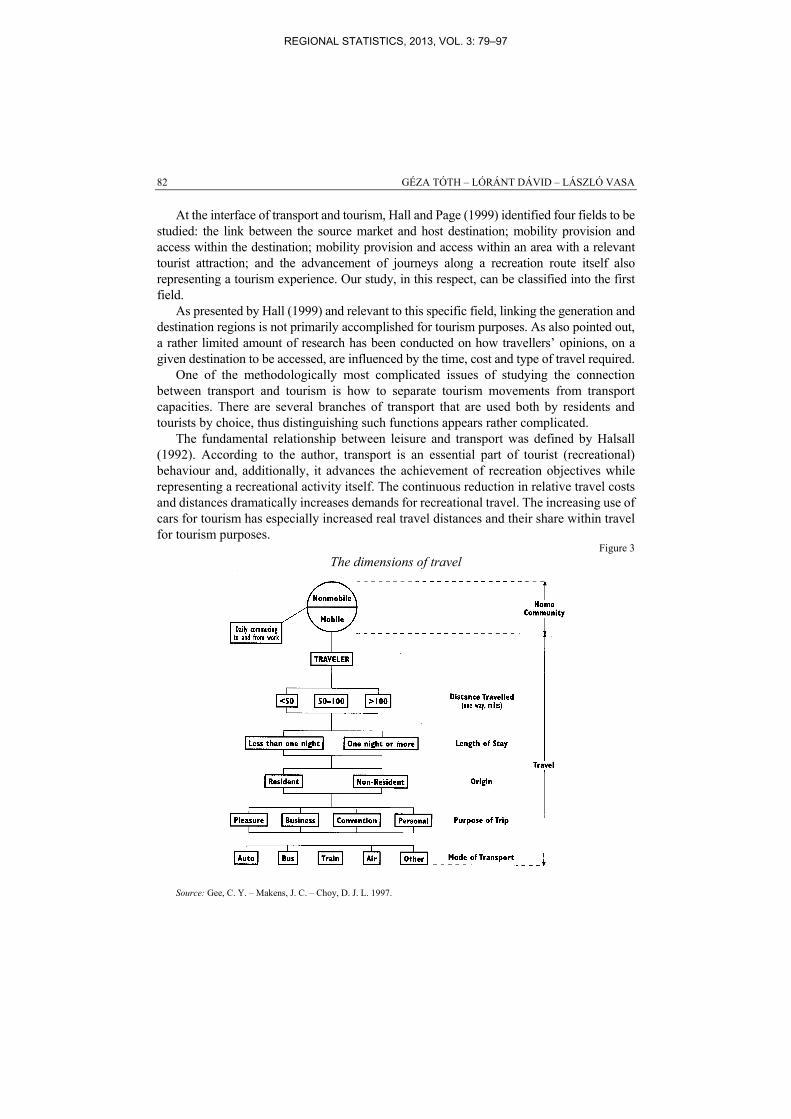
The fundamental relationship between leisure and transport was defined by Halsall (1992). According to the author, transport is an essential part of tourist (recreational) behaviour and, additionally, it advances the achievement of recreation objectives while representing a recreational activity itself. The continuous reduction in relative travel costs and distances dramatically increases demands for recreational travel. The increasing use of cars for tourism has especially increased real travel distances and their share within travel for tourism purposes.
Figure 3
The dimensions of travel
Source: Gee, C. Y. – Makens, J. C. – Choy, D. J. L. 1997.
REGIONAL STATISTICS, 2013, VOL. 3: 79–97
TRANSPORTATION AND ACCESSIBILITY AT EUROPEAN LEVEL 83
Travel is a complex process influenced by a number of other factors; the various dimensions of the travel process are demonstrated by Figure 3. This present research neither goes into details regarding the above dimensions, nor does it intend to give a detailed analysis on the figure below.
Tourism and accessibility
A study into the relationship between transport and tourism can only be sufficient if adequately broad and general. Not only should the level of services provided by the transport infrastructure be taken into account, but also features of those potentially participating, the criteria for travel etc. should also be studied. To this, accessibility should also be considered. However, due to the multiplicity of literature it is also important to define accessibility in this respect.
Definitions for accessibility were often developed as the establishment of a spatial model or calculation. Thus, a more detailed analysis into the topic is thought to be more expedient pointing out the wide range of connections the relationship between accessibility and tourism is dependent on. Such an approach is reflected by the definition according to which accessibility can be regarded as the sustainability potential of the built environment and the dimension of mankind’s quality of life, thus, it is basically an approach of how the relative importance of certain spatial points are judged (Makri 2001).
This concept of accessibility includes the following aspects: 1. Physical accessibility – whether a given point can be accessed, despite existing
physical obstacles, allowing tourists to reach the required destination; 2. Mental accessibility – whether the given individual can apprehend and use the
opportunities provided by a destination; 3. Social accessibility – whether, due to their social status, individuals have
information and the desire to travel; 4. Organisational accessibility – whether individuals have access to opportunities,
information and services; 5. Financial accessibility – whether the use of individual or community transportation
methods is affordable in order to reach the required destination. This definition of accessibility was found appropriate to our study as its elements are
linked either directly or indirectly to the causal factors and impacts influencing tourist activities indicated by Figure 2, as well as the extent and character of flows between the generating and destination regions.
The content behind the definition of accessibility can be modelled in various ways; however, in our study several examples were applied for quantification; regarding the basic definition, the same contextural framework was studied.
Methods
The research included three methods. Although different approaches, the three methodologies have a rather similar approach. First, the spatial interaction model of concurrent destinations was used in order to model the amplitude of European tourism flows. Calculated results of the model (with various distance approaches) were compared
REGIONAL STATISTICS, 2013, VOL. 3: 79–97
84 GÉZA TÓTH – LÓRÁNT DÁVID – LÁSZLÓ VASA
to the actual data, particularly guest nights, thus a general view on the existing relationship between transport distance and tourism was obtained.
By applying the second method namely the shift-share analysis in addition to the general results obtained by the above study, the relationship between the accessibility of European groups of countries and the number of guest nights was analysed. Two approaches of this method were applied with accessibility compared to changes in the number of guests in the first, whereas to the spatial disparities of guest nights per bed in the second.
Finally, in order to quantify the relationship between the number of international and domestic guest nights and accessibility, the loglinear analysis was applied. A more detailed description on these methodologies is provided later.
A research into the European tourism flows
Transport distance as one of the substantial indicators of travel is only one among the selection criteria for destinations. Regarding distance, a different overall view is drawn for movements for leisure purposes when compared to all dislocations. According to Bull (1994), the travel intensities with shortening distances will increase to a certain point followed by a decline and finally, a zero travel intensity is observed at zero distance. This is because too close thus too easily accessible destinations are not attractive for visitors and are considered to be part of their everyday milieu.
It can also be concluded that several tourist destinations indicate a rather intensive development despite their locations being relatively distant to their competitors. In many cases, poor accessibility can be practically balanced by other factors of attraction as well as a destination that is conceivable when the attraction is represented by unfavourable accessibility and the resultant “wild” destination aspect.
Certain studies reveal that accessibility has a primary role in selecting tourist destinations (Thompson–Schofield 2007). Tourism in easily accessible towns indicates intensive development as opposed to those hard-to-access, which stagnate. According to one hypothesis, tourists, during their travel decisions, select the destinations based first on the local possibilities and attractions (Crompton 1992). In this decision-making, destinations suiting the purposes of visitors and with similar types of endowments are taken into account (Celata 2007). Only after this primary selection is made will destinations be compared according to accessibility. Thus, accessibility primarily has or can theoretically have a role in substituting potentially visitable destinations. On the contrary, destinations capable of providing comparative advantages for tourists can attract a significant number of visitors even if with relatively unfavourable accessibility. Consequently, the matter of accessibility is relevant for destinations with similar endowments (seaside), whereas it is less remarkable for those with individual attractions (historical towns, spas). Favourable accessibility itself does not necessarily represent a source of competitiveness.
When studying tourism flows, the question can be raised of how individuals, at a given point of origin, will select among the accessible travel destinations. According to Haynes and Fortheringham (1990), spatial choice process has three characteristics. First, this is a discrete process. That is a given travel destination is either selected or not and there is a finite number of travel alternatives. Second, the number of alternatives is often extremely
REGIONAL STATISTICS, 2013, VOL. 3: 79–97
TRANSPORTATION AND ACCESSIBILITY AT EUROPEAN LEVEL 85
large. Third, the alternative destinations all have fixed spatial locations, which limit the degree to which alternatives are substitutes for one another (Fotheringham et al. 2000). As a result of these criteria, Fortheringham (1983, 1984, 1991) developed a spatial interaction model of competing destinations that is basically a single limited accessibility model by which we first intended to analyse the relationship between accessibility and tourism. Accordingly:
Iij=(Oi; Sj; Dij; Aj) where Iij is the interaction between the ith origin and the jth destination, Oi is the ith place’s ability as an origin to contribute to the interaction, Sj is the attractiveness of j as a destination, Dij is the intervening distance between the origin and destination and Aj is the competing destinations variable being the accessibility of jth destination relative to all others that may interact with the ith origin, i.e.:
DSA ijm
jk1k
ij
Hereafter, the research attempts to focus on the type of relationship explored between theoretical accessibility calculated for tourism and statistical data on the number of visitors. Can the number of guest nights at hotel type units be estimated by applying the spatial interaction model? Within this, a further question concerns the role of transport, i.e. the distance in the estimation and whether Bull’s (1994) theory can be validated by data.
The starting point of our study, for practical reasons, was the European Union’s NUTS system as it provides data at comparable regional levels. Moreover, the NUTS system was introduced not only in EU-27 member states but also in the EFTA countries, consequently data for the regions of Switzerland, Norway and Iceland were also taken into account in the analysis. For the calculations, NUTS2 data were used. The number of regions considered was 280 with the transcontinental areas of France, Spain and Portugal excluded.
In the model, the universal accessibility definition was applied, i.e. given regions were not analysed by their main generating regions and how the appropriate destinations are accessed. In other words, theoretically, travel is possible from any region to any other one with a tourist motivation. (Obviously, in practice, this is not the case; however, due to the features of modelling, it was not included)
The participatory capacity of departure regions in the interaction was quantified by their population data.1 The total number of the population was included in the model despite it being unlikely in reality that everyone would participate in tourism flows (see the definition of accessibility). Significant variations can be observed in implementing tourism activity based on age, sex, financial status, marital status and other considerations. By including the total population as potential tourists in the model, a theoretical maximum was defined to which the amplitude and spatial distribution of real flows become readily measurable.
The tourist attraction of destinations was represented by the number of beds in hotel type units in the given region. Using this criteria, the main level of attraction is indicated
1 Data source was in this case as for other statistical data alike, the Eurostat database
(http://epp.eurostat.ec.europa.eu/portal/page/portal/eurostat/home/).
REGIONAL STATISTICS, 2013, VOL. 3: 79–97
86 GÉZA TÓTH – LÓRÁNT DÁVID – LÁSZLÓ VASA
directly, not in regard to the general level of economic development and processes, the greater the attraction, the more beds there are.
The distance between the origin and destination regions were specified by the distance between the regional centres by road measured in minutes. In this study, when preparing the road network database, accessibility time in minutes for all road segments (for crossings-to-crossing sections) was defined with speeds appropriate to each road category. Within the networks, by programming GIS software, time demand of the optimal routes requiring the minimal access time was also established for the study area. This procedure corresponds to defining the optimal access path between two points of a graph where the edges are the road segments and resistance data for the edges are the time data required for the journey. Applying road distance data is only the first approach as other transport sub-sectors also play a relevant role in tourism-induced travel in the study regions. In this respect, the time-space being significantly different from the geographical space, and modelled by applying road distances (Dusek–Szalkai 2008), could be a good starting point in this present analysis.
The number of guests in a given region, i.e. in this particular case, the number of guest nights can be calculated as the sum of incoming tourism flows.
The spatial interaction model is based on a gravitational analogy as field intensity here is also studied in the relation to mass and distance. Our research intends to focus on the second i.e. the topic of accessibility. To estimate the role of distance sensitivity in tourism flows, an analysis on the value γ constant that can tie in the gravity model was relevant. Therefore, calculations were performed by constants within the range between 0 and 2, followed by studying the strength of correlation between the calculated and actual values.
As concluded by Dusek (2003) in his work on the gravity model: “With the exponent increasing, the intensity of interregional connections becomes more distance sensitive and collaterally the relevance of masses will gradually decline.”
Table 1
Weighted means of correlation coefficients for various γ constants of the gravity model
γ 0.0 0.5 1.0 1.5 2.0
Source: Own calculation.
As seen in Table 1, by applying the spatial interaction model, data on the number of guests can be sufficiently estimated, as coefficients of determination are relatively high; however, they cannot be regarded as distance dependent. This is due to several reasons. On the one hand, the most important tourist destinations are located at the continent’s periphery at positions relatively disadvantageous from the point of view of accessibility. On the other hand, the tourism product as a tourism experience is indefinable, “one-shot and perishing” i.e. cannot be stored. If somebody intends to spend their summer holidays at the seaside, such demand will not be replaced by spending it at a nearby although easily accessible mountainous area but will undertake travelling to remote peripheries.
REGIONAL STATISTICS, 2013, VOL. 3: 79–97
TRANSPORTATION AND ACCESSIBILITY AT EUROPEAN LEVEL 87
A study into accessibility and the number of guests by applying shift-share analysis
The following analysis studies the extent of guest numbers in European regions explained by accessibility and other local reasons. For this, the shift-share analysis was applied. Description on the method has been given in several spatial statistical publications and volumes (Houston 1967, Curtis 1972, Berzeg 1978, Stevens–Craig 1980) and an example for its application regarding accessibility in Hungary was provided by Tóth (2002).
Here, a different approach was attempted. As already indicated earlier, accessibility has or can have a role primarily in substituting potentially visitable destinations (Celata 2007). Obviously, the question can be raised as to whether this is the case for all destination groups.
Therefore, destinations with similar features were studied from the aspect of accessibility. European regions were classified into five groups based on the location of the countries involved. Our hypothesis in this respect was that for the contiguous groups of countries, several differences can be observed regarding the type and strength of relationship between accessibility and the number of guests.
The groups and the countries included are as follows: 1. Western Europe: Belgium, the Netherlands, Luxemburg, France, United
Kingdom, Ireland; 2. West Central Europe: Germany, Switzerland, Austria, Liechtenstein; 3. East Central Europe: Poland, the Czech Republic, Slovakia, Hungary, Romania,
Slovenia; 4. Northern Europe: Denmark, Finland, Sweden, Norway, Iceland, Estonia, Latvia,
Lithuania; 5. Southern Europe: Portugal, Spain, Italy, Greece, Bulgaria, Malta, Cyprus. 6. The groups and the countries included can be seen in Figure 1.
REGIONAL STATISTICS, 2013, VOL. 3: 79–97

88 GÉZA TÓTH – LÓRÁNT DÁVID – LÁSZLÓ VASA
Figure 1
The groups of European countries
Accessibility in this respect was studied not only based on road transport data but also
multimodal accessibility i.e. based on the use of various modes of conveyance and attempting to take them into account collectively.
For this, data available on the Espon website was used. Downloadable data, among others, included multimodal accessibility of NUTS3 regions in the study area. As our research was intended to be carried out on the NUTS2 level, such data was inappropriate thus a population-weighted mean was applied.
Initially, changes in the number of guest nights were analysed between 2003 and 2009. In the second study, the specific method of shift-share analysis with the spatial disparities of guest nights per bed in 2009 factorised was applied. The intention being to explore the breadth of accessibility and other local factors responsible for spatial disparities. It is not possible to define the influencing specific local factors from the analysis; only to the extent that changes in the number of guests deviating from the European average is influenced by accessibility (in other words, the extent positive or negative deviation or short surplus or deficiency in the number of guests compared to the average in guest nights is entailed), and other factors characteristic for the given region including the level of urbanisation, seaside or mountain location etc.
Groups of countriesGroup 1Group 2Group 3Group 4Group 5
Groups of countries
Group 1 Group 2 Group 3 Group 4 Group 5
REGIONAL STATISTICS, 2013, VOL. 3: 79–97

TRANSPORTATION AND ACCESSIBILITY AT EUROPEAN LEVEL 89
Table 2
Surplus/deficiency in the number of guests and its components (2003/2009) (%)
Regions Total Spatial Accessibility
Western Europe 100 –69 169
West Central Europe 100 –6 703 6 803
East Central Europe –100 136 –236
Northern Europe –100 –56 –44
Southern Europe 100 226 –126
Source: Own calculation.
As indicated by the data in Tables 2 and 3, accessibility plays a more important role in the changes in the number of guests than spatial dimensions i.e. other local conditions for three of the five groups of countries as having higher absolute values. It is due to their accessibility that Western and West Central Europe have more advantageous trends, whereas countries in East Central Europe show slower dynamics compared to the European average primarily due to their accessibility. Inaccessibility further spoils disadvantageous local conditions in Northern Europe, whereas for countries in Southern Europe, accessibility can slightly worsen favourable local endowments. The accessibility of Southern Europe cannot be disadvantageous enough within the continent to impede the increase in the number of guests exceeding the European average. Table 3 indicates the component changes in the number of guests between 2003 and 2009.
Regarding the factorisation of guest nights per bed data for 2009, a somewhat different overall view can be seen (Tables 4 and 5). In this respect, one can observe a more important role of accessibility only for the West Central European countries compared to local conditions for the number of guest nights per bed. For the other groups of countries, it can be seen that conditions determined by local endowments can only be modified in a positive or negative way by accessibility.
In summary, while accessibility plays a significant role in the changes in the number of guests in yet more groups of countries, its role in effectiveness (capacity exploited) is not relevant.
Table 3
The share of regions in surplus/deficiency in the number of guests and its components (2003/2009)
(%)
Regions Surplus in
the number of guests
Deficiencyin the number
of guests
The impact of
territoriality is positive
The impact of
territoriality is negative
The impact of
accessibility is positive
The impact of
accessibility is negative
Western Europe 27.5 – – 11.3 32.0 – West Central Europe 1.5 – – 57.6 68.0 – East Central Europe – 6.6 5.3 – – 10.7 Northern Europe – 93.4 – 31.1 – 28.0 Southern Europe 71.0 – 94.7 – – 61.3
Total 100.0 100.0 100.0 100.0 100.0 100.0
Source: Own calculation.
REGIONAL STATISTICS, 2013, VOL. 3: 79–97

90 GÉZA TÓTH – LÓRÁNT DÁVID – LÁSZLÓ VASA
Table 4
Surplus/deficiency in the number of guests and its components, 2009 (%)
Regions Total Spatial Accessibility
Western Europe 100 83 17
West Central Europe 100 –8 804 8 904
East Central Europe –100 –71 –29
Northern Europe 100 216 –116
Southern Europe –100 –74 –26
Source: Own calculation. Table 5
The share of regions in surplus/deficiency in the number of guests and its components, 2009
(%)
Regions Surplus in
the number of guests
Deficiency in the number
of guests
The impact of
territoriality is positive
The impact of
territoriality is negative
The impact of
accessibility is positive
The impact of
accessibility is negative
Western Europe 86.2 – 71.1 – 33.6 –
West Central Europe 0.3 – – 28.0 66.4 –
East Central Europe – 40.6 – 28.6 – 27.3
Northern Europe 13.5 – 28.9 – – 36.4
Southern Europe – 59.4 – 43.4 – 36.2
Total 100.0 100.0 100.0 100.0 100.0 100.0
Source: Own calculation.
The loglinear theoretical model
Where there is no destination due to the lack of tourist attractions, none will be established even after having potential infrastructural development implemented. In turn, among destinations with similarly advantageous endowments for tourism, theoretically a higher flow tends towards regions with better accessibility conditions.
This final research primarily intends to examine the degree that guest nights of a destination depend upon accessibility and local conditions in cases where existing tourist attractions can be found.
The hypothesis, in this present case, is also that a relationship between accessibility and the number of guest nights is assumed. In our study, the extent and components of this will be analysed by applying the loglinear model.
The loglinear model examines when and in which context our variables are interdependent on each other. The method interprets the connection between variables as follows: in case any of the variables fall into any of the defined categories, this then increases the likelihood of such variables falling into another category according to other features. Such attribution is usually referred to as interaction between the variables (Füstös 1985).
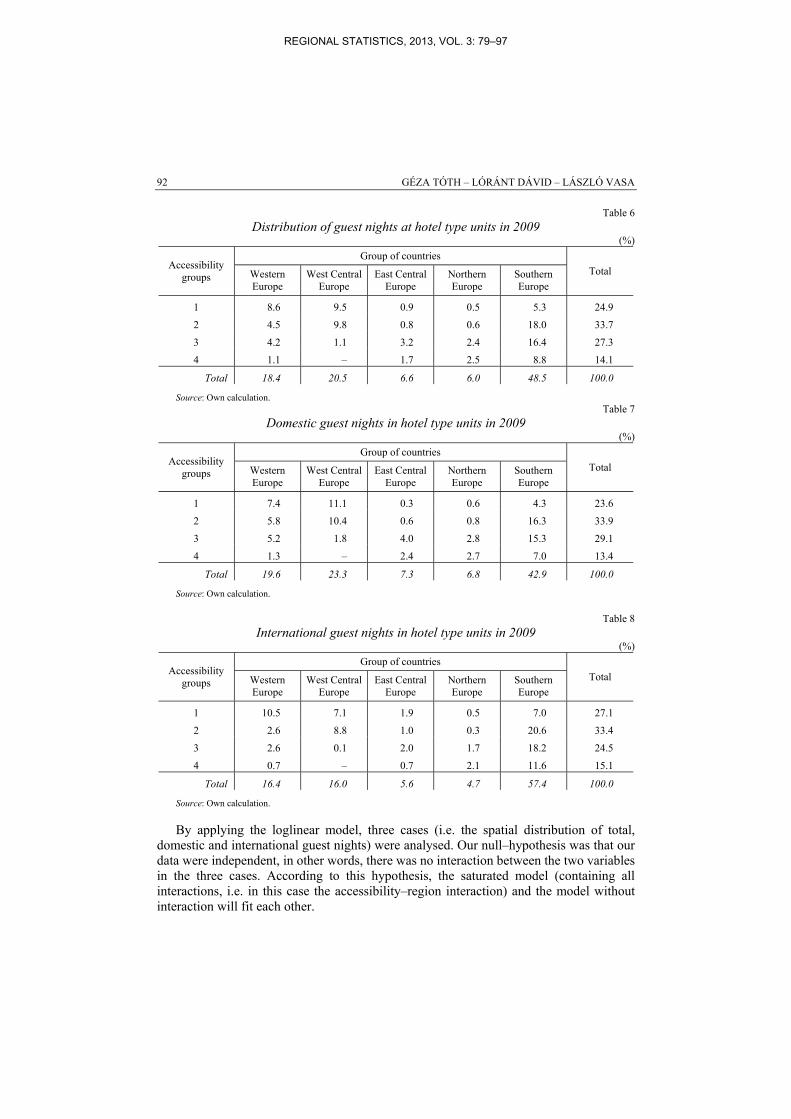
An average contingency table is taken as a starting point (Tables 6, 7 and 8). The regions studied were classified, by using the accessibility data of Espon described above, into four accessibility groups. Thus, based on accessibility, data on the number of guests for all groups of countries could be classified into these four groups. As, at present, no
REGIONAL STATISTICS, 2013, VOL. 3: 79–97
TRANSPORTATION AND ACCESSIBILITY AT EUROPEAN LEVEL 91
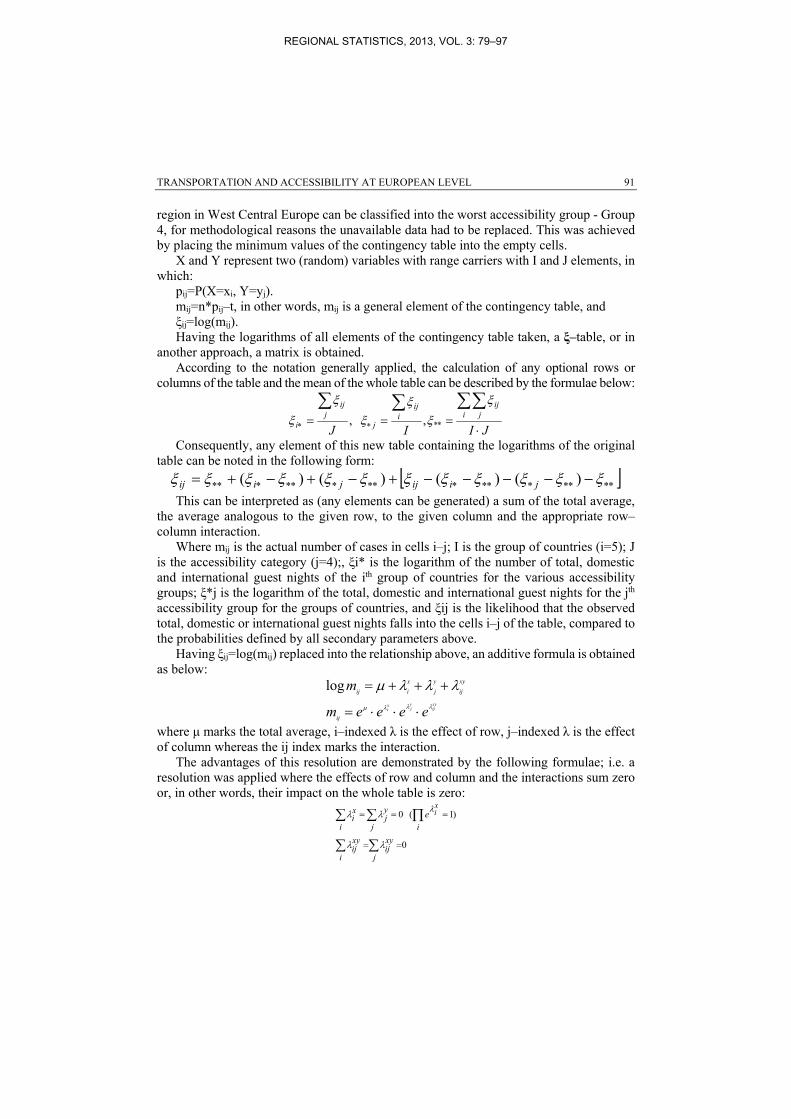
region in West Central Europe can be classified into the worst accessibility group - Group 4, for methodological reasons the unavailable data had to be replaced. This was achieved by placing the minimum values of the contingency table into the empty cells.
X and Y represent two (random) variables with range carriers with I and J elements, in which:
pij=P(X=xi, Y=yj). mij=n*pij–t, in other words, mij is a general element of the contingency table, and ξij=log(mij). Having the logarithms of all elements of the contingency table taken, a ξ–table, or in
another approach, a matrix is obtained. According to the notation generally applied, the calculation of any optional rows or
columns of the table and the mean of the whole table can be described by the formulae below:
JIIJi j
ij
iij
jj
ij
i
**,,
Consequently, any element of this new table containing the logarithms of the original table can be noted in the following form:
)()()()( jiijjiij This can be interpreted as (any elements can be generated) a sum of the total average,
the average analogous to the given row, to the given column and the appropriate row–column interaction.
Where mij is the actual number of cases in cells i–j; I is the group of countries (i=5); J is the accessibility category (j=4);, ξi* is the logarithm of the number of total, domestic and international guest nights of the ith group of countries for the various accessibility groups; ξ*j is the logarithm of the total, domestic and international guest nights for the jth accessibility group for the groups of countries, and ξij is the likelihood that the observed total, domestic or international guest nights falls into the cells i–j of the table, compared to the probabilities defined by all secondary parameters above.
Having ξij=log(mij) replaced into the relationship above, an additive formula is obtained as below:
xyij
yj
xi eeeem
m
ij
xy
ij
y
j
x
iij
log
where μ marks the total average, i–indexed λ is the effect of row, j–indexed λ is the effect of column whereas the ij index marks the interaction.
The advantages of this resolution are demonstrated by the following formulae; i.e. a resolution was applied where the effects of row and column and the interactions sum zero or, in other words, their impact on the whole table is zero:
0
)1(0
j
xyij
i
xyij
ii j
yj
xi
xie
REGIONAL STATISTICS, 2013, VOL. 3: 79–97
92 GÉZA TÓTH – LÓRÁNT DÁVID – LÁSZLÓ VASA
Table 6
Distribution of guest nights at hotel type units in 2009 (%)
Accessibility groups
Group of countries
Total Western Europe
West Central Europe
East Central Europe
Northern Europe
Southern Europe
1 8.6 9.5 0.9 0.5 5.3 24.9
2 4.5 9.8 0.8 0.6 18.0 33.7
3 4.2 1.1 3.2 2.4 16.4 27.3
4 1.1 – 1.7 2.5 8.8 14.1
Total 18.4 20.5 6.6 6.0 48.5 100.0
Source: Own calculation. Table 7
Domestic guest nights in hotel type units in 2009 (%)
Accessibility groups
Group of countries
Total Western Europe
West Central Europe
East Central Europe
Northern Europe
Southern Europe
1 7.4 11.1 0.3 0.6 4.3 23.6
2 5.8 10.4 0.6 0.8 16.3 33.9
3 5.2 1.8 4.0 2.8 15.3 29.1
4 1.3 – 2.4 2.7 7.0 13.4
Total 19.6 23.3 7.3 6.8 42.9 100.0
Source: Own calculation.
Table 8
International guest nights in hotel type units in 2009 (%)
Accessibility groups
Group of countries
Total Western Europe
West Central Europe
East Central Europe
Northern Europe
Southern Europe
1 10.5 7.1 1.9 0.5 7.0 27.1
2 2.6 8.8 1.0 0.3 20.6 33.4
3 2.6 0.1 2.0 1.7 18.2 24.5
4 0.7 – 0.7 2.1 11.6 15.1
Total 16.4 16.0 5.6 4.7 57.4 100.0
Source: Own calculation.
By applying the loglinear model, three cases (i.e. the spatial distribution of total, domestic and international guest nights) were analysed. Our null–hypothesis was that our data were independent, in other words, there was no interaction between the two variables in the three cases. According to this hypothesis, the saturated model (containing all interactions, i.e. in this case the accessibility–region interaction) and the model without interaction will fit each other.
REGIONAL STATISTICS, 2013, VOL. 3: 79–97
TRANSPORTATION AND ACCESSIBILITY AT EUROPEAN LEVEL 93
Results of the loglinear model
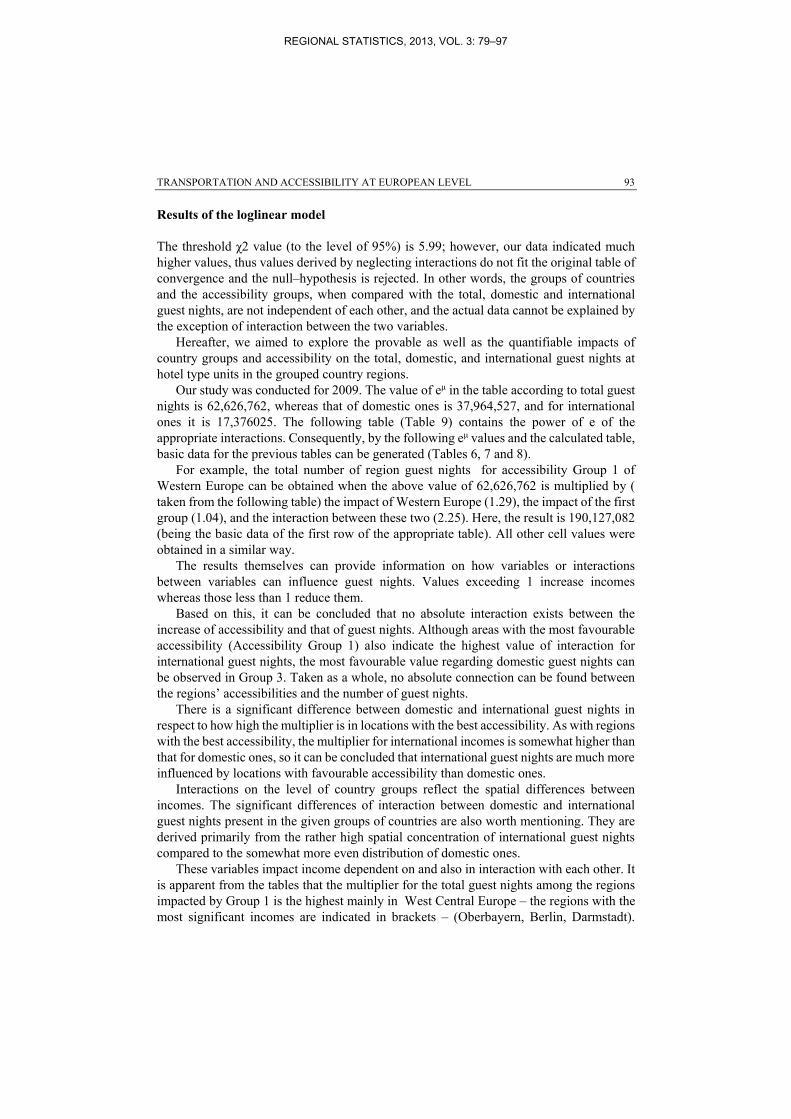
The threshold χ2 value (to the level of 95%) is 5.99; however, our data indicated much higher values, thus values derived by neglecting interactions do not fit the original table of convergence and the null–hypothesis is rejected. In other words, the groups of countries and the accessibility groups, when compared with the total, domestic and international guest nights, are not independent of each other, and the actual data cannot be explained by the exception of interaction between the two variables.
Hereafter, we aimed to explore the provable as well as the quantifiable impacts of country groups and accessibility on the total, domestic, and international guest nights at hotel type units in the grouped country regions.
Our study was conducted for 2009. The value of eμ in the table according to total guest nights is 62,626,762, whereas that of domestic ones is 37,964,527, and for international ones it is 17,376025. The following table (Table 9) contains the power of e of the appropriate interactions. Consequently, by the following eμ values and the calculated table, basic data for the previous tables can be generated (Tables 6, 7 and 8).
For example, the total number of region guest nights for accessibility Group 1 of Western Europe can be obtained when the above value of 62,626,762 is multiplied by ( taken from the following table) the impact of Western Europe (1.29), the impact of the first group (1.04), and the interaction between these two (2.25). Here, the result is 190,127,082 (being the basic data of the first row of the appropriate table). All other cell values were obtained in a similar way.
The results themselves can provide information on how variables or interactions between variables can influence guest nights. Values exceeding 1 increase incomes whereas those less than 1 reduce them.
Based on this, it can be concluded that no absolute interaction exists between the increase of accessibility and that of guest nights. Although areas with the most favourable accessibility (Accessibility Group 1) also indicate the highest value of interaction for international guest nights, the most favourable value regarding domestic guest nights can be observed in Group 3. Taken as a whole, no absolute connection can be found between the regions’ accessibilities and the number of guest nights.
There is a significant difference between domestic and international guest nights in respect to how high the multiplier is in locations with the best accessibility. As with regions with the best accessibility, the multiplier for international incomes is somewhat higher than that for domestic ones, so it can be concluded that international guest nights are much more influenced by locations with favourable accessibility than domestic ones.
Interactions on the level of country groups reflect the spatial differences between incomes. The significant differences of interaction between domestic and international guest nights present in the given groups of countries are also worth mentioning. They are derived primarily from the rather high spatial concentration of international guest nights compared to the somewhat more even distribution of domestic ones.
These variables impact income dependent on and also in interaction with each other. It is apparent from the tables that the multiplier for the total guest nights among the regions impacted by Group 1 is the highest mainly in West Central Europe – the regions with the most significant incomes are indicated in brackets – (Oberbayern, Berlin, Darmstadt).
REGIONAL STATISTICS, 2013, VOL. 3: 79–97
94 GÉZA TÓTH – LÓRÁNT DÁVID – LÁSZLÓ VASA
Whereas for accessibility, the multiplier is the most significant in the Group 2 (Tirol, Schleswig–Holstein, Salzburg). The positive impact of Group 3 is represented mainly in East Central Europe (Zachodniopomorskie, Małopolskie, Severovýchod), while that of Group 4 is observable in Northern Europe (Norra Mellansverige, Vestlandet, Sør–Østlandet).
When the components i.e. the domestic and international guest nights are examined, a difference can be seen. Although, for all groups, the multiplier is the highest in the group of countries for both the domestic and international groups where it was seen in the ‘total’ category, but their extent is varying. In three of the four accessibility groups, the multiplier for domestic groups is somewhat lower compared to that seen for the international ones. In Group 2, the multiplier for international guest nights is more than double the domestic guest nights. This refers to the rather pronounced spatial and accessibility concentration of international guest nights in Europe.
Conclusions
Based on the research carried out, it was concluded that the spatial interaction model is adequately suitable to estimate data on the number of guests; they cannot be seen as distance dependent. With the results confirmed, we discussed the estimates on the relationship between the intensity of travel (that was modelled by the number of guest nights) and acknowledged distance (Bull 1994).
The results of the shift–share analysis carried out indicated that accessibility plays a more important role than spatial dimension for three of the five groups of countries. Regarding the data of guest nights per bed in 2009, a more important role of accessibility is observed exclusively for West Central European countries compared to local conditions. In other words, conditions determined by local endowments can only be modified by accessibility. Therefore, while accessibility still plays a significant role in the changes regarding the number of guests in more groups of countries, its role in effectiveness (capacity exploited) is not relevant. Our relevant hypothesis, according to which there is significant difference between relationship of the different groups of countries accessibility and tourism, was demonstrated.
REGIONAL STATISTICS, 2013, VOL. 3: 79–97
TRANSPORTATION AND ACCESSIBILITY AT EUROPEAN LEVEL 95
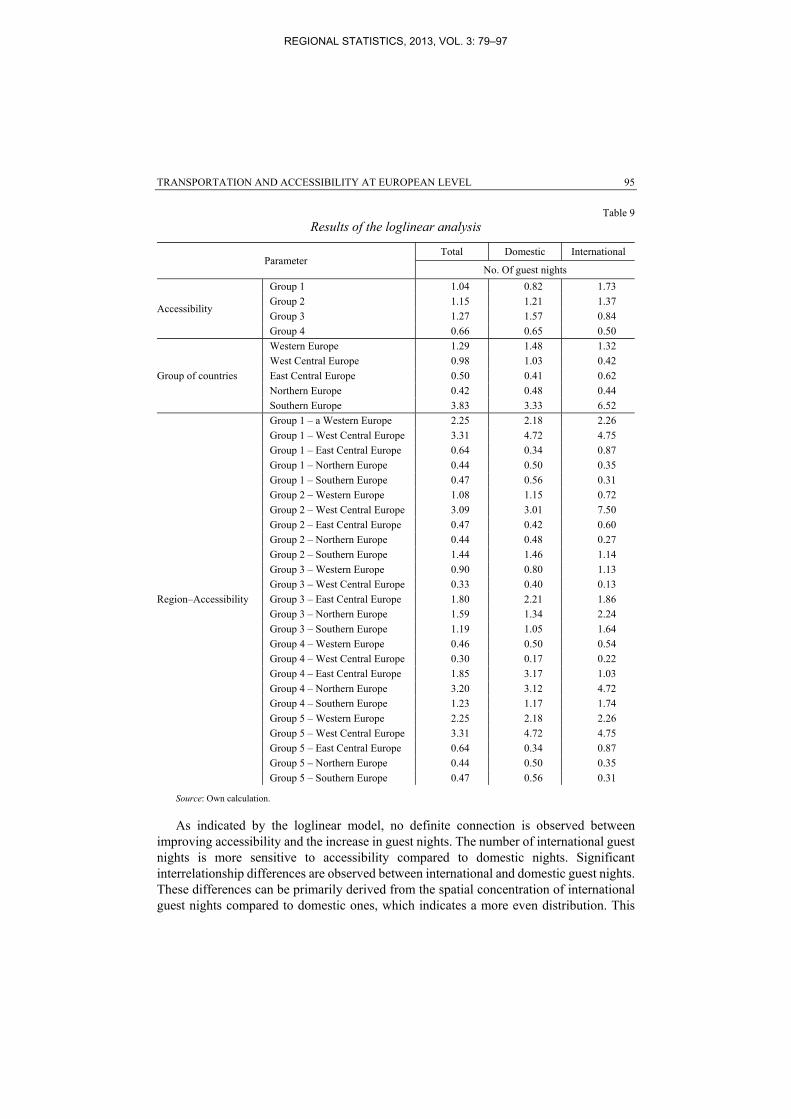
Table 9
Results of the loglinear analysis
Parameter Total Domestic International
No. Of guest nights
Accessibility
Group 1 1.04 0.82 1.73
Group 2 1.15 1.21 1.37
Group 3 1.27 1.57 0.84
Group 4 0.66 0.65 0.50
Group of countries
Western Europe 1.29 1.48 1.32
West Central Europe 0.98 1.03 0.42
East Central Europe 0.50 0.41 0.62
Northern Europe 0.42 0.48 0.44
Southern Europe 3.83 3.33 6.52
Region–Accessibility
Group 1 – a Western Europe 2.25 2.18 2.26
Group 1 – West Central Europe 3.31 4.72 4.75
Group 1 – East Central Europe 0.64 0.34 0.87
Group 1 – Northern Europe 0.44 0.50 0.35
Group 1 – Southern Europe 0.47 0.56 0.31
Group 2 – Western Europe 1.08 1.15 0.72
Group 2 – West Central Europe 3.09 3.01 7.50
Group 2 – East Central Europe 0.47 0.42 0.60
Group 2 – Northern Europe 0.44 0.48 0.27
Group 2 – Southern Europe 1.44 1.46 1.14
Group 3 – Western Europe 0.90 0.80 1.13
Group 3 – West Central Europe 0.33 0.40 0.13
Group 3 – East Central Europe 1.80 2.21 1.86
Group 3 – Northern Europe 1.59 1.34 2.24
Group 3 – Southern Europe 1.19 1.05 1.64
Group 4 – Western Europe 0.46 0.50 0.54
Group 4 – West Central Europe 0.30 0.17 0.22
Group 4 – East Central Europe 1.85 3.17 1.03
Group 4 – Northern Europe 3.20 3.12 4.72
Group 4 – Southern Europe 1.23 1.17 1.74
Group 5 – Western Europe 2.25 2.18 2.26
Group 5 – West Central Europe 3.31 4.72 4.75
Group 5 – East Central Europe 0.64 0.34 0.87
Group 5 – Northern Europe 0.44 0.50 0.35
Group 5 – Southern Europe 0.47 0.56 0.31
Source: Own calculation.
As indicated by the loglinear model, no definite connection is observed between improving accessibility and the increase in guest nights. The number of international guest nights is more sensitive to accessibility compared to domestic nights. Significant interrelationship differences are observed between international and domestic guest nights. These differences can be primarily derived from the spatial concentration of international guest nights compared to domestic ones, which indicates a more even distribution. This
REGIONAL STATISTICS, 2013, VOL. 3: 79–97
96 GÉZA TÓTH – LÓRÁNT DÁVID – LÁSZLÓ VASA
refers to the rather pronounced spatial and accessibility concentration of international guest nights in Europe.
The estimate conceptualised in the null–hypotheses, according to which transport impacts tourism productivity, was proven.
Although the type and strength of the relationship between tourism productivity and the level of services provided by transport can vary when different approaches are applied, the relationship is fundamentally significant and should be included in tourism planning documents.
REFERENCES
Apec tourism working group (2003): Best practices in tourism accessibility for travellers with restricted physical ability Final report, Singapore.
http://www.tc.gov.yk.ca/pdf/accessibility_best_practices_in_tourism.pdf Berzeg, K. (1978): The Empirical Content of Shift–Share Analysis Journal of Regional Science 18 (3): 463–468. Bull, A. (1994): The Economics of Travel and Tourism Pitman Publishing, Melbourne. Carda, J. A. – Colea, S. T.–Humphreya, A. H. (2006): A comparison of the Accessibility and Attitudinal Barriers
Model: Travel providers and travellers with physical disabilities Asia Pacific Journal of Tourism Research 11 (2): 161–175.
Celata F. (2007): Geographic marginality, transport accessibility and tourism development In: Celant A. (ed.) Global Tourism and Regional Competitiveness pp. 37–46. Patron, Bologna.
Chew, J. (1987): Transport and tourism in the year 2000 Tourism management 8 (2): 83–85. Crompton, J. L. (1992): Structure of vacation destination choice sets Annals of Tourism Research 19 (3): 420–
434. Curtis, W.C. (1972): Shift–share analysis as a technique in rural development research American Journal of
Agricultural Economics 54 (2): 267–270. Dusek, T. – Szalkai, G. (2008): Differences between geographical space and time spaces: theoretical
consequences and Hungarian examples 48th Congress of the European Regional Science Association, Liverpool.
Dusek, T. (2003) A gravitációs modell és a gravitációs törvény összehasonlítása (Comparing the Gravity Model and the Law of Gravitation) Tér és Társadalom 17 (1): 41–58.
European Communities (2004): Improving information on accessible tourism for disabled people, Luxembourg http://ec.europa.eu/enterprise/sectors/tourism/files/studies/improving_information_on_accessibility/improving_accessibility_en.pdf
Fotheringham, A.S (1984): Spatial flows and spatial patterns Environment and Planning A 16 (4): 529–543. Fotheringham, A.S (1991): Migration and spatial structure: The development of the competing the destinations
model In: Stillwell, J. –Congdon, P. (eds) Migration Models: Macro and Micro Approaches Belhaven, London.
Fotheringham, A.S. – Brunsdon, C. – Charlton, M. (2000) Quantitative Geography: Perspectives on Spatial Data Analysis Sage, London.
Fotheringham, A.S. (1983): A new set of spatial–interaction models: The theory of competing destinations Environment and Planning A. 15 (1): 15–36.
Füstös, L. (1985) Loglineáris modell kontingencia táblák elemzésére (Loglinear model to analyse contingency tables). MTA Szociológiai Kutató Int., Budapest.
Gee, C.Y. – Makens, J.C. – Choy, D.J.L. (1997): The Travel Industry John Wiley and Sons, New York. Gunn, C. A. (1994): Tourism Planning Basic Concepts Cases Taylor & Francis, Washington. Hale, C.M.–Page, S. J. (1999) Geography of Recreation and Tourism: Place and Space Routledge, London. Hall, C. M (2010): Spatial analysis: A critical tool for tourism geographies. In: Wilson, J. Space Place and
Tourism New Perspectives in Tourism Geographies pp: 1–16. Routledge, London. Hall, C. M. (1991): Introduction to Tourism In Australia: Impacts, Planning and Development Longman
Cheshire, Melbourne.
REGIONAL STATISTICS, 2013, VOL. 3: 79–97

TRANSPORTATION AND ACCESSIBILITY AT EUROPEAN LEVEL 97
Hall, C.M. – Page, J. (2009): Progress in Tourism Management: From the geography of tourism to geographies of tourism – A review Tourism Management 30 (1): 3–16.
Hall, C.M. (2005). Time, space, tourism and social physics Tourism Recreation Research 30 (1): 93–98. Hall, C.M. (2008). Of time and space and other things: Laws of tourism and geographies of contemporary
mobilities In: Burns, P. –Novelli, M. (Eds.) Tourism and mobilities pp. 15–32 CABI, Wallingford. Hall, D. R. (1999): Conceptualising tourism transport: inequality and externality issues. Journal of Transport
Geography 7 (3): 181–188. Halsall, D. (ed.) (1982): Transport for Recreation IBG Transport Geography Study Group, Lancaster. Haynes, K.E. – Fotheringham, A.S. (1990): The impact of space on the application of discrete choice models
Review of Regional Studies 20 (2): 39–49. Houston, D. B. (1967): The shift and share analysis of regional growth: a critique Southern Economic Journal 33
(4): 577–581. Inskeep, E. (1991): Tourism Planning. An Integrated and Sustainable Approach Van Nostrand Reinhold, New
York. Jászberényi, M.–Pálfalvi, J. 2009. Nemzetközi közlekedés és turizmus (International transport and tourism),
Bologna – Tankönyvsorozat, Aula Kiadó, Budapest. Knowles, R. (1993) Research agendas for transport geography in 1990s. Journal of Transport Geography 1 (1):
3–11. Makrí, M.B., (2001): Accessibility Indices. A Tool for Comprehensive Land–Use Planning Proceedings of the
TLEnet 5th workshop, The Nordic Research Network on Modelling Transport, Land–Use and the Environment, Sweden.
Page, S. (1994): Transport for Tourism Routledge, London. Page, S. (1999): Transport and Tourism Longman, New York. Page, S. (2005): Transport and Tourism: Global Perspectives Pearson Education, Harlow. Pearce, D. (1989). Tourist development Longman, New York. Prideaux, B. (1993): Possible Effects of New Transport Technologies in the Tourist Industry in the 21st Century.
The Australian Transport Research Forum 18:245–258. Robbins, D.–Thompson, K. (2007): Guest editorial: Special issue on transport at tourist destinations. Journal of
Transport Geography 15 (2): 80–82. Stevens, B. H. – Craig, L. M. (1980): A critical review of the literature on shift–share as a forecasting technique
Journal of Regional Science 20 (4): 419–437. Thurot, J.M. (1980). Capacité de charge et production touristique CHET, Aix–en–Provance. Thompson, K. – Schofield, P. (2007): An Investigation of the Relationship between Public Transport Performance
and Destination Satisfaction Journal of Transport Geography 15 (2): 136–144. Tóth, G. (2002): Kísérlet autópályáink területfejlesztő hatásának bemutatására (An attempt to represent the impact
of motorways in regional development in Hungary). Területi Statisztika 42 (6): 493–505.
Acknowledgement
The research was supported by the János Bolyai Research Scholarship of the Hungarian Academy of Sciences.
REGIONAL STATISTICS, 2013, VOL. 3: 79–97
Copyright © 2022 FDOKUMEN