National Transportation Safety Board Aviation Accident Final ...
Upload
khangminh22Category
view
0download
0
~ .
"
•;
".I ..
~ ,J
/1 J
HIGHWAY RESEARCH
RECORD Number 56
Pipes, Drainage Structures and Cylinder Pile Retaining Wall
7 Reports
Presented at the 43rd ANNUAL MEETING
January 13-17, 1964
HIGHWAY RESEARCH BOARD of the
Division of Engineering and Industrial Research National Academy of Sciences
National Research Council Washington, D. C.
1964

Department of Materials and Construction John H. Swanberg, Chairman
Chief Engineer Minnesota Department of Highways, St. Paul
CONSTRUCTION DIVISION
R. L. Peyton, Chairman Assistant State Highway Engineer
State Highway Commission of Kansas , Topeka
H. W. Humphres, Vice Chairman Assistant Construction Engineer
Washington Department of Highways, Olympia
COMMITTEE ON CONSTRUCTION PRACTICES- EARTHWORK (As of December 31, 1963 )
H. W. Humphres, Vice Chairman Assistant Construction Engineer
Washington Department of Highways, Olympia
C. J. Downing, Construction Engineer, New Hampshire Department of Public Works and Highways, Concord
W. S. Ekern, Deputy Chief Engineer-Operations, Minnesota Department of Highways, St. Paul
L. F. Erickson, Assistant Construction Engineer, Idaho Department of Highways, Boise
Erling Henrikson, Construction Engineer, North Dakota State Highway Department , Bismarck
J. S. Hill, Assistant Director, Division of Construction, Kentucky Department of Highways, Frankfort
Charles Runnel, Engineer of Road Construction, State Highway Department of Indiana, Indianapolis
J. E. Johnson, Urban Engineer, Virginia Department of Highways, Richmond Charles S. Lundberg, Road Construction Engineer, Michigan State Highway Department,
Lansing William J. Mac Creery, Assistant to the Road Construction Engineer, Michigan State
Highway Department, Lansing J. P. Moss, Moss-Thornton Company, Inc. , Leeds, Alabama Thomas H. F. Norris, Engineer of Construction, Illinois Division of Highways ,
Springfield Lester W. Novinger, Chief, Planning and Design Engineer, Delaware State Highway
Department, Dover Andrew W. Potter, Utilities Engineer, South Dakota Department of Highways, Pierre Charles H. Shepard, Soils Engineer, Ohio Department of Highways, Columbus Edgar H. Stickney, Construction Engineer, Vermont Department of Highways,
Montpelier
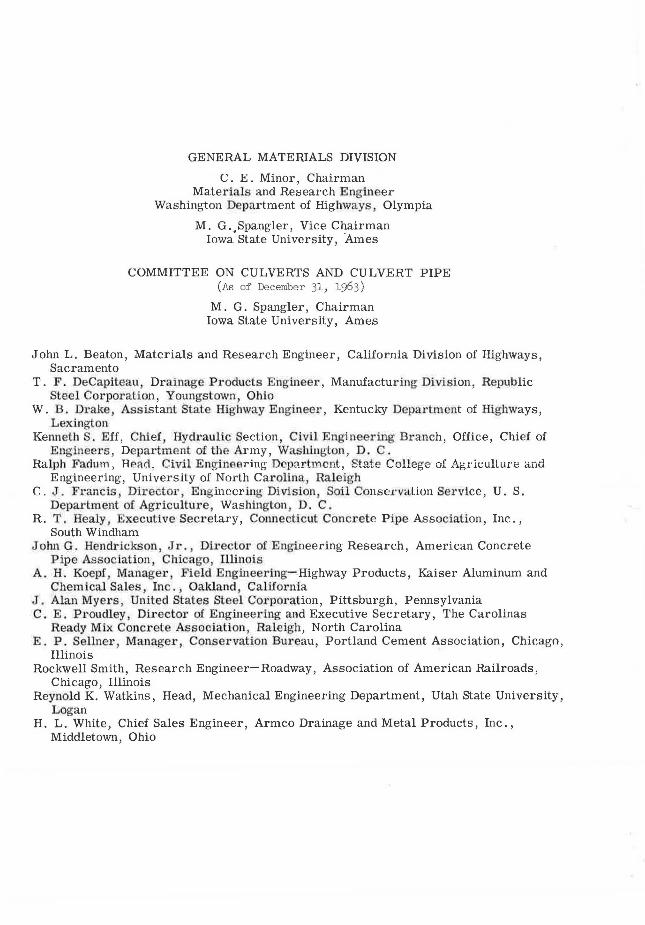
GENERAL MATERIALS DIVISION
C. E . Minor, Chairman Materials and Research Engineer
Washington Department of Highways, Olympia
M. G. Spangler, Vice Chairman Iowa' State University, Ames
COMMITTEE ON CULVERTS AND CULVERT PIPE (As of December 3l, l963)
M. G. Spangler, Chairman Iowa State University, Ames
John L. Beaton, Materials and Research Engineer, California Di vision of Highways, Sacramento
T. F. DeCapiteau, Drainage Products Engineer, Manufacturing Division, Republic Steel Corporation, Youngstown, Ohio
W. B . Drake Assistant State Highway Engineer, Kentucky Department of Highways, Lexington
Kenneth S. Eff, Chief, Hydraulic Section, Civil Engineering Branch, Office, Chief of Engineers, Depar tment of the Army, Washinglon, D. C.
Ralph Farl11rn, Hi:-ar.l , Civil Engin . erin~ Dopurtmcnt, State College of A!!,rkullure and Engineering, University of North Carolina, Raleigh
C. J . Francis Director , Engineering Di vision, Soil Conse1·ve:Llion Service, U. S. Department of Agriculture, Washington, D. C.
R. T. Healy, • xecutive Sec1·etary, Connecticut Concrete Pipe Association, Inc., South Windham
Jotm G. Hendrickson, Jr., Director of Engineering Research, American Concrete Pipe Association, Chicago , Illinois
A. H. Koepf Manager, Field Engineering- Highway Products, Kaiser Aluminum and Chemical Sales, Inc., Oakland CaWornia
J. Alan Myers , United States Steel Co1·poration, Pittsburgh, Pennsylvania C. E. Proudley , Director of Engineering alld Executive Secretary, The Carolinas
Ready Mix Concrete Association Raleigh, North Carolina E. P . Sellner, Manager, Conservation Bureau, Portland Cement Association, Chicago,
Illinois Rockwell Smith, Research Engineer-Roadway, Association of American Railroads,
Chicago, Illinois Reynold K. Watkins, Head, Mechanical Engineering Department, Utah State University,
Logan H. L. White, Chief Sales Engineer, Armco Drainage and Metal Products, Inc. ,
Middletown, Ohio

COMMITTEE ON METALS IN HIGHWAY STRUCTURES (As of December 31, 1963)
Grover LaMotte, Chairman Welding Engineer, Air Reduction Sales Company , Inc.
New York, New York
W. C. Anderson, Chief Research and Development Engineer, The Union Metal Manufacturing Company, Canton, Ohio
John L. Beaton, Equipment Engineer, California Division of Highways, Sacramento Gordon Cape , Manager of Technical Research, Dominion Bridge Company, Ltd.,
Montreal, Canada S. K. Coburn, Research Technologist, Applied Research Laboratory, U. S. Steel
Corporation, Monroeville, Pennsylvania Frank Couch, Welding Engineer, Bethlehem Steel Company, Bethlehem, Pennsylvania John R. Daesen, Director, The Galvanizing Institute, Protomatic, Inc., Park Ridge,
Illinois T. D. Dismuke, Product Engineering Group, Homer Research Laboratories,
Bethlehem Steel Company, Bethlehem, Pennsylvania E . S. Elcock, Bridge Engineer, State Highway Commission of Kansas, Topeka Eric L. Erickson, Chief, Bridge Division, U.S. Bureau of Public Roads, Washington,
D. C. Edward A. Fenton, Technical Secretary, American Welding Society, New York, New
York James H. Havens, Assistant Director of Research, Kentucky Department of Highways,
Lexington G. 0. Hoglund, Alcoa Process Development Laboratories, Aluminum Company of
America, New Kensington, Pennsylvania I. 0. J ahlstrom , Bridge Engineer , Operations, California Di vision of Highways,
Sacramento Ray I. Lindberg, Research Scientist, Metallurgical Research Division, Reynolds
Metals Company, Richmond, Virginia Robert A. Manson, Metallurgist, Bridge Section, Minnesota Department of Highways,
St. Paul Arthur W. Moon , Office of Deputy Chief Engineer , Structures, New York State Depart
ment of Public Works, Albany Robert A. Norton, Bridge Engineer, Connecticut State Highway Department, Wethers-
field J. C. Oliver, Testing Engineer, Alabama State Highway Department, Montgomery D. H. Overman, Columbus, Ohio Joseph W. Pitts, Metallurgist, National Bureau of Standards, Washington, D. C. Melvin Romanoff, Chemist, Metal Reactions Section, Metallurgy Division, National
Bureau of Standards, Washington, D. C. Clyde F. Silvus, Bridge Engineer, Texas Highway Department, Austin Oscar Teitel, Product Engineer, International Pipe and Ceramics Corporation, East
Orange, New Jersey Lewis A. Tomes, Research Associate, Calcium Chloride Institute, Washington, D. C. L. E. Wood, Department of Civil Engineering, Purdue University, Lafayette, Indiana

Contents
SOME EFFECTS OF FABRICATION PRACTICES ON STRENGTH CHARACTERISTICS OF REINFORCED CONCRETE CULVERT PIPE
Robert C. Deen and J. H. Havens. . . . . . . . . Discussion: M. G. Spangler .. . ........ . .
STRUCTURAL CHARACTERISTICS OF REINFORCED CONCRETE ELLIPTICAL SEWER AND CULVERT PIPE
Harold V. Swanson and Mason D. Reed .
STRUCTURAL PERFORMANCE AND LOAD REACTION PATTERNS OF FLEXIBLE ALUMINUM CULVERT
1 25
. ..... 35
H. E. Valentine . . . . . . . . . . . . . . . . . . . . . . . . . 47
INFLUENCE OF WALL STIFFNESS ON CORRUGATED ~ METAL CULVERT DESIGN
R. L. Brockenbrough . . . . . . Discussion: T. F. deCapiteau ...
CYLINDER PILE RETAINING WALL
George H. Andrews and John A. Klas ell
CORROSION PERFORMANCE OF ALUMINUM CULVERT
Thomas A. Lowe and A. H. Koepf . . . . . . . .
ISO-pH MAPS IDENTIFY AREAS DETRIMENTAL TO DRAINAGE STRUCTURE PERFORMANCE LIFE
71 80
..... 83
..... 98
J. C. Oliver and R. D. Palmore ................ 116


So1ne Effects of Fabrication Practices on Strength Characteristics of Reinforced Concrete Culvert Pipe
ROBERT C. DEEN and J. H. HAVENS Respectively, Assistant Director of Research and Director of Research, Kentucky Department of Highways, Lexington
With the recent increase of highway construction activity, it soon became apparent that there was a definite need for knowledge concerning the manufacture, installation, and field behavior of pipe culverts under the higher and higher fills that are used. The study reported in this paper concerns the fabrication practices and their possible relationship to pipe strength, failure of pipe under embankment loads, and the feasibility of repairing or restoring the structural integrity of in-place pipe that have been damaged.
Thirty-three sections of 54-in. diameter, Class III pipe were fabricated and tested so that the following variables could be studied: (a) type of lap used to fabricate cages of reinforcing steel (lapped and tied or lapped and welded), (b) relative position of joints of inner and outer cages of steel in the pipe, (c) position of joints with respect to points of application of the load in the three-edge bearing test, (d) use of reinforced gunite liner for repair purposes, and (e) effect of lateral restraint on load-carrying capacity of the pipe.
Results of the investigation indicate that: (a) the 0. 01- in. crack strengths and ultimate strengths were significantly affected by the three methods used to prepare joints in reinforcing cages; (b) there appears to be no measurable difference in performance of pipe in which joints were spaced 0° apart, 90° and 180° apart; (c) load- carrying capacities were not significantly affected by orientation of joints in the three- edge bearing tests; (d) repairs made on structurally damaged pipe sufficed to restore original load- carrying capacity to the pipe; and (e) rods used to provide lateral restraint appeared to increase load- carrying capacity of the pipe in the same proportion as internal steel.
•UNDERGROUND CONDUITS have been used for hundreds of years for drainage and water supply purposes. With the advent of railway and automobile transportation, the use of underground conduits for drainage purposes beneath the roadways increased greatly. It soon became apparent that there was a definite need for knowledge concerning the manufacture, installation, and field behavior of pipe culverts. Accordingly in the first half of the century, much attention and research has been directed by many individuals and organizations toward the development and establishment of acceptable techniques and specifications for the manufacture and installation of pipe culverts.
Factors governing maximum height of fill, and thus maximum load that may be safel placed over reinforced concrete pipe culverts, are (a) pipe strength, (b) character of
Paper sponsored by Committee on Culverts and Culvert Pipe.
1

2
fill material over the pipe, (c) character of foundation material beneath the pipe, (d) relative settlement of material over the pipe to that of material on either side of the pipe, and (e) method of bedding and installation. In an attempt to provide a method by which one can easily identify a satisfactory pipe with regard to quality and strength, the rather simple and convenient three- edge bearing test has been proposed as ASTM Designation C 76- 59T (AASHO Ml 70- 57). This test method, applicable to concrete pipe up through the 72- in. inside diameter size, is currently being used in Kentucky as well as in many other areas to evaluate the stren~th of a reinforced concrete pipe. A criterion for the installation design of concrete pipe culverts has been developed by the U. S. Bureau of Public Roads in cooperation with the American Concrete Pipe Association and was distributed to the various highway agencies on April 4, 1957, as Circular Memorandum 22- 40, U. S. Bureau of Public Roads. This memorandum is the basis for specifications adopted in 13 states, including Kentucky, to provide for an efficient utilization of rigid pipe by specifying bedding details, methods of installation, and pipe strength required for various heights of fill.
Early experience gained from work on the Interstate Highway System disclosed a need for additional detailed study and understanding of the theory of design, pipe fabrication practices, and construction or installation practices. Investigations of certain aspects of the theory and installation practices have been reported by the Research Division of the Kentucky Department of Highways (1, 2, 3, 4). On November 12, 1959, the Bureau requested the states to furnish annual performance data to evaluate the installation criterion, and according to the Bureau's Circular Memorandum 32- 30, dated October 18, 1962, 34 states are participating in this study and are making annual reports. The study reported herein concerns the fabrication practices and their possible relationship to pipe strength, failure of pipe under embankment loads, and feasibility of repairing or restoring the structural integrity of in-place pipe that have damaged during or soon after construction.
THEORETICAL CONSIDERATIONS
The strength of reinforced concrete pipe is commonly stated in terms of D-load strength, the load in pounds per linear foot of internal diameter. An advantage of the D- load designation is that all sizes of pipe of a given D-load, installed under similar conditions of bedding and backfilling, will support the same maximum height of fill. Reinforced concrete pipe are tested by the three- edge bearing test and are classified according to the D-load that will produce a 0. 01-in. crack of the D-load that will produce ultimate failure.
The three- edge bearing test is a severe test inasmuch as the load applied to the conduit is in the form of point loading and inasmuch as there is no side support applied to the conduit as there would be in the case of a field installation. Under field conditions of loading, the vertical loads applied to the conduit will be distributed over a portion of the conduit rather than concentrated, and side pressures will be exerted on the conduit; thus, under field conditions the conduit may sustain loads which are greater than those indicated by the three- edge bearing test. This fact is accounted for in design by use of a load factor which is the ratio of the strength of a pipe under any stated condition of loading to its strength when tested by the three- edge bearing method. The value of the load factor is greatly dependent on the method in which the conduit is bedded as well as the nature and density of the backfill material.
It is imperative, therefore, that installation of the pipe culvert be in full accordance with the design theory and with the plans . If damage occurs to the pipe, and if full faith is credited to the design procedure, the fault must arise from either poorly fabricated pipe, or improper installation techniques, or negligence in adhering strictly to plans.
If a pipe is damaged, whether the cause is apparent or not, the question inevitably arises as to what resources are available as an alternative to complete removal and replacement; that is, can the pipe be effectively and satisfactorily repaired in place? With regard to this, Paragraph 30 of ASTM C 76- 59T (AASHO Ml 70-60) is cited in full:
Pipe may be repaired, if necessary, because of occasional imperfections in manufacture or accidental injury during handling

3
DISCONTINUITY IN COMPRESSION RING
INTERNAL REINFORCEMENT
COMPRESSION RING PANELS
Figure 2. Concrete pipe with di scontinuity in compression ring .
Figure 1 . Pipe consisting of compression panels and external reinforcement .
and will be ac ceptable i f , in the opinion of t he purchaser, t he repair s are sound and properly f inished and cured and the r e paired pi pe conforms to t he requi rements of t he se specifi cations .
In a most liberal interpretation, the pipe, even though severely damaged, could be acceptable if repaired and restored sufficiently to meet the requirements of- the specification.
The reinforcement steel in a concrete pipe is more or less inactive or passive so long as the pipe is subjected to a uniform radial loading. In this case, the annular shell of the pipe is uniformly in compression. Any unbalance in imposed loads produces tensile stresses in the outer portion of the concrete, and inasmuch as the concrete is inherently weak in tension but strong in compression, the function of the reinforcement is to provide a tensile reactance to the com-pression borne by the concrete . Thus a pipe could be fabricated from individual concrete panels with external steel bands in much the same manner as wood-stave barrels (Fig. 1). It follows then that one or more damaged panels could be replaced and thereby restore the continuity of bearing and compression in the shell.
However, if the shell were cast monolithically about the steel and were then fractured to such an extent that continuity of compressive bearing in the concrete was lost (Fig. 2), it follows that routing of the damaged concrete and replacement with new concrete , even though a high degree of bond was not achieved, should restore the pipe virtually to its original strength (Fig. 3). This idea assumes, of
Figure 3 . Pipe wit h compre s s i on patched and re s t ored.
r ing

4
Figure 4. Failure in bottom of 54-in. culvert under a 53-ft fill; Station 1087+50, I-75-7( 5)160 , Grant County.
course, that the steel is not damaged and that the pipe, when restored, is not critically out- of- round.
Many of the pipe found to be damaged in-place have been deformed considerablyotherwise the concrete shell would have remained intact (Figs. 4 and 5). Rejecting any thought toward jacking in-place pipe back to roundness, the problem at hand involves the degree of collapse to which remedial treatment might be deemed feasible. For instance, if the pipe is elongated horizontally and if the continuity of the shell is restored, the pipe could never be quite as strong as the original round pipe. If the interior of the pipe is also lined to provide an additional compression ring (preferably reinforced), it should be possible to strengthen the pipe to a degree equal to or greater than its original value (Fig. 6).
Of equal importance to the strength of the pipe is the continuity of reinforcement steel. It is assumed that the steel in a damaged pipe may have been stressed to or beyond the yield point, but that it is capable of again withstanding an equal level of stress unless continuity has been impaired. A broken weld or series of welds would therefore be an obvious detriment to strength unless repaired before replacement of concrete in the compression shell. In fact, welds and laps are of considerable interest to this study because of their possible influence on the original strength of the pipe. In manufacture, where two cages of wire are used, it is the usual practice to place the joints 180 deg apart. It follows, therefore, that if the welds or laps are weak and if the pipe is by chance positioned in the three- edge bearing test or in an embankment so that the joints are located at points of greatest bending and highest stresses, strength could be seriously affected-more so than if the joints were randomly orientated.
Aside from the other factors, such as wall thickness and amount and strength of steel which are more closely related to design, the quality of welds or laps in the steel may largely determine D-load strengths. In an older specification ((AASHO M 41- 55), deleted in 1957), the weld was described as follows:

5
Figure 5. Failure in top of 54-in. culvert under a 53-ft fill; Station 1087+50, I -75-7(5)160, Grant County .
If welded, the member at either a welded splice or intersection shall develop a t ensile strength not less than the minimum strength r e quired for the reinforcement .. .
The specifications (AASHO M 170- 60 and ASTM D 76- 59 T) specify: "If the splices are not welded ... ", and the alternative of welding is not subsequently clarified. AASHO M 32- 60, Cold-Drawn Stee l Wire for Con-crete Reinforcement, covers the requirements for the wire to be used in Welded Steel Wire Fabric for Concrete Reinforcement, AASHO M 55- 60 (ASTM A 185- 58 T), which in turn includes a shear-type test for the quality of welds obtained in the manufacture of the fabric (mesh). Apparently none of the existing specifications covers the particular point about welding the mesh to form the reinforcing cage.
Observations of in-place pipe which were damaged structurally to an extent that the welded joints in the steel cage were exposed (in the bottom of the pipe), revealed that some welds (lapped about 1% in., welded on one side) had broken. Welded joints were then clipped from normal production cages and these were tested in tension. Invariably the splice
Figure 6.
ADDITIONAL CAGE OF REINFORCEMENT
Repaired pipe with r e inforced, gunite liner.

6
Figure 7. Joint of inner cages of reinforcement used in Series A and B.
was weake1-o than the wire. It was noted, however, that the break usually occurred at the juncture of the wire and fillet where the weld cut into the wire and reduced the cross- section. Also, due to the eccentricity of the pull about the weld, there was bending of the wire at its juncture with the weld. Although these pull-tests were not realistic or representative of the strength of the joint when encased in concrete, it was apparent that the welds were incapable of withstanding the full tension of the wire.
MATERIALS AND APPARATUS
In an effort to obtain additional information concerning the effects of various pipefabrication practices on pipe performances, the Kentucky Concrete Pipe Company was most cooperative in manufacturing and testing several sections of pipe at the Louisville plant.
Thirty-three sections of Class III pipe, 54 in. in inside diameter by 4 ft in length, were prepared according to the following schedule:
Series A-Four sections, inner and outer cages of reinforcement lapped at least 40 diameters (Fig. 7), laps 180 deg apart.
Series B-Four sections, inner and outer cages of reinforcement lapped at least 40 diameters, laps 90 deg apart.
Series C-Four sections, inner and outer cages lapped approximately 3 in. and fastened with two spot welds (Fig. 8), welds placed 180 deg apart.
Series D-Four sections, inner and outer cages lapped approximately 3 in. and fastened with two spot welds, welds placed 90 deg apart.
Series E-Four sections, inner and outer cages lapped approximately 3 in. and fastened with two spot welds, welds 0 deg apart.
Series F-Four sections, non-reinforced. Series G-Three sections, inner and outer cages lapped approximately 1 Y2 in. and
fastened with one spot weld (Fig. 9), welds spaced 180 deg apart.

Figure 8. Joint of inner cages of reinforcement used in Series c, D and F .
Series H-Three sections, inner and outer cages lapped approximately 1 Y2 in. and fastened with one spot weld, welds spaced 90 deg apart.
Series J -Three sections, inner and outer cages lapped approximately 1 Y2 in. and fastened with one spot weld, welds placed 0 deg apart.
7
The inner cages of reinforcement were made from 3- x 8-in., No. 0 + 5, welded wire fabric. The No. 0 wire (0. 3065-in. diameter) was the longitudinal wire in the fabric and was spaced 3 in. , center-to- center. This is the wire which provides the reinforcement for the concrete pipe. The No. 5 wire (0. 2070-in. diameter) was spaced at 8 in. The outer cage of reinforcement was made from 3- x 8- in. , No. 2 + 7, weldedwire fabric; the No. 2 wire (0. 2625-in. diameter), on 3-in. spacing, provided the reinforcement for the pipe.
All sections of pipe used in this investigation were machine-made, tamped pipe. The four sections of pipe in Series F were manufactured on November 9, 1960, and the 20 sections in Series A through E were made November 10, 1960. The last nine sections, Series G, Hand J, were prepared on November 14, 1960. Test cylinders, 6 x 12 in. , and beams, 3 x 5 x 20 in. , were fabricated from the same concrete used in the pipe.
A Forney testing machine having a capacity of 500, 000 lb, located in the yard of the Louisville plant of the Kentucky Concrete Pipe Company, was made available for loading the pipe. All of the tests were made in this machine.
Figure 10 shows a yoke assembly which was used to restrain selected sections of pipe along their horizontal diameters during the three- edge bearing test. The four different sizes of tie rods used in this portion of the study were (a) uniform diameter of % in.; (b) uniform diameter of % in.; (c) a %-in. rod with a reduced section, 8. 0 in. long x O. 30 in. in diameter, at the middle; and (d) a %-in. rod with a reduced section, 2. 6 in. long x 0. 30 in. in diameter, at the middle. Selected pipe were tested in three-

8
Figure 9. Joint of reinforced cages used in Series G, H and J.
Figure 10. Yoke assembly for providing lateral restraint .

"' "'
50
40
g 30
'tl .. 0
...:i 20
Series A o:pped 40 or more diameters
ncr cage of reinforcement steel
ter cage of reinforcement steel
Pipe A- l Pipe A- 4 Position of Pipe During Loading
0. 01" crack inside bottom -Load removed
\
First crack observed inside bottom
10 irs.t crack observed inside bottom
Change in Vertical Diameter (%)
Figure 11. Load-deformation curves for Series A.
edge bearing and with horizontal restraint to obtain some knowledge of the horizonta l reactance to vertical loading.
9
From the group of pipe which was loaded to failure , a limited number was s elected for repair. To effect the repair, a cage of reinforcement steel was prepared from 3- x 8-in., No. 0 + 4 wire fabric and placed in the broken pipe sections before gunite was applied to a thickness of approximately 2% in.
Reinforced Concrete Pipe
Twenty-five pipe were loaded by the three-edge bearing method in accordance with ASTM C 76- 59 T. Pipe E- 2, as will be shown subsequently (Fig. 26), was tested under a two-point bearing condition. In addition to recording the load required to produce a 0. 01-in. crack and the ultimate load, provisions were also made to record load and changes in diameters throughout the entire test. The changes in the vertical and horizontal diameters were measured by means of extension dials (Fig. 10). The loaddeformation curves obtained from these tests are shown in Figures 11 through 18. At the top of each figure are sketches showing the position of the pipe and the relative locations of the laps in the two cages of reinforcement steel during the test. An examination of these load- deformation curves indicates certain characteristics (Fig. 19) which are essentially the same for all pipe regardless of fabrication and (or) placement of the steel or position of the pipe in the testing machine.
The load-deformation curves are essentially linea r up to the occurrence of the 0. Olin. crack. There is a very slight tendency for the deformation to increase, with little attendant increase in load, when the first crack appears-at something less than 0. 1 percent change in vertical diameter and a load of 13 to 18 kips. This tendency for the curve to flatten seems to be more pronounced after the 0. 01-in. crack appeared-apparently, there was a slight redistribution of stress from concrete to steel. The 0. 01-in. crack typically occurred at a strain of 0.1 to 0. 2 percent and at a load of 18 to 25 kips. The slopes of the curves become flatter as the ultimate load (40 to 50 kips) is reached

10
50
40
P.30 g '"" "' ..3 20
10 •
<ll
P<
50
40
;g.30
'"" "' 0
...:i 20
'""'Bo 0 0 Pipe B-1 Pipe B-3 Pipe B-2 Pipe B-4
PoRition of Pipe D11rine; Loac1ine
Cracks on outside Steel in outer cage started to break both sides
Steel in outer cage started to break both sides
cage started to break Lo~d--,----'i...+· Fir st on right side; then on left side
top
First crack observed inside bottom
First crack observed inside bottom Flrst crack observed inside bottom
I 1Jest ended . r '\..tfl1lalling on inside on right side removed --Load Removed
Spalling 11 I inside ..
both sides J J Spalling on
I. • inside both sides
Change in Vertical Diameter (%)
Figure 12 . Load-deformation curves for Series B.
O'r o spot welds -
Inner cage of 00 011te r cage of reinforcernCent steel reinforcement steel
Series Pipe C-1 Pipe C-3 Pipe C-2 Pipe C-4
Position of Pipe During Loading
Load removed
Change in Vertical Diameter (%)
Figure 13. Load-deformation curves for Series C.

50
40
m p.
630
"' " 0
>-< 20
0 0
50
10
s 0 ~ 0
,lJ
v :;!
00 .s "' v > " v 00
,lJ 0
.;< u
" " u
11
Series D 00 s 0 ~ 0
,lJ
v Pipe D-1 Pipe D-3 Pipe D-4 Pipe D-2
] s Position of Pipe During Loading
.;< u
" " u
Steel in outer cage started to break
'"' on left side :s;-steel in outer cage started to break
• ........_ S t "cl in inner cage started to
0.4
Eirst crack observed inside bottom
Fi rst crack observed inside bottom
0.8 1.2
D-2
z. o Z. •I Z.8
-~l'\. --........ . ~break on right side
I 'Lo ad -..._ Tes ~emoved r Load removed ende d
Cracks o outside P i ~ D- 4 / 5 en right side P 6 on lef: side
6 8 10 12
Change in Vertical Diameter (%)
Figure 14. Load-deformation curves for Series D.
'"'"'E 0 0 Pipe E-2 Pipe E-3 Pipe E-4
Position of Pipe During Loading
CracKs on outside Cracks on outside
5 on left side ·6 on left side T es t ended
\4 on right side Pipe t3 l on right side
/ ·--Test ended
Pipe E-4 ,,>~·Started to shear in top
/-~rted to shear
\ Started to shear in top Cra~ks on "'-..,- - Afte·r applying yolk outside
4 on right side Maintained load and applied yolk 6 on left side
crack inside bottom ~
ir st crack o bserved I inside. bo'ttbm
Reloaded to this point twice
Pipe E-Z
Change in Vertical Diameter (%)
Figure 15. Load-deformation curves for Series E.

12
50
40
10
One
"~:,~:OP>>< G-' Series G
Position of Pipe During Loading
shear Sheared
0 . 01" c rack inside bottom
FU:st crack observed inside bottom
0 . 01 11 c rack inside bottom
irst c rack observed inside bottom
First crack observed inside bottom
9 on right side 6 on left side
Steel in outer cage started to break /just below weld&
spalling on inside
teel in outer cage started to br eak both sides many welds failed spalling on inside
o ~~~ ..... ~~ ...... ~~ ........ ~~-'-~~-'-~~ ...... ~~--'~~--''--~~.._~~.._~~.._~_....._~~ ........ ~~ ...... ~ 0
so
40
0.30
6
0.4 0.8 1.2 1.6 ?,0 2.4 2.8 4 6 8 10
Change in Vertical Diameter (%)
Figure 16. Load-deformation curves for Series G.
Series H 0 Pipe H-1 Pipe H-2 Pipe H-3
Position of Pipe During Loading
12 14 16
Slarlod to shear in bottom .;Shoi1red in top ...--steel in o uter cage started to / Welds of 1nner c~ge broke twisteO break on right side
Started to shear in top ~ '---..._ I /Shea.red top arn!J>otlQl'n. -----Ct'-acka on outside '- ~ ~ -------- 7 on right side
C-- ' _Pipo J:l-3 6 on left side
• ~- ---............ _...,...Steel in outer cage started to break / --~· C~l ended "'-............- on left side spalling on inside
·~- Test ende Wel ds on inner cage broke ~rest end(!d
twisted Cracks in outside Sheared in boltom 5. 5 on e ach side Cracks on outside - 6 on each side
~ 0 . 01 11 crack inside bottom
First crack observed inside bottom
Fi..rst crack observed inside bottom
First crac: observed in-Side bottom
Steel in outer cage started to break on right side
Change in Vertical Diameter (%)
Figure 17. Load-deformation curves for Series H.

50
40
13
Series J 00 Pipe J-1 Pipe J-2 Pipe J -3
Position of Pipe During Loading
Sheared in top----.
Started to shear >L'~
in top / " --· ==--' or=:= ..2.S:.: ,F 'cracks on outs.1de ..._____ .rt. ·-,.....;.;\
5. 5 on right side Cracks on outside 6 on l eft si d e 5 on each side Pipe J -3
Steel in oute r cage. s tarted to break J on right side .ep alling on inside
Test ondc
Sbnarcd in bottom
Stool in outer in outer cage started to break both sides spalling on inside
\ "\.· i rst crack observed inside bottom "First c rack obkerved inside bottom
Fi ·rst crack observed inside bottom
Test ended
60
50
30
20
10
Change in Vertical Diameter (%)
Figure l8. Load-deformation curves for Series J.
Shearin of conc.rc t j w (top nnd or bo t tom) (Fig. 20)
. /~· /~
/ . ,"/ i ,"/
·?(/--~-.!/. 0 . Ol 11 crack
Jslde botto
First crack inside bottom)
carried b s teel reinfor ccm n
Breakin of s t ~cl ln oul r cage on horl2ontn1 dinmct1;r ( Fig. 21 )
··-- ' --- ' - ... -. __ ,_&_4.--.J.__:.. __ ,. - -~ . ~ ·-·-·-- ..............
2
~~..... a ll conditions -·- ·-! ~ ~-........ 'f Typical curve for
.,,,," "'-
3
· , \ '"'::- Singl e weld ........ \ . . \ "·
'-,;.· -·-'-,..._._ --=·--· '>. '4-:: Lnpped
' Two welds
S allin of on inside on horizontal diameter (Fig; 22)
6 9 ll
Change in Vertical Diameter (%)
Figure l9. Typical load-deformation curves .
at strains of 0. 6 to 1. 5 percent. The pipe in Series A and B (steel lapped 40 diameters and tied) appear to have reached the ultimate load at smaller deformations, 0. 6 to 1. 0 percent, and therefore gave steeper curves than pipe in which the steel was welded.

14
Figure 20 . Shear-type failure in top of pipe.
Soon after the ultimate load was reached, the concrete at the top and (or) bottom began to shear (Figs, 4, 5 and 20) . There was a slight decrease in the load at this point
and thereafter the load remained r ather constant to
TABLE l
SUMMARY OF TEST RESULTS ON PIPE TESTED IN THREE-EDGE BEARING
Pipe No.
A-1 A-4 B-1 B-2 B-3 B-4 C-1 C-2 C-3 C-4 0-1 D-2 D- 3 D-4 E-2 E-3 E-4 G-1 G-2 G-3 H-1 H-2 H-3 J-1 J-2 J-3
0. 01-In. Crack
Load D-Load (kips) (lb/ sq ft)
23 1, 278
28 1, 556
30 1, 667
28 1, 556 27 1, 500 20 1,111 25 1,389 32 1, 778 24 1, 333 26 1,444 25 1, 389
24 1, 333
29 1, 611
20 1, 111 25 1, 389
21 1, 167 21 1, 167 21 1, 167
Ultimate
Load D-Lcad (kips) (lb/ sq ft)
37 2,056 46 2, 556 44 2,444 47 2, 611 46 2, 556 47 2, 611 47 2, 611 47 2, 611 43 2, 389 44 2, 444 45 2, 500 41 2, 278 48 2, 667 46 2, 556 43 2, 389 46 2, 556 44 2,444 50 2, 778 43 2,389 47 2, 611 43 2, 389 43 2, 389 45 2, 500 41 2, 278 47 2, 611 43 2, 389
Date
Manufactured
11-10- 60 11-10-60 11-10- 60 11-10- 60 11 10 60 11- 10- 60 11-10- 60 11- 10- 60 11- 10- 60 11- 10- 60 11-10- 60 11- 10- 60 11- 10- 60 11-10- 60 11-10-60 11-10-60 11-10- 60 11-14- 60 11-14- 60 11-14- 60 11-14- 60 11-14- 60 11- 14- 60 11-14-60 11- 14- 60 11-14-60
Tested
12- 8- 60 5-11- 61 12- 8- 60 5- 11- 61 5 11 61 5- 11- 61 12- 8-60 5- 11- 61 5-11- 61 5-11- 61 12- 8- 60 5-11- 61 5-11- 61 5-11- 61 5-25-61 5-25-61 5-25-61 12- 8- 60 5- 25-61 5- 25- 61 5- 25- 61 5- 25-61 5-2 5-61 5-25-61 5- 25-61 5- 25- 61
strains of 2 . 7 to 6 percent. At deformations of this magnitude the steel started to break in the outer cage about midway up the sidewalls (Fig. 21). Very soon after the steel began to fail, the load decreased rapidly as the stresses transferred to the inside portion of the wall arn.l cau8ed cumpressi ve failure of the concrete (Figs. 4 and 22). It may be noted from the load-deformation graphs that pipe not sufficiently loaded to break the steel recovered approximately 50 percent of the strain upon unloading, and that those in which the steel had been broken regained only about 15 percent of the strain.
Other pertinent data from these tests are summarized in Table 1.

15
Figure 2l. Broken steel in outer cage of reinforcement .
Figure 22. Compressive failure of inner portion of concrete wall.

16
Figure 23 . Non-reinforced concrete pipe under test .
TABLE 2 Non-Reinforced Concrete Pipe SUMMARY OF TEST RESULTS ON NON-REINFORCED
CONCRETE PIPE (Series F)
Ultimate Date Load D-Load
Pipe No.
(kips) Manufactured Tested
F-1 F-2 F-3 1
F-4
16. 5 26. 0 23 .0 22. 0
919 1,440 1,280 1,220
11-9- 60 11-9- 60 11-9-60 11-9-60
1Maximum vertical deflection less than Ya in ,
12-6- 60 7-18- 61 7-18- 61 7-18- 61
Four pipe (Series F) fabricated with no reinforcing steel were broken in the threeedge bearing test (Fig. 23). The results of these tests are summarized in Table 2.
Repaired Pipe
Three pipe (C-3, E-2, and J-2) were used for this portion of the study. These pipe were first loaded in the three- edge bearing, us described previously, to obtain damaged pipe. The results of these loading
tests were given in Figures 13, 15and18-which indicate the extent of structural damage before repair was attempted. To effect the repair, a cage of reinforcement was placed in the damaged pipe and gunite was applied and permitted to cure. After repairs had been completed, the pipe were again loaded by the three-edge bearing method.
The cages of reinforcing steel used in the repair work were fabricated from 3- x 8-in. , No . 0 to 4 wire fabric. The cages for pipe C- 3 and pipe J- 2 were prepared from a single section of the wire fabric; the joints were lapped approximately 3 in. and were joined by a single weld on each strand of wire. The cages were positioned in the damaged pipe and a clearance of about 1 in. was maintained between the wire and the wall of the pipe by clipping and bending portions of the No. 4 wire. The cage of pipe E-2 consisted of two semicircular sections of wire fabric lapped approximately 3 in. and spliced together with two spot welds on each strand of wire. The clearance between the wire and the pipe wall was maintained with 1- in. mortar cubes.

17
Figure 24. Close-up of gunite repair .
TABLE 3
SUMMARY OF TEST RESULTS ON REPAIRED PIPE
Ultimate Date Pipe No. Load D-Load Manu- Initial Repaired Tested (kips) (lb/sq ft) factured Testing
C-3 90 5,000 11-10- 60 5-11- 61 6-13- 61 7-18- 61 E-2 1121 6,222 11-10-60 5-25-61 6-13-61 7-18-61 J-2 94 5,222 11-14-60 5-25-61 6-13- 61 7-18- 61
1Yoked to prevent rebound.
The proportioning of the material used to prepare the gunite was three parts sand, two parts cement, and water as needed to obtain the desired consistency. The total quantity of materials used for repair of the three pipe included seven bags of portland cement and 30 gal of water . Approximately 300 lb of material was lost through rebound . The gunite was applied to a thic.kness ranging between 2% in. and 3}'2 in . The gunite was applied first to the sides of the pipe, then to the top and finally to the bottom after removing rebound material with compressed air (Fig. 24). Gunite work was done on June 13, 1961, by a Department of Highways' maintenance crew.

18
Figure 25. Repaired pipe E-2 .
Special provision was made to prevent pipe E- 2 from rebounding; or recovering its circular shape after it had been loaded beyond its ultimate strength. At the conclusion of the initial loading test, the yoke assembly (Fig. 10) was placed on the pipe to hold it in its collapsed shape until it could be repaired and retested. Figure 25 shows pipe E- 2 after it had been repaired and at the time of retesting.
The load- deformation curves for the gunite- repaired pipe are shown in Figures 26 through 28. It is noted that this type of repair is more than adequate to restore structural integrity to the pipe. Table 3 summarizes some data obtained in this portion of the study. Figures 29 and 30 show a repaired pipe before and after the loading test.
Laterally Restrained Pipe
To determine the effects of lateral restraint (lateral resistance) on the load- carrying capacity of pipe, pipe A-2, A-3 and E-1 were laterally restrained by the yoke assembly (Fig. 10) and were then loaded. The load-deformation curves resulting from these tests are shown in Figures 31 to 33.
Even though the lateral restraint was applied by a rather critical, two-point bearing, the load-carrying capacity was increased 150 to 260 percent . When the %-in. diameter tie rods or the tie rods having the reduced section were used, this increase was 150 to 180 petcent, and when the %-In. diameter tie rods were used in the yoke assembly, the increase in ultimate load was 230 to 260 percent.
The overall slope of the load- deformation curves was somewhat steeper when the lateral restraint was applied than when the pipe was not restrained. The first crack observed in these restrained pipe was at a load of approximately 20 kips and a strain of less than 0.1 percent; the 0.01-in. crack occurred at loads of 25 to 30 kips and strains of 0.1 to 0.15 percent. Table 4 summarizes some of the data obtained from these tests.

100
90
80
70
60
30
20
10
-, ' f"lakinH off of RU~i t:s---,
Test ended>
~.F'i.r :ii t crack observed inside bottom First crack observed inside top
Pipe C-3
Position of Pipe Du.ring ~t:Jdin
O '-~~"-~~'--~~"-~~~~~"-~~'--~~'--~~.._~__, ·o
Figure 26.
110
100
90
80
70
-; 60 g "' ~ 50 -1
40
30
20
10
0.4 0.8 1.2 1.6 2.0 2.4 2.8 40 6.0
Change in Vertical Diameter (%)
Load-deformation curve for repaired pipe C-3·
',i.,,
\ I I I
Steel in inner cage started to _j' break Gunite spalling on nside \
\
Test ended~
1-... l't'B t crack observed in inside top
Pipe E-2
Position of Pipe
0 ._~~"-~~"-~--'~~--'~~--'~~--'D~u-r_ln~c"'"-L-o_n_d_i~. ~s'--~J 0 0.4 0.8 1.2 1.1. 2.0 2.4 2.8 40 11.0
Change in Vertical Diameter (%)
Figure 27. Load-deformation curve for repaired pipe E-2.
19

20
100
90
80
Started to tlhear
70 Stee l in inner cage started to br- ~ k,------.....;::~...._lcs t ended
.l:i""ll"st c rac k obs e rved inside bottom o;-60
g ~ 50 0 ~
40 Pipe J -2
30
20
10
Position of Pipe -Dur1n Londlng
OL-~-'-~~-'-~--'~~-'-~~-'-~--'~~-"-~~-'-~-:'
o o.4 a.e i.2 i.6 z.o z.4 z.s 4.0 6.o Change in Vertical Diameter (%)
Figure 28. Load-deformation curve for repaired pipe J-2 .
Figure 29. Repaired pipe before testing.

Figure 30. Repaired pipe ai'ter testing .
TABLE 4
SUMMARY OF TEST RESULTS ON LATERALLY RESTRAINED PIPE
0. 01-In. Crack Ultimate Date Pipe
No, Load D-Load Load D-Load (kips) (lb sq/ft) (kips) (lb sq/ft) Manufactured Tested
A-2 25 1,389 74 1 4, 111 11-10- 60 5-9- 61 1052 5,833
A-3 25 1,389 68 3 3,778 11-10- 60 5-9- 61 1042 5,778
53 4 2,944 E-1 30 1,667 61 5 3,389 11-10-60 12-20-60
93 2 5, 167
1 Tie rods having r~uced sections 2.6 in. in length, 0.30 in. in diameter . zTie rods 3
/ 4 -in. W'liform diameter. 3 Tie rods having reduced sections 8 in. in length, 0.30 in. in diameter. 4 No lateral restraint. 5 Tie rods 3
/ 8 -in. rmifonu diameter.
21
The ultimate load data summarized in Table 4, as well as those contained in Tables 1 and 2, are presented in graphical form in Figure 34. The sums of the areas of steel in the internal reinforcement and in yoke-assembly tie rods have been plotted as a function of the ultimate loads obtained in the bearing tests. A similarity is noted here in the linear relationships apparent in these data and in those presented by the American Concrete Pipe Association (5); that is, the additional area of steel contained in the yokeassembly tie rods increases the load- carrying capacity of the pipe in much the same manner as if this steel had been included in the internal reinforcement. Also, the ulti-

22
110
-Test ended
1 00
90
80
70 :J/4'' wnform tie rods used for lateral r e stra int
Figure 31. Test results for pipe .. IJ .. -2: (l) restrained by four 0.30-in. diameter, 2.6-in. long, reduced-section tie rods; loaded to failure of reduced section and then unloaded; and (2) restrained by four 3
/ 4 -in. uniform-diameter tie rods and loaded to ultimate. Both sets of tie rods elongated (yielded); elongation was concentrated in reduced section in first test condition; uniform rods elongated uniformly throughout
60
'g 40 0
....i
30
20
10
Pipe A-2
Position of Pipe During Loading
their full length.
O ~O~---:Q~4,--~7Q~8....;_--,l~.Z~~~l.~6---:~-Z~O~~~Z-4~~Z~8~~-'-~~~6
Change in Vertical Diamete r (%)
Figure 32. Test results for pipe A-3: (1) restrained by four 0.30-in. diameter, 8-in. long, reduced-section tie rods; loaded to ulti1llatc and then unloade d; (2) restrained by four 3
/ 4 -in. uniformdia.meter tie rods; loaded to ultimate and then unloaded; and (3) loaded to ultimate
without lateral restraint.
110
100
9
8
7
v; .!:l- 6 d
10
/ Loaid removed
'3/411 uniform tie rods used for lateral
----; I I I I I
"' ~ restraint
~-"'"' ~" "~ "'"' "- Load ~ " .E ~ " •@
~ ~
" I
I I
I I I
I
I
I Steel in outer case started to break
/ spal~~ I _,,/ Test e nded I / /
I /
/,:.:~.O .,.0
l OBDeam Pipe A-
3
/ I no late ral
/ / restraint
/; // PositlQn of Pipe I D=mgL=~~ I 0o'--~70~.~4~-Q-'-a~--,1~.2~~-1.~6~~~z~o~~z~4~~-z~s~~~4-o~---'~o
Change in Vertical Diameter (%)
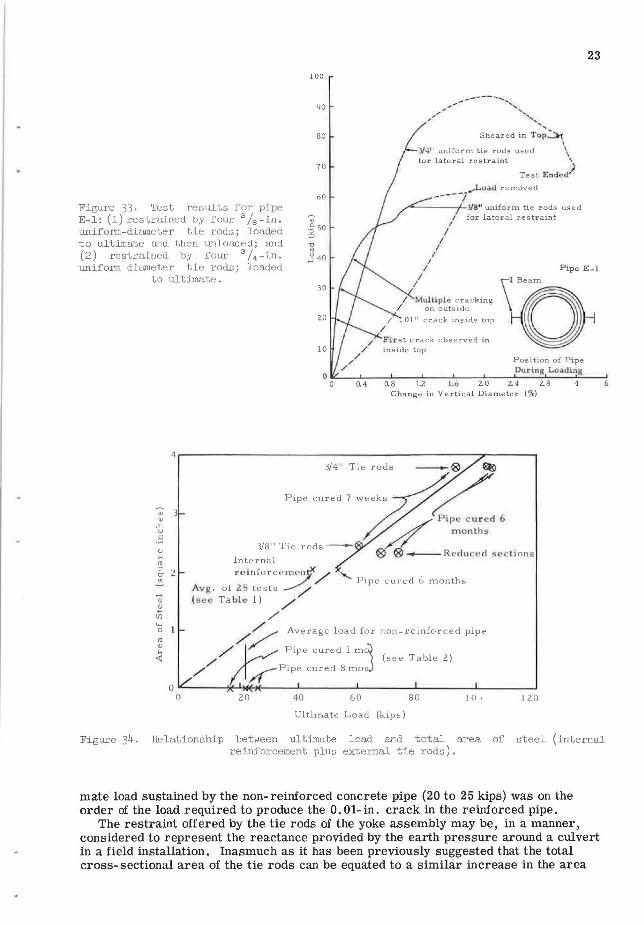
Figure 33 . Test results for pipe E-l: (l) restrained by four 3
/ 8 -in. uniform-diameter tie rods; loaded to ultimate and then unloaded; and (2) restrained by four 3
/ 4 -in. uniform diameter tie rods; loaded
to ultimate .
100
90
80
70
oO
30
20
10
-----, ,,.,,.- ... , ..... ,,,,,," ' .........
Sheared in T;;~
----7
I
\ '
Test Ended)
.,Load removed
/0--- -1-'J/8" uniform tie rods used for lateral res tr aint
23
Pipe E-1
E'i"rst crac:ic observed in inside top
Position of Pipe
0 1o<..-....L..--'----'----'---'---~D-ur_ln~g:.L-L_oa_d_ln~g"---'
'" J "' ..<:; u
.5 "' ... "' " 2 er '"
..... "' 2l
(/)
'>-< 0
"' <1)
... <t:
0 0
o o.4 o.8 12 1.0 z.o z.4 2.8 4 Change in Vertical Diamete r (o/o)
3/4" Tie rods - ® -
Pipe cured 7 w~ob v Internal
1• ei nfor cl!7m~nd</ '
/ / P ip · cur d 6 fl months
® @-Reduce d sec ti ons
Pipe cured 6 months Avg. of 25 t ests / (s .., Table 1) /
/ /~ Average load for non-reinforced pipe // v Pipe cured 1 m~ (see Tabl e 2) / /1 £ Pipe cured 8 mos5
20 40 60 80 l O·• 120
Ultimate Load (kips)
6
Figure 34. Relationship between ultimate load and total area of steel (internal reinforcement plus external tie rods).
mate load sustained by the non-reinforced concrete pipe (20 to 25 kips) was on the order of the load required to produce the 0. 01- in. crack in the reinforced pipe.
The restraint offered by the tie rods of the yoke assembly may be, in a manner, considered to represent the reactance provided by the earth pressure around a culvert in a field installation. Inasmuch as it has been previously suggested that the total cross- sectional area of the tie rods can be equated to a similar increase in the area

24
of internal reinforcement, it may be inferred that lateral earth pressures on the pipe culvert can also be related to an equivalent area of internal reinforcing steel-that is, the resistance of the soil to lateral deformations is analogous to diametrical reinforcement. Thus, compaction of backfill contributes to the load- carrying capacity of a pipe in much the same way as internal reinforcing steel.
SUMMARY OF SIGNIFICANT FINDINGS
The prLric ipal findings r eg3.rdir1g the fabrication and location of j oi..J.ts in the rein-forcing steel are summarized as follows:
1. The 0. 01- in. crack strength and the ultimate strength are not significantly affected by the three methods used to fabricate joints in the reinforcing cages. Data indicate that there is very little difference in the overall performance of pipe prepared with: (a) lapped-and-tied joints (Fig. 7), (b) double-welded joints (Fig. 8), and (c) single-welded joints (Fig. 9).
2. With regard to the relative positions of joints in the outer and inner cages of reinforcement, there appears to be no measurable difference in the performance of pipe in which the joints are spaced: (a) 0 deg apart, (b) 90 deg apart , and (c) 180 deg apart.
3. The load- carrying capacities of the pipe fabricated for this investigation were not significantly affected by location of joints in the three- edge bearing tests. Pipe oriented with their joints in the most critical location (points of maximum bending, that is, four cardinal points) performed as satisfactorily as those pipe in which joints were located in more favorable positions.
The findings from the other phases of study are summarized as follows:
1. The ultimate loads withstood by non- reinforced concrete pipe were approximately equal to the load required to produce the 0. 01-in. crack in the reinforced pipe.
2. The repairs, which were made on structurally damaged pipe, with reinforcedi;unite inner linen:;, sufficed to restore origL11al load- carrying capacity to the pipe.
3. Steel in tie rods used to provide lateral resistance (horizontal reactance to vertical loading) appeared to increase the load- carrying capacity of pipe to the same extent that an equal amount of internal reinforcement would have provided.
These findings have already proved to be of value and suggest additional areas of study. Committee C-13 of ASTM approved the following revision to C76 in 1962 (AASHO Committee on Materials subsequently approved a revision of Ml 70 to conform to ASTM C76-62T):
When splices are welded and are not l apped t o the minimum requirements above , pull t ests of representative specimens shall devel op at l east 75 per cent of the minimum specified s trength of the steel.
ThP. appa.rP.nt rP.lationships between the action of external, horizontal tie steel and the action of internal reinforcing steel may engender further study and lead, perhaps, to more meaningful relationships between passive earth-pressures and the ability of D- strength pipe to withstand fill loads.
REFERENCES
1. Taylor, R. R., "Performance of a Reinforced Concrete Pipe Culvert with Standard and B1 High Fill Bedding Under Rock Embankment." HMRL (Aug. 1961).
2. Deen, R. C., and Hughes, R. D., "Performance Survey of Reinforced Concrete Pipe Culverts." HMRL (March 1961).
3. Hughes, R. D., "Second Annual Performance Survey of Reinforced Concrete Pipe Culverts." HMRL(Feb. 1962).
4. Hughes, R. D., "Third Annual Performance Survey of Reinforced Concrete Pipe Culverts." HMRL(Jan. 1963).
5. "D-Load Design and Tests of Concrete Pipe-1956." Tech. Memo., Amer. Cone. Pipe Assoc. (Oct. 1, 1957).

25
Discussion M. G. SPANGLER, Research Professor of Civil Engineering, Iowa State University, Ames-The authors have included some appropriate suggestions relative to the repair in situ of reinforced concrete pipes which have suffered structural damage due to earth overburden load. The writer has had an opportunity to investigate a number of pipelines which have been damaged and would like to add his experiences, opinions, and recommendations for repair work to those expressed by the authors.
When a reinforced concrete pipe is subjected to earth loading and visual evidence of structural effect appears, such evidence can be roughly divided into three stages or categories. The first stage is the appearance of fine hairline longitudinal cracks in the concrete surface in the invert and later in the crown of the pipe. As the load increases, the cracks open wider and become more plainly visible, and additional cracks, roughly parallel to the first, may develop. These cracks are caused by bending moments produced in the pipe wall by vertical load and reaction. Similar cracks may develop in the outside surface of the pipe at the springings, because bending moments at these locations are in the opposite direction from those at the top and bottom. They, of course, are not visible from the inside of the pipe.
If the load continues to increase, a second stage of visible damage frequently develops. This is a "slabbing" or "spalling" of the protective cover of concrete over the reinforcing steel at the invert and/ or the top of the pipe. This action is caused by the fact that as the pipe deforms under load-the vertical diameter shortens and the horizontal diameter lengthens-the inner cage of steel has a tendency to change shape faster than the more rigid concrete wall in which it is embedded. This causes radial inward forces to be exerted against the protective cover of concrete, which is thereby stressed in direct tension (Fig. 35a). These tensile stresses produce the spalling effect. Similar spalling in the tensile zones on the outside of the pipe at the springings does not develop, inasmuch as the radial stresses in these areas are directed inward toward the central core of the wall rather than toward the relatively thin protective cover, as is the case at the bottom and top on the inside of the pipe.
A preliminary or incipient phase of spalling is the development of rupture of the protective cover of concrete along a circumferential surface at the inner cage of reinforcement. This rupture surface may not be visible from the inside of the pipe, but can be identified by tapping lightly on the pipe wall with a ball peen hammer. Areas thus affected will yield a hollow sound under the hammer. A circumferential rupture surface at the end of a pipe is shown in Figure 36.
This spalling action can be prevented or greatly inhibited by incorporating radial ties in the pipe wall at the top and bottom during manufacture as shown in Figure 35b. The function of these ties is to hold the inner cage of steel in position and prevent its displacement toward the center of the pipe, thus eliminating the tendency for radial stress damage to the concrete cover.
A third stage of structural damage may develop in extreme cases of overloading. This stage is characterized by relatively
Radial fies af l<>p onr.I ho/lorn i'1hibif- IN>dtm<y for con<0rd11 lo spa/I.
Figure 35 .

26
Figure 36 . Incipient spalling stage II damage. End vie•..r of circumferential crack in protective cover over reinforcement.
large changes in the vertical and horizontal diameters; by the development of shear and diagonal tension failures in the concrete, especially in the bottom of the pipe; and by compression failure of the concrete on the inside surface along longitudinal elements at the spring lines. A pipe which has reached this stage has lost much of its inherent strength as an elastic ring. It has become essentially a 4-hinged ring which depends almost wholly on the passive resistance pressure of the enveloping soil for maintenance of its shape and ability to carry vertical load.
Cause of Structural Damage
Structural damage to the extent indicated in the several stages previously described is frequently brought about by one or both of two details of construction in connection with installation of the pipes. One of these is the excavation of a trench to a width substantially in excess of that assumed in the design of a ditch conduit. The load on a pipe in a trench is very sensitive to the width of the trench at the elevation of the top of the pipe. If for any reason the installer elects to increase this width, he should make sure that the pipe is sufficiently strong to support the additional load. On one project involving a 24- in. pipeline, the design width and the specified width of trench was 48 in. The tr-ench was actually dug 56 in. wide in some areas and 62 in. in others. This increased the load on the pipe by approximately 25 and 46 percent, respectively. The factor of safety used in design was not large enough to absorb these increases in load, and the sewer was in trouble.
Another frequent cause of structural distress is failure to obtain a good quality of bedding during construction. The function of the pipe bedding is to distribute laterally the upward reaction on the bottom of the pipe. The greater the width of reaction distribution, the less will be the bending moment in the pipe wall and the greater the loadcarrying capacity of the pipe, other factors being equal. For example, suppose two similar pipes are subjected to vertical loads which are distributed uniformly over the top 180 deg. If the quality of bedding on one of them is such that the bottom reaction is uniformly distributed over 60 deg of arc, the maximum bending moment in the pipe wall (neglecting lateral pressure on the pipe) is
0.189Wcr (1)

27
in which
W c = load on pipe, plf; and r = mean radius of pipe, ft.
In contrast, if the bottom reaction is uniformly distributed over a narrower width of 10 deg, the bending moment is
0.272 Wcr (2)
This represents a reduction of 30 percent in pipe strength due simply to the reduction in width of reaction distribution from 60 to 10 deg. In other words , a pipe on a 60-deg bedding is about 1.4 times as strong-that is, it will carry 1.4 times as much earth load as if it were supported on a bedding 10 deg wide.
Marston recognized the influence of bedding width on the strength of pipes in the ground. His earliest definitions of "Ordinary Bedding"-Class C- and "Firs t Class Bedding"- Class B- called for shaping the s oil at the bottom of an excavation to fit the contour of the pipe to get good reaction distribution. "Impermissible Bedding"- Class D-was the term used to designate the situation where a pipe is laid directly on a flat bed of soil with no effort made to shape it to the pipe contour, and as the name implies, this type of installation was not recommended. If pipes are laid on a flat bed of soil, it may be necessary to use a higher strength of pipe to insure that the load will be carried satisfactorily.
Obviously it takes time and requires careful workmanship to shape the soil to obtain a good bedding and good reaction distribution. Sometimes, contractors install a pipe on a flat bed of soil and then attempt to get satisfactory bedding by compacting the soil beneath the lower haunches of the pipe, but this procedure is not always successful. Two pipeline installations in which this method of bedding pipes was employed and which the writer has recently had an opportunity to study are described.
The first of these was in a region of "fairly stiff glacial till." The installation procedure was to blade this natural soil to flat surface at an elevation approximately 1 in. below the grade of the bottom of the pipe. A layer of pit run, fine sand was spread on the soil and brought to grade and the pipe installed on the sand layer. Next, sand was placed alongside the pipe up to the spring lines and allowed to take its angle of repose. Job site soil was then bladed up at the sides of the pipe adjacent to the sand and compacted by the wheels of a maintainer operating parallel to the pipeline. The wheels were run as close to the pipe as possible. Laterally beyond the width of the maintainer the soil was compacted by sheepsfoot roller. Figure 37 shows the installation procedure.
In the second case, the natural soil was a sandy material which was sufficiently dense and had enough cohesion to enable it to stand temporarily on a fairly steep slope.
Job slfe sc>i/ Job site soil
compacted by mC1inforiwr wheels
~~~~;'l0'/~W1""7'1~_,.~~~~!li"i~"' ~ ~ ' ·,,-Min. --Graded svrhce of
n<7furLfl ffround
Figure 37 . Pipe bedding.

28
Soil t:f>mpae:l«d w/fh 1
'J-ramp"etuiflm~nt /0/_/ pcf
.Soil in a1.ws A -A "very faose!y compgc/ed"
Figure 38. Pipe bedding.
0/08.4;xl
The pipes were installed on this compact material at the bottom of the excavation, which was not shaped to fit the contour of the pipe. Backfill was placed under the haunches and alongside the pipe. The soil at the sides was compacted in layers by means of mechanical equipment which had a tamping face about 12- x 18- in. in area. Tamping was carried out in a vertical direction only, with no special effort made to compact soil in the triangular areas below the springlines.
Both of these pipelines developed evidence of stage I structural effect and a limited amount of stage II effect. In the second case described, several sections of pipes were removed and the backfill soil and bedding of the pipes were examined. Measurements of soil density above and at the sides of the pipes indicated good quality compaction. Also, a density measurement in the bedding directly beneath the longitudinal centerline indicated a compact supporting material in this region (Fig. 38). However, the backfill beneath the lower haunches of the pipe was described by the engineers who observed the removal of the pipe as "very loosely compacted."
Obviously, in both these cases the bottom reaction was concentrated over a relatively narrow longitudinal element. ThiR P.ausP.d thP. dP.vP.lopmP.nt of relatively high bending moments and the resulting structural damage to the pipe.
When pipes ilre installed on a flat bed of soil, as previously described, special care and effort must be exercised to obtain good quality compaction of backfill in the critical areas beneath the lower haunches of the pipes. It must be reaiized that compaction of soil in the vertical direction does not spread laterally. The soil under the haw1ches must be specifically and thoroughly compacted; otherwise these areas will not be capable of providing satisfactory distribution of the bottom reaction on the pipe. A much better procedure, one which will produce more positive and reliable results, is to shape the bedding material to fit the contour of the pipe. The objective of obtaining a wide distribution of the upward reaction should be kept constantly in mind during construction.
Another circumstance which may lead to difficulty due to concentration of the reaction, is the presence of bed rock or other highly compact and unyielding material at a shallow depth beneath the bottom of a pipe. There should always be sufficient bedding material of a yielding character to prevent approach to a strain- resistant stratum as the pipe settles normally under vertical load. This bedding material should be such that the pipe can "nestle down" and develop good reaction distribution.
Repairs
It is feasible and usually economical to repair damaged reinforced concrete pipe in situ without removal and replacement. Pipes which are cracked longitudinally to the extent described in stage I, cannot be said to have failed in any reasonable sense of the word. As a rule, such cracks indicate nothing more than that the reinforcement steel is being stressed at a level somewhere near that for which it was designed and which it is capable of carrying. Unless the cracks are wide enough to permit corrosion of the steel, they are not at all damaging to the pipe. Longitudinal cracks typical of stage I structural effect are shown in Figures 39 and 40.

( \ \ {
29
Figure 39. Stage I cracks in crown of pipe~1 /100 -in. crack center; hairline crack, right; very fine hairline crack, left.
Figure 40. Stage I crack in pipe invert~approximately 1/ 16 in . wide.

30
Figure 4l. Spalled concrete, stage II damage to left of hammer, ice in pipe invert at right.
Figure 42. Spalled concrete, stage II damage.

31
Figure 43. Advanced stage II damage to l08-in. pipe. When damage was first discovered, engineer ordered timber struts installed. Later these were removed and a system of diameter measurements established, which indicated that the pipe had reached state of equilibrium. Beddings were improved by grouting, then pipe walls were repaired with
concrete. Pipeline has served satisfactorily for 14 years (at this writing).
Opinions vary relative to the width of a crack which will permit the steel to corrode and deteriorate. It is this writer's opinion that cracks up to about Yl6 in. in width can be safely tolerated in a reinforced concr ete pipe , unless the environment is unusually conducive to corrosion of steel. If cracks greater than Y1s in. have developed, they can be repaired by reaming out with an air chisel to the depth of the steel and replacing with gunite concrete or some similar protective material. It is not wise to try to fill the cracks without first reaming them out.
Damage described under stage IT (that is, spalling of the protective cover over the steel at the top or bottom) has the appearance of a very severe condition (Figs. 41 and 42). One engineer described it by saying, "It looks like the foundation is coming up through the bottom of the pipe." Actually it is not as severe as it appears to be and can be repaired with complete safety and confidence. When this type of damage occurs, the pipe has deformed enough to develop a substantial amount of passive resistance pressure of the soil at the sides. It has, in effect , become a "semi-rigid" pipe and a state of equilibrium develops in which the vertical load is carried by the residual inherent strength in the pipe plus the passive resistance pressure against the sides. This state of equilibrium develops in early phases of pipe damage and can be verified by measuring the vertical and horizontal diameters of the pipes and marking the points

32
GROUT CONSOLIDATED
ref.:-::-:--7'='
-· ---- . .
"" '<'.
\
Figure 44. Method of improving pipe bedding by grouting.
Figure 45. Stage II damaged 84-in. pipe removed for inspection of grout injected through holes drilled approximately at lower quarter points. After bedding was improved, pipes were repaired on the inside with gunite concrete. Pipeline has served satisfactorily for
9 yr (at this writing) and repairs appear to be permanent.

33
Figure 46. Parallel 84-in. pipelines only 1 ft apart. Impossible to do an adequate job of compacting soil under haunches with pipes so close together.
between which measurements are made. Then repeat the measurements at about 30-day intervals until a steady state is indicated. The pipe may then be repaired by reaming out all cracks wider than ';/16 in. and removing all spalled and broken concrete with an air chisel. Then replace with gunite concrete to protect the steel against corrosion.
In severe cases of stage II damage (Fig. 43), when it is known that the density of soil beneath the lower haunches is deficient, the pipe can be strengthened by pressure grouting the soil in this region. Holes may be drilled in the pipe wall between the spring line and the lower quarter point and grout forced into the soil (Fig. 44). This improves the bedding situation and increases the lateral pressure and the pipe is greatly strengthened. An 84-in. pipe grouted in this manner and then removed to observe the results is shown in Figure 45. After the grouting operation was completed, gunite repairs of the inside of the pipe were carried out.

34
When two pipelines are laid parallel, they should be placed sufficiently far apart to permit workmen to do an effective job of compacting the soil beneath the lower haunches of the pipes. Figure 46 shows two parallel 90-in. pipelines with only 1 ft clearance between them. Obviously it was impossible to adequately compact the soil in the triangular spaces beneath the spring lines.
Damage to pipes described under stage III is very severe and the inherent strength of the pipe is, for all practical purposes, completely dissipated. However, the development of very high passive soil pressures at the sides of the pipe holds it in a quasicircular shape even though the pipe diameters are extensively changed. As a matter of fact, the writer has never seen or heard of a reinforced concrete pipe that has completely collapsed under a fill. Under the severest conditions, there is still a substantial area of waterway and hydraulic capacity remaining, and this should be preserved to the greatest extent possible.
Repairs can be made either by threading a thin-walled steel pipe through the damaged pipe and pressure grouting the annular space with concrete, or by guniting a 2-to 3-in. lining on the inside of the damaged pipe, as shown in Figures 24, 25 and 29. This gunite lining should be reinforced, either by a wire mesh cage or a spirally wound continuous- bar cage. An economic study should be made to determine the proper choice between the liner pipe and the gunite methods of repair. Both are effective and will restore the pipeline to a serviceable condition.

Structural Characteristics of Reinforced Concrete Elliptical Sewer and Culvert Pipe HAROLD V. SWANSON and MASON D. REED
Respectively, Manager and Supervisor, Civil Engineering, International Pipe and Ceramics Corporation, East Orange, N. J.
•ALL WELL-ENGINEERED structures are functional in form. They embody the shape which most efficiently satisfies their end use. Most pipe have circular cross-sections inasmuch as the closed circle, encompassing a given area with the least perimeter, is hydraulically the most efficient. Sometimes, however, a pipe of different shape may be used to advantage.
One such useful shape is the ellipse. Elliptical pipe possess unique hydraulic and structural characteristics by virtue of their geometry. The characteristics of elliptical pipe with the major axis placed horizontally (HE pipe) are quite different from those gained from placing the major axis vertically (VE pipe). In effect, elliptical pipe are two distinctly different types of structures, each having its advantages and disadvantages. For example, HE pipe provides several hydraulic advantages at flows of less than full depth, and VE pipe provides greater structural strength under external earth loads.
ASTM Committee C-13 has formally adopted specifications for strength classifications and corresponding required reinforcement for HE and VE pipe; this specification, ASTM C507, has recently been issued. It will be necessary for the designer, however, to relate these 3- edge bearing test strength classes in the specification to required field strengths.
The purpose of this paper is to detail a method of structural design for these two types of pipe such that it will be possible to determine field loads under various installation conditions and relate these field loads to the conventional 3- edge bearing test strengths. Alternatively, it will be possible to relate known test strength of pipe to permissible field conditions.
DIMENSIONS OF PIPE
The shape and wall thicknesses of HE and VE pipe have been standardized by the industry. The various sizes are given in terms of the "equivalent round" pipe, based on the elliptical pipe having approximately the same total flow capacity as the round size. These standard pipe are shown in ASTM C 507. It may be noted that the term "elliptical" is a misnomer because the shape is defined by circular arcs; the approximation to an ellipse, however, is very close (Fig. 1).
FIELD LOADS
The method of determining earth loads is identical to the Marston-Spangler theory of loads on underground conduits for trench or embankment conditions. These methods, developed over a number of years, have been compiled and summarized by Spangler in several papers (1, 2). For completeness of this paper, those methods applicable to the present subject are-also reviewed here. In accordance with these theories, the method of calculating static loads in a trench installation is distinguished from that used for positive projecting embankment conditions.
Paper sponsored by Committee on Culverts and Culvert Pipe . 35

36
t TRUE ELLIPSE
Figure 1 . Basic geometry of elliptical pipe .
TRENCH LOADS
Trench loads are computed from Marston's formula for closed conduits (~ )
Wt = Cd w (Bd)2
(1)
in which
Wt trench load, lb/ lin ft; Cd trench load coeffi
cient; and Bd trench width, ft.
The value of the trench load coefficient, Cd, may be found from Figure 2.
POSITIVE PROJECTING CONDUIT LOADS
Earth loads for positive projecting rigid conduits are
computed in accordance with the Marston- Spangler expression (_!, i)
(2)
in which
We embankment load, lb/ lin ft; Cc = embankment load coefficient; and Re = outside horizontal width of the pipe, ft.
The value of the embankment load coefficient, Cr., may be found from the curves of Figure 3. The use of K µ = 0. 1924 for the curves, results in the most conservative embankment load for the range of soil types generally encountered.
...,
15
14
13
12
II
10
$_9 J: u. 6 07
"' ~ 6 ...J
~5 4
3
2 ,,
A BC D E
I I
I I I
J /ti I '!JV
I II V/ J rb ~
A = Cd FOR !<_..• = .1924 MIN FOR GRANULAR MATERIAL WITHOUT COHESION
B =Cd FOR K,.' - .165 MAX FOR SAND AND GRAVEL
C =Cd FOR Kl''• . 150 MA)( FOR SATURATED TOP SOIL
0 =Cd FOR Kl' ' = . 130 ORDINARY MAX FOR CLAY
E =Cd FORK)/= .1 10 MAX FOR SATURATED CLAY
K = RANKINE'S RATIO ( . 333 GENERALLY USED)
,a'= COEFFICIENT OF SLIDING FRICTION BETWEEN FILL MATERIALS AND SIDES OF TRENCH
/v 0 o 1 2 3 4 e
VALUES OF COEFFICIENT- Cd
Figure 2. Computation diagram for earth fill loads on ditch conduits .

It is noted that the Cc curves are dependent on the product of the settlement ratio, rsd' times the projection ratio, p. The settlement ratio is a function of the deflection of the conduit and the relative settlement of the soil under and at the sides of the conduit ( 4). Analysis has indicated that, for pr actical purposes, settlement ratios for circular and elliptical pipe may be considered equal. For rigid culverts on foundations of ordinary soils the settlement ratio is generally chosen between +O. 5 to +0. 8.
In Spangler's derivation for earth load, the projecting height of the conduit above the natural ground is defined as a proportion of the conduit horizontal span, pBc. It is usually more convenient to express this height as a proportion of the total vertical height of the pipe. For circular conduits, with horizontal span equal to the diameter, the height of the projection in terms of the vertical height remains pBc; but for elliptical pipe, the projection height in terms of the vertical height of the pipe may be ex-
.... 0 Ul 6 l---+--+----+--1---1---.IL----.<~...q..LIJ
:h >---+----<--!- ->-- ,..,r'91~~K".~~f'> ~ /
4 r--"'1--r------t-----,~.,..,..<-;"'!>-~~:o>t-=-:::i---;
1<,M•O.I 24 00~~-2~~3-~4-~5-~s'---1L._--'-s -~9---'10
VALUES OF COEFFICIENT-Cc
r,d = SETTLEMENT RATIO
p • PROJECTION RATIO
K = RANKINE'S RATIO ( .333 GENERALLY USED)
37
.f' = COEFFICIENT OF SLIDING FRICTION IN EMBANKMENT
Figure 3. Computation diagram for earth fill loads on embankment conduits.
pressed as PeB 'c, in which B 'c is the vertical height of the pipe. Then for any specified elliptical pipe projection ratio, Pe, the projection ratio, p, required to find the coefficient, C, may be found by p = 0. 69pe for HE pipe, and p = 1. 45pe for VE pipe.
This relationship is derived from the dimensions of standard elliptical pipe.
NEGATIVE PROJECTING AND Il\IIPERFECT TRENCH CONDUITS
Positive projecting conduits are those installed with the top of the pipe above the natural ground surface. Embankment culverts are also sometimes installed in a subtrench with the top of the pipe below the natural ground surface. In this case, the load on the culvert should be calculated according to the theory of negative projecting conduits.
A further type of installation is the imperfect trench, which is an artificial negative projecting condition used to reduce the load on a conduit under high fills. After the embankment has been placed to several feet over the top of the pipe, a trench equal in width to that of the pipe is dug in the fill directly over the pipe. The trench is filled with loose compressible material, and the remainder of the embankment is placed. The friction developed along the sides of the trench supports some of the load of the embankment, reducing that which the pipe must support. This would be a particularly useful method of installation for HE pipe when it is necessary to place it under a high embankment. (Because of its breadth, HE pipe is less efficient structurally than circular and VE pipe.)
The formulas and coefficient diagrams for calculating loads in both these types of installation may be found in the literature ~' ~).
LIVE LOADS
Surface live loads transmitted to the pipe are based on Holl's integration of the Boussinesq formula for a surface point load transmitted through a semi-infinite elastic solid (4). Both impact and the support given by adjacent unloaded sections of pipe should- be taken into account. The general expression is

38
CL may be found from
in which
2 1- -
1T
W1 = live load on pipe, lb/ tin ft; CL live load coefficient; Rf = live load reduction factor; P = wheel load, lb; lf = live load impact factor
Ai = % horizontal outside width of pipe, ft;
) -
B = half of effective pipe length supporting one wheel load, ft;
(3)
(4)
L = effective length of pipe supporting one wheel load, ft (3 ft generally used); and H = height of earth cover over pipe, ft.
Wiggin, Enger and Schlick have proposed live load reduction factors resulting from the adjacent unloaded sections of pipe which support the loaded sections. These factors were given for covers 2. 5 ft and greater and for pipe sizes 4 in . to 60 in. To make the values a continuous function suitable for computer programing, empirical formulas approximating the values (§) are suggested as
for H between 0 and 3 ft, and
362 Rr = 0.79 + ~
Rf= 0. 79 + 36~ + 0.02(H-3) qi , - '
(5a)
(5b)
for H greater than 3 ft, in which qi is the horizontal inside breadth of the pipe and Rf should never be greater than 1. 0.
Suggested empirical impact factors for flexible or unpaved roadways are indicated in Table 1.
The equation for CL was programed for computer analysis and values were determined for two trucks with axle width of 6. 0 ft, passing within 3. 0 ft of each other. The results are given in Table 2. The coefficients shown are based on the combined effect of all four wheel loads.
LOAD FACTORS FOR ELLIPTICAL PIPE
Sewer and culvert pipe are commonly designed for strength in a 3-edge bearing test (AASHO-T33). For the same total load, this concentrated load test imposes more severe stresses in the pipe than would be induced by distributed trench or embankment loadings. For any particular combination of pipe size, wall thickness, reinforcing steel and field installation conditions, it would be possible to make comparative stress analyses to determine the test load comparable to the field load. The analysis of the indeterminate structure of reinforced concrete cross- section would, however, present a laborious task of design. To simplify design, the concept of a generalized load factor applicable to all sizes of pipe has been used for many years. The ratio of the strength of the pipe under a specified condition of field loading to its three- edge bearing test strength is called the load factor. If the load factors are known for the various field conditions, the designer is able to relate the calculated field load to a three- edge bearing test strength.

For a reinforced concrete elliptical pipe a factor of safety of 1 based on the minimum 0. 01-in. crack test strength is suggested, in keeping with many years practice with circular reinforced concrete pipe. Cracks of this width are noninjurious, and small cracks in concrete will heal autogenously. Proof- of- design testing of reinforced concrete pipe requires conservatively proportioned reinforcing steel to insure that all pipe will be capable of meeting specified test strengths, thus providing, for the great majority of pipe, a margin on cracking in the field. Safety against ultimate failure is provided by the specified margin between 0. Olin. crack and ultimate strength in the 3- edge bearing test. This margin will be even greater in the field, due to the reduced shear stresses, and the build-up of supporting passive earth pressure at the sides of the pipe if the pipe were overloaded to failure in the field installation. The required 3- edge bearing strength is
Qo.01 Wd W1 --+ - -Lfd Lfll
in which
Qo.oi = 3-edge bearing test load causing 0.01-in. crack, lb/ lin ft; Lfd = load factor for earth loads; · Lfll = load factor for live loads, 1. 5 in all cases; Wd = earth load on pipe in trench or embankment, lb/lin ft; and W1 = superimposed surface live load on pipe, lb/ lin ft.
TABLE ~
Equivalent Height of Earth Cover (ft) Round Pipe
Size (in , ) 4 6 i 10 12 14
(a) HE pipe
18 0. 235 0.161 0.109 0.078 0. 058 0.045 0.035 0.029 0.020 0. 015 0.011 24 o. 245 0.184 0.130 0.095 0.072 0.056 0.044 o. 036 0.025 o. 019 0. 014 27 0.249 0.193 0.140 0.104 0. 079 0.061 0.049 0.040 0.028 0. 021 0. 016 30 o. 251 0.201 0.149 0.112 0. 085 0.067 0.053 0.043 0. 031 0.023 0. 017 33 0. 253 0.207 0.156 0.119 0. 091 0.072 0.057 0.047 0.033 0. 025 o. 019 36 0. 255 o. 214 0.165 0.127 0. 098 0.077 0.062 o. 051 0. 036 0.027 0. 021 39 0.256 0.218 0.171 0.133 0. 104 0.082 0.067 o. 055 0.039 0 . 029 0.023 42 0. 256 0.222 0.176 0.139 0. 109 0.087 0.071 0. 058 0 .041 0. 031 0.024 48 0. 257 0.227 0 . 184 0.147 0 . 117 0.094 0.077 0.064 0 . 046 0 . 035 0.027 54 0. 258 0.231 0.191 0.156 0 . 126 0.102 0.084 0.070 o. 051 0.038 0 .030 60 0. 259 0,234 0. 196 0.162 0 . 133 0.109 0.090 0.076 0.055 0.042 0.033 66 0,259 o. 236 0.200 0.168 0.139 0.115 0.096 0.081 0.059 0.045 0.036 72 0. 259 0. 237 o. 203 0.172 0 . 144 0.120 0.101 0.085 0.063 0.049 0,038 78 0. 259 o. 238 0.206 0. 176 0.148 0.125 0.105 0,090 0.067 0. 052 0.041 84 0. 259 0. 239 0.208 0.179 0.152 0.128 0. 109 0,094 0.070 0. 055 0.043 90 0. 259 0.240 0. 209 0.181 0 . 155 0.132 0. 113 0.097 0.074 0.058 0.046 96 o. 259 0.240 0. 210 0. 183 0. 157 0. 135 0.116 o. 100 0. 177 0 , 060 0.048
102 0. 260 0.241 0.211 0.184 0. 159 0. 137 0,119 0. 103 0.079 0. 063 0.050 108 0.260 o. 241 0. 212 0. 186 0.161 0.139 0.121 0.105 0.082 0.065 0.052
(b) VE Pipe
36 0.247 0.187 0.134 0.098 0.074 0.057 0.046 0.037 0.026 0.019 0. 015 39 0.249 0.194 0. 141 0.104 0.079 0,061 0.049 0.040 0.028 0. 021 0. 016 42 0. 251 0.199 0. 147 0.110 0.084 0,065 0.052 0,042 0.030 0.022 0.017 48 o. 253 0.208 0. 156 0. 119 0.091 0.072 0. 057 0,047 0.033 0.025 0. 019 54 o. 255 0. 215 o. 166 0. 128 0.100 0. 079 0. 063 0. 052 0 ,037 0 . 028 0,021 60 0,256 0.221 0. 174 0. 136 0. 107 0.085 0.069 0 . 057 0.040 0.030 0.023 66 0. 257 o. 225 0. 180 0. 143 0.113 0. 091 0.074 0. 061 0.044 0.033 0.025 72 o. 258 o. 228 0. 186 0. 149 0.119 0.096 0,079 0.065 0.047 0 . 035 0.027 78 o. 258 o. 231 0.191 0. 155 0.125 0.102 0.083 0,069 0.050 0.038 0,030 84 0. 258 o. 233 0. 194 0.160 0. 130 0.106 0.088 0.073 0,053 0 . 040 0. 031 90 0.259 o. 235 0. 197 0.164 0. 134 0.110 0.092 0.077 0. 056 0 . 043 o. 033 96 o. 259 0.236 0. 200 0.167 0.138 0.114 0.095 0.080 0.059 0.045 0,035
102 o. 259 o. 237 0. 202 0. 170 0.142 0,118 0.099 o. 083 0.061 0. 047 0.037 108 0. 259 o. 238 0.204 0.173 0.145 0. 121 0.102 o. 086 0.064 0.049 0,039
39
TABLE 1
IMPACT FACTORS, If
Cover, H If
(ft)
1.0 0.50 1. 5 0. 50 2.0 0.50 2.5 0.43 3.0 0.38 3 . 5 o. 30 4 . 0 0.23 4.5 0.17 5.0 0.10 5.5 0.04 5. 75 and above 0
(6)
16 18 20
0.009 0.007 0.006 0.011 0.009 0.007 0. 012 0.010 0.008 0.014 0.011 0.009 0.015 o. 012 0.010 0.016 0. 013 0.011 0.017 0.014 0.011 0. 019 o. 015 0. 012 0 . 021 0,017 0.014 0. 023 0.019 o. 015 0.026 0.021 o. 017 0. 028 0.022 0. 018 0.030 0.024 0.020 0.032 0.026 o. 021 0. 034 0.028 o. 023 0.036 0,029 0.024 0. 038 0.031 0.026 0.040 0.032 0.027 0.042 0.034 0. 028
0.011 0.009 0.007 0.012 0. 010 0.008 0.013 0.010 0.009 0. 015 0. 012 0.010 0.016 0.013 0.011 0 .018 0. 014 0.012 0. 020 0. 016 0. 013 0 . 021 o. 017 0.014 0.023 0. 018 0. 015 0.025 0.020 0. 016 0.026 0. 021 o. 017 0.028 0.022 o. 018 0.029 0.023 0·.019 0.030 0.024 0.020

40
..!!i. a 2o
2b
a
3-EDGE BEARING TEST VERTICAL EARTH LOAD SIDE SUPPORT
Figure 4. Load conditions for HE pipe .
b • 1- 0
3 - EDGE BEAR ING TEST VERTICAL EARTH LOAD SIDE SUPPORT
Figure 5. Load conditions for VE pipe .
GENERAL METHOD OF DERIVATION OF LOAD FACTORS
Load factors for any given conditions of field installation may be found by comparing the critical tensile stresses developed in the field and those induced in a 3- edge bearing test. The load factor is the ratio of the field load to test load producing the same critical stress.
The stress analysis of elliptical pipe follows the general methods used by Spangler (7) in deriving load factoro for circular rigid conduits. The pipe is considered a u elastic beam of constant and homogeneous cross- section, indeterminate to the third degree, from which by conventional moment-area principles, the redundant moment, thrust and shear forces may be determined. Table 3 indicates the resulting coefficients for moment, thrust and shear for the various test and field loading conditions shown in Figures 4 and 5.

41
TABLE 3
MOMENT , THRUST AND SHEAR COEFFICIENTS FOR PIPE
At Invert At Top At Springlines Loading Condition
MA PA VA MB PB VB Ms Ps Vs
(a) HE Pipe
3- edge bearing test o . 297 0 o . 500 0. 297 0 -o . 500 -0.203 -0. 500 0 Vertical earth load p1 = O. 707 0 . 1414 -o. 0410 0 0.1229 0. 0410 0 -0.1545 -0. 500 -o. 0410
0. 500 0 . 1717 -0. 0621 0 0.1296 0. 0621 0 -0.1619 -0. 500 -0.0621 Side support Pe= 0. 9 - Q. 0786q -0. 4469q 0 -0.0826q -0.5531q 0 0.1009q 0 -o. 0025q
0. 7 -0. 0709q -0.3320q 0 -0. 0946q -0.6680q 0 0.1123q 0 -0. 0460q 0. 5 - o . 0523q -0. 2158q 0 -0. 0976q -0. 7842q 0 o. 0916q 0 -0.2158q 0. 3 - o . 0288q -0.1079q 0 -0. 0848q -0. 892lq 0 0. 0432q 0 -0.1079q
(b) VE Pipe
3- edge bearing test 0. 227 0 0. 500 0. 227 0 -o . 500 - 0.106 - 0. 500 0 Vertical earth load pi = 0, 707 0.1152 -o. 0166 0 o. 0996 o. 0166 0 - 0.0835 - 0. 500 -0.0166
0. 500 0.1376 -o. 0250 0 0.1043 0. 0250 0 - 0.0874 - 0. 500 -0.0250 Side support Pe= 0. 9 -0.1446q -o. 4466q 0 -0.1514q -0.5534q 0 0.1240q 0 -o. 0022q
0 .7 -0.1311q -o. 3281q 0 -0.1749q -0.6719q 0 0, 1398q 0 -o. 0421q 0 . 5 -o. 0946q -0.2074q 0 -0.1799q -0.7926q 0 0.1127q 0 -0.2074q o. 3 -o.0496q -0.0989q 0 -o. 1518q -o. 901lq 0 o. 0493q 0 -0.0989q
Note: Fron the tabulated coefficients) CJ above) the bending moments, thrusts and shears may be found from the following relationships:
M = C a W p = c w v =cw
in which M =bending moment at sectionJ in.-lb/lin ftJ P =thrust at section, lb/Un ft, V = shear at section J J.h/ltn ft J
W = total vertical 101111 on plr:eJ lb/lin ft, = Q for 3-edge bearing test, = W8 for vertical earth load and side support, and
a= half of major axis of pipe (to if. of wall), ft,
in which g_ = active lateral pressure as proportion of vertical load, p =projection ratio (p = 0.69Pe for HE and 1.45 Pe for VE), K =Rankine ratio (use 0.333),
Cc = embankment load coefficient, H = height of earth cover over pipe, ft, and
Be = outside horizontal width of pipe, ft.
Wall sections of maximum bending moment may then be analyzed for stresses, and from a ratio of test to field stresses the general expression for embankment load coefficients, corresponding to Spangler's notation is
in which
Lf embankment load factor, A factor corresponding to pipe shape, N factor corresponding to distribution of vertical load and vertical reaction, x factor corresponding to the area of vertical projection of the pipe in which
active lateral pressure acts, and q = ratio of the total active lateral pressure to the total vertical load.
q may be found from
Kand Cc are defined in Figure 3, and p, H, and Bare defined in Figure 6.
(7)
(8)
The resulting factors to be used in the embankment load factor equation are given in Table 4. Embankment installation conditions corresponding to Class Band Class C bedding are shown in Figure 6.
fu trenches, side support is disregarded. The parameter x in Eq. 7 is therefore zero, and the load factor becomes a constant for each class of bedding. The theoretical determination of trench load factors, using this equation, then yields for Class C (ordinary) bedding, 1. 75 and 1. 66 for HE pipe and VE pipe, respectively, and for Class B (first class) bedding, 2.12 and 1. 98 for HE pipe and VE pipe, respectively.
However, because of the correspondence of these theoretical factors to trench load factors as determined by test at Iowa State University for circular pipe, it is suggested

42
:r
:r
TOP OF EMBANKMENT
CLASS C BEOOING
(ORDINARY)
TOP OF EMBANKMENT
CLASS C BEODING
(ORDINARY)
TOP OF EMBANKMEN
CLASS B BEDDING
(FIRST CLASS)
TOP OF EMBANKMENT
T HOROUGHLY TAM PED EARTH
SHAPED TO FIT
x
CLASS B BEODING
(FIRST CLASS)
Figure 6. Installation of HE and VE pipe in embankments.
that the test values used be for Class C (ordinary) bedding-1 . 5, and for Class B (first class) bedding- 1. 9.
Figure 7 shows details of trench installations corresponding to Class B and Class C bedding.
LOAD FACTORS FOR SUPERIMPOSED SURF ACE (LIVE) LOADS
The load transmitted to a buried pipe by a concentrated load at the ground surface is considered to act as a uniformly distributed load over a selected effective length of
pipe. In actuality the intensity
Type Pipe
HE
VE
A
I. 337
I. 021
TABLE 4
LOAD FACTOR COEFFICIENTS
N x
Bedding Projection Ratio
Class Factor Pe p
B 0. 9 o. 62 (fir at claM) 0. GJO O.? 0. 48
0.5 0. 34 c 0. 3 0 . 21
(ordinary) 0. 763 0 0
B 0. 9 1. 30 (fir st class) o. 51 6 o. 7 1. 01
0. 5 0.72 c o. 3 0. 43
(ordinary) o. 615 0 0
Factor
0. 421 o. 309 0 . 268 0. 146
0
0. 718 o. 639 0.457 0 . 238
0
of vertical pressure is highest at the crown of the pipe. This has little effect on the load factor, however, because maximum field moments occur at the invert where the bearing pressure does remain uniform , thus maintaining approximately the same maximum bending moment as occurs under vertical earth load. In deriving load factors for circular pipe, Spangler (7) found a very narrow range of load factor for super-imposed loads varying from 1. 51 for 1 ft of fill to a maximum of 1. 70 for relatively high fills.

CAREFULLY COMPACTED BACKFILL
H
CAREFULLY CO MPACTED BACKF!LL
1 •
CLASS B BEDDING Lt =I. 9
(FIRST CLASS)
'-FINE GRANULAR FILL
CLASS B BEDDING Lt= I. 9
(FIRST CLASS)
LIGHTLY COMPACTED BACKFILL
CLASS C BEDDING Lt• 1.5
(ORDINARY)
H
LIGHTLY COMPACTED BACKFILL
CLASS C BEDDING Lt• 1.5
(ORDINARY)
Figure 7. Installation of RE and VE pipe in trenches.
43
The load factor did not increase with higher class of bedding because the increased bending moment at the top compensated for the reduction in moment at the invert. Embankment installation likewise had no effect, because surface loads do not induce appreciable accompanying increases in side support. Accordingly, Spangler recommended a constant value of 1. 5 for all superimposed surface loads.
In view of the correlation of trench load factors for HE, VE and circular pipe , the identical constant load factor of 1. 5 for surface loads on each of these types of pipe appears reasonable.
CONCRETE CRADLE LOAD FACTORS
Concrete cradle load factors for round pipe have been determined principally by test, several series of experiments having been conducted at Iowa State and Ohio State Universities (8, 9). Apparently, the mechanism of failure is associated with "springing" of the pipe from the cradle. For this reason, perhaps such load factors should be determined by test rather than by stress analysis . This suggests a line of future research.
DETERMINATION OF STEEL REINFORCEMENT
Once the designer has , through the use of the proper load factor, determined the required 3-edge bearing test D-load to meet a specific field installation, he must then select the proper amount of steel reinforcement such that the pipe will have the strength to meet the design D-load. Standard D-load classifications and designs are specified in ASTM C 507. The 3- edge bearing test loads in pounds per linear foot of pipe are found by multiplying those D-loads by the inside horizontal span of the pipe, in feet. Several examples of the use of load factors are given in the Appendix.

44
CONCLUSION
The use of load factors in design is a simple method of avoiding a laborious stress analysis for each installation. Having once performed the computation and expressed the results in terms of load factors, the exercise need not be performed again. By a proof-of- design test , the designer is assured that the pipe will be capable of sustaining the stresses in the field that he has determined implicitly through the use of load factors.
FF.FEHE NCES
1. Spangler, M . G., "Analysis of Loads and Supporting Strengths, and Principles of Design for Highway Culverts." Proc. HRB, 26: 1S9- 213 (1946).
2. Spangler, M. G., "Underground Conduits-An Appraisal of Modern Research." Trans. ASCE, 113:316-374 (194S).
3. Marston, A. , "The Theory of External Loads on Closed Conduits in Light of the Latest Experiments." Bull. 96, Iowa State College.
4. Spangler, M. G., "Soil Engineering." Chap. 25 and 17, International Textbook Co. , Scranton, Pa . (1951).
5. Peckworth , H.F., "Concrete Pipe Handbook." Chap. 6, Amer. Cone. Pipe Assoc., Chicago, Ill. (1959).
6. Wiggin, T., Enger, M. , and Schlick, J., "A Proposed New Method of Determining Barrel Thicknesses of Cast Iron Pipe." Journal AWW A, 31 (5) (May 1939).
7. Spangler, M. G., "The Supporting Strength of Rigid Pipe Culverts." Bull. 112, Iowa State College.
S. Abernathy, L. L., "Effect of Trench Conditions and Arch Encasement on LoadBearing Capacity of Vitrified Clay Pipe." Ohio State Univ. Eng. Exp. Sta. Bull. 15S (Nov. 1955).
9. Schlick, W. J. , and Johnson, J. W., "Concrete Cradles for Large Pipe Conduits." Iowa State Univ. Bull. SO (Sept. 1926).
Appendix Examples
No. 1: A 48-in. equivalent round VE culvert is to be placed in a trench. The cover over the top of the pipe is 15 ft. The soil is sand and gravel and weighs 110 pcf. The bedding is considered ordinary. What are the required D- load strength and pipe class? Step 1. Compute earth load from
Wt = Cd w (Ba) 2 (Sa)
if w = 110 pcf,
Ba = Be + 2 = 4. 11 + 2 H = 15 ft,
H/ Bd = 15/ 6.11 = 2. 455, Ca= 1.6, and Kµ = 0.165 (Fig. 2).
6.11 ft,
This yields Wt = 1. 6 x 110 x (6.11) 2 = 6, 570 lb/ lin ft
Step 2. Compute required 3- edge bearing strength from
Qo.01 = Wa/Lfa in which
Wa Wt, and Lfd = 1. 5 (ordinary bedding)
{Sb)
(!:la)

which yields Qo.01 = 6, 570/1. 5 = 4, 380 lb/lin ft
Step 3. Compute D-load and class from
D- load = Q o. 01/ horiz. inside span, ft = 4,380/3.19 = 1375D
Therefore, the pipe used must be Class VE IV (ASTM C507).
45
(9b)
(10)
No. 2: A 96-in. equivalent round HE pipe is to be placed in a roadway embankment. The cover over the top of the pipe will be 4 ft. Live load will be equivalent to H-20 truck loading on a flexible pavement. The culvert will have first class bedding in ordinary soil and will be projecting 0. 7 of its vertical height above the natural ground; soil weight is 120 pcf. Step 1. Compute embankment earth load from
if
w = 120 pcf, Be = 11. 63 ft,
H = 4 ft, H/Bc 4/11.63 = 0.344,
Pe 0. 7, p 0. 69pe, p = 0.69 x 0.7 0.483,
rsd = 0.8, and Cc= 0.4(Fig. 3).
This yields W = 0. 4 x 120 x (11. 63) 2 = 6, 500 lb/lin ft
Step 2. Compute live load from
W1 = CLP (1.0 + If)
in which
CL = 0. 183 (Table 2), P = 16, 000 lb (rear wheel, H- 20 truck), and If = 0. 23 (Table 1).
Therefore W1 = 0.183 x 16,000 x 1.23 = 3,600lb/linft
Step 3. Compute required 3- edge bearing strength from
Wd W1 Qo.ol = Lfd + Lfll
in which
If
Wd =We, Lfll = 1. 5,
_ 6, 500 3 600 _ I Qo.01 -- 2.46 + 1T - 5, 040 lb lin ft, and
A Lfd = N- xq·
A = 1. 337 (Table 5), N = 0. 630 (Table 5), x = 0. 369 (Table 5), and
q = pK (__!! + E.) = 0. 483 x 0. 333 (0. 344 + 0. 242) 0. 236 Cc Be 2 0.4
(lla)
(llb)
(12a)
(12b)
(13)

46
then 1.337
Lfd = 0.63 - 0.369 x 0.236 = 2 · 46 ·
Step 4. Compute D-load and Class from
D-load = Qo.01/horiz. insidespaninft = 5,040/10.05 = 501D (14)
Therefore, the pipe used must be Class HE-A (ASTM C507}.

Structural Performance and Load Reaction Patterns of Flexible Aluminum Culvert H. E. VALENTINE
Senior Test Engineer, Engineering Test Section, Product Development Division, Reynolds Metals Company, Richmond, Virginia
In November and December 1962 live load tests were performed on seven aluminum culverts ranging in size from 24 to 54 in. Strain measurements were taken simultaneously with measurements of soil pressure developed around the culvert and with measurements of culvert deflection. All testing was done in soil compacted to 90 percent by the modified AASHO method. All applied loads were AASHO-H20.
This paper presents the data collected and points out the load- soil reaction relationships found to exist. The soil pressure and culvert strain distributions around the culverts are presented, and size-to-size and fill height-to-fill height comparisons given. Recommended minimum fill- height tables are presented as a development of the data collected in this series of tests.
The tests indicated that under concentrated loading and under conditions of high compaction, aluminum culverts initially tend to move toward a square shape. The data supporting this proposition are presented and discussed.
• THIS PAPER is an indirect result of a testing program to improve understanding of the relationships between soil and buried culvert. The objective of the test was to derive a minimum, safe fill-height table for a range of culvert sizes and gages under AASHO-H20 loading. Very little performance data are available on flexible culvert under low-fill conditions with AASHO- H20 or concentrated loading. The scope of the data collected in this test was such that much new material could be made available. More than 5, 000 items of data were recorded, mainly coincident measurements of soil pressure in the full circle around a culvert; strain of the surface fibers on both the interior and exterior of the full circle; and deflection vertically, horizontally, and at a 45° angle.
Seven culverts were selected for this test. The sizes and gages were as follows:
Culvert Number Description
1 24 in., full circle, 16 gage, riveted 2 24 in., full circle, 16 gage, spot welded 3 24 in., vertically elongated (5 %), 16 gage , riveted 4 36 in. , full circle, 14 gage , riveted 5 36 in., vertically elongated (5 %), 14 gage, riveted 6 54 in., full circle, 12 gage, riveted 7 54 in., vertically elongated (5 %), 12 gage, riveted
The soil selected for this test had an AASHO classification of A- 4 and was placed with 90 percent compaction as determined by AASHO Method T 180- 57 (Method A). Testing was performed at a site approximately 15 mi southeast of Richmond, Va., near the James River. This area is normally used as a source of subgrade soil.
Paper sponsored by Committee on Culverts and Culvert Pipe . 47
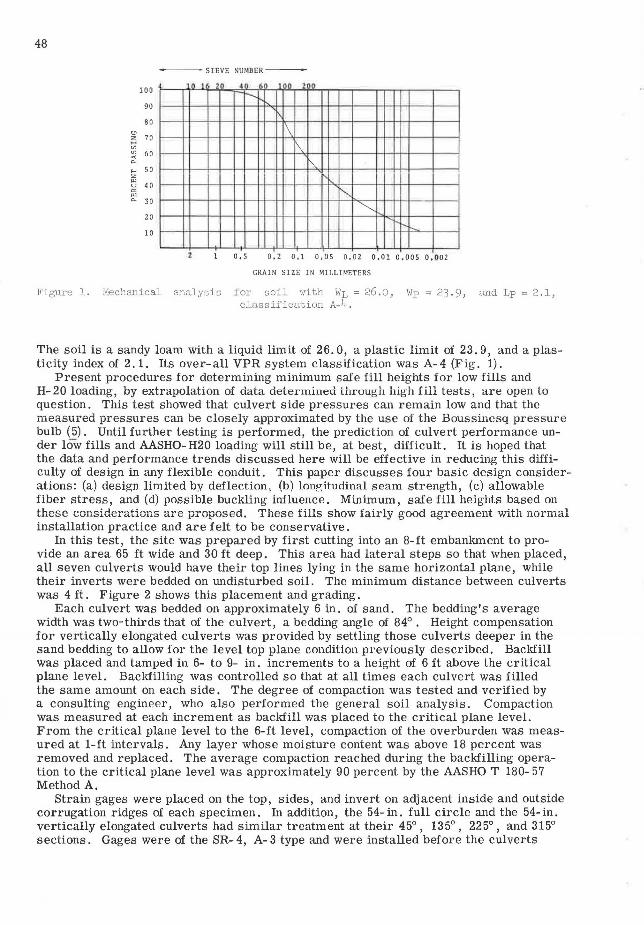
48
- --SIEVE NUMBER---
100 n I : o 40 ~l 100 zoo
r-~ 90
\ BO
70 \ 60
\
so ." ~
40
r--.. 30
""' 20 ~
10
0 ,5 0,2 0.1 0,05 0.02 0.01 o.oos 0 , 002
GRAIN SIZE IN MILLIMETERS
Figure l. Mechanical analysis for soil with WL = 26 .o, Wp = 23 . 9, and Lp = 2 .1, classification A-4.
The soil is a sandy loam with a liquid limit of 26. 0, a plastic limit of 23. 9, and a plasticity index of 2. 1. Its over-all VPR system classification wa s A- 4 (Fig. 1).
Present procedures for determining minimum safe fill heights for low fills and H- 20 loading, by extrapolation of data deter mined through high fill tests , are open lo question. This test showed that culvert side pressures can remain low and that the measured pressures can be closely approximated by the us e of the Boussinesq pressure bulb (5). Until further testing is performed, the prediction of culvert performance under low fills and AASHO- H20 loading will still be, at best, difficult. It is hoped that the data and performance trends discussed here will be effective in reducing this difficulty of design in any flexible conduit. This paper discusses four basic design considerations: (a) design limited by deflection, (b) longitudinal seam strength, (c) allowable fiber stress, and (d) possible buckling influence. Minimum, safe fill heights based on these considerations are proposed. These fills show fairly good agreement with normal installation practice and are felt to be conservative.
In this test, the site was prepared by first cutting into an 8-ft embankment to provide an area 65 ft wide and 30 ft deep. This area had lateral steps so that when placed, all seven culverts would have their top lines lying in the same horizontal plane, while their inverts were bedded on undisturbed soil. The minimum distance between culverts was 4 ft. Figure 2 shows this placement and grading.
Each culvert was bedded on approximately 6 in. of sand. The bedding's average width was two-thirds that of the culvert, a bedding angle of 84° . Height compensation for vertically elongated culverts was provided by settling those culverts deeper in the sand bedding to allow for the level top plane condition previously described. Backfill was placed and tamped in 6- to 9- in. increments to a height of 6 ft above the critical plane level. Backfilling was controlled so that at all times each culvert was filled the same amount on each side. The degree of compaction was tested and verified by a consulting engineer, who also performed the general soil analysis. Compaction was measured at each increment as backfill was placed to the critical plane level. From the critical plane level to the 6-ft level , compaction of the overburden was measured at 1-ft intervals. Any layer whose moisture content was above 18 percent was removed and replaced. The average compaction reached during the backfilling operation to the critical plane level was approximately 90 percent by the AASHO T 180- 57 Method A.
Strain gages were placed on the top, sides, and invert on adjacent inside and outside corrugation ridges of each specimen. In addition, the 54- in. full circle and the 54-in. vertically elongated culverts had similar treatment at their 45°, 135°, 225°, and 315° sections. Gages were of the SR- 4, A- 3 type and were installed before the culverts

6FT
l
30FT
l Figure 2. Test site preparation, placement, and grading.
olo1NG IRACKS
49
were set onto the test bed. Heavy wax coatings were used to give mechanical and moisture protection. A total of 72 active gages were used. A compensator gage was placed in each culvert providing separate temperature compensation.
Attempts were made to measure the amount of pres'tress that occurred due to backfilling the culvert to the critical plane level. Only on the comparatively rigid 24-in. culverts was it possible to get accurate values. Due to relatively minor movement of the culverts, it was possible to get large changes in apparent strain during initial placement. This variability and the physical limitations at the test site made it impractical to measure the amount of prestress the culverts received during backfilling to the critical plane level. Computed stress due to backfilling agreed well on culverts 1 and 2 with the measured values.
All strain gages were wired to a 100- stage switching unit and read by a Baldwin Indicator and later in the test series by a Budd Digital Indicator. During the live load testing of the culvert, numerous passes had to be made over the culvert test area to arrive at a steady strain value. Initial passes at each fill level impressed lower culvert strains than successive loading passes at that same level. A 14-pass replicability test was run at the 2%- ft level. On the third pass, strain on all culverts had increased to within five percent of the largest, respective, strain recorded in the following 11 passes. This test was conducted over a 28- hr period. At all other load levels, it was generally necessary to make five loading passes. When the last two were within five percent of each other, those values were averaged and that strain reported for that particular load at that level. The lower strains measured during preceding passes were discarded.
Soil bearing pressures at the culvert wall were measured at all strain gage locations. Following the procedure established by Kaiser Aluminum, and reported in "Structural Considerations and Development of Alwninum Alloy Culvert" (2), pressure measurements were made through the use of a rubber cell connected by rigid tubing to gages placed at the front of the culvert at the same level as the cell location. In addition to those pressure measurements already outlined, pressure traverses were taken across the tops of culvert 1 and culvert 6. In each case, six pressure cells, each 8 in. long, were placed along the top of the culvert every 2?'2 ft, center-to-center, from the

50
180"
Figure 3. Strain, pressure, and deflection measurements.
pressure cell located directly over the load point where strain gage 1 and pressure cell 1 were located.
Deflection measurements were also made on each culvert. On culvP.rt. 1- 5, horizontal and vertical deflections were measured. On culverts 6 and 7, horizontal, vertical, and 45° displacements were measured. For this purpose, extensometers were manufactured that used 2-in. and 3-in. dial indicators that were read to the nearest thousandth of an inch.
All zero- loads and zero- strains were then measured at the critical plane level. This value is used throughout the data tables as the base value for deflection, soil pressure, and strain.
Measurements of strain, pressure, and deflection (Figs. 3-14) were made at the following fill heights and under the following conditions:
1. Critical plane level; 2. 2'lz-ft of overburden, no additional load; 3. 5 ft of overburden, no additional load; 4. 6 ft of overburden, no additional load; 5. 5 ft of overburden, no additional load;

45°
I I IJ I I I I I 90"
22s• 35•
1so•
Figure 4. Strain, pressure, and deflection measurements.
o•
315
270 II I • I I I I
225
\ \
II. ... I!!
STRAIN IN MICRO INCHES PER INCH
iso•
l 45 • '
go•
135°
Figure 5. St rain, pressure, and deflection measurements. 01 ......

VERTICALLY
VERTICALLY
VERTICALLY
2?0 ~ I 1\1 I I I I I
zzs
I I I
rn \flCRO IXC!IES rER
1 so•
4 5 .1
I ' U' I 190•
35°
Figure 6. Strain, pressure, and deflection neasurements.
315
CULVERT
CULVERT 4
CULVERT
CULVERT 1
o•
FULL CIRCLE, 54", 12 GA.
FULi. CIRCLE, 36", 14 GA.
FULL CIRCLE, 24", 16 GA. (SPOT WELDED)
FULL CIRCLE, 24", 16 GA.
45•
I I I "JI -Zll 4 r I I 90 •
STRAIN IN MICRO INCHES PER INCH.
180°
Figure 7. Strain, pressure, and deflection measurements.
c.n Nl

53
I I GAGE NO. I
3.0
2.5
2.0
1.5 ~
""' 1.0
"' .5 J I
0 i\
FILL HGT. {FT l21 5 6 5 4 3 2 VI 0
- .5
v'' -
- 1.0 - - 7 ,__ - --
\ - 1.5
\ ----
- 2.0 -I
•2.5 GAGE NO. ~
· 3.0 I -·-I
,_..-- SOIL LOAD -- ,__SOIL LOAD• -I I I AASHO•H20 -·- r-
I : I Figure 8 . Strain vs soil load and soil load plus AASHO- H20 culvert 1-24 in. FC, 16 ga .
I I GAGE NO. 9
3.0
2.5
2.0 --l.!l -...,
~ 1.0
e \ J " .5 ·--
-~ s 0
FILL HGT. {FT.)21 5 6 5 4 3 2 ~I 0
;; - .5
I 1.0 v - \- --
- 1.5 ./ --
2.D i--- __ ,_. ·- --, __ -- --
• 2.5 GAGE NO. IJ3 ---3.0 ~ --l-,.._.. SOIL LOAD SOIL LOAD_. -..._. --1· I
AASHO·H~O -- -
I I ! I Figure 9. Strain vs soil load and soil load plus AASHO-H20 culvert 2-24 in. FC, 16 ga
s.w.

54
I I GAGE NO. 17
3.0
2.!5 :--r---_ I
2.0 I r--... -/-1.5 >->-- ---
........... ,__ ,_ t-
,__ r'-.. I 1.0
\ .5 ~ --I\' --~ 0
FILL HGT. (FT.)2J 5 6 5 4 3 2 !\' 0
- .5 I -1.0 -- --t- ~ - t-
-1.5 ,_ \ " /
1 L---'
2.0 - ·- --- - - -l---'
-2.5 ~;;-L I
·3.0 t- I - 1- - t-
i--- SOIL LOAD SOIL LOAD+ -,___, ' I AASHO-HtO
I I I Figlll'e 10. Strain vs soil load and soil load plus AASHO-H20 culvert 3-24 in. VE, 16 ga .
I I GAGE NO. 25
3.0
2.!I
2.0
~
1.:1
r----. ~ 1.0
)__ .5 I\
\ ~
./ 0
FILL HGT. (FT.)2J 5 6 5 4 3 I 0
- .5
~ -1.0
/ - \ --1.5
\ -2.0
·2.5 I GAGE NO. zg \
·3.0 I I .
~ SOIL LOAD SOIL LOAD+ -' I AASHO-HtO - ~
I I I Figlll'e ll. Strain vs soil load and soil load plus AASHO-H20 culvert 4-36 in. FC, 14 ga.

55
I I GAGE NO. 33
3.0
2.!I
2.0
~
1.e -......
"" 1.0 \ ·--
.5 I\
\ I 0
FILL HGT. (FT.)21 5 6 5 4 3 2 I 0
·- .5 ---1.0 ~ _\
- 1.e ~~
~
/ I\
2.0
· 2.5 GAGE NO. 37
· 3.0 I I - SOIL LOAD SOIL LOAD• -I
AASHO•H20
I I I Figure 12. Strain vs soil load and soil load plus AASHO-H20 culvert 5-36 in. VE, 14 ga.
I I GAGE NO. 41
3.0 ------ - - -- >--
2.5
'
·- --,_ --1- . 2.0
I/
~:t; 1.5 ·-· - -- - ··--- t-·- - - - -- I---
t--t--r---1.0
,___ ,_ ~ I-<--
t---~ I .5
1\ 7 I 0
FILL HGT. (FT.)21 5 6 5 4 3 \ l j 0
..:'1 - .5 - --
\ ---
-1.0 i.__-; /.. - '--- 1.5 -
~ -2.0 - -- - ,_
-2.5 I - c----1---GAGE NO. 49
\ --1 ·3.0 ~
C-0-- SOIL LOAD SOIL LOAD• -I I AASHO•H20
I ! I Figure 13. Strain vs soil load and soil load plus AASHO-H20 culvert 6-54 in. FC, 12 ga .

56
! ! GAGE NO. 5 7
3.0
2.!I
z.o i-- I
~
1.11
\ 1.0
\ I .5
' ~
I 0
FILL HGT. (FT,)2J !I 6 5 4 3 2 I 0 ~
- .5 - --
v~ -1.0 -- - - -
-1.5 / ,
\_ ,_ -..___ ---z.o -- - --2.5 I
GAGE N0.65 ,_
-3.0 --- I f.,--- SOIL LOAD SOIL LO.t.D + -I I
AASHO~Hl!O
I I I Figure 14. Strain vs soil load and soil load plus AASHO-H20 culvert 7~54 in. FC.
6. 5 ft of overburden with AASHO-H20 loading; 7. 4 ft of overburden with AASHO- H20 loading; 8. 3 ft of overburden with AASHO- H20 loading; 9. 2% ft of overburden with AASHO- H20 loading;
10. 2 ft of overburden with AASHO-H20 loading; 11. l 1/2 ft of overburden with AASHO-H20 loading; 12. 1 ft of overburden with AASHO- H20 loading; and 13. 6 in. of overburden with AASHO-H20 loading.
During the time that load testing was taking place, inclement weather caused testing delays for periods of up to two days. During these times, a limited amount of consolidation of the soil would occur and corresponding changes of strain and deflection would also occur. In these instances the changes due simply to consolidation over a period during which there was no testing are, in part, represented in graphs of strain values as irregularities in the plots. Inasmuch as smooth curves were drawn, these irregularities do not materially affect the results.
An exception to the procedure thus far outlined was the measurements taken at the 6-in. fill-height level with AASHO-H20 loading. At this level, due to a culvert failure on the third loading pass, a steady-state strain condition was not reached. For this reason, the values at the 6-in. level are somewhat subjective. In general, the last strain value recorded is presented in the graphs and tables, for it was the last pass that gave the greatest strain indication. Also, on the 6-in. level, no load deflection data are available because load deflections were not read until it was observed that the strain values were approaching a steady state. Testing was discontinued at the 6- in. fill- height level.
Loads were applied by a single-axle, dual-wheel trailer. A D- 7 Caterpillar tractor was used as the weight on the trailer. Its position on the trailer was verified by an industrial scale to provide exactly 32, 000 lb on the load axle. The trailer position was controlled so that one pair of wheels passed directly over the point at which strain, deflection, and pressure were being measured.

Each test section was 15 ft long and was coupled to an access section of the same diameter, which also was 15 ft long.
DISCUSSION OF RESULTS
57
The full range of data presented in the following pages has all the random scatter inherent in a test of this type. In illustrating examples of pressure, deflection and strain, the use of culvert 6 (54-in. full circle) is convenient because of its complete instrumentation. Figure 3 shows a polar plot of the radial pressures measured around culvert 6 at the fill heights of 1, 1%, 2, and 2Y2 ft. As previously noted, a very interesting correlation is seen between Figure 3 and Figure 4. Figure 4 is the Boussinesq pressure distribution (Q) for the same conditions of load and for the same geometric locations from the load as were recorded and plotted for culvert 6. The curve similarities had not been expected.
Before further consideration of the differences between the generally considered pressure distribution and the measured pressure distribution, other data, concurrently recorded, should be reviewed (Tables 1- 7). In Figure 5, the levels of extreme fiber strain for the same loading conditions on culvert 6 are presented. Figure 4 also indicates a more abrupt strain decrease past the 45° section proceeding through the bottom arc of the culvert than the strain levels normally associated with high-fill loading. E'Ssentially this same strain pattern is repeated on all other culverts. As a cross reference, Figure 5 presents comparative strains at 1-ft level of fill with an H- 20 load on culverts 7, 5, and 3 (vertically elongated). Figure 7 presents the same loading conditions and plots the strain on culverts 6, 4, 2, and 1. In all cases, it is seen that the highest extreme fiber stresses occur in the top half of the culvert. Consideration of these figures shows good correlation between the measured pressures and the resulting strains.
Another set of data should be helpful in fully developing this correlation. Deflections measured on these culverts reveal a performance that is not usually considered. If usual conditions are expressed as a horizontal outward expansion of a loaded culvert, approximately equal to the vertical compression of that culvert, it can be shown that there should be little or no change in the 45° section inside dimension. The actual case, however, is that the horizontal outward movement of these culverts ranged from 0 to 80 percent of the vertical compression of the culverts and diagonal ( 45° section) diameters extended in an amount approximately equal to the outward expansion of the horizontal diameter of the culverts. Measured deflections are given in Tables 1- 7.
Complete comparisons can be made from these data tables, which are a condensation of the over- all data collected during this test series. Strain in the extreme fibers of the culvert is presented on a complete basis for the first time, but are not totally unusual or unexpected as they are in many cases presuggested by Koeph (2). Deflection measurements, although unusual, generally agree with deflection of one culvert measured by Ahlvin (1). One particularly important point to be derived from the deflection and strain data rs the strong proof presented to establish that there is a tendency for culverts under some installation and loading conditions to deform toward a square shape. Data collected by Ahlvin suggest the occurrence of this effect.
As previously mentioned, the strain gages used in this test were single- axis type and could indicate only the hoop strains. Culvert loading of the AASHO- H20 type under low-fill conditions would not produce just simple strains. However, because strains were being read on the corrugation ridges, the effects of complex strains in the strain gage plane would be minimized. Complex strains would increase below the ridges, but there would be only a very narrow area near the ridge where principal strains would approach or exceed the hoop strain at the ridges. The use of these hoop strains in empirically derived reaction formulas would therefore give reasonably accurate maximum representations. A purely theoretical analysis of bending and the resulting hoop stresses indicate that bending is a limiting design factor. In actual practice, the culverts in this test series displayed bending patterns that are difficult to predict theoretically. The load is a concentrated one; and the recipient of the load has a very low longitudinal stiffness and, consequently, lends itself to rapid distribution of the load along

58
TABLE 1
24 IN. FULL CIRCLE 16 GAGE 5/ 16 IN. RIVETED CULVERT
Goi l U,11rJ Onl:£ Goi t Lo1.1d & AA:JHO-H20
Ztrnin 011;:c Strain Str.llin Strain Str.:lin Pod ti on ~ ~ ~ Deflect.ion ~ ~ ~ Deflection
"Fill Ht.2)1' T - 105 87 4 .004 -1163 - 25 0.5 .009
B - 80 - 47 0 s 20 l(J~ J. :i;
·ru 1 m . 5' 1' - lh!i 16z > .cot -JJ 73 - 10 1 . 001
B - 188 - 72 0 s j ;>() p I..
•ru1 11t .. 6• T • ?CO 152 .I .()();!
-1093 -1025 L~ .004 - 170 - 77 0
~~ 120 ' · ~ f!ll 111 •• 5• ·r - ?:,tJ l'J'/ 11 . 010 - n8 242 ? .001 s -1050 5 2. 4 .011 - 993 . 75 o.8 .099
- 1?8 -110 0 - 320 - 57 0 !l lU~ I~~ ~ . ~ - &o 100 1.8
nn Ht..11• T - 160 307 6 .024 s - 555 - 98 } .020 B 0 43 0 s - 218 2:!!1 ~ · 2
fill Hl.3 ' T - 810 670 11.9 ,099 s - 718 - 153 6.5 .oao B - 190 268 0 5 - 21>8 ~ 6. ~
fill Ht.2l'1 ' ( p...,~- <8•' T • 345 307 5.2 .o48 - 744 556 10 . 088 s -2065 - 65 1. 5 . o48 748 - 171 6.5 . 075 B - 55 168 15 - 117 203 15 s - 1:1~ 2i1~ 2 . ~ - gi2 22,l 6
fll.l Ht. 2 ' {Prc-Tl!.ilt) T - ?25 217 3.5 .024 -1108 964 15.2 .151 a -194, . 0) .) .03~ R~.~ ~'.'? 8.5 .131 B 0 lo8 15 - 240 }8} 15 s - 6'l 122 l.~ -m ltOO 8.2
F'!ll Ht· '' CPoo.t -Tead T - 215 245 4.7 .157 s -2505 - 87 . ? . 065 8 • l ?.O 296 15 s l?.3 lllz 2. 5
l'iH llLJ11' (Pro-Tout) T - ll5 w - ?J.2'• 15}1• 8 . 21} s }5 795 - 503 ,, • 2•11 B - 115 ~18 - B}8 881 15 s 75 1112 .. 515 :m 5, 5
Ftll Ht .UP (Pool- Teol) T - 55 - 53 2 . 165 s -1845 - 355 ,7 .176 B - 635 743 15.5 s 305 - 102 2
nu Ht.1• (Pr.,·Tootl T 15 - 73 31 . 140 -2675 2187 31 . 574 s -1845 - 245 13.5 ,153 805 - 345 17 .406 B - 545 688 16 - 935 ?,118 16 s }20 - 122 16. 5 • 1005 145 12
Fill Ht . li {Pon<-'l'•a tl T 105 - 123 0 .196 s -1845 - 275 l . 191 B - 685 928 16 s N - 122 2 . ~
nu 11• . *' Pre-~~nll T - 160 27 -9145 8017 s -1775 - ''"O 775 - 175 B - •35 5?~ - 1.395 1425 s Z2 IZ~ -1812 llil~
Fill Ht.)\ • (Post-Test) T - ••19 ?'.)25 0 . 3116 s -?3115 - 165 .5 . 158 B - 735 835 16
2 . r.
UNITS I .'Hrnin: Micro-in./in • Premrnre: P.S.I. Oerlnction: 1'11oucmndtt'rlot nn inch
+fill hrrip;ht llr. fill i:·, lwi nr~ i ncrc:i: P.rl, Rr>m1iini n!~ fill h r?ir,htr; n r-e .:\Fi fill ir. bP.ins t'cmovcd .
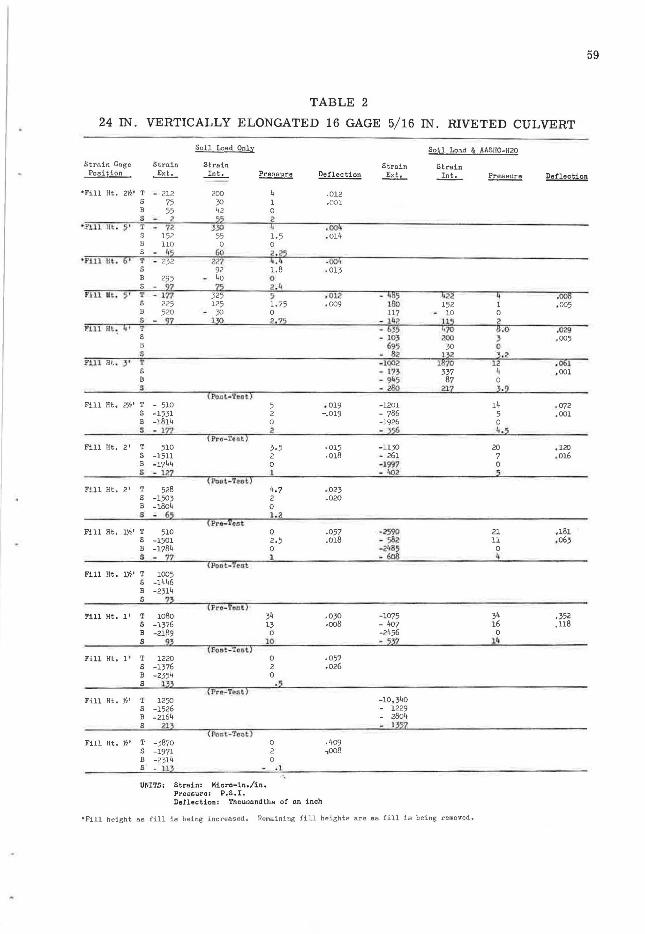
59
TABLE 2
24 IN. VERTICALLY ELONGATED 16 GAGE 5/ 16 IN. RIVETED CULVERT
Soil Load Onl;r Soil Load & AASHO-H20
Strain Gage Stro.in Strain Strain Strain Pas! tion ~ ~ ~ De flee ti on ~ ~ ~ Deflectioll
'Fill Ht. 2Y,,• T - 212 200 .012 s 75 30 1 . ()()1
B 55 42 0 s - 2 ~~ 2
' Fill llt. 5' T - 72 3JO ,, .oo4
s 152 55 1.5 .014 B 110 0 0 s - Ii~ 60 2 . 2~
' fill Ht . 6· T - 232 ??? h.~ .()()1, s 92 1.8 .013 B 295 - 4o 0 s - 2Z 22 2. 4
l'lll Ht. 5 ' T - 171 325 5 . 012 • 1185 11 22 4 .OOI! 225 125 1.75 .009 l8o 152 l . 005
B 520 - 30 0 117 - 10 0 s - 2Z l:lQ a. z~ - l'•?. u:z 2
f'ill llt~ ,,, T - 635 •·10 8.o .029
s - 10} 200 } ,005 B 695 30 0 s - 62 1;g ~ - 2
Fi.U Ht. }' T - 1002 1870 12 .061 s • l?} 337 ,, ,001 B - 945 87 0 s - 280 217 }.9
(l'l>ol-Teat) Fill Ht , 2*' T - 510 5 • 019 -1201 14 ' 072
s -1531 2 -. 019 - 786 5 . 001 B -1814 0 -1926 0 s - 1?7
\Pro-Te ot) 2 - ):;6 4.5
Fill Ht. 2' T 510 3,5 ·015 -1130 20 , 120 s -1511 2 .018 - 261 7 , 016 B -1744 0 -1997 0 s - 127 1 - 11()2 :i
(Pool-T,,otl Fill Ht. 2 ' T 528 4,7 .023
s -1503 2 .020 B -1804 0 s - 6 1 . 2
Pro- c&t Fill Ht, lY,,' T 510 0 .057 -2590 21 ,181
s -1501 2 . 5 .018 - 582 ll . 063 B -1784 0 - 21•85 0 s - ?7
(Poot.-Teo:t 1 - 6o8 4
Fill Ht. ll>' T 1005 s -144 6 B -2314 s
Pra-Teo~ Fill Ht. 1 1 T l08o 34 .030 -1075 34 ,352
s -1376 13 -008 - 4o7 16 .us B -2189 0 -2456 0 s 9} 10 - 537 lit
(Poe t-Toa d Fill Ht, l' T 1220 0 .057
s -1376 2 .026 B -2354 0 s I
Pre-tea t Fill Ht. Y,,• T 1250 -10,340
s -1526 - 1229 B -2164 - 2804 s 21} - i;m
(Po3 t-Toot) Fill Ht. y,• T -3870 0 .409
s -1971 2 .,008 B -2314 0 s - l1 - .l
UNITS: Strain: Micro-in./in. Pressure: P.S.I. Deflection : Thouaondths of on inch
•Fill height as fill ia being in creased. Remain ing fi ll heights are aa fill is being removed.

60
TAHLE 3
24 IN. FULL CIRCLE 16 GAGE SPOT WELDED CULVERT
Soil Load Onl:z: Se>il Lond & AAS110-H20
Strain Gnge Stroin Strain Strain Strain Position ~ ..!!!h. ~ Defle c tion ~ ~ l'reasure Deflection
•Fill Ht.2)1 1 T - 170 145 .005 - 97 60 .011
B 85 67 0 s - '·~ 0 ·~ ·nu 11~.5· T - i'I 1~5 s .055 s - 3'1 105 2 .013 B 103 10 0 s - ro l~ · ~ · ru1 H·l.6' T - 223 155 5.5 .055 s - 82 70 2 .on B 75 - 75 0 s - Zz ~~ .?
F"ill H~. 5 ' T - ?55 225 s.s . 055 - 325 <!50 5 .056 s - 62 115 3 . o88 916 128 2 .012 B 100 - 70 0 ?5 - 57 0 s - n 9~ i.~ - 1110 10~ ds t'.l.ll lit. 4• t - ~15 }<!5 .055 s - GO 205 3.25 . oo6 8 -1852 - 35 0 s - l 'l8 m i .12
nu HL. >' T - ?95 ll . JOZ s - 16? )00 5 .oa a - 1'•2 175 0 s
(p.,~ -Tut) • 3Go 323 4.5
Fill Ht,2)',' T - 438 - 377 5.1 . o&> - 831 582 ll .104 -3908 195 2 .00} - 218 260 5 .020
B - 122 88 0 - 177 83 0 s -9•;2 ~
( Pt'e-Tutil) 2. 4 -m 26? '•·5
Fill Ht.2 1 T - 448 - 377 4.2 .076 -1293 1053 15.5 .178 s -3913 185 1 .001 - 247 }50 8.1 .07? B - ~~ 3 0 - 332 278 0 s 246 228 1.7 - 508 '453 6 .5
{Poqt.-'rl'et Fill Ht. ?' T - 566 - 182 6.o ,113 ,
s -3820 170 2 .029 B - 182 193 0 s :.o8 ll~
(Pre-To~d 2.s
!"ill Ht.lY,' T - 478 - 297 -2150 1817 21 . 333 s -3878 175 - 269 240 14 .195 B - 162 128 - 875 713 0 s _,,,,.~ ~8
{Poo t-Test) - 899 ~1 8 . z
Fill Ht.l)\' T - 623 - 202 6.7 . 218 s -3668 - 195 2.5 .125 B - 647 528 0 s -361?. l.03 I
(Pro-Toa tl Fill Ht.l' T 578 - ?17 .199 -30ll 2238 31.'.J .488
s -3648 - 205 .114 - 276 250 12 .257 B 497 418 0 - 979 812 0 s -}1•92 m 1, . 2 - 818 XZ2 12
(Pool-To~~) Fill Ht. l' T 578 - 307 .248
s -3548 - 345 .157 B - 832 728 0 s .31172 ~8 1,.7
(Prc .. 1'ootl Fill Ht. )\' T -4183 1453 -91108 6203
s - 758 - 985 - 632 575 B -3652 1248 -1552 1388 s -1222 £3 -1!211 1208
CPo• t-Tontl Fill Ht. )\' T _!1!150 1621 .392
-1178 - 615 -2 ,132 B -34'12 978 0
- 1 2 -2208
UNITS: Str1:1.in: Micro-in ./in. Preosure: P.s.I. Deflection: Thousn.ndtha of on inch
•Fill height 9.S fill is being increaoed. Remaining fill heirr,htG aro ns fill iR being removed.

61
TABLE 4
36 IN . FULL CIRCLE 14 GAGE 5/ 16 IN. RIVETED CULVERT
Soil Lond Onl~ Soil Lood & AASHD-H20
Strain Gage Stroin Strain Strain Strain Position ~ ..ltl.,_ ~ Deflection ~ ..ltl.,_ ~ Deflection
'Fill Ht, 2)\ • T - 167 U5 6 .018 s 5 - 13 1.5 .009 ll - 220 - 83 o s 2~ - 100 2
"fill Ill. !i ' 'I' - 192 - l'i'O 6 .018 s 22 15 1.75 .012 B - 210 - 150 o s 22 - lit<> 2
•hn Ht. 6• T - 225 147 5.5 . 023 s 2355 32 2.3 .013 B - 218 - 180 o s ~~ - 12Q 2
f'J.11 Kt . 5 ' T - 2 7 202 6 .002 - 3~:; 250 5 .O<O s 550 5C 2 .926 152 6o 1.7 .015 B - 240 - 150 o - 2<8 - 143 0 s 6~ - 10~ ~ &I - 1 •1~ 2
f ill Ht. 4• T - 502 375 8 .025 s - 55 Bo 2.6 .043 B - 138 - 95 0 s Zz - llto ~.:22
flll Ht. }' T - m &;>i 1;1 .9 .125 s - 75 55 3.5 .096 B - 130 5 o s
(Poot·Toot.l 30 - no q
Fill Ht. 2Y>' T - 543 - 1•52 .075 -1143 705 15 .141 s 45 17 .070 - 37 46 3.5 .102 B 2 o 23 o - 52 - ''2 2. ;i 6z - 43 4
CPro--Tonl) Fill Ht. 2' T - 453 - 512 5,5 .065 -1863 603 21 .284
s 75 3 1.7 .065 - 75 52 4 , 5 .175 B - 18 0 189 o s - '•z - ~2 2. - 100 - 132 6
(Post-rr1tt1 t) Fill Ht. 2 ' T - 448 - 494 11 .124
s 105 - 45 2 .117 B 90 0 s 10 - ,,
Pr"- e11t Fill Ht. 1}>' T - 453 - 512 1 • 223 -3399 1794 29 • 564
s 95 - 33 2,5 . 207 - 102 67 4, 5 .296 B 12 3 m 0 s - 15 - 22
( Poc;t·T• oti) 3 - ~s 54 5
Fill Ht. l*' T - 713 - 482 s 245 - 263 B 182 s
Pro-T~sl
Fill Ht. l' T - 643 - 562 1 .194 -3884 2071 23 ,685 s 250 - 265 2 .191 119 - 19 3 .393 B 172 3 - 263 4 s 30 - u:;
1.Pool-T.,.d 2. . 2 - ''•? 21 7,5
Fill Ht. l' T - 563 - 762 o . 230 s 305 - 343 1.5 .254 B 262 ) s 125 - ~~2 2
( Pro-Teo ti Fill Ht . !>' T
s B s
Por1t-T~tH.
Fill Ht. )> • T o s -1 . 5
4 0
~~ITS: Strain: Micro-in./in. Pres(jure: P.S.I. Def lee tion: ThoUDBnd.ths of an inch
• F! 11 heicrh t aG till i:; being increa::;ed. Hemaining rill heights are as fill is being removed .

62
TABLE 5
36 IN. VERTICALLY ELONGATED 14 GAGE 5/16 IN . RIVETED CULVERT
Soil Lond Onl:l, Soil Load & AASHO- H20
Strain Gnge StrA.in St r ain St rain St rain Position ~ ..l.!!.h_ ~ Deflec ti on ..!lli_ ..l.!!.h_ ~ Deflec tion
• ru1 11t. z»• T - 7} 6? >·5 .002 s 5 - 25 1.5 .OO} 8 1,7 - :io 0 s 18
- l~ 2 ' fill UL. 5 ' T 185 4.25 .005
s }10 215 1.5 .010 n }8o <!02 0 s ~l~ 16~ 1
·nu rn . 6• T 175 370 11, 3 .CICl1 s 315 190 2 .011 n 397 182 0 s ~28 l'•~ I
f'ill lit. 5' T i/17 }22 4.25 .o 105 1160 1'.1 . 004 s }10 215 2 . 019 )00 J92 1 . 2 .noR n ;B~ J8u 0 )80 16? 0 5 :N 1'lZ 1 ~Q ~~ l
Fill lit . ••• 1' - 220 4 .012 s 110 - 65 2 .026 B 140 - 75 0 s -~ - 120 - ~ hu 1tt. } ' T 285 1 .9 . 041 s ~ - 60 2,1 . o44 8 150 - 60 0 s ,., - 120 0
(Pod t -Todtl Fill Ht. 2*' T - 188 150 4 .019 - 474 '°" 9.5 .057
s 22 - 33 l .028 - 13 - 66 2.8 .052 B 105 - 68 0 92 - 61 0 s - 12 - 82
(Pre-Tes t) - l - 10 - 193 0
Fill lit. L' T - 193 170 3 .u18 -1018 787 17 .1•5 s - •2 - 23 , 5 .02• - 16 - 44 3.2 .09• B 135 - 98 0 7~ 11 0 $ - 2 - z2 - ? - 51' - l S'• ~
(Poat-Toot) Fill Ht. 2' T - 279 285 l'• .o68
s - 62 5 0 .o48 B 150 - 58 0 3 - - l2 - 1
Pre-Teat. Fill Ht. ll>' T - 238 2~ .100 -1803 1465 26 . 279
s 42 - 23 .087 - 94 66 7 .149 B 125 - 48 5} - '•5 0 s - 41 - 22 - 1~2 - 96 J
(Poot-T"8t) Fill Ht. 1Y2' T - 3o8 285
s - 8 - 13 E 75 - 38 s - 109. 18
Pre- Teen. Fill Ht. l' T - 308 280 .085 -2812 2212 32 .428
s 12 - 1) 1 .074 187 - 173 3 .20• B 95 i,s 0 2 26 0 s - 72 18 1.5 - 223 - 57 1,
(J>out-To~I) Fill Ht. l' T - 2)8 185 4. 5 .119
s 32 - 15 1 .115 B 55 18 0 s - 109 28 0
(Pro-Tact) Fill Ht. l /2 'T - 138 i•o -3123 2535
s 92 - 73 - 248 172 E 85 - 38 5 32 s - 89 - 12 - 294 - 19
(Pos t-Tea t I Fill Ht. l/2'T - 193 92 0 .107
s 211 - 61 . 2 .128 B 25 - 20 0 s - 17 - 10? -1
UNITS: Strain: Micro-in ./in. Preesuro : P.S.I. Deflection: Thou.sand ths of an inch
•Fill height as fill is being increa~ed. Hemainin~ fi l l heightG arP. as fill ie being removed .

63
the length as well as around the circumference of the culvert. It should be pointed out that a sharp distinction must be made between the culvert reactions to this type load through low fill and the r eaction that can be expected by high f ill loading. Under highfill conditions a more equal p r essure distribution is maintained around the culvert (2), and the fiber stresses and pressure measurements in the longitudinal direction do not show the variations shown under conditions of low fill and .AA.SRO- H20 loading. This is an important distinction and one that should be seriously'considered in the design of flexible culvert.
DESIGN PROCEDURES
Before testing was begun, it was expected that the results would be consistent with performance predicted by criteria as presented in such publications as those listed here as general references. As data reduction began r eaching a comprehensible level, a lar ge miscalculation in procedure was suspected. After thorough review of the data , a different situation was made clear . Special consideration must be made to predict deflections, stresses, and pressure distributions in culvert installations and loadings similar to those recorded here, as opposed to installations with much lower compactions and loadings by high fills.
Design attention was initially given to the formula for deflection as developed by Spangler (_§):
KWc r 3
in which
Ax D1 K=
We r
E I
E' e
Ax = Di EI + 0. 061 E ' r 3
hprizontal deflection (equal to vertical deflection, Ay) in in., deflection lag factor, a bedding constant dependent on the bedding angle, vertical load per unit length of pipe in lb per lin in. , mean radius of the pipe in in., modulus of elasticity of the pipe material in psi, moment of inertia per unit length of the pipe wall cross- section in • 4 • rn. perm., er == modulus of soil reaction in psi, modulus of passive resistance of the enveloping soil in lb per sq in.
. P s i de perm.= - - - , and
Ax/ 2 Pside == passive pressure measured at the side of the culvert in psi.
Continuing to use culvert 6 as an example, Table 8 gives values of measured Ax
(1)
and Ay vs computed values. Wide margins of difference were found throughout the data. Table 9 gives calculations of the value E'. Numerous manipulations of the Spangler formula were tried with varying degrees of success in predicting the required I for situations in which all other values were supplied. No satisfactory association was found between t he data measured in thi s test series and that predicted by the Spa ngler equation. Additiona l tests or more complete analysis may deter mine a reliable assoc iation . The table of minimum fi ll heights developed by the preceding for111ula and using pressures , deflections (horizontal), and bedding angles recorded in this test indicates very low minimum fill requirements.
A number of questions are left unanswered. Considering the repeated verification of this formula under other conditions of compaction and loading, would this culvert installation in time have performed as the equation predicts? And, with changes in soil compos ition or moisture or compaction or changes in culvert metal, what then is the performance, either in the short or the long term ?
There is a clear indication that other possible des ign limits must be considered. It becomes necessary to define proper safety factors for allowable wall stresses and for shear and bearing stresses at riveted joints. Koeph (5) has established a table of sheet bearing strengths and rivet shear stresses for aluminum culvert where a safety factor of 3. 3, based on ultimate strength, was used as being consistent with the general design

TABLE 6
54 IN. FULL CIRCLE 12 GAGE 3/ 8 DOUBLE RIVETED CULVERT
Strain Gage 'PolJ.!.. t°lOD
Strain ~
So1?. l..oa.d Oftl.y
Strain.
~ ~ ~ Strain Ext.
lciU Led J. .u.51lO-R20
Strain
~ ~
•:nn Ht. Zl'l' T - 85 20il- 2 .030 .026 .004
45• 270 154 2 s 247 219 . 5
n5· 282 202 i.5 B 320 157 0
2~0 2~ l~ 2 s <!9' 8o5 . 5
315° 220 r!>? ··~ ·~!I· T ~- . ...,---- - --..;,,-- .l"ii
45• 312 87 0 , 120 s 165 242 3.5 .021
135° 250 ,,, 6 B397 77 0
225• 339 e, ' ~- ~ ~J l
•f'ill il t . et• r - ») ~7 't .6 --.1~
·~ 290 19 0 - ·~ ~ ~ m ~ ·= i»• u~ ''° •.2
·3 "«> • 37 0 ~· }:Ii! YI •.? •••• 81.2 )
ll5. 205 ~ "·" FW St.,. '? • li;cl .3:'JO 6. .. 1~ - ~o :no "'
.,. ~ 6'J l.15 .1,i+ };,) - 2) 1 a 15 m ' ·' .o,a 60 <62 '·9
1)5' ZlO 1!2 }.5 ZS2 li!O ) . 5 !ll.O 50 0 .:.27 too- 0
~· ~ 9f~ t75 ~ J; ~.9
~
.101
.077
. 016
U'i• :r:l.? lq<:;t ' 220 l~-- J.~'--------fLU Bt. 4•
4;
0 '" r~ ~~ ~:;' - - :iZ?
s 165 5 3.5 . 049 135' 17 - 140 3.0
B 182 - -l08 O 225• 8lt - 16o 4. 75
s 0 '87 3 'nY ~ _J9 _ __;·:...:.U,..~c__....;.),_,.zs,,,_ _____ _
rm ii 'C • .,. y .. <150 ~ .. c19 ~ m ~ .ill s - 190 25 • 069 ~ -~ -~
• m -= 225• 104 - 16)
s 2 ~" ,,,,. - '° -, e ffiCt-"':ut..}
Fill Kt, 2*' T - 675 212 4. 5 . 215 -lo65 437 12 45" 145 - 283 - .5 .154 164 '"" 615 4.2 s .. l.45 70 2.4 . 073 - 776 45 4.8
135° 10 248 3 l 2Lto 3 B 203 - 223 5 198 ~ 215 0
225• 12? - l.72 " 5 ll7 - 17? 0 s - 15 SI,; 6.7 - ., "84 2.8
:llY n t. - 26 • Z
• 268 . 1?2 ~ 086
Fill Ht. 2' T 45• s
135° B
- 645 130
- 740 20
193
TI't:C-t· .. t.) 232 } .208 -1387 882 16 .348
- 233 -1.2 .152 210 - 6r.i. 8 .195 70 2.5 • o68 - 821 105 5,5 .12}
268 2 -40 308 5 -208 0 208 •203 0
22"i 0 ,,, _,r.., i. 14o ·162 5
TABLE 7
54 IN. VERTICALLY ELOKGATED 12 GAGE 3/8 DOUBLE RIVETED CULVERT
lio!l Load O)il.y .Soh Lend t. l.lGR0-.!20
H r aio Gage Strain &tr&i.ll Strd.D Strain
~ ~ ~ Pr.e l!l1n1r• D•:!l• ot!c= ~ ...!!h. ~ D•.f'.1H t.! C13
•Fill Ht. 2* 1 T - 25 - 123 4 .ozo 45' - }8o • 85 1 .on S-90 -.52 0 .oo4
135° 218 .. .53 0 B-<07) - yr/ 0
rn• 13) - "'' 2., • - 21' - 87 0
""Jl'Y - U5 S l ·~Pit.. ~ I T Zl' ~- , .06'/
~,. - 62 1'7 2 ·'"" g ,,, 20) > . aio
lW 9'> n1 4 I -16.S • ll? ?
22;0 692 ... 8} 6 s - 20 •• , 0
ll5 '_ 155 - 2}) • • , •nu h. 6• ~ 21Y! l.SI S .DS?
45' - 92 ll.2 2 . c6) 6 115 170 1,8 . QlD
13'' 1078 175 2 B -1618 • 290 0
225' 7}0 - 130 5.8 8 • 2} 1!68 0
M5• 1.1'" m 2: .. 9 ,...u ... ,.--: o> ·= 1.s ·™ 90 t><> s .Oli9
•5· • n t40 , . oM - w •'1 i .a .051 5 12.5 133 a. .019 102 10, l .003
n;• 1118 200 &. :i..ZJ.! 195 1.5 B -16"8 - 277 2 - 1(.66 • ~ 0
225• 755 - 145 • no - 1~ 4.4 8 l <;O 14) 0 - 18 11' 0
)15' 150__ 2j0 - - }.) . -- - 1"" -- _ 167 • ·l 1:.u Ht . 4' 1 T • iO) " S.1' ~C:95" ·r : ~ : rn i·' :~?
13'0 117) - 'O 4 •• , B -1895 - 470 2
225• 61? - ID 5,5 8 -235 - 115 0
n s-- • 100 - 9' 4 fill Kt~t- ---.. ~ 90 · ill
45• - llO 273 .107 8 - 50 - 177 .025
13;• . 1578 .. 1' B -1903 .. 422
225• 8o7 - '1.5 .6 - ~ - 102
!>W _ _ __ ___ 85 • 100 CPoal.,,;1'c111':. )
FUl St. ~1 T - 255 • . 2 .102 • 652 l} .144 .117 .029
45' 168 - 21+3 .1 s - 43 4
13.5. ZJ.3' • i.s 4 B 1950 672 ' 225° ·1005 • 323 5.5 6 - l? - 32 5
"'. - 75 ~ 2 (J1o,., .t .. 1)
:t . 2 ' T - 225 4.5 45• 158 - 198 .1
5 - l8 l 135' 215} - 43 3.5
B 1945 - 42} 2.5 225• - 975 - 298 5
s 7 - 16 0
.100 152
.021+ - 62 ><m 1946
.. ioy.. - lJ .. ns
.102 - 785 ,102 178 . 011 l
2136 1951
- 869 6
- 430
20 - 448 - 336 - l 2) - )61
- 410
24 - )99 - )01 - 96
5.5 2.0 1 .2 • 3 0 0
16.S 5 2 4.5 4 6 0
.193 ,13' .o48

LS • 20 5,5 1.2 • }5 :il> > >IS" 32 - 7" 1 10 - >90 s.s
(Poin.-t. 11~ )
fill Ht. 2' ~ - 815 417 3 .~ 45• 165 - 194 0 • li6 s - 790 120 3 .ooz
135" 8 306 B 233 - 213
225• 150 - l 7i:. s 2 590 l
315" 132 - 123 - _,.
(Pre-Test) fill Ht, l*' T - 720 332 -22,30 lOJ.5 23 .535
45• 145 153 35'+ 1JO 11 .259 5 - 795 llO - 908 1?2 5 .177
135" 5 323 - 63 }lo'/ 5.5 • 193 - 203 201 }&>} 0
225" 132 - 162 129 - )} 5.5 • - 20 615 - 68 .m 3.5
)15' 102 - U} .,_ 12 (t"oo&-'lt1111:.)
Fill Ht, l*' T -1205 51? 4 .322 '5" 235 24J 1.5 .199 s - 870 l?O 3 .126
135" 15 278 3.8 B 2}3 - Zl3 0
225• 13? - 172 4 5 - 45 615 l. 2
'!15. 2'2 - >83 l U're-fe.t1:.>
rw 1t. l' ., ... at5 r..u .t .J)ll - )6.15 2920 "2 .. 761 ,,. 200 a6? 1 .196 625 -157) 16 , l'.15 s - 675 l)O }.2 .099 -1045 ;,>) 6.; . <'/6
·~· l~ - ~ ) : ; - ;~ - ~; ~ 225' llO - l?Z ;.2 ~ - 182 6
s • ., Si~ 2 • 135 ~ 2. 7 'll5' 232 - m .,_ ,., - 61 1 •
UG.0-t---TH: ) Till Ht. 1' T - 965 462 0 ,363
45• 295 2187 2 • 228 s - 9'1-5 19Q i...s .1s1
135•-4-0 )08 5 B 173 - 2)) 0
225• 102 ... 192 -!i-s -125 6)0 2
'll,. WI • J'i} - • (fre--Tu t)
J'ill Kt, l/2 1'1' - 915 412 }4o? i.s• 215 2081 -1m s - 905 18o 250
1}5' - 30 }18 338 B 143 .. Zl3 - 211
225• io2 - 162 - U? s - U5 625 578
}15' 28.l - Jl''-------------'=--~=----------CP011Jt.-'ru t) 1'ill Ht. l/2'T -1305 667 0 • 399
45• 1153 - 253 1.5 • 241 5 -1007 158 4 .164
135" - 85 200 3.5 B lo8 ,.249 2
225• 22 - 1'4 5 s - 21? 620 2
315• na - 393 - · '
UHlTS 1 Strain: Micro-1.n,/in. Preaaure: P.S.I. DefieetJ.oa.: 'l'boueandtb111 or u 1.ncb
•fill beign.t a11 rill ie being increaaed. Remaining !ill height111 art &Ill !ill illl bdng T8lllOTed,
'})'' • "" } .3 - IOi - fS'l 5 ' (Pc1\.-Tutl
1111 Ht. 21 T -m 12 .122 .,. Zl2 2}1 • 1 . l.l.l. 5 22 .5 -020
1'5" Zl59 10 3 B 1949 - 1+10 3
225' 1137 - 298 5 6 3 3 0
~1~· l - 2 - l (Pre-'I'ut)
fill B.t. 1*' 'I' - 2?0 -2115 31 .24o 45• 183 • 163 418 - ?93 8 . 169 s 2? - 26 .5 .. 161
135" 2173 • 48 2071 9? 3 B 1910 - }68 1910 • 358 3
225• -113? - <?O 10?0 .. 2?8 5
.}~=~ i~ = l~ =~ ii' )'ill iii.. Ui' 7~ (P91n.-7Ht) ,.7 .lfl'7
.,. '18 - ~> -1 ol)l • - 38 • 18 • .066
lW -> - 18 • • 1900 - •18 4
•<o· -m - '°' 6.o • - •• ' 0
JIW -10 - &? -1 ~••tJ
Fill Ht. 1" T - 190 .5 .127 -3145 36 45• 278 - 263 -2 -127 578 -1123 10 s 22 l.!5 • 025 - 38 1
135' 2053 12 3 1953 6? 5 • 1890 - }48 4 186o - 393 ;. 5
225' 9» - 263 5.5 - \>05 - 318 4.5 s - S? 2a o - 147 48 o ~- } __ __ - . 5 • 5 - S2? U.5
Gi'Gic:;;:fQTI Fill Bt. 1 1 T - }15
45• 398 393 s 8
135' CO» 2 • 18?0 • }88
225' U} - }08 5 - 17 88
115• us - 152 . \P.J.a.-'l:Ht]
.174 .149 .091
N.ll Mt. V.?lT - 2.S' -J8lo .,. J)S • 518 ,., 1200 • 22 22
lJ5' ao3 - is 20.ia ,. • l.84c5 - "8 1114) -368
~-= ., == =~ .315'· 1,.2(1: - 1"2 "t?l -1~2
l101t~tfi11tl Fill Bt. 1/2 1'1' - 410 0 • 185
45• 236 - 248 0 .157 s a.2 1.5 • o8}
135" 2'32 - 18 3.5 B 18?0 • 336 5
225" 695 - 268 6 s 137 11+6 0
315° 100 - 125 - .5
UNI'l'& i Sua.S..u Mlc.ro-in./b. Pr.eu~.iM,: P .S . l . 0.tliKW.at 1'hou.MD4t"ta. oC -.n inch
•n11 beight aa !111 h being increu11d. Reniaining !ill heighte &re u fill il!I beia.g remand,
.545 . 193 .204

66
Culvert
2
3
6
Fill Height
(ft)
5 3 2 1 5 3 2 1 5 3 2 1 5 3 2 1 5 3 2 1
TABLE 8
Cam.pl..!ted l!.xa (in.)
0 . 385 0.197 0. 678 0.864 0. 074 o. 078 0.250 0. 778 0 . 041
0. 071 0. 330 o. 086 0. 426 0.855 2. 74 0.051 0. 663 0. 913 2.24 0.254 0.000 1.18 2. 28 o. 784 2. 23 3 . 36
11. 6
aFrom Spangler 1 s formula (Eq. 1) ~
MeaS!!!' ~ci l!.x
(in.)
0.009 0 . 080 0 . 131 0.406 0 . 012 0. 021 0.072 o. 257 0 . 005 0 . 001 0 . 063 0 . 118 0 . 015 o. 096 0 . 175 0. 393 0 . 008 0 . 044 0 . 094 0 . 204 0.077 O. !Gl 0.195 0. 275 0.051 0 . 107 0 . 133 0 . 193
M1?asur1?rt l!.y
(in. )
0. 001 0. 099 0.151 o. 574 0.050 0.102 0.178 0.488 0.008 0 . 061 0.181 0. 352 0. 020 0.125 0. 284 0. 685 o. 004 0. 041 0.145 0. 428 0.101 o. 219 o. 348 0. 761 0. 049 0.113 0.193 0. 545
TABLE 9
MODULUS OF SOIL REACTION, VALUES
OF E ' , AS COMPUTED FROM TEST DATA
Culvert
I 2. 3 4 5 6 1
Modulus (psi)
1, 026 2, 802 4, 135 1, 742 2, 312
990 384
Average modulus = 1, 913 psi.
practice for flexible metal culverts. A safety factor of 1. 85, based on yield stress, was considered sufficient for application to bending and compressive stresses in the culvert wall. This same safety factor is suggested in an ASCE Proceedings paper (13) covering aluminum alloys. It is acknowledged that the only true measure of a design safety factor is in testing a large rep
resentative product sample to failure. It was not, however, within the scope of this lesl lo tesl all culverts to complete failure. The test was terminated when the first culvert failed. That failure was a two-point failure in culvert 4 (36 in. 12 gage, full circle), that occurred at the 6-in. fill- height level under an AASHO- H20 load. Rutting under the load wheels reduced the soil cover to 4 in.
In addition to the design limits imposed by allowable deflection and allowable shear and bearing stresses, two other areas warrant consideration. Both arc generally considered in structural design problems. The first is that of the combined bending and compressive stresses in the culvert wall; the second, that of the influence of buckling limits.
In the former, assimilation of this test data yielded an empirical mathematical expression for the combined compressive and bending stresses in the culvert wall. The basis for the equation is the expression for bending moment in a tube due to uniform load, where from Roark~):
in which
M = moment at a point on the tube, w = vertical load in psi, R = mean radius of culvert, and k = a constant dependent on the manner of loading.
(2)
Because the data show the maximum bending stress to occur at or near the culvert top, a summation of all loads contributing to this moment would be
(3)
Further (as illustrated in Figs. 2 and 3), w1, w2 ... wn can be expressed as a func~ tion of the unit load at the culvert top, w, and the radius of the culvert, so that for any given R
(4)

67
substituting: (5)
resolving: (6)
equating: (7)
in which
ST f3 = bending stress at the culvert top
and rearranging: (8)
Little accuracy is lost if the total stress (compressive plus bending) in the critical range is used in place of S. As a practical matter of developing a design tool the equation can be written as
c 2 Stotal = T wR [Cr K] (9)
From Eq. 9, using data collected in this test, a curve relating culvert radius and Cr K can be drawn (Fig. 15). This equation was used as a design guide based on a maximum allowable stress of 11, 800 psi. The curve of Cr K determined in this test was extrapolated to culvert diameters up to 84 in. so that an estimate could be made of the maximum allowable loads, w, on culverts other than those sizes that had been tested.
The fourth design consideration included in this minimum fill-height table was that of buckling. Of the three design criteria previously discussed, longitudinal- shear and -bearing stresses, deflection, and bending-compression stresses, only the former was evaluated in the same manner as for high-fill loading. The remaining two criteria required special consideration. Deflection showed marked irregularities between measured data and theoretical deflection. In considering fiber stresses, a combination bending-compression formula hides to some extent the individual nature of these stresses. Most significant though is the evaluation of these stresses and the eventual location of the maximum stress at the top of the culvert. The vertically elongated culverts all showed high stresses at the invert that generally remained comparatively high, but leveled off with increasing load and near the one foot of fill level were exceeded by the stress at the culvert top.
As it was in two of the three design procedures previously discussed, buckling, too, should be approached from a slightly different point of view than that normally used to analyze buckling in conduit loaded by high earth fill. Buckling may be an important short- term design consideration under conditions similar to those imposed by this test. It is believed that long-term design considerations for low fills and AAS HO- H20 loads would be controlled by allowable fiber stresses and culvert deflection in situations where initial compaction is high. However, for the short term it appears that additional protection may be necessary. In fact, little is known about buckling failures in existing culverts under low fills subjected to
40
35
~ 30
~ 25
0 < ~
15
10
Figure _!_ ) .
\ \
\ \ ~ ~ r--
.010 , 020 .030 .0 40 .oso
Bending moment constant (CrK).
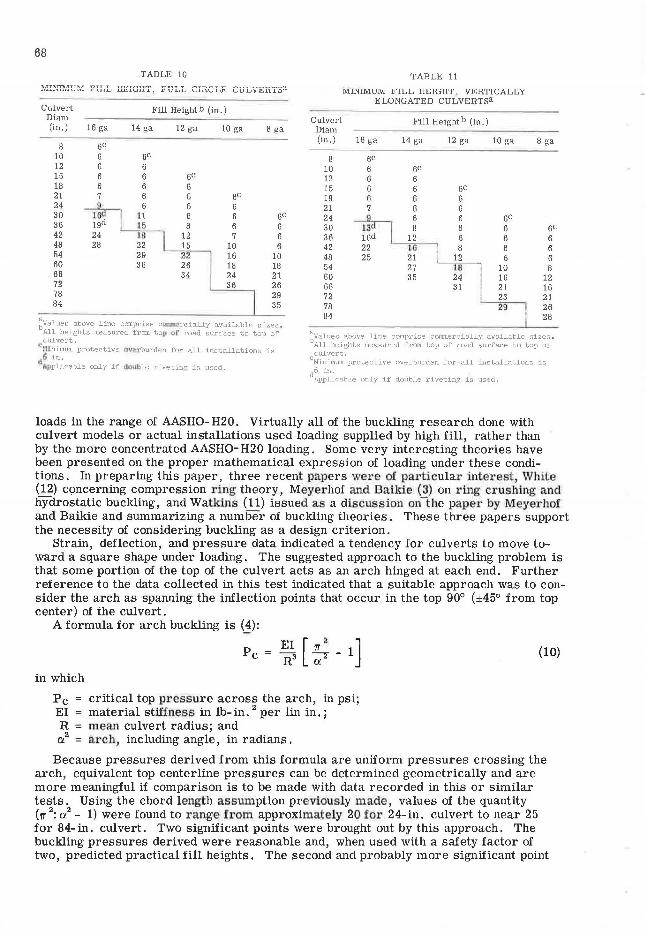
68
TABLE 10
1'.'1:nill.1UM: PILL IIEIGIIT, FULL CIRCLE CULVERTsa
Culvert Fill Height b (in. ) Diam (in.) 16 ga 14 ga 12 ga 10 ga 8 ga
8 5c 10 6 5c 12 6 6 15 6 6 5c 18 6 6 6 21 7 6 6 5c 24 6 6 6 30 l1 6 6 5c 36 .15 8 6 6 42 .18 12 7 6 48 22 15 10 6 54 29 2 16 10 60 36 26 18 18 66 34 24 21 72 36 26 78 29 84 35
~alues above line comprise cUl:lmercially available sizes . All heights measured from top or road surface to top of culvert.
c~.Unimwu protective ovM•burden for a]_l installations is
46 in. f1jjplicable only if double riveting is used.
TABLE 11
NllNlMUM ~"ILL Hl!:lUH'l'. Vl!:HTICALLY ELONGATED CULVERTsa
Culvert Diam
Fill Height b (in.)
(in.) 16 ga 14 ga 12 ga 10 ga 8 ga
8 5c 10 6 5c 12 6 6 15 6 6 5c 18 6 6 6 21 7 6 6 24 6 6 5c 30 8 6 6 5c 36 12 6 6 6 42 JG 8 6 6 48 21
11 6 6
54 27 B 10 8 60 35 4 16 12 66 1 21 16 72 23 21 78 2El 26 84 28
~alues above line comprise commercially available sizes . All heights measured from top of road surface to top of culvert.
cMinimum protective overburden for all installations is
d6 in: . . . . Applicable only if double riveting is used.
loads in the range of AASHO- H20. Virtually all of the buckling research done with culvert models or actual installations used loading supplied by high fill, rather than by tho moro concontratod AASHO- H20 loading. Somo very interesting theories have been presented on the proper mathematical expression of loading under these conditions. In preparing this paper, three recent papers were of particular interest, White (12) concerning compression ring theory, Meyerhof and Bailtie (3) on ring crushing and hydrostatic buckling, and Watkins (11) issued as a discussion on-the paper by Meyerhof and Baikie and summarizing a number of buckling theories. These three papers support the necessity of considering buckling as a design criterion.
Strain, deflection, and pressure data indicated a tendency for culverts to move toward a square shape under loading. The suggested approach to the buckling problem is that some portion of the top of the culvert acts as an arch hinged at each end. Further reference to the data collected in this test indicated that a suitable approach was to consider the arch as spanning the inflection points that occur in the top 90° (±45° from top center) of the culvert.
A formula for arch buckling is ~):
(10)
in which
Pc critical top pressure across the arch, in psi; EI material stiffness in lb-in. 2 per lin in.; R mean culvert radius; and ci arch, including angle, in radians.
Because pressures derived from this formula are uniform pressures crossing the arch, equivalent top centerline pressures can be determined geometrically and are more meaningful if comparison is to be made with data recorded in this or similar tests. Using the chord length assumption previously made , values of the quantity (rr 2
: a.2 - 1) were found to raIJ.ge from approximately 20 for 24-in. culvert to near 25
for 84-in. culvert. Two significant points were brought out by this approach. The buckling pressures derived were reasonable and, when used with a safety factor of two, predicted practical fill heights. The second and probably more significant point

69
was that the approach is based on the assumption that the culvert installation is rigid enough to establish inflection points in the culvert over the arc ±45° from the top centerline; and that as soon as the degree of restraint maintained in this test is released, it will no longer react in the same manner. With the full culvert wall (from top center ±90°) acting to assume the loading, Eq. 10 is not continuous and either bending or deflection would control design.
This hypothesis of buckling performance also defines its application as a design factor. The general application is to highly compacted installations where low fill and relatively concentrated loads will be encountered-unpaved roads, airport installations, and during construction at most sites.
SUMMATION
The preceding discussion pointed out that, for low-fill AAS HO- H20 loading, culvert design in well-compacted installations was initially limited by three stress determinations: bending stress, buckling stress, and longitudinal seam strength. Long-term design solutions appear to be controlled by deflection, longitudinal seam strength, and bending stress. The included fill- height tables contain provisions for these design controls.
The allowable bending stresses all reflect a factor of safety of 1. 85 or greater, based on a minimum compressive yield strength of 22, 000 psi. This safety factor was based upon considerations which developed the same safety factor for alloy 6061-T6 and 6062-T6 in aluminum bridges and associated structures ~). The safety factor of 2. 2 on ultimate strengths (minimum ultimate strength for culvert alloy is 31, 000 psi), was found not to be a limiting factor in design.
A minimum safety factor on buckling stress of 2. 0 was selected from examination of long- standing design criteria for culverts. Applying this safety factor to the method used herein for determining buckling stresses yields a more conservative design. Because buckling stresses are not, in general, limiting factors for culvert diameters less than 42 in. the buckling safety factors increase to a value of approximately 5for12-in. culverts.
A larger safety factor than used in bending and buckling was used in computing allowable compressive stresses on rivets, and the corresponding bearing stress on the culvert sheet adjacent to the rivets, as well as cin the shear strengths of spot welds. The value of 3. 3 that was selected (§) is consistent with design procedure in both aluminum and steel culverts and reflects, in part, general design practice as well as a recognition that bending at a riveted or spot welded joint would decrease the performance of that joint.
The minimum fill- height tables for both full circle and vertically elongated culverts are, additionally, based upon the following assumptions:
1. The culvert bedding material be shaped to the configuration of the culvert and that the shaped width be at least 1/2 the diameter of the culvert.
2. The backfill compaction is greater than 88 percent by the Modified AAS HO Method.
3. The vertical elongation of any culvert resulting from the backfill operation is not restricted.
4. The rivet alloy, size, and number conform to present standard specifications. 5. The spot welded culverts have a minimum spot shear strength of 1, 200 lb on 16
and 14. ga culvert and a minimum spot shear strength of 1, 700 lb on thicker sheets and that double spot welding is used on diameters larger than 36 in;
6. Standard coupling bands, firmly attached, will be used. 7. The culvert extension on either side of the load lane remains in compacted soil
for a distance equal to 1 % times its diameter or that a shape retaining abutment is used.
These assumptions cover good general construction and manufacturing procedures that are equally important in either steel or aluminum culvert installations.
No specific provision has been made in these fill- height tables for vehicle impact. In addition, the effect of the pavement in distributing the wheel load was not a consideration.

70
Culvert performance data collected in this test series in many ways bridges the division in design theories currently being used. It gives extended range to culvert performance knowledge that has previously been concentrated around reactions to highfill loadings. This work also raises questions about the long-term load reactions of culverts initially installed at high compactions, and indicates the need to design for both conditions if soil restraint at a culvert's side is now considered static. Numerous culvert sizes and gages not now in regular use are included in the fill- height tables, and should be useful in future culvert selection.
REFERENCES
1. Ahlvin, R. G., "Effects of Heavy-Load Traffic on a Shallow-Buried Flexible Pipe." Proc. HRB, 39:372-384 (1960).
2. Koepf, A. H., "Structural Considerations and Development of Aluminum Alloy Culvert." HRB Bull. 361, pp. 25-70 (1962).
3. Meyerhof, G. E., and Baikie, L. D., "Strength of Steel Culvert Sheets Bearing Against Compacted Sand Backfill." HRB Highway Res. Rec. 30, pp. 1-19 (1963).
4. Roark, R. J., "Formulas for Slreso and Slrain." 3rd Ed., McGraw-Hill, New York (1954).
5. Spangler, M. G., "Soil Engineering." 2nd Ed., International Textbook Co., Scranton, Pa. (1960).
6. Spangler, M. G. , "The Structural Design of Flexible Pipe Culverts." Iowa State Coll. Bull. 153 (1941).
7. "Structural Aluminum Design." Reynolds Metals Co. ( 1962). 8. "Technical Information Report on Aluminum Culvert." Kaiser Aluminum and
Chemical Sales (Jan. 1961). 9. Watkins, R. K., "Failure Conditions of Flexible Culverts lmbedded in Soil."
Prot:. HRB, 39:301-371 (1960). 10. Watkins, R. K., "Influence of Soil Characteristics on Deformation of Embedded
Flexible Pipe Culverts." HRB Bull. 223, pp. 14-24 (1959). 11. Watkins, R. K., "Some Observations on the Ring Buckling of Buried Flexible
Conduits." Utah State Univ., Logan, Utah (1963). 12. White, H. L., and Layer, J. P., "The Corrugated Metal Conduit as a Compres
sion Ring." Proc. HRB, 39:389-397 (1960). 13. American Society of Civil Engineers, "Suggested Specifications for Structures of
Aluminum Alloys 6061-T6and 6062-T6." Proc. Paper 3341 (Dec. 1962).
Influence of Wall Stiffness on Corrugated Metal Culvert Design
R. L. BROCKENBROUGH Applied Research Laboratory, U. S. Steel Corporation, Monroeville, Pennsylvania
Recent research has shown that the strength of metal culverts is significantly influenced by the stiffness of the culvert wall. Based on this research, a simple method for determining maximum fill heights for flexible metal culverts is described. This method is used to compare the structural efficiency of two corrugation profiles, namely, the present standard %- by 2%- in. profile and a proposed 1- by 3- in. profile, which has considerably greater stiffness. A table of maximum allowable fill heights based on a safety factor of approximately 2 .0 against structural failure is given for steel culverts with the 1- in. -deep profile. It is suggested that the present 1k in. -deep corrugation be used for culverts having diameters of less than approximately 36 in., and that the 1-in. -deep corrugation be used for culverts having diameters of approximately 36to108 in. It is also concluded that an aluminum-alloy culvert, because of its lower modulus of elasticity, has a smaller safety factor against structural failure than a steel culvert having the same metal thickness, yield strength, and corrugation profile.
•THE METHODS previously used to determine the strength of flexible metal culverts were generally based on predictions of one or more of the following phenomena: (a) excessive culvert deflection, (b) yielding of the entire cross-section of the culvert wall, and (c) failure of the longitudinal culvert joints. Culvert deflection has usually been predicted by Spangler's formula (]). This formula considers the influence of wall stiffness on the deflection of a culvert, but does not necessarily consider the influence of wall stiffness on the strength of a culvert. Yielding of the entire crosssection and failure of the longitudinal joints have sometimes been predicted by first determining by the ring compression method ~) the forces present in the culvert wall. This method, which is based on an assumed uniform circumferential force in the culvert walls, does not take explicit account of the influence of wall stiffness on the strength of a culvert.
Recent research by Watkins ~) has confirmed that in addition to the three phenomena previously mentioned, the phenomenon of ring buckling, which is greatly dependent on wall stiffness, must also be considered in predicting the strength of corrugated metal culverts. Therefore, this paper describes a simple design method for determining the strength and, consequently, the maximum fill heights for such culverts. This method is based on recent research and takes full account of the influence of wall stiffness on the strength of corrugated metal culverts.
DESIGN CRITERIA
It has been generally recognized for some time that as the height of fill over a corrugated metal culvert increases, the top of the culvert moves downward while the sides of the culvert move outward. This movement causes bending stresses in the culvert
Paper sponsored by Committee on Culverts and Culvert Pipe.
71

72
wall that are proportional to the amount of movement, but allows passive pressure to develop along the sides of the culvert so that the soil pressure on the culvert approaches a uniform hydrostatic pressure. This uniform pressure, of course, causes uniform circumferential compressive stresses (hoop stresses) in the culvert wall that can be approximated by the simple ring compression formula ~)
f =PD 2A
(1)
in which P is the vertical soil pressure on top of the culvert, D is the diameter of the culvert, and A is the cross-sectional area of the culvert wall. Therefore, the stress in the culvert wall is the sum of the uniform stress due to ring compression and the bending stresses due to the slight change in shape of the culvert. (For very shallow fill heights, the pressure around the culvert may not be uniform and very large bending stresses may occur. A simplified analysis incorporating ring compression does not necessarily apply in such instances. However, the present report is not concerned with shallow fill heights.)
The soil pressure, P, is the sum of the pressure created by the dead weight of the soil and the pressure created by live loads. The pressure created by the soil alone is usually taken as the product of the density of the soil (frequently estimated to be 1, 000 pcf) and the height of fill above the top of the culvert. The live- load pressure for an AASHO- H 20 highway loading is significant only for fill heights of approximately 10 ft and less. The pressures vary with fill height as follows (1): 10 to 8 ft, 100 psf; 6 ft, 200 psf; 4 ft, 400 psf; 2 ft, 800 psf; and 1 ft, 1, 600 psf. Intermediate highway-loading values may be determined by interpolation. Live- load pressures resulting from railway loadings can be obtained from National Corrugated Metal Pipe Association (1).
Localized yielding of the outer fibers of the culvert wall due to the combined bending and uniform hoop stresses is not likely to cause failure of the culvert. However, when the uniform ring compression stress in the culvert wall reaches the yield point, yielding occurs over the entire wall cross-section rather than just at the outer fiber, and the culvert cannot carry any additional load. A failure of the longitudinal culvert joints would also constitute culvert failure. Consequently, according to most of the available literature on the design of flexible metal culverts (2), the ring compression stress (Eq. 1) divided by an appropriate safety factor should be limited to whichever is lcssthe stress at which the longitudinal culvert joint would fail, or the yield point of the culvert material (sometimes referred to as short column strength, or crushing strength).
However, recent research has confirmed that ring buckling strength must also be considered in addition to yield point and joint strength. Ring buckling is a phenomenon similar to column buckling; that is, when the compressive stress in the wall of a culvert reaches a critical value, the culvert wall buckles. Such a structural failure may occur when the ring compression stress is much less than the yield point of the culvert material. On the other hand, it is possible to design efficient longitudinaljoints-either riveted or spot-welded-that will allow the stress in the culvert wall to reach the yield point. In the following discussions, therefore, it will be assumed that the joints do not limit the strength of the culvert.
The most ovbious method for estimating the critical ring buckling stress is by calculating the critical hydrostatic buckling pressure, Pc, from the classical buckling formula (_§) for a cylinder under fluid pressure:
p _ 24EI c - D3 (2)
in which E is the modulus of elasticity of the culvert material and I is the moment of inertia of the cross-section of the culvert wall. (EI, of course, is a measure of the stiffness of the wall of a culvert.) When the value for the critical pressure in Eq. 2 is substituted into Eq. 1, the critical ring buckling stress, fc, is expressed
(3)

73
The buckling behavior of a culvert under soil pressure, however, differs somewhat from the buckling behavior of a cylinder under fluid pressure. Specifically, Eq. 2 does not take into account (a) the increase in the maximum radius of culvert wall curvature that occurs when a culvert deflects under the vertical earth pressure (the top and bottom portions of the culvert become flatter), (b) the bending moment in the culvert that accompanies this change in shape, and (c) the ability of the surrounding soil, unlike fluid, to withstand shearing forces. The behavior described in the first two items decreases the buckling strength of a culvert, but that described in the third item increases the buckling strength and therefore tends to offset the effects of the first two items. To examine the validity of using the hydrostatic-buckling equation (Eq. 2) for estimating the ring buckling stress of a culvert, Watkins ~) conducted tests on models of culverts buried in fine sand. In these tests, the vertical soil pressure on the culvert models was increased in increments until the culvert models failed structurally. Ring buckling was characteristic of each failure.
Watkins' test results were reported in the convenient form shown in Figure 1, where compressive stresses at failur e (computed by Eq. 1) are plotted against a culvert flexibility parameter, 10'1D2A/ (EI), which is analogous to the slenderness ratio of a column. (The long dashed line, giving the test data, has been modified slightly for flexibility parameters less than approximately 5. 0 to take into account the difference between the 40, 000-psi yield point of the culvert model material and the 33, 000-psi typical minimum yield point of the culvert material herein considered.) Critical stresses calculated by Eq. 3 (based on hydrostatic buckling) and the limitation imposed by yielding of the entire cross-section of the culvert wall are also shown.
Figure 1 shows that culvert models with low flexibility parameters (less than approximately 4 sq in./lb) failed when the ring compression stress was less than either the yield point or the hydrostatic buckling stress. Figure 1 also shows that culvert models with higher flexibility parameters (greater than approximately 4 sq in. / lb) failed when the ring compression stress was greater than the hydrostatic buckling stress but less than the yield point. Such behavior can be attributed to the ability of the soil to withstand shearing forces; presumably, tests conducted in soils with weaker shearing strengths or in saturated soils would show stresses at failure that are closer to the hydrostatic buckling stress. Therefore, to estimate the ultimate strength of a culvert, Watkins suggested the use of the curve shown as a solid line in Figure 1. For flexibility parameters greater than 7. 27, this curve is defined by the hydrostatic- buckling curve (Eq. 3), and for smaller flexibility parameters, this curve is defined by a straight- line transition that is tangent to the hydrostatic- buckling curve (at a flexibility parameter of 7. 27) and passes through the yield point at a flexibility parameter of zero, The following equation defines this transition (which is analogous to the transition curve between the yield point and the Euler buckling curve for columns):
. [ 104D
2AJ fc (psi)= 33-2.27 EI 1,000 ( 4)
in which D, A, E, and I are expressed in in. and lb. Figure 2 shows a suggested design- stress curve that provides a safety factor against
structural failure of approximately 2. 0. The curve was obtained by plotting the hydrostatic buckling stresses divided by 1. 5 and a straight-line transition tangent to this curve passing through the yield point divided by 2. 0. The curve was plotted for 33, 000-psi yield-point steel, which is usually the minimum value found in culvert sheets. The factor of 1. 5, rather than 2. 0, was applied to the hydrostatic buckling stresses to take into account the fact that, as indicated by Watkins' tests, a culvert surrounded by soil will buckle at stresses somewhat higher than those calculated from the hydrostaticbuckling equation. That is, although a nominal safety factor against hydrostatic buckling of 1. 5 was used to construct a portion of the curve, it is suggested that the safety factor against structural failure, which depends on the soil and the compaction methods used, will be at least 2. 0 for average culvert installation. (If the surrounding soil be-:comes saturated and hydraulic conditions are approached, the safety factor may be somewhat less than 2. 0. Even under such extreme conditions, however, the suggested

74
CULVERT STRENGTH GOVERNED BY CULVERT STRENGTH GOVERNED BY
HYDROSTATIC BUCKLING AND YIELDING HYDROSTATIC BUCKLING ONLY
·u; c. • 40,00
01<1 Q. C\J
II .....
. -
~ 30,000 LU er ..... en z ~ 20,00 --
K - -'----..... I
I
I I
Y1El o PLNT -- -"\
' ~- i\-")-- --..... ' I ~ ' ~' en LU er Q.
2 8 10,00 O~c=[33-2 .27 IO~rA ]1000
I I C> ~ er
-- , .__WATKINS' TEST DAT~ - -- -1- ---,_ _ ---
' I
~ t--..._ r-f" 12EI -- c 02, ..!.._ ___ _
---
- ~
-- "'""" ...... _
0 0 2 3 4 5 6 7 8 9 10 II 12 13 14 15 16 17 18
--22,50 Ill
°' ... 20,0 0 01<1 Q. C\J
II 17,50 .....
~ 15,00 LU er ..... en z Q en en LU er Q.
2 0 ()
C>
12,50
10,00
7,50
5,0 0
0
0 ~
0
0
- I - I ~
- L 0 -
~ 2,50 0
CULVERT FLEXIBILITY PARAMETER, 10~rA 1 inches2/pound
Figure 1. Critical stresses for flexible metal culverts .
-- ------, ')--.{.. ' I 24 ]O '
~ ', r-....._ .... 42'---~ ~' 48
~ .........._ _, r-- f 8EI " o:t .. .......__ 60 -µ
:[16.5 -0.847 1~~D2
A ] 1000 -~ 66
71 ·-2
78-
p 1AMff ERf F9R I
I j 3 Ci°R R~GAT \ON-~
3 4 5 6 7 8 9 10 11 12 13 14 15 16 17 18 I04D2A CULVERT FLEXIBILITY PARAMETER, El , inches2/pound
Figure 2. Suggested design stresses for flexible metal culverts.
curves provide an adequate safety factor.) Equations for the design stress corresponding to the curve may be written as follows when 104D2A/ (EI) < 9:
. [ 104D
2A J f (psi) = 16. 5 - 0.847 E I 1, 000 (5)

or when 104D2A/(El)2_ 9, as
f ( .) 8EI psi = D2A (6)
In addition to the stress limitations, culvert deflections should also be limited so that the predicted critical stresses will not be significantly reduced by bending moments or by an increase in radius. The limitation presently specified for many culvert designs- 5 percent of the culvert diameter- appears to be an ap-
Sheet Gage
20 18 16 14 12 10 8
75
TABLE 1
SECTIONAL PROPERTIES PER INCH OF WIDTH OF CORRUGATED CULVERT SHEETS'
Uncoated Thickness
(in.)
o. 0359 0. 0478 0. 0598 o. 0747 0.1046 0.1345 0. 1644
Area (A) (in. ' / in.)
y, X 2'/, in.
0. 0388 o. 0516 o. 0646 0. 0808 0.1130 0.1454 0.1775
1 x 3 in.
o. 0445 o. 0593 0.0742 0.0927 0.1300 0.1674 0. 2048
Moment of Inertia (!) (in . '/in.)
y, x 2% in.
0. 00121 0. 00160 0. 00200 o. 00250 0 . 00350 0. 00450 o. 00550
1 x 3 in.
o. 00515 o. 00689 o. 00866 o. 0109 0. 0154 0. 0202 o. 0251
1 Properties given based on uncoated thicknes ses listed .
propriate limitation. (It is suggested that when t.X is limited to 5 percent, the effects of bending need not be considered in culvert strength predictions, for reasons previously mentioned.) The culvert deflection can be predicted by Spangler's formula (1)
~x = D1KWcR3
EI+ 0.061 E'R3
in which AX = the increase in horizontal diameter of culvert ,
D1 = dimensionless deflection lag factor, K dimensionless bedding constant,
We vertical load on culvert, R culvert radius, and
E ' modulus of soil reaction.
The factors involved in this equation are discussed in detail by Spangler (1). Like buckling strength, the culvert deflection depends on the wall stiffness, EI.
COMPARISON OF TWO CORRUGATION PROFILES
(7)
An examination of Eqs. 3 and 4 shows that for any given culvert diameter the critical buckling stress increases with increasing values of the culvert wall stiffness to crosssectional area ratio (EI/ A). It follows that for a culvert made from any given material, the structural efficiency (strength for a given cross- sectional area) increases with increasing values of I/ A. For corrugated metal sheets, the I/ A ratio can be readily increased by increasing the depth of the corrugation. For example, the present standard corrugation for shop-fabricated metal culverts-Yi (corrugation dept h) by 2% in. (corrugation width)- has an I/ A ratio of 0. 0311, whereas the 1- by 3- in. corrugation has an I/ A ratio of approximately 0.117. For a given cross-sectional area, therefore, the deeper corrugation provides more than three times the stiffness of the present standard corrugation. Sectional properties for the two corrugations are given in Table 1.
Figure 3 using two corrugation profiles illustrates where ultimate fill heights (that is, the fill heights that would theoretically cause failure) are plotted against required culvert wall areas. The standard gage number providing the wall areas for each of the profiles is indicated on the abscissa. The sheet thickness required to provide any given culvert wall area is less for the 1- by 3- in. profile than for the Y2- by 2%- in. profile. This results from the fact that the flat-to-formed-width ratios for the two corrugations are 1. 24 and 1. 08, respectively.
The strength curves in Figure 3 are for each of two different design assumptions: (a) ring compression stress limited to the yield point (33 , 000 psi) only-past method , and (b) ring compression stress limited to the critical ring buckling stresses calculated from E~. 3 and 4-method suggested by recent research. (For steel culverts with a %- by 2 7'3- in. corrugation, Eq. 3 applies to all culvert diameters greater than 26 in . ; for steel culverts with a 1- by 3-in. corrugation, Eq. 3 applies to all culvert diameters greater than 50 in.) An examination of Figure 3 reveals the following:

76
~ QI -f-:I: (!)
w :I:
_J _J
Li: w ~ ::!!
~ ~
220
200
180
160
140
8
0.14 0.16 0.18 0.20 0.22 AREA, A, inches 2/ inch
20 18 16 14 12 10 8 GAGE (IX3 CORR.)
20 1e 16 14 12 10 a GAGE ( 1/2 x 2-213 CORR.)
Figure 3. Comparison of ultimate fill heights for two corrugation profiles .
1. If ultimate fill heights are calculated on the basis of yield point only, the same area of metal is required for either of the profiles considered although the metal thicknesses required are different.
2. Ultimate fill heights calculated only on the basis of yield point may be very unconservati ve.
3. If ultimate fill heights are calculated on the basis of critical ring buckling stresses-as tests have demonstrated should be done-the area of metal (and, consequently, weight of metal) required for the 1- by 3-in. corrugation is considerably less than the area of metal required for the %- by 2%- in. corrugation . (This fact is especially true for the larger culvert diameters.)
In addition to the weight savings possible with the proposed 1- by 3-in. corrugation, a culvert of this profile will deflect less under a given load than a culvert with the same cross-sectional area made from the Y2- by 22/s-in. corrugation, if both culverts have similar earth backfills. A better quality soil or more compaction- corresponding to a larger value of E ' - must be used for culverts with %- in. corrugations than with the deeper corrugations to make the deflection the same.
To illustrate these facts, culvert deflections at increasing fill heights were computed from Spangler's equation (Eq. 7) for 48-in. diameter culverts with each of the two corrugations. The results are shown in Figure 4. The values assumed for the terms in Spangler's equation were D1 = 1. 5, K = 0.10, and E' = 700 and 2, 000 psi.

77
101--~1----J~-+~-+~-+-~-+-~-1-~-t--~t----11---
J
I 2 3 4 5
CULVERT DEFLECT I ON , ~x , percent
Figure 4. Comparison of culvert deflections for two corrugation profiles.
Although the 16-ga culvert with a 1- by 3-in. corrugation had about 10 percent less wall area than the 14-ga culvert with a%- by 2%-in. corrugation, the culvert with the Y2-in. corrugation deflected more than the culvert with the 1-in. corrugation for the same fill height. Before reaching a culvert deflection of 5 percent, the culvert with the 1-in. corrugation withstood about 35 percent more fill for E' = 700 psi and 10 percent more fill for E' = 2, 000.psi than the culvert with the Y2-in. corrugation. For the same fill height and a deflection of 5 percent, a greater value of E ' is required with the %- in. corrugation than with the 1-in. corrugation. The value of E ' can be increased only by better compaction around the culvert or by using a better quality backfill. Either of these operations would add substantially to culvert installation costs .
From the previous discussions it might appear that the 1- by 3-i n. corrugation, because of its favorable I/ A ratio, would require less culvert material tllan the %- by 2%-in. corrugation for all culvert diameters. However, this is not true. A minimum thickness (larger than the calculated thickness which is quite small that would apply to either corrugation is frequently specified for small-diameter culverts because of practical considerations, such as local indentation resistance. Thus, if the same minimum thickness is specified for the two corrugations, the 1/2- in. corrugation will require about 13 percent less material than the 1-in. corrugation because of previously mentioned flat-to-formed-width ratios.

78
TABLE 2
SUGGESTED STANDAr~ GAGES ron ROUND COf'u'1UGATED STEEL CULV1~TITS
Fill Height (ft)
1b - 10 11 - 15 16 - 20 21 - 25 26 - 30 31 - 35 36 - 40 41 - 45 46 - 50 51 - 60 61 - 70 71 - 80 81 - 100
UNDER EARTH FILLS AND AASHO-H20 HIGHWAY LOADING"
Sheet Gages for Culvert Diamete r s (in . )
36 42 48 54 60 66 72 78 84 90 96 102 108
16 14 14
(12)
20 20 20 18 20 20 20 18 20 20 18 16 20 20 16 14
--.i. 18 16 14 12 12 10 s I 16 14 12 12 10 8 Zoned 14 12 10 10 8 A 12 10 8 8
20 .....,1~8-~1~6 -~12,__-,'-';'--~~-=-~~~~~~'--~--Jl--18 ! 6 14 12
12 10 8 E ' ~ 700 is!C 10 8
18 16 12 10 16 14 12 10 10 H 12 8 14 12 (10) (8) 12 12 8 12 (10 ( 8)
(10) ( 8)
8 8 E' = l 000 lBLC
E ' I I 500 sic Zone! c
i aSheet gages are for ste.el sheets (33,000-psi yield point) with a 1- by 3-in. corrugation and have been calculated ta provide a safety factor of approximately 2 . 0 against structural failure. Structural f'ailure by yielding, ring buckling) and joint failure have been considered. Two 3 / 8 -in. diruneter rivets per corrugation are required except for gages shown in parentheses, for which two
,.,1 I~ -Jn . iJ..1J:imo t.c?r r1 \-c'Lc:i J.10r cornma\.1011 a.ro ro.qu.lrCl"d. liti.n:J.mui:D rill ho1v,)1t.. lo 1 rt tor dinmotora up to lt8 in. H.1.nimlilil fill heights for larger- culverts arc- 1. /4 t.h.o culvorl. 4-tamoter. ~alucw or coJu.l.ua o!' doil reaat1on 1 g-' 1 :rciq!,J,J.rod t.o 1'1.mlt ultimate culvert deflection \.o 5 percent. ~~ A: good btlC:kfill ccmpact.ion rcQ.u:lred . ?.nc 8: etccllenL l>MktlU cra....,ll<>n "1quU-.,d .
Zon C: aU.Pcu•S.or compn.ctlon Of oaluct-ed bo.ckO..l.ln or ~ of 5 percent verticaJ.ly elon51U.ed pipe required.
SUGGESTED CUL VERT DESIGNS
Table 2 gives suggested sheet thicknesses for steel culverts (33, 000-psi typical minimum yiP.l<I pnint.) with t.hP. t- by 3-in. profilP. undP.r an P.arth fill WP.ighing 100 pcf and AASHO- H20 highway loading. The culvert designs, which include diameters of 36 to 108 in. , are based on Eqs. 5 and 6, which are shown plotted in Figure 2 for the 1-by 3-in. profile. Because the El/A ratio is nearly constant for any given culvert material and corrugation profile, the design stress varies only with the culvert diameter. Twenty gage was used as a reasonable although arbitrary mi ni mum thic.kn ess. (On the basi s of this minimum thickness, the Yz-in. corrugation because of its smaller flat-toformed-width ratio is generally more efficient than the 1-in. corrugation for culverts having diameters less than 36 in. Therefore, no suggested thicknesses are given in Table 2 for the 1- by 3-in. corrugation in culverts with diameters less than 36 in.) When compared with the presently specified thicknesses (1) for the Y2- by 2%-in. profile, the culvert designs shown in Table 2 represent significant weight savings.
Longitudinal joint design was also considered for the culvert designs given in Table 2. The joint designs were based on the following ultimate joint strengths for various culvert gages , rivet diameters , and rivets per joint ft: (a) 20 ga, %-in. diameter, 8/ joint ft , 17 100 lb/ joi nt it; (b) 18 ga, %- in. diameter, 8/joint ft, 22, 2001b/ joint ft; (c) 8 to 16 ga , %-in. diameter , 8/ joint ft 27,600 lb/joint ft; and (d) 8 to 12 ga, 1kin. diameter, 8/ joint ft, 49, 000 lb/joint ft. Two %-in.-diameter rivets per corrugation (8 rivets/ ft) were found sufficient to provide a joint having a safety factor of 2. 0, except for a few instances in which two Y2- in. - diameter rivets per corrugation (8 rivets/ ft) were required. The joint design for the 1- by 3-in. profile compares favorably with the joint presently used for culverts with a Y2- by 2%-in. profile-two %-in.-diameter rivets per corrugation (9 rivets/ ft) for culvert diameters of 42 in. and larger. Joints can also be obtained by automatic spot-welding techniques.
As previously mentioned, it is desirable to prevent excessive culvert deflection. This can usually be accomplished by compacting the soil as it is backfilled around the culvert. As a guide to the degree of compaction required for the culvert designs given in Table 2, the value of the modulus of soil reaction, E ', required to limit the culvert deflection to 5 percent was calculated by using Spangler's formula with the following assumed values: D1 = 1. 25 and K = 0.10. On the basis of the values calculated for E ', Table 2 was then divided into three zones: Zone A, in which an E' of 700 psi is satis-

79
factory; Zone B, in which an E' of 700 to 1, 000 is required; and Zone C, in which an E ' greater than 1, 000 psi is required.
Unfortunately, no detailed information is available on the degree of compaction required in different types of soil to obtain these values of E '. However, the values of E' that were developed in a number of actual culvert installations were reported by Watkins and Spangler (1) and are discussed briefly by Spangler (!). For five culverts with compacted sandy- clay- loam or clayey- sandy- silt backfills, the E ' values ranged from 502 to 1, 320 psi, the average value being 765 psi. However, a value of 7, 980 psi was reported for a culvert with a crushed- sandstone backfill compacted to full Proctor density. As a result of these measurements, Spangler recommended a value of 700 psi for design use when the soil is compacted to 90 percent of Proctor density for a distance equivalent to two diameters on each side of the pipe. (It is assumed that the compaction would extend vertically to approximately the top of the pipe.) Consequently, such compaction, which is probably typical of present practice, is indicated for Zone A of Table 2. For Zone B, values of E' up to 1, 000 psi are required, and therefore, the backfill must be placed more carefully and compacted more fully. For Zone C, where E ' values of more than 1, 000 psi are required, it is suggested-unless the backfill is of a select quality and is eompacled to full Proctor density-that the culvert be vertically elongated to 5 percent of its diameter. Of course, vertically elongated pipe could also be used in Zone A or Zone B if soil conditions were such that the required E' values indicated in Table 2 could not be easily obtained. If the pipe is vertically elongated to 5 percent of its diameter, the following maximum E' values would be required to limit the final culvert deflection to 5 percent: Zone A, 250 psi; Zone B, 375 psi; and Zone C, 700 psi. These values were calculated by Spangler's equation based on a total culvert deflection of 10 percent.
Nonferrous Metal Culverts
As previously mentioned, EI is a measure of culvert wall stiffness. The discussion presented thus far has been conducted only in terms of relative I values, and the advantage of using a greater Ito increase the stiffness has been clearly indicated. Obviously, the use of a greater E is also advantageous in increasing stiffness. For example, when a culvert is constructed from aluminum alloy, which has an E about one-third that of steel, the culvert will have a stiffness one-third that of a steel culvert if both culverts have the same corrugation profile and sheet thickness. Consequently, if an aluminumalloy culvert is used that has the same thickness, corrugation profile, and diameter as a steel culvert, and the yield strength of aluminum alloy is the same as the yield point of the steel, the steel culvert will in all cases have a greater safety factor against structural failure than the aluminum-alloy culvert. Furthermore, the aluminum-alloy culvert will deflect considerably more than the steel culvert under the same loading and soil conditions.
SUMMARY
The significant results of this study can be summarized as follows:
1. Because culvert wall stiffness is an important consideration in the structural design of flexible metal culverts, Eqs. 5 and 6 represent a convenient method for determining design stresses and, consequently, maximum allowable fill heights for a culvert with a given stiffness.
2. The proposed 1- by 3-in. corrugation profile, because of its favorable ratio of wall stiffness to cross-sectional area (EI/ A), generally is structurally more efficient than the present standard Y2- by 2%- in. profile for culverts with diameters of approximately 36 in. and larger. Minimum thickness limitations favor the%- by 2%-in. profile for culverts with diameters of approximately 3 6 in. and less.
3. Under similar load and backfill conditions, a culvert made from the 1- in. deep rrofile deflects less than a culvert with the same cross- sectional area made from the Yi-in. deep profile. A better quality soil or more compaction must be used with the %- in. deep profile to limit the deflection to the same amount that would occur with the 1- in. deep corrugation.

80
4. An aluminum-alloy culvert having the same diameter, thickness, corrugation pJ.~ofile, and yield strength a:s a :sLeel culvert will have a smaiier safety factor against structural failure than the steel culvert. Furthermore, the aluminum-alloy culvert will deflect considerably more than the steel culvert under the same loading and soil conditions.
REFERENCES
1. Spangler, M. G., "Soil Engineering." International Textbook Co. (1960). 2. White, H. L., and Layer, J.P., "TheCorrugatedMetalConduitasaCompression
Ring." Proc. HRB, 39:389-397 (1960). 3. Watkins, R. K., Discussion of "Strength of Steel Culvert Sheets Bearing Against
Compacted Sand Backfill," by G. G. Meyerhof and L. D. Baikie. HRB Hwy. Res. Rec. 30, pp. 14-18 (1963).
4. National Corrugated Metal Pipe Association, "Corrugated Metal Drainage Structures." Tech. Man. 1161 (1961).
5. Timoshenko, S. P., andGere, J.M., "Theory of Elastic Stability." McGraw-Hill (1961).
6. American Iron and Steel Institute, "Commentary on the 1962 Edition, Light Gage Cold- Formed Steel Design Manual." (1962).
7. Watkins, R. K., andSpangler, M. G., "SameCharacteristicsoftheModulusof Passive Resistance of Soil: A Study in Similitude." Proc. HRB, 37:576-583 (1958).
Discussion T. F. DE CAPITEAU, Drainage P.i:~ucts Engineer, Republic Steel Corporation, Youngstown, Ohio-The significance of wall stiffness in the design of corrugated metal pipe structures has been recognized since this product was first produced more than 60 years ago, but a satisfactory method of using the value EI in designing a flexible structure has been quite elusive.
Spangler's deflection formulas permit correlation of the wall i:;tiffnP.88 with ::rn ;:intir.ipated adequacy of the earth· envelope to predict defelction under any load. However, wall stiffness contributes very little in comparison to compaction of the soil in limiting deflection, and deflection can theoretically be held to an acceptable value by proper selection of fill material and adequate compaction when the pipe wall itself is entirely inadequate.
The importance of a good installation procedure is becoming more evident each year, and l>etter techniques for selecting, placing, and compacting the backfill around flexible conduits have greatly reduced the hazard of excessive deflection.
Mr. Brockenbrough' s report on the influence of wall thickness on the design of corrugated metal pipe gives an excellent means of determining the adequacy of the pipe wall in the interaction range where wall area and seam strength may be suspect as well as in the elastic buckling range where stiffness is the limiting factor.
It should be recognized, however, that the hydrostatic buckling formula which is the basis of this report is not strictly applicable to the problem, even though it does provide a useful tool for investigating the elastic buckling design concept. Hydrostatic pressure is active and uniform and is also capable of following the movement of a pipe wall as deflection leading to buckling is developed. A culvert, on the other hand, is subjected to active vertical pressures and passive horizontal pressures. When deflection occurs the passive pressures build up to a value sufficient to establish equilibrium between the vertical pressures, the horizontal pressures, and the inherent strength of the pipe. While the pressures may develop so as to be nearly uniform the slight difference will be of a nature to constrain buckling.
Hydrostatic pressure as considered in the buckling formula represents the condition most conducive to buckling and would only be encountered by a culvert if installed in a completely saturated plasticized clay backfill. All other conditions of backfill material

81
INTERACTIO N ELASTIC BUCl(LING A.ANGE 35, 000 RANCit
I J I I I l < 11
' x 3 ,, COR.RUOATION
l\
\\ RADIUS OF GYRATION: .3452.4"
D < 4.2.5' D > 4. :25'
fc:33,D00-913,67 D2 PSI ;c: 2.97.97 l< 10 3 PSI
\ ' D" ,._ I
I\ : 3' ;,.
11:2." >< 2 213" ( 0 R.R. U G AT I 0 1\1
-· I x RADIUS OF GYRATION= .17593"
0(2.167' D) 2.167' ' -Fe= 33,000 - 3518 o"- PSI f.c= 77.375" 10 3 PSI
\ ~ o•
\ w
~ ~lu >C 3 "
"",-z__ 111 IJ.'' 6 ' r--, i "1:;: i--._
""'-..... ---- 7' I 6' I
9' I O'
33, 0 00
iii 30, 000 Q.
01<( Q. l'I
II 2S, ooo 0
<+
"' "' 20, 000 w a I-Cl>
:z IS, 000 ~ "' "' w 0( Io, 000 0.
~ 0 u
CJ 5, 0 00 z «
0 0 10 2.0 40 so 60 70 80 90 100
0 1 IN FEET
Figure 5. Critical stresses for flexible steel culverts.
and compaction would render the conduit less vulnerable to buckling. A factor accounting for the effect of soil properties on the hydrostatic buckling formula would make its use more rational.
The author has introduced a safety factor of 2. 0 in the allowable stress formula for the interaction range and 1. 5 for the elastic buckling range. These values may be adequate but the basis for choosing them is not clear and introducing them into the formulas confuses the issue. The formulas expressed for critical stress without the safety factors would permit a designer to use a safety factor of his own choosing based on his knowledge of the installation. It is doubtful that an appropriate safety factor can be justified for general use in a design method so recently developed. A gage table on this basis may not be acceptable. Actually, a safety factor of 2. 5 was objected to as being too low about two years ago, indicating that a higher value should be used for a flexible metal culvert. The bases for this opinion were valid and are just as substantial today.
The critical stress in the interaction range where ring compression combines with hydrostatic buckling is
( 104 D2 A) . fc = 33 - 2. 27 EI 1, 000 psi (8)
In the elastic buckling range the critical stress from the hydrostatic buckling formula is
12E I . fc - D2l\ psi (9)
It is interesting to note that because the radius of gyration does not vary appreciably f9r a particular corrugation, r 2 can be substituted for I/ A to facilitate computations. For the steel culvert with 1- by 3-in. corrugations in Brockenbrough's paper, r 2
= 0.11919, and for diameters less than 51 in.

82
fc = (33,000 - 6.34491D2) psi (10)
and for diameters greater than 51 in.
f _ 42.9084 x 10⁶
psi c - D~ (11)
This makes it possible to plot critical stress versus D2 instead of the parameter 104 D2 A/ (EI), and if the diameter, D, is expressed in feet, the graph becomes more comprehensive (Fig. 5).
R. L. BROCKENBROUGH, Closure-Mr. deCapiteau indicates that the safety factor against structural failure suggested, approximately 2. 0, may be too low. Safety factors as high as 3. 0 or 4. 0 have been used in the past. However, these safety factors were generally against only one failure condition, either uniform yielding of the culvert wall or failure of longitudinal joints, and were necessarily high because failure by buckling was not considered in the design calculations. Information regarding the elastic stability of flexible metal culverts under earth fills was lacking at that time. The recent model tests referred to by the author show that flexible culverts will buckle at stresses higher (for the flexibility parameters indicated) than those predicted by the hydrostatic buckling equation and thus substantiate the use of the hydrostatic buckling equation as a conservative lower limit for the strength of such culverts. Because this new information is available, it is possible to use a safety factor against all modes of structural failure (including buckling) that is closer to the safety factors used for other engineering structures.
The allowable stresses for uniform compression suggested by the author for the 1-by 3-i11. t:urrugalio11, Eqs. [j and 0 and Figul'e2, decl'easefrom 13,400 psi for a :JO-in.diameter culvert, the smallest diameter suggested for the 1-in.-deep corrugation, to 2, 400 psi for a 108- in. - diameter culvert, the largest culvert diameter suggested for the 1- in. - deep corrugation. Thus, although the culvert designs suggested by the author (Table 2) have a safety factor of approximately 2. 0 against structural failure, the designs have a safety factor against uniform yielding of 2.46 to 13. 7 (based on a typical minimum yield point of 33, 000 psi), and therefore, are generally more conservative culvert designs than those suggested in the past.

Cylinder Pile Retaining Wall GEORGE H. ANDREWS and JOHN A. KLASELL
Respectively, District Engineer and Associate Highway Engineer, Washington Department of Highways
This paper discusses the conditions encountered during construction of the Seattle Freeway, I-5 through Seattle, Wash. , necessitating a change in design of retaining walls , from the conventional reinforced concrete cantilever or counterfort wall to cast-in-place concrete cylinders with welded steel beam reinforcement.
Also discussed are the geological and geographical problems that combined to create massive foundation failures requiring the change in design concept, as well as their solution and the construction techniques involved. Although expensive, the cylinder pile retaining wall provides a method of controlling earth movements by placing the strength of the wall in the soil before excavation begins.
Also covered are the design of a 57-in. diameter concrete cylinder, the original assumptions used for load and resistive capacity of the clay materials, and the reasons for the various assumed values and their locations.
Analysis is also given for the jacking load tests run on the cylinders, as well as a discussion of the differences between the test and calculated values for such items as the load-carrying capacity of the large cylinders, the location of the neutral axis, the tension carrying capacity of concrete, the coefficient of horizontal subgrade reaction, and the behavior ofpreconsolidated clays during excavation operations.
Observations made for a one-year period on the cylinder wall are given, together with a discussion of the ability of the cylinder to function as a retaining wall under working loads.
•UNANTICIPATED soil conditions encountered during the construction of I-5 through the City of Seattle required a change in design and construction techniques . This change involved a bold approach to sidehill ~1 tability maintenance and elimination of damage to adjacent pr operty (outside the right-of-way).
Traffic on 1-5 required as many as 12 lanes. These lanes were benched into the sidehill to conserve right-of-way and to permit connection to existing surface streets. A typical section along Capitol Hill (as designed) is shown in Figure 1 and a plan showing a section of the Seattle Freeway is shown in Figure 5.
Basically, the hill is composed of horizontal varved clay preconsolidated through pressure of glacial ice load and an upper mantle of glacial till. Advance foundation explorations had shown that removal of the glacial loading caused vertical fractures in the clay. Trouble was anticipated because past history of the location had revealed the existence of numerous slide areas most of which were fairly shallow and apparently caused by supersaturation of the weathered mantle of exposed clays.
Based on observations and conventional analysis, it was felt that proper drainage during construction would control the excess water problem. In addition, contract specifications were written providing excavation extent and sequence limitations in an
Paper sponsored by Committee on Construction Practices~Earthwork .
83

84
l5 ES E APT.
0 BLD~- 0 BE R/W LINE o o c
ORIGINAL EX. STREf Tl _,, .. - 0 0 c - 210
SOUTHBOUND G~?:J~D~ _ ---- _ ...... 1._.----- - 200
(ON STRUCTUR~ - ------ - 190 ------ _ /_,,- NORiH BOUND
170 r IRAJ.1P: / 1RAMP 160 t __ .. :i - - t
Figure 1. Design of Seattle Freeway, Capitol Hill section (scale: 1 11 = 60 1 ) .
attempt to prevent the development of massive slides that might result from the presence of the vertical fracture planes and horizontal varves. The specifications provided a limit of 200 ft horizontally for any major excavation with at least 200 ft between excavations.
Retaining walls as originally designed were to be conventional reinforced concrete, either cantilever or counterfort, depending on height. Design loads applied to the walls varied from equivalent fluid pressures of 30 psf/ft of height for dry areas in granular cuts to 60 psf/ ft of height for wet areas in clay cuts.
'T'n ini:;nrP. th::it ::ir.hrn l lo::i<l,c; woul<l not P.XCP.P.d the design loads, the backfill behind the walls was to be granular and free draining to reduce lateral pressures. Footings varied between spread and pile depending on available foundation support.
CONSTRUCTION
During construction of the section immediately north of the central business district, the first problem in the nature of a slide in a retaining wall and abutment excavation at Olive Way occurred. The construction area was within the 200-ft specified limits, and the back slope had been cut to approximately 3/ 4: 1. The footings for several sections of the wall were poured on piling driven to a 35-ton load-bearing capacity and battered. Before the wall stems were formed, a slide movement of the backslope started to occur. It appeared to be a series of block slides moving outward .on nearly horizontal planes at various elevations above the bottom of the footing.
To reduce the driving force, the top of the cut was lowered immediately and the slope laid back as much as possible. Heavy rock riprap was added behind the wall footing to buttress the slope. Neither had any effect. To more accurately pin-point the exact location and extent of the slip planes, slope indicators were installed that showed the lower limit of the slippage zone to be on a plane approximately 6 ft below the bottom of the footing.
The slope indicator, developed by Stanley D. Wilson of Seattle, used for this purpose consisted of a 3- in. plastic tube inserted in a prebored hole drilled to the required depth. An electronically activated pendulum that travels in preformed grooves was lowered into the plastic tube. This instrument registers the slope at any given elevation. From this information a deflection curve of the tube and an estimation of the forces involved could be determined. The wall was redesigned and constructed as a solid concrete block on the footings thereby adding weight and causing the batter piles to function. This brought good results and the slide movement was stopped. To complete the planned roadway facility in the area, it was necessary to excavate in front of the wall footing to a depth of approximately 20 ft in order to construct a two- lane vehicular tunnel for reversible traffic. To prevent reactivation of the slide some means of toe support for the wall appeared necessary while the tunnel was being built and back-

190 -
180 -170 -160 -150 -140 -
ORIGINAL GROUND LINE
APPROX. SLIPPAGE PLANE
85
R/W LINE
-----~ -=--iaOJ EX. STREE~
--:7 - 100 I - 170
Figure 2. Design of Se attle Freeway, construction of concrete cylinders (scale: l" = 60 1).
filled. Strutting across the excavation was impractical, and tie backs through the rock riprap were impossible. Investigation into the possible use of large concrete cylinders poured in place against the toe of the wall footing was carried out. Because there were no known design criteria for this type of construction, it was necessary to establish rational criteria as the design progressed. Reinforced concrete piles 4 ft 6 in. in diameter approximately 45 ft deep with a spacing at 6 ft centers were designed. These poured-in-place cylinders (Fig. 2) solved the problem.
During the excavation of a footing for a bridge structure on the adjacent project to the north, another slide similar to the Olive Way slide started to develop along Lakeview Boulevard. Immediately adjacent to the slide area stood a seven-story apartment building. A 3 5-ft high retaining wall was to be constructed between the bridge footing excavation and the building. It was evident that the wall excavation would almost certainly cause the slide to progress further into the hill and endanger the building.
Slope indicator tubes were immediately installed to determine the length, depth, and directional components of the earth movement. Surface cracks and the readings on the slope indicator tubes revealed that the movement was a block slide with an approximate depth of 45 ft. The back edge of the moving block angled downward through the wall location just westerly of the building. The base of the slippage was along a defined horizontal weak plane. Although movement (slippage) along this weak plane had not yet extended back under the proposed wall location, there was immediate danger that the slide would progress to the east and the proposed retaining wall location and building area. Because the horizontal layer of weak soil on which the slide was moving extended back under the proposed wall and the apartment house, the contractor was instructed not to proceed with further excavation and pile driving.
Because the back edge of the slide had not yet progressed into the footing area of the wall, consideration was given to lowering the footing below the horizontal slip plane and increasing the design to withstand the additional loading. This would have meant making deep excavations in front of the apartment building and using heavy and expensive shoring with no assurance that another slip plane would not develop below the new footing elevation. In addition, the time required for such conventional construction procedures would have caused considerable project delay.
It was decided to use the poured-in-place cylinder pile design. In this case, an active pressure had not yet developed at the cylinder location, and it was realized that if they could be installed before slippage occurred behind the wall location, the loading criteria could utilize the strength of the undisturbed natural soil formation. Also, in this case, the cylinders could be constructed to extend above the future subgrade of the adjacent roadway to the full wall height. This would allow substitution for the planned wall and would permit excavation in front of the wall without delay for shoring. A face wall was developed on the roadway side of the cylinders to simulate the original design.

86
140-
R/W LI NE
/ ,,-----
-220 -210 -200 -190 - 180 -170
'- " DIAM. CYLINDERS AT 61-0"CTRS. (MAX. LENGTH 81 FEET)
Figure 3, Final construction configuration (scale: l" = 60').
To develop resistance to the assumed loads, the design called for 4-ft 9- in. cylinders at 6-ft centers. Cylinders up to 81 ft long were required to reach below the slip plane and other possible planes. The loading was too great to permit the use of reinforcing steel; therefore, welded steel beams were employed. The beams provided the necessary stiffness required for their placement into the predrilled hole8.
Due to the lack of information available for this type of wall construction, provisions were made for instrumentaliou of the beams to study the magnitude of the loading and deflections during loading.
SR- 4 strain gages and slope indicators were installed on the beams (Fig. 8). EPY-150 epoxy was used to affix these gages to the beam, and Colma Joint Sealer was used to provide a flexible watertight and airtight protection for the wiring connections to the junction box installed at the top of the beam. Also, a slope indicator tube was fastened with an epoxy sand grout mixture to the inside flange and web angle of the beams that were instrumented.
The initial cylinder pile wall construction along Lakeview Boulevard extended approximately 360 lineal ft to the south from the intersection of the Lakeview- Eastlake Frontage road structure and Lakeview Boulevard at Belmont Place (Fig. 5). This section of wall has 62 piling that vary in depth from 62 to 81 ft. The weight of the beams varies from 8 to 16 tons.
To avoid delays between concrete pouring and adjacent hole boring and to provide a minimum concrete curing period of three days, it was decided to maintain at least four spaces between open holes as construction progressed. This allowed the drilling crew to prepare a hole while the beam setting crew and concrete crew finished the cylinder pile in a previously drilled hole.
A Calweld truck-mounted earth borer, a 75-ton Loraine crane with a 100-ft boom, an arc welder, compressor, 10-ton fork lift, and various other smaller pieces of equipment were used in this operation. The Cal weld drill rig was equipped with a 48- in. diameter bucket with 5-in. side teeth. Drilling started at pile 18 near the north end of the cylinder wall. Five-foot casing was ordered for installation in the upper 15 to 20 ft of boring to retain the sandy clays in that area. However, in the first hole it was found that a 10- to 12-ft thick layer of very wet sand was present from an approximate depth of 62 to 75 ft. This necessitated full depth casing to prevent sloughing. Excessive moisture from this layer was a constant problem in the borings of the north half of the cylinder pile section, and steady pumping was required before concrete placing. Slough into the holes from this wet zone was not always avoidable, and ultimately it was found

87
necessary in a few holes to drill and case to the upper limit of the sand zone then place the I-beam and drive it to its final elevation with an improvised mandrel and hammer. Because the concrete backfill was used basically to provide full bearing of the soils against the beam without allowing intrusion into the hole, no loss in stability was expected by driving the !:>earns into the sand rather than boring and placing concrete.
Problems developed between the sequencing of the boring and casing operation and the beam placement operation. Also, the concrete under pressure intruded through sand lenses into the area of adjacent holes. This intrusive concrete was well hardened by the time the construction sequence allowed drilling of the adjacent hole thereby hampering the effectiveness of the bucket drill. This problem led to spacing the beams at 7-ft centers where this construction was employed at other locations.
During the boring of the first set of holes, considerable difficulty was encountered in pulling the casing because the earth behind the wall tended to creep forward and exert its pressure on the cylinders. During subsequent operations, however, as the gaps were filled the casings became easier to pull, indicating that the soil loading was being transmitted onto completed piles.
Progress was slow at the beginning of the project, and some questions regarding the construction method were raised. To work out some of the construction problems, charts based on work experience were prepared to determine a better sequence of operations. It was determined that a second large crane used full time for beam and concrete placing would economically increase production. A 70-ton Manitowoc crane and an additional drill rig (a 5-ft diameter Williams earth auger mounted on a Bucyrus Erie 38B crawler with a 60-ft boom) were put on the project. The complete installation of the 62 cylinder piles was completed in 47 working days.
To make the cylinders work as a unit and to transfer shear between cylinders, a 60- by 12- in. cap beam was poured that engaged the uppermost 9 in. of each steel beam. This cap beam was reinforced with six No. 7 bars. To receive the face wall, blackouts were formed in the concrete backfill on the front face of the beams down to subgrade. On the first beams this was accomplished by bolting a 10- by 18- in. timber block to the steel beams, the front face of which was rounded to the contour of the 5-ft diameter casing. This block arrangement was installed in the field. To eliminate this extra step in the field construction pattern, the blackout was soon changed to 13-ga metal that was welded to the beams in the shop. After the beams were installed and roadway excavation completed, the blackouts were removed to expose approximately 18 in. of the steel beam face. Tension ties consisting of 24-in. bolts at 18- to 24- in. centers were welded to the beams and after conventional forming, the face wall was poured giving the final appearance of a standard retaining wall. The final construction features of the cylinder pile wall are shown in Figure 3.
Slide problems similar to those previously mentioned occurred in other areas of the project. In all cases, except one, the nature of the movement was the same, namely, block slides moving outward on nearly horizontal planes with surface cracks developing from 50 to 100 ft from the cut face. Slope indicators confirmed that the slides extended back horizontally and then angled upward to the surface. The one exception was a mantle slide approximately 300 ft wide that developed during heavy rains and was apparently caused by saturation, softening, and subsequent failure of the upper mantle.
Because the soils along the Freeway route adjacent to Capitol Hill did not respond as anticipated to conventional analysis and slide problems did develop, a solution was employed to provide construction continuation and adjacent property damage prevention. The solution has added many dollars to the construction costs; however, it has proven very successful in terms of effectiveness and speed of construction. Additional study and documentation are still required to prove the criteria developed for the walls constructed on this project.
A part of this studying process has been a search for an answer to the unorthodox behavior of the soils. The answer to date is centered around the theory that clays are preconsolidated under extreme pressure from the glacial periods. The extreme pressure, of course, is now dissipated at the ground surface; however, it is still "lockedin" at greater depths and as deep excavations are made, the release of these "lockedin" stresses combined with the lack of horizontal plane cohesion that have been unloaded

88
crack
not t o sca le
Horizontal plane
Figure 4. Development of tension cracks due to the release of "locked-in" stress .
may permit horizontal slippage near the toe of t.he excavation . Lateral movement at the toe along the well-defined horizontal planes quickly develops tension cracks in the slope along the top of excavation (Fig. 4). This theory, as set forth by the Soils Engineering Consultants, has been fairly well documented by slope indicator data. Once the vertical cracks have developed surface water enters and builds up hydrostatic pressure against the wedgP. and the clay disintegrates and softens. Further movement occurs and new cracks open up and the slide progresses up the slope.
Accepting this analysis, it then becomes very important to prevent the release of pressure or to control the allowable movement so that the strength of the clay is not exceeded. To accomplish this , the cylinder pile concept of retaining wall construction seems to be very well adapted because the strength of the wall is placed in the soil before excavation begins, and adequate stiffness can be designed into the beams to restrict the deflection to within the safe limits of the soil. Another very important benefit from the cylinder pile construction approach is the elimination of pile-driving shock waves under the footings of conventional walls. Taking all points into consideration, it is felt that cylinder pile wall construction has a definite place in areas where room and construction schedules are tight.
DESIGN
The cylinder pile is designed using the loading data shown in Figure 7. The most difficult design problem is determining the magnitude and location of the loads. Cylinder 5 used in Test 1 is designed to carry 30 pcf equivalent fluid pressure (EFP) from the top of the wall down to the slip plane. Cylinder 83, shown in Section BB of Figure 6 and used in Test 2 is designed to carry 45 pcf EFP from the top of the wall down to a point 5 ft below the subgrade. The passive soil pressure, Pp, and the active soil pressure, Pa, were found by using the formula Pp = Po + /3 Z + Qu and Pa = Po + 13 Z - Qu ~). The passive and active soil pressures determined by the formula were used to find the supporting capacity of the soil in the cylinder design. The equations take into account the surcharge of soil, Po, that is overlaying the stratum at which Pa and Pp are being sought by the use of the term Po. The term Po = ( /3 h) is the

/ /
I
Southbound Ahorl'
0
8d!erve !Jiit!, H.
Figure 5. Plan of Seattle Freeway in vicinity of cylinder Wall W-7·
89
weight of the soil above the soil stratum being investigated, h is the height , o is the unit weight of soil , and Z equals the thickness of the soil stratum being investigated. The term Qu is the unconfined compressive strength of the soil. From laboratory test data a value of 5 kips/ sq ft (ksf) was assumed for Qu in the hard clay material encountered in the area of the cylinders. Values of Qu are shown to range from 4 to 8 ksf for very stiff clay ~). These values of Qu are valid when the contact pressure is less than one- half the ultimate unit bearing capacity of clay (1).
This assumption of 5 ksf is within these limits, as the blow count from a standard penetration test as well as laboratory test results in the area of Wall W-7 (Fig. 5) shows an ultimate bearing capacity greater than 10 ksf. Using an assumed earth pressure and resistive capacity of the soil below subgrade and with no knowledge of Kh (Coefficient of Horizontal Subgrade Reaction) it was felt that the deflection of the cylinders would have to be kept at a minimum in order for the cylinder design to function successfully as a retaining wall. The maximum deflection at the top of the cylinder was set at 6 in. and the maximum deflection at the slip plane or 5 ft below subgrade was set between 1 and Y2 in. After the loads and dimensions of the cylinder were determined, a deflection calculation was made to determine whether the cylinder deflection was within this limit assuming the tip of the cylinder to be stationary.
There is an inconsistency between the term "equivalent fluid pressure" and the term "Qu." In the following discussion the definition of the term EFP shall be taken as the pressure exerted on a vertical surface, such as a retaining wall , by a cohesionless free- draining gravel backfill material for which the angle of internal friction, 9, is either known or can be easily determined.
The term "EFP" implies that the soil has a 9 angle and little or no cohesion, C, whereas the term Qu, as used in the equation ~), refers to clays with zero or small 9 angles and a cohesive value. From observations and tests of similar soils conditions , it is now believed that based on a total stress analysis the hard clays have a high apparent C value when they are undisturbed. When the material is unloaded or disturbed the value of C is greatly reduced and the chunky hard clay exhibits the properties of a soil aggregate having an angle of 9 and a reduced value of C. There is a pronounced reduction in the strength of the clay when it is unloaded.
The true in- place strength of the clay soil in this area is not known because it has not been possible to extract a completely undisturbed sample for testing. If this value

90
,/ ..
~--~· ....... --·-
0-J?ma.f 6'-at.ntf 9 · .. -·
.·· . ···--·
<XI- ·· ·· .. - :.:
... ~··" ...... ·-
-s t'en('ta / S-?p pion#! EL. 110
R<r~ aM1'11bc"- /Chy~
SECTION A-A
_p:;>a :.::..
~~-~?.-- -- -· --- ··=--- ·· 1412. - -
-~ - __ .JN2 - -
vECTIOA'/ B -8 .
...
Figure 6. Design and test configuration of cylinder pile Wall W-7 ·
100.....
.··
could be determined, the original assumptions could be changed to give a more precise approach to the determination of the lateral pressure and passive resistance to be used.
The material in the mantle slide behind Cylinder 5 consisted of soft, disturbed backfill materials which when saturated would produce an EFP of about 84 lb/ft (1). By removing this material and replacing it with crushed stone, the E FP was reduced and assumed to be 30 lb/ ft (!).
If the coefficient or horizontal subgrade reaction, Kh, were known, the dashed line shown in Figure 7A would represent the resistive soil pressure. The high soil pressure that is found by using a value of Kh occurring at point X in Figure 7A probably would exceed the strength of the soil at this point and the load would tend to be redistributed as shown in Figure 7B; however, the load diagram shown in · Figure 7C was used to simplify the calculations, and this was based on the assumption

7/~-,. ..... *D
Pot ential
BSl l p P lane ~-
~ ~
-~-
\ \ \
---~
Cyl inde r Pl l e
~{• «D
EL l 10
\
' \ \
" \ \
' \ ' '
·'
. \ I
s~waw -" iPF"f* ,.,D
EL 110
91
F J
Pt= ( Pp - Pa)
-·~ ~"'\
- - - - - ~1 --F3
(A) (B) (C). Po l nt "A"
In cases where a slip plane or weak zone do not exist 11 D11 shall be a minimum of 5 1 - 0 11 below the subgrade.
Figure 7. Design diagrams: (A) resistive soil pressure, (B) load distribution, and (C) asswned loading.
that the active pressure acted only on the unsupported portion of the cylinder and Qu is 5 kips maximum as outlined elsewhere in this paper.
With an equivalent fluid pressure of 30 pcf and the assumed loading as shown in Figure 7C, the length of the pile was determined by trial and error and by satisfying the two equations, !:: M = 0 and i; Fh = 0.
Knowing the length of the cylinder and the loads acting on it, a moment and shear diagram can be drawn. The size of the beam can then be determined.
The steel beam core was used instead of the reinforcing steel cage because of construction handling problems. A high- strength , low- alloy steel (ASTM 441) was used in the beams to reduce weight and size.
The maximum and minimum center-to-center spacing was set for the 4-ft 9-in. diameter cylinder piles at 71/2 ft maximum to 6 ft and 7 ft minimum . The maximum spacing was set by the size of the steel beams; the minimum spacing was set by construction conditions as previously discussed.
The design of the steel beam was based on the assumption that the beam would carry the entire load and the concrete would fill the remaining area in the 4-ft 9-in. diameter drilled shafts. It was contemplated that there would be some interaction between the steel and concrete; but because the amount of interaction was so indeterminate , it was not considered.
Baldwin Lima Hamilton bonded wire gages AB-1 (SR- 4) strain gages were placed at ten locations on Test Beam 1, Cylinder 5, and at seven locations on Test Beam 2, Cylinder 83, as shown in Figure 8. Two gages were placed at each location and waterproofed with a sealer compound. A slope indicator tube was also placed on each beam that had the SR- 4 strain gages .
The strain gage and slope indicator tubes on Cylinders 2, 5, 11, and 14, which were the first cylinders to be constructed, were originally installed to determine the actual load carried by the beams. With this information the original loading diagram could be verified or adjusted. It was determined by the gage readings that the entire steel beam went into tension for the first seven weeks.
The material in front of Cylinder 5, Wall W- 7, was then excavated causing the earth to exert a load on the cylinder wall. When Cylinder 5 was loaded by the excavation, the strain gages on the beam showed tension and compression as anticipated. With tension in all the gages before the initial load, it is difficult to determine the neutral axis , NA,

92
4 ; ir~ Gage-~
Comp. Gage~
Active
Sect jon A-A
5 ension F lange Flange
Comp. Flange2'_
A
~ ~ Comp. Gage #I
Gage #1
0 z <lJ
I Gage //2
01
"' ~Subgrade ::;,. (.!J
Gage #5 I I
Gage #3
Flang2.
Gage #7
»z,<$W> i S ubgrad~
Gage #2 "'
Gage #3 ;::...
Gage #7 -..,,
Gage #8 Gage #6 ~
Gage #4 ;:....
Plane Gage #9 Gage #5 ;:....
Gage #I 0 Gage #6 -I.I\
TEST BEAM NO. 2 TEST BEAM NO.
Figure 8. Strain gage placement and spacing .
of the cylinder. In Cylinder 82, a strain gage was placed on the web so that the tension could be determined and the other gage readings corrected.
It was noted from the first load test on Cylinder 5 that the NA was near the center of the beam section; therefore, it was felt that a gage in the center of the web would only detect the initial tension effects with the loading effects being negligible.
After five weeks of loading on Cylinder 5, the gages and slope indicators showed the beam to be stressed to about 13 percent of the original assumed load. The stress did not appreciably increase beyond this initial load limit and because of the small load on the beam, a load test was necessary to get more information on the structural characteristics of the beam and the supporting characteristics of the soil.
The equipment used for Test 1 and later for Test 2 is shown in Figure 9. The load was applied by a 50-ton jack and the results of Test 1 are given in Table 1. The small stress readings on SR-4 strain gages 4, 5, 8 and 9 (Table 1) and the small slope indicator readings shown on the curve in Figure 11 are all within instrument error.
The moment of inertia, lxx, of Cylinder 5 was calculated by the formula t::.= PL;;/ 3 El assuming the Cylinder to be fixed at 34 ft below the top. The point at which Cylinder 5 was assumed fixed was determined by the test dial gage deflection curve shown in Figure 11. The Ixx of the transformed section was calculated assuming the cylinder was an uncracked section. The two values of Ixx agree fairly well with Ixx transformed section equaling 8. 8 x 10⁵
, in. 4 and Ixx (by deflection) equaling 10 x 105, in . 4 • The
compressive strength of concrete as shown by the curve in Figure 10 is 6, 000 psi, and

93
Cylinder #5
SR-4 st rain
Slope
Iron
Figure 9. Cylinder t est plan confi guration .
the modulus of elasticity of concrete, Ee, was taken to be as tentatively recommended by ACI-ASCF for prestressed concrete, approximately 5, 000 ksi while the modulus of elasticity of steel, Es, was taken to be 30, 000 ksi giving an n of approximately 6.
The maximum stress in gage 1 as given in Table 1 is 2. 4 ksi, whereas the calculated stress in the cylinder at that point using the uncracked section and using an n = 6 is 3. 0 ksi. This shows fair correlation between test and calculated values.
The added stiffness realized, in Cylinder 5 (not anticipated by the initial assumptions) is believed to be mainly caused by the ability of the concrete in the cylinders to carry tension. The added stiffness may also be due, in part, to the initial tension in the steel that was indicated by the strain gages and may have been caused by the shrinkage of the concrete onto the steel beam which in turn would set up tension stresses in the steel through the effects of Poisson's ratio.
By using the formula for beams on elastic foundation ~) and assuming an infinite beam, a value for the coefficient of horizontal subgrade reaction, Kh, was investigated. Using the dial gage deflection curve, Ixx, and the loading data from Test 1, the value of Kh was calculated to be 2 .16 k/cu in. This value of Kh is much higher than any of the recommended values in hard clay.
Cylinder 5 was reanalyzed as a beam on an elastic foundation (j) using an assumed value of 850 pci for Kh, !xx for an uncracked section, and the loads as shown in Figure 7C. The calculations showed that there was very little difference in the maximum moment between this method and the original trial and error method used.
TABLE 1
TEST DATA FOR TEST 1, CYLINDER 5, WALL W-7
Load Upper
(ton) Dia l 1 ks i 2 ksi 3 ksi 4 ks i 5 ks i 7 ksi 8 ksi 9 ksi (in . )
10 0. 02 20 0. 074 +0.84 +O. 450 +O. 30 -0.15 25 0. 109 +1. 050 +0. 450 +0.45 -o. 15 30 0 . 147 +1. 50 +0. 600 +O. 60 +O. 09 -0.15 - 0. 15 40 0. 250 +2 . 4 +1. 05 +O. 90 +0. 15 - 0. 30 - 0. 15

94
6000#
Q)
> ·- _c Ill .., Ill Q) c: I.. Q) Q_ I.. E ...., 0 "' u
0
n = 6
Ee = 4800 ~~ ~O~?
- - I
/' /
/
/ /
/ Concrete Test Cylinder / Strength Curve
1/ Retaining Wall W-7 / Class AX Concrete and
I
I Pozzolith I
lJAYS
Figure lO. Concrete compressive strength curve.
A total deflection of approximately 2 in. was calculated and was less than initially anticipated; therefore, the simplified trial and error solution using the loading as shown in Figure 7C and a limiting value of 5 ksf for Qu gives results that are very close to those found by the elas-tic analysis.
1©1 40 Tons
0 - I I ...
, /.;--Slope
lo- / ,'T Max.
' : 20 - t l
I I
30 -
40-
50-
60-
70-
78
II; ., Subgrade I ll,l§>/'!}11/ill.lllll
Slip Plane
El . l l O'
Indicator Curve = A = 0.55"
Figure ll. Deflection curve for Test l showing dial gage and slope
indicator data.
The calculations of Kh show that a small change in deflection will cause a large change in the value of Kh; therefore, the value Kh within a large range has little effect on the deflection of the cylinders when the value of EI i::; lar~e.
After evaluating the information in Test 1 and finding that the results were not as anticipated another test was set up on Cylinder 83, shown in Section BB Figure 6, to verify some of the data from the first test and further investigate the location of the NA, tension effect, and Kh.
The same equipment and method used in Test 1 were used in Test 2. The location of the SR- 4 strain gages are shown in Figure 8 with gage 4 being placed in the center of the web so that the tension effect and NA could be evaluated.
Tension showed on all the gages in Test 2 before the cylinder was excavated. The actual tension cannot be completely evaluated because of a malfunction of the strain gage meter a few weeks before the test was to be made.
The SR-4 strain gage readings for Test 2 are given in Table 2, and the deflection curve is shown in Figure 12. Strain gage 4 that is on the web of the steel beam showed negligible change during the test loading; therefore, it was assumed that the cylinder acted as an uncracked beam during the entire test.
The property of the cylinder pile to act as an uncracked beam during loading was also observed in Test 1 and with the added information showing the NA to remain in the center as shown in Test 2, it is felt that the concrete does take tension that is normally not assumed in design.
The maximum stress shown by the strain gages and those calculated using an Ixx of the transformed section seem to agree because the calculated stress at gage 3 is 2. 2 ksi and Table 2 shows a stress of 2. 1 ksi for gage 3. The calculated deflection 0. 0926 in., assuming the beam to be fixed 23 ft from the top (determined from the Test 2 dial gage deflection curve) using the transformed Ixx and the observed total deflection 0.104 in., also agrees fairly well.
Using the data found in Test 2, the value of Kh was calculated to be approximately 200 kips/ cu. in. This is larger than the value found in Test 1 and much larger than

Load
lOk 20k 30k 40k 50k
Subtotal
50k 60k 70k 80k 90k
Total
0
5
10
D la 1
~b Grade
25
30
35
40
43
Figure 12.
95
TABLE 2
TEST DATA FOR TEST 2, CYLINDER 83, WALL W-7
Upper Lower 1 4 Dial Dial ks i ksi ksi ksi
0. 006 o. 001 - 0 . 03 +O. 21 -0.18 0. 0 o. 007 0. 003 -o. 09 +0.12 -o. 15 0. 0 0. 013 0.003 -0 . 18 +0 . 18 -0. 21 0. 0 0.012 0.003 - 0.18 +0.18 :-o. 24 0. 0 0.020 0.004 -0.18 +0.18 -0. 30 M 0.058 o. 014 -0. 66 +0.87 -1. 08 0.0
0.031 o. 008 -0. 48 +O. 45 -0.48 0.0 0. 009 0. 002 -0.12 +O. 09 -0.12 0.0 0. 013 0.003 -o. 15 +0.15 -o. 30 0.0 0. 015 o. 006 -0. 18 +0.18 -0. 30 0.0 0. 009 0. 005 -0.18 +0. 24 -0. 30 0.0 0.104 0.030 -1. 29 +1. 53 -2.10 0.0
,''6= 0.18" ,
I c(s-slope Indicator
, Curve
1/ Load=90k
I
, , , ,. A= 0.075" I
I I
I I
I , , , I .
I
Deflection curve for Test 2 .
5 7 ksi ksi ksi
+0.18 -0. 03 +O. 06 +0.15 -o. 03 +O. 06 +O. 24 :-0.18 +O. 09 +0.09 -0.15 +0.12 +0.24 -o. 21 +0.15 +O. 90 -o. 60 +0.48
+O. 36 -0. 30 +O. 21 +0.15 -0.12 +O. 06 +0.27 -0.15 +0.15 +O. 30 -0. 24 +0.18 +O. 27 -0. 24 +0.18 +1. 89 -1. 35 +1.05
any recommended value. (The values for Kh in this paper were calculated using the full diameter of the cylinder.)
The strain gages in Cylinder 83 were read before, during, and after the unloading or excavation in front of Wall W- 7. After evaluating these readings using the loadto- stress data found in Test 2, it was determined that an E FP load of approximately 100 pcf was impressed on the cylinder during the unloading operation. The large load is believed to be caused by the release of the high "locked-in" lateral stresses in the overconsolidated clays.
The results of Test 2 have confirmed most of the data found in the first test, but added testing is necessary to resolve all the questions that this type of design has brought up.
The two load tests that have been conducted on the
cylinder pile are only short-time load tests at best. The final test of this type of design would have to be determined over a longer period of time.
The SR-4 strain gages and slope indicators on cylinders 2, 5, 11, and 14 have been observed for approximately one year. Slope indicator and strain gage curves from July 1962 to July 1963 are shown in Figures 13 and 14. The curves show the loading on the cylinders to be quite constant between August 1962 and April 1963. In April 1963 added load was brought onto the cylinders by a malfunction of horizontal drilling in the area. During the drilling operation for horizontal drains, air was being used at 100 psi to blow out the tailings in the drill hole. The drill hole became plugged and the air pressure pushed the water through the fissures and cracks in the hill behind Wall W- 7 causing the release of the old slide. The added load came on the cylinder wall in April 1963 as shown in the curves. The loading on the cylinder wall again became quite constant from April 1963 to July 1963.
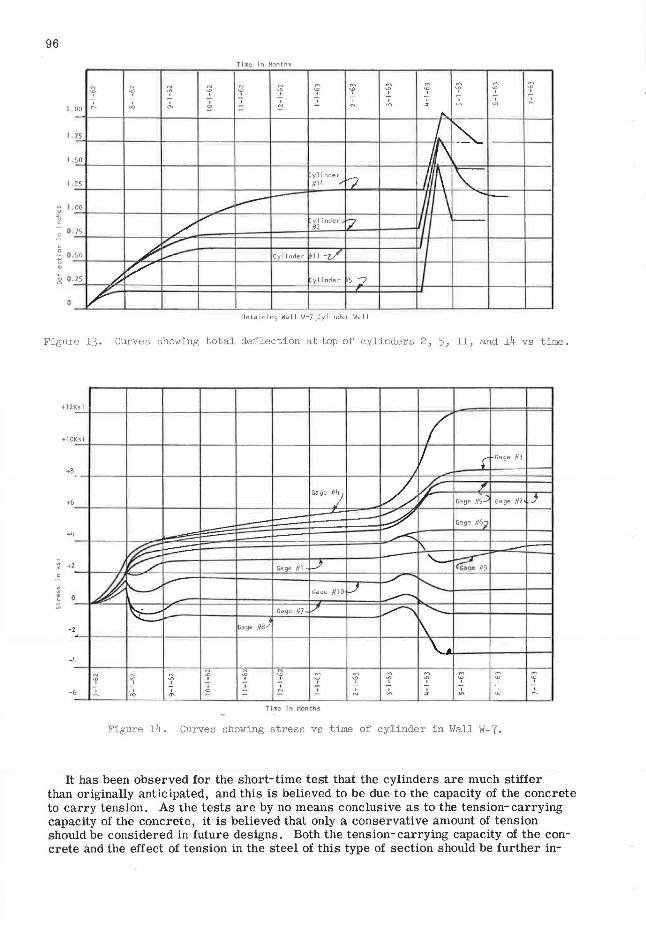
96
Time In Months
N N N M M M
"' "' "' "' "' "' "! "' "' "! "' "! ' ' ' ' ' ' ' ;!_ ' ' ' ' ' ' ' ' ' '
"' "' N N M ... "' ~
. 00 - ... 7> "'-I\ 50
yl i nder
r7 I \ " 25 #14 "
~I -;: 0
l--- \ -"---.
00 ~
/ v hi inder,. t7 -
. 75
/ ~ , 50 1--- Cylinder 11/11 -z/
. 25 /,, ~ yl inder 15 -; I I
0 v Retaining Wall W-7 Cylinder Wall
Figure 13. Curves showing total deflection at top of cylinders 2, 5, 11, and 14 vs time.
+12 Ks i
+10 Ks i (
I [ Gage #3
+8 j
h /
Ga~e #') // ?
'/" Gage #5-" Gage #2 .J +6
- - -.// Gage #6'}
+4 ........-=:::::
/~ " - '- ~ Gaqe #I u - <Cos- #9 +2
0 ~ ---/ I'-.._ ....__....,
Gage #10 LJ ....---..-~_, Gage #7 v """'\ ..........
2 ~age #8 } ~ \
4
N N N N
~ M M M
"' "! "' "' ' "' "' "! "' "' "' "' ' ' ' .!. ' ' ' ' ' 6 ' ' ' = N ' ' .!-. ' ' '
~ "' "' N ... ~ "' ~
Time in Months
Figure 14. Curves snowing stress vs time of cylinder in Wall W-7.
It has been observed for the short-time test that the cylinders are much stiffer than originally anticipated, and this is believed to be due to the capacity of the concrete to carry tension. As the tests are by no means conclusive as to the tension-carrying capacity of the concrete, it is believed that only a conservative amount of tension should be considered in future designs. Both the tension-carrying capacity of the concrete and the effect of tension in the steel of this type of section should be further in-

97
vestigated before any large value is assigned to the tension- carrying capacities of the concrete.
The type of load test conducted on the cylinders is not considered to be suitable for determining the Kh value of the clay because the inherent error in the testing equipment is excessive for such use, and the Kh value was found to be very sensitive to deflection in the cylinder design. A more suitable test for determining the Kh value has been proposed and is being carried out at this time.
The long-term test shown by the curves in Figures 13 and 14 shows the cylinder pile to be stable under normal working loads. The slope indicators, giving very little information in the short-time load test because of their error, have proven to be valuable in this type of testing because the error over a longer period of time tends to balance out.
Cylinder pile design has given rise to many questions regarding loading, capacity of the soil, and the structural properties of the cylinder pile. The tests that have been conducted on the cylinders have given some insight as to the properties of the cylinders, but further testing is required to fully answer the questions that have arisen.
REFERENCES
1. "Evaluation of Coefficients of Subgrade Reaction. " Geotechnique, 4, 5: 315 (Mar. -Dec. 1954-55).
2. "Soils Mechanics and Foundations Dimensions. " ASCE Proc. , p. 262- 22 (Sept. 1953).
3. Timoshenko, S. , "Strength of Materials, Part II." 4. Hete'nyi, M., "Beams on Elastic Foundation."

Corrosion Performance of Aluminum Culvert THOMAS A. LOWE and A. H. KOEPF
Respectively, Department of Metallurgical Research, Kaiser Aluminum and Chemical Corporation, Spokane, Washington; and Field Engineering Manager, Highway Products, Kaiser Aluminum, Oakland, California
This paper discusses corrosion characteristics of aluminum and how these characteristics might be affected by burial in soil. The influence of various types of soil on aluminum are discussed in the light of experience gained through monitored culvert installations including a compendium of field performance with aluminum culvert and an appraisal of the over-all performance of the product.
•MORE THAN 20, 000 installations of aluminum culvert have been made since its introduction approximately four years ago. No problems involving corrosion have been encountered in any of the major Great Soil groups during this period. Since aluminum culvert became available, its resistance to attack by soils has been of interest to the culvert buyer. A thorough investigation of the corrosion performance of many representative installations has been made to record their condition.
An earlier report (1) detailed the structural characteristics and performance of aluminum culvert. This paper discusses the influence of soil characteristics on corrosion of aluminum, describes the test program initiated to evaluate corrosion performance, and reports the results of in-place inspections of culvert and laboratory evaluation of representative samples removed during inspection.
FUNDAMENTALS OF ALUMINUM CORROSION
Aluminum like many other metals is dependent on a surface film for corrosion resistance. Its superiority for many applications is based on the properties and characteristics of this film as compared with films on other metals. Aluminum oxide forms instantaneously on a bare aluminum surface when oxygen is present. This oxide film possesses a number of beneficial properties. It is tough; it does not flake or break away as the metal surface is distorted, formed, or subjected to temperature or humidity variations. It is inert to a range of chemical environments from strong acid to alkaline but generally within a pH range of 4 to 9. It is a good electrical insulating material. It immediately re-forms, if damaged mechanically or corroded, and the new film has properties similar to the one replaced. Should the film be disrupted as the result of corrosion, the corrosion products that collect at the point of attack tend to stifle further corrosion reaction by providing an effective barrier between the metal surface and the aggressive environment.
Corrosion of metals is an electrochemical mechanism. It can therefore be seen that the presence of a tough, uniform, renewable film that serves as an inert barrier between the metal and its environment and acts as an insulator in an ionic circuit would inhibit electrochemical reaction.
ALUMINUM'S RESISTANCE TO CORROSION
The corrosion resistance of aluminum has been reported for many applications. Most of these reports note that aluminum is not immune to some attack. They establish that attack does not proceed at a linear rate, but decreases within a short time to
Paper sponsored by Committee on Metals in Highway Structures. 98

... -· . • · :_ I ~ ..... ·-:- .....
99
-· .. . -
Figure 1. Type of attack on (a) bare and (b) clad aluminum surfaces, caustic fluoride etch, lOOX.

100
TABLE 1
CORROSION PERFORMANCE OF UNPROTECTED ALUMINUM ALLOYS IN SEAWATER (~, 23)
Maximum Percent Change
Alloy and Temper Pit Depth (mils) in Tensile Strength
0. 5 Yr 8. 0 Yr O. 5 Yr 1. 0 Yr 2.0 Yr 8.0 Yr
3003-H14 9.0 7.0 - 3 - 2 - 4 - 1 Alclad 3004-H18 2.5a 0 5050-H34 11. 0 12.0 - 2 - 1 - 5 - 3 5052-H34 12.5 10.5 - 2 - 2 - 3 - 2
aDepth of pitting confined to the cladding.
virtual arrestment. Excellent long-term evidence of this characteristic is the ASTM 20-yr data for aluminum alloys exposed in various industrial, marine, and rural environments (2). Sim-
TABLE 2
TYPICAL VALUESa
Alloy
1100 2024-T4 3003 3004 5052 5086 6061-T6 7072
Potential (v)
0.84 0.69 o. 83 0.84 0.86 0.88 0.83 0.96
ain aqueous solution contal11l11g 57 gm/liter NaCl and 3 gm/liter H,, 02 at 25C, using a 0.1 N calomel refer-ence electrode.
ilar performance has been observed in sea water tests as shown by the pit count data presented in Table 1 (~).
Improvement of Corrosion Resistance
Alloying. -Pure aluminum is of little interest to a structural engineer because of its low mechanical properties. Some elements that are added to improve these properties also improve the corrosion resistance of the metal. Examples of such elements are magnesium and manganese as used in alloy 3004, the core material for aluminum culvert sheet. Other elements such as copper greatly detract from the corrosion resistance of pure aluminum.
Cladding. -Further improvement of corrosion resistance can be gained by cladding each side of one aluminum alloy with another aluminum alloy that is more electronegative. In illustrating the purpose of cladding, it should be explained that attack of aluminum usually occurs at highly localized point sources. These points are believed to represent defects in the oxide film which are more vulnerable to penetration by aggressive ions. If attack occurs, these small areas become the anodes of corrosion cells which tend to penetrate into the metal rather than causing a general removal of metal over large areas; however, the penetrating attack is generally self arresting. By adding a more electronegative cladding to the surface of the alloy, galvanic protection of the alloy is provided. Then, should corrosion occur, the attack will spread laterally over the clad layer rather than into the core, as shown in Figure 1. The corrosion products formed at any point of attack on this clad surface have the same tendency to arrest further attack as do those on any corrosion-resistant aluminum alloy. Even should the alloy 7072 cladding be completely removed, the 3004 core alloy of culvert sheet possesses a high order of corrosion resistance.
The typical solution potentials for some of the more common alloys are given in Table 2. It can be seen that alloy 7072 is sufficiently anodic to provide protection to all the alloys listed.
INFLUENCE OF SOIL CHARACTERISTICS ON CORROSION
Soil Resistivity
One of the most widely used measurements for indicating soil corrosivity is resistivity. Because corrosion is an electrochemical phenomenon, the importance of resistivity is evident. The higher the resistance the lower the current flow for a given driving force and consequently the lower the metal loss. Flow of corrosion currents are further reduced by adding the resistance of the aluminum oxide film to the resistance offered by the soil.

101
A minimum soil resistivity of 1, 500 ohm-cm has been suggested as a threshold value below which corrosion of aluminum may occur (4). In soils having a lower resistivity, protection of the aluminum has been advocated for successful performance. This minimum figure was obtained through considerable field experience with aluminum pipelines. Other uses of resistivity have been proposed to classify the aggressiveness of soils (5, 6, 7). That resistivity influences the processes of corrosion of buried metals is seldom disputed. There are many cases, however, indicating that other factors play an equal or perhaps more significant role in corrosion of buried culverts
Soil pH
Soil chemistry is believed to contribute to the corrosivity of a soil (8, 9). Various construction materials theoretically display varying resistances to corroSion within the range of pH encountered in soils. Aluminum oxide is generally inert to chemical attack within the range of pH 4 to 9 (10). This range accounts for nearly all soils in the United States because it almost covers the entire range of pH listed by the U. S. Department of Agriculture (_!!).
Other Factors
Other factors that contribute to soil corrosion are permeability, moisture content, and the homogeneity of the surrounding soil electrolyte. A number of investigators feel that corrosion of buried metals is caused by the non-uniform nature of the contacting soil (12, 13). This lack of uniformity is related to the consistency of soil compaction and its subsequent influence on aeration and moisture retention. Uncontrolled backfill can foster the establishment of differential concentration cells on a metal surface. These can exist until soil compaction reaches that of the undisturbed stage. Aluminum, of course, is no more subject to such corrosion than other metals commonly used underground.
SOIL CLASSIFICATION
Many classifications have been applied to soils. These may be broadly subdivided into two groups, structural and pedological. It should be noted that all soil classifications are general. Within each classification area there might be considerable variation of certain soil characteristics. From a corrosivity standpoint, certain soil groups might be mild in one geographical area and severe in other areas. Nonetheless, it is useful to discuss the soil associations and relate them to the corrosion characteristics of soils previously discussed.
Structural Classification
The structural series of soils is of particular importance in construction uses. There are several of these: the Unified Soil Classified System (14); the U. S. Bureau of Public Roads and Highway Research Board Classification, adopted by the American Association of State Highway Officials (15); and the Civil Aeronautics Administration Classification of Soils for Airport Construction (16). These systems rate soils in engineering terms, using bearing strength, drainage characteristic, plasticity, and liquid limit. The FHA (17) and the U. S. Army (18) have provided generalized ratings of structural and corrosion performance of soils based on the engineering classification. The textural Classification Chart (!§) rates soils on the basis of material, sizing, and grading.
Pedological Classification
The Pedological classification system of soils (Table 3) has been broadened and improved by the U. S. Department of Agriculture (19). This classification describes soils through the geological similarity, including climate, vegetation, parent material, and age. There is also a similarity in chemical composition. This system provides the best insight into a means of determining the chemical forces present and relating them to corrosion studies of aluminum culvert.

102
TABLE 3
CHEMICAL CHARACTERISTICS OF THE GREAT SOIL GROUPS
Group
Desert
Chestnut and Brown
Chernozem
Prairie
Gray-Brown Podzolic
Red-Yellow Poclzolic
Poclzol
General Location in United States
Western States, inland from Pacific Coast to Rocky Mountains
Western Great Plains, North Dakota to Texas
Northern and Central Great Plains
Central Midwest, Minnesota to Kansas
Central East Mississippi River to Atlantic Ocean , Kentucky to Michigan , Northwest Pacific Coast
Southeast, Virginia to Texas, and Missouri
Northern Great Lakes, New England
TABLE 4
Common Range of Reaction
Neutral to strongly alkaline (pH 6. 6 - 8. 5)
Neutral to strongly alkaline (pH 6. 5 - 8. 5)
Slightly acid to neutral (pH 5. 6 - 7. 0)
Medium acid to neutral (pH 5. 6 - 7. 0)
Strongly acid to slightly acid (pH 5. l - 6. 1)
Very strongly acid to medium acid (pH 4. 5 - 5. 5)
Extremely acid to strongly acid (pH 4. 0 - 5. 5)
CHEMICAL COMPOSITION OF THE SPECIAL SOIL GROUPS
Group
Alluvial
Sand Saline water and soil
Peat
Ground Water Podzol
Peat and Silt, Muck or Half Bogs
Clay Muck
8u lfur ic Acid or Sulfides
Major Location in United States
River channels or basins, valley bottoms
Western Nebraska, pockets in Southwes t All sea coast areas 1 narrow belt in
Uplands to wide belt in Coastal flluina. Selected roads in northern Midwest
Southern Florida, western Great Lakes, California delta
Coastal areas, Georgia to Mississippi
Southern Georgia, Southern Florida, Gulf Coast
Gulf Coast bayous, river mouth banks, Southern Atlantic Coastal Plain
Isolated locations in northern California, Yellowstone, in coal beltsi western Pennsylvania to Missouri
Common Range of Reaction
Variable: from strong alkaline, reflects character of great soil
Neutral Slightly acid to alkaline
Very strongly acid to slightly acid (pH 4. 0 - 6. 5)
Acid to alkaline
Very strong acid to neutral (pH 4. b - 'I. ~)
Extremely acid to neutral (pH 3. O - 7. 3)
Extremely acid to neutral (pH4.0-7.0)
Other groups from the Great Soil classification and special groups have been treated separately in Table 4. These groups are of particular interest when examining soils for characteristics that might affect aluminum performance. To maintain a true perspective of the incidence of these special soils, it is pointed out that as a group they total less than five percent of the United States, with three groups, saline water and soil, alluvial, and sand, making up the vast majority.
CURRENT EVALUATION
Previous investigations of aluminum's resistance to soil corrosion were found to be quite limited as to the alloys or soils studied (12, 20, 21, 22). However, a study of all available information indicated the more corrosion-resistant aluminum alloys should perform well in that broad category of soils that are acceptable structurally to the highway engineer.
Early Tests
Prior to the introduction of aluminum culvert, a field service program was undertaken to determine its resistance to soil corrosion. Test pipes incorporated several aluminum alloys of previously demonstrated high corrosion resistance. Initial field installations were made in selected soils , attempting to cover the five basic chemical soil classifications used by the National Bureau of Standards (12). Subsequently, an
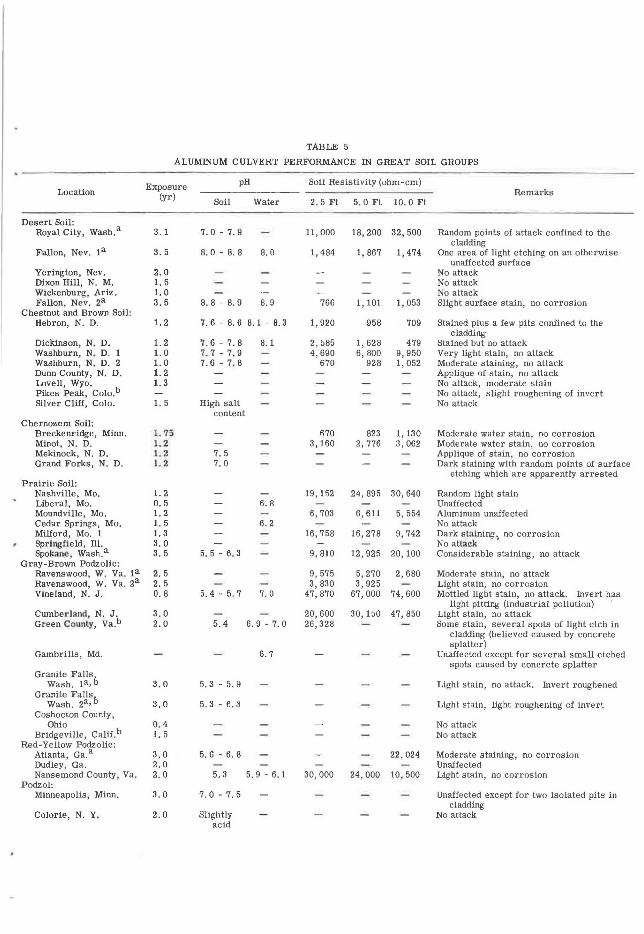
TABLE 5
ALUMINUM CULVERT PERFORMANCE IN GREAT SOIL GROUPS
Exposure pH Soil Resistivity (ohm-cm) Location (yr) Remarks
Soil Water 2.5 Ft 5.0 Ft 10.0 Ft
Desert Soil: Royal City, Wash .a 3. 1 7.0-7.9 11, 000 1 B, 200 32, 500 Random points of attack confined to the
Fallon, Nev. 1a 3. 5 B. 0 - B. 8 8.0 cladding
1, 484 1, 867 1, 474 One area of light etching on an otherwise unaffected surface
Yerington, Nev. 2.0 No attack Dixon Hill, N. M. 1. 5 No attack Wickenburg, Ariz. 1. 0 No attack Fallon, Nev. 2a 3.5 8. 8 - 8. 9 8.9 766 1, 101 1, 053 Slight surface stain, no c·orrosion
Chestnut and Brown Soil: Hebron, N. D. 1. 2 7. 6 - 8. 6 8. 1 - 8. 3 1,920 958 709 Stained plus a few pits confined to the
cladding Dickinson, N. D. 1. 2 7. 6 - 7. 8 8. 1 2, 585 1,628 479 Stained but no attack Washburn, N. D. 1 1.0 7.7 - 7.9 4,690 6, 800 9,950 Very light stain, no attack Washburn, N. D. 2 1. 0 7.6-7. 8 670 928 1,052 Moderate staining, no attack Dunn County, N. D. 1. 2 Applique of stain, no attack Lovell, Wyo. 1. 3 No attack, moderate stain Pikes Peak, Colo.b No attack, slight roughening of invert Silver Cliff, Colo. 1. 5 High salt No attack
content Chernozem Soll:
Breckenridge, Minn. 1. 75 670 823 1, 130 Moderate water stain, no corrosion Minot, N. D. 1. 2 3,160 2,776 3,062 Moderate water stain, no corrosion Mekinock, N. D. 1. 2 7.5 Applique of stain, no corrosion Grand Forks, N. D. I. 2 7.0 Dark staining with random points of surface
etching which are apparently arrested Prairie Soil:
Nashville, Mo. 1. 2 19,152 24,895 30,640 Random light stain Liberal, Mo. 0.5 6.8 Unaffected Moundville, Mo. 1. 2 6,703 6,611 5, 554 Aluminum unaffected Cedar Springs, Mo. 1. 5 6.2 No attack Milford, Mo. 1 1. 3 16,758 16,278 9,742 Dark slnlning) no corrosion Springfield , Ill. 3,0 No at(ack Spokane, Wash.a 3.5 5. 5 - 6. 3 9, 810 12,925 20,100 Considerable staining, no attack
Gray-Brown Poclzolic: Ravenswood, W. Va. 1a 2. 5 9,575 5,270 2, 680 Moderate stain, no attack Ravenswood, W. Va. 2a 2. 5 3,830 3,925 Light stain, no corrosion Vineland, N. J. 0.8 5. 4 - 5. 7 7.0 47,870 67,000 74,600 Mottled light stain, no attack. Invert has
light pitting (industrial pollution) Cumberland, N. J. 3 . 0 20,600 30, 150 47,850 Light stain, no attack Green County, Va.b 2.0 5.4 6. 9 - 7. 0 26,328 Some stain, several spots of light etch in
cladding (believed caused by concrete splatter)
Gambrills, Md. 6.7 Unaffected except for several small etched spots caused by concrete splatter
Granite Fallsb Wash. 1a, 3. 0 5. 3 - 5. 9 Light stain, no attack. Invert roughened
Granite Fallsb Wash . 2a, 3,0 5.3 - 6.3 Light stain, light roughening of invert
Coshocton County, Ohio 0.4 No attack
Bridgeville, Calif. b 1. 5 No attack Red-Yellow Poclzolic:
Atlanta, Ga. a 3.0 5. 6 - 6. 8 22,024 Moderate staining, no corrosion Dudley, Ga. 2.0 Unaffected Nansemond County, Va. 2.0 5. 3 5. 9 - 6. 1 30,000 24,000 10, 500 Light stain, no corrosion
Poclzol: Minneapolis, Minn. 3. 0 7.0 - 7.5 Unaffected except for two isolated pits in
cladding Calorie, N. Y. 2.0 Slightly No attack
acid

TABLE 5 (Cont'd)
ALUMINUM CULVERT PERFORMANCE IN GREAT SOIL GROUPS
Exposure pH Soil Resistivity (ohm-cm) Location (yr) Remarks
Soil Water 2. 5 Ft 5. 0 Ft 10 . 0 Ft
Alluvial: Salton Sea, Calif. ~.n 7. 5 - 8. 0 50 Random light surface etch confined Lu
Calif. 1 a cladding
Hayward, 3.25 7.4 -7.9 1,006 958 1, 072 Mottled stain, no attack, random pitting of clad in invert
Hayward, Calif. 2a 3.25 8. 0 - 8. 1 No attack Concord, Calif.a 3.6 7.6-7.8 1, 053 1, 197 1,264 Mottled light stain with a few small areas of
etching confined to the clad Saline Water and Soil:
Dunedin, Fla. 2. 5 - 3. 0 Sea Invert stained, some fouling, no attack water
Pumpkin Creek, Colo. I. 5 No attack Woodside, Utah 1. 0 Alkaline 50 Up to 13. 9:1\ salt (8% Mg,so.)-no corrosion Wendover, Utah 1. 5 Alkaline 50 No attack on soil side. Random slight etch-
ing of cladding in invert Oxnard, Calif . 1. 5 Dull, matte appearance, no attack Nags Head, N. c. 1. 0 756 1, 053 766 No attack, heavy stain on invert, no corrosion Port Charlotte, Fla. 3.0 3,970 2, 870 2, 105 Soil side stained, no attack, rand om light
pitti ng in the invert Peat Soil:
Cle Elum, Wash .a 3. 0 + 6.3 10, 050 10 , 500 14, 350 Slight water stain, no attack Belle Glade , Fla. 2. 0 7.1 -8,0 6.8 7.1 622 909 1,395 Invert disculurt::!Ll. 1.Jul uu cur1·u8iuu Manotowish, Wis. 1. 1 3.2-4.4 5. 7 - 6, 4 16,758 22,023 22,981 Light water stain, no attack
Ground Water Podzol: Waycross, Ua. 2.U 4. 2 - 4. 6 5.4 47,878 83' 150 93,900 Lustrous , generally unaffected except for a
Fla.a few cladding pits
Sarasota, 3.5 4.8 -5.2 5.0 - 6,0 143,400 79,400 32,000 Unaffected Bermont, Fla. 2,5 6. 0 33,500 23 ,940 8,400 A few random cladding pits, otherwise
unaffected Citrus Center , Fla. 3.0 6.8-7.8 7.9 -8.3 13,400 8,610 6,300 Uniform light stain, no attack Brunswick, Ga. 2 . 0 7.4-7.8 7.1 440 - 1, 530 153 Cladding uniformly removed over much of
6,470 surface, attack confined to c ladding Silt Muck or Half Bog:
Chalmette, La. 1a 3.0 7.2-7.5 766 939 708 Stained, no corrosion Chalmette, La. 2a 3. 0 7. 5 957 1, 053 881 Moderate stain, no attack Greenwich, N. J. 3.0 4.1 7.8 852 1, 149 1, 550 Random attack , confined to cladding
Clay Muck or Bog: Gramercy, La. la 3. 5 6. 9 - 7. 1 479 507 574 Applique of etching in the clad layer Gramercy, t.a. 2a 3.5 6.5-7. 0 Applique of etching in the clad layer
SUifuric Acid or Sulfides: Liberal, Mo. 0.5 2.7 Clad gone in invert, core alloy pitting Moundville, Mo. 3.1 Severely corroded invert Osceola , Mo. 1. 2 2.6 Severely corroded invert Oroville , Calif. 2.0 Invert cladding gone, metal perforated Redding, Calif. 2. 0 Invert cladding gone , metal perforated Coshocton County,
Ohio 1 0.4 4. 1 - 4. 2 Slight attack Coshocton County,
Ohio 2 0.4 3.1 Cladding gone in invert, metal perforated
ainspected p eriodically as bErosion sit e .
part of original test program .

105
increasing number of installations in all types of exposure were added to the original placement. Exposures were made in all the basic Great Soil types.
Present Study
Approximately 500 installations were screened early in 1963. Some were inspected in detail and have been reported. These represent typical performances in the various exposures mentioned. In addition to an evaluation of soil corrosion per se, it was of interest to determine the performance of aluminum culvert with particular effluents. These included runoff which is acidic due to the oxidation of sulfides and runoff which is erosive due to entrained particulate matter.
Culvert Examination
At each installation reported, a section of the culvert was uncovered and examined closely to determine its condition. Samples, approximately 6 by 6 in., were removed from those culverts comprising the original test program and from certain others where permission from such removal could be readily obtained. An effort was made to include any questionable surface condition in the sample. In addition to observations of the culvert soil-side performance, a check was made of the condition of the invert or waterside surfaces.
Measurements of the soil resistivity were generally taken with a Model 263A Vibroground equipped with a harness for obtaining the average resistivity through 2. 5-, 5. 0-and 10. 0-ft depths. Soil and water pH readings were made with a Beckman Model 180 pocket pH meter. Some readings were omitted because of lack of water flow at the time of inspection, or because of lack of interest in specific measurements due to the overriding influence of other characteristics affecting culvert performance, such as erosion or acid runoff.
Culvert samples were returned to the laboratory where they were cleaned and examined more closely. Sections were taken from samples showing corrosion for metallographic determination of the nature and extent of attack. Areas of stain or unusual surface condition were similarly examined.
The results of these inspections are given in Table 5. An attempt has been made to place each of the installations within the proper Great Soils group to facilitate comparisons within and among the groups.
RESISTANCE TO CHEMICAL ATTACK
A study of the data indicates that the performance of aluminum is relatively consistent throughout each soil group. Within the entire listing of Great Soil groups in Table 3 (more than 95 percent of the geography of the United States) there is no evidence of general corrosion attack on aluminum. The pH range of 4. 0 to 9. 0 removes the prospect of chemical attack on the oxide film. Typical of the attack observed on aluminum culvert in certain cases is the sample from Royal City, Wash. This installation has been inspected at the end of 0. 5-, 1-, 2- and 3.1-yr exposure. Random superficial attack was noted on this culvert at the end of 0. 5 yr that was similar to that seen after 1 yr (Figs. 2, 3 and 4). Subsequent inspections and sampling indicated that the attack had not progressed to any measurable degree (Figs. 5, 6 and 7).
Alluvial soils do not seem to follow any consistent pattern with respect to their chemical activity. The increase in fines in such soils, however, tends to reduce their resistivity. In areas of less rainfall, these soils may become alkaline as in Concord, Calif. The low resistivity mildly alkaline soil there has caused no significant attack. Differential coloration in the two corrugation valleys (Fig. 8) was caused by the chromicphosphoric acid cleaning solution. A section through the lacy patterns of etching noted on that sample shows the attack to be superficial (Fig. 9).
Experience with salt water exposure (23) and experience gained during this evaluation indicate that aluminum can serve satisfactorily in saline environments. However , it is possible for the corrosion of aluminum culvert stock to proceed at significant rates in the presence of chlorides under anaerobic conditions. This should not be construed to

Figure 2. Random superficial attack of aluminum culvert at Royal City, Wash., after 1 yr, no e_tch, 5/6 X.

107
Figure 3. Random attack of aluminum culvert at Royal City, Wash., after 1 yr, caustic fluoride etch, lOOX.
Figure 4. Random attack of aluminum culvert at Royal City, Wash., after 1 yr, caustic fluoride etch, lOOX.

Figure 5, Random superficial attack of aluminum culverL aL Royal ClLy, Waioll., afLer 3.1 yr, no etch, 5/6 X.
Figure 6. Random attack of aluminum culvert at Royal City, Wash., after 3 .1 yr, caustic fluoride etch, lOOX. Depicted here is the unaffected condition of most of the surface
and the nature and extent of pitting which appear as small dark spots on the surface.

Figure 7. Random attack of alumimun culverl at. Royal CiLy, Wash., after 3.l yr, caustic fluoride etch, lOOX. 1'he area showing maximm11 depth of attack has some clad alloy remain
ing on the surface.
Figure 8. Alwnimun culvert, Concord, Calif., after 3. 5 yr-, no etch, 5 /6 X. Coloration in the corrugation valley was caused by chromic-phosphoric acid cleaning solution.

110
.~ -". .. . •, · .. ~ :
.·. .. •. .,., .. ,
..... -:
.. . ·~ . -. ~ . .
:. , .. . .
....... .
""·'-•. , .. .... . . .... . • .
'.
. . . . .
. .. : .... -....... ~ ..
-:.- ..... ..
•. -. . '·· .
. ' ~ .-
::..
.· ~.--... . .
....... ...
. -. ... - . ..... . . ..
r ' , . . . ..... ... ~
• .# . . ... !" ~
!' - •
Figure 9. Aluminum culvert, Concord, Calif., after 3. 5 yr, no etch, lOOX. Chemical attack was superficial on the soil-side surface.
indicate problems with aluminum due to anaerobic bacteria such as the sulfate reducers. There is considerable information attesting its compatibility in the acid hydrogen sulfide environments caused by these bacteria.
The peats, bogs, and mucks are normally very poor construction soils (14, 15, 16, 17, 18) and are, therefore, generally rejected in favor of selected backfill for structural n~asom;. Nonelheless, for reasons uf umle1·_slamli11g suil t:orrusiu11, lltey are of inleresl.
The organic acids usually associated with peat do not cause corrosion of aluminum. In addition to the installations shown under "peat" and "ground-water podzol" in Table 5, aluminum has provided nine years of satisfactory performance for buried irrigation lines in a Grayland, Wash. bog.
Performance of aluminum in silt mucks will depend upon soil characteristics such as pH and resistivity combined with chemical content of the soil, primarily chlorides, and the extent to which good backfill compaction practices are followed.
Clay-rich mucks present an extreme case. They drain poorly and consequently afford poor aeration characteristics. They are difficult to compact, thereby offering numerous opportunities for heterogeneous soil conditions on the culvert surface. Resistivities are usually low, therefore concentration cell activity may proceed at significant rates. The typical appearance of aluminum culvert after 3. 5 yr service in a clay muck at Gramercy, La. is shown in Figure 10. Original surface can be seen on much of the sample. The photomicrograph in Figure 11 indicates the condition which prevails over most of the remaining surface-a thin layer of cladding is still present. Deepest attack of the core alloy 2. 0 mils is shown in Figure 12. Fortunately, the occurrence of clay-rich mucks is quite limited. They usually occur at the point where a river empties into the ocean or in a few isolated swamp areas of the United States.
Sulfuric acid or exposed natural sulfide deposits can produce acid conditions of pH 1.o.C'IC th~n A n Tn th;o ("H]C'.1.0. nn ...... ..-.n.cdnn r.f 'll11n·dn11Y'V"I n'ln l"\nn11-r th ..... n11rrh rliC!C!Al11tinn Af tho .LVUl.J 11,..L.L-.LA .L • V • .&.l..L ................ .._,_._.....,' '-'\J.&. .&. \J.._,.LV.L.L \J..&. ~.L ..... .1..L ... .&.&.L ..... .L.L.&. V-.L.I. \JV'-" ..... .L "&&.&. '-"....._5.1..1. ............ ...,....,, .............. .._,, ...... \J.L ".1..1.V
oxide and aggressive attack of the underlying metal. Some areas where sulfuric acid of this concentration occurs have been located. In northern California, natural sulfide deposits lie near the surface in a few isolated areas. When uncovered, they promote the formation of acid runoff. Volcanic sulfuric acid is created by subsurface action in Lassen National Park, and aggressive concentrations are also found in the Yellowstone Park region. Many instances of sulfuric acid runoff below pH 4. 0 have been observed

Figure 10 . Aluminum culvert, Gramercy, La., after 3.5 yr in clay muck, no etch, 5/6 X. Areas which have not been attacked can be distinguished from those on which the cladding
has been et ched.
--.~ ..... .... . .:
Figure 11. Aluminum culvert, Gramercy, La . Soil-side section represents typical condit i on of etched surfaces on sample, caustic fluor ide etch, lOOX.

112
- ~ -~ - . . -
~'~-- .- : . . ":'-"'_ . .. ... .. :; .. : ~ ":"' ... · •. · .: ~
-- '
~- · - ~ .... • .,:,,-~ >- .. '•,.i- ~ .. ..· ~---:.::..· -
·-- ... .. : ... - <:::. - _.. ~
· . .,.., '"'.: .. .. _ .. · ,, -· --. : .. -~-
.. """ .... --. .. ... -: ·--_"":"'·-
- ·. ..;... __
.·. -· .... . --:---,, .. '· ....... ~ -;: . .;. ·: ....... -..
.:..!' ,. .;. ...... .. ..... ..
.... ... · ... :,., .. ' ........ .. ; t • .,~
-.' '•,."' e -: ~ ~ -: . - . .. ~ - .. -· ~:-·.- .
Figure 12. Aluminum culvert, Gramercy, La. Areas of deepes t at tack typified by thi s soil-side section occurred on the corrugation crest, caustic fluoride etch, lOOX.
in the coal-rich Western Appalachians from Pittsburgh, Pa. to Missouri and Mississippi. These are generally well located by previous experience, color of the runoff area, or lack of vegetation.
It is of academic interest to note that aluminum can provide satisfactory performance in acid areas if dilution raises the pH value to above 4. 0. Such a case exists in Meigs County, Ohio where corrosion has caused rapid destruction of non-aluminum corrugated culvert. Aluminum culvert was tested there in 1960. No readings more acid than pH 5. 0 have been taken during the interim, and the aluminum is unaffected. The culverts in Coshocton County, Ohio offer another case where runoff below pH 4. 0 is causing severe attack and above 4. 0 is causing only insignificant attack.
RESISTANCE TO EROSION
Discussion of corrosion of aluminum culvert must include consideration of the effects of abrasive forces on the over-all performance or service life of the structure. A program of field evaluation has been established to observe the behavior of aluminum and, in some cases, galvanized steel culvert in a variety of aggressive exposures. Some of the installations are noted in Table 5.
Preliminary investigation indicates that bed load type and water velocity at the invert, which combine to become the destructive energy, are the basis for comparing the various installations. Observations indicate that a bed load of sandy material alone will not remove significant amounts of metal from the aluminum surface even at substantial velocities. It will, however, cause slight roughening of the invert. Bed loads consisting of stones would be expected to provide higher energy at a given velocity. Where significant roughening or metal movement has been noted , the hed loa<I included a substantial quantity of rocks 3 in. or more in diameter.
Experience to date with heavy bed loads has been at velocities up to 8 fps, 8 to 10 fps, 13 fps, and 25 to 30 fps. No significant roughening occurred below 8 fps. A slight roughening has been observed in the 8 to 10 fps range causing surface displacement of a random nature (Fig. 13). In this instance, the energy is sufficient to abrade zinc and

r
113
(o)
(b)
Figure l3. Aluminum culvert, Granite Falls, Wash: (a) clad alloy, (b) core alloy, caustic fluoride etch, lOOX. This section from the invert shows distortion of the cladding layer
that occurs as a result of the peening action of particles carried by the runoff.
(o)
(b)
•
Figure l4. Galvanized steel culvert, Granite Falls, Wash: (a) bakelite mounting, (b) steel core, no etch, lOOX. This section from the invert shows that the zinc coating has been removed from the galvanized steel invert and pitting of the underlying steel has
started.

114
iron oxide. To date, typical performance of the steel at this site is shown in the photomicrograph (Fig. 14). One culvert in which velocity is 13 fps shows definite signs of metal removal due to wear energy. An experimental installation where water velocity was 25 to 30 fps provided destructive energy of such force that neither corrugated metal (aluminum or steel) nor concrete could resist rapid wear that caused thinning and destruction of the inverts by tearing.
Thus, from the preliminary program, it appears that hydraulic design of aluminum culvert might well be limited to sustained velocities below 10 fps where a heavy rockladen bed load is anticipated. Where the bed load is sandy, higher velocity limits are possible.
CONCLUSIONS
On the basis of aluminum culvert inspection results of nearly 500 installations in the major Great Soil groups, the following tentative conclusions can be drawn:
1. Aluminum culvert is resistant to attack by soils of the Great Soil groups that com prise almost all of the soil in the United States. It is being used successfully throughout the country.
2. The corrosivity of a soil to aluminum roughly follows its structural rating, that is, corrosion possibilities increase as the structural desirability of the soil decreases. Exceptions are the Peat and associated groups that are good draining, highly organic materials. In these soils, aluminum is performing well.
3. The corrosion attack observed on the soil-side surface of some aluminum culvert is believed to be the result of non-uniform soil compaction rat.her than of borderline pH or resistivity conditions. Such lack of uniformity causes concentration cells whose activity is influenced by soil resistivity. Good compaction at the time of installation can reduce attack from such cells.
4. The 7072 alloy cladding on aluminum culvert stock is providing adequate protection to the 3 004 alloy core.
5. Effluents normally encountered with culverts are causing no corrosion problem. However, acid runoffs having a pH of 4. 0 or lower can cause aggressive attack of aluminum. Bare aluminum is not 1·ecummended fu1· l11ese highly add fluws.
6. Service performance of aluminum in abrasive or erosive runoff is very satisfactory. The results of inspections reported here indicate that use of aluminum culvert should be limited to runoff velocities below 10 fps if a heavy rock-laden bed load is anticipated. Higher velocities are permissible when the bed load is primarily sand.
7. Soil resistivity, soil pH, or a combination of these characteristics do not offer a completely reliable basis for predicting soil corrosivity. These factors can, however, have an influence upon the over-all corrosivity.
REFERENCES
1. Koeph, A. H., " Structural Considerations and Development of Aluminum Alloy Culvert." HRB Bull. 361, pp. 25-55 (1962).
2. ASTM Spec. Tech. Publ. 175 (1956). 3. Summerson, T. J., et al., "Metals." ASTM Spec. Tech. Publ. 196. 4. Whiting, J. F., and Wright, T. E., Corrosion, p. 9 (Aug. 1961). 5. Stratfull, R. F., Corrosion, pp. 115-118 (Oct. 1961). 6. Denison I. A., and Ewing, S. P., Soil Science, 40:287 (1935). 7. Ewing, S., Amer. Gas Assn. Monthly, 13 :70 (Feb. 1931). 8. Shipley, J. W., and McHaffie, I. R., Chem. Met., Canada, 8:121 (1924). 9. Denison, I. A., and Hobbs, R. B., Jour. Res. NBS, 13:125, RP 696 (1934).
10. McKee, A. B., and Brown, R. H., Corrosion, 3:595 (1947). 11. "Soil Survey Manual." U. S. Dept. of Agric. Handbook 18, p. 235 (1951). 12. Romanoff, M., "Underground Corrosion." NBS Circ. 579 (1957). 13. Tomashav, N. D., and Mikhailovsky, Y. M., Corrosion, pp. 41-46 (Feb. 1959). 14. "Unified Soil Classification System for Roads, Airfields, Embankments, and
Foundations." MIL-STD-619(CE) (June 1960).

;
115
15. "Manual of Highway Construction, Practices and Methods." AASHO (1958). 16. Spangler, M. G., "Soil Engineering." 2nd Ed., Internat. Textbook (1960). 17. "Engineering Soil Classification for Residential Developments." FHA 373. 18. "Roads and Airfields." U. S. Dept. of Army TMS-250 (Aug. 1957). 19. "SoilsandMen." U.S. Dept. ofAgric. (1938). 20. Sprowls, D. 0. , and Carlisle, M. E., Jr., Corrosion, 17:125 (1961). 21. Gilbert, P. T., and Porter, F. C., "Tests on the Corrosion of Buried Aluminum,
Copper, and Lead." Iron Steel Inst. (London) Spec. Rept. 45 (1952). 22. "Aluminum Pipeline Case History Data." NACE Committee T-2M Rept. Mater.
Protect. , 2(10):101 (1963). 23. Summerson, T. J. , "Corrosion Resistant Aluminum Structural Alloys for Marine
Environments . " Presented at 18th Ann. NACE Conf. (Mar. 1962).

I so-pH Maps ldentif y Areas Detrimental to Drainage Structure Performance Life J. C. OLIVER and R. D. PALMORE
Respectively, Testing Engineer and Geologist, Bureau of Materials and Tests, Alabama State Highway Department
•THIS PAPER is a preliminary report of an investigation to determine the hydrogenion concentration in natural water throughout Alabama and to map these data. AIRo reported is a study to show how such data, together with data on the hydrogen- ion concentration and electrical resistivity of various soil types, can be used to construct a map outlining geographic areas that are detrimental to metal highway drainage structures.
During the summer of 1960 it was discovered that two perforated metal pipes on I-65-2, near Jemison, Ala., had been excessively damaged along the flow line by natural elements. This deterioration, or corrosion, of pipe culverts in certain areas of Alabama is not unusual, but the fact that these pipes had been destroyed in less than eight months was unusual.
Investigation showed that the pH of the water passing through these drainage structures was about 2. 5, and the nearby soil in places was so acid that no vegetation would grow, also, that the rocks in the immediate vicinity were intensely folded phyllites disseminated with pyrite, an iron-sulfide mineral that upon weathering and contact with the flowing water produced sulfuric acid. Apparently, this acid was produced in enough concentration to severely corrode the lower portion of the existing pipes. The condition was corrected by replacing the damaged pipe with terracotta clay pipe.
The occurrence initiated the idea that it might be possible lo vreuelermine areas within the State where existing soil, rock, or water conditions might be aggressive to certain types of drainage pipe.
Previous experience by the Bureau of Maintenance has developed the fact that metal pipe does not give satisfactory performance life either in the immediate coastal area or in some areas adjacent to coal mining operations in north central Alabama.
PURPOSE AND SCOPE
Zoning the State into areas of high and low pH value seemed the most economical and feasible approach to the problem. Therefore, a review of the literature was begun. This effort, coupled with interviews with pipe manufacturers, maintenance engineers and highway department chemists indicated that not only was the life of a drainage pipe dependent on the pH of its hydraulic traffic, but that some ten to twelve other factors also were believed to have a definite effect on the life of pipe culverts, including:
1. Amount of flowing water. 2. Velocity of flowing water. 3. Content of abrasive sediments. 4. Hydrogen- ion (pH) concentration of the water. 5. Hydrogen- ion (pH) concentration of the in- place soil. 6, Electrical resistivity of the in-place soil. 7. Chemical content of the water with regard to the concentration of calcium car
bonate, sulfates, and dissolved solids. 8. Geologic environment from which the water originates.
Paper sponsored by Committee on Metals in Highway Structures.
116

117
9. Presence of organic compounds. 10. Man-made interference of the watershed, such as agriculture and pollution.
It was generally concluded, however, that the major factors affecting the life of pipe culverts are items 4, 5 and 6 in the preceding list. Therefore, it was decided to broaden the scope of this investigation to encompass these three main factors in pipe corrosion and to divide the study into two phases: Phase I was established to be the testing and mapping of hydrogen- ion concentrations in the natural water throughout the State and Phase II was to be a study of the electrical resistivity and hydrogen- ion concentration in the various soil types. The end product of this study is expected to be the construction of a map which would outline geographic areas where no alternates would be carried in the Alabama Highway Department's specifications as to type of drainage pipe.
This paper, then, deals only with the findings on the pH of natural water throughout Alabama. As can be imagined, this project is of considerable magnitude, and although this work has been in progress for approximately two years, certain questionable areas within the State still have not been sampled or the data thoroughly analyzed. Therefore, the current paper is presented as a preliminary report on Phase I.
The remaining field work and final report, for both phases of the study, will be made by the Water Resources Division of the Alabama Geological Survey, through a cooperative research program financed by H.P. S. funds. This agency will undertake an "inplace" water sampling program, in conjunction with an investigation of the related soils conditions. A complete report is expected by the spring of 1965.
GENERAL INFORMATION
'To define the limits of the project, and to establish the correct terminology for natural water and corrosional phenomena, the following were adopted:
Hydrogen-Ion Concentration (pH). -The hydrogen- ion concentration indicates how acid or how alkaline a water is. The symbol pH is a much more usable expression and is employed to represent the hydrogen-ion concentration. For example, a water with a pH of 7. 0 is said to be neutral-neither acid nor basic. A pH of 6. O means that the water is ten times more acid than water of pH 7. O; pH 5 means it is 10 times more acid than pH 6 or 100 times more acid than pH 7.
Groundwater. - For the purpose of this study, groundwater is considered to be that water which is contained within its natural geologic environment in a zone of saturation. A spring, for example, is considered to be groundwater until it has migrated one surface foot from the zone of seepage. It then becomes surface water.
The mineral content and pH of groundwater are directly related to the geologic formations through which it moves. At the outcrop area of a water-bearing stratum the water is generally acidic due to the presence of organic acids derived from the decomposition of vegetation, animal matter, and the weathered soil mantle. As this water moves down within the formation, it tends to collect and become saturated with water- soluble minerals. Generally, groundwater becomes more alkaline as it moves down dip in the Coastal Plain of Alabama.
Surface Water. - Surface water is considered to be that water which is visible on the earth's surface. Examples are puddles, ponds, streams, rivers, and lakes.
The mineral content of surface water is dependent on the character of the soil and the rock through which it flows. It is also influenced by outside contamination with sewage, mine drainage, vegetation, and agricultural components. It is known that the mineral content and pH vary in surface water during periods of heavy rainfall and drought.
In Alabama the pH of surface water, when not affected by unusual conditions, ranges from 6. 3 to 7. 8 .
Theory of Corrosion. - A review of the available literature indicates that corrosion is one of the principal causes of deterioration of metal pipe. Other materials such as concrete and wood are likewise subject to rot and corrosion. It is generally accepted that the corrosion of metal in soil is an electro- chemical process and occurs in the presence of moisture, oxygen, and soil salts.

118
In fact, the Southern Bell Telephone Company has, for about the last 25 years, routinely conducted electrolysis tests prior to laying underground cables and conduits. These tests are performed in order to combat the electro- chemical action produced by moisture and soils on their cables and conduits. A study of Southern Bell's electrolysis data is scheduled for Phase II of this report by the Geological Survey.
The foregoing deals with corrosion resulting from metal in contact with soil. However, experience with drainage structures is that corrosion of the pipe's exterior is usually of less consequence than that occurring from the hydraulic traffic on the pipe interior.
CHEMICAL CLASSIFICATION OF WATER AS IT AFFECTS DRAINAGE STRUCTURES
Mineral Water.-Sulfur-bearing coal seams, or geologic strata containing sulfide ore deposits (such as the phyllite with disseminated pyrite discussed earlier), produce waters which arc corrosive to nearly all materials normally used for drainage structures. This is due to the formation of free acid, originating from acid-forming salts carried in the water.
Every stream in a sulfide mineralogical environment is not necessarily contaminated with chemical constituents that are harmful to structures through which they flow. Other investigations have shown that only the stream that comes in contact with a sulfide- bearing stratum, or issues from an associated mining operation, is contaminated.
For example, in the Brookwood coal mining area of north-central Alabama, only water issuing from mines in or actually cutting certain groups of coal is contaminated. Water issuing from mines developed in some of the other coal beds has a relatively low hydrogen- ion concentration with an almost neutral pH. This occurrence is generally typical for all areas within the Warrior coal field.
Acid Water. -This classification includes many of the conditions previously mentioned. In addition, it refers to aggressive waters caused by contamination with organic acids present in marsh and swamp land, or other areas where considerable quantities of vegetable matter are decaying. Such conditions, often found in conjunction with soft, unstable foundations, tend to increase the difficulty in constructing suitable drainage structures .
Southern Alabama is characterized by many semi-tropical swampy areas where this acid condition is common.
Alkali Water. -"Alkali" is rather a vague term when used to describe certain salts present in many of the arid and semi-arid regions of the western States. This word, it seems, originally was used to describe the soils of these areas in relation to their ability to produce agricultural crops. In general, both concrete and metal pipes fail to provide satisfactory service when associated with an alkaline hydrologic environment.
Drainage structures in Alabama are not seriously affected by this condition. Salt Water. -The chlorides in sea water are primarily responsible for the corrosion
of metal, whereas certain magnesium salts are thought to cause deterioration of concrete. The deterioration resulting from chemical attack by this type of water is accelerated by mechanical disintegration resulting from alternating periods of wetting and drying, as well as frost action. The southwestern tip of Alabama is subject to this corrosional condition.
CONSTRUCTING THE ISO-pH MAP
It has been previously stated that the purpose of Phase I was to develop maps showing the existing pH values for water throughout the State . This was begun by consulting the Groundwater and Surface Water Branches of the U , S . Geological Survey. Both of these agencies had numerous records and publications that listed the location, date of test, and hydrogen- ion concentration value for groundwater and surface water throughout Alabama.
The Public Health Department had also made an extensive study of the surface water in Alabama, and in doing so had recorded the pH at numerous stations along major streams.
..
I
,,
119
It was also found that the Groundwater Branch had recorded numerous pH values for deep water wells. These values were omitted from the current study because they often were taken from bored wells whose depths exceeded 100 feet. It is planned, however, to contour the pH values from these deep water sources. This is expected to have little or no consequence on the study, but merely to provide a comparison with the pH trend for surface water.
The actual construction of the iso-pH map was done by plotting each pH value, as to date, and the location from which it was recorded on a State map, scaled 1 in. to 8 mi. That is, all values recorded during seasons of heavy rainfall were plotted and contoured on one map, and the pH values for dry seasons were plotted and contoured on a second map.
It was necessary in contouring the pH's to set all values in the range of 6. 7 to 7. 3 as neutral. This was done not only to facilitate the actual contouring, but also to take care of the variation in pH values produced by temperature and atmospheric pressure.
High-Water Isa-pH Map.-Figure 1 shows the iso-pH map constructed with pH values taken during the high-water months of December to April since 1955. The "low" areas in north-central Alabama are produced by acid water from the coal mining area. Also worthy of note are the slightly acidic values in the extreme south, and the alkaline trend in the central belt of the State. The alkaline trend generally follows the strike of calcareous sediments in the coastal plain formations.
This map is considered to be of a more general nature than those shown in Figures 2 and 3 because of the limited number of available pH data.
Low-Water Iso-pH Map. - Figure 2 shows the iso-pH map constructed with pH values recorded during low-water periods in the months of July to October since 1955.
This map also shows low values in the coal mining region and a definite acidic condition existing along the southern part of the State.
It can also be noted that the pH trend in the east- central part of the State is most irregular. This is probably due to the complex geologic and soil conditions that exist in this section of the State. Parent material found in this area consists of igneous and metamorphic rocks, which include slates, schists, phyllites, quartzites, granites, gneiss, and marble. Sulfide minerals are also known to be common to many of the watersheds in this vicinity .
Contours drawn from pH values taken in the east-central part of Alabama , therefore, are presumably less accurate than for any other area due to the variable nature. of these soils and rocks. The Geological Survey is presently conducting a close- knit sampling program in this area with the hopes of analyzing the pH trend more precisely.
Isa-pH Check Map. - Figure 3 shows the iso-pH map constructed with pH values determined by the Alabama Highway Department. These data were obtained by having the seven divisional offices take samples from designated sources within the counties in their respective areas. This sampling was conducted during the months of September and October 1962.
Samples were collected in 6- oz pharmaceutical bottles. Each bottle was thoroughly rinsed with the water that was to be sampled, and then tightly capped, numbered, and sent to the chemical laboratory in Montgomery. Care was taken to get these water samples to the laboratory as soon as was practical so as to obtain as accurate an in- place pH reading as possible. The readings were made with a Beckman ZeroMatic pH meter.
In all, more than 700 pH readings were made from springs, branches, and creeks in almost every township in Alabama. This resulted in coverage of the out-of-the-way sources heretofore untested. In this way, many of the unexpectedly high and low values caused by pollution were accounted for.
As shown in Figure 3, the map produced is somewhat comparable to the maps made from government data.
Zone Map of Corrosive Areas. - Figure 4 shows the final interpretation of the iso-pH maps. It is a map which outlines the areas where deleterious water conditions were found to exist. In drafting this map, the "lows" were marked off in rectangular-type patterns roughly conforming to the pH contours of that particular area.
The acidic area in north- central Alabama that results from the presence of coal deposits was studied in detail. It was decided to establish the outer limits of these ag-

~ "O
))
APPROX. 35 MILES
t N
j
Figure 1. !so-pH map of Alabama surface waters constructed on pH values recorded during high-water
periods (December to April) since 1955·
APPROX. 35 MILES _.I
Figure 2. !so-pH map of Alabama surface waters constructed on pH values recorded during low-water
periods (August to October) since 1955.

\. _, L.,
Figure 3. constructed
-.
' N
'
APPROX . 35 MILES
Iso-pH map of Alabama surface waters on pH values recorded in field survey of
September-October 1962.
'
Figure 4. specific
J
IZlZZI Concrele Or Clay Pipe Should Be Used
llllIIIIIll Cloy Pipe Should Be Used
)
~ MarQincl Areas W~ Melal Pipe Can Be Used Bui Cont rol• Or Clay Pipe Is Recommended . ·
Pipe zoning map of Alabama showing areas where types of drainage pipe are recommended to
provide longer performance life.
122
gressive zones to be compatible with the margin of the areas that are underlain by coal seams known to contain excessive amounts of sulfides. Alabama Geological Survey publications on the coal in this region served as a guide to the location and content of these seams. Previous experience and records on the coal beds in this area were also utilized.
Figure 4 shows the recommendation for areas where specific types of drainage pipe should be used.
In summary it can be said that chemical, soil, and rock conditions, in addition to the pH of water, influence the service life of pipe culverts. Some of these phenomena are as yet not fully understood. Therefore, because the major portion of damage to drainage pipe is believed to result from its hydraulic traffic, a study of the surface water pH value is the most reasonable approach to identifying areas where water may be corrosive to pipe culverts. Although the scope of this type investigation is of a general nature, it does reduce the magnitude of the area of study, by isolating those areas where detailed study should be made.
CONCLUSIONS
1. Measuring the pH of surface water throughout an area is a fast, relatively inexpensive means of identifying areas that may affect the performance life of highway drainage structures.
2. The accuracy of an iso-pH map is based on taking a sufficiently large number of readings, in enough locations, to insure thorough coverage of the area.
3. In areas of questionable pH values a check sampling program should be conducted. This is necessary to confirm the presence of organic compounds originating from pollution and agricultural products.
4. Separate test programs and maps should be made for seasons during heavy rainfall, and light rainfall. A third map should be constructed as a check against the season producing the most aggressive condition.
5. The variable nature of in-place pH values taken in surface water will result in a general pH trend; that is, iso-pH lines are not conclusive, but averages, and should · be considered as such.
REFERENCES
1. Baker, J., "Geology and Ground Water Resources of the Piedmont Area." Spec. Rpt. 23, Alabama Geological Survey, University, Ala. (1957).
2. Beaton, J. L., and Stratfull, R. F., "Corrosion of Corrugated Metal Culverts in California." HRBBull. 223, p. 1 (1959).
3. Beaton, J. L., and Stratfull, R. F., "Field Test for Estimating the Service Life of Corrugated Metal Pipe Culverts." Bur. Materials and Research, Div. of Highways, State of California (Jan. 1962).
4. Carlston, C. W. , "Ground Water Resources of the Cretaceous Area of Alabama." Spec. Rpt. 18, Alabama Geological Survey (1944).
5. Caroon, L., Personal Discussion and Interview, District Engineer, Surface Water Branch, U.S. Geological Survey, University, Ala. (Nov. 1961).
6. Cook, J. D., and Scott, R. G., "Sewer Facts." Clay Products Assoc. 7. Gill, D. G. (Chairman), "Studies of Pollution in Streams of Alabama." State
of Alabama, Water Improvement Advisory Commission (1949). 8. LaMoreaux, P. E., "Fluoride in the Ground Water of the Tertiary Area of
Alabama." Bull. 59, Alabama Geological Survey, University, Ala. (1948). 9. LaMoreaux, P. E., Personal Discussion and Interview, State Geologist, Alabama
Geological Survey, University, Ala. (Nov. 1961). 10. Langbein, W. B., and Iseri, K. T., "General Introduction and Hydrologic Defini
tions." Manual of Hydrology. Part I, Water Supply Paper 1541- A, U. S. Geological Survey.
11. Leopole, L.B., and Langbein, W. B., "A Primer of Water." U.S. Geological Survey.

12.
13.
14.
15.
16.
17.
18.
19.
20.
21.
22.
23.
24.
25.
26.
·'
/
Manson, P. W., "Drain Tile Characteristics That Determine the Durability of Concrete Drain Tile When Exposed to Acid Waters." Tech. Memo. , Amer. Cone. Pipe Assoc. (Oct. 1, 1960).
123
Manson, P. W., and Miller, D. G., "Essential Characteristics of Durable Concrete Draintile for Alkali Soils." Tech. Memo., University of Minn.
McCalley, H., "Warrior Coal Basin." Spec. Rpt. 10, Alabama Geological Survey, University, Ala. (1900).
McCalley, H. , "Map of the Warrior Coal Basin." Alabama Geological Survey, University, Ala. (1898).
Miller, D. G., "Basic Requirements for Sulphate Resistant Draintile with Particular Reference to the Cement." Tech. Memo. , Am. Cone. Pipe Assoc. (Nov. 1, 1958).
Miller, D. G., and Manson, P. W., "Long-Time Tests of Concretes and Mortars Exposed to Sulphate Waters." Tech. Bull. 194, Univ. of Minnesota Agric. Exper. Sta. (May 1951).
Peckworth, H. F. , "Concrete Pipe Field Manual." Managing Director, Amer. Cone. Pipe Assoc.
Pierce, L. B., "Hydrology and Surface Water Resources of East Central Alabama." Spec. Rpt. 22, AlabamaGeologicalSurvey, University, Ala.(1955).
Pierce, L. B., "Surface Water Resources and Hydrology of West Central Alabama." Spec. Rpt. 24, Alabama Geological Survey, University, Ala. (1959).
Powell, W. J., Personal Discussion and Interview, District Geologist, Ground Water Branch, U.S. Geological Survey, University, Ala. (Nov. 1961).
Prouty, W. F., "Map of Coosa Coal Field." Alabama Geological Survey, University, Ala. (1912).
Prouty, W. F. , "Geology of Clay County." County Report No. 1, Alabama Geological Survey, University, Ala. (1923).
Squire, J., "Map of Cahaba Coal Field." Alabama Geological Survey, University, Ala. (1905).
Spindler, W. H., "Handbook of Drainage and Construction Products." Mark Development Division, Armco Steel Corp.
Watkins, R. K., "Influence of Soil Characteristics on the Deformation of Embedded Flexible Pipe Culverts." HRB Bull. 223, p. 14 (1959).
Copyright © 2022 FDOKUMEN