TRANSED 2018 - Transportation Research Board
166
TRANSPORTATION RESEARCH TRANSED 2018 15th International Conference on Mobility and Transport for Older Adults and People with Disabilities November 12–15, 2018 Taipei, Taiwan, R.O.C. Number E-C262 April 2020
-
Upload
khangminh22 -
Category
Documents
-
view
0 -
download
0
Transcript of TRANSED 2018 - Transportation Research Board
T R A N S P O R T A T I O N R E S E A R C H
TRANSED 2018
15th International Conference on Mobility and Transport for Older
Adults and People with Disabilities
November 12–15, 2018 Taipei, Taiwan, R.O.C.
Number E-C262 April 2020

TRANSPORTATION RESEARCH BOARD 2020 EXECUTIVE COMMITTEE OFFICERS
Chair: Carlos M. Braceras, Executive Director, Utah Department of Transportation, Salt Lake City
Vice Chair: Susan A. Shaheen, Adjunct Professor, Co-Director, Transportation Sustainability Research Center, University of California, Berkeley
Division Chair for NRC Oversight: Chris Hendrickson, Hamerschlag University Professor Emeritus, Carnegie Mellon University
Executive Director: Neil J. Pedersen, Transportation Research Board
TRANSPORTATION RESEARCH BOARD 2019–2020 TECHNICAL ACTIVITIES COUNCIL
Chair: Hyun-A C. Park, President, Spy Pond Partners, LLC, Arlington, Massachusetts Technical Activities Director: Ann M. Brach, Transportation Research Board David Ballard, Senior Economist, Gellman Research Associates, Inc., Jenkintown,
Pennsylvania, Aviation Group Chair Richard Bornhorst, Principal, FACTOR, Inc., Silver Spring, Maryland, Freight Systems
Group Chair Michael Griffith, Director, Office of Safety Technologies, Federal Highway Administration,
Safety and System Users Group Chair George Avery Grimes, CEO Advisor, Patriot Rail Company, Denver, Colorado, Rail Group
Chair Brendon Hemily, Principal, Hemily and Associates, Toronto, Ontario, Public
Transportation Group Chair Nikola Ivanov, Deputy Director, Center for Advanced Transportation Technology
Laboratory, University of Maryland, College Park, Young Members Council Chair C. James Kruse, Director, Center for Ports and Waterways, Houston, Texas, Marine Group
Chair Mark Reno, Principal Engineer, Quincy Engineering, Inc., Rancho Cordova, California,
Design and Construction Group Chair Elizabeth Rushley, Lawhon & Associates, Inc., Columbus, Ohio, Planning and Environment
Group Chair Joseph Schofer, Professor and Associate Dean of Engineering, McCormick School of
Engineering, Northwestern University, Evanston, Illinois, Policy and Organization Group Chair
William Varnedoe, Principal, The Kercher Group, Raleigh, North Carolina, Operations and Preservation Group Chair
Fred R. Wagner, Partner, Venable, LLP, Washington, D. C., Legal Resources Group Chair
TRANSPORTATION RESEARCH CIRCULAR E-C262
TRANSED 2018 15th International Conference on Mobility and
Transport for Older Adults and People with Disabilities
November 12–15, 2018 Taipei, Taiwan, R.O.C.
Transportation Research Board 500 Fifth Street, NW
Washington, D.C. www.trb.org

TRANSPORTATION RESEARCH CIRCULAR E-C262 ISSN 0097-8515 The Transportation Research Board is one of seven major programs of the National Academies of Sciences, Engineering, and Medicine. The mission of the Transportation Research Board is to provide leadership in transportation improvements and innovation through trusted, timely, impartial, and evidence-based information exchange, research, and advice regarding all modes of transportation The Transportation Research Board is distributing this E-Circular to make the information contained herein available for use by individual practitioners in state and local transportation agencies, researchers in academic institutions, and other members of the transportation research community. The information in this E-Circular was taken directly from the submission of the authors. This document is not a report of the National Academies of Sciences, Engineering, and Medicine.
Committee on Accessible Transportation and Mobility
International Steering Committee Joey Goldman, Co-Chair Julie Babinard, Co-Chair
Mary Crass Ping-der Huang
Sminu Jindal Il-Yung Lee Cheng Liang
Puay Tiak Lim
Joan C. Lo Suporntum Mongkolsawadi
Hitoshi Okubo Pamela Pui-Yu
Tom Rickert Hiroyuki Shirinashihama
Ling Suen Russell Thatcher Sean M. H. Wang
Patrick Yeh
Scientific Committee Aline Alauzet
Kai-Kuo Chang Shyue-Koong Chang
Wan-Hui Chen Yu-Chiun Chiou
Peter Cosyn Trevor Hanson
Sheng-Tsung Hou Shou-Ren Hu
Hyung Shik Kim
Joseph Kwok Cheng Liang
Ching-Lung Liao Liang-Tay Lin
Joan C. Lo Shih-Ching Lo Andrea Lubin
Shiaw-Shyan Luo Roger Mackett Hang Sau Ng
Uwe Rutenberg Lilian Salazar
Lalita Sen Judy Shanley
Chung-Wei Shen Anabela Simoes
Jau-Ming Su Chien-Hung Wei
Chao-Fu Yeh Mohammed Yousuf
Organizing Committee
Jacob Chen Ping-der Huang
Joa-Song Hwang
Cheng Liang Ben Lin
Joan C. Lo Ting-Yi Sung
Sean M. H. Wang Shu-Fen Wu Patrick Yeh
TRB Staff
Claire Randall, Senior Program Officer Steve Andrle, Program Manager, NDS Safety Data and Public Transportation
Mary Kissi, Senior Program Associate
Transportation Research Board 500 Fifth Street, NW
Washington, D.C. www.trb.org

iv
Contents
INTRODUCTION..........................................................................................................................1 Chronology of TRANSED Conferences .................................................................................. 1 2018 Conference ........................................................................................................................ 2 Pre-Conference Activities ......................................................................................................... 2 Opening Session ........................................................................................................................ 3 Parallel Sessions and Activities ................................................................................................ 3 Closing Session .......................................................................................................................... 3 Post-Conference Activities ........................................................................................................ 4 Acknowledgment ....................................................................................................................... 4
CONFERENCE PAPERS ............................................................................................................ 5 Innovative Mobility Management: Considering the
Needs of Individuals with Disabilities .................................................................................. 5 Using Smartphone and Bluetooth Technologies to Support
Safe and Accessible Street Crossing for People with Vision Impairment ...................... 13 Progress of Accessibility in Transportation in Japan Over
the Last Three Decades: An Observation Through Three Case Studies ........................ 23 Accessibility Survey for Generation of Representative Customer Requirements in
Accessible Design for Sleeping Compartments on Long-Distance Passenger Rail ........ 37 Study on Compact Barrier-Free Lavatories for Small Passenger Ships ........................... 46 New Brabant-Net Trambus Line: Meticulous Infrastructure and Street Design as a
Leverage to More Accessible City Transport to and from the Belgian Capital ............ 56 Improving Accessibility for People with Mental Health Conditions .................................. 66 Improving Accessibility for Older People Is More Than a Right ...................................... 74 Increasing Accessibility of Physical Maps for All ................................................................ 82 Navigation and Wayfinding for Persons with Visual Impairments in Metro Stations .... 93 Demonstration Experiments for Autonomous Minibus and Comprehensive
Transportation Policies of Local Governments .............................................................. 103 Community-Based Approach to Addressing Transportation Needs for
Rural Older Adults in Canada: Progress in Research ................................................... 113 Effectiveness of Elongated Tactile Clues for Providing Directional Information to the
Hands of Blind and Visually Impaired Pedestrians Before Crossing Intersections .... 121 APPENDICES
A. TRANSED 2018 Program Book ..................................................................................... 127 B. Abbreviations and Acronyms ........................................................................................... 158

1
Introduction
RANSED is the International Conference on Mobility and Transport for Older Adults and People with Disabilities. Held approximately every 3 years, TRANSED conferences are
milestone events in the field of accessible transportation. They attract researchers, policymakers, transportation operators, consumers, and other specialists from around the world to share innovations and best practices to make transportation and mobility accessible to everyone.
This e-circular includes background information about previous TRANSED conferences and a brief description of the conference itself. The remainder of the e-circular includes 13 of the conference papers which were selected based on their high overall review score and whose authors agreed to complete an edit, if requested, in the English language. For all of the peer-reviewed papers, reviewers were asked to consider the quality of the content, applicability of the research or practice, and pertinence to the conference themes and topics. These papers represent a sample of current research and practice in the field of accessible transportation for older adults and people with disabilities.
CHRONOLOGY OF TRANSED CONFERENCES
TRANSED Conferences have been held around the world since 1978. Previous conference titles and themes were
• 1978 Cambridge‚ England, Mobility for the Elderly and Handicapped.• 1981 Cambridge, England, Mobility for Elderly and Handicapped Persons.• 1984 Orlando, Florida, Mobility and Transport for Elderly and Handicapped
Persons. • 1986 Vancouver, Canada, Mobility in the Global Village.• 1989 Stockholm, Sweden, Towards Mobility as a Human Right.• 1992 Lyon, France, From Human Rights to a Better Quality of Life.• 1995 Reading, England, Ideas into Actions.• 1998 Perth, Australia, Setting the Pace.• 2001 Warsaw, Poland, Towards Safety‚ Independence and Security.• 2004 Hamamatsu, Japan, Accessible Transportation and Road Design: Strategies for
Success. • 2007 Montreal, Canada, Benchmarking‚ Evaluation and Vision for the Future.• 2010 Hong Kong, China, Sustainable Transport and Travel for All.• 2012 New Delhi, India, Seamless Access for All: Universal Design in Transport
Systems and Built Infrastructure‚ a Key Element in the Creation of Livable Cities. • 2015 Lisbon, Portugal, Aim and Manage for Inclusive Access.
T

2 TR Circular E-C262: TRANSED 2018
2018 CONFERENCE The 15th TRANSED Conference was held November 12–15, 2018 at the Taipei International Convention Center. The Eden Social Welfare Foundation (ESWF), based in Taipei, served as the conference organizing and funding entity, engaging in partnerships with the Government of the Republic of China (Taiwan), several universities, and various transportation and technology providers. The Transportation Research Board’s (TRB’s) Standing Committee on Accessible Transportation and Mobility selected ESWF to plan the conference. Accessible Transportation and Mobility Committee members provided technical support and served in various roles on the 2018 TRANSED International Steering Committee and Scientific Committee.
ESWF organized the conference events and representatives from the organization chaired the Scientific Committee. In planning the conference, ESWF identified three areas of purpose of the event:
1. Discuss key issues around accessible mobility and transport with representatives and
professionals from industries, governments, and academia; 2. Provide a platform for experts and professionals to share knowledge and experiences
on the development of accessible mobility and transport and to explore the needs and trends of accessible mobility and transport development based on theoretical as well as practical perspectives; and
3. Present the achievements of Taiwan’s accessible mobility and transport development to delegates from around the world, promoting Taiwan’s investments and approaches.
The theme of the 2018 conference was “Mobility for All: Connecting the World with Accessible Transportation.” A total of 638 individuals attended the conference, representing 31 countries in Asia, North America, Africa, South America, Europe, and Australia.
Researchers, planners, advocates, and human service providers submitted more than 150 abstracts addressing the four primary thematic areas of the conference:
1. Accessible Transportation and Tourism in Air, Land, and Water; 2. Safe and Sustainable Mobility for Older Adults and People with Disabilities; 3. Integration of Accessible Information, Finance, and Transportation Development; and 4. Smart Cities and Their Growth in the Asia–Pacific Region and Worldwide. Panels of researchers and specialists in the field of accessible transportation reviewed all
abstracts and papers submitted for presentation and publication. The various papers and posters presented at the conference are included in this e-circular. PRE-CONFERENCE ACTIVITIES Four pre-conference workshops were organized to allow for collaborative sessions about accessible mobility. Two technical visits were also offered.

Introduction 3
OPENING SESSION The conference opened with a presentation by Taiwanese Vice President Chen Chien-jen, who welcomed officials and delegates, and highlighted Taiwan’s efforts to advance accessibility.
Two keynote speeches followed. These included a presentation by Piroon Laismit, Executive Director of the Asia–Pacific Development Center on Disability (APCD), who provided an overview of the United Nations’ Convention on the Rights of Persons with Disabilities (CRPD) which emphasizes that persons with disabilities have the same rights to be included in society as everyone else and no one will be discriminated against; that persons with disabilities are to be respected for who they are and that everyone should have equal opportunities and equal access, as well as the freedom to make their own choices; and that children with disabilities should be respected for who they are. He discussed the approach of Thailand, as well as other Asian countries, to address CRPD, and provided a series of examples of successful approaches. He also emphasized a number of tenets of universal design and accessibility.
Keynote speaker Wen-Jong, Administrative Deputy Minister of the Ministry of Transportation and Communications, offered an overview of Taiwan’s demographic changes, which are resulting in significant growth of the population of older adults. With this comes an increasing number of people with disabilities. He described Taiwan’s recent approach to reducing barriers for people with disabilities and discussed 2008 legislation governing facilities for people with disabilities on public transportation. The People with Disabilities Rights Protection Act requires that public transportation providers provide barrier-free facilities and services in compliance with minimum standard regulations and enforces the requirements with potential penalties for noncompliance. He emphasized Taiwan’s efforts to support universal design to further improve transportation accessibility. PARALLEL SESSIONS AND ACTIVITIES The conference included exhibitors representing government, manufacturing, academia, and NGOs. Their exhibits focused on accessibility experiences, technology, policy advocacy, and collaboration.
Parallel topic discussions and poster presentations were conducted from November 13 through 15.
During these presentations, researchers, policymakers, transport operators, and service providers presented the results and findings of their research and overviews of practical approaches. The parallel sessions were specially organized during the afternoon to facilitate communication between the Taiwanese government, key stakeholders, and academics. Representatives from government departments, field industries, and universities were invited to discuss accessible transport from a variety of perspectives. CLOSING SESSION Judy Shanley moderated the closing session, which allowed for a roundtable discussion of the various accessibility policy approaches from around the world. Panelists included Janet Glendenning, Canadian Transportation Agency; Nattapong Nualsanit, Ministry of Transport,
4 TR Circular E-C262: TRANSED 2018
Thailand; Abraham Zorrilla, City of Houston, Texas; and Ching-Fu Chen, National Cheng Kung University, Taiwan.
After the roundtable forum, the conference concluded with a special ceremony in which the President of ESWF thanked the TRB’s, TRANSED 2018 committees, and delegates for making the conference a success. POST-CONFERENCE ACTIVITIES An accessible tour was offered by ESWF for conference delegates. ACKNOWLEDGMENT Thank you to Eileen Lu, Director, ESWF, for her tireless efforts to plan and promote TRANSED 2018.
PUBLISHER’S NOTE The views expressed in this publication are those of the committee and do not necessarily reflect the views of the Transportation Research Board or the National Academies of Sciences, Engineering, and Medicine. This publication has not been subjected to the formal TRB peer-review process.
5
CONFERENCE PAPERS
Innovative Mobility Management Considering the Needs of Individuals with Disabilities
JUDY L. SHANLEY Easterseals, Inc.
obility management is the practice of coordinating the professionals and organizations who provide transportation. The purpose is to facilitate the efficiency and effectiveness of
transportation service, and thereby, build a continuum of mobility options to address transportation gaps. It is anticipated that mobility management addresses the diverse accessibility needs of riders with disabilities and provides a network to develop innovative mobility solutions that enable individuals with disabilities to live, learn, work, and play in inclusive communities. This paper highlights the major phases involved in implementing a community mobility management program and identifies benefits for individuals with disabilities and transit agencies. Among the benefits of mobility management are increased service options and cost-effectiveness and improved relationships between human service and transportation professionals. The exciting world of mobility innovation will bring opportunities for individuals with disabilities, yet, as new mobility options are explored, there are important factors to consider to ensure that transportation services are accessible and viable for individuals with disabilities. INTRODUCTION Mobility management is about coordinating transportation providers and services to establish a continuum of service for riders with disabilities and other populations for whom traditional service may be difficult to access. Mobility management is designed to respond to the individual needs of each rider, regardless of where they live or how they choose to get around (1). Characteristics of a mobility management program include:
• Encourages innovation and flexibility to reach the “right fit” solution for customers; • Strives for easy information and referral to assist customers in learning about and
using services; and • Incorporates customer feedback as services are evaluated and adjusted.
Mobility management holds promise to identify and implement innovative transportation
service that enables individuals with disabilities to access community settings in an inclusive way. Mobility management creates opportunities for individuals to use transportation service beyond what can be provided by paratransit service, which can be unpredictable, unreliable, and costly (2). Further, mobility management provides an opportunity for individuals with disabilities to be truly participatory in planning and delivering transportation service, which serves to strengthen the range and availability of accessible options for individuals. In the United States, the Coordinating Council on Access and Mobility, facilitated by the Federal Transit
M
6 TR Circular E-C262: TRANSED 2018
Administration (FTA) recommends that diverse federal agencies coordinate policies, funding, and service to make transportation service more efficient. The FTA and the National Center for Mobility Management collect examples or an inventory of coordination and mobility management at the state and regional levels. The following provides transportation planners, providers, and human services professionals information about how to implement a mobility management program through a multiphase process, a description of benefits for individuals with disabilities, and a discussion about the future of mobility management in response to mobility innovation. IMPLEMENTING A MOBILITY MANAGEMENT PROGRAM When planners, human services, and transit professionals consider a systemic process for implementing a mobility management program it helps to provide a roadmap and guidance to achieve program purposes. Having a process, including a series of thoughtful phases in planning and carrying out a mobility management program also helps to implement accountability measures since everyone knows what is expected at each phase. The process also helps in articulating the vision and purpose of the mobility management program to internal and external stakeholders. A framework for implementing a mobility management program is described in the following four-phase process. Phase 1: Create a Transportation Inventory Mobility management begins when individuals, including human services professionals, transportation planners, transportation providers, and individuals with disabilities are interested in better understanding the array of transportation services that are available in a state, region, or local community. There can be a community meeting that focuses on accessible transportation options during which transportation services are inventoried. Often a diverse range of organizations, from human services to transit, develop a mobility or transportation community team to address accessible transportation issues. Information is typically collected regarding who provides the service, the target audience that accesses the service, and the parameters of the service including service times, cost, and accommodations descriptions. Creating a transportation service inventory or conducting an environmental scan becomes the first phase in implementing a mobility management program. The mobility management planning team wants enough data through this inventory to inform decisions about future services. The phase also includes a means of cataloguing the information, so it can be easily retrieved and used. Data walks, where users and stakeholders have an opportunity to learn about the data and its meaning is one way for the information to be organized and communicated (3). Phase 2: Conduct a Gap Analysis The transportation team uses data to assess where there might be holes or gaps in service. Gaps can include: (1) geographic areas in which there is no service; (2) the unavailability of certain types of services, such as wheelchair-accessible vehicles; or (3) services that do not operate at times of the day or on weekends. This second phase, conducting a gap analysis, becomes the blueprint for mobility management activities. The group may want to use a database to organize
Shanley 7
information about what services are available and what services may be missing. The information generated through this review will be the foundation for service recommendations and can be used as an historical resource as future planning occurs. Phase 3: Generate Solutions When a team of mobility professionals understand where gaps in service might be, they can better consider solutions to address these holes. The third phase involves generating solutions to address the deficiencies in transportation service. To support these solutions, it is important that the financial and operational impacts of a particular solution are included when making a business case for a particular approach. As part of these solutions, the team considers whether a new service is warranted or some modification of existing service may be appropriate. For example, a human service organization that provides transportation service to adults with intellectual disabilities could partner with an area business which uses vehicles that are only partially filled. This business may consider sharing the empty seats on its vehicles with an organization in the same geographic area that needs to get its elderly clients to an adult day program. When organizations share vehicles or share seats on existing vehicles, service becomes more efficient, potentially reducing operational costs. In these cases, it is important to ensure there are reliable accountability procedures in place and organizations have valid systems for cost allocation and cost recovery. In the United States, various federal funding sources may have different requirements for the types of services, trips, or passengers that can be paid for through the federal source. As part of the mobility management process (phase one), when teams are understanding the various services in their community, important variables to consider include how the existing service is paid for, the intended purpose of the funding, and how providers are reimbursed for the costs of the service.
When the inventory or environmental scan identifies a need for service, and there is no current service in place, organizations can strategize regarding the best opportunity to create a new service. Considerations regarding how the new service will be paid for, who will manage the service, and who will be eligible to use the service must be considered prior to implementation. The team can consider the most optimal means of starting a new service and specifically determine if any new vehicles or equipment might be needed, or whether the new service can be provided by reexamining the use and efficiency of existing transit resources. Perhaps current routes can be reconfigured or redesigned to maximize vehicle efficiency and address the service gaps.
However, if existing vehicles or equipment are not available, and the team determines that a new vehicle or equipment is needed, organizations can work together to obtain new vehicles and figure out the best means to purchase the equipment. Organizations can collaborate to apply for a grant program that could support the purchase of a vehicle, such as those available in the United States through the FTA and Enhanced Mobility for Seniors and Individuals with Disabilities funds. The team may consider whether there are private foundations or businesses that could support the purchase of vehicles or equipment. If it is not feasible that new vehicles can be purchased, the mobility management team may want to consider how enhanced service can be provided without investing in new vehicles. With the advance of shared-ride service and ride-hailing companies such as Uber and Lyft, mobility management increasingly includes these shared-ride services. The team should explore how shared-ride services would consider the needs of individuals with disabilities and assess whether the shared-mobility provider has the capacity to address these needs (4). As an example, a rural community in northeast Ohio identified a gap

8 TR Circular E-C262: TRANSED 2018
in service throughout their multicounty community. Planners supplemented a fixed-route service with options that included taxi service and the use of ride-hailing services. Community residents, including those with disabilities, had access to an array of transportation options that they otherwise would not have had. In another more urban setting—Dallas, Texas—the transit agency works closely with ride-hailing services to offer riders access to and from the agency’s fixed-route systems. The Shared-Use Mobility Center’s (SUMC’s) (5) Mobility on Demand Learning Center catalogues innovations in shared-use mobility and provides descriptive information and case studies regarding these partnerships so that they can be replicated. As described in the Benefits for Individuals with Disabilities section of this paper, there are important factors or conditions that should be considered when implementing any new type of mobility service. Phase 4: Continue to Assess During the final phase, when a new service is in place, or services have been changed, it is important for the community transportation team to continuously assess the service and continue to compare these services with the needs of individuals with disabilities. This phase is often called the continuous improvement phase. Outcome variables that would be important to inform the team regarding the efficacy of community transportation services can include:
1. Do individuals with disabilities report being able to access community settings to a greater extent because of the improved availability of reliable service?
2. Do individuals with disabilities report improved outcomes such as improved health because they can get to medical appointments or improved economic independence because they can access their jobs more regularly?
3. Do transportation providers indicate more efficiency in cost and vehicle use? 4. Have human services organizations, and the individuals they serve, remained active
in planning and designing community mobility services? 5. How does the data and outcomes related to the service impact upon other plans that a
state, region, or local community might have?
Data gathered from this continuous improvement phase are used consistently to monitor and improve service. The mobility management program must also align with other initiatives and plans within a setting, such as those related to regional coordination plans, community health plans, economic development, and smart growth plans. The likelihood of sustainability of services may be increased when there is cohesion across all community planning and when services are flexible to meet the varying needs of diverse community residents (6).
Coordinating transportation services through mobility management programs creates opportunity for individuals with disabilities (7). This opportunity results in improved access to life activities such as education, employment, and independent living. As community mobility teams convene to identify mobility solutions, this work should be grounded in the purposes and benefits of mobility management.

Shanley 9
MOBILITY MANAGEMENT: BENEFITS TO INDIVIDUALS WITH DISABILITIES A lack of reliable and accessible transportation can have significant adverse impacts for individuals with disabilities (8). According to a national study, the 2002 National Transportation Availability and Use Survey, the U.S. Department of Transportation, indicated that riders with disabilities and older adults face barriers to using public transportation, causing them to miss out on employment and community integration opportunities. According to the study nearly 23% of riders with disabilities require specialized assistance or equipment to travel outside the home, while less than 1% of riders without disabilities do. In the United States, riders with disabilities have difficulty getting the transportation they need at nearly four times the rate of riders without disabilities. These barriers are even more pronounced in rural areas, where infrequent or unreliable paratransit services are the only form of transportation available (9).
Community mobility management programs address transportation barriers by identifying transportation options for individuals with disabilities. In fact, there are many benefits associated with coordinating services through mobility management. Benefits are realized both for the rider with a disability, and for the agency or organization providing the transportation service. Figure 1 includes some of the benefits that can be realized through mobility management.
First, mobility management programs are most viable when individuals with disabilities themselves are engaged in the process. Individuals add value and perspective and represent an important source to confirm needs and solutions (10). Second, the process and its outcomes identify gaps and inefficiencies in the way that transportation services are delivered. This results in improved efficiency, cost-effectiveness, and potential cost-savings for transit providers. The definition of mobility management and its emphasis on coordination between human services and transit professionals and their organizations is the third benefit. Human services professionals have conversations and develop relationships with mobility providers, offering their expertise and resources to improve the accessibility of all transit services. These conversations and the meaningful coordinated systems that result affect usability of service, making transportation more viable for a larger number of community citizens. Potentially, this work can result in increased ridership by community citizens who may not have previously considered transportation modes. Finally, when human services organizations and transit providers collaborate, they may discover new resources that result in unintended positive consequences. For instance, in one northeast U.S. community, the mobility management program and activities identified dissemination channels for information about transportation services that
FIGURE 1 Benefits of mobility management.
Benefits of Mobility Management Include Improvements in 1. Engaging people with disabilities; 2. Cost-efficiency; 3. Relationships between human services and transit; 4. Usability of service; 5. Ridership; and 6. Resource identification.

10 TR Circular E-C262: TRANSED 2018
had been underutilized prior to mobility management. In another case, transit providers were able to identify meeting venues that were fully compliant with the Americans with Disabilities Act (ADA). These meeting venues became important meeting locations for transportation public meetings. In a final example of the benefits related to unintended positive consequences, through the relationship, potential grant opportunities were identified that supported the implementation of new service in a region. Mobility management can and does make sense to address the mobility needs of individuals with disabilities. As we move to the future, mobility management is an important platform upon which to build innovative service. CONSIDERING THE FUTURE The transit industry is increasingly changing and having to adapt its services to evolving mobility options. Transportation solutions such as shared-ride services, car sharing, volunteer driver programs, and bike- and scooter-sharing modes have expanded the range of options available to individuals with disabilities and the rise of technology has contributed to this innovation (11). The challenge has been, and will continue to be, ensuring that these services are accessible and viable, providing the supports to the varying functional needs that individuals with disabilities have. Mobility management creates the forum for exchanging information about these innovative modes and assessing their alignment with the needs and purposes of a mobility management program. As transportation planners, transportation providers, and human services providers develop a continuum of mobility options to fit the needs of individuals in their communities, there are questions and considerations that can be asked as the services are expanded.
Individuals with disabilities themselves are critical informants to expand the range of mobility options in a community transportation network. As new service is considered, the following factors are important to making sound and accurate decisions about the value that a new mobility option can bring to the community.
• Reliability. What is the history of the service and provider in getting people where they need to go? Has the service been implemented in communities that are comparable to the community considering the service?
• Safety and maintenance. How are vehicles maintained? Is there any inspection requirement for vehicles?
• Driver training. Will there be diversity training (cultural and linguistic, disability, older adults)? Are there any requirements?
• Cost. Fixed or variable cost? Who pays? Is this a shared expense between providers? • Service times and scope of service. When does the service operate? Is this consistent
with the needs of riders? • Accessibility. How do riders arrange for service? Is technology required? Does a rider
need an electronic payment system? Are vehicles accessible? • Customer feedback. How do they use these data? How often do they collect these
data? Does the feedback include opportunities for qualitative comments and stories or cases from passengers that describe their experience?
• Evaluation and performance monitoring. What internal controls does the provider have to correct issues and problems? What recourse does the rider have regarding input into service?

Shanley 11
• Rider input. It is important to have the voice of riders at the table to inform the process. Does the provider have opportunities for rider input as the service is being planned and implemented?
The world of mobility is changing, bringing innovation and exciting options. However, as the range of mobility options expand, the needs of riders with differing mobility capacities and preferences should be considered from the beginning, rather than as an afterthought. The factors described above can be incorporated into initial planning conversations, and in the ongoing implementation of innovative service. CONCLUSION Mobility management creates opportunities and promise for the continued availability of accessible, reliable, and safe service for individuals with disabilities. A thoughtful and systematic approach to implement mobility management can have long-lasting impacts on the ability of individuals with disabilities to live, learn, work, and play in our communities in inclusive ways. The benefits realized through the coordination of transportation service has multiple benefits for riders with disabilities and the agencies providing the service. It is anticipated that the future will continue to bring innovation and opportunity to the world of mobility management. REFERENCES 1. Burkhardt, J., and J. McLary, J. The Business Case for Mobility Management. American
Public Transportation Association. Available at https://www.apta.com/resources /mobility/Documents/Business-Case-for-Mobility-Management.pdf.
2. Thatcher, R., C. Ferris, D. Chia, J. Purdy, B. Ellis, B. Hamby, J. Quan, and M. Golden. TCRP Report 163: Strategy Guide to Enable and Promote the Use of Fixed-Route Transit by People with Disabilities. 2013. Available at https://nacto.org/wp-content/uploads/2016/05/2-9_Thatcher-et-al-Strategy-Guide-to-Enable-and-Promote-the-Use-of-Fixed-Route-Transit-by-People-with-Disabilities-TCRP-Report-163_2013.pdf.
3. Murray, B., E.Falkenburger, and P. Saxena. Data Walks: An Innovative Way to Share Data with Communities. Urban Institute, Washington, D.C., 2015.
4. Feigon, S., and C. Murphy. TCRP Report 188: Shared Mobility and the Transformation of Public Transit. 2016. Available at https://www.nap.edu/catalog/23578/shared-mobility-and-the-transformation-of-public-transit.
5. Shared-Use Mobility Center. Mobility on Demand Learning Center. https://learn.shareduse mobilitycenter.org/about/.
6. Potts, J. F., M. A. Marshall, E. C. Crockett, and J. Washington. TCRP Report 140: A Guide for Planning and Operating Flexible Public Transportation. 2010. Available at http://www.trb.org/Publications/Blurbs/163788.aspx.
7. National Center for Mobility Management. Developing Coordinated Transportation Plans. Available at https://nationalcenterformobilitymanagement.org/wp-content/uploads/2013/11/Coordinated _Planning_Brief_final.pdf.
8. National Transportation Availability and Use Survey. U.S. Bureau of Transportation Statistics, U.S. Department of Transportation, 2002.
12 TR Circular E-C262: TRANSED 2018
9. KFH Group. Expanding Access to Our Communities: A Guide to Successful Mobility Management Practices in Small Urban and Rural Areas. NCHRP Project 20-65, 2018. Available at http://onlinepubs.trb.org/onlinepubs/nchrp/docs/NCHRP20-65(68)_FR.pdf.
10. National Aging and Disability Transportation Center. Coordinated Transportation Planning Information Brief: Requirements, Strategies, and Tools for Meaningful Engagement for Older Adults and People with Disabilities. 2016. Available at https://www.nadtc.org/resources-publications/coordinated-transportation-planning-information-brief-requirements-strategies-and-tools-for-meaningful-engagement-for-older-adults-and-people-with-disabilities.
11. TRB Special Report 319: Between Public and Private Mobility: Examining the Rise of Technology-Enabled Transportation Services. 2016. Available at http://www.trb.org/Publications/Blurbs /173511.aspx.
13
CONFERENCE PAPERS Using Smartphone and Bluetooth Technologies to Support Safe and
Accessible Street Crossing for People with Vision Impairment
CHEN-FU LIAO University of Minnesota
luetooth low-energy (BLE) technology has become an important component of many Internet of Things applications, such as data communications, remote sensing, positioning,
and providing location-based services. The research team developed a smartphone-based assistive system that uses a network of BLE beacons to provide location-specific traffic and navigational information for people who are visually impaired. To ensure information integrity and security, a self-monitoring methodology was developed by reprogramming the firmware of each BLE beacon to monitor its peers in the Bluetooth network. A multiregression (MR) technique was implemented to model the relationship between Bluetooth received signal strength (RSS) and the actual ranging distance. This methodology reduces the environmental uncertainty and dynamic nature of RSS measurements in an outdoor environment. An extended Kalman filter was used to provide positioning and mapping solutions in the absence of GNSS. In addition, several statistical techniques were implemented to evaluate their effectiveness in detecting location changes of one or multiple BLE beacons in a network based on Bluetooth signal strength indications. The results indicated that this approach is able to successfully detect the changes of a BLE network that would indicate a problem (such as vandalism or loss of power) with the network. With the self-monitoring network, one may locate the smartphone to ensure information associated with each BLE beacon provides the correct location to reliably support wayfinding for the visually impaired in a transportation network. INTRODUCTION After receiving orientation and mobility training from instructors, people who are blind or visually impaired usually can travel independently to known places along familiar routes by relying on a cane or a guide dog for obstacle avoidance. However, physical and informational barriers often discourage people with vision impairment from traveling in an unfamiliar environment. Blind people’s perception of the environment is different from the spatial cognition of sighted people. With the limited visual feedback available to them, unsighted people primarily rely on auditory, olfactory, or tactile feedback to determine their location with respective to their immediate environment. When blind pedestrians travel in less familiar areas, movement and information barriers create additional challenges for them to find their way and further limit their accessibility and mobility. Therefore, providing information to the blind that make them aware of where they are with respect to the surrounding environment at key decision-making locations becomes essential.
B
14 TR Circular E-C262: TRANSED 2018
LITERATURE REVIEW Though not always reliable, many environmental cues are available to support the decision-making of people with vision impairment on various components of wayfinding. They often use auditory and limited visual information that they gather to make safe decisions while traveling in a transportation network. Although there are many aids (such as Braille maps, etc.) to assist wayfinding in addition to the cane or guide dog, blind people tend to use their cognitive map and spatial knowledge as primary guidance (1). Giudice and Legge (2) reviewed various technologies developed for blind navigation and concluded that no single technology can provide both indoor and outdoor navigation and guidance for the blind. They assert that one must gain more insight from studying perception in order to have a clear understanding of the cognitive demands on the blind when they interpret information received by the sensory system.
For example, people with a vision impairment generally have difficulty crossing intersections due to the lack of information available to them about the traffic, geometry at intersections (3, 4), and intersection types (e.g., signalized, unsignalized or roundabout). Guth et al. (5) found that site specific characteristics (for example, treatments such as rumble strips or speed countermeasures) appeared to have a greater impact on reducing the number of conflicts between pedestrians and vehicles than did a mobility device such as, cane or guide dog.
In order to provide signal information to blind users, Bohonos et al. (6) demonstrated a Universal Real Time Navigational Assistance (URTNA) system using Bluetooth beacons incorporated into a traffic controller to transmit signal timing to a user’s cell phone. URTNA has proven that appropriate software can be developed, but a review of the literature yielded no further research in this area. Barbeau et al. (7) developed a travel assistance device (TAD) using a GNSS-enabled smartphone to assist transit riders with intellectual disabilities navigating the public transportation system. The TAD prompts the rider in real time with a recorded audio message, visual images, and vibration alerts when the rider should pull the stop request cord to exit the bus. It is especially helpful for those who are cognitively disabled. Ganz et al. (8) used radio frequency identification (RFID) technology with a customized handheld device to support navigation for the blind in an unfamiliar indoor environment.
Some regions in Europe have begun to develop pedestrian navigation technology to assist the visually impaired or disabled. One example is the city of Stockholm’s e-Adept project (9–11). Other examples include Finland’s NOPPA project which is designed to provide public transport passenger information and pedestrian guidance through a speech interface (12). The ASK-IT project (13, 14) partly funded by the European Commission under the 6th Framework Programme, uses personal profiling and web services to provide users with navigation, transportation and accessibility information.
In France, the Mobiville project aims to develop a real time multimodal transportation information service and provide location-based navigation service for pedestrians using smartphones (15). These systems rely on GNSS to determine a user’s location and typically require additional dead-reckoning sensors for GNSS unfriendly environments. Recently, Aira (16) used smart glasses that relayed real-time video to a smartphone to guide vision-impaired travelers. But, it requires an off-site human assistant over the smartphone app to provide navigation information.
A typical audible pedestrian signals (APSs) system generates auditory cues continuously to help the blind pedestrian locate the pushbutton. After an APS pushbutton is activated, the APS system announces an auditory message such as “Walk sign is ON” when the pedestrian signal
Liao 15
display is in the “WALK” phase. Some APS systems can vocally count down the remaining time (in seconds) available to cross an intersection during the pedestrian “DON’T WALK” phase.
However, there are complaints about the noise generated by the APS from residents near the installations. The repeating tone adds 5 dBs of noise within 6 to 12 ft of the pushbutton. In the United States, there is no standard pushbutton location and an additional stub is often required for installing pushbutton station poles. Ongoing maintenance and Braille verification require additional effort. Liao (17) developed a mobile accessible pedestrian signal system that allows a user to obtain intersection geometry and traffic signal information from a smartphone that would complement the need for the APS.
Liao (17, 18) developed a smartphone app, in connection with Bluetooth beacons placed at key decision points around a work zone, to provide situation awareness along with routing or bypassing information to the visually impaired. A geospatial database of the locations of the Bluetooth beacons was developed to allow the smartphone app to query the audible message associated with discovered Bluetooth beacons.
The latest Bluetooth technology, Bluetooth Low Energy (BLE) or Bluetooth Smart, has considerably reduced power consumption as compared to earlier versions of the technology. Low-cost BLE devices have enabled many applications using BLE tags and smartphone devices to locate or identify personal items or alert owners when personal belongings are left behind. The received signal strength indication (RSSI) of BLE can also be used to estimate distance between smart devices. Newer smartphones on the market are now all equipped with BLE technology. In an article, “Mobile Telephony Market,” the Bluetooth Special Interest Group predicts that more than 90% of Bluetooth-enabled smartphones will support the low-energy standard by 2018.
Given limitations in the location capability of GNSS in urban canyons and other GNSS unfriendly environments, their research team uses Bluetooth devices as smart beacons in a network to identify a pedestrian’s location more accurately and reliably at a decision location or a point of interest (e.g., corner of an intersection, bus stop, entrance of a building).
In a related but different application of BLE, Fernandez-Llorca et al. (19) developed an assistive system using RSSI from BLE beacon or RFID tags integrated with a stereo vision system to identify the specific type of impairment for pedestrians with disabilities. Experiments were conducted at a crosswalk where disabled travelers were asked to wear a BLE or RFID tag that contained an identifier of their type of disability. The results indicated that RFID and BLE tags were correctly associated to their corresponding pedestrian 78% and 91.5% of the time, respectively. More relevant to the discussion here, Faragher and Harle (20) investigated the positioning accuracy of BLE devices used in a broadcasting mode for fingerprint-based indoor positioning. They concluded that the positioning accuracy improves with the number of beacons per fingerprint, up to six to eight beacons.
As determined by many researchers, Bluetooth signals exhibit high variability in space and time, mostly because of the randomness of the radio signals, especially an issue in outdoor environments. Therefore, the research team developed a methodology to incorporate the geometric characteristics of a network of BLE beacons in order to further reduce the effect of noise on the Bluetooth RSSI. In addition, the research team modified the firmware of each BLE beacon that enables the forming of a self-monitoring network to ensure the integrity of network configuration, geometry, and information. The self-monitoring functionality reports network status automatically which reduces the maintenance required from a public agency. A crowdsourcing technique was used to transmit information from a local BLE network to a cloud server through the smartphone network of users.
16 TR Circular E-C262: TRANSED 2018
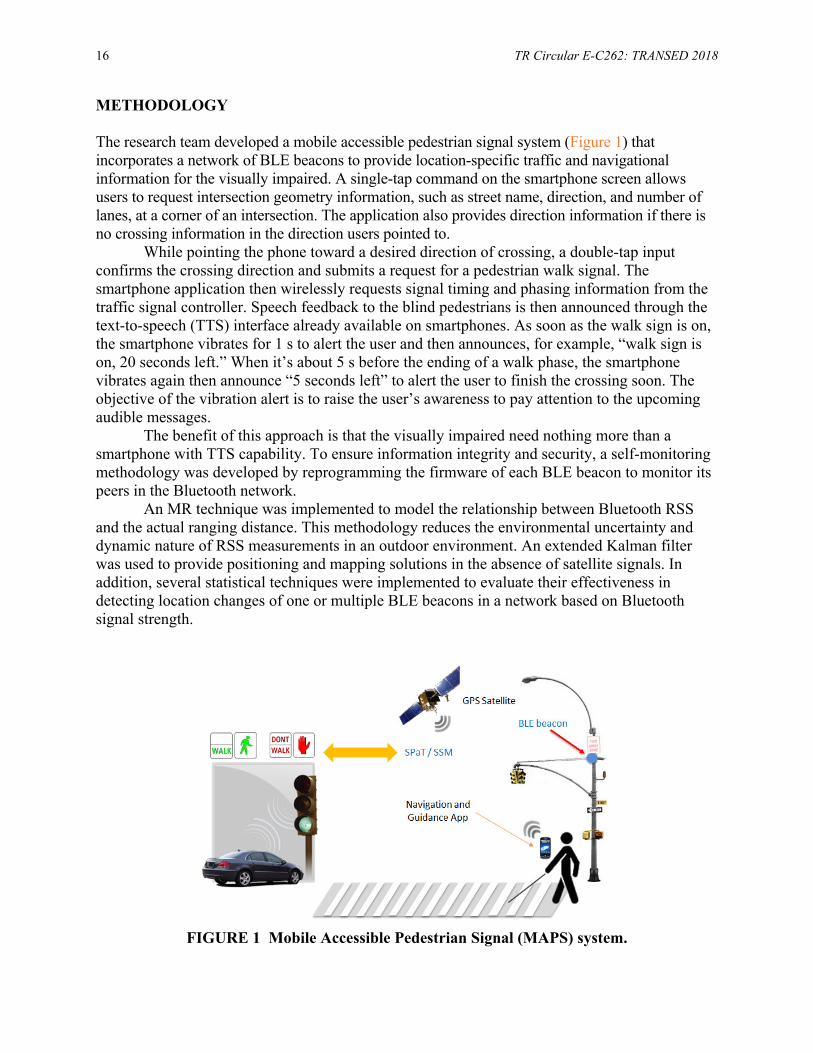
METHODOLOGY The research team developed a mobile accessible pedestrian signal system (Figure 1) that incorporates a network of BLE beacons to provide location-specific traffic and navigational information for the visually impaired. A single-tap command on the smartphone screen allows users to request intersection geometry information, such as street name, direction, and number of lanes, at a corner of an intersection. The application also provides direction information if there is no crossing information in the direction users pointed to.
While pointing the phone toward a desired direction of crossing, a double-tap input confirms the crossing direction and submits a request for a pedestrian walk signal. The smartphone application then wirelessly requests signal timing and phasing information from the traffic signal controller. Speech feedback to the blind pedestrians is then announced through the text-to-speech (TTS) interface already available on smartphones. As soon as the walk sign is on, the smartphone vibrates for 1 s to alert the user and then announces, for example, “walk sign is on, 20 seconds left.” When it’s about 5 s before the ending of a walk phase, the smartphone vibrates again then announce “5 seconds left” to alert the user to finish the crossing soon. The objective of the vibration alert is to raise the user’s awareness to pay attention to the upcoming audible messages.
The benefit of this approach is that the visually impaired need nothing more than a smartphone with TTS capability. To ensure information integrity and security, a self-monitoring methodology was developed by reprogramming the firmware of each BLE beacon to monitor its peers in the Bluetooth network.
An MR technique was implemented to model the relationship between Bluetooth RSS and the actual ranging distance. This methodology reduces the environmental uncertainty and dynamic nature of RSS measurements in an outdoor environment. An extended Kalman filter was used to provide positioning and mapping solutions in the absence of satellite signals. In addition, several statistical techniques were implemented to evaluate their effectiveness in detecting location changes of one or multiple BLE beacons in a network based on Bluetooth signal strength.
FIGURE 1 Mobile Accessible Pedestrian Signal (MAPS) system.

Liao 17
Positioning and Ranging Using BLE The GNSS satellite positioning system provides relatively accurate positioning solution in an open space. However, in urban canyons or indoor environments, the position solution is unavailable or degraded due to signal strength, reflections, multipath, and other factors. Bluetooth technology has been applied in many transportation applications (9, 21, 22). It uses a radio or broadcast communications system not requiring line of sight. However, its signal attenuation may be influenced by physical obstacles in the environment. The research team evaluated the RSSI of BLE beacons mounted in different orientations in an outdoor environment and modeled the RSSI range relationship. An MR model using singular value decomposition (SVD) technique was introduced to remove RSSI range noise and estimate the range from a smartphone to other BLE tags. An extended Kalman filter (EKF) was formulated to take the range estimates from the MR and SVD combined model to determine the location of a smartphone with respect to a local coordinate system.
The RSSI measurements can be expressed as a vector in a multidimensional space with noise and pure signal lying in orthogonal subspaces. A Hankel matrix (23) is constructed for the RSSI measurements for altering its singular spectrum. The high-energy components are supposed to contain a pure signal, whereas the low-energy components are supposed to contain only noise. The RSSI measurements 𝑌 consisting of the pure signal 𝑋 and the noise 𝑁 can be expressed as follows.
𝑌 = 𝑋 + 𝑁 (1) where, 𝑌, 𝑋, and 𝑁 are the raw RSSI measurement, pure RSSI signal and noise vectors, respectively. Using the SVD technique (24), the matrix 𝐻 can be decomposed and expressed as 𝐻 = 𝑈 𝛴 𝑉 (2) where 𝑈 ∈ 𝑅 (𝐾 × 𝐾) = the orthonormal left singular vectors; 𝑉 ∈ 𝑅 (𝑀 × 𝑀) = the orthonormal right singular vectors; 𝛴 = 𝑑𝑖𝑎𝑔 𝑐 , 𝑐 , . . . , 𝑐 and 𝑐 , 𝑐 , . . . , 𝑐 = the singular values of the matrix; and 𝐻 , where 𝑐 ≥ 𝑐 . . .≥ 𝑐 ≥ 0 and 𝑝 = 𝑚𝑖𝑛 (𝐾,𝑀).
The largest singular components in Equation 2 capture almost only signal information
whereas the smallest ones contain almost only noise. The noise reduction can be obtained by adapting a diagonal weighting matrix 𝑊 to Equation 2.
𝐻 = 𝑈 (𝑊𝛴) 𝑉 (3)
The matrix 𝐻 is no longer in the Hankel form. However, the nondiagonal components of 𝐻 can be averaged to extract the improved signal 𝑋 = [𝑥(0), 𝑥(1), 𝑥(2), . . . , 𝑥(𝐷 − 1)] . A least square (LS) estimation or rank reduction approach is applied to select the
weighting matrix W. It is assumed that the pure RSSI signal 𝑋 consists of 𝑟 complex components

18 TR Circular E-C262: TRANSED 2018
such that the rank of 𝐻 is 𝑟. The LS estimates of 𝐻 is obtained by setting the 𝑀 − 𝑟 smallest eigenvalues to zero.
𝐻 , = [𝑈 𝑈 ][𝛴 0 0 0 ][𝑉 𝑉 ] (4) where 𝛴 contains the 𝑟 largest singular values, and 𝐻 , is the best rank-𝑟 estimation of 𝐻 .
Due to the environmental dynamics, the nature of the Bluetooth wireless medium and the uncertainties in the power-distance model, the research team adapted an SVD-based MR model proposed by Fan et al. (25) for a Bluetooth network. The MR model is selected to map the distance from a BLE to all the other BLE beacons to be described by a weighted combination of RSSI values from all BLE beacons. The RSSI mapping is created by considering the RSSI values from all BLE beacons in a local network where a smartphone is located. This mapping is updated dynamically to reflect the current environment. Therefore, it can better characterize the RSSI-distance relationship in a target area. The MR-SVD-based methodology offers better Bluetooth range estimation between a smartphone and BLE beacons. It is incorporated into an EKF for positioning estimation.
Figure 2 illustrates a simple BLE network in which each BLE beacon has the capability to scan and receive the Bluetooth signal from the other BLE beacons. The research team reprogrammed the firmware of commercial off-the-shelf BLE beacons to periodically scan its peers within its range of detection. Statistical methodologies were investigated to detect changes of the location of a BLE beacon within its network configuration.
A cumulative summation (CUSUM) methodology and two location change indices were introduced to test what happens if the location of a BLE module is changed or the configuration of the BLE network is altered. The CUSUM technique is used to evaluate the location changes of a single BLE module. A normalized weighted signal level change (NWSLC) index was used to evaluate the geometry configuration of a local BLE network.
FIGURE 2 Illustration of monitoring RSSI in a BLE network.
Liao 19
Self-Monitoring BLE Network Figure 2 illustrates a simple BLE network in which each BLE beacon has the capability to scan and receive the Bluetooth signal from the other BLE beacons. The research team reprogrammed the firmware of commercial off-the-shelf BLE beacons to periodically scan its peers within its range of detection. Statistical methodologies were investigated to detect changes of the location of a BLE beacon within its network configuration.
A NWSLC index was used to evaluate and monitor the geometry configuration of a local BLE network. NWSLC describes the changes of a network signature by weighting the signal level differences between the reference (from F1 scan) and current (from F2 scan) signal level with its reference signal strength and then taking the normalized average. It is defined as follows. 𝐴 = ∑ 𝑆𝑖𝑔𝐿𝑒𝑣𝑒𝑙 × 𝑆𝑖𝑔𝐿𝑒𝑣𝑒𝑙 − 𝑆𝑖𝑔𝐿𝑒𝑣𝑒𝑙 (5)
where 𝐴 = the NWSLC index;
n = the number of data samples (i.e., n = | F1 ∩ F2|); N = the total number of signal levels (i.e., N = 5 in this case); 𝑆𝑖𝑔𝐿𝑒𝑣𝑒𝑙 = the signal level of reference AP i (from scan F1); and 𝑆𝑖𝑔𝐿𝑒𝑣𝑒𝑙 = the signal level of current AP i (from scan F2).
The location of a smartphone is defined as changed when the NWSLC index is larger
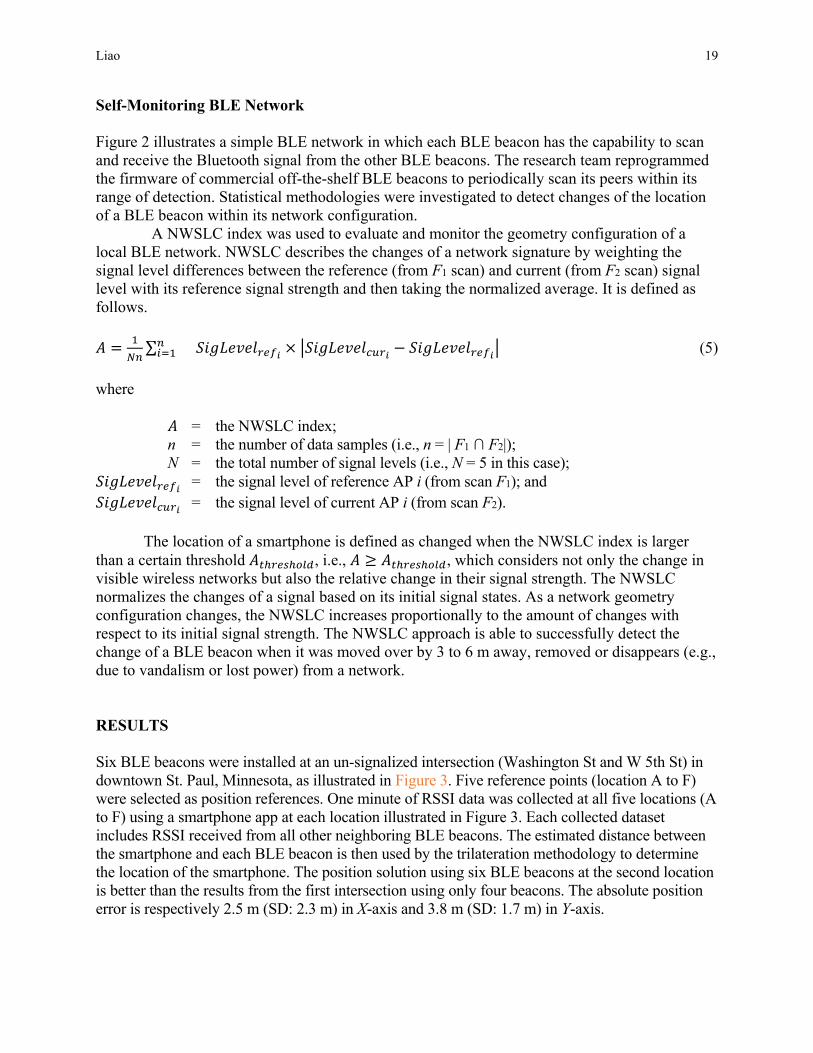
than a certain threshold 𝐴 , i.e., 𝐴 ≥ 𝐴 , which considers not only the change in visible wireless networks but also the relative change in their signal strength. The NWSLC normalizes the changes of a signal based on its initial signal states. As a network geometry configuration changes, the NWSLC increases proportionally to the amount of changes with respect to its initial signal strength. The NWSLC approach is able to successfully detect the change of a BLE beacon when it was moved over by 3 to 6 m away, removed or disappears (e.g., due to vandalism or lost power) from a network. RESULTS Six BLE beacons were installed at an un-signalized intersection (Washington St and W 5th St) in downtown St. Paul, Minnesota, as illustrated in Figure 3. Five reference points (location A to F) were selected as position references. One minute of RSSI data was collected at all five locations (A to F) using a smartphone app at each location illustrated in Figure 3. Each collected dataset includes RSSI received from all other neighboring BLE beacons. The estimated distance between the smartphone and each BLE beacon is then used by the trilateration methodology to determine the location of the smartphone. The position solution using six BLE beacons at the second location is better than the results from the first intersection using only four beacons. The absolute position error is respectively 2.5 m (SD: 2.3 m) in X-axis and 3.8 m (SD: 1.7 m) in Y-axis.
20 TR Circular E-C262: TRANSED 2018
FIGURE 3 A network of six BLE beacons installed in downtown St. Paul, Minnesota.
The research team also validated the NWSLC-based RSSI signal fingerprint techniques as discussed in previous section. The NWSLC-based approach is able to successfully detect the changes of a BLE network that would indicate a problem (such as vandalism or loss of power) with the network. The statistical approach is able to detect location changes of 3 m for a peer BLE beacon 86% of the time. The detection rate increases to 100% when a beacon is moved over 6 m away from its original location. SUMMARY The research team developed a smartphone-based assistive system to support safe and accessible street crossing for the visually impaired. With the integration of the self-monitoring BLE network, the smartphone can be located to ensure information associated with each BLE beacon provides the correct location to reliably support wayfinding for the visually impaired in a transportation network and thus ensure that information provided to the visually impaired is up-to-date and at the correct location.
The self-monitoring feature ensures the information provided to users is correct. It reports BLE network status automatically to the system administrator and reduces the maintenance required from public agencies. The crowdsourcing technique sends BLE information from a local network back to the cloud server using a user’s smartphone network.
Although this application was initially designed for people with a visual impairment, the design can also benefit all users who require additional navigation information in an unfamiliar environment, and warn distracted pedestrians looking down at their smartphones that they are about to enter an intersection.
Liao 21
ACKNOWLEDGMENT The author thanks the Roadway Safety Institute (RSI) at the University of Minnesota and the Minnesota Department of Transportation for supporting this project. The RSI is the University Transportation Center for the U.S. Department of Transportation (DOT) Region 5, which includes Minnesota, Illinois, Indiana, Michigan, Ohio, and Wisconsin. Financial support from RSI was provided by the U.S. DOT administered through the Office of the Assistant Secretary for Research and Technology. REFERENCES 1. Golledge, R. G., and T. Gärling. Cognitive Maps and Urban Travel. Handbook of Transport
Geography and Spatial Systems (D. A. Hensher, K. J. Button, K. E. Haynes and P. R. Stopher, eds.), Elsevier, Amsterdam, 2004, Ch. 28.
2. Giudice, N. A., and G. E. Legge. Blind Navigation and the Role of Technology. The Engineering Handbook of Smart Technology for Aging, Disability, and Independence (A. Helal, M. Mokhtari, and B. Abdulrazak, eds.), John Wiley & Sons, Inc., Hoboken, N.J., 2008.
3. Barlow, J. M., B. L. Bentzen, and T. Bond. Blind Pedestrians and the Changing Technology and Geometry of Signalized Intersections: Safety, Orientation, and Independence. Journal of Visual Impairment & Blindness, Vol. 99, No. 10, 2005, pp. 587–598.
4. Ponchillia, P., E. Rak, A. Freeland, and S. LaGrow. Accessible GPS: Reorientation and Target Location among Users with Visual Impairments. Journal of Visual Impairment & Blindness, Vol. 101, No. 7, 2007, pp. 389–401.
5. Guth, D. Why Does Training Reduce Blind Pedestrians’ Veering? Blindness and Brain Plasticity in Navigation and Object Perception (J. J. Rieser, D. H. Ashmead, F. Ebner, and A. L. Corn, eds.), Psychology Press, New York, 2007, pp. 353–365.
6. Bohonos, S., A. Lee, A. Malik, C. Thai, and R. Manduchi. Universal Real-Time Naigational Assistance (URNA): An Urban Bluetooth Beacon for the Blind. San Juan: HealthNet Press, 2007.
7. Barbeau, S. J., N. L. Georggi, and P. L. Winters. Integration of GPS-Enabled Mobile Phones and AVL: Personalized Real-Time Transit Navigation Information on Your Phone. Presented at 89th Annual Meeting of the Transportation Research Board, Washington, D.C., 2010.
8. Ganz, A., S. R. Gandhi, J. Schafer, T. Singh, E. Puleo, G. Mullett, and C. Wilson. PERCEPT: Indoor Navigation for the Blind and Visually Impaired. Presented at 33rd Annual International Conference of the IEEE EMBS, Boston, Mass., 2011.
9. Jonsson, A., S. Sandberg, and T. Uppgård. Urban Guidance for the Blind and Visually Impaired – Pedestrian Route Planning and Navigation Using a Mobile Handset. Expanding the Knowledge Economy: Issues, Applications. Case Studies (P. Cunningham and M. Cunningham, eds.), IOS Press, Amsterdam, 2007.
10. Dawidson, E. Pedestrian Navigation in Stockholm: How Local Data Together with Advanced Positioning Techniques Can be Used for Detailed Routing. Proc., 16th ITS World Congress, Stockholm, Sweden, 2009.
11. Johnni, P. Stockholm: A City for Everyone How New Technology Can Make Every Day Life Easier for Elderly and People with Disabilities. Proc., 16th ITS World Congress, Stockholm, Sweden, 2009.
12. Virtanen, A., and S. Koshinen. NOPPA: Navigation and Guidance System for the Blind. Proc., 11th ITS World Congress, Nagoya, Japan, 2004.
13. Bekiaris, E., K. Kalogirou, and M. Panou. Personalised Infomobility Services within ASK-IT Project. Proc., 14th ITS World Congress, Beijing, China, 2007.
14. Edwards, S., H. Bryan, and J. Wagner. Indoor Localisation for Disabled People: ASK-IT Project. Proc., 14th ITS World Congress, Beijing, China, 2007.

22 TR Circular E-C262: TRANSED 2018
15. Coldefy, J. The Mobiville Project: Large Scale Experimentation of Real-Time Public Transport Information Service Providing Satellite Based Pedestrian Guidance on Smart Phones. Proc., 16th ITS World Congress, Stockholm, Sweden, 2009.
16. Aira. https://aira.io/. Accessed August 2018. 17. Liao, C.-F. Using Smartphone App to Support Visually Impaired Pedestrians at Signalized
Intersection Crossings. Transportation Research Record: Journal of the Transportation Research Board, No. 2393, 2013, p.12–20.
18. Liao, C.-F. Development of a Navigation System Using Smartphone and Bluetooth Technologies to Help the Visually Impaired Navigate Work Zones Safely. Report #2014-12. Minnesota Department of Transportation, St. Paul, 2014.
19. Fernandez-Llorca, D., R. Q. Minguez, I. P. Alonso, C.F. Lopez, I.G. Daza, M.A. Sotelo, and C.A. Cordero. Assistive Intelligent Transportation Systems: The Need for User Localization and Anonymous Disability Identification. IEEE Intelligent Transportation Systems Magazine, Vol. 9, No. 2, 2017, pp. 25–40.
20. Faragher, R., R. Harle. An Analysis of the Accuracy of Bluetooth Low Energy for Indoor Positioning Applications. Proc., 27th International Technical Meeting of the Satellite Division of the Institute of Navigation, Tampa, Florida, 2014, pp. 201–210.
21. Kikawa, M., T. Yoshikawa, S. Ohkubo, A. Takeshita, Y. Shiraishi, and O. Takahashi. A Presence-Detection Method Using RSSI of a Bluetooth Beacon. International Journal of Informatics Society, Vol. 2, No. 1, 2010, p. 23–31.
22. Martchouk, M., F. Mannering, and D. Bullock. Analysis of Freeway Travel Time Variability Using Bluetooth Detection. Journal of Transportation Engineering, Vol. 137, No. 10, 2011, pp. 697–704.
23. Golub, G. H., and C. F. Van Loan. Matrix Computations, 4th ed., Johns Hopkins University Press, Baltimore, Md., pp. 784, 2012.
24. Hermus, K., I. Dologlou, P. Wambacq, and D. V. Compernolle. Fully Adaptive SVD-Based Noise Removal for Robust Speech Recognition. Proc., European Conference on Speech Communication and Technology, Budapest, Hungary, 1999, pp. 1951–1954.
25. Fan, S.-H., Y.-T. Hsu, and F.-Y. Sung. An Enhanced Beacon Localization Approach Using Mutual Signal Strength in Cellular Networks. IEEE Internet of Things Journal, Vol. 2, No. 6, 2015, pp. 596–603.
23
CONFERENCE PAPERS
Progress of Accessibility in Transportation in Japan Over the Last Three Decades
An Observation Through Three Case Studies
YOSHITO DOBASHI NOBUAKI OHMORI
Utsunomiya University
ursuant to the Convention on the Rights of Persons with Disabilities (CRPD), Japan is taking various initiatives to realize an inclusive society. This paper discusses key factors in how
transportation accessibility has evolved in Japan. We examined these initiatives through three major projects that were conducted decades apart—in the 1990s, 2000s, and 2010s—and were respectively awarded by the central government for their pioneering achievement in accessibility. We studied their process and achievement by visiting the sites and interviewing stakeholders. The Hankyu Itami Station Project rebuilt a railway station as part of the reconstruction effort following the Great Hanshin–Awaji Earthquake of 1995, and included disabled people and elderly people in the project committee. In the Fukuoka Nanakuma Line Project, the project team visited and listened to various disabled people’s organizations (DPOs) and invited them to project sites and demonstration tests. In the Sendai Tozai Line Project, the city transportation bureau sought to accommodate the needs of people with disabilities to the highest level as defined in national guidelines, in collaboration with DPOs. By examining and comparing the three projects, we can see how accessibility in Japan has changed over time. Official guidelines are now instrumental in accumulating knowledge for responding to the needs of people with mobility impairments, and DPOs now play a specific role in refining existing designs rather than simply demanding their needs. Through this paper, we hope to shed light on accessibility initiatives in Japan to realize an environment as envisioned in the CRPD. BACKGROUND Pursuant to the CRPD (1), Japan is taking various initiatives to realize an inclusive society and is particularly accelerating its efforts toward the 2020 Tokyo Olympic and Paralympic Games. In this convention, accessibility is a very important concept. It specifically refers to universal design in Articles 2 and 4, and to “personal mobility” in Article 20. This indicates that accessibility in transportation is a critical issue.
In the United States, the Architectural Barrier Act (ABA) was enacted in 1968, the Rehabilitation Act (RA) in 1973, and the ADA in 1990. The dissemination of these laws spread widely and influenced disability movements throughout the world. The RA and ADA, in particular, stipulate the involvement of local community and especially disabled people (2), and this stipulation has changed Japanese society’s stance toward disabled people at various levels of society such that the participation of disabled people’s communities has become commonplace in railway projects.
P
24 TR Circular E-C262: TRANSED 2018
In the United Kingdom (UK), the parliament took proactive actions through its Social Exclusion Unit to examine how people are excluded from various spheres of society, including the transportation sector (3). The Disability Discrimination Act (DDA) was enacted in 1995 in response to disabled people’s movements that put pressure on the government for its establishment (4). The CRPD was ratified in 2009. Thereafter, the DDA was replaced with the Equality Act in 2010, which made it compulsory to respect the involvement of disabled people in policy decisions (5). The government has since formulated various plans and acts for more accessible transportation in consultation with the public (6). It officially addresses the issue of “accessible transport” (7) and discloses documents and the outcome of consultations with the public.
On the global scale, 62 countries out of 85 (72.9%) have access standards, according to a 1996 United Nations survey (8). Since the CRPD came into effect in 2008, it has been ratified by 177 countries to date. This means 177 countries are committed to securing accessibility for all people and indicates that mobility of all has gained legitimacy.
In Japan, approaches to accessibility have only recently begun to reach the needs of people with disabilities. These approaches began as local government initiatives in the 1970s (9) and eventually developed into national initiatives around the 1990s to 2000s.
Various data appear to show that initiatives improve accessibility have been successful. However, many issues still need to be addressed. Currently, the Cabinet Office is taking the initiative in pursuing the Universal Design 2020 Action Plan (UD2020) “to realize a society of coexistence, a society in which those with disabilities can pursue their dreams and more fully harness their potential and capabilities in the same manner as those without disabilities” [cited from the Secretariat Cabinet (10)]. Based on the realization that a foundation must first be developed to create an inclusive society, the government included the concepts of emotional barrier-free and universal design in urban planning in the action plan. In 2018, the Law for Promoting Easy Mobility and Accessibility for the Aged and Disabled of 2006 was revised to enhance the relationships between the physical and social aspects of accessibility, create master plans, and accommodate people with needs.
To gain a broad perspective of the reality of accessibility in Japan, this paper discusses key factors in how transportation accessibility has evolved in Japan, over the last three decades in particular, through three best practices in railways. Specific focus will be placed on public involvement processes, as they have finally begun to take root in Japan in the last few decades (11). METHODS We examined transportation accessibility in Japan through three major projects that were conducted decades apart—in the 1990s, 2000s, and 2010s—and were respectively awarded by the central government for their pioneering achievement in accessibility. These three projects are the Hankyu Itami Station Rehabilitation Project (recommenced in 1998), the Fukuoka Nanakuma Line Project (commenced in 2005), and the Sendai Tozai Line Project (commenced in 2015).
We studied their achievements thoroughly by visiting the sites, interviewing stakeholders, such as transport bureaus, DPOs, and design committee chairpersons, and examining available resources. In this study, we placed strong emphasis on the processes rather than the technical

Dobashi and Ohmori 25
aspects by placing more importance on interviews with stakeholders than on an examination of the technical aspects of how accessibility has been achieved in the projects.
RESULTS Outline of Hankyu Itami Station Project The Hankyu Itami Station Project rebuilt a railway station in Itami City as part of the reconstruction effort following the Great Hanshin–Awaji Earthquake of 1995. In planning the project, a committee was organized, comprised of members representing Hankyu Railway and Itami City Government and Itami residents, including disabled people and elderly people. This is said to be the first railway project that included the participation of disabled people from the planning stage, based on the awareness that government manuals and regulations alone did not fully address the needs of people with disabilities. Railway Company and Local Government The railway company, Hankyu Corporation, had voluntarily introduced barrier-free railway facilities even before the establishment of local ordinances for welfare town planning in the 1990s in the Kansai area. However, the company was initially hesitant to introduce accessible amenities to the rehabilitation of Hankyu Itami Station due to constraints such as financial feasibility. Yet, based on its previous achievements in accessibility in the 1970s and 1980s and the wide media broadcast of the station’s serious damage, the company ultimately decided to incorporate accessibility and become the first barrier-free railway transportation project to introduce public involvement from the very beginning in Japan.
The Itami City government launched its welfare town initiative in 1981 and introduced a local accessible guideline as early as in 1985, before the introduction of any prefectural regulation or national law. However, it was not easy to spread the concept to departments other than the welfare department. In 1992, Hyogo prefecture became the first prefecture to establish a local ordinance for welfare town planning and created a guideline for accessible facilities in 1993. Itami City, as a city located in Hyogo prefecture, followed this movement and renewed its local guideline in 1994. Regulations and Guidelines In this project, the committee made an effort to go beyond complying with regulations of Itami City and Hyogo prefecture guidelines. Through interviews, we found that committee members tried to discuss each of the items that were brought to their attention by DPOs. They discussed feasibility in terms of technical and financial aspects, putting less priority on compliance with regulations and guidelines. As a result, the project succeeded in planning a station that incorporates specifications that are much higher than those required by regulations and guidelines, such as rooftop parking for wheelchair users and evacuation areas in the corners of the platform.
26 TR Circular E-C262: TRANSED 2018
Public Involvement In this project, the donor, Eco-mo Foundation, imposed a condition to include public involvement. Additionally, DPOs and Itami City’s physically disabled people’s welfare association had been negotiating with the local government and Hankyu Railway for the installation of an elevator before the earthquake, and the two sides had been about to come to an agreement. DPOs also collected petitions from more than 850 people whose responses to questionnaires presented 56 categories of opinions and submitted the petitions not only to Itami City government and Hankyu Railway, but also to Eco-mo Foundation in Tokyo. In consideration of the above, the right persons were chosen as members of the committee.
The approach of the committee was to think together and become actively involved in the project. On the other hand, Hankyu Railway was wary of any requests that could incur a loss, although it did say that it learned much from the voices of disabled people.
The discussion did not go smoothly from the beginning. The disabled people committee members were uncomfortable about conveying the various needs of different disabilities on behalf of other disabled people and were hesitant to tell their peers what were financially and technically difficult issues. They visited various places such as highway service areas to collect information on the latest multipurpose toilets and ostomate facilities. The discussions were endless.
The committee aimed to reach a conclusion but not without sufficient discussion. The chairman and vice chairman from academia listened to the arguments with fairness and objectivity and established a kind of mutual trust with all members. Conclusion Public involvement ensured the Hankyu Itami Station Project included the following characteristics:
• Accessibility is a prerequisite of the project; • Participation of disabled people is a requirement; • Specifications are planned beyond the scope of regulations and guidelines; • A committee is created representing all stakeholders; • The committee discusses all issues raised by DPOs; • The members attempt to collect best practices from throughout the country; and • Disabled people members collect the opinions of their peers with other disabilities. As a result, this project was regarded as a pioneering project in barrier-free railway
transport (12). It became the best practice at the time by incorporating all possible accessibility measures. Outline of Fukuoka Nanakuma Line Project The Fukuoka Nanakuma Line, completed in 2005, is considered one of the most accessible railway lines of the early 21st century. Detailed design was carefully planned to accommodate the needs of disabled people and to adopt best practices in accessibility. Although the project team did not organize a committee that included local residents as in the Itami project, it visited DPOs, invited them to project sites and demonstration tests, and listened to the voices of disabled people. The success of this project is widely introduced in national and local guidelines as a best practice.

Dobashi and Ohmori 27
Railway Company and Local Government In this project, Fukuoka Transport Bureau took a conscious approach to addressing the needs of people who have mobility difficulties based on the awareness that the existing Kuko Line (1981) and Hakozaki Line (1982) had not sufficiently introduced accessibility at the time of their construction. It was a unique approach that differed from the national guideline. The transport bureau had an idea to do something new and something good that could only be done in a city the size of Fukuoka, which had a population of roughly 1.25 million in 1995.
A design committee was organized to participate in the planning of the project and held a total of 13 meetings. It is also worth noting that the committee did not disband for the next 10 years. Although there were no disabled people among the members, the relationship between the bureau and disabled people deepened as the committee members strengthened their interest in public involvement especially by disabled people. Furthermore, some working members displayed good understanding of disabled people’s participation, and one of the managers of the bureau was keen in listening to the voices of disabled people.
Fukuoka Transport Bureau also collected a wealth of nationwide information for reference, including the basic design of Sendai subway (13). An interview with stakeholders revealed that the bureau asked the person involved in Sendai Namboku line that they wanted to refer to Sendai’s approach. All stakeholders of the project were positive about creating the best subway. Regulations and Guidelines The Fukuoka Nanakuma Line Project was characterized by Fukuoka Transport Bureau’s efforts to create an original accessible environment without clinging to local and national guidelines. That is to say, the bureau took new approaches that went beyond existing regulations and guidelines to form “best practices” that became the foundation for creating new guidelines.
Since the first guideline was formulated by the Fukuoka city government in 1999, it has been revised three times. These guidelines introduced the bureau’s efforts as best practices and contributed significantly to raising the level of accessibility. Additionally, the 2013 national guideline also introduced many of Fukuoka’s efforts as good practices, including Nanakuma Line’s lighting, elevators, space between trains and platforms, and platform door signs. Public Involvement From the planning stage, the Nanakuma Line Project adopted approaches that differed from other railway projects in response to active movements by DPOs against the inadequate accessibility level of existing lines (such as the Kuko Line and Hakozaki Line operated by Fukuoka Transport Bureau and the Nishitetsu and JR Lines operated by other operators). Some DPOs established mutual trust with the bureau from before the commencement of the project through their continuous approach to the bureau requesting improvement in accessibility.
Through a thorough review survey of existing lines in 1994–1995, Fukuoka Transport Bureau came to the understanding that it was critical to give consideration to passengers with mobile and visual disabilities. It therefore initiated discussions with DPOs in Fukuoka through the umbrella organization of Fukuoka City Committee of Disabled People’s Organizations, which was established in 1981, the International Year for Disabled People. More than 20 meetings were held

28 TR Circular E-C262: TRANSED 2018
to discuss and collect information on the needs of disabled people with about 30 DPO members of the umbrella organization. Furthermore, demonstrations of sound signage and announcements were conducted with the participation of a few hundred people. Conclusion As a result of the project, the Nanakuma Line was awarded a national barrier-free award, and many of the measures and approaches were introduced in national guidelines as best practices at that time. There were several main factors for its success. One was that the inadequacies of existing lines had already been identified by DPOs, and the transport bureau was aware of them. Another was that DPO movements and the bureau’s sincere attitude led to the incorporation of accessibility measures. Still another was that an umbrella organization of DPOs in Fukuoka already existed that the bureau could easily approach. The bureau and the project design committee efficiently and effectively utilized these social capitals to establish the best accessible line at the time. Outline of Sendai Tozai Line Project The Sendai Tozai Line Project built a new public subway that commenced operations in Sendai City in 2015. The city transportation bureau sought to accommodate the needs of people with disabilities to the highest level as defined in national guidelines in collaboration with both officially and unofficially recognized DPOs. These efforts resulted in one of the best subway systems in Japan today. Railway Company and Local Government In Sendai, there were movements for community-based support in the 1960s, the first wheelchair national assembly was organized in the 1970s, and the first “welfare community” was created in the 1970s. Disabled people’s movements were active, and the local government was also positive in creating a welfare community.
Against such background, the planning of the Sendai Tozai Line in the 2000s aimed to develop the best subway possible by collecting relevant information from throughout the country. From the very beginning, it was clear that providing accessibility was an important concept of the project. According to interviews with stakeholders, Sendai Transport Bureau has already obtained detailed information about Nanakuma Line for reference from early on. An executive officer at the bureau stated that “all public transport bureaus are connected.” In fact, there is one technical committee and another operational committee comprising all subway authorities in Japan for exchanging information and establishing connections. The relationship seems to be extremely close especially among ordinance-designated cities. Under this situation, the Tozai Line was planned to be and turned out to be a highly accessible subway by integrating measures and techniques at the highest level by collecting best practices from throughout the country. Regulations and Guidelines Through interviews, the staff of the transport bureau revealed that the bureau aimed to comply to the greatest extent with national guidelines’ three degrees of compliance: minimum, average, and desirable. At the local level as well, there were many regulations and decrees, including the local

Dobashi and Ohmori 29
ordinance for Sendai welfare community and welfare community guidelines. Therefore, the bureau needed to make the Sendai Tozai Line as accessible as possible in order to comply with all national and local rules.
Additionally, as planned in the Basic Vision of Sendai City for Accessibility, the bureau consulted with local DPOs and other various stakeholders to make designated areas accessible. It also attempted to address all the complaints that have been made regarding the low accessibility level of the existing Namboku Line. Public Involvement Fourteen DPOs, officially led by the Sendai City Welfare Association for the Disabled, collected the opinions and needs of stakeholders including ineligible members, and successfully conveyed their requests to the bureau through Sendai barrier-free promotion meetings sponsored by the local government, opinion exchange meetings for subways organized by the bureau, and various other such meetings.
The Namboku Line, which opened in 1987, was equipped with elevators in 15 out of 16 stations from the beginning. However, as this was the extent of accessibility introduced to the line, the bureau continued to negotiate with DPOs regarding how to achieve greater accessibility such as by introducing sound signage. As one executive officer stated, the bureau wanted to “sweep off” all complaints by making the new line as accessible as possible. The continuous negotiations with DPOs were effective in creating such an environment. It should be noted that the bureau did not close its door to nonofficial DPOs, of which there were eight, but kept it open to also hear and receive their requests. Conclusion The Sendai Tozai Line has been highly evaluated in many ways by newspapers and by national government agencies (Cabinet Office Award and Ministry of Land, Infrastructure, Transport and Tourism (MLIT) Award). As its plan (2003–2015) was approved after the enactment of the Accessible Public Transport Law in 2001, the transport bureau was extremely careful to comply with accessible laws. In the planning of the Tozai Line, the transport bureau and DPOs established a mutual relationship through regular discussions. Even after the completion of the subway, they still continue to discuss accessibility issues through various channels. It is important for everyone to keep their voices heard so that the government can hear it and lend an ear to it as the voices of its citizens. ANALYSIS Table 1 shows the history of the three projects in relation to the history of barrier-free transportation in Japan. This section will analyze the important elements of the projects to see their similarities and differences.

TABLE 1 History of the Three Projects Examined in This Paper
Japan Hankyu Railway (Itami Station) Fukuoka City Subway Sendai Subway World
1970s
1970: Basic Act for Persons with Disabilities
1950: Establishment of the Itami City Physically Disabled People’s Welfare Association
1950: Establishment of the Fukuoka Physically Disabled Persons’ Association
1970s: Movements in community-based support; 1970s: Welfare community movement; 1973: First national assembly for wheelchair users
1975: Declaration on the Rights of Disabled Persons
1980s
1983: National Building Accessibility and Mobility Standards; 1984: Guidelines to Improve Barrier-Free Access for Public Transport
1985: Itami City Building Accessibility and Mobility Standards (1st)
1982: Commencement of Kuko Line; 1983: Commencement of Hakozaki Line
1987: Commencement of Namboku Line
1981: International Year for Disabled People
1990s
1994: The Law for Promoting the Construction of Easily Accessible and Usable Designated Building for the Aged and the Physically Disabled (Heart Building Law); 1992: Local ordinances promoting “welfare towns” (started in Osaka and Hyogo, then nationwide); 1995: The Great Hanshin–Awaji Earthquake
1993: Hyogo Prefectural Building Accessibility and Mobility Standards; 1994: Revision of Itami City Building Accessibility and Mobility Standards; 1995: Collapse of Itami Station; 1996–1998: Committee for Rehabilitation of Hankyu Itami Station; 1998: Recommencement of Hankyu Itami Station
1990: Fukuoka protest for mobility gathering; 1992: Official decision in implementing elevators to all stations; 1995: Start of planning for Nanakuma Line; 1999: Fukuoka City Building Accessibility and Mobility Standards (1st)
1997: Sendai City Building Accessibility and Mobility Standards
1995: ADA in the United States; 1995: DDA in the U.K.; Late 1990s: Disability acts throughout the world (advanced countries and developing countries)
2000s
2000: The Law for Promoting Easy Public Transport Mobility for the Aged and the Physically Disabled (Barrier-Free Transport Law); 2000: Basic vision (municipal government); 2006: The Law for Promoting Easy Mobility and Accessibility for the Aged and Disabled (New Barrier-Free Law)
2000: Recommencement of the station square of Hankyu Itami Station; 2002: Award from the cabinet secretary for barrier-free achievement; 2004: Change from welfare plaza to town planning information plaza in the station
2004: Installation of platform doors to all Kuko Line stations; 2005: Commencement of Nanakuma Line; 2005: Installation of platform doors to all Hakozaki Line stations 2005: Award from the cabinet secretary for barrier-free achievement
2003: Commencement of the planning of Tozai Line
2006: Approval of CRPD; 2008: Effectuation of CRPD
2010s
2011: Major revision of the Basic Act for Persons with Disabilities; 2014: Ratification of CRPD; 2018: Revision of Law for Promoting Easy Mobility and Accessibility for the Aged and Disabled
2017: Moving out of Information Plaza from the station
2013: Commencement of construction work to extend Nanakuma Line (through 2022)
2010~: Sendai city council for barrier-free; 2015: Commencement of Tozai Line; 2017: Award from MLIT for barrier-free achievement; 2018: Award from the cabinet secretary for barrier-free achievement

Dobashi and Ohmori 31
Railway Company and Local Government It was difficult to identify how and who actually came up with and developed each accessibility measure. However, more than who said what, it matters what the conclusion of the discussions was. One of the major achievements of the discussions was “co-creation.” It was a concept that contributed to improving the accessibility of facilities in the projects. For instance, in the Hankyu Itami Station Project, disabled people in the project committee strongly demanded dedicated parking areas, and the technical side of the project responded by creating a covered parking area on the roof of the station building. In the Fukuoka Nanakuma Line Project, discussions with stakeholders resulted in the invention of Braille blocks that have wheelchair crossing points so that wheelchair users can cross the braille blocks without impact. In the Sendai Tozai Line Project, the transport bureau made all entrance gates wide gates in response to the request of DPOs. These are examples that not only represent the ideas of railway operators or DPOs, but are essentially “co-creations” that have been achieved through discussions. Regulations and Guidelines Generally speaking, all three projects aimed to create best practices of the time beyond the scope of existing guidelines or regulations. The project in the 1990s attempted to create a foundation for guidelines, the project in the 2000s tried to raise the level of the standard, and the project in the 2010s aimed to achieve the highest standard in the field. The approaches to guidelines and standards have changed. In the beginning when the guideline was premature, local governments tried to assess the needs of disabled people through direct dialogue with DPOs. Gradually, such knowledge came to be accumulated in guidelines, which encouraged operators to raise the level of their approaches by spotlighting specific cases. As the levels of the guidelines became higher, operators simply needed to target to the highest level.
Itami City, as mentioned earlier, established a guideline even before a prefectural government ordinance was established. Fukuoka city introduced a guideline for accessible buildings in 1999, and Sendai city introduced a similar guideline in 1994. Subsequently, all of these guidelines have been revised from time to time to further respond to the growing demand to accommodate the needs of disabled people.
Actually, the Japanese national guideline is just a reference and is not binding. On the other hand, the local guidelines are mandatory. Therefore, it is necessary to make changes from the local level to create a more accessible society. Public Involvement It is important for disabled people to specify their needs so that operators can give shape to them. They need to have good leaders who can gather such needs and convey them in a way that the local government and operators can fully understand them. In the three projects, there were such leaders who took the necessary approach to deliver the needs of disabled people to committees or to the transport bureau. There were also people who had a good understanding of such needs on the side of the operators and local governments who learned about social needs from movements led by the socially vulnerable and racial minorities and student protests and were able to address these needs. In terms of public involvement in the three projects, not only the stakeholders but

32 TR Circular E-C262: TRANSED 2018
also the operators and local government officials stated that taking the participatory approach was highly meaningful in accommodating the needs of diverse passengers.
What the projects had in common was that the operators sincerely responded to the requests of disabled people with respect to their dignity. On the side of disabled people, they were able to specifically explain their problems and needs and receive proper response to their requests. Table 2 shows the significant actions taken in each project. Level of Public Acceptance While the data is limited, a census on disability carried out by the Cabinet Office in 1987 found that only 12.5% of the people consider accessible environment as an important element to disabled people. However, when the Hankyu Itami Station Project was being planned, public opinion in support of disabled people going out had just reached 33.2% in 1997. This growing awareness among the public made it possible to invest nearly a billion yen (about $9 million) in a project to accommodate accessibility. The figure reached 40.9% in 2001 right after the enactment of the Barrier-Free Transportation Law in 2000. Now it is 52% and among the top elements that include vocational training, education, and rehabilitation. Moreover, awareness of the term “barrier-free” has reached more than 95% in 2018 (14). The importance of disabled people’s going out has gained strong understanding.
According to interviews with subway operators, elevators were considered “luxury goods” in the 1980s and 1990s. Today, however, relatively larger cars are being introduced (cars with a capacity of 13–18 people, where regulations require cars with a capacity of up to 11 people) to accommodate the needs of disabled people as well as to secure space to carry stretchers in times of emergency. In the case of the Sendai Tozai Line, most stations were constructed with two accessible paths to the entrance at ground level. This was not possible in
TABLE 2 DPO Actions in the Three Projects
Project Date Actions
Itami 1995–1998 • Submission of petitions (850) to related authorities in 1995 • Inclusion of disabled people in the project committee • Establishment of close relationships among different DPOs
Fukuoka 1995–2005 (now)
• Consultation with the transport bureau through an existing umbrella DPO (30 DPOs, more than 20 meetings) from 1995
• Participation in experiments and observation tours • Active approaches especially by specific DPOs before the planning
stage
Sendai 2010–2015 (now)
• Movements in community-based support in the 1960s, the first wheelchair national assembly in the 1970s, and the first “welfare community” in the 1970s
• DPO participation in meetings, experiments and observation tours (at least eight times) through various channels from 2010
• Active involvement of various nonregistered DPOs through an umbrella DPO

Dobashi and Ohmori 33
the 1980s and 1990s when the public was not sufficiently aware of the needs and importance of accessibility for disabled and elderly people. Plan-Do-Check-Act and Disabled People’s Organization Movements Interviews with railway operators indicated that the plan-do-check-act (PDCA) cycle was actually implemented in the field. It was implemented at various levels within the same project, such as within the same operator and among different operators, and information was collected from various operators as well as from MLIT.
In all three projects, information was collected from nationwide railway operators, and new measures were introduced not only to the new lines but also to existing lines to raise their level of accessibility.
Surprisingly, the concept of total design that was first introduced to the Sendai Namboku Line was adopted by the Fukuoka Nanakuma Line, and the efforts that went into planning the Nanakuma Line were introduced to the Sendai Tozai Line. As an executive of Sendai Transport Bureau said, as mentioned earlier, “all public transport bureaus are connected.”
DPO movements are also an engine of PDCA, as they promote the sharing of information on the latest measures and initiatives among nationwide DPOs. The continuous efforts of such movements were common to all three projects. DPOs visualized their needs for physically accessible environments in a way that operators could understand, and the subtle pressure prompted the operators to introduce the latest, optimal measures and initiatives to new lines through the country through the process of PDCA. CONCLUSION By examining and comparing the three projects, we can see how accessibility in Japan has changed over time to comply with the CRPD to secure mobility for all. It started with the basic approach of discussing and verifying the feasibility of requests raised by disabled people in the Hankyu Itami Station Project. We can also see progress in technologies as well as in information-sharing among executing agencies. The PDCA cycle worked particularly effectively in the case of the Nanakuma Line and Tozai Line Projects. Official guidelines are now instrumental in accumulating knowledge for responding to the needs of people with mobility impairments. In fact, the case study of the Nanakuma Line is mentioned at length in local and national guidelines. In the case of the Tozai Line, the goal was to comply with guidelines at the highest level. DPOs continue to play a significant role in refining existing designs and demanding further improvement through discussions with executing agencies, and co-creations are still being born in collaboration between executing agencies and disabled people. Through this paper, we hope to shed light on accessibility initiatives in Japan and gain ideas on how to push them forward more effectively by bringing together all available resources to realize an environment as envisioned in the CRPD.
Besides the three best practices discussed, various other achievements have been taken throughout the country. Figure 1 shows improvements in accessibility of main passenger facilities in railway stations and of train cars.

34 TR Circular E-C262: TRANSED 2018
FIGURE 1 Accessible railways facilities and train cars in Japan: improvements from
FY2001–2017 (15). (Note: Data from 2001–2009 are based on railway stations with more than 5,000 passengers per day, while data after 2010 are based on railways stations with
more than 3,000 passengers per day. Also, the decline in accessible train cars from 2006 and after is due to changes in the official criteria for accessibility).
This trend was realized owing to DPO movements for mobility that targeted the
government and public transport operators. By visualizing barriers that used to be invisible, governments and operators were able to grasp the needs of disabled people and become more sensitive to their issues. Moreover, they realized that disabled people are also important users (passengers) of public transport and should be accommodated as much as possible.
The level and approach to public participation differed in each project, and consisted of varying degrees of interviews, participation in experiments, visits to project sites, exchanges of opinions for mock-up trials, attendance in committee meetings, etc. It is difficult to say which approaches were most effective and whether they continue to be effective, but employing the best possible way at the time is the greatest solution, and that was what they did.
In the1990s, when governments lacked sufficient knowledge and information, it was necessary to listen directly to disabled people to revise or to create guidelines. In the 2000s, they lent an ear to the voices of the people to refine the guidelines. And in the 2010s, they primarily needed to focus on complying with the guidelines to the highest level. As information about costs related to the Nanakuma Line and Tozai Line was not mentioned with any emphasis, cost was probably not a major issue compared to the mission to make the lines accessible, which had come to be strongly supported by public opinion.
0.0
10.0
20.0
30.0
40.0
50.0
60.0
70.0
80.0
90.0
100.0
2001 2002 2003 2004 2005 2006 2007 2008 2009 2010 2011 2012 2013 2014 2015 2016 2017
elimination of level differences braille blocks
accessible toilets accessible train car
%
FY
Dobashi and Ohmori 35
For further studies, we need to check whether other projects were also implemented in compliance with CRPD to realize accessible environment for all. As the Law for Promoting Easy Mobility and Accessibility for the Aged and Disabled was revised this year and UD2020 has been approved, we need to keep our eyes open to the future direction of changes and developments not only at the policy level but also at the field level. We also need to keep our eyes on international standards such as the IPC guideline toward the Tokyo Olympic and Paralympic Games, so that Japan may stand on par with other countries as part of the process of an international PDCA cycle. ACKNOWLEDGMENT This research was supported by a grant offered by the Foundation for Promoting Personal Mobility and Ecological Transportation (Eco-Mo Foundation) in FY2017 (No.188-2). REFERENCES 1. The United Nations. Convention on the Rights of Persons with Disabilities. 2016. Available at
https://www.un.org/development/desa/disabilities/convention-on-the-rights-of-persons-with-disabilities.html#Fulltext. Accessed July 3, 2018.
2. U.S. DOT. Public Involvement Techniques. Available at https://www.planning.dot.gov/Pu. 3. Social Exclusion Unit. Making the Connections. Office of the Deputy Prime Minister, London, 2003. 4. Ryan, F. Celebrating the Hidden History of Disabled People’s Fight for Civil Rights. The Guardian,
Nov 4, 2015. 5. Parliament of United Kingdom. Implementation of the Right of Disabled People to Independent
Living: Human Rights Joint Committee, 2012. Available at https://publications.parliament.uk /pa/jt201012/jtselect/jtrights/257/25706.htm. Accessed August 5, 2018.
6. Department for Transport and Disabled Persons Transport Advisory Committee. Draft Transport Accessibility Action Plan, 2018. Available at https://www.gov.uk/government/consultations/draft-transport-accessibility-action-plan. Accessed August 7, 2018.
7. Department for Transport, DPTAC, and DFT Equalities Team. Accessible Transport, 2018. Available at https://www.gov.uk/government/policies/accessible-transport. Accessed August 7, 2018.
8. Takamine, Y. Disability and Development : International Trends in Accessibility in Infrastructure Projects. Human Science, Vol. 21, No. 3, 2008, pp. 79–115 (in Japanese).
9. Nomura, K. Outline of Welfare Town Planning. Study of Current Rehabilitation, Vol. 80, 1994, pp. 2–10 (in Japanese).
10. Cabinet Secretariat. Meeting of the Ministerial Council on Universal Design 2020. 2017. Available at https://japan.kantei.go.jp/97_abe/actions/201702/20article2.html. Accessed July 3, 2018.
11. Schwartz, M., H. Yajima, J. Bartsch, and J. Brittingham. Public Involvement in Japanese Transportation Decision-Making. Transportation Research Record: Journal of the Transportation Research Board, No. 1858, 2003, pp. 89–94.
12. ECO-MO Foundation ed. Aiming for an Extremely Barrier-Free Railway Station: The Process of Rehabilitation of Hankyu Itami Station from the Great Hanshin–Awaji Earthquake. Taisei-shuppan, 2001 (in Japanese).
13. Transportation Bureau City of Sendai. Planning of Basic Design for Sendai Subway. 1988. 14. Cabinet Office. Awareness Survey on Barrier-Free and Universal Design. 2018. Available at
http://www8.cao.go.jp/souki/barrier-free/tyosa_kenkyu/h29/index.html. Accessed July 26, 2018 (in Japanese).

36 TR Circular E-C262: TRANSED 2018
15. Ministry of Land, Infrastructure, and Transport. Report on Improvement in Accessibility of Public Transport. Available at http://www.mlit.go.jp/sogoseisaku/barrierfree/sosei_barrierfree _mn_000003.html. Accessed March 14, 2019 (in Japanese).
37
CONFERENCE PAPERS
Accessibility Survey for Generation of Representative Customer Requirements in Accessible Design for Sleeping
Compartments on Long-Distance Passenger Rail
KAMOLNAT TABATTANON University of Michigan
KATHARINE HUNTER-ZAWORSKI
Oregon State University
ndividuals and their assistive technologies may experience different limitations that what may have been applicable when regulations such as the ADA were enacted due to increased age,
weight, and size in the population and advancements in technology. Changes in design standards and transportation codes of practice are needed to fully account for these changes. As part of the recommendation to change, designers of accessible spaces need updated understanding in order to account for inclusive accessibility in their design decisions. However, it was unknown whether there are significant differences between responses, preferences to accessibility, and customer requirements from respondents who identify differently among the target population. An online survey was distributed to determine the needs, values, and responses to certain aspects of the design concepts from members of the target population. Results from the 173 respondents suggest that for design features involving height of berths, reachability and privacy of accessible restroom accommodations, individuals with reduced mobility expressed different customer design requirements. Comments received during the project also suggest that providing the target population with a means of visually accessing design alternatives may aid in engaging respondents in considering in-use interactions with the designed space. INTRODUCTION Accessibility in transportation services is key in providing inclusive access and independence (1). Trends in the population indicate a continued increase in age, size, weight, and prevalence of persons with disabilities, and with these shifts, the demand for accessible transportation will also increase(2–5) However, in developing inclusive designs, consideration of the changing population and their evolving assistive technologies may entail different design parameters than what may have been applicable at the time regulations such as the ADA were written (e.g., devices are now larger and heavier, or consist of different technology) (2, 3, 6). Changes in standards of transportation regulation or industry-specific codes of practice for facilities, services, and vehicles are needed in order to fully account for these shifts in the passenger population (3, 4, 7).
Feedback and comments received directly from the rail industry indicate that improvements to accessible accommodations and access within the train cars are needed for intercity passenger rail travel. In order to address this design challenge, it is crucial for designers
I

38 TR Circular E-C262: TRANSED 2018
and policy makers to understand the full range of user attributes and needs. However, defining the “user” or target population(s) is often complex, and there is a gap in research in addressing the importance of accounting for differences within the defined population when formulating user needs and requirements, notably in the context of accessible design (8, 9). It has been shown that appropriate understanding of the target population within early phases of design has to potential to decrease time and costs and may also increase inclusivity (10).
TRB’s Safety Innovations Deserving Exploratory Analysis (IDEA) Project-31 aimed to extend the design process of accessible design in passenger rail using a potentially cost-saving methodology; the computer-aided design and digital human modeling aspect of the methodology is discussed in a separate paper (11). As part of a larger research effort, this paper discusses an online survey administered to investigate accessibility needs, values, and preferences between responses from persons with reduced mobility (PRM) and those without (non-PRM). Knowledge gained through results is expected to aid designers in making informed decisions when determining where and how design compromises may be made. METHODOLOGY The protocol for the protection of human subjects was approved by the university’s Institutional Review Board, and participants provided informed consent. Participants were solicited via e-mail to organizations within the target population, flyers, and community outreach.
An online survey was administered in conjunction to a full-scale soft mock-up of an accessible sleeper compartment for a passenger rail car. The survey provided no images of potential design scenarios and focused on investigating accommodation needs and population reaction to hypothetical amenities (e.g., an elevator on bi-level rail cars or fold-flat seats).
The survey consisted of 28 questions. Participants were informed that any questions they chose to skip could be skipped. In addition, the survey was not automatically advancing; respondents took their time and changed answers as they wish. Respondents self-identified as having or having experienced reduced mobility or neither. The first seven questions were self-reported identification questions regarding the respondent’s situation including their mobility and use of mobility aids. Three questions were about the respondent’s experience, if any, with passenger rail and accessibility. The remaining questions were divided into topics of traveling via overnight passenger rail and also addressed amenity needs; these topics were movement about the train and sleeping and restroom and shower accommodations. On the final page, respondents were given the opportunity to provide additional written comments. This space was not character limited, and no specific prompt directing comments were given.
Likert-scale responses labeled with “1: agree” through “5: disagree” were used to determine the level of importance of specific aspects of accessibility. For these questions, respondents were also able to provide written comments explaining their responses. The following nine statements were given for Likert-scale prompts.
Questions 1–3 addressed general mobility: 1. It is important for me to be able to move about the train. 2. It is important for me to be able to access the upper level. 3. If available, I would use an elevator on a moving bi-level train to access both levels.
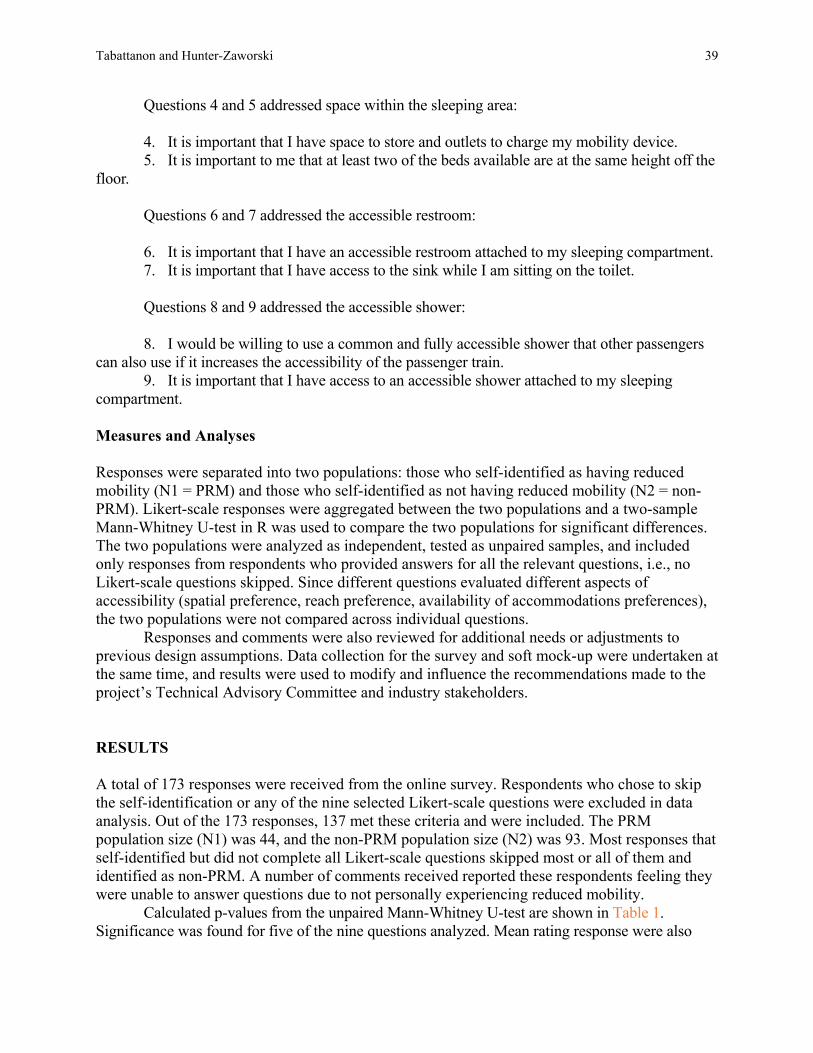
Tabattanon and Hunter-Zaworski 39
Questions 4 and 5 addressed space within the sleeping area:
4. It is important that I have space to store and outlets to charge my mobility device. 5. It is important to me that at least two of the beds available are at the same height off the
floor.
Questions 6 and 7 addressed the accessible restroom:
6. It is important that I have an accessible restroom attached to my sleeping compartment. 7. It is important that I have access to the sink while I am sitting on the toilet.
Questions 8 and 9 addressed the accessible shower:
8. I would be willing to use a common and fully accessible shower that other passengers
can also use if it increases the accessibility of the passenger train. 9. It is important that I have access to an accessible shower attached to my sleeping
compartment. Measures and Analyses Responses were separated into two populations: those who self-identified as having reduced mobility (N1 = PRM) and those who self-identified as not having reduced mobility (N2 = non-PRM). Likert-scale responses were aggregated between the two populations and a two-sample Mann-Whitney U-test in R was used to compare the two populations for significant differences. The two populations were analyzed as independent, tested as unpaired samples, and included only responses from respondents who provided answers for all the relevant questions, i.e., no Likert-scale questions skipped. Since different questions evaluated different aspects of accessibility (spatial preference, reach preference, availability of accommodations preferences), the two populations were not compared across individual questions.
Responses and comments were also reviewed for additional needs or adjustments to previous design assumptions. Data collection for the survey and soft mock-up were undertaken at the same time, and results were used to modify and influence the recommendations made to the project’s Technical Advisory Committee and industry stakeholders. RESULTS A total of 173 responses were received from the online survey. Respondents who chose to skip the self-identification or any of the nine selected Likert-scale questions were excluded in data analysis. Out of the 173 responses, 137 met these criteria and were included. The PRM population size (N1) was 44, and the non-PRM population size (N2) was 93. Most responses that self-identified but did not complete all Likert-scale questions skipped most or all of them and identified as non-PRM. A number of comments received reported these respondents feeling they were unable to answer questions due to not personally experiencing reduced mobility.
Calculated p-values from the unpaired Mann-Whitney U-test are shown in Table 1. Significance was found for five of the nine questions analyzed. Mean rating response were also
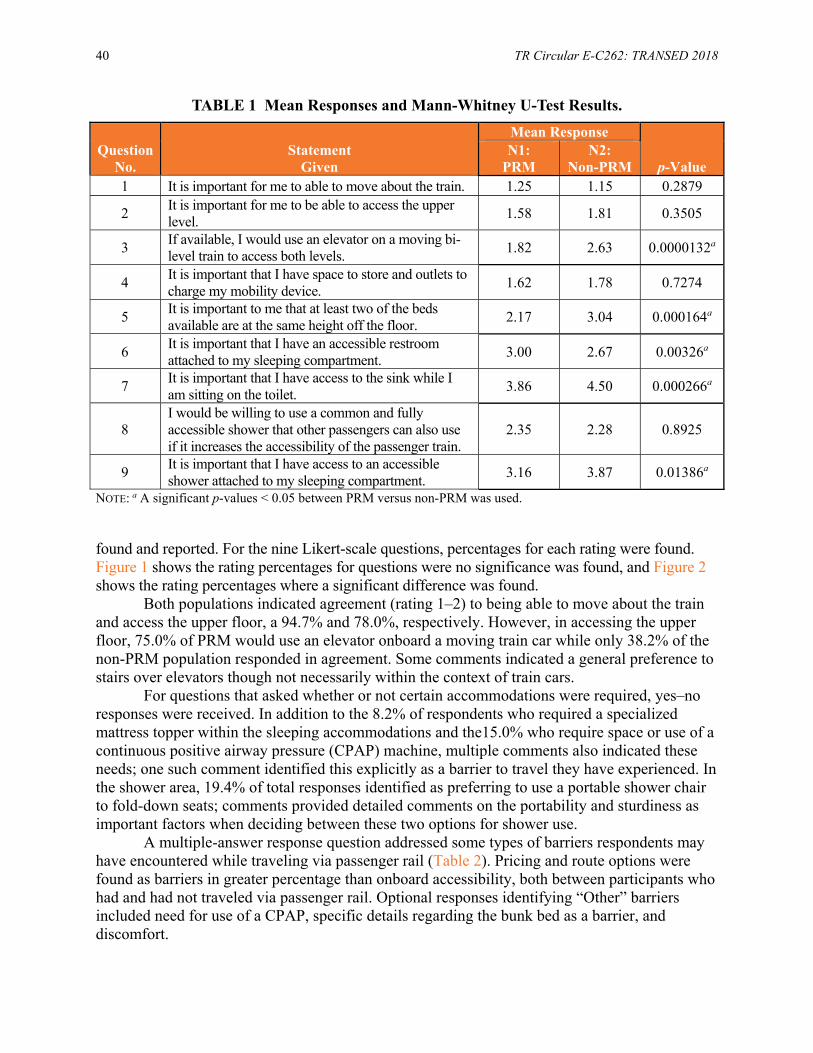
40 TR Circular E-C262: TRANSED 2018
TABLE 1 Mean Responses and Mann-Whitney U-Test Results.
Question No.
Statement Given
Mean Response
p-Value N1:
PRM N2:
Non-PRM 1 It is important for me to able to move about the train. 1.25 1.15 0.2879
2 It is important for me to be able to access the upper level. 1.58 1.81 0.3505
3 If available, I would use an elevator on a moving bi-level train to access both levels. 1.82 2.63 0.0000132a
4 It is important that I have space to store and outlets to charge my mobility device. 1.62 1.78 0.7274
5 It is important to me that at least two of the beds available are at the same height off the floor. 2.17 3.04 0.000164a
6 It is important that I have an accessible restroom attached to my sleeping compartment. 3.00 2.67 0.00326a
7 It is important that I have access to the sink while I am sitting on the toilet. 3.86 4.50 0.000266a
8 I would be willing to use a common and fully accessible shower that other passengers can also use if it increases the accessibility of the passenger train.
2.35 2.28 0.8925
9 It is important that I have access to an accessible shower attached to my sleeping compartment. 3.16 3.87 0.01386a
NOTE: a A significant p-values < 0.05 between PRM versus non-PRM was used. found and reported. For the nine Likert-scale questions, percentages for each rating were found. Figure 1 shows the rating percentages for questions were no significance was found, and Figure 2 shows the rating percentages where a significant difference was found.
Both populations indicated agreement (rating 1–2) to being able to move about the train and access the upper floor, a 94.7% and 78.0%, respectively. However, in accessing the upper floor, 75.0% of PRM would use an elevator onboard a moving train car while only 38.2% of the non-PRM population responded in agreement. Some comments indicated a general preference to stairs over elevators though not necessarily within the context of train cars.
For questions that asked whether or not certain accommodations were required, yes–no responses were received. In addition to the 8.2% of respondents who required a specialized mattress topper within the sleeping accommodations and the15.0% who require space or use of a continuous positive airway pressure (CPAP) machine, multiple comments also indicated these needs; one such comment identified this explicitly as a barrier to travel they have experienced. In the shower area, 19.4% of total responses identified as preferring to use a portable shower chair to fold-down seats; comments provided detailed comments on the portability and sturdiness as important factors when deciding between these two options for shower use.
A multiple-answer response question addressed some types of barriers respondents may have encountered while traveling via passenger rail (Table 2). Pricing and route options were found as barriers in greater percentage than onboard accessibility, both between participants who had and had not traveled via passenger rail. Optional responses identifying “Other” barriers included need for use of a CPAP, specific details regarding the bunk bed as a barrier, and discomfort.
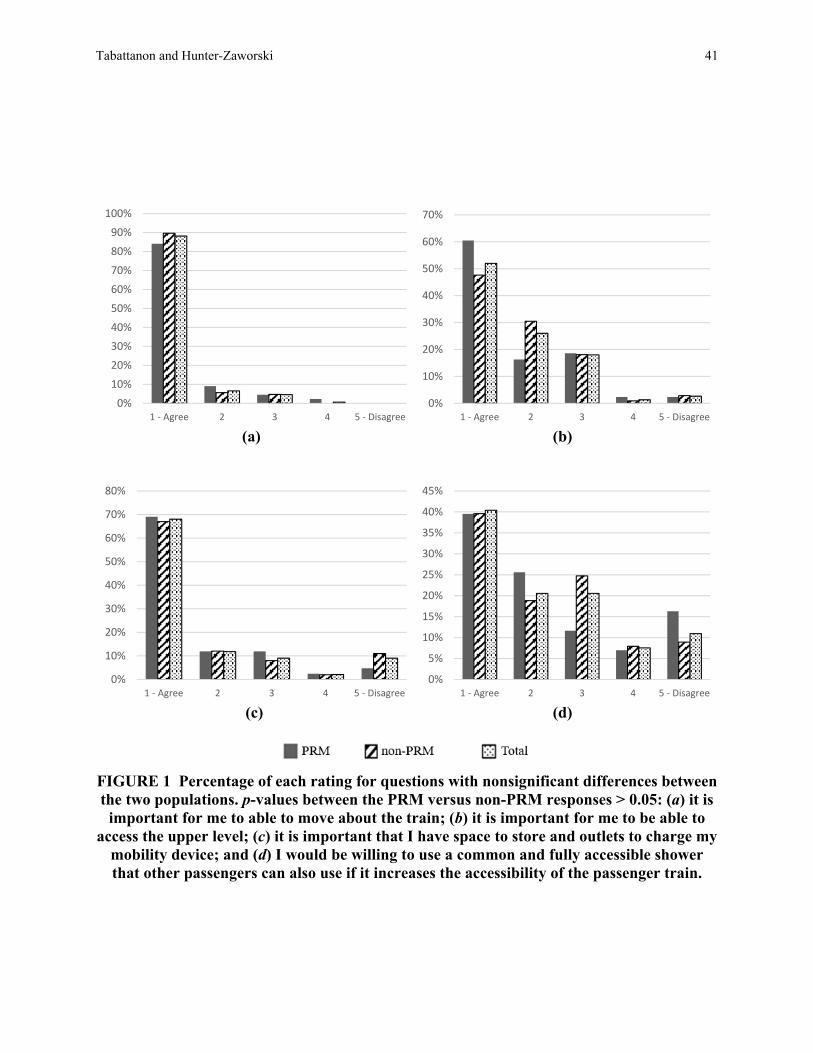
Tabattanon and Hunter-Zaworski 41
(a) (b)
(c) (d)
FIGURE 1 Percentage of each rating for questions with nonsignificant differences between the two populations. p-values between the PRM versus non-PRM responses > 0.05: (a) it is
important for me to able to move about the train; (b) it is important for me to be able to access the upper level; (c) it is important that I have space to store and outlets to charge my
mobility device; and (d) I would be willing to use a common and fully accessible shower that other passengers can also use if it increases the accessibility of the passenger train.
0%10%20%30%40%50%60%70%80%90%
100%
1 - Agree 2 3 4 5 - Disagree0%
10%
20%
30%
40%
50%
60%
70%
1 - Agree 2 3 4 5 - Disagree
0%
10%
20%
30%
40%
50%
60%
70%
80%
1 - Agree 2 3 4 5 - Disagree0%
5%
10%
15%
20%
25%
30%
35%
40%
45%
1 - Agree 2 3 4 5 - Disagree

42 TR Circular E-C262: TRANSED 2018
(a)
(b)
(c)
(d)
(e)
FIGURE 2 Percentage of each rating for questions with significant differences between the two populations. p-values between the PRM versus non-PRM responses < 0.05: (a) if available, I would use an elevator on a moving bi-level train to access both levels; (b) it is important to me
that at least two of the beds available are at the same height off the floor; (c) it is important that I have an accessible restroom attached to my sleeping compartment; (d) it is important
that I have access to the sink while I am sitting on the toilet; and (e) it is important that I have access to an accessible shower attached to my sleeping compartment.
0%
10%
20%
30%
40%
50%
60%
1 - Agree 2 3 4 5 -Disagree
0%5%
10%15%20%25%30%35%40%
1 - Agree 2 3 4 5 -Disagree
0%
10%
20%
30%
40%
50%
60%
1 - Agree 2 3 4 5 -Disagree
0%10%20%30%40%50%60%70%80%
1 - Agree 2 3 4 5 -Disagree
0%
10%
20%
30%
40%
50%
1 - Agree 2 3 4 5 -Disagree
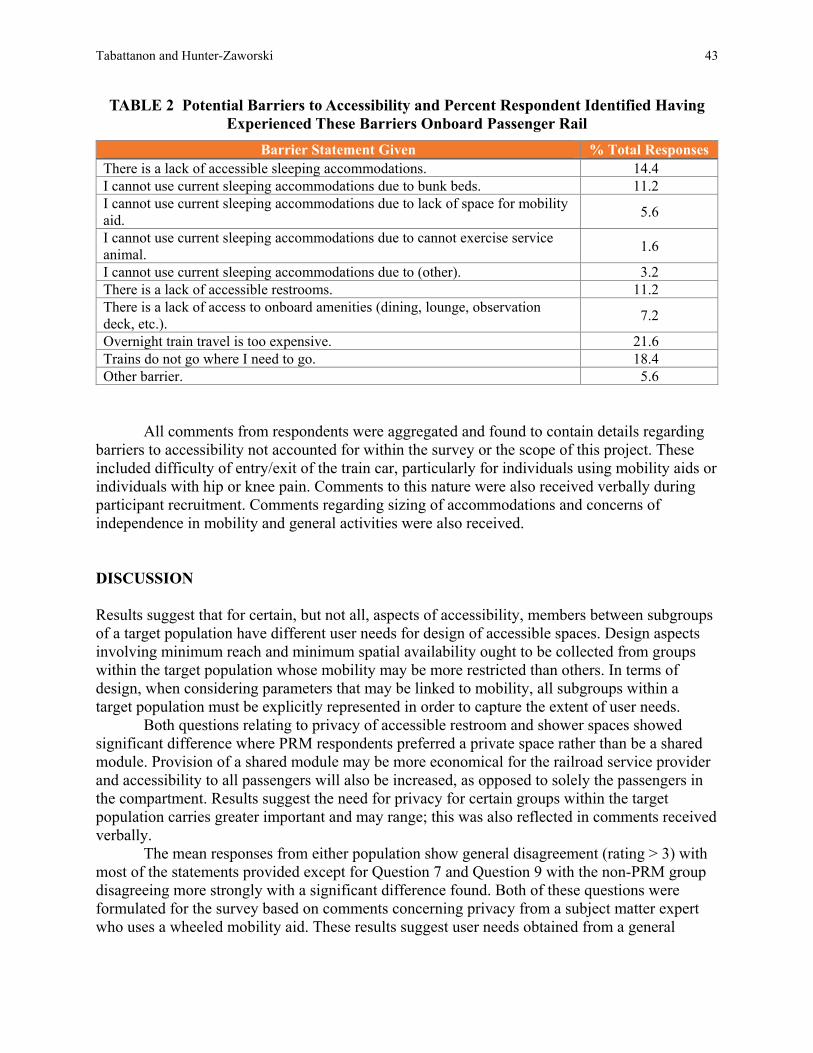
Tabattanon and Hunter-Zaworski 43
TABLE 2 Potential Barriers to Accessibility and Percent Respondent Identified Having Experienced These Barriers Onboard Passenger Rail
Barrier Statement Given % Total Responses There is a lack of accessible sleeping accommodations. 14.4 I cannot use current sleeping accommodations due to bunk beds. 11.2 I cannot use current sleeping accommodations due to lack of space for mobility aid. 5.6
I cannot use current sleeping accommodations due to cannot exercise service animal. 1.6
I cannot use current sleeping accommodations due to (other). 3.2 There is a lack of accessible restrooms. 11.2 There is a lack of access to onboard amenities (dining, lounge, observation deck, etc.). 7.2
Overnight train travel is too expensive. 21.6 Trains do not go where I need to go. 18.4 Other barrier. 5.6
All comments from respondents were aggregated and found to contain details regarding
barriers to accessibility not accounted for within the survey or the scope of this project. These included difficulty of entry/exit of the train car, particularly for individuals using mobility aids or individuals with hip or knee pain. Comments to this nature were also received verbally during participant recruitment. Comments regarding sizing of accommodations and concerns of independence in mobility and general activities were also received. DISCUSSION Results suggest that for certain, but not all, aspects of accessibility, members between subgroups of a target population have different user needs for design of accessible spaces. Design aspects involving minimum reach and minimum spatial availability ought to be collected from groups within the target population whose mobility may be more restricted than others. In terms of design, when considering parameters that may be linked to mobility, all subgroups within a target population must be explicitly represented in order to capture the extent of user needs.
Both questions relating to privacy of accessible restroom and shower spaces showed significant difference where PRM respondents preferred a private space rather than be a shared module. Provision of a shared module may be more economical for the railroad service provider and accessibility to all passengers will also be increased, as opposed to solely the passengers in the compartment. Results suggest the need for privacy for certain groups within the target population carries greater important and may range; this was also reflected in comments received verbally.
The mean responses from either population show general disagreement (rating > 3) with most of the statements provided except for Question 7 and Question 9 with the non-PRM group disagreeing more strongly with a significant difference found. Both of these questions were formulated for the survey based on comments concerning privacy from a subject matter expert who uses a wheeled mobility aid. These results suggest user needs obtained from a general
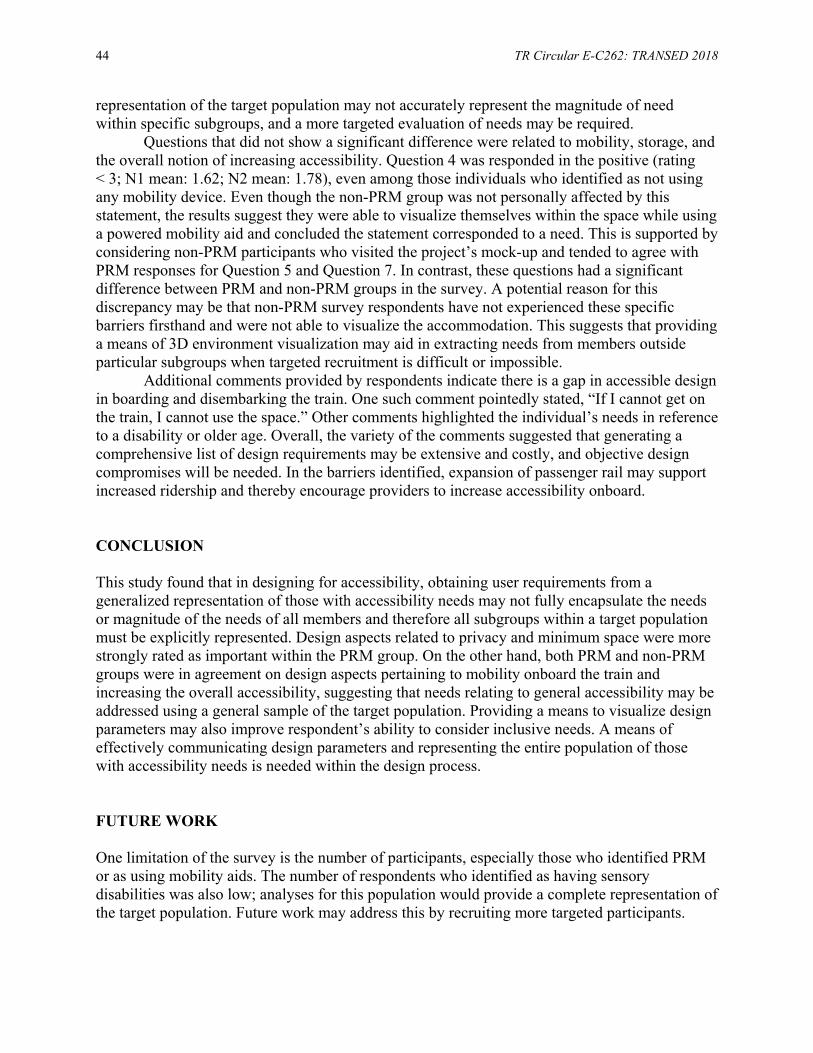
44 TR Circular E-C262: TRANSED 2018
representation of the target population may not accurately represent the magnitude of need within specific subgroups, and a more targeted evaluation of needs may be required.
Questions that did not show a significant difference were related to mobility, storage, and the overall notion of increasing accessibility. Question 4 was responded in the positive (rating < 3; N1 mean: 1.62; N2 mean: 1.78), even among those individuals who identified as not using any mobility device. Even though the non-PRM group was not personally affected by this statement, the results suggest they were able to visualize themselves within the space while using a powered mobility aid and concluded the statement corresponded to a need. This is supported by considering non-PRM participants who visited the project’s mock-up and tended to agree with PRM responses for Question 5 and Question 7. In contrast, these questions had a significant difference between PRM and non-PRM groups in the survey. A potential reason for this discrepancy may be that non-PRM survey respondents have not experienced these specific barriers firsthand and were not able to visualize the accommodation. This suggests that providing a means of 3D environment visualization may aid in extracting needs from members outside particular subgroups when targeted recruitment is difficult or impossible.
Additional comments provided by respondents indicate there is a gap in accessible design in boarding and disembarking the train. One such comment pointedly stated, “If I cannot get on the train, I cannot use the space.” Other comments highlighted the individual’s needs in reference to a disability or older age. Overall, the variety of the comments suggested that generating a comprehensive list of design requirements may be extensive and costly, and objective design compromises will be needed. In the barriers identified, expansion of passenger rail may support increased ridership and thereby encourage providers to increase accessibility onboard. CONCLUSION This study found that in designing for accessibility, obtaining user requirements from a generalized representation of those with accessibility needs may not fully encapsulate the needs or magnitude of the needs of all members and therefore all subgroups within a target population must be explicitly represented. Design aspects related to privacy and minimum space were more strongly rated as important within the PRM group. On the other hand, both PRM and non-PRM groups were in agreement on design aspects pertaining to mobility onboard the train and increasing the overall accessibility, suggesting that needs relating to general accessibility may be addressed using a general sample of the target population. Providing a means to visualize design parameters may also improve respondent’s ability to consider inclusive needs. A means of effectively communicating design parameters and representing the entire population of those with accessibility needs is needed within the design process.
FUTURE WORK One limitation of the survey is the number of participants, especially those who identified PRM or as using mobility aids. The number of respondents who identified as having sensory disabilities was also low; analyses for this population would provide a complete representation of the target population. Future work may address this by recruiting more targeted participants.
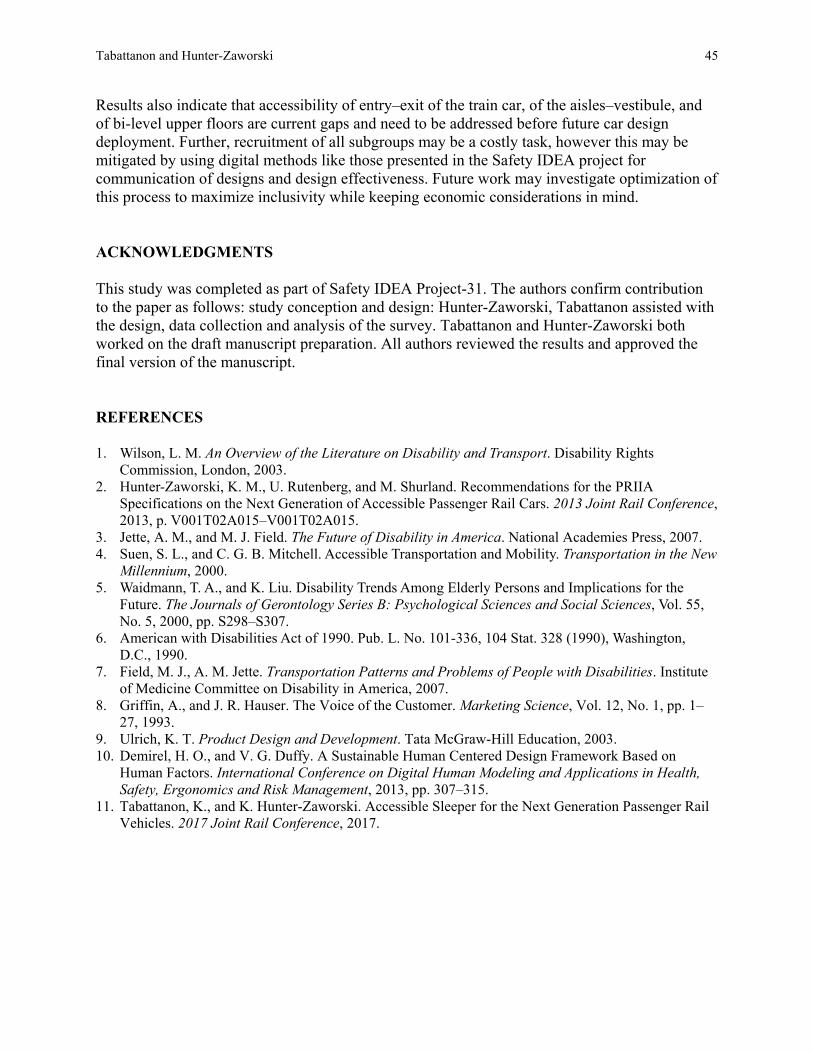
Tabattanon and Hunter-Zaworski 45
Results also indicate that accessibility of entry–exit of the train car, of the aisles–vestibule, and of bi-level upper floors are current gaps and need to be addressed before future car design deployment. Further, recruitment of all subgroups may be a costly task, however this may be mitigated by using digital methods like those presented in the Safety IDEA project for communication of designs and design effectiveness. Future work may investigate optimization of this process to maximize inclusivity while keeping economic considerations in mind. ACKNOWLEDGMENTS This study was completed as part of Safety IDEA Project-31. The authors confirm contribution to the paper as follows: study conception and design: Hunter-Zaworski, Tabattanon assisted with the design, data collection and analysis of the survey. Tabattanon and Hunter-Zaworski both worked on the draft manuscript preparation. All authors reviewed the results and approved the final version of the manuscript. REFERENCES 1. Wilson, L. M. An Overview of the Literature on Disability and Transport. Disability Rights
Commission, London, 2003. 2. Hunter-Zaworski, K. M., U. Rutenberg, and M. Shurland. Recommendations for the PRIIA
Specifications on the Next Generation of Accessible Passenger Rail Cars. 2013 Joint Rail Conference, 2013, p. V001T02A015–V001T02A015.
3. Jette, A. M., and M. J. Field. The Future of Disability in America. National Academies Press, 2007. 4. Suen, S. L., and C. G. B. Mitchell. Accessible Transportation and Mobility. Transportation in the New
Millennium, 2000. 5. Waidmann, T. A., and K. Liu. Disability Trends Among Elderly Persons and Implications for the
Future. The Journals of Gerontology Series B: Psychological Sciences and Social Sciences, Vol. 55, No. 5, 2000, pp. S298–S307.
6. American with Disabilities Act of 1990. Pub. L. No. 101-336, 104 Stat. 328 (1990), Washington, D.C., 1990.
7. Field, M. J., A. M. Jette. Transportation Patterns and Problems of People with Disabilities. Institute of Medicine Committee on Disability in America, 2007.
8. Griffin, A., and J. R. Hauser. The Voice of the Customer. Marketing Science, Vol. 12, No. 1, pp. 1–27, 1993.
9. Ulrich, K. T. Product Design and Development. Tata McGraw-Hill Education, 2003. 10. Demirel, H. O., and V. G. Duffy. A Sustainable Human Centered Design Framework Based on
Human Factors. International Conference on Digital Human Modeling and Applications in Health, Safety, Ergonomics and Risk Management, 2013, pp. 307–315.
11. Tabattanon, K., and K. Hunter-Zaworski. Accessible Sleeper for the Next Generation Passenger Rail Vehicles. 2017 Joint Rail Conference, 2017.
46
CONFERENCE PAPERS
Study on Compact Barrier-Free Lavatories for Small Passenger Ships
KEIKO MIYAZAKI
National Maritime Research Institute
TORU TAKAHASHI Eco-Mo Foundation
SHINICHI INOUE
MHI Shimonoseki Engineering Co, Ltd.
n Japan, over 400 small islands have residents in Japan and small passenger ships are vital means for transportation for the residents and visitors to the islands. A typical small passenger
ship in Japan is about 20 m long and has a capacity of around 50 passengers. Japanese barrier-free guidelines for passenger ships are issued for supplementing “Japanese barrier-free law.” The guidelines recommend that lavatories of passenger ships should be barrier-free regardless of sizes of ships. The guidelines also show a full-size barrier-free lavatory. However, the full-size barrier-free lavatories have difficulties to be installed in small passenger ships owing to the limited space.
Considering the aforementioned situation, the research team designed several types of compact barrier-free lavatories after interviews and questionnaire investigations to ship builders and ship owners. Then the research team made mock-ups based on the designs and conducted experiments on land to find the smallest sizes and to examine the usability. In the experiments, two wheelchair users and two visually impaired persons evaluated the usability. The research team confirmed the usability thorough interviews to the disabled persons and the caretaker supporting one of the wheelchair users. Finally, the research team designed general arrangements of small passenger ships with the compact barrier-free lavatories to examine the feasibility of installing the lavatories.
Individual passenger ship can choose the suitable barrier-free lavatory among the designs the research team proposed according to the ship's feature and the navigational environment. The development of these compact barrier-free lavatories can encourage activities for disabled persons and motivate ship owners to build new barrier-free passenger ships. INTRODUCTION In Japan, more than 400 small islands have residents and small passenger ships are vital means for transportation for the residents and visitors to the islands. A typical small passenger ship in Japan is about 20 m long and has a capacity of around 50 passengers. Figure 1 shows an example of typical small passenger ships.
Japanese barrier-free guidelines for passenger ships are issued for supplementing “Japanese barrier-free law.” The guidelines recommend that lavatories of passenger ships should
I

Miyazaki, Takahashi, and Inoue 47
be barrier-free regardless of sizes of ships. The guidelines also show a full-size barrier-free lavatory which is illustrated in Figure 2. Figure 2 also shows an example of full-size barrier-free lavatories in ferry boats. The full-size barrier-free lavatory has an enough space for a wheelchair user to rotate in it. However, the full-size barrier-free lavatories have difficulties to be installed in small passenger ships owing to the limited space.
Considering the aforementioned situation, the research team designed several types of compact barrier-free lavatories after interviews and questionnaire investigations to shipbuilders and ship owners. The purposes of our study are to find the smallest sizes of the compact barrier-free lavatories and to examine both the usability and the feasibility of the compact barrier-free lavatories for small passenger ships.
FIGURE 1 Example of typical small passenger ship.
FIGURE 2 Illustration of full-size barrier-free lavatory in guidelines (left) and
example of full-size barrier-free lavatory in ferry boat (right).
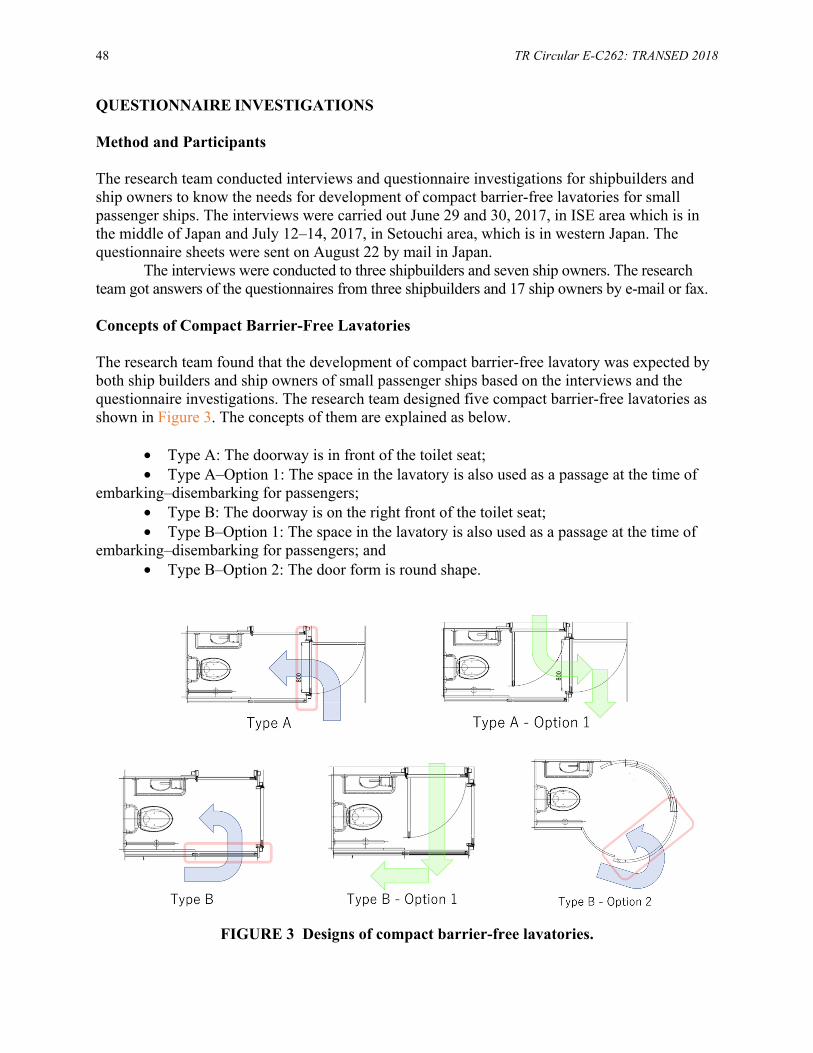
48 TR Circular E-C262: TRANSED 2018
QUESTIONNAIRE INVESTIGATIONS Method and Participants The research team conducted interviews and questionnaire investigations for shipbuilders and ship owners to know the needs for development of compact barrier-free lavatories for small passenger ships. The interviews were carried out June 29 and 30, 2017, in ISE area which is in the middle of Japan and July 12–14, 2017, in Setouchi area, which is in western Japan. The questionnaire sheets were sent on August 22 by mail in Japan.
The interviews were conducted to three shipbuilders and seven ship owners. The research team got answers of the questionnaires from three shipbuilders and 17 ship owners by e-mail or fax. Concepts of Compact Barrier-Free Lavatories The research team found that the development of compact barrier-free lavatory was expected by both ship builders and ship owners of small passenger ships based on the interviews and the questionnaire investigations. The research team designed five compact barrier-free lavatories as shown in Figure 3. The concepts of them are explained as below.
• Type A: The doorway is in front of the toilet seat; • Type A–Option 1: The space in the lavatory is also used as a passage at the time of
embarking–disembarking for passengers; • Type B: The doorway is on the right front of the toilet seat; • Type B–Option 1: The space in the lavatory is also used as a passage at the time of
embarking–disembarking for passengers; and • Type B–Option 2: The door form is round shape.
FIGURE 3 Designs of compact barrier-free lavatories.

Miyazaki, Takahashi, and Inoue 49
The space in the lavatory is used as a passage in Option 1 only during embarking–disembarking. It can be efficiency from the viewpoint of a space of a small passenger ship. An outside door of the passage of embarking–disembarking is usually weathertight, and the passage of embarking–disembarking must be kept as an escape route. Both Japan Craft Inspection Organization and MLIT confirmed that Option 1 satisfied those issues. EXAMINATIONS ON USABILITY Method The research team conducted experiments of the five compact barrier-free lavatories for small passenger ships to find the smallest sizes and to examine the usability. The experiments were carried out on December 15, 2017, in a factory of Nagasaki which is in western Japan. Participants Two visually impaired persons had been nominated as participants from an organization of disabled persons in Nagasaki. Spinal Injuries Japan also had nominated two wheelchair users as representative participants. They and the caretaker supporting one of the wheelchair users participated the experiments and evaluated the usability of the compact barrier-free lavatories. Mock-Ups The research team made the mock-ups of the five compact barrier-free lavatories and conducted experiments in the factory. Figure 4 shows a mock-up of Type B–Option 1 as an example.
FIGURE 4 Mock-up of Type B–Option 1.
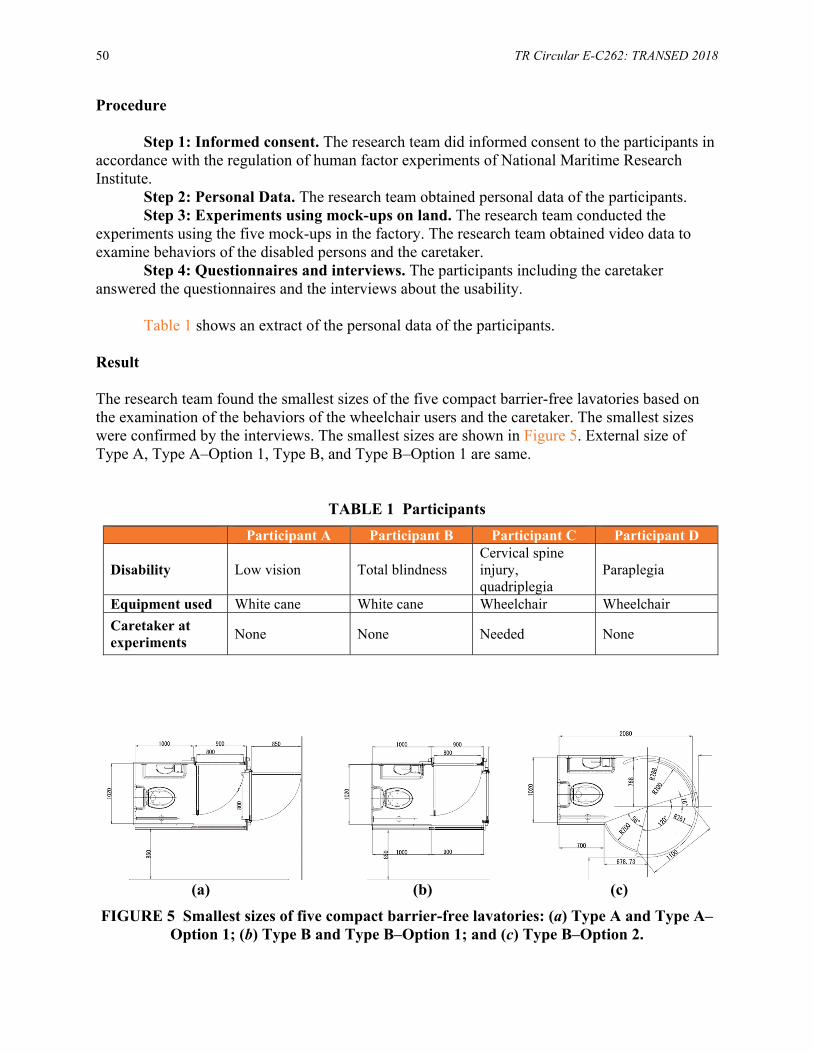
50 TR Circular E-C262: TRANSED 2018
Procedure
Step 1: Informed consent. The research team did informed consent to the participants in accordance with the regulation of human factor experiments of National Maritime Research Institute.
Step 2: Personal Data. The research team obtained personal data of the participants. Step 3: Experiments using mock-ups on land. The research team conducted the
experiments using the five mock-ups in the factory. The research team obtained video data to examine behaviors of the disabled persons and the caretaker.
Step 4: Questionnaires and interviews. The participants including the caretaker answered the questionnaires and the interviews about the usability.
Table 1 shows an extract of the personal data of the participants. Result The research team found the smallest sizes of the five compact barrier-free lavatories based on the examination of the behaviors of the wheelchair users and the caretaker. The smallest sizes were confirmed by the interviews. The smallest sizes are shown in Figure 5. External size of Type A, Type A–Option 1, Type B, and Type B–Option 1 are same.
TABLE 1 Participants Participant A Participant B Participant C Participant D
Disability Low vision Total blindness Cervical spine injury, quadriplegia
Paraplegia
Equipment used White cane White cane Wheelchair Wheelchair Caretaker at experiments None None Needed None
(a) (b) (c)
FIGURE 5 Smallest sizes of five compact barrier-free lavatories: (a) Type A and Type A–Option 1; (b) Type B and Type B–Option 1; and (c) Type B–Option 2.
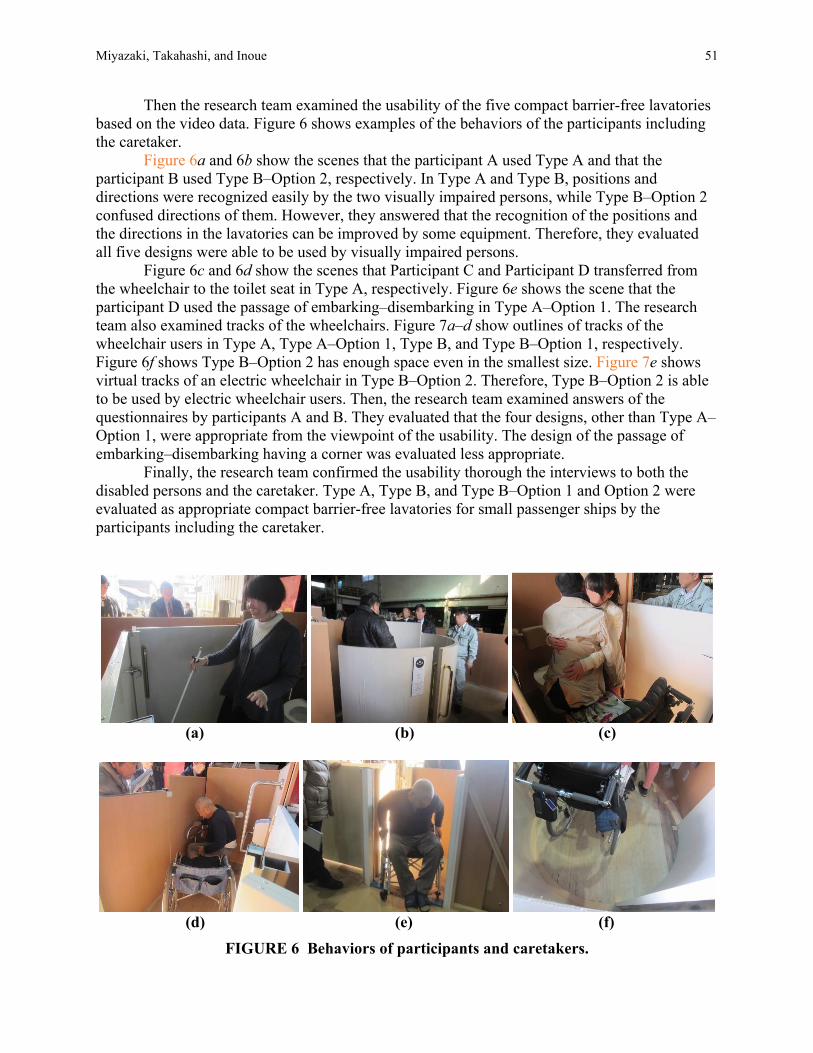
Miyazaki, Takahashi, and Inoue 51
Then the research team examined the usability of the five compact barrier-free lavatories based on the video data. Figure 6 shows examples of the behaviors of the participants including the caretaker.
Figure 6a and 6b show the scenes that the participant A used Type A and that the participant B used Type B–Option 2, respectively. In Type A and Type B, positions and directions were recognized easily by the two visually impaired persons, while Type B–Option 2 confused directions of them. However, they answered that the recognition of the positions and the directions in the lavatories can be improved by some equipment. Therefore, they evaluated all five designs were able to be used by visually impaired persons.
Figure 6c and 6d show the scenes that Participant C and Participant D transferred from the wheelchair to the toilet seat in Type A, respectively. Figure 6e shows the scene that the participant D used the passage of embarking–disembarking in Type A–Option 1. The research team also examined tracks of the wheelchairs. Figure 7a–d show outlines of tracks of the wheelchair users in Type A, Type A–Option 1, Type B, and Type B–Option 1, respectively. Figure 6f shows Type B–Option 2 has enough space even in the smallest size. Figure 7e shows virtual tracks of an electric wheelchair in Type B–Option 2. Therefore, Type B–Option 2 is able to be used by electric wheelchair users. Then, the research team examined answers of the questionnaires by participants A and B. They evaluated that the four designs, other than Type A–Option 1, were appropriate from the viewpoint of the usability. The design of the passage of embarking–disembarking having a corner was evaluated less appropriate.
Finally, the research team confirmed the usability thorough the interviews to both the disabled persons and the caretaker. Type A, Type B, and Type B–Option 1 and Option 2 were evaluated as appropriate compact barrier-free lavatories for small passenger ships by the participants including the caretaker.
(a) (b) (c)
(d) (e) (f)
FIGURE 6 Behaviors of participants and caretakers.

52 TR Circular E-C262: TRANSED 2018
(a) (b)
(c) (d) (e) FIGURE 7 Outline of tracks of wheelchair users in (a) Type A,
(b) Type A–Option 1, (c) Type B, (d) Type B–Option 1, and (e) Virtual tracks of electric wheelchair in Type B–Option 2.
As the research team had just two representative wheelchair users in our study and they
evaluated the usability subjectively, the research team had asked the Spinal Injuries Japan to confirm the result for generalization. The deputy representative of board members of the Spinal Injuries Japan examined the experiment results and the video data. After he reviewed the behaviors of the two wheelchair users and the caretaker, he verified the smallest sizes of the compact barrier-free lavatories and the usability of them. EXAMINATIONS ON FEASIBILITY Method The research team designed several general arrangements of small passenger ships with the compact barrier-free lavatories to examine the feasibility of installing the lavatories. In this paper, the research team explained the general arrangements installing Type B and Type B–Option 1 and Option 2, respectively.

Miyazaki, Takahashi, and Inoue 53
Result Figure 8a and 8b show general arrangements installing an ordinal lavatory and a full-size barrier-free lavatory, respectively. Figure 8c shows a general arrangement installing Type B. The capacities of Figure 8a–c are 50, 44, and 48 passengers, including two barrier-free seats, respectively.
Figure 9 shows a general arrangement installing Type B–Option 1. As the space in the lavatory is used as a passage at the time of embarking–disembarking for passengers, the space in the ship is used efficiently.
FIGURE 8 General arrangement installing Type B.
FIGURE 9 General arrangement installing Type B–Option 1.
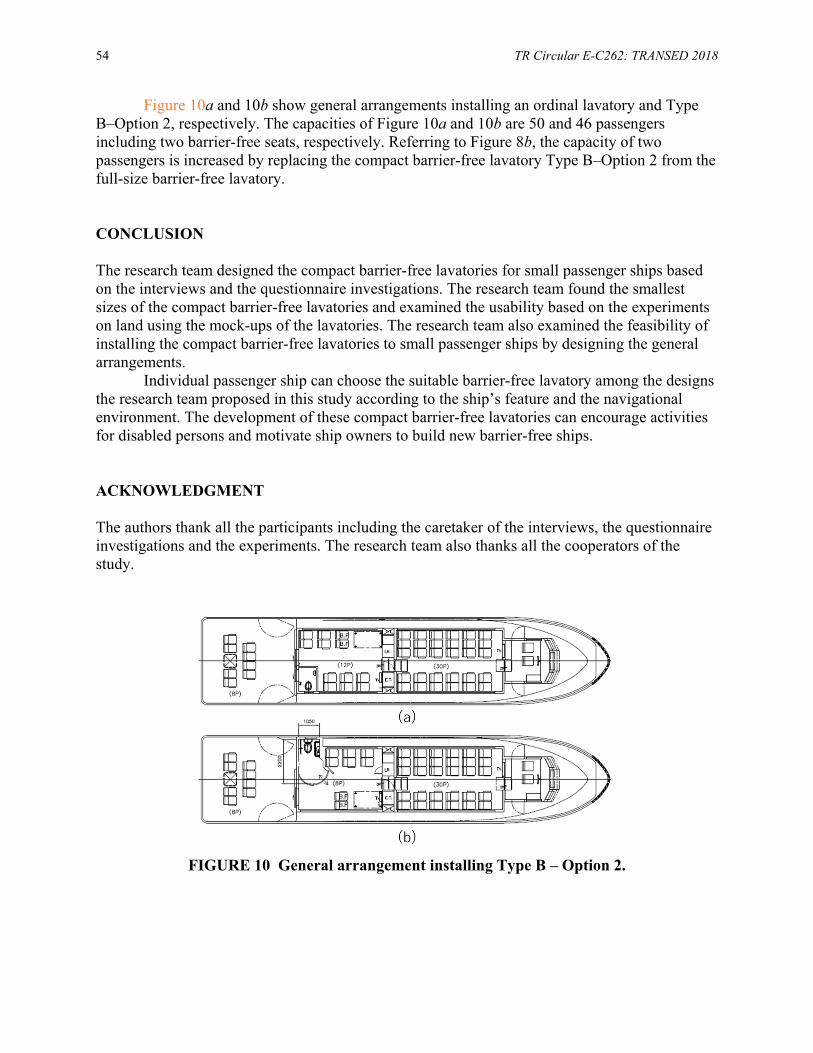
54 TR Circular E-C262: TRANSED 2018
Figure 10a and 10b show general arrangements installing an ordinal lavatory and Type B–Option 2, respectively. The capacities of Figure 10a and 10b are 50 and 46 passengers including two barrier-free seats, respectively. Referring to Figure 8b, the capacity of two passengers is increased by replacing the compact barrier-free lavatory Type B–Option 2 from the full-size barrier-free lavatory. CONCLUSION The research team designed the compact barrier-free lavatories for small passenger ships based on the interviews and the questionnaire investigations. The research team found the smallest sizes of the compact barrier-free lavatories and examined the usability based on the experiments on land using the mock-ups of the lavatories. The research team also examined the feasibility of installing the compact barrier-free lavatories to small passenger ships by designing the general arrangements.
Individual passenger ship can choose the suitable barrier-free lavatory among the designs the research team proposed in this study according to the ship’s feature and the navigational environment. The development of these compact barrier-free lavatories can encourage activities for disabled persons and motivate ship owners to build new barrier-free ships. ACKNOWLEDGMENT The authors thank all the participants including the caretaker of the interviews, the questionnaire investigations and the experiments. The research team also thanks all the cooperators of the study.
FIGURE 10 General arrangement installing Type B – Option 2.

Miyazaki, Takahashi, and Inoue 55
RESOURCES 1. Ministry of Land, Infrastructure, Transport, and Tourism, Technical Regulations of Japanese
Barrier-Free Law, 2008. http://www.mlit.go.jp/common/000234974.pdf. Accessed Sept. 18, 2018.
2. Ministry of Land, Infrastructure, Transport, and Tourism. Japanese Barrier-Free Guidelines for Passenger Ships, 2008. http://www.ecomo.or.jp/barrierfree/guideline/guideline_ship.html Accessed Sept. 18, 2018.
56
CONFERENCE PAPERS
The New Brabant-Net Trambus Line Meticulous Infrastructure and Street Design as a Leverage to
More Accessible City Transport to and from the Belgian Capital
PETER COSYN FREDERIK DAMS PHILIP STEPPE
BRIAN VAN ACKER TRACTEBEL
SEBASTIAAN LEENKNEGT
Ney & Partners
EDDY GIELIS JOOST SWINNEN
De Lijn
he public transport authority “De Lijn” appointed a consortium of Tractebel Engineering, Bureau Bas Smets, and Ney and Partners to develop new public transport corridors to
improve the access to Brussels. An innovative trambus concept was chosen because of its flexibility, and cost-efficiency and aptness to operate in an urban context.
This aptness was of an extreme importance in the first corridor design that was developed linking the city center with the airport: the corridor uses existing streets with an important amount of car and bicycle traffic on a limited space. The driving flexibility of the trambus made it possible to keep on combining all these modes by a keen reorganization of the infrastructure use. The project created additional leverages for accessibility in the area. An important step was the design of a new access platform using several new well-designed standard elements leading to minimal use of space with high versatility and comfort for all users. Conceptual standardization accommodates better for users with mental disorders, facilitates the visual impaired and reduces building costs giving opportunities for prefabrication.
The design process of the platform had even impact on the organization of the access of blind and wheelchair passengers on the new rolling stock. Due to this smaller existing and larger new rolling stock will both be able to dock at the new platforms. INTRODUCTION The Brabant-net project will create three new public transport lines in the northern edge of Brussels: a high-speed tram from Willebroek to Brussels, the “ring” trambus from Brussels Airport via Vilvoorde to the Heysel and Jette and an airport tram from SNCB Brussels North Station to Brussels Airport. The new public transport axes of Brabant-net focus on smart mobility. The project responds to current and future traffic demands by eliminating missing links
T

Cosyn, Dams, Steppe, Van Acker, Leenknegt, Gielis, and Swinne 57
in the rail and bus network. Estimates predict 30,000 new users of public transport per day. Planning such transport corridors has a large impact on the surrounding city and the urban fabric.
The design started with a meticulous analysis of the problem, the related ambitions and requirements, the existing situation, and the development of a strong conceptual framework. It resulted in an urban design based on three perspectives: context, the transport corridor as an object, and locality. Combining these elements guaranteed an integrated approach. The three perspectives were developed in parallel but with strong mutual interaction. The design process aimed for a qualitative integration of the transport corridor in the existing context. Opportunities for local added value due to the project are searched. The public transport project will be a leverage for improvement of cross-links between different modes. It will create local opportunities to restore and improve slow traffic links. It will trigger urban development opportunities and finally it will improve accessibility of the city and its public transport.
The subproject ring trambus will be executed first. This line crosses the municipalities of Grimbergen, Vilvoorde, Machelen, and Zaventem and is indicated in red on the map in Figure 1. Although this system first intended to be a tramway, there was chosen for an innovative trambus concept. This trambus concept combines the transportation capacity of a streetcar and the versatility of a bus, using a multiarticulated vehicle with low-floor access platforms and multiple wide doors driving on rubber tyres. As it needs no rails nor overhead lines, the concept reduces costs and has more versatility and aptness to an existing urban context.
This aptness was of an extreme importance: the corridor uses existing streets with an important amount of car and bicycle traffic on a limited space. The driving flexibility of the trambus made it possible to keep on combining all these modes by a keen reorganization of the infrastructure use. Where possible dedicated bus lanes were created in order to minimize hindrance by other traffic modes.
This trambus project triggers a large-scale city renovation project with impact on the complete urban fabric. In a lot of situations, the project requires a façade-to-façade refurbishment of existing streets and lanes. A strategic selection of locations for stops and/or by architectural integration of specific (tram) bus lane elements creates added value to the city and its public space. Local urban fabric values can be revitalized and upgraded.
INFRASTRUCTURE
Two types of stops were developed. The standard stop is described as “an urban stop.” These urban stops (Figure 2) are designed with a modest, reserved attitude towards the existing context. The design uses the existing urban floor.
Infrastructural elements such as platform kerbs and the shelter infrastructure are used as a recurring element along the tram line. They increase recognisability and readability of the system. This factor makes transport infrastructure more accessible and usable for people with cognitive problems.
Certain locations, have or have potential for a public space with a strong identity. The introduction of a well-equipped stop infrastructure can upgrade these spaces. At these locations we introduce an “urban roof:” a shelter infrastructure with a strong and distinct identity creating a new context, with an architecture based on a strong relationship between the stop and the directly surrounding public space (Figure 3).
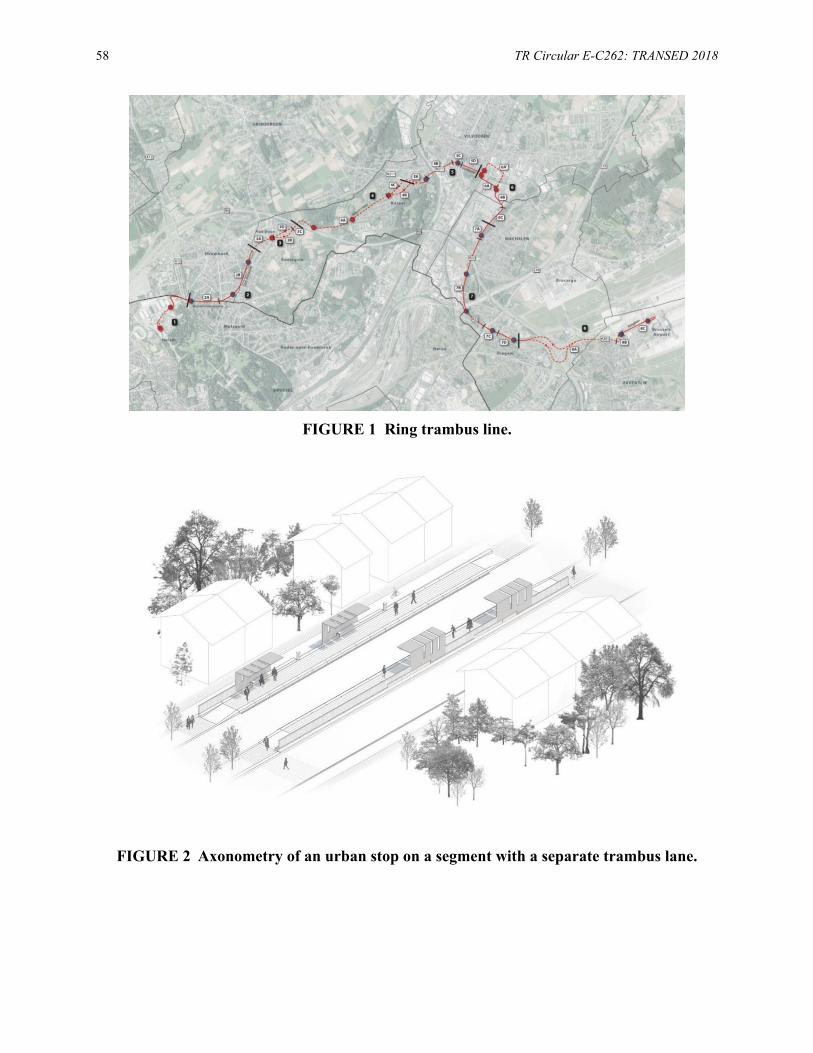
58 TR Circular E-C262: TRANSED 2018
FIGURE 1 Ring trambus line.
FIGURE 2 Axonometry of an urban stop on a segment with a separate trambus lane.
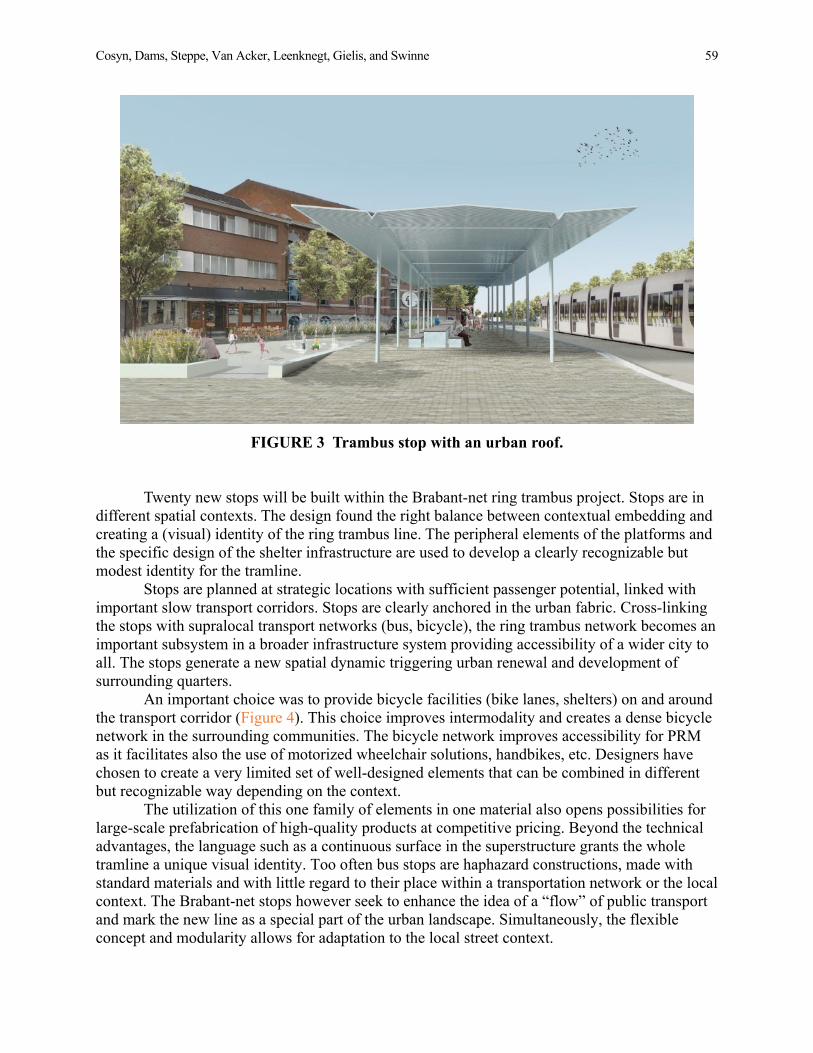
Cosyn, Dams, Steppe, Van Acker, Leenknegt, Gielis, and Swinne 59
FIGURE 3 Trambus stop with an urban roof.
Twenty new stops will be built within the Brabant-net ring trambus project. Stops are in different spatial contexts. The design found the right balance between contextual embedding and creating a (visual) identity of the ring trambus line. The peripheral elements of the platforms and the specific design of the shelter infrastructure are used to develop a clearly recognizable but modest identity for the tramline.
Stops are planned at strategic locations with sufficient passenger potential, linked with important slow transport corridors. Stops are clearly anchored in the urban fabric. Cross-linking the stops with supralocal transport networks (bus, bicycle), the ring trambus network becomes an important subsystem in a broader infrastructure system providing accessibility of a wider city to all. The stops generate a new spatial dynamic triggering urban renewal and development of surrounding quarters.
An important choice was to provide bicycle facilities (bike lanes, shelters) on and around the transport corridor (Figure 4). This choice improves intermodality and creates a dense bicycle network in the surrounding communities. The bicycle network improves accessibility for PRM as it facilitates also the use of motorized wheelchair solutions, handbikes, etc. Designers have chosen to create a very limited set of well-designed elements that can be combined in different but recognizable way depending on the context.
The utilization of this one family of elements in one material also opens possibilities for large-scale prefabrication of high-quality products at competitive pricing. Beyond the technical advantages, the language such as a continuous surface in the superstructure grants the whole tramline a unique visual identity. Too often bus stops are haphazard constructions, made with standard materials and with little regard to their place within a transportation network or the local context. The Brabant-net stops however seek to enhance the idea of a “flow” of public transport and mark the new line as a special part of the urban landscape. Simultaneously, the flexible concept and modularity allows for adaptation to the local street context.
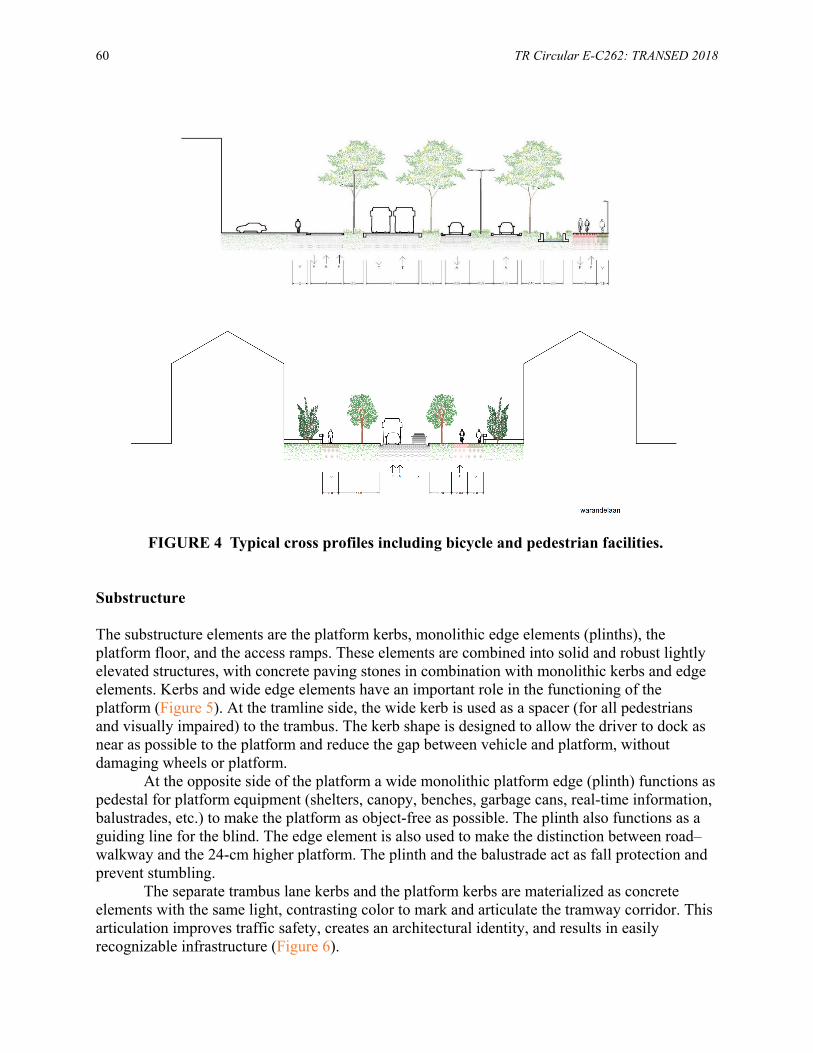
60 TR Circular E-C262: TRANSED 2018
FIGURE 4 Typical cross profiles including bicycle and pedestrian facilities.
Substructure
The substructure elements are the platform kerbs, monolithic edge elements (plinths), the platform floor, and the access ramps. These elements are combined into solid and robust lightly elevated structures, with concrete paving stones in combination with monolithic kerbs and edge elements. Kerbs and wide edge elements have an important role in the functioning of the platform (Figure 5). At the tramline side, the wide kerb is used as a spacer (for all pedestrians and visually impaired) to the trambus. The kerb shape is designed to allow the driver to dock as near as possible to the platform and reduce the gap between vehicle and platform, without damaging wheels or platform.
At the opposite side of the platform a wide monolithic platform edge (plinth) functions as pedestal for platform equipment (shelters, canopy, benches, garbage cans, real-time information, balustrades, etc.) to make the platform as object-free as possible. The plinth also functions as a guiding line for the blind. The edge element is also used to make the distinction between road–walkway and the 24-cm higher platform. The plinth and the balustrade act as fall protection and prevent stumbling.
The separate trambus lane kerbs and the platform kerbs are materialized as concrete elements with the same light, contrasting color to mark and articulate the tramway corridor. This articulation improves traffic safety, creates an architectural identity, and results in easily recognizable infrastructure (Figure 6).
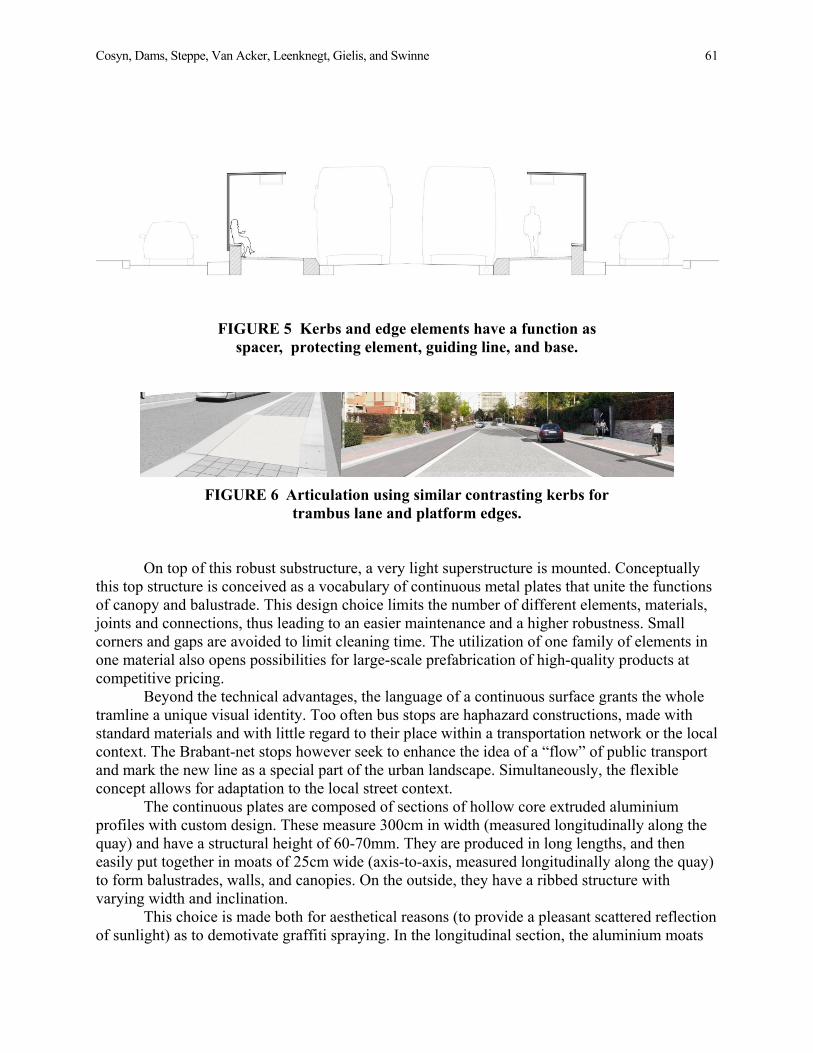
Cosyn, Dams, Steppe, Van Acker, Leenknegt, Gielis, and Swinne 61
FIGURE 5 Kerbs and edge elements have a function as spacer, protecting element, guiding line, and base.
FIGURE 6 Articulation using similar contrasting kerbs for trambus lane and platform edges.
On top of this robust substructure, a very light superstructure is mounted. Conceptually this top structure is conceived as a vocabulary of continuous metal plates that unite the functions of canopy and balustrade. This design choice limits the number of different elements, materials, joints and connections, thus leading to an easier maintenance and a higher robustness. Small corners and gaps are avoided to limit cleaning time. The utilization of one family of elements in one material also opens possibilities for large-scale prefabrication of high-quality products at competitive pricing.
Beyond the technical advantages, the language of a continuous surface grants the whole tramline a unique visual identity. Too often bus stops are haphazard constructions, made with standard materials and with little regard to their place within a transportation network or the local context. The Brabant-net stops however seek to enhance the idea of a “flow” of public transport and mark the new line as a special part of the urban landscape. Simultaneously, the flexible concept allows for adaptation to the local street context.
The continuous plates are composed of sections of hollow core extruded aluminium profiles with custom design. These measure 300cm in width (measured longitudinally along the quay) and have a structural height of 60-70mm. They are produced in long lengths, and then easily put together in moats of 25cm wide (axis-to-axis, measured longitudinally along the quay) to form balustrades, walls, and canopies. On the outside, they have a ribbed structure with varying width and inclination.
This choice is made both for aesthetical reasons (to provide a pleasant scattered reflection of sunlight) as to demotivate graffiti spraying. In the longitudinal section, the aluminium moats

62 TR Circular E-C262: TRANSED 2018
are not bolted but rather clicked together using built-in snap-fit joints. In the transversal section, the corner details are internally reinforced with epoxy-glued stainless-steel profiles. Small, secondary aluminium profiles are produced to close top and side edges. There is no secondary structure to support the aluminium panels; they are fully self-supporting (Figure 7 and Figure 8).
The balustrades and canopies are structurally connected to the prefab concrete base elements through the previously mentioned stainless-steel profiles. This is done via the back-side of the base rather than the top to allow for maximum use of the platform width for accessibility, and to avoid the connection detail. The prefab concrete elements thus serve as foundation for the top structure of the stops. The combination of the hollow core together with the machinability of aluminium allows for complete integration of lighting, water evacuation, electrical wiring, and glass edge detailing. There are no visible screws, bolts, or joints. This further reduces the risk of vandalism.
The LED lighting is integrated at the far edge of the canopy as a longitudinal line, filtered through the semi-cut pattern of ribs. The water gutter is a small rib-free zone in the corner detail. Small round holes lead the water into dedicated hollow parts of the vertical profiles, finally releasing it onto the street at the bottom of the canopy. The electrical wiring for the photovoltaic panels on the rooftop is equally inserted into dedicated hollow parts. The balustrade is cut in vertical stripes, making it semi-transparent.
The concept is completely modular; different types of stops can be made to suit different needs along the public transportation line. Potentially the system could be deployed on an even
FIGURE 7 Typical aluminium profile.
Balustrade + pedestal Shelter + pedestal Balustrade FIGURE 8 Modularity.

Cosyn, Dams, Steppe, Van Acker, Leenknegt, Gielis, and Swinne 63
wider scale in Flanders for trambus stops or other elements in public space. Already within the scope of Brabant-net, the same system is reused for bicycle shed canopies. Beyond expansion, the system also offers the possibility of easy repair and replacement in case of vandalism or traffic incidents. This possibility is inscribed within the tender procedure, with a separate subcontract for long-term maintenance supply. In this way, the design not only offers an immediate solution but also a long-term guarantee for fully accessible trambus stops.
Accessibility Features
De Lijn Accessibility Policy Plan
De Lijn constantly strives to improve the service without requiring separate treatment for certain passengers. The accessibility policy plan sets out the guidelines for the easy, safe and comfortable use of public transport. The main points for attention are
• A clear role for public transport and for adapted transport;• More accessible vehicles and stops;• Clear travel and accessibility information;• Evaluation of the reservation requirement for wheelchair users;• Customer friendly reception for people with an impairment; and• Consultation with accessibility stakeholders.
As a result, De Lijn did a lot of effort in creating accessible bus stops. In many cases the effects are limited as the mobility chain is discontinuous due to the lack of accessible walkways leading to the stops. In this project optimization of slow transport networks created a more continuous mobility chain. Currently, a More Mobile Line pilot project and innovative projects such as OV-buddies and BlueAssist are in progress. The More Mobile Line Pilot is set up to abolish the current reservation requirement for wheelchair users. Customers can download an app to see the next stops of their trip or be notified when they must get off. Real-time information on arrival is provided at major stops. The trams and buses are equipped with spoken and written stop announcements.
Project Features
As the design was based on functions and not on the rules and metrics in design standards, solutions are generally giving more comfort than the standards that in many cases lead to a technical minimum. Using universal design principles platforms provide comfort to all by providing features that make them more usable for specific groups.
Conceptual standardization accommodates better for users with mental disorders, facilitates the visual impaired and reduces building costs giving opportunities for prefabrication. The platforms design guarantees a smooth flow of users entering or leaving buses. Columns of canopies and other objects (seats, garbage bins, etc.) are bundled in one compact zone. The use of aluminium panels reduces structure thickness, resulting in more free space on the platform. The accessibility to the stop-platforms for wheelchair users, trolleys, strollers is ensured by providing inclined surfaces. For this slope a monolithic (but sufficiently rough) material for driving comfort is chosen. Longitudinal slope of access ramps is better than standard Belgian
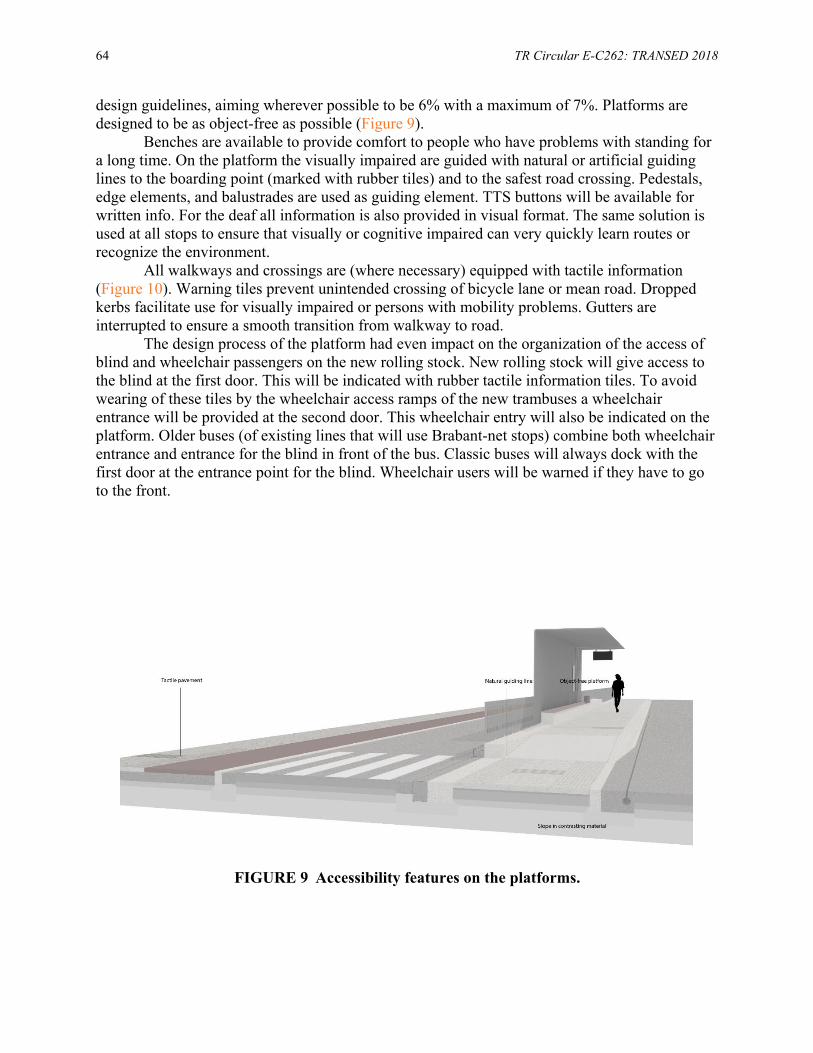
64 TR Circular E-C262: TRANSED 2018
design guidelines, aiming wherever possible to be 6% with a maximum of 7%. Platforms are designed to be as object-free as possible (Figure 9).
Benches are available to provide comfort to people who have problems with standing for a long time. On the platform the visually impaired are guided with natural or artificial guiding lines to the boarding point (marked with rubber tiles) and to the safest road crossing. Pedestals, edge elements, and balustrades are used as guiding element. TTS buttons will be available for written info. For the deaf all information is also provided in visual format. The same solution is used at all stops to ensure that visually or cognitive impaired can very quickly learn routes or recognize the environment.
All walkways and crossings are (where necessary) equipped with tactile information (Figure 10). Warning tiles prevent unintended crossing of bicycle lane or mean road. Dropped kerbs facilitate use for visually impaired or persons with mobility problems. Gutters are interrupted to ensure a smooth transition from walkway to road.
The design process of the platform had even impact on the organization of the access of blind and wheelchair passengers on the new rolling stock. New rolling stock will give access to the blind at the first door. This will be indicated with rubber tactile information tiles. To avoid wearing of these tiles by the wheelchair access ramps of the new trambuses a wheelchair entrance will be provided at the second door. This wheelchair entry will also be indicated on the platform. Older buses (of existing lines that will use Brabant-net stops) combine both wheelchair entrance and entrance for the blind in front of the bus. Classic buses will always dock with the first door at the entrance point for the blind. Wheelchair users will be warned if they have to go to the front.
FIGURE 9 Accessibility features on the platforms.
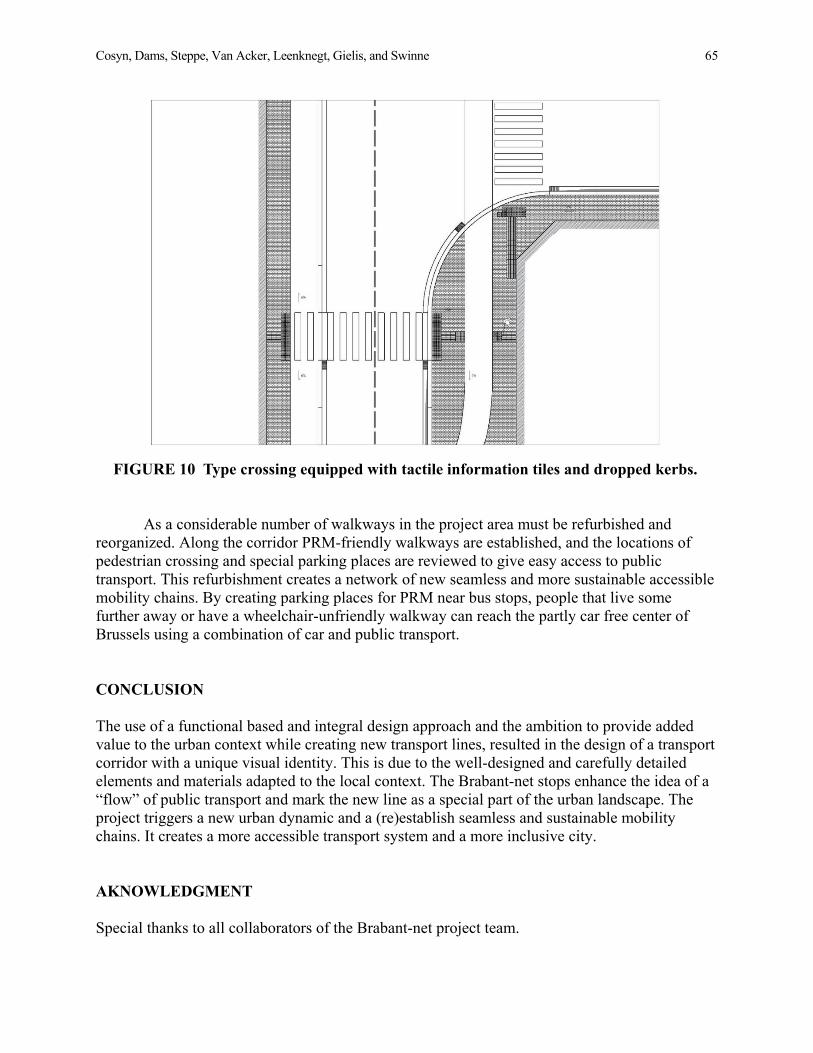
Cosyn, Dams, Steppe, Van Acker, Leenknegt, Gielis, and Swinne 65
FIGURE 10 Type crossing equipped with tactile information tiles and dropped kerbs.
As a considerable number of walkways in the project area must be refurbished and reorganized. Along the corridor PRM-friendly walkways are established, and the locations of pedestrian crossing and special parking places are reviewed to give easy access to public transport. This refurbishment creates a network of new seamless and more sustainable accessible mobility chains. By creating parking places for PRM near bus stops, people that live some further away or have a wheelchair-unfriendly walkway can reach the partly car free center of Brussels using a combination of car and public transport.
CONCLUSION
The use of a functional based and integral design approach and the ambition to provide added value to the urban context while creating new transport lines, resulted in the design of a transport corridor with a unique visual identity. This is due to the well-designed and carefully detailed elements and materials adapted to the local context. The Brabant-net stops enhance the idea of a “flow” of public transport and mark the new line as a special part of the urban landscape. The project triggers a new urban dynamic and a (re)establish seamless and sustainable mobility chains. It creates a more accessible transport system and a more inclusive city.
AKNOWLEDGMENT
Special thanks to all collaborators of the Brabant-net project team.

66
CONFERENCE PAPERS
Improving Accessibility for People with Mental Health Conditions
ROGER L. MACKETT Centre for Transport Studies University College London
he purpose of this paper is to discuss some of the issues that people with a mental health condition face when traveling. After discussing the nature of mental health conditions, some
results from a survey carried out by the author of 385 people with a mental health condition are presented. It is shown that 90% of the respondents have anxieties when traveling, and 68% have depression. The paper then discusses the causes of anxiety. These are associated with interactions with other people encountered when traveling, both staff and fellow travelers, wayfinding, including getting lost, finding toilets, using ticket machines, handling money and feelings of not being in control and not being able to obtain help. The complexity of some of situations caused by anxiety are illustrated by some examples. Ways of ameliorating the effects of some of these issues are discussed, including staff training, use of mobile phones, better signposting, and smart ticketing. INTRODUCTION In England, 26% of all adults report having been diagnosed with at least one mental illness, while a further 18% say that they have experienced a mental illness without being diagnosed (1). More women than men report having been diagnosed with a mental illness. The prevalence is highest between the ages of 27 and 74, peaking in the 55–64 age group. Mental health conditions (2) include:
• Agoraphobia, which is a fear of being in situations where escape might be difficult, or
help would not be available if things go wrong. • Anxiety, which is a feeling of unease such as worry or fear. It can have a
psychological impact, which can include lack of concentration and loss of self-confidence. • Bipolar disorder, formerly known as manic depression, is a condition that affects
moods, which can swing from one extreme to another. • Depression has psychological symptoms including finding it difficult to make
decisions and loss of self-confidence and self-esteem. • Obsessive-compulsive disorder (OCD) is a mental health condition where a person
has obsessive thoughts and compulsive behaviors. • Post-traumatic stress disorder (PTSD) is an anxiety disorder caused by very stressful,
frightening, or distressing events. • Psychosis is a mental health problem that causes people to perceive or interpret things
differently from those around them. • Schizophrenia is a long-term mental health condition that causes a range of different
psychological symptoms, including muddled thoughts based on hallucinations or delusions and changes in behavior.
T
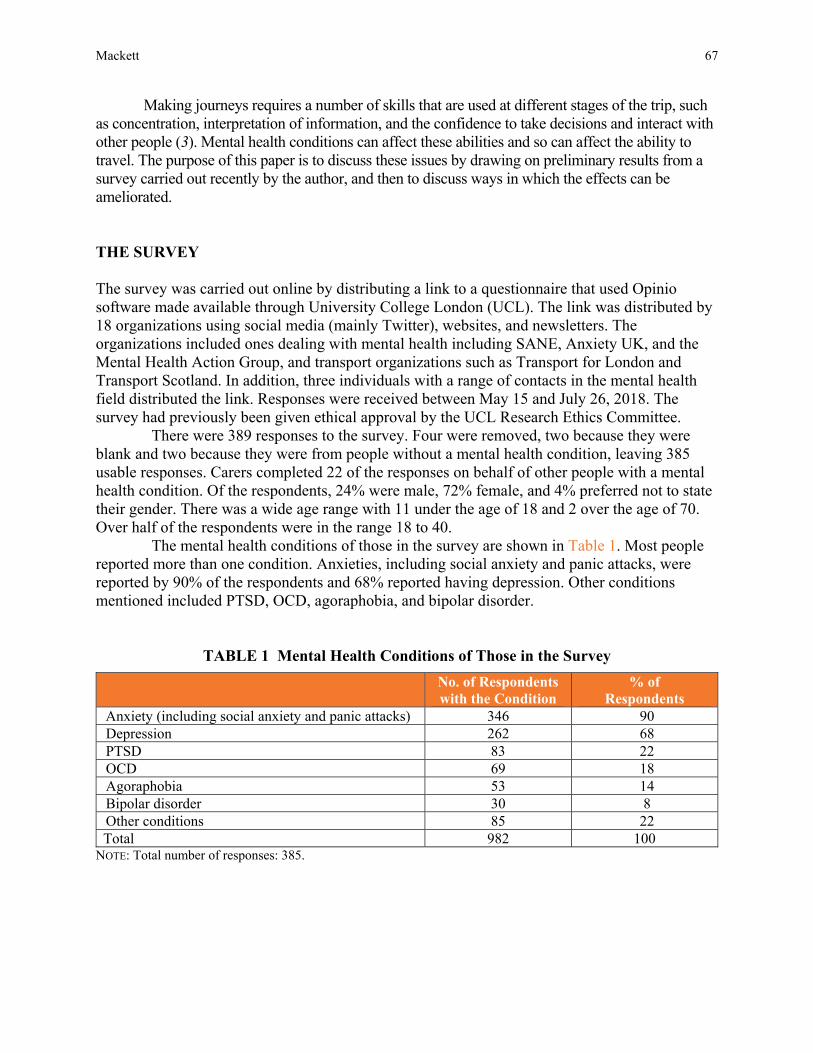
Mackett 67
Making journeys requires a number of skills that are used at different stages of the trip, such as concentration, interpretation of information, and the confidence to take decisions and interact with other people (3). Mental health conditions can affect these abilities and so can affect the ability to travel. The purpose of this paper is to discuss these issues by drawing on preliminary results from a survey carried out recently by the author, and then to discuss ways in which the effects can be ameliorated. THE SURVEY The survey was carried out online by distributing a link to a questionnaire that used Opinio software made available through University College London (UCL). The link was distributed by 18 organizations using social media (mainly Twitter), websites, and newsletters. The organizations included ones dealing with mental health including SANE, Anxiety UK, and the Mental Health Action Group, and transport organizations such as Transport for London and Transport Scotland. In addition, three individuals with a range of contacts in the mental health field distributed the link. Responses were received between May 15 and July 26, 2018. The survey had previously been given ethical approval by the UCL Research Ethics Committee.
There were 389 responses to the survey. Four were removed, two because they were blank and two because they were from people without a mental health condition, leaving 385 usable responses. Carers completed 22 of the responses on behalf of other people with a mental health condition. Of the respondents, 24% were male, 72% female, and 4% preferred not to state their gender. There was a wide age range with 11 under the age of 18 and 2 over the age of 70. Over half of the respondents were in the range 18 to 40.
The mental health conditions of those in the survey are shown in Table 1. Most people reported more than one condition. Anxieties, including social anxiety and panic attacks, were reported by 90% of the respondents and 68% reported having depression. Other conditions mentioned included PTSD, OCD, agoraphobia, and bipolar disorder.
TABLE 1 Mental Health Conditions of Those in the Survey No. of Respondents
with the Condition % of
Respondents Anxiety (including social anxiety and panic attacks) 346 90 Depression 262 68 PTSD 83 22 OCD 69 18 Agoraphobia 53 14 Bipolar disorder 30 8 Other conditions 85 22 Total 982 100
NOTE: Total number of responses: 385.

68 TR Circular E-C262: TRANSED 2018
Since 90% of the respondents have anxiety, the rest of this paper will focus on its effect on travel. The respondents were given a list of possible causes of anxiety while traveling, based on evidence in the literature and were free to indicate as many as they wished (3). The causes of anxiety when going out that were reported in the survey by the respondents are shown in Table 2.
The top reason given was “What other people think about me,” cited by 69% of the respondents, followed by “Feeling out of control” and “Having to mix with strangers,” both mentioned by 67%. Other factors cited by more than half of the respondents were “Feeling claustrophobic and unable to escape” and “How other people behave.” It is clear from Table 2 that many factors cause anxiety while traveling.
The respondents were invited to give examples of how anxiety affected their journeys. Sometimes the effects can be long term. For example, a man aged 41–50 said:
I was on a train, traveling to London …. I became so anxious that I just got off at the next stop and had no idea where I was at all. It took me over an hour to regain any sort of calm and control. I then had to get back on the train to be able to go home again. I have never been able to use public transport again since. That was 20+ years ago.
The reasons cited can be grouped under themes, for example:
• Interacting with other people: – What other people think about me. – Having to mix with strangers. – How other people behave. – Having to talk to staff such as bus drivers.
TABLE 2 Causes of Anxieties That the Respondents Have When They Go Out Number of Respondents Reporting
Each Cause of Anxiety Respondents What other people think about me 261 69% Feeling out of control 257 67% Having to mix with strangers 254 67% Feeling claustrophobic and unable to escape 221 58% How other people behave 197 52% Feeling disoriented 181 48% Failure of the bus, train, or car 180 47% Having to talk to staff such as bus drivers 175 46% Finding suitable toilet facilities 154 40% Getting lost 149 39% Having to take decisions about where to go 141 37% Not being able to obtain help 132 35% Remembering where I am going to 76 20% Using ticket machines 70 18% Handling money 53 14% Something else 55 14% Total 2556 99%
NOTE: Total number of responses: 381.
Mackett 69
• Factors associated with wayfinding: – Remembering where I am going to. – Having to take decisions about where to go. – Feeling disoriented. – Getting lost.
• Factors influenced by the actions of travel operators: – Failure of the bus, train, or car. – Finding suitable toilet facilities. – Using ticket machines. – Handling money.
• Factors stemming from their mental health condition: – Feeling out of control. – Feeling claustrophobic and unable to escape. – Not being able to obtain help.
It should be noted that some of these are combinations of factors: “Feeling disoriented”
and “Not being able to find help” may be combinations of an effect of the person’s mental health condition and of wayfinding; “handling money” may be to do with interacting with other people or to do with the way the transport operator requires travelers to handle money.
Interacting with other people is a major issue, for example through overcrowding:
Train became severely overcrowded at Clapham Junction. Caused a massive panic attack. I was crying, sweating, shaking etc. Someone kindly offered me a seat when my legs buckled. Someone else gave me a bottle of water. [Female aged 41–50].
And
I was in a station and the noise and crowds made me feel very anxious and disoriented—I felt like I was trapped and couldn’t see away out—I ended up crouching on the floor and crying. [Male aged 41–50].
Strangers can be helpful:
I've had panic attacks when traveling which leave me exhausted, embarrassed and confused. I've needed to rely on the help of strangers to help me and get me home. [Female aged 31–40].
However, they can also take advantage of a fellow traveler:
I have offered people money to give up their seat for me. Last time it cost me £30. [Female aged 41–50]. Sometimes people suffering from anxiety feel the need to conceal their difficulties:
Severe panic attack on Motorway. Had to pull over and pretend the car was faulty. [Male aged 51–60]. Bus journeys can also be challenging:

70 TR Circular E-C262: TRANSED 2018
I have experienced severe anxiety, when traveling on a bus. I believe I had a panic attack. The panic attack was so bad that I had to get off the bus to get some fresh air, so I could calm down. [Male aged 41–50].
MAKING TRAVEL BY PEOPLE WITH A MENTAL HEALTH CONDITION EASIER There are various ways in which some of the issues arising from the anxieties that affect people with a mental health condition when traveling can be ameliorated. For example, one of the main areas of concern is the need to interact with other people when traveling, both fellow travelers and staff such as bus drivers and ticket office staff. One of the main ways to improve communication between staff and people with mental health conditions is by providing suitable training for staff. Some schemes in Great Britain include training about assisting people with mental impairments (4). This can include awareness of hidden disabilities, training in how to talk to people with mental health issues and cognitive impairments, awareness and understanding of their needs and ways of presenting information in appropriate ways.
A second way to improve communication between passengers and staff is the use of Travel (or Journey) Assistance (or Support) Cards which travelers can show to staff to indicate their disability or particular needs. Some cards have a pre-printed message such as “I have a hidden disability” while others have a blank space for the user to write in his or her specific message to the bus driver. This enables the traveler to communicate with a bus driver without needing to speak, enabling them to explain briefly and discretely the nature of their health condition.
It is more difficult to improve the nature of interactions with fellow travelers. The issue of the attitudes and behavior of the public is much wider than the transport field, but traveling is an area where strangers need to mix together and sometimes need to co-operate so there needs to be tolerance of people whose behavior seems to be unusual. One issue is the behavior of other people such as playing loud music that can cause distress. One approach is to use publicity campaigns to increase the understanding of the public about hidden disabilities including mental health conditions, since there is evidence that people with mental impairments suffer from more discrimination and prejudice than people with physical and sensory impairments (5). They are also more likely to have been victims of hate crime.
An example of a successful scheme to help people with hidden disabilities using public transport is the “Please offer me a seat” badge introduced by Transport for London (6), which not only shows that the wearer of the badge would welcome being offered a seat, for example to avoid being in very close proximity to other travelers, but also sends out the message “I have a hidden disability and so would appreciate some understanding without having to explain why.”
A second set of factors that cause anxiety for people with mental health condition are those associated with wayfinding. Two aspects mentioned in Table 2 are “Remembering where they are going to” and “Having to take decisions about where to go.” Like other travelers, people with mental health conditions require clear information both on the internet and in paper form such as maps and timetables. People with specific needs such as avoiding overcrowding would find information tailored to their needs useful. When traveling there is a need for clear information both physical and virtual, for example, mobile phone apps. This is particularly important because nearly half the respondents said that feeling disoriented was an issue for them. Reducing street clutter, simplifying the urban landscape and providing clear and consistent signposting can all assist to reduce disorientation. On buses and trains, AVI (audio-visual information), for example, stating the final destination and the next stopping point, can provide
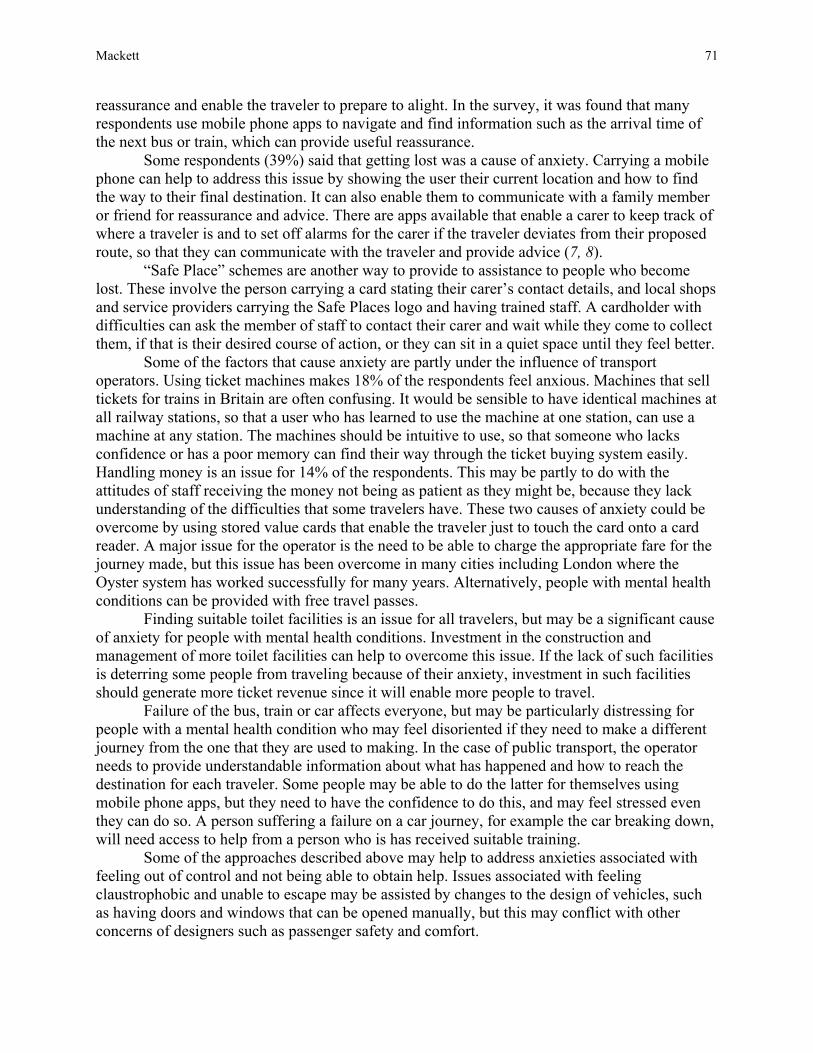
Mackett 71
reassurance and enable the traveler to prepare to alight. In the survey, it was found that many respondents use mobile phone apps to navigate and find information such as the arrival time of the next bus or train, which can provide useful reassurance.
Some respondents (39%) said that getting lost was a cause of anxiety. Carrying a mobile phone can help to address this issue by showing the user their current location and how to find the way to their final destination. It can also enable them to communicate with a family member or friend for reassurance and advice. There are apps available that enable a carer to keep track of where a traveler is and to set off alarms for the carer if the traveler deviates from their proposed route, so that they can communicate with the traveler and provide advice (7, 8).
“Safe Place” schemes are another way to provide to assistance to people who become lost. These involve the person carrying a card stating their carer’s contact details, and local shops and service providers carrying the Safe Places logo and having trained staff. A cardholder with difficulties can ask the member of staff to contact their carer and wait while they come to collect them, if that is their desired course of action, or they can sit in a quiet space until they feel better.
Some of the factors that cause anxiety are partly under the influence of transport operators. Using ticket machines makes 18% of the respondents feel anxious. Machines that sell tickets for trains in Britain are often confusing. It would be sensible to have identical machines at all railway stations, so that a user who has learned to use the machine at one station, can use a machine at any station. The machines should be intuitive to use, so that someone who lacks confidence or has a poor memory can find their way through the ticket buying system easily. Handling money is an issue for 14% of the respondents. This may be partly to do with the attitudes of staff receiving the money not being as patient as they might be, because they lack understanding of the difficulties that some travelers have. These two causes of anxiety could be overcome by using stored value cards that enable the traveler just to touch the card onto a card reader. A major issue for the operator is the need to be able to charge the appropriate fare for the journey made, but this issue has been overcome in many cities including London where the Oyster system has worked successfully for many years. Alternatively, people with mental health conditions can be provided with free travel passes.
Finding suitable toilet facilities is an issue for all travelers, but may be a significant cause of anxiety for people with mental health conditions. Investment in the construction and management of more toilet facilities can help to overcome this issue. If the lack of such facilities is deterring some people from traveling because of their anxiety, investment in such facilities should generate more ticket revenue since it will enable more people to travel.
Failure of the bus, train or car affects everyone, but may be particularly distressing for people with a mental health condition who may feel disoriented if they need to make a different journey from the one that they are used to making. In the case of public transport, the operator needs to provide understandable information about what has happened and how to reach the destination for each traveler. Some people may be able to do the latter for themselves using mobile phone apps, but they need to have the confidence to do this, and may feel stressed even they can do so. A person suffering a failure on a car journey, for example the car breaking down, will need access to help from a person who is has received suitable training.
Some of the approaches described above may help to address anxieties associated with feeling out of control and not being able to obtain help. Issues associated with feeling claustrophobic and unable to escape may be assisted by changes to the design of vehicles, such as having doors and windows that can be opened manually, but this may conflict with other concerns of designers such as passenger safety and comfort.
72 TR Circular E-C262: TRANSED 2018
Another approach to improving the confidence of travelers is through enhancing their travel skills through travel training and schemes to provide experience in traveling. Travel training provides tailored and practical help in traveling by public transport, on foot or by bicycle. The objective is to help people travel independently with confidence. The term “travel training” is used to refer to a range of comprehensive schemes or programmes and can take various forms. Travel training usually involves classroom exercises and journeys with a trainer on a one-to-one basis to provide experience and to give people with mental impairments and others the confidence to make unaccompanied journeys. There are also travel buddy schemes that offer one-to-one training, usually concentrating on practical aspects of making a journey. They are are usually aimed at people who are able to use public transport but who require extra short-term support, boosting their confidence and capability and enabling them to be independent. Another approach is to provide experience of using particular aspects of a journey such as traveling on a train or using a bus station by offering group tours so that people with particular concerns can gain experience and become more familiar with various aspects of traveling. CONCLUSIONS Many people in Britain have a mental health condition. This paper has examined the travel needs of people with mental health conditions, particularly those who suffer from anxiety when traveling. A survey carried out by the author has revealed how complex some of the issues faced by such people when traveling. Two of the main areas where they have difficulty is interacting with other people, both staff and fellow travelers, and wayfinding. There are also some issues associated with traveling such as dealing with ticket machines and handling money. Other issues include finding toilet facilities and failure of the train, bus or car.
The paper has shown that there are various ways in which some of these difficulties can be ameliorated, for example, staff can be given better understanding through effective training. It is more difficult to educate the public, but campaigns may be effective and there are schemes such as the “Please offer me a seat” which may encourage the public to be more empathetic. Anxieties about wayfinding may be partly addressed by providing clearer navigation information, both before and during the journey, both on paper and electronically. Mobile phone apps can be particularly useful for those able to use them because they can show the user where they are and routes to the destination. Some apps allow a carer to track where a traveler is and to indicate if they deviate from their planned route.
Addressing anxieties while traveling is about increasing the self-confidence of the traveler. This can be done directly by enhancing their travel skills through travel training and schemes to provide experience in traveling.
Overall, there are a number of ways in which the anxieties that some people with mental health conditions have when traveling can be ameliorated, but probably the more effective is to increase the understanding of staff and the public that many people need help and support while traveling even though the cause of those needs is not visible.
Mackett 73
REFERENCES 1. Bridges, S. Mental Health Problems. Health Survey for England 2014, Vol. 1, Health, Social Care
and Lifestyles, Health and Social Care Information Centre, 2015, Chapter 2. Available at http://content.digital.nhs.uk/catalogue/PUB19295/HSE2014-ch2-mh-prob.pdf. Accessed Sept. 26, 2018.
2. NHS Choices. Health A–Z. Available at https://www.nhs.uk/conditions/. Accessed Sept. 26, 2018. 3. Mackett, R. L. Building Confidence – Improving Travel for People with Mental Impairments. Report
produced for Disabled Persons Transport Advisory Committee, 2017. https://www.gov.uk/government/publications/exploring-the-barriers-to-travel-for-people-with-mental-impairments. Accessed Sept. 26, 2018.
4. Department for Transport. Summary of Responses to the Department for Transport’s Review of the Mandatory Disability Awareness Training Exemption Applied Under EU Regulation 181/2011 (Concerning Bus And Coach Passenger Rights), 2015. https://www.gov.uk/government/uploads/system/uploads/attachment_data/file/398693/summary-responses-2a.pdf. Accessed Sept. 26, 2018.
5. Department for Work and Pensions. Fulfilling Potential: Building a Deeper Understanding of Disability in the UK Today, 2013. https://www.gov.uk/government/publications/fulfilling-potential-understanding-disability. Accessed Sept. 26, 2018.
6. Transport for London. Please Offer Me a Seat: New Badge Created for Those Less Able to Stand. https://tfl.gov.uk/info-for/media/press-releases/2016/august/please-offer-me-a-seat---new-badge-created-for-those-less-able-to-stand. Accessed Sept. 26, 2018.
7. Barbeau, S. J., P. L. Winters, N. L. Georggi, M. A. Labrador, and R. Perez. Travel Assistance Device: Utilising Global Positioning System-Enabled Mobile Phones to Aid Transit Riders with Special Needs. ET Intelligent Transport Systems, Vol. 4, 2010, pp. 2–23. http://digital-library.theiet.org/content/journals/10.1049/iet-its.2009.0028. Accessed Sept. 26, 2018.
8. App&Town. Compagnon. http://www.appandtown.com/compagnon.html. Accessed Sept. 26, 2018.
74
CONFERENCE PAPERS
Improving Accessibility for Older People Is More Than a Right
ROGER L. MACKETT Centre for Transport Studies University College London
his paper commences by considering the right of older people to travel and then examines their contributions to society and how these can be valued, which shows that older people
make an economic contribution to society that exceeds the costs that they impose. The benefits of greater mobility for older people, both to themselves and to wider society, are then considered, followed by discussion of the influence of aging on mobility in terms of the types of journeys they make in terms of trip purpose and modal share. Having considered these issues, the paper examines ways of overcoming the barriers to access for older people so that they can travel more, and so enhancing their contribution to society while enjoying their right to travel. INTRODUCTION The United Nations CRPD contains two articles relevant to travel (1). Article 9 on Accessibility says that, in order for people with disabilities to live independently and participate fully in all aspects of life, states should take appropriate measures to ensure to persons with disabilities have access, on an equal basis with others, to the physical environment, to transportation, to information and communications, and to other facilities and services open or provided to the public, both in urban and in rural areas, including the identification and elimination of obstacles and barriers to accessibility. Article 20 of the Convention on Personal Mobility requires that states take effective measures to ensure personal mobility with the greatest possible independence for persons with disabilities.
These two articles make it clear that disabled people have a right to travel just as everyone else does. There is no equivalent Convention for older people although there is a UN International Day of Older People. The United Nations Economic Commission for Europe has called for the full integration and participation of older persons in society, including the needs of older people in using public transport and in promoting both labor market participation and life-long learning and education for older people, which implies ensuring that older people can travel to such (2).
Many older people are disabled and so will have their rights to accessibility and personal mobility covered by the UN CRPD. It seems clear that even without an explicit convention on the rights of older people, their ability to travel is a basic right. However, in addition to these human rights, there are many other good reasons why improving accessibility for older people is a good idea. The purpose of this paper is to explore these reasons, particularly economic ones.
T

Mackett 75
THE CONTRIBUTION OF OLDER PEOPLE TO SOCIETY All members of society, including older ones, have inherent value, for example, in terms of creativity and relationships. One aspect is their economic contribution to society. The value of this for people aged 65 and over in the U.K. has been estimated in a study commissioned by the WRVS (now the Royal Voluntary Service) (3). An economic model was constructed using a number of headings for people aged 65 and older. Table 1 shows the costs and the contributions. It can be seen that older people contribute more to society than they receive from it with a ratio of contributions to costs of 1.29 to 1. The assumptions underlying the figures shown in Table 1 have been examined and found to be reasonable (4). Much of the expenditure depends on the use of transport, for example enabling them to carry out much of their shopping, volunteering and employment. It has also been shown that improving accessibility for older people can increase their economic contribution to society (4). THE BENEFITS OF GREATER MOBILITY FOR OLDER PEOPLE In the previous section, it was argued that older people contribute significantly to the economy and that travel facilitates much of this. Greater mobility by older people would also provide benefits to older people, improving their quality of life. For example, Gabriel and Browning (5) interviewed 999 older people who said that being able to walk and being mobile enabled them to retain their independence, which was seen as an important element of a good quality of life and reduced their dependence on others. Choi et al. (6) surveyed 1926 elderly women in Britain over a period of 7 years. They found that regular physical activity, including walking and cycling, reduced the decline in health-related aspects of the quality of life.
A good example of a policy to increase mobility by older people in Britain is the concessionary travel pass scheme which allows free off-peak bus travel across the whole country of residence (England, Scotland or Wales) of the passholder. There have been a number of studies that have examined various aspects of the impact of the scheme (7, 8). Overall, it can be argued that the policy of offering concessionary bus travel to older people has achieved its TABLE 1 The Costs and Contributions of Older People in the UK in 2010 in £million (2007)
Costs £m Contributions £m Pensions 68,205 Expenditure including multiplier effects 75,944 Age-related welfare payments 23,127 Volunteering 10,594
Age-related health care
44,954 Childcare 2,730 Other non-tax contributions 41,588 Employment taxes 15,965 Taxes on expenditure 16,939 Other taxes 12,131
Total 136,286 Total 175,891 Net financial contribution to society 39,605 Ratio of contributions to costs 1.29:1
Source: (3)
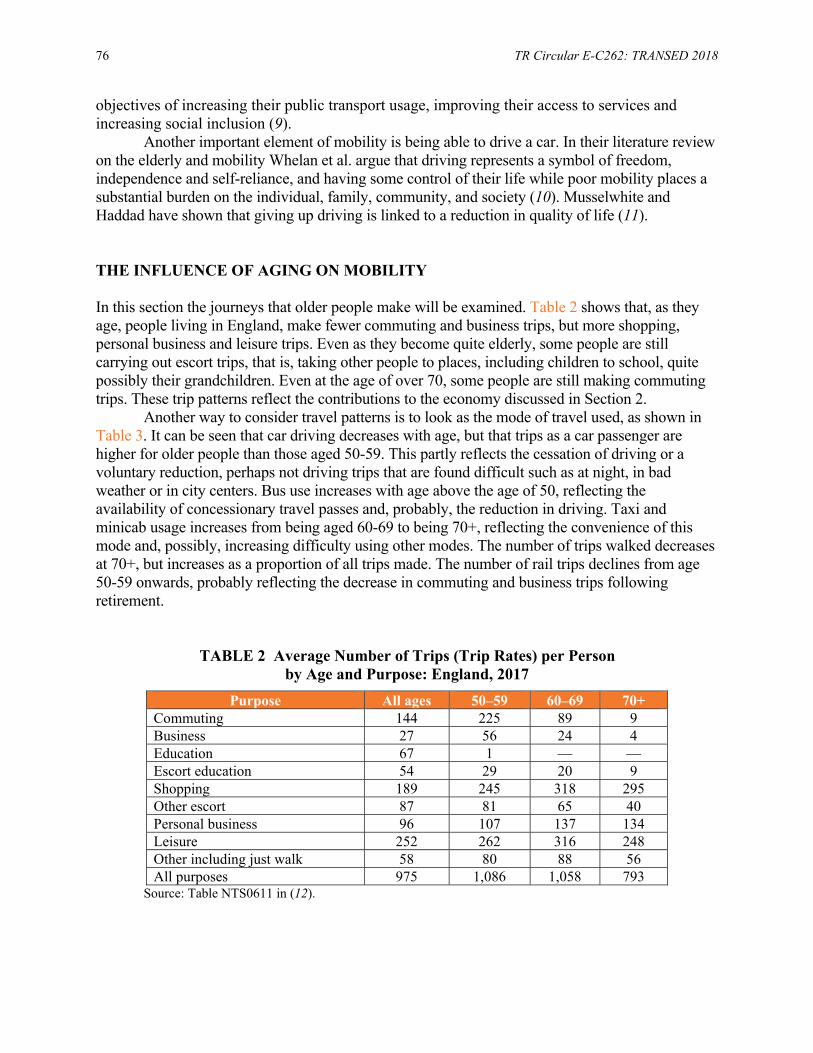
76 TR Circular E-C262: TRANSED 2018
objectives of increasing their public transport usage, improving their access to services and increasing social inclusion (9).
Another important element of mobility is being able to drive a car. In their literature review on the elderly and mobility Whelan et al. argue that driving represents a symbol of freedom, independence and self-reliance, and having some control of their life while poor mobility places a substantial burden on the individual, family, community, and society (10). Musselwhite and Haddad have shown that giving up driving is linked to a reduction in quality of life (11).
THE INFLUENCE OF AGING ON MOBILITY
In this section the journeys that older people make will be examined. Table 2 shows that, as they age, people living in England, make fewer commuting and business trips, but more shopping, personal business and leisure trips. Even as they become quite elderly, some people are still carrying out escort trips, that is, taking other people to places, including children to school, quite possibly their grandchildren. Even at the age of over 70, some people are still making commuting trips. These trip patterns reflect the contributions to the economy discussed in Section 2.
Another way to consider travel patterns is to look as the mode of travel used, as shown in Table 3. It can be seen that car driving decreases with age, but that trips as a car passenger are higher for older people than those aged 50-59. This partly reflects the cessation of driving or a voluntary reduction, perhaps not driving trips that are found difficult such as at night, in bad weather or in city centers. Bus use increases with age above the age of 50, reflecting the availability of concessionary travel passes and, probably, the reduction in driving. Taxi and minicab usage increases from being aged 60-69 to being 70+, reflecting the convenience of this mode and, possibly, increasing difficulty using other modes. The number of trips walked decreases at 70+, but increases as a proportion of all trips made. The number of rail trips declines from age 50-59 onwards, probably reflecting the decrease in commuting and business trips following retirement.
TABLE 2 Average Number of Trips (Trip Rates) per Person by Age and Purpose: England, 2017
Purpose All ages 50–59 60–69 70+ Commuting 144 225 89 9 Business 27 56 24 4 Education 67 1 — — Escort education 54 29 20 9 Shopping 189 245 318 295 Other escort 87 81 65 40 Personal business 96 107 137 134 Leisure 252 262 316 248 Other including just walk 58 80 88 56 All purposes 975 1,086 1,058 793
Source: Table NTS0611 in (12).

Mackett 77
TABLE 3 Average Number of Trips per Person by Age and Mode: England, 2017
Mode All Ages 50–59 60-69 70+ Walk 255 242 246 179 Bicycle 17 17 16 7 Car driver 390 617 526 350 Car passenger 204 122 170 159 Bus 55 38 64 67 Rail 31 31 18 8 Taxi 9 7 7 11 All modes 975 1,086 1,058 793
Source: Table NTS0601 in (12).
As people age, many of them have increasing mobility difficulties. The National Travel Survey in Great Britain (12) shows that this has an effect on trip making. Those with a mobility difficulty aged between 16 and 49 make about 79% of the number of trips that those with no mobility difficulties make whereas those aged 70+ with a mobility difficulty make only about 48% of the trips made by people of the same age with no difficulty.
It has been shown in this section that travel patterns change as people become older. This partly reflects changing lifestyles with fewer of them in employment and consequently more time available for other activities. It also reflects increasing mobility difficulties. This raises the question whether older people are being prevented from making trips that they wish to make.
Table 4 shows the type of activity that the 1,445 respondents aged 60 or over in a household survey stated that they would like to do more of and the types of barrier that prevent them from doing so. It can be seen that social activities are the most popular type activity of which they would like to do more, followed by shopping, with small percentages wanting more day center visits, trips to the Post Office and the chance to visit others in hospitals. These reflect the types of activities older people tend to travel to, as indicated in Table 2. This suggests that there are some older people who are prevented from reaching the types of activities in which others participate.
The barriers shown in Table 4 have been classified under three headings: direct transport–journey, mobility–sensory–health and non-transport. It should be acknowledged that the first two categories overlap: for example, if an elderly person has difficulty stepping on a high-floor vehicle that could be seen as a mobility barrier or a transport barrier since the vehicle is not appropriate for a person with that characteristic. Non-transport barriers are probably to do with the nature of the activity. It can be seen that transport barriers affect the three top answers of visiting and meeting friends and family. Most public transport systems tend to be radial, focusing on city and town centers, while the homes of family and friends are likely to be in the suburbs and other less accessible locations, which may be difficult to reach from the home of the older person. In other words, the transport barrier may be the lack of transport or a complex journey. Mobility and similar barriers affect more older people than the other barriers for shopping and Post Office journeys many of which would be in centers accessible by bus, suggesting that the difficulties lie in accessing buses. (The survey was carried out in 2000 before low-floor buses were so numerous). For leisure–sport and day center visits the barriers are not on the journey and so probably lie at the destination.

78 TR Circular E-C262: TRANSED 2018
TABLE 4 Barriers to Activities for Older People
Would Like to Do More
%
Principle Barrier Direct Transport–
Journey % Mobility–Sensory
–Health % Non-
Transport % Visit family 12 58 18 24 Visit friends’ homes 10 46 27 25 Meet friends elsewhere
10 46 21 33
Leisure–sport 8 15 24 57 Other shopping 7 37 43 21 Food shopping 6 33 50 16 Day center visit 2 25 30 45 Post Office 2 40 42 19 Visit others in hospital
1 65 23 13
Source: Table 5.3 in (13). Note: the figures in bold indicate the barrier which affects the highest proportion of older people for that trip purpose.
Because the internet has developed relatively recently, most older people will not have learned to use computers at school. Some of them will have used the internet in the course of their work and it is likely that many of them will have retained their knowledge. However, there will be others who did not use computers in the course of their work: some of these may have learned to use the internet in later life, but others will not have done so. Table 5 shows the use of internet and/or e-mail by people aged 52 and over. It can be seen that usage declines with age. Usage is higher for men than women, with a more rapid decline for women, so that at the age of 80+ fewer than 25% of women use the internet or e-mail compared with 46% of men.
Having a licence to drive a car gives the holder the freedom to travel by car. The National Travel Survey (12) shows that in England, the level of licence holding increases with age to middle age and then declines. For men there is a decline after the age of 59. For women there is a decline after the age of 49 reflecting the fact that in the past, fewer women than men chose to learn to drive. There is a steeper decline after the age of 70 for women than for men.
The data cited in this section have shown that some older people are less able to travel than younger people, for a number of reasons including increasing mobility difficulties, and because fewer of them can access the internet or drive a car. However, as shown above they would still like to travel. None of the factors discussed in this section mean that they should not be able to travel, just that it is more difficult. In the next section, ways in which it can be made easier for older people to travel are discussed.
TABLE 5 Use of Internet or E-Mail by Age and Sex in England, 2014–2015 52–54 55–59 60–64 65–69 70–74 75–79 80+ Total Men 94 92 90 81 71 53 46 80 Women 93 90 87 78 64 47 23 73
Source: Table S3a in (14).

Mackett 79
OVERCOMING THE BARRIERS TO ACCESS FOR OLDER PEOPLE In this section, the ways in which some of the barriers to travel for older people are being overcome in Great Britain will be considered (15). Overcoming the Barriers to Traveling by Bus As shown in Table 3, bus use increases with age. In Britain, much has been done to assist older people in Britain, All older people are entitled to free off-peak bus travel and all buses are low floor. A major issue is the attitudes of bus drivers: in the past training of bus drivers to show consideration to older and disabled travelers has been optional for operators in the past but it is now compulsory. However, a major issue in Britain is the reductions in the number of bus services, which is having a significant impact, particularly in rural areas, which is having a major impact on older people who can longer drive. Overcoming the Barriers to Traveling by Rail All rail vehicles must be fully accessible in Britain including displaying audio-visual information showing the destination and next stop by 2020. Guidance on making stations more accessible is available. Funding is being made available to improve the accessibility of some stations, often by putting in lifts up to footbridges to allow transfer between platforms. The Passenger Assist scheme offers free assistance from a member of staff on railway stations to all those who request it. Everybody in Britain aged 60 or over is entitled to purchase a Senior Railcard for £30 a year offering a saving of one-third on most rail tickets except in the morning peak in London and the surrounding area. Overcoming the Barriers to Walking The provision of facilities on the street is the responsibility of the local authority. A key requirement of many older people is seating and uncluttered streets. Guidance on the design of streets and of escalators and lifts is given in the Inclusive Mobility Guidelines (16), but the focus tends to be on detailed design rather than the quantity of facilities that should be provided in an area. Very elderly people require about 50% longer to cross the road than the general population, which means that, if the timings of pedestrian signal are based on the speed of walking of the general population, they will be inadequate for many older people (17). Overcoming the Barriers to Traveling by Car Deteriorating eyesight and reaction times may lead to some older people giving up driving or restricting their driving to certain locations or times of day. Others may be forced to cease driving because of conditions such as dementia that are associated with growing old. In Britain, the Blue Badge scheme provides parking facilities to those with severe mobility problems, including great difficulty in walking.

80 TR Circular E-C262: TRANSED 2018
Improving the Travel Experience of Older People There are various other ways in which the travel experience of older people can be improved. The provision of high-quality travel information in a coherent way is important for all travelers. There are some issues for older people because many of them cannot see or hear as well as younger people. Much information is provided online nowadays but, as shown in Table 5, many older people do not use the internet. Also, many choose to use simple mobile phones that cannot access apps to provide wayfinding information when on a journey. The availability of toilets is also important to many older people. Some older people have disabilities that are not visible. A scheme in Britain to make drivers aware of hidden disabilities is the Travel Support or Journey Assistance Card. These are cards issued by bus operators for passengers to show discretely to the bus driver to indicate the needs of specific passengers and contain messages such as “Please wait for me to sit down in case I fall” or “Please scan my pass for me.” Into the Future The advent of more autonomous vehicles, eventually resulting in driverless cars, should mean that fewer older people will lose the ability to travel independently by car because technology will compensate for the deterioration in perceptive faculties (sight, hearing, and so on). More older people would be encouraged to continue in employment if more flexible smart ticketing for public transport were introduced so that season tickets would allow for part-time work. In Britain, allowing older people to use their free bus passes to buy cheap rail tickets would let those who make insufficient rail trips to justify the cost of the present railcard obtain a discount, and so they would be encouraged make more rail trips. More generally, greater flexibility in ticketing systems would enable more older people to enjoy the lifestyles that have evolved in modern times with some people working part-time, others working voluntarily, spending time in leisure pursuits and providing assistance to their extended families. CONCLUSIONS This paper has shown that older people make valuable contributions to society and that increasing their mobility would enable them to contribute even more. They already make many trips, often for shopping and leisure, but also to work and in providing child care for grandchildren. They would like to travel more, particularly to visit friends and family, but there are barriers. Many of these result from the interaction of the characteristics of the older person and the nature of the transport system. Some older people have disabilities that make all traveling difficult. Others have difficulty traveling resulting from declining abilities that make walking far, standing for long periods, handling coins or understanding timetables difficult. None of this means that they should prevented from traveling in order to enjoy life or contribute further to society. By increasing understanding of the travel needs of older people and investing in suitable facilities and schemes, older people will not only be able to contribute even more to society economically and socially, they will also be able to enjoy their right to a good quality of life.

Mackett 81
REFERENCES 1. United Nations. United Nations Convention on the Rights of Persons with Disabilities. 2006.
www.un.org/disabilities/documents/convention/convention_accessible_pdf.pdf. Accessed Sept. 29, 2018.
2. United Nations Economic Commission for Europe. Integration and Participation of Older Persons in Society, 2009. https://www.unece.org/fileadmin/DAM/pau/_docs/age/2009/Policy_briefs/4-Policybrief_Participation_Eng.pdf. Accessed Sept. 29, 2018.
3. WRVS. Gold Age Pensioners: Valuing the Socio-Economic Contribution of Older People in the UK, 2011. http://www.royalvoluntaryservice.org.uk/our-impact/reports-and-reviews/gold-age-pensioners. Accessed Sept. 29, 2018.
4. Mackett, R. L. Improving Accessibility for Older People: Investing in a Valuable Asset, Journal of Transport and Health, Vol. 2, 2015, pp. 5–13.
5. Gabriel, Z., and A. Bowling. Quality of Life from the Perspectives of Older People, Ageing & Society, Vol. 24, 2004, pp. 675–691.
6. Choi, M., D. Prieto-Merino, C. Dale, E. Nüesch, A. Amuzu, A. Bowling, S. Ebrahim, and J. P. Casa. Effects of Changes in Moderate or Vigorous Physical Activity on Changes in Health-Related Quality of Life of Elderly British Women Over Seven Years, Qual Life Res, Vol. 22, 2013, pp. 2011–2020, http://www.ncbi.nlm.nih.gov/pubmed/23242939. Accessed Sept. 29, 2018.
7. Mackett, R. L. Impact of Concessionary Bus Travel on the Wellbeing of Older and Disabled People. Transportation Research Record: Journal of the Transportation Research Board, No. 2352, 2013, pp. 114–119. http://dx.doi.org/10.3141/2352-13.
8. Mackett, R. L. The Impacts of Concessionary Travel Passes for Older and Disabled People: A Review of the Evidence. Report produced as a contribution to the work of the CILT Concessionary Travel Group and the CILT Accessibility and Inclusion Forum, Chartered Institute of Logistics and Transport, 2014. www.bit.ly/concessionary. Accessed Sept. 29, 2018.
9. Mackett, R. L. Has the Policy of Concessionary Bus Travel for Older People in Britain Been Successful? Case Studies in Transport Policy, Vol. 2, 2014, pp.81–88.
10. Whelan, M., J. Langford, J. Oxley, S. Koppel, and J. Charlton. The Elderly and Mobility: A Review of the Literature. Report Number 255, Accident Research Centre, Monash University, Clayton, Victoria, Australia, 2006. http://monash.edu/miri/research/reports/muarc255.pdf. Accessed Sept. 29, 2018.
11. Musselwhite, C., and H. Haddad. Mobility, Accessibility, and Quality of Later Life. Quality in Ageing and Older Adults, Vol. 11, 2010, pp. 25–37.
12. Department for Transport. National Travel Survey, 2017. https://www.gov.uk/government /statistics/national-travel-survey-2017. Accessed Sept. 29, 2018.
13. Department for Transport. Older People: Their Transport Needs and Requirements: Main Report. Technical report, Department for Transport, 2001.
14. Banks, J., G. D. Batty, J. Nazroo, and A. Steptoe. The Dynamics of Ageing: Evidence from the English Longitudinal Study of Ageing 2002–15 (Wave 7), 2016. https://www.elsa-project.ac.uk /publicationDetails/id/8696. Accessed Sept. 29, 2018.
15. Mackett, R. L. Overcoming the Barriers to Access for Older People. Report produced for the Age Action Alliance, 2014. http://ageactionalliance.org/wordpress/wp-content/uploads/2014/11 /Overcoming-the-barriers-to-access-Nov-14.pdf. Accessed Sept. 29, 2018.
16. Department for Transport. Inclusive Mobility: A Guide to Best Practice on Access to Pedestrian and Transport Infrastructure, 2005. https://www.gov.uk/government/publications/inclusive-mobility. Accessed Sept. 29, 2018.
17. Asher, L., M. Aresu, E. Falaschetti, and J. Mindell. Most Older Pedestrians Are Unable to Cross the Road in Time: A Cross-Sectional Study. Age and Ageing, Vol. 41, 2012, pp. 690–694.

82
CONFERENCE PAPERS
Increasing Accessibility of Physical Maps for All
HOI KEI PHOEBE CHAN S. LING SUEN
Intelligent Computer Systems and Applications Inc.
hile many people rely on online maps using smart devices, physical maps are still useful and relevant when traveling to destinations where there is limited or no access to phone/
tablet, data or Wi-Fi or where GPS maps are not available. Maps of various places may come in all types and sizes, but they often lack accessibility features to help people of all abilities orientate and navigate in the physical environment more safely and easily.
Through literature review, this multidisciplinary paper will briefly track the history of map-making, including modern cartography like Geographic Information System (GIS), along with the use of important elements such as scale, colors, spacing, size, fonts, and symbols on a printed map.
The paper concludes that it is still impossible to identify ideal fonts and sizes to accommodate all map readers due to variations in individual preferences, especially those with visual and cognitive impairments. However, it will provide pointers on the basic elements that require special attention in map design: uniformity in layout; inclusion of essential accessibility features for people with reduced mobility (e.g., accessible building entrances, curb cuts, elevators, washrooms); provision for those with sensory impairments (e.g., color-weakness), reading impairments (e.g., illiterate, dyslexic) and cognitive impairments, etc. Future research in the field could focus on accessible typeface or font, size and strokes for maps. In addition, research and development projects on integrating 2D and 3D imaging with artificial intelligence, coupled with infrared and RFID technologies in maps could potentially be beneficial towards making transportation accessible. INTRODUCTION While many people rely on online maps using smart devices, physical maps are still useful and relevant when traveling to destinations where there is limited or no access to phone/ tablet, data or Wi-Fi. Also, GPS may not be available indoors while older GPS maps integrated in vehicles can be expensive or impossible to update due to newer software and hardware requirements. Maps of various places may come in all types and sizes (printed on various mediums or hand drawn), but they often lack accessibility features to help people of all abilities navigate the environment more safely and easily. This paper explores how cities, along with their transport and tourism providers (such as customer service at hotels, restaurants), can improve the accessibility of their maps to facilitate wayfinding for newcomers, visitors, pregnant women, adults traveling with young children and persons with disabilities. This will be illustrated by selected examples found in the field.
W
Chan and Suen 83
METHODOLOGY This paper examines the history of map-making to understand how and why they were created over time. A literature review is undertaken on modern cartography like GIS and its current practices, follow by an exploration of how spatial and pattern recognition (more specifically language processing) may help in developing better maps. The various disabilities that may not be addressed in typical maps will be discussed accordingly. History of Maps Maps have been around for over 5,000 years. Early maps are more pictorial, depicting small areas with no sense of direction since North was not indicated. Also, they were often seen as works of art rather than reference documents (1).
Ancient Greeks were the ones who studied extensively the “size and shape of the earth and its habitable areas, climatic zones and country positions” while the Ancient Romans used maps for military and administrative needs to control its vast empire. Around 150 AD, Ptolemy referred to a system of latitudes and longitudes and started to describe locations based on astronomical observations from those areas (2).
During the Middle Ages, map-making was dominated by European religious orders who focused on Jerusalem as center of the world while the Orient was located at the top of the map. An Arab scholar, named Al-Sharif al-Idrisi, produced maps that greatly influenced cartographers as his work drew on Greek, Islamic and Christian knowledge. Characteristics of his maps include: (1) orientation of south at the top as the correct direction of prayer, (2) earth is encircled by sea while surrounded by fire as indicated by the Koran, and (3) locations were in distorted dimensions (3).
During the Renaissance, Johannes Gutenberg’s printing press allowed for a greater dissemination of maps to a wider audience (1). Also, there is an increased emphasis on their accuracy to address countries’ commercial expansion, formation of new colonies and military expansion (2). In the 1500s, Gerardus Mercator created a new map by flattening the earth and distorting objects’ dimensions closest to the poles, thus allowing navigators to chart a course more easily despite the distortion (3).
The Industrial Revolution brought in the need for people to travel more; so, smaller practical and portable maps with finer features were produced to replace the cumbersome and decorative maps (2). With today’s technological advances, satellites and smart mobile technology allow the production of accurate maps, and to assists users to locate community resources as needed (e.g. the Vancouver Coastal Health online map) (4, 5). These illustrates that maps in all media are very powerful navigation tools if designed and used properly.
In summary, maps played an important role in history and will remain an essential navigation and orientation tool. Lessons learned are: (1) small and portable maps in various media preferred, (2) clear and precise directions/locations needed, (3) legible fonts preferred, (4) frequent updates in view of new developments required, and (5) information they contained could turn out to be biased.

84 TR Circular E-C262: TRANSED 2018
Modern Cartography and Geographic Information System GIS is a computer program that is commonly used to capture, store, manipulate, analyze, manage, and present spatial or geographic data. This system also allows people to create maps for analysis and presentations (6). Therefore, it is important to understand how its functioning can improve people’s ability to create legible maps. Also, map users need to be reminded that they must first acquire the map reading skills to fully comprehend what GIS can provide.
According to World Health Organization and United Nations Environmental Programme, maps “allow us to convey information and findings that are difficult to express verbally, or to condense messages that would be lengthier to describe in words. They are often more memorable, because they have color and shape” (6). Thus, it is important to take note on the following factors that affect the usefulness of GIS for accessible transportation purposes. GIS and Visual Impairments There are two aspects that mapmakers need to cater to: low-vision readers and those with color deficiencies.
For those with low vision, high-contrast (low vision) maps can be made to accompany text-based route descriptions. Tactile maps could be built to complement RFID type navigation systems to provide a spatial understanding of the environment. This combination of technologies has the potential of enhancing independent mobility for blind or low vision travelers (7).
According Peterson’s GIS Cartography: A Guide to Effective Map Design, it is to everyone’s interest to appreciate the effects of color vision deficiency on map-making. Statistics show red-green deficiency affects about 8% of men and 0.5% of women of Northern European descent, about 5% of Asian males and about 4% of African males. The blue–yellow deficiency affects about 0.01% of all people, male and female in equal proportions. Meanwhile, the black-white deficiency affects about 0.003% of all people (8).
It is recommended to use high-saturation colors (full/colorful) since colors that are low in saturation (dull/greytone) are difficult to distinguish. In addition, pure red and pure green cause a lot of problems to some readers; therefore, it is ideal to tint them with other hues to allow people to distinguish between the colors. It is troublesome as well “when the polygons, points, or lines are numerous and close together” (8). An individual with color blindness once told the authors that some maps with shapes like dotted lines would allow him to navigate around more easily than solid lines. He did caution that one must do it judiciously or it could become confusing.
There are numerous resources like Peterson’s book called Cartographer’s Toolkit: Colors, Typography, Patterns (9) and an online program called Vischeck (found at http://www.vischeck.com/, but unavailable on August 27, 2018) to simulate maps to test their accessibility for color blind people. Therefore, there is little excuse to ignore color blindness when creating future maps.
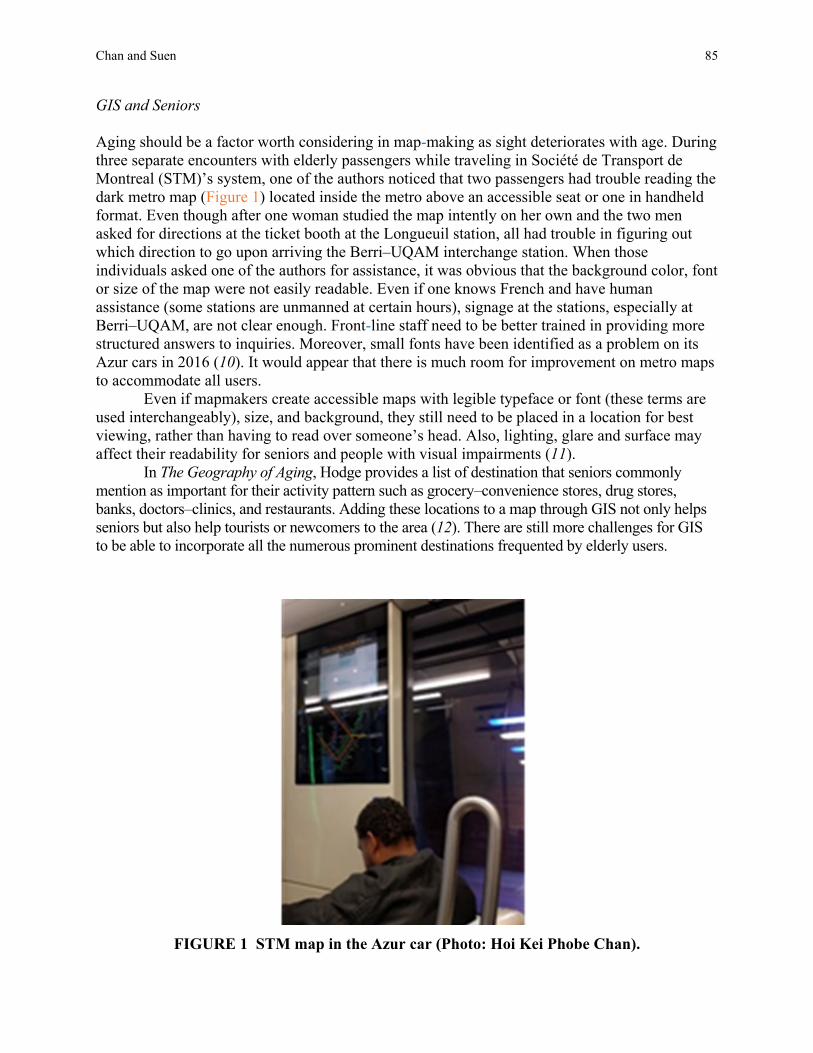
Chan and Suen 85
GIS and Seniors Aging should be a factor worth considering in map-making as sight deteriorates with age. During three separate encounters with elderly passengers while traveling in Société de Transport de Montreal (STM)’s system, one of the authors noticed that two passengers had trouble reading the dark metro map (Figure 1) located inside the metro above an accessible seat or one in handheld format. Even though after one woman studied the map intently on her own and the two men asked for directions at the ticket booth at the Longueuil station, all had trouble in figuring out which direction to go upon arriving the Berri–UQAM interchange station. When those individuals asked one of the authors for assistance, it was obvious that the background color, font or size of the map were not easily readable. Even if one knows French and have human assistance (some stations are unmanned at certain hours), signage at the stations, especially at Berri–UQAM, are not clear enough. Front-line staff need to be better trained in providing more structured answers to inquiries. Moreover, small fonts have been identified as a problem on its Azur cars in 2016 (10). It would appear that there is much room for improvement on metro maps to accommodate all users.
Even if mapmakers create accessible maps with legible typeface or font (these terms are used interchangeably), size, and background, they still need to be placed in a location for best viewing, rather than having to read over someone’s head. Also, lighting, glare and surface may affect their readability for seniors and people with visual impairments (11).
In The Geography of Aging, Hodge provides a list of destination that seniors commonly mention as important for their activity pattern such as grocery–convenience stores, drug stores, banks, doctors–clinics, and restaurants. Adding these locations to a map through GIS not only helps seniors but also help tourists or newcomers to the area (12). There are still more challenges for GIS to be able to incorporate all the numerous prominent destinations frequented by elderly users.
FIGURE 1 STM map in the Azur car (Photo: Hoi Kei Phobe Chan).

86 TR Circular E-C262: TRANSED 2018
ACCESSIBLE MAPS THROUGH A SCIENTIFIC LENS? Technological advances allow researchers to study and understand the impact of topics like spatial recognition and GPS navigation can improve maps’ accessibility for users. Spatial Recognition and Technology Even if it is controversial, studies have often indicated that men are better at spatial cognition like mental rotation associated with wayfinding and which explains why there are more men in Science, Technology, Engineering and Mathematics than women. However, these deficiencies can be remedied for women when given the right opportunities through spatial training exercises (13). Therefore, it shows that everyone can be trained to increase their spatial recognition skills up to a certain level.
After numerous rescues, “police in northern Scotland issued an appeal for hikers to learn orienteering skills rather than relying solely on smartphones for navigation”, considering the reliance on technology disrupt people’s understanding of the tangible world (14). There is a definite need for all people to master the basics like map-reading and orientation skills despite technological advances.
Grabar mentioned that “[i]n a handful of studies conducted over the last decade in the United States, England, Germany and Japan, researchers have shown that GPS navigation has a generally pernicious effect on the user’s ability to remember an environment and reconstruct a route” (15). Not to mention, “[p]articipants using GPS navigation performed 20 percent worse than their paper-map peers” according to Toru Ishikawa’s research (15). Grabar’s article also shows spatial recognition is a skill that can be lost if one relies too much on technologies (15).
Other spatial abilities that are important to maps are “ ‘route memory’—[one’s] ability to remember the way—and ‘map rotation.’ Map rotation involves mentally rotating a map as [one] make[s] successive turns, without having to turn it” (16).
Even if technological advances allow Google Maps in Japan “[to show] shops inside train stations […] marks every crosswalk and even has a timestamp for when a bus you can take will arrive if there's a stop close by” (17), it is up to transportation planners to create adequate and accessible signage or maps and guides in the physical environment to allow everybody, including foreigners, to navigate their immediate surroundings without feeling overwhelmed. Ideal Size, Spacing and Stroke Thickness In Beveratou’s The Effect of Type Design and Typesetting on Visually Impaired Readers, it is suggested that font sizes between 16–18 and bigger gaps between lines to decrease crowding. Crowding occurs when letter identification decreases with other surrounding letters. She mentioned an older research by Prince that “inter-letter spacing should be 40% and inter-line spacing 140% of the letter ‘o’ ” while “the ideal stroke thickness is thought to be equivalent to 17.5% of the height of an ‘o’ ” (18). In addition, Shaw’s research back in 1969 suggested that “people affected by glaucoma benefit from a bolder typeface” (18).
For more current design standards, Jeremy Loyd says in his article that it is ideal to stay around 13px/ pixels. His rule of thumb on paragraph spacing is around half of the line’s height but does not seem to discuss a stroke’s thickness (19).
Chan and Suen 87
Even though these research findings are useful, it is difficult to apply the ideal size, spacing and stroke thickness on map-making given the amount of information that need to be conveyed. Turning Toward Scientific Research for Fonts and Colors? The use of science, like artificial intelligence, in transportation is not new considering companies are investing in initiatives like self-driving cars. Therefore, if one can teach a machine to think like a human, this could potentially help researchers and others identify the best fonts and colors for their needs. An article by Jimmy Stamp discusses National Geographic’s 80-year-old font on maps since the 1930s (20). What is interesting about that typed font is that it replaced hand-lettered maps which were more precise than movable type of printing which existed at that time.
It is obvious that readability (how easy to read words in a document) and legibility (how easy to distinguish the letters in a typeface) of maps as a form of signalization affect how people interact with their environment based on findings from pilot projects in cities across North America (19, 21). Or else, there would not be a long list of public signage typefaces either in use or retired that is available on Wikipedia (22).
There is much discussion online regarding the serif and sans serif fonts whose difference lies in the extended features at the end of the stroke. It is interesting that creators of IDEO Font Map try using artificial intelligence to see if machine learning can address challenges in design, potentially increasing accessibility as most designers tend to stick with the generic ones or choose within the serif or sans serif category (23). Depending on the user, one either loves the fonts or hates them (24). It is important to note that there is at least a font called Dyslexie (25) and color scheme of charcoal grey on white background that works well for persons with dyslexia, a learning disability (26).
Beveratou’s paper investigated past research in the field. Prince’s 1967 research demonstrated that words should be in serif while single letters or syllables should be in sans serif. Pelli’s 1994 research shows how noise, known as visual elements that make recognition more difficult, affects legibility more than the size (18). By increasing the size, thinner parts of letters are more visible and ends up masking the noise. Words in sans serif were well read when “both spacing and leading were at their widest,” but do not work for serif ones. Meanwhile, people with normal vision read better with default spacing and sans serif typeface (18).
Meanwhile, Reece’s 2008 paper says it is difficult to compare past research due to differences in methodologies, fonts and participants’ conditions, demonstrating how these variables affect the results (18). Also, it is found that only certain typefaces, like Times New Roman, improve reading rate of the visually impaired if they are in bigger sizes. Despite contradictory findings, another research has found that out of the top five most read typefaces in that research, four of them were serif (18). Yet in 2017, according to C. Y. Suen et al., the top four typeface or font that are most legible and readable are Garamond (serif), followed by Arial, Helvetica (sans serif) and Times New Roman (serif) (27). These demonstrate that there is no perfect font and size. It all depends on individuals’ visual abilities.
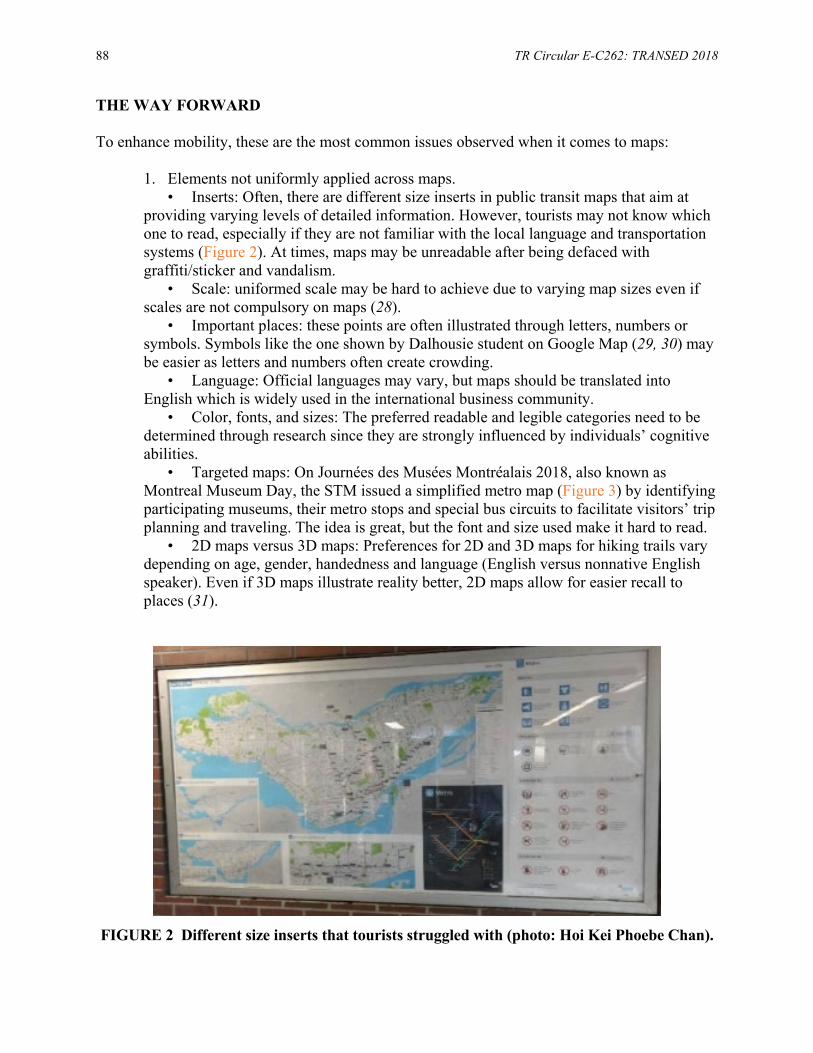
88 TR Circular E-C262: TRANSED 2018
THE WAY FORWARD To enhance mobility, these are the most common issues observed when it comes to maps:
1. Elements not uniformly applied across maps. • Inserts: Often, there are different size inserts in public transit maps that aim at
providing varying levels of detailed information. However, tourists may not know which one to read, especially if they are not familiar with the local language and transportation systems (Figure 2). At times, maps may be unreadable after being defaced with graffiti/sticker and vandalism.
• Scale: uniformed scale may be hard to achieve due to varying map sizes even if scales are not compulsory on maps (28).
• Important places: these points are often illustrated through letters, numbers or symbols. Symbols like the one shown by Dalhousie student on Google Map (29, 30) may be easier as letters and numbers often create crowding.
• Language: Official languages may vary, but maps should be translated into English which is widely used in the international business community.
• Color, fonts, and sizes: The preferred readable and legible categories need to be determined through research since they are strongly influenced by individuals’ cognitive abilities.
• Targeted maps: On Journées des Musées Montréalais 2018, also known as Montreal Museum Day, the STM issued a simplified metro map (Figure 3) by identifying participating museums, their metro stops and special bus circuits to facilitate visitors’ trip planning and traveling. The idea is great, but the font and size used make it hard to read.
• 2D maps versus 3D maps: Preferences for 2D and 3D maps for hiking trails vary depending on age, gender, handedness and language (English versus nonnative English speaker). Even if 3D maps illustrate reality better, 2D maps allow for easier recall to places (31).
FIGURE 2 Different size inserts that tourists struggled with (photo: Hoi Kei Phoebe Chan).
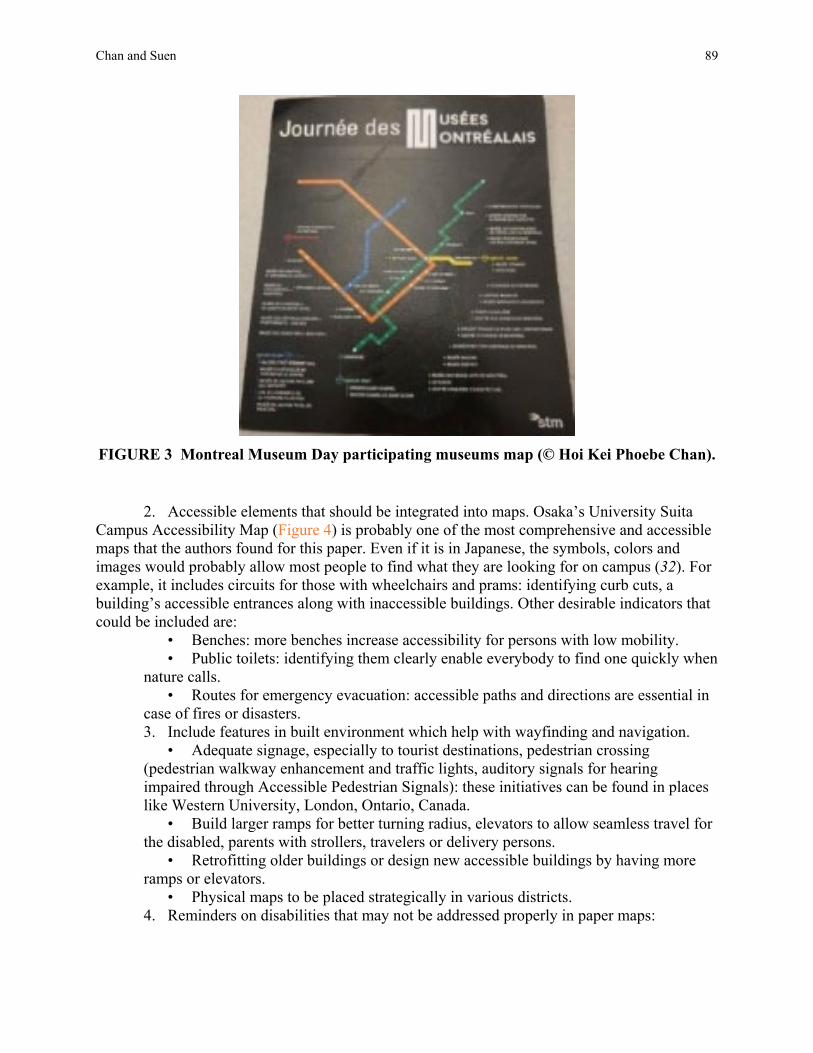
Chan and Suen 89
FIGURE 3 Montreal Museum Day participating museums map (© Hoi Kei Phoebe Chan).
2. Accessible elements that should be integrated into maps. Osaka’s University Suita Campus Accessibility Map (Figure 4) is probably one of the most comprehensive and accessible maps that the authors found for this paper. Even if it is in Japanese, the symbols, colors and images would probably allow most people to find what they are looking for on campus (32). For example, it includes circuits for those with wheelchairs and prams: identifying curb cuts, a building’s accessible entrances along with inaccessible buildings. Other desirable indicators that could be included are:
• Benches: more benches increase accessibility for persons with low mobility. • Public toilets: identifying them clearly enable everybody to find one quickly when
nature calls. • Routes for emergency evacuation: accessible paths and directions are essential in
case of fires or disasters. 3. Include features in built environment which help with wayfinding and navigation.
• Adequate signage, especially to tourist destinations, pedestrian crossing (pedestrian walkway enhancement and traffic lights, auditory signals for hearing impaired through Accessible Pedestrian Signals): these initiatives can be found in places like Western University, London, Ontario, Canada.
• Build larger ramps for better turning radius, elevators to allow seamless travel for the disabled, parents with strollers, travelers or delivery persons.
• Retrofitting older buildings or design new accessible buildings by having more ramps or elevators.
• Physical maps to be placed strategically in various districts. 4. Reminders on disabilities that may not be addressed properly in paper maps:
90 TR Circular E-C262: TRANSED 2018
FIGURE 4 Osaka University’s Accessibility Map (© Osaka University).
• Reading disorders like dyslexia; • Cognitive disorders; • Color blindness or other visual weaknesses; • Deafness or hard of hearing; and • Physical disability.
5. Future technology? There are many uses of infrared (IR), a wireless and mobile technology used for device communication over short ranges. When it comes to mapping, IR thermal technology is current used in satellite imagery to access and map larger areas. While it is used in archaeology to solve some age-old questions and mysteries (33), the primary use of infrared cameras in transportation is on traffic surveillance. It may be useful to conduct future research and development projects on integrating 2D and 3D imaging with artificial intelligence, coupled with IR and RFID technologies on maps towards making transportation accessible.
Even if it is difficult to address the needs of all users from around the world, there may be
a continuing need to pursue interdisciplinary research for a uniform font along with an acceptable font size and color for physical maps. Everyone, especially tourism and transport providers, should remember that nothing really replaces human assistance for wayfinding. Until then, mapmakers should strive to apply the best practices found in the field for more readable and legible maps.
REFERENCES 1. Maxwell, R. Spatial Orientation and the Brain: The Effects of Map Reading and Navigation. GIS
Lounge. Available at https://www.gislounge.com/spatial-orientation-and-the-brain-the-effects-of-map-reading-and-navigation/. Accessed March 8, 2013.
2. Dempsey, C. Mapping Through the Ages: The History of Cartography. GIS Lounge. Available at https://www.gislounge.com/mapping-through-the-ages/. Jan. 29, 2011.
Chan and Suen 91
3. Western University. Creating a Barrier-Free Campus. Available at http://www.uwo.ca/fm/initiatives /accessibility.html#aps. 2018.
4. Osaka University. Access Maps. Available at http://www.osaka-u.ac.jp/en/access/suita/accessibility. 2018.
5. CBC News. Vancouver maps helps hungry people find healthy, low-cost food. Available at http://www.cbc.ca/news/canada/british-columbia/vancouver-food-asset-map-1.4357392. Accessed Oct. 17, 2017.
6. A History of the World in Twelve Maps. Time. Available at http://ideas.time.com/2013/11/21/a-history-of-the-world-in-twelve-maps/slide/al-sharif-al-idrisi-world-map-1154/. Accessed Nov. 15, 2013.
7. ClickAndGo Wayfinding Maps. Retrieved from ClickAndGo Wayfinding Maps. http://www.clickand gomaps.com/. Accessed Sept. 24, 2018.
8. Schobesberger, D., and T. Patterson. Evaluating the Effectiveness of 2D vs. 3D Trailhead Maps. 6th ICA Mountain Cartography Workshop, 2008, pp. 200–205. Available at http://www.mountaincartography.org/publications/papers/papers_lenk_08/schobesberger.pdf. Accessed 2017.
9. Peterson, G. N. GIS Cartography: A Guide to Effective Map Design. CRC Press, 2014. 10. CBC News. AZUR not for short people: New Metro car receives mixed reviews from commuters.
Available at https://www.cbc.ca/news/canada/montreal/azur-metro-mixed-reviews-1.3579387. Accessed May 13, 2016.
11. Black Dog Sign Company. Wayfinding Signs and ADA Compliance. 2018. Available at http://blackdogsigncompany.com/wayfinding-signs-and-ada-compliance/
12. Hodge, G. The Geography of Aging: Preparing Communities for the Surge in Seniors. McGill-Queen’s University Press, 2008.
13. Curry, A. Men Are Better At Maps Until Women Take This Course. Available at http://nautil.us /issue/32/space/men-are-better-at-maps-until-women-take-this-course. Accessed Jan. 28, 2016.
14. McGuire, S. The Most Popular Font Types in America [Infographic]. Available at https://venngage .com/blog/popular-font-types/. Accessed Oct. 12, 2017.
15. Grabar, H. Smartphones and the Uncertain Future of ‘Spatial Thinking’. Citylab. Available at https://www.citylab.com/life/2014/09/smartphones-and-the-uncertain-future-of-spatial-thinking /379796/. Accessd Sept. 9, 2014.
16. Stamp, J. The Secret to National Geographic's Maps Is an 80-Year Old Font. Available at https://www.smithsonianmag.com/arts-culture/the-secret-to-national-geographics-maps-is-an-80-year-old-font-22205390/. Accessed Aug. 2, 2013.
17. Engadget. What we’re using: Google Maps while lost in Japan. Available at https://www.engadget .com/2018/02/12/what-were-using-google-maps-japan/. Accessed Dec. 2, 2018).
18. Beveratou, E. The Effect of Type Design and Typesetting on Visually Impaired Readers. Series on Language Processing, Pattern Recogntion, and Intelligent Systems. Digital Fonts and Reading (M. C. Dyson and C. Suen, eds.), Vol. 1, 2016, pp. 1–18.
19. Enavotatuts+. Typographic Readability and Legibility. Available at https://webdesign.tutsplus.com /articles/typographic-readability-and-legibility--webdesign-12211. Accessed May 8, 2013.
20. Suen, C., S. Nikfal, B. Zhang, and J. Janbi. Characteristics of English, Chinese, and Arabic typefaces. Advances in Chinese Document and Text Processing (C.-L. Liu and Y. Lu, eds.), Vol. 7, 2017.
21. CTV News Montreal. Sign of the times: Ville St. Laurent releases results of signage pilot. Retrieved from https://montreal.ctvnews.ca/sign-of-the-times-ville-st-laurent-releases-results-of-signage-pilot-project-1.3834839. Accessed March 8, 2018.
22. Wikipedia. List of public signage typefaces. Available at https://en.wikipedia.org/wiki/List_of _public_signage_typefaces. Accessed June 29, 2018.
23. Intergovernmental Committee on Surveying and Mapping. History of Mapping. Accessed Available at https://www.icsm.gov.au/education/fundamentals-mapping/history-mapping. Accessed July 5, 2018.

92 TR Circular E-C262: TRANSED 2018
24. Natural Resources Canada. Satellite Imagery and Air Photos. Available at http://www.nrcan.gc.ca /earth-sciences/geomatics/satellite-imagery-air-photos/10782. Accessed Nov. 20, 2015.
25. Dyslexie Font.com. Dyslexie font. 2017. Available at https://www.dyslexiefont.com/en/typeface/. 26. Peterson, G. N. Cartographer's Toolkit: Colors, Typography, Patterns. Accessed June 29, 2012. 27. Dalhousie student puts recreation on the map. The Chronicle Herald. Available at http://thechronicle
herald.ca/southshorebreaker/1542276-dalhousie-student-puts-recreation-on-the-map. Accessed Feb. 2, 2018.
28. Buckley, A. Choosing the Best Way to Indicate Map Scale. ArcGIS Blog, 2007. Available at https://www.esri.com/arcgis-blog/products/product/mapping/choosing-the-best-way-to-indicate -map-scale. Accessed Aug. 6, 2007.
29. The Health and Environment Linkages Initiative. Maps and spatial information technologies (Geographical Information Systems) in health and environment decision-making. 2018. Available at http://www.who.int/heli/tools/maps/en.
30. Google Maps. Dartmouth Recreation and Open Spaces Asset Map. 2018. Available at getactivedartmouth.ca.
31. Southorn, G. Why are some people better at map reading than others. Available at http://360.here.com/2014/10/06/people-better-map-reading-others/. Accessed Oct. 6, 2014.
32. IDEAS.TED.COM. Gallery: Archaeological mysteries hidden in satellite images. Available at https://ideas.ted.com/gallery-archaeological-mysteries-hidden-in-satellite-images/. Accessed April 19, 2017.
33. Oxford Brookes University. New wayfinding and signage - send us your views. Available at https://www.brookes.ac.uk/space-to-think/news-and-events/wayfinding-and-signage. Accessed May 5, 2015.

93
CONFERENCE PAPERS
Navigation and Wayfinding for Persons with Visual Impairments in Metro Stations
GAURAV RAHEJA
Centre for Excellence in Transportation Systems (CTRANS)
TRISHA SINHA Indian Institute of Technology Roorkee, Roorkee, India
majority of persons with vision impairments (PVIs) remain confined to their personal environments with restricted mobility owing to lack of independent and safe cues for
navigation in built environments. Mobility within Mass Rapid Transit Stations (MRTS) for PVIs remains a challenging reality with wide scopes for ground interventions especially in sensory wayfinding and information design. Based on a live study of mobility in MRTS in the city of New Delhi, this paper identifies some critical issues for navigation of PVIs in managing mobility through the entire travel chain.
Ethnographic survey supported by field observations along with tracking and tracing were employed as key methods for gathering field data. These research methods provided an in-depth insight into understanding the sensory navigation issues involved in movement of PVIs. The key results involve a post evaluative status check of Metro Rail Stations in New Delhi. Analyzing mobility and route navigation perspectives for PVIs in different zones of a metro station: Entrance, Ticket Counters, Automated Fare Collection Gates, Staircases, Elevators, Platform location, Train identification cues, etc. formed an integral part of this study. It identifies and discusses through a human response and feedback in determining the accessibility and efficacy of tactile guiding systems and other sensory cues including color contrast.
The study concludes with critical findings for developing navigation for PVIs with further emphasis on contextual learnings to improvise accessibility provisions for providing ease of navigation and wayfinding for the PVIs in MRTS elsewhere. BACKGROUND India is a home to a large population with disabilities of which vision impairment forms a large percentage. Irrespective of the nature and type of disability, mobility remains a critical dimension of human life for education, employment, work, performance of basic activities of daily living and participation in life. PVIs in context of loss of vision face diverse challenges while moving around the changing urban infrastructure systems. Developing a safe, secure and accessible mobility systems remains a challenging perspective for most urban situations.
MRTS existing as metro rail systems provides a uniquely standardized network of urban mobility transporting millions on a daily basis across the complex cities of 21st century. Delhi Metro has evolved and expanded over the years as a unique mobility interface for a wide range of population groups in Delhi. The system has been progressively expanding in phases (Phase I, II, III) and improving its capacity and reach. In light of its expanse and huge network laid out in
A

94 TR Circular E-C262: TRANSED 2018
the metropolitan city of Delhi, it also becomes vital to understand the challenges of population groups with limited mobility and reach. This paper investigates a case of PVIs and their wayfinding issues with respect to Metro Stations as an integral part of the MRTS in Delhi. The broad aim of the study is to gain an insight into critical issues of PVIs and their mobility experiences using Delhi Metro and its infrastructure. It generates an evaluative feedback through live observation studies and accessibility audit in select Delhi Metro Stations. UNDERSTANDING VISION IMPAIRMENT AND WAYFINDING NEEDS Vision impairment is prevalent in various forms and degrees and covers a very wide range from total blindness to moderate visual difficulties. Visual disorders that are commonly prevalent among the vision impairments may occur in diverse forms such as blindness, halo formation around point images in low light, blurred vision, night blindness, decreased visual acuity, double vision, visual field loss, limited vision due to involuntary movement of the eye, general fatigue after prolonged use of the eye, eyes may not move or focus in the same direction, loss of accommodation, cloudy vision, appearance of flashing lights, intolerance to visual perception of light, peripheral loss of vision/tunnel vision and loss of color vision. Some of the other rare visual disorders are distortion of vision to some degree at all distances, vision with blue/red tint, distinct colored edges around objects, especially in high-contrast situations, unable to perceive depth, sudden appearance of many floaters and fluctuating vision. The current Indian scenario necessitates examining and analyzing various ways to support the PVIs by means of mobility aids which include assistive devices on the personal front as well as environmental tools & technologies.
India is a home to the world’s largest number of people with blindness. Of the 37 million people with blindness across the globe, over 15 million are from India (1). There are approximately 39 million people with blindness in the world, while another 246 million people have some form of significant visual impairment. In India, there are 82 million people with moderate visual impairment which will likely to be 139 million by the year 2020. Among them, the majority of people with vision impairment are the older people over the age of 50 years due to age-related diseases such as glaucoma and diabetic retinopathy (2). In their daily lives, PVIs remain a vulnerable section of the society, exposed to minor injuries or major accidents when traversing anomalous environments on the way to their destination. For this type of wayfinding, it is essential to use and organize definite sensory cues from external environments.
Passini in his research titled, Wayfinding without Vision, explains how wayfinding is related to both cognitive and behavioral abilities of an individual. He further states that to move freely in the large-scale architectural and urban environment can be a difficult task for any person; it can be an exasperating one for the visually impaired (3). Thus, this group mainly depends on training, patience, courage and personal experience to move in the given space. The person with vision impairment who is interested in living active life has no option but to rely on the architectural and urban environments else he suffers personal, social and professional independence. He describes wayfinding as a combination of three related steps:
Raheja and Sinha 95
1. Decision-making or planning to reach the point of destination. 2. Execution of decision for on field actions and movements in space. 3. Processing of information that results in the perception and cognition of
environmental image.
Environment can be legible in the sense of organizing and facilitating travel only if it allows its users to clearly and quickly define routes through its networks. Thus, legibility is an important cognitive and environmental characteristic that influences wayfinding and travel generally (4). However, in a usual understanding wayfinding is the ability of traveling between locations and directed movement from an origin to a specific destination thus involving the interaction between the traveler and the environment (5). In addition, wayfinding is a behavior which cannot be lucrative unless one knows the location, destination and the best route for destination, recognizing destination and finally be able to find a way back (6). State of the art literature informs an advanced understanding about wayfinding as a cognitive and spatial behavior involving movement and decision-making (7). It is therefore important to understand the wayfinding needs and behavior of PVIs in contemporary urban mobility systems like Delhi Metro to further gain insight into accessibility perspectives and safer mobility experiences. UNIVERSAL DESIGN: CONTEXTUAL INTERPRETATIONS Universal design (UD) is an approach and philosophy that advocates inclusion of diversity in a far reaching and a wide manner. The term UD first came into usage in the mid-1980’s by United States (U.S.) architect, Ronald L. Mace which stated it as “The design of products and environments to be usable by all people, to the greatest extent possible, without the need for adaptation or specialized design” (8) Since then the concept of UD has escalated globally and has slowly gained recognition but has seen an uneven adoption. Also, language has played, and continues to play, a major role in the advancement of UD as they have the power to define, classify, and construct the content and context as well. Therefore, Steinfeld and Maisel in 2012 (9) extended and revised the definition of UD as a process that enables and empowers a diverse population by improving human performance, health and wellness, and social participation. It creates products, systems, and environments to be as usable as possible by as many people as possible regardless of age, ability or situation.
UD terminology and interpretation differs from one country to another and often reflect each nation’s societal values and diversity in culture influence how the movement has been adopted in different countries. But still it remains a strategy that has been implemented by various sectors of the private and public realm for fairly narrowly framed purposes. However, the common goal of social inclusion transcends national laws, policies, and practices.
UD can therefore be interpreted in in different dimensions keeping a common goal of inclusion. It therefore requires to develop a holistic and a specific understanding about the contextual interpretations of UD or PVIs and their mobility in MRTS. This implies decoding the key principles of UD for inclusion of PVIs in urban mobility systems.
Table 1 illustrates possible applications and interpretation of UD principles towards a seamless and safe mobility for PVIs. It however could be extended to other forms of human diversity.

96 TR Circular E-C262: TRANSED 2018
TABLE 1 UD Principles: Contextual Interpretation(s)
India, a country with strong historic and cultural past, has deep rooted traditions that are part of its social and cultural life. There are many important Indian issues that make its people unique.
Continuing the spirit of UD that advocates against “one design fits all,” the UD India Principles are developed by an interdisciplinary team of Indian experts to address the needs of diverse population in the Indian context. UD involves a fundamental shift in thinking about design, particularly with regard to designing to address social difference. The democratic values of UD are grounded in self-reliance, social empowerment and personal choice. As a design approach, UD requires incorporating flexibility, adaptability and modularity to achieve best fit and mass customization for everyone.
At the Center for UD at North Carolina State University a group of experts established Seven Principles of UD to provide guidance in the design of products and environments. UD India Principles are additional principles which when added to the larger framework of the Seven Principles of UD (USA), allow customizing UD applications, regionalizing UD contexts and
UD Principles Definition Contextual Interpretation(s) Equitable use The design is useful and marketable to people
with diverse abilities. Ease of access from entry, to ticketing, to boarding and exit.
Flexible use The design accommodates a wide range of individual preferences and abilities.
Level platform with coach, real time information providing flexibility in choice and timing of travel.
Simple and intuitive use
Use of the design is easy to understand, regardless of the user's experience, knowledge, language skills, or current concentration level.
Spatial and sensory information integration at all levels of MRTS.
Perceptible information
The design communicates necessary information effectively to the user, regardless of ambient conditions or the user's sensory abilities.
Simplified, legible, and alternative information and wayfinding design for diversity of PVIs.
Tolerance for error The design minimizes hazards and the adverse consequences of accidental or unintended actions.
Design for safety at edges like corners, platform, staircase nosing, lift controls, structural systems of the built form or train coach, etc.
Low physical effort The design can be used efficiently and comfortably and with a minimum of fatigue.
Ease in vertical mobility, accessible information systems (visual, audio and tactile), sensory information in ticket vending machines, coach position, standardization, etc.
Size and space for approach and use
Appropriate size and space is provided for approach, reach, manipulation, and use regardless of user’s body size, posture, or mobility.
Aisle gates, edge protection bars around columns, tactile and colored warning lines, etc., for accommodation of white cane movement.
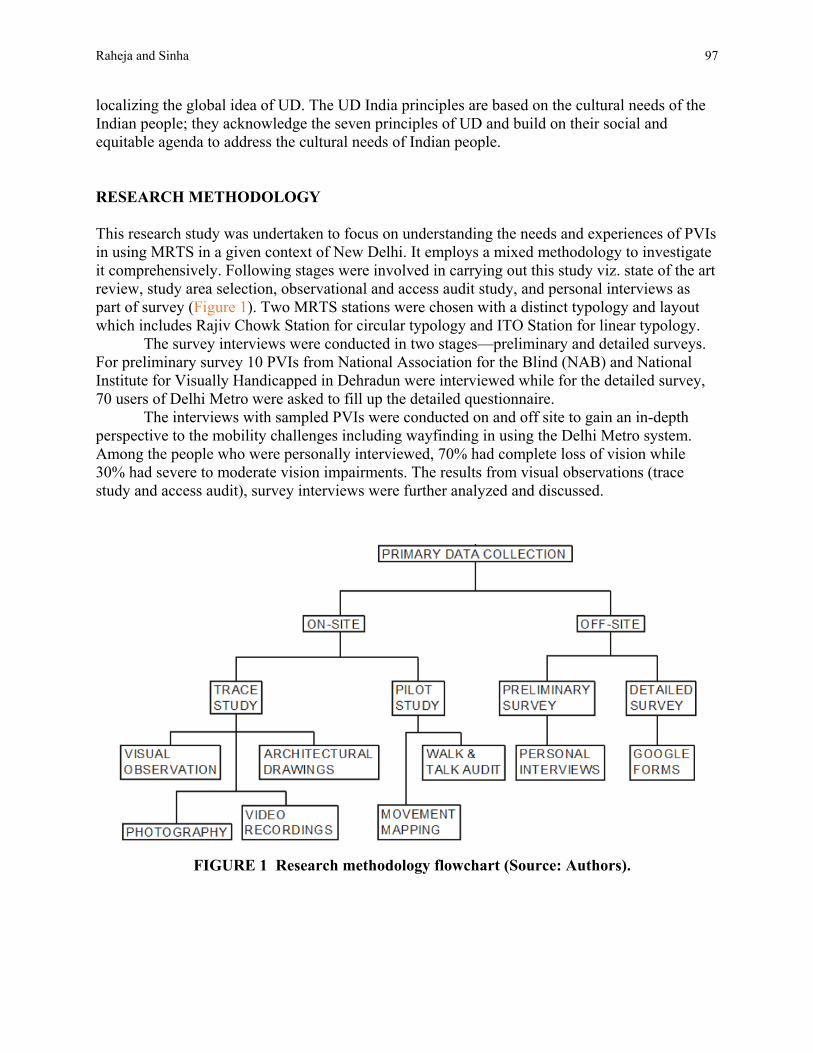
Raheja and Sinha 97
localizing the global idea of UD. The UD India principles are based on the cultural needs of the Indian people; they acknowledge the seven principles of UD and build on their social and equitable agenda to address the cultural needs of Indian people.
RESEARCH METHODOLOGY
This research study was undertaken to focus on understanding the needs and experiences of PVIs in using MRTS in a given context of New Delhi. It employs a mixed methodology to investigate it comprehensively. Following stages were involved in carrying out this study viz. state of the art review, study area selection, observational and access audit study, and personal interviews as part of survey (Figure 1). Two MRTS stations were chosen with a distinct typology and layout which includes Rajiv Chowk Station for circular typology and ITO Station for linear typology.
The survey interviews were conducted in two stages—preliminary and detailed surveys. For preliminary survey 10 PVIs from National Association for the Blind (NAB) and National Institute for Visually Handicapped in Dehradun were interviewed while for the detailed survey, 70 users of Delhi Metro were asked to fill up the detailed questionnaire.
The interviews with sampled PVIs were conducted on and off site to gain an in-depth perspective to the mobility challenges including wayfinding in using the Delhi Metro system. Among the people who were personally interviewed, 70% had complete loss of vision while 30% had severe to moderate vision impairments. The results from visual observations (trace study and access audit), survey interviews were further analyzed and discussed.
FIGURE 1 Research methodology flowchart (Source: Authors).

98 TR Circular E-C262: TRANSED 2018
ACCESS AUDIT AND OBSERVATION FEEDBACKS
The accessibility audit and trace study observations involving PVIs in the given MRTS context led to wide range of structured understanding which has been classified sequentially (zone and element wise) as part of trip chain.
1. Drop-off point to entrance. Abrupt level changes and inconsistent pedestrian facilitieson the way to entrance, with low contrast flooring in external environments were observed as initial barriers. Lack of sensory cues and consistent tactile guiding framework leading to challenges in orienting and wayfinding. Signage and other information systems were found to be legible with requirements for improvisation through sensory layers.
2. Ticketing area, public amenities. The ticketing area was approached by a tactileflooring system leading to the counters. However, long queues and information organization remain a challenge for PVIs to maneuver independently (Figure 2). Movement from external environment to the ticketing area were found to have variations between one station and the other specially with tactile layouts for guiding PVIs to the ticketing zones.
3. Security and automatic fare collection (AFC) flap gates. The security check zonesalong with AFC gates did not find a consistent tactile form of guidance. Further luggage identification through scanner checks was observed as a challenge to PVIs (Figure 2). However, the human assistance being provided by the Delhi Metro staff was found to be professional and supportive. The timing for opening and closing of flap gates was found to be less for some users with visual impairment leading to confusion at times.
4. Vertical movement. Vertical circulation was observed through three distinct modesincluding staircases, escalators and elevators. This itself adds a flexible dimension and a mobility choice to the PVIs depending upon the degree and nature of vision impairment. The step edges and landings have color contrast and tactile indications in consistent manner. However, a layer of sensory information through braille plates on handrails would improve access for person with complete blindness. In case of elevators, braille information was integrated in the lift control panels but a high footfall of passengers and their cultural behavior poses a challenge for PVIs and other disabilities.
FIGURE 2 Ticketing zone with multiple information and AFC gates at Rajiv Chowk Metro Station (Source: https://www.deccanherald.com/content/461517/metro-looks-
shrink-queues-exact.html).

Raheja and Sinha 99
5. Platform Area. The platform area was found to have edge lines in contrasting yellowcolor with movement guided through the tactile tiles including warning and guiding features. The same was found to be a critical aid in guiding wayfinding to the coach. The metro stations have been over the years improving with new features for passenger safety including installation of Platform screen doors. This would aid in enhancing safety for PVIs and avoid accidental falls into the platform zone. As a principle of Tolerance of Error, it contributes greatly to the UD mandate in MRTS.
6. Metro Coach. The coach design has level entry with platforms and remains a hugelyaccessible component of the Delhi metro in enhancing mobility with access and affordability. The challenges in the coach design for PVIs include braille information, audio enhancement features in times of noisy travel, luggage storage for travel to mobility hubs or interchange terminals, etc. Due to different phases of operational metro rail now, the coach design(s) have both real time and fixed information display. However, Delhi metro provides escort services for PVIs for additional support as human assistance, it would still be considered appropriate to additionally look into information and technology-based assistance in improving coach design.
7. Tactile Ground Surface Indicators (TGSI). TGSI’s remain one of the critical mobilitycues in moving through any built environment. MRTS like Delhi metro has been one of the initial examples to initiate a culture of tactile guiding systems in transportation. Over the years of growth of Delhi metro and expanse in Delhi and other cities, laying of TGSI’s has seen newer forms of layouts adding to the inconsistency. It is important to understand the impact of such inconsistencies on the mobility of PVIs for whom they become cognitive cues of wayfinding and edge detection for warning/guidance. Some of the critical observations of TGSIs were observed as viz. absence of TGSI connect with nearest public transport from entry/exit of MRTS station, absence of grab rails along with TGSI in angular and circular geometries of station spaces, diverse types of junction designs leading to inconsistency across the Delhi Metro System (Figure 3 and Figure 4).
FIGURE 3 Inconsistent variation in TGSI layouts (Source: Authors).

100 TR Circular E-C262: TRANSED 2018
FIGURE 4 Typical TGSI layout at platform level (Yellow line) (Source: Authors).
SURVEY RESULTS AND DISCUSSION
Personal interviews with around 70 PVIs led to an understanding of their choices, breaking myths about what could be perceived as barriers or facilitators in moving through Delhi metro. The results have been summarised and reported providing an insight into specific user perspectives and interface with MRTS. Of the survey group, 40% of the users traveled quite frequently by Metro while 30% of them chose to take Metro based on their trip length while the rest 20% rarely used the services. On the issue of tactile guiding tiles, 10% of PVI at NAB (off site interviews) shared that its current layout aids their movement with independence while 20% of the users remarked it as confusing and inconsistent. Variations in TGSI layout was highlighted as a confusion by most respondents (70%) especially at junctions and identifying services like elevators (Figure 5); 70% of PVIs reported to have never used and relied on the same. Almost half of the users surveyed (50%) expressed that they could easily detect floor levels and intermediate changes in them in the given MRTS environments of Delhi Metro.
It was striking to note that almost all of them agreed that audio announcements provided in Delhi metro were extremely helpful. Use of public amenities remains a divided subject amongst the survey respondents; 50% of them stated that they have never used public toilet on
FIGURE 5 Variation in TGSI layout for access to elevators (Source: Authors).

Raheja and Sinha 101
Delhi metro, while 40% of them reported that it was challenging and confusing for them to way-find the toilet.
Thirty percent of PVI have been using the recent mobile apps or any other technologies for Navigation in Delhi Metro. One of the greatest barriers while trip making was highlighted as orientation and locating the entry–exit point in metro station.
41% of the users never noticed the “you are here” map in Metro stations; 75% of the users thought that the information (textual) display system in ticketing zone is organized and legible, rest 25% reported it as unorganized and illegible. Some users (53%) informed that they follow general public movement to locate the entrance to metro stations, while the other 47% use external signage for the same. Fifty-eight percent of the people did not find connectivity of entrance to the drop-off point as satisfactory; 71% of the users said that the illegibility of signage is due to improper location while others marked the option for improper color and font size.
Some users (76%) suggest signage as a way for identifying landmarks while 49% of the users think that the warning signage is not accessible from the common public space; 75% users either use tactile tiles or colored footprints while the rest 25% never used/noticed. Fifty-eight percent users think public toilets are directly accessible but not easy to locate while 33% said they are located in inaccessible corners. During the rush hours, 62% users accessed escalators while only 8% used elevators and 30% went for staircase.
Overall, the respondents felt that development of Delhi Metro as an MRTS in the city of Delhi is a welcome feature for accessible and safe travel. With its evolution further, the users also expect an improved set of features. Some of the users were using the Human Assistance Services for Delhi Metro, while some others felt improvements in wayfinding through sensory and tactile systems could be prioritized and standardized. Last-mile connectivity from MRTS to either place of stay or work remains a larger subject to be addressed jointly by MRTS and the other transport services in order to make it a seamless, integrated and an inclusive model. It was also observed and understood from the PVIs that mobile communication provides a big support and aid in ease of wayfinding in several contexts. However, there remains a scope to intervene into consistency of information design, planning and improve its adequacy. Likewise, the tactile systems of floor guidance in metro rail systems in general and Delhi Metro in specific require to simulate and adopt a best practice of providing tactile information.
CONCLUSIONS
The Project on Wayfinding Systems for People with Vision Impairments in MRTS revealed numerous significant facts regarding the critical issues in daily life of PVIs while accessing MRTS. It brings to light a whole range of physical and sensory elements of the MRTS design and planning that impact on wayfinding and navigation for PVIs through both observation and interaction with users. Delhi Metro remains a unique example of emergence and application of UD philosophy in practice. This study reveals its experience with PVIs, shares their insights on various barriers and facilitators existing amidst diverse mobility situations.
These issues when addressed with empirical knowledge and understanding can lead to better development of features in MRTS in India. The study finds key barriers for PVIs as information availability in multi modal formats, inconsistency of tactile guiding indicators, tactile information on handrails, security check points, access to lift points, orientation in external environments. While the barriers provide a scope for reasonable improvement within the
102 TR Circular E-C262: TRANSED 2018
MRTS, the key facilitators emerging form the study include multiple options of vertical circulation, seamless access between platform and metro coach, audio announcements, human assistance provided by Delhi Metro, etc. It is imperative to interpret UD in this particular context to strengthen an enabling experience of movement in the Metro stations and add value through inclusion of diversity.
This paper paves way for future research to be initiated into the post occupancy evaluation studies of improving mobility interface of various disabilities with built infrastructure. It can be well assumed that inclusive urban futures significantly rely on integration in mobility systems. ACKNOWLEDGMENTS This research acknowledges the support provided by Ministry of Human Resources and Development, Government of India and Delhi Metro Rail Corporation, New Delhi. REFERENCES 1. Sinha, K. India has largest blind population. 2007. Available at
https://timesofindia.indiatimes.com/india/India-has-largest-blind-population/articleshow. Accessed Sept. 25, 2018.
2. WHO. Blindness and Vision Impairment. 2018. Available at http://www.who.int/news-room/fact-sheets/detail/blindness-and-visual-impairment. Accessed Sept. 25, 2018.
3. Passini, R., and G. Proulx. Wayfinding without Vision: An Experiment with Congenitally Totally Blind People. Environment and Behavior, 1998, pp. 227–252. Available at https://www.stolaf.edu/people/huff/classes/Readings/Passini'88.pdf. Accessed Sept. 23, 2018.
4. Human Wayfinding and Cognitive Maps. Wayfinding Behavior: Cognitive Mapping and Other Spatial Processes (R. G. Gulledge, ed.), The Johns Hopkins University Press, Baltimore, Md., 1999, pp. 5–45.
5. Raubal, M. Agent-Based Simulation of Human Wayfinding: A Perceptual Model for Unfamiliar Buildings. Ph.D. thesis. Faculty of Science and Informatics, Vienna University of Technology, 2001.
6. Carpman, J. R., and M. A. Grant. Design That Cares: Planning Health Facilities for Patients and Visitors (2nd ed.), American Hospital Publishing, Chicago, 1993.
7. Xia, J., C. Arrowsmith, M. Jackson, and W. Cartwright. The Wayfinding Process Relationships Between Decision-Making and Landmark Utility. Tourism Management, Vol. 29, 2008, pp. 445–457.
8. Mace, R. Universal Design: Barrier-Free Environment for everyone. Los Angeles, CA: Designers West, 1985.
9. Universal Design: Creating Inclusive Environments (E. Steinfeld and J. L. Maisel, eds.), Wiley & Sons, Hoboken, N.J., 2012.

103
CONFERENCE PAPERS
Demonstration Experiments for Autonomous Minibus and Comprehensive Transportation Policies of Local Governments
SOICHIRO MINAMI
Chuo University–FFJ-EHESS
HIDETADA HIGASHI Yamanashi Gakuin University
utonomous vehicle technology (AVT) is advanced as a solution to transportation problems, such as improving the quality of life for low-mobility persons. Several hurdles associated
with safety risks and uncertainty, however, hinder its social implementation. The purpose of this study is to elucidate the social implementation of AVT by analyzing case studies of autonomous minibus experiments in Europe and Japan. In Europe, experiments are usually initiated by local governments, and although implemented in few areas, these are frequently long term or permanent and accessible daily to everybody. In Japan, experiments are initiated by the central government and implemented in many areas. These are commonly single events lasting about a week. Access to the autonomous minibus in Japan is limited and requires reservation or registration; moreover, it is not accessible daily. This study reveals that the social implementation of the emerging mobility technology can be effectively promoted by local governments. Local governments, which is in charge of local transportation policies, are requested to have an initiative to plan the demonstration experiments of AVT and MaaS suitable with the local transportation plan. INTRODUCTION The purpose of this study is to elucidate the social implementation of AVT. The technology is advanced as a solution to transportation problems, such as improving the quality of life of PRM. It is associated with safety risks and uncertainty that must be overcome for its social implementation. AVT is described at times as a disruptive innovation yet to spread and be implemented. Recently, demonstration experiments of autonomous minibus have been implemented in many areas to develop the technology and resolve safety concerns. The objectives of these demonstrations include technical inspection, improving the life of people, and assessing impacts on the community and economy. In this study, case studies are analyzed from an interdisciplinary perspective comprising Management of Technology (MOT) and Transportation Economics (TE). METHODS We analyzed case studies from Japan, Switzerland, and France to clarify the implementation success of the autonomous minibus. The contributions of demonstration experiments to
A
104 TR Circular E-C262: TRANSED 2018
technological development and the feedback for social implementation of the autonomous minibus were evaluated using MOT. The position in the local transportation policy or strategy, the relation to comprehensive local transport plans and policies, and the impact of the service for low-mobility persons were assessed based on TE. We analyzed the subjectivity, role, and authority of local governments in the demonstration experiments. CASE STUDIES IN EUROPE (FRANCE AND SWITZERLAND) Situation State of Technology The leading companies of AVT in Europe are NAVYA and Easy Mile. Both are French companies founded in 2014, being NAVYA based in Lyon and Easy Mile in Toulouse. The NAVYA, with over 200 employees in France and the United States, developed the autonomous shuttle (minibus) and autonomous cab (taxi) (1). Easy Mile, with it’s over 100 employees, developed the EZ10 autonomous minibus and the autonomous Electric Baggage Tractor (2). Social Background of European Transport Policy The principal consideration in European transport policies is the sustainability or Sustainable Transport. The sustainability concept includes environmental protection, guarantee for transportation rights, and the impact on regional society and economy. The European Commission Joint Expert Group defines transportation rights as allowing basic access, needs, and development of individuals, companies, and society to be met safely, in a manner consistent with human and ecosystem health, and promoting equity within and between generations (3). In fact, transportation rights contributed significantly to the introduction of MaaS in Finland. This, therefore, provides context for understanding the evolution of autonomous vehicles in Europe.
European countries established new transportation laws and decentralized transport policies starting from the early 1980s. In 1982, LOTI (Domestic Transport Orientation Law), instituted in France, became the first law on transportation rights and was integrated in the transportation code in 2010. The Transport Act 2000 secured transportation rights in the U.K. in 2000. These laws define and mandate comprehensive local transport plans, including the Urban Mobility Plan (Plan de Déplacements Urbain) in France and Local Transport Plan in the U.K. A Comprehensive Local Transport Plan (CLTP) is a legally binding target to supply any traffic service, to invest any transport infrastructure, and to allocate traffic usage as a common social service in a region. It must fulfill criteria, including environmental, social, and economic sustainability, bound by planning or targets in each sector agreed through public participation (4).
A CLTP also includes strategies to introduce innovative technologies for sustainable mobility. Integration of the autonomous traffic service in comprehensive and systematic public transport networks through a CLTP is crucial for AVT’s contribution in the realization of MaaS.
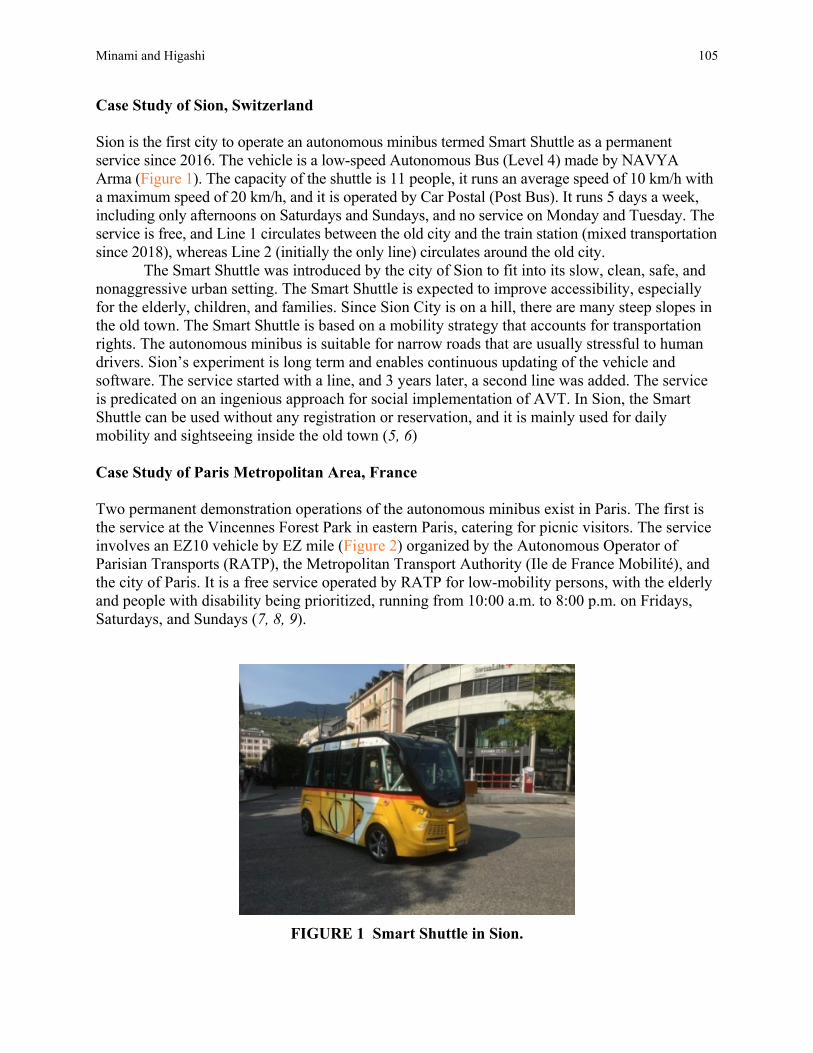
Minami and Higashi 105
Case Study of Sion, Switzerland
Sion is the first city to operate an autonomous minibus termed Smart Shuttle as a permanent service since 2016. The vehicle is a low-speed Autonomous Bus (Level 4) made by NAVYA Arma (Figure 1). The capacity of the shuttle is 11 people, it runs an average speed of 10 km/h with a maximum speed of 20 km/h, and it is operated by Car Postal (Post Bus). It runs 5 days a week, including only afternoons on Saturdays and Sundays, and no service on Monday and Tuesday. The service is free, and Line 1 circulates between the old city and the train station (mixed transportation since 2018), whereas Line 2 (initially the only line) circulates around the old city.
The Smart Shuttle was introduced by the city of Sion to fit into its slow, clean, safe, and nonaggressive urban setting. The Smart Shuttle is expected to improve accessibility, especially for the elderly, children, and families. Since Sion City is on a hill, there are many steep slopes in the old town. The Smart Shuttle is based on a mobility strategy that accounts for transportation rights. The autonomous minibus is suitable for narrow roads that are usually stressful to human drivers. Sion’s experiment is long term and enables continuous updating of the vehicle and software. The service started with a line, and 3 years later, a second line was added. The service is predicated on an ingenious approach for social implementation of AVT. In Sion, the Smart Shuttle can be used without any registration or reservation, and it is mainly used for daily mobility and sightseeing inside the old town (5, 6) Case Study of Paris Metropolitan Area, France Two permanent demonstration operations of the autonomous minibus exist in Paris. The first is the service at the Vincennes Forest Park in eastern Paris, catering for picnic visitors. The service involves an EZ10 vehicle by EZ mile (Figure 2) organized by the Autonomous Operator of Parisian Transports (RATP), the Metropolitan Transport Authority (Ile de France Mobilité), and the city of Paris. It is a free service operated by RATP for low-mobility persons, with the elderly and people with disability being prioritized, running from 10:00 a.m. to 8:00 p.m. on Fridays, Saturdays, and Sundays (7, 8, 9).
FIGURE 1 Smart Shuttle in Sion.

106 TR Circular E-C262: TRANSED 2018
FIGURE 2 Ez10 in Vincennes Forest Park.
The second service is at La Defense business area in the west of Paris. It utilizes an Arma
vehicle from NAVYA and is organized by Ile de France Mobilité and operated by Keolis, including two lines. It is a free service for everyone, comprising a Northern line running from Mondays to Fridays every 10 min from 9:00 a.m. to 8:00 p.m. and a Southern line at the same frequency every day from 10:00 a.m. to 8:00 p.m. (weekdays from 9:00 a.m.) (10). Case Study of Lyon, France The autonomous minibus experiment has been ongoing since 2016 in the Lyon Metropolis. The minibus service operating in the Southern redevelopment area uses NAVYA’s Arma vehicle similar to the city of Sion. It is a free service not requiring reservation, covering the last mile of the tramway. The vehicle runs every 30 min (15 min during peak hours) from 7:30 a.m. to 7:00 p.m. Mondays to Fridays and from 10:00 a.m. to 7:30 p.m. on Saturdays. The service involved 22,000 passengers from September 2016 to October 2017 (11). Features of Demonstration Experiments in Europe In Europe, experiments operate permanently at high frequency daily or weekly. The operation is open to everyone, and reservation is not needed. In some cases, however, priority is accorded to persons with low mobility.

Minami and Higashi 107
STUDIES IN JAPAN
State of Technology
The rural areas project of the MLIT involves four autonomous vehicles (12). These include a cart-type autonomous vehicle produced by Yamaha Motor Co., an autonomous car produced by AISAN TECHNOLOGY CO., Ltd., an improved minibus by Advanced Smart Mobility Co., Ltd. (AS-Mobi), and Easy Mile’s EZ10 introduced by DeNA. The vehicle from Yamaha Motor Co. is based on the magnetic automatic guide used in Golf courses, whereas the vehicle from AISAN TECHNOLOGY CO. (a software developer for surveying and civil engineering) is equipped with light detection and ranging (lidar) technology. The improved minibus (type Hino Liesse) from AS-Mobi (a venture company based on an Advanced Mobility Research Center in the Institute of Industrial Science at the University of Tokyo) involves the lidar and magnetic guide. DeNA is the largest application for smartphone developers in Japan and has a partnership with Easy Mile (13).
Another important company in the sector is the SoftBank Group (a subsidiary of SB Drive) (14). SoftBank Corp. is a leading software wholesale company and one of three major mobile phone carriers. SB Drive has partnerships with the AS-Mobi and NAVYA companies, indicating both French autonomous minibus companies have agents in Japan (DeNA-Easy Mile and SoftBank-NAVYA). Demonstration experiments by DeNA and SoftBank are restricted to private properties (e.g., university campus or parking lot of large mall) (13, 14).
Japanese automobile manufacturers are also developing AVT, including the technology by Toyota Motor Company in partnership with SoftBank and Uber Technology. The automobile companies are, however, exploring autonomous vehicles and the MaaS business independently from the MLIT experiment projects.
Social Background of Transport Policy in Japan
Mobility in provinces and rural areas in Japan has been problematic since the beginning of the 21st century. Deregulation in public transportation caused many private operators to terminate bus and rail lines in provinces and rural areas. Following these terminations, municipalities started operating mobility services substitutes.
To cope with the problems, the Japanese government enacted new transportation laws, including the Act on Revitalization and Rehabilitation of Local Public Transportation Systems in 2007 (revised in 2014) (15) and the Basic Act on Transportation Policy in 2013 (16). The new laws require implementation of Local Public Transport Network Plans developed by municipalities with a minor role in the local mobility policy for municipalities. Unlike in France and the U.K., the establishment of a plan is optional.
Demonstration Experiments in Rural Areas by the MLIT
The MLIT has implemented some demonstration experiment projects. The largest project is the autonomous vehicle service based on Michi-no-Eki and other facilities in the Chusankan, mountainous in English, rural area (12, 17). The aim of the project is to ensure and provide mobility logistics in depopulating areas facing lack of public transportation using autonomous technology. The Michi-no-Eki is a roadside rest area in Japan with shops and other public

108 TR Circular E-C262: TRANSED 2018
facilities, established as a joint project between the road administrator (MLIT or prefecture) and municipalities. It is therefore suitable as a base for mobility demonstration.
This project is an experiment involving a public offering, and the MLIT selects locations for experiments based on applications from municipalities. The selected areas include areas for technical verification termed Designation, areas for verification of the business model termed Application, and areas for assessment through desk studies (no experiment) referred to as Feasibility Study. In this project, 18 areas were selected, and 13 demonstrations were performed from September 2017 to March 2018, with each demonstration lasting about a week. The AISAN, AS-Mobi, Yamaha, and DeNA EZ10 vehicles operated as Lv2 and Lv4 (Table 1) were accessed only by selected monitors with pre-registration. Features of Demonstration Experiments in Japan The primary aim of demonstration experiments in Japan is to acquire technical verification for the establishment of regulation for autonomous vehicles and road regulation. Secondary aims include social acceptance and verification of the business. Experiments in Japan are one-time, low-frequency, short-term operations restricted to randomly selected monitors with reservation. Technical verification requires long-term experiments because short-term experiments only allow the Japanese government, researchers, and developers to acquire limited data. The effects
TABLE 1 List of Demonstration Experiments at Michi-no-Eki by MLIT in 2017 (FY) Name of Michi-no-Eki
or Facility Name of
Municipality Name of
Prefecture Type Period
(mm/dd) Vehicle Type
Service Length
No. of Monitors
Cosmall Taiki Taiki Town Hokkaido App 12/10–12/17 AS 7.6 km 120 Kamikoani Kamikoani
Village Akita Des 12/3–12/10 YM 3.2 km 100
Takahata Takahata Town Yamagata App 2/25 – 3/4 AI 20 km 90 Hitachiota Hitachiota City Ibaraki App 11/18 – 11/25 YA 3.2 km 160 Nishikata Tochigi City Tochigi Des 9/2 - 9/7 EZ 2.0 km 70 Yamakoshi-ORATARU Nagaoka City Niigata FS Taira Nanto City Toyama App 11/26 – 11/30 AI 16 km 70 Minami-Alps-Mura Hase Ina City Nagano App 2/10 – 2/16 AS 5 km 160 Meiho Gujo City Gifu FS Donguri-no-Sato Inabu Toyota City Aichi FS Oku-Eigenji Keiryu-no-Sato Higashiomi
City Shiga Des 11/11 – 11/17 AS 4.6 km 120
Imoko-no-Sato Otsu City Shiga FS Akagi-Kogen Iinan Town Shimane Des 11/11 – 11/17 AI 5.7 km 60 Koigakubo Niimi City Okayama App 3/3 – 3/16 YM 2.2 km 200 Kusunoki Komorebi-no-sato* Ube City* Yamaguchi FS Nishiiya Kazurabashi Miyoshi City Tokushima App 12/3 – 12/9 AI 7.2 km 80 Branch office of Yamakawa* Miyama City* Fukuoka App 2/17 – 2/24 YA 10 km 80 Ashikita DEKOPON Ashikita Town Kumamoto Des 9/30 – 10/7 YA 6.3 km 100 NOTE: [Type] Des: Designation, App: Application, FS: Feasibility Study. [Vehicle Type] AS: AS-Mobi (Lv2 and Lv4), AI: AISAN (Lv2 and Lv 4), YM: Yamaha (Lv2 and Lv 4), EZ: DeNA
EZ10 (Lv4). * Bases of Ube City and Miyama City are not Michi-no-Eki. Source: MLIT (12).

Minami and Higashi 109
of mobility, the impacts on the society, and the assessment of the autonomous service business can also not be adequately addressed by short-term experiments.
The MLIT evaluated applicant areas only from the technical examination perspective. The experiments in Japan were planned without considering regional transport policies, such as the quality of the local transportation plan. A serious existing problem is the collapse of the public transport networks, which, until the end of the 20th century, were protected by regulations. The operators were able to sustain the main bus lines, train service, and rural bus services through an integrated network. After deregulation of public transportation, many rural bus services were transferred to municipalities, causing isolation from existing networks. The experiments done by the MLIT were therefore mostly in the area with isolated mobility services. The Japanese government must address the challenges of integrating new autonomous mobility services in existing transport networks. Evidently, the current state of autonomous mobility in Japan remains distant from realizing MaaS. RESULTS Comparison Between Autonomous Minibus Experiments in Europe and Japan The case studies examined reveal differences in transportation policies of various countries, and the decentralization of transportation policies affected the outcome of the experiments. The experimental projects in Japan are initiated by the central government and involve a public offer to which municipalities apply to host projects. These are short-term demonstrations which yield limited findings. Contrarily, in France and Switzerland, the experimental projects are initiatives of the local governments. In these cases, the autonomous minibus services for demonstration are part of the local transportation plan or strategy. These are long-term bus services, and findings from the experiments provide adequate feedback for technology development and improvement of transportation policies. Concurrently, initiatives by local governments lower obstacles for social implementation of the autonomous minibus technology through zoning and special regulation. A comparison of the results between Japan and Europe is presented in Table 2. Implication of Sion Case as a Desirable Demonstration The primary objectives of the demonstration experiments are technical inspection, investigation of improvement in the lives of people, and assessment of the impact on society. A desirable demonstration must integrate views of developers, users, and residents. In this respect, the experiments conducted in Japan are not optimal due to the short duration and limited users. In Japan, however, the objectives are mainly technical verification and assessment of the business model. That is, demonstration experiments in Japan are not designed to assess the impact on residents and the society in the region. For residents, demonstration experiments are one-time leisure events like a “fair ride” in an amusement park. This “fair ride” approach, however, provides little contribution to technical verification and has limited implications for business models.

110 TR Circular E-C262: TRANSED 2018
TABLE 2 Comparison Between Autonomous Minibus Experiments in Europe and Japan Europe Japan
Key actor Local governments Central government (MLIT) Number of places A few places Many places Number of passengers
Many people A few persons
Operating period Long term or middle term* as a permanent service
Short term (only 1 week) as a temporary demonstration
Accessibility Everybody, without reservation Only monitors (reservation is obligatory) Operator Bus operator Developer/agent of the vehicle Daily use Possible Impossible Aim of experiment Inspection of technology and
assessment of social effect Technological assessment and seeking new traffic business
Mobility strategy Defined in transportation plan Developing new bus lines *Some areas in Europe have implemented middle-term experiments lasting 1–3 months1, 2.
In contrast, the Sion case study is advantageous for technical verification and societal impact assessment. It demonstrates the inferior technical performance of the autonomous shuttle compared with existing cars in terms of value proposition, including speed and mileage. That is, the city of Sion is not attempting to introduce autonomous driving as a technical feature relative to existing cars. The autonomous shuttle allows the recognition of new value propositions, including harmlessness, convenience for mobility-impaired people, and low operational cost. The autonomous shuttle in Sion is a permanent service to solve local mobility problems through its daily use by residents. It can trigger lifestyle changes in residents and therefore allow assessment of its impact on society and improvement of people’s lives.
The case of Sion demonstrates a better way to introduce potentially disruptive innovation involving high risk and danger. The critical detail of the case study is the ingenious design of the operational design domain. This implies the city of Sion designed the transportation plan of the city with accommodation for the autonomous shuttle.
Such design incorporates five keys elements, including • Risk management associated with the use of nascent technology on public roads; • Minimization of conflict with existing propositions and networks; • Control of the social circumstance and technical environment for the experience; • Control of the product performance to reduce the risk and danger,; and • Design of a product suitable for the city (Figure 3).
CONCLUSIONS This study reveals social implementation of the autonomous minibus necessitates initiation by local governments familiar with local circumstances, including mobility problems. Long-term or permanent demonstration experiments are useful for the generation of data and knowledge for technical inspection, the effect on mobility, and the impact on the regional society. The study
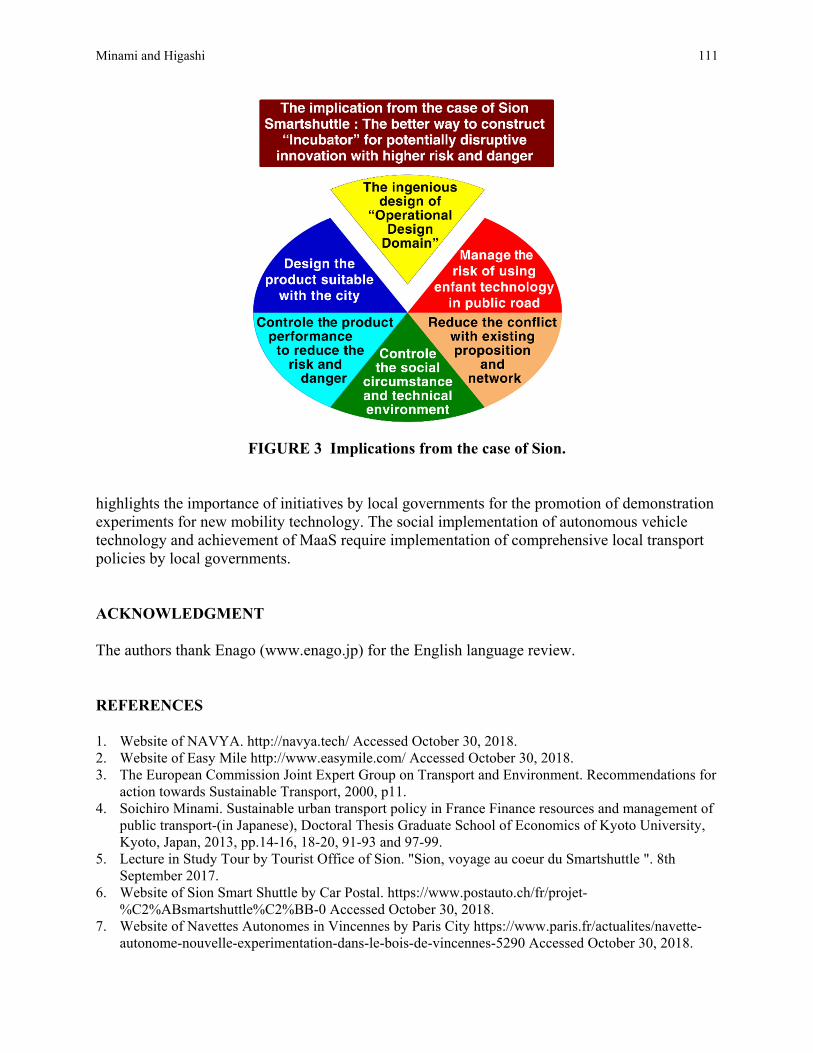
Minami and Higashi 111
FIGURE 3 Implications from the case of Sion.
highlights the importance of initiatives by local governments for the promotion of demonstration experiments for new mobility technology. The social implementation of autonomous vehicle technology and achievement of MaaS require implementation of comprehensive local transport policies by local governments. ACKNOWLEDGMENT The authors thank Enago (www.enago.jp) for the English language review. REFERENCES 1. Website of NAVYA. http://navya.tech/ Accessed October 30, 2018. 2. Website of Easy Mile http://www.easymile.com/ Accessed October 30, 2018. 3. The European Commission Joint Expert Group on Transport and Environment. Recommendations for
action towards Sustainable Transport, 2000, p11. 4. Soichiro Minami. Sustainable urban transport policy in France Finance resources and management of
public transport-(in Japanese), Doctoral Thesis Graduate School of Economics of Kyoto University, Kyoto, Japan, 2013, pp.14-16, 18-20, 91-93 and 97-99.
5. Lecture in Study Tour by Tourist Office of Sion. "Sion, voyage au coeur du Smartshuttle ". 8th September 2017.
6. Website of Sion Smart Shuttle by Car Postal. https://www.postauto.ch/fr/projet-%C2%ABsmartshuttle%C2%BB-0 Accessed October 30, 2018.
7. Website of Navettes Autonomes in Vincennes by Paris City https://www.paris.fr/actualites/navette-autonome-nouvelle-experimentation-dans-le-bois-de-vincennes-5290 Accessed October 30, 2018.
112 TR Circular E-C262: TRANSED 2018
8. Website of Navettes Autonomes in Vincennes by RATP https://www.ratp.fr/groupe-ratp/newsroom/nouvelles-mobilites/navettes-autonomes-lancement-dune-nouvelle-experimentation Accessed October 30, 2018.
9. Website of Navettes Autonomes in Vincennes by STIF https://www.iledefrance-mobilites.fr/actualites/lexperimentation-navettes-autonomes-ile-de-france-se-poursuit-a-vincennes/ Accessed October 30, 2018.
10. Website of Navettes Autonomes in La defence by Navia https://navya.tech/navettes-autonomes-navya-a-paris-la-defense/ Accessed October 30, 2018.
11. Inteview to Mr. Keroum SLIMANI, Chef of Mobility Projet at Grand Lyon Metropole. 14th September 2017.
12. Web site of Autonomous vehicle service based on Michi-no-Eki and other public facilities in Chusankan rural area by MLIT. http://www.mlit.go.jp/road/ITS/j-html/automated-driving-FOT/index.html Accessed October 30, 2018.
13. Website of Robot Shuttle by DeNA. https://robot-shuttle.com/ Accessed October 30, 2018. 14. Website of SB Drive. https://www.softbank.jp/drive/ Accessed October 30, 2018. 15. Act on Revitalization and Rehabilitation of Local Public Transportation Systems. MLIT.
http://www.mlit.go.jp/sogoseisaku/transport/sosei_transport_tk_000055.html. Accessed Oct. 30, 2018.
16. Basic Act on Transportation Policy. MLIT. http://www.mlit.go.jp/sogoseisaku/transport_policy /sosei_transport_policy_tk1_000010.html. Accessed October 30, 2018.
17. Shinji ITSUBO, Kazuya TAMADA et al. Public acceptance analysis of automated driving through field operational tests using michi-no-eki as a base of a service. Japan Society of Civil Engineers: Proceedings of Infrastructure Planning, 2018, vol.57, 4 pages.
113
CONFERENCE PAPERS
Community-Based Approach to Addressing Transportation Needs for Rural Older Adults in Canada
Progress in Research
TREVOR R. HANSON MATTHIEU GOUDREAU
DAVID COPP University of New Brunswick
ver the last 60 years, rural areas of Canada have become increasingly car-dependent and among the most rapidly aging. In areas such as New Brunswick (pop. 750,000), a Province
on Canada’s east coast where approximately 50% of the population lives in rural areas, there have been few if any transportation options for rural older adults who are unable to drive themselves. Local non-profit groups have organized volunteer-based automobile transportation in response to this need, facilitated in part through public funding, though early on faced challenges that limited widespread development.
This paper presents a summary of research undertaken in New Brunswick, Canada, towards understanding the use of Volunteer Driver Programs to help older adults meet their transportation needs.
This paper describes the development of these programs in New Brunswick over time, as well as profiling the progress in research, including exploring how transportation engineering and planning tools can be used to support program development. Research includes developing a common data collection and reporting standard for programs; quantifying "successful" programs through a maturity model; the potential for autonomous vehicles to address rural transportation needs.
The lessons of the New Brunswick experience can be valuable for car-dependent rural jurisdictions looking for low-cost solutions to assist older adults who cannot meet their transportation needs independently. INTRODUCTION The Province of New Brunswick, Canada is located on Canada’s east coast (Figure 1) and is home to about 750,000 people in a land area of 71,400 km2 (1), or approximately twice the geographic area of Taiwan, with about 3% of the population (2). Approximately 50% of the population lives in three metropolitan areas ranging from 102,000 to 145,000 people (1), with the remainder living in smaller cities, towns, villages and unincorporated rural areas, connected province-wide through 18,000 km of roads (not including municipal streets) (3). The primary mode of transportation in New Brunswick is the automobile, with 91% of the 280,000 workers commuting most of the time by car, truck or van; only 2.2% of commuters travel by public transit (4).
O

114 TR Circular E-C262: TRANSED 2018
FIGURE 1 New Brunswick in Canada (Source: Google Maps).
This dependence on the automobile for transportation presents a challenge for jurisdictions like New Brunswick, which also has a rapidly aging population. Presently, nearly 20% of New Brunswick’s population is over the age of 65, tied for the highest percentage in Canada (5) and this percentage is projected to increase to over 30% by the year 2038 (6). In Foley et al.’s highly cited work, “Driving Life Expectancy of Persons Aged 70 Years and Older in the United States”, their data suggests that drivers aged 70 to 74 years will outlive their ability to drive by 7 years (men) and 10 years (women) (7). In a car -dependent, low-population density environment like New Brunswick, it can be expected that there will be a significant part of the older adult population which will find itself dealing with the challenges of driving cessation and seeking alternatives.
The Rural and Urban Transportation Advisory Committee (RUTAC) to the Economic and Social Inclusion Corporation (ESIC) of New Brunswick (an anti-poverty government agency in New Brunswick) highlighted this issue in its 2017 transportation strategy submission to the New Brunswick government: “there is currently no plan to help prepare for the number of people in this group who will look to transition from being drivers to passengers due to health effects of aging and the onset of a disability” (8). The RUTAC strategy also highlighted that 37% of New Brunswickers live in rural unincorporated areas where there is no access to public transit.
Though New Brunswick lacks a long-term transportation plan for public transportation, there have been considerable advancements in the provision of volunteer-based transportation emerging through grassroots non-profit organizations, many of which now receive some sort of public financial support. This paper describes the development of these programs in New Brunswick over time, as well as profiling the progress in research, including exploring how transportation engineering and planning tools can be used to support program development. The
Province of New Brunswick,

Hanson, Goudreau, and Copp 115
lessons of the New Brunswick experience can be valuable for car-dependent rural jurisdictions looking for low-cost solutions to assist older adults who cannot meet their transportation needs independently.
Volunteer Driver Programs as a Rural Transportation Solution in Car-Dependent Environments The use of volunteer transportation as a low-cost transportation solution is not new, though organizations like the Independent Transportation Network of America (ITN America) have employed a more user-centric approach that focuses on a way to help older adults transition from the “driver’s seat to the passenger seat” (9). The defining features of the programs such as ITN America are that volunteer drivers use their own vehicles to transport passengers (who are members of the organization and pay a nominal fee) to various destinations (often medical or work related) under the auspices of a non-profit or charity dedicated to the activity. Drivers are typically compensated for vehicle wear and tear, have their insurance covered by the organization, undergo a background check, and are dispatched from a central dispatch.
In 2008, the Committee on Paratransit (AP060), Accessibility Transportation and Mobility (ABE060) and Rural Public and Intercity Bus Transportation (AP055) of the TRB had the study of volunteer driver programs as a joint “Research Need” of the committees (10). The Research Need was entitled “Maximizing Benefits and Addressing Challenges of Volunteer Driver Transportation Programs” and included multiple research questions:
1. In what settings are volunteer driver programs meeting unmet needs and filling gaps
as an alternative or supplement to other service modes in transportation networks? 2. Where, when, and in what ways do volunteer driver programs complement or
compete with public and/or private operators; and, in what settings might such programs hinder the growth of public or private providers?
3. Why do certain volunteer driver programs succeed and why do others not? Are there common factors for success or lack of success?
4. What operational characteristics are central to successful programs and what elements of the program enhance a program’s long-term sustainability?
5. What additional metrics beyond those commonly used for demand-response transportation are currently used and should be used to measure the success of volunteer driver programs?
The purpose of publishing Research Needs Statements is two-fold: first, to provide an input to the research prioritization and funding arm of various U.S. transportation research funding programs (e.g. Transit Cooperative Research Program); second, to provide a vetted research area that could be used by other researchers to support their own independent research. Initial Challenges with Replicating Successful Volunteer Transportation in New Brunswick Hanson (11) reviewed the availability of alternative transportation in New Brunswick and concluded that “the most successful rural system appears to be a member-based service using passenger vehicles” called the Charlotte Dial-a-Ride, which served 134 members with 42 volunteer drivers. The service area was Charlotte County, a predominantly rural area of about
116 TR Circular E-C262: TRANSED 2018
27,000 people (25,000 in 2016) over an area of 3,400 km2 (12). The program relied on volunteer drivers using their own vehicles to provide transportation to organization members and coordinated through a central dispatch, like a taxi service. Unlike a taxi service, users had to be members and provide advance notice.
The success of this program in one area of New Brunswick led to efforts to replicate the model in other areas of New Brunswick, though the first spin-off program folded only a few months after beginning operation. The reasons for failure were growing too big, too fast; having too large a service area with too few volunteers; and having incomplete operational policies (13). Hanson (13) also concluded that there was a lack of any available scientific planning tools to support program development, with guiding documentation being case study- based. These issues reflected the broader issues identified in the 2008 TRB Research Needs Statement.
Growth in Rural Volunteer Transportation in New Brunswick Beginning in 2010 the Government of New Brunswick began formalizing its support for rural volunteer transportation through a stated policy within its Overcoming Poverty Together Plan (14), and operationalized the support through a government corporation called the ESIC. This financial support was distributed through non-profit agencies that acted as intermediaries between ESIC and the broader community, with these agencies helping to match priority community projects to available funding.
The staff of the Charlotte Dial-a-Ride were active in sharing their lessons and best practices, and in concert with available seed funding through ESIC, begat grassroots efforts in rural communities throughout New Brunswick to develop similar (but not identical) programs. It is likely that the “bottom-up” approach where the desire for a transportation solution came from a community itself helped to ensure support at the outset; this contrasted the more typical “top down” system approach which characterized the one New Brunswick program that ultimately failed. Since 2010, the number of volunteer transportation operators grew from 1 to 2, back to 1, eventually growing to seven or eight operators by 2015. Presently there are 13 similarly scoped operators covering most regions of New Brunswick, along with several other community van or bus initiatives (15). UNDERSTANDING SUCCESSFUL VOLUNTEER DRIVER PROGRAMS The apparent success of these regional rural volunteer driver programs operating in similar environments with similar organizational structures suggested that New Brunswick operators had developed a model for rural transportation that had the potential to be successful elsewhere. The challenge was in understanding and quantifying the success of these programs. The research described herein was conducted as part of a 5-year grant from the Natural Sciences and Engineering Research Council of Canada (NSERC) to develop planning and forecasting tools for age-friendly community transportation, specifically focused on volunteer driving. The research had four main objectives (abridged):
1. Develop an inventory of volunteer driver programs that is national in scope, focused on qualifying and quantifying their organizational and operational attributes;
2. Identify critical success factors for program deployment and sustainability;

Hanson, Goudreau, and Copp 117
3. Predict travel demand for a volunteer driver program; 4. Quantify the safety benefits of transitioning a medically-at-risk rural older driver to a
volunteer driver program.
Furthermore, ABE060 developed a new Research Needs Statement building from the 2008 Statement and incorporating these objectives (16). Beginnings of a Research Program Several nascent volunteer driver programs in New Brunswick assembled to create an informal network of operators that would share best practices. These programs were invited to participate in a research program that would involve understanding and quantifying how they provide transportation. The challenge, as identified in Hanson and Caissie (17) was that operators were not employing a common data collection standard or employing common definitions. The first step was to work with operators to identify what type of data would be relevant to their operations and could be standardized; many already had developed data processes to satisfy the operational needs of their organizations. New Brunswick also has two official languages, English and French, which meant the working language of the organizations could be either English only, French only, or both, and terminology needed to have the same meaning in either language. In 2016, researchers were able to secure participation from seven volunteer programs which agreed to collect travel data and share with the researchers. It took approximately one year for all the groups to buy in and transition to the new data collection approach.
The types of travel data that were being recorded and shared by the operators is described in a conference paper by Hanson and Goudreau (18). The data included information about a “Drive,” or the attributes (e.g. number of passengers, number of stops by purpose, time of day, mileage, and destination) for the time a volunteer was occupied serving a particular client or clients. This provided information that would lay the foundation for Objective #1 in the NSERC grant described above. The first full year of travel data collected in the template as described in (18) was between February 2017 and January 2018, and this data was presented at the 2019 TRB Annual Meeting.
A Novel Contribution: Identifying Critical Success Factors An additional objective for the research program was the identification of critical success factors; this was also a desired outcome of the 2008 TRB Research Needs Statement. The approach to developing these factors is described in a conference paper by Goudreau and Hanson (19), employing a "maturity" analysis, which is a measure of the extent to which a process is defined, managed, measured, and controlled (20). Goudreau and Hanson adapted a technique for understanding the construction industry, called the Construction Industry Macro Maturity Model (CIM3) developed by Willis and Rankin (21), for use in quantifying the maturity of processes in volunteer driver programs. Numerous best practice guides were sourced (primarily from the United States), including consultations with partner volunteer programs in New Brunswick, to identify 42 organizational processes as “Key Practices.” Program operators responded to a survey that associated a maturity level to each process, quantified to a score out of four, with groups categorized according to number of riders. This approach led the researchers to conclude
118 TR Circular E-C262: TRANSED 2018
that some practices were transitional in nature, with some key practices necessary at higher levels of maturity in earlier stages of group development. Communicating the Results At each stage of the research, results were communicated to participating volunteer driver programs. Initially, results were presented orally at the regular joint meetings of the operators. The more complicated findings, such as the maturity results and initial results from one year of travel data, were synthesized into a brief for the operators. The briefs were written in English and professionally translated into French. Research was also synthesized into Canadian conference papers, with more detailed results intended for international journal publications. THE FUTURE OF RESEARCH INTO VOLUNTEER DRIVER PROGRAMS The current outstanding research needs involve estimating potential travel demand for volunteer driver programs and quantifying the safety benefits of transitioning a medically-at-risk driver to being a passenger in a volunteer program. The nationally scoped inventory is also a need.
Estimating travel demand is complicated by the lack of household or individual travel data in New Brunswick. It is also unclear how much of user’s transportation is satisfied by a volunteer driver program. Initial efforts to estimate travel demand have involved applying estimated vehicle trip rates from a convenience sample of older adults in New Brunswick to the estimated number of older adults that require assistance with transportation to develop overall annual trip rates. The trip rates observed for the well-established Charlotte Dial-a-Ride program were extrapolated to the provincial level to estimate the proportion of overall trip demand potentially satisfied by a volunteer driver program, which was projected to align with demographic projections for 2038. Initial estimates using this method suggest that the number of trips expected to be taken in New Brunswick by older adults will increase by nearly 60% over the next 20 years, but further work is needed to refine these estimates. Nevertheless, corresponding growth in demand for volunteer transportation could likely be expected.
There are also opportunities to leverage transportation planning tools to facilitate the study of volunteer driver programs and their incorporation into transportation planning. For example, stated choice surveys in transportation are used in urban transportation surveys to determine the preferences of respondents for the attributes such as cost and time that distinguish the utility of different modes of transportation. Development of a well-constructed stated choice survey will provide a reasonable measure of the utility function, which has potential to quantify the potential modal split among alternatives, such as a volunteer program or rural bus, as well as determining the aspects of those programs which influence preference. Stated choice experiments have primarily been applied in urban areas; therefore, applications in a rural area like New Brunswick to better understand the trip attributes that appeal to seniors would be unique and provide beneficial insight for planning and developing senior transport systems. It would also provide a framework for future applications, as more advanced transportation technologies are developed to test their potential usage by the growing senior population in New Brunswick. Currently, the construction of a stated choice experiment targeted at volunteer driver program users is underway.
Hanson, Goudreau, and Copp 119
Finally, volunteer driver programs offer the potential to be proxies to study how individuals that currently do not have their own transportation may make use of autonomous vehicles (AVs). AVs, commonly known as self-driving vehicles, have often been presented as a mobility solution for people who have never been licensed to drive or who can no longer operate a vehicle due to the health effects of aging or medical conditions, and where transit or friends and family are not an option. These attributes are typical of the clientele of volunteer driver programs in New Brunswick. While the new access to transportation with AVs has the potential to improve the quality of life for rural older adults who rely on others for transportation, the challenge is that little research has explored the degree by which AVs may help support the travel of rural older adults. Currently, research is set to begin at University of New Brunswick that will look at how the volunteer driver themselves support users, and whether there is a connection between trip type and level of volunteer assistance. The expected outcome will provide insight on the type of trips that AV may support. CONCLUSIONS Volunteer driver programs are offering a key alternative for rural transportation in New Brunswick, Canada, and many operators have been actively involved in efforts to understand and quantify their success. Operators appear to have been more successful employing a “bottom-up” approach, where communities themselves have taken an active role in organizing programs, though partial public funding support through a government agency also appears to have been a catalyst. A scientific approach to understanding volunteer driver programs has been dependent on obtaining consistent data from partners, employing techniques to quantify the maturity of their operations. Future efforts will involve estimating travel demand for these programs, leveraging transportation planning tools to determine what users value about these programs (when compared to other modes), as well as using the study of these programs as a proxy for understanding uptake of AVs by rural users. ACKNOWLEDGMENTS Research funding is provided by the NSERC REFERENCES 1. Statistics Canada. Focus on Geography Series, 2016 Census. Publication Statistics Canada Catalogue
no. 98-404-X2016001, 2017. 2. Government of Taiwan. National Statistics. Statistical Bureau, Taipei. https://eng.stat.gov.tw
/mp.asp?mp=5. Accessed October 3, 2018. 3. Government of New Brunswick. Transportation. https://www2.gnb.ca/content/gnb/en
/gateways/about_nb/transportation.html. Accessed October 3, 2018. 4. Statistics Canada. Commuting Destination (5), Main Mode of Commuting (10), Sex (3) and Age (5)
for the Employed Labour Force Aged 15 Years and Over Having a Usual Place of Work, in Private Households of Canada, Provinces and Territories, Census Divisions and Census Subdivisions, 2016 Census - 25% Sample Data. Publication 98-400-X2016329, 2016.
120 TR Circular E-C262: TRANSED 2018
5. Statistics Canada. Age and Sex Highlight Tables, 2016 Census. Government of Canada,, Ottawa. https://www12.statcan.gc.ca/census-recensement/2016/dp-pd/hlt-fst/as/index-eng.cfm).
6. Statistics Canada. Population Projections for Canada (2013 to 2063), Provinces and Territories (2013 to 2038), Catalogue no. 91-520-X. Government of Canada, Ottawa. http://www.statcan.gc.ca /pub/91-520-x/91-520-x2014001-eng.pdf.
7. Foley, D. J., H. K. Heimovitz, J. M. Guralnik, and D. B. Brock. Driving Life Expectancy of Persons Aged 70 Years and Older in the United States. American Journal of Public Health, Vol. 92, No. 8, 2002, pp. 1284-1289.
8. RUTAC. From Surfaces to Services: an Inclusive and Sustainable Transportation Strategy for the Province of New Brunswick, 2017.
9. Freund, K., and J. McKnight. Independent Transportation Network: Alternative Transportation for the Elderly. Publication Transit IDEA Project 9, 1997.
10. Transportation Research Board. Maximizing Benefits and Addressing Challenges of Volunteer Driver Transportation Programs. https://rns.trb.org/details/dproject.aspx?n=15380. Accessed October 1, 2018.
11. Hanson, T. R. Transportation alternatives for rural seniors in New Brunswick, Canada: Issues, policy implications and research needs.In, 2009.
12. Statistics Canada. Charlotte, CT [Census division], New Brunswick and New Brunswick [Province] (table). Census Profile. 2016 Census. Statistics Canada Catalogue no. 98-316-X2016001., 2017.
13. Hanson, T. R. Planning for Future Successes Among Rural Volunteer Driver Programs: Understanding Local Preferences of Prospective Users and Drivers. Presented at Transportation Research Board 93rd Annual Meeting, 2014.
14. ESIC. Overcoming Poverty Together, 2009. 15. MacAfee, S. Re: Inventory of VDP? Personal Correpondence, 2018. 16. Transportation Research Board. Developing and Sustaining Volunteer Driver Programs as an
Effective Mode of Low-Cost Accessible Transportation. https://rns.trb.org/details/dproject.aspx?n=39803. Accessed October 3, 2018.
17. Hanson, T. R., and D. Caissie. Enabling and Measuring Success Among New Brunswick Volunteer Driver Programs in an Era of Demographic Change: Toward a Common Data Collection Standard. Presented at Canadian Transportation Research Forum 51st Annual Conference, Toronto, ON, 2016.
18. Hanson, T. R., and M. Goudreau. How many New Brunswickers rely on organized volunteer driver programs? Preliminary tools and approaches to help us find the answer. Presented at 52nd Canadian Transportation Research Forum, Winnipeg, MB, 2017.
19. Goudreau, M., and T. R. Hanson. The Development and Application of a Maturity Model to Understand Volunteer Driver Program Practices. Presented at 53rd Canadian Transportation Research Forum, Gatineau, QC, 2018.
20. Dorfman, M., and R. Thayer. The capability maturity model for software. Software Engineering, 1997, pp. 427-438.
21. Willis, C. J., and J. H. Rankin. The construction industry macro maturity model (CIM3): theoretical underpinnings. International Journal of Productivity and Performance Management, Vol. 61, No. 4, 2012, pp. 382-402.

121
CONFERENCE PAPERS
Effectiveness of Elongated Tactile Clues for Providing Directional Information to the Hands of Blind and Visually Impaired
Pedestrians Before Crossing Intersections
JINRO TAKATO TAKABUN NAKAMURA
MASAKI TAUCHI Okayama Prefectural University
hen blind and visually impaired persons (BVIPs) attempt to walk on crosswalks, certain clues for the walking direction is essential. Therefore, short tactile arrows are employed.
However, our previous study has shown that a minimum length of 100 mm for a tactile arrow was necessary to obtain moderate effectiveness and that even longer clues with a minimum length of 100 mm did not distinctly increase the accuracy of the direction. In this study, we evaluated a novel method that enables BVIPs to continuously trace elongated tactile clues while BVIPs walk toward a crosswalk.
Ten BVIPs participated in this experiment. The BVIPs were instructed to walk in the direction predicted from various elongated tactile clues using them either by the dorsum or palm of the hand. A walkway, 5 m long and 3 m wide, that was assumed to be a crosswalk, was positioned in front of the starting point. The elongated tactile clues (tactile bars) that were examined had a diameter of 35 mm and a length of 100, 250, 500, or 1,000 mm. The subjects were asked to walk while continuously touching the guide bar and maintain the same direction after leaving the crosswalk. To evaluate the effect of the length of the tactile bars, the veering tendency was measured as an angle between the middle line of the walking pathway and the straight line that connects the distal end of the tactile clue to the trajectory of subjects located 3 m beyond the starting point. The confidence level of the direction taking strategy obtained by this method was measured after each trial. Subjects chose one among “not confident”, “slightly not confident”, “not very sure”, “rather confident”, and “confident”.
The veering angle (VA) tended to decrease as the length of the tactile clue increased. This effect was particularly prominent when BVIPs used their palms instead of the dorsa. The difference in the VA between the subject’s preferred and non-preferred hand was not significant regardless of the length of the guide bars. When participants used tactile bars that were shorter than (or equal to) 250 mm, subjects often reported lower confidence in terms of their direction judgment. When the length of bars exceeded 500 mm, the subjects reported substantially higher confidence.
Based on these results, tactile bars with lengths greater than 500 mm were effective in indicating an accurate direction and providing higher self-confidence for direction taking strategy. These results indicated that the new method, in which the subjects can continuously touch the direction clue during the early phase of walking, is useful.
W

122 TR Circular E-C262: TRANSED 2018
INTRODUCTION When BVIPs cross an intersection unassisted, prior information concerning the timing to start walking, the walking direction and distance is necessary. BVIPs are also required to maintain their direction until they reach their goal of locating the opposite side of a crosswalk. For a long time, BVIPs have employed audible or tactile cues to safely and reliably perform these tasks. For example, APSs have been installed to provide valid timings to start walking by audibly indicating the 'Walk phase' of a pedestrian signal. The information provided by ordinary APS sounds to BVIPs, however, is not perfect owing to large limitations in terms of the provision of directional information about walking in a crosswalk.
A dropped curb between a sidewalk and a roadway, the noise of a running car and tactile pavement [tactile walking surface indicators (TWSIs)] installed in front of a crosswalk have served as clues to predict the crossing direction. However, none of these TWSIs provide sufficient accuracy with regard to the walking direction. In 2003, an APS that emits alternate sound from speakers installed at both ends of a crosswalk, which is referred to as a back and forth sound emitting system, was developed. This APS has a function to provide an audible directional clue before and during crossing (1). The effectiveness of this APS in obtaining directional clues by BVIPs before and during walking was demonstrated. However, this effectiveness was sometimes hampered by the sound-reflecting objects, such as buildings located near intersections. For this reason, additional information provided by systems to APS, which is not affected by environmental factors, is needed.
In many European countries and North America, the length of short tactile arrows is typically less than 50 mm. These arrows that indicate the walking direction are installed on the surface of the push button box of an APS. However, our evaluation of these tactile arrows revealed that the length of these short arrows is not sufficient for indicating the precise walking direction (2). A minimum length of 100 mm for the tactile arrows was needed to reduce the direction error and increase the self-confidence level for the direction taking strategy of the user. However, even if the tactile arrows were 500 mm, the maximum improvement was only 7.1% (3).
In a long-distance crosswalk, the initial direction taking before walking become crucial for the safe and secure crossing at intersections. The reason the accuracy of the direction does not increase even when longer tactile arrows are utilized may be explained by the notion that the direction taking is performed by BVIPs who are standing in one place. In the early phase of walking, the initial walking speeds of BVIPs are not sufficiently fast due to low inertia. Therefore, the right and left rocking of the body due to a slow walking speed may spoil the information that is obtained from the tactile arrows.
We hypothesized that if we can continuously provide tactile clues in the initial phase of walking, the direction taken by the BVIPs should be more precise and correct compared with the ordinary direction. This approach can be rationalized because walking speed and body movement stabilize after a few steps of walking. In this study, we quantitatively examined the effect of the elongated tactile bars on the accuracy of direction that enables BVIPs to continuously obtain directional clues during the initial walking phase. This way of detecting direction by elongated tactile bars during walking is referred to as dynamic direction taking strategy (DYDTS).

Takata, Nakamura, and Tauchi 123
METHOD Ten BVIP subjects (six male and four female) with ages between 47 years old and 73 years old participated in this study. All participants had the experience of walking unassisted for more than 10 years. The participants were instructed to start walking using one of the elongated bars, which served as a type of handrail, as a tactile clue. The diameter of the bars was 35 mm, and the length of the bars was 100 mm, 250 mm, 500 mm, and 1,000 mm. The bars were positioned in front of the experimental pathway (Figure 1).
The subjects were asked to walk parallel to the orientation of the elongated bars. The height of the top surface of the bars was set 85 cm above the floor. The same number of trials for both the dominant and non-dominant hand was performed for each length of the tactile bars. The same number of trials was also performed for the palm and dorsum of the hand.
To estimate the effect of the length of the tactile clue, the VA was employed as a measure. The VA was calculated as an angle between the midline of the walking pathway and a straight line drawn to connect the 0 m point of the midline to a trajectory at a distance of 3 m from the starting point (Figure 2).
FIGURE 1 Experimental walking pathway. The thick solid lines indicate walking trajectories.
FIGURE 2 Calculation of the VA (θ) measured 3 m from the starting points.

124 TR Circular E-C262: TRANSED 2018
The self-confidence level obtained using the DYDTS method was measured after each trial. Subjects were asked to choose among “not confident,” “slightly confident,” “not sure,” “rather confident,” and “confident.” The former two were categorized as lower self-confidence, and the latter two were considered to be higher self-confidence. “Not sure” was classified as intermediate self-confidence. RESULT Veering angle The mean VA at the 3 m point of the walking pathway was measured for each length of the tactile bars. The mean was 6.0 +/- 4.6 degrees for the 100 mm bar, 5.1 +/- 4.1 degrees for the 250 mm bar, 4.2 +/- 3.3 degrees for the 500 mm bar, and 3.6 +/- 3.0 degrees for the 1,000 mm bar. The amount of veering tendency measured for the VA decreased as the length of the tactile bars increased.
Differences in the mean VA between type of handedness, i.e., dominant hands or non-dominant hands, were compared by a two-way analysis of variance. The main effect of the dominant side (F(1,64)=3.99, p=0.51) and the VA in terms of the handedness was not significant.
The influence of the use of the palm and dorsum of the hand on the mean VA measured at the 3 m point was examined for the elongated bars of various lengths (Figure 3).
The VA when using the palm of the hand was significantly smaller than the VA when using the dorsum of the hand [F (1, 8) = 6.91, p <0.05)]. When the dorsum of the hand was used to touch the tactile bars, the VA became prominent, especially when the length of the bars was at least 250 mm. The minimum degree of VA was attained for lengths greater than 500 mm. As a result of multiple comparisons, a significant difference was observed between 250 and 500 mm of the tactile cues.
FIGURE 3 Relationship between the length of the elongated bars and the VA when the
participants use palm or dorsum of the hand.
0.0
2.0
4.0
6.0
8.0
10.0
Palm Dorsum
Veer
ing
Angl
e (D
egre
e)
100 250 500 1,000*
(mm)
* p < .10
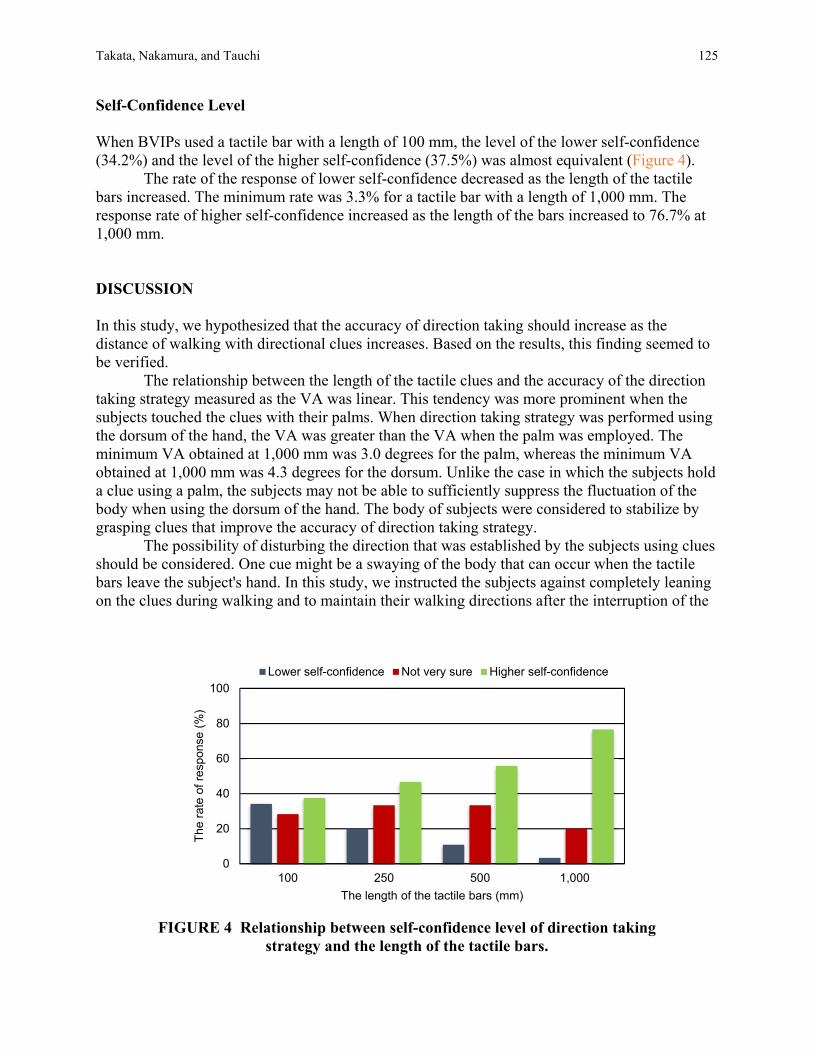
Takata, Nakamura, and Tauchi 125
Self-Confidence Level When BVIPs used a tactile bar with a length of 100 mm, the level of the lower self-confidence (34.2%) and the level of the higher self-confidence (37.5%) was almost equivalent (Figure 4).
The rate of the response of lower self-confidence decreased as the length of the tactile bars increased. The minimum rate was 3.3% for a tactile bar with a length of 1,000 mm. The response rate of higher self-confidence increased as the length of the bars increased to 76.7% at 1,000 mm. DISCUSSION In this study, we hypothesized that the accuracy of direction taking should increase as the distance of walking with directional clues increases. Based on the results, this finding seemed to be verified.
The relationship between the length of the tactile clues and the accuracy of the direction taking strategy measured as the VA was linear. This tendency was more prominent when the subjects touched the clues with their palms. When direction taking strategy was performed using the dorsum of the hand, the VA was greater than the VA when the palm was employed. The minimum VA obtained at 1,000 mm was 3.0 degrees for the palm, whereas the minimum VA obtained at 1,000 mm was 4.3 degrees for the dorsum. Unlike the case in which the subjects hold a clue using a palm, the subjects may not be able to sufficiently suppress the fluctuation of the body when using the dorsum of the hand. The body of subjects were considered to stabilize by grasping clues that improve the accuracy of direction taking strategy.
The possibility of disturbing the direction that was established by the subjects using clues should be considered. One cue might be a swaying of the body that can occur when the tactile bars leave the subject's hand. In this study, we instructed the subjects against completely leaning on the clues during walking and to maintain their walking directions after the interruption of the
FIGURE 4 Relationship between self-confidence level of direction taking
strategy and the length of the tactile bars.
0
20
40
60
80
100
100 250 500 1,000
The
rate
of r
espo
nse
(%)
The length of the tactile bars (mm)
Lower self-confidence Not very sure Higher self-confidence
126 TR Circular E-C262: TRANSED 2018
clues. The subjects seemed to suppress their body fluctuations after the interruption of clues. However, further examination of the relationship between the accuracy of the orientation and the instruction might be necessary.
Our previous experiment indicated that using tactile clues from 15 mm to 200 mm showed that the degree of higher self-confidence increased significantly as the length of the clues increased (4). In this study, we applied longer clues and determined that the degree of self-confidence was maximized when the longest clue of 1,000 mm was employed. The results were similar to our previous study, in which the length of the clues increased, and the tendency of higher self-confidence was obtained.
Although the longer tactile clues length will likely yield better results in terms of the accuracy of direction taking strategy and higher self-confidence, the clues for a length of approximately 500 mm may be practical for implementation at an intersection. CONCLUSIONS
1. The elongated tactile bars positioned at the starting location were used by the BVIPs subjects for the purpose of direction taking strategy while they were walking.
2. The relationship between the accuracy of the direction taking strategy and the length of the elongated tactile bars of 100 mm, 250 mm, 500 mm, and 1,000 mm was examined.
3. The VA 3 m from the starting point decreased as the length of the tactile clues increased; this effect was particularly prominent when BVIPs used their palms instead of the dorsum.
4. The difference in the VA between the subjects’ dominant hands or non-dominant hands was not significant, regardless of the length of the guide bars.
5. The degree of self-confidence in the subject's direction taking increased when the length of clues increased toward 1,000 mm.
6. These results demonstrated the effectiveness of the proposed direction taking strategy as the DYDTS method was demonstrated. A reasonable length of the elongated tactile bars for the direction taking strategy for the street crossing was estimated to be approximately 500 mm. REFERENCES 1. Masaki Tauchi, Hajime Sawai, Jinro Takato, Takashi Yoshiura, Kohei Takeuchi. Development and
Evaluation of a Novel Type of Audible Traffic Signal for the Blind Pedestrians, Proceedings of the 9th International Mobility Conference, 1998. 108-111.
2. Jinro Takato, Takabun Nakamura, Masaki Tauchi. Effectiveness of various tactile directional indicators used for direction taking of visually impaired persons to cross intersection, Proceedings of the 15th International Mobility Conference. 2015. 132-133
3. Jinro Takato, Masumi Takeda, Takabun Nakamura, Masaki Tauchi. Relationship between the length of tactile indicators and the accuracy of direction-taking by visually impaired persons, Journal of Japanese Society for Low-vision Research and Rehabilitation. 2009. 9:171-177 (in Japanese)
4. Masaki Tauchi, Masumi Takeda, Jinro Takato. The relationship between accuracy of direction taking by the persons with visual impairment and the length of tactile signage, The Japanese Journal of Ergonomics, 2007. 43 (2 Supplement): 170-171 (in Japanese)
127
APPENDIX A
TRANSED 2018 Program Book
2017 - 2019International Development Output Plan
2017 - 2019International Development Output Plan
IndiaLaos
Chengdu
Taiwan
SriLanka
Vietnam
Myanmar(Burma)
Nepal
Malaysia
Guangdong
Thailand
● Landmine survivors
● NGO Empowerment
● Vocational training for people with disabilities
● Volunteering Services
● Tuition subsidies
● International volunteer and internship project
● Landmine
● Donation of technology assistance
● Elder Service
● Promotion of wheelchair accessible environment
● International issue cooperation and NGO empowerment
● International Elephant project
● New immigrant families and Chinese speaking kindergarten
●●
●●●
●●●
●●●●●
●●●●●●●●●
●●●●
●●●●
●●
●●
OF THE NATIONAL ACADEMIESTRANSPORTATION RESEARCH BOARD
Transportation Research Board(TRB) is one of six major divisions of the National Research Council, which serves
as an independent adviser to the federal government and others on scientific and technical questions of national
importance, and which is jointly administered by the National Academy of Sciences, the National Academy of
Engineering, and the Institute of Medicine. The mission of the Transportation Research Board is to provide leader-
ship in transportation innovation and progress through research and information exchange, conducted within a
setting that is objective, interdisciplinary, and multimodal. The Board is supported by state transportation depart-
ments, federal agencies including the component administrations of the U.S. Department of Transportation, and
other organizations and individuals interested in the development of transportation.
Each year, TRB’s varied activities engage more than 7,000 engineers, scientists, and other transportation
researchers and practitioners from the public and private sectors and academia, all of whom contribute their
expertise in the public interest by participating on TRB committees, panels, and task forces. Others get involved
and support TRB activities by becoming a TRB Affiliate; participating in TRB-sponsored conferences and work-
shops; authoring technical papers and contract research reports; and more.
TRB's Committee on Accessible Transportation and Mobility (ABE 60)The Committee's mandate is to educate everyone on the issues and gaps related to mobility needs for people with
limited transportation options - people with mobility, sensory and cognitive disabilities; older adults; and individuals
without private transportation. With a large proportion of our population reaching their golden years, the Commit-
tee is dedicated to ensuring mobility options that will provide older adults with a high level of accessibility and
affordability. The Committee has a global focus and broad international representation.
Providing accessible transportation enables all individuals to participate fully in an active community life. Accessi-
ble transportation through universal and inclusive design is one of the key messages the Committee communi-
cates to various groups involved in providing seamless, accessible transportation.
The TRB Committee on Accessible Transportation and Mobility works closely with other TRB Committees to
collaborate and sponsor joint activities.
People interested in participating as a friend of the Committee or as a prospective member are encouraged to join
us for our annual Committee meeting, or participate in one of our Subcommittee meetings (Policy and Practice,
Research, and Accessible Transportation Technology). All meetings are held each January at the TRB Confer-
ence in Washington, DC.
C
M
Y
CM
MY
CY
CMY
K
§j�|§�‧U� ≠±� ©�.pdf 2 2018/11/6 上午11:45
128

Contents
02
04
13
16
17
18
19
20
26
27
32
34
56
73
79
80
100
About the Conference About TRANSED
Conference Committee
Welcome MessageGeneral Information Venue
Floor Plan
APP
Conference Information Program
Conference Materials
Pre-Conference Workshop
Keynote Speech
Topic Discussion
Parallel Session
Round Table Forum
Pre-conference & Post conferenceExhibitionAcknowledgement
129
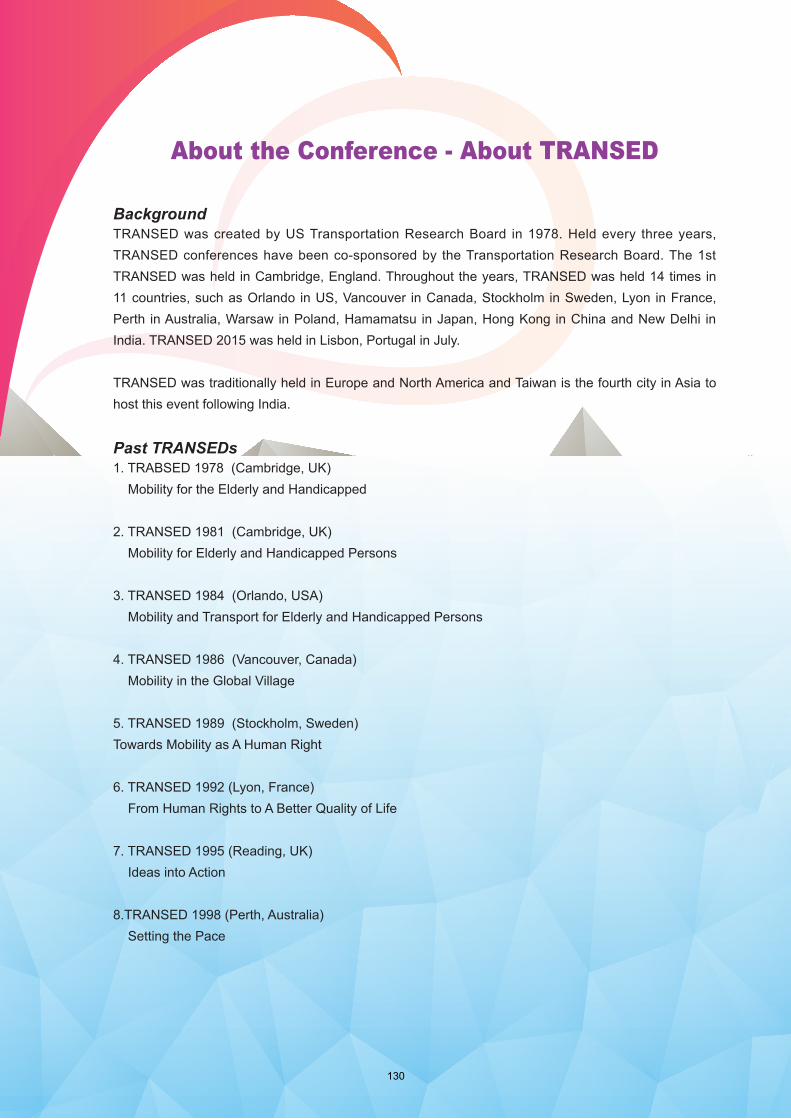
TRANSED2018
TRANSED2018
About the Conference - About TRANSED
BackgroundTRANSED was created by US Transportation Research Board in 1978. Held every three years, TRANSED conferences have been co-sponsored by the Transportation Research Board. The 1st TRANSED was held in Cambridge, England. Throughout the years, TRANSED was held 14 times in 11 countries, such as Orlando in US, Vancouver in Canada, Stockholm in Sweden, Lyon in France, Perth in Australia, Warsaw in Poland, Hamamatsu in Japan, Hong Kong in China and New Delhi in India. TRANSED 2015 was held in Lisbon, Portugal in July.
TRANSED was traditionally held in Europe and North America and Taiwan is the fourth city in Asia to host this event following India.
Past TRANSEDs1. TRABSED 1978 (Cambridge, UK)
Mobility for the Elderly and Handicapped
2. TRANSED 1981 (Cambridge, UK)Mobility for Elderly and Handicapped Persons
3. TRANSED 1984 (Orlando, USA)Mobility and Transport for Elderly and Handicapped Persons
4. TRANSED 1986 (Vancouver, Canada)Mobility in the Global Village
5. TRANSED 1989 (Stockholm, Sweden)Towards Mobility as A Human Right
6. TRANSED 1992 (Lyon, France)From Human Rights to A Better Quality of Life
7. TRANSED 1995 (Reading, UK)Ideas into Action
8.TRANSED 1998 (Perth, Australia)Setting the Pace
130

TRANSED2018
TRANSED2018
9. TRANSED 2001 (Warsaw, Poland)Towards Safety, Independence and Security
10. TRANSED 2004 (Hamamatsu, Japan)Universal Transportation and Road Design: Strategies for Success
11. TRANSED 2007 (Montreal, Canada)Benchmarking, Evaluation and Vision for the Future
12. TRANSED 2010 (Hong Kong, China)Sustainable Transport and Travel for All
13. TRANSED 2012 (New Delhi, India)Seamless Access for All: Universal Design in Transport System and Built Infrastructure-A Key Element in the Creation for Liable Cities
14. TRANSED 2015 (Lisbon, Portugal)Aim and Manage to Implement Inclusive Access for All
131

TRANSED2018
About the Conference - Conference Committee
International Steering Committee
Suporntum MongkolsawadiSecretary GeneralThe Redemptorist Foundation for People with Disabilities, Thailand
Pamela Pui-Yu, LeungChief Executive OfficerThe Hong Kong Society for Rehabilitation, Hong Kong
Sminu Jindal SvayamChairperson, India
Mary CrassHeadInstitutional Relations and Summit, Organisation for Economic Co-operation and Development (OECD), France
Hitoshi OkuboPresidentECOMO Foundation, Japan
Joey GoldmanCo-ChairTransportation Research Board Committee on Accessible Transportationand Mobility (ABE 60), USA
Tom RickertExecutive DirectorAccess Exchange International, USA
Ling Suen DirectorIntelligent Computer Systems & Applications (ICSA) Inc., Canada
Julie BabinardSenior Transport SpecialistWorld Bank, USA
132
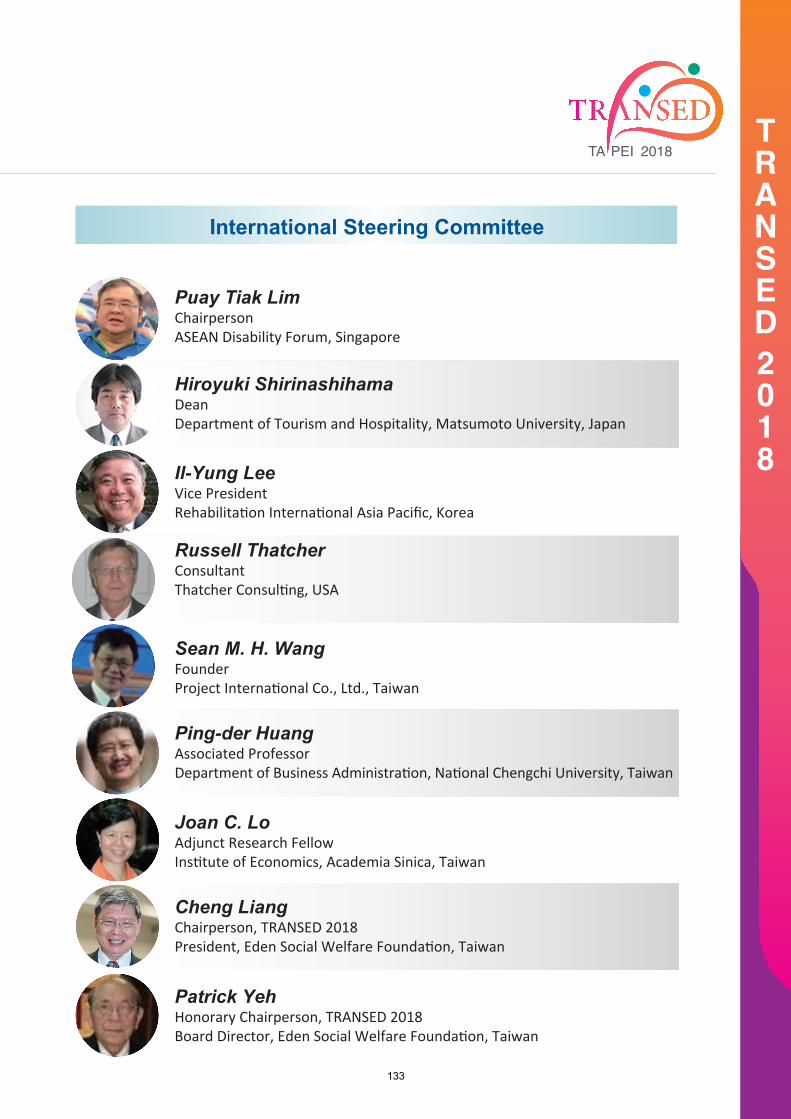
TRANSED2018
International Steering Committee
Il-Yung LeeVice PresidentRehabilitation International Asia Pacific, Korea
Sean M. H. WangFounderProject International Co., Ltd., Taiwan
Cheng LiangChairperson, TRANSED 2018President, Eden Social Welfare Foundation, Taiwan
Hiroyuki ShirinashihamaDeanDepartment of Tourism and Hospitality, Matsumoto University, Japan
Russell Thatcher ConsultantThatcher Consulting, USA
Puay Tiak LimChairpersonASEAN Disability Forum, Singapore
Ping-der HuangAssociated ProfessorDepartment of Business Administration, National Chengchi University, Taiwan
Joan C. LoAdjunct Research FellowInstitute of Economics, Academia Sinica, Taiwan
Patrick YehHonorary Chairperson, TRANSED 2018Board Director, Eden Social Welfare Foundation, Taiwan
133
TRANSED2018
Scientific Committee
Roger MackettProfessorTransport Insititude, Univesity College London, UK
Lilian Salazar Assistant ProfessorInstituto Tecnologico de Monterrey, Mexico
Mohammed YousufProgram ManageUS Federal Highway Administration, USA
Alauzet AlineDeputy ManagerIFSTTAR, France, France
Judy ShanleyAssistant Vice PresidentEaster Seals Inc., USA
Andrea LubinSenior ResearcherRutgers University, New Brunswick, New Jersey, USA
Peter CosynSenior Project ManagerTractebel Engineering, Belgium
Trevor HansonAssociate ProfessorUniversity of New Brunswick, Canada
About the Conference - Conference Committee
134

TRANSED2018
Scientific Committee
Shyue-Koong ChangDirector and ProfessorDept of Civil Engineering; Advanced Public Transport Research Center,National Taiwan University, Taiwan
Kai-Kuo ChangDirector Transportation Safety Division, Institute of Transportation (IOT), Ministry of Transportation and Communications, Taiwan
Joseph KwokVice ChairpersonAsia Pacific Disability Forum, Hong Kong
Hyung Shik KimExpert MemberUN Committee on the Rights of Persons with Disabilities, Korea
Lalita Sen Professor Texas Southern University, USA
Uwe RutenbergPresidentRutenberg Design Inc., Canada, Canada
Hang Sau NgSenior ConsultantHong Kong Society for Rehabilitation, Hong Kong
Anabela SimoesProfessorUniversidade Lusofona, Portugal, Portugal
135
TRANSED2018
Scientific Committee
About the Conference - Conference Committee
Sheng-Tsung HouDirector and ProfessorGraduate Institute of Public Affairs and Social Innovation, Feng Chia University
Shih-Ching LoChairman and Associate Professor Department of Transportation Technology and Logistics Management,Chung Hua University, Taiwan
Yu-Chiun ChiouDepartment Head and ProfessorDepartment of Transportation and Logistics Management,National Chiao Tung University, Taiwan
Wan-Hui ChenProfessorDepartment of Transportation Management, Tamkang University, Taiwan
Ching-Lung LiaoDirector and ProfessorRailway Technology Research Center, National Taiwan University, Taiwan
Shiaw-Shyan LuoAssociate ProfessorDepartment of Transportation Management, Tamkang University, Taiwan
Liang-Tay LinDean and ProfessorDepartment of Transportation and Logistics,College of Construction and Development , Feng Chia University, Taiwan
Jau-Ming SuProfessorDepartment of Transportation and Logistics, Feng-Chia University, Taiwan
136

TRANSED2018
Scientific Committee
Chien-Hung WeiProfessorDepartment of Transportation and Communication Management Science & Institute of Telecommunications Management, National Cheng Kung University,Taiwan
Chung-Wei ShenAssistant ProfessorDepartment of Transportation and Communication Management Science & Institute of Telecommunications Management, National Cheng Kung University,Taiwan
Chao-Fu YehAssistant ProfessorDepartment of Transportation and Logistics, Feng-Chia University, Taiwan
Shou-Ren HuProfessorDepartment of Transportation and Communication Management Science & Institute of Telecommunications Management, National Cheng Kung University,Taiwan
Cheng LiangChairperson, TRANSED 2018President, Eden Social Welfare Foundation, Taiwan
Joan C. LoAdjunct Research FellowInstitute of Economics, Academia Sinica, Taiwan
137

TRANSED2018
Organizing Committee
About the Conference - Conference Committee
Joa-Song HwangChief Executive OfficerEden Social Welfare Foundation, Taiwan
Jacob ChenBoard DirectorEden Social Welfare Foundation, Taiwan
Joan C. LoAdjunct Research FellowInstitute of Economics, Academia Sinica, Taiwan
Ping-der HuangAssociated ProfessorDepartment of Business Administration, National Chengchi University, Taiwan
Patrick YehHonorary Chairperson, TRANSED 2018Board Director, Eden Social Welfare Foundation, Taiwan
Sean M. H. WangFounderProject International Co., Ltd., Taiwan
Ting-Yi SungDeputy DirectorInstitute of Information Science, Academia Sinica, Taiwan
Cheng LiangChairperson, TRANSED 2018President, Eden Social Welfare Foundation, Taiwan
138

TRANSED2018
Organizing Committee
Ben LinVice Chief Executive OfficerEden Social Welfare Foundation, Taiwan
Shu-Fen WuDirector GeneralInternational Development Division, Eden Social Welfare Foundation, Taiwan
139

TRANSED2018
TRANSED2018
140
TRANSED2018
Dear guests and friends,
Since the United Nations passed the Convention on the Rights of Persons with Disabilities (CRPD) in December 2006, Eden has been proactively promoting the spirits underlying every right protected by the Convention. Eden has spared no effort in constructing and offering both persons with disabilities and the elderly with comprehensive services. Furthermore, it is our mission to exchange viewpoints and experience on this globally significant issue with the international community. We feel greatly privileged to organize the 15th International Conference on Mobility and Transport for Elderly and Disabled Persons in 2018, which will be held at the Taipei International Convention Center from November 12th to 15th.
The theme of the conference is “Mobility for All: Connecting the World with Accessible Transportation.” Starting with a plenary lecture, the conference continues with a variety of discussions, in which researchers, practitioners, service providers, policy planners, educators, and experts in the field of aging from around the world are invited to discuss the latest on accessible transportation. Formats will include keynote speeches, topic discussions, thesis poster exhibitions, practical on-site exhibits. Workshops focusing on special issues will allow participants to gain awareness and understand academic application, industry exchange and experience sharing from various relevant fields in the world. These exchanges will in turn create a common platform for brainstorming and learning, bringing forth the multifaceted thinking and innovative development of industry, the public sector, and academia.
We sincerely invite you to participate at TRANSED 2018, a great opportunity for synergy in the fields of academia, cutting edge technologies and enterprises connect and network. Through the research presentations, booth exhibitions and promotional materials in the conference manual, participants will gain a broader global perspective of this issue, with the aim to creating exchange and mutual benefits. We look forward to your active support, participation and sponsorship. Together, we will drive the general public in Taiwan to seriously regard the accessible environment and services, promote the exchange with international accessible network, and strive for a barrier free society, built with hearts and minds without barriers!
On behalf of the Organizing Committee of the 15th International Conference on Mobility and Transport for Elderly and Disabled Persons, we send our warmest regards and wish the greatest success for the conference.
Patrick Ying-Ping Yeh Honorary Chairperson of the Organizing Committee, TRANSED 2018
Welcome Message
141
TRANSED2018
Welcome Message
Dear Guests, Colleagues and Friends,
Greetings from Eden Family!
The 15th International Conference on Mobility and Transport for Elderly and Disabled Persons, (TRANSED 2018) is scheduled to be held at Taipei International Convention Center during 12 Nov 2018 (Mon) to 15 Nov 2018 (Thu). The theme of the conference is "Mobility for all: Connecting the World with Accessible Transportation," which focuses on four main areas: 1. Accessible Transportation and Tourism in Air, Land and Water; 2. Safe & Sustainable Mobility for Elderly and Persons with Disabilities; 3. Collaboration and Coordination across Information Financial and Transportation Services; 4. Smart City Network & Smart Growth in the Asia Pacific Region and Worldwide.
Held every two or three years, TRANSED series of conferences are milestone events in the field of accessible transportation, attracting researchers, policymakers, transport operators, consumers and other specialists from around the world to share innovations and best practices in order to make transportation and mobility accessible to everyone.
From the first conference in 1978 held at Cambridge, UK, this coveted conference has been to different continents providing a platform for innovation, research and inclusive practices in mobility and transport under the aegis of the US Transportation Research Board of National Academics (TRB).
Eden Social Welfare Foundation (hereafter referred to as Eden) is deeply honored to host this prestigious triennial International Conference in Taiwan. With a phenomenal rise in the ageing population in Taiwan, it is truly significant to have the conference in Taiwan and mull over the challenges and prospects the inclusive and accessible transportation poses before the developing economies in our region.
Eden, in its 36 years of existence, has sought to accomplish the United Nations’ Sustainable Development Goals (SDGs) and follow the principles of the Convention on the Rights of Persons with Disabilities (CRPD), proactively sharing and communicating with the international community regarding the experiences of serving the older adults and the persons with disabilities. In particular, our experiences that it is “accessibility” that largely decides whether or not, the older adults, children, women who are family way, people of all sizes and dimensions and persons with disabilities, can fully participate in our society, contribute to the development of nation and reap the benefits of social inclusion.
142
TRANSED2018
After three years of rigorous preparation, a warm up event took place last year, with the "2017 Cooperation Forum on Accessibility & Prosperity in Cities," in which scholars and experts were invited to visit Taiwan to inspect the progress of the TRANSED 2018 preparations, and experience the accessible transportation systems in five major cities in Taiwan. The visiting experts were encouraged to see the commitment shown by the city leadership and they saw a huge potential in Taiwan’s march towards inclusive and accessible cities that are not only smart but also humane. We at Eden, sincerely hope to plan and create a platform at this international conference through the exchange of expertise and experience from various countries. With diverse presentations such as keynote speeches, panel discussions, workshops, and VR experience exhibition given by renowned subject experts, scholars and practitioners from Europe, the United States, and the Asia Pacific region, the conference is set to provide participants with a rich and innovative learning environment and enhance their professional knowledge in relevant fields, hoping to further benefit more older adults and persons with disabilities in the future!
Each TRANSED International Conference has always been an innovation milestone for accessible transportation in the global community. We sincerely invite you to attend, contribute to, partner with us, support and sponsor this remarkable event in Taiwan, to link up with the world, create a forward-looking, smart and sustainable accessible transportation and services for the older adults and persons with disabilities.
On behalf of the Eden Family & TRANSED 2018 Organizing Committee, I look forward to your participation in all forms possible, as a visitor, delegate, researcher, partner, supporter, sponsor or an exhibitor. Lets make best use of this unique opportunity and take ownership of making this coveted and unique conference a grand success.
Thank you,
Cheng LiangChairperson of Organizing Committee, TRANSED 2018
143
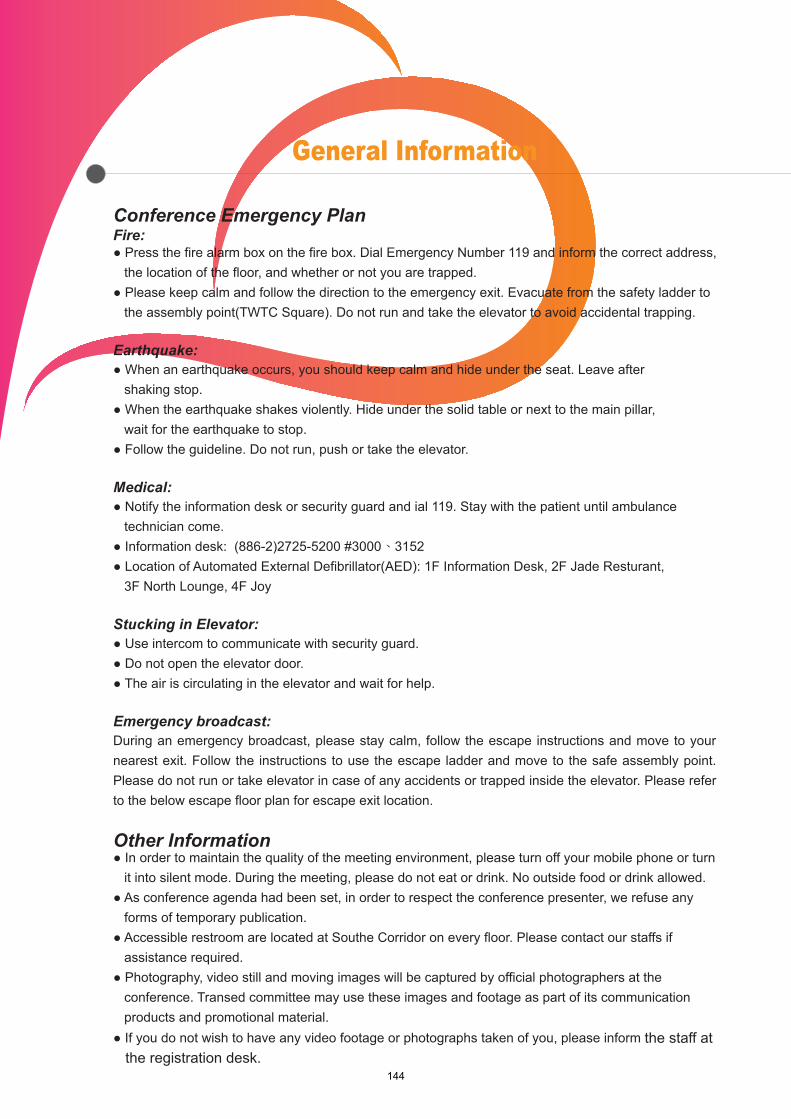
TRANSED2018
General Information
Conference Emergency PlanFire: ● Press the fire alarm box on the fire box. Dial Emergency Number 119 and inform the correct address,
the location of the floor, and whether or not you are trapped.● Please keep calm and follow the direction to the emergency exit. Evacuate from the safety ladder to
the assembly point(TWTC Square). Do not run and take the elevator to avoid accidental trapping.
Earthquake:● When an earthquake occurs, you should keep calm and hide under the seat. Leave after
shaking stop.● When the earthquake shakes violently. Hide under the solid table or next to the main pillar,
wait for the earthquake to stop.● Follow the guideline. Do not run, push or take the elevator.
Medical:● Notify the information desk or security guard and ial 119. Stay with the patient until ambulance
technician come.● Information desk: (886-2)2725-5200 #3000、3152● Location of Automated External Defibrillator(AED): 1F Information Desk, 2F Jade Resturant,
3F North Lounge, 4F Joy
Stucking in Elevator:● Use intercom to communicate with security guard.● Do not open the elevator door.● The air is circulating in the elevator and wait for help.
Emergency broadcast:During an emergency broadcast, please stay calm, follow the escape instructions and move to your nearest exit. Follow the instructions to use the escape ladder and move to the safe assembly point. Please do not run or take elevator in case of any accidents or trapped inside the elevator. Please refer to the below escape floor plan for escape exit location.
Other Information● In order to maintain the quality of the meeting environment, please turn off your mobile phone or turn
it into silent mode. During the meeting, please do not eat or drink. No outside food or drink allowed.● As conference agenda had been set, in order to respect the conference presenter, we refuse any
forms of temporary publication.● Accessible restroom are located at Southe Corridor on every floor. Please contact our staffs if
assistance required.● Photography, video still and moving images will be captured by official photographers at the
conference. Transed committee may use these images and footage as part of its communicationproducts and promotional material.
● If you do not wish to have any video footage or photographs taken of you, please inform the staff at the registration desk.
144
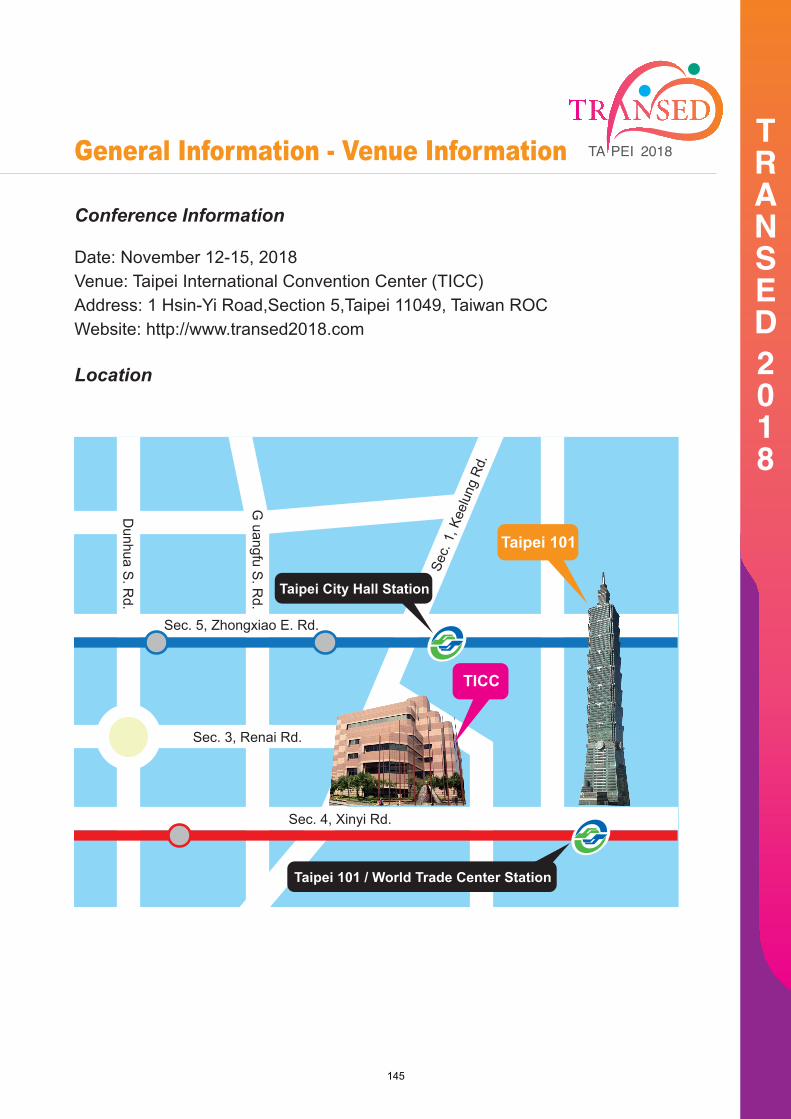
TRANSED2018
Sec. 4, Xinyi Rd.
Sec. 5, Zhongxiao E. Rd.
Sec. 3, Renai Rd.
Sec
. 1, K
eelu
ng R
d.
TICC
Taipei 101
Taipei City Hall Station
Taipei 101 / World Trade Center Station
G uangfu S
. Rd.
Dunhua S
. Rd.
Conference Information
Date: November 12-15, 2018Venue: Taipei International Convention Center (TICC)Address: 1 Hsin-Yi Road,Section 5,Taipei 11049, Taiwan ROCWebsite: http://www.transed2018.com
Location
General Information - Venue Information
145
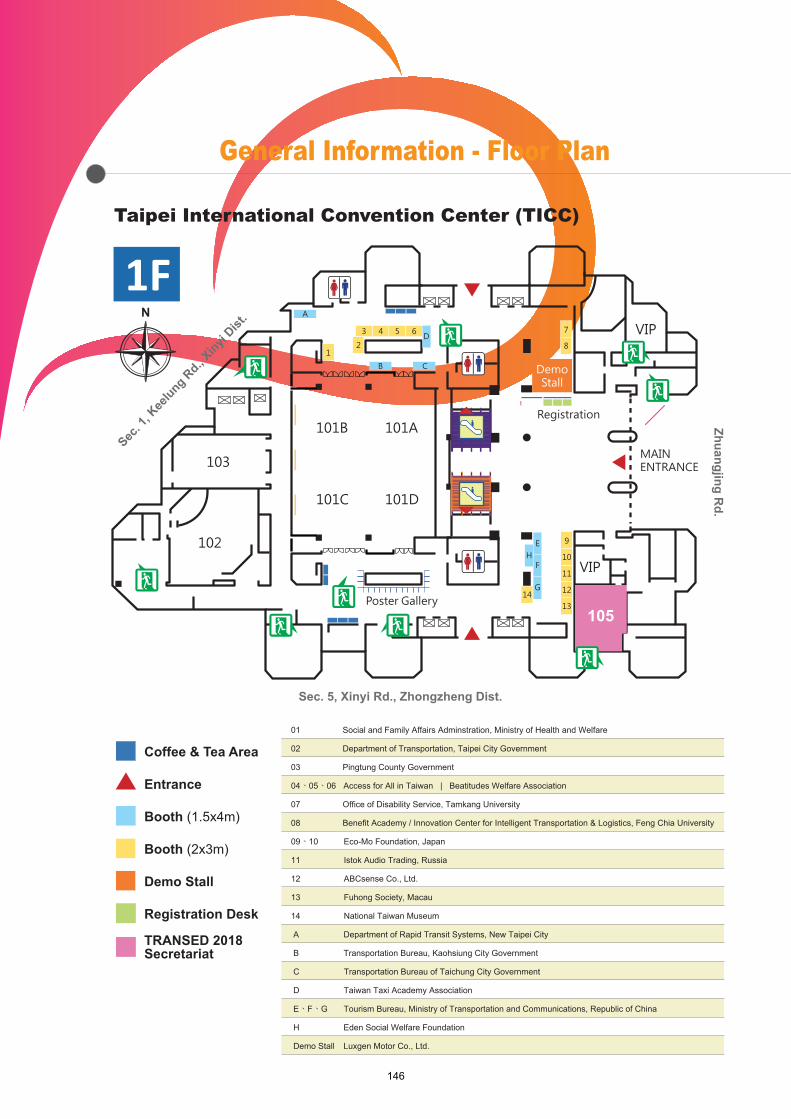
TRANSED2018
General Information - Floor Plan
102
DemoStall
103
101B
B
A
12
3 4 5 6
C
D
101A
101C 101D
105
VIP
VIP
MAINENTRANCE
Poster Gallery
Registration
7
8
9E
F
G
H 10
11
12
1314
Sec. 5, Xinyi Rd., Zhongzheng Dist.
Coffee & Tea Area
Zhuangjing Rd.
Sec. 1
, Kee
lung Rd., X
inyi Dist
.
01 Social and Family Affairs Adminstration, Ministry of Health and Welfare
02 Department of Transportation, Taipei City Government
03 Pingtung County Government
04、05、06 Access for All in Taiwan | Beatitudes Welfare Association
07 Office of Disability Service, Tamkang University
08 Benefit Academy / Innovation Center for Intelligent Transportation & Logistics, Feng Chia University
09、10 Eco-Mo Foundation, Japan
11 Istok Audio Trading, Russia
12 ABCsense Co., Ltd.
13 Fuhong Society, Macau
14 National Taiwan Museum
A Department of Rapid Transit Systems, New Taipei City
B Transportation Bureau, Kaohsiung City Government
C Transportation Bureau of Taichung City Government
D Taiwan Taxi Academy Association
E、F、G Tourism Bureau, Ministry of Transportation and Communications, Republic of China
H Eden Social Welfare Foundation
Demo Stall Luxgen Motor Co., Ltd.
Entrance
Booth (1.5x4m)
Booth (2x3m)
Demo Stall
Registration Desk
TRANSED 2018Secretariat
Taipei International Convention Center (TICC)
146
TRANSED2018
General Information - APP
Conference Application
● For Android:
1. Download Conference App, TRANSED 2018 on Google Play
2. Log-In
3. Please refer to below icon's guidline
● About the Conference: Brief introduction of the conference.● Program: Conference program. Daily program: You may view the daily program, and select
the session you interest into My Schedule.● Social Program: View the social events of this conference.● My Schedule: Open My Schedule to view personal calender● Album: You can view photos, videos and upload business card● Papers & Posters: All Abstract, Full Paper, Presentation Material can be downloaded here.● News: You may find latest news here.● Map
● For IOS:
Please find the QR code below and login
147

TRANSED2018
Conference Information - Program
Day 1|Tuesday, November 13, 201808:00-09:00 Registration (TICC Foyer)
09:00-10:00 Open Ceremony (TICC 101)
10:30-11:30
10:00-10:30
Keynote Speech I (TICC 101)
Moderator: Mr. Joey GoldmanCo-chair, Transportation Research Board Commmittee on Accessible Transportation and Mobility (ABE60)
Keynote Speaker: Amb. Piroon Laismit Executive Director, Asia-Pacific Development Center on Disability (APCD)
Break
11:30-12:30
Keynote Speech II (TICC 101)
Moderator: Mr. Joey GoldmanCo-chair, Transportation Research Board Commmittee on Accessible Transportation and Mobility (ABE60)
Keynote Speaker: Mr. Hong-Mo WuMinister, Ministry of Transportation and Communications, Republic of China (Taiwan)
12:30-14:00 Lunch (TICC Banquet Hall)
14:00-15:30
Topic Discussion 1A (TICC 101A) Topic Discussion 1B (TICC 101B) Topic Discussion 1C (TICC 101C) Topic Discussion 1D (TICC 101D)
Session Chair:Dr. Pamela Pui Yu Leung (Hong Kong)
Presenter:1A.1Mr. Bryan Matthews (UK)Is Transport still a Barrier toEmployment for Disabled People?
1A.2Ms. Natalia Martins Goncalves(Brazil)The Contribution of Public Transport tothe Accessibility to Development ofHigher Education: The Cases of Quito,Equator and Criciuman, Brazil.
1A.3Mr. Hsuan-Wei Fu (Taiwan)Using Big Data to Analyze theProductivity of Accessible TransportServices.
1A.4Mrs. Nishimura Ai (Japan)A comparative analysis on sustainableurban projects and new mobiliy servicesbetween France and Japan.
Session Chair:Prof. Lalita Sen (USA)
Presenter:1B.1Dr. Takao Yanagihara (Japan)Comparison between the FunctionalHealth and Transportation Means inRural and Urban Elderly CommunityDwellers.
1B.2Ms. Amanda Fernandes Ferreira(Brazil)The Influence of the Elderly in The Mobility Standard of Families in theMetropolitan Region of Belo Horizonte.
Session Chair:Prof. Shih-Ching, Lo (Taiwan)
Presenter:1D.1 Mr. Peter Cosyn (Belgium)On Wheels App Making AccessibilityInformation Accessible.
1D.2Dr. Chien-Pang Liu (UK)How MaaS Facilitate ConvenientMobility Service.
1D.3Ms. Yen-Hung Chou (Taiwan) Facilitating Convenient Public Transport in Rural Areas by Applying IntelligentTransportation System (ITS)Technologies.
Session Chair:Prof. Roger Mackett (UK)
Presenter:1C.1Mr. Yoshito Dobashi (Japan)The Progress of Accessibility in Transportation in Japan over TheLast Three Decades: An ObservationThrough Three Case Studies.
1C.2Prof. M. Shafiq-Ur (Rahman Bangladesh)Travel Pattern and Mobility Constraints ofDisabled People: A Case Study inDhaka City, Bangladesh.
1C.3Prof. Liam Fassam (UK)Creating Models of Transport Infrastructure for The Elderly Population;Literature Review and Cluster Analysis ofEssential Services for Mitigating TheEffects of Service Delivery Cost andSocial Exclusion.
1C.4Prof. Roger Mackett (UK)Improving Accessibility for People withMental Health Conditions.
A1-The Impact ofAccessible Transportation
B1-Studies on Older Adults'Transportation Behaviors
D1-Application forInformation Provision
B2-The Correlation betweenAccessibility and Transportation
Behaviors
Registration (TICC Foyer)
148
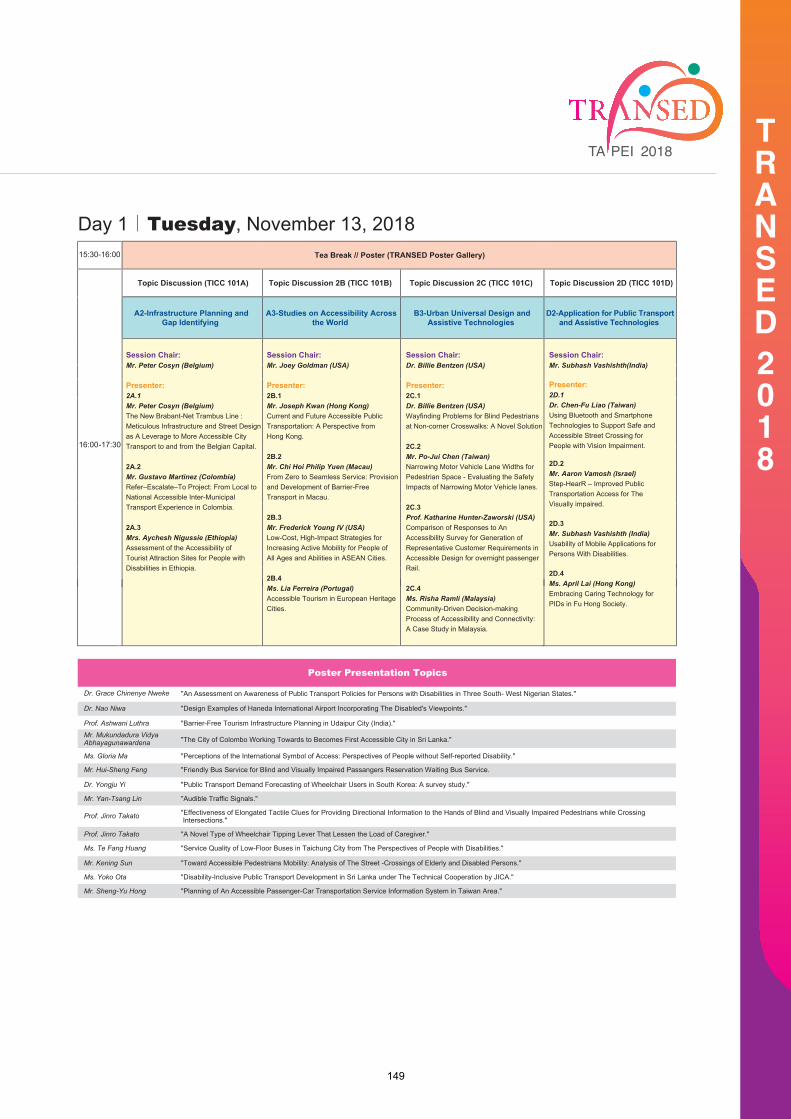
TRANSED2018
Session Chair:Mr. Peter Cosyn (Belgium)
Presenter:2A.1Mr. Peter Cosyn (Belgium)The New Brabant-Net Trambus Line :Meticulous Infrastructure and Street Designas A Leverage to More Accessible CityTransport to and from the Belgian Capital.
2A.2Mr. Gustavo Martinez (Colombia)Refer–Escalate–To Project: From Local toNational Accessible Inter-MunicipalTransport Experience in Colombia.
2A.3Mrs. Aychesh Nigussie (Ethiopia)Assessment of the Accessibility ofTourist Attraction Sites for People withDisabilities in Ethiopia.
15:30-16:00 Tea Break // Poster (TRANSED Poster Gallery)
16:00-17:30
Topic Discussion (TICC 101A) Topic Discussion 2B (TICC 101B) Topic Discussion 2C (TICC 101C) Topic Discussion 2D (TICC 101D)
A2-Infrastructure Planning andGap Identifying
A3-Studies on Accessibility Acrossthe World
B3-Urban Universal Design andAssistive Technologies
D2-Application for Public Transportand Assistive Technologies
Session Chair:Mr. Joey Goldman (USA)
Presenter:2B.1Mr. Joseph Kwan (Hong Kong)Current and Future Accessible PublicTransportation: A Perspective fromHong Kong.
2B.2Mr. Chi Hoi Philip Yuen (Macau)From Zero to Seamless Service: Provisionand Development of Barrier-Free Transport in Macau.
2B.3Mr. Frederick Young IV (USA)Low-Cost, High-Impact Strategies forIncreasing Active Mobility for People ofAll Ages and Abilities in ASEAN Cities.
2B.4Ms. Lia Ferreira (Portugal)Accessible Tourism in European HeritageCities.
Session Chair:Dr. Billie Bentzen (USA)
Presenter:2C.1Dr. Billie Bentzen (USA)Wayfinding Problems for Blind Pedestriansat Non-corner Crosswalks: A Novel Solution
2C.2Mr. Po-Jui Chen (Taiwan) Narrowing Motor Vehicle Lane Widths forPedestrian Space - Evaluating the SafetyImpacts of Narrowing Motor Vehicle lanes.
2C.3Prof. Katharine Hunter-Zaworski (USA)Comparison of Responses to An Accessibility Survey for Generation of Representative Customer Requirements inAccessible Design for overnight passengerRail.
2C.4 Ms. Risha Ramli (Malaysia)Community-Driven Decision-makingProcess of Accessibility and Connectivity:A Case Study in Malaysia.
Session Chair:Mr. Subhash Vashishth(India)
Presenter:2D.1Dr. Chen-Fu Liao (Taiwan)Using Bluetooth and SmartphoneTechnologies to Support Safe andAccessible Street Crossing for People with Vision Impairment.
2D.2Mr. Aaron Vamosh (Israel)Step-HearR – Improved PublicTransportation Access for TheVisually impaired.
2D.3Mr. Subhash Vashishth (India) Usability of Mobile Applications for Persons With Disabilities.
2D.4Ms. April Lai (Hong Kong)Embracing Caring Technology forPIDs in Fu Hong Society.
Poster Presentation Topics
Dr. Grace Chinenye Nweke "An Assessment on Awareness of Public Transport Policies for Persons with Disabilities in Three South- West Nigerian States."
Dr. Nao Niwa "Design Examples of Haneda International Airport Incorporating The Disabled's Viewpoints."
Prof. Ashwani Luthra "Barrier-Free Tourism Infrastructure Planning in Udaipur City (India)."
Mr. Mukundadura VidyaAbhayagunawardena "The City of Colombo Working Towards to Becomes First Accessible City in Sri Lanka."
Ms. Gloria Ma "Perceptions of the International Symbol of Access: Perspectives of People without Self-reported Disability."
Mr. Hui-Sheng Feng "Friendly Bus Service for Blind and Visually Impaired Passangers Reservation Waiting Bus Service.
Dr. Yongju Yi "Public Transport Demand Forecasting of Wheelchair Users in South Korea: A survey study."
Mr. Yan-Tsang Lin "Audible Traffic Signals."
Prof. Jinro Takato "Effectiveness of Elongated Tactile Clues for Providing Directional Information to the Hands of Blind and Visually Impaired Pedestrians while Crossing Intersections."
Prof. Jinro Takato "A Novel Type of Wheelchair Tipping Lever That Lessen the Load of Caregiver."
Ms. Te Fang Huang "Service Quality of Low-Floor Buses in Taichung City from The Perspectives of People with Disabilities."
Mr. Kening Sun "Toward Accessible Pedestrians Mobility: Analysis of The Street -Crossings of Elderly and Disabled Persons."
Ms. Yoko Ota "Disability-Inclusive Public Transport Development in Sri Lanka under The Technical Cooperation by JICA."
Mr. Sheng-Yu Hong "Planning of An Accessible Passenger-Car Transportation Service Information System in Taiwan Area."
Day 1|Tuesday, November 13, 2018
149

TRANSED2018
Session Chair:Mr. Peter Cosyn (Belgium)
Presenter:3A.1Mr. Subhash Vashishth (India)Universal Accessibility ofPedestrian Subways.
3A.2Prof. Pei-Fen Kuo (Taiwan)A Spatial Zero-Inflated RegressionModel for Paratransit DemandEstimation.
3A.3Mr. Ka-Long Chan (Hong Kong)Accessible Public Light Bus forHong Kong–from Zero to Trial.
Session Chair:Mr. Joseph Kwan (Hong Kong)
Presenter:3B.1Mr. Tomohiro Kitano (Japan)Universal Design on Development and Operation of Taxi Vehicle in Japan,Its Status and Problem Issues.
3B.2Prof. Meenakshi Balakrishnan (India)Improving Public Bus Transit Accessibilityfor Visually Impaired.
3B.3Prof. Katharine Hunter-Zaworski (USA)The Dilemma of Occupant Protection andManeuverability of Large WheeledMobility Devices on Passenger Rail.
Session Chair:Prof. Shou-Ren Hu (Taiwan)
Presenter:3C.1Prof. Gaurav Raheja (India)Age Friendly Urban Public SpacesTowards Sustainable and Inclusive Futures.
3C.2Dr. Helena Svensson (Sweden)Effects of Free Travel in Public Transport for Older People and People with Disabilities.
Session Chair:Mr. Daisuke Sawada (Japan)
Presenter:3D.1Prof. Roger Mackett (UK)Improving Accessibility for Older People isMore Than A Right.
3D.2Prof. An Neven (Belgium)Secure Old people’s Ultimate LifestyleMobility by Offering Augmented RealityTraining Experiences.
3D.3Dr. Ryusuke Takeuchi (Japan)Local Mobility Countermeasures inHokkaido Prefecture in Japan.
3D.4Mr. Atsushi Matsubara (Japan)Current Status of Response to Peoplewith Dementia on Public Transportationin Japan.
08:00-09:00 Registration (TICC Foyer)
09:00-10:30
Topic Discussion 3A (TICC 101A) Topic Discussion 3B (TICC 101B) Topic Discussion 3C (TICC 101C) Topic Discussion 3D (TICC 101D)
A4-Unmet Needs on Different Types of Transportation Means
A5-Universal Design for Public Transportation
B4-Government Policies and Strategies Responding to Aging
Population
B6-Transportation Service for Older Adults I
10:30-11:00 Break // Poster (TRANSED Poster Gallery)
11:00-12:30
Topic Discussion 4A (TICC 101A) Topic Discussion 4B (TICC 101B) Topic Discussion 4C (TICC 101C) Topic Discussion 4D (TICC 101D)
A6-Working on Accessibility: Guide, Assessment and Toolkit A7-MRT Focused Discussion B5-Accessibility Related
LegislationsB7-Transportation service for older
adults II
Session Chair:Prof. Chih-Peng Chu (Taiwan)
Presenter:4A.1Dr. Regina Cohen (USA)Assessment Method of Accessibility andUsability in Buildings: “Universal Designfor All” Diagnostics Tool.
4A.2Ms. Sally Swanson (USA)Universal Design and Global WayfindingGuidelines and Applications ThatSupport Accessibility for Everyone.
4A.3Mr. Jeff Turner (UK)Ensuring the Sustainable MobilityToolkit Delivers Access for All. Lessonsfrom The Literature and Future ResearchDirections.
Session Chair:Mr. Subhash Vashishth (India)
Presenter:4B.1Dr. Toshiyuki Uwano (Japan)Empirical Research of The PublicTransportation Changing The Life ofPWD in the Society. - Evidence ofTaipei Metro with the Own Wheelchair. -
4B.2Prof. Gaurav Raheja (India)Navigation and Wayfinding for Personswith Visual Impairments in Indian MetroStations.
4B.3Mr. Ramana Rachaprolu (India)Mumbai Metro Line 3 (Colaba-Bandra-SEEPZ): Design Interventions forSafe Mobility of Elderly and Persons withDisabilities.
4B.4 Ms. Amanda Fernandes Ferreira (Brazil)Urban Equity: An Overview of Urban Rail Systems Accessibility Around The World
Session Chair:Dr. Chao-Fu Yeh (Taiwan)
Presenter:4C.1Dr. Varuni Tennakoon (Sri Lanka)Stakeholder Perspectives RegardingTransportation Safety of People withDisabilities and Older Citizens inSri Lanka.
4C.2Dr. Meenu Bhambhani (India)Policy Gaps in Providing Dignified andAccessible Last Mile Connectivity toPersons with Disability in India.
Session Chair:Prof. Chung-Wei Shen (Taiwan)
Presenter:4D.1Prof. An Neven (Belgium)Commuting for People with Disabilities toA Day Care Centre - A Case Study.
4D.2Dr. Itsuki Yoshida (Japan)Possibility of "Last One Mile" MobilityUtilizing Taxi Services in Local Cities of Japan.
4D.3Dr. Helena Svensson (Sweden)The Mobility Situation for Older People inRural Areas in Sweden.
4D.4Mr. Matthieu GoudreauA Community-based Approach toAddressing Transportation Needs forRural Older Adults in Canada: Progressin Research.
12:30-14:00 Lunch (TICC Banquet Hall)
Day 2|Wednesday, November 14, 2018
Conference Information - Program
150
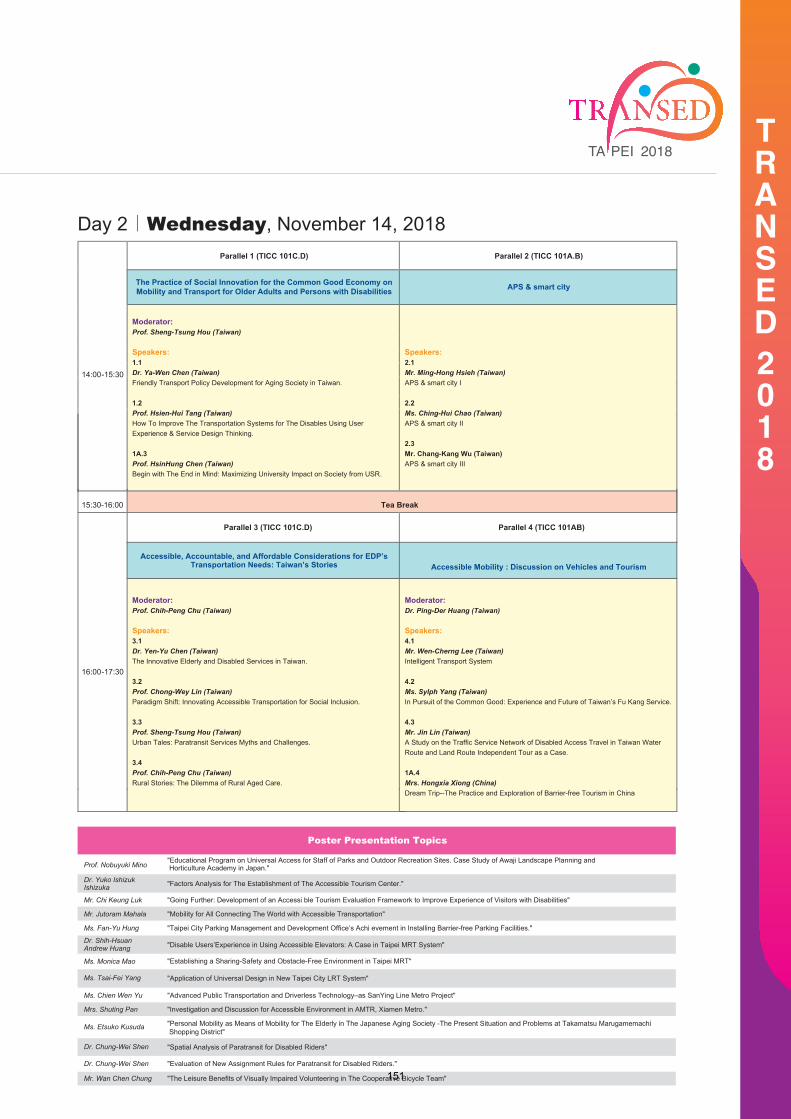
TRANSED2018
14:00-15:30
Parallel 1 (TICC 101C.D) Parallel 2 (TICC 101A.B)
The Practice of Social Innovation for the Common Good Economy on Mobility and Transport for Older Adults and Persons with Disabilities APS & smart city
Moderator:Prof. Sheng-Tsung Hou (Taiwan)
Speakers:1.1 Dr. Ya-Wen Chen (Taiwan) Friendly Transport Policy Development for Aging Society in Taiwan.
1.2 Prof. Hsien-Hui Tang (Taiwan) How To Improve The Transportation Systems for The Disables Using User Experience & Service Design Thinking.
1A.3Prof. HsinHung Chen (Taiwan)Begin with The End in Mind: Maximizing University Impact on Society from USR.
Speakers:2.1Mr. Ming-Hong Hsieh (Taiwan) APS & smart city I
2.2 Ms. Ching-Hui Chao (Taiwan) APS & smart city II
2.3 Mr. Chang-Kang Wu (Taiwan) APS & smart city III
15:30-16:00 Tea Break
16:00-17:30
Parallel 3 (TICC 101C.D) Parallel 4 (TICC 101AB)
Accessible, Accountable, and Affordable Considerations for EDP’s Transportation Needs: Taiwan’s Stories Accessible Mobility : Discussion on Vehicles and Tourism
Moderator:Prof. Chih-Peng Chu (Taiwan)
Speakers:3.1Dr. Yen-Yu Chen (Taiwan)The Innovative Elderly and Disabled Services in Taiwan.
3.2Prof. Chong-Wey Lin (Taiwan)Paradigm Shift: Innovating Accessible Transportation for Social Inclusion.
3.3Prof. Sheng-Tsung Hou (Taiwan)Urban Tales: Paratransit Services Myths and Challenges.
3.4 Prof. Chih-Peng Chu (Taiwan)Rural Stories: The Dilemma of Rural Aged Care.
Moderator:Dr. Ping-Der Huang (Taiwan)
Speakers:4.1Mr. Wen-Cherng Lee (Taiwan)Intelligent Transport System
4.2Ms. Sylph Yang (Taiwan)In Pursuit of the Common Good: Experience and Future of Taiwan’s Fu Kang Service.
4.3Mr. Jin Lin (Taiwan)A Study on the Traffic Service Network of Disabled Access Travel in Taiwan WaterRoute and Land Route Independent Tour as a Case.
1A.4Mrs. Hongxia Xiong (China)Dream Trip--The Practice and Exploration of Barrier-free Tourism in China
Poster Presentation Topics
Prof. Nobuyuki Mino"Educational Program on Universal Access for Staff of Parks and Outdoor Recreation Sites. Case Study of Awaji Landscape Planning and Horticulture Academy in Japan."
Dr. Yuko IshizukIshizuka "Factors Analysis for The Establishment of The Accessible Tourism Center."
Mr. Chi Keung Luk "Going Further: Development of an Accessi ble Tourism Evaluation Framework to Improve Experience of Visitors with Disabilities"
Mr. Jutoram Mahala "Mobility for All Connecting The World with Accessible Transportation"
Ms. Fan-Yu Hung "Taipei City Parking Management and Development Office’s Achi evement in Installing Barrier-free Parking Facilities."
Dr. Shih-HsuanAndrew Huang "Disable Users’Experience in Using Accessible Elevators: A Case in Taipei MRT System"
Ms. Monica Mao "Establishing a Sharing-Safety and Obstacle-Free Environment in Taipei MRT"
Ms. Tsai-Fei Yang "Application of Universal Design in New Taipei City LRT System"
Ms. Chien Wen Yu "Advanced Public Transportation and Driverless Technology–as SanYing Line Metro Project"
Mrs. Shuting Pan "Investigation and Discussion for Accessible Environment in AMTR, Xiamen Metro."
Ms. Etsuko Kusuda "Personal Mobility as Means of Mobility for The Elderly in The Japanese Aging Society -The Present Situation and Problems at Takamatsu Marugamemachi Shopping District"
Dr. Chung-Wei Shen "Spatial Analysis of Paratransit for Disabled Riders"
Dr. Chung-Wei Shen "Evaluation of New Assignment Rules for Paratransit for Disabled Riders."
Mr. Wan Chen Chung "The Leisure Benefits of Visually Impaired Volunteering in The Cooperative Bicycle Team"
Day 2|Wednesday, November 14, 2018
151

TRANSED2018
Day 3|Thursday, 15 November, 2018 08:00-09:00 Registration (TICC Foyer)
09:00-10:30
Topic Discussion 5A (TICC 101A) Topic Discussion 5B (TICC 101B) Topic Discussion 5C (TICC 101C) Topic Discussion 5D (TICC 101D)
A9A8-Accessible Tourism-Advocacyand Innovation
-Accessible Tourism - System and Aids B8-Special Transport Services D3-Autonomous Vehicles and
E-hailing Service
10:30-11:00 Tea Break // Poster (TRANSED Poster Gallery)
11:00-12:30
Topic Discussion 6A (TICC 101A) Topic Discussion 6B (TICC 101B) Topic Discussion 6C (TICC 101C) Topic Discussion 6D (TICC 101D)
A10-Accessible tourism-Universal design
B9-Discussion on Resilience and Flexible Systems and Aids Design
C-Collaboration and Coordination across Information, Financial and
Transportation ServicesD4-Smart City and Caring
Technology
Session Chair:Mrs. Ling Suen (Canada)
Presenter:6A.1Mrs. Chan Suen Ling (Canada)Increasing Accessibility of Physical Maps for All.
6A.2Ms. Gloria Ma (Hong Kong)“Wheel We Hike?” in Hong Kong: Experiences of Hiking Using Wheelchairs and Co-construction ofAccessible Hiking Routes Database.
6A.3Dr. Keiko Miyazaki (Japan)Study on Compact Carrier-Free Lavatories for Small Passenger Ships.
Session Chair:Prof. Lalita Sen (USA)
Presenter:5A.1Prof. An Neven (Belgium) Towards A System of VoluntaryAssistance Provision on PublicTransport.
5A.2Mr. Hideto Kijima (Japan)Lift Taxi Service for Overseas Touristsin Japan. Our Operation andCustomer's Fact.
5A.3Prof. Lalita Sen (USA)Accessibility for The Disabled andOlder Population: A Study of TheHimalayan region of India and China.
5A.4Mrs. Cristina Francisco (Dominican)Promotion of The Development ofAccessible Tourism in The Caribbean.
Session Chair:Prof. Katherine Hunter-Zaworski (USA)
Presenter:5B.1Dr. Hisashi Emori (Japan)Indoor Mobile Mapping System forEvaluating Signage Visibility.
5B.2Prof. Gaurav Raheja (India)Universal Design Approach for BusShelters in Urban Indian Context.
5B.3Mr. Herbert Wai (Hong Kong)Promoting Accessible Tourism UsingGeographic Information System (GIS)and Web Accessibility Standards-A CaseStudy in Hong Kong: Access Guide 4.0.
5B.4Prof. Katharine Hunter-Zaworski (USA)Safe Transport of Wheeled Mobility Aidsby Airlines: The Canadian Initiative.
Session Chair:Mr. Rex Luk (Hong Kong)
Presenter:5C.1Ms. Anne Durand (France) Alternatives to Special Transport Servicesin the Netherlands: The Perspective of Mobility-Impaired People.
5C.2Mr. Ching-Teng Yao (Taiwan)A Study of The Development and Efficiency of Transportation Service Aidsfor The Elderly-Take Cloud SomersaultHandicap Bus for Example.
5C.3Mr. Ka-Long Chan (Hong Kong)Rehabus Service Enhancement Study forHong Kong and Taiwan.
5C.4Ms. Chia Hsuan Yen (Taiwan)The Impact of Rehabus Operators' Operational Strategies on Operational Performance -Take The Tainan City as Example.
Session Chair:Mr. Hang Sau Ng (Hong Kong)
Presenter:5D.1Mr. Jamaal Schoby (USA)The Optimization of Publicly RegulatedE-hailing ADA ComplementaryParatransit: Implications from Boston,MA and Kansas City, MO.
5D.2Dr. Soichiro Minami (Japan)Demonstration Experiment ofAutonomous Minibus and ComprehensiveTransport Policy of Local Governments.
5D.3Mr. Bryan Matthews (UK)Inclusive Mobility and Automation inRoad Transport: Hopes and Fearsamongst Disabled and Older People.
Session Chair:Prof. Anabela Simoes (Portugal)
Presenter:6B.1Prof. Katharine Hunter-Zaworski (USA)Seating of Passengers with WheeledMobility Devices on Intercity Trains.
6B.2Prof. Anabela Simoes (Portugal)Towards Resilient and Inclusive UrbanTransport Systems.
6B.3Mr. Ashok Singh (India)Accessible Multipurpose Flood CumCyclone Shelters in Orissa, India.
Session Chair:Dr. Judy Shanley (USA)
Presenter:6C.1Dr. Judy Shanley (USA)Innovative Mobility Management: Considering The Needs of Individuals withDisabilities.
6C.2Ms. Vidhya Ramasubban (India)Kickstart Cabs- A Case Study of Accessible Transportation in India.
6C.3Ms. Manisha Singh (India)Mphasis UberACCESS and UberASSIST,India's First Public Taxi Service forPeople with Disability: A Collaborationbetween Corporates of IT, Transportationand Not for Profits Working for Peoplewith Disability
6C.4Prof. Sheng-Tsung Hou (Taiwan)Tourism Innovation in The Rural Taiwan:The Case of Accessible Taxi
Session Chair:Dr. Joseph Kwok (Hong Kong)
Presenter:6D.1Mr. Sai Padma Murthy (India)Retrofitting A Ravaged City -Visakhapatnam : A Case Study ofSouth Indian Coastal City.
6D.2Prof. Gaurav Raheja (India)Cross Cultural Paradigms of InclusiveStreet Mobility in Smart City Contexts
6D.3Dr. Regina Cohen (Brazil)Rio De Janeiro/Brazil: Smart Cities MustConsider The Rights of All.
Conference Information - Program
152
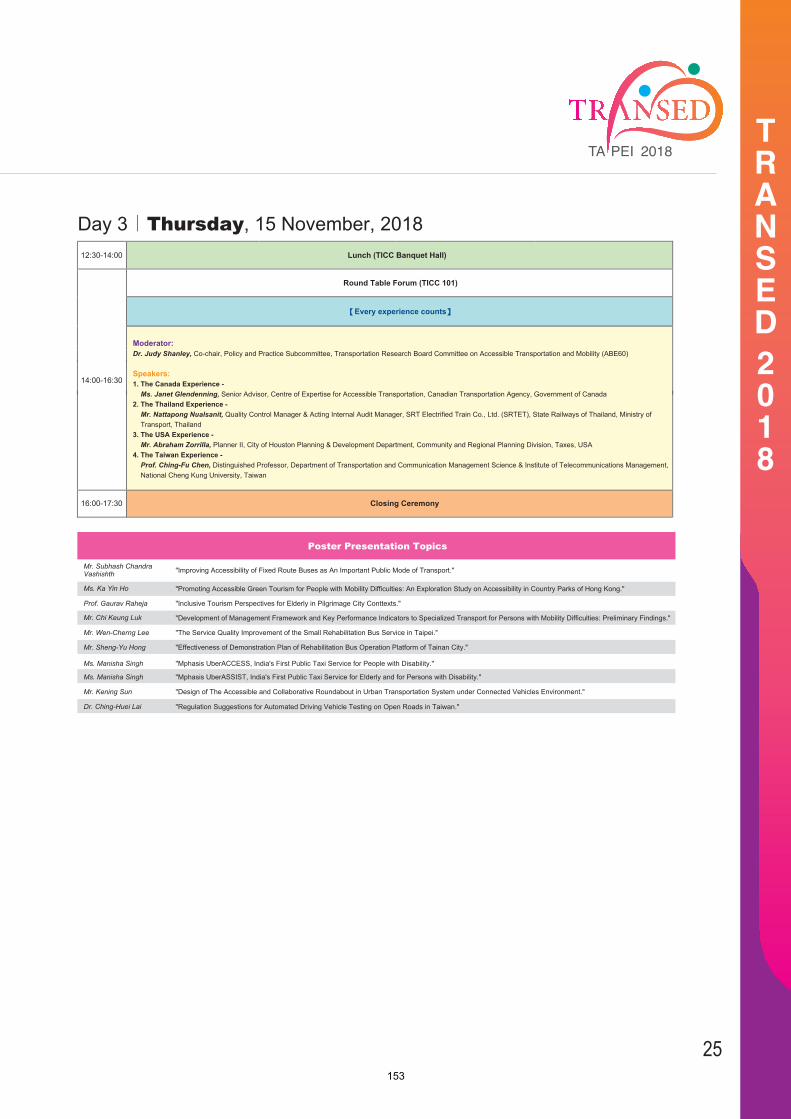
TRANSED2018
25
Day 3|Thursday, 15 November, 2018
Poster Presentation Topics Mr. Subhash ChandraVashishth "Improving Accessibility of Fixed Route Buses as An Important Public Mode of Transport."
Ms. Ka Yin Ho "Promoting Accessible Green Tourism for People with Mobility Difficulties: An Exploration Study on Accessibility in Country Parks of Hong Kong."
Prof. Gaurav Raheja "Inclusive Tourism Perspectives for Elderly in Pilgrimage City Conttexts."
Mr. Chi Keung Luk "Development of Management Framework and Key Performance Indicators to Specialized Transport for Persons with Mobility Difficulties: Preliminary Findings."
Mr. Wen-Cherng Lee "The Service Quality Improvement of the Small Rehabilitation Bus Service in Taipei."
Mr. Sheng-Yu Hong "Effectiveness of Demonstration Plan of Rehabilitation Bus Operation Platform of Tainan City."
Ms. Manisha Singh "Mphasis UberACCESS, India's First Public Taxi Service for People with Disability."
Ms. Manisha Singh "Mphasis UberASSIST, India's First Public Taxi Service for Elderly and for Persons with Disability."
Mr. Kening Sun "Design of The Accessible and Collaborative Roundabout in Urban Transportation System under Connected Vehicles Environment."
Dr. Ching-Huei Lai "Regulation Suggestions for Automated Driving Vehicle Testing on Open Roads in Taiwan."
12:30-14:00 Lunch (TICC Banquet Hall)
14:00-16:30
Round Table Forum (TICC 101)
Every experience counts
16:00-17:30 Closing Ceremony
Moderator:Dr. Judy Shanley, Co-chair, Policy and Practice Subcommittee, Transportation Research Board Committee on Accessible Transportation and Mobility (ABE60)
Speakers:1. The Canada Experience -
Ms. Janet Glendenning, Senior Advisor, Centre of Expertise for Accessible Transportation, Canadian Transportation Agency, Government of Canada2. The Thailand Experience -
Mr. Nattapong Nualsanit, Quality Control Manager & Acting Internal Audit Manager, SRT Electrified Train Co., Ltd. (SRTET), State Railways of Thailand, Ministry of Transport, Thailand
3. The USA Experience - Mr. Abraham Zorrilla, Planner II, City of Houston Planning & Development Department, Community and Regional Planning Division, Taxes, USA
4. The Taiwan Experience - Prof. Ching-Fu Chen, Distinguished Professor, Department of Transportation and Communication Management Science & Institute of Telecommunications Management, National Cheng Kung University, Taiwan
153
TRANSED2018
● Conference Material
This Conference is a green meeting supporter. All session materials including Keynote Speech, Topic Discussion, Parallel Sessions and Round Table Forum can be downloaded through conference application or website.
Conference Information - Conference Materials
154

TRANSED2018
Conference Information
Preconference Workshop
● Pre- Conference Workshop Topics
I. Safe Transport of Powered Wheeled Mobility Devices ParticularlyScooters on Public Transit
II. How to Plan Accessibility in New Urban Trends: Creating Smart,Inclusive, Sustainable, and Resilient Cities, Using New (Mobility)Concepts.
III. Understanding Hidden Disabilities
IV. Bridging the Gap: Your Role in Transporting Children with Disabilitiesto School in Developing Countries.
155
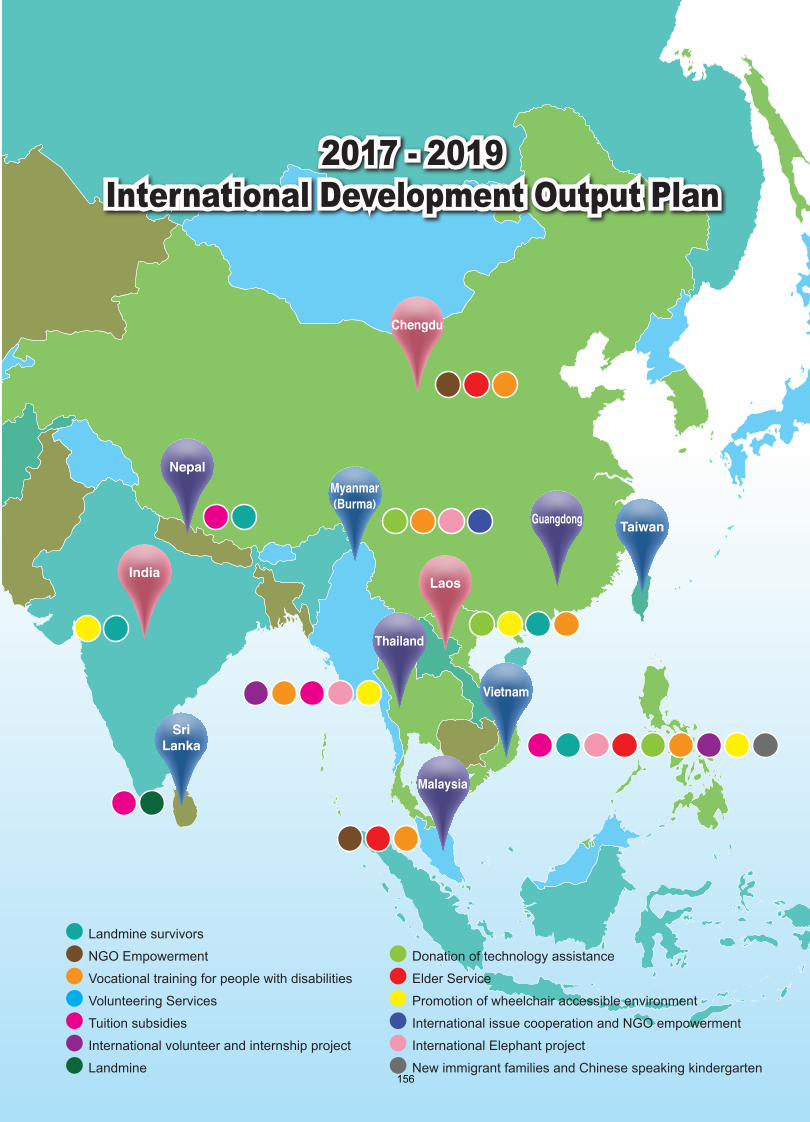
2017 - 2019International Development Output Plan
2017 - 2019International Development Output Plan
IndiaLaos
Chengdu
Taiwan
SriLanka
Vietnam
Myanmar(Burma)
Nepal
Malaysia
Guangdong
Thailand
● Landmine survivors
● NGO Empowerment
● Vocational training for people with disabilities
● Volunteering Services
● Tuition subsidies
● International volunteer and internship project
● Landmine
● Donation of technology assistance
● Elder Service
● Promotion of wheelchair accessible environment
● International issue cooperation and NGO empowerment
● International Elephant project
● New immigrant families and Chinese speaking kindergarten
●●
●●●
●●●
●●●●●
●●●●●●●●●
●●●●
●●●●
●●
●●
OF THE NATIONAL ACADEMIESTRANSPORTATION RESEARCH BOARD
Transportation Research Board(TRB) is one of six major divisions of the National Research Council, which serves
as an independent adviser to the federal government and others on scientific and technical questions of national
importance, and which is jointly administered by the National Academy of Sciences, the National Academy of
Engineering, and the Institute of Medicine. The mission of the Transportation Research Board is to provide leader-
ship in transportation innovation and progress through research and information exchange, conducted within a
setting that is objective, interdisciplinary, and multimodal. The Board is supported by state transportation depart-
ments, federal agencies including the component administrations of the U.S. Department of Transportation, and
other organizations and individuals interested in the development of transportation.
Each year, TRB’s varied activities engage more than 7,000 engineers, scientists, and other transportation
researchers and practitioners from the public and private sectors and academia, all of whom contribute their
expertise in the public interest by participating on TRB committees, panels, and task forces. Others get involved
and support TRB activities by becoming a TRB Affiliate; participating in TRB-sponsored conferences and work-
shops; authoring technical papers and contract research reports; and more.
TRB's Committee on Accessible Transportation and Mobility (ABE 60)The Committee's mandate is to educate everyone on the issues and gaps related to mobility needs for people with
limited transportation options - people with mobility, sensory and cognitive disabilities; older adults; and individuals
without private transportation. With a large proportion of our population reaching their golden years, the Commit-
tee is dedicated to ensuring mobility options that will provide older adults with a high level of accessibility and
affordability. The Committee has a global focus and broad international representation.
Providing accessible transportation enables all individuals to participate fully in an active community life. Accessi-
ble transportation through universal and inclusive design is one of the key messages the Committee communi-
cates to various groups involved in providing seamless, accessible transportation.
The TRB Committee on Accessible Transportation and Mobility works closely with other TRB Committees to
collaborate and sponsor joint activities.
People interested in participating as a friend of the Committee or as a prospective member are encouraged to join
us for our annual Committee meeting, or participate in one of our Subcommittee meetings (Policy and Practice,
Research, and Accessible Transportation Technology). All meetings are held each January at the TRB Confer-
ence in Washington, DC.
C
M
Y
CM
MY
CY
CMY
K
§j�|§�‧U� ≠±� ©�.pdf 2 2018/11/6 上午11:45
156

November 12 15, 2018TAIPEI INTERNATIONAL CONVENTION CENTER (TICC)
15th International Conference on Mobility andTransport for Elderly and Disabled Persons
( TRANSED 2018 )Mobility for all:Connecting the World with Accessible Transportation
Organizer:
15th International C
onference on Mobility and Transport for Elderly and D
isabled Persons ( TRAN
SED 2018 )
PRO
GR
AM
BO
OK
C
M
Y
CM
MY
CY
CMY
K
§j�|§�‧U� ≠±� ©�.pdf 1 2018/11/6 上午11:45
157

158
APPENDIX B
Abbreviations and Acronyms
ADA Americans with Disabilities Act ADL Activities of daily living APS Audible pedestrian signals AV Autonomous vehicles BLE Bluetooth Low Energy BVIP Blind and visually impaired persons CLTP Comprehensive Local Transport Plan CRPD Convention on the Rights of Persons with Disabilities CTP Concessionary travel pass CUSUM Cumulative summation DOT Department of Transportation DPO Disabled people’s organizations DYDTS Referred to as dynamic direction taking strategy EKF Extended Kalman filter ESIC Economic and Social Inclusion Corporation ESWF Eden Social Welfare Foundation FTA Federal Transit Administration GIS Geographic Information System ICSA Intelligent Computer Systems and Applications IoT Internet of Things IRB Institutional Review Board LIDAR Light detection and ranging LS Least square MAPS Mobile accessible pedestrian signal MLIT Ministry of Land, Infrastructure, Transport and Tourism MOT Management of Technology MRTS Mass Rapid Transit Stations NSERC Natural Sciences and Engineering Research Council of Canada NWSLC Normalized weighted signal level change OCD Obsessive-compulsive disorder PRM Persons with reduced mobility PTSD Post-traumatic stress disorder PVI Persons with vision impairments RFID Radio frequency identification RSI Roadway Safety Institute RSS Received signal strength RSSI Received signal strength indication RUTAC Rural and Urban Transportation Advisory Committee SIG Special Interest Group STEM Science, Technology, Engineering and Mathematics STM Société de Transport de Montreal

Abbreviations and Acronymes 159
SVD Singular value decomposition TAD Travel assistance device TE Transportation Economics TGSI Tactile Ground Surface Indicators TRB Transportation Research Board TTS Text-to-speech U.K. United Kingdom UCL University College London UD Universal design UNECE United Nations Economic Commission for Europe URTNA Universal Real Time Navigational Assistance VA Veering angle WAV Wheelchair-accessible vehicles

The National Academy of Sciences was established in 1863 by an Act of Congress, signed by President Lincoln, as a private, non-
governmental institution to advise the nation on issues related to science and technology. Members are elected by their peers for
outstanding contributions to research. Dr. Marcia McNutt is president.
The National Academy of Engineering was established in 1964 under the charter of the National Academy of Sciences to bring the
practices of engineering to advising the nation. Members are elected by their peers for extraordinary contributions to engineering.
Dr. John L. Anderson is president.
The National Academy of Medicine (formerly the Institute of Medicine) was established in 1970 under the charter of the National
Academy of Sciences to advise the nation on medical and health issues. Members are elected by their peers for distinguished contributions
to medicine and health. Dr. Victor J. Dzau is president.
The three Academies work together as the National Academies of Sciences, Engineering, and Medicine to provide independent,
objective analysis and advice to the nation and conduct other activities to solve complex problems and inform public policy decisions.
The National Academies also encourage education and research, recognize outstanding contributions to knowledge, and increase
public understanding in matters of science, engineering, and medicine.
Learn more about the National Academies of Sciences, Engineering, and Medicine at www.national-academies.org.
The Transportation Research Board is one of seven major programs of the National Academies of Sciences, Engineering, and Medicine.
The mission of the Transportation Research Board is to provide leadership in transportation improvements and innovation through
trusted, timely, impartial, and evidence-based information exchange, research, and advice regarding all modes of transportation. The
Board’s varied activities annually engage about 8,000 engineers, scientists, and other transportation researchers and practitioners from
the public and private sectors and academia, all of whom contribute their expertise in the public interest. The program is supported by
state transportation departments, federal agencies including the component administrations of the U.S. Department of Transportation,
and other organizations and individuals interested in the development of transportation.
Learn more about the Transportation Research Board at www.TRB.org.