Accessibility instruments survey
38
Edited by Angela Hull, Cecília Silva and Luca Bertolini Accessibility Instruments for Planning Practice Angela Hull, Cecília Silva and Luca Bertolini Accessibility Instruments for Planning Practice
-
Upload
westminster -
Category
Documents
-
view
0 -
download
0
Transcript of Accessibility instruments survey

Edited by Angela Hull, Cecília Silva and Luca Bertolini
Accessibility Instrumentsfor Planning PracticeAn
gela
Hul
l, Ce
cília
Silv
a an
d Lu
ca B
erto
lini
Acc
essi
bili
ty I
nst
rum
ents
for
Pla
nn
ing
Pra
ctic
e

Edited by
Angela Hull, Cecília Silva and Luca Bertolini
Accessibility Instruments for Planning Practice
ESF provides the COST Office through an EC contract
COST is supported by the EU RTD Framework programme

Edited by: Angela Hull School of the Built Environment Heriot-Watt University Edinburgh EH14 4AS Cecília Silva Research Centre for Territory, Transports and Environment (CITTA) Faculty of Engineering of Oporto University Rua Dr Roberto Frias s/n 4200-465 Porto Luca Bertolini University of Amsterdam Department of Geography Planning and International Development Studies, Nieuwe Prinsengracht 130 1051PH Amsterdam © COST Office, 2012 No permission to reproduce or utilise the contents of this book by any means is necessary, other than in the case of images, diagrammes or other material from other copyright holders. In such cases, permission of the copyright holders is required. This book may be cited as: COST Action TU1002 –Accessibility Instruments for Planning Practice. Please note: exceptions must be justified in writing by the Action Chair/MC.
Neither the COST Office nor any person acting on its behalf is responsible for the use which might be made of the information contained in this publication. The COST Office is not responsible for the external websites referred to in this publication.
ISBN13: 978-989-20-3187-3 (hbk)
ISBN13: 978-989-20-3210-8 (ebk)

CChapter 4. ACCESSIBILITY INSTRUMENTS SURVEY
Angela Hull, Enrica Papa, Cecilia Silva, Anssi Joutsiniemi

206 Accessibility Instruments for Planning Practice

Chapter 4. Accessibility Instruments Survey 207
44.1 Introduction This chapter presents the main results of the Accessibility Instrument Survey (AIS), collecting basic information on each of the accessibility instruments reviewed in this report (for more detail on these Instruments see Chapter 3). The aim of the survey was to enable quick, objective and comparable overviews of each of the reviewed accessibility instruments. The information collected will enable the categorization of accessibility instruments present in this research, aiming to be a reference for future categorization of accessibility instruments for planning practice. These categories will support the analysis of the coverage of accessibility instruments in this research, i.e., identify how representative this research is across different accessibility instrument types. In addition, these will be used to analyse the characteristics and concerns which most frequently underlie the development of accessibility instruments. Finally, the survey also collects developer’s perceptions on the usefulness of their accessibility instruments in planning practice, enabling the first insight into the main research question of this COST Action, although limited to the developer’s point of view.
In summary, the results of the survey will be used for four purposes: Development of an accessibility instrument sheet for each accessibility
instrument summarizing its main characteristics (Appendix A); Identify the coverage of accessibility instrument types present in this research
(Section 4.3.1) discussing the representativeness of this Action; Provide a glimpse on the characteristics and concerns which most frequently
underlie the development of accessibility instruments (Section 4.3.2); Provide a first insight into the perceived usefulness of accessibility
instruments in planning practice from the point of view of the developer (Section 4.3.2 and Section 4.3.3).
The next section provides an overview of the Survey describing the information collected. This section also describes the development process of this survey including data collection, dates and means. The results of the survey are analysed in the third section starting with a discussion on the coverage of accessibility instruments reviewed by this research (Section 4.3.1), identifying accessibility measure types which are represented and which are absent. This discussion is accompanied by the presentation of the main categories of accessibility instruments from the perspective of the end user. These categories try to summarize the main concerns planning practitioners are expected to have when searching for an accessibility instrument and is built upon some of the information collected by the survey. Following, the third section also presents a general analysis of the results (Section 4.3.2), focussing on the dominant characteristics of the accessibility instruments reviewed and on the developer’s perception of the usefulness their instrument will have for end users. The section ends with a brief cross analysis of results (Section 4.3.3) trying to identify relationships between accessibility instrument characteristics and perceptions of usefulness by developers. The fourth and last section presents the main conclusions of this study.

208 Accessibility Instruments for Planning Practice
44.2 The Accessibility Instrument Survey The Accessibility Instrument Survey was conducted on the Action’s website (http://www.accessibilityplanning.eu) with developers of accessibility instruments participating in this research being invited by e-mail with a direct link to the survey (which was not accessible otherwise or searchable on the web).
The development of the survey started in the beginning of 2011 with a general discussion meeting involving all research groups of this COST Action. The main issues of the survey were discussed in a general assembly, which was later subdivided into smaller groups to work on the particular questions in each group. This process enabled the development of an inclusive survey considering different perspectives and the backgrounds of accessibility instrument developers. The draft version of the survey was then further developed by a smaller team. The survey was available to be filled in by all participating accessibility instrument developers from mid-August to mid-September 2011.
A preliminary analysis of the results of the survey and of the comments left by the accessibility instrument developers revealed some minor corrections required for the survey. These corrections were developed following a general discussion meeting in Edinburgh in the fall of the same year with corrected questions sent out for a second round by the end of the year, concluding the data collection phase of the survey.
The final version of the survey (see Appendix B) holds 4 main groups of questions preceded by a preliminary group of questions providing general information on the developer of the accessibility instrument (such as, name, e-mail and institution) as well as the name of the accessibility instrument. The remaining questions are divided into four groups:
Planning Context. 1. Planning Goals. 2. Characteristics of the Instrument. 3. End-users and how they use the tool. 4.
The first group of questions aimed to identify a number of baseline issues for the development of the accessibility instrument, namely, if there are political requirements for accessibility planning in the country/region of origin/activity of the developer, as well as, information on the geographical scale, the status of development of the instrument and the type of planning process for which the instrument is intended.
The second group of questions aimed to identify the main planning goals considered in the development of the instrument, or in other words, the planning goals the instruments are able to consider or provide an answer to. Within this group of questions, planning goals were divided into public stakeholder goals, private investor goals and personal/individual goals.
The third group of questions aimed to summarize the main operational characteristics of the accessibility instruments surveyed, including accessibility measures type (identifying if the measure follows traditional contour measures, gravity measures, utility

Chapter 4. Accessibility Instruments Survey 209
measures, etc.) and the components considered (from the 4 main components of Transport, Land use, Temporal and Individual components), the level of disaggregation with regard to spatial, socio-economic and temporal data and analysis, and the transport modes and opportunities considered. This group also includes questions evaluating the developer’s perception on the ability of the instrument to replicate reality and on the speed of the tool.
Finally, the last group of questions aimed to evaluate the developer’s perception on the usefulness of the accessibility instrument in planning practice and to understand the relationship with the potential end users. With regard to the developer’s perception of usefulness, respondents are asked to rate how easy it is to use the instrument, the knowledge and skills required to use the instrument, the ability to provide understanding on the quality and experience of travel and the success of the instrument in its intended role in urban planning. Additional questions include issues on potential users, the role in connecting service users and accessibility providers and the role in urban planning. This group ends with questions on the main issues blocking implementation of the accessibility instrument.
With the exclusion of the rating questions, most questions allowed multiple responses. The large majority of questions allowed an answer of “Not applicable” or “Don’t know yet” (in this case only for instruments marked as “in development” in question 1.3 identifying the status of development of the instrument).
44.3 Accessibility Instruments in TU1002
4.3.1. Coverage of Accessibility Instruments The aim of this section is to present an overview of accessibility instruments and to show the coverage of the tools reviewed by this research, identifying which types and which application are represented or are absent and to provide a tool for urban and transport planning practitioners for choosing what they may need. In other words, this paragraph illustrates a “coverage analysis”, showing how many instruments of each type have been proposed in the COST Action, through a clear and quick synopsis of the main characteristics of the different instruments.
The coverage analysis of accessibility tools has been developed starting from the point of view of the potential user and the instruments have been categorized starting from five basic questions planning practitioners may have when they have to choose the instrument that best fits their requirements: For each planning question a category and several classes have been defined as summarized in the following table.

210 Accessibility Instruments for Planning Practice
TTable 4.1 Categories of how the Accessibility Instruments inform planning goals
Practitioners’ planning question Category Class
What is the geographical scale? (question 1.1 of the survey)
Geographical scale Supra-national
National
Supra-municipal
Municipal
Neighbourhood
Street
What is the planning goal? (question 2.1 of the survey)
Planning goal How to decide on the location of residences /activities / services?
How to manage, encourage or reduce the use of a particular transport mode(s)?
How to stimulate economic development?
How to ensure economic equity?
How to ensure social equity and/or cohesion?
How to ensure reductions of emission/energy use?
What kind of support are you looking for? (question 3.1 of the survey)
Decision support task Passive decision support tool
Active decision support tool
Cooperative decision support tool
Used in the ex-post evaluation of the decision impact
What will you need support on? (question 4.7 of the survey)
Role in urban planning to create new insights
to justify decisions/ positions already taken
to support strategy/ option generation
to support strategy/ optio

Chapter 4. Accessibility Instruments Survey 211
PPractitioners’ planning question CCategory Class n selection
What are the transport modes you want to consider? (question 3.8 of the survey)
Transport mode Any mode
Walking
Bicycle
Public Transport
Car
Truck
What are the trip purposes you want to consider? (question 3.9 of the survey)
Trip purpose No purpose / not applicable
All purposes (aggregate measure)
Work
Leisure
Healthcare
Shopping
In order to show the coverage of the accessibility instrument, the following tables (from Table 4.2 to Table 4.7) demonstrate how the tools presented in this research can be used and in which circumstances, according to the different services provided by the instruments. From the coverage analysis some clusters of accessibility instruments were defined according to the categories used.
The accessibility instruments presented in this research cover all the geographic scales from the supra-national scale to the street level, but only IMaFa and RIN can be used at the supranational scale; IMaFa, GDATI, TRACE and RIN can be applied at the national scale. Only IMaFa, PlaSynt, ASAMeD and MoSC consider the street level. Almost all of the instruments have been developed for the use at the supra-municipal scale and around 3/4 for the municipal scale. On the other hand, the instruments for applications at the macro or micro scale are less numerous. Most of the instruments, as showed in Table 4.2, can be used also for applications at two or more geographic scales.

212 Accessibility Instruments for Planning Practice
TTable 4.2 Coverage of each Accessibility Instrument according to the geographical scale
Accessibility instrument Geographic scale
Acronym
Coun
try
sup
ra_n
atio
nal
nat
iona
l
supr
a-m
unic
ipal
mun
icip
al
neig
hbou
rhoo
d
stre
et
IMafA ES
RIN DE
TRACE BE
PlaSynt SE
MoSC USA
GDATI PL
SAL PT
InViTo IT
EMM DE
SNAMUTS AU
SOTO NO
ABICA DK
UrbCA PT
HIMMELI FI
GraBAM IT
JAD NL
SNAPTA UK
ATI SL
SoSINeTi SW
ASAMeD UK
PST SE
MaReSi SC NO
multi scale
under municipal
municipal
and/ or supramunicipal

Chapter 4. Accessibility Instruments Survey 213
TTable 4.3 Coverage of the Accessibility Instruments according to the planning goals
Accessibility Instruments Public Sector Planning goal
Acronym
Coun
try
How
to d
ecid
e on
the
loca
tion
of re
side
nces
/a
ctiv
ities
/ s
ervi
ces?
How
to m
anag
e, e
ncou
rage
or r
educ
e th
e us
e of
a p
artic
ular
tran
spor
t mod
e(s)
?
How
to e
nsur
e ec
onom
ic e
quity
?
How
to e
nsur
e so
cial
equ
ity a
nd/o
r co
hesi
on?
How
to s
timul
ate
econ
omic
dev
elop
men
t?
How
to e
nsur
e re
duct
ions
of
emis
sion
/ene
rgy
use?
Othe
r
SNAMUTS AU
ATI SL
ABICA DK
EMM DE
PST SW
PlaSynt SW
IMaFa ES
SoSINeTi SW
ASAMeD GR
SNAPTA UK
HIMMELI FI
TRACE BE
SOTO NO
INVITO IT
MSC USA
UrbCA PT, ES
GDATI PL
MaReSi SC NO
GraBAM IT
SAL PT
multi objective
urban planning oriented
trasport planning ooriented

214 Accessibility Instruments for Planning Practice
According to the planning goals (see Table 4.3), nine accessibility tools proposed in this research have a multi objective structure. The other tools are mainly aimed at deciding on the location of residences /activities / services (urban planning oriented) or at managing, encouraging or reducing the use of a particular transport mode (transport planning oriented). One instrument (EMM) has the objective of stimulating economic development. The economic and social equity goals are covered by two instruments (SNAMUTS and ATI). None of the accessibility tools has any particular relevant aim to reduce emissions/energy use. Several instruments have also identified other specific objectives besides of the once available, which nevertheless could be settled within the existing list of general objectives and concerns (focussing on particular transport, land use, social or economic objectives).
The tools that are “transport planning oriented”, aiming to manage, encourage or reduce the use of a particular transport mode, can be divided into different categories according to the particular transport mode they are oriented towards. Two instruments (SAL and ABICA) have the goal of managing all the transport modes. GraBAM has the aim of reducing car use and encouraging public transport, while PST has the objective of managing car, bicycle and walking modes. PlaSynt and MaReSi SC focus on car use and SNAMUTS and GDATI have the aim of managing public transport modes (see Table 4.4).
TTable 4.4 Coverage of the Accessibility Instruments according to the planning goals – transport modes
Accessibility Instruments Public Planning goal – transport modes
(How to manage, encourage or reduce the use of a particular transport mode(s)?)
Acronym
Coun
try
Car
Publ
ic
Tran
spor
t
Bicy
cle
Wal
king
SAL PT
ABICA DK
GraBAM IT
PlaSynt SW
PST SW
MaReSi SC NO
SNAMUTS AU
GDATI PO

Chapter 4. Accessibility Instruments Survey 215
As regards the decision support task, the accessibility tools can be categorized according to their mission in the planning process: a passive decision support tool (aids the process of decision making, but cannot bring out explicit decision suggestions or solutions), an active decision support tool (can bring out such decision suggestions or solutions), a cooperative decision support tool (allows the decision maker or advisor to modify, complete, or refine the decision suggestions provided by the system, before sending them back to the system for validation) or a tool used in the ex-post evaluation of the decision impact.
The accessibility instruments cover all the different decision support tasks, with a significant (nearly half of the instruments) prevalence of strategic planning support tools (see Table 4.5). We can find two passive decision support tools; three active decision support tools; four cooperative decision support tools; three can be used in the ex-post evaluation of the decision impact. Finally, one instrument is used in many different parts of the planning, appraisal and project delivery process.

216 Accessibility Instruments for Planning Practice
TTable 4.5 Coverage of the Accessibility Instruments according to the decision support task
Accessibility Instruments Decision support task
Acronym Co
untry
Pass
ive
deci
sion
sup
port
tool
Activ
e de
cisi
on s
uppo
rt to
ol
Coop
erat
ive
deci
sion
sup
port
tool
Used
in th
e ex
-pos
t eva
luat
ion
of th
e de
cisi
on im
pact
Stra
tegi
c pl
anni
ng s
uppo
rt to
ol
Othe
r
PST SW
SAL PT
MaReSi SC NO
GraBAM IT
RIN DE
GDATI PO
TRACE BE
MSC USA
UrbCA PT, ES
SNAPTA UK
ASAMeD UK;NL;SE;BRA;CH;SA;JA
SoSINeTi SW
PlaSynt SE
EMM DE
HIMMELI FI
SNAMUTS AU
SOTO NO
IMaFa ES
ATI SL
JAD NL
INVITO IT
ABICA DK
ACCALC UK;EC;Global
ADSS
CDSS
Ex post evaluation
Strategic planning DSS
PDSS

Chapter 4. Accessibility Instruments Survey 217
TTable 4.6 Coverage of the Accessibility Instruments according to the instrument’s role in urban planning
Accessibility Instruments Role in urban planning
Acronym Co
untry
To c
reat
e ne
w in
sigh
ts
To ju
stify
dec
isio
ns/
posi
tions
al
read
y ta
ken
To s
uppo
rt st
rate
gy/
optio
n ge
nera
tion
To s
uppo
rt st
rate
gy/
optio
n se
lect
ion
To s
uppo
rt in
tegr
atio
n of
urb
an
plan
ning
per
spec
tives
Othe
r
PST SW
CAM PT, ES
PlaSynt SW
EMM DE
SNAMUTS AU
ASAMeD UK;NL;SE;BRA;CHI;SA;JA
SAL PT
INVITO IT
IMaFa ES
TRACE BE
RIN DE
–SOTO NO
JAD NL
ABICA DN
HIMMELI FI
GDATI PL
GraBAM IT
SNAPTA UK
ATI SL
MaReSi SC NO
GDATI PO
MoSC USA
SoSINeTI SW
ACCALC UK /EC/ Global
multi role
specific role

218 Accessibility Instruments for Planning Practice
The accessibility instruments have different (intended) roles in the urban planning process: they can be used to create new insights, to justify decisions/ positions already taken, to support strategy/ option generation, to support strategy/ option selection, to support integration of urban planning perspectives. According to this categorization, two tools (PST and UrbCA) have all the above mentioned functions.
PlaSynt, EMM, SNAMUTS, ASAMeD, SAL and InViTo can be used to create new insights, strategy/ option generation, strategy/ option selection and integration of urban planning perspectives. SOTO, JAD and ABICA have the function of creating new insights and of supporting strategy / option generation.
In general, it is fair to say that around half of the accessibility instruments have a multi-role in urban planning, focussing most of the different urban planning roles for which planning support systems generally developed. The other half has more specific roles, concentrating on one of two of these roles at a time. Within these instruments, the roles of creating new insight, supporting strategy/ option generation and to supporting integration of urban planning perspectives are most frequently found.

Chapter 4. Accessibility Instruments Survey 219
TTable 4.7 Coverage of the Accessibility Instruments according to the transport modes used in the instrument
Accessibiliity Instruments Transport modes used in the instruments
Acronym Country
Any
mod
e
Car
Publ
ic T
rans
port
Wal
king
Bicy
cle
Othe
r
Not
app
licab
le
PST SW
MaReSi SC NO
ACCALC UK /EC/ Global
EMM DE
SAL PT
RIN DE
JAD NL
ABICA DK
HIMMELI FI
UrbCA PT, ES
INVITO IT
GraBAM IT
IMaFa ES
SNAPTA UK
SNAMUTS AU
GDATI PO
SOTO NO
SoSINeTi SW
PlaSynt SW
ASAMeD UK;NL;SE;BRA;CHI;SA;JA
MoSC USA
TRACE BE
Multi modal
Caar
Car + sm
Sustainable mobility

220 Accessibility Instruments for Planning Practice
Accessibility instruments use different transport modes and in most cases combinations of them. All main transport modes are covered by the accessibility instruments researched in this Action, although analysis on accessibility by public transport, have more instruments to choose from. Instruments, such as, PST, MaReSi SC and ACCALC can use any mode, while EMM, SAL and RIN consider accessibility by the major transport mode groups (car, public transport, bicycle and walking). Most instruments consider more than one transport mode. Instruments dedicated exclusively to one particular transport mode can be found for car accessibility (HIMMELI and UrbCA) and for public transport (SNPTA, SNAMUTS, GDATI, SOTO and SoSINeTi).
According to the trip purposes/ opportunities used in the instruments, the majority of the instruments make use of all purposes (work, leisure, healthcare, shopping, education). Some of these use aggregate measure and thus are unable to specify the accessibility to particular activities while others may consider accessibility to any particular activity type. From the remaining instruments some focus on work and shopping activities can be inferred.

Chapter 4. Accessibility Instruments Survey 221
TTable 4.8 Coverage of the Accessibility Instruments according to the trip purpose
Accessibility Instruments Trip purposes / opportunities used in the instrument
Acronym Country
Any
purp
ose
(dis
aggr
egat
e) o
r All
purp
oses
(agg
rega
te m
easu
re)
Wor
k
Leis
ure
Hea
lthca
re
Shop
ping
Educ
atio
n
Othe
r
SNAPTA UK
PST SW
PlaSynt SW
SNAMUTS AU
SOTO NO
SAL PT
MoSC USA
RIN DE
UrbCA PT, ES
EMM DE
IMaFa ES
ABICA DK
GraBAM IT
HIMMELI FI
TRACE BE
MaReSi SC NO
JAD NL
ACCALC UK /EC/ Global
Multi purpose
Systematic ttrips
Shhopping

222 Accessibility Instruments for Planning Practice
All the characteristics of each instrument have been summarized in Appendix 2 in order to clearly show the characteristics and coverage of each instrument presented in the research and their specific differences.
4.3.2. Planning Context and Usability of Accessibility Instruments This section covers what the survey has told us about the planning context in which the accessibility instruments are designed to be used, the planning goals the instruments can address, the characteristics of the instruments, and developers’ perceptions of how useful their instruments are for end users.
Planning Context
In three of the countries sampled (UK, Norway and Germany) there is a policy requirement to assess accessibility in urban planning and/ or transport planning (See Figure 4.1). Whilst in Sweden, Belgium, Spain, Greece and Denmark it is advised to use an accessibility instrument in either urban planning or transportation planning. Undertaking an accessibility assessment does not appear to be a requirement, at least in the context of Finland, Australia, Poland, Italy, Portugal, Slovenia, and the Netherlands.
FFigure 4.1 Policy requirements to undertake an accessibility analysis
Twelve of the instruments have been already used in either urban/ transport or health service planning. Five of these tools are also used in research by the tool developer. The remaining instruments are research tools which have either been developed or are in the process of development.
3
8
10
2
There are legalrequirements to use
an accessibilityassessment
It is advised to usean accessibility
assessment
It is neither requirednor advised
Other0
2
4
6
8
10
12

Chapter 4. Accessibility Instruments Survey 223
All the instruments are designed to be used by spatial or urban planners. In four cases these users were the only ones perceived to be potential users. Eighteen (78%) are also relevant for transport planners. Just over half (52%) of tool initiators also feel that their instruments would be appropriate for other tool initiators/ developers or researchers to use too.
Twelve tool initiators thought a range of other users would be interested in their instrument besides urban and transport planners. Of the 3 retail location instruments, two mention retailers and two mention politicians. Politicians are mentioned by 6 other tool initiators in combination with citizens/ citizens and retailers/ and health, education, and retailers. 3 other tool initiators anticipate that either health and education, or health, education, retailers and citizens could be potential users.
Planning Goals
Thirteen of the instruments only address one of the public stakeholder planning goals as shown in
Table 4.3 above. 7 instruments address multiple goals (See Table 4.9), and in 4 cases no answer was given.

224 Accessibility Instruments for Planning Practice
TTable 4.9 Instruments that address multiple public stakeholder goals
Instrument Public Stakeholder Goals Addressed
PST How to manage, encourage or reduce the use of a particular transport mode(s)
Traffic and urban planning in municipalities
PlaSynt How to manage, encourage or reduce the use of a particular transport mode(s)
The impact of planning/ development proposals on travel habits such as route choice and mode choice, the retail potential and the potential for public space to be used
EMM How to decide on the location of residences/ activities/ services
How to stimulate economic development
How to ensure reductions of emissions/ energy use
SNAMUTS How to decide on the location of residences/ activities/ services
How to manage, encourage or reduce the use of a particular transport mode(s)
How to ensure social equity and/ or cohesion
How to ensure economic equity
How to secure speed/ cost efficiency/ potential of a particular transport mode. How to manage urban growth/ transformation/ revitalization. How to enhance stakeholders’ understanding of the link between land use and transport planning, and best practice in public transport network and service design.
ASAMeD How to decide on the location of residences/ activities/ services
How to improve cycling and pedestrian access; how to revitalize central areas; how to achieve social sustainability or cohesive communities; how to ensure access to basic services (health, education, welfare, food, shopping); how to increase the quality and experience of travel; how to create a low energy built environment.
ATI How to decide on the location of residences/ activities/ services;
How to ensure economic equity;
How to ensure social equity and/ or cohesion.
ABICA How to decide on the location of residences/ activities/ services
How to manage, encourage or reduce the use of a particular transport mode(s)
PST, PlaSynt and SNAMUTS are research tools that are already used by urban or transport planners; EMM and ASAMeD are accessibility instruments used by researchers; and ATI and ABICA are instruments “in development”.

Chapter 4. Accessibility Instruments Survey 225
FFigure 4.2 Private investor concerns addressed by the instruments
Figure 4.2 shows that nearly two-thirds (61%) of the instruments address private investors’ concerns of where to locate their business. Thirteen of the instruments focus only on this and/or the issue of where to invest in real estate. JAD specifically addresses the private investors’ goal of how to create places with high land values through transport investment.
PST and ASAMeD also address the public stakeholder concern of developing efficient transport services.
EMM, SNAMUTS, GDATI, and InVio provide information to private transport operators on where and how to develop public transport services. Except for GDATI, these instruments also address the issues of where to locate a business and/ or invest in real estate.
PlaSynt and MaReSi SC specifically focus on private sector retailers and public sector goals of managing transport. PlaSynt aims to identify the local market catchment area for retail and MaReSi SC answers the question of how large a shopping centre do we need in this location?
Figure 4.3 shows that 43% of instruments address the key issue for individuals of choosing where to live. Eight of the 10 instruments focus on this individual goal only; EMM also aims to support decisions on where to find the nearest activity, and MaReSi SC also supports decisions on where to find the nearest activity and choosing the best route to that activity.
SNAMUTS and ASAMeD address both how to choose the best route to a particular activity and how to choose the nearest activity. The latter specifically has the aim of “Choosing a neighbourhood/ housing area with a good choice of services available (health, education, etc), the quickest route to work, and how to get to the nearest opportunity”. TRACE assesses how to choose the nearest retail activity.
14
7
4
0 0
4
1 2
02468
10121416
Whe
re to
loca
te b
usin
ess
(for c
omm
erce
, ser
vice
and
othe
r com
pani
es)
Whe
re to
inve
st in
real
esta
te (f
or re
al e
stat
eow
ners
and
trad
ers)
Whe
re a
nd h
ow to
deve
lop
publ
ic tr
ansp
ort
serv
ices
(priv
ate
oper
ator
s)
Whe
re a
nd h
ow to
deve
lop
freig
ht s
uppl
ych
ains
(fre
ight
ope
rato
rs)
Enha
ncin
g pa
trona
ge
leve
ls th
roug
h in
form
atio
n an
d m
arke
ting
– ac
cess
to
info
rmat
ion
Othe
r
Not
app
licab
le
Don
’t kn
ow y
et
226 Accessibility Instruments for Planning Practice
Four instruments are able to help in the choice of the best route to a particular activity. SNAMUTS focuses on only district centres within the metropolitan area where there are spatial concentrations of two or more activities (employment, education, leisure, retail or health facilities). SNAPTA focuses on how to choose the best route to a destination by public transport and covers the activities of employment, education, leisure and health facilities. The two other instruments that enable choosing the best route to a particular activity are MaReSi SC and ASAMeD.
FFigure 4.3 Individual goals addressed by the instruments
Accessibility Instrument Characteristics
Several questions sought information on the specific characteristics or the components of accessibility which the instruments focussed on. The transport modes and the trip purposes analysed have already been addressed in tables Table 4.7 and Table 4.8 above. This section focuses on the accessibility components, the accessibility measure traditions the instrument is attached to, how well instrument developers perceive their instrument represents reality, and what the perceived user experience is.
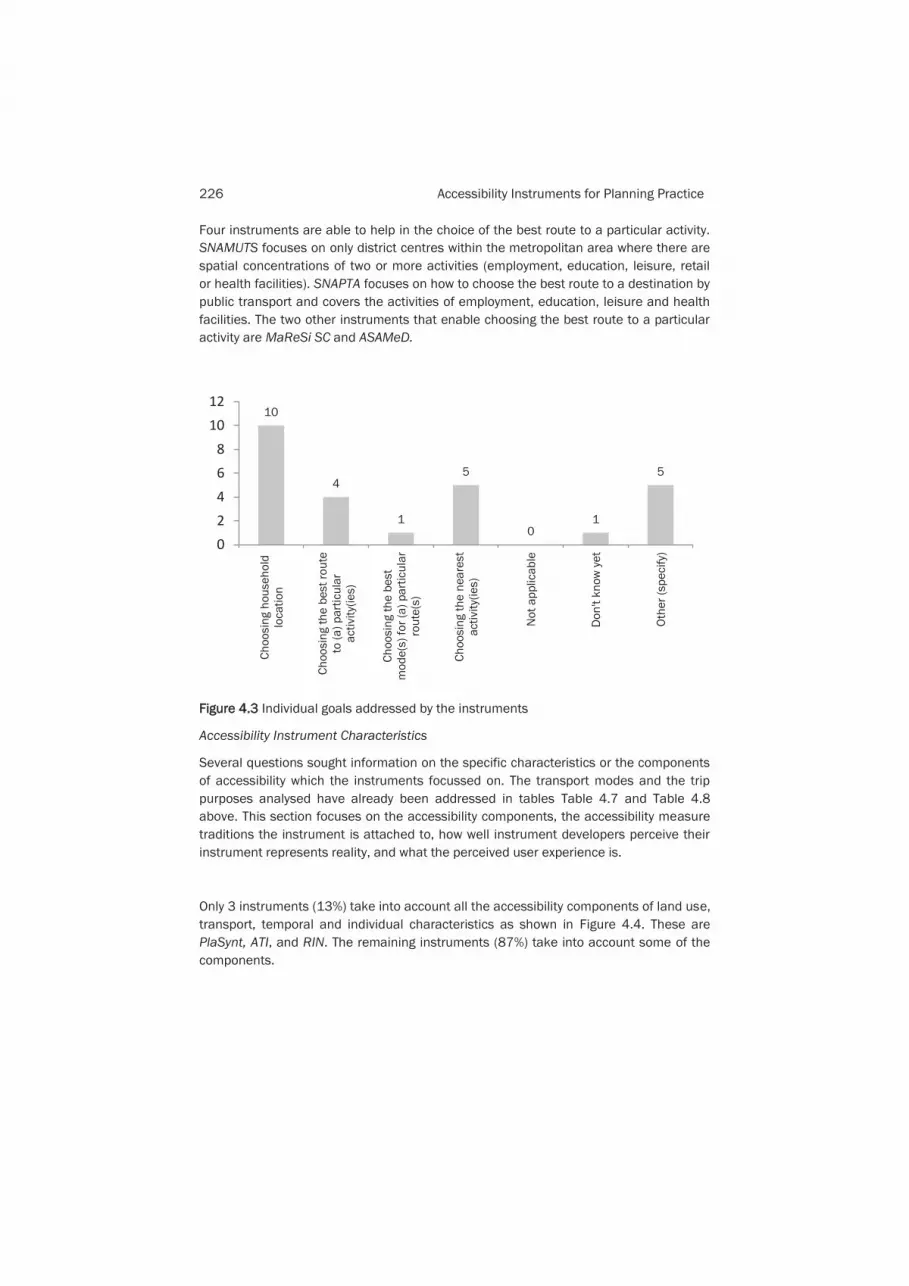
Only 3 instruments (13%) take into account all the accessibility components of land use, transport, temporal and individual characteristics as shown in Figure 4.4. These are PlaSynt, ATI, and RIN. The remaining instruments (87%) take into account some of the components.
10
4
1
5
0 1
5
02468
1012
Choo
sing
hou
seho
ldlo
catio
n
Choo
sing
the
best
rout
eto
(a) p
artic
ular
activ
ity(ie
s)
Choo
sing
the
best
mod
e(s)
for (
a) p
artic
ular
rout
e(s)
Choo
sing
the
near
est
activ
ity(ie
s)
Not
app
licab
le
Don
't kn
ow y
et
Othe
r (sp
ecify
)

Chapter 4. Accessibility Instruments Survey 227
FFigure 4.4 Accessibility components addressed by the instruments
There are four main accessibility measures that the instruments rely on. These are gravity-based measures, network measures, spatial separation measures and contour measures (See Figure 4.5). Ten instruments are attached to only one of these traditions; the other instruments use combinations of accessibility measures in their analysis. Table 4.9 shows a grouping of the instruments around the accessibility measure traditions.
Figure 4.5 Accessibility measures used in the instruments
15 15
7 8
1 1
02468
10121416
Land
-use
Tran
spor
tatio
n
Tem
pora
l
Indi
vidu
al
Not
app
licab
le
Don
't kn
ow y
et
8 8 9
1
6
2
9
0
2
0 0 0 0123456789
10
Spat
ial s
epar
atio
n m
easu
res
(1)
Cont
our m
easu
res
(2)
Gra
vity
mea
sure
s (3
)
Com
petit
ion
mea
sure
s (4
)
Tim
e-sp
ace
mea
sure
s (5
)
Utili
ty m
easu
res
(6)
Net
wor
k m
easu
res
(7)
info
rmat
ion
acce
ssib
ility
mea
sure
s (u
se ‘o
ther
’ fie
lds
in fo
llow
ing
ques
tions
to d
escr
ibe)
Othe
r
Othe
r (sp
ecifi
c)
Not
app
licab
le
Don
’t kn
ow y
et

228 Accessibility Instruments for Planning Practice
TTable 4.10 Accessibility measures used in the instruments Accessibility Instruments Accessibility measure traditions
Acro
nym
Coun
try
Spat
ial
s sepa
ratio
n
Cont
our
Grav
ity
Net
wor
k
Tim
e-sp
ace
Info
rmat
ion
Utili
ty
Com
petit
ion
Othe
r
SNAPTA UK SNAMUTS AU TRACE BE IMaFa ES ASAMeD UK;NL;SE;BRA;CHI;SA;JA ATI SL SOTO NO SAL PT MSC USA
GDATI PO PST SW PlaSynt SW RIN DE
MRSC NO EMM DE HIMMELI FI JAD NL ABICA DK GraBAM IT UrbCA PT, ES INVITO IT SoSINeTi SW ACCALC UK /EC/ Global
Few of the instruments have been designed to evaluate the quality and experience of travel. Tool developers were asked to rate their instruments on this attribute on a scale of 1-7, with 7 being the highest rating The mean and median scores in Table 4.11 show that the sample accessibility instruments are relatively weak in their ability to demonstrate understanding of the quality and experience of travel.
Spatial separation/ contour
measures
Gravity-based measures
Network measures

Chapter 4. Accessibility Instruments Survey 229
TTable 4.11 Developer’s perception on a number of issues influencing usability of Accessibility Instruments
Theme Question Min. Max Mean Median
Usability of tool in understanding the quality and experience of travel
Social evaluation 1 7 4 4.5
Environmental evaluation
1 7 3.9 4
Safety and security evaluation
1 7 2.5 2
Physical skills evaluation
1 6 2.4 1
Quality, accuracy and speed of the instrument
Quality of data 3 7 5.6 6
Quality of calculations 3 7 5.6 5
Accuracy of the model 3 7 5.2 5
Speed of the tool 1 7 3.9 4
Knowledge and Skill levels required by practitioners
Modelling and computational skills
1 7 4.5 4
Spatial awareness skills 2 7 4.6 5
Understanding policy context
1 6 3.7 4
Tool Initiators Evaluation of the Ease of Using Accessibility Instruments
Ease of collecting data 2 7 4.2 4
Ease to play 1 7 3.8 3
Transparency 3 7 5.4 5
Flexibility 3 7 5.4 6
Understandable output 4 7 5.3 5
Visual representation 2 7 5.5 6

230 Accessibility Instruments for Planning Practice
A number of questions explored how ‘easy to use’ the instruments would be for practitioners, Table 4.11 above shows the four categories of questions with each question rated by tool developers on a scale of 1-7, with 7 being the highest rating.. The first category focused on the quality and experience of travel. The table shows that the mean and median scores are the lowest ratings given overall for this suite of questions, with tool developers being more confident that their instrument would be able to provide evaluation of the social aspects of accessibility.
Tool developers were asked to rate the quality of the data and the calculations as well as the accuracy of the model and the speed of the instrument’s calculations. Tool developers gave slightly higher ratings for the quality of data and the quality of calculations than the accuracy and the speed of the instrument. The best performing instruments on these representations of reality were both gravity-based accessibility measures.
Tool developers rated the prior knowledge and skills required from practitioners to be able to use their instrument. Modelling and computational, and spatial awareness, skills were seen as more necessary than knowledge and understanding of the policy context
The visual representation of accessibility instruments for end users and the flexibility of the instrument in terms of the ease of changing parameters and variables are both highly rated in this sample. In both cases the median score shows that the distribution is influenced by a few low scoring instruments. Tool initiators also consider their instruments have a high level of transparency in terms of the main causal assumptions and that the output is understandable. Problems arise more from the ease of playing with the instrument and the ease of collecting the necessary data, both of which have lower ratings.
Two of the instruments described as ‘in use’ by practitioners received higher scores on the usability of instruments, as did many of the instruments classified as ‘in development’. This suggests that engagement with practitioners does lead to positive refinement of the instruments and also that the more recent tool developers are starting to address the usability of their instruments.
Institutional barriers to using Accessibility Instruments
This last section looks at some of the known barriers to using accessibility instruments. Tool developers identified a number of institutional issues that block the effective use of accessibility instruments in their country. Data availability is the most problematic issue identified, followed by separate institutions for urban and transport planning and formal government processes. The different objectives of organisations and the political commitment to implement accessibility instruments are also seen as problematic.

Chapter 4. Accessibility Instruments Survey 231
TTable 4.12 Barriers to the use of Accessibility Instruments
Barrier No. of responses % of sample
Separate urban and transport planning institutions 9 39%
Formal processes 7 30%
Financial arrangements 2 9%
Data availability 11 48%
Different planning objectives and/ or assumptions 6 26%
Staff technical skills 4 17%
Political commitment 6 26%
Other 5 22%
Four respondents were not aware of any institutional issues that might create a barrier to the use of accessibility instruments. Two respondents mentioned only barriers which were not included in the question. Seven respondents identified three or more barriers. Several respondents identified additional barriers.
Table 4.13 Institutional and other issues that might block the effective use of accessibility instruments
Instrument Barriers SNAPTA Resources including time available to planning agencies to engage in
such deliberation; Sometimes - timely and consistent data availability
TRACE Data availability, tool in development
SAL The instrument considers several activities (any you want but this does not mean it does so in an aggregate manner)
MaReSi SC
Black-boxing and competing analyses (non-transparent, non-understandable, incomprehensible assumption etc) from the initiators' consultants
ACCALC Most money in transport planning is linked to the delivery of a project not to the analysis of problems for users so there will always be relatively more analysis to make the case for than to understand the accessibility needs of people
IMaFa Not easy to elaborate and high cost instrument
SoSiNeTi Long term data, post evaluation data

232 Accessibility Instruments for Planning Practice
4.3.3. Cross-analysis In this cross-analysis questions from three survey sections – Planning Context (Q 1.1-1.4), Planning Goals (Q 2.1-2.3), and Characteristics of the Instrument (Q 3.1-3.12) – were tested against evaluative answers of End-users and how they use the tool (Q 4.1-4.9).
It was clear from the very beginning, that the survey composed as the first stage of the Action will contain inconsistencies in terminology and it became clear in the analysis of the survey that the respondents from different backgrounds bring natural uncertainties, fluctuation and mismatch to their answers. Therefore at this stage it is not feasible to try a comprehensive cross analysis, but instead to seek to find some preliminary main characteristics of the instruments.
A systematic check was made for clusters of answers in each question according to the most obviously recognised components and mapped against Qs 4.2, 4.4 and 4.5. For each class the mean values of the answers have been calculated and histogram have been defined, in order to understand if any relation exists between the Accessibility Instruments and the usage potential of the tool. For most of the analyses no significant relations have been found.
FFigure 4.6 Cross-analysis of selected questions
Typical histograms of cross analyses in Figure 4.6 above show the variation in answers that make further explanation using cluster analysis difficult. So far the best candidate for providing a common explanatory factor for the end-use characteristics was found from the group of questions concerning the aggregation/disaggregation level of data (Q3.4-3.6).
0
1
2
3
4
5
6
7
8
Formal Planning Process
Both/Other/Not Applicable/Don't Know Yet
0
1
2
3
4
5
6
7
8
None/Aggregate Measure
Dissaggregate measure

Chapter 4. Accessibility Instruments Survey 233
Some tentative results can be seen through a single analysis. Questions in section 3.4 required respondents to identify the level(s) of spatial aggregation in their instrument. Detailed sub questions were divided in four and included aggregation by area units (administrative unit level), local level spatial enclaves (plot level), networks (street segment level) and social grouping (individual group level). Of these the last three contain a description of disaggregated spatial entities in models, which might give a hint of the complexity of the operation procedure. This was used as a clustering principle that is easily recognized. Five instruments 13 are based solely on aggregated data and four instruments 14 use only a single type of disaggregated data. The remaining twelve instruments 15 were ones containing multiple disaggregate data sources.
13 SoSINeTi, ABICA, GraBAM, SOTO, SNAMUTS
14 MoSC, ATI, IMaFa, SNAPTA
15 UrbCA, RIN, IN.VI.TO, JAD, SAL, ASAMeD, MaReSi SC, TRACE, GDATI, HIMMELI, PST; PlaSynt

234 Accessibility Instruments for Planning Practice
TTable 4.14 Grouping by spatial aggregation and the difference between three instrument groups
3.4 Identify the level(s) of
spatial aggregation of ddata used in
the instrument.
. Eas
e of
col
lect
ing
data
ease
to p
lay
with
inst
rum
ent
trans
pare
ncy
of m
ain
caus
al a
ssum
ptio
ns
flexi
bilit
y of
inst
rum
ent (
ease
of c
hang
ing
para
met
ers
and
varia
bles
)
unde
rsta
ndab
le o
utpu
t
visu
ally
repr
esen
tatio
n
Plea
se ra
te th
e kn
owle
dge
and
skill
s re
quire
d to
use
the
tool
in te
rms
of:
mod
ellin
gcom
puta
tiona
l ski
lls
spat
ial a
war
enes
s sk
ills
unde
rsta
ndin
g po
licy
cont
ext
usab
ility
in e
nviro
nmen
tal e
valu
atio
n
usab
ility
in s
afet
y an
d se
curit
y ev
alua
tion
usab
ility
for p
hysi
cal s
kills
eva
luat
ion
Q 4.2 Q 4.4 Q 4.5
A B C D E F A B C B C D
Only aggregate data (N=6);
MEAN
2,333
2,333
3,667
3,833
3,667
2,833
3,000
2,667
1,500
1,500
0,833
1,000
One disaggregate
source (N=4); MEAN
4,750
2,750
5,500
5,500
5,750
6,500
5,250
4,000
2,000
4,000
3,500
2,750
Multiple disaggregate
data source (N=12); MEAN
4,308
4,154
5,308
5,308
5,154
5,538
4,231
4,923
4,308
4,077
2,154
2,154
Difference: row1 | row2
-2,417
-0,417
-1,833
-1,667
-2,083
-3,667
-2,250
-1,333
-0,500
-2,500
-2,667
-1,750
Difference: row1 | row3
-1,974
-1,821
-1,641
-1,474
-1,487
-2,705
-1,231
-2,256
-2,808
-2,577
-1,321
-1,154
Difference: row2 | row3
0,442
-1,404
0,192
0,192
0,596
0,962
1,019
-0,923
-2,308
-0,077
1,346
0,596
Although it is obvious that the visual representation benefits from detailed data collection in the same way as the applicability of the instrument for social-economic evaluation is correlated with the level of the socioeconomic disaggregation of the data, it appears that it also has the effect of wider usage and operation of the instrument. Even though the sample sizes are small and the objectivity of respondents can be further debated, it is probably not too much to say that the level of aggregation/disaggregation divides instruments into two major categories that also have very different usage potentials.

Chapter 4. Accessibility Instruments Survey 235
Figure 4.7 Images showing two extreme principles of accessibility instruments: zonal aggregation vs. detailed morphology

236 Accessibility Instruments for Planning Practice
44.4 Conclusions This conclusion summarises the main findings of the questionnaire survey and draws out some salient points that will be reflected on in Section 5 of this report.
We have heterogeneity evident in the accessibility instruments in this COST Action. This may reflect the diversity of the urban planning contexts across Europe and the different institutional contexts for urban planning such as the legal underpinnings, responsibilities and the spatial levels at which urban planning governance takes place. The instruments in this Action focus essentially on the needs of spatial/ urban planners (27%) and transport planners (24%) for data on accessibility.
In particular, the instruments are intended to support the following urban planning tasks:
The integration of urban planning perspectives (27%). 1. Strategy/ option generation (25%). 2. Strategy/ option selection (23%). 3. Create new insights (16%). 4. Justify decisions/ positions already taken (10%). 5.
Few instruments are able to understand the quality and experience of travel.
An accessibility analysis is required in 3 EU member states for some aspects of urban and transport planning. The survey confirms that the instruments developed in these countries tend to have a higher level of transparency of the main causal assumptions, since they have been used by practitioner and other stakeholders. The visual representation of the findings is also more developed in these instruments. Where there is a legal requirement, the instruments focus more on aspects of a liveable, sustainable community/ settlement, than the other instruments.
The survey suggests that in another four member states it is advised to undertake accessibility assessments and in the remaining countries in this Action, it does not yet appear to be supported. Respondents drew attention to a number of barriers to using accessibility instruments in their country. These included data availability (mentioned by 48% of respondents), separate urban and transport planning institutions (39%), formal processes (30%), different planning objectives/ assumptions (26%), and political commitment (26%). Five respondents mentioned other barriers too.
Despite the diversity of instruments and their purposes, the Tables in this section have started to cluster and categorize the instruments based on the questionnaire responses. Clustering has been analyzed for the issues of geographic scale (Table 4.2), public sector planning goals (
Table 4.3), decision support task (Table 4.5), role in urban planning (Table 4.6), transport modes used in the instruments (Table 4.7), trip purposes (Table 4.8), and accessibility measure traditions (Table 4.10).

Chapter 4. Accessibility Instruments Survey 237
Tool developers were asked to rate how user-friendly their instruments were on a number of dimensions. Generally higher ratings were given for the quality of the data used, the quality of the instrument calculations, the visual representation of outputs and the flexibility of the instrument in terms of changing parameters. Lower ratings were generally given for the speed and accuracy of the instrument, the ease of playing with the instrument and the ease of collecting data by end –users. However, some instruments “in development” were given higher ratings on these aspects by their tool developers.

238 Accessibility Instruments for Planning Practice

DICHIARAZIONE RELATIVA AL CONTRIBUTO INDIVIDUALE APPORTATO DA CIASCUN AUTORE
PUBBLICAZIONE Hull A, Papa E, Silva C, Joutsiniemi A (2012) Accessibility Instruments Survey In: Accessibility Instruments for Planning Practice. Report 1 of COST Action TU1002 "Accessibility Instrument for Planning Practice in Europe". p. 205-237, BRUXELLES:COST Office, ISBN: 978-989-20-3187-3 Pur nell’unitarietà della stesura del paper, sono da attribuirsi il paragrafo 4.1 a Cecilia Silva, il paragrafo 4.2 a Angela Hull, il paragrafo 4.3 ad Enrica Papa, il paragrafo 4.4 ad Anssi Joutsiniemi