TRANSPORTATION IMPROVEMENT PROGRAM
189
TRANSPORTATION IMPROVEMENT PROGRAM FISCAL YEAR 2013/2014 THROUGH FISCAL YEAR 2017/2018 ADOPTED: June 21, 2013 AMENDED September 20, 2013 August 16, 2013 November 22, 2013 P.O. Box 150045 Cape Coral, Florida 33915 239-244-2220 www.leempo.com "The preparation of this report has been financed in part through grant[s] from the Federal Highway Administration and Federal Transit Administration, U.S. Department of Transportation, under the State Planning and Research Program, Section 505 [or Metropolitan Planning Program, Section 104(f)] of Title 23, U.S. Code. The contents of this report do not necessarily reflect the official views or policy of the U.S. Department of Transportation."
-
Upload
khangminh22 -
Category
Documents
-
view
1 -
download
0
Transcript of TRANSPORTATION IMPROVEMENT PROGRAM

TRANSPORTATION IMPROVEMENT PROGRAM FISCAL YEAR 2013/2014 THROUGH FISCAL YEAR 2017/2018
ADOPTED: June 21, 2013
AMENDED September 20, 2013
August 16, 2013 November 22, 2013
P.O. Box 150045 Cape Coral, Florida 33915
239-244-2220 www.leempo.com
"The preparation of this report has been financed in part through grant[s] from the Federal Highway Administration and Federal Transit Administration, U.S. Department of Transportation, under the State Planning and Research Program, Section 505 [or Metropolitan Planning Program, Section 104(f)] of Title 23, U.S. Code. The contents of this report do not necessarily reflect the official views or policy of the U.S. Department of Transportation."

Transportation Improvement Program FY 2013/14 through FY 2017/18

Table of Contents RESOLUTION I-1 GLOSSARY II-1 INTRODUCTION III-1 PROJECT LOCATION MAP IV-1 HIGHWAY PROJECTS V-1 AVIATION PROJECTS VI-1 BICYCLE PEDESTRIAN ACTIVITIES VII-1 TRANSIT PROJECTS VIII-1 TRANSPORTATION DISADVANTAGED PROGRAM PROJECTS IX-1 INTERMODAL DEVELOPMENT PROJECTS X-1 SAFETY PROJECTS XI-1 PLANNING XII-1 FINANCIAL SUMMARY BY CATEGORY – 2010/11 – 2014/15 XIII-1 PROGRAMMED LOCAL GOVERNMENT HIGHWAY IMPROVEMENTS XIV-1 FEDERALLY OBLIGATED PROJECTS XV-1 ROLL FORWARD AMENDMENTS XVI-1
Transportation Improvement Program FY 2013/14 through FY 2017/18

Transportation Improvement Program FY 2013/14 through FY 2017/18

SECTION I RESOLUTION
Transportation Improvement ProgramFY 2013/14 through FY 2017/18
I - 1

Transportation Improvement ProgramFY 2013/14 through FY 2017/18
I - 2

Transportation Improvement ProgramFY 2013/14 through FY 2017/18
I - 3

Transportation Improvement ProgramFY 2013/14 through FY 2017/18
I - 4

SECTION II GLOSSARY
Transportation Improvement ProgramFY 2013/14 through FY 2017/18
II - 1

Transportation Improvement ProgramFY 2013/14 through FY 2017/18
II - 2

Acronyms Used in this TIP
ACRONYM DESCRIPTION ACRONYM DESCRIPTION
AADT Annual Average Daily Traffic CTST Community Traffic System Team
ADA American Disabilities Act CTD Commission for Transportation Disadvantaged
ADM Administration CUTR Center for Urban Transportation Research
AMDA Application for Master Development Approval CUTS Coordinated Urban Transportation Systems
AMPO Association of Metropolitan Planning Organization DB Design – Build
ATIS Advanced Traveler Information System DBE Disadvantaged Business Enterprise
ATMS Advanced Traffic Management System DMS Dynamic Messaging System
ATPPL Alternative Transportation in Parks and Public Lands DOT Department of Transportation
BOCC Board of County Commissioners DRI Development of Regional Impact
BPAC Bicycle Pedestrian Advisory Committee EAR Evaluation and Appraisal Report
BPCC Bicycle Pedestrian Coordinating Committee EEO Equal Employment Opportunity
BRT Bus Rapid Transit EMO Environmental Management Office
CAC Citizens Advisory Committee ENV Environmental Mitigation
CAD Computer Aided Drafting ESRI Environmental Systems Research Institute
CAMP Corridor Access Management Plan EST Environmental Screening Tool
CAP Capital Grant ETAT Environmental Technical Advisory Team
CAT Collier Area Transit ETDM Efficient Transportation Decision Making
CEI Construction Engineering Inspection FAC Federal Aid Circular
CEMP Comprehensive Emergency Management Plan FAP Federal Aid Program
CFASPP Continuing Florida Aviation System Planning Process FDOT Florida Department of Transportation
CFDA Catalogue of Federal Domestic Assistance FGCU Florida Gulf Coast University
Transportation Improvement ProgramFY 2013/14 through FY 2017/18
II - 3

CFR Code of Federal Regulations FHWA Federal Highway Administration
CIGR County Incentive Grant Program with growth management funds FIHS Florida Interstate Highway System
CIP Capital Improvement Program FM Federal Management
CM/TSM Congestion Mitigation/Transportation System Management FMR Federal Management Regulation
CMR Congestion Monitoring Report FPN Financial Project Number
CMP Congestion Management Process FPTA Florida Public Transportation Association
CMS Congestion Management System FS Florida Statutes
COOP Continuity of Operation Plan FSUTMS Florida Standard Urban Transportation Model Structure
CRA Community Redevelopment Agency FY Fiscal Year
CRT Commuter Rail Transit GA General Aviation
CTC Community Transit Coordinator GIS Geographical Information System
HWY Highway PDC Present Day Cost
I- Interstate PD&E Project Development & Environment
ICAR Intergovernmental Coordination and Review PE Preliminary Engineering
IDAS Intelligent Transportation Systems Deployment analysis System PEA Planning Emphasis Area
ITS Intelligent Transportation System PIP Public Involvement Plan
IMS Incident Management System PL Planning
ISTEA Intermodal Surface Transportation Efficiency Act of 1991 PTO Public Transportation Organization
ITSSC Intelligent Transportation Systems Stakeholder Committee RFP Request for Proposal
JARC Job Access and Reverse Commute ROW, R/W Right of Way
JPA Joint Participation Agreement SAFETEA-LU Safe, Accountable, Flexible, Efficient Transportation Equity Act: A Legacy for Users
LAP Local Agency Program SAP Specific Area Plans
LAR Local Advance Reimbursement SEIR State environmental Impact Report
LC Lee County SIB State Infrastructure Bank
Transportation Improvement ProgramFY 2013/14 through FY 2017/18
II - 4

ACRONYM DESCRIPTION ACRONYM DESCRIPTION
LCB Local Coordinating Board SIS Strategic Intermodal System
LCDOT Lee County Department of Transportation SOV Single Occupancy Vehicle
LCHSTP Locally Coordinated Public Transit Human Services Transportation Plan SR State Road
LOS Level of Service SRTS Safe Route to School
LRTP Long Range Transportation Plan STP Surface Transportation Program
LUAM Land Use Allocation Model SW Sidewalk
MCC Model Coordinating Committee SWFIA Southwest Florida International Airport
MN Maintenance SWFMRT Southwest Florida Metro-Regional Transportation
M&O Maintenance and Operations SWFRPC Southwest Florida Regional Planning Council
MPO Metropolitan Planning Organization TAC Technical Advisory Committee
MPOAC Metropolitan Planning Organization Advisory Council TAN Transportation Advisory Network
MPP/PL Metropolitan Planning Program TAOC Transit Authority Oversight Committee
MSTU Municipal Service Taxing Unit TAZ Traffic Analysis Zone
NARC National Association of Regional Councils TD Transportation Disadvantaged
NEPA National Environmental Policy Act TDM Transportation Demand Management
NHAC Principal Arterials TDP Transit Development Plan
NS/EW North South/East West TDSP Transportation Disadvantaged Service Plan
OMB Office of Management and Budget TE Transportation Enhancement
OPS Operations Grant T/E Grant Trip Equipment Grant
PDA Personal Digital Assistant TEA Transportation Enhancement Application
TEA-21 Transportation Equity Act for the 21st Century TRANPLAN Transportation Planning
TELUS Transportation Economic and Land Use System TRIP Transportation Regional Incentive Program
TIA Traffic Impact Analysis TRB Transportation Research Board
Transportation Improvement ProgramFY 2013/14 through FY 2017/18
II - 5

ACRONYM DESCRIPTION ACRONYM DESCRIPTION
TIM Traffic Incident Management ULAM Urban Land Use Allocation Model
TIP Transportation Improvement Plan UPWP Unified Planning Work Program
TMA Transportation Management Area USC United States Code
TMC Transportation Monitoring Center UZA Urbanized Area
TOCC Traffic Operations Coordinating Committee ZDATA Zonal Data
TOP Transportation Operations Program LCHSTP Locally Coordinated Human Services Transportation Plan
RW Runway ATCT Air Traffic Control Tower
N, S, E, W North, South, East or West SMS Safety Management System
Bus. Business VASI Visual Approach Slope Indicator
FUNDING CODES USED IN THIS TIP
FUND DESCRIPTION GROUP DESCRIPTION
ACAN ADVANCE CONSTRUCTION ANY AREA F32 OFA – AC FUNDING
ACBR ADVANCE CONSTRUCITON (BRT) F32 OFA – AC FUNDING
ACCM ADVANCE CONSTRUCTION (CM) F32 OFA – AC FUNDING
ACEM EARMARKS AC F43 100% FEDERAL DEMO/EARMARK
ACEN ADVANCE CONSTRUCTION (EBNH) F32 OFA – AC FUNDING
ACEP ADVANCE CONSTRUCTION (EBBP) F32 OFA – AC FUNDING
ACER ADVANCE CONSTRUCTION (ER) F32 OFA – AC FUNDING
Transportation Improvement ProgramFY 2013/14 through FY 2017/18
II - 6

FUND DESCRIPTION GROUP DESCRIPTION
ACIM ADVANCE CONSTRUCTION (IM) F12 I, IM – AC FUNDING
ACNH ADVANCE CONSTRUCTION (NH) F22 NH – AC FUNDING
ACNP ADVANCED CONSTRUCTION – NATIONAL HIGHWAY PERFORMANCE PROGRAM FEDERAL
ACNR AC NAT HWY PERFORM RESURFACING F22 NH – AC FUNDING
ACSA ADVANCE CONSTRUCION (SA) F32 OFA – AC FUNDING
ACSB AC FOR SABR – STP BRIDGES F32 OFA – AC FUNDING
ACSE ADVANCE CONSTRUCTION (SE) F32 OFA – AC FUNDING
ACSL ADVANCE CONSTRUCION (SL) F32 OFA – AC FUNDING
ACSN ADVANCE CONSTRUCTION (SN) F32 OFA – AC FUNDING
ACSU ADVANCE CONSTRUCTION (SU) F32 OFA – AC FUNDING
ACTA AC-TRANS ALTERNATIVES ANY AREA F32 OFA – AC FUNDING
ACTL TRANS ALTERNAIVES <200K F32 OFA – AC FUNDING
ACTN AC-TRANS ALTERNATIVES <5K F32 OFA – AC FUNDING
ACTU AC-TRANS ALTERNAIVES >200K F32 OFA – AC FUNDING
ACXA ADVANCE CONSTRUCTION (XA)
BNBR AMENDMENT 4 BONDS (BRIDGES) N31 BONDS
BNCA BOND – CONTROLLED ACCESS N31 BONDS
Transportation Improvement ProgramFY 2013/14 through FY 2017/18
II - 7

FUND DESCRIPTION GROUP DESCRIPTION
BNDS BOND – STATE N31 BONDS
BNIR R/W & BRIDGE BONDS FOR INTRASTATE N31 BONDS
BNPK AMENDMENT 4 BONDS (TPK) N32 BONDS – TURNPIKE
BRAC BRT (AC/REGULAR) F34 OFA – AC/REGULAR
BRP STATE BRIDGE REPLACEMENT N11 100% STATE
BRRP STATE BRIDGE REPAIR AND REHAB N11 100% STATE
BRT FEDERAL BRIDGE REPLACEMENT – ON SYSTEM F31 OFA – REGULAR FUNDS
BRTD FEDERAL BRIDGE REPLACEMENT – DISCRETIONARY F33 OFA – DEMO/EARMARK FUNDS
BRTZ BRT (AC/REGULAR) F31 OFA – REGULAR FUNDS
CFA CONTRACTOR FUNDS ADVANCE N49 OTHER NON-FEDERAL FUNDS
CIGP COUNTY INCENTIVE GRANT PROGRAM N11 100% STATE
CIGR CIGP FOR GROWTH MANAGEMENT N11 100% STATE
CM CONGESTION MITIGATION – AQ F31 OFA – REGULAR FUNDS
COE CORP OF ENGINEERS (NON-BUDGET) F49 100% FEDERAL NON-FHWA
D UNRESTRICTED STATE PRIMARY N11 100% STATE
DC STATE PRIMARY PE CONSULTANTS N11 100% STATE
DCA DEPARTMENT OF COMMUNITY AFFAIRS N49 OTHER NON-FEDERAL FUNDS
Transportation Improvement ProgramFY 2013/14 through FY 2017/18
II - 8

FUND DESCRIPTION GROUP DESCRIPTION
DDR DISTRICT DEDICATED REVENUE N11 100% STATE
DDRF DISTRCIT DEDICATED REVENUE MATCHING FUNDS N11 100% STATE
DEM ENVIRONMENTAL MITIGATION N11 100% STATE
DEMW ENVIRONMENTAL MITIGATION – WETLANDS N11 100% STATE
DEP DEPARTMENT OF ENVIRONMENTAL PROTECTION N11 100% STATE
DER EMERGENCY RELIEF – STATE FUNDS N11 100% STATE
DFTA FEDERAL PASS – THROUGH $ FROM FTA F49 100% FEDERAL NON-FHWA
DI STATE-STATEWIDE INTER/INTRASTATE HIGHWAY N11 100% STATE
DIH STATE IN-HOUSE PRODUCT SUPPORT N11 100% STATE
DIOH STATE 100% - OVERHEAD N11 100% STATE
DIRS ADVANCE ACQUISITION – INTRASTATE CORRIDOR N11 100%
DIRT STATE FUNDS (DIRS) ON TPK N21 TURNPIKE CAPITAL IMPROVEMENT
DIS STRATEGIC INTERMODAL SYSTEM N11 100% STATE
DITS STATEWIDE ITS N11 100% STATE
DL LOCAL FUNDS – PTO- BUDGETED N44 LOCAL
DPTO STATE PTO N11 100% STATE
DRA REST AREAS N11 100% STATE
Transportation Improvement ProgramFY 2013/14 through FY 2017/18
II - 9

FUND DESCRIPTION GROUP DESCRIPTION
DS STATE PRIMARY HIGHWAYS AND PTO N11 100% STATE
DSB PRIMARY CONSULTANT/REIMBURSE BY BOND N41 TOLL CAPITAL IMPROVEMENTS
DSF STATE PRIMARY MATCHING FUNDS N11 100% STATE
DU STATE PRIMARY/FEDERAL REIMBURSEMENT F49 100% FEDERAL NON-FHWA
DWS WEIGH STATIONS N11 100% STATE
EB EQUITY BONUS F31 OFA – REGULAR FUNDS
EBBP EQUITY BONUS – BRIDGE F34 OFA – AC/REGULAR
EBNH EQUITY BONUS – NH F34 OFA – AC/REGULAR
EBOH EQUITY BONUS – OVERHEAD F31 OFA – REGULAR
FAA FEDERAL AVIATION ADMINISTRATION F49 100% FEDERAL NON-FHWA
FBD FERRYBOAT DISCRETIONARY F33 OFA – DEMO/EARMARK FUNDS
FCO PRIMARY/FIXED CAPITAL OUTLAY N11 100% STATE
FEDR FEDERAL RESEARCH ACTIVITIES F49 100% FEDERAL NON-FHWA
FEMA FEDERAL EMERGENCY MANAGEMENT ASSISTANCE F49 100% FEDERAL NON-FHWA
FFTF FEDERAL FORTFITURE TRUST FUND F49 100% FEDERAL NON-FHWA
FHPP FEDERAL HIGH PRIORITY PROJECTS F33 OFA – DEMO/EARMARK FUNDS
FLEM FL DIV OF EMERGENCY MANAGEMENT N49 OTHER NON-FEDERAL FUNDS
Transportation Improvement ProgramFY 2013/14 through FY 2017/18
II - 10

FUND DESCRIPTION GROUP DESCRIPTION
FMA FEDERAL MANTIME ADMINISTRATION F49 100% FEDERAL NON-FHWA
FRA FEDERAL RAILROAD ADMINISTRATION F49 100% FEDERAL NON-FHWA
FRAD FRA GRANT PAYBACK N11 100% STATE
FRM6 HIGHWAY PRIORITY PROJECTS F43 100% FEDERAL DEMO/EARMARK
FSDU FED STIMULUS, FTA REIMB F49 100% FEDERAL NON-FHWA
FSF1 FED STIMULUS, S/W MANAGED F45 100% FEDERAL STIMULUS
FSFB FED STIMULUS, FERRY BOAT DISC F45 100% FEDERAL STIMULUS
FSSE FED STIMULUS, ENHANCEMENT F45 100% FEDERAL STIMULUS
FSSL FED STIMULUS, AREAS <= 200K F45 100% FEDERAL STIMULUS
FSSN FED STIMULUS, NON-URBAN F45 100% FEDERAL STIMULUS
FSSU FED STIMULUS, URBAN AREAS > 200K F45 100% FEDERAL STIMULUS
FTA FEDERAL TRANSIT ADMINISTRATION F49 100% FEDERAL NON-FHWA
FTAD FTA FUNDS COMM. BY TD COMM. F49 100% FEDERAL NON-FHWA
FTAT FHWA TRANSFER TO FTA (NON-BUDGETED) F43 100% FEDERAL DEMO/EARMARK
GMR GENERAL REVENUE FOR SIS
HP FEDERAL HIGHWAY PLANNING F31 OFA – REGULAR FUNDS
HPAC HP (AC/REGULAR) F34 OFA – AC/REGULAR
Transportation Improvement ProgramFY 2013/14 through FY 2017/18
II - 11

FUND DESCRIPTION GROUP DESCRIPTION
HPP HIGH PRIORITY PROJECTS F43 100% FEDERAL DEMO/EARMARK
HR FEDERAL HIGHWAY RESEARCH F31 OFA – REGULAR FUNDS
HSP HIGHWAY SAFETY PROGRAM F31 OFA – REGULAR FUNDS
IM INTERSTATE MAINTENANCE F11 I, IM – REGULAR FUNDING
IMAC IM (AC/REGULAR) F13 IM – AC/REGULAR
IMD INTERSTATE MAINTENANCE DISCRETIONARY F41 100% FEDERAL FUNDS
IRR INDIAN RESERVATION RAILROADS F31 OFA – REGULAR FUNDS
IVH INTELLIGENT VEHICLE HIGHWAY SYSTEM F33 OFA – DEMO/EARMARK FUNDS
LF LOCAL FUNDS N44 LOCAL
LFD “LF” FOR STTF UTILITY WORK N11 100% STATE
LFF LOCAL FUNDS FOR MATCHIN F/A N44 LOCAL
LFI LOCAL FUNDS INTEREST EARNED N44 LOCAL
LFP LOCAL FUND FOR PARTICIPATING LOCAL
LFRF LOCAL FUNDS REIMBURSEMENT FUTURE
NCPD NATIONAL CORRIDOR PLAN AND DEV F33 OFA – DEMO/EARMARK FUNDS
NH PRINCIPAL ARTERIALS F21 NH – REGULAR FUNDING
NHAC NH (AC/REGULAR) F23 NH – AC/REGULAR
Transportation Improvement ProgramFY 2013/14 through FY 2017/18
II - 12

FUND DESCRIPTION GROUP DESCRIPTION
NHBR NATIONAL HIGHWAY BRIDGES F21 NH – REGULAR FUNDING
NHRE NATION HWY PERFORM – RESURFACING F21 NH – REGULAR FUNDING
NHTS NATIONAL HIGHWAY TRAFFIC SAFETY F49 100% FEDERAL NON- FHWA
NSTP NEW STARTS TRANSIT PROGRAM N11 100% STATE
PL PLANNING FEDERAL
PLER PLANNING – EMERGENCY RELIEF F42 100% FEDERAL – EMERGENCY
RECT RECREATIONAL TRAILS F31 OFA – REGULAR FUNDS
RHH RAIL-HIGHWAY CROSSINGS – HAZARD F31 OFA – REGULAR FUNDS
RHP RAIL-HIGHWAY CROSSINGS – PROT DEVICES F31 OFA – REGULAR FUNDS
SA STP, ANY AREA F31 OFA – REGULAR FUNDS
SAFE SECURE AIRPORTS FOR FL ECONOMY N11 100% STATE
SE STP, ENHANCEMENT F31 OFA – REGULAR FUNDS
SED STATE ECONOMIC DEVELOPMENT N11 100% STATE
SIBG SIB FUNDS – GROWTH MANAGEMENT N48 OTHER SIB FUNDS
SIB1 STATE INFRASTRUCTURE BANK N48 OTHER SIB FUNDS
SN SURFACE TRANSPORTATION PROGRAM (STP) – MANDATORY – NON-URBAN FEDERAL
SR2E SAFE ROUTES – EITHER F31 OFA – REGULAR FUNDS
Transportation Improvement ProgramFY 2013/14 through FY 2017/18
II - 13
FUND DESCRIPTION GROUP DESCRIPTION
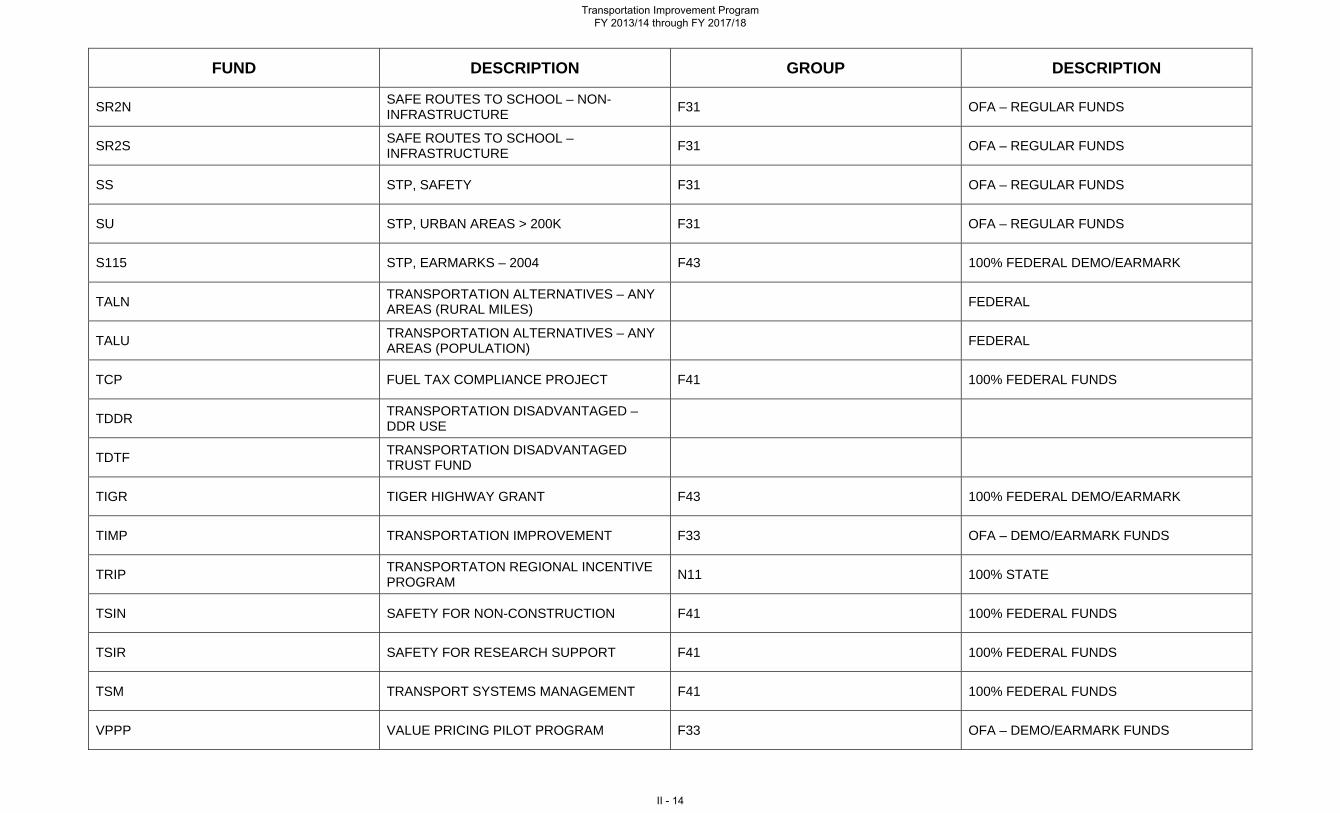
SR2N SAFE ROUTES TO SCHOOL – NON-INFRASTRUCTURE F31 OFA – REGULAR FUNDS
SR2S SAFE ROUTES TO SCHOOL – INFRASTRUCTURE F31 OFA – REGULAR FUNDS
SS STP, SAFETY F31 OFA – REGULAR FUNDS
SU STP, URBAN AREAS > 200K F31 OFA – REGULAR FUNDS
S115 STP, EARMARKS – 2004 F43 100% FEDERAL DEMO/EARMARK
TALN TRANSPORTATION ALTERNATIVES – ANY AREAS (RURAL MILES) FEDERAL
TALU TRANSPORTATION ALTERNATIVES – ANY AREAS (POPULATION) FEDERAL
TCP FUEL TAX COMPLIANCE PROJECT F41 100% FEDERAL FUNDS
TDDR TRANSPORTATION DISADVANTAGED – DDR USE
TDTF TRANSPORTATION DISADVANTAGED TRUST FUND
TIGR TIGER HIGHWAY GRANT F43 100% FEDERAL DEMO/EARMARK
TIMP TRANSPORTATION IMPROVEMENT F33 OFA – DEMO/EARMARK FUNDS
TRIP TRANSPORTATON REGIONAL INCENTIVE PROGRAM N11 100% STATE
TSIN SAFETY FOR NON-CONSTRUCTION F41 100% FEDERAL FUNDS
TSIR SAFETY FOR RESEARCH SUPPORT F41 100% FEDERAL FUNDS
TSM TRANSPORT SYSTEMS MANAGEMENT F41 100% FEDERAL FUNDS
VPPP VALUE PRICING PILOT PROGRAM F33 OFA – DEMO/EARMARK FUNDS
Transportation Improvement ProgramFY 2013/14 through FY 2017/18
II - 14

FUND DESCRIPTION GROUP DESCRIPTION
XU STP URBAN AREAS OVER 200K
Transportation Improvement Program FY 2013/14 through FY 2017/18
II - 15

Transportation Improvement Program FY 2013/14 through FY 2017/18
II - 16

SECTION III
INTRODUCTION
Transportation Improvement Program FY 2013/14 through FY 2017/18
III - 1

Transportation Improvement Program FY 2013/14 through FY 2017/18
III - 2

PURPOSE The Lee County Metropolitan Planning Organization’s (MPO) Transportation Improvement Program (TIP) for fiscal years (FY) 2013/14 through 2017/18 addresses the requirement of 23 CFR 450.324 (d) in providing a staged, multi-year, intermodal program of transportation projects consistent with the MPO’s Long Range Transportation Plan (LRTP). The TIP contains all transportation projects within the Lee County metropolitan planning area boundary funded by Title 23 and Title 49 funds as well as all regionally significant transportation projects for which federal action is required. The TIP depicts the MPO’s priorities for the expenditure of federal funds for each of the first three (3) years of the State's Tentative Work Program. For federal purposes, projects in years four and five, which also represent the MPO’s annual priorities for those years and are included in the Work Program as well, are considered illustrative and have no standing for federal authorization. The inclusion of projects in the five year TIP also constitutes their official endorsement by the Lee County MPO to ensure federal funding eligibility in the event of expansion of its urbanized area boundary, changes in funding sources, changes in Federal regulations or other unforeseeable circumstances.
COVERAGE This TIP covers all federally-funded transportation improvement, system or demand management projects, and all transit or paratransit grants within the Lee County transportation study area. All such projects have been included, regardless of whether they are in an urban or rural area or which category of funding is intended to be used. State resurfacing, restoration, rehabilitation, reconstruction and other maintenance projects not altering the functional capacity or capability of a facility have been included with the highway projects.
FINANCIAL PLAN
The TIP for Lee County is financially constrained by year, so that financial resources can be directed towards high priority transportation needs in the area. Consequently, the level of authorized funding (both current and projected) available to the state and the Lee County metropolitan area is used as the basis for financial restraint and scheduling of federally funded projects in Lee County. The Florida Department of Transportation (FDOT) uses the latest project cost estimates, and the latest projected revenues based on a district wide statutory formula to implement projects within Lee County in the Work Program, and this is reflected in the TIP as well. The projects in the TIP are presented in Year of Expenditure (YOE) in the year that they are programmed to be completed which takes into account the inflation rate over the five years in the TIP. The programmed cost estimate for each project is inflated to the year that the funds are expended based on reasonable inflation factors developed by the State and its partners. This TIP is also constrained as a result of local funds from the local governments Capital Improvement Programs committed to certain projects in the TIP. This TIP has been developed in cooperation with the FDOT and LeeTran (the local transit operator in Lee County) who were both responsible for providing the MPO with estimates of available federal and state funds. Lee County has been relying on a mix of specialty funding and innovative financing mechanisms over the years, not only to advance the construction of projects already programmed in the Work Program and the TIP, but also to include previously unfunded construction phases. The American Recovery and Reinvestment Act of 2009 (ARRA) led to the construction of over $80,000,000 in projects throughout the County. These projects included new roadway construction, bridge improvements, bicycle/pedestrian projects, intersection improvements, and transit projects. Some of the major projects funded through ARRA dollars include the construction of the Metro Parkway extension from US 41 to Six Mile Cypress Parkway, the widening of I-75 from Colonial Boulevard to Luckett Road, and the widening of the Six Mile Cypress Parkway from north of Daniels Parkway to south of Winkler Road, all projects that are currently under way or recently completed.
Transportation Improvement Program FY 2013/14 through FY 2017/18
III - 3

Other examples of specialty funding include the 6-lane widening of Metro Parkway from Six Mile Cypress Parkway to Daniels Parkway through a State Infrastructure Bank (SIB) loan that allowed the project to be accelerated with the interest on the loan being paid by the Lee Memorial Health System. Joint regional priority lists have also been adopted annually to tap into the Transportation Regional Incentive Program (TRIP) of the “Pay as You Grow” Growth Management Initiative. Two important projects from Lee County which were awarded funding from this Program include the 4-lane widening of Burnt Store Road from SR 78 to Tropicana Parkway, and the LeeTran Operations Facility on Evans Avenue which had its groundbreaking facility on March 25, 2013. The shift in the State’s transportation investment policy to fund 75% of state highway discretionary dollars on projects on the SIS encouraged the Lee County and Collier MPOs to adopt joint regional priority lists annually to tap into Strategic Intermodal System (SIS) funds, and other available statewide discretionary funds. The Interstate 75 and the SR 82 widening projects have been the major beneficiaries of these funds in Lee County. Projects such as the 6-lane widening of Colonial Boulevard from I-75 to SR 82, the 6-lane widening of Daniels Parkway from Chamberlain Parkway to Gateway Boulevard and the 6-lane widening of Del Prado Boulevard from NE 7th Street to South of Diplomat Parkway were all completed with the help of the County Incentive Grant Program (CIGP). This program requires a 50% state and a 50% local match. The State has also taken advantage of the MAP 21 guidelines to flex the state portion of Transportation Alternative Program funds to program highway capacity and traffic operations improvements in Lee County including part of the Right-of-Way phase for the SR 82 widening from Lee Boulevard to Shawnee Road, the addition of left turn lanes on SR 82 at Homestead Road, and the implementation of the Advanced Traffic Management System Phase II. Innovative financing mechanism undertaken in Lee County includes donations of right-of-way or the use of existing retention ponds for stormwater retention in capacity projects through public private partnerships. An example of the latter was the 6-lane widening of US 41 from north of Imperial River to Corkscrew Road where the use of the existing retention ponds allowed the widening to be accomplished within the existing right-of-way. This actually resulted in freeing up previously programmed right-of-way funds for use in other US 41 capacity projects in south Lee County. Another example is the building of retention ponds on previously donated Conservation 20/20 land for the 6-lane widening of US 41 from Corkscrew Road to San Carlos Boulevard, currently under way. This project included landscaping around the retention pond. Another example of public private partnerships is the financial package that has been put together to widen SR 78 from Chiquita Boulevard to Burnt Store Road. Right-of-Way for this project has been acquired through partial donation of land by developers and property owners, with the rest being paid with state funds. A portion of the total construction cost initially programmed in an outer year of the Work Program was advanced to FY 2012/13 through an SIB loan with the interest being paid by the City of Cape Coral. The remainder of the construction cost was advanced by the City of Cape Coral to FDOT so that the project could commence in FY 2012/13, with the interest on the loan being paid by the City though non-ad valorem revenues. As part of this financial package, the Lee County MPO will reimburse back all the construction dollars advanced by the City with future year funds allocated to the Lee County MPO. In the past, Lee and Collier Counties were also fortunate to receive additional SIS growth management funds and an increase in federal funding (including an $81 million earmark) through SAFETEA-LU allowing the state to combine 10 individual mainline projects on I-75 from Golden Gate Parkway to Colonial Boulevard into one construction project while advancing the construction by five years.
Transportation Improvement Program FY 2013/14 through FY 2017/18
III - 4
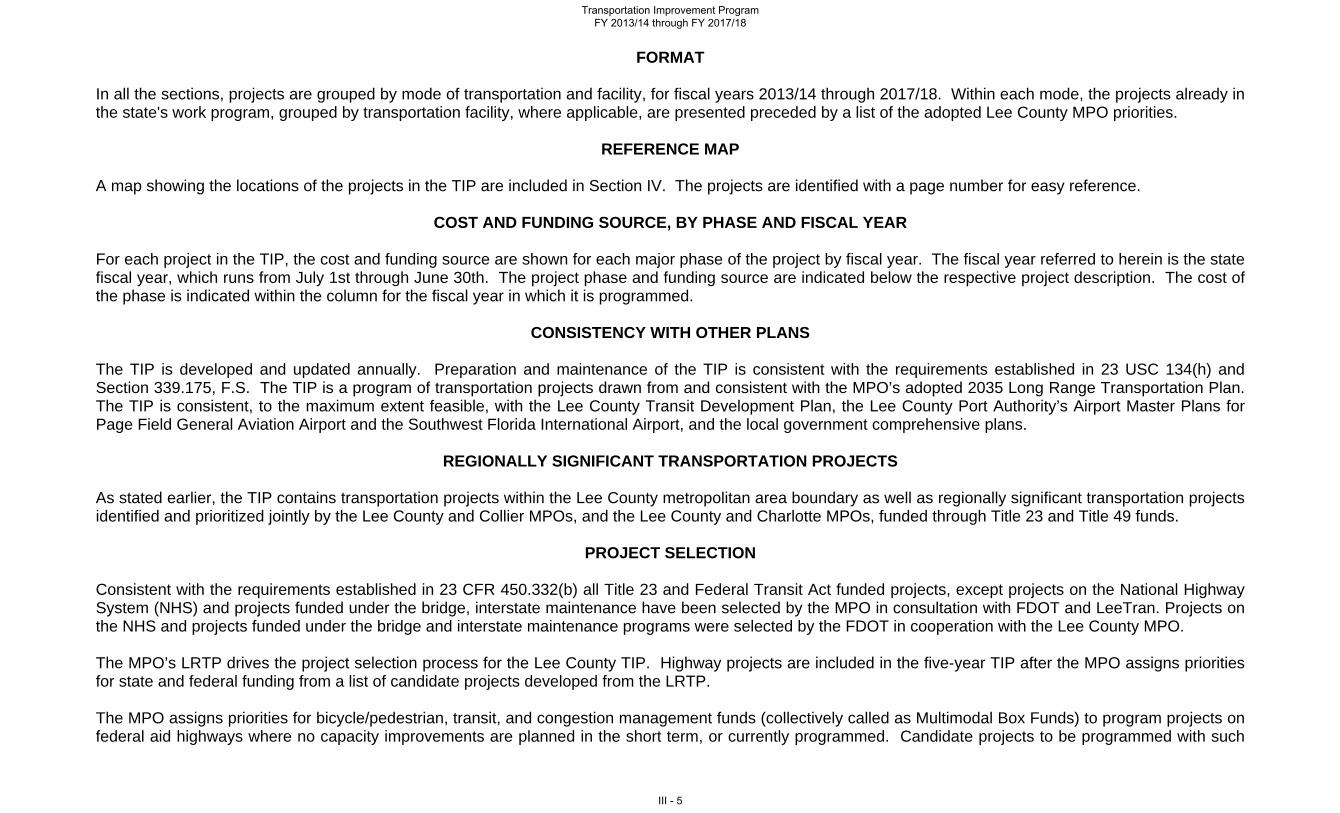
FORMAT
In all the sections, projects are grouped by mode of transportation and facility, for fiscal years 2013/14 through 2017/18. Within each mode, the projects already in the state's work program, grouped by transportation facility, where applicable, are presented preceded by a list of the adopted Lee County MPO priorities.
REFERENCE MAP
A map showing the locations of the projects in the TIP are included in Section IV. The projects are identified with a page number for easy reference.
COST AND FUNDING SOURCE, BY PHASE AND FISCAL YEAR For each project in the TIP, the cost and funding source are shown for each major phase of the project by fiscal year. The fiscal year referred to herein is the state fiscal year, which runs from July 1st through June 30th. The project phase and funding source are indicated below the respective project description. The cost of the phase is indicated within the column for the fiscal year in which it is programmed.
CONSISTENCY WITH OTHER PLANS
The TIP is developed and updated annually. Preparation and maintenance of the TIP is consistent with the requirements established in 23 USC 134(h) and Section 339.175, F.S. The TIP is a program of transportation projects drawn from and consistent with the MPO’s adopted 2035 Long Range Transportation Plan. The TIP is consistent, to the maximum extent feasible, with the Lee County Transit Development Plan, the Lee County Port Authority’s Airport Master Plans for Page Field General Aviation Airport and the Southwest Florida International Airport, and the local government comprehensive plans.
REGIONALLY SIGNIFICANT TRANSPORTATION PROJECTS As stated earlier, the TIP contains transportation projects within the Lee County metropolitan area boundary as well as regionally significant transportation projects identified and prioritized jointly by the Lee County and Collier MPOs, and the Lee County and Charlotte MPOs, funded through Title 23 and Title 49 funds.
PROJECT SELECTION
Consistent with the requirements established in 23 CFR 450.332(b) all Title 23 and Federal Transit Act funded projects, except projects on the National Highway System (NHS) and projects funded under the bridge, interstate maintenance have been selected by the MPO in consultation with FDOT and LeeTran. Projects on the NHS and projects funded under the bridge and interstate maintenance programs were selected by the FDOT in cooperation with the Lee County MPO. The MPO’s LRTP drives the project selection process for the Lee County TIP. Highway projects are included in the five-year TIP after the MPO assigns priorities for state and federal funding from a list of candidate projects developed from the LRTP. The MPO assigns priorities for bicycle/pedestrian, transit, and congestion management funds (collectively called as Multimodal Box Funds) to program projects on federal aid highways where no capacity improvements are planned in the short term, or currently programmed. Candidate projects to be programmed with such
Transportation Improvement Program FY 2013/14 through FY 2017/18
III - 5

funds are developed from the MPO’s Congestion Management Process Plan, LeeTran’s Transit Development Plan and the Transit Element of the MPO’s LRTP, and the MPO Countywide Bicycle Pedestrian Master Plan. The MPO also assigns priorities for Transportation Enhancement (now replaced with Transportation Alternative Program (TAP)) funds. Candidate projects include bicycle pedestrian projects on federal aid highways and local roads, and are typically identified or referenced in the MPO Countywide Bike/Ped Master Plan. Under SAFETEA-LU, SRTS projects had its own source of funding but MAP 21 now requires such projects to compete with other eligible projects for TAP funds. For the FY 2013/14 through FY 2017/18 Tentative Work Program and consequently this TIP, such projects programmed earlier with SRTS funds have now been replaced with TAP funds. Two such projects have also been programmed with District allocated STP funds and MPO Multimodal Box funds. SRTS projects are referenced in the MPO Countywide Bike/Ped Master Plan.
PROJECT PRIORITY STATEMENT
The project priorities adopted by the Lee County MPO are listed by funding category at the beginning of Section V. There are separate project priority lists for various funds including district-allocated Surface Transportation Program (STP) and State funds, Transportation Regional Incentive Program (TRIP) funds, Strategic Intermodal System (SIS) funds, Multi-Modal Transportation Enhancement Box funds, Local and Regional Transportation Enhancement (TE) funds, Safe Route to School (SRTS) funds, and Public Transportation (PTO) Aviation funds. The evaluation criteria used to prioritize the projects for all the aforementioned fund types except SRTS, PTO Aviation, Regional TE (priorities in the first two lists are assigned by the Lee County School District and the Lee County Port Authority respectively before they are endorsed by the MPO Board) is included at the beginning of the sections. The MPO did assign priorities for SRTS projects where they competed for Multimodal Box and TE funds but the priorities were placed at the bottom of the lists. Proposals and rankings based on the evaluation criteria for the various categories of funding were reviewed by the MPO advisory committees before they recommended project priorities. Subsequently, the recommended priorities went through a public hearing before priorities were adopted by the MPO Board. The adopted priorities and those endorsed in the case of SRTS and PTO Aviation funds were subsequently transmitted to FDOT for providing guidance in programming state and federal funds in Lee County during the development of its new Tentative Work Program for FY 2013/14 through FY 2017/18.
Transportation Improvement Program FY 2013/14 through FY 2017/18
III - 6

IMPLEMENTED AND DELAYED PROJECTS Generally, major road improvement projects costing more than one million dollars, and impacting traffic capacity and safety are identified as “major projects” in the TIP. However, exceptions may include high priority traffic operations and interchange improvements at locations which in the past have caused significant travel delays due to high traffic congestion. Because construction phases of major road improvements take at least 2 years to complete, projects identified in a previous year TIP are not completed prior to the publication of the new TIP, and so is the case with this TIP. However, pre-construction phases of several projects identified from previously adopted TIPs have been completed, while construction is under way for the 6-lane widening of US 41 from 4 to 6 lanes of US 41 from Corkscrew Road to San Carlos Boulevard, the widening of I-75 from Luckett Road to SR 78, the I-75/SR 80 interchange improvements, the Direct Connect project linking I-75 to the Southwest Florida International Airport, the Metro Fowler Crossover from Winkler Avenue to Hanson Street, the SR 78 4-laning from Chiquita Boulevard to Burnt Store Road, the Lee County Advanced Traffic Management System Phase I, and the new LeeTran Headquarters Facility on Evans Avenue. The following major projects have been completed:
1. The SR 82 six-laning from Ortiz to Colonial Boulevard (FTP #1954882) 2. The Six Mile Cypress Parkway four-laning from North of Daniels Parkway to South of Colonial Boulevard (FPN #4080401) 3. The six-lane extension of Metro Parkway from US 41 to Six Mile Cypress Pkwy (FTP #195719) 4. Resurfacing of SR 78 from US 41 to east of Del Prado Blvd (FPN #4252301) 5. New sidewalks on west of US 41 from north of Caloosahatchee Bridge to SR 78 (FPN # 4251271) 6. New sidewalks on US 41 from south of Daniels Parkway to Palm Drive (FPN #4226301) 7. Resurfacing of SR 82 from west of Sunshine Boulevard to west of Columbus Boulevard (This project also includes the addition of eastbound and westbound left turn lanes
on SR 82 to Columbus Boulevard)(FPN #4172442) 8. The implementation of the Caloosahatchee River Bridges Incident Management System (FPN #4054624)
The following projects or project phases have been delayed:
1. The SR 78 resurfacing project from US 41 to New Post Road has been deferred from FY 2014/15 to FY 2015/16 (FPN # 4313171) 2. The SR 78 resurfacing project from Winkler Avenue to SR 82I has been deferred from FY 2014/15 to FY 2015/16 (FPN #4313131)
The following project has been dropped:
1. The Page Field Airport capital project (FPN #4313621) has been deleted.
Transportation Improvement Program FY 2013/14 through FY 2017/18
III - 7

PUBLIC INVOLVEMENT
Pursuant to subsections 450.316(b)(1)(ix) and (xi), C.F.R. and Section 5 of the MPO Handbook, specific opportunities provided for public comment on this TIP have resulted from the MPO's Public Involvement Plan. These opportunities have included the review of the draft document by the Citizens Advisory Committee and the Technical Advisory Committee of the Lee County MPO, and also reviewed by the public through a posting of the document on the MPO website and by copies disseminated to the libraries throughout Lee County and a public hearing held at the June 21, 2013 MPO Board meeting. Prior to the public hearing, a public notice announcing the public hearing was published in the News-Press. Written notification of the public hearing and the availability of the draft TIP at the MPO website for review were also mailed to the members in the MPO’s Transportation Advisory Network.
CERTIFICATION
An annual joint review and evaluation of the metropolitan transportation planning process for the Lee County MPO was conducted on January 18, 2013 and a joint certification statement was signed between the Lee County MPO and FDOT on May 17, 2013. A copy of the signed certification statement is shown at the end of this section along with the list of corrective actions that need to be addressed by the MPO. The last FHWA Certification took place in August of 2010 and the next anticipated FHWA certification will take place in 2014.
CONGESTION MANAGEMENT PROCESS
The Lee County MPO has an adopted Congestion Management Process that includes a prioritization process that also looks at how effective the Process and implemented projects have been. The CMP requires the annual publication of a congestion monitoring report that includes analysis of performance measures to evaluate how effective implemented projects are. The congestion monitoring report also details the efforts being undertaken to monitor the existing transportation network throughout Lee County and identify congestion on that network. Congestion is reported by the public, bus drivers, and public safety agencies through a survey which is published in the News-Press and also distributed electronically. An interactive form to report the congestion is also posted in the MPO website. An MPO Traffic Management Operations Committee reviews the reported locations and identifies potential projects to be funded with Multimodal Enhancement Box funds that the Lee County MPO sets aside annually from its share of Transportation Management Area (Urbanized areas with populations greater than 200,000) funds. Additionally low cost and quick fix improvements such as retiming of traffic signals and restriping are implemented by local jurisdictions in a matter of months.
TRANSPORTATION DISADVANTAGED The Lee County MPO is the designated official planning agency for the transportation disadvantaged program while Good Wheels Inc. is the Community Transportation Coordinator (CTC) for this program. As the CTC for Lee County, Good Wheels provides services under a memorandum of agreement with the Florida Commission for the Transportation Disadvantaged. Section IX includes the transportation disadvantaged program projects in the state Tentative Work Program for fiscal years 2013/14 through 2017/18.
Transportation Improvement Program FY 2013/14 through FY 2017/18
III - 8

DETERMINATION OF FULL PROJECT COSTS How do I get to full project costs and other project details? The normal project production sequence is to have a Project Development and Environment (PD&E) phase, a Design (PE) phase, a Right-of-Way (ROW) phase and a Construction (CST) phase. Some projects may not have a ROW phase, if land is not needed to complete the project. Projects on the Strategic Intermodal System (SIS) The SIS is a network of high priority transportation facilities which includes the state’s largest and most significant commercial service airports, spaceport, deep water seaports, freight rail terminals, passenger rail and intercity bus terminals, rail corridors, waterways and highways. All projects on the SIS will have an SIS identifier on the TIP page on the comments line. SIS project costs on the TIP pages has historical costs shown under the less than 2013/14 column, in the five years of the current TIP in the 2013/2014 through 2017/2018 columns, and projected costs to complete the project from the Long Range Transportation Plan in the greater than 2017 column, if there are unfunded phases of the project left. For additional information on a project, access to the Long Range Transportation Plan (LRTP) is provided. The link to the LRTP is http://www.leempo.com/documents/LRTPAmended12-14-2012.pdf and the LRTP reference on the TIP page provides the information necessary to locate additional details regarding the project. Non-SIS projects on State Highway System Costs on the TIP pages for projects not on the SIS will have historical costs shown under the less than 2013/14 column, in the five years of the current TIP in the 2013/2014 through 2017/2018 columns, and projected costs to complete the project from the Long Range Transportation Plan in the greater than 2017 column, if there are unfunded phases of the project left. For additional information on a project, access to the Long Range Transportation Plan (LRTP) is provided. The link to the LRTP is http://www.leempo.com/documents/LRTPAmended12-14-2012.pdf and the LRTP reference on the TIP page provides the information necessary to locate additional details regarding the project. Local Government Maintained Off System Projects For off system projects that are listed in the TIP, where the maintaining local jurisdiction is receiving State funding for a portion of the project, the cost information under the less than 2013/14 funding column came from each of those jurisdiction’s CIP’s and the future cost to complete the project came from the LRTP. DISCLAIMER: The “Total Project Cost” amount displayed for each of the federal and state funded projects in the TIP represents the historical cost information for all projects having expenditures paid by FDOT prior to FY 2014, the 5 years of programming in the FDOT Work Program for projects (FYs 2014 through 2018) plus the projected cost to complete the projects from the MPO LRTP in the greater than 2018 column.
Transportation Improvement Program FY 2013/14 through FY 2017/18
III - 9

For a more comprehensive view of a particular project and a timeframe of when the future phases of a project are planned to be built (within a five year window of time), please refer to the MPO Long-Range Transportation Plan (LRTP), or contact Lee MPO staff at [email protected].
Transportation Improvement Program FY 2013/14 through FY 2017/18
III - 10

Transportation Improvement Program FY 2013/14 through FY 2017/18
III - 11

Transportation Improvement Program FY 2013/14 through FY 2017/18
III - 12

Transportation Improvement Program FY 2013/14 through FY 2017/18
III - 13

Transportation Improvement Program FY 2013/14 through FY 2017/18
III - 14

Transportation Improvement Program FY 2013/14 through FY 2017/18
III - 15

Transportation Improvement Program FY 2013/14 through FY 2017/18
III - 16

SECTION IV PROJECT LOCATION MAP
Transportation Improvement Program FY 2013/14 through FY 2017/18
IV - 1

Transportation Improvement Program FY 2013/14 through FY 2017/18
IV - 2

XY
XY
XYXY
XYXY
XY XYXY
XY
XY
XY
XY
V-17
V-18
V-20
V-22
V-23
V-23
V-24
V-25
V-26
V-26
V-27
V-28
V-28
V-31
V-31
V-32
V-32
V-33
V-33
V-34
V-34
VII-10
VII-10
VII-11
VII-11
VII-12
VII-12
VII-13
VII-13
VII-14
VII-14VII-15
VII-15
VII-16
VII-16
VII-16
VII-17
VII-17
VII-18
VII-18
VII-19
VII-20VII-20VII-21
VII-21VII-21
VII-22 VII-22VII-23
XI-4 XI-3
XI-5
XI-5
V-28XI-4
XI-4V-30
Burnt Store Rd
SR 78
Bayshore R
d
US 41
Del Prado Blvd
El Dorado Pkwy
Skyli
ne
Blvd
Chiquita Blvd
Sand
s Blvd
Tropicana Pkwy
Stringfellow Rd
Cape Coral Pkwy
Diplomat Pkwy
SR 80
SR 82
Homestead RdAlabama Rd
SR 82
US 4
1
I 75
I 75
Six M
ile Cy
press
Corkscrew Rd
I 75US 41
Bonita Beach Rd
Alico Rd
Estero Blvd
SanC
arlos
Blvd SummerlinRd
Sanibel - Captiva RdMcGreg
or Blvd
LegendXY Highway Capacity - IntersectionXY Safety Project - IntersectionXY Maintenance Project - IntersectionXY PD&E - Intersection
Highway Capacity ProjectSafety ProjectMaintenance ProjectPD&E ProjectBike-Ped ProjectMajor Roads
TIP PROJECT LOCATIONSFY 13/14 - 17/18
Brian V. Raimondo 5.24.13Senior Planner - GIS SpecialistSource: Lee MPO TIP FY 13/14 - 17/18
µ0 2.5 5 7.5 101.25
Miles
Transportation Improvement Program FY 2013/14 through FY 2017/18
IV - 3

Transportation Improvement Program FY 2013/14 through FY 2017/18
IV - 4

SECTION V
HIGHWAY PROJECTS This section of the Transportation Improvement Plan (TIP) consists of the highway capital improvements and resurfacing projects in the state Tentative Work Program for fiscal years 2013/14 through 2017/18. Included in the beginning of this section are also the adopted priorities from last year for funding against the MPO’s share of FDOT district allocated state and federal funds, and the MPO annual set-asides for bike/ped, traffic operations, and transit projects. In addition to local priorities, this section includes a list of the joint regional priorities for SIS funds for the Lee and Collier MPOs, a list of the joint regional priorities for TRIP funds for the Lee and Collier MPOs, a list of the joint regional priorities for TRIP funds for the Lee and Charlotte-Punta Gorda MPOs, and a list of joint regional pathways priorities for Transportation Enhancement Activity funds. The MPO uses an evaluation methodology to rank candidate projects for district-wide Surface Transportation Program (STP) and state funds before priorities are assigned by the MPO. The criteria are included in this section. The candidate projects for regional priorities for SIS and TRIP funds came from the Lee-Collier Bi-County Regional Transportation Network. SIS priorities are based on technical evaluations using current year and 2035 traffic volume data, and a volume to capacity ratio. The evaluation criterion for prioritizing TRIP projects is also included in this section.
Transportation Improvement Program FY 2013/14 through FY 2017/18
V - 1

Transportation Improvement Program FY 2013/14 through FY 2017/18
V - 2
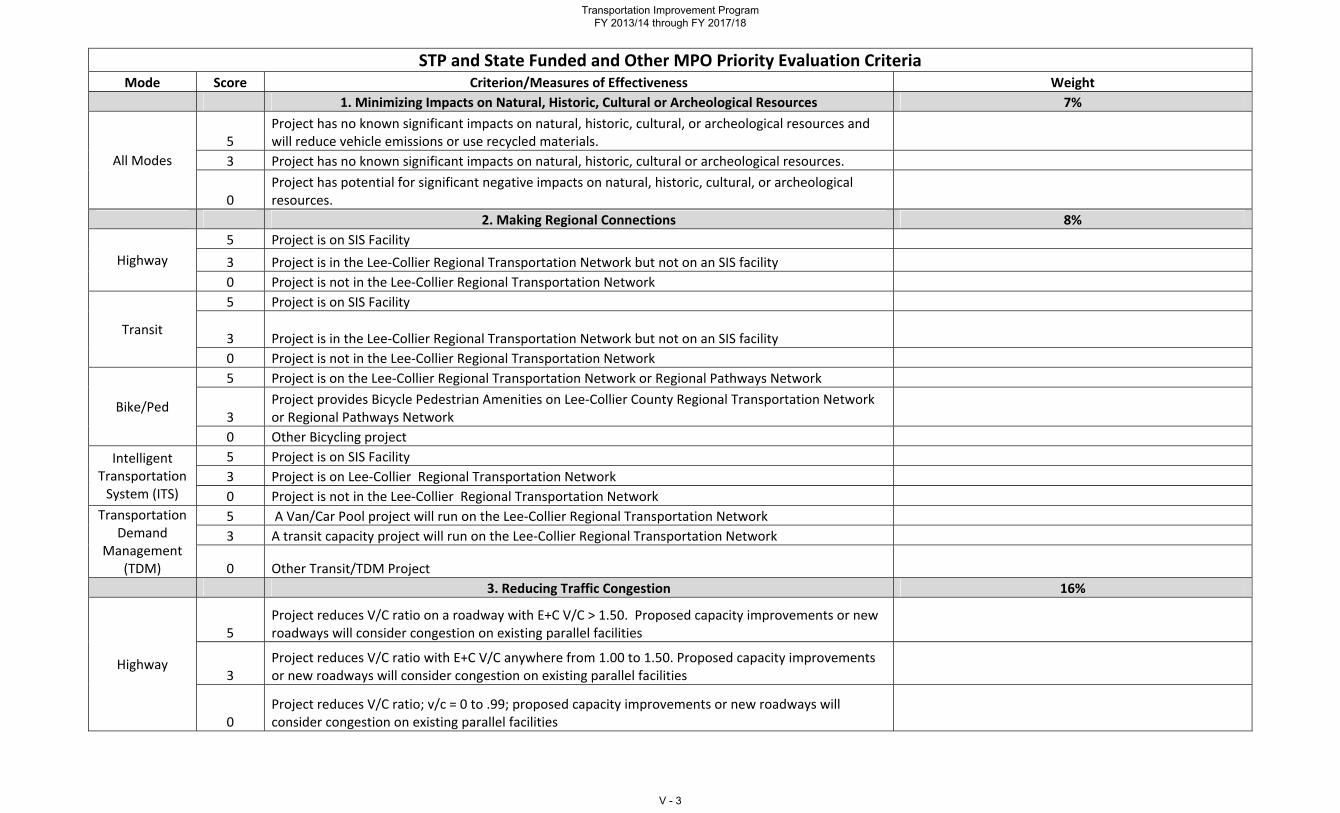
STP and State Funded and Other MPO Priority Evaluation CriteriaMode Score Criterion/Measures of Effectiveness Weight
1. Minimizing Impacts on Natural, Historic, Cultural or Archeological Resources 7%
All Modes 5
Project has no known significant impacts on natural, historic, cultural, or archeological resources and will reduce vehicle emissions or use recycled materials.
3 Project has no known significant impacts on natural, historic, cultural or archeological resources.
0 Project has potential for significant negative impacts on natural, historic, cultural, or archeological resources.
2. Making Regional Connections 8%
Highway 5 Project is on SIS Facility 3 Project is in the Lee‐Collier Regional Transportation Network but not on an SIS facility 0 Project is not in the Lee‐Collier Regional Transportation Network
Transit
5 Project is on SIS Facility
3 Project is in the Lee‐Collier Regional Transportation Network but not on an SIS facility 0 Project is not in the Lee‐Collier Regional Transportation Network
Bike/Ped
5 Project is on the Lee‐Collier Regional Transportation Network or Regional Pathways Network
3 Project provides Bicycle Pedestrian Amenities on Lee‐Collier County Regional Transportation Network or Regional Pathways Network
0 Other Bicycling project Intelligent
Transportation System (ITS)
5 Project is on SIS Facility 3 Project is on Lee‐Collier Regional Transportation Network 0 Project is not in the Lee‐Collier Regional Transportation Network
Transportation Demand
Management (TDM)
5 A Van/Car Pool project will run on the Lee‐Collier Regional Transportation Network 3 A transit capacity project will run on the Lee‐Collier Regional Transportation Network
0 Other Transit/TDM Project 3. Reducing Traffic Congestion 16%
Highway
5 Project reduces V/C ratio on a roadway with E+C V/C > 1.50. Proposed capacity improvements or new roadways will consider congestion on existing parallel facilities
3 Project reduces V/C ratio with E+C V/C anywhere from 1.00 to 1.50. Proposed capacity improvements or new roadways will consider congestion on existing parallel facilities
0 Project reduces V/C ratio; v/c = 0 to .99; proposed capacity improvements or new roadways will consider congestion on existing parallel facilities
Transportation Improvement Program FY 2013/14 through FY 2017/18
V - 3

Mode Score Criterion/Measures of Effectiveness Weight
Transit
5 Project creates exclusive ROW for transit parallel to E+C congested road with v/c >1.50
3 Project adds bus pull‐off bays, signal prioritization/bus bypass, or new peak hour service to a E+C congested road with v/c anywhere from 1.00 to 1.50
0 Other transit projects
Bike
5 Project adds bicycle facilities to an E+C roadway with v/c > 1.50
3 Project adds bicycle facilities to an E+C roadway with v/c anywhere from 1.00 to 1.50 0 Project adds bicycle facilities to an E+C roadway with v/c < 1
ITS 5
Project adds coordinated traffic signal systems, or congestion pricing, or temporary shoulder use to an E+C congested road with v/c > 1.50
3 Project adds coordinated traffic signal systems, advanced traveler information systems, or temporary shoulder use to an E+C congested road with v/c > 1 ≤ 1.50
0 Other ITS projects
TDM 5 No TDM projects 3 Project reduces peak hour vehicle trips 0 Other TDM projects
Pedestrian
5 Project provides pedestrian facilities to an E+C congested roadway with v/c > 1.50
3 Project augments pedestrian facilities or fills sidewalk gaps on an E+C congested roadway with v/c anywhere from 1.00 to 1.50
0 Project adds bicycle facilities to an E+C roadway with v/c < 1 4. Supporting Community Plans and Minimizing Community Impacts 8%
All Modes 5
Project is identified in adopted Community Plan, Sector Plan, Neighborhood Plan, or MPO corridor or Sub‐Area Plan and/or actively supported by Neighborhood Association(s) in the corridor.
3 Project is consistent with Sustainability/Livability Policies and will not negatively impact Environmental Justice (EJ) communities in the corridor
0 Project does not meet either of the above requirements 5. Alternatives to Driving Alone 15%
Highway 5 Project adds managed lanes that will provide incentive for HOV use 3 Project adds sidewalks, bike lanes, and ADA‐accessible bus stops 0 Project does not meet any of the above requirements
Transit
5 Project adds new transit service(e.g. new bus routes, adds service hours) 3 Project decreases headways
0 Project does not meet above requirements Bike 5 Project provides marked & signed bike lanes and/or shared use paths within urbanized areas
Transportation Improvement Program FY 2013/14 through FY 2017/18
V - 4

Mode Score Criterion/Measures of Effectiveness Weight
3 Project provides marked & signed bike lanes and/or shared used paths in transitioning urbanized areas or rural areas
0 Project does not meet any of the above two requirements
ITS 5 No existing ITS facilities 3 Project provides incentives to car/van pool 0 Other ITS projects
TDM 5 Project makes vehicles available for van/carpooling 3 Project provides other TDM opportunities 0 No TDM opportunities
Pedestrian 5
Project provide safe, comfortable pedestrian facilities in urbanized areas including sidewalks with buffers or shared use paths, and ped signals and crosswalks
3 Project provide safe, comfortable pedestrian facilities in transitioning urban or rural area including sidewalks with buffers or shared use paths, and ped signals and crosswalks
0 Project does not meet any of the requirements
6. Improving Access to Activity Centers (Shopping, Jobs, Tourism, Education and/or Medical) 10%
Highway 5 Project connects to two or more Tier II Activity Centers or connects to at least one Tier I Activity Center 3 Project connects to at least one Tier II Activity Center 0 Project connects to Tier III Activity Centers only
Transit 5 Project connects to two or more Tier II Activity Centers or connects to at least one Tier I Activity Center 3 Project connects to at least one Tier II Activity Center 0 Project connect to Tier III Activity Centers only
Bike
5 Bicycling project address bicycle gaps in roadways with Tier I or at least two Tier II Activity Centers
3 Bicycling project parallel & adjacent to a road segment with bicycle gaps connecting to a Tier I or Tier II Activity Center
0 Other Bicycling project
ITS 5
Project improves traffic progression on road corridor connecting to two or more Tier II Activity Centers, or at least one Tier I Activity Center
3 Project improves traffic progression on road corridor connecting at least two Tier II Activity Centers 0 Does not meet requirements
TDM 5 Project provides TDM options to a Tier I Activity Center 3 Project provides options to a Tier II or Tier II Activity Center 0 Other TDM projects
Transportation Improvement Program FY 2013/14 through FY 2017/18
V - 5

Mode Score Criterion/Measures of Effectiveness Weight
Pedestrian 5
Pedestrian project on roadway with sidewalk gaps and connecting to two or more Tier II or at least one Tier I Activity Center
3 Pedestrian project on parallel to or alternative access to roadway with sidewalk gaps and connecting to a Tier I or Tier II Activity Centers
0 Does not meet requirements 7. Enhancing Goods Movement 7%
Highway, Rail & ITS 5
Project enhances highway and rail capacity in Regional Freight Corridors, Regional Freight Connectors, and Active Rail Lines identified in the Lee County Goods and Freight Mobility Study, or adds a Rail Truck Transfer Facility that reduces truck use, or ITS deployments that reduces traffic congestion on these corridors and connectors
3 Project corrects geometrical design standards in Regional Freight Corridors and Regional Freight Connectors, or they are identified as congestion hot spots in the Goods and Freight Mobility Study
0 Project does not meet any of the above requirements
Transit & TDM 5
Project reduces single occupant vehicles within Regional Freight Corridors and Connectors in Lee County
3 Project adds service in dedicated ROW parallel to Regional Freight Corridors and Connectors 0 Other Transit or TDM projects
Bike & Pedestrian
5 Project adds bicycle pedestrian facilities on Regional Freight Corridors 3 Project adds bike ped facilities on Regional Freight Connectors 0 Other bicycle and pedestrian projects
8. Safety (Reducing Crashes) 17%
Highway 5
Capacity or traffic operation projects on limited access facilities with one or more top 50 Lee County Crash locations within its project limits
3 Project on roadways with one or more top 50 Lee County crash locations within its project limits(Proposed new roads will consider crashes on existing parallel facilities)
0 Project does not meet requirements
Transit 5
Project adds bus pull‐off bays, signal prioritization/bus bypass, sidewalks or shared use connections to transit stops
3 Project improves transit passenger safety (lighting, surveillance, stops and bus shelters ) 0 Other Transit projects
Bike 5 Bicycle project with a total of 5 or more bicycle crashes or at least one fatality within the project limits
3 Bicycle project with a total of 1 ‐ 4 bicycle crashes within project limits 0 Project does not meet the above two requirements
Transportation Improvement Program FY 2013/14 through FY 2017/18
V - 6

Mode Score Criterion/Measures of Effectiveness Weight
ITS
5 ITS deployments including ATMS, IMS, FMS
3 Projects that result in active traffic management strategies such as Speed Harmonization, Dynamic Merge Control etc.
0 All other ITS projects TDM 0 All TDM Projects
Pedestrian 5
Pedestrian project with a total of 5 or more pedestrian crashes or a at least one fatality within project limits
3 Pedestrian project on road segment with 4 or more pedestrian crashes within project limits 0 Project does not meet the above requirements
9. Long Term Maintenance Costs 5%
All Modes 5 Project reduces long term maintenance costs 3 Project increases long term maintenance costs 0 Other project
10. Improving Existing Facilities 7%
All Modes 5
Project is within existing ROW including in parallel corridors or maintains ongoing function of existing transit services
3 Project is on an existing roadway but additional ROW may be needed 0 Other project
Tier I - Lee Memorial Hospital, Gulf Coast Hospital, Edison Mall, Coconut Mall, Gulf Coast Town Center, Florida Gulf Coast University, Edison College, Regional Parks, Page Field Airport, SWFIA, Government Office Block, Mixed Use Downtown, Chicos Tier II - Echo Park, CREW, Caloosa Nature Center, Shell Park, shopping centers anchored by Supermarkets, Libraries, Charter and Lee County Schools, isolated government office building, commercial corridor (e.g. US 41, SR 80, Pine Island Road ), Community Parks (e.g. Lakes Park)
Tier III - Neighborhood Parks, Non continuous Strip Malls, Pharmacies, gas stations, Post Offices,
Transportation Improvement Program FY 2013/14 through FY 2017/18
V - 7

STP AND STATE FUNDED PRIORITIES FOR FY 2017/18 Adopted by Lee County MPO on June 22, 2012
2012 Priority FM # Project From To Improvement Type Length (miles) Next Phase PDC Estimate (in
$1,000)
1 4299601 Funding for County Traffic Operations Center1
$300
2 1957641 Multi-Modal Enhancement Box1
$4,700
3 SR 739 (Fowler St) Metro/Fowler SR 82 (Dr. Martin Luther King Jr. Blvd) 4L 2 way to 3L 1 way 1.4 Planning Study $610
4 San Carlos Trolley Lane Summerlin Road Matanzas Pass Bridge Run an exclusive trolley lane service 4.4 Planning Study2 $610
5 US 41 Victoria Avenue Pondella Road 4L to 6L 5.1 PD&E $3,030
6 4126363 Countywide ATMS Phase III Implementation CST $16,440
7 Metro Pkwy (SR 739) Daniels Pkwy South of Winkler Ave 4L to 6L 4.6 ROW $31,000
8 Caloosahatchee Bridges Incident Management System Phase II implementation CST
$8,220
Notes: 1The top two priorities are set asides that the Lee County MPO request annually from off the top of XU funds allocated to the Lee County urbanized area.
2This project may be withdrawn or modified if FDOT is successful in obtaining FTA 5339 Alternative Analysis Discretionary Grant Program funds
Transportation Improvement Program FY 2013/14 through FY 2017/18
V - 8
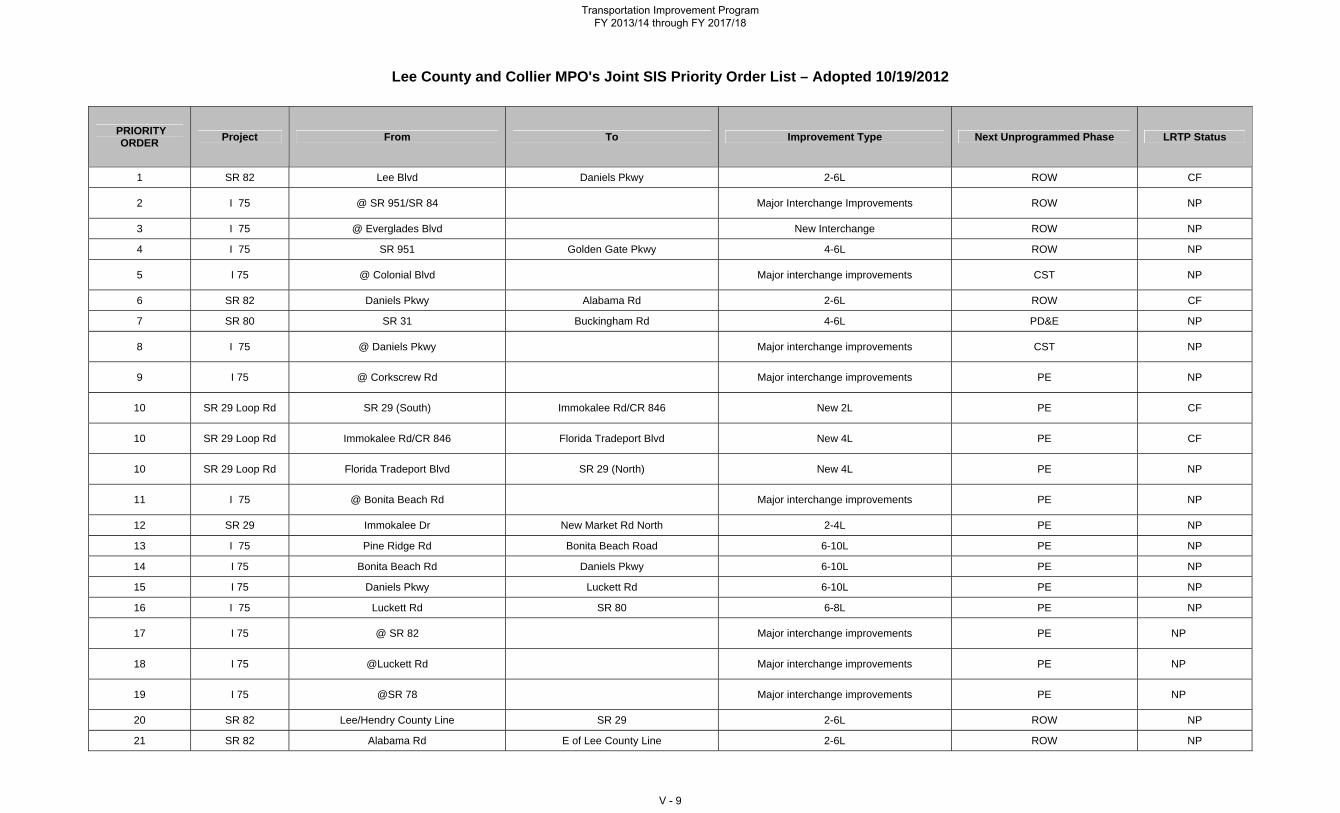
Lee County and Collier MPO's Joint SIS Priority Order List – Adopted 10/19/2012
PRIORITY ORDER Project From To Improvement Type Next Unprogrammed Phase LRTP Status
1 SR 82 Lee Blvd Daniels Pkwy 2-6L ROW CF
2 I 75 @ SR 951/SR 84 Major Interchange Improvements ROW NP
3 I 75 @ Everglades Blvd New Interchange ROW NP
4 I 75 SR 951 Golden Gate Pkwy 4-6L ROW NP
5 I 75 @ Colonial Blvd Major interchange improvements CST NP
6 SR 82 Daniels Pkwy Alabama Rd 2-6L ROW CF
7 SR 80 SR 31 Buckingham Rd 4-6L PD&E NP
8 I 75 @ Daniels Pkwy Major interchange improvements CST NP
9 I 75 @ Corkscrew Rd Major interchange improvements PE NP
10 SR 29 Loop Rd SR 29 (South) Immokalee Rd/CR 846 New 2L PE CF
10 SR 29 Loop Rd Immokalee Rd/CR 846 Florida Tradeport Blvd New 4L PE CF
10 SR 29 Loop Rd Florida Tradeport Blvd SR 29 (North) New 4L PE NP
11 I 75 @ Bonita Beach Rd Major interchange improvements PE NP
12 SR 29 Immokalee Dr New Market Rd North 2-4L PE NP
13 I 75 Pine Ridge Rd Bonita Beach Road 6-10L PE NP
14 I 75 Bonita Beach Rd Daniels Pkwy 6-10L PE NP
15 I 75 Daniels Pkwy Luckett Rd 6-10L PE NP
16 I 75 Luckett Rd SR 80 6-8L PE NP
17 I 75 @ SR 82 Major interchange improvements PE NP
18 I 75 @Luckett Rd Major interchange improvements PE NP
19 I 75 @SR 78 Major interchange improvements PE NP
20 SR 82 Lee/Hendry County Line SR 29 2-6L ROW NP
21 SR 82 Alabama Rd E of Lee County Line 2-6L ROW NP
Transportation Improvement Program FY 2013/14 through FY 2017/18
V - 9

22 I 75 CR 951 SR 29 4-6L PE SIS Needs
23 SR 29 New Market Road North Hendry County Line 2-4L PE NP
24 SR 29 9th St North Immokalee Dr 2-4L PE NP
25 SR 29 Immokalee Rd Ext Immokalee Rd/CR 846 2-4L PE NP
26 SR 29 Immokalee Road Ext I 75 2-4L PE NP
27 I 75 Golden Gate Pkwy Pine Ridge Rd 6-8L PE NP
28 I 75 @Del Prado Blvd New Interchange IJR NP
29 I 75 @SR 29 Major Interchange Improvements PE SIS Needs
Acronyms
PE - Design CF - Project Phase in Cost Feasible Plan DSB - Design Build Project
ROW - Right-of-Way NP - Project Phase in Needs Plan
CST - Construction IJR - Interchange Justification Report
Transportation Improvement Program FY 2013/14 through FY 2017/18
V - 10

TRIP Project Prioritization and Evaluation Criteria
1. Project or new transit service is on SIS facility or relieves and SIS facility:
10 points If project is on a primary SIS facility or relives a primary failing SIS facility (LOS E & F) by > 10%
8 points If project is on a primary SIS facility or relieves a primary SIS facility (LOS C & D) by >10%
6 points If projects is on a primary SIS facility or relieves a primary SIS facility by > 5%
3 points If project reduces traffic on a primary SIS facility or relieves a primary facility by < 5%
2 points If projects is on an emerging SIS facility or relieving an emerging SIS facility by > 5%
1 point If project is estimated to reduce traffic on the emerging SSI facility by < 5%
2. Provide connectivity to the SIS1:
3 points To projects making a new or improving a direct connection to a primary SIS facility
1 point To projects making a new or improving a direct connection to an emerging SIS facility
3. County Enterprise Zones, Rural Area Critical Economic Concern:
3 points If project improves roads and access or adds new transit service to the Heartland Rural Areas of critical Economic Concern
2 points If project improves roads and access or adds new transit service to a County Enterprise Zone2
4. Subject to local government ordinance that establishes corridor management techniques, including access management strategies, right of way acquisition and protection measures, appropriate land use strategies, zoning and setback requirements for adjacent land use1:
Transportation Improvement Program FY 2013/14 through FY 2017/18
V - 11

5 points If project or new transit service is on roadway that has a corridor action plan, right-of-way acquisition and protection measures and setback requirements.
3 points If project or new transit service is on roadway that has access management standards consistent with FDOT standards, right-of-way acquisition and protection measures.
2 points If project or new transit service is on roadway that has access management standards and right-of-way protection measures.
5. Production Readiness, determined by phase for which TRIP funding is requested:
5 points Construction
3 points ROW Acquisition
1 point Design
6. TRIP funding not received for a project in this jurisdiction:
6 points For a project in a jurisdiction that has never received TRIP funding
3 points For a project in a jurisdiction that has not received TRIP funding for the last three years of funding (FY 2010, 2011, or 2012)
2 points For a project in a jurisdiction that has not received TRIP funding for the last two years of funding (FY 2011 and 2012)
1 point For a project in a jurisdiction that has not received TRIP funding for the last year of funding (FY 2012)
Transportation Improvement Program FY 2013/14 through FY 2017/18
V - 12

7. Job Access and Economic Stimulus:
4 points For a project that improves or provides new access or transit service to a commercial development that reduces trip lengths, number of trips made or single occupant vehicle trips
8. Performance on previous TRIP projects:
2 points For a project in a jurisdiction that has constructed the previous awarded projects when the funding was requested
-2 points For a project in a jurisdiction that has asked for changes on the previous awarded projects versus when the funding was requested
9. Overmatch (Local + Regional + Private + Federal Share):
5 points For a project where the TRIP funds will be 10% or less of the total project cost
3 points For a project where the TRIP funds are greater than 10% but less than 25% of the project funding
1 point For a project where the TRIP funds are greater than 25% of the project funding
10. Encourage Public – Private Partnerships:
8 points For a project where the private contribution towards the project is greater than 50% of the funding for the project
5 points For a project where the private contribution towards the project is greater than 25% but less than 50% of the funding for the project
2 points For a project where the private contribution towards the project is greater than 10% but less than 25% of the funding for the project
Transportation Improvement Program FY 2013/14 through FY 2017/18
V - 13

1This is a statutory prioritization criterion. 2An Enterprise Zone is a specific geographic area targeted for economic revitalizing. Enterprise Zones encourage economic growth and investment in distressed areas by offering tax advantages and incentives to businesses located within the zone boundaries. Notes:
An application form must be completed for every project for which TRIP funds are requested.
For highway projects, Lee County and Collier MPO staffs will conduct two (2) E + C network model runs using 2015 zonal data for each submitted project within their jurisdictions, one (1) with the proposed project and one (1) without. For all other types of projects, including ITS, transit, and intermodal projects, appropriate analysis results must be submitted by applicant to receive credit.
A copy of the relevant provisions of the ordinance that establishes corridor management practices for the specific corridor on which the project is proposed
must accompany the application.
A resolution or letter signed by the County Commission Chairperson or the Mayor or an authorized local government/agency official committing local match for TRIP funding must be submitted with the application.
The TRIP program is designed to address growth and development by expanding infrastructure to provide additional or new service and capacity.
Transportation Improvement Program FY 2013/14 through FY 2017/18
V - 14

2012 TRIP Priorities for Lee and Collier Counties
Sponsor Route From To Proposed Improvement Requested Phase Total Cost Requested
TRIP Funds
1. Utilizing
or relieveing
an SIS Facility
2. SIS Connecti
vity
3. County Enterprise
Zones, Rural Area Economic Concern
4. Corridor
Management
Techniques
5. Producti
on Readine
ss
6. TRIP
Funding Not
Received
7. Job Access
and Econom
ic Stimulu
s
8. Peformanc
e on Previous
TRIP Projects
9. Overmat
ch
10. Public Private-
Partnerships
Total Points
Scoring Priority Order
2011/12
Collier County
CAT Intermodal Center
Government Center on US 41 CST $2,257,500
$1.05 million 0 0 3 3 5 0 4 2 1 0 18 Funded
2013/14
Collier County Collier Blvd Green
Blvd
Golden Gate Blvd
4L to 6L CST $32,700,000 $7,000,000 3 3 0 3 5 0 4 2 3 0 23 Funded
Collier County Collier Blvd
Golden Gate Main Canal
Green Blvd 4L to 6L ROW $24,985,000 $2,400,000 3 3 0 3 3 0 4 2 5 0 23 Funded
Cape Coral SR 78 Burnt
Store Rd Chiquita Blvd 2L to 4L ROW/CST $67,000,000 $10,000,00
0 1 3 0 5 3 6 4 2 5 2 31 Funded
Collier County
US 41 and Collier Blvd
CR 951 intersections
Intersection improvements
CST $24,985,000 $6,000,000 3 3 2 3 5 0 4 2 5 0 27 #2
LeeTran Bus Shelters @ Various locations
Capital Expenditures
CST $1,000,000 $500,000 1 1 2 0 5 3 4 2 1 0 19 #3
2014/2015
Collier County
Logan Blvd.
Immokalee Road
Bonita Beach Rd
New 2L CST $18,500,000 $6,000,000 3 0 0 3 5 0 4 2 1 8 26 #1
Lee County
Burnt Store Rd SR 78
Tropicana Pkwy
2L to 4L CST $7,700,000 $3,850,000 3 3 0 3 5 3 4 2 1 0 24 Funded
LeeTran Beach Park & Ride
@ Summerlin Square
Capital Expenditures
Design/ROW/CST $4,000,000 $2,000,000 1 0 0 3 5 0 4 2 3 0 18 #2
2015/2016 Collier County
CAT Transfer Station/Operations Center Facility CST $16,592,825 $5,000,000 1 3 0 3 5 1 4 2 1 0 20 #1
Transportation Improvement Program FY 2013/14 through FY 2017/18
V - 15

LeeTran
LeeTran Maintenance, Administration & Operations
Facility CST $30,000,000 $6,000,000 1 0 0 3 5 1 4 2 3 0 19 #2
Lee County
Big Carlos Bridge Bridge Replacement 2L PE $3,600,000 $1,800,000 0 0 0 3 1 1 4 2 1 0 12 #3
2016/2017 Lee County
Burnt Store Road
Tropicana Pkwy
Diplomat Pkwy 2L to 4L CST $5,000,000 $2,500,000 3 3 0 3 5 2 4 2 1 0 23 #1
2017/2018
Collier County Collier Blvd
Golden Gate Main Canal
Green Blvd. 4L to 6L CST $26,998,738 $7,000,000
3 3 0 3 5 3 4 2 1 0 24 #1
Cape Coral
Chiquita Blvd
South of Cape Coral Pkwy
North of SR 78
4L to 6L
ROW $30,000,000 $4,000,000 0 0 0 5 3 6 4 0 3 0 21 #2
LeeTran Regional Transfer Facility and Connector
Facility and New Service Route
CST $3,000,000 $1,500,000 3 0 0 5 1 3 4 2 0 0 18 #3
LeeTran LeeTran Capital Expenditures for Passenger Amenities, Bus Pull-Outs, and pavement markings
Facility CST $1,000,000 $500,000 0 0 0 3 5 3 0 2 0 0 13 #4
Transportation Improvement Program FY 2013/14 through FY 2017/18
V - 16

JOINT MPO STAFF RECOMMENDED TRIP PRIORITIES ( LEE AND CHARLOTTE COUNTY-PUNTA GORDA MPO )
Adopted: 4/20/2012
Sponsor Route From To Proposed Improvement Requested
Phase Total Cost Requested TRIP
Funds Joint Staff
2016/17 Lee County Burnt Store Rd Tropicana Pkwy Diplomat Pkwy 2L to 4L CST $5,000,000 $2,500,000 #1
2017/18
Charlotte County Burnt Store Rd Point North of Tern Bay Blvd Scham Rd 2L to 4L CST $37,110,000 $2,500,000 #1
Lee County Chiquita Blvd South of Cape Coral Pkwy North of SR 78 4L to 6L ROW $30,000,000 $4,000,000 #2
Charlotte County Piper Rd North Henry St US 17 New 4L CST $22,191,000 $2,000,000 #3 LeeTran Regional Transfer Facility and Connector Build bus facility and develop new service route CST $3,000,000 $1,500,000 #4
Charlotte County US 41 @ Carmalita St Ext. Make Carmalita St 2 Way between NB and SB US 41; Add traffic signals at both US 41 intersections at Carmelita; Extend multi-use trail along US 41 from Helena Ave to Carmalita and along Carmalita to Taylor St
CST $1,700,000 $850,000 #5
LeeTran LeeTran Capital Expenditures for Passenger Amenities, Bus Pull-Outs, and pavement markings Build bus facilities CST $1,000,000 $500,000 #6
Transportation Improvement Program FY 2013/14 through FY 2017/18
V - 17
PHASE FUND MANAGED BY LESS THAN
2014 2013/14 2014/15 2015/16 2016/17 2017/18 GREATER
THAN 2018 ALL YEARS
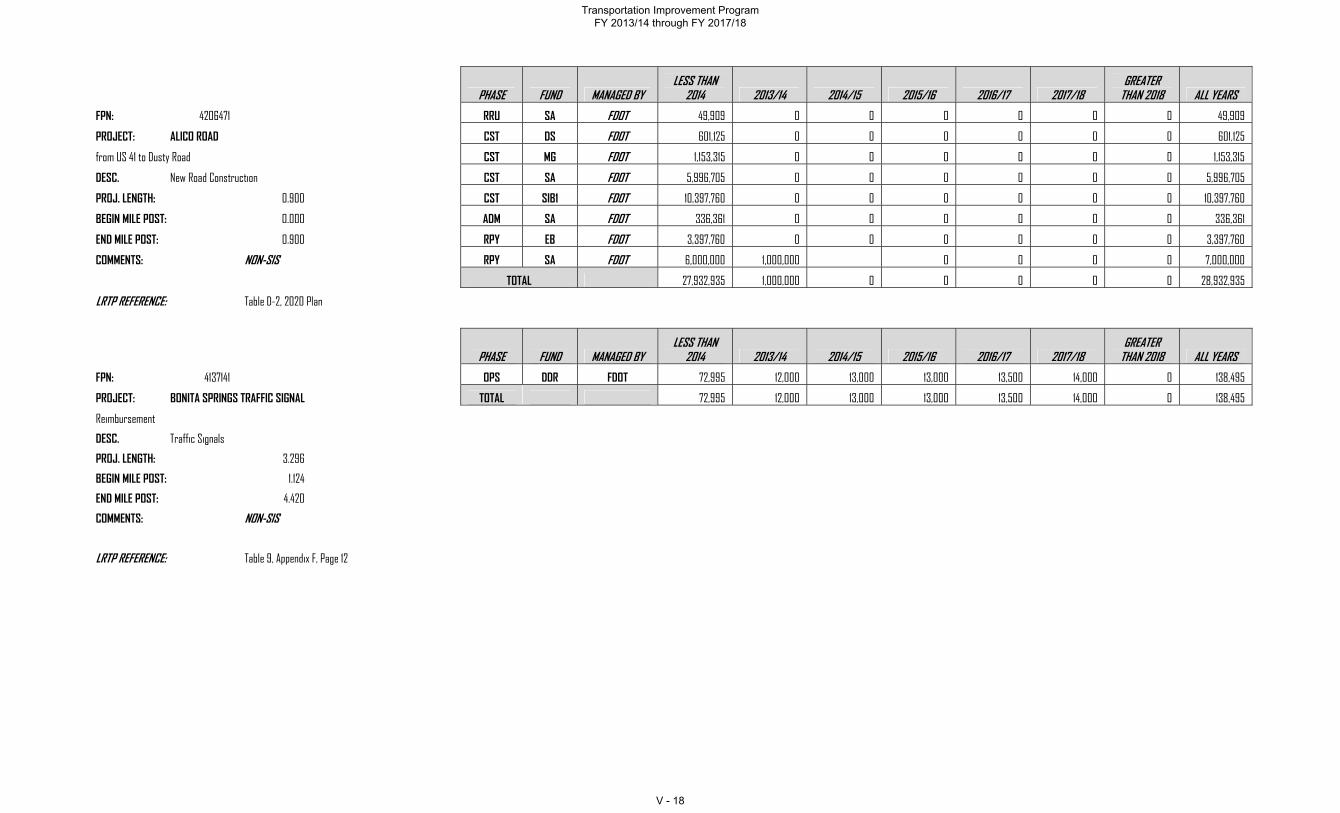
FPN: 4206471 RRU SA FDOT 49,909 0 0 0 0 0 0 49,909
PROJECT: ALICO ROAD CST DS FDOT 601,125 0 0 0 0 0 0 601,125
from US 41 to Dusty Road CST MG FDOT 1,153,315 0 0 0 0 0 0 1,153,315
DESC. New Road Construction CST SA FDOT 5,996,705 0 0 0 0 0 0 5,996,705
PROJ. LENGTH: 0.900 CST SIB1 FDOT 10,397,760 0 0 0 0 0 0 10,397,760
BEGIN MILE POST: 0.000 ADM SA FDOT 336,361 0 0 0 0 0 0 336,361
END MILE POST: 0.900 RPY EB FDOT 3,397,760 0 0 0 0 0 0 3,397,760
COMMENTS: NON-SIS RPY SA FDOT 6,000,000 1,000,000 0 0 0 0 7,000,000
TOTAL 27,932,935 1,000,000 0 0 0 0 0 28,932,935
LRTP REFERENCE: Table D-2, 2020 Plan
PHASE FUND MANAGED BY LESS THAN
2014 2013/14 2014/15 2015/16 2016/17 2017/18 GREATER
THAN 2018 ALL YEARS
FPN: 4137141 OPS DDR FDOT 72,995 12,000 13,000 13,000 13,500 14,000 0 138,495
PROJECT: BONITA SPRINGS TRAFFIC SIGNAL TOTAL 72,995 12,000 13,000 13,000 13,500 14,000 0 138,495
Reimbursement
DESC. Traffic Signals
PROJ. LENGTH: 3.296
BEGIN MILE POST: 1.124
END MILE POST: 4.420
COMMENTS: NON-SIS
LRTP REFERENCE: Table 9, Appendix F, Page 12
Transportation Improvement Program FY 2013/14 through FY 2017/18
V - 18

PHASE FUND MANAGED BY LESS THAN
2014 2013/14 2014/15 2015/16 2016/17 2017/18 GREATER
THAN 2018 ALL YEARS
FPN: 4136361 OPS DDR FDOT 54,683 12,000 13,000 13,000 13,500 13,500 0 119,683
PROJECT: CAPE CORAL TRAFFIC SIGNALS TOTAL 54,683 12,000 13,000 13,000 13,500 13,500 0 119,683
Reimbursement
DESC. Traffic Signals
PROJ. LENGTH: 2.243
BEGIN MILE POST: 7.514
END MILE POST: 9.757
COMMENTS: NON-SIS
LRTP REFERENCE: Table 9, Appendix F, Page 12
PHASE FUND MANAGED BY LESS THAN
2014 2013/14 2014/15 2015/16 2016/17 2017/18 GREATER
THAN 2018 ALL YEARS
FPN: 4298141 CST LFP LEE County 0 0 8,460,860 0 0 0 0 8,460,860
PROJECT: CR 765 (BURNT STORE) CST TRIP LEE County 0 0 2,813,366 0 0 0 0 2,813,366
from SR 78 (Pine Island) Rd. to Tropicana Pkwy. TOTAL 0 0 11,274,226 0 0 0 0 11,274,226
DESC. Add Lanes & Rehabilitate Pvmnt.
PROJ. LENGTH: 2.019
BEGIN MILE POST: 0.026
END MILE POST: 2.045
COMMENTS: NON-SIS; Less than 2011 includes limits up to Van Buren.
LRTP REFERENCE: Table 6-1, Page 6-4, Project #16
Transportation Improvement Program FY 2013/14 through FY 2017/18
V - 19
PHASE FUND MANAGED BY LESS THAN
2014 2013/14 2014/15 2015/16 2016/17 2017/18 GREATER
THAN 2018 ALL YEARS
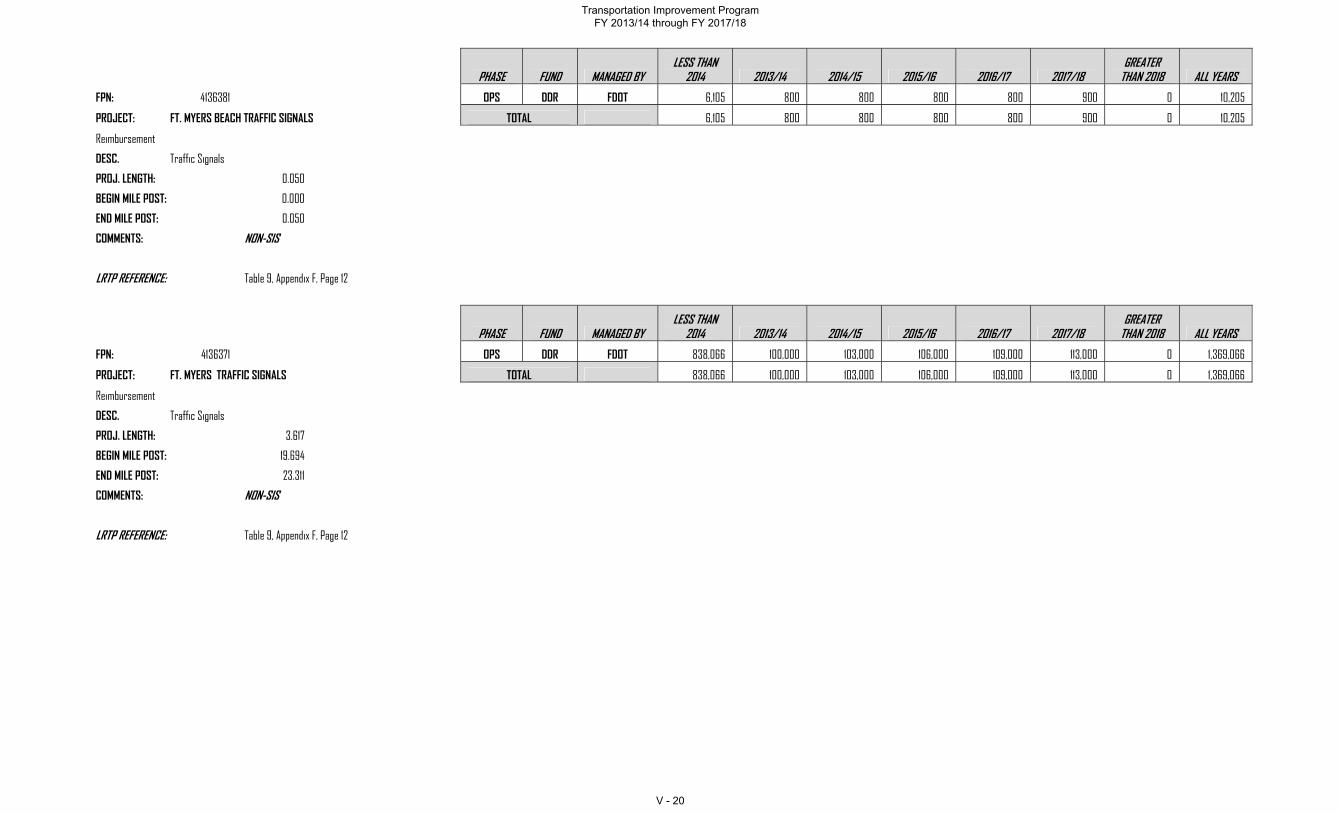
FPN: 4136381 OPS DDR FDOT 6,105 800 800 800 800 900 0 10,205
PROJECT: FT. MYERS BEACH TRAFFIC SIGNALS TOTAL 6,105 800 800 800 800 900 0 10,205
Reimbursement
DESC. Traffic Signals
PROJ. LENGTH: 0.050
BEGIN MILE POST: 0.000
END MILE POST: 0.050
COMMENTS: NON-SIS
LRTP REFERENCE: Table 9, Appendix F, Page 12
PHASE FUND MANAGED BY LESS THAN
2014 2013/14 2014/15 2015/16 2016/17 2017/18 GREATER
THAN 2018 ALL YEARS
FPN: 4136371 OPS DDR FDOT 838,066 100,000 103,000 106,000 109,000 113,000 0 1,369,066
PROJECT: FT. MYERS TRAFFIC SIGNALS TOTAL 838,066 100,000 103,000 106,000 109,000 113,000 0 1,369,066
Reimbursement
DESC. Traffic Signals
PROJ. LENGTH: 3.617
BEGIN MILE POST: 19.694
END MILE POST: 23.311
COMMENTS: NON-SIS
LRTP REFERENCE: Table 9, Appendix F, Page 12
Transportation Improvement Program FY 2013/14 through FY 2017/18
V - 20

PHASE FUND MANAGED BY LESS THAN
2014 2013/14 2014/15 2015/16 2016/17 2017/18 GREATER
THAN 2018 ALL YEARS
FPN: 4130661 ROW BNIR FDOT 66,083 0 0 0 0 0 0 66,083
PROJECT: I 75 ROW DIH FDOT 22,133 0 0 0 0 0 0 22,133
from N of SR 80 to S of SR 78 PE NHAC FDOT 8,399,771 0 0 0 0 0 0 8,399,771
DESC. Bridge Rehab & Add Lanes CST CFA FDOT 71,607,500 0 0 0 0 0 0 71,607,500
PROJ. LENGTH: 1.583 CST DS FDOT 67,043 0 0 0 0 0 0 67,043
BEGIN MILE POST: 26.577 CST ACSA FDOT 125,000 0 0 0 0 0 0 125,000
END MILE POST: 28.160 CST DIH FDOT 44,646 0 0 0 0 0 0 44,646
COMMENTS: SIS CST NHAC FDOT 5,642,529 0 0 0 0 0 0 5,642,529
CST NHAC FDOT 250,091 0 0 0 0 0 0 250,091
LRTP REFERENCE: Table 6-1, Page 6-4, Project 13 ADM DS FDOT 2,307,801 0 0 0 0 0 0 2,307,801
ADM NHAC FDOT 449,580 0 0 0 0 0 0 449,580
ADM SA FDOT 35,000 0 0 0 0 0 0 35,000
RPY DDR FDOT 150,000 0 0 0 0 0 0 150,000
RPY ACNH FDOT 0 71,607,500 0 0 0 0 0 71,607,500
TOTAL 89,167,177 71,607,500 0 0 0 0 0 160,774,677
PHASE FUND MANAGED BY LESS THAN
2014 2013/14 2014/15 2015/16 2016/17 2017/18 GREATER
THAN 2018 ALL YEARS
FPN: 4126363 PE SU FDOT 0 0 0 424,940 0 0 0 424,940
PROJECT: LEE COUNTY COMPUTER SIGNAL SYSTEM TOTAL 0 0 0 424,940 0 0 0 424,940
Update Phase II
DESC. ATMS - Arterial Traffic MGMT
PROJ. LENGTH: 0.002
BEGIN MILE POST: 0.000
END MILE POST: 0.001
COMMENTS: NON-SIS; Design-Build Criteria Package for 412636-4
LRTP REFERENCE: Table 6-1, Page 6-4, Project 32
Transportation Improvement Program FY 2013/14 through FY 2017/18
V - 21

PHASE FUND MANAGED BY LESS THAN
2014 2013/14 2014/15 2015/16 2016/17 2017/18 GREATER
THAN 2018 ALL YEARS
FPN: 4126364 PE TALT FDOT 0 0 0 0 60,000 0 0 60,000
PROJECT: LEE COUNTY COMPUTER SIGNAL SYSTEM DSB DDR FDOT 0 0 0 0 10,266,402 0 16,400,000 26,666,402
Update Phase II DSB DIH FDOT 0 0 0 0 112,300 0 0 112,300
DESC. ATMS - Arterial Traffic MGMT DSB DS FDOT 0 0 0 0 705,520 0 0 705,520
PROJ. LENGTH: 0.002 DSB SA FDOT 0 0 0 0 793,101 0 0 793,101
BEGIN MILE POST: 0.000 DSB TALT FDOT 0 0 0 0 610,318 0 0 610,318
END MILE POST: 0.001 TOTAL 0 0 0 0 12,547,641 0 16,400,000 28,947,641
COMMENTS: The greater than 2018 is for Phase III that completes the project
LRTP REFERENCE: NON-SIS; Table 6-1, Page 6-4, Project 32
PHASE FUND MANAGED BY LESS THAN
2014 2013/14 2014/15 2015/16 2016/17 2017/18 GREATER
THAN 2018 ALL YEARS
FPN: 1957641 CST SU FDOT 0 0 0 0 3,489,491 6,393,713 0 9,883,204
PROJECT: LEE MPO IDENTIFIED OPERATIONAL CST TALU FDOT 0 0 0 0 667,810 667,730 0 1,335,540
Improvements Funding TOTAL 0 0 0 0 4,157,301 7,061,443 0 11,218,744
DESC. Traffic OPS Improvement
PROJ. LENGTH: 0.000
BEGIN MILE POST: 0.000
END MILE POST: 0.000
COMMENTS: This is the multi-modal enhancement box
LRTP REFERENCE: Table 12-7, Page 12-8
Transportation Improvement Program FY 2013/14 through FY 2017/18
V - 22

PHASE FUND MANAGED BY LESS THAN
2014 2013/14 2014/15 2015/16 2016/17 2017/18 GREATER
THAN 2018 ALL YEARS
FPN: 4136951 PE DIH FDOT 296,134 0 0 0 0 0 0 296,134
PROJECT: SR 78 (PINE ISLAND) PE DS FDOT 24,660 0 0 0 0 0 0 24,660
from Burnt Store Road to W of Chiquita Blvd. PE EB FDOT 815,187 0 0 0 0 0 0 815,187
DESC. Add Lanes & Reconstruct PE SIB1 FDOT 1,500,000 0 0 0 0 0 0 1,500,000
PROJ. LENGTH: 1.940 PE SU FDOT 672,214 0 0 0 0 0 0 672,214
BEGIN MILE POST: 5.467 ROW BNDS FDOT 261,288 0 0 0 0 0 0 261,288
END MILE POST: 7.407 ROW DDR FDOT 73,805 0 0 0 0 0 0 73,805
COMMENTS: NON-SIS ROW DIH FDOT 573,139 258,465 0 0 0 0 0 831,604
ROW DS FDOT 254,002 0 0 0 0 0 0 254,002
LRTP REFERENCE: Table 6-1, Page 6-4, Project 17 ROW EB FDOT 8,101,000 0 0 0 0 0 0 8,101,000
RRU DDR FDOT 1,031,899 0 0 0 0 0 0 1,031,899
RRU DS FDOT 5,600 0 0 0 0 0 0 5,600
RRU LF FDOT 1,296,400 0 0 0 0 0 0 1,296,400
CST ACSU FDOT 13,375 0 0 0 0 0 0 13,375
CST SIB1 FDOT 8,706,887 0 0 0 0 0 0 8,706,887
CST SU FDOT 43,546 0 0 0 0 0 0 43,546
ADM DDR FDOT 349,200 0 0 0 0 0 0 349,200
ADM SIB1 FDOT 100,000 0 0 0 0 0 0 100,000
RPY SU FDOT 1,500,000 0 0 0 0 0 0 1,500,000
RPY ACSA FDOT 0 0 0 5,000,000 3,806,887 0 0 8,806,887
TOTAL 25,618,336 258,465 0 5,000,000 3,806,887 0 0 34,683,688
Transportation Improvement Program FY 2013/14 through FY 2017/18
V - 23
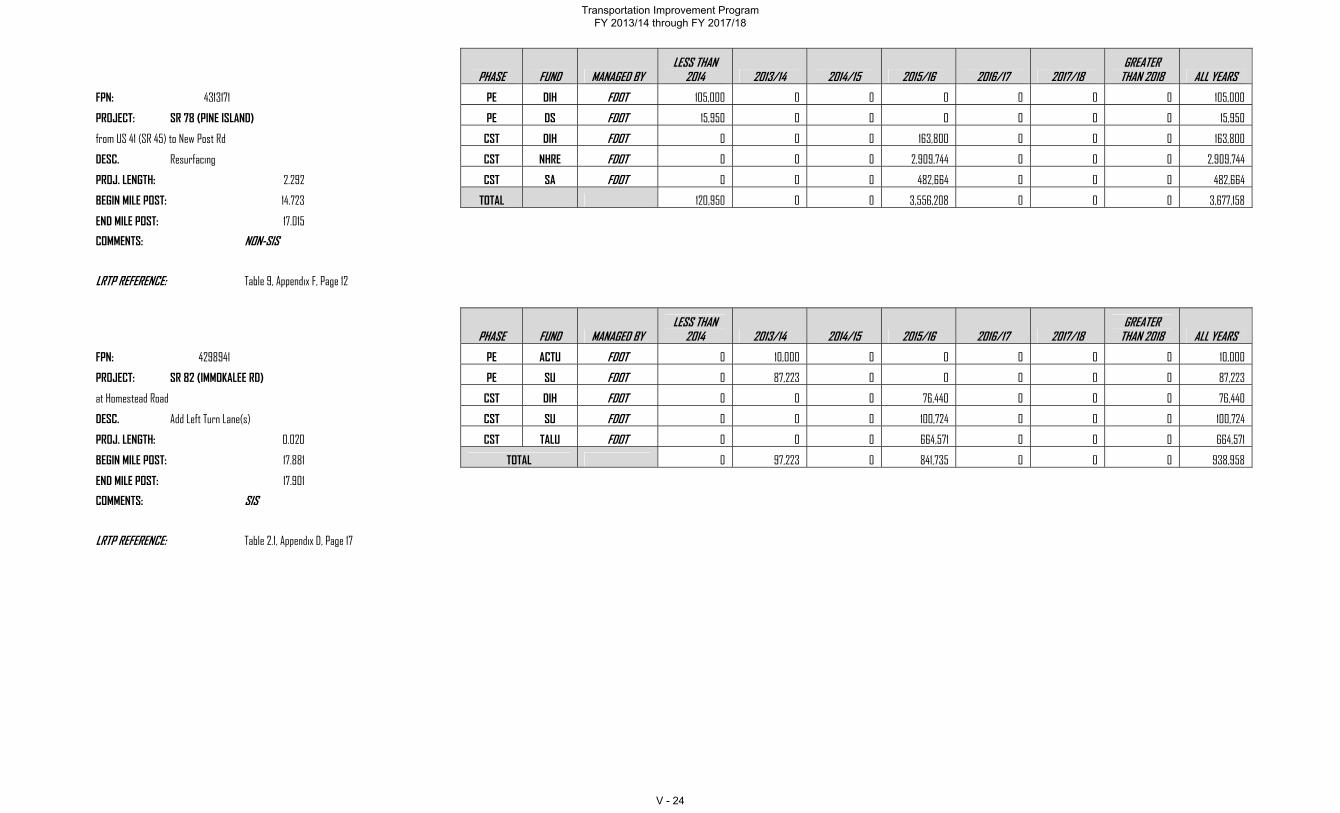
PHASE FUND MANAGED BY LESS THAN
2014 2013/14 2014/15 2015/16 2016/17 2017/18 GREATER
THAN 2018 ALL YEARS
FPN: 4313171 PE DIH FDOT 105,000 0 0 0 0 0 0 105,000
PROJECT: SR 78 (PINE ISLAND) PE DS FDOT 15,950 0 0 0 0 0 0 15,950
from US 41 (SR 45) to New Post Rd CST DIH FDOT 0 0 0 163,800 0 0 0 163,800
DESC. Resurfacing CST NHRE FDOT 0 0 0 2,909,744 0 0 0 2,909,744
PROJ. LENGTH: 2.292 CST SA FDOT 0 0 0 482,664 0 0 0 482,664
BEGIN MILE POST: 14.723 TOTAL 120,950 0 0 3,556,208 0 0 0 3,677,158
END MILE POST: 17.015
COMMENTS: NON-SIS
LRTP REFERENCE: Table 9, Appendix F, Page 12
PHASE FUND MANAGED BY LESS THAN
2014 2013/14 2014/15 2015/16 2016/17 2017/18 GREATER
THAN 2018 ALL YEARS
FPN: 4298941 PE ACTU FDOT 0 10,000 0 0 0 0 0 10,000
PROJECT: SR 82 (IMMOKALEE RD) PE SU FDOT 0 87,223 0 0 0 0 0 87,223
at Homestead Road CST DIH FDOT 0 0 0 76,440 0 0 0 76,440
DESC. Add Left Turn Lane(s) CST SU FDOT 0 0 0 100,724 0 0 0 100,724
PROJ. LENGTH: 0.020 CST TALU FDOT 0 0 0 664,571 0 0 0 664,571
BEGIN MILE POST: 17.881 TOTAL 0 97,223 0 841,735 0 0 0 938,958
END MILE POST: 17.901
COMMENTS: SIS
LRTP REFERENCE: Table 2.1, Appendix D, Page 17
Transportation Improvement Program FY 2013/14 through FY 2017/18
V - 24

PHASE FUND MANAGED BY LESS THAN
2014 2013/14 2014/15 2015/16 2016/17 2017/18 GREATER
THAN 2018 ALL YEARS
FPN: 1954882 PE DIH FDOT 84,871 0 0 0 0 0 0 84,871
PROJECT: SR 82 (MLK BLVD) PE LF FDOT 217,929 0 0 0 0 0 0 217,929
E of Ortiz Ave (CR 865) to S of Lee Blvd. (CR 884) PE LFR FDOT 34,369 0 0 0 0 0 0 34,369
DESC. Add Lanes & Rehabilitate Pvmnt. PE DS FDOT 699,490 0 0 0 0 0 0 699,490
PROJ. LENGTH: 3.298 PE LF FDOT 320,085 0 0 0 0 0 0 320,085
BEGIN MILE POST: 3.842 PE LFR FDOT 2,648,502 0 0 0 0 0 0 2,648,502
END MILE POST: 7.140 PE SU FDOT 501,148 0 0 0 0 0 0 501,148
COMMENTS: SIS ROW BNDS FM 300 0 0 0 0 0 0 300
ROW DIH FM 46,933 0 0 0 0 0 0 46,933
LRTP REFERENCE: Table 6-1, Page 6-4, Project 6 ROW DS FM 615 0 0 0 0 0 0 615
RRU GMR FM 11,335 0 0 0 0 0 0 11,335
CST DC FM 42 0 0 0 0 0 0 42
CST DDR FM 192,811 0 0 0 0 0 0 192,811
CST DIH FM 26,287 0 0 0 0 0 0 26,287
CST DDR FM 149,973 0 0 0 0 0 0 149,973
CST GMR FM 7,225,762 0 0 0 0 0 0 7,225,762
CST LF FM 15,924,599 0 0 0 0 0 0 15,924,599
CST SIBG FM 15,000,000 0 0 0 0 0 0 15,000,000
ADM DDR FM 8,962,965 5,946,499 0 0 0 0 0 14,909,464
ADM DS FM 340,538 0 0 0 0 0 0 340,538
ADM LF FM 250,000 0 0 0 0 0 0 250,000
ADM SU FM 2,682,871 0 0 0 0 0 0 2,682,871
TOTAL 55,321,425 5,946,499 0 0 0 0 0 61,267,924
Transportation Improvement Program FY 2013/14 through FY 2017/18
V - 25

PHASE FUND MANAGED BY LESS THAN
2014 2013/14 2014/15 2015/16 2016/17 2017/18 GREATER
THAN 2018 ALL YEARS
FPN: 4308861 PE DIH FDOT 0 0 0 10,000 0 0 0 10,000
PROJECT: SR 865 (SIX MILE CYPRESS PKWY) PE SU FDOT 0 0 0 114,924 0 0 0 114,924
at US 41 (SR 45) CST SU FDOT 0 0 0 0 516,109 0 0 516,109
DESC. Intersection Improvement TOTAL 0 0 0 124,924 516,109 0 0 641,033
PROJ. LENGTH: 0.314
BEGIN MILE POST: 9.457
END MILE POST: 9.771
COMMENTS: NON-SIS
LRTP REFERENCE: Table 12-7, Page 12-8
PHASE FUND MANAGED BY LESS THAN
2014 2013/14 2014/15 2015/16 2016/17 2017/18 GREATER
THAN 2018 ALL YEARS
FPN: 4126721 OPS DDR FDOT 1,327,052 167,000 172,000 178,000 184,000 189,000 0 2,217,052
PROJECT: LEE COUNTY TRAFFIC SIGNALS TOTAL 1,327,052 167,000 172,000 178,000 184,000 189,000 0 2,217,052
Reimbursement
DESC. Traffic Signals
PROJ. LENGTH: 9.184
BEGIN MILE POST: 0.900
END MILE POST: 10.084
COMMENTS: NON-SIS
LRTP REFERENCE: Table 9, Appendix F, Page 12
Transportation Improvement Program FY 2013/14 through FY 2017/18
V - 26

PHASE FUND MANAGED BY LESS THAN
2014 2013/14 2014/15 2015/16 2016/17 2017/18 GREATER
THAN 2018 ALL YEARS
FPN: 4317031 PE BRRP FDOT 0 0 0 200,000 0 0 0 200,000
PROJECT: US 41 (SR 45) PE DIH FDOT 0 0 0 10,000 0 0 0 10,000
at Caloosahatchee River Bridge Number 120002 CST BRRP FDOT 0 0 0 0 2,499,044 0 0 2,499,044
DESC. Bridge - Repair/Rehabilitation CST DIH FDOT 0 0 0 0 32,567 0 0 32,567
PROJ. LENGTH: 0.939 TOTAL 0 0 0 210,000 2,531,611 0 0 2,741,611
BEGIN MILE POST: 23.647
END MILE POST: 24.586
COMMENTS: NON-SIS
LRTP REFERENCE: Table 9, Appendix F, Page 12
PHASE FUND MANAGED BY LESS THAN
2014 2013/14 2014/15 2015/16 2016/17 2017/18 GREATER
THAN 2018 ALL YEARS
FPN: 4313321 PDE ACSU FDOT 0 230,253 0 0 0 0 0 230,253
PROJECT: US 41 (SR 45) PDE SU FDOT 0 869,747 0 0 0 0 0 869,747
at CR 865 (Bonita Beach Road) PE FDOT 0 0 0 0 0 0 8,860,000 8,860,000
DESC. PD&E/EMO Study ROW/CST FDOT 0 0 0 0 0 0 57,960,000 57,960,000
PROJ. LENGTH: 1.000 TOTAL 0 1,100,000 0 0 0 0 66,820,000 67,920,000
BEGIN MILE POST: 0.490
END MILE POST: 1.490
COMMENTS: NON-SIS
LRTP REFERENCE: Table 12-9, Page 12-10
Transportation Improvement Program FY 2013/14 through FY 2017/18
V - 27

PHASE FUND MANAGED BY LESS THAN
2014 2013/14 2014/15 2015/16 2016/17 2017/18 GREATER
THAN 2018 ALL YEARS
FPN: 4290991 PE DDR FDOT 60,380 0 0 0 0 0 0 60,380
PROJECT: US 41 (SR 45) PE DIH FDOT 28,360 0 0 0 0 0 0 28,360
from North Fork Road to Sabal Springs Blvd. PE DS FDOT 8,112 0 0 0 0 0 0 8,112
DESC. Resurfacing CST DDR FDOT 0 888,521 0 0 0 0 0 888,521
PROJ. LENGTH: 0.767 CST DIH FDOT 0 145,113 0 0 0 0 0 145,113
BEGIN MILE POST: 28.818 TOTAL 96,852 1,033,634 0 0 0 0 0 1,130,486
END MILE POST: 29.585
COMMENTS: NON-SIS
LRTP REFERENCE: Table 9, Appendix F, Page 12
PHASE FUND MANAGED BY LESS THAN
2014 2013/14 2014/15 2015/16 2016/17 2017/18 GREATER
THAN 2018 ALL YEARS
FPN: 4295471 PE DDR FDOT 124,125 0 0 0 0 0 0 124,125
PROJECT: US 41 (SR 45) PE DIH FDOT 43,138 0 0 0 0 0 0 43,138
from Sabal Springs Blvd. to Charlotte C/L PE DS FDOT 162,782 0 0 0 0 0 0 162,782
DESC. Resurfacing CST DDR FDOT 0 594,566 0 0 0 0 0 594,566
PROJ. LENGTH: 3.676 CST DIH FDOT 0 67,015 0 0 0 0 0 67,015
BEGIN MILE POST: 29.665 CST DS FDOT 285 0 0 0 0 0 0 285
END MILE POST: 33.341 CST SA FDOT 0 5,513,346 0 0 0 0 0 5,513,346
COMMENTS: NON-SIS TOTAL 330,330 6,174,927 0 0 0 0 0 6,505,257
LRTP REFERENCE: Table 9, Appendix F, Page 12
Transportation Improvement Program FY 2013/14 through FY 2017/18
V - 28

PHASE FUND MANAGED BY LESS THAN
2014 2013/14 2014/15 2015/16 2016/17 2017/18 GREATER
THAN 2018 ALL YEARS
FPN: 4313131 PE DIH FDOT 45,000 0 0 0 0 0 0 45,000
PROJECT: US 41 (SR 45) CST DIH FDOT 0 0 218,400 0 0 0 0 218,400
from Winkler Avenue to SR 82 CST DS FDOT 0 0 6,216,879 0 0 0 0 6,216,879
DESC. Resurfacing TOTAL 45,000 0 6,435,279 0 0 0 0 6,480,279
PROJ. LENGTH: 2.388
BEGIN MILE POST: 21.033
END MILE POST: 23.421
COMMENTS: NON-SIS
LRTP REFERENCE: Table 9, Appendix F, Page 12
PHASE FUND MANAGED BY LESS THAN
2014 2013/14 2014/15 2015/16 2016/17 2017/18 GREATER
THAN 2018 ALL YEARS
FPN: 4308851 CST LFP FM 0 0 0 74,552 0 0 0 74,552
PROJECT: VERONICA SHOEMAKER CST SU FM 0 0 0 131,738 0 0 0 131,738
at SR 884 (Colonial Blvd.) TOTAL 0 0 0 206,290 0 0 0 206,290
DESC. Add Left Turn Lane(s)
PROJ. LENGTH: 0.107
BEGIN MILE POST: 0.000
END MILE POST: 0.107
COMMENTS: NON-SIS
LRTP REFERENCE: Page 12-8, Table 12-7
Transportation Improvement Program FY 2013/14 through FY 2017/18
V - 29

PHASE FUND MANAGED BY LESS THAN
2014 2013/14 2014/15 2015/16 2016/17 2017/18 GREATER
THAN 2018 ALL YEARS
FPN: 4299601 OPS ACSU LEE 0 0 0 300,000 0 0 0 300,000
PROJECT: LEE COUNTY TRAFFIC MANAGEMENT OPS SU LEE 0 300,000 300,000 0 300,000 300,000 300,000 1,500,000
Center Operations TOTAL 0 300,000 300,000 300,000 300,000 300,000 300,000 1,800,000
DESC. Traffic Management Centers
PROJ. LENGTH: 0.000
BEGIN MILE POST: 0.000
END MILE POST: 0.000
COMMENTS: NON-SIS
LRTP REFERENCE: Page 12-8, Table 12-7
PHASE FUND MANAGED BY LESS THAN
2014 2013/14 2014/15 2015/16 2016/17 2017/18 GREATER
THAN 2018 ALL YEARS
FPN: 1957187 PE SU FDOT 0 0 250,000 0 0 0 0 250,000
PROJECT: SR 739 (FOWLER STREET) ROW/CST 0 0 0 0 0 0 38,400,000 38,400,000
from Hanson Street to SR 82 (MLK) TOTAL 0 0 250,000 0 0 0 38,400,000 38,650,000
DESC. Preliminary Engineering
PROJ. LENGTH: 1.261
BEGIN MILE POST: 2.295
END MILE POST: 3.556
COMMENTS: NON-SIS
LRTP REFERENCE: Page 6-4, Table 6-1, Project 42
Transportation Improvement Program FY 2013/14 through FY 2017/18
V - 30

PHASE FUND MANAGED BY LESS THAN
2014 2013/14 2014/15 2015/16 2016/17 2017/18 GREATER
THAN 2018 ALL YEARS
FPN: 4332371 PE SU CC 0 0 135,518 0 0 0 0 135,518
PROJECT: SIGNAL TIMING PE TALU CC 0 0 114,482 0 0 0 0 114,482
DESC. Traffic Signal Update TOTAL 0 0 250,000 0 0 0 0 250,000
PROJ. LENGTH: 0.000
BEGIN MILE POST: 0.000
END MILE POST: 0.000
COMMENTS: NON-SIS
LRTP REFERENCE: Appendix F, Page 12, Table 9
PHASE FUND MANAGED BY LESS THAN
2014 2013/14 2014/15 2015/16 2016/17 2017/18 GREATER
THAN 2018 ALL YEARS
FPN: 4332221 PE SU FDOT 0 0 71,014 0 0 0 0 71,014
PROJECT: SR 78 CST DS FDOT 0 0 0 7,603 0 0 0 7,603
at Santa Barbara Blvd CST SU FDOT 0 0 0 190,805 0 0 0 190,805
DESC. Add Left Turn Lane(s) TOTAL 0 0 71,014 198,408 0 0 0 269,422
PROJ. LENGTH: 0.001
BEGIN MILE POST: 9.756
END MILE POST: 9.757
COMMENTS: NON-SIS
LRTP REFERENCE: Appendix D, Page 51, Table 7.1
Transportation Improvement Program FY 2013/14 through FY 2017/18
V - 31

PHASE FUND MANAGED BY LESS THAN
2014 2013/14 2014/15 2015/16 2016/17 2017/18 GREATER
THAN 2018 ALL YEARS
FPN: 4332231 PE SU FDOT 0 0 67,598 0 0 0 0 67,598
PROJECT: SR 78 CST DS FDOT 0 0 0 5,717 0 0 0 5,717
at Chiquita Blvd CST SU FDOT 0 0 0 151,014 0 0 0 151,014
DESC. Add Left Turn Lane(s) TOTAL 0 0 67,598 156,731 0 0 0 224,329
PROJ. LENGTH: 0.001
BEGIN MILE POST: 7.513
END MILE POST: 7.514
COMMENTS: NON-SIS
LRTP REFERENCE: Page 12-8, Table 12-7
PHASE FUND MANAGED BY LESS THAN
2014 2013/14 2014/15 2015/16 2016/17 2017/18 GREATER
THAN 2018 ALL YEARS
FPN: 4329031 PE DDR FDOT 100,000 0 0 0 0 0 0 100,000
PROJECT: I-75 (SR 39) PE DIH FDOT 2,636 0 0 0 0 0 0 2,636
Collier County Line Corkscrew Road CST DDR FDOT 0 497,000 0 0 0 0 0 497,000
DESC. Drainage Improvements CST DIH FDOT 0 1,000 0 0 0 0 0 1,000
PROJ. LENGTH: 8.400 TOTAL 102,636 498,000 0 0 0 0 0 600,636
BEGIN MILE POST: 0.000
END MILE POST: 8.400
COMMENTS: SIS
LRTP REFERENCE: Appendix F, Page 12, Table 9
Transportation Improvement Program FY 2013/14 through FY 2017/18
V - 32

PHASE FUND MANAGED BY LESS THAN
2014 2013/14 2014/15 2015/16 2016/17 2017/18 GREATER
THAN 2018 ALL YEARS
FPN: 4334411 PE DDR FDOT 0 0 21,331 0 0 0 0 21,331
PROJECT: SR 80 (PALM BEACH BLVD) PE DIH FDOT 0 0 6,000 0 0 0 0 6,000
over Orange River at Bridge Number 120160 CST BRRP FDOT 0 0 0 334,845 0 0 0 334,845
DESC. Bridge-Repair/Rehabilitation CST DIH FDOT 0 0 0 14,196 0 0 0 14,196
PROJ. LENGTH: 0.151 TOTAL 0 0 27,331 349,041 0 0 0 376,372
BEGIN MILE POST: 6.026
END MILE POST: 6.177
COMMENTS: SIS
LRTP REFERENCE: Appendix F, Page 12, Table 9
PHASE FUND MANAGED BY LESS THAN
2014 2013/14 2014/15 2015/16 2016/17 2017/18 GREATER
THAN 2018 ALL YEARS
FPN: 4258411 PE DIH FDOT 72,574 0 0 0 0 0 0 72,574
PROJECT: SR 82 ROW ACTU FDOT 0 3,728,745 0 0 0 0 0 3,728,745
from CR 884 (Lee Blvd.) to Shawnee Road ROW SU FDOT 0 6,723,180 626,755 0 0 0 0 7,349,935
DESC. Add Lanes & Reconstruct RRU DIH FDOT 0 0 0 0 0 0 500,000 500,000
PROJ. LENGTH: 4.462 CST DI FDOT 0 0 0 0 0 0 48,823,911 48,823,911
BEGIN MILE POST: 7.082 CST DIH FDOT 0 0 0 0 0 0 897,795 897,795
END MILE POST: 11.544 ADM DI FDOT 0 0 0 0 0 0 200,000 200,000
COMMENTS: SIS PE EB FDOT 2,429,840 0 0 0 0 0 0 2,429,840
PE SU FDOT 2,181,756 0 0 0 0 0 0 2,181,756
ENV SU FDOT 0 70,000 0 0 0 0 130,000 200,000
LRTP REFERENCE: Page 6-4, Table 6-1, Project 21 TOTAL 4,684,170 10,521,925 626,755 0 0 0 50,421,706 66,384,556
JLimbaugh
Typewritten Text
JLimbaugh
Typewritten Text
JLimbaugh
Typewritten Text
JLimbaugh
Typewritten Text
JLimbaugh
Typewritten Text
JLimbaugh
Typewritten Text
v-33
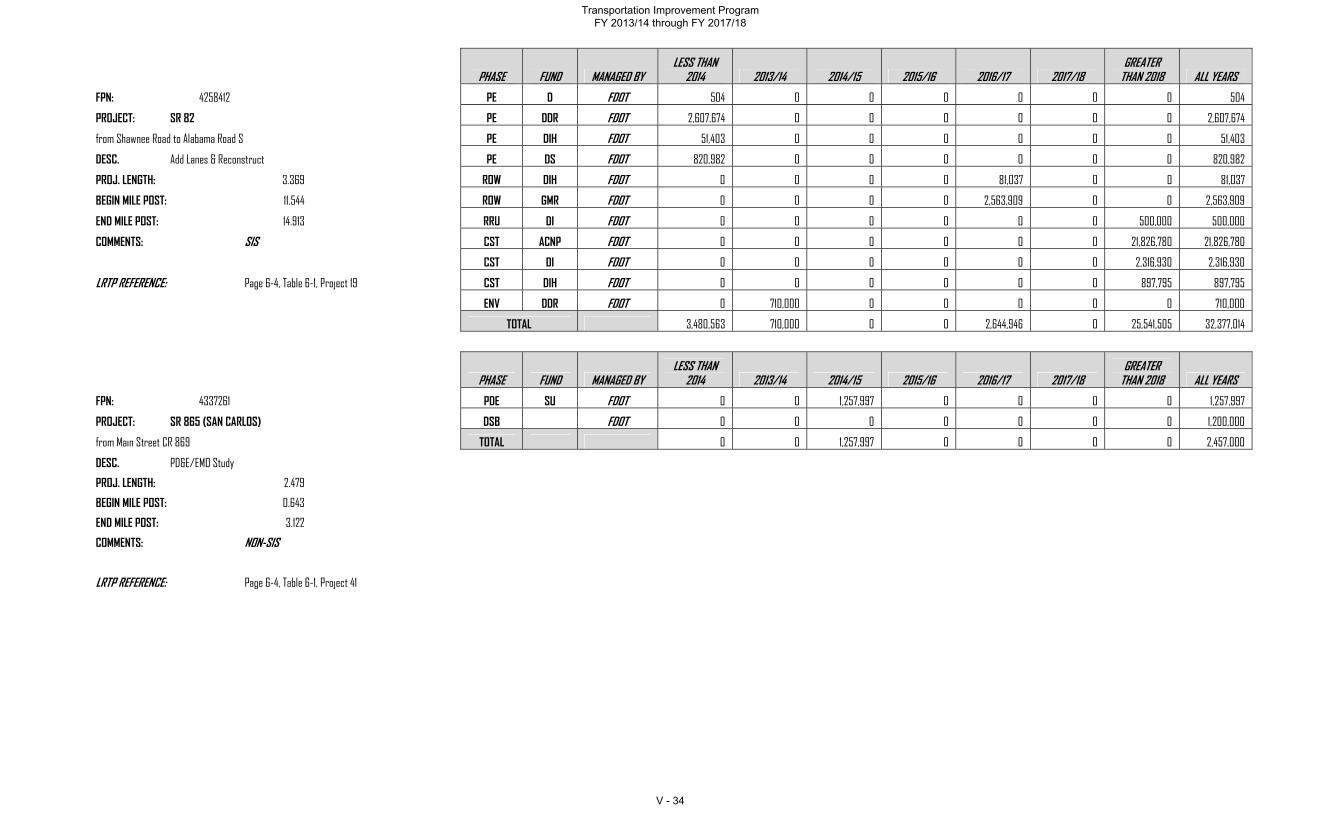
PHASE FUND MANAGED BY LESS THAN
2014 2013/14 2014/15 2015/16 2016/17 2017/18 GREATER
THAN 2018 ALL YEARS
FPN: 4258412 PE D FDOT 504 0 0 0 0 0 0 504
PROJECT: SR 82 PE DDR FDOT 2,607,674 0 0 0 0 0 0 2,607,674
from Shawnee Road to Alabama Road S PE DIH FDOT 51,403 0 0 0 0 0 0 51,403
DESC. Add Lanes & Reconstruct PE DS FDOT 820,982 0 0 0 0 0 0 820,982
PROJ. LENGTH: 3.369 ROW DIH FDOT 0 0 0 0 81,037 0 0 81,037
BEGIN MILE POST: 11.544 ROW GMR FDOT 0 0 0 0 2,563,909 0 0 2,563,909
END MILE POST: 14.913 RRU DI FDOT 0 0 0 0 0 0 500,000 500,000
COMMENTS: SIS CST ACNP FDOT 0 0 0 0 0 0 21,826,780 21,826,780
CST DI FDOT 0 0 0 0 0 0 2,316,930 2,316,930
LRTP REFERENCE: Page 6-4, Table 6-1, Project 19 CST DIH FDOT 0 0 0 0 0 0 897,795 897,795
ENV DDR FDOT 0 710,000 0 0 0 0 0 710,000
TOTAL 3,480,563 710,000 0 0 2,644,946 0 25,541,505 32,377,014
PHASE FUND MANAGED BY LESS THAN
2014 2013/14 2014/15 2015/16 2016/17 2017/18 GREATER
THAN 2018 ALL YEARS
FPN: 4337261 PDE SU FDOT 0 0 1,257,997 0 0 0 0 1,257,997
PROJECT: SR 865 (SAN CARLOS) DSB FDOT 0 0 0 0 0 0 0 1,200,000
from Main Street CR 869 TOTAL 0 0 1,257,997 0 0 0 0 2,457,000
DESC. PD&E/EMO Study
PROJ. LENGTH: 2.479
BEGIN MILE POST: 0.643
END MILE POST: 3.122
COMMENTS: NON-SIS
LRTP REFERENCE: Page 6-4, Table 6-1, Project 41
Transportation Improvement Program FY 2013/14 through FY 2017/18
V - 34

PHASE FUND MANAGED BY LESS THAN
2014 2013/14 2014/15 2015/16 2016/17 2017/18 GREATER
THAN 2018 ALL YEARS
FPN: 4258413 PE DIH FDOT 46,157 0 0 0 0 0 0 46,157
PROJECT: SR 82 PE DS FDOT 2,825,126 0 0 0 0 0 0 2,825,126
from Alabama Road S to Homestead Road S ROW DDR FDOT 0 0 0 2,738,374 0 0 0 2,738,374
DESC. Add Lanes & Reconstruct ROW DIH FDOT 0 0 0 200,000 0 0 0 200,000
PROJ. LENGTH: 3.576 CST CM FDOT 0 0 0 0 0 1,687,885 0 1,687,885
BEGIN MILE POST: 14.913 CST DDR FDOT 0 0 0 0 0 17,242,060 0 17,242,060
END MILE POST: 18.489 CST DS FDOT 81 0 0 0 0 10,778,769 0 10,778,850
COMMENTS: SIS CST SA FDOT 0 0 0 0 0 7,718,999 0 7,718,999
ENV DDR FDOT 0 741,000 0 0 0 0 0 741,000
LRTP REFERENCE: Page 6-4, Table 6-1, Project 22 TOTAL 2,871,364 741,000 0 2,938,374 0 37,427,713 0 43,978,451
PHASE FUND MANAGED BY LESS THAN
2014 2013/14 2014/15 2015/16 2016/17 2017/18 GREATER
THAN 2018 ALL YEARS
FPN: 4258414 PE DDR FDOT 2,607,878 0 0 0 0 0 0 2,607,878
PROJECT: SR 82 PE DIH FDOT 18,228 0 0 0 0 0 0 18,228
from Homestead Road S to Hendry C/L ENV DDR FDOT 0 387,000 0 0 0 0 0 387,000
ROW/CST FDOT 0 0 0 0 0 0 28,213,000 28,213,000
DESC. Add Lanes & Reconstruct TOTAL 2,626,106 387,000 0 0 0 0 28,213,000 31,226,106
PROJ. LENGTH: 3.565
BEGIN MILE POST: 17.986
END MILE POST: 21.551
COMMENTS: SIS
LRTP REFERENCE: Page 6-4, Table 6-1, Project 23
Transportation Improvement Program FY 2013/14 through FY 2017/18
V - 35

PHASE FUND MANAGED BY LESS THAN
2014 2013/14 2014/15 2015/16 2016/17 2017/18 GREATER
THAN 2018 ALL YEARS
FPN: 4136952 CST DDR FDOT 0 0 67,911 0 0 0 0 67,911
PROJECT: SR 78 CST DIH FDOT 0 0 5,305 0 0 0 0 5,305
Burnt Store Road Chiquita Blvd. TOTAL 0 0 73,216 0 0 0 0 73,216
DESC. Signing/Pavement Markings
PROJ. LENGTH: 1.814
BEGIN MILE POST: 5.467
END MILE POST: 7.281
COMMENTS: NON-SIS
LRTP REFERENCE: Appendix F, Page 12, Table 9
PHASE FUND MANAGED BY LESS THAN
2014 2013/14 2014/15 2015/16 2016/17 2017/18 GREATER
THAN 2018 ALL YEARS
FPN: 4329201 CST DIH FDOT 0 500 0 0 0 0 0 500
PROJECT: FT. MYERS OPERATIONS CENTER TOTAL 0 500 0 0 0 0 0 500
DESC. Renovations
PROJ. LENGTH: 0.000
BEGIN MILE POST: 0.000
END MILE POST: 0.000
COMMENTS: NON-SIS
LRTP REFERENCE: Appendix F, Page 12, Table 9
Transportation Improvement Program FY 2013/14 through FY 2017/18
V - 36

PHASE FUND MANAGED BY LESS THAN
2014 2013/14 2014/15 2015/16 2016/17 2017/18 GREATER
THAN 2018 ALL YEARS
FPN: 4329211 CST DIH FDOT 0 500 0 0 0 0 0 500
PROJECT: FT. MYERS LABORTORY TOTAL 0 500 0 0 0 0 0 500
DESC. Renovations
PROJ. LENGTH: 0.000
BEGIN MILE POST: 0.000
END MILE POST: 0.000
COMMENTS: NON-SIS
LRTP REFERENCE: Appendix F, Page 12, Table 9
PHASE FUND MANAGED BY LESS THAN
2014 2013/14 2014/15 2015/16 2016/17 2017/18 GREATER
THAN 2018 ALL YEARS
FPN: 4329281 CST DIH FDOT 0 500 0 0 0 0 0 500
PROJECT: SWIFT SUNGUIDE CENTER TOTAL 0 500 0 0 0 0 0 500
DESC. Renovations
PROJ. LENGTH: 0.000
BEGIN MILE POST: 0.000
END MILE POST: 0.000
COMMENTS: NON-SIS
LRTP REFERENCE: Appendix F, Page 12, Table 9
Transportation Improvement Program FY 2013/14 through FY 2017/18
V - 37

PHASE FUND MANAGED BY LESS THAN
2014 2013/14 2014/15 2015/16 2016/17 2017/18 GREATER
THAN 2018 ALL YEARS
FPN: 4082631 ACM D FDOT 30,638,675 3,000,000 3,000,000 3,000,000 3,588,400 0 0 43,227,075
PROJECT: LEE COUNTY ROADWAY & BRIDGE TOTAL 30,638,675 3,000,000 3,000,000 3,000,000 3,588,400 0 0 43,227,075
MAINTENANCE
DESC. Primary System
PROJ. LENGTH: 0.000
BEGIN MILE POST: 0.000
END MILE POST: 0.000
COMMENTS: NON-SIS
LRTP REFERENCE: Appendix F, Page 12, Table 9
PHASE FUND MANAGED BY LESS THAN
2014 2013/14 2014/15 2015/16 2016/17 2017/18 GREATER
THAN 2018 ALL YEARS
FPN: 4082641 ACM D FDOT 2,148,034 50,000 50,000 50,000 52,000 0 0 2,350,034
PROJECT: LEE COUNTY ROADWAY & BRIDGE TOTAL 2,148,034 50,000 50,000 50,000 52,000 0 0 2,350,034
MAINTENANCE
DESC. INTERSTATE SYSTEM
PROJ. LENGTH: 0.000
BEGIN MILE POST: 0.000
END MILE POST: 0.000
COMMENTS: SIS
LRTP REFERENCE: Appendix F, Page 12, Table 9
Transportation Improvement Program FY 2013/14 through FY 2017/18
V - 38

PHASE FUND MANAGED BY LESS THAN
2014 2013/14 2014/15 2015/16 2016/17 2017/18 GREATER
THAN 2018 ALL YEARS
FPN: 4125801 ACM DDR FDOT 551,775 0 0 0 0 0 0 551,775
PROJECT: LEE COUNTY HIGHWAY ACM DDR Lee County 1,141,749 213,232 219,629 226,218 233,008 239,999 0 2,273,835
TOTAL 1,693,524 213,232 219,629 226,218 233,008 239,999 0 2,825,610
DESC. Lighting
PROJ. LENGTH: 0.000
BEGIN MILE POST: 0.000
END MILE POST: 0.000
COMMENTS: NON-SIS
LRTP REFERENCE: Appendix F, Page 12, Table 9
PHASE FUND MANAGED BY LESS THAN
2014 2013/14 2014/15 2015/16 2016/17 2017/18 GREATER
THAN 2018 ALL YEARS
FPN: 4128951 ACM DDR FDOT 551,775 0 0 0 0 0 0 551,775
PROJECT: MOA FT. MYERS MOWING AND LITTER ACM DDR Fort Myers 1,141,749 213,232 219,629 226,218 233,008 239,999 0 2,273,835
REMOVAL TOTAL 1,693,524 213,232 219,629 226,218 233,008 239,999 0 2,825,610
DESC.
PROJ. LENGTH: 0.000
BEGIN MILE POST: 0.000
END MILE POST: 0.000
COMMENTS: NON-SIS
LRTP REFERENCE: Appendix F, Page 12, Table 9

PHASE FUND MANAGED BY LESS THAN
2014 2013/14 2014/15 2015/16 2016/17 2017/18 GREATER
THAN 2018 ALL YEARS
FPN: 4135481 ACM DDR FDOT 51,760 0 0 0 0 0 0 51,760
PROJECT: CAPE CORAL HIGHWAY ACM DDR Cape Coral 192,593 37,772 38,905 40,072 41,274 42,513 0 393,129
TOTAL 244,353 37,772 38,905 40,072 41,274 42,513 0 444,889
DESC. Lighting
PROJ. LENGTH: 0.000
BEGIN MILE POST: 0.000
END MILE POST: 0.000
COMMENTS: NON-SIS
LRTP REFERENCE: Appendix F, Page 12, Table 9
PHASE FUND MANAGED BY LESS THAN
2014 2013/14 2014/15 2015/16 2016/17 2017/18 GREATER
THAN 2018 ALL YEARS
FPN: 4135491 ACM DDR FDOT 450,198 0 0 0 0 0 0 450,198
PROJECT: FT. MYERS HIGHWAY ACM DDR Fort Myers 1,126,914 285,920 294,497 303,332 312,437 321,811 0 2,644,911
TOTAL 1,577,112 285,920 294,497 303,332 312,437 321,811 0 3,095,109
DESC. Lighting
PROJ. LENGTH: 0.000
BEGIN MILE POST: 0.000
END MILE POST: 0.000
COMMENTS: NON-SIS
LRTP REFERENCE: Appendix F, Page 12, Table 9

PHASE FUND MANAGED BY LESS THAN
2014 2013/14 2014/15 2015/16 2016/17 2017/18 GREATER
THAN 2018 ALL YEARS
FPN: 4227501 ACM D FDOT 3,775 550 550 550 550 550 0 6,525
PROJECT: NPDES TOTAL 3,775 550 550 550 550 550 0 6,525
DESC. Permits
PROJ. LENGTH: 0.000
BEGIN MILE POST: 0.000
END MILE POST: 0.000
COMMENTS: NON-SIS
LRTP REFERENCE: Appendix F, Page 12, Table 9
PHASE FUND MANAGED BY LESS THAN
2014 2013/14 2014/15 2015/16 2016/17 2017/18 GREATER
THAN 2018 ALL YEARS
FPN: 4245741 ACM DDR Bonita Springs 281,039 77,080 79,392 81,774 84,228 86,756 0 690,269
PROJECT: BONITA SPRINGS HIGHWAY TOTAL 281,039 77,080 79,392 81,774 84,228 86,756 0 690,269
DESC. Lighting
PROJ. LENGTH: 0.000
BEGIN MILE POST: 0.000
END MILE POST: 0.000
COMMENTS: NON-SIS
LRTP REFERENCE: Appendix F, Page 12, Table 9

PHASE FUND MANAGED BY LESS THAN
2014 2013/14 2014/15 2015/16 2016/17 2017/18 GREATER
THAN 2018 ALL YEARS
FPN: 4294171 ACM D FDOT 286,906 400,000 400,000 0 0 0 0 1,086,906
PROJECT: MOWING AND LITTER TOTAL 286,906 400,000 400,000 0 0 0 0 1,086,906
DESC. Removal
PROJ. LENGTH: 0.000
BEGIN MILE POST: 0.000
END MILE POST: 0.000
COMMENTS: NON-SIS
LRTP REFERENCE: Appendix F, Page 12, Table 9
PHASE FUND MANAGED BY LESS THAN
2014 2013/14 2014/15 2015/16 2016/17 2017/18 GREATER
THAN 2018 ALL YEARS
FPN: 4128951 CST DS FDOT 27 0 0 0 0 0 0 27
PROJECT: MOA FT MYERS MOWING & LITTER TOTAL 27 0 0 0 0 0 0 27
DESC. Removal
PROJ. LENGTH: 0.000
BEGIN MILE POST: 0.000
END MILE POST: 0.000
COMMENTS: NON-SIS
LRTP REFERENCE: Appendix F, Page 12, Table 9
HIGHWAYS LESS THAN
2011 2012/13 2013/14 2014/15 2015/16 2016/17 GREATER
THAN 2016 ALL YEARS
TOTAL $ 253,263,714 $ 104,877,259 $ 25,237,818 $ 18,545,615 $ 31,370,200 $ 46,051,184 $ 226,096,211 $ 695,422,260
Transportation Improvement Program FY 2013/14 through FY 2017/18
V - 42

SECTION VI
AVIATION PROJECTS
This section includes the aviation projects from the State Tentative Work Program for fiscal years 2013/14 through 2017/18. The projects are grouped by airports – first Page Field and then Southwest Florida International Airport. The Lee County Port Authority has indicated that the projects in this section are all consistent with the appropriate airport master plans. The aviation project priorities were developed by the Lee County Port Authority to reflect needs identified in current master plan documents for the airports under its jurisdiction. The two lists of the MPOs endorsed aviation priorities are included in the beginning of this section.
Transportation Improvement Program FY 2013/14 through FY 2017/18
VI - 1

Transportation Improvement Program FY 2013/14 through FY 2017/18
VI - 2

WORK PROGRAM ONLINE - AIRPORT
CAPITAL IMPROVEMENT PLAN SUMMARY Page 1 of 27/10/2012
Local ID:Page Field
Lee County Port Authority
12-0027
03198.*A
Airport:
Sponsor: Sponsor ID:
NPIAS No.:
Site No.:
FMY
RSW
Sponsor Sponsor YearProject Description:
Priority Sponsor Requested Funding Breakdown
Federal State LocalFAA
FMY84 410812 1 04 2013UPIN: FDOT Item No.: $720,000
Rehab of Runways 13/31 and 5/23
72 $648,000 $0 $72,000
PFL0004170 03 2013UPIN: FDOT Item No.: $2,262,861
Design and Construct Perimeter Road and Land Acquisition
22 $2,021,575 $193,029 $48,257
PFL0007902 06 2013UPIN: FDOT Item No.: $300,000
Rehabilitation Ramps
62 $0 $0 $300,000
2013Yearly Total $3,282,861$2,669,575 $193,029 $420,257
FMY84 410812 1 04 2014UPIN: FDOT Item No.: $12,900,605
Rehab of Runways 13/31 and 5/23
72 $6,715,080 $5,779,205 $406,320
PFL0007455 07 2014UPIN: FDOT Item No.: $250,000
Demolish and Build Hangars
0 $0 $0 $250,000
PFL0007902 06 2014UPIN: FDOT Item No.: $2,000,000
Rehabilitation Ramps
62 $0 $1,840,000 $160,000
PFL0009595 08 2014UPIN: FDOT Item No.: $300,000
Phase V Ramp & Hangars
0 $0 $0 $300,000
PFL0009690 05 2014UPIN: FDOT Item No.: $60,000
Approach Obstruction Removal
95 $0 $0 $60,000
2014Yearly Total $15,510,605$6,715,080 $7,619,205 $1,176,320
FMY615 12 2015UPIN: FDOT Item No.: $305,800
Southwest Ramp Expansion to include parcel acquisition
46 $0 $5,800 $300,000
PFL0003264 09 2015UPIN: FDOT Item No.: $100,000
North Quadrant Improvements Phase II
45 $0 $0 $100,000
PFL0007455 07 2015UPIN: FDOT Item No.: $2,250,000
Demolish and Build Hangars
0 $0 $2,000,000 $250,000
Transportation Improvement Program FY 2013/14 through FY 2017/18
VI - 3

PFL0007901 10 2015UPIN: FDOT Item No.: $100,000
Rehab Ramp D
62 $0 $0 $100,000
PFL0008763 11 2015UPIN: FDOT Item No.: $430,000
South Danley & North Airport Road Utility Improvements
20 $0 $0 $430,000
PFL0009595 08 2015UPIN: FDOT Item No.: $3,000,000
Phase V Ramp & Hangars
0 $0 $2,640,000 $360,000
2015Yearly Total $6,185,800$0 $4,645,800 $1,540,000
FMY615 12 2016UPIN: FDOT Item No.: $2,194,200
Southwest Ramp Expansion to include parcel acquisition
46 $0 $1,994,200 $200,000
FMY84 410812 1 04 2016UPIN: FDOT Item No.: $101,395
Rehab of Runways 13/31 and 5/23
72 $0 $101,395 $0
PFL0003264 09 2016UPIN: FDOT Item No.: $1,500,000
North Quadrant Improvements Phase II
45 $0 $1,280,000 $220,000
PFL0007454 13 2016UPIN: FDOT Item No.: $340,000
Security Cameras
1 $0 $272,000 $68,000
PFL0007901 10 2016UPIN: FDOT Item No.: $1,444,000
Rehab Ramp D
62 $0 $1,235,200 $208,800
PFL0008763 11 2016UPIN: FDOT Item No.: $1,720,000
South Danley & North Airport Road Utility Improvements
20 $0 $1,720,000 $0
2016Yearly Total $7,299,595$0 $6,602,795 $696,800
PFL0009356 14 2017UPIN: FDOT Item No.: $160,000
Replace VASIs with PAPAIs
43 $128,000 $16,000 $16,000
2017Yearly Total $160,000$128,000 $16,000 $16,000
PFL0009356 14 2018UPIN: FDOT Item No.: $940,000
Replace VASIs with PAPAIs
43 $752,000 $94,000 $94,000
2018Yearly Total $940,000$752,000 $94,000 $94,000
Transportation Improvement Program FY 2013/14 through FY 2017/18
VI - 4

WORK PROGRAM ONLINE - AIRPORT
CAPITAL IMPROVEMENT PLAN SUMMARY Page 1 of 47/10/2012
Local ID:Southwest Florida International Airport
Lee County Port Authority
12-0135
03198.2*A
Airport:
Sponsor: Sponsor ID:
NPIAS No.:
Site No.:
RSW
RSW
Sponsor Sponsor YearProject Description:
Priority Sponsor Requested Funding Breakdown
Federal State LocalFAA
PFL0001369 420652 1 04 2013UPIN: FDOT Item No.: $16,250,804
Design and construction of Runway 6R/24L and associated support facilities.
64 $0 $8,125,402 $8,125,402
PFL0003816 03 2013UPIN: FDOT Item No.: $3,000,000
Design and Construct ATCT and TRACON
0 $0 $1,500,000 $1,500,000
PFL0003821 418425 1 10 2013UPIN: FDOT Item No.: $2,025,000
Expand Terminal Entrance Road
48 $0 $0 $2,025,000
PFL0006549 410814 1 12 2013UPIN: FDOT Item No.: $367,500
Purchase Structural Fire Truck
50 $0 $92,500 $275,000
PFL0007897 14 2013UPIN: FDOT Item No.: $151,993
Stucco Refurbishment
45 $0 $0 $151,993
PFL0008764 05 2013UPIN: FDOT Item No.: $3,776,040
Remediation of Hazardous Wildlife Areas
61 $0 $0 $3,776,040
PFL0008769 06 2013UPIN: FDOT Item No.: $1,500,000
FIDS Upgrade
41 $1,125,000 $187,500 $187,500
PFL0009358 11 2013UPIN: FDOT Item No.: $100,000
Fiber System Upgrades
20 $0 $0 $100,000
PFL0009730 07 2013UPIN: FDOT Item No.: $5,000,000
BHS Improvements Phase I
41 $0 $0 $5,000,000
RSW59 430000 1 09 2013UPIN: FDOT Item No.: $668,798
North Property Utilities and Roads
45 $0 $334,399 $334,399
2013Yearly Total $32,840,135$1,125,000 $10,239,801 $21,475,334
PFL0001369 420652 1 04 2014UPIN: FDOT Item No.: $2,477,645
Design and construction of Runway 6R/24L and associated support facilities.
64 $0 $0 $2,477,645
Transportation Improvement Program FY 2013/14 through FY 2017/18
VI - 5

PFL0003816 03 2014UPIN: FDOT Item No.: $14,517,184
Design and Construct ATCT and TRACON
0 $0 $7,258,592 $7,258,592
PFL0007897 14 2014UPIN: FDOT Item No.: $566,352
Stucco Refurbishment
45 $0 $0 $566,352
PFL0008764 05 2014UPIN: FDOT Item No.: $2,300,000
Remediation of Hazardous Wildlife Areas
61 $0 $0 $2,300,000
PFL0009697 15 2014UPIN: FDOT Item No.: $2,000,000
Terminal Security Checkpoint Modifications
1 $1,600,000 $200,000 $200,000
2014Yearly Total $21,861,181$1,600,000 $7,458,592 $12,802,589
PFL0003816 03 2015UPIN: FDOT Item No.: $12,000,000
Design and Construct ATCT and TRACON
0 $0 $6,000,000 $6,000,000
PFL0003821 418425 1 10 2015UPIN: FDOT Item No.: $2,917,000
Expand Terminal Entrance Road
48 $0 $2,917,000 $0
PFL0007897 14 2015UPIN: FDOT Item No.: $144,911
Stucco Refurbishment
45 $0 $0 $144,911
PFL0009360 21 2015UPIN: FDOT Item No.: $10,000
Airside Pavement Rehabilitation
68 $0 $5,000 $5,000
PFL0009533 16 2015UPIN: FDOT Item No.: $114,000
Solar ARFF
60 $0 $0 $114,000
PFL0009697 15 2015UPIN: FDOT Item No.: $2,000,000
Terminal Security Checkpoint Modifications
1 $1,600,000 $200,000 $200,000
2015Yearly Total $17,185,911$1,600,000 $9,122,000 $6,463,911
PFL0001369 420652 1 04 2016UPIN: FDOT Item No.: $16,541,647
Design and construction of Runway 6R/24L and associated support facilities.
64 $0 $0 $16,541,647
PFL0003816 03 2016UPIN: FDOT Item No.: $16,000,000
Design and Construct ATCT and TRACON
0 $0 $8,000,000 $8,000,000
PFL0007897 14 2016UPIN: FDOT Item No.: $166,657
Stucco Refurbishment
45 $0 $0 $166,657
PFL0008773 17 2016UPIN: FDOT Item No.: $400,000
Realign Chamberline Parkway
23 $0 $200,000 $200,000
Transportation Improvement Program FY 2013/14 through FY 2017/18
VI - 6

PFL0009360 21 2016UPIN: FDOT Item No.: $590,000
Airside Pavement Rehabilitation
68 $0 $295,000 $295,000
PFL0009533 16 2016UPIN: FDOT Item No.: $750,000
Solar ARFF
60 $0 $0 $750,000
PFL0009697 15 2016UPIN: FDOT Item No.: $20,000,000
Terminal Security Checkpoint Modifications
1 $1,600,000 $9,200,000 $9,200,000
RSW61 18 2016UPIN: FDOT Item No.: $2,250,000
Pavement Rehabilitation of Roads
23 $0 $1,125,000 $1,125,000
2016Yearly Total $56,698,304$1,600,000 $18,820,000 $36,278,304
PFL0000265 20 2017UPIN: FDOT Item No.: $300,000
Rehabilitate North Parking Lots
22 $0 $0 $300,000
PFL0001369 420652 1 04 2017UPIN: FDOT Item No.: $16,541,647
Design and construction of Runway 6R/24L and associated support facilities.
64 $0 $0 $16,541,647
PFL0004216 13 2017UPIN: FDOT Item No.: $1,544,736
Purchase ARFF Crash Vehicle
98 $0 $772,368 $772,368
PFL0007458 08 2017UPIN: FDOT Item No.: $15,000,000
BHS Expansion
41 $0 $0 $15,000,000
PFL0007459 19 2017UPIN: FDOT Item No.: $400,000
Expand Employee Parking Lot
23 $0 $0 $400,000
PFL0007897 14 2017UPIN: FDOT Item No.: $537,674
Stucco Refurbishment
45 $0 $0 $537,674
PFL0008773 17 2017UPIN: FDOT Item No.: $3,000,000
Realign Chamberline Parkway
23 $0 $1,500,000 $1,500,000
PFL0009360 21 2017UPIN: FDOT Item No.: $6,150,000
Airside Pavement Rehabilitation
68 $0 $3,075,000 $3,075,000
PFL0009697 15 2017UPIN: FDOT Item No.: $20,000,000
Terminal Security Checkpoint Modifications
1 $1,600,000 $9,200,000 $9,200,000
RSW61 18 2017UPIN: FDOT Item No.: $6,600,000
Pavement Rehabilitation of Roads
23 $0 $3,300,000 $3,300,000
2017Yearly Total $70,074,057$1,600,000 $17,847,368 $50,626,689
Transportation Improvement Program FY 2013/14 through FY 2017/18
VI - 7

PFL0000265 20 2018UPIN: FDOT Item No.: $7,000,000
Rehabilitate North Parking Lots
22 $0 $0 $7,000,000
PFL0001369 420652 1 04 2018UPIN: FDOT Item No.: $16,541,646
Design and construction of Runway 6R/24L and associated support facilities.
64 $0 $0 $16,541,646
PFL0007459 19 2018UPIN: FDOT Item No.: $10,000,000
Expand Employee Parking Lot
23 $0 $0 $10,000,000
PFL0007897 14 2018UPIN: FDOT Item No.: $183,772
Stucco Refurbishment
45 $0 $0 $183,772
2018Yearly Total $33,725,418$0 $0 $33,725,418
Transportation Improvement Program FY 2013/14 through FY 2017/18
VI - 8

PHASE FUND MANAGED BY LESS THAN
2014 2013/14 2014/15 2015/16 2016/17 2017/18 GREATER
THAN 2018 ALL YEARS FPN: 4295111 CAP DPTO 0 0 0 772,368 0 0 0 772,368 PROJECT: LEE COUNTY PORT AUTHORITY - CAP LF 0 0 0 772,368 0 0 0 772,368 Southeast Florida International Airport TOTAL 0 0 0 1,544,736 0 0 0 1,544,736 DESC. Aviation Safety Project PROJ. LENGTH: 0.000 BEGIN MILE POST: 0.000 END MILE POST: 0.000 COMMENTS: SISPurchase ARFF Crash Vehicle
LRTP REFERENCE:
PHASE FUND MANAGED BY LESS THAN
2014 2013/14 2014/15 2015/16 2016/17 2017/18 GREATER
THAN 2018 ALL YEARS FPN: 4309821 CAP DDR 0 0 5,800 100,000 0 0 0 105,800 PROJECT: PAGE FIELD AIRPORT CAPITAL CAP FAA 0 0 137,750 2,375,000 0 0 0 2,512,750 Improvement CAP LF 0 0 1,450 25,000 0 0 0 26,450 DESC. Aviation Capacity Project TOTAL 0 0 145,000 2,500,000 0 0 0 2,645,000 PROJ. LENGTH: 0.000 BEGIN MILE POST: 0.000 END MILE POST: 0.000 COMMENTS: NON-SIS; Design and Construct SW Ramp to Include Aquistion
LRTP REFERENCE:
PHASE FUND MANAGED BY LESS THAN
2014 2013/14 2014/15 2015/16 2016/17 2017/18 GREATER
THAN 2018 ALL YEARS FPN: 4313681 CAP DDR 0 0 0 10,000 91,395 0 0 101,395 PROJECT: PAGE FIELD AIRPORT CAPITAL CAP FAA 0 0 0 50,000 4,000,800 0 0 4,050,800 Improvements CAP LF 0 0 0 10,000 91,395 0 0 101,395 DESC. Aviation Preservation Project TOTAL 0 0 0 70,000 4,183,590 0 0 4,253,590 PROJ. LENGTH: 0.000 BEGIN MILE POST: 0.000 END MILE POST: 0.000 COMMENTS: NON-SIS
LRTP REFERENCE:
Transportation Improvement Program FY 2013/14 through FY 2017/18
VI - 9

PHASE FUND MANAGED BY LESS THAN
2014 2013/14 2014/15 2015/16 2016/17 2017/18 GREATER
THAN 2018 ALL YEARS FPN: 4309791 CAP DDR 0 0 0 1,125,000 2,550,000 1,000,000 0 4,675,000 PROJECT: SOUTHWEST FLORIDA INTERNATIONAL CAP LF 0 0 0 1,125,000 2,550,000 1,000,000 0 4,675,000 Airport Capital Improvement TOTAL 0 0 0 2,250,000 5,100,000 2,000,000 0 9,350,000 DESC. Aviation Preservation Project PROJ. LENGTH: 0.000 BEGIN MILE POST: 0.000 END MILE POST: 0.000 COMMENTS: SIS; Pavement Rehabilitation of Roads
LRTP REFERENCE:
PHASE FUND MANAGED BY LESS THAN
2014 2013/14 2014/15 2015/16 2016/17 2017/18 GREATER
THAN 2018 ALL YEARS FPN: 4314131 CAP GMR 0 0 0 0 875,000 0 0 875,000 PROJECT: SOUTHWEST FLORIDA INTERNATIONAL CAP LF 0 0 0 0 875,000 0 0 875,000 Airport Capital Improvement TOTAL 0 0 0 0 1,750,000 0 0 1,750,000 DESC. Aviation Capacity Project PROJ. LENGTH: 0.000 BEGIN MILE POST: 0.000 END MILE POST: 0.000 COMMENTS: SIS
LRTP REFERENCE:
PHASE FUND MANAGED BY LESS THAN
2014 2013/14 2014/15 2015/16 2016/17 2017/18 GREATER
THAN 2018 ALL YEARS FPN: 4206521 CAP DDR 2,877,008 178,462 5,837,606 8,000,000 0 0 0 16,893,076 PROJECT: SOUTHWEST FLORIDA INTERNATIONAL CAP DIS 5,523,000 0 0 0 0 8,270,823 0 13,793,823 Airport Capital Improvement CAP DPTO 1,686,111 7,080,130 162,394 0 0 0 0 8,928,635 DESC. Aviation Preservation Project CAP GMR 9,227,000 0 0 0 0 0 0 9,227,000 PROJ. LENGTH: 0.000 CAP LF 19,127,008 7,258,592 6,000,000 8,000,000 0 8,270,823 0 48,656,423 BEGIN MILE POST: 0.000 CAP LFR 627,008 0 0 0 0 0 0 627,008 END MILE POST: 0.000 TOTAL 39,067,135 14,517,184 12,000,000 16,000,000 0 16,541,646 0 98,125,965 COMMENTS: SIS; SEQ01=Preliminary Dsgn, Geotechnical, Survey and Dsgn
LRTP REFERENCE:
Transportation Improvement Program FY 2013/14 through FY 2017/18
VI - 10

PHASE FUND MANAGED BY LESS THAN
2014 2013/14 2014/15 2015/16 2016/17 2017/18 GREATER
THAN 2018 ALL YEARS FPN: 4313671 CAP DDR 0 0 5,000 141,222 505,862 0 0 652,084 PROJECT: SOUTHWEST FLORIDA INT'L ARP CAP DPTO 0 0 0 153,778 2,569,138 0 0 2,722,916 Parallel Runway 6R/24L Phase 1 CAP LF 0 0 5,000 295,000 3,075,000 0 0 3,375,000 DESC. Aviation Capacity Project TOTAL 0 0 10,000 590,000 6,150,000 0 0 6,750,000 PROJ. LENGTH: 0.000 BEGIN MILE POST: 0.000 END MILE POST: 0.000 COMMENTS: SIS
LRTP REFERENCE:
PHASE FUND MANAGED BY LESS THAN
2014 2013/14 2014/15 2015/16 2016/17 2017/18 GREATER
THAN 2018 ALL YEARS FPN: 4313631 CAP DPTO 0 0 0 0 272,000 0 0 272,000 PROJECT: PAGE FIELD AIRPORT CAPITAL IMPROV. CAP LF 0 0 0 0 68,000 0 0 68,000
TOTAL 0 0 0 0 340,000 0 0 340,000 DESC. Aviation Security Project PROJ. LENGTH: 0.000 BEGIN MILE POST: 0.000 END MILE POST: 0.000 COMMENTS: NON-SIS
LRTP REFERENCE:
PHASE FUND MANAGED BY LESS THAN
2014 2013/14 2014/15 2015/16 2016/17 2017/18 GREATER
THAN 2018 ALL YEARS FPN: 4300001 CAP DDR 415,601 0 0 0 0 2,417,747 0 2,833,348 PROJECT: LEE COUNTY PORT AUTHORITY CAP DPTO 0 0 0 0 0 2,582,253 0 2,582,253 Southeast Florida Int'l Airport CAP LF 415,601 0 0 0 0 5,000,000 0 5,415,601 DESC. Aviation Safety Project TOTAL 831,202 0 0 0 0 10,000,000 0 10,831,202 PROJ. LENGTH: 0.000 BEGIN MILE POST: 0.000 END MILE POST: 0.000 COMMENTS: SIS; Capital Improvements
LRTP REFERENCE:
Transportation Improvement Program FY 2013/14 through FY 2017/18
VI - 11

PHASE FUND MANAGED BY LESS THAN
2014 2013/14 2014/15 2015/16 2016/17 2017/18 GREATER
THAN 2018 ALL YEARS FPN: 4304911 CAP DDR 7,000 0 0 0 0 935,328 0 942,328 PROJECT: PAGE FIELD GENERAL CAP DPTO 0 0 0 0 280,000 0 0 280,000 Aviation Airport CAP FAA 175,000 0 0 0 0 0 0 175,000 DESC. Aviation Preservation Project CAP LF 1,750 0 0 70,000 238,832 0 0 310,582 PROJ. LENGTH: 0.000 TOTAL 183,750 0 0 70,000 518,832 935,328 0 1,707,910 BEGIN MILE POST: 0.000 END MILE POST: 0.000 COMMENTS: NON-SIS
LRTP REFERENCE:
AVIATION MANAGED BY LESS THAN
2014 2013/14 2014/15 2015/16 2016/17 2017/18 GREATER
THAN 2018 ALL YEARS TOTAL $ 39,898,337 $ 14,517,184 $ 12,155,000 $ 22,954,736 $ 17,523,590 $ 28,541,646 $ - $ 135,590,493
Transportation Improvement Program FY 2013/14 through FY 2017/18
VI - 12

SECTION VII
BICYCLE PEDESTRIAN ACTIVITIES This section includes the projects funded through the Transportation Enhancement Activity (TEA) Program, and identified in the State Tentative Work Program for fiscal years 2013/14 through 2017/18. Projects funded through this program in FDOT District One are further divided into Local and Regional TEA projects. The evaluation methodology used to rank the local TEA proposals are included at the beginning of this section, followed by a list of the MPO’s adopted local TEA priorities from 2011, and the regional TEA priorities that were adopted jointly by the Lee County and the Collier MPOs. This section also includes the sidewalk projects that are funded through the Safe Route to School (SRTS) Program and the bicycle pedestrian projects funded through the Lee MPO’s own Multimodal Transportation Enhancement Box funds. The latter is set at $5,000,000 a year, and also funds transit and congestion management projects. The bicycle pedestrian projects for these programs are determined by the MPO’s Countywide Bicycle Pedestrian Master Plan. Candidate projects on arterial and collector roads must be identified in the Primary Network and the Secondary Network. There is also general language in the Master Plan that allows projects on local roads to be considered for SRTS and Local TEA Program funds while not specifically calling out what those projects are. For consideration of Regional TEA Program funds, candidate projects must be identified in the Lee County and Collier MPO Regional Pathways Map as stated in the Master Plan. In addition to the stand alone bicycle pedestrian projects, every effort is made by FDOT to accommodate such facilities during roadway projects whether they are new construction, reconstruction or RRR projects as per its Plans Preparation Manual. Similarly road projects undertaken by the local jurisdictions in Lee County are driven by Complete Streets Policy adopted by the Lee County Board of County Commissioners, and a MPO resolution that was adopted in 2009 that calls for FDOT and local governments to accommodate bicycle pedestrian and transit facilities in roadway design and construction.
Transportation Improvement Program FY 2013/14 through FY 2017/18
VII - 1

Transportation Improvement Program FY 2013/14 through FY 2017/18
VII - 2

TRANSPORTATION ENHANCEMENT ACTIVITY PRIORITIES
Evaluation Criteria Bicycle /Pedestrian Projects Notes:
1. Connection to a similar facility: A project may connect to a similar facility on the same street or on intersecting streets. A similar facility may be an existing facility or a programmed project. A bike path and a sidewalk shall be treated as similar facilities, but such a connection will be awarded less credit than bike path-to bike path or sidewalk-to-sidewalk connections. 10 points Bike Path to Bike Path, Bike Lane to Bike Lane or Paved Shoulder, Paved Shoulder to Paved Shoulder or Bike Lane, or Sidewalk to Sidewalk
at both ends. 7 points A Sidewalk project connects with a Bike Path at both ends or vice versa, or a Sidewalk project connects with Bike Path at one end and a
Sidewalk on the other end, or a Bike Path connects with a Bike Path at one end and a Sidewalk at the other end. 5 points Bike Path to Bike Path, Bike Lane to Bike Lane or Paved Shoulder, Paved Shoulder to Paved Shoulder or Bike Lane, or Sidewalk to Sidewalk
at one end. 2 points Bike Path to Sidewalk, Bike Lane to Sidewalk, Paved Shoulder to Sidewalk at one end.
2. Reduction of School Busing Needs: The project will reduce busing for Kindergarten to 6th grade school students by eliminating hazardous
conditions within one mile of a school along the project route. This information will be provided by the Lee County School District. 10 points Project eliminates the need for a school bus route as the users can now walk or bike to school. Five (extra) points for each additional school
bus route. 8 points Busing some students is no longer required, but a bus route is not eliminated. 4 points Project is one of several segments needed to reduce busing. 0 points Project has no impact on busing.
3. Access to Bicycle/Pedestrian Attractions: Attractions shall include parks and other public facilities; and retail/service development.
Retail/service development may include shopping centers with or without an anchor tenant, or free-standing stores and consumer services like
Transportation Improvement Program FY 2013/14 through FY 2017/18
VII - 3

and Eckerd Pharmacy, a coin laundry, or a convenience store. It may also include a commercial district with a strip of retail stores and consumer services without an anchor store. Attractions do not include schools.
10 points Attractions adjacent to the project 8 points Attractions within 1000’ of the project 4 points Attractions within 2000’ of the project
4. Housing Units: The number of housing units accessible by pedestrian and cyclists within 2000 feet of project will be the raw score for the
project. Inaccessibility may be as a result of barriers such as canals and gated communities within the 2000 feet buffer or the lack of connecting public ways. The project sponsor shall provide housing unit data.
1 point for every 400 housing unit for a maximum of 10 points
5. Housing Units without Vehicles: The percentage of occupied housing units without any vehicles available within the Census tract traversed by
the project in the 2000 Census for which tract data are available will be raw score for the project. For projects located in more than one Census tract, the percentages shall be weighted by the percentage of the project length within each tract. Where a project follows a tract boundary, half the weight shall be given to each tract. MPO staff will obtain this information on its own.
1 point for every 4% for a maximum of 10 points
6. Local Financial Participation: A project will be awarded points in proportion to an applicant’s percentage of total financial participation.
10 points >75% 8 points 51-75% 6 points 26-50% 4 points 11-25% 2 points 1-10%
7. Bicycle/Pedestrian Crash Data: The total bicycle and pedestrian crashes for the last three years within the project limits shall be the raw score
for the project. The project sponsor shall provide the data for the bicycle/pedestrian crashes in the last three years.
1 point for every one accident for a maximum of 10 points
8. Speed Limit: Points will be awarded to a project depending upon the speed limit of the roadway along which the bicycle/pedestrian facility is to be located.
Transportation Improvement Program FY 2013/14 through FY 2017/18
VII - 4

5 points > 50 mph 4 points 45 mph 2.5 points 40 mph 1.5 points 35 mph 0.5 points 30 mph
9. Traffic Volume: The Annual Average Daily Traffic (AADT) of the adjacent roadway shall be the raw score for the project. The project sponsor
shall provide the AADT from Lee County’s 2009 Traffic Count Report, and identify the location where the count was taken.
1 point for every 3000 AADT for a maximum of 10 points
10. Total Shoulder and Lane Width: The combined existing width of the outside (curb) lane and paved shoulder shall be taken into account while awarding points to a project. The width will be measured from the inside strip of the outside (curb) lane (or the centerline, for unstriped roads) to the pavement edge or curb face.
5 points <14 Ft 2.5 points 14-18 Ft 0 points >18 Ft
11. Proximity to Schools: Points shall be given based upon how far students have to walk or bicycle to school. If there is more than one school
within one mile, use the school yielding the highest score.
Elementary School 30 points School adjacent to the project 15 points School within ½ a mile of the project 12 points School within 1 mile of the project
Middle School 15 points School adjacent to the project
12 points School within ½ a mile of the project 6 points School within 1 mile of the project
High School 10 points School adjacent to the project 8 points School within ½ a mile of the project 4 points School within 1 mile of the project
Transportation Improvement Program FY 2013/14 through FY 2017/18
VII - 5

12. Intermodal Connections: To qualify as an intermodal connector, a project must either follow or cross a Lee Tran bus route. The number of buses per week in both directions on all such routes will be the raw score for the project. Half as many credits will be given to the project if it extends an existing connection to a bus route within 1000 feet of the project.
1 point for every 96 trips (both directions) for a maximum of 10 points
* K-8 schools are scored as elementary schools, while 6-12 schools are scored as middle schools. K-8 schools include Sanibel, School, Michigan Montessori and North Fort Myers Academy. 6-12 schools are Riverdale High and Lee High.
Transportation Improvement Program FY 2013/14 through FY 2017/18
VII - 6

Local TE/Box and SRTS Priorities ‐Adopted June 22, 2012
Capital Cost Planning Cost
PE/Survey Cost
Total Construction
Cost
Priority Order Applicant Project Limits Improvements Phase SE Box SRTS
LeeTran
Purchase of Diesel‐Electric Hybrid or Clean Burning Heavy Duty Transit Buses CAP $1,500,000 X 1
FM Colonial Blvd
Metro Pkwy to Veronica Shoemaker Pkwy
Add Shared Use Path on north side + Bus Shelter
PE + CST * $ 392,503 X X 2
MPO McGregor Blvd
Brentwood Pkwy to Tanglewood Pkwy
Add sidewalk (east side)
PE + CST * $ 146,116 X X 3
MPO SR 78 @ Santa Barbara Blvd
Add a second 550' long WB left turn lane on SR 78 to SB Santa Barbara
PE + CST $66,000 $ 165,787 X 4
MPO SR 78 @ Chiquita Blvd
Extend the 450' long existing WB left turn lane on Pine Island Rd to SB Chiquita Blvd to 590'
PE + CST $57,598 $ 131,160 X 5
FMB Island‐wide Planning Study Bike/Ped Planning Study PL $90,000 X X 6
CC El Dorado/Del Prado Coronado to Willington Sidewalks (both sides) CST $ 384,407 X X 7
CC Palm Tree/Wildwood Pkwy
SE 47TH Terrace to Country Club Sidewalks (both sides) CST $ 981,989 X 8
Transportation Improvement Program FY 2013/14 through FY 2017/18
VII - 7

CC Skyline Blvd Gleason to Trafalgar Sidewalk (north side) CST $ 342,737 X 9
FM Franklin Street Ford to Highlands Sidewalk (north side) CST $ 183,497 X 10
FMB Connecticut St. Estero Blvd. to Estero Bay Sidewalk (6' east side) CST * * X 11
FM Jeffcott St. Ford St to Highlands St. Sidewalk (north side) CST $ 224,731 X 12
FM Stella St. Ford St to Highlands St. Sidewalk (north side) CST $ 243,107 X 13
FM Katherine St. Ford St to Highlands St. Sidewalk (north side) CST $ 247,109 X 14
CC Old Burnt Store Rd.
Embers Pkwy to Tropicana Parkway Bike Path CST $ 279,849 X 15
CC Sands Blvd.
ElDorado Pkwy to Beach Pkwy Sidewalk (both sides) CST $ 661,002 X 16
Cape Traffic Signal Coordination
All City of Cape Coral owned or maintained traffic signals
Traffic signal retiming and coordination in 8 corridors with City owned/maintained traffic signals CST 250,000 X 17
LC Leeland Heights Blvd.
Lee Blvd to Homestead Rd. Sidewalk (north side) CST * $ 849,092 X X X 18
FM Winkler/Six Mile/Challenger Sidewalks CST * * X X 19
CC SW 32nd/SW 3rd/SW 37th Sidewalks CST * * X X 20 LC Queens/Richmond Sidewalks CST * $ 333,823 X X 21 FM Sunset/Moreno/Canelo Sidewalks CST 75308 * X X 22
* Awaiting FDOT Cost Estimate
Transportation Improvement Program FY 2013/14 through FY 2017/18
VII - 8

Table 1 PROPOSED JOINT REGIONAL ENHANCEMENT PRIORITIES FOR FY 2017/18 - Adopted May 2012
MPO Priority Project From To Proposed Improvements Next Unfunded Phase Cost
1 US 41 River of Grass Greenway CR 92 Marsh Trail Trailhead 12' Pathway (North Side) Design $700,000
2 Abel Canal PD&E Study Joel Blvd Harnes Marsh Pathway on Canal Right of Way PD&E Study $300,000
3 SR 78 Shared Use Path and Bike Lanes East of Park 78 Drive Durrance Road 10' Shared Use Path and 5' wide Bike Lanes Design Build $1,111,859
4 Winkler Canal Feasibility Study McGregor Avenue Cleveland Avenue Pathway on Canal Right of Way Feasibility Study $250,000
Transportation Improvement Program FY 2013/14 through FY 2017/18
VII - 9

PHASE FUND MANAGED BY LESS THAN 2014 2013/14 2014/15 2015/16 2016/17 2017/18 GREATER THAN
2018 ALL YEARS FPN: 4281061 CST ACTU CC 0 571,000 0 0 0 0 0 571,000 PROJECT: ACADEMY BLVD. TOTAL 0 571,000 0 0 0 0 0 571,000
from Nicholas Parkway to Veterans Parkway DESC. Sidewalk PROJ. LENGTH: 1.700 BEGIN MILE POST: 0.000 END MILE POST: 1.700 COMMENTS: NON-SIS; Sidewalks on both sides.
LRTP REFERENCE: Table 7, Appendix F, Page 9
PHASE FUND MANAGED BY LESS THAN 2014 2013/14 2014/15 2015/16 2016/17 2017/18 GREATER THAN
2018 ALL YEARS FPN: 4313231 PE TALT FDOT 0 0 0 50,000 0 0 0 50,000 PROJECT: BERT DRIVE CST TALT FDOT 0 0 0 0 189,044 0 0 189,044
from Michigan Ave. to Ballard Rd. TOTAL 0 0 0 50,000 189,044 0 0 239,044 DESC. Sidewalk PROJ. LENGTH: 0.001 BEGIN MILE POST: 0.000 END MILE POST: 0.001 COMMENTS: NON-SIS; Sidewalk on west side.
LRTP REFERENCE: Table 7, Appendix F, Page 9
Transportation Improvement Program FY 2013/14 through FY 2017/18
VII - 10

PHASE FUND MANAGED BY LESS THAN 2014 2013/14 2014/15 2015/16 2016/17 2017/18 GREATER THAN
2018 ALL YEARS FPN: 4308911 CST LFP CC 0 0 0 77,870 0 0 0 77,870 PROJECT: CAPE CORAL PKWY CST SU CC 0 0 0 402,453 0 0 0 402,453
from Dead End to Agualinda BLVD. TOTAL 0 0 0 480,323 0 0 0 480,323 DESC. Sidewalk PROJ. LENGTH: 0.893 BEGIN MILE POST: 0.000 END MILE POST: 0.893 COMMENTS: NON-SIS; Sidewalk on both sides.
LRTP REFERENCE: Appendix E, Page 107, Project 92
PHASE FUND MANAGED BY LESS THAN 2014 2013/14 2014/15 2015/16 2016/17 2017/18 GREATER THAN
2018 ALL YEARS FPN: 4313301 PE TALU CC 0 0 65,000 0 0 0 0 65,000 PROJECT: CAPE CORAL SIDEWALKS CST LFP CC 0 0 0 0 81,077 0 0 81,077 DESC. Sidewalk CST TALU CC 0 0 0 0 229,425 0 0 229,425 PROJ. LENGTH: 0.617 TOTAL 0 0 65,000 0 310,502 0 0 375,502 BEGIN MILE POST: 5.191 END MILE POST: 5.808 COMMENTS: NON-SIS; Sidewalks are on Diplomat/NE 16th/NE 10th
LRTP REFERENCE: Appendix E, Page 41
PHASE FUND MANAGED BY LESS THAN 2014 2013/14 2014/15 2015/16 2016/17 2017/18 GREATER THAN
2018 ALL YEARS FPN: 4308921 PE TALU CC 0 0 75,000 0 0 0 0 75,000 PROJECT: CHIQUITA BLVD CST LFP CC 0 0 0 9,889 0 0 0 9,889 from SR 78 (Pine Island) NW 4th St. CST SU CC 0 0 0 265,650 0 0 0 265,650 DESC. Sidewalk TOTAL 0 0 75,000 275,539 0 0 0 350,539 PROJ. LENGTH: 1.403 BEGIN MILE POST: 6.252 END MILE POST: 7.655 COMMENTS: NON-SIS; Sidewalk is on east side.
LRTP REFERENCE: Appendix E, Page 41
Transportation Improvement Program FY 2013/14 through FY 2017/18
VII - 11

PHASE FUND MANAGED BY LESS THAN 2014 2013/14 2014/15 2015/16 2016/17 2017/18 GREATER THAN
2018 ALL YEARS FPN: 4308901 CST LFP CC 0 94,996 0 0 0 0 0 94,996 PROJECT: CHIQUITA BLVD. CST SU CC 0 75,436 0 0 0 0 0 75,436 from SW 47th Terrace to SW 32nd Terrace CST TALU CC 0 569777 0 0 0 0 0 569,777 DESC. Sidewalk TOTAL 0 740,209 0 0 0 0 0 740,209 PROJ. LENGTH: 2.055 BEGIN MILE POST: 1.013 END MILE POST: 3.068 COMMENTS: NON-SIS; Sidewalks are on both sides.
LRTP REFERENCE: Appendix E, Page 41
PHASE FUND MANAGED BY LESS THAN 2014 2013/14 2014/15 2015/16 2016/17 2017/18 GREATER THAN
2018 ALL YEARS FPN: 4308891 CST LFP CC 0 0 0 29,363 0 0 0 29,363 PROJECT: DIPLOMAT PKWY CST SU CC 0 0 0 349,140 0 0 0 349,140 from Del Prado Blvd. to NE 24th Ave. TOTAL 0 0 0 378,503 0 0 0 378,503 DESC. Sidewalk PROJ. LENGTH: 1.036 BEGIN MILE POST: 6.146 END MILE POST: 7.182 COMMENTS: NON-SIS; Sidewalks are on both sides.
LRTP REFERENCE: Appendix E, Page 41
PHASE FUND MANAGED BY LESS THAN 2014 2013/14 2014/15 2015/16 2016/17 2017/18 GREATER THAN
2018 ALL YEARS FPN: 4309241 PE SA FDOT 0 0 89,423 0 0 0 0 89,423 PROJECT: FRANKLIN PARK CST SA FDOT 0 0 0 295,245 0 0 0 295,245 Elementary SRTS Safety Sidewalks TOTAL 0 0 89,423 295,245 0 0 0 384,668 DESC. Sidewalk PROJ. LENGTH: 0.492 BEGIN MILE POST: 0.000 END MILE POST: 0.492 COMMENTS: NON-SIS; Sidewalk is on west side of Midway Avenue from Canal Street to Edison Avenue
LRTP REFERENCE: Appendix E, Page 67
Transportation Improvement Program FY 2013/14 through FY 2017/18
VII - 12

PHASE FUND MANAGED BY LESS THAN 2014 2013/14 2014/15 2015/16 2016/17 2017/18 GREATER THAN
2018 ALL YEARS FPN: 4313241 PE TALT FDOT 0 0 0 0 70,000 0 0 70,000 PROJECT: JEFFCOTT STREET CST TALT FDOT 0 0 0 0 0 224,000 224,000 from US 41 (SR 45) to Fowler Street TOTAL 0 0 0 0 70,000 0 0 294,000 DESC. Sidewalk PROJ. LENGTH: 0.001 BEGIN MILE POST: 0.000 END MILE POST: 0.001 COMMENTS: NON-SIS; Sidewalk is on west side.
LRTP REFERENCE: Table 7, Appendix F, Page 9
PHASE FUND MANAGED BY LESS THAN 2014 2013/14 2014/15 2015/16 2016/17 2017/18 GREATER THAN
2018 ALL YEARS FPN: 4313211 PDE LF FM 0 0 0 0 80,000 0 0 80,000 PROJECT: JOHN YARBOROUGH LINEAR PARK PDE TALT FM 0 0 0 0 170,000 0 0 170,000 Phase IV PE/ROW/CST FM 0 0 0 0 0 0 1,200,000 1,200,000 DESC. Bike Path/Trail TOTAL 0 0 0 0 250,000 0 1,200,000 1,450,000 PROJ. LENGTH: 0.001 BEGIN MILE POST: 0.000 END MILE POST: 0.001 COMMENTS: NON-SIS; The PD&E study project limits are from north of Colonial to North Colonial Waterway
LRTP REFERENCE: Table 7, Appendix F, Page 9
Transportation Improvement Program FY 2013/14 through FY 2017/18
VII - 13

PHASE FUND MANAGED BY LESS THAN 2014 2013/14 2014/15 2015/16 2016/17 2017/18 GREATER THAN
2018 ALL YEARS FPN: 4282531 PE SA FDOT 15,000 0 0 0 0 0 0 15,000 PROJECT: JAMES STEPHENS INT'T PE SR2S FDOT 40,347 0 0 0 0 0 0 40,347 Academy Sidewalk Safe Routes to School CST TALU FDOT 0 98,307 0 0 0 0 0 98,307 DESC. Sidewalk TOTAL 55,347 98,307 0 0 0 0 0 153,654 PROJ. LENGTH: 0.001 BEGIN MILE POST: 0.000 END MILE POST: 0.001 COMMENTS: NON-SIS; Proposed sidewalk is on west side of Marsh Ave from New York Avenue to Arlington Ave.
LRTP REFERENCE: Appendix E, Page 67
PHASE FUND MANAGED BY LESS THAN 2014 2013/14 2014/15 2015/16 2016/17 2017/18 GREATER THAN
2018 ALL YEARS FPN: 4281111 CST TALT CC 0 520,000 0 0 0 0 0 520,000 PROJECT: OASIS BLVD - GLEASON TOTAL 0 520,000 0 0 0 0 0 520,000 from Beach Parkway to Surfside Blvd. DESC. Sidewalk PROJ. LENGTH: 1.291 BEGIN MILE POST: 0.000 END MILE POST: 1.291 COMMENTS: NON-SIS; Proposed sidewalk is on both sides
LRTP REFERENCE: Table 7, Appendix F, Page 9
Transportation Improvement Program FY 2013/14 through FY 2017/18
VII - 14

PHASE FUND MANAGED BY LESS THAN 2014 2013/14 2014/15 2015/16 2016/17 2017/18 GREATER THAN
2018 ALL YEARS FPN: 4309211 PE SA FDOT 0 0 75,017 0 0 0 0 75,017 PROJECT: ORANGEWOOD ELEMENTARY SRTS CST SA FDOT 0 0 0 176,259 0 0 0 176,259 Safety sidewalks TOTAL 0 0 75,017 176,259 0 0 0 251,276 DESC. Sidewalk PROJ. LENGTH: 0.189 BEGIN MILE POST: 0.000 END MILE POST: 0.189 COMMENTS: NON-SIS; Proposed sidewalk is on east side of Marvaez St. from Winkler Ave to Commercial Dr.
LRTP REFERENCE: Appendix E, Page 67
PHASE FUND MANAGED BY LESS THAN 2014 2013/14 2014/15 2015/16 2016/17 2017/18 GREATER THAN
2018 ALL YEARS FPN: 4313291 CST LF CC 0 0 0 0 20,000 0 0 20,000 PROJECT: SE 8TH STREET CST TALT CC 0 0 0 0 245,568 0 0 245,568
from Cultural Park Blvd to Santa Barbara Blvd. TOTAL 0 0 0 0 265,568 0 0 265,568 DESC. Sidewalk PROJ. LENGTH: 0.001 BEGIN MILE POST: 0.000 END MILE POST: 0.001 COMMENTS: NON-SIS; Proposed sidewalk is on both sides.
LRTP REFERENCE: Table 7, Appendix F, Page 9
Transportation Improvement Program FY 2013/14 through FY 2017/18
VII - 15

PHASE FUND MANAGED BY LESS THAN 2014 2013/14 2014/15 2015/16 2016/17 2017/18 GREATER THAN
2018 ALL YEARS FPN: 4301191 PE DIH FDOT 0 0 15,000 0 0 0 0 15,000 PROJECT: SR 78 PE SU FDOT 0 0 173,498 0 0 0 0 173,498 from US 41 Business to Hart Road CST DIH FDOT 0 0 0 10,920 0 0 0 10,920 DESC. Bike Lane/Sidewalk CST SA FDOT 0 0 0 39,162 0 0 0 39,162
PROJ. LENGTH: 1.157 CST SU FDOT 0 0 0 154,258 0 0 0 154,258 BEGIN MILE POST: 15.858 TOTAL 0 0 188,498 204,340 0 0 0 392,838 END MILE POST: 17.015 COMMENTS: NON-SIS; Proposed sidewalk is on south side.
LRTP REFERENCE: Appendix E, Page 106, Project 69
PHASE FUND MANAGED BY LESS THAN 2014 2013/14 2014/15 2015/16 2016/17 2017/18 GREATER THAN
2018 ALL YEARS FPN: 4298231 DSB DDR FDOT 0 0 0 199,436 0 0 0 199,436 PROJECT: SR 80 DSB DIH FDOT 0 0 0 131,040 0 0 0 131,040 from Orange River Blvd. to CR 80 (Buckingham Rd.) DSB SU FDOT 0 0 0 149,109 0 0 0 149,109 DESC. Bike Path/Trail DSB TALT FDOT 0 0 0 1,165,449 0 0 0 1,165,449
PROJ. LENGTH: 4.946 TOTAL 0 0 0 1,645,034 0 0 0 1,645,034 BEGIN MILE POST: 5.795 END MILE POST: 10.741 COMMENTS: SIS; Proposed bike path is on north side.
LRTP REFERENCE: Appendix E, Page 104, Project 1
PHASE FUND MANAGED BY LESS THAN 2014 2013/14 2014/15 2015/16 2016/17 2017/18 GREATER THAN
2018 ALL YEARS FPN: 4308871 PE DIH FDOT 0 0 0 10,000 0 0 0 10,000 PROJECT: SR 867 (MCGREGOR BLVD.) PE SU FDOT 0 0 0 57,922 0 0 0 57,922 from Royal Palm SQ to CR 884 (Colonial) CST DIH FDOT 0 0 0 0 24,101 0 0 24,101 DESC. Sidewalk CST SU FDOT 0 0 0 0 277,507 0 0 277,507
PROJ. LENGTH: 0.192 TOTAL 0 0 0 67,922 301,608 0 0 369,530 BEGIN MILE POST: 6.293 END MILE POST: 6.485 COMMENTS: NON-SIS; Proposed sidewalk is on east side.
LRTP REFERENCE: Appendix E, Page 41
Transportation Improvement Program FY 2013/14 through FY 2017/18
VII - 16

PHASE FUND MANAGED BY LESS THAN 2014 2013/14 2014/15 2015/16 2016/17 2017/18 GREATER THAN
2018 ALL YEARS FPN: 4313311 CST TALT CC 0 0 0 0 122,712 0 0 122,712 PROJECT: SW 20TH AVENUE TOTAL 0 0 0 0 122,712 0 0 122,712 from Veterans Parkway to 30th Terrace DESC. Sidewalk
PROJ. LENGTH: 0.001 BEGIN MILE POST: 0.000 END MILE POST: 0.001 COMMENTS: NON-SIS; Proposed sidewalk is on east side.
LRTP REFERENCE: Table 7, Appendix F, Page 9
PHASE FUND MANAGED BY LESS THAN 2014 2013/14 2014/15 2015/16 2016/17 2017/18 GREATER THAN
2018 ALL YEARS FPN: 4251321 CST DS FDOT 88 0 0 0 0 0 0 88 PROJECT: US 41 (SR45) CST SA FDOT 0 82,996 0 0 0 0 0 82,996 from Littleton Road to Del Prado Blvd. CST SU FDOT 0 5,155 0 0 0 0 0 5,155 DESC. Sidewalk PE SU FDOT 111,462 0 0 0 0 0 0 111,462
PROJ. LENGTH: 2.031 CST DDR FDOT 0 23,922 0 0 0 0 0 23,922 BEGIN MILE POST: 27.973 CST SA FDOT 0 302,141 0 0 0 0 0 302,141 END MILE POST: 30.004 CST SU FDOT 0 181,631 0 0 0 0 0 181,631
TOTAL 0 507,694 0 0 0 0 0 507,694
COMMENTS: NON-SIS; Proposed sidewalk is on west side.
LRTP REFERENCE: Appendix E, Page 41
Transportation Improvement Program FY 2013/14 through FY 2017/18
VII - 17


PHASE FUND MANAGED BY LESS THAN 2014 2013/14 2014/15 2015/16 2016/17 2017/18 GREATER THAN
2018 ALL YEARS FPN: 4300141 DSB TALT FDOT 0 0 446,062 0 0 0 0 446,062 PROJECT: SANIBEL LIGHTHOUSE TOTAL 0 0 446,062 0 0 0 0 446,062
DESC. Building Repair/Rehabilitation PROJ. LENGTH: 0.000 BEGIN MILE POST: 0.000 END MILE POST: 0.000 COMMENTS: NON-SIS
LRTP REFERENCE: Table 7, Appendix F, Page 9
PHASE FUND MANAGED BY LESS THAN 2014 2013/14 2014/15 2015/16 2016/17 2017/18 GREATER THAN
2018 ALL YEARS FPN: 4332271 PE LFP CC 0 0 89,905 0 0 0 0 89,905 PROJECT: EL DORADO PKWY/DEL PRADO CST LFP CC 0 0 0 70,245 0 0 0 70,245 at Various Locations CST SU CC 0 0 0 375,609 0 0 0 375,609 DESC. Sidewalk TOTAL 0 0 89,905 445,854 0 0 0 535,759 PROJ. LENGTH: 0.925 BEGIN MILE POST: 0.000 END MILE POST: 0.925 COMMENTS: NON-SIS
LRTP REFERENCE: Table 7, Appendix F, Page 9
PHASE FUND MANAGED BY LESS THAN 2014 2013/14 2014/15 2015/16 2016/17 2017/18 GREATER THAN
2018 ALL YEARS FPN: 4332381 PE SU FDOT 0 0 102,137 0 0 0 0 102,137 PROJECT: LEELAND HEIGHTS BLVD CST SA FDOT 0 0 0 517,832 0 0 0 517,832 from Richmond Ave to Homestead Road CST SU FDOT 0 0 0 448,953 0 0 0 448,953 DESC. Sidewalk TOTAL 0 0 102,137 966,785 0 0 0 1,068,922 PROJ. LENGTH: 1.273 BEGIN MILE POST: 16.854 END MILE POST: 17.722 COMMENTS: NON-SIS
LRTP REFERENCE: Table 7, Appendix F, Page 9
Transportation Improvement Program FY 2013/14 through FY 2017/18
VII - 19

PHASE FUND MANAGED BY LESS THAN 2014 2013/14 2014/15 2015/16 2016/17 2017/18 GREATER THAN
2018 ALL YEARS FPN: 4332301 PE LFP CC 0 0 91,685 0 0 0 0 91,685 PROJECT: PALM TREE BLVD. CST LFP CC 0 0 0 127,867 0 0 0 127,867 from SE 47th Terrace To sE 40th Street CST SU CC 0 0 0 383,020 0 0 0 383,020 DESC. Sidewalk TOTAL 0 0 91,685 510,887 0 0 0 602,572 PROJ. LENGTH: 1.009 BEGIN MILE POST: 0.062 END MILE POST: 1.071 COMMENTS: NON-SIS
LRTP REFERENCE: Table 7, Appendix F, Page 9
PHASE FUND MANAGED BY LESS THAN 2014 2013/14 2014/15 2015/16 2016/17 2017/18 GREATER THAN
2018 ALL YEARS FPN: 4328981 PE SA FDOT 0 0 31,271 0 0 0 0 31,271 PROJECT: QUEENS DRIVE AND RICHMOND AVE CST SA FDOT 0 0 0 0 223,316 0 0 223,316 Safe Routes to School TOTAL 0 0 31,271 0 223,316 0 0 254,587 DESC. Sidewalk PROJ. LENGTH: 0.100 BEGIN MILE POST: 0.000 END MILE POST: 0.100 COMMENTS: NON-SIS
LRTP REFERENCE: Table 7, Appendix F, Page 9
PHASE FUND MANAGED BY LESS THAN 2014 2013/14 2014/15 2015/16 2016/17 2017/18 GREATER THAN
2018 ALL YEARS FPN: 4332351 PE LFP CC 0 0 63,041 0 0 0 0 63,041 PROJECT: SANDS BLVD CST LFP CC 0 0 0 40,826 0 0 0 40,826 from Cape Coral Pkwy to Beach Pkwy CST SU CC 0 0 0 255,400 0 0 0 255,400 DESC. Sidewalk CST TALU CC 0 0 0 3,300 0 0 0 3,300 PROJ. LENGTH: 0.735 TOTAL 0 0 63,041 299,526 0 0 0 362,567 BEGIN MILE POST: 0.000 END MILE POST: 0.735 COMMENTS: NON-SIS
LRTP REFERENCE: Table 7, Appendix F, Page 9
Transportation Improvement Program FY 2013/14 through FY 2017/18
VII - 20

PHASE FUND MANAGED BY LESS THAN 2014 2013/14 2014/15 2015/16 2016/17 2017/18 GREATER THAN
2018 ALL YEARS FPN: 4332361 PE LFP CC 0 0 98,810 0 0 0 0 98,810 PROJECT: SANDS BLVD CST LFP CC 0 0 0 62,049 0 0 0 62,049 from El Dorado Pkwy to Cape Coral Pkwy CST SU CC 0 0 0 404,899 0 0 0 404,899 DESC. Sidewalk TOTAL 0 0 98,810 466,948 0 0 0 565,758 PROJ. LENGTH: 0.000 BEGIN MILE POST: 0.000 END MILE POST: 0.000 COMMENTS: NON-SIS
LRTP REFERENCE: Table 7, Appendix F, Page 9
PHASE FUND MANAGED BY LESS THAN 2014 2013/14 2014/15 2015/16 2016/17 2017/18 GREATER THAN
2018 ALL YEARS FPN: 4332321 PE LFP CC 0 0 35,924 0 0 0 0 35,924 PROJECT: SKYLINE BLVD. CST SU CC 0 0 0 216,543 0 0 0 216,543 from Gleason Pkwy to SW 26th Street TOTAL 0 0 35,924 216,543 0 0 0 252,467 DESC. Sidewalk PROJ. LENGTH: 0.795 BEGIN MILE POST: 2.045 END MILE POST: 2.840 COMMENTS: NON-SIS
LRTP REFERENCE: Table 7, Appendix F, Page 9
PHASE FUND MANAGED BY LESS THAN 2014 2013/14 2014/15 2015/16 2016/17 2017/18 GREATER THAN
2018 ALL YEARS FPN: 4332341 PE LFP CC 0 0 42,753 0 0 0 0 42,753 PROJECT: SKYLINE BLVD. CST LFP CC 0 0 0 42,753 0 0 0 42,753 from Veterans Memorial Pkwy to Trafalgar Pkwy CST SU CC 0 0 0 214,765 0 0 0 214,765 DESC. Sidewalk TOTAL 0 0 42,753 257,518 0 0 0 300,271 PROJ. LENGTH: 1.101 BEGIN MILE POST: 3.048 END MILE POST: 4.149 COMMENTS: NON-SIS
LRTP REFERENCE: Table 7, Appendix F, Page 9
Transportation Improvement Program FY 2013/14 through FY 2017/18
VII - 21

PHASE FUND MANAGED BY LESS THAN 2014 2013/14 2014/15 2015/16 2016/17 2017/18 GREATER THAN
2018 ALL YEARS FPN: 4332211 PE SU FDOT 0 0 36,000 0 0 0 0 36,000 PROJECT: SR 867 (MCGREGOR BLVD.) CST DS FDOT 0 0 0 6,618 0 0 0 6,618 from Tanglewood Parkway to Brentwood Parkway CST SU FDOT 0 0 0 166,463 0 0 0 166,463 DESC. Sidewalk TOTAL 0 0 36,000 173,081 0 0 0 209,081 PROJ. LENGTH: 0.272 BEGIN MILE POST: 5.449 END MILE POST: 5.721 COMMENTS: NON-SIS
LRTP REFERENCE: Appendix E, Page 41
PHASE FUND MANAGED BY LESS THAN 2014 2013/14 2014/15 2015/16 2016/17 2017/18 GREATER THAN
2018 ALL YEARS FPN: 4332181 PE SU FDOT 0 0 93,655 0 0 0 0 93,655 PROJECT: SR 884 COLONIAL BLVD CST DS FDOT 0 0 0 18,185 0 0 0 18,185 from Veronica Shoemaker to SR 739 (Metro Pkwy) CST SU FDOT 0 0 0 450,329 0 0 0 450,329 DESC. Bike Path/Trail TOTAL 0 0 93,655 468,514 0 0 0 562,169 PROJ. LENGTH: 0.583 BEGIN MILE POST: 2.490 END MILE POST: 3.073 COMMENTS: NON-SIS
LRTP REFERENCE: Appendix E, Page 104, Project 15
PHASE FUND MANAGED BY LESS THAN 2014 2013/14 2014/15 2015/16 2016/17 2017/18 GREATER THAN
2018 ALL YEARS FPN: 4332261 PLN SU MPO 0 0 0 91,000 0 0 0 91,000 PROJECT: TOWN OF FORT MYERS BEACH TOTAL 0 0 0 91,000 0 0 0 91,000 Bike/Pedestrian Master Plan DESC. Bike Lane/Sidewalk PROJ. LENGTH: 0.000 BEGIN MILE POST: 0.000 END MILE POST: 0.000 COMMENTS: NON-SIS
LRTP REFERENCE: Table 7, Appendix F, Page 9
Transportation Improvement Program FY 2013/14 through FY 2017/18
VII - 22

PHASE FUND MANAGED BY LESS THAN 2014 2013/14 2014/15 2015/16 2016/17 2017/18 GREATER THAN
2018 ALL YEARS FPN: 4332311 PE LFP CC 0 0 100,849 0 0 0 0 100,849 PROJECT: WILDWOOD/PALM TREE BLVD. CST LFP CC 0 0 0 140,726 0 0 0 140,726 from SE 40th Street o Conrty Club Blvd. CST SU CC 0 0 0 421,204 0 0 0 421,204 DESC. Sidewalk TOTAL 0 0 100,849 561,930 0 0 0 662,779 PROJ. LENGTH: 0.000 BEGIN MILE POST: 0.000 END MILE POST: 0.000 COMMENTS: NON-SIS
LRTP REFERENCE: Table 7, Appendix F, Page 9
BIKE/PED MANAGED BY LESS THAN 2014 2013/14 2014/15 2015/16 2016/17 2017/18 GREATER THAN
2018 ALL YEARS
TOTAL $ 55,347
$ 2,579,553
$ 2,311,461
$ 8,192,074
$ 2,444,176
$ - $ 1,200,000
$ 17,006,611
Transportation Improvement Program FY 2013/14 through FY 2017/18
VII - 23

Attachment a
PHASE FUND MANAGED BY LESS THAN
2014 2013/14 2014/15 2015/16 2016/17 2017/18
GREATER THAN 2018 ALL YEARS
FPN: 435448-1
PE SU MPO 0 200,000 0 0 0 0 0 200,000 PROJECT: Lee County Complete Streets Initiative
PE SU MPO 0 35,000 0 0 0 0 0 35,000
Mobility Improvements DESC. TIGER Grant
PROJ. LENGTH: 0.000
TOTAL
235,000
235,000 BEGIN MILE POST: 0.000
END MILE POST: 0.000 COMMENTS: Design/Build criteria package
LRTP REFERENCE: Page E-60 (page 760) & E-91 (page 791)
PHASE FUND MANAGED BY
LESS THAN 2014 2013/14 2014/15 2015/16 2016/17 2017/18
GREATER THAN 2018 ALL YEARS
FPN: 435448-2
CST TIGER MPO 0 10,473,900 0 0 0 0 0 10,473,900 PROJECT: Lee County Complete Streets Initiative
CST LF LEE 0 2,737,018 0 0 0 0 0 2,737,018
Mobility Improvements
DESC. TIGER Grant
PROJ. LENGTH: 0.000
TOTAL
13,210,918 BEGIN MILE POST: 0.000
END MILE POST: 0.000 COMMENTS: LF match consist of projects that are being completed by others
LRTP REFERENCE: Page E-60 (page 760) & E-91 (page 791)
TIGER MANAGED BY
LESS THAN 2014 2013/14 2014/15 2015/16 2016/17 2017/18
GREATER THAN 2018 ALL YEARS
TOTAL MPO/LEE $ 0 $ 13,445,918 $ 0 $ 0 $ 0 $ 0 $ $ 13,445,918
JLimbaugh
Typewritten Text
JLimbaugh
Typewritten Text
JLimbaugh
Typewritten Text
JLimbaugh
Typewritten Text
JLimbaugh
Typewritten Text
vii-24
dscott
Typewritten Text
dscott
Typewritten Text

Transportation Improvement Program FY 2013/14 through FY 2017/18
VII - 24

SECTION VIII
TRANSIT PROJECTS
This section consists of the transit projects in the state Tentative Work Program for fiscal years 2013/14 through 2017/18. Lee Tran has indicated that the projects for fiscal years 2013/14 through 2017/18 in this section are all consistent with the Transit Development Plan (TDP) and the Americans with Disabilities Act (ADA) Complementary Paratransit Plan. A major TDP update was completed in 2012. The transit project priorities are developed by Lee Tran to reflect needs identified in its current TDP. The transit projects identified herein are all consistent, to maximum extent feasible, with approved local government comprehensive plans. Lee Tran is the recipient of the FTA and state funds for all these projects. Lee Tran has demonstrated the financial capacity to handle its projects in the past, and will continue to have the financial capacity to do so, as certified by Lee Tran in each grant application that is filed with FTA. Procedures to test and monitor financial capacities have been identified in the adopted TDP, and are now being implemented.
Transportation Improvement Program FY 2013/14 through FY 2017/18
VIII - 1

Transportation Improvement Program FY 2013/14 through FY 2017/18
VIII - 2

PHASE FUND MANAGED BY LESS THAN 2014 2013/14 2014/15 2015/16 2016/17 2017/18 GREATER
THAN 2018 ALL YEARS FPN: 4308831 PLN SU MPO 0 124,000 0 0 0 0 0 124,000 PROJECT: TRANSIT BUS PULL OUT STUDY TOTAL 0 124,000 0 0 0 0 0 124,000
DESC. PTO Studies PROJ. LENGTH: 0.001 BEGIN MILE POST: 0.000 END MILE POST: 0.001 COMMENTS: NON-SIS
LRTP REFERENCE: Page 12-8, Table 12-7
PHASE FUND MANAGED BY LESS THAN 2014 2013/14 2014/15 2015/16 2016/17 2017/18 GREATER
THAN 2018 ALL YEARS FPN: 4308841 PLN SU MPO 0 55,000 0 0 0 0 0 55,000 PROJECT: TRANSIT BUS QUEUE STUDY TOTAL 0 55,000 0 0 0 0 0 55,000
DESC. PTO Studies PROJ. LENGTH: 0.001 BEGIN MILE POST: 0.000 END MILE POST: 0.001 COMMENTS: NON-SIS
LRTP REFERENCE: Page 12-8, Table 12-7
PHASE FUND MANAGED BY LESS THAN 2014 2013/14 2014/15 2015/16 2016/17 2017/18 GREATER
THAN 2018 ALL YEARS FPN: 4073291 OPS DDR LEE 6,805,610 370,714 0 0 0 0 0 7,176,324 PROJECT: LEE COUNTY - TRANSIT SYSTEM OPS DPTO LEE 3,391,103 707,984 1,441,941 1,441,062 2,190,458 0 0 9,172,548 Operating Assistance OPS DS LEE 6,825,404 0 0 0 0 0 0 6,825,404 DESC. Urban Corridor Improvements OPS LF LEE 12,822,117 1,078,698 1,441,941 1,441,062 2,190,458 0 0 18,974,276 PROJ. LENGTH: 0.000 TOTAL 29,844,234 2,157,396 2,883,882 2,882,124 4,380,916 0 0 42,148,552 BEGIN MILE POST: 0.000 END MILE POST: 0.000 COMMENTS: NON-SIS
LRTP REFERENCE: Page 13-6, Table 1
Transportation Improvement Program FY 2013/14 through FY 2017/18
VIII - 3

PHASE FUND MANAGED BY LESS THAN 2014 2013/14 2014/15 2015/16 2016/17 2017/18 GREATER
THAN 2018 ALL YEARS FPN: 4101151 PLN DDR MPO 27,619 0 0 0 0 0 0 27,619 PROJECT: LEE COUNTY MPO TRANSIT PLANNING PLN DPTO MPO 91,342 17,583 17,583 17,583 17,583 0 0 161,674 FTA 5303 PLN DS MPO 314 0 0 0 0 0 0 314 DESC. Modal Systems Planning PLN DU MPO 954,205 140,667 140,667 140,667 140,667 0 0 1,516,873 PROJ. LENGTH: 0.000 PLN LF MPO 119,276 17,583 17,583 17,583 17,583 0 0 189,608 BEGIN MILE POST: 0.000 TOTAL 1,192,756 175,833 175,833 175,833 175,833 0 0 1,896,088 END MILE POST: 0.000 COMMENTS: NON-SIS
LRTP REFERENCE: Page 13-6, Table 1
PHASE FUND MANAGED BY LESS THAN 2014 2013/14 2014/15 2015/16 2016/17 2017/18 GREATER
THAN 2018 ALL YEARS FPN: 4101251 OPS DU LEE 2,178,400 394,150 394,150 394,150 394,150 394,150 0 4,149,150 PROJECT: LEE COUNTY TRANSIT SYSTEM - (LCTS) OPS LF LEE 2,178,400 394,150 394,150 394,150 394,150 394,150 0 4,149,150 Operating Assistance TOTAL 4,356,800 788,300 788,300 788,300 788,300 788,300 0 8,298,300 DESC. Operating/Admin. Assistance PROJ. LENGTH: 0.000 BEGIN MILE POST: 0.000 END MILE POST: 0.000 COMMENTS: SIS; Section 5311 Rural and Small Areas Paratransit Operating
LRTP REFERENCE: Page 13-6, Table 1
PHASE FUND MANAGED BY LESS THAN 2014 2013/14 2014/15 2015/16 2016/17 2017/18 GREATER
THAN 2018 ALL YEARS FPN: 4101401 OPS DDR LEE 3,802,231 1,752,379 0 0 1,644,406 0 0 7,199,016 PROJECT: LEE COUNTY - TRANSIT SYSTEM OPS DPTO LEE 4,079,736 11,387 1,779,732 1,819,647 175,241 1,874,236 0 9,739,979 Operating Assistance OPS DS LEE 1,377,593 0 0 0 0 0 0 1,377,593 DESC. Operating for Fixed Route OPS LF LEE 9,259,560 1,763,766 1,779,732 1,819,647 1,819,647 1,874,236 0 18,316,588 PROJ. LENGTH: 0.000 TOTAL 18,519,120 3,527,532 3,559,464 3,639,294 3,639,294 3,748,472 0 36,633,176 BEGIN MILE POST: 0.000 END MILE POST: 0.000 COMMENTS: NON-SIS; Section 5307 Urbanized Areas Large Urban Cities Transit
LRTP REFERENCE: Page 13-6, Table 1
Transportation Improvement Program FY 2013/14 through FY 2017/18
VIII - 4
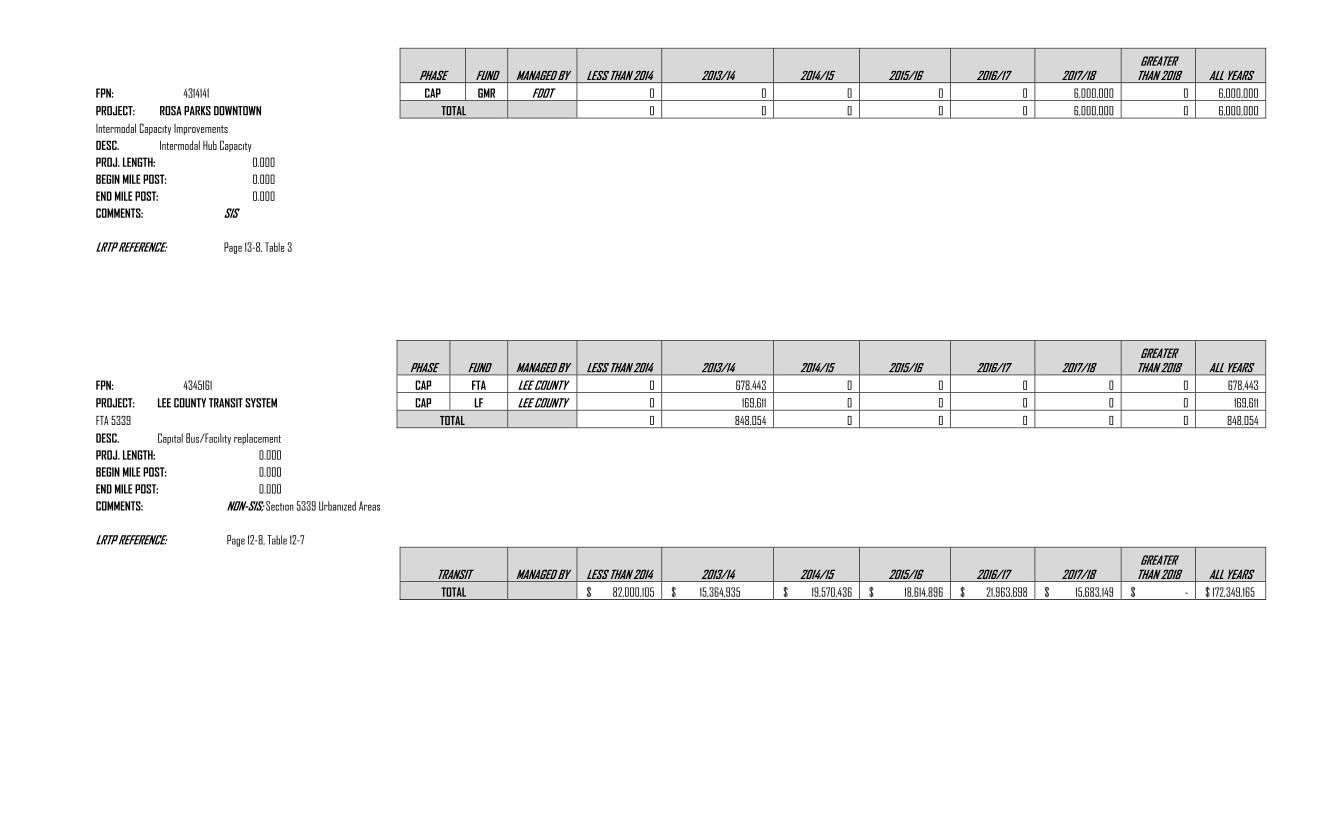
PHASE FUND MANAGED BY LESS THAN 2014 2013/14 2014/15 2015/16 2016/17 2017/18 GREATER
THAN 2018 ALL YEARS FPN: 4314141 CAP GMR FDOT 0 0 0 0 0 6,000,000 0 6,000,000 PROJECT: ROSA PARKS DOWNTOWN TOTAL 0 0 0 0 0 6,000,000 0 6,000,000 Intermodal Capacity Improvements DESC. Intermodal Hub Capacity PROJ. LENGTH: 0.000 BEGIN MILE POST: 0.000 END MILE POST: 0.000 COMMENTS: SIS
LRTP REFERENCE: Page 13-8, Table 3
PHASE FUND MANAGED BY LESS THAN 2014 2013/14 2014/15 2015/16 2016/17 2017/18 GREATER
THAN 2018 ALL YEARS FPN: 4345161 CAP FTA LEE COUNTY 0 678,443 0 0 0 0 0 678,443 PROJECT: LEE COUNTY TRANSIT SYSTEM CAP LF LEE COUNTY 0 169,611 0 0 0 0 0 169,611 FTA 5339 TOTAL 0 848,054 0 0 0 0 0 848,054 DESC. Capital Bus/Facility replacement PROJ. LENGTH: 0.000 BEGIN MILE POST: 0.000 END MILE POST: 0.000 COMMENTS: NON-SIS; Section 5339 Urbanized Areas
LRTP REFERENCE: Page 12-8, Table 12-7
TRANSIT MANAGED BY LESS THAN 2014 2013/14 2014/15 2015/16 2016/17 2017/18 GREATER
THAN 2018 ALL YEARS TOTAL $ 82,000,105 $ 15,364,935 $ 19,570,436 $ 18,614,896 $ 21,963,698 $ 15,683,149 $ - $ 172,349,165

PHASE FUND MANAGED BY LESS THAN 2014 2013/14 2014/15 2015/16 2016/17 2017/18 GREATER
THAN 2018 ALL YEARS FPN: 4101471 CAP FTA LEE COUNTY 22,469,756 6,137,832 4,117,102 4,117,102 4,117,102 4,117,102 0 45,075,996 PROJECT: LEE COUNTY TRANSIT SYSTEM CAP LF LEE COUNTY 5,617,439 1,029,275 1,534,458 1,029,275 1,029,275 1,029,275 0 11,268,997 Facility Project FTA 5307 TOTAL 28,087,195 5,146,377 7,672,290 5,146,377 5,146,377 5,146,377 0 56,344,993 DESC. Capital for Fixed Route PROJ. LENGTH: 0.000 BEGIN MILE POST: 0.000 END MILE POST: 0.000 COMMENTS: NON-SIS; Section 5307 Urbanized Areas
LRTP REFERENCE: Page 13-6, Table 1
PHASE FUND MANAGED BY LESS THAN 2014 2013/14 2014/15 2015/16 2016/17 2017/18 GREATER
THAN 2018 ALL YEARS FPN: 4226212 CAP ACSU LEE COUNTY 0 0 0 836,035 0 0 0 836,035 PROJECT: LEETRAN BUS PURCHASE CAP FTAT LEE COUNTY 0 0 3,500,000 1,100,000 1,500,000 0 0 6,100,000
CAP SU LEE COUNTY 0 0 3,500,000 263,965 1,500,000 0 0 5,263,965 DESC. Purchase Vehicles/Equipment TOTAL 0 0 7,000,000 2,200,000 3,000,000 0 0 12,200,000 PROJ. LENGTH: 0.000 BEGIN MILE POST: 0.000 END MILE POST: 0.000 COMMENTS: NON-SIS; Local Match: Toll Revenue Credits May Be used as Soft Match
LRTP REFERENCE: Page 12-8, Table 12-7
PHASE FUND MANAGED BY LESS THAN 2014 2013/14 2014/15 2015/16 2016/17 2017/18 GREATER
THAN 2018 ALL YEARS FPN: 4329621 CAP DDR LEE COUNTY 0 0 0 857,913 0 0 0 857,913 PROJECT: LEE COUNTY TRANSIT CAP DPTO LEE COUNTY 0 8,265 8,290 1,033,571 2,416,489 0 0 3,466,615 Capital Improvements CAP LF LEE COUNTY 0 8,265 8,290 1,891,484 2,416,489 0 0 4,324,528 DESC. Intermodal Hub Capacity TOTAL 0 16,530 16,580 3,782,968 4,832,978 0 0 8,649,056 PROJ. LENGTH: 0.000 BEGIN MILE POST: 0.000 END MILE POST: 0.000 COMMENTS: NON-SIS
LRTP REFERENCE: Page 13-6, Table 1

SECTION IX TRANSPORTATION DISADVANTAGED PROGRAM PROJECTS
This section includes the transportation disadvantaged program projects in the state Tentative Work Program for fiscal years 2013/14 through 2017/18 and additional projects proposed by the Lee County MPO. Currently, the community transportation coordinator (CTC) for the transportation disadvantaged program in Lee County is Good Wheels Inc., which provides services under a memorandum of agreement with the Florida commission for the Transportation Disadvantaged. The Lee County MPO, as the designated official planning agency for the program, confirms that the projects through 2017/18 in this section are all consistent with the Transportation Disadvantaged Service Plan (TDSP) adopted by the Lee County Local Coordinating Board in April 2013.
Transportation Improvement Program FY 2013/14 through FY 2017/18
IX - 1

Transportation Improvement Program FY 2013/14 through FY 2017/18
IX - 2

PHASE FUND MANAGED BY LESS THAN
2014 2013/14 2014/15 2015/16 2016/17 2017/18 GREATER
THAN 2018 ALL YEARS FPN: 2072671 OPS LF GOODWHEELS 0 71,080 73,868 73,774 73,774 0 0 292,496 PROJECT: LEE COUNTY TD COMMISSION TRIP OPS TDDR GOODWHEELS 99,174 99,174 99,174 99,174 99,174 0 0 495,870 and Equipment Grant OPS TDTF GOODWHEELS 523,339 540,546 565,637 564,791 564,791 0 0 2,759,104 DESC. TD Commission - Capital TOTAL 622,513 710,800 738,679 737,739 737,739 0 0 3,547,470 PROJ. LENGTH: 0.000 BEGIN MILE POST: 0.000 END MILE POST: 0.000 COMMENTS:
LRTP REFERENCE:
PHASE FUND MANAGED BY LESS THAN
2014 2013/14 2014/15 2015/16 2016/17 2017/18 GREATER
THAN 2018 ALL YEARS FPN: 2072672 PLN TDTF LEE MPO 30,391 29,557 30,391 29,702 29,702 0 0 149,743 PROJECT: LEE COUNTY LCB ASSISTANCE TOTAL 30,391 29,557 30,391 29,702 29,702 0 0 149,743 Commission TD DESC. TD Commission – Capital PROJ. LENGTH: 0.000 BEGIN MILE POST: 0.000 END MILE POST: 0.000 COMMENTS:
LRTP REFERENCE:
TRANSPORTATION DISADVANTAGED MANAGED BY
LESS THAN 2014 2013/14 2014/15 2015/16 2016/17 2017/18
GREATER THAN 2018 ALL YEARS
TOTAL $ 652,904 $ 740,357 $ 769,070 $ 767,441 $ 767,441 $ - $ - 3,697,213
Transportation Improvement Program FY 2013/14 through FY 2017/18
IX - 3

Transportation Improvement Program FY 2013/14 through FY 2017/18
IX - 4

SECTION X
INTERMODAL DEVELOPMENT PROJECTS This section includes the intermodal development projects that are contained in the state Tentative Work Program for fiscal years 2013/14 through 2017/18. The intermodal projects identified herein are consistent, to the maximum extent feasible, with approved local government comprehensive plans and airport master plans.
Transportation Improvement Program FY 2013/14 through FY 2017/18
X - 1

Transportation Improvement Program FY 2013/14 through FY 2017/18
X - 2

PHASE FUND MANAGED BY LESS THAN
2014 2013/14 2014/15 2015/16 2016/17 2017/18 GREATER
THAN 2018 ALL YEARS
FPN: 4179851 CAP DDR LEE 0 300,000 0 0 0 0 0 300,000
PROJECT: LEE COUNTY (LEETRAN) CAPITAL CAP DPTO LEE 125,000 0 0 0 0 0 0 125,000
Improvements (Design) CAP LF LEE 125,000 300,000 0 0 0 0 0 425,000
DESC. Prelim ENG for Future Capacity TOTAL 250,000 600,000 0 0 0 0 0 850,000
PROJ. LENGTH: 0.000
BEGIN MILE POST: 0.000
END MILE POST: 0.000
COMMENTS: NON-SIS
LRTP REFERENCE: Page 13-6, Table 1
PHASE FUND MANAGED BY LESS THAN
2014 2013/14 2014/15 2015/16 2016/17 2017/18 GREATER
THAN 2018 ALL YEARS
FPN: 4184251 ADM DIS LEE 0 0 2,917,000 0 0 0 0 2,917,000
PROJECT: SOUTHWEST FLORIDA INTERNATIONAL ADM LF LEE 972,333 0 0 0 0 0 0 972,333
Airport Midfield Entrance Road ADM LFR LEE 2,917,000 0 0 0 0 0 0 2,917,000
DESC. Intermodal HUB Capacity TOTAL 3,889,333 0 2,917,000 0 0 0 0 6,806,333
PROJ. LENGTH: 0.000
BEGIN MILE POST: 0.000
END MILE POST: 0.000
COMMENTS: SIS
LRTP REFERENCE:
INTERMODAL MANAGED BY LESS THAN
2014 2013/14 2014/15 2015/16 2016/17 2017/18 GREATER
THAN 2018 ALL YEARS
TOTAL $ 4,139,333 $ 600,000 $ 2,917,000 $ - $ - $ - $ - $ 7,656,333
Transportation Improvement Program FY 2013/14 through FY 2017/18
X - 3

Transportation Improvement Program FY 2013/14 through FY 2017/18
X - 4

SECTION XI SAFETY PROJECTS
This section contains those projects within Lee County in the state and Tentative Work Program for fiscal years 2013/14 through 2017/18 that are funded with state and federal safety funds. The candidate projects competing for these safety funds are prioritized by the Lee County Community Traffic Safety Team (CTST), and submitted to FDOT District One Office.
Transportation Improvement Program FY 2013/14 through FY 2017/18
XI - 1
Transportation Improvement Program FY 2013/14 through FY 2017/18
XI - 2

PHASE FUND MANAGED BY LESS THAN
2014 2013/14 2014/15 2015/16 2016/17 2017/18 GREATER
THAN 2018 ALL YEARS FPN: 4308581 PE DIH FDOT 10,000 0 0 0 0 0 0 10,000 PROJECT: SR 82 CST DS FDOT 26 0 0 0 0 0 0 26 at Veronica Shoemaker Blvd. One Way Pair CST SA FDOT 0 5,155 0 0 0 0 0 5,155 DESC. Intersection Improvement PE HSP FDOT 84,303 0 0 0 0 0 0 84,303 PROJ. LENGTH: 0.180 CST HSP FDOT 0 551,707 0 0 0 0 0 551,707 BEGIN MILE POST: 1.908 TOTAL 94,329 556,862 0 0 0 0 0 651,191 END MILE POST: 2.088 COMMENTS: SIS
LRTP REFERENCE: Appendix F, Page 12, Table 9
PHASE FUND MANAGED BY LESS THAN
2014 2013/14 2014/15 2015/16 2016/17 2017/18 GREATER
THAN 2018 ALL YEARS FPN: 4308641 CST CST FDOT 26 0 0 0 0 0 0 26 PROJECT: SR 884 (COLONIAL BLVD.) CST SA FDOT 0 5,155 0 0 0 0 0 5,155 at US 41 (SR 45) PE DIH FDOT 10,952 0 0 0 0 0 0 10,952 DESC. Intersection Improvement PE HSP FDOT 89,604 0 0 0 0 0 0 89,604 PROJ. LENGTH: 1.057 PE SA FDOT 9,246 0 0 0 0 0 0 9,246 BEGIN MILE POST: 20.235 CST HSP FDOT 0 363,032 0 0 0 0 0 363,032 END MILE POST: 20.792 TOTAL 109,828 368,187 0 0 0 0 0 478,015 COMMENTS: NON-SIS
LRTP REFERENCE: Appendix F, Page 12, Table 9
PHASE FUND MANAGED BY LESS THAN
2014 2013/14 2014/15 2015/16 2016/17 2017/18 GREATER
THAN 2018 ALL YEARS FPN: 4308561 CST DS FDOT 26 0 0 0 0 0 0 26 PROJECT: US 41 (SR 45) CST SA FDOT 0 5,155 0 0 0 0 0 5,155 at Winkler Avenue PE DIH FDOT 644 0 0 0 0 0 0 644 DESC. Traffic Signal Update PE HSP FDOT 38,982 0 0 0 0 0 0 38,982 PROJ. LENGTH: 0.031 PE SA FDOT 9,356 0 0 0 0 0 0 9,356 BEGIN MILE POST: 21.013 CST HSP FDOT 0 538,670 0 0 0 0 0 538,670 END MILE POST: 21.044 TOTAL 49,008 543,825 0 0 0 0 0 592,833 COMMENTS: NON-SIS
LRTP REFERENCE: Appendix F, Page 12, Table 9
Transportation Improvement Program FY 2013/14 through FY 2017/18
XI - 3

PHASE FUND MANAGED BY LESS THAN
2014 2013/14 2014/15 2015/16 2016/17 2017/18 GREATER
THAN 2018 ALL YEARS FPN: 4308651 CST HSP FDOT 0 2,062 0 0 0 0 0 2,062 PROJECT: US 41 (SR 45) PE DIH FDOT 194 0 0 0 0 0 0 194 at Cortez Blvd. / Edison Avenue PE HSP FDOT 38,128 0 0 0 0 0 0 38,128 DESC. Traffic Signal Update PE SA FDOT 9,806 0 0 0 0 0 0 9,806 PROJ. LENGTH: 0.285 CST HSP FDOT 0 245,472 0 0 0 0 0 245,472 BEGIN MILE POST: 22.888 CST SA FDOT 0 5,155 0 0 0 0 0 5,155 END MILE POST: 23.173 TOTAL 48,128 252,689 0 0 0 0 0 300,817 COMMENTS: NON-SIS
LRTP REFERENCE: Appendix F, Page 12, Table 9
PHASE FUND MANAGED BY LESS THAN
2014 2013/14 2014/15 2015/16 2016/17 2017/18 GREATER
THAN 2018 ALL YEARS FPN: 4295091 PE DIH FDOT 29 0 0 0 0 0 0 29 PROJECT: US 41 SR 45 PE HSP FDOT 55,758 0 0 0 0 0 0 55,758 from Hanson Street to SR 82 PE SA FDOT 9,971 0 0 0 0 0 0 9,971 DESC. Pedestrian Safety Improvement CST HSP FDOT 0 884,797 0 0 0 0 0 884,797 PROJ. LENGTH: 1.349 CST SA FDOT 0 12,177 0 0 0 0 0 12,177 BEGIN MILE POST: 22.233 TOTAL 65,758 896,974 0 0 0 0 0 962,732 END MILE POST: 23.582 COMMENTS: NON-SIS
LRTP REFERENCE: Appendix F, Page 12, Table 9
PHASE FUND MANAGED BY LESS THAN
2014 2013/14 2014/15 2015/16 2016/17 2017/18 GREATER
THAN 2018 ALL YEARS FPN: 4333701 PE HSP FDOT 0 113,068 0 0 0 0 0 113,068 PROJECT: SR 82 PE SA FDOT 0 10,000 0 0 0 0 0 10,000 at Fowler Street CST DDR FDOT 0 0 14,781 0 0 0 0 14,781 DESC. Intersection Improvement CST HSP FDOT 0 0 357,504 0 0 0 0 357,504 PROJ. LENGTH: 0.188 CST SA FDOT 0 0 8,488 0 0 0 0 8,488 BEGIN MILE POST: 0.551 TOTAL 0 123,068 380,773 0 0 0 0 503,841
END MILE POST: 0.739
COMMENTS: SIS
LRTP REFERENCE: Appendix F, Page 12, Table 9
Transportation Improvement Program FY 2013/14 through FY 2017/18
XI - 4

PHASE FUND MANAGED BY LESS THAN
2014 2013/14 2014/15 2015/16 2016/17 2017/18 GREATER
THAN 2018 ALL YEARS FPN: 4334071 PE HSP FDOT 0 105,000 0 0 0 0 0 105,000 PROJECT: SR 867 PE SA FDOT 0 10,000 0 0 0 0 0 10,000 at A&W Bulb Road CST DDR FDOT 0 0 10,641 0 0 0 0 10,641 DESC. Intersection Improvement CST HSP FDOT 0 0 266,166 0 0 0 0 266,166 PROJ. LENGTH: 0.292 CST SA FDOT 0 0 7,742 0 0 0 0 7,742 BEGIN MILE POST: 1.856 TOTAL 0 115,000 284,549 0 0 0 0 399,549
END MILE POST: 2.148
COMMENTS: NON-SIS
LRTP REFERENCE: Appendix F, Page 12, Table 9
PHASE FUND MANAGED BY LESS THAN
2014 2013/14 2014/15 2015/16 2016/17 2017/18 GREATER
THAN 2018 ALL YEARS FPN: 4327551 PE DIH FDOT 10,000 0 0 0 0 0 0 10,000 PROJECT: US 41 PE HSP FDOT 75,000 0 0 0 0 0 0 75,000 from South of Coconut Road to San Carlos Blvd. DSB DDR FDOT 0 52,354 0 0 0 0 0 52,354 DESC. Lighting DSB HSP FDOT 0 1,241,222 0 0 0 0 0 1,241,222 PROJ. LENGTH: 4.884 DSB SA FDOT 0 1,503,785 0 0 0 0 0 1,503,785 BEGIN MILE POST: 5.496 TOTAL 85,000 2,797,361 0 0 0 0 0 2,882,361
END MILE POST: 10.380
COMMENTS: NON-SIS
LRTP REFERENCE: Appendix F, Page 12, Table 9
SAFETY MANAGED BY LESS THAN
2014 2013/14 2014/15 2015/16 2016/17 2017/18 GREATER
THAN 2018 ALL YEARS TOTAL $ 452,051 $ 5,653,966 $ 665,322 $ - $ - $ - $ - $ 6,771,339
Transportation Improvement Program FY 2013/14 through FY 2017/18
XI - 5

Transportation Improvement Program FY 2013/14 through FY 2017/18
XI - 6

SECTION XII PLANNING
This section contains the FHWA Section 112 transportation planning funds that are annually allocated to the Lee County MPO, FTA Section 5303 transportation planning funds, and the Transportation Disadvantaged Commission planning grant.
Transportation Improvement Program FY 2013/14 through FY 2017/18
XII - 1

Transportation Improvement Program FY 2013/14 through FY 2017/18
XII - 2

PHASE FUND MANAGED BY LESS THAN 2014 2013/14 2014/15 2015/16 2016/17 2017/18 GREATER
THAN 2018 ALL YEARS FPN: 4236421 PLN PL Lee MPO 707,087 683,574 0 0 0 0 0 1,390,661 PROJECT: LEE COUNTY MPO FY 2013/2014 UPWP TOTAL 707,087 683,574 0 0 0 0 0 1,390,661
DESC. Transportation Planning PROJ. LENGTH: 0.000 BEGIN MILE POST: 0.000 END MILE POST: 0.000 COMMENTS: NON-SIS
LRTP REFERENCE:
PHASE FUND MANAGED BY LESS THAN 2014 2013/14 2014/15 2015/16 2016/17 2017/18 GREATER
THAN 2018 ALL YEARS FPN: 4256681 PLN PL Lee MPO 0 0 683,219 683,219 0 0 0 1,366,438 PROJECT: LEE COUNTY MPO FY 2015/2016 UPWP TOTAL 0 0 683,219 683,219 0 0 0 1,366,438
DESC. Transportation Planning PROJ. LENGTH: 0.000 BEGIN MILE POST: 0.000 END MILE POST: 0.000 COMMENTS: NON-SIS
LRTP REFERENCE:
PHASE FUND MANAGED BY LESS THAN 2014 2013/14 2014/15 2015/16 2016/17 2017/18 GREATER
THAN 2018 ALL YEARS FPN: 4318081 PLN PL Lee MPO 0 0 0 0 683,219 683,219 0 1,366,438 PROJECT: LEE COUNTY MPO FY 2017/2018 UPWP TOTAL 0 0 0 0 683,219 683,219 0 1,366,438
DESC. Transportation Planning PROJ. LENGTH: 0.000 BEGIN MILE POST: 0.000 END MILE POST: 0.000 COMMENTS: NON-SIS
LRTP REFERENCE:
Transportation Improvement Program FY 2013/14 through FY 2017/18
XII - 3

PLANNING MANAGED BY LESS THAN 2011 2012/13 2013/14 2014/15 2015/16 2016/17 GREATER
THAN 2016 ALL YEARS TOTAL $ 707,087 $ 683,574 $ 683,219 $ 683,219 $ 683,219 $ 683,219 $ - $ 4,123,537
Transportation Improvement Program FY 2013/14 through FY 2017/18
XII - 4

SECTION XIII
FINANCIAL SUMMARY BY CATEGORY FISCAL YEARS 2013/14- 2017/18
Transportation Improvement Program FY 2013/14 through FY 2017/18
XIII - 1

Transportation Improvement Program FY 2013/14 through FY 2017/18
XIII - 2

FDOT STATE TRANSPORTATION IMPROVEMENT PROGRAM FISCAL YEARS: 2013 THROUGH 2018 FUND TOTAL PROGRAM 2013 2014 2015 2016 2017 2018
ADVANCED CONSTRUCTION (NH) ACNH 71,784,629 177,129 71,607,500 0 0 0 0
ADVANCED CONSTRUCTION (SA) ACSA 9,304,880 497,993 0 0 5,000,000 3,806,887 0
ADVANCED CONSTRUCTION (SU) ACSU 7,649,095 7,418,842 230,253 0 0 0 0
ADVANCED CONSTRUCTION (TALU) ACTU 4,324,745 0 4,324,745 0 0 0 0
CONGESTION MITIGATION – AQ CM 1,687,885 0 0 0 0 0 1,687,885
EQUITY BONUS EB 2,861,752 2,861,752 0 0 0 0 0
FED STIMULUS, S/W MANAGED FSF1 1,080,575 1,080,575 0 0 0 0 0
FED STIMULUS, URBAN AREAS > 200K FSSU 145,512 145,512 0 0 0 0 0
SAFETY (HIWAY SAFETY PROGRAM) HSP 6,622,811 1,954,111 4,045,030 623,670 0 0 0
PRINCIPAL ARTERIALS NH 7,683,547 7,683,547 0 0 0 0 0
NH (AC/REGULAR) NHAC 207,865 207,865 0 0 0 0 0
NAT HWY PERFORM – RESURFACING NHRE 5,201,580 2,291,836 0 0 2,909,744 0 0
STP, ANY AREA SA 21,954,442 3,040,858 8,455,065 211,941 1,511,162 1,016,417 7,718,999
STP, ENHANCEMENT SE 257,004 257,004 0 0 0 0 0
SAFE ROUTES – INFRASTRUCTURE SR2S 109,404 109,404 0 0 0 0 0
STP, URBAN AREAS > 200K SU 31,550,369 2,947,415 8,248,715 2,894,808 6,071,185 4,994,533 6,393,713
TRANSPORTATION ALTS – ANY AREA TALT 3,432,516 0 520,000 0 1,215,449 1,697,067 0
TRANSPORTATION ALTS - >200K TALU 3,970,431 631,099 668,084 667,837 667,871 667,810 667,730
TRANSPORTATION IMPROVEMENTS TIMP 672,118 672,118 0 0 0 0 0
HIGHWAYS 180,483,160 31,977,060 98,099,392 4,398,256 17,375,411 12,182,714 16,468,327
FDOT STATE TRANSPORTATION IMPROVEMENT PROGRAM FISCAL YEARS: 2013 THROUGH 2018 FUND TOTAL PROGRAM 2013 2014 2015 2016 2017 2018
METRO PLAN (85% FA; 15% OTHER) PL 4,123,537 707,087 683,574 683,219 683,219 683,219 683,219
PLANNING 4,123,537 707,087 683,574 683,219 683,219 683,219 683,219
Transportation Improvement Program FY 2013/14 through FY 2017/18
XIII - 3

FDOT STATE TRANSPORTATION IMPROVEMENT PROGRAM FISCAL YEARS: 2013 THROUGH 2018
FUND TOTAL PROGRAM 2013 2014 2015 2016 2017 2018 FEDERAL AVIATION ADMIN FAA 6,563,550 0 0 137,750 2,425,000 4,000,800 0 AVIATION 6,563,550 0 0 137,750 2,425,000 4,000,800 0
FDOT STATE TRANSPORTATION IMPROVEMENT PROGRAM FISCAL YEARS: 2013 THROUGH 2018
FUND TOTAL PROGRAM 2013 2014 2015 2016 2017 2018 ADVANCE CONSTRUCTION (SU) ACSU 836,035 0 0 0 836,035 0 0 STATE PRIMARY/FEDERAL REIMB DU 3,599,642 531,407 534,817 534,817 534,817 534,817 394,150 FEDERAL TRANSIT ADMINISTRATION FTA 45,784,527 25,199,017 4,117,102 4,117,102 4,117,102 4,117,102 4,117,102 FHWA TRANSFER TO FTA (NON-BUD) FTAT 6,100,000 0 0 3,500,000 1,100,000 1,500,000 0 STP, URBAN AREAS > 200K SU 5,263,965 0 0 3,500,000 263,965 1,500,000 0 TRANSIT 61,049,352 25,730,424 4,651,919 11,651,919 6,851,919 7,651,919 4,511,252
FDOT STATE TRANSPORTATION IMPROVEMENT PROGRAM FISCAL YEARS: 2013 THROUGH 2018
FUND TOTAL PROGRAM 2013 2014 2015 2016 2017 2018 ADVANCE CONSTRUCTION (SU) ACSU 300,000 0 0 0 300,000 0 0 STP, URBAN AREAS > 200K SU 1,400,000 200,000 300,000 300,000 0 300,000 300,000 TRANSPORTATION ALTS – ANY AREA TALT 512,458 66,396 0 446,062 0 0 0 MISCELLANEOUS 2,212,458 266,396 300,000 746,062 300,000 300,000 300,000
GRAND TOTAL 254,432,057 58,680,967 103,734,885 17,617,206 27,635,549 24,818,652 21,962,798
Transportation Improvement Program FY 2013/14 through FY 2017/18
XIII - 4

SECTION XIV PROGRAMMED LOCAL GOVERNMENTS HIGHWAY IMPROVEMENTS
This section lists programmed capacity improvement, intersection improvement, system preservation, and bicycle/pedestrian projects, as submitted by Lee County, the Cities of Bonita Springs, Cape Coral, Fort Myers and Sanibel, and the Town of Fort Myers Beach. This listing includes project limits, the project type, the amount of funding, and years for which funding is currently programmed in each of the local Capital Improvement Program.
Transportation Improvement Program FY 2013/14 through FY 2017/18
XIV - 1
Transportation Improvement Program FY 2013/14 through FY 2017/18
XIV - 2

Transportation Improvement Program FY 2013/14 through FY 2017/18
XIV - 3

Transportation Improvement Program FY 2013/14 through FY 2017/18
XIV - 4

City of Cape Coral, Florida FY2011-2012 Adopted Operating Budget
133
FUNDED
CAPITAL IMPROVEMENTS PROGRAM
FUNDING SOURCE FY 2012 FY 2013 FY 2014 FY 2015 FY 2016 FY 2017 TOTAL
STORMWATERDrainage Improvements Stormwater Revenues $1,000,000 $1,000,000 $1,000,000 $1,000,000 $1,000,000 $0 $5,000,000Boat launch faci l i ty (land) Env Res Stormwater Revenues - 95,000 95,000 95,000 95,000 - 380,000 NW Drainage Improvements Stormwater Revenues 5,250,000 - - - - - 5,250,000
TRANSPORTATION
Street Programs Six Cent Gas Tax 726,498 675,643 628,348 799,548 743,580 - 3,573,617
Road resurfacing Six Cent Gas Tax - 1,000,000 1,100,000 1,100,000 1,200,000 1,200,000 5,600,000
Road resurfacing - 4 Lane Roads General Fund - 1,000,000 1,000,000 1,000,000 1,000,000 1,000,000 5,000,000
Traffic Control Devices/Intersection Imp Five Cent Gas Tax 300,000 350,000 350,000 700,000 700,000 700,000 3,100,000
Sidewalks CPF Five Cent Gas Tax 100,000 400,000 200,000 200,000 500,000 - 1,400,000
Sidewalks - CPF - SRTS Grants (Federa l , State, Local ) - 210,574 - - - - 210,574
Sidewalks - CPF - TEA Grants (Federa l , State, Local ) - - 520,000 570,000 - - 1,090,000
Intersection/roadway l ighting Five Cent Gas Tax 50,000 50,000 50,000 50,000 50,000 75,000 325,000
Turn Lane Improvement Five Cent Gas Tax 50,000 50,000 50,000 50,000 50,000 50,000 300,000
North Cape East/West Corridor Five Cent Gas Tax 40,000 - 2,500,000 - 200,000 400,000 3,140,000
Access Mgmt & Circulation Improve. Five Cent Gas Tax 70,000 100,000 250,000 250,000 400,000 400,000 1,470,000
S.R. 78 para l lel access road Five Cent Gas Tax - 250,000 - 250,000 250,000 - 750,000
Median curbing projects Five Cent Gas Tax - - 500,000 500,000 500,000 - 1,500,000
Median curbing with loca l match Five Cent Gas Tax - - - 25,000 25,000 25,000 75,000
Downtown Transportation Five Cent Gas Tax 40,000 - - - - - 40,000
UTILITIES
Galvanized pipe svc replacement Water & Sewer User Fees 1,000,000 1,000,000 1,000,000 - - - 3,000,000
Aqui fer Storage and Recovery Water & Sewer User Fees - - - 9,125,000 - - 9,125,000
Pa lm Tree Water Main Extens ion Water & Sewer User Fees - - - - - - -
L/S #105 Insta l l new wetwel l***** Water & Sewer User Fees - - 360,000 - - - 360,000
L/S #106 rehab***** Water & Sewer User Fees - 203,500 - - - - 203,500
L/S #111 new wetwel l***** Water & Sewer User Fees - 330,000 - - - - 330,000
L/S #102 new wetwel l***** Water & Sewer User Fees - - 330,000 - - - 330,000
L/S #112 rehab*** Water & Sewer User Fees - 209,000 - - - - 209,000
L/S #113 Insta l l new wetwel l**** Water & Sewer User Fees - - 330,000 - - - 330,000
L/S #114 rehab***** Water & Sewer User Fees - 203,500 - - - - 203,500
L/S #115 rehab***** Water & Sewer User Fees 203,500 - - - - - 203,500
L/S #116 rehab***** Water & Sewer User Fees - - 218,500 - - - 218,500
L/S #118 rehab*** Water & Sewer User Fees - - 234,000 - - - 234,000
L/S #119 rehab*** Water & Sewer User Fees - - 234,000 - - - 234,000
L/S #121 rehab*** Water & Sewer User Fees - - 234,000 - - - 234,000
Transportation Improvement Program FY 2013/14 through FY 2017/18
XIV - 5

Transportation Improvement Program FY 2013/14 through FY 2017/18
XIV - 6

Transportation Improvement Program FY 2013/14 through FY 2017/18
XIV - 7
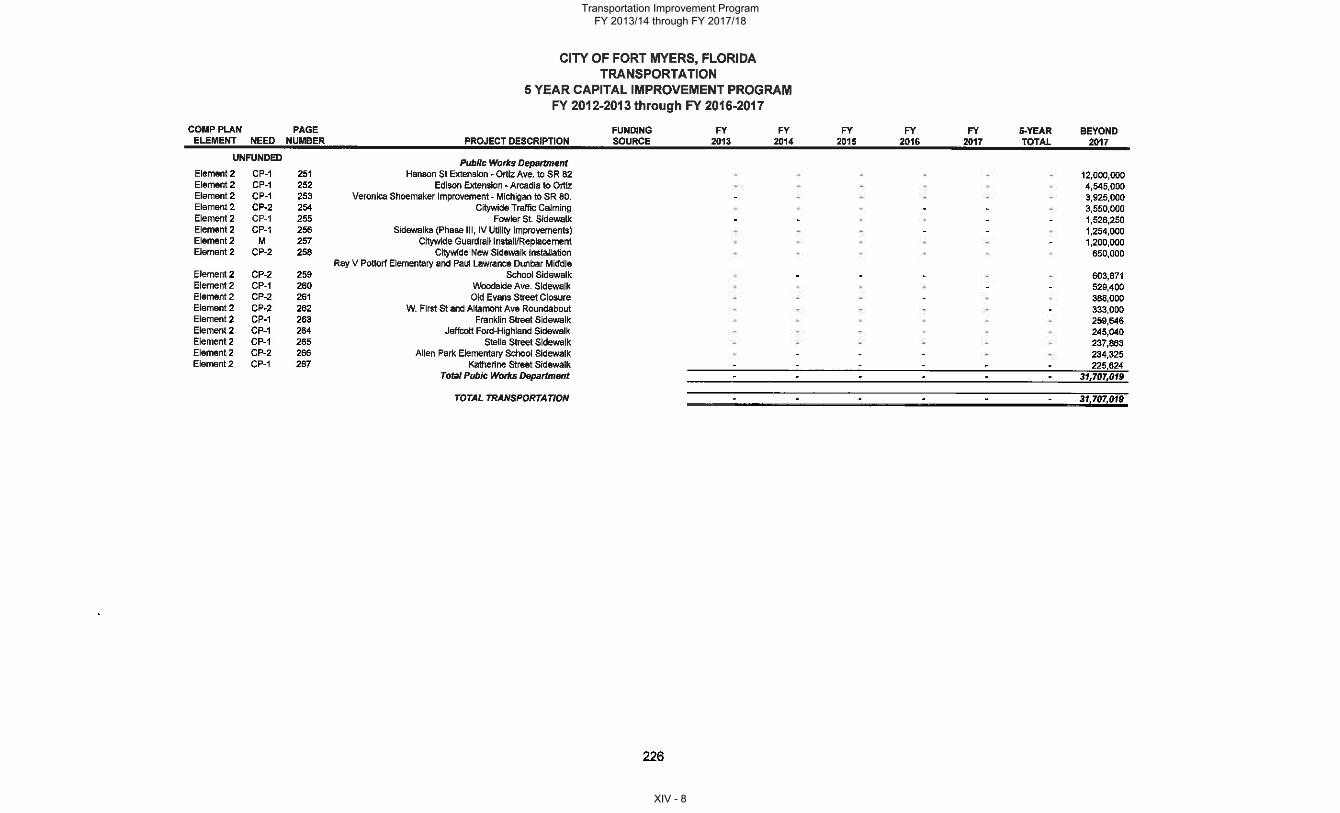
Transportation Improvement Program FY 2013/14 through FY 2017/18
XIV - 8

Transportation Improvement Program FY 2013/14 through FY 2017/18
XIV - 9

Transportation Improvement Program FY 2013/14 through FY 2017/18
XIV - 10

SUMMARY OF MAJOR ROAD PROJECTS PROGRAMMED BY LEE COUNTY - FY 12/13 TO FY 16/17 (as adopted September 19, 2012)
FY 98-11 FUTURECOMM PROJ. LENGTH PRIOR FY 11/12 5-YEAR PROJECT REVENUE PROJECTDIST. NUMBER PROJECT NAME (MILES) EXP. BUDGET 12/13 13/14 14/15 15/16 16/17 TOTAL 6-10 TOTAL SOURCE MANAGER
MAJOR PROJECTS
2 205075 Alico Rd 4L/Ben Hill-Airport Haul Rd (PRELIM DESIGN UNDERWAY) 1.78 34,308 715,297 1,590,000 170,000 0 8,200,000 750,000 10,710,000 0 11,459,605 GT, AV Sarah Clarke, 533-87184L widening, including on-road bike lanes and 12' multi-use paths PRELIM PRELIM DES MIT CST/CEI LS [email protected] both sides
All 206002 Bicycle/Pedestrian Facilities 15,425,655 403,415 472,000 456,250 684,000 400,000 1,905,000 3,917,250 3,700,000 23,446,320 IF/GT Mike Tisch, 533-8110Annual project for facilities on existing County-maintained roads DES/CST DES/CST DES/CST DES/CST DES/CST DES/CST DES/CST CST [email protected] Projects:
Gulf Dr. Path Widening, Wheeler Rd-1st St. E. (deferred due to bridge 27,000
condition/weight restrictions - carryover) CST
Stringfellow/Oleander Paved Shoulder, 1st Ave.-8th Ave. 230,000 230,000
CST
Villas Sidewalks on Crest Lane and Gorham Ave. (Complete Streets 190,000 239,250 429,250
recommendation) DES/SUR CST
Pedestrian Connection, N. Brentwood Rd.-Summerlin Bike Path 17,000 34,000 51,000
(Complete Streets recommendation) DES CST
Three Oaks/Imperial Bike Lane Conversion, Co. Line-Bonita Beach Rd., 52,000 52,000
and E. Terry St.-Corkscrew Rd. CST
Fiddlesticks Blvd.Bike Path/Resurface, Fiddlesticks Ent.-Daniels 200,000 650,000 850,000
DES/SUR CST
Daniels Bike Path/South Side, Six Mile Pkwy.-I-75 400,000 1,800,000 2,200,000
DES CST
Six Mile Bike Path Gap/West Side, Heritage Palms-Winkler Ext. 105,000 105,000
CST
3 Big Carlos Pass Bridge Replacement 0 0 0 65,958 2,870,205 2,869,248 2,869,248 8,674,659 32,125,341 40,800,000 SANIBEL Ehab Guirguis, 533-9416Funds to replace 2L bascule bridge with fixed-span bridge (Sufficient build- DES DES DES/CST CST CST/CEI SURP. [email protected] up of funds for DES in FY 15/16 at $3,600,000, rest for CST) TOLLS
3 205720 Bonita Beach Road Phase II (CST UNDERWAY) 0.90 2,993,703 7,077,630 366,000 0 0 0 0 366,000 0 10,437,333 AV Sarah Clarke, 533-87186L, Old 41 to Lime St. (Jointly funded per interlocal agreement) - including DES/ROW/ ROW/CST/ LS [email protected] bike lanes and sidewalks on both sides CST CEIGFRTF Loan Repayment - Principal ($3,750,000) 0 0 0 0 70,848 85,094 155,942 3,594,058 3,750,000 IF24
GFRTF Loan Repayment - Interest (0.5%) 18,750 18,750 18,750 18,750 18,750 18,396 93,396 112,146
3 205723 Bonita Beach Road Phase III (DES UNDERWAY) 2.00 1,783,789 302,369 0 0 0 0 0 0 23,000,000 25,086,158 IF24/CITY/ Sarah Clarke, 533-87186L widening, W. of US 41 to Old 41 - including on-road bike lanes and DES DES/ROW ROW/CST AV [email protected] on both sides, and approx. 14 transit stops
2 206758 Briarcliff/Rippe Signalization 0 25,000 0 225,000 0 0 0 225,000 0 250,000 GT Steve Jansen, 533-9507Joint project with FDOT to install signal when meets warrants DES CST [email protected]
1,4 204088 Burnt Store Road 4L (DES/ROW UNDERWAY) 3.60 8,302,733 1,307,159 500,000 50,000 8,200,000 890,000 5,500,000 15,140,000 13,380,000 38,129,892 SURP. Sarah Clarke, 533-8718SR 78 (Pine Island Road) to Van Buren Parkway (IN PHASES) DES/ROW ROW ROW DES CST/CEI LS/DES CST/CEI CST/CEI/LS TOLLS/IF [email protected] including on-road bike lanes, 10' multi-use path on east side, 6' side
walk on west side
2 204054 Colonial Boulevard/Six Mile to SR 82 (CST UNDERWAY) 2.65 26,382,011 5,895,408 829,000 0 0 0 0 829,000 0 33,106,419 AV Randy Cerchie, 533-85736L widening, plus interstate access improvements (includes $1,000,000 ALL CST/MIT LS [email protected] City of Fort Myers and $4.7 million in State TRIP funds)
2 Crystal Dr. 2LD 0 0 0 0 0 850,000 250,000 1,100,000 5,425,000 6,525,000 GT Sarah Clarke, 533-8718Reconstruct 2L undivided roadway to 2L divided section with DES ROW CST/CEI [email protected] bike lanes and sidewalks on both sides
2 Crystal/Plantation Roundabout 0 0 125,000 450,000 0 0 0 575,000 0 575,000 GT Sarah Clarke, 533-8718Construct roundabout at intersection, including bike-ped features ROW CST [email protected]
2 Daniels Resurfacing/Six Mile to I-75 2.60 0 0 1,700,000 0 0 0 0 1,700,000 0 1,700,000 GT Randy Cerchie, 533-8573Resurfacing, including conversion of shoulders to designated bike lanes CST [email protected]
Project Summary Adopted 13-17 CIP.xlsx Page 1 10/1/12
Transportation Improvement Program FY 2013/14 through FY 2017/18
XIV - 11

SUMMARY OF MAJOR ROAD PROJECTS PROGRAMMED BY LEE COUNTY - FY 12/13 TO FY 16/17 (as adopted September 19, 2012)
FY 98-11 FUTURECOMM PROJ. LENGTH PRIOR FY 11/12 5-YEAR PROJECT REVENUE PROJECTDIST. NUMBER PROJECT NAME (MILES) EXP. BUDGET 12/13 13/14 14/15 15/16 16/17 TOTAL 6-10 TOTAL SOURCE MANAGER
3 205067 Estero Blvd. Improvements 6.00 1,493,305 2,547,018 0 7,000,000 0 0 0 7,000,000 38,750,000 49,790,323 GT/TOWN Rob Phelan, 533-8594Phased reconstruction of County roadway within Town, including adding PRELIM DES/CST CST/CEI DES/CST/CEI GRANT [email protected] stops, bike lanes and sidewalks on both sides , and replacement of City water lines and County sewer lines (costs don't reflect utilityreplacements). Phase 1 estimated from Lani Kai to Donora Blvd. (1.1 miles), to be refined through on-going preliminary design study.
1,2 Fiber Ring 0 0 0 350,000 0 0 0 350,000 0 350,000 SURP. Sue Hopwood, 533-0157Completion of duplicate fiber ring linking Cape Coral toll facilities CST TOLLS [email protected]
3 204083 Gladiolus Widening (CST ON GLADIOLUS AND BASS COMPLETED, 2.30 20,429,434 3,561,450 0 0 0 0 0 0 0 23,990,884 IF4/IF24/ Rob Phelan, 533-8594A&W BULB PORTION UNDERWAY) ALL CST/MIT/LS GT/AV [email protected] Pine Ridge Rd. to Bass Rd., 6L Bass Rd. to Winkler Rd., plus 4L BassRd. from Healthpark to Gladiolus and A&W Bulb Rd. reconstruction,including on-road bike lanes and sidewalk on one side
5 205063 Homestead 4L/Sunrise-Alabama (DES/ROW UNDERWAY) 2.25 2,244,733 1,055,253 1,700,000 1,700,000 100,000 10,750,000 800,000 15,050,000 0 18,349,986 IF23/LOAN Sarah Clarke, 533-87184L widening, south of Sunrise Blvd. to Alabama Rd., including on-road DES/ROW DES/ROW ROW ROW DES CST/CEI LS AV [email protected] lanes and sidewalks on both sides
GFRTF Loan Repayment - Principal ($3,400,000) 0 0 100,000 100,000 100,000 100,000 400,000 500,000 900,000 IF23
GFRTF Loan Repayment - Interest (0.5%) 0 0 8,500 16,500 16,500 69,750 111,250 111,250
5 205080 Homestead Road Complete Street 1.00 0 0 1,500,000 0 0 0 0 1,500,000 0 1,500,000 GT Sarah Clarke, 533-8718Reconstruction of existing 4LD roadway from Alabama Rd. to Beth Stacey DES [email protected]. to reflect community plan concept of Complete Street (still being
defined by community)
4 Kismet/Littleton Realignment 0 0 0 0 225,000 0 625,000 850,000 0 850,000 IF22 Sarah Clarke, 533-8718Realignment of eastern end of Kismet Pkwy. to connect directly to DES CST [email protected] Rd., including on-road bike lanes and sidewalks on both sides
(subject to execution of joint-funding interlocal agreement, amounts
reflect County's share only)
5 205068 Luckett Rd 4L/Ortiz to I-75 (ROW UNDERWAY) 0.46 538,982 611,017 0 0 0 0 0 0 3,069,000 4,218,999 IF23/AV Rob Phelan, 533-85944L widening, including on-road bike lanes and sidewalks on both sides ROW ROW CST/CEI/LS [email protected]
1 205904 Matlacha Pass Bridge Replacement (CST UNDERWAY) 13,551,594 11,214,270 0 0 0 0 0 0 0 24,765,864 GT/IF22 Randy Cerchie, 533-8573Includes wide shoulders and ped facilities on both sides ALL CST/CEI [email protected] Repayment (Principal and Interest) 7,588,749 5,663,928 5,660,717 5,660,717 18,913,394 GT
2 204100 North Airport Rd. Ext. West (DES UNDERWAY) 0.62 237,068 587,932 3,745,000 0 0 0 0 3,745,000 0 4,570,000 LOAN Sarah Clarke, 533-87182L Extension, end of existing road to Metro Parkway, including on-road DES/ROW DES/ROW/RR RR/CST/CEI [email protected] lanes, a 10' multi-use path on north side and 6' sidewalk on south
GFRTF Loan Repayment - Principal ($3,845,000) 0 769,000 769,000 769,000 769,000 769,000 3,845,000 0 3,845,000 IF23
GFRTF Loan Repayment - Interest (0.5%) 0 500 15,380 11,535 7,690 3,845 38,950 38,950
2 North Airport Rd. Reconstruction 0 0 500,000 1,800,000 0 0 0 2,300,000 0 2,300,000 GT Sarah Clarke, 533-8718Reconstruct existing road to match cross-section of extension, including DES CST [email protected] bike lanes and sidewalks on both sides
2,4 Ortiz 4L/Colonial-MLK 1.73 0 0 0 0 0 0 0 0 10,941,000 10,941,000 IF23/AV Rob Phelan, 533-85944L widening, Colonial Blvd. to SR 82 (Dr. Martin Luther King, Jr. Blvd.), ALL [email protected] on-road bike lanes and sidewalks on both sides
5 205056 Ortiz 4L/Luckett-SR 80 1.33 8,395,896 3,143,404 0 0 0 0 0 0 9,709,000 21,248,300 IF23/AV Rob Phelan, 533-85944L widening, Luckett Rd. to SR 80 (Palm Beach Blvd.), including on-road DES/ROW ROW CST/CEI/LS [email protected] lanes and sidewalks on both sides
4,5 204072 Ortiz 4L/MLK-Luckett 1.25 8,578,403 465,695 0 0 0 0 0 0 9,703,000 18,747,098 IF23/AV Rob Phelan, 533-85944L widening, SR 82 (Dr. Martin Luther King, Jr. Blvd.) to Luckett Rd., DES/ROW ROW CST/CEI/LS [email protected] on-road bike lanes and sidewalks on both sides
ALL 206759 Signal System ATMS Upgrade 0 750,000 750,000 750,000 750,000 750,000 0 3,000,000 0 3,750,000 GT Mike Say, 533-9514Upgrade signal system, install ITS field equipment CST CST CST CST CST [email protected]
Project Summary Adopted 13-17 CIP.xlsx Page 2 10/1/12
Transportation Improvement Program FY 2013/14 through FY 2017/18
XIV - 12

SUMMARY OF MAJOR ROAD PROJECTS PROGRAMMED BY LEE COUNTY - FY 12/13 TO FY 16/17 (as adopted September 19, 2012)
FY 98-11 FUTURECOMM PROJ. LENGTH PRIOR FY 11/12 5-YEAR PROJECT REVENUE PROJECTDIST. NUMBER PROJECT NAME (MILES) EXP. BUDGET 12/13 13/14 14/15 15/16 16/17 TOTAL 6-10 TOTAL SOURCE MANAGER
2 204604 Six Mile Cypress Pkwy 4L (CST UNDERWAY) 2.30 4,277,606 4,442,696 1,500,000 0 0 0 0 1,500,000 0 10,220,302 IF23/CITY/ Rob Phelan, 533-8594N. of Daniels Pkwy. to S. of Winkler Ext. (funding includes ARRA ALL CST/CEI LS ARRA/[email protected] and State TRIP funds) AV
2 206007 Summerlin/Boyscout-Cypress Lake (CST COMPLETE) 2.60 33,516,239 3,843,063 880,000 0 0 0 0 880,000 0 38,239,302 IF23/AV Sarah Clarke, 533-87186L widening, including overpass at College Parkway ALL CST/ROW LS [email protected]
2 204053 Three Oaks Parkway Extension North 3.50 6,423,703 5,846,040 0 0 0 0 0 0 38,086,883 50,356,626 IF24 Sarah Clarke, 533-8718New 4L, N. of Alico Rd. to Daniels Pkwy., including on-road bike lanes DES/ROW DES/ROW ROW/CST [email protected] sidewalks on both sides
3 204043 Three Oaks Parkway Extension South (CST COMPLETE) 4.15 50,753,268 6,525,965 0 0 0 0 0 0 0 57,279,233 AV Sarah Clarke, 533-8718New 4L, East Terry St. to Coconut Road ALL ROW/LS [email protected]
1,2,3 Toll Interoperability 0 0 100,000 750,000 0 0 0 850,000 0 850,000 SURP. Sue Hopwood, 533-0157Upgrade hardware/software to maintain interoperability with other toll CST CST TOLLS [email protected]
1,2,3 Toll System Replacement 0 0 0 0 0 0 1,600,000 1,600,000 7,100,000 8,700,000 SURP. Sue Hopwood, 533-0157Funds for complete replacement due to technology changes CST CST TOLLS [email protected]
SUBTOTALS 43.02 205,362,430 60,320,081 16,257,000 13,767,208 12,829,205 24,709,248 14,299,248 81,861,909 194,989,224 542,533,644MAJOR MAINTENANCE PROJECTS
CW 404683 Road Resurface/Rebuild Program 42,898,305 4,808,112 3,500,000 3,500,000 5,000,000 5,000,000 5,000,000 22,000,000 25,000,000 94,706,417 GT Randy Cerchie, 533-8573Funds for rebuilding/resurfacing County-maintained roads as identified CST CST CST CST CST CST CST CST [email protected] systematic evaluation
CW 405714 Master Bridge Project 6,283,463 747,243 530,000 175,000 190,000 160,000 155,000 1,210,000 1,150,000 9,390,706 GT Ehab Guirguis, 533-9416Funds for capital repairs/replacement of small bridges and culverts as CST CST CST CST CST CST CST CST [email protected] throughout the year by inspections/critical events
CW 406024 Roadway Beautification 7,020,732 268,295 100,000 100,000 100,000 100,000 100,000 500,000 3,000,000 10,789,027 AV Ehab Guirguis, 533-9416Funds for installation of landscaping on existing roads, including funds LS LS LS LS LS LS LS LS [email protected] grants to community groups ($100,000 per year)
CW 406670 Signal Maintenance Upgrades 349,898 104,388 100,000 100,000 100,000 100,000 100,000 500,000 500,000 1,454,286 GT Mike Berens, 533-9500Fund to replace critical signal components as needed CST CST CST CST CST CST CST CST [email protected]
CW 406713 Master Signal Project/Major Intersections 6,570,222 2,344,904 1,500,000 1,500,000 1,500,000 1,500,000 1,500,000 7,500,000 7,500,000 23,915,126 GT Steve Jansen, 533-9507Funds for small-scale intersection improvements, including signalization CST CST CST CST CST CST CST CST [email protected]
5 406692 Intersection Equipment Replacement 0 250,000 250,000 0 0 0 0 250,000 0 500,000 GT Mike Say, 533-9514Replacing all signal equipment at College Pkwy/New Brittany and at CST CST [email protected] Hill Griffin Pkwy/FGCU Main Entrance
SUBTOTALS 63,122,620 8,522,942 5,980,000 5,375,000 6,890,000 6,860,000 6,855,000 31,960,000 37,150,000 140,755,562TOTAL 268,485,050 68,843,023 22,237,000 19,142,208 19,719,205 31,569,248 21,154,248 113,821,909 232,139,224 683,289,206
NOTE: Budget figures represent estimates for programming purposes. All dollar figures are subject to adjustment. Program year represents when funds are available, not necessarily when phase started or completed.Totals exclude loan repayments/interest.
KEY (PHASES): PRELIM = Preliminary Study; PD&E = Project Development & Environmental Study; DES = Design; ROW = Right-of-Way Acquisition; CST = Construction; CEI = Construction Engineering Inspection; PM = Project Management; LS = Landscaping;MIT = Mitigation
KEY (FUNDS): IF23 = Road Impact Fees from District 23; GT = Local Option Gas Taxes; CITY = City funds; PS = Public Safety funds; FDOT = Florida Dept. of Transportation; AV = Ad Valorem
Project Summary Adopted 13-17 CIP.xlsx Page 3 10/1/12
Transportation Improvement Program FY 2013/14 through FY 2017/18
XIV - 13

Transportation Improvement Program FY 2013/14 through FY 2017/18
XIV - 14

Transportation Improvement Program FY 2013/14 through FY 2017/18
XIV - 15
mmarion
Typewritten Text
City of Sanibel
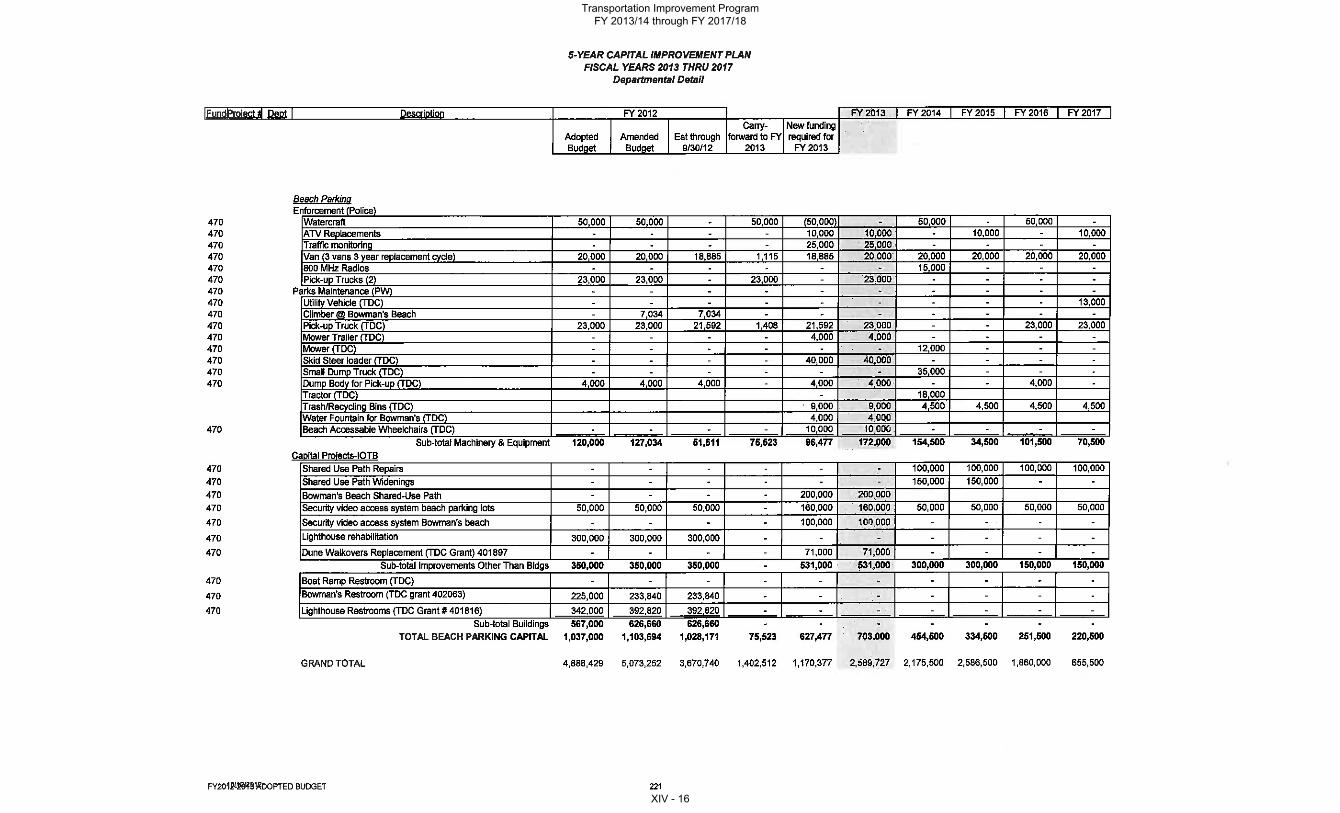
Transportation Improvement Program FY 2013/14 through FY 2017/18
XIV - 16
mmarion
Typewritten Text
City of Sanibel

SECTION XV FEDERALLY OBLIGATED PROJECTS
This section includes the annual listing of projects for which federal funds have been obligated in the preceding year (10/01/2011-9/30/2012). The list has been extracted from FDOT’s Web Site and included in this section as is, and the same list has also been posted in the MPO’s Web Site at www.leempo.com.
Transportation Improvement Program FY 2013/14 through FY 2017/18
XV - 1

Transportation Improvement Program FY 2013/14 through FY 2017/18
XV - 2
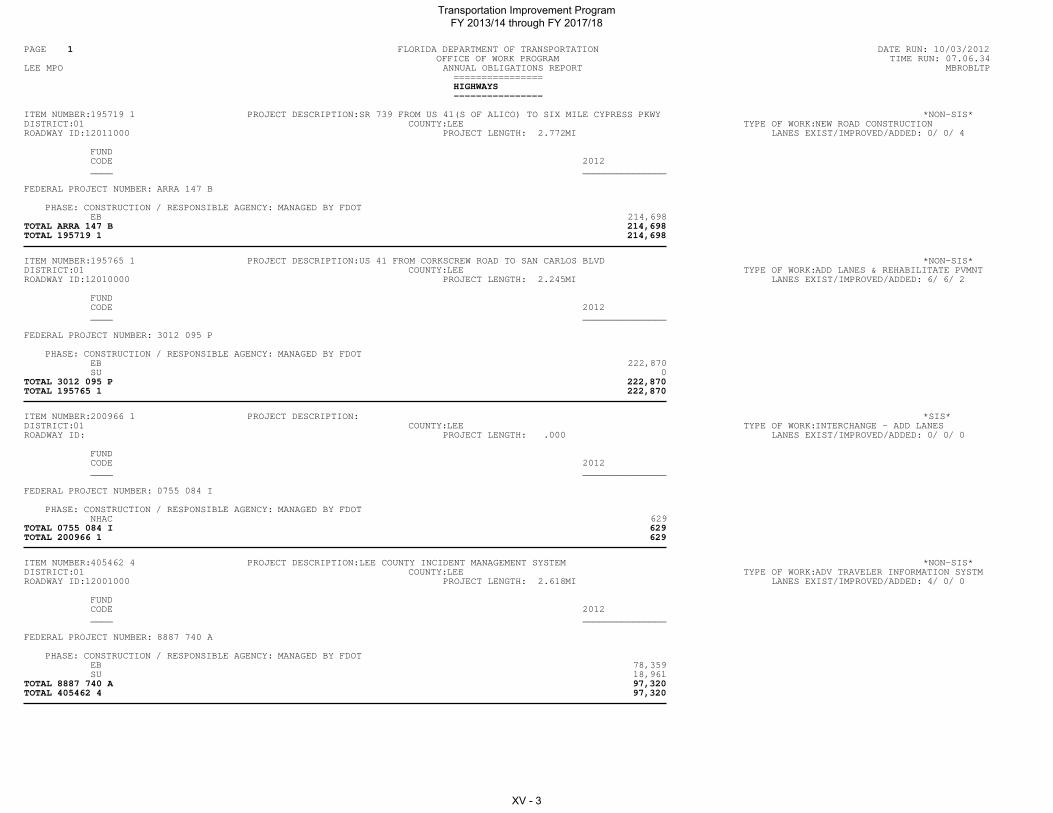
PAGE 1 FLORIDA DEPARTMENT OF TRANSPORTATION DATE RUN: 10/03/2012OFFICE OF WORK PROGRAM TIME RUN: 07.06.34
LEE MPO ANNUAL OBLIGATIONS REPORT MBROBLTP================HIGHWAYS================
ITEM NUMBER:195719 1 PROJECT DESCRIPTION:SR 739 FROM US 41(S OF ALICO) TO SIX MILE CYPRESS PKWY *NON-SIS*DISTRICT:01 COUNTY:LEE TYPE OF WORK:NEW ROAD CONSTRUCTIONROADWAY ID:12011000 PROJECT LENGTH: 2.772MI LANES EXIST/IMPROVED/ADDED: 0/ 0/ 4
FUNDCODE 2012____ _______________
FEDERAL PROJECT NUMBER: ARRA 147 B
PHASE: CONSTRUCTION / RESPONSIBLE AGENCY: MANAGED BY FDOTEB 214,698
TOTAL ARRA 147 B 214,698TOTAL 195719 1 214,698
ITEM NUMBER:195765 1 PROJECT DESCRIPTION:US 41 FROM CORKSCREW ROAD TO SAN CARLOS BLVD *NON-SIS*DISTRICT:01 COUNTY:LEE TYPE OF WORK:ADD LANES & REHABILITATE PVMNTROADWAY ID:12010000 PROJECT LENGTH: 2.245MI LANES EXIST/IMPROVED/ADDED: 6/ 6/ 2
FUNDCODE 2012____ _______________
FEDERAL PROJECT NUMBER: 3012 095 P
PHASE: CONSTRUCTION / RESPONSIBLE AGENCY: MANAGED BY FDOTEB 222,870SU 0
TOTAL 3012 095 P 222,870TOTAL 195765 1 222,870
ITEM NUMBER:200966 1 PROJECT DESCRIPTION: *SIS*DISTRICT:01 COUNTY:LEE TYPE OF WORK:INTERCHANGE - ADD LANESROADWAY ID: PROJECT LENGTH: .000 LANES EXIST/IMPROVED/ADDED: 0/ 0/ 0
FUNDCODE 2012____ _______________
FEDERAL PROJECT NUMBER: 0755 084 I
PHASE: CONSTRUCTION / RESPONSIBLE AGENCY: MANAGED BY FDOTNHAC 629
TOTAL 0755 084 I 629TOTAL 200966 1 629
ITEM NUMBER:405462 4 PROJECT DESCRIPTION:LEE COUNTY INCIDENT MANAGEMENT SYSTEM *NON-SIS*DISTRICT:01 COUNTY:LEE TYPE OF WORK:ADV TRAVELER INFORMATION SYSTMROADWAY ID:12001000 PROJECT LENGTH: 2.618MI LANES EXIST/IMPROVED/ADDED: 4/ 0/ 0
FUNDCODE 2012____ _______________
FEDERAL PROJECT NUMBER: 8887 740 A
PHASE: CONSTRUCTION / RESPONSIBLE AGENCY: MANAGED BY FDOTEB 78,359SU 18,961
TOTAL 8887 740 A 97,320TOTAL 405462 4 97,320
Transportation Improvement Program FY 2013/14 through FY 2017/18
XV - 3

PAGE 2 FLORIDA DEPARTMENT OF TRANSPORTATION DATE RUN: 10/03/2012OFFICE OF WORK PROGRAM TIME RUN: 07.06.34
LEE MPO ANNUAL OBLIGATIONS REPORT MBROBLTP================HIGHWAYS================
ITEM NUMBER:406225 3 PROJECT DESCRIPTION:I-75 AT CORKSCREW INTERCHANGE *SIS*DISTRICT:01 COUNTY:LEE TYPE OF WORK:INTERCHANGE IMPROVEMENTROADWAY ID:12075000 PROJECT LENGTH: .983MI LANES EXIST/IMPROVED/ADDED: 4/ 4/ 0
FUNDCODE 2012____ _______________
FEDERAL PROJECT NUMBER: 0755 081 I
PHASE: GRANTS AND MISCELLANEOUS / RESPONSIBLE AGENCY: MANAGED BY FDOTEB 144,480SA 185,401
TOTAL 0755 081 I 329,881TOTAL 406225 3 329,881
ITEM NUMBER:411038 1 PROJECT DESCRIPTION:I-75 FROM S OF LUCKETT ROAD TO S OF SR 80 *SIS*DISTRICT:01 COUNTY:LEE TYPE OF WORK:ADD LANES & RECONSTRUCTROADWAY ID:12075000 PROJECT LENGTH: 1.667MI LANES EXIST/IMPROVED/ADDED: 4/ 4/ 2
FUNDCODE 2012____ _______________
FEDERAL PROJECT NUMBER: 0751 175 I
PHASE: RAILROAD AND UTILITIES / RESPONSIBLE AGENCY: MANAGED BY FDOTNH 59,047
PHASE: CONSTRUCTION / RESPONSIBLE AGENCY: MANAGED BY FDOTACNH 73,000RED 20,990
TOTAL 0751 175 I 153,037TOTAL 411038 1 153,037
ITEM NUMBER:411042 1 PROJECT DESCRIPTION:I-75 AT SR 80 INTERCHANGE *SIS*DISTRICT:01 COUNTY:LEE TYPE OF WORK:INTERCHANGE IMPROVEMENTROADWAY ID:12075000 PROJECT LENGTH: 1.000MI LANES EXIST/IMPROVED/ADDED: 4/ 4/ 2
FUNDCODE 2012____ _______________
FEDERAL PROJECT NUMBER: 0751 130 I
PHASE: PRELIMINARY ENGINEERING / RESPONSIBLE AGENCY: MANAGED BY FDOTNHAC 2,909
TOTAL 0751 130 I 2,909
FEDERAL PROJECT NUMBER: 0751 176 I
PHASE: RAILROAD AND UTILITIES / RESPONSIBLE AGENCY: MANAGED BY FDOTNH 26,119
PHASE: CONSTRUCTION / RESPONSIBLE AGENCY: MANAGED BY FDOTACNH 56,000NH 256,584
TOTAL 0751 176 I 338,703TOTAL 411042 1 341,612
Transportation Improvement Program FY 2013/14 through FY 2017/18
XV - 4

PAGE 3 FLORIDA DEPARTMENT OF TRANSPORTATION DATE RUN: 10/03/2012OFFICE OF WORK PROGRAM TIME RUN: 07.06.34
LEE MPO ANNUAL OBLIGATIONS REPORT MBROBLTP================HIGHWAYS================
ITEM NUMBER:412636 1 PROJECT DESCRIPTION:LEE COUNTY COMPUTER SIGNAL SYSTEM UPDATE *NON-SIS*DISTRICT:01 COUNTY:LEE TYPE OF WORK:TRAFFIC CONTROL DEVICES/SYSTEMROADWAY ID: PROJECT LENGTH: .000 LANES EXIST/IMPROVED/ADDED: 0/ 0/ 0
FUNDCODE 2012____ _______________
FEDERAL PROJECT NUMBER: 8887 820 A
PHASE: PRELIMINARY ENGINEERING / RESPONSIBLE AGENCY: MANAGED BY FDOTEB 21,375
TOTAL 8887 820 A 21,375TOTAL 412636 1 21,375
ITEM NUMBER:412636 2 PROJECT DESCRIPTION:LEE COUNTY COMPUTER SIGNAL SYSTEM UPDATE PHASE I *NON-SIS*DISTRICT:01 COUNTY:LEE TYPE OF WORK:TRAFFIC CONTROL DEVICES/SYSTEMROADWAY ID:12000000 PROJECT LENGTH: .001MI LANES EXIST/IMPROVED/ADDED: 0/ 0/ 0
FUNDCODE 2012____ _______________
FEDERAL PROJECT NUMBER: 8886 052 A
PHASE: CONSTRUCTION / RESPONSIBLE AGENCY: MANAGED BY FDOTACSU 3,536,026EB 20,000SU 2,878,088
TOTAL 8886 052 A 6,434,114TOTAL 412636 2 6,434,114
ITEM NUMBER:413066 1 PROJECT DESCRIPTION:I-75 FROM N OF SR 80 TO SOUTH OF SR 78 *SIS*DISTRICT:01 COUNTY:LEE TYPE OF WORK:BRIDGE-REHAB AND ADD LANESROADWAY ID:12075000 PROJECT LENGTH: 1.583MI LANES EXIST/IMPROVED/ADDED: 4/ 4/ 2
FUNDCODE 2012____ _______________
FEDERAL PROJECT NUMBER: 0755 086 I
PHASE: GRANTS AND MISCELLANEOUS / RESPONSIBLE AGENCY: MANAGED BY FDOTNHAC 449,580
TOTAL 0755 086 I 449,580
FEDERAL PROJECT NUMBER: 0755 097 I
PHASE: CONSTRUCTION / RESPONSIBLE AGENCY: MANAGED BY FDOTACSA 125,000NH 14,043,858NHAC 0
PHASE: REPAYMENTS / RESPONSIBLE AGENCY: MANAGED BY FDOTACNH 80,000,000
TOTAL 0755 097 I 94,168,858TOTAL 413066 1 94,618,438
ITEM NUMBER:413695 1 PROJECT DESCRIPTION:SR 78 (PINE ISLAND) FROM BURNT STORE ROAD TO W OF CHIQUITA BLVD *NON-SIS*DISTRICT:01 COUNTY:LEE TYPE OF WORK:ADD LANES & RECONSTRUCTROADWAY ID:12060000 PROJECT LENGTH: 1.940MI LANES EXIST/IMPROVED/ADDED: 4/ 4/ 2
FUNDCODE 2012____ _______________
FEDERAL PROJECT NUMBER: 1061 030 P
PHASE: PRELIMINARY ENGINEERING / RESPONSIBLE AGENCY: MANAGED BY FDOTSU 0
TOTAL 1061 030 P 0
Transportation Improvement Program FY 2013/14 through FY 2017/18
XV - 5
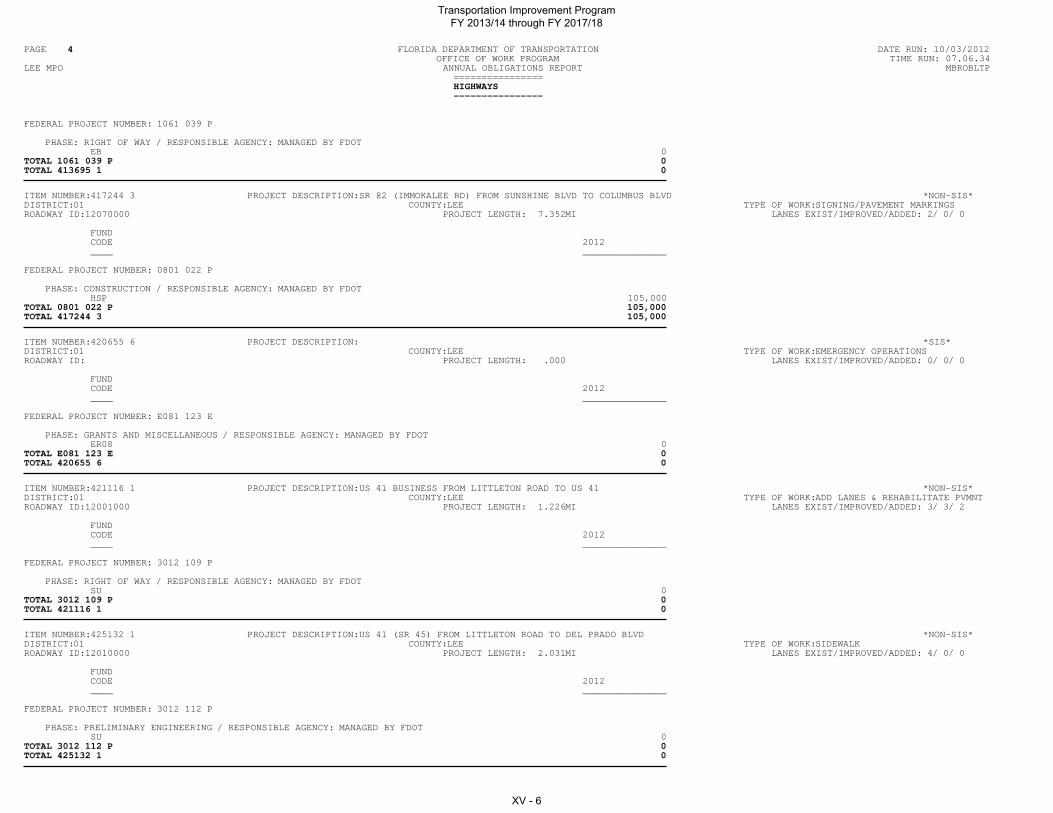
PAGE 4 FLORIDA DEPARTMENT OF TRANSPORTATION DATE RUN: 10/03/2012OFFICE OF WORK PROGRAM TIME RUN: 07.06.34
LEE MPO ANNUAL OBLIGATIONS REPORT MBROBLTP================HIGHWAYS================
FEDERAL PROJECT NUMBER: 1061 039 P
PHASE: RIGHT OF WAY / RESPONSIBLE AGENCY: MANAGED BY FDOTEB 0
TOTAL 1061 039 P 0TOTAL 413695 1 0
ITEM NUMBER:417244 3 PROJECT DESCRIPTION:SR 82 (IMMOKALEE RD) FROM SUNSHINE BLVD TO COLUMBUS BLVD *NON-SIS*DISTRICT:01 COUNTY:LEE TYPE OF WORK:SIGNING/PAVEMENT MARKINGSROADWAY ID:12070000 PROJECT LENGTH: 7.352MI LANES EXIST/IMPROVED/ADDED: 2/ 0/ 0
FUNDCODE 2012____ _______________
FEDERAL PROJECT NUMBER: 0801 022 P
PHASE: CONSTRUCTION / RESPONSIBLE AGENCY: MANAGED BY FDOTHSP 105,000
TOTAL 0801 022 P 105,000TOTAL 417244 3 105,000
ITEM NUMBER:420655 6 PROJECT DESCRIPTION: *SIS*DISTRICT:01 COUNTY:LEE TYPE OF WORK:EMERGENCY OPERATIONSROADWAY ID: PROJECT LENGTH: .000 LANES EXIST/IMPROVED/ADDED: 0/ 0/ 0
FUNDCODE 2012____ _______________
FEDERAL PROJECT NUMBER: E081 123 E
PHASE: GRANTS AND MISCELLANEOUS / RESPONSIBLE AGENCY: MANAGED BY FDOTER08 0
TOTAL E081 123 E 0TOTAL 420655 6 0
ITEM NUMBER:421116 1 PROJECT DESCRIPTION:US 41 BUSINESS FROM LITTLETON ROAD TO US 41 *NON-SIS*DISTRICT:01 COUNTY:LEE TYPE OF WORK:ADD LANES & REHABILITATE PVMNTROADWAY ID:12001000 PROJECT LENGTH: 1.226MI LANES EXIST/IMPROVED/ADDED: 3/ 3/ 2
FUNDCODE 2012____ _______________
FEDERAL PROJECT NUMBER: 3012 109 P
PHASE: RIGHT OF WAY / RESPONSIBLE AGENCY: MANAGED BY FDOTSU 0
TOTAL 3012 109 P 0TOTAL 421116 1 0
ITEM NUMBER:425132 1 PROJECT DESCRIPTION:US 41 (SR 45) FROM LITTLETON ROAD TO DEL PRADO BLVD *NON-SIS*DISTRICT:01 COUNTY:LEE TYPE OF WORK:SIDEWALKROADWAY ID:12010000 PROJECT LENGTH: 2.031MI LANES EXIST/IMPROVED/ADDED: 4/ 0/ 0
FUNDCODE 2012____ _______________
FEDERAL PROJECT NUMBER: 3012 112 P
PHASE: PRELIMINARY ENGINEERING / RESPONSIBLE AGENCY: MANAGED BY FDOTSU 0
TOTAL 3012 112 P 0TOTAL 425132 1 0
Transportation Improvement Program FY 2013/14 through FY 2017/18
XV - 6

PAGE 5 FLORIDA DEPARTMENT OF TRANSPORTATION DATE RUN: 10/03/2012OFFICE OF WORK PROGRAM TIME RUN: 07.06.34
LEE MPO ANNUAL OBLIGATIONS REPORT MBROBLTP================HIGHWAYS================
ITEM NUMBER:425841 1 PROJECT DESCRIPTION:SR 82 FROM CR 884 (LEE BLVD) TO SHAWNEE ROAD *NON-SIS*DISTRICT:01 COUNTY:LEE TYPE OF WORK:ADD LANES & RECONSTRUCTROADWAY ID:12070000 PROJECT LENGTH: 4.462MI LANES EXIST/IMPROVED/ADDED: 2/ 2/ 4
FUNDCODE 2012____ _______________
FEDERAL PROJECT NUMBER: 0801 021 P
PHASE: PRELIMINARY ENGINEERING / RESPONSIBLE AGENCY: MANAGED BY FDOTEB 224,652SU 0
TOTAL 0801 021 P 224,652TOTAL 425841 1 224,652
ITEM NUMBER:427306 1 PROJECT DESCRIPTION:SR 884 AT SIX MILE CYPRESS *NON-SIS*DISTRICT:01 COUNTY:LEE TYPE OF WORK:TRAFFIC SIGNALSROADWAY ID:12005000 PROJECT LENGTH: .049MI LANES EXIST/IMPROVED/ADDED: 6/ 0/ 0
FUNDCODE 2012____ _______________
FEDERAL PROJECT NUMBER: 0861 018 P
PHASE: CONSTRUCTION / RESPONSIBLE AGENCY: MANAGED BY FDOTHSP 5,264
TOTAL 0861 018 P 5,264TOTAL 427306 1 5,264
ITEM NUMBER:427352 1 PROJECT DESCRIPTION:BEN C PRATT/6 MILE CYPRESS FROM N OF CR 865 (DANIELS) TO S OF WINKLER *NON-SIS*DISTRICT:01 COUNTY:LEE TYPE OF WORK:ADD LANES & REHABILITATE PVMNTROADWAY ID:12570000 PROJECT LENGTH: 3.080MI LANES EXIST/IMPROVED/ADDED: 4/ 4/ 2
FUNDCODE 2012____ _______________
FEDERAL PROJECT NUMBER: ARRA 544 B
PHASE: CONSTRUCTION / RESPONSIBLE AGENCY: MANAGED BY FDOTSU 0
TOTAL ARRA 544 B 0TOTAL 427352 1 0
ITEM NUMBER:428107 1 PROJECT DESCRIPTION:HANSON STREET FROM CORTEZ BLVD TO US 41 (SR 45) *NON-SIS*DISTRICT:01 COUNTY:LEE TYPE OF WORK:SIDEWALKROADWAY ID:12000000 PROJECT LENGTH: .485MI LANES EXIST/IMPROVED/ADDED: 0/ 0/ 0
FUNDCODE 2012____ _______________
FEDERAL PROJECT NUMBER: 3012 101 P
PHASE: CONSTRUCTION / RESPONSIBLE AGENCY: MANAGED BY FDOTSE 29,205
TOTAL 3012 101 P 29,205TOTAL 428107 1 29,205
Transportation Improvement Program FY 2013/14 through FY 2017/18
XV - 7

PAGE 6 FLORIDA DEPARTMENT OF TRANSPORTATION DATE RUN: 10/03/2012OFFICE OF WORK PROGRAM TIME RUN: 07.06.34
LEE MPO ANNUAL OBLIGATIONS REPORT MBROBLTP================HIGHWAYS================
ITEM NUMBER:428109 1 PROJECT DESCRIPTION:MICHIGAN AVENUE FROM MICHIGAN AVE LINK E OF CLOTILDE (DEAD END) *NON-SIS*DISTRICT:01 COUNTY:LEE TYPE OF WORK:SIDEWALKROADWAY ID:12000000 PROJECT LENGTH: .350MI LANES EXIST/IMPROVED/ADDED: 0/ 0/ 0
FUNDCODE 2012____ _______________
FEDERAL PROJECT NUMBER: 3012 099 P
PHASE: CONSTRUCTION / RESPONSIBLE AGENCY: MANAGED BY FDOTSE 15,500
TOTAL 3012 099 P 15,500TOTAL 428109 1 15,500
ITEM NUMBER:428251 1 PROJECT DESCRIPTION:TRAFALGAR ELEMENTARY SIDEWALKS SAFE ROUTES TO SCHOOL *NON-SIS*DISTRICT:01 COUNTY:LEE TYPE OF WORK:SIDEWALKROADWAY ID:12000000 PROJECT LENGTH: .001MI LANES EXIST/IMPROVED/ADDED: 0/ 0/ 0
FUNDCODE 2012____ _______________
FEDERAL PROJECT NUMBER: SRTS 271 A
PHASE: CONSTRUCTION / RESPONSIBLE AGENCY: MANAGED BY CITY OF CAPE CORALSR2S 0
PHASE: CONSTRUCTION / RESPONSIBLE AGENCY: MANAGED BY FDOTSR2S 0
TOTAL SRTS 271 A 0TOTAL 428251 1 0
ITEM NUMBER:428253 1 PROJECT DESCRIPTION:JAMES STEPHENS INT'T ACADEMY SIDEWALK SAFE ROUTES TO SCHOOL *NON-SIS*DISTRICT:01 COUNTY:LEE TYPE OF WORK:SIDEWALKROADWAY ID:12000000 PROJECT LENGTH: .001MI LANES EXIST/IMPROVED/ADDED: 0/ 0/ 0
FUNDCODE 2012____ _______________
FEDERAL PROJECT NUMBER: SRTS 284 A
PHASE: PRELIMINARY ENGINEERING / RESPONSIBLE AGENCY: MANAGED BY FDOTSR2S 0
TOTAL SRTS 284 A 0TOTAL 428253 1 0
ITEM NUMBER:428734 1 PROJECT DESCRIPTION:SR 865 (SAN CARLOS BLVD) FROM ESTERO BLVD TO MAIN STREET *NON-SIS*DISTRICT:01 COUNTY:LEE TYPE OF WORK:BRIDGE REHABILITATIONROADWAY ID:12004000 PROJECT LENGTH: .643MI LANES EXIST/IMPROVED/ADDED: 2/ 0/ 0
FUNDCODE 2012____ _______________
FEDERAL PROJECT NUMBER: ARRA 707 B
PHASE: CONSTRUCTION / RESPONSIBLE AGENCY: MANAGED BY FDOTSU 1,482
TOTAL ARRA 707 B 1,482TOTAL 428734 1 1,482
Transportation Improvement Program FY 2013/14 through FY 2017/18
XV - 8

PAGE 7 FLORIDA DEPARTMENT OF TRANSPORTATION DATE RUN: 10/03/2012OFFICE OF WORK PROGRAM TIME RUN: 07.06.34
LEE MPO ANNUAL OBLIGATIONS REPORT MBROBLTP================HIGHWAYS================
ITEM NUMBER:429201 1 PROJECT DESCRIPTION:GULF ELEMENTARY AND MIDDLE SHOOLS - SRTS SWK SAFETY *NON-SIS*DISTRICT:01 COUNTY:LEE TYPE OF WORK:SIDEWALKROADWAY ID: PROJECT LENGTH: .000 LANES EXIST/IMPROVED/ADDED: 0/ 0/ 0
FUNDCODE 2012____ _______________
FEDERAL PROJECT NUMBER: 8886 262 A
PHASE: CONSTRUCTION / RESPONSIBLE AGENCY: MANAGED BY CITY OF CAPE CORALSE 0
PHASE: CONSTRUCTION / RESPONSIBLE AGENCY: MANAGED BY FDOTSE 0
TOTAL 8886 262 A 0TOTAL 429201 1 0
ITEM NUMBER:429488 1 PROJECT DESCRIPTION:SR 78 FROM 300' EAST OF US 41 B TO N EVALENA LANE *NON-SIS*DISTRICT:01 COUNTY:LEE TYPE OF WORK:LIGHTINGROADWAY ID:12060000 PROJECT LENGTH: .502MI LANES EXIST/IMPROVED/ADDED: 4/ 0/ 0
FUNDCODE 2012____ _______________
FEDERAL PROJECT NUMBER: 1061 040 P
PHASE: PRELIMINARY ENGINEERING / RESPONSIBLE AGENCY: MANAGED BY FDOTHSP 0
TOTAL 1061 040 P 0TOTAL 429488 1 0
ITEM NUMBER:429509 1 PROJECT DESCRIPTION:US 41 SR 45 FROM HANSON STREET TO SR 82 *NON-SIS*DISTRICT:01 COUNTY:LEE TYPE OF WORK:PEDESTRIAN SAFETY IMPROVEMENTROADWAY ID:12010000 PROJECT LENGTH: 1.349MI LANES EXIST/IMPROVED/ADDED: 6/ 0/ 0
FUNDCODE 2012____ _______________
FEDERAL PROJECT NUMBER: 3012 114 P
PHASE: PRELIMINARY ENGINEERING / RESPONSIBLE AGENCY: MANAGED BY FDOTHSP 0SA 0
TOTAL 3012 114 P 0TOTAL 429509 1 0
ITEM NUMBER:429838 1 PROJECT DESCRIPTION:EUGENIA AVE FROM W OF MARSH AVE TO E OF CLOTILDE AVE *NON-SIS*DISTRICT:01 COUNTY:LEE TYPE OF WORK:SIDEWALKROADWAY ID: PROJECT LENGTH: .000 LANES EXIST/IMPROVED/ADDED: 0/ 0/ 0
FUNDCODE 2012____ _______________
FEDERAL PROJECT NUMBER: 8887 982 A
PHASE: CONSTRUCTION / RESPONSIBLE AGENCY: MANAGED BY FDOTSE 1,000
PHASE: CONSTRUCTION / RESPONSIBLE AGENCY: RESPONSIBLE AGENCY NOT AVAILABLESE 290,491
TOTAL 8887 982 A 291,491TOTAL 429838 1 291,491
Transportation Improvement Program FY 2013/14 through FY 2017/18
XV - 9

PAGE 8 FLORIDA DEPARTMENT OF TRANSPORTATION DATE RUN: 10/03/2012OFFICE OF WORK PROGRAM TIME RUN: 07.06.34
LEE MPO ANNUAL OBLIGATIONS REPORT MBROBLTP================HIGHWAYS================
ITEM NUMBER:429980 1 PROJECT DESCRIPTION:I 75 FROM CORKSCREW RD TO LUCKETT RD *SIS*DISTRICT:01 COUNTY:LEE TYPE OF WORK:OVERHEAD SIGNINGROADWAY ID:12075000 PROJECT LENGTH: 15.789MI LANES EXIST/IMPROVED/ADDED: 6/ 0/ 0
FUNDCODE 2012____ _______________
FEDERAL PROJECT NUMBER: 0754 162 I
PHASE: PRELIMINARY ENGINEERING / RESPONSIBLE AGENCY: MANAGED BY FDOTSA 83,399
TOTAL 0754 162 I 83,399TOTAL 429980 1 83,399
ITEM NUMBER:430037 1 PROJECT DESCRIPTION:TICE ELEMENTARY SIDEWALKS *NON-SIS*DISTRICT:01 COUNTY:LEE TYPE OF WORK:SIDEWALKROADWAY ID:12000000 PROJECT LENGTH: .159MI LANES EXIST/IMPROVED/ADDED: 0/ 0/ 0
FUNDCODE 2012____ _______________
FEDERAL PROJECT NUMBER: SRTS 191 A
PHASE: CONSTRUCTION / RESPONSIBLE AGENCY: MANAGED BY FDOTSR2S 124,913
TOTAL SRTS 191 A 124,913TOTAL 430037 1 124,913
ITEM NUMBER:430856 1 PROJECT DESCRIPTION:US 41 (SR 45) AT WINKLER AVENUE *NON-SIS*DISTRICT:01 COUNTY:LEE TYPE OF WORK:TRAFFIC SIGNAL UPDATEROADWAY ID:12010000 PROJECT LENGTH: .219MI LANES EXIST/IMPROVED/ADDED: 6/ 0/ 0
FUNDCODE 2012____ _______________
FEDERAL PROJECT NUMBER: 3012 117 P
PHASE: PRELIMINARY ENGINEERING / RESPONSIBLE AGENCY: MANAGED BY FDOTHSP 0SA 0
TOTAL 3012 117 P 0TOTAL 430856 1 0
ITEM NUMBER:430858 1 PROJECT DESCRIPTION:SR 82 AT VERONICA SHOEMAKER BLVD ONE WAY PAIR *NON-SIS*DISTRICT:01 COUNTY:LEE TYPE OF WORK:INTERSECTION IMPROVEMENTROADWAY ID:12070000 PROJECT LENGTH: .180MI LANES EXIST/IMPROVED/ADDED: 4/ 0/ 0
FUNDCODE 2012____ _______________
FEDERAL PROJECT NUMBER: 0801 027 P
PHASE: PRELIMINARY ENGINEERING / RESPONSIBLE AGENCY: MANAGED BY FDOTHSP 35,253
TOTAL 0801 027 P 35,253TOTAL 430858 1 35,253
Transportation Improvement Program FY 2013/14 through FY 2017/18
XV - 10

PAGE 9 FLORIDA DEPARTMENT OF TRANSPORTATION DATE RUN: 10/03/2012OFFICE OF WORK PROGRAM TIME RUN: 07.06.34
LEE MPO ANNUAL OBLIGATIONS REPORT MBROBLTP================HIGHWAYS================
ITEM NUMBER:430864 1 PROJECT DESCRIPTION:SR 884 (COLONIAL BLVD) AT US 41 (SR 45) *NON-SIS*DISTRICT:01 COUNTY:LEE TYPE OF WORK:INTERSECTION IMPROVEMENTROADWAY ID:12005000 PROJECT LENGTH: 1.057MI LANES EXIST/IMPROVED/ADDED: 6/ 0/ 0
FUNDCODE 2012____ _______________
FEDERAL PROJECT NUMBER: 0861 019 P
PHASE: PRELIMINARY ENGINEERING / RESPONSIBLE AGENCY: MANAGED BY FDOTHSP 37,273SA 0
TOTAL 0861 019 P 37,273TOTAL 430864 1 37,273
ITEM NUMBER:430865 1 PROJECT DESCRIPTION:US 41 (SR45) AT CORTEZ BLVD / EDISON AVE *NON-SIS*DISTRICT:01 COUNTY:LEE TYPE OF WORK:TRAFFIC SIGNAL UPDATEROADWAY ID:12010000 PROJECT LENGTH: .285MI LANES EXIST/IMPROVED/ADDED: 6/ 0/ 0
FUNDCODE 2012____ _______________
FEDERAL PROJECT NUMBER: 3012 115 P
PHASE: PRELIMINARY ENGINEERING / RESPONSIBLE AGENCY: MANAGED BY FDOTHSP 0SA 0
TOTAL 3012 115 P 0TOTAL 430865 1 0
ITEM NUMBER:431726 1 PROJECT DESCRIPTION:SR 82 AT GREGORY AVE S *NON-SIS*DISTRICT:01 COUNTY:LEE TYPE OF WORK:INTERSECTION IMPROVEMENTROADWAY ID:12070000 PROJECT LENGTH: .406MI LANES EXIST/IMPROVED/ADDED: 2/ 0/ 0
FUNDCODE 2012____ _______________
FEDERAL PROJECT NUMBER: 0801 023 P
PHASE: PRELIMINARY ENGINEERING / RESPONSIBLE AGENCY: MANAGED BY FDOTHSP 37,989
TOTAL 0801 023 P 37,989TOTAL 431726 1 37,989
ITEM NUMBER:431727 1 PROJECT DESCRIPTION:SR 82 AT HAVILAND AVE S *NON-SIS*DISTRICT:01 COUNTY:LEE TYPE OF WORK:INTERSECTION IMPROVEMENTROADWAY ID:12070000 PROJECT LENGTH: .400MI LANES EXIST/IMPROVED/ADDED: 2/ 0/ 0
FUNDCODE 2012____ _______________
FEDERAL PROJECT NUMBER: 0801 025 P
PHASE: PRELIMINARY ENGINEERING / RESPONSIBLE AGENCY: MANAGED BY FDOTHSP 36,962
TOTAL 0801 025 P 36,962TOTAL 431727 1 36,962TOTAL DIST: 01 103,462,357TOTAL HIGHWAYS 103,462,357
Transportation Improvement Program FY 2013/14 through FY 2017/18
XV - 11

PAGE 10 FLORIDA DEPARTMENT OF TRANSPORTATION DATE RUN: 10/03/2012OFFICE OF WORK PROGRAM TIME RUN: 07.06.34
LEE MPO ANNUAL OBLIGATIONS REPORT MBROBLTP================PLANNING================
ITEM NUMBER:420869 1 PROJECT DESCRIPTION:LEE COUNTY MPO FY 2010/2011 UPWP *NON-SIS*DISTRICT:01 COUNTY:LEE TYPE OF WORK:TRANSPORTATION PLANNINGROADWAY ID: PROJECT LENGTH: .000 LANES EXIST/IMPROVED/ADDED: 0/ 0/ 0
FUNDCODE 2012____ _______________
FEDERAL PROJECT NUMBER: 0261 048 M
PHASE: PRELIMINARY ENGINEERING / RESPONSIBLE AGENCY: RESPONSIBLE AGENCY NOT AVAILABLEPL 340,918
TOTAL 0261 048 M 340,918TOTAL 420869 1 340,918
ITEM NUMBER:423642 1 PROJECT DESCRIPTION:LEE COUNTY MPO FY 2013/2014 UPWP *NON-SIS*DISTRICT:01 COUNTY:LEE TYPE OF WORK:TRANSPORTATION PLANNINGROADWAY ID: PROJECT LENGTH: .000 LANES EXIST/IMPROVED/ADDED: 0/ 0/ 0
FUNDCODE 2012____ _______________
FEDERAL PROJECT NUMBER: 0261 049 M
PHASE: PRELIMINARY ENGINEERING / RESPONSIBLE AGENCY: RESPONSIBLE AGENCY NOT AVAILABLEPL 168,543
TOTAL 0261 049 M 168,543TOTAL 423642 1 168,543TOTAL DIST: 01 509,461TOTAL PLANNING 509,461
Transportation Improvement Program FY 2013/14 through FY 2017/18
XV - 12

PAGE 11 FLORIDA DEPARTMENT OF TRANSPORTATION DATE RUN: 10/03/2012OFFICE OF WORK PROGRAM TIME RUN: 07.06.34
LEE MPO ANNUAL OBLIGATIONS REPORT MBROBLTP================MISCELLANEOUS================
ITEM NUMBER:429960 1 PROJECT DESCRIPTION:LEE COUNTY TRAFFIC MANAGEMENT CENTER OPERATIONS *NON-SIS*DISTRICT:01 COUNTY:LEE TYPE OF WORK:TRAFFIC MANAGEMENT CENTERSROADWAY ID: PROJECT LENGTH: .000 LANES EXIST/IMPROVED/ADDED: 0/ 0/ 0
FUNDCODE 2012____ _______________
FEDERAL PROJECT NUMBER: 8886 060 A
PHASE: GRANTS AND MISCELLANEOUS / RESPONSIBLE AGENCY: MANAGED BY LEE COUNTY BOCCSU 100,000
TOTAL 8886 060 A 100,000TOTAL 429960 1 100,000TOTAL DIST: 01 100,000TOTAL MISCELLANEOUS 100,000
GRAND TOTAL 104,071,818
Transportation Improvement Program FY 2013/14 through FY 2017/18
XV - 13

Transportation Improvement Program FY 2013/14 through FY 2017/18
XV - 14

SECTION XVI ROLL FORWARD AMENDMENTS
Transportation Improvement Program FY 2013/14 through FY 2017/18
XVI - 1

Transportation Improvement Program FY 2013/14 through FY 2017/18
XVI - 2

SECTION XVI ROLL FORWARD AMENDMENTS
August 16, 2013
PHASE FUND MANAGED BY LESS THAN
2014 2013/14 2014/15 2015/16 2016/17 2017/18 GREATER
THAN 2018 ALL YEARS
FPN: 1957652 CST DDR FDOT 50,000 0 0 0 0 0 50,000
PROJECT: US 41
from Corkscrew Rd to San Carlos Blvd. TOTAL 50,000 50,000
DESC. Landscaping
PROJ. LENGTH: 2.237
BEGIN MILE POST: 7.938
END MILE POST: 10.175
COMMENTS:
RESPONSIBLE AGENCY: Lee County
LRTP REFERENCE: Table 9, Appendix F, Page 12

SECTION XVII FEDERAL LANDS APPROPRIATIONS
(Eastern Federal Lands Highway Division)
This section of the Transportation Improvement Plan (TIP) consists of the Eastern Federal Lands Highway Division (EFLHD) FY 2014-2017 Transportation Improvement Program (TIP) developed a for transportation projects within Federal Lands. The Federal requirement under Title 23 U.S.C. § 204 requires that the TIP be developed as part of the transportation planning process for Federal Lands projects. Please note that this TIP is not an all-inclusive transportation program for all Federal agencies. Rather, it is representative of those projects that are approved by the FHWA to utilize FLHP funding. Funding Sources •Park Roads and Parkways PRP Program (PRP) •Public Lands Highway-Forest Highway Program (PFH) •Public Lands Highway Discretionary Program (PLH-D) •Refuge Roads Program (RR) •Indian Reservation Roads Program (IRR) •Emergency Relief for Federally Owned Roads Program (ERFO) •FLMA Funds (NPS, FS, FWS, DOD, ETC.) •Miscellaneous Department of Transportation (DOT) Appropriations (Misc) •Surface Transportation Program (STP) •National Highway Systems (NHS) •Highway Bridge Replacement and Rehabilitation Program (HBRR) Transportation Improvement Program (TIP) Overview Selection Process

National Park Service
Park Road and Parkway Program (PRP)
Identified transportation projects to be funded under each funding category of the Park Roads and Parkways Program must be nominated through a call for projects and selected based on eligibility under the program and by priority, either nationwide or within the Region.
The Parks will nominate projects but the Region or Washington Support Office (WASO) will be responsible for selecting and prioritizing candidate projects. All projects utilizing FLHP funding must be submitted to the FHWA for approval. The selection processes for each Category are described as follows:
Category I: Resurfacing, Rehabilitation, Restoration (3R), and Reconstruction Projects (4R): Regions will call for and select projects on a maximum four-year cycle (3-years recommended). 4R projects shall be selected using the Choosing By Advantage (CBA) process and criteria. 3R projects are evaluated using these same broad criteria, but Regions may use other procedures other than CBA for prioritization. For more information relative to the CBA criteria visit http://www.nps.gov/transportation/roads/manual/appendix_d.htm.
For Category 1 projects, representatives from the Region, Federal Lands Highway Division (FLHD), and Parks will meet to form a selection committee to select and prioritize projects. Projects selected are summarized and forwarded to the Regional Director for approval. For eligibility guidelines visit http://www.nps.gov/transportation/roads/manual/revised_cat1.htm.
Category II, System Completion: The WASO will call for and select projects on a four-year cycle using CBA criteria. To complete congressionally authorized parkways, projects will be selected by the WASO based on prioritized projects, congressional interest, project scheduling, and availability of funds. The Parks, Regions and FLHDs will work together to nominate projects, develop, and update a five-year program and schedule of these projects, for use by the WASO for congressional inquiries, funding legislation, and planning.
Category III, Transportation Systems Projects: The WASO will call for and select planning, construction, or procurement projects on a four-year cycle using CBA criteria. Parks identify their transportation issues generated from General Management Plans, transportation planning, engineering studies or TEA-21 ‘Section
3039’ transits need studies for the Parks requiring further study and analysis. Parks forward their project proposals to the corresponding Regions for regional approval. Regions prioritize the projects proposals and forward a selected number of project proposals to WASO for consideration. All project proposals are then evaluated service wide by using the CBA process and Alternative Transportation Program eligibility criteria by a committee consisting of Regional Federal Lands Highway Program Coordinators and Washington office staff. For more information visit http://www.nps.gov/transportation/alt/eval-plan.htm

Fish and Wildlife Service
Refuge Road Program (RRP)
23 USC 202 (e) and 204 (k) (3) provides guidance on criteria for selection of projects to be improved under the Refuge Roads Program. Projects are selected taking into consideration the following criteria:
1. The comprehensive conservation plan for each refuge. 2. The need for access as identified through land use planning 3. The impact of land use planning on existing transportation facilities 4. The National Wildlife Refuge System Administration Act of 1966
Since the transportation act requires funding to be eligible based upon the relative needs of the various refuges, the selection process favors project items that improve the condition rating factors that help establish the needs. These factors include the road condition rating which considers the number of miles of fair, poor, and failed (deficient) roads, and the bridge condition rating.
The basic eligibility requirements were established by the Transportation Equity Act for the 21st Century (TEA-21) and are included in Title 23 - United States Code (23 USC). Section 204 of 23 USC requires that funds made available for refuge roads shall be used only to pay the cost of certain maintenance and improvement activities. Construction of new roads is not authorized by TEA-21. For more information visit the following Web page: http://refuges.fws.gov/roads/guidance/index.html
The FWS Regional Offices are required to consider condition, congestion and safety in project selection, and identify any areas of specific concern to the national refuge roads coordinator. Projects related to human safety and welfare are given greater consideration. Regional Offices review all project submissions, develop five-year project lists and coordinate project proposals with the Federal Lands Highway Division Offices. The five-year lists are submitted to the Washington Office for review. The FWS provides the five-year list to the Federal Lands Highway Office for review and approval.

Forest Service
Forest Highway Program (PFH)
The Forest Highway Program is managed through the "tri-party" partnership of the Federal Lands Highway Divisions (FLHD), State highway agency (SHA), and the Forest Service (FS). The Federal Highway Administration (FHWA) is required to arrange and conduct annual program meetings with the FS and each SHA to jointly select the projects which will be included in the programs for the current fiscal year and at least the next 4 years (23 CFR 660). Projects included in each year’s program will be selected considering the following criteria:
1. The development, utilization, protection, and administration of the National Forest System (NFS) and its resources; 2. The enhancement of economic development at the local, regional, and national level, including tourism and recreational travel; 3. The continuity of the transportation network serving the NFS and its dependent communities; 4. The mobility of the users of the transportation network and the goods and services provided; 5. The improvement of the transportation network for economy of operation and maintenance and the safety of its users; 6. The protection and enhancement of the rural environment associated with the NFS and its resources; and 7. The results for FHs from the pavement, bridge, and safety management systems.
The recommended program will be prepared and approved by the FHWA with concurrence by the FS and the SHA. Following approval, the SHA will advise any other cooperators in the State of the projects included in the final program and shall include the approved program in the State’s process for development of the Statewide Transportation Improvement Program. For projects located in metropolitan areas, the FHWA and the SHA will work with the Metropolitan Planning Organizations (MPO) to incorporate the approved program into the MPO’s Transportation Improvement Program.

Public Lands Highways Discretionary Program (PLH)
Each year, a memorandum is sent from the Federal Highway Administration (FHWA) Headquarters Office to the FHWA division offices requesting the submission of candidate projects for the following fiscal year's funding. The FHWA division offices provide this solicitation request to the State transportation departments, who are the only agencies that can submit candidates for this program under the provisions of 23 U.S.C. 202(b). The State transportation department coordinates with local and Federal agencies within their State to develop viable candidate projects. The State transportation department submits the candidate applications to the FHWA division office. After the division office has reviewed the submission and ensured that the submission and all applications meet the requirements, they send the applications to the Office of Program Administration in Headquarters. The candidate project applications are reviewed and evaluated by the Office of Program Administration and an allocation plan is prepared for presentation of the candidate projects to the Office of the Federal Highway Administrator, where the final selection of projects for funding is made. Note that, often Congress specifies in the legislative process that funding be designated for specific projects. This congressional intent is honored provided that the designated projects meet the statutory eligibility criteria for the program. For more information relative to the selection criteria visit the FHWA's website at http://www.fhwa.dot.gov/discretionary/012304a3.htm