Developing Performance Indicators to Evaluate the Management Effectiveness of the Massachusetts...
40
University of Massachuses Boston ScholarWorks at UMass Boston Urban Harbors Institute Publications Urban Harbors Institute 1-1-2010 Developing Performance Indicators to Evaluate the Management Effectiveness of the Massachuses Ocean Management Plan Jack Wiggin University of Massachuses Boston, [email protected] Dan Hellin University of Massachuses Boston, [email protected] Kristin Uiterwyk University of Massachuses Boston, [email protected] Robert E. Bowen University of Massachuses Boston, [email protected] Prassede Vella Massachuses Office of Coastal Zone Management See next page for additional authors Follow this and additional works at: hp://scholarworks.umb.edu/uhi_pubs Part of the Environmental Health and Protection Commons , Natural Resources Management and Policy Commons , and the Oceanography Commons is Research Report is brought to you for free and open access by the Urban Harbors Institute at ScholarWorks at UMass Boston. It has been accepted for inclusion in Urban Harbors Institute Publications by an authorized administrator of ScholarWorks at UMass Boston. For more information, please contact [email protected]. Recommended Citation Wiggin, Jack; Hellin, Dan; Uiterwyk, Kristin; Bowen, Robert E.; Vella, Prassede; Weber, John; Moura, Stephanie; Napoli, Nicholas; Starbuck, Kim; and Krum, Howard, "Developing Performance Indicators to Evaluate the Management Effectiveness of the Massachuses Ocean Management Plan" (2010). Urban Harbors Institute Publications. Paper 3. hp://scholarworks.umb.edu/uhi_pubs/3
-
Upload
oregonstate -
Category
Documents
-
view
0 -
download
0
Transcript of Developing Performance Indicators to Evaluate the Management Effectiveness of the Massachusetts...

University of Massachusetts BostonScholarWorks at UMass Boston
Urban Harbors Institute Publications Urban Harbors Institute
1-1-2010
Developing Performance Indicators to Evaluate theManagement Effectiveness of the MassachusettsOcean Management PlanJack WigginUniversity of Massachusetts Boston, [email protected]
Dan HellinUniversity of Massachusetts Boston, [email protected]
Kristin UiterwykUniversity of Massachusetts Boston, [email protected]
Robert E. BowenUniversity of Massachusetts Boston, [email protected]
Prassede VellaMassachusetts Office of Coastal Zone Management
See next page for additional authors
Follow this and additional works at: http://scholarworks.umb.edu/uhi_pubsPart of the Environmental Health and Protection Commons, Natural Resources Management
and Policy Commons, and the Oceanography Commons
This Research Report is brought to you for free and open access by the Urban Harbors Institute at ScholarWorks at UMass Boston. It has been acceptedfor inclusion in Urban Harbors Institute Publications by an authorized administrator of ScholarWorks at UMass Boston. For more information, pleasecontact [email protected].
Recommended CitationWiggin, Jack; Hellin, Dan; Uiterwyk, Kristin; Bowen, Robert E.; Vella, Prassede; Weber, John; Moura, Stephanie; Napoli, Nicholas;Starbuck, Kim; and Krum, Howard, "Developing Performance Indicators to Evaluate the Management Effectiveness of theMassachusetts Ocean Management Plan" (2010). Urban Harbors Institute Publications. Paper 3.http://scholarworks.umb.edu/uhi_pubs/3

AuthorsJack Wiggin, Dan Hellin, Kristin Uiterwyk, Robert E. Bowen, Prassede Vella, John Weber, Stephanie Moura,Nicholas Napoli, Kim Starbuck, and Howard Krum
This research report is available at ScholarWorks at UMass Boston: http://scholarworks.umb.edu/uhi_pubs/3

Developing Performance Indicators to Evaluate the Management Effectiveness of the Massachusetts Ocean Management Plan January, 2010 Prepared by:
The Urban Harbors Institute The University of Massachusetts Boston’s Environmental, Earth and Ocean Sciences Department and The Massachusetts Ocean Partnership With assistance from:
The Massachusetts Executive Office of Energy and Environmental Affairs
FINAL DRAFT

“Developing Performance Indicators to Evaluate the Management Effectiveness of the Massachusetts Ocean Management Plan”
Urban Harbors Institute, University of Massachusetts Boston – January, 2010 i | P a g e
Contributors
Urban Harbors Institute, University of Massachusetts Boston:
Jack Wiggin, Dan Hellin and Kristin Uiterwyk
Department of Environmental, Earth and Ocean Sciences, University of Massachusetts Boston:
Robert E. Bowen
Massachusetts Office of Coastal Zone Management:
Prassede Vella and John Weber
Massachusetts Ocean Partnership:
Stephanie Moura, Nicholas Napoli, Kim Starbuck and Howard Krum
Acknowledgements The following group of experts provided invaluable insight, knowledge and expertise during the indicator selection process:
Prassede Vella, John Weber, Todd Callaghan and Dan Sampson (Massachusetts Office of Coastal Zone Management); David Terkla and Anamarija Frankic (Department of Environmental, Earth and Ocean Sciences, University of Massachusetts Boston); Christine Tilburg (Gulf of Maine Council on the Marine Environment, ESIP Program); Alex Strysky (Massachusetts Department of Environmental Protection, Waterways Program); Kathryn Ford (Massachusetts Department of Fish and Game, Division of Marine Fisheries); Andrea Rex (Massachusetts Water Resources Authority); Betsy Nicholson (NOAA, Coastal Services Center); Steven Katona (Ocean Health Index); and Phil Colarusso (U.S. Environmental Protection Agency).

“Developing Performance Indicators to Evaluate the Management Effectiveness of the Massachusetts Ocean Management Plan”
Urban Harbors Institute, University of Massachusetts Boston – January, 2010 ii | P a g e
Contents
Contributors ................................................................................................................................................... i
Acknowledgements ........................................................................................................................................ i
Introduction .................................................................................................................................................. 1
A Structured Approach to Indicator Identification and Screening ............................................................... 2
Methodology ................................................................................................................................................. 2
Recommended Final List of Indicators .......................................................................................................... 8
Summary ..................................................................................................................................................... 10
Next Steps ................................................................................................................................................... 11
The Indicator Identification Methodology and its Applicability to Other Management Applications ....... 12
Appendix 1: Detailed Methodology ........................................................................................................ 13
Appendix 2: Workshop Attendees .......................................................................................................... 23
Appendix 3: Reviewed Program Documents ........................................................................................... 24
Appendix 4: Goals, Strategies, and Outcomes from the Massachusetts Ocean Management Plan ...... 25
Appendix 5: The Indicators Spreadsheet used during the First Workshop ............................................ 29
Appendix 6: Final List of Recommended Socio-economic and Environmental Indicators with Initial Information on Data Availability and Quality. ............................................................................................ 31

“Developing Performance Indicators to Evaluate the Management Effectiveness of the Massachusetts Ocean Management Plan”
Urban Harbors Institute, University of Massachusetts Boston – January, 2010 1 | P a g e
INTRODUCTION In June 2009, the Massachusetts Executive Office of Energy and Environmental Affairs (EEA) released its draft Massachusetts Ocean Management Plan (draft plan) for public comment. The plan is required by the Oceans Act of 2008 to, among other things, be adaptive to evolving knowledge and understanding of the ocean environment. The plan’s Science Framework establishes a blueprint for future research and data acquisition and ensuring that the plan evolves and its management measures adapt to this new and enhanced information. As stated in Chapter 5 of the draft plan, an important part of the science framework is the development and implementation of a performance evaluation system with a series of indicators to help EEA and stakeholders evaluate the implementation of the Massachusetts Ocean Management Plan, identify the environmental and socio-economic impacts of plan management decisions, and identify new or emerging issues.
Volume 2 of the draft plan contains a section entitled Development of Evaluation Measures for the Massachusetts Ocean Management Plan. This section outlines a proposed process “to identify measures of success or indicators that can be used to measure performance of management strategies in achieving desired outcomes.”
As the development of indicators is a high priority of the draft plan, the Massachusetts Ocean Partnership (MOP) in consultation with EEA contracted with the Urban Harbors Institute (UHI) of the University of Massachusetts Boston (UMass Boston). The project team1 and other professionals from organizations and agencies experienced with the selection and use of indicators conducted the process outlined in Volume 2 of the draft plan to identify and select a set of environmental, socio-economic, and governmental indicators to evaluate the effectiveness of the Massachusetts Ocean Management Plan. The process consisted of the following components:
Define the main objectives or questions that need to be answered;
Compile a comprehensive set of potential indicators;
Derive a list of candidate indicators (environmental, socio-economic, and governance) with the greatest potential to address EEA’s objectives/questions;
Develop recommended screening criteria to assess the applicability of candidate indicators;
Conduct a preliminary determination of data availability and quality from existing sources;
Convene two meetings of an expert group to select the indicators based on the screening criteria and determine data availability and characteristics; and
Recommend next steps to advance indicator development.
The work described in this report also contributes to a broader interest and goal of the Massachusetts Ocean Partnership which is to coordinate indicator initiatives to inform ocean management and to advance the development and use of indicators of the ocean’s ability to provide ecosystem services. Currently, there are a number of initiatives, focusing on the coastal and ocean areas of the Northwest Atlantic/Gulf of Maine region, to develop indicators for various purposes and audiences. The process and products of this work in support of the Massachusetts Ocean Management Plan (e.g., the list of indicators and associated data) will be useful in collaborative efforts to integrate and coordinate these regional efforts.
1 The project team refers to core personnel from UHI, EEA and MOP who worked collaboratively throughout the
process to select indicators to evaluate the effectiveness of the Massachusetts Ocean Management Plan.

“Developing Performance Indicators to Evaluate the Management Effectiveness of the Massachusetts Ocean Management Plan”
Urban Harbors Institute, University of Massachusetts Boston – January, 2010 2 | P a g e
A STRUCTURED APPROACH TO INDICATOR IDENTIFICATION AND SCREENING Although ocean and coastal environments are complex, they do have an underlying structure that can be understood and managed if relevant information is accessible to practitioners – indicators can convey this information. In order to achieve desired management outcomes, practitioners need information on: coastal communities; the structure of the coastal/ocean economy; the societal gains and losses influenced by the environment; and coastal environmental change. Such information can be conveyed by identifying a limited number of indicators that focus on evaluating key management issues using related data and information.
It is important to establish, at the outset, how terms relating to indicators will be used in this report. Terms such as measure, variable, indicator, index and metric have all been used to describe the use of data/information for evaluation of environmental management programs. While there are subtle differences between these terms, for the current purpose, the term “indicator” will be used to refer to data collected to aid in the process of integrated ocean management. This report proposes the use of two indicator classes in the Massachusetts Ocean Management Plan’s implementation: outcome indicators and governance indicators.
Outcome indicators measure socio-economic and environmental changes in integrated coastal and ocean systems. Governance indicators assess implementation of policy programs. Both classes of indicators can be sub-categorized as:
Individual Indicators – Directly measure a single attribute and are assessed at the smallest available unit of analysis. Example: “Number of beach closure days.”
Integrated Indicators – Aggregate measure of an attribute requiring more than one individual indicator. Example: “Economic value of recreational boating.”
Indicator Sets – A group of individual indictors that measure related parameters, e.g., phosphate, nitrate, salinity, pH, etc. and can be used together to give a picture of the state of the environment. Example: “Water chemistry.”
For indicators to be useful, their incorporated data should be directly related to the management issue being examined and structured to indicate changes and trends in environmental and socio-economic conditions that will serve as an early warning system and help guide management and policy response and decision-making.
METHODOLOGY NOTE: Appendix 1 contains the same eight steps of the methodology outlined below, but provides more
detail on Steps 5 - 8.
The methodology used generally followed the “Process for Selecting Indicators” proposed in the draft plan (Volume 2, Chapter 3). As recommended by the draft plan, an expert group2 was recruited to help guide indicator selection. The expert group provided invaluable insight, knowledge and experience into selecting recommended indicators within the EEA-structured framework.
Since this process was conducted in a short period of time (ten weeks), the process was not as exhaustive or deliberative as it could have been. A longer timeframe for conducting the process might not have produced a very different outcome (based on the experience of the project team), but would likely have provided an opportunity for more detailed descriptions of candidate indicators and
2 The draft plan refers to the expert group as a “steering committee” or “work group.”

“Developing Performance Indicators to Evaluate the Management Effectiveness of the Massachusetts Ocean Management Plan”
Urban Harbors Institute, University of Massachusetts Boston – January, 2010 3 | P a g e
associated data, greater discussion and comprehension of the specific management strategies of the ocean plan, and a more elaborate process for refining the selection of indicators by the expert group. These opportunities may be realized in coming months as EEA continues the process of identifying and reviewing indicators for potential use in the context of ocean management in Massachusetts.
The methodology consisted of the following steps (these are illustrated in Figure 1):
1. Select individuals to form an expert group;
2. Develop a comprehensive list of indicators (“A” in Figure 1);
3. Pre-screen the comprehensive list to develop a candidate list of indicators (“B”);
4. Develop management questions from the goals of the draft plan to help guide indicator selection;
5. Convene first workshop with the expert group to present the candidate list of potential indicators and initiate the indicator selection process (“C”);
6. Analyze the output from the first workshop and develop a grouped candidate list of indicators (“C”);
7. Convene second workshop with the expert group to develop a ranked candidate list of indicators (“D”); and
8. Develop a final list of recommended indicators (“E”). Any indicators not included in the final list are re-assigned to the initial comprehensive list for use in future indicator selection processes (“F”).
Figure 1: Illustration of the methodology used to select indicators for the Massachusetts Ocean Management Plan. Note: During the process, a number of indicators were added, some were removed and others were combined into indicator sets, therefore the sizes of the boxes are only a general representation of the number of indicators at each step.

“Developing Performance Indicators to Evaluate the Management Effectiveness of the Massachusetts Ocean Management Plan”
Urban Harbors Institute, University of Massachusetts Boston – January, 2010 4 | P a g e
Step 1: Select Individuals to Form an Expert Group (see Appendix 2 for expert group member list)
The approach for developing a set of recommended indicators for use in evaluating the Massachusetts Ocean Management Plan involved engaging a group of individuals with diverse expertise in sciences, economics and management. This expert group was charged with: (1) selecting indicators most critical to evaluating the outcomes of the plan’s management actions; and (2) providing input on data needs, sources, availability and quality.
The expert group was comprised of individuals with a range of expertise matching the subject matter encompassed by the plan. The expert group included participants with scientific backgrounds, knowledge of data sources, expertise in resource management, and past experience in the development of coastal/ocean indicators. The year-long process for developing the draft plan had engaged numerous scientists and technical staff from government, academia and NGOs as members of one of six technical work groups (habitats, fisheries, sediment resources, transportation, navigation and infrastructure, recreational and cultural services, and renewable energy) or of the Ocean Science Advisory Council (SAC)3. Members of the indicators expert group were drawn primarily from those involved in the draft plan development efforts (EEA work groups, SAC, EEA staff) since they possessed the necessary expertise and were familiar with the scope and objectives of the plan. Two members were invited specifically for their experience in the development of regional and global ocean indicators.
Step 2: Develop a Comprehensive List of Indicators
There have been many efforts internationally, in the broader US, and within the Northeast region to develop indicators of coastal and ocean environmental and/or socio-economic conditions and to measure program effectiveness. As a first step in this process, the project team reviewed the results of a number of relevant initiatives (Appendix 3) to compile a comprehensive list of indicators for potential use in the Massachusetts Ocean Management Plan. The purpose of this was to capture the results and value of the considerable effort and thought invested in these other efforts.
The initial, comprehensive list of 274 indicators (64 governance, 90 environmental, and 120 socio-economic) was compiled by reviewing: (1) watershed, ocean and coastal management programs that incorporate the use of indicators into their management strategies; (2) recent and/or on-going efforts to develop lists of indicators to assess various environmental and management goals; and (3) the draft Massachusetts Ocean Management Plan itself. This comprehensive list included those indicators with relevance to the region and the ecosystems of the Northwest Atlantic.
Step 3: Pre-screen the Comprehensive List to Develop a Candidate List of Indicators
Previous experience has shown that indicator selection can be a lengthy process and it was clear that, in light of the limited time available, it would not be practicable to continue with such a large number of indicators. Therefore, the project team identified the indicators in the comprehensive list that were most relevant to the plan. Relevance was determined by applying the following question:
Which indicators are most critical for assessing whether or not the impacts of a project or decision in the planning area meets one or more of the four goals of the Massachusetts Ocean Management Plan?
3 A council of nine scientists with expertise in marine sciences and data management that assisted in the
development of the ocean management plan for Massachusetts.

“Developing Performance Indicators to Evaluate the Management Effectiveness of the Massachusetts Ocean Management Plan”
Urban Harbors Institute, University of Massachusetts Boston – January, 2010 5 | P a g e
The four goals of the draft plan are:
1. To balance and protect the natural, social, cultural, historic, and economic interests of the marine ecosystem;
2. To protect biodiversity, ecosystem health, and the interdependence of ecosystems;
3. To support wise use of marine resources, including renewable energy, sustainable uses, and infrastructure; and
4. To incorporate new knowledge as the basis for management that adapts over time to changing socio-economic, technological, and environmental conditions.
NOTE: The detailed goals, strategies, and outcomes of the draft plan can be found in Appendix 4.
This pre-screening produced a candidate list of 89 indicators (25 socio-economic, 32 environmental, and 32 governance indicators). The focus of the two workshops with the expert group was the socio-economic and environmental indicators in the candidate list. The selection of governance indicators to be included in the plan was considered more straight-forward (related to management measures in the plan), and was undertaken by the project team.
While those indicators not selected for the candidate list were deemed to be less relevant to the goals of the plan at this time, the comprehensive list itself remains a valuable resource for future indicator selection efforts associated with the Massachusetts Ocean Management Plan and potentially other indicator initiatives.
Step 4: Develop Management Questions from the Goals of the Draft Plan to Help Guide Indicator Selection
The selection of indicators should ultimately be based on their ability to answer management questions. The project team developed three main management questions to guide the selection of indicators for the Massachusetts Ocean Management Plan. They were based on the 15 specific requirements of the Massachusetts Oceans Act, the four goals of the draft plan and focused on the desired outcomes of the plan’s management actions. These three questions were:
How are environmental conditions and natural resources changing (spatially and temporally) in response to management actions of the plan?
Are the economy and quality of life of the people improved as a result of management of allowable uses in the planning area?
What are the trends in climate change and sea level rise, and possible implications on environmental conditions and coastal communities?
Step 5: Convene First Workshop with the Expert Group (October 2, 2009)
The specific goals of the first workshop were to:
Provide the expert group with an introduction to the use of indicators to assess an ocean management plan;
Discuss other indicator efforts within the region;
Explain the proposed indicator selection process, desired outcomes and what would be asked of the expert group; and
Present and initiate discussion about the candidate list of indicators (with a focus on socio-economic and environmental indicators).

“Developing Performance Indicators to Evaluate the Management Effectiveness of the Massachusetts Ocean Management Plan”
Urban Harbors Institute, University of Massachusetts Boston – January, 2010 6 | P a g e
In advance of the second workshop, each expert group member was asked to individually complete a worksheet identifying those socio-economic and environmental indicators from the candidate list that he/she felt were critical to assessing plan effectiveness (guided by the three management questions from Step 4). Indicator data availability was not considered at this stage of the selection process. The review of the 32 candidate governance indicators was undertaken separately by the project team. A sample of the worksheet used by the expert group is shown below. The complete worksheet can be found in Appendix 5.
The objective is to develop a list of indicators that can be used to assess the effectiveness of the actions associated with the Massachusetts Ocean Management Plan in achieving the plan's goals.
We would like you to help identify which indicators are of critical importance to answering each of the questions below. The following list of indicators has been selected as potentially relevant to this objective. Please use the "Your selection" column to show the level of importance of each indicator. Please feel free to add any comments/clarifications in the "Your comments" column. Y = critical N = not critical ? = don't know
At this stage do NOT focus on data availability or quality. This phase is to develop the list of the most useful / critical indicators.
ID# Indicator Is this indicator critical to understanding the degree of change
in environmental conditions and natural resources (spatially and
temporally)?
Is this indicator critical to understanding the degree of change in the economy and quality of life of
humans?
Is this indicator critical to understanding trends in climate
change (including sea level rise) and the clear implications on
environmental conditions and human well-being?
Your selection Your comments Your selection Your comments Your selection Your comments
S1 Annual yield from aquaculture (by species)
S15 Land use/land cover
S18 % employees in marine industry
S19 Cost of disease/illness
S20 Economic value of aquaculture
S21 Economic value of coastal industry sectors
S22 Economic value of fisheries (commercial)
Step 6: Analyze the Output from the First Workshop and Develop a Grouped Candidate List of Indicators
Responses from the individual worksheets completed by the members of the expert group were compiled, analyzed, and the candidate list of indicators was grouped into four categories, indicating their initial relevance to the management questions. A fifth category was created for new indicators suggested by the expert group during the assessment. This resulted in the development of the grouped candidate list used in the second workshop. More information on the scoring methodology used to analyze the worksheet responses and to group the indicators into categories is located in Appendix 1.
Step 7: Convene Second Workshop with the Expert Group (November 10, 2009)
The specific goals of the second workshop were for the expert group as a whole to:
Further refine the grouped candidate list of indicators in the context of:
o The goals, strategies, and objectives of the draft Massachusetts Ocean Management Plan (Appendix 4);

“Developing Performance Indicators to Evaluate the Management Effectiveness of the Massachusetts Ocean Management Plan”
Urban Harbors Institute, University of Massachusetts Boston – January, 2010 7 | P a g e
o The need to measure socio-economic and environmental trends and changes that are the result of ocean management plan-related management actions;
o The need to measure changes that may not be the result of ocean management plan actions but may still influence management decisions; and
o The uses permitted under the Massachusetts Ocean Sanctuaries Act (as amended by the Oceans Act), including: offshore renewable energy facilities; sand mining; submarine cables; pipelines; and offshore aquaculture.
Assess the relative importance of each indicator in the grouped candidate list in relation to the others and identify a shortlist of potential indicators that could be included in the final list of indicators (Step 8);
o The results from the first workshop were presented as a list of the indicators grouped into five categories as discussed above. To assist in assessing each indicator in relation to the others, a conceptual line, or critical needs threshold was defined. Those indicators assessed to be above the threshold would be considered of highest relevance and priority.
o The expert group was asked to work through the list of indicators and, in the context outlined above, decide if various indicators were more useful in assessing plan effectiveness than others. This exercise included the 14 new indicators (10 environmental and four socio-economic) that the expert group had suggested.
o As part of this process, duplicate indicators were identified and other indicators were grouped into logical Indicators Sets.
o The results of the second workshop were organized into the ranked candidate list of indicators.
Begin to identify data availability and quality for the potential indicators; and
Discuss other factors that could influence indicator selection and how these might be applied to indicator selection in the future (i.e., the indicator screening criteria).
Step 8: Develop the Final List of Recommended Indicators
Using the results of the second workshop, members of the project team reorganized the indicators from the ranked candidate list developed in Step 7 into four new categories reflecting their ultimate use in assessing the management actions of the plan. While data availability and quality were recognized as crucial to the actual use of indicators, these were not the primary criteria by which the final list of indicators was selected. This exercise also included the governance indicators. The four new categories were:
Primary Indicators – Those indicators that will provide the best information to assess the degree of success of the Massachusetts Ocean Management Plan. While data are available for some of these indicators, it will be necessary to determine if the current data are suitable and if the data gathering efforts need to be refined. Efforts should be made to gather information for those indicators where data are not currently available.
Supporting Indicators – Those indicators that may provide valuable supporting information to better understand the primary indicators. Data for many of these indicators are already being gathered. Efforts should be made to ensure that this continues and that data are gathered in a manner that will be of most value to the Commonwealth.

“Developing Performance Indicators to Evaluate the Management Effectiveness of the Massachusetts Ocean Management Plan”
Urban Harbors Institute, University of Massachusetts Boston – January, 2010 8 | P a g e
Secondary Indicators – Those indicators chosen by the expert group that are related to the Massachusetts Ocean Management Plan and are not currently deemed critical to assessing the success of the plan. In many cases, data for these indicators are not currently being gathered, and future data collection efforts should be made as the opportunity/need arises or as funding becomes available. These indicators may well become important as new issues emerge or as projects are proposed.
Indicators Not Currently of Interest – Those indicators that are not relevant to assessing the effectiveness of the Massachusetts Ocean Management Plan at this time and are not expected to become so in the foreseeable future.
It is important to note that the final list of recommended indicators was selected based on the draft Massachusetts Ocean Management Plan made available for public comment in June of 2009. The list of indicators and the assignment of indicators to specific categories may be modified along with revisions to the plan. Additionally, indicators may be added or removed from this list as new data become available, new uses are proposed and implemented in the planning area, or new conditions arise that warrant their use.
RECOMMENDED FINAL LIST OF INDICATORS
Primary Indicators
Environmental
Change in location and/or extent of core and important habitat (e.g., feeding, nesting, breeding areas) of Special, Sensitive or Unique Marine and Estuarine Life and Habitat (SSU) species (e.g., whales, birds etc., as identified in the plan)
Change in abundance/population density of species within SSU areas (e.g., whales, birds etc., as identified in the plan)
Change in areal extent of SSU resources (e.g., eelgrass, mudflats, hard/complex bottom etc., as identified in the plan)
Change in: (1) total biomass/abundance; and/or (2) distribution of biomass/abundance across species for fish, mollusks and crustacean species within SSU areas
Expansion of the range of “watched” invasive species (i.e., invasive species that are currently being monitored)
Number and extent of habitats (by type) with a focus on SSUs
Fish Population Assessment:
Biomass of species in trawl (by species)
Fisheries (landings, effort)
Mean length of fish sampled
Number of individuals of fish in trawl (by species), age structure
Mean sea level rise
Sea surface, water column and bottom temperature

“Developing Performance Indicators to Evaluate the Management Effectiveness of the Massachusetts Ocean Management Plan”
Urban Harbors Institute, University of Massachusetts Boston – January, 2010 9 | P a g e
Socio-economic
Economic value (production volume, etc.) and leased area of aquaculture operation
Economic value of fisheries (commercial)
Economic value of fisheries (recreational)
Economic value of offshore renewable energy
Economic value of recreational boating
Economic value of coastal industry sectors (other than fisheries, recreational boating, offshore energy and offshore aquaculture)
Total production capacity of renewable energy in offshore federal, offshore state and inshore waters
Governance
Number of projects proposed/established in SSU areas, and areal extent by type
Number of projects proposed/established in non-SSU use areas of the planning region (e.g., multi-use areas and renewable energy areas), and areal extent by type
Number of actions in science plan initiated/implemented
Number of public access sites
Number of user conflicts reported by type/cause (e.g., number of recreational boats displaced by offshore aquaculture)
Number and areal extent of the designated areas in the plan area: protected (e.g., SSUs); designated for a particular use; and designated for multi-use
% of required state energy produced from renewable energy
Number of public participation efforts
Resources expended for implementation of plan and science framework (MOP, trust fund, etc)
Supporting Indicators
Environmental
Marine disease indices (e.g., MSX, Dermo, shell disease) including Harmful Algal Blooms and other diseases (in shellfish, bivalves, fish etc.)
Mussel tissue data or other measures of inorganic contaminants
Water Chemistry:
Nitrates
Dissolved oxygen
Phosphates
Salinity
Chlorophyll a concentration (phytoplankton biomass)
pH/carbonate saturation
Rainfall
Number of winds/storms per year >x knots and directionality
Number of (or frequency of) confirmed spills (including type, cause and volume)
Beach closure days

“Developing Performance Indicators to Evaluate the Management Effectiveness of the Massachusetts Ocean Management Plan”
Urban Harbors Institute, University of Massachusetts Boston – January, 2010 10 | P a g e
Socio-economic
Number of employees in marine industry
Number of registered vessels
Number of whale watch trips and/or attendance on whale watch vessels
Land use/land cover
Mean coastal property value
Population density in coastal "high hazard areas" or "coastal zone"
Total cost of weather disasters/year
Secondary Indicators
Environmental
Inorganic contaminant index in biota water/sediment
Organic contaminant index in biota water/sediment
Species diversity index
Zooplankton (identification, enumeration)
Sedimentation rates for selected areas - including sediment transport
Population distribution of threatened/endangered species with a focus on SSUs
Beach attendance (as a measure of the perceived cleanliness of the beach)
Socio-economic
Number of divers/dive trips/air fills
Number and value of recreational fishing days
Cost of marine vectored disease/illness
Costs of invasive species (social, economic, health)
SUMMARY
The effort and results reported here are in support of the Commonwealth in its efforts to develop and implement a system of performance measures for the initial and long-term implementation of the Massachusetts Ocean Management Plan.
This report provides a description of the structured process used to identify sets of indicators most useful for evaluating the effectiveness of the plan. This process is an adaptation of other regional, national and international integrated environmental management efforts that have faced issues similar to those articulated in the plan. The process included a systemic review of other related efforts to emphasize refinement and expansion over novel invention and to benefit from lessons learned by others.
Given the ambitious goals of the plan, the information provided by the selected indicators should assist with:
Assessing the need for additional detail and/or refinement of siting provisions and regulatory standards;

“Developing Performance Indicators to Evaluate the Management Effectiveness of the Massachusetts Ocean Management Plan”
Urban Harbors Institute, University of Massachusetts Boston – January, 2010 11 | P a g e
Providing critical information needed to evaluate the social and environmental effects of actions carried out within and beyond the plan’s planning boundary;
Providing critical information needed to evaluate the overall policy implementation of the plan to ensure effective and efficient governance;
Maximizing the ability of the plan to adapt to changing conditions and knowledge;
More effectively understanding the various sources of social and environmental change to ensure that actions carried out under the auspices of the plan are appropriately designed; and
Ensuring appropriate information is available for plan managers in preparing reports to the Commonwealth on plan activities.
As the plan is implemented, refinements and adaptations in response to new information and greater conditional understanding will be bolstered by having a structured, transparent, stakeholder driven process (e.g., the process described in this report) to which managers can refer.
NEXT STEPS While this process produced a list of recommended indicators for the Massachusetts Ocean Management Plan, further work will be required for short- and long-term implementation including:
The details of an indicator (e.g., unit, frequency and location of measurement) need to be refined based on its precise use(s). Furthermore, before determining exactly what data are needed, and in what form, it is first necessary to have an idea of how the data will be used.
Initial efforts have been made to identify the data currently available for primary, supporting and secondary indicators (see Appendix 6), but ultimately, an indicator’s usefulness will depend at least in part on the quality, availability, and scale of data. Efforts to mine current programs for useful data and carefully design new data acquisition programs to yield data with the needed attributes should be continued. This will be integrated into the plan’s science framework as it is further developed.
Datasets that support the selected indicators should become priorities for improved access and interoperability through state and regional data networks and data portals.
The degree and nature of use by plan managers of the indicator protocol and conclusions of this report should be periodically assessed as part of adaptive management, which is one of the goals of the plan. Accordingly, if this structured process holds its intended value, it will contribute materially to other efforts directed at determining the integrated information needs of managers in the future and in other related environments.
As the plan is implemented and evaluated, reporting products will need to be developed to convey the outcomes of plan implementation to a broad stakeholder community. These will likely include the development of new visualization tools, including interactive maps, web technology, and graphics that clearly convey information without mitigating the nuances of the information.
The information and reporting products created in support of the plan should be developed in ways that build upon and contribute to other regional efforts already in place or in the planning stage. The overall goal should be to maximize the combined value of all relevant information identification, acquisition and reporting systems.

“Developing Performance Indicators to Evaluate the Management Effectiveness of the Massachusetts Ocean Management Plan”
Urban Harbors Institute, University of Massachusetts Boston – January, 2010 12 | P a g e
As EEA and MOP advance the practice of and approaches towards comprehensive ecosystem-based management, the indicators and related datasets should be linked to well-defined ecosystem services in order to monitor, visualize, and manage the provision of those services. This will also provide a means for educating stakeholders about the various benefits provided by the coastal ocean. This step should be coordinated with project teams developing methodologies to model the provision of ecosystem services and their value.
THE INDICATOR IDENTIFICATION METHODOLOGY AND ITS APPLICABILITY TO OTHER MANAGEMENT
APPLICATIONS The methodology used in developing indicators in support of the Massachusetts Ocean Management Plan is based upon existing related indicator identification protocols that are well established in literature. The specific application of this process was directed by the established goals and needs of the plan. The process can – and has – been used in other management environments. Future efforts to establish the indicators that would contribute to other regional integrated management questions – such as those considering information in support of regional assessments of ecosystem health or regional ecosystem service values – could be based on the core themes of this methodology; however, certain attributes of the method would require modification. Because this methodology was developed to identify goal-specific results, its application in other management environments would, minimally, include differences in:
The specification of a candidate list of indicators that initiates the process. An initial candidate list is driven by an effort to identify a limited list of indicators – drawn from a longer comprehensive list – that provide the most direct benefit to the management goal. As the management goals change, so should the candidate list and the questions used to build the candidate list.
The specific sub-questions used to assess the direct relevance of candidate list indicators to the management goal. These sub-questions provide the basic guidance to the first meeting of the expert group and would be different with a different set of management goals or changes to the spatial and temporal dimension of the management effort.
The make-up of the expert group. Again, with changes in the management goal the value of specific expert insights would change accordingly.
In short, the effort here was to establish an adaptable, stakeholder/expert engaged, and transparent process to identify critical indicators to support a specific management need. While the process is applicable, in general, to other related efforts, certain specific attributes of the process as applied to the Massachusetts Ocean Management Plan would change.
“Developing Performance Indicators to Evaluate the Management Effectiveness of the Massachusetts Ocean Management Plan”
Urban Harbors Institute, University of Massachusetts Boston – January, 2010 13 | P a g e
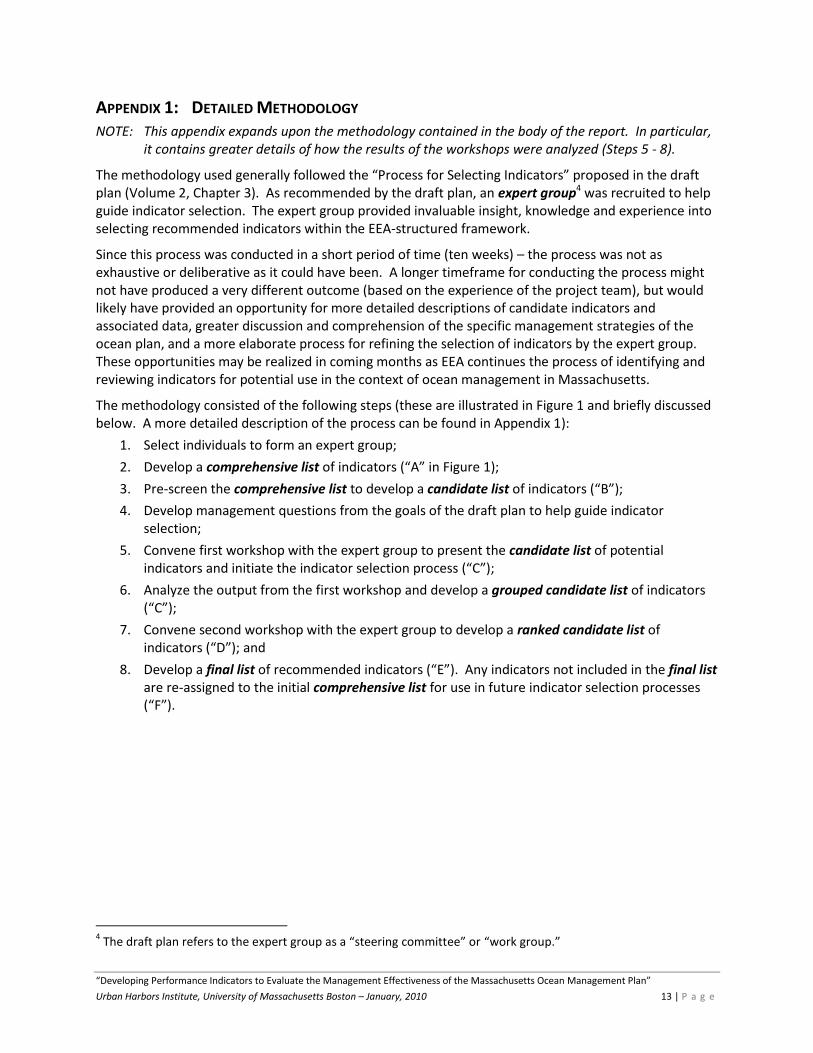
APPENDIX 1: DETAILED METHODOLOGY NOTE: This appendix expands upon the methodology contained in the body of the report. In particular,
it contains greater details of how the results of the workshops were analyzed (Steps 5 - 8).
The methodology used generally followed the “Process for Selecting Indicators” proposed in the draft plan (Volume 2, Chapter 3). As recommended by the draft plan, an expert group4 was recruited to help guide indicator selection. The expert group provided invaluable insight, knowledge and experience into selecting recommended indicators within the EEA-structured framework.
Since this process was conducted in a short period of time (ten weeks) – the process was not as exhaustive or deliberative as it could have been. A longer timeframe for conducting the process might not have produced a very different outcome (based on the experience of the project team), but would likely have provided an opportunity for more detailed descriptions of candidate indicators and associated data, greater discussion and comprehension of the specific management strategies of the ocean plan, and a more elaborate process for refining the selection of indicators by the expert group. These opportunities may be realized in coming months as EEA continues the process of identifying and reviewing indicators for potential use in the context of ocean management in Massachusetts.
The methodology consisted of the following steps (these are illustrated in Figure 1 and briefly discussed below. A more detailed description of the process can be found in Appendix 1):
1. Select individuals to form an expert group;
2. Develop a comprehensive list of indicators (“A” in Figure 1);
3. Pre-screen the comprehensive list to develop a candidate list of indicators (“B”);
4. Develop management questions from the goals of the draft plan to help guide indicator selection;
5. Convene first workshop with the expert group to present the candidate list of potential indicators and initiate the indicator selection process (“C”);
6. Analyze the output from the first workshop and develop a grouped candidate list of indicators (“C”);
7. Convene second workshop with the expert group to develop a ranked candidate list of indicators (“D”); and
8. Develop a final list of recommended indicators (“E”). Any indicators not included in the final list are re-assigned to the initial comprehensive list for use in future indicator selection processes (“F”).
4 The draft plan refers to the expert group as a “steering committee” or “work group.”

“Developing Performance Indicators to Evaluate the Management Effectiveness of the Massachusetts Ocean Management Plan”
Urban Harbors Institute, University of Massachusetts Boston – January, 2010 14 | P a g e
Figure 1: Illustration of the methodology used to select indicators for the Massachusetts Ocean Management Plan. Note: During the process, a number of indicators were added, some were removed and others were combined into indicator sets, therefore the sizes of the boxes are only a general representation of the number of indicators at each step.
Step 1: Select Individuals to Form an Expert Group (see Appendix 2 for expert group member list)
The approach for developing a set of recommended indicators for use in evaluating the Massachusetts Ocean Management Plan involved engaging a group of individuals with diverse expertise in sciences, economics and management. This expert group was charged with: (1) selecting indicators most critical to evaluating the outcomes of the plan’s management actions; and (2) providing input on data needs, sources, availability and quality.
The expert group was comprised of individuals with a range of expertise matching the subject matter encompassed by the plan. The expert group included participants with scientific backgrounds, knowledge of data sources, expertise in resource management, and past experience in the development of coastal/ocean indicators. The year-long process for developing the draft plan had engaged numerous scientists and technical staff from government, academia and NGOs as members of one of six technical work groups (habitats, fisheries, sediment resources, transportation, navigation and infrastructure, recreational and cultural services, and renewable energy) or of the Ocean Science Advisory Council (SAC)5. Members of the indicators expert group were drawn primarily from those involved in the draft plan development efforts (EEA work groups, SAC, EEA staff) since they possessed the necessary expertise and were familiar with the scope and objectives of the plan. Two members were invited specifically for their experience in the development of regional and global ocean indicators.
5 A council of nine scientists with expertise in marine sciences and data management that assisted in the
development of the ocean management plan for Massachusetts.

“Developing Performance Indicators to Evaluate the Management Effectiveness of the Massachusetts Ocean Management Plan”
Urban Harbors Institute, University of Massachusetts Boston – January, 2010 15 | P a g e
Step 2: Develop a Comprehensive List of Indicators
There have been many efforts internationally, in the broader US, and within the Northeast region to develop indicators of coastal and ocean environmental and/or socio-economic conditions and to measure program effectiveness. As a first step in this process, the project team reviewed the results of a number of relevant initiatives (Appendix 3) to compile a comprehensive list of indicators for potential use in the Massachusetts Ocean Management Plan. The purpose of this was to capture the results and value of the considerable effort and thought invested in these other efforts.
The initial, comprehensive list of 274 indicators (64 governance, 90 environmental, and 120 socio-economic) was compiled by reviewing: (1) watershed, ocean and coastal management programs that incorporate the use of indicators into their management strategies; (2) recent and/or on-going efforts to develop lists of indicators to assess various environmental and management goals; and (3) the draft Massachusetts Ocean Management Plan itself. This comprehensive list included those indicators with relevance to the region and the ecosystems of the Northwest Atlantic.
Step 3: Pre-screen the Comprehensive List to Develop a Candidate List of Indicators
Previous experience has shown that indicator selection can be a lengthy process and it was clear that, in light of the limited time available, it would not be practicable to continue with such a large number of indicators. Therefore, the project team identified the indicators in the comprehensive list that were most relevant to the plan. Relevance was determined by applying the following question:
Which indicators are most critical for assessing whether or not the impacts of a project or decision in the planning area meets one or more of the four goals of the Massachusetts Ocean Management Plan?
The four goals of the draft plan are:
1. To balance and protect the natural, social, cultural, historic, and economic interests of the marine ecosystem;
2. To protect biodiversity, ecosystem health, and the interdependence of ecosystems;
3. To support wise use of marine resources, including renewable energy, sustainable uses, and infrastructure; and
4. To incorporate new knowledge as the basis for management that adapts over time to changing socio-economic, technological, and environmental conditions.
NOTE: The detailed goals, strategies, and outcomes of the draft plan can be found in Appendix 4.
This pre-screening produced a candidate list of 89 indicators (25 socio-economic, 32 environmental, and 32 governance indicators). The focus of the two workshops with the expert group was the socio-economic and environmental indicators in the candidate list. The selection of governance indicators to be included in the plan was considered more straight-forward (related to management measures in the plan), and was undertaken by the project team.
While those indicators not selected for the candidate list were deemed to be less relevant to the goals of the plan at this time, the comprehensive list itself remains a valuable resource for future indicator selection efforts associated with the Massachusetts Ocean Management Plan and potentially other indicator initiatives.
“Developing Performance Indicators to Evaluate the Management Effectiveness of the Massachusetts Ocean Management Plan”
Urban Harbors Institute, University of Massachusetts Boston – January, 2010 16 | P a g e
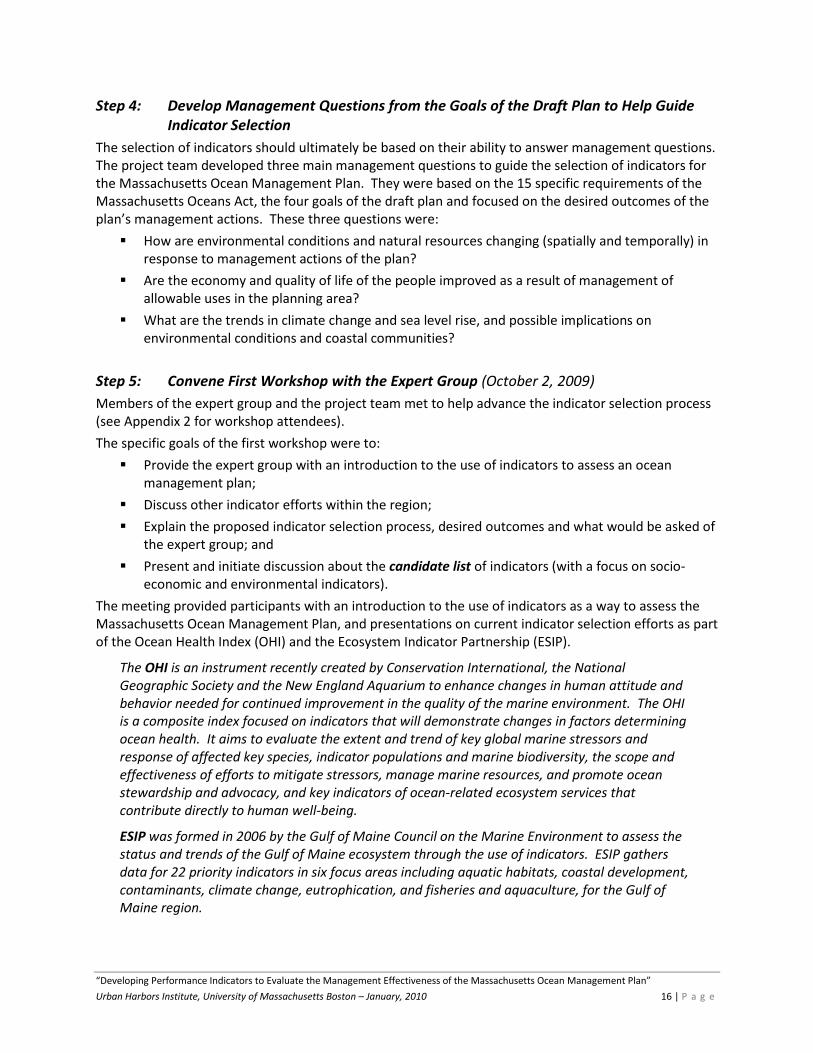
Step 4: Develop Management Questions from the Goals of the Draft Plan to Help Guide Indicator Selection
The selection of indicators should ultimately be based on their ability to answer management questions. The project team developed three main management questions to guide the selection of indicators for the Massachusetts Ocean Management Plan. They were based on the 15 specific requirements of the Massachusetts Oceans Act, the four goals of the draft plan and focused on the desired outcomes of the plan’s management actions. These three questions were:
How are environmental conditions and natural resources changing (spatially and temporally) in response to management actions of the plan?
Are the economy and quality of life of the people improved as a result of management of allowable uses in the planning area?
What are the trends in climate change and sea level rise, and possible implications on environmental conditions and coastal communities?
Step 5: Convene First Workshop with the Expert Group (October 2, 2009)
Members of the expert group and the project team met to help advance the indicator selection process (see Appendix 2 for workshop attendees).
The specific goals of the first workshop were to:
Provide the expert group with an introduction to the use of indicators to assess an ocean management plan;
Discuss other indicator efforts within the region;
Explain the proposed indicator selection process, desired outcomes and what would be asked of the expert group; and
Present and initiate discussion about the candidate list of indicators (with a focus on socio-economic and environmental indicators).
The meeting provided participants with an introduction to the use of indicators as a way to assess the Massachusetts Ocean Management Plan, and presentations on current indicator selection efforts as part of the Ocean Health Index (OHI) and the Ecosystem Indicator Partnership (ESIP).
The OHI is an instrument recently created by Conservation International, the National Geographic Society and the New England Aquarium to enhance changes in human attitude and behavior needed for continued improvement in the quality of the marine environment. The OHI is a composite index focused on indicators that will demonstrate changes in factors determining ocean health. It aims to evaluate the extent and trend of key global marine stressors and response of affected key species, indicator populations and marine biodiversity, the scope and effectiveness of efforts to mitigate stressors, manage marine resources, and promote ocean stewardship and advocacy, and key indicators of ocean‐related ecosystem services that contribute directly to human well‐being.
ESIP was formed in 2006 by the Gulf of Maine Council on the Marine Environment to assess the status and trends of the Gulf of Maine ecosystem through the use of indicators. ESIP gathers data for 22 priority indicators in six focus areas including aquatic habitats, coastal development, contaminants, climate change, eutrophication, and fisheries and aquaculture, for the Gulf of Maine region.

“Developing Performance Indicators to Evaluate the Management Effectiveness of the Massachusetts Ocean Management Plan”
Urban Harbors Institute, University of Massachusetts Boston – January, 2010 17 | P a g e
The selection of indicators for Massachusetts was based on the need to provide a way to assess: (1) whether the goals of the plan are being reached; (2) socio-economic and environmental trends and changes that are the result of management actions; and (3) environmental or socio-economic changes that although caused by natural and anthropogenic drivers rather than by the plan’s management actions, may still affect management decision-making.
In advance of the second workshop, each expert group member was asked to individually complete a worksheet identifying those socio-economic and environmental indicators from the candidate list that he/she felt were critical to assessing plan effectiveness (guided by the three management questions from Step 4). Indicator data availability was not considered at this stage of the selection process. The review of the 32 candidate governance indicators was undertaken separately by the project team. A sample of the worksheet used by the expert group is shown below. The complete worksheet can be found in Appendix 5.
The members of the expert group were asked to complete their review within a week following the workshop.
Below is a sample of the spreadsheet that the members of the expert group used to review the candidate list of indicators following the first workshop. The complete spreadsheet can be found in Appendix 5.
The objective is to develop a list of indicators that can be used to assess the effectiveness of the actions associated with the Massachusetts Ocean Management Plan in achieving the plan's goals.
We would like you to help identify which indicators are of critical importance to answering each of the questions below. The following list of indicators has been selected as potentially relevant to this objective. Please use the "Your selection" column to show the level of importance of each indicator. Please feel free to add any comments/clarifications in the "Your comments" column. Y = critical N = not critical ? = don't know
At this stage do NOT focus on data availability or quality. This phase is to develop the list of the most useful / critical indicators.
ID# Indicator Is this indicator critical to understanding the degree of change
in environmental conditions and natural resources (spatially and
temporally)?
Is this indicator critical to understanding the degree of change in the economy and quality of life of
humans?
Is this indicator critical to understanding trends in climate
change (including sea level rise) and the clear implications on
environmental conditions and human well-being?
Your selection Your comments Your selection Your comments Your selection Your comments
S1 Annual yield from aquaculture (by species)
S15 Land use/land cover
S18 % employees in marine industry
S19 Cost of disease/illness
S20 Economic value of aquaculture
S21 Economic value of coastal industry sectors
S22 Economic value of fisheries (commercial)
NOTE: This stage of the indicator selection process did not take into consideration screening criteria such as data availability; the objective was to conceptually identify the best indicators for evaluating outcomes of the plan’s strategies and actions. Participants were invited to provide comments to clarify the reasoning behind their decisions, and were encouraged to identify those instances where they were not able to draw a clear conclusion. Participants were also

“Developing Performance Indicators to Evaluate the Management Effectiveness of the Massachusetts Ocean Management Plan”
Urban Harbors Institute, University of Massachusetts Boston – January, 2010 18 | P a g e
encouraged to add any indicators missing from the candidate list that they felt would be necessary for answering any of the three questions.
Step 6: Analyze the Output from the First Workshop and Develop a Grouped Candidate List of Indicators
All members of the expert group reviewed the candidate list of indicators as requested and returned their individual spreadsheets electronically.
In order to determine the critical significance of any given indicator to the three management questions, responses were analyzed in the following way:
1. The percentage of respondents who listed an indicator as critical for each question was calculated (with a maximum of 100% for an individual question). See columns Q1, Q2 and Q3 below.
2. The cumulative total percent across all three questions was determined (with a maximum of 300%). See TOTAL column below.
3. If 80% or more of respondents agreed that an indicator was critical to answering a question, it was deemed that a consensus had been reached and the indicator was given a point. If it was found that an indicator was critical for all three questions it was given a score of “3”. Therefore scores ranged from zero to three. See column #Y below. This differs from the previous analysis (in 2 above) in that it helps distinguish those indicators that are critical across questions from those that simply have a relatively high cumulative total percent.
Below shows part of the analysis that was conducted:
%age of respondents who listed indicator as critical
Green ≥80% listed as critical
Number of questions where ≥80% ranked indicator as
critical or not critical
ID# Indicator Q1 Q2 Q3
TOTAL CONSENSUS ON QUESTIONS
%Y %Y %Y #Y #N
E12 Marine disease indices (MSX, Dermo, shell disease) 100% 100% 100% 300% 3 0
E76 # of winds/storms per year >x knots 100% 90% 100% 290% 3 0
E85 Sea surface temperature 100% 90% 100% 290% 3 0
S79 Population/population density residing in coastal zone 100% 100% 89% 289% 3 0
E64 Fisheries (landings, effort) 90% 90% 100% 280% 3 0
S94 Beach nourishment (location, volume, cost) 89% 100% 89% 278% 3 0
S99 Sand mining for beach nourishment (location, volume, cost) 89% 100% 89% 278% 3 0
E7 Species diversity index 90% 80% 80% 250% 3 0
E2 Abundance of individuals (e.g., marine mammals, seabirds, 100% 90% 40% 230% 2 0
E13 Mean sea level rise 40% 90% 100% 230% 2 0
S78 Population density in coastal high hazard areas 22% 100% 100% 222% 2 0
S100 Total cost of weather disasters/year 22% 100% 100% 222% 2 0
This analysis resulted in the assignment of the each of the 57 indicators to one of four categories (see Table 1 below), with the aim that this categorization would guide discussion at the second workshop. An additional category was created for new indicators suggested by workshop attendees.

“Developing Performance Indicators to Evaluate the Management Effectiveness of the Massachusetts Ocean Management Plan”
Urban Harbors Institute, University of Massachusetts Boston – January, 2010 19 | P a g e
Table 1: The categories into which the 57 indicators were assigned as a result of the first workshop.
Category # Indicators
Description Critical to # Questions
1 8 These indicators were listed as critical by ≥80% of respondents for all three questions
3
14 These indicators were listed as critical by ≥80% of respondents for two questions
2
2 16 These indicators were listed as critical by ≥80% of respondents for one or fewer questions but had relatively high cumulative totals
0 or 1
3 16 These indicators were listed as critical by ≥80% of respondents for one or fewer questions and had relatively low cumulative totals
0 or 1
4 3 These had a low cumulative total and were not listed as critical by ≥80% of respondents for any questions
0
5 14 Additional indicators suggested NA
The analysis showed that there was consensus that eight indicators were critical for all three questions and 14 indicators were deemed critical for two of the questions (Category 1). In preparation for the second workshop, these indicators were placed at the top of the list of indicators, suggesting that they were important and that they warranted further discussion.
At this point, three indicators that had low cumulative totals were deemed not to be critical for answering any of the three key questions and so were placed at the bottom of the indicator list presented at the second workshop (Category 4).
Thirty other indicators were deemed critical to answering just one of the questions.
Two indicators were deemed not to be critical to answering any of the questions, but had relatively high cumulative totals across the three questions. Given their high cumulative totals, it was decided to combine them with the 30 indicators critical to answering one question. These 32 indicators were divided between Categories 2 and 3, with Category 2 containing those indicators with higher cumulative totals relative to those in Category 3.
The analysis above does not imply that indicators in Category 1 are necessarily “more” critical than those in the other categories. The exercise undertaken by the workshop participants was to assess each indicator in relation to each of the three management questions, irrespective of any of the other indicators. Therefore, Category 1 simply contains those indicators that the workshop attendees generally agreed were critical across two or more questions.
The results of this analysis became the grouped candidate list used in the second workshop.
Step 7: Convene Second Workshop with the Expert Group (November 10, 2009)
See Appendix 2 for workshop attendees.
The specific goals of the second workshop were for the expert group as a whole to:
Further refine the grouped candidate list of indicators in the context of:
o The goals, strategies, and objectives of the draft Massachusetts Ocean Management Plan (Appendix 4);
o The need to measure socio-economic and environmental trends and changes that are the result of ocean management plan-related management actions;
o The need to measure changes that may not be caused by ocean management plan actions but may still affect management decisions; and

“Developing Performance Indicators to Evaluate the Management Effectiveness of the Massachusetts Ocean Management Plan”
Urban Harbors Institute, University of Massachusetts Boston – January, 2010 20 | P a g e
o The uses permitted under the Ocean Sanctuaries Act (as amended by the Oceans Act), including: renewable energy facilities; sand mining; submarine cables; pipelines; and offshore aquaculture.
Assess the relative importance of each indicator in the grouped candidate list in relation to the others and identify a shortlist of potential indicators that could be included in the final list of indicators (Step 8);
Begin to identify data availability and quality for the potential indicators; and
Discuss other factors that could influence indicators selection and how these might be applied to indicator selection in the future.
The results from the first workshop were presented as a list of the indicators grouped into the five categories discussed above. To assist in assessing each indicator in relation to the others, a conceptual line, or critical needs threshold was defined. Those indicators assessed to be above the threshold would be considered of highest relevance and priority. It was stressed that:
1. Indicators assessed as not exceeding the needs threshold would not be rejected as potential future indicators but would simply not be considered critical indicators at this time; and
2. There was no limit to the number of indicators that could be included in the shortlist of potential indicators (i.e., if one indicator met the criteria another did not necessarily have to be moved below the threshold).
The line, or critical needs threshold, was initially determined to be the operational distinction delineating categories one and two in Table 1. The expert group was asked to work through the list of indicators and, in the context outlined above, decide if various indicators were more useful in assessing plan effectiveness than others. This exercise included the 14 new indicators (10 environmental and four socio-economic) from Category 5 that the expert group had suggested.
Through this discussion a number of cases of substantive overlap between indicators were identified, and these were removed from the list to mitigate information duplication. An example of duplicative indicators was “Number and extent of habitats (by type)” and “Areal extent of seagrass beds”, since eelgrass is a habitat. The participants also suggested that a number of indicators could be grouped into Indicator Sets (as discussed in the Introduction) since collectively they could act as an indicator. An example of this was combining nitrates, phosphates, dissolved oxygen, salinity, chlorophyll a concentration and pH/carbonate saturation into a more generic water chemistry indicator set. This would serve to have indicator components that can be used separately (depending on the issue) or collectively (to serve as a holistic indicator of water chemistry).
The results of this exercise were organized into the ranked candidate list of indicators.
While the availability of data was not a primary criterion in identifying an indicator as critical, the practicability of data acquisition was, to some extent. If the group felt that an indicator could not be measured with any accuracy or that gathering the data at a fine enough scale across the planning area was not feasible in the near future (due to cost, time, availability, technology, resources etc.), the indicator was moved down to the very bottom of the indicator list and was flagged as being unfeasible at present.
The majority of indicators were discussed in detail and a general consensus was reached as to whether they should be considered for the final list of recommended indicators.
The group also provided information about the availability and quality of data for those indicators that were discussed in detail. This discussion was facilitated by the fact that EEA staff had provided information on data availability for many of the indicators prior to the workshop.

“Developing Performance Indicators to Evaluate the Management Effectiveness of the Massachusetts Ocean Management Plan”
Urban Harbors Institute, University of Massachusetts Boston – January, 2010 21 | P a g e
The last item on the agenda for the second workshop focused on potential screening criteria that could be used to evaluate indicators. The attendees were provided with a list of potential screening criteria and were asked to comment on the relative value of each criterion for indicator selection and to suggest additions or refinements. The discussion resulted in the following list of screening criteria (in no specific order):
Is the indicator relevant to policy goals and issues? Is the indicator useful to users (does it convey meaningful information; does it provide decision support to management)?
Are data (current, historical) available for the indicator? Are there established thresholds for the indicator?
Can the indicator be linked to a cause-effect relationship?
Is the indicator responsive to change (spatially, temporally)? How much change does it take to trigger a measurable response? How rapidly does the indicator respond to change and for how long?
Is the indicator scalable?
Is the indicator comparable to regional/global data?
Is the indicator practicable to measure (e.g., cost, time, availability, resources)?
Is the indicator scientifically and technically sound?
It became clear that the relative value of the criteria for indicator selection will vary depending on a number of factors. For example, a high cost of data acquisition might negatively affect the selection of a particular indicator. However, if that indicator is the only way to measure an impact, then cost becomes less of an issue. Another example is that while an indicator might be important to measure an impact, it may become less so if a number of other existing indicators could measure the impact almost as well. The conclusion was that it was not possible to rank the screening criteria by importance and that not all criteria had equal weighting. However, there was agreement that all of the screening criteria could be grouped under the following general criteria:
Applicability, including relevance to policy;
o Ability to detect change
o Ability to predict change
Availability of data; and
Data quality.
Step 8: Develop the Final List of Recommended Indicators
Using the results of the second workshop, members of the project team reorganized the indicators from the ranked candidate list developed in Step 7 into four new categories reflecting their ultimate use in assessing the management actions of the plan. While data availability and quality were recognized as crucial to the actual use of indicators, these were not the primary criteria by which the final list of indicators was selected. This exercise also included the governance indicators. The four new categories were:
Primary Indicators – Those indicators that will provide the best information to assess the degree of success of the Massachusetts Ocean Management Plan. While data are available for some of these indicators, it will be necessary to determine if the current data are suitable and if the data gathering efforts need to be refined. Efforts should be made to gather information for those indicators where data are not currently available.

“Developing Performance Indicators to Evaluate the Management Effectiveness of the Massachusetts Ocean Management Plan”
Urban Harbors Institute, University of Massachusetts Boston – January, 2010 22 | P a g e
Supporting Indicators – Those indicators that may provide valuable supporting information to better understand the primary indicators. Data for many of these indicators are already being gathered. Efforts should be made to ensure that this continues and that data are gathered in a manner that will be of most value to the Commonwealth.
Secondary Indicators – Those indicators chosen by the expert group that are related to the Massachusetts Ocean Management Plan and are not currently deemed critical to assessing the success of the plan. In many cases, data for these indicators are not currently being gathered, and future data collection efforts should be made as the opportunity/need arises or as funding becomes available. These indicators may well become important as new issues emerge or as projects are proposed.
Indicators Not Currently of Interest – Those indicators that are not relevant to assessing the effectiveness of the Massachusetts Ocean Management Plan at this time and are not expected to become so in the foreseeable future.
It is important to note that the final list of recommended indicators was selected based on the draft Massachusetts Ocean Management Plan made available for public comment in June of 2009. The list of indicators and the assignment of indicators to specific categories may be modified along with revisions to the plan. Additionally, indicators may be added or removed from this list as new data become available, new uses are proposed and implemented in the planning area, or new conditions arise that warrant their use.

“Developing Performance Indicators to Evaluate the Management Effectiveness of the Massachusetts Ocean Management Plan”
Urban Harbors Institute, University of Massachusetts Boston – January, 2010 23 | P a g e
APPENDIX 2: WORKSHOP ATTENDEES
Expert Group
First Workshop Only
Anamarija Frankic*, Department of Environmental, Earth and Ocean Sciences, UMass Boston;
Betsy Nicholson*, NOAA, Coastal Services Center; and
John Weber*, Massachusetts Office of Coastal Zone Management (EEA).
Both Workshops
Todd Callaghan*, Massachusetts Office of Coastal Zone Management (EEA);
Phil Colarusso*, U.S. Environmental Protection Agency;
Kathryn Ford*, Massachusetts Department of Fish and Game, Division of Marine Fisheries;
Steven Katona*, Consultant, Ocean Health Index;
Andrea Rex*, Massachusetts Water Resources Authority;
Alex Strysky*, Massachusetts Department of Environmental Protection, Waterways Program;
David Terkla*, Department of Environmental, Earth and Ocean Sciences, UMass Boston;
Christine Tilburg*, Gulf of Maine Council on the Marine Environment, ESIP Program; and
Prassede Vella*, Massachusetts Office of Coastal Zone Management (EEA).
Second Workshop Only
Dan Sampson, Massachusetts Office of Coastal Zone Management (EEA).
*denotes members of the expert group asked to review the candidate list of indicators after the first workshop.
Project Team Attendees
Both Workshops
Robert Bowen, Department of Environmental, Earth and Ocean Sciences, UMass Boston;
Jack Wiggin, Urban Harbors Institute, UMass Boston;
Dan Hellin, Urban Harbors Institute, UMass Boston;
Kristin Uiterwyk, Urban Harbors Institute, UMass Boston;
Stephanie Moura, Massachusetts Ocean Partnership;
Nicholas Napoli, Massachusetts Ocean Partnership;
Kim Starbuck, Massachusetts Ocean Partnership; and
Howard Krum, Massachusetts Ocean Partnership.

“Developing Performance Indicators to Evaluate the Management Effectiveness of the Massachusetts Ocean Management Plan”
Urban Harbors Institute, University of Massachusetts Boston – January, 2010 24 | P a g e
APPENDIX 3: REVIEWED PROGRAM DOCUMENTS Documents included:
Appendices 8 and 9 of A 25 Year Strategic Plan for the Great Barrier Reef World Heritage Area 1994-2019. (http://www.gbrmpa.gov.au/__data/assets/pdf_file/0005/7169/mp_017_appendix_8-9.pdf. Accessed December 2009.)
Belfiore, S. et al. (2006). A handbook for measuring the progress and outcomes of integrated coastal and ocean management. IOC Manuals & Guides; ICAM Dossier 2, Paris, UNESCO.
Boelens, R., Gray, J., Parsons, A. (2004). Review and Evaluation of Marine Environmental Impact Indicators and their Application in Ireland. NDP Marine RTDI Desk Study Series.
Boston Harbor and Massachusetts Bay Monitoring Programs. (http://www.mwra.com/harbor/html/bhrecov.htm).
Bowen, R.E. (2009). Massachusetts Ocean Management Plan Appendix C -- Science Tools to Implement EBM in MA. (http://commpres.env.state.ma.us/mop/draft_plan/tech_reports/science_tools.pdf).
Chesapeake Bay Program (CBP) Environmental Indicator Framework. (http://www.chesapeakebay.net/content/publications/cbp_13416_13440.pdf).
Coastal Zone Management Act Performance Measurement System. (http://coastalmanagement.noaa.gov/success/measure.html#2).
Ecosystem Indicator Partnership website (http://www.gulfofmaine.org/esip/factsheet-01.php).
Executive Office of Energy and Environmental Affairs. (2009). Massachusetts Ocean Management Plan.
Katona, S. (2008). Feasibility Study for Creating an Ocean Health Index. A White Paper prepared for Conservation International, the National Geographic Society and The New England Aquarium. Draft.
Mills, K. E. (2006). A Strategy for Gulf of Maine Ecosystem Indicators and State of the Environment Reporting. Gulf of Maine Council on the Marine Environment.
Ministry for the Environment. (2001). Environmental Performance Indicators: Confirmed indicators for the marine environment. (http://www.mfe.govt.nz/publications/ser/marine-indicators-jun01.html).
Northeast Coastal Indicators Workshop: Workshop report-out and senior management panel response. (http://www.gulfofmaine.org/nciw/FinalWorkshopSummary.pdf).
UNESCO. (2003). A Reference Guide on the Use of Indicators for Integrated Coastal Management. Dossier no. 1. http://unesdoc.unesco.org/images/0013/001305/130584e.pdf.
UNESCO. (2003). The Integrated, Strategic Design Plan for the Coastal Ocean Observations Module of the Global Ocean Observing System. GOOS Report No. 125; IOC Information Documents Series N°1183; (http://www.ioc-goos.org/index.php?option=com_oe&task=viewDocumentRecord&docID=105).
Walmsley, J. (2009). Gulf of Maine State of the Environment Reporting. Scoping Document, Final Report.

“Developing Performance Indicators to Evaluate the Management Effectiveness of the Massachusetts Ocean Management Plan”
Urban Harbors Institute, University of Massachusetts Boston – January, 2010 25 | P a g e
APPENDIX 4: GOALS, STRATEGIES, AND OUTCOMES FROM THE DRAFT MASSACHUSETTS OCEAN
MANAGEMENT PLAN (made available for public comment in June of 2009).
Goal #1: Integrated management
Requirements of the Oceans Act:
Set forth the Commonwealth’s goals, siting priorities, and standards for ensuring effective stewardship of its ocean waters held in trust for the benefit of the public.
Adhere to sound management practices, taking into account the existing natural, social, cultural, historic, and economic characteristics of the planning areas.
Coordinate uses that include international, federal, state and local jurisdictions.
Encourage public participation in decision-making.
Strategies:
Define goals, strategies, and outcomes that are responsive to the Act, reflect consideration of public comment, and can be achieved within the Act’s timeline based on existing information.
Review and incorporate as appropriate related/relevant Commonwealth law and policies, such as those related to climate change.
Characterize the planning area and its component regions through the baseline assessment and regional characterizations.
Review and consider the policies of regional, municipal, and other formal plans that address ocean waters.
Accommodate local and regional policies and initiatives that are consistent with the Act and the Commonwealth’s ocean management goals.
Develop criteria for selecting alternative management strategies/actions.
Identify measures of success or indicators that can be used to measure performance of management strategies in achieving desired outcomes.
Designate protection and use areas and develop integrated management measures in consideration of international, federal, state, and local jurisdictions.
Coordinate designation of protection and use areas and measures with federal agencies.
Coordinate designation of protection and use areas in state waters with review of adjacent federal waters for areas with similar features/values.
Develop governance structure that maintains Ocean Advisory Commission (OAC) and Science Advisory Council (SAC) functions and coordinates roles and responsibilities of state agencies in integrated ocean management, plan implementation, and advisory capacity to Secretary of Energy and Environmental Affairs.
Maintain ‘networked’ governance structure for flexibility and responsiveness to implementation of Act.
Outcome: An integrated ocean management plan that:
Is responsive to the Oceans Act.
Is implemented in coordination across jurisdictional levels.
Achieves balance through the designation of areas for uses and activities allowed pursuant to the Oceans Sanctuaries Act and in the planning area.

“Developing Performance Indicators to Evaluate the Management Effectiveness of the Massachusetts Ocean Management Plan”
Urban Harbors Institute, University of Massachusetts Boston – January, 2010 26 | P a g e
Goal #2: Effective stewardship/protection of the marine ecosystem
Requirements of the Oceans Act:
Value biodiversity and ecosystem health.
Respect the interdependence of ecosystems.
Identify and protect special, sensitive, or unique marine and estuarine life and habitats.
Strategies:
Compile existing data to identify ecologically important areas.
Review Fisheries and Habitat Work Group reports.
Review certainty/uncertainty of existing data and available methodologies.
Develop Ecological Valuation Index (EVI).
Develop compatibility/conflict matrix.
Map gradations of ecological value based on EVI.
Consider connectivity between/among areas of ecological value.
Overlay existing regulatory protected areas.
Define “special, sensitive, and unique.”
Overlay data from other work groups.
Apply conservative approach to area designated for management areas as proportion of overall planning area.
Map appropriate Special, Sensitive, and Unique areas.
Develop/modify regulations to reflect protected status.
Outcome: Special, sensitive, and unique areas identified and protected based on the first generation of an ecosystem-based management approach.
Goal #3: Effective stewardship/economic use of marine ecosystem
Requirements of the Oceans Act:
Preserve and protect the public trust.
Preserve and enhance public access.
Reflect the importance of the waters of the Commonwealth to its citizens who derive livelihoods and recreational benefits from fishing.
Foster sustainable uses that capitalize on economic opportunity without significant detriment to the ecology or natural beauty of the ocean.
Support the infrastructure necessary to sustain the economy and quality of life for the citizens of the Commonwealth.
Identify appropriate locations and performance standards for activities, uses, and facilities allowed in Ocean Sanctuaries.
Address climate change and sea level rise.
Strategy:
Map gradations of habitat value.
Overlay existing regulatory protected areas.

“Developing Performance Indicators to Evaluate the Management Effectiveness of the Massachusetts Ocean Management Plan”
Urban Harbors Institute, University of Massachusetts Boston – January, 2010 27 | P a g e
Overlay use data.
Apply compatibility matrix.
Identify potentially suitable use areas (for sustainable uses, infrastructure, renewable energy, and other uses allowed under the Ocean Sanctuaries Act).
Apply conservative approach to total area designated as use areas as proportion of overall planning area, informed or modified by the following guidance for decision-making, explicit or inherent in the Act and/or illustrated through workgroup report data:
o Minimize conflict with commercial fishing by siting development areas outside areas of significant fishing effort and value.
Minimize conflict with significant interconnections between homeports and grounds.
For specific projects developed pursuant to the ocean management plan, develop methodology to identify impacted fishery and assess economic impact of specific development projects (apply through Massachusetts Environmental Policy Act [MEPA]).
For specific projects developed pursuant to the ocean management plan, develop framework for mitigation (apply through MEPA).
o Minimize conflict with recreational fishing by siting incompatible uses outside areas of concentrated recreational fishing activity.
Preserve/enhance public access by siting use areas to minimize impacts to concentrations of recreational uses.
o Consider impacts to significant interconnections between shore access points and destination areas.
Incorporate specific performance standard(s) for deepwater aquaculture criteria in development area.
Apply performance standard specifically for cables; evaluate management measures for other utilities based on compatibility matrix factors like significance/duration of impact, conflict with other uses.
Identify appropriate test/pilot project areas for renewable energy development as part of use areas or performance standard overlay.
For renewable energy facilities, use and resource overlays provide basis for identifying “appropriate scale” and generally appropriate areas, for the following factors from the Act:
o Protection of the public trust.
o Compatibility with existing uses.
o Environmental protection.
o Public safety.
Develop performance standards to address:
o Community benefit.
o Proximity to the shoreline.
o Appropriateness of technology and scale.
“Appropriate scale” incorporates consideration of appropriateness of scale necessary to be responsive to climate change and state renewable energy statutory requirements.

“Developing Performance Indicators to Evaluate the Management Effectiveness of the Massachusetts Ocean Management Plan”
Urban Harbors Institute, University of Massachusetts Boston – January, 2010 28 | P a g e
Outcome: Use areas identified and enforceable management measures promulgated such that:
Locations and performance measures for allowable uses and infrastructure are identified.
Renewable energy development is of appropriate scale.
Conflicts with/impacts to existing uses and resources are minimized.
Measures for reconciling use conflicts with fisheries are developed.
Permitting is streamlined.
Goal #4: Adaptive framework
Requirements of the Oceans Act:
Encourage public participation in decision-making.
Adapt to evolving knowledge and understanding of the ocean environment
Strategies:
Prioritize key management issues and related science needs for the next iteration of the ocean management plan.
With the SAC, develop a strategy for addressing prioritized ocean management issues that require additional scientific research and/or data collection.
Prioritize scientific research and data collection efforts of state agencies to reflect ocean management plan priorities.
Facilitate the use of science in public outreach and education.
To assist in implementing the science strategy, enlist the expertise and capacity of the University of Massachusetts, other colleges and universities, federal agencies, non-governmental organizations, and other entities engaged in ocean-related scientific research.
Institute a process for future amendments to the ocean management plan that adequately responds to the pace of advances in science and technology and economics.
Ensure public participation as a key part of the ocean plan amendment process.
Outcome: An adaptive framework that:
Establishes the ocean management plan as a key driver of future, ocean-related scientific research.
Provides basis for sound ocean policy, management, and science in the future.
Results in science and research in response to identified management and policy issues.
Continues to engage stakeholders in future iterations of the ocean management plan.
Provides a foundation to communicate scientific information to the public.
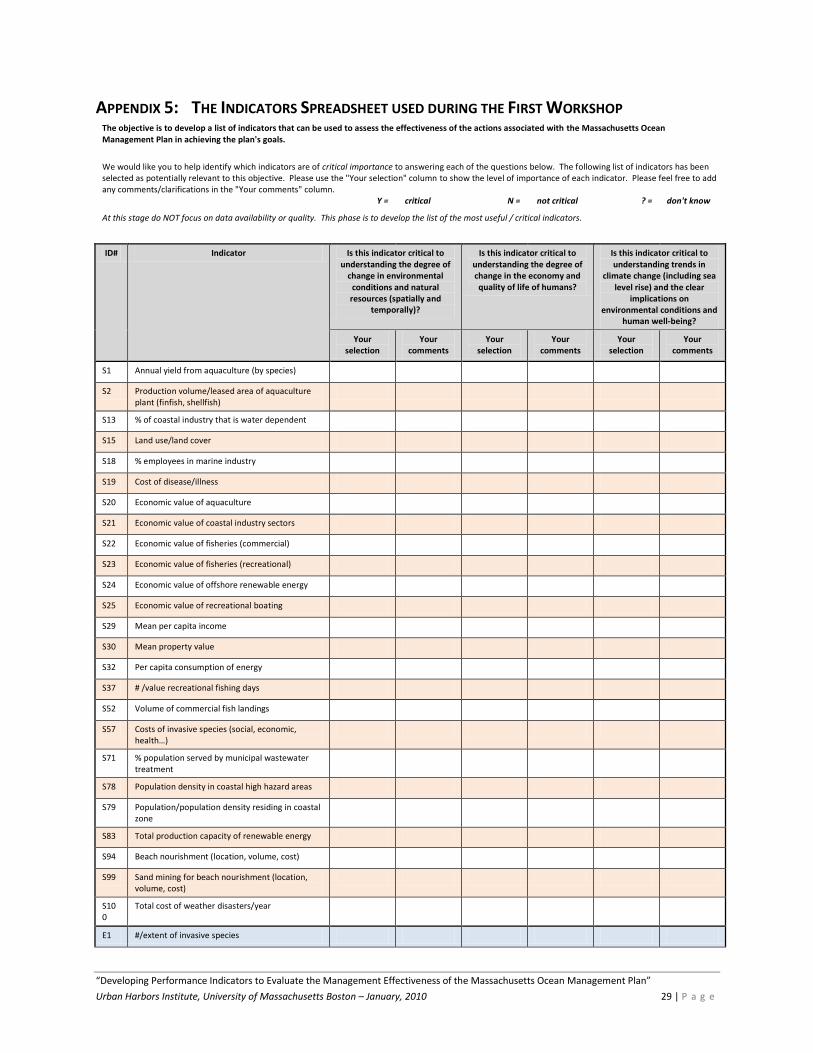
“Developing Performance Indicators to Evaluate the Management Effectiveness of the Massachusetts Ocean Management Plan”
Urban Harbors Institute, University of Massachusetts Boston – January, 2010 29 | P a g e
APPENDIX 5: THE INDICATORS SPREADSHEET USED DURING THE FIRST WORKSHOP The objective is to develop a list of indicators that can be used to assess the effectiveness of the actions associated with the Massachusetts Ocean Management Plan in achieving the plan's goals.
We would like you to help identify which indicators are of critical importance to answering each of the questions below. The following list of indicators has been selected as potentially relevant to this objective. Please use the "Your selection" column to show the level of importance of each indicator. Please feel free to add any comments/clarifications in the "Your comments" column. Y = critical N = not critical ? = don't know
At this stage do NOT focus on data availability or quality. This phase is to develop the list of the most useful / critical indicators.
ID# Indicator Is this indicator critical to understanding the degree of
change in environmental conditions and natural resources (spatially and
temporally)?
Is this indicator critical to understanding the degree of change in the economy and quality of life of humans?
Is this indicator critical to understanding trends in
climate change (including sea level rise) and the clear
implications on environmental conditions and
human well-being?
Your selection
Your comments
Your selection
Your comments
Your selection
Your comments
S1 Annual yield from aquaculture (by species)
S2 Production volume/leased area of aquaculture plant (finfish, shellfish)
S13 % of coastal industry that is water dependent
S15 Land use/land cover
S18 % employees in marine industry
S19 Cost of disease/illness
S20 Economic value of aquaculture
S21 Economic value of coastal industry sectors
S22 Economic value of fisheries (commercial)
S23 Economic value of fisheries (recreational)
S24 Economic value of offshore renewable energy
S25 Economic value of recreational boating
S29 Mean per capita income
S30 Mean property value
S32 Per capita consumption of energy
S37 # /value recreational fishing days
S52 Volume of commercial fish landings
S57 Costs of invasive species (social, economic, health…)
S71 % population served by municipal wastewater treatment
S78 Population density in coastal high hazard areas
S79 Population/population density residing in coastal zone
S83 Total production capacity of renewable energy
S94 Beach nourishment (location, volume, cost)
S99 Sand mining for beach nourishment (location, volume, cost)
S100
Total cost of weather disasters/year
E1 #/extent of invasive species

“Developing Performance Indicators to Evaluate the Management Effectiveness of the Massachusetts Ocean Management Plan”
Urban Harbors Institute, University of Massachusetts Boston – January, 2010 30 | P a g e
E2 Abundance of individuals (e.g., marine mammals, seabirds, nekton…)
E4 Habitat diversity
E5 Population diversity index
E7 Species diversity index
E9 Rainfall
E12 Marine disease indices (MSX, Dermo, shell disease)
E13 Mean sea level rise
E14 Mean sea surface and bottom temp
E21 HAB events
E22 Nitrates
E24 Phosphates
E25 # of (or frequency of) confirmed spills (by type/cause)
E29 Inorganic contaminant index (from land or vessels)
E31 Mussel tissue data
E32 Organic contaminant index (from land, vessels)
E53 # and extent of habitats (by type)
E54 # individuals of fish in trawl (by species), age structure
E61 Areal extent of sea grass beds
E62 Biomass of species in trawl (by species)
E64 Fisheries (landings, effort)
E66 Mean length of fish sampled
E68 Presence of keystone species/indicator species
E75 Zooplankton (identification, enumeration)
E76 # of winds/storms per year >x knots
E77 Average wave height
E79 Chlorophyll a concentration (phytoplankton biomass)
E80 Dissolved oxygen
E83 pH
E84 Salinity
E85 Sea surface temperature
E86 Sedimentation rates for selected areas - including sediment transport
If you have additional indicators that you feel are critical to the Massachusetts Ocean Management Plan, please list them here:
Note: Under the ID# column, “S” indicates a socio-economic indicator, and “E” indicates an environmental indicator.

“Developing Performance Indicators to Evaluate the Management Effectiveness of the Massachusetts Ocean Management Plan”
Urban Harbors Institute, University of Massachusetts Boston – January, 2010 31 | P a g e
APPENDIX 6: FINAL LIST OF RECOMMENDED SOCIO-ECONOMIC AND ENVIRONMENTAL
INDICATORS WITH INITIAL INFORMATION ON DATA AVAILABILITY AND QUALITY.
Type Outcome Indicator Potential Data Availability Potential Future Data Sources
PR
IMA
RY
Envi
ron
me
nta
l
Change in location and/or extent of core and important habitat (e.g., feeding, nesting, breeding areas) of Special, Sensitive or Unique Marine and Estuarine Life and Habitat (SSU) species (e.g., whales, birds etc., as identified in the plan)
- Massachusetts Division of Fisheries and Wildlife (DFW). - Mass Audubon. - New England Aquarium (NEAQ) - Provincetown Center for Coastal Studies (PCCS). - Massachusetts Division of Marine Fisheries (DMF). - National Oceanic and Atmospheric Administration (NOAA).- National Marine Fisheries Service (NMFS). - US Fish and Wildlife Service (USFWS) North Atlantic Right Whale Consortium (NARWC). - Natural Heritage and Endangered Species Program (NHESP). - US Navy? - The College of the Atlantic? - The Nature Conservancy?
Change in abundance/population density of species within SSU areas (e.g., whales, birds etc., as identified in the plan)
Change in areal extent of SSU resources (e.g., eelgrass, mudflats, hard/complex bottom etc., as identified in the plan)
Change in: (1) total biomass/abundance; and/or (2) distribution of biomass/abundance across species for fish, mollusks and crustacean species within SSU areas
Expansion of the range of watched invasive species
- Marine Invasive Species Monitoring Program. - Marine Invader Monitoring and Information Collaborative (MIMIC) - Massachusetts Office of Coastal Zone Management (CZM). - Rapid Assessment Surveys - MIT SeaGrant and others.
Number and extent of habitats (by type) with a focus on SSUs
- Department of Environmental Protection (DEP) - eelgrass data. - CZM. - Massachusetts Water Resources Authority (MWRA) - benthic habitat and infaunal data.
Fish Population Assessment Biomass of species in trawl (by species) Fisheries (landings, effort) Mean length of fish sampled # individuals of fish in trawl (by species), age structure(?)
- DMF conducts resource assessment trawls although the data are somewhat limited both temporally and spatially and are focused on groundfish1. - MWRA.
Mean sea level rise - National Ocean Service (NOS) maintains a series of tidal records in the Center for Operational Oceanographic Products and Services (CO-OPS) program. - Buoy data2.
- Woods Hole Oceanographic Institution (WHOI).

“Developing Performance Indicators to Evaluate the Management Effectiveness of the Massachusetts Ocean Management Plan”
Urban Harbors Institute, University of Massachusetts Boston – January, 2010 32 | P a g e
Sea surface, water column and bottom temperature
- Sea Surface Temperature (SST) can be derived from Sea-viewing Wide Field-of-view Sensor (SeaWiFS). - Bottom temperature is frequently modeled. - MWRA. - DMF3.
- NOAA. - WHOI. - Gulf of Maine Ocean Observing System (GoMOOS). - Northeastern Regional Association of Coastal Ocean Observing Systems (NERACOOS). - Marine Ecosystem Dynamics Modeling Laboratory (MEDML), UMass Dartmouth. - Department of Environmental, Earth and Ocean Sciences (EEOS), UMass Boston. - Buoys collect SST and other data but coverage may be limited4.
- MOP will be supporting the Marine Ecosystem Dynamics Modeling Laboratory (MEDML), UMass Dartmouth to model some oceanographic conditions.
Soci
o-e
con
om
ic
Economic value, production volume and leased area of aquaculture operation
- DMF maintains data and it is digitized5. - Other data may not be centralized and might need to be gathered from municipalities. Gathered as part of the Cumulative Impacts Study. - Massachusetts Department of Agricultural Resources (MDAR). - US Department of Agriculture (USDA). - Data derived from the MOP / Industrial Economics (IEc) Community Linkages report and the MOP Cumulative Impacts Analysis aquaculture dataset.
Economic value of fisheries (commercial)
- DMF. - NMFS. - NOAA/NMFS - Standard Atlantic Fisheries Information System (SAFIS).
Economic value of fisheries (recreational)
- DMF. - NOAA/NMFS.
Economic value of offshore renewable energy
Economic value of recreational boating - Massachusetts Marine Trades Association (MMTA). - US Coast Guard (USCG). - The MOP / IEc Community Linkages report has a section on recreational boating based on the Donahue Institute report “An Assessment of the Coastal and Marine Economies of Massachusetts”.
- Pending MOP Human Use Characterization studies.
Economic value of coastal industry sectors (other than fisheries, recreational boating, offshore energy and offshore aquaculture)
Total production capacity of renewable energy in offshore federal, offshore state and inshore waters
- Can likely be derived from Executive Office of Energy and Environmental Affairs (EEA) records. - Information from potential proponents.

“Developing Performance Indicators to Evaluate the Management Effectiveness of the Massachusetts Ocean Management Plan”
Urban Harbors Institute, University of Massachusetts Boston – January, 2010 33 | P a g e
SUP
PO
RTI
NG
Envi
ron
me
nta
l
Marine disease indices (e.g., MSX, Dermo, shell disease) including Harmful Algal Blooms and other diseases (in shellfish, bivalves, fish etc.)
- DMF tracks the distribution of shell diseases, HABs. - MWRA monitors flounder liver disease at three locations.
Mussel tissue data or other measures of inorganic contaminants
- Gulfwatch program.
Water Chemistry Nitrates Dissolved oxygen Phosphates Salinity Chlorophyll a concentration (phytoplankton biomass) pH/carbonate saturation
- MWRA. - Ecosystem Indicator Partnership (ESIP)6. - MEDML. - EEOS.
- MOP will be supporting MEDML to model some oceanographic parameters.
Rainfall - MWRA. - NOAA. - National Weather Service (NWS). - Blue Hill Meteorological Observatory.
Number of winds/storms per year >x knots and directionality
- National Data Buoy Center.
Number of (or frequency of) confirmed spills (including type, cause and volume)
- DEP's Emergency Response Unit maintains the data. However, it is not readily accessible and there may be confidentiality issues7. - USCG? - Applied Science Associates (ASA)?
Beach closure days - Department of Public Health (DPH).
Soci
o-e
con
om
ic
Number of employees in marine industry
- Donahue Institute report. - US Bureau of Labor Statistics. - NOAA Office of Statistics.
- Pending MOP Human Uses study will improve / develop data.
Number of registered vessels - Massachusetts Environmental Police's (MEP) Boat, Recreation Vehicle and Snowmobile Registration Bureau. - MOP / IEc Community Linkages report. - Massachusetts Ocean Resource Information System (MORIS).
Number of whalewatch trips and/or attendance on whalewatch vessels
- WHOI? - Stellwagen Bank National Marine Sanctuary - http://sanctuaries.noaa.gov/special/- whale_econ/whale_report.pdf
Land use/land cover - NOAA Coastal Change Analysis Program (C-CAP). - Office of Geographic and Environmental Information (MassGIS).
Mean coastal property value
Population density in coastal "high hazard areas" or "coastal zone"
- Depends on whether census blocks coincide with high hazard areas. - Other data sources / methods?
Total cost of weather disasters/year - Federal Emergency Management Agency (FEMA)? - Massachusetts Emergency Management Agency (MEMA)?

“Developing Performance Indicators to Evaluate the Management Effectiveness of the Massachusetts Ocean Management Plan”
Urban Harbors Institute, University of Massachusetts Boston – January, 2010 34 | P a g e
SEC
ON
DA
RY
Envi
ron
me
nta
l
Inorganic contaminant index in biota/water/sediment
- No centralized, ongoing data collection. - United State Geological Survey (USGS) - sediment data?
Organic contaminant index in biota/water/sediment
- No centralized, ongoing data collection. - ESIP has been unsuccessful in identifying /locating such data. - USGS - sediment data?
Species diversity index - Depends on species. Some such indices exist (e.g., benthic infauna). Others would need to be developed or defined.
Zooplankton (identification, enumeration)
- Some modeling work has been done; some scientific papers. - NEAQ? - PCCS?
Sedimentation rates for selected areas - including sediment transport
- USGS will be conducting a sediment transport study that builds on the MOP circulation model hindecast database.
Beach attendance - Department of Conservation and Recreation (DCR) may have some data.
Population distribution of threatened/endangered species with a focus on SSUs
- Perhaps look at changes in the number of species in the red list. - MA Audubon? - NEAQ? - PCCS? - DMF? - DFW? - USFWS?
Soci
o-e
con
om
ic
Number of divers/dive trips/air fills? - Pending MOP Human Uses study will improve / develop data.
Number and value of recreational fishing days
- DMF – recreational saltwater fishing licenses.
- Pending MOP Human Uses study will improve / develop data.
Cost of marine vectored disease/illness
Costs of invasive species (social, economic, health…)
1 Trawl Survey Information - The DMF trawl survey covers species identification, abundance and biomass, weight, and length of species. It occurs in May and September and has for 30 years. It only covers demersal species, and the most reliable analyses are done only on species vulnerable to the trawl method. Some species are known to have substantial adult and juvenile fish in the catch, and therefore analyses can be done to separate them out (for example, a large number of small fish can have the same weight as a small number of large fish). This is the Methods description from the 2008 annual report: (available at: http://www.mass.gov/dfwele/dmf/programsandprojects/rap_2008_annual_report.pdf): "The study area is stratified based on five bio-geographic regions and six depth zones. Trawl sites are allocated in proportion to stratum area and randomly chosen in advance within each sampling stratum. Randomly chosen stations in locations known to be untowable due to hard bottom are reassigned. Sampling intensity is approximately 1 station per 19 square nautical miles. A minimum of two stations are assigned to each stratum. A standard tow of 20-minute duration at 2.5 knots was attempted at each station during daylight hours with a 3/4 size North Atlantic type two seam otter trawl (11.9 m headrope/15.5 m footrope) rigged with a 7.6 cm rubber disc sweep; 19.2 m, 9.5 mm chain bottom legs; 18.3 m, 9.5 mm wire top legs; and 1.8 X 1.0 m, 147 kg wooden trawl doors. The codend contains a 6.4 mm knotless liner to retain small fish. Prior to setting the net at each station, NOAA Corps officers surveyed the site by visually scanning for buoys marking fixed gear as well as determining the suitability of the bottom for towing the net based on the sounder image. Whenever necessary, sites were relocated due to untowable bottom or concentrations of fixed gear. Abbreviated tows of 13-19 minute duration were accepted as valid and expanded to the 20 minute standard. Standard bottom trawl survey techniques were used when processing the catch. Generally, the total weight (nearest 0.1 kg) and length-frequency (nearest centimeter) were recorded for each species on standard trawl logs. Collections of age and growth material, and biological observations were undertaken during the measuring operation. Specimens were also saved to fulfill requests. At each station, surface temperatures were measured with a bucket thermometer and surface salinity was recorded with a refractometer. Bottom temperatures were continuously recorded with an Onset Computer Tidbit TM attached to the net’s headrope."

“Developing Performance Indicators to Evaluate the Management Effectiveness of the Massachusetts Ocean Management Plan”
Urban Harbors Institute, University of Massachusetts Boston – January, 2010 35 | P a g e
2 Sea level data are available at: www.pol.ac.uk/psmsl/psmsl_individual_stations.html
3 Bottom Temperature - From the Draft Plan Volume 2 Baseline Assessment, Chapter 8, Climate Change: "Marine Fisheries has long-term temperature monitoring stations at locations throughout the state. SST data is available since 1988 through the shellfish classification database which contains sites primarily in embayments. The Fisheries Resource Assessment program measures the bottom temperature at all tow locations during its assessment trawls in May and September (since 1978). There are also several bottom temperature datasets overseen by the Coastal Lobster Investigation program: Cleveland Ledge (continuous since 1990, in 35 feet of water), Buzzards Bay (continuous since 1989, in 70 feet of water), sites in Cape Cod Bay at 60 feet, 90 feet, and 120 feet water depth (continuous since 1988), and temperature data on lobster traps (since 2006, summer only). Some datasets have received preliminary analysis, and show a general warming trend."
4 There are a number of buoys gathering temperature (surface, and some both bottom and surface), salinity, wave height, wind and tide data in various locations including Mass Bay, Buzzard's Bay, and off the Cape and the Islands.
5 Oil Spill Tracking - DEP's Emergency Response Unit is responsible for oil spill tracking. MassDEP manages the oil spill database. Apparently the data are not stored in an easy-to-access form. One would need to establish a new protocol if one wanted to use # oil spills as an indicator. There may also be an issue with giving these data to an outside source.
6 Chlorophyll a - Data also exists on a number of buoys. Nitrates and phosphates - ESIP, through the effort of members from EPA and USGS, have completed work on nitrogen and phosphorus loading for embayments of interest in Mass (Cape Cod and North) using the SPARROW model.
7 Aquaculture Data - All of the available aquaculture data is digitized. The SAFIS database is where dealer information is housed, and if things are reported correctly, it is identified if the catch is from aquaculture facilities. It is described here: http://www.mass.gov/dfwele/dmf/dealers/ma_safis_overview.pdf . The Standard Atlantic Fisheries Information System, or SAFIS, is an electronic reporting system that has been developed by the Atlantic Coastal Cooperative Statistics Program (ACCSP) and the National Marine Fisheries Service (NOAA Fisheries), in conjunction with many state partners on the East Coast. To obtain SAFIS data, contact DMF. Some of the information in the database is confidential. Also, DMF produces an annual aquaculture report, which consolidates the annual reports required of all aquaculture license holders. These reports are not online right now, but they are available by DMF. The reports include species, volume, area of aquaculture, etc. It is divided by municipality, but all available in a single report (a Word document). ESIP has the data on aquaculture for Massachusetts.