Comparative Study on Competitiveness between Norway and ...
118
Comparative Study on Competitiveness between Norway and Russia Nazar Kokaurov Bachelor’s thesis May 2019 School of Business Degree Programme in International Business
-
Upload
khangminh22 -
Category
Documents
-
view
0 -
download
0
Transcript of Comparative Study on Competitiveness between Norway and ...

Comparative Study
on Competitiveness
between Norway and Russia
Nazar Kokaurov
Bachelor’s thesis May 2019 School of Business Degree Programme in International Business

Description
Author(s)
Kokaurov, Nazar Type of publication
Bachelor’s thesis Date
May 2019
Language of publication: English
Number of pages
116 Permission for web
publication: x
Title of publication
Comparative Study on Competitiveness between Norway and Russia Degree programme
Degree Programme in International Business
Supervisor(s)
Akpinar, Murat
Assigned by
JAMK Centre for Competitiveness
Abstract
In the modern world, scholars have paid significant attention to the competitiveness of nations, since it reflects the economic and the social situation of a country. There are frameworks and models that determine a level of competitiveness; therefore, it is possible to compare the competitive level of different countries. In particular, Norway and Russia have analogously developed oil and gas production, however, this inheritance of natural resources does not make the countries competitively equal. Actually, the Global Competitiveness Index 2018 (GCI) ranked Norway at 16th, while Russia was in the 43rd position. Thus, the objective of the present study was to investigate the reasons for Norway’s competitiveness over Russia. The GCI, which was used as the theoretical framework, allowed to conduct a cross-country comparison by illustrating distinctions in the provided so-called productivity pillars that were constituted by corresponding subpillars.
A comparative case study formed the research strategy, and the data was collected by applying a qualitative approach which allowed analysing the data in-depth. It was mainly reached through the secondary data retrieved from online sources. Also, it was complemented by primary data that was obtained from online semi-structured interviews with two native Russian-speaking respondents involved in researches at Nord University.
Preliminary results showed that there were five pillars (namely Institutions, Skills, Labour market, Financial system, and Innovation capability) that illustrated the highest contrast between the examined countries, while 23 subpillars were identified as the most problematic areas for Russia compared to Norway. In the in-depth analysis, the main findings were related to systematic drawbacks of Russia, its comparatively weak level of financing of education and businesses which also were not encouraged and supported enough to innovate. Additionally, the poorer economic circumstances of residents had a negative impact on Russia. Among the major reasons, it was found that cultural differences between the chosen nations influenced Norway’s competitiveness more positively. Practically, some of the successful actions of Norway were provided for Russian policymakers’ consideration in order to increase the competitiveness of the country.
Keywords/tags (subjects) Competitiveness, Comparative Case Study, Russia, Norway, Global Competitiveness Index
Miscellaneous (Confidential information)

1
Contents
1 Introduction .................................................................................................. 4
1.1 Background .................................................................................................. 4
1.2 Motivation ................................................................................................... 7
1.3 Research problem, question, approach and structure of the thesis .......... 8
2 Literature review ......................................................................................... 10
2.1 Competitiveness ........................................................................................ 10
2.2 The Diamond of National Advantage ........................................................ 14
2.3 Development of the Porter’s Diamond Model ......................................... 17
2.4 Emerald Model .......................................................................................... 19
2.5 Theoretical Framework ............................................................................. 21
3 Methodology ............................................................................................... 26
3.1 Research approach .................................................................................... 26
3.2 Research context ....................................................................................... 29
3.3 Data collection ........................................................................................... 33
3.4 Data analysis .............................................................................................. 37
3.5 Verification of the results .......................................................................... 39
4 Results......................................................................................................... 41
4.1 Preliminary analysis ................................................................................... 41
4.2 In-depth analysis ....................................................................................... 49
4.2.1 Institutions ............................................................................................ 50
4.2.2 Skills ...................................................................................................... 57
4.2.3 Labour market ...................................................................................... 63
4.2.4 Financial system.................................................................................... 65
4.2.5 Innovation capability ............................................................................ 70
4.3 Summary.................................................................................................... 78

2
5 Discussion.................................................................................................... 80
References .......................................................................................................... 90
Appendices ........................................................................................................113
Figures
Figure 1. Production of crude oil by October of 2018 ................................................... 5
Figure 2. Natural gas production in 2017 ....................................................................... 6
Figure 3. Determinants of the Diamond Model ........................................................... 14
Figure 4. Comparison of the Porter's Diamond Model and the Nine Factor Model ... 18
Figure 5. The Dual Double Diamond Model ................................................................. 19
Figure 6. The Emerald Model ....................................................................................... 20
Figure 7. The Global Competitiveness Index 2018 ....................................................... 23
Figure 8. Location of Norway and its neighbours ........................................................ 29
Figure 9. Location of Russia and its neighbours ........................................................... 32
Figure 10. Process of in-depth data analysis ................................................................ 38
Figure 11. Norway performance overview .................................................................. 42
Figure 12. Russia performance overview ..................................................................... 43
Figure 13. Interest rates of the countries .................................................................... 66
Figure 14. Total researchers per 1 000 employed ....................................................... 75
Tables
Table 1. Norway's selected indicators .......................................................................... 30
Table 2. Employment of 15-74 years population in Norway by industries.................. 31
Table 3. Russia's selected indicators ............................................................................ 32
Table 4. GDP composition of Russia by economic activities in 2018 ........................... 33
Table 5. Types of qualitative interview ........................................................................ 35
Table 6. Comparison of Russia's and Norway's pillars scores ...................................... 44
Table 7. Scores in Business dynamism ......................................................................... 45
Table 8. Scores in Institutions ...................................................................................... 46
Table 9. Scores in Skills ................................................................................................. 47

3
Table 10. Scores in Labour market ............................................................................... 47
Table 11. Scores in Financial system ............................................................................ 48
Table 12. Scores in Innovation capability ..................................................................... 48
Table 13. Variables for in-depth analysis ..................................................................... 49
Table 14. Snapshot of performance in science, reading and mathematics ................. 61

4
1 Introduction
1.1 Background
In the days of the developing megatrend of globalization and international trade,
competition among countries rises, and the competitiveness of a country has
become a source for discussions. There are different definitions of competitiveness
postulated by a variety of experts from all around the world as well as frameworks
that allow determining the level of competitiveness of a specific nation. Some of
them are similar in certain points, while others are much broader and concrete
providing with rankings, figures, and possibilities to examine countries in their annual
indicators by comparing them either with their previous positions or with other
countries. Porter (1990) fundamentally contributed to the field as he introduced the
Diamond Model framework in his study titled The Competitive Advantage of Nations
where the competitiveness of nation may be determined by four attributes: Factor
Conditions, Demand Conditions, Related and Supporting Industries and Firm
Strategy, Structure and Rivalry. Porter’s Diamond has become a classical, and it
motivated many academics to apply and research the model. Obviously, the
framework was criticised and subjected to alterations, and therefore, after several
modifications done by different scholars, a reputable work has been done by Moon
(2006) who introduced the Dual Double Model considering both internal and
external environment and taking into account the possible dependence of one
country on another. Furthermore, special attention should be paid to the Emerald
Model by Reve & Sasson (2012) that has been created to assess the competitive
advantage of some regions or industries of a country.
Speaking more about frameworks that may be used in countries’ comparison in
terms of their competitiveness, the one that is known for the careful calculations of
many indicators is the Global Competitiveness Index that is published every year in
the Global Competitiveness Report by the World Economic Forum. The index
assesses countries following the set criteria of 12 pillars supported by subpillars and
place them accordingly because of having a specific figure for a pillar. (Schwab 2018.)
Consequently, it is possible to find countries that are similar in their trade activities,

5
location or historical connections where the position of one can significantly differ
from a vis-à-vis.
Actually, there is a variety of empirical studies dedicated to a comparison of the
competitiveness between selected countries sectors. For example, Akpinar &
Mermeciouglu (2014) examined the Turkish and Finnish IT industries. Also, it is
possible to find a big number of comparative researches about the competitiveness
of countries that represent the same region. The work aimed to compare chosen
Latin American Countries was done by Castro-Gonzalez, Espina & Tinoco-Egas (2017).
Even though that it is mentioned above that the number of researches of the subject
is not small, there are, however, no studies aimed to investigate the difference of
competitiveness between Norway and Russia, the countries that have a considerable
economic similarity. Concretely, The Kingdom of Norway and the Russian Federation
are the countries that are known for their richness in fossil fuels, especially in the
forms of oil and natural gas. Russia and Norway are among the top ten countries
producing crude oil (see Figure 1). If Russia is the second producer in the world,
Norway takes one of the leading positions solely representing the continent of
Europe.
Figure 1. Production of crude oil by October of 2018 (adapted from Production of crude oil including lease condensate 2019)
0 2 4 6 8 10 12
USA
Russia
Saudi Arabia
Iraq
Canada
Kuwait
Brazil
Nigeria
Mexico
Norway
Angola
Thousands barrel per day
Co
un
try

6
From the perspective of natural gas production, both countries take the highest
places globally (see Figure 2). In the case of Russia, it is again in the second place,
whereas Norway is also among the top. Similar to crude oil production, Norway is the
only European country that is present in the ranking.
Figure 2. Natural gas production in 2017 (adapted from Global Energy Statistical Yearbook 2018)
The importance of the oil and gas sector in both countries is evident. Developed
sector allows the states to provide inhabitants with workplaces, build international
trade partnerships because of export, and invest earned money to purposes that
may positively contribute to the level of competitiveness of the country. In 2018, the
industry of petroleum mostly contributed to the economy of Norway by being 17% of
GDP (Macroeconomic indicators for the petroleum sector 2018). Around 20% of gas
consumption needs in Europe (mainly to Germany, France and Belgium) are satisfied
by Norwegian export (Sasson & Blomgren 2011). There were more than 170
thousands of employees in the industry in the year of 2017 (Employment in the
petroleum industry 2018).
Speaking about Russia, the petroleum contribution to GDP of Russia is even more
significant: in 2017, it was around 30% (Candau 2018). According to Barden (2017),
36% of federal budget revenues were generated from the petroleum operations in
2016, when Russia was mainly exporting to the Netherlands, Germany, and China.
0
100
200
300
400
500
600
700
800
900
USA Russia Iran Canada Qatar China Norway Australia Saudi Arabia Algeria
Bill
ion
cu
bic
met
ers
Countries

7
The Ministry of Energy of the Russian Federation has reported that 288 licensed
organizations could conduct the business in the territory of Russia (Ministerstvo
Energetiki Rossiiskoi Federatsii 2018).
1.2 Motivation
Basically, the author’s interest in researching the competitiveness had been rising
and reinforced during the course named Economics of Internationalization and
Competitiveness at the university. The Global Competitiveness Index (GCI) that was
studied in several lectures made the author thinking more about differences in some
countries’ positions, their circumstances, obstacles, and actions. Distinctions in
numbers motivated the author to go in details to fathom why one country, which has
a lot in common with another, is much more competitive. Therefore, the study aims
to contribute to the issue of comparison of competitiveness between two nations
that are not identically located, have a different history and the form of government
but have quite analogously essential industry influencing the countries’ economy.
Speaking about the case of the thesis, the similarity between chosen countries is
apparent, they both benefit from the oil and gas sector. However, the perception of
countries in terms of competitiveness differ. Referring to the GCI 2018, Russian
Federation was ranked only as 43rd, when Norway is considerably higher in the rating
being 16th (Schwab 2018). In general, Norway is famous for its high living standards.
It has a leading welfare system providing citizens with free education, social benefits,
and high-quality health care. (OECD 2017.) Russia, in turn, cannot boast of such
results but as we see from the figures above, the country has a bigger production of
products made of the natural resources. Those endowments of Russia, however, do
not make the quality of Russian citizens’ life the same as Norwegians have. This can
be illustrated by GDP/capita of the countries, in 2017 Norway had 75 505 USD, while
Russian indicated only 10 743 USD meaning that it is almost 86% less than in Norway
(Schwab 2018).
For this reason, The Kingdom of Norway may play a role model for Russia which
might adopt some Norway’s approaches that positively contributed to the country’s

8
position and pay attention to some factors not allowing Russia to climb on the
ranking.
Last but not least, Russia was chosen intentionally, personal motivation has also
played a role in selecting a country for the research since the author’s nationality is
Russian. It enables the author to collect the needed data from different resources
that are available or may be accessible only in the Russian language.
1.3 Research problem, question, approach and structure of the thesis
Research problem
Even though Russia is one of the richest countries in the production of oil and gas, it
is quite lowly ranked in the GCI 2018. Therefore, the country needs information
regarding the weakest elements that impede its competitiveness. It is of vital
importance to understand what exactly has to be improved in order not to go the
way that does not positively contribute to the country’s progress. Hence, due to the
assumption that countries strive to develop, to adopt policies to current conditions
and to prosper, it is reasonable to look for more successful examples of nations by
setting their activities, regulations, and directions as bottom lines and endeavouring
to reach their indicators as a minimum requirement to progress. Due to Norway’s
relatively high position in terms of competitiveness and, moreover, similarity of the
richness in gas and oil to Russia, it allows to have a better understanding of the point
that having a massive inheritance of natural resources is not enough to be globally
competitive because it is a very complex subject involving a variety of corresponding
factors that the research aims to investigate.
The issue may seem relevant, however, by the moment of the research, there are no
easily found studies dedicated to the competitiveness of Norway or/and Russia. It is
possible to access the study of Triantafyllou (2014) who examined the business
environment and the competitiveness of Russia and even compared it to so-called
Black Sea region countries and BRIC members. In the case of Norway, it is even more
challenging to find similar available researches. One of this limited number is a work
by Semini et al. (2016) who analysed the potential competitive advantage for

9
manufacturers in Norway. Obviously, both mentioned studies differ from this thesis,
though touch similar subject.
Research question
As it may become clear from the previously said words, the research addresses to
answer the following research question:
• What are the reasons behind Norway’s competitiveness over Russia?
Research approach
Ideally, the information is obtained through the most recent and available secondary
data. Saunders, Lewis and Thornhill (2009, 269) describe that it provides researchers
with the advantage of having data that enables to compare information among all
the findings. Moreover, the secondary data collected for the thesis is complemented
by answers gained through tailored interviews with experts representing both
countries to have a possibility to consider the issue from both perspectives. In this
thesis, interviews are also crucial to be conducted to have reliable and valid data to
answer the research question (ibid., 318). Therefore, the research is qualitative by
nature.
The Global Competitiveness Index 2018 was chosen as the theoretical framework
that narrows allocation of the secondary data that is relevant for the research as well
as formulates the questions needed for doing the interviews.
Structure of the thesis
The thesis is composed of five chapters. It starts from Introduction chapter that
covers background, motivation, research problem, research question and approach.
Literature Review goes as the second chapter where the author critically reviews
definitions of competitiveness defined by some academics, the common measures,
famous models of competitiveness; the theoretical framework is also included in the
chapter. The third chapter is concerned with the methodology used for this study. It
provides the readers with a more detailed description of the research approach, the
context of the research, the way of collecting the data needed for this study and the
way of analysing the collected data. Also, the chapter contains results verification.

10
Chapter four presents the findings based on the secondary data gathered for the
thesis as well as the results of interview discussions undertaken during the data
collection process. The chapter includes the summary of the major findings of the
study. The thesis ends by the fifth chapter named Discussion where the author
discusses the practical implementations, reflect the thesis limitations and leave some
recommendations for future researches that will be helpful for the field.
2 Literature review
2.1 Competitiveness
Definition
The term “competitiveness” has been defined differently by different economists,
researchers, and scholars. One of them is Porter (1990, 73) who argues that
competitiveness is created only when industries of a nation are able to innovate and
upgrade. Porter (2012) adds that the industry, in turn, may develop only under
appropriate conditions that are fostered by the nation. Moreover, the environment is
the key to a nation in its success (ibid.). Atkinson (2013) supposes that a region’s
economic health and its competitiveness are strongly connected. He reveals that the
economic health may be determined by the number of jobs but, in reality, a region
may have a lower employment rate while still being more productive than another.
Therefore, competitiveness may be defined by the region’s ability to have more
exports in value-added terms than its imports. (2.)
However, Krugman (1994, 31) alleges that in practice selling more abroad than
buying – considered as a so-called trade surplus – may be a weakness. For instance,
Leightner (2010, 44) in his study discusses the trade surplus of China which is, in fact,
the excess savings exported mainly to the USA. Those savings are accumulated in the
system where a Chinese citizen needs to pay for healthcare services before the
treatment despite having a health insurance that covers only a part of treatment
costs. In China, hospitals aim for profits, and it is not profitable to treat patients who
are not able to pay, thus, poorer people are not treated and thus receive fatal
diseases. A Chinese citizen, due to fear and uncertainty, may save 28% on average of

11
her/his income that maximizes his/her utility. (ibid., 46.) The government instead of
making huge investments could improve the citizens’ quality of life by spending more
in the healthcare sector. The current system will limit China’s competitiveness in the
long-run because the local people are not secure, and they may not contribute to the
development because of the inappropriate environment. Therefore, according to
Ketels (2016, 7), the competitiveness of locations should not be perceived equally to
the competitiveness of firms. It differs in a sense that a region can adjust levels of
prosperity at any moment and there is a relation among location in a country
because the prosperity of one may positively or negatively influence on the
prosperity of others. These may lead to a dangerous part of the concept of
competitiveness: policies may intentionally aim to increase export by decreasing the
prosperous level. (ibid., 8.) As we see from China’s example, people are not provided
with a sufficient level of health care services. Delgado et al. (2012, 6) profess the
view that a nation is perceived as competitive when it is able to provide people with
high standard of living. Thus, Chetyrkina (2016, 54) says that quality of life should be
provided by re-distributed value from trade surplus that will make the country
competitive and allow to enhance the value.
Hence, Krugman (1994, 31) refers to the definition of competitiveness made by Ty-
son (1993, 1) saying that it is a region’s ability to provide people with rising and
sustainable living standards while produced goods and services meet international
markets. Going back to Porter (1990, 76), he expresses that environment for a
region’s competitiveness is created by productivity – “the value of the output
produced by a unit of labour or capital” depending on the efficiency of the
production, quality, and features of the product. Sustainable living standards
mentioned by Tyson are maintained by the nation if its industries achieve high-
productivity (Porter 1990, 76). Additionally, productivity is supposed to be a
determinant of the economic growth also including “rates of returns obtained by
investments in an economy” (Sala-I-Martin et al. 2007, 3).
Hall and Jones (1999, 144) were studying the difference between countries economic
performance and concluded that the productivity plays the critical role which
reaches a high level when there are policies set to provide citizens with conditions
allowing to prosper. Important to mention that even though that the prosperity is

12
impacted by the country’s endowments, it has no contribution to productivity and
there are examples of successful countries with limited natural resources like
Germany and Switzerland (Porter 1990, 76; Delgado et al. 2012, 8). The key point is
to manage the legacy and direct it to long-run development. Moreover, natural
resources, obviously, become a considerable part of the country’s trade but may be a
source of corruption arising in political institutions (Delgado et al. 2012, 12).
Considering all of the written above features, Bondarenko (2007, 25) complexly de-
fines competitiveness as the country’s ability to develop in terms of external
economic circumstances by sustaining the development in conditions of achieving
strategic targets and providing domestic industries with appropriate economic,
social, political, managerial and marketing factors that positively impact to design,
produce, sell goods and services that are more attractive for consumers comparing
to competitors’ offers that, in turn, contributes to citizens well-being caused by the
development of national economy. In other words, it is the ability to have a
combination of inheritance and policies that build a benevolent environment for
businesses and enhance people’s prosperity (Garelli 2006, 63).
Measurement
Gross Domestic Product per capita (it is calculated in the way of division of GDP by
the number of inhabitants) may be considered as one of the metrics of nations’
competitiveness. In general, GDP measures the current production of a country and
indicates the country’s performance in general (Kubiszewski et al. 2013, 57). GDP
may be calculated by the income of the population; therefore, it considers the
productivity level of population and institutions. Changes in GDP may be caused by
changes in produced goods and services or their prices. (Ivković & Strossmayer 2016,
260.) Then it may be connected with revenues generated from international trade
leading to less money invested in the domestic market. Hence, a nation may start
losing its competitiveness. Important to mention that GDP measures the economic
growth of a nation influencing human welfare, since the resources needed for the
level of education, security and health shall be increased accordingly. (Samans 2017.)

13
The measurement, however, is originally based only on monetary transactions with
no consideration of people’s life quality expressed in the form of social context,
human development and well-being (Costanza et al. 2009, 8-9).
In order to consider issues that are not covered by GDP/capita, it is possible to refer
to Social Progress Index focusing on the social and environmental performance of a
country (Porter, Stern, & Green 2017, 14). It is predominantly measured by a nation’s
ability to provide its people with basic human needs such as nutrition, medical care,
water, shelter, sanitation and safety, then with access to education, wellness,
environmental quality and finally with maintaining of basic human rights and
freedoms, build the blocks that will help people and communities to develop and
sustain their quality of life and reach their full potential (ibid., 16-17). These factors
directly affect human lives and productivity and subsequently have an influence on
economic growth and national competitive advantage. The index allows to
holistically see the social progress of the country and understand what kind of
improvements are needed and where the efforts should be directed to contribute to
handling issues and enhancing the competitiveness (Porter 2016).
Education is one of the major parts of the index that is, according to Ramoniene and
Lanskoronskins (2011, 128-138), connected with the country’s future growth
potential contributing to R&D development. Social progress creates a learning
society where more productive economy emerges; therefore, living standards will be
increased (Stiglitz, & Greenwald 2014, 6). The country’s actions towards social
progress may be considered as the development of human rights. Protection of
human rights positively influences people’s motivation to work more and makes the
environment more attractive to foreign investors (Brown 2008, 8).
Furthermore, political stability attracts Foreign Direct Investments (FDI) that
contribute to the development of the country. Apart from cash flow and bigger
capitals, it helps local companies to enter international markets, to have knowledge
coming from and over the boarders as well as to stimulate productivity by increasing
competition in the domestic market that increases innovations made by domestic
companies. (Gonzalez 2017.) Developing countries or the ones which are not
comparatively developed de facto in need for FDI to obtain a competitive advantage
in particular industries (Moon, Rugman & Verbeke 1995, 101).

14
2.2 The Diamond of National Advantage
Porter (1990, 78) to answer the question of why companies from a concrete region
succeed over its international competitors, introduced the Diamond Model including
four attributes (see Figure 3). The model tells that prosperity is not inherited but
created, thus, the Diamond Model is a proactive model (Cho & Moon 2005, 4).
Figure 3. Determinants of the Diamond Model (adapted from Porter 1990)
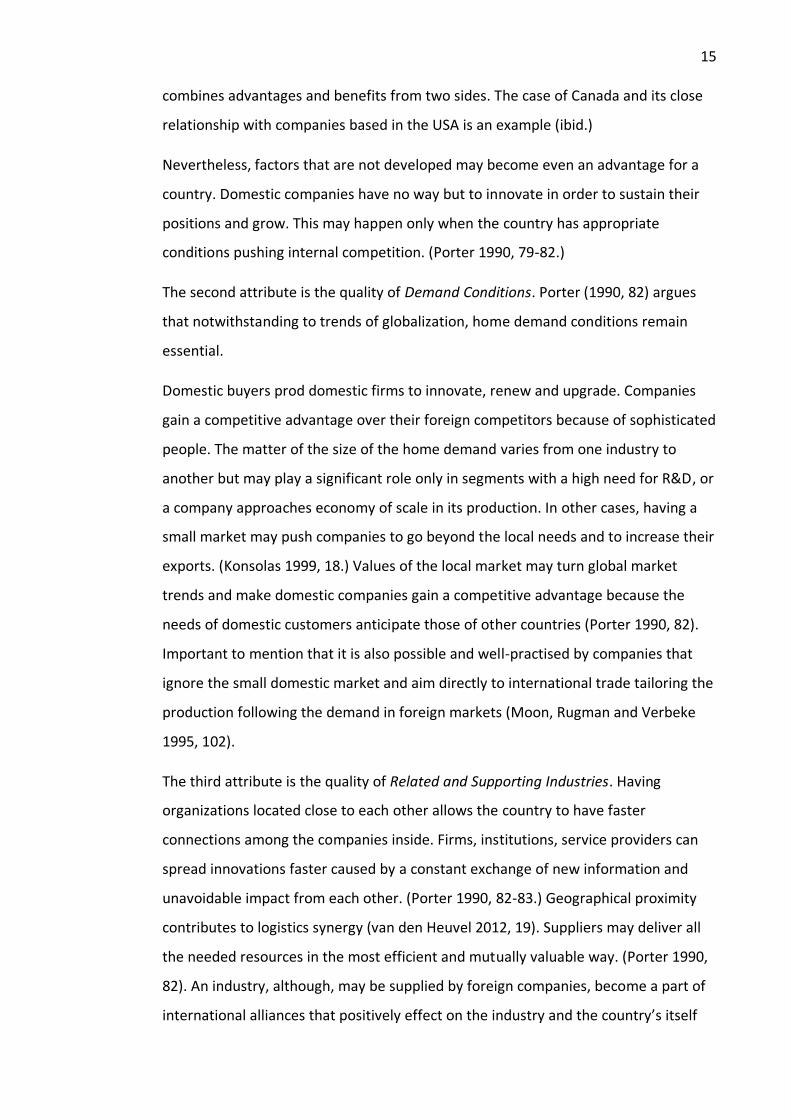
The first attribute of the model is the quality of Factor Conditions. The factor is
divided into two categories: basic and advanced (Konsolas 1999, 17). Basic factors
are those that a nation inherits or can create by simple investments and with not a
great endeavour. It could be a geographical location of a country, natural resources,
climate, and low-skilled labour. Advanced factors such as educated population,
skilled workforce, developed infrastructure, and scientific base can be only created
by a nation that demands specialized and continuous contribution (ibid.) Prosperity
grows in that nation that has a variety of high-quality universities, research institutes,
and training possibilities. Such a developed scientific base shall be a productivity
driver. (Porter et al. 2008, 49.)
Advanced factors give an advantage of being difficult to imitate by foreign
competitors as well as allowing to enhance present factors (Porter 1990, 79).
However, Moon, Rugman and Verbeke (1995, 100-101) notice that in the case of a
small economy, advanced factors may also be complemented by close to borders
trading partners or by the presence of MNEs in the territory of the country that
15
combines advantages and benefits from two sides. The case of Canada and its close
relationship with companies based in the USA is an example (ibid.)
Nevertheless, factors that are not developed may become even an advantage for a
country. Domestic companies have no way but to innovate in order to sustain their
positions and grow. This may happen only when the country has appropriate
conditions pushing internal competition. (Porter 1990, 79-82.)
The second attribute is the quality of Demand Conditions. Porter (1990, 82) argues
that notwithstanding to trends of globalization, home demand conditions remain
essential.
Domestic buyers prod domestic firms to innovate, renew and upgrade. Companies
gain a competitive advantage over their foreign competitors because of sophisticated
people. The matter of the size of the home demand varies from one industry to
another but may play a significant role only in segments with a high need for R&D, or
a company approaches economy of scale in its production. In other cases, having a
small market may push companies to go beyond the local needs and to increase their
exports. (Konsolas 1999, 18.) Values of the local market may turn global market
trends and make domestic companies gain a competitive advantage because the
needs of domestic customers anticipate those of other countries (Porter 1990, 82).
Important to mention that it is also possible and well-practised by companies that
ignore the small domestic market and aim directly to international trade tailoring the
production following the demand in foreign markets (Moon, Rugman and Verbeke
1995, 102).
The third attribute is the quality of Related and Supporting Industries. Having
organizations located close to each other allows the country to have faster
connections among the companies inside. Firms, institutions, service providers can
spread innovations faster caused by a constant exchange of new information and
unavoidable impact from each other. (Porter 1990, 82-83.) Geographical proximity
contributes to logistics synergy (van den Heuvel 2012, 19). Suppliers may deliver all
the needed resources in the most efficient and mutually valuable way. (Porter 1990,
82). An industry, although, may be supplied by foreign companies, become a part of
international alliances that positively effect on the industry and the country’s itself

16
because of the flow of technologies, novelties, and information coming from outside
(Konsolas 1999, 19). Such strong connections make domestic companies reach the
highest productivity and increase the performance of the country (Delgado et al.
2012, 11-12). Apart from well-established home industries and suppliers’
relationship, companies should also look for mutually beneficial international
partners that will allow to have a stronger global position, enhance performance and
also have spread of valuable information (Moon, Rugman and Verbeke 1995, 104).
The fourth attribute is the quality of Firm Strategy, Structure and Rivalry. Local
companies by competing with each other are pushed, intentionally or not, to come
up with novelties, reducing costs, investing more, improving quality, consequently,
make themselves stronger players in the global arena (Porter 1990). Managerial
approaches, organizational structures, goals, eagerness to enter foreign markets,
should fit the industry where firms compete. Simultaneously, national context
(historical tendencies, quality of education) directly influence the way companies
managed. (Konsolas 1999, 19.) The motivation and attitude of individuals to succeed
towards competitors should also be considered (Porter 1990, 84). The appearance of
new enterprises creates pressure in the market because of making a danger to
recapture a certain niche. The number of businesses, however, does not determine
the intensity of domestic rivalry because it is more important to have companies be
committed to the industry and not very cooperative with each other (Konsolas 1999,
20). Moon, Rugman and Verbeke (1995, 104-105) comment that domestic rivalry is
not always a key to be internationally competitive. They suggest considering Korean
development where the fierce local competition was prevented by the government
before the end of the 1980s due to resources scarcity. Only new and more
democratic policies and the world’s economic recession made domestic companies
focus more on Korean customers. (ibid.)
According to Porter (1990, 87), the role of a Government is not predominant; it is
indirect. The government plays the role of catalyst that reinforces all four
components. The government cannot create a competitive advantage, but it can
provide companies with appropriate policies, regulations, therefore, edify the
needed conditions for domestic industries. Governmental policies should encourage
local companies to upgrade and innovate, but the result of any action of the

17
government may be slow, requiring time to see the either positive, negative or
neutral effect. (ibid.) Moon, Rugman and Verbeke (1995, 110-112) contradict saying
the government should be a central factor in the Diamond because it is also in the
interest of the government to have sustainable firms when they mainly care only
about their performance.
Additionally, another exogenous factor is the Chance – events that may not be
controlled and by local companies. These events like global political changes,
economic changes, demand changes may happen outside the country and influence
the whole national industry. (Konsolas 1999, 20.) For example, fluctuations in oil
prices made the biggest Norwegian oil company Statoil stop its investment
programmes, and it even had to cancel some agreements. In 2015, Statoil cancelled
partnership with drilling company Songa Trym. (Offshore Energy Today.)
2.3 Development of the Porter’s Diamond Model
The Diamond Model paid attention of different scholars. It led to further studies
regarding the model and its adjustments, improvements and tailoring to different
contexts and countries’ level of development.
As it may become clear by the comments of Moon, Rugman and Verbeke written
above, Diamond’s Model is too much domestic-market based that does not fit to
countries representing small economies which are more likely to be depended on
international activities (Balcarová 2013, 7).
Therefore, Moon, Rugman and Verbeke (1995; 1998) introduced the Double
Diamond Model. Both studies of the model aimed to define the competitiveness of
Singapore and Korea, which were small economies at the moment of the research,
mainly developed by international activities to have advanced technologies, foreign
capital, to obtain access to natural resources and workforce, information and
innovation exchange with another country’s diamond model (Phungtua 2016, 27-29).
The model was empirically studied by Liu & Hsu (2009) who compared the
competitiveness of Taiwan and Korea. They found that Taiwan was slightly more
competitive partly because of its role in the global market (ibid.)

18
The focus of the Double Diamond model was still mainly on physical factors (Cho &
Moon 2005, 5). Thus, Cho & Moon (2013) came up with the Nine-factor Model.
Comparing to Porter's model, the main difference (see Figure 4) is in a sense that
natural resources, geographical environment (now under the section named
endowment) and human factors including public servants, workers, entrepreneurs,
business leaders, and engineers are not the Factor attribute (ibid.) Physical Factors
are supposed to be motivated, controlled and created by Human Factors who are the
national economy drivers (Moon 2006, 5).
Figure 4. Comparison of the Porter's Diamond Model and the Nine Factor Model (adapted from Cho & Moon 2013, 150)
Important to mention that the factor of the Government is considered as Internal
which is External Factor in Porter’s version (Balcarová 2013, 8). Business
environment expresses the level of infrastructure (telecommunication, roads) and
defines the difficulty of starting the business in the country (ibid.) Infrastructure in
the form of transportation belongs to the Related & Supporting Industries (Cho &
Moon 2013, 150). Additionally, even though that Figure 4 demonstrates
determinants of the Diamond Model in the form of the list, it is vital to remember
that attributes Government and Chance indirectly influence on countries’
competitiveness.
According to Moon (2006, 5), both the Double Diamond and Nine Factors Models
should be combined into the one model to determine the competitiveness of the
country more carefully. Therefore, Moon introduced the Dual Double Model that

19
considers previous, and physical and human factors from domestic and international
perspectives (see Figure 5). (ibid.)
Figure 5. The Dual Double Diamond Model (adapted from Cho & Moon 2013, 173)
In the empirical study, Cho & Moon (2009) tested the Diamond Model (DM), the
Double Diamond Model (DDM), Nine Factors Models (NFM) and the Dual Double
Diamond Model (DDD) and found that models give different results. For instance,
Sweden's competitive position was determined as 5th via DM, DDM and NFM but
DDD showed that the country’s actual rank is 7th, whereas Honk-Kong takes the 5th
place climbing from 17th, 13th and 6th places determined via DM, DDM and NFM
respectively (according to available data at the moment of the research).
2.4 Emerald Model
A cluster is geographically nearly located network of interrelated organizations
including different companies, research institutes, and educational units. All in all,
clusters play important role in the nations’ competitive advantage. Since they are
present in the territory of a country, clusters provide local people with workplaces,
they positively impact on productivity, push the emergence of new businesses and
support existed ones. (Porter 2000; 2008.) Clusters intermediate innovations because
the success of one will be spread among other representatives of the local economy
(Shiryaev et al. 2016).
Consequently, the presence of developed clusters contributes to the economic sound
of the nation. These thoughts made Reve & Sasson (2012) develop the Emerald
Model (see Figure 6). According to Akpinar, Can & Mermeciouglu (2017, 162), Sasson

20
& Reve (2012) examined the model in terms of attractiveness for inward FDI; Akpinar
& Mermeciouglu (2014) also used the model on comparison between Finnish and
Turkish IT clusters; Sasson (2011) approached the Emerald Model on Norwegian
health industry’s competitiveness; and Akpinar, Can & Merme-ciouglu (2017)
assessed U.S. states competitiveness via the model. It tells that the model may
examine stimulation of the ability of a country to globally compete since clusters are
located entirely or partly in the territory of the country.
Figure 6. The Emerald Model (adapted from Sasson 2011, 6)
The model consists of 6 dimensions conceptualizing regions’ ability to attract
advanced educational institutions and departments, talented employees, advanced
scholars, R&D projects, adequate and willing investors and owners, the creation and
implementation of environmental solutions, as well as a diverse and significant group
of related companies (Reve & Sasson 2015, 18). Cluster Dynamics is in the role of the
moderator of the dimensions’ influence on economic performance (ibid.) According
to Akpinar & Mermeciouglu (2014, 5), Cluster Dynamics show the flow of knowledge
in the cluster.
Cluster Attractiveness addresses to the degree of the cluster’s completeness, the
presence of needed firms related to the industry, its value-creation properties and its
geographical distribution (Sasson 2011).
Education Attractiveness is the dimension that demonstrates the market competition
level of the industries from the perspective of human capital investments. Actually,
the dimension is expressed by investments from educational units that provide

21
inhabitants with educational programs tailored to the industry’s relevant needs. The
industries can develop over time in the case of the constant flow of the best human
capital. (ibid.)
Sasson affirms that R&D and Innovation Attractiveness is of vital importance in terms
of sustainable economic growth. The dimension may be determined by the number
of researchers, existed number of R&D institutions, the amount of investments
allocated to R&D needs related to the cluster activities. Also, the number of
registered patents and produced publications should also be included. (ibid.)
Talent Attractiveness is the fourth dimension. An educated workforce is always
desired in the cluster. Enlightened people graduated from the educational
institutions contribute to the competitiveness by being competent professionals who
can give a push to the sector. The role of the cluster here is not only to have more
people obtained a degree but provide them with sufficient conditions for their
growth. (Ibid.) Additionally, foreign talents coming to the industry are also counted,
since they come not only as professionals but with insights and perspective from
another culture (Sassen 2011, 50).
The fifth dimension is Ownership Attractiveness. Having investments in the form of a
significant amount of foreign or national capital coming to finance the current and
future activities of the industry is important to develop emerging businesses like
start-ups and established business that also may need special financing to keep
updated to the market trends and innovate (Akpinar & Mermeciouglu 2014, 6).
Because of increasing environmental load, pollution, climate change, and other
adverse environmental tendencies, clusters are considered through their
Environmental Attractiveness where firms endeavour to minimize their emissions by
coming up with the most environmentally friendly solutions, and the government
sets new frameworks and standards (Sasson 2011; Reve & Sasson 2015).
2.5 Theoretical Framework
The Global Competitiveness Index (GCI) is annually published in the Global
Competitiveness Report by the World Economic Forum. Porter et al. (2008, 43) argue
that GCI includes both microeconomic and macroeconomic factors of

22
competitiveness. Therefore, GCI allows for understanding the level of nations’
competitiveness position by considering the internal and external environment.
Therefore, GCI 2018 was designed under The Fourth Industrial Revolution (4IR) to
provide governments, business leaders as well as other stakeholders with insights
regarding strategical actions and effort needed to consider in order to have
sustainable economic growth and increasing nation’s competitiveness (Schwab
2018). 4IR, according to Schwab (2016), is based on the Third Industrial Revolution –
the era of active integration of information technology and globalization in daily life.
4IR has appeared because of the very fast development of technological
breakthroughs like the Internet of Things, artificial intelligence, biotechnology, and
autonomous driving. 4IR shall have a considerable impact on the worldwide business,
on people’s income, quality of their life, changes in the employment and,
consequently, new technologies undoubtedly reflecting productivity. (ibid.)
In general, GCI defines competitiveness as “the set of institutions, policies, and
factors that determine a country’s level of productivity” that is contemplated as the
key aspect in the economic growth and the level of living standards of the
population. By considering the last financial crisis and the era of 4IR, Schwab
expresses that modern countries in order to remain competitive, need to
• be ready to resilient external shocks to avoid internal economic losses,
• be flexible – respond to changes and turn them to a benefit,
• have an ecosystem where all parties encouraged to contribute to the
innovation making process, and
• integrate changes in trends and technological novelties directed to
strengthen the quality of life. (Schwab 2018.)
Because of that, GCI provides with 12 pillars – so-called “productivity drivers” – that
are calculated by collecting the country-level data (see Figure 7). The pillars are of
equal importance, and one cannot replace another. (ibid.) Important to mention that
the pillars represent some aspects that were already identified in this review of the
literature. It allows having a wholistic view on the competitiveness of a specific

23
country (Dusa 2014, 4).
Figure 7. The Global Competitiveness Index 2018 (adapted from Schwab 2018, 39)
Pillar 1: Institutions. It covers rate of security, social capital, checks and balances,
public sector performance, level of transparency, property rights and corporate
governance.
The difference in the pillar reflects the difference among countries’ capital and
income. Economic productivity, well-being, and development of a nation are
considerably contributed from strong institutions (Schwab 2018, 12-13). Institutions
set the context, where actors organize their activities, by establishing both legal and
informal regulations (ibid., 39). Strong institutions may reflect the countries stable
administrative and legal framework that, in turn, become attractive for investors
(Sala-I-Martin et al. 2015, 35).
Pillar 2. Infrastructure. In GCI the infrastructure is represented in the quality of all
the forms of transportation – air, water, rails and road as well as the quality of public
utility. Apart from the reduction of transportation, having a faster information flow,
convenient infrastructural parts enable to access to energy sources that are very
important in the era of 4IR. (Schwab 2018, 39.)

24
Pillar 3. ICT adoption. In the modern world quality of ICT is the essence because it
provides the nation with better communication channels, lower barriers to innovate
and give accesses to different services (ibid., 16). As the primary purpose of ICT to
contribute to technological development, the component addresses the speed of
integration of novelties in the nation’s industries (ibid., 39).
Pillar 4. Macroeconomic stability. The component is based only on two indicators –
Inflation and Debt dynamics. Both indicators determine the competitiveness of the
nation from the investors’ perspective. Competitiveness shall be reinforced by
sustainable public budget and modest inflation that secure investments, ensure the
confidence for businesses, consequently, reducing risks of economic destabilization
that adverse the nation’s productivity. (ibid.)
Pillar 5. Health. It is focused on the life longevity of one person. The health of the
population is valued since from the born children should be physically developed,
have no mental disorders to become healthy adults with cognitive abilities. Workers
that are free from diseases and illnesses can input more in their workplaces.
Obviously, that healthy people only positively impact productivity. (ibid., 41.)
Pillar 6. Skills. Similar to previously reviewed models (Section 2.1, 2.2., 2.3), the pillar
addresses to skilfulness of workers. They shall be sufficiently educated to contribute
to the productivity of the nation. What is important, in 4IR, the education should
develop quick knowledge absorption to allow people having an ability of critical view
on the issues and of using creative methods in coming up with solutions. (ibid.)
Pillar 7. Product Market. It covers the market conditions of the countries where
local, as well as foreign firms, operate. The pillar reveals the degree of the openness
of the market saying that more competition happens in countries encouraging firms
to compete with each other because it drives innovations. Also, it increases the
quality of supply due to more continually growing demand for the best products.
(ibid.)
Pillar 8. Labour Market. The pillar is in the degree of possibility to have people be
reorganized and managed to enhance their capacity and benefit in productivity.
Similar to Talent Attractiveness dimension from the Emerald Model, the pillar

25
examines the way of having the right people on the right place to develop their
talent. What is important is that all workers need to be provided with clear and
sufficient rights that will protect them. These allow to be more secure from external
negative impacts and to have people that can flexibly respond to shocks by changing
the way of doing. (ibid.)
Pillar 9. Financial System. Availability of financial products such as insurance, debt,
credit, and equity together with the riskiness of the financial system are covered by
the pillar. Following the author, the productivity is reached by having a sound
financial system due to its necessity in preventing hard consequences of financial
shocks and ensuring the beneficial investments made by savings and analysing the
possible positive outputs. (ibid., 42.)
Pillar 10. Market Size. This considers both local and foreign markets where domestic
firms operate. The size is determined by the amount of exports, investments and the
value of consumption.
It is more beneficial to have a large market due to the point that it enables to have
the economy of scale, diffusion of innovations that are easier equipped by a bigger
number of firms because their rivalry is minimized due to more of them present.
Also, knowledge and technologies are created and accumulated faster in big markets.
(ibid.)
Pillar 11. Business dynamism. The component reveals the ability of the business
sector to come up with new approaches of organizing, administrating and
implementing their activities by market trends and using new technologies. It also
covers the ease of starting a business and, more importantly, a possibility to sustain
in the market. The pillar matters because it shows how firms can respond to
changing the environment, reconsider themselves, equip needed tools, take risks,
probe new solutions to increase productivity. (ibid.)
Pillar 12. Innovation capability. This pillar is very similar to R&D and Innovation
Attractiveness defined in the Emerald Model.

26
Similarly, it addresses the number of R&D activities and their outputs. Such R&D
activities shall be supported by the state to have the outputs become new and useful
products. Those nations that accumulate generated knowledge and provide with
opportunities to innovate significantly increase their competitiveness. (ibid.)
Reasons for choosing GCI as the framework
The reason why GCI was chosen as the theoretical framework, is in its
comprehensiveness in defining the competitiveness rank among analysed countries
and it also serves as clearly enunciated model for achieving a certain level of
competitiveness, its maintenance and constant enhancement (Dusa 2014). The
framework also allows to have a cross-country comparison and see a clear difference
between both.
DM and DDM are models that can be applied via different indicators (Hanafi et al.
2017, 362). NFM and DDD are very similar to each other and, in fact, represent only
wider variations of DM; the Emerald Model is also very broad and was not originally
designed for comparing countries competitiveness, while GCI is based on the similar
aspects, but it is measured on concrete and wide indicators and provide with recent
and available data. Moreover, GCI 2018 is determined by 98 indicators where 64 of
them are new (Schwab 2018, 38). It means that GCI was renewed as a response to
changes in world trends and shall be perceived as a modern model.
3 Methodology
3.1 Research approach
Before the start of conducting research, usually, the researcher should choose
whether it will be qualitative or quantitative because one research method is the
contrast of another. The difference does not make one approach worse or better,
but it allows researchers to properly and accurately answer the research question
(Silverman 2011).
As noted by Saunders et al. (2009), quantitative research is densely connected with
the provision of mathematically based methods consisting of diverse statistics and/or

27
graphs. Whilst the qualitative method for research deals with data expressed in
words. (151.) Queirós, Faria & Almeida (2017, 370) point out that qualitative
research is concerned with deep insights regarding a problem set by the researcher.
It allows to profoundly analyse the issue from different perspectives and develop
demonstrative information. Consequently, once the qualitative method is
approached, the researcher focuses on understanding, excluding any quantification
of reality aspects. (ibid.) According to Hancock, Ockleford & Windridge (2009, 6), in
qualitative research, it is connected with the impossibility of sufficiently reflect data
using numbers. However, it is not correct to assume that qualitative research always
avoids any sort of numerical information. According to Maxwell (2010), numbers are
accepted to be used, if they supplement the research. This is essential to understand
because the thesis references some databases providing information regarding some
indicators of Russia and Norway. Also, important to mention that insertion of
quantitative data should be carefully done by the researcher in order to not to turn it
into a so-called mixed-method study.
Actually, Maxwell contends that the main difference between quantitative and
qualitative is that the first focuses on correlations and variables, while the second –
on events and processes. (ibid.) Therefore, in order to answer the research question,
the qualitative research was approached to assimilate the determinants of Norway’s
competitiveness over Russia via considering the aspects of Russia that needed to be
improved, whereas in some cases, Norway’s successful doings and policies can even
show a direction for Russia.
Hancock, Ockleford & Windridge (2009) discuss the criticism over the qualitative
approach naming that it cannot be applicable to other similar conditions because it is
too concentrated on a specific group of people, cases and there are selected
interviews participants. Nevertheless, they importantly allege that qualitative
research has a purpose of not to generalise to a larger researching area. (7.) Similarly,
this thesis aimed not to compare many countries, but to focus on certain nations and
more deeply analyse them. In fact, there are other countries that may be similar to
Norway in terms of their economic activities, but from the perspective of
competitiveness, they are lower. However, it does not mean that they need the same
pieces of advice as Russia because they are more likely to be absolutely different.

28
Due to this, in the case of the study, generalisation will not bring in useful
conclusions.
Moreover, this research had the exploratory purpose because it fitted the expression
of Saunders et al. (2009) who claim that exploratory study is the one that
corresponds the researcher’s intention to find out the nature of the problem which
the researcher is not sure about. Exploratory nature is also flexible in the sense that
it allows having the direction changed because of the appearance of data, for
example, from the interviews. (139-140.) This was crucial for this study since it
collected the primary data through the interviews and the possibility of new insights
was expected (more in chapter 3.3).
As for the research strategy for the thesis, the comparative case study was chosen.
According to Hancock & Algozzine (2017), a single case study is a type of qualitative
research which diligently examines a unit limited by place and time. Commonly,
researchers applying case studies direct their work to the perspective of making
recommendations to address the problem of the case. (9-10.) The role of the context
in a case study is utterly important because it allows having a better understanding
of the issue (ibid., 16). The strategy fitted this thesis because of the research aim to
investigate the weaker position of one country in comparison to another where the
context was needed to see the picture of the set problem. Also, the comparison was
limited by the space – the activities only under the sovereignty of the selected
nations. However, the thesis considered two countries in which contexts were
reasonably different. Thus, comparative case study, which may include several cases
was logically applied in this thesis. It had the same features but as Goodrick (2014, 1)
claims it “required more extensive conceptual, analytic and synthesizing work”. It is
clearly related to the obvious hallmark of analysing and synthesising specifics of a
couple or more cases in order to dispose of a way of comparison among cases (ibid.)
Barlett & Varvus (2017, 911) argue that comparative case study does not neglect the
opportunity of analysing the case more deeply through comparison to another case
to have an appropriate output. Having Norway as a successful example for Russia to
understand why the first country is more competitive than the second is
demonstrated in the study through the comparison of these countries’ elements of
competitiveness calculated in the Global Competitiveness Index 2018.

29
3.2 Research context
Basically, the thesis considers two countries to analyse. As it was mentioned in the
previous parts of the study for several times, the competitiveness of Russia may be
increased and Norway, the country with similar fossil fuels resources, can illustrate
its approaches to become more competitive. For this reason, the modern context is
needed to be introduced in order to have an awareness of the countries’ industries,
current positions and some of their indicators reflecting the picture of the present
situation in the country.
Norway
Norway or how it is also known as the Kingdom of Norway is a North-European
country located on the Scandinavian Peninsula. The country’s territory is in total
385.1 thousand square kilometres including the territory of a vast number of small
islands and archipelago Svalbard. (Koubaa 2012, 3.) Norway is surrounded by the
North Sea, the Norwegian Sea and Skagerrak Strait that separates it from Denmark
and by the Barents Sea. Also, the kingdom has land boarders with Russia, Sweden,
and Finland (see Figure 8).
Figure 8. Location of Norway and its neighbours (adapted from Harvard University Center for Geographic Analysis 2019)
Nowadays, the population of Norway is 5.296 million with 1.08% of annual growth. It
has grown by around 38% since the 1950s, significantly because of increased

30
immigration which represents 17% of the whole number of residents. (Modig 2018,
2.)
Table 1 shows that Norway’s GDP has grown by almost 5.2% from 2016 to 2017.
Inward FDI stocks decreased in 2017 by 2.3%, when Outward FDI stocks showed a
growth of 3.8%. The unemployment rate is one of the lowest in the world being
noticeably below the average by 1.6% (OECD Data 2019). In the period, inflation
significantly went down by 1.8%
Table 1. Norway's selected indicators (adapted from OECD Data 2019)
Indicator 2016 2017
GDP (million USD) 308 057 324 938
Inward FDI stocks (million USD) 147 524 144 177
Outward FDI stocks (million USD) 192 013 199 647
Unemployment (%) 4.7 4.2
Inflation (%) 3.6 1.9
GDP of Norway is mainly composed of services of different kinds that contribute
64%. The industry is another sector composing 33.7% to GDP of the country, while
Agriculture is 2.3% (CIA World Factbook 2018). Going further, the main realms of the
residents’ employment is human health and social work activities – 20.8%, wholesale
and retail trade: repair of motor vehicles and motorcycles – 13.3%, and construction
– 8.4% (see Table 2).

31
Table 2. Employment of 15-74 years population in Norway by industries (adapted from Statistics Norway 2019)
Industry Percentage
Human health and social work activities 20.8
Wholesale and retail trade; repair of motor vehicles and motorcycles 13.3
Construction 8.4
Education 8.2
Manufacture 8
Public adm., defence, soc. security 6.4
Real estate, professional, scientific and technical activities 6.3
Transportation and storage 5.2
Administrative and support service activities 5
Other service activities 3.9
Accommodation and food service activities 3.6
Information and communication 3.4
Agriculture, forestry and fishing 2.2
Financial and insurance activities 1.7
Mining and quarrying 2
Electricity, water supply, sewerage, waste management 1.2
Unspecified 0.6
Norway mainly exports goods to a historical partner – UK with 21% of total. Germany
with 16% of Norway’s exports takes second place. Conspicuously that Norway trades
with neighbours – Scandinavian countries; in 2017, both Sweden and Denmark were
exported more than 11%. The Netherlands with 10% should also be mentioned as
another important destination for exports. (Trading Economics 2019.) Exports were
37.4% of total GDP in 2017 mainly consisting of natural resources (Statistics Norway
2019). Norway’s import partners are Sweden – 12%, Germany – 11%, and China –
9.6% (The Observatory of Economic Complexity 2019).
Russia
Russian Federation, as the country officially named, covers 17.098 thousand square
kilometres being the biggest country in the world in terms of the size of territory
(Bradshaw 2008, 193). Due to such a huge territory, the country is present in 11 time
zones (ibid.) and it is surrounded by many seas, oceans and has borders with plenty
of countries: Poland, Finland, Belarus, Lithuania, China, Mongolia, North Korea,
Ukraine, Azerbaijan, Kazakhstan, Latvia, Estonia, Georgia, and Norway (see Figure 9).

32
According to Federalnaya sluzhba gosudarstvennoi statistiki (2018), there are 146.9
million of inhabitants.
Figure 9. Location of Russia and its neighbours (adapted from Harvard University Center for Geographic Analysis 2019)
Table 3 shows that the Russian GDP has significantly increased by 18.5% from 2016
to 2017. Inward and outward FDI has also shown positive changes in growing for
10.7% and 12% respectively. The level of unemployment in Russia is around the
average of OECD countries but considerably higher than, for example, Norway’s.
However, it shows a positive tendency. Inflation rate demonstrated a dramatic
decline: from a high indicator of 7% in 2016 it decreased to 3.7% in 2017.
Table 3. Russia's selected indicators (adapted from World Bank 2019, OECD 2019 and Federalnaya sluzhba gosudarstvennoi statistiki 2019)
Indicator 2016 2017
GDP (million USD) 1 284 728 1 577 524
Inward FDI stocks (million USD) 393 910 441 123
Outward FDI stocks (million USD) 334 275 380 047
Unemployment (%) 5.4 5.2
Inflation (%) 7.0 3.7
The top three economic activities contributing to GDP of Russia comes from
Wholesale and retail trade; repair of vehicles – 14.3%, manufacturing – 13.6%, and
mining – 12.8% (see Table 4). Real estate transactions and services also are high
taking almost one-tenth – 9.2%.

33
Table 4. GDP composition of Russia by economic activities in 2018 (Federalnaya Sluzhba Gosudarstvennoi Statistiki 2018)
Economic activity Percentage
Wholesale and retail trade; repair of vehicles 14.3
Manufacturing 13.6
Mining 12.8
Real estate transactions and services 9.2
Public administration and security, military security; social security 7.6
Transportation and storage 7.0
Construction 6.0
Finacial and insurance 4.3
Professional, scientific and technical activities 4.2
Agriculture 3.5
Health care 3.4
Education 3.2
Communication 2.4
Administrative and related additional services 2.3
Electric, gas and smoke energy provision 2.7
Others 3.5
According to Workman (2019), Russia mainly trades with its neighbouring country
China but also with Germany and the Netherlands. Particularly, in 2018, major export
destinations were China – 11%, the Netherlands – 8.1%, and Germany – 5.8%. The
vast majority of imports were from China – 20%, again Germany – 12%, and another
neighbour and historically close country – Belarus – 5.7%. (The Observatory of
Economic Complexity 2019.)
3.3 Data collection
In order to answer the research question and address the problem, the needed data
was partly collected by using secondary data – the dataset which was not primarily
gathered by author and taken from somewhere else (Martins, de Cunha & Serra
2018, 2). This type of data may be usually found in textbooks, academic articles,
scientific reviews and journals, news and different online sources (Saunders et al.
2009, 263-265). According to Doolan, Winters & Nouredini (2017), because of the
technological era, modern researchers have open access to a variety of data on the

34
web to develop and interpret it. The researcher obviously needs to understand the
concepts and the theory of the data to conduct her/his research sufficiently. (2.)
Actually, there were many benefits for the study using the existed data. It allowed
collecting the data more quickly as well as not having an additional risk for the
examined subjects as they have been already researched (4). Indeed, for this thesis,
some databases provided with information to consider exempting the author from
applying extra techniques and resources to collect the data. The author could
concentrate more on analyzing the existing facts and broad data instead of gathering
it. Martins et al. (2018) profess the view that very often some secondary data is
beneficial for other purposes that the data was collected for. Thus, based on their
knowledge researchers may manipulate the secondary data to develop new
conclusions. (3.) Irwin (2013, 303) very aptly affirms that getting the most out of the
secondary data requires from researchers to creatively and critically construe the
data.
The secondary data that is necessary for the research was collected on the Internet.
The author used sources which are available for everyone and involves different
databases providing with various figures and information of the selected countries.
Official websites of big global organizations such as the World Bank, the World
Economic Forum and OECD were used for the study. Also, available databases and
online libraries were actively used, namely: Google Scholar, Research Gate,
Cyberleninka, SSRN, Elibrary, MolUch.
Goodrick (2014, 8) notes that it is possible for comparative case studies to use only
secondary data as a source to be analysed in researches. However, secondary data
may not exist in the needed form, might address absolutely different purposes and
even require financial investments to be accessed. Additionally, there is a possible
difficulty in evaluating source reliability, validity, and relevancy. (Saunders et al.
2009, 270-272.) This thesis was not an exception for these issues, and it also
encountered the lack of studies of the topic, especially the subject of the
competitiveness of Russia and/or Norway. Irwin (2013, 298) complements saying
that there is a challenge for researchers to interpret the secondary data that does
not seem as grabbed from the context.

35
Therefore, there was a need for the thesis to have primary data. It is defined as the
data that is collected concretely for the purpose of contributing to answering the
research question (Saunders et al. 2009, 598). Erikkson & Kouvalainen (2016, 91)
distinguish interviews as one of the adequate ways of producing data for a
qualitative study. Interviews provide researchers with information that does not exist
in published forms, and as a big benefit, it may provide with insights from people
who have knowledge and experience that are related to the study. Actually, there
are different kinds of interviews (see Table 5) and researchers should choose one to
sufficiently address research aims. (ibid., 94.)
Table 5. Types of qualitative interview (Erikkson & Kovalainen 2016)
Structured
(standardized)
interviews
Semi-structured
(guided) interviews
Unstructured
(narrative/open)
interviews
• Conducted with a script and pre-designed questions almost excluding any flexibility,
• Usually used to get information about what happened de facto,
• Often used when the interviewer has poor knowledge of what is asked, when it is needed to orderly compare the interview results or when the interviewer needs to avoid having too much different responses from different perspectives.
• Have an outline designed beforehand,
• The interviewer may change the order of questions for different interviewees,
• Have features of informality and may have a nature of the conversation, though comprehensiveness and systematic basis prevail,
• Requires from the interviewers to be carefully prepared and understand the context of the questions.
• Used to deeply discover an interviewee’s perspective regarding the subject,
• No scripts but some directing questions,
• The interview may be turned to an appeared issue during the interview,
• Predominately depends on an interviewed person’s experience, thoughts, and insights.

36
As for this thesis, semi-structured interviews were undertaken because it was
supposed to give some freedom in answers for the interviewees, though the
questions are designed in advance and are following the theoretical framework. As
experts in their fields and, moreover, as representatives of the countries they have
the knowledge to respond to the raised issues and provide the research with a
deeper understanding of the problem. Also, semi-structured type of interview was
chosen because the possibility of an appearance of new questions is assumed during
the interview (Saunders et al. 2009, 320). Therefore, the author did not seek to have
a very strict interview which leads to limitations of the information obtained.
Besides, there was no need for a subjective and long interview, where the
interviewer cannot guide the interview concretely to the direction addressing
research problem to have more relevant information (Brinkmann 2013, 21).
Interviews were conducted as a one-to-one to have them focused on the questions
asked to convey their ideas with no interruptions (ibid., 28). The lists of prepared
questions may be found in appendices (see Appendix 1 and Appendix 2).
Participants for the interviews were not haphazardly chosen. The idea was to take
the ones who have experience and can sufficiently contribute to the field of
exploration. Participants represented two countries at the same time – Russia and
Norway – meaning that they have the perspective of local people experienced the
environment themselves. When it is said that they are professionals, it reveals that
they have positions in Norwegian university. First was Andrey Mineev (AM
hereafter), who is a Russian researcher working at Nord University. The second was
Andrey Kazakov (AK hereafter) whose nationality is also Russian and who is working
as an adviser at the High North Center for Business and Governance at Nord
University Business School. Both of interviewees have been working in Norway for
more than ten years which allows them to have an understanding of different realms
in Norway as well as in Russia – their country of origin where they spent most of their
life. Thus, the interviews were in the mother tongue of the participants – Russian.
The first was with AM and was 36 minutes long. The second was with AK and was 67
minutes long.

37
Important to mention that due to the impossibility of having a personal meeting with
interviewees (they are not in Finland where the research study is undertaken), it was
decided to have an online video-call meeting which allows conducting an interview in
the case of geographical remoteness (Saunders et al. 2009, 350). Since participants
were not physically at the one place, there was a threat of having experience human
interactions differently than it could be in a face-to-face meeting. However, if a
videoconference interview is agreed beforehand, it provides a sufficient possibility to
have an appropriate rapport between participants. (ibid.) The interviews were
conducted via Skype video-calls which were also recorded via the application
function. O’Gorman & MacIntosh (2015, 121) emphasise that recording interviews
makes the transcription more accurate and allowing researchers to come back to the
interviews as many times as needed later. For this thesis, it is an advantage because
the interviews were not short, required attention and contained a considerable
amount of gathered information making the recording reasonable.
3.4 Data analysis
Qualitative content analysis technique was applied for this study because it
corresponded to the problem, the aims and the question of the thesis. The
technique, for Erikkson & Kovalainen (2016), has two major purposes. First is to
provide with a wholistic and informative ‘picture’ of the examined aspect. Second is
to contextually interpret collected data in a thorough and deep way. (120.)
Therefore, the analysis starts from the preliminary data analysis where the pillars
determined in the Global Competitiveness Index 2018 were analysed for the next
stage – in-depth analysis aimed to follow the question of the difference in the
competitiveness between Norway and Russia. Once the pillars were chosen to be
analysed in-depth, the author went through the subpillars to identify the elements of
the difference between the countries’ competitiveness.
The variables for the preliminary analysis came from the theoretical framework and
included 12 pillars from the Global Competitiveness Index 2018 (see Figure 7 in
chapter 2.5). The in-depth analysis focused on variables that are subpillars that
represent the main difference in the countries’ competitiveness.

38
For preliminary analysis, it is clear: the author needed only to select the pillars that
are noticeably different and then to choose which subpillars made the most
difference between the nations. Next paragraphs are dedicated to the description of
the in-depth data analysis step-by-step (see Figure 10).
Figure 10. Process of in-depth data analysis (Creswell 2014)
The first step was to prepare and organize the data. It began with the collected
secondary data that were downloaded and saved on the computer, whereas some of
it was “bookmarked” on the web-browser due to the impossibility to download. The
author put the files to folders where all of them were allocated to a variable. The
files were examined: needed fragments were highlighted in the computer application
named Preview as well as some information was transferred to a separate MS Word
file to be examined before being subsumed in the final paper. Also, there were
interviews that the author decided to transcribe from the recorded video-call to
another MS Word file in order to make the subsequent analysis of the data less time-
consuming (instead of listening again and again, the author had the text in front of
him). By the names of participants, the author categorised the files with transcribed
interviews to not have them mixed.
Once the data was organized, the author went through it several times in his own
pace to have a picture of what he had and, as Creswell (2014, 198) says, to
understand the credibility and depth of the data. The next step was to code the data
which is utile in terms of categorization because it helps to sort, label the data in
some categories that make the whole process of a qualitative analysis easier (ibid.).
Creswell declares that very often codes appear during the actual analysis of the data
(ibid., 199). This dissertation was not an exception for it: the codes emerged when
the author was analysing the data collected for the study. Practically, if a piece of the
Data preparation and
organization
Critical read and look at the data
Coding the dataIdentifying the
themes Interpretation of
findigs
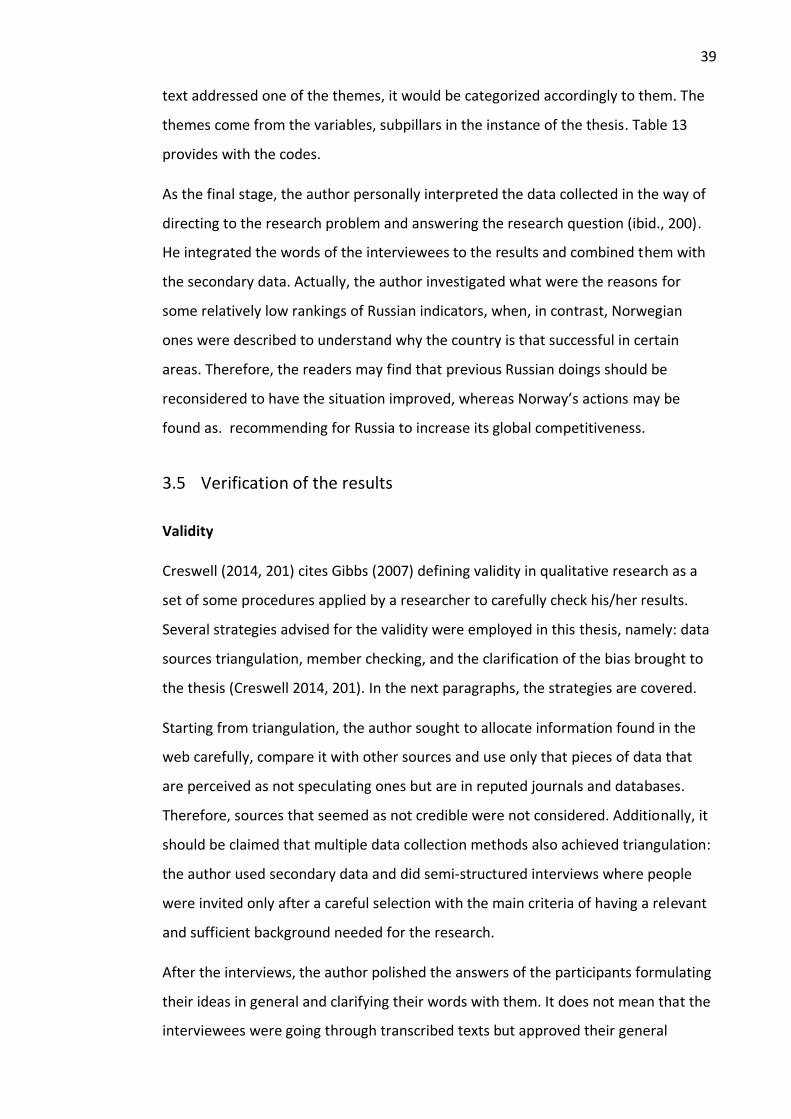
39
text addressed one of the themes, it would be categorized accordingly to them. The
themes come from the variables, subpillars in the instance of the thesis. Table 13
provides with the codes.
As the final stage, the author personally interpreted the data collected in the way of
directing to the research problem and answering the research question (ibid., 200).
He integrated the words of the interviewees to the results and combined them with
the secondary data. Actually, the author investigated what were the reasons for
some relatively low rankings of Russian indicators, when, in contrast, Norwegian
ones were described to understand why the country is that successful in certain
areas. Therefore, the readers may find that previous Russian doings should be
reconsidered to have the situation improved, whereas Norway’s actions may be
found as. recommending for Russia to increase its global competitiveness.
3.5 Verification of the results
Validity
Creswell (2014, 201) cites Gibbs (2007) defining validity in qualitative research as a
set of some procedures applied by a researcher to carefully check his/her results.
Several strategies advised for the validity were employed in this thesis, namely: data
sources triangulation, member checking, and the clarification of the bias brought to
the thesis (Creswell 2014, 201). In the next paragraphs, the strategies are covered.
Starting from triangulation, the author sought to allocate information found in the
web carefully, compare it with other sources and use only that pieces of data that
are perceived as not speculating ones but are in reputed journals and databases.
Therefore, sources that seemed as not credible were not considered. Additionally, it
should be claimed that multiple data collection methods also achieved triangulation:
the author used secondary data and did semi-structured interviews where people
were invited only after a careful selection with the main criteria of having a relevant
and sufficient background needed for the research.
After the interviews, the author polished the answers of the participants formulating
their ideas in general and clarifying their words with them. It does not mean that the
interviewees were going through transcribed texts but approved their general

40
thoughts. According to Creswell, it makes any research more valid, since it is
supposed to check the accuracy of the findings (ibid.).
Finally, to clarify the bias in this study, it is needed to be noted that at the moment of
the research, the author was only a second-year bachelor’s level student meaning
that the lack of experience in the field was definitely met by him. The completed
course related to the field of the thesis is the one and only piece of academic
background that is directly connected with the field of competitiveness. Thus, the
thesis is limited by the relatively short time spent in the studying realm. However,
studied cases related to the competitiveness of nations, cities, and firms as well as
some additional articles that the author had got familiar with before the actual
research influenced his interpretations and perception of some issues that are
present in this thesis. Besides, subjectivity is the matter that may be faced by every
human being. It means that some conclusions, analysis were still made from the
personal perspective, though the author endeavoured to reflect most neutrally and
objectively. Last but not least, the study aims to provide with recommendations for
Russia that, it should be admitted, may be seen as utopian and difficult to implement
due to a complicated situation requiring a careful step-by-step analysis requiring the
involvement of a great number of experts, investments and adjustments. Norway in
the research also should not be distinguished as an idealistic example where every
element is perfect: crucial to understand, Norway’s pillars that are considerably
better than Russia’s were taken for the analysis, meaning that in some areas Russia is
either not really lower than Norway or even higher (more in chapter 4.1).
Reliability
By definition, reliability is consecutive results that are achieved by the research
approach used for a study (Saunders et al. 2019, 156). Hesse-Biber (2016) advises to
ensure reliability in qualitative studies, and researchers should have the collected
data that “make sense”. Actually, all the effort in the thesis was put to address the
research question and the research approach directed to collect the information that
may be only sufficient to contribute to the research question answering.
Consequently, all the found data was carefully and constantly being checked for
several times in order to eliminate the possible mistakes. Especially, in the phase of
coding because, according to Creswell (2014, 202), Gibbs (2007) determine it as the

41
stage where shifts in the codes’ senses may occur. To prevent possible changes, the
author incessantly compared the codes and the data. Also, Erikkson & Kovalainen
(2016, 120) asserts that coding allows authors to be objective in their conclusions.
This an essential point, since the author of this thesis strived to impartially answer
the research question where other researchers can come up with the same thoughts
of having the same data. Apart from coding, transcription also was worth special
attention and dedicated diligence to avoid having errors that may lead to unreliable
results and create obstacles in the successful analysis.
Interviews were conducted in the manner proposed by Saunders et al. (2009). They
accentuate that the interviewer needs to have enough knowledge (the author
designed questions after long preparation and studying the theoretical framework,
got familiar with the context of researched countries and made a preliminary
analysis). The questions ought to be asked clearly, and with no specific intonations
and behaviour that may influence the answers and the findings; attentively listen to
interviewees and not turn the interview to a debate or a talk. (328-334.)
4 Results
4.1 Preliminary analysis
The chapter presents the thesis findings that are divided into two parts: preliminary
and in-depth analysis. This separation was done to allocate the needed areas in order
to analyse them in-depth and provide with insights regarding the issues that are
feasible to be influenced and changed by possible guidelines. The whole analysis is
derived from the theoretical framework based on the Global Competitiveness Index
2018 where at first pillars and subpillars (variables) are chosen to be analysed, and
then the variables are investigated deeply.
Before going into details, the overall performances of the countries are needed to be
introduced to have an understanding of their progress in certain areas as well as in
total.

42
Figure 11. Norway performance overview (adapted from Schwab 2018, 439)
Starting from Norway, it is seen that the country is in 11% of the most competitive
countries in the world being in almost every pillar above the European and North
American average (see Figure 11). It markedly takes the highest rank in the pillar of
Macroeconomic stability, it also succeeds (in top ten countries in the index) in pillars
of Health, Skills and Business dynamism as well as has a strong rank in Institutions
and ICT adoption. Even though the scores in Innovation capability and Labour
markets are not the highest, it is still far above from the average in Europe and North
America positively pulling weight in the competitiveness of the country. Market size
of Norway is quite small and represents the worst element of the country in the
index. Infrastructure that may be perceived as a strong Norway’s pillar due to the
score of 75 is the only one which is below the average and takes the second lowest
position in the ranking.
In the Global Competitiveness Index 2018, Russia is 43rd out of 140 countries present
in the ranking, though it is higher than the Eurasian countries average (see Figure
12). What is noticeable, the Russian Federation has big Market size that is 6th in the
whole index. However, Russia is not everywhere higher an average Eurasian nation: it
is seen that Russia is below in some pillars like Health and Product market.

43
Figure 12. Russia performance overview (adapted from Schwab 2018, 483)
Additionally, it shows middling places in the others, for example, in Financial system,
Institutions, and Labour market. There is a score of Macroeconomic stability that is
high – 88 out of 100 and higher the average in Eurasia but it is also observable that it
takes only 55th place in the whole rating. The lowest Russian score is in Innovation
capability – 51, though it is bigger than the average and shows not the worst position
in the whole ranking.
Pillars
There is a need to compare the countries pillars and then to choose the ones that
make that noticeable difference and are needed to be introspected more. The two
previous figures show not only the rankings but provide with the scores that
allowsthe author to see the real picture of the discrepancy between the selected
nations.
Concretely, Table 6 provides with the comparison of total pillars’ score of Russia and
Norway from the perspective of Norway due to its higher position in the ranking. We
see that aggregate difference in the score is 12 whereas Institutions, Macroeconomic
stability, Health, Skills, Product market, Labour market, Financial system, Business
dynamism, and Innovation capability have the main dissimilarities in the scores.
Infrastructure has just a difference of 3 and is supposed to be excluded from the

44
analysis since there is not a huge need for Russia to improve it by following Norway
as a role model. Market size is that pillar which is worse in Norway’s score when
Russian Market size has definitely a significant score.
Table 6. Comparison of Russia's and Norway's pillars scores (adapted from Schwab 2018)
Pillar Russia Norway Difference
Overall 66 78 12
Institutions 53 77 24
Infrastructure 72 75 3
ICT adoption 72 82 10
Macroeconomic stability 88 100 12
Health 68 98 30
Skills 68 84 16
Product market 54 63 9
Labour market 59 73 14
Financial system 55 80 25
Market size 84 61 (23)
Business dynamism 63 77 14
Innovation capability 51 68 17
It is reasonable to carry the research with the pillars that make the difference.
However, not all of them should be analysed deeper. Important to remember that
the idea is to investigate the reasons behind Norway’s competitiveness over Russia,
but some pillars are not very low in Russia’s indicators and about the same in
Norway. Thus, there is no reason to carry the study with the pillar of ICT adoption
and Macroeconomic stability that should be considered as satisfactory for Russia.
Also, Norway’s pillars need to be decent as well to allow the continuation of the
study. For instance, Product market of Norway is one of the worst pillars of the
country and cannot be a demonstrative one for Russia. Consequently, it is excluded
from the in-depth analysis.
Noticeably, Health has the most significant distinction in the figures: 30. However, if
it is to be gone more concretely, it is seen that the pillar is determined by only Health
life expectancy (Schwab 2018, 637). There is a difficulty to influence on the life
expectancy of one country because there may be a colossal number of corresponding
factors affecting the rate (e.g., traffic accidences, nutrition) that not all may be

45
prevented by something particular. For example, the promotion of a healthy lifestyle
does not go well with the thesis purpose.
Another pillar is Business dynamism which has the difference of 14 that is
considerable. Russia also has a quite low score when Norway’s – high.
Notwithstanding these points, the thesis will not focus on the pillar because almost
every subpillar is the same in Russia and Norway. Table 7 shows that only two
subpillars notably differ from each other whereas some are almost the same and the
rest are too low in Norway’s. For this reason, the author decided to not to include
the pillar in the in-depth analysis.
Table 7. Scores in Business dynamism (adapted from Schwab 2018)
Subpillar Russia Norway Difference
Cost of starting a business 99.5 99.6 0.1
Time to start a business 90.4 96.5 6.1
Insolvency recovery rate 43.8 100.0 56.2
Insolvency regulatory framework 71.9 71.9 0.0
Attitudes towards entrepreneurial risk 54.8 53.4 (1.4)
Willingness to delegate authority 53.9 79.9 26.0
Growth of innovative companies 45.8 57.2 11.4
Companies embracing disruptive ideas 43.6 57.7 14.1
The remaining pillars are the following: Institutions, Skills, Labour market, Financial
system, and Innovation capability. All of them correspond to the earlier mentioned
criteria in the selection. Next, the analysis provides with the subpillars picking for the
research. Logic is similar to the pillars choosing.
Subpillars
Starting from Institutions (see Table 8), it is seen that the biggest difference is in
Incidence of corruption, Judicial Independence and Freedom of the press. Also,
Property rights, Intellectual property protection and Strength of auditing and
reporting standards have to be analysed because of the difference and low Russian
figures. Organized crime, Homicide rate and Reliability of police services are worth to
be noticed, however, will not be examined because of their difficulty in changing
implementations.

46
Table 8. Scores in Institutions (adapted from Schwab 2018)
Subpillar Russia Norway Difference
Organized crime 61.6 83.4 21.8
Homicide rate 65.0 100.0 35.0
Terrorism incidence 93.1 100.0 6.9
Reliability of police services 51.8 79.8 28.0
Social capital 43.9 64.0 20.1
Budget Transparency 88.5 76.9 (11.6)
Judicial Independence 38.4 83.5 45.1
Efficiency of legal framework in challenging regulations 36.1 56.9 20.8
Freedom of the press 50.0 92.4 42.4
Burden of government regulations 39.1 47.5 8.4
Efficiency of legal framework in settling disputes 42.1 66.1 24.0
E-Participation Index 92.1 97.8 5.7
Future orientation of government 47.9 63.0 15.1
Incidence of corruption 29.0 85.0 56.0
Property rights 45.5 79.3 33.8
Intellectual property protection 47.7 74.6 26.9
Quality of land administration 86.7 66.7 (20.0)
Strength of auditing and reporting standards 55.0 83.0 28.0
Conflict of interest regulation 50.0 67.0 17.0
Shareholder governance 73.0 83.0 10.0
Going further, Skills is another pillar that was decided to be examined deeply (see
Table 9). From here the subpillars of Extent of staff training, Quality of vocational
training, Skillset of graduates and Ease of finding skilled employees were taken.
Pupil-to-teacher ratio in primary education is higher in Norway, but in Russia the
figure is adequate.

47
Table 9. Scores in Skills (adapted from Schwab 2018)
Subpillar Russia Norway Difference
Mean years of schooling 71.3 85.2 13.9
Extent of staff training 48.7 68.2 19.5
Quality of vocational training 51.2 69.8 18.6
Skillset of graduates 49.8 66.1 16.3
Digital skills among population 63.7 71.6 7.9
Ease of finding skilled employees 56.4 70.6 14.2
School life expectancy 86.3 99.2 12.9
Critical thinking in teaching 49.8 64.0 14.2
Pupil-to-teacher ratio in primary education 74.6 100.0 25.4
Next is Labour market (see Table 10). According to the pillar, Russia may increase its
scores by having Norway as an example in Active Labour policies, Reliance on
professional management and Labour tax rate. Therefore, Workers’ rights will not be
considered because of the satisfactory result of Russia. In the table, it is observable
that Russia outperforms the vis-à-vis country in some subpillars like Flexibility in
wage determination. It makes the pillar with no dramatic difference in overall pillar
score (e.g., comparing to Financial system), though it is still conspicuous.
Table 10. Scores in Labour market (adapted from Schwab 2018)
Subpillar Russia Norway Difference
Redundancy costs 72.2 90.3 18.1
Hiring and Firing practices 52.0 45.4 (6.6)
Cooperation in Labour-employer relations 54.2 77.5 23.3
Flexibility of wage determination 60.6 47.3 (13.3)
Active Labour policies 45.0 69.5 24.5
Workers' rights 73.2 97.9 24.7
Ease of hiring foreign labour 47.4 53.7 6.3
Internal Labour mobility 52.6 52.5 (0.1)
Reliance on professional management 48.1 77.2 29.1
Pay and productivity 57.7 58.8 1.1
Female participation in Labour force 80.9 95.6 14.7
Labour tax rate 60.7 89.0 28.3
In terms of the most distinctive pillar of the selected nations – Financial system (see
Table 11), the most visible dissimilarities are in Insurance premium, Domestic credit
to private sector and Soundness of banks. Financing of SMEs is also taken for the

48
deeper analysis, since the difference is high, and Norway’s indicator is close to 70.0
(which is considered as high due to the first score in the ranking of 79.9 by the USA).
The area of subpillar is also needed to be improved, as Titov said it in the World
Economic Forum 2019 (World Economic Forum Annual Meeting 2019).
Table 11. Scores in Financial system (adapted from Schwab 2018)
Subpillar Russia Norway Difference
Domestic credit to private sector 57.3 100 42.7
Financing of SMEs 39.0 65.0 26.0
Venture capital availability 27.9 48.4 20.5
Market capitalization 32.0 52.1 20.1
Insurance premium 18.7 76.3 57.6
Soundness of banks 45.1 84.5 39.4
Non-performing loans 81.9 98.6 16.7
Credit gap 100.0 95.9 (4.1)
Banks' regulatory capital ratio 91.0 100.0 9.0
Finally, Innovation capability in countries differ enormously in the score of
International co-inventions by 66.4 and Patent applications by 58.6 (see Table 12). It
is easily observable that Russian research institutions have better quality by 52.3;
however, it is a good figure for Russia meaning that it will not be included in further
research. Instead, the focus will be directed at investigation of the difference in R&D
expenditures, Trademark applications and State of cluster development.
Table 12. Scores in Innovation capability (adapted from Schwab 2018)
Subpillar Russia Norway Difference
Diversity of workforce 63.7 63.1 (0.6)
State of cluster development 41.4 64.6 23.2
International co-inventions 17.2 83.6 66.4
Multi-stakeholder collaboration 50.6 62.4 11.8
Scientific publications 91.4 92.1 0.7
Patent applications 28.8 87.4 58.6
R&D expenditures 37.7 64.4 26.7
Quality of research insitutions 70.4 18.1 (52.3)
Buyer sophistication 40.9 54.3 13.4
Trademark applications 64.4 87.7 23.3

49
All in all, the in-depth analysis will involve the chosen subpillars that may be found as
variables and provided by Table 13.
Table 13. Variables for in-depth analysis
Pillar Subpillar/variable Code
Institutions Judicial Independence I1
Institutions Freedom of the press I2
Institutions Incidence of corruption I3
Institutions Property rights I4
Institutions Intellectual property protection I5
Institutions Strength of auditing and reporting standards I6
Skills Extent of staff training S1
Skills Quality of vocational training S2
Skills Skillset of graduates S3
Skills Ease of finding skilled employees S4
Labour market Cooperation in Labour-employer relations L1
Labour market Active Labour policies L2
Labour market Reliance on professional management L3
Labour market Labour tax rate L4
Financial system Domestic private sector F1
Financial system Financing of SMEs F2
Financial system Insurance premium F3
Financial system Soundness of banks F4
Innovation capability State of cluster development Ic1
Innovation capability International co-inventions Ic2
Innovation capability Patent applications Ic3
Innovation capability R&D expenditures Ic4
Innovation capability Trademark applications Ic5
4.2 In-depth analysis
As mentioned in the chapter of methodology, the analysis of some subpillars consists
of secondary data and includes primary (semi-structured interviews) data. It is
organized in the way of going through each variable and providing with insights
regarding all of them. It is assumed that the distinctions in the figures between the
nations are observable in the tables in chapter 4.1 meaning that there is no need to
highlight them again.

50
4.2.1 Institutions
Judicial independence
The subpillar is the result of the survey question about the dependency of the
judiciary on some parties in the country, where the indication of the lower figure
means the worse (Schwab 2018, 634).
The words of Council of Europe representatives define the situation in Judicial
independence in Russia by saying that the country ought to raise the question of the
judiciary on a daily basis (Muižnieks, Hammarberg & Gil-Robles 2016). As a big issue,
they name that the decisions made by international authorities such as the European
Court of Human Rights recorded more than 70 incompliances of the judgements
from the period of 2010 to 2015. They also express that problems in the Russian
judicial system are related to “insufficient judicial independence and excessive
prosecutorial powers”. However, all the issues are possible to overcome by new
regulations directed mainly at consolidation of impartiality, effectiveness, and
independence of judges. (ibid.) According to Chief Justice of Canada (2017), Russian
laws cannot protect judges from the external influence of some state or private
interests; therefore, cases may be reassigned to a new date. The presidents of
Russian courts are too powerful in the career of the judges who, in turn, have their
interest in achieving a certain result in a case (ibid.) Therefore, the International
Commission of Jurists (2014) have claimed that such pressure in making decisions
lead to briberies.
Kondrashov (2015) believes that the current system in Russia increases the
dependence of the judicial branch on the executive authority because, in fact, judges
are assigned by the presidents of courts and members of the Presidential
Commission on preliminary consideration of candidates. It should be changed in the
way of creating a special judiciary committee assigning judges. (183.) For example, in
Norway, judges are assigned by the government on the recommendation of the
Committee on the appointment of judges (Chibisova 2014).
In Russia, possible judge’s offenses are initiated to be considered, again, by the court
president when the qualifying collegium is only a part of the process which,
moreover, consists of the judges by a two-third meaning that it may lead to some

51
“agreement” beneficial for the parties. Residents also have a chance to report about
the action of a judge but, in practice, they are not considered as the ones organized
by the court president. (Kondrashov 2015, 183). Norway’s actions in this issue are
demonstrative because the chairman of Norwegian courts has no power and
influence in the process. All the complaints that are mainly initiated by different
individuals are considered by the steering committee that consists of two judges, one
lawyer and two public members appointed by the government for four years.
(Chibisova 2014).
Kornus and Deryuga (2018, 112) also distinguish the problem that some Russian
judges have little experience making them consult with more experienced
colleagues, therefore, decreasing the level of independence. Thus, Kondrashov
(2015, 183) proposes that the post of a judge need to be restricted to the ones who
obtain a degree by studying part-time or in the evening studying form. According to
Federalnye Arbitrazhnye Sudy Rossiiskoi Federatsii (2019), it is obligatory for a
Russian judge to have a qualification in law. In contrast, Norway employs people who
have a different background that allows having “a broad and varied background of
experience” and law graduates are not immediately hired for a court position (The
Courts of Norway 2019).
Freedom of the press
This subpillar is based on the level of media development in the country, non-
dependence of media and free will of local journalists, where the indication of the
higher figure the worse (Schwab 2018, 634).
Zakem, Saunders, Hashimova & Hammerberg (2018) stated that the issue in Russia is
caused by the ownership of the media channels divided by two sectors: the state and
private that are mainly presented as the same business units. The state’s ownership
is dominated in the TV and radio media, while the private sector controls major
online media and printed media. (10-13.) Zakem et al. (ibid., 14-15) continue by
saying that some private companies are very powerful and influential owning more
than 200 media companies of different scales, some – the most popular Russian
social media, when both may have 25% of shares of famous Russian TV channels
owned by the state, and they also are full owners of other central TV channels,

52
newspapers and control the leading radio stations. Zakem et al. further express that
The Presidential Administration of Russia plays a vital role in the mass media to
promote the national interests by allocating the budget for federal channels (23).
On the contrary, Norway actively encourages pluralism and freedom of the speech by
promoting competition among companies. For example, not a single company may
have more than one-third share in any media type, whether TV, radio or printed. The
country also has the dominant national broadcaster (which requires a fee from
subscribes) that aims to diversify the sphere, and it faces a furious competition by
private media organizations, though the broadcaster dominates in TV and radio.
(Arkin 2018.)
Apart from that, Arkin distinguishes Norwegian authority that contributes to
providing the sphere of media with conditions where openness and transparency
prevail as well as monitors the ownership matters and balance. The commission
created for the incentive of pluralism constantly puts the effort in journalism
development by supporting and assisting different projects aiming to media
innovations. (ibid.)
Incidence of corruption
The subpillar reflects the perception of involved parties in business about the level of
corruption in the government sector, where the indication of the lower figures
means more corruption happened (Schwab 2018, 634).
Kritskaya, Kanskaya & Yanchenkova (2018, 47) claim that corruption may accompany
a Russian citizen from his/her birth being in the majority of realms of social life,
therefore, requires special attention to be paid. Naumenko (2018, 65) states that
even though that there are some cases of arrested public officers accused in
corruption on a large scale, it is just a “peak of an iceberg”, whereas not that big
occasions are not revealed. Therefore, Naumenko points to the need for setting
anticorruption development as the priority for Russian involved parties. He suggests
that the Prosecutor's office should be the principal law enforcement body, which
itself is fighting corruption, and supervises the activities of other bodies in this area
instead of just being a part of the process that coordinates powers. As an important
element, Naumenko distinguishes the importance of the involvement of some
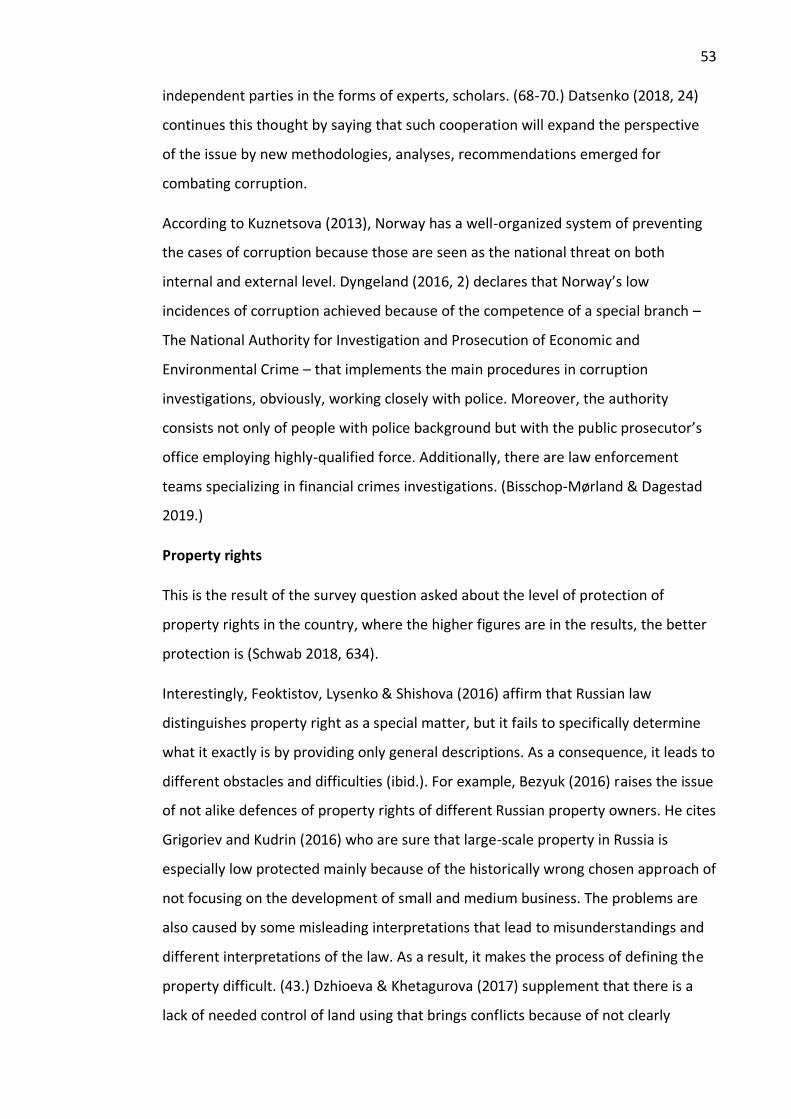
53
independent parties in the forms of experts, scholars. (68-70.) Datsenko (2018, 24)
continues this thought by saying that such cooperation will expand the perspective
of the issue by new methodologies, analyses, recommendations emerged for
combating corruption.
According to Kuznetsova (2013), Norway has a well-organized system of preventing
the cases of corruption because those are seen as the national threat on both
internal and external level. Dyngeland (2016, 2) declares that Norway’s low
incidences of corruption achieved because of the competence of a special branch –
The National Authority for Investigation and Prosecution of Economic and
Environmental Crime – that implements the main procedures in corruption
investigations, obviously, working closely with police. Moreover, the authority
consists not only of people with police background but with the public prosecutor’s
office employing highly-qualified force. Additionally, there are law enforcement
teams specializing in financial crimes investigations. (Bisschop-Mørland & Dagestad
2019.)
Property rights
This is the result of the survey question asked about the level of protection of
property rights in the country, where the higher figures are in the results, the better
protection is (Schwab 2018, 634).
Interestingly, Feoktistov, Lysenko & Shishova (2016) affirm that Russian law
distinguishes property right as a special matter, but it fails to specifically determine
what it exactly is by providing only general descriptions. As a consequence, it leads to
different obstacles and difficulties (ibid.). For example, Bezyuk (2016) raises the issue
of not alike defences of property rights of different Russian property owners. He cites
Grigoriev and Kudrin (2016) who are sure that large-scale property in Russia is
especially low protected mainly because of the historically wrong chosen approach of
not focusing on the development of small and medium business. The problems are
also caused by some misleading interpretations that lead to misunderstandings and
different interpretations of the law. As a result, it makes the process of defining the
property difficult. (43.) Dzhioeva & Khetagurova (2017) supplement that there is a
lack of needed control of land using that brings conflicts because of not clearly

54
defined territories. Therefore, they believe that it is of vital importance for Russia to
conduct the adjustments with a concentration to more wholistic protection of the
property rights because a resident due to fear and uncertainty may reinvest his/her
property to foreign assets bereaving investments to the local economy. Bureaucracy
making the process be time- and finance-consuming ought to be reconsidered
because of the corruption occurred that slows the development of the property
rights in Russia. (ibid.)
Norway, in turn, promotes transparency in the interest in movable as well as real
property. The whole system (started from the law determination of property to the
judicial system that clearly and openly defines the possible issues) is effective
because it aims to protect the rights. (Norway Business Law Handbook 2013, 117.)
The system is very proper in terms of registration the ownership and has it defined in
the rule of law. There is the authority that contributes to careful registration of
property. The government set the protection of the rights to property as the area for
the constant endeavour. (Norwegian Ministry of Foreign Affairs 2014.)
Intellectual property protection
Schwab (2018, 635) determines it as the results of the survey question about the
perception of security regarding intellectual property, where stronger protection is
reflected by higher figures.
Kitayov & Pak (2015) emphasise the role of intellectual property protection as
strategically crucial in the overall economic and political development of Russia.
Currently, there are frail indicators which are caused by the poor awareness of the
need in protecting the intellectual property. Kitayov and Pak carried a survey asking
127 of respondents (17-41 age group) about their familiarity with just the term, and
it showed that Russian society does not know precisely what the intellectual property
is; probably because of their Soviet mentality which assumes that everything can be
publicly used (205.) The respondents find nothing against the law in copying and
distributing music, films, and documents of different kinds among their friends,
relatives. Kitayov and Pak concluded their investigation by saying that Russian
residents do not understand and undervalue the protection of intellectual property

55
and, as a consequence, do not respect it in the way they respect tangible properties.
(ibid., 206-208).
Chernysheva & Novikova (2018, 71) as the major problem consider the inaccurate
and limited interpretation of the intellectual property in the Civil Code of Russia that
does not correspond with the International Declaration of the Intellectual Property.
Russian law also does not protect Russian authors in foreign territories such as the
EU because it does not apply the rule of rewarding the authors in the case of official
reselling. Chernysheva and Novikova continue criticizing the superficiality of the
Russian legislation by saying that it is not sufficient to recognize only that intellectual
work that is applied to be registered via the official website. In their opinion, the
owners should have a right to inform about the property on their own websites.
(ibid., 75-76.) However, it is worth to be mentioned that Bankovskiy & Entyakova
(2018, 263) think that Russia is more or less in the right direction aligning with
international norms. They say that the creation of a separate monitoring party and
constant development of it will positively contribute to the extent of intellectual
property protection (ibid., 256). Additionally, the continuous joining to global
initiatives is beneficial: from February 2018, Russia is a part of the Hague Agreement
concerning the International Registration of Industrial Designs that allows having an
international application for an intellectual work faster (ibid., 255).
Speaking about Norway, it has the roots of Intellectual property protection in the
19th century when it was legislated. The current agency responsible for registering
intellectual property is more than 100 years old. (Stenvik 2016, 226.) Actually,
Norway provides the protection as the combination of a variety internationally
agreed acts, rules, and participation in agreements as well as developed acts made
on their own, for instance, adoption of the Marketing Control Act in the year 2009
prohibits any copying of recognizable signs that are even not registered. As another
example, the possibility of providing a grant for patents in the English language has
started the implementation since 2015. (Stenvik 2016, 227.) Kazachenok (2015)
supposes that the EU member and partner-countries (like Norway) have an aim to
implement mechanisms working towards creating a zone where the single market,
freedom of action and education and other economic strongholds prevail. Therefore,
the protection of intellectual property is one of the top priorities for them. (35.) She
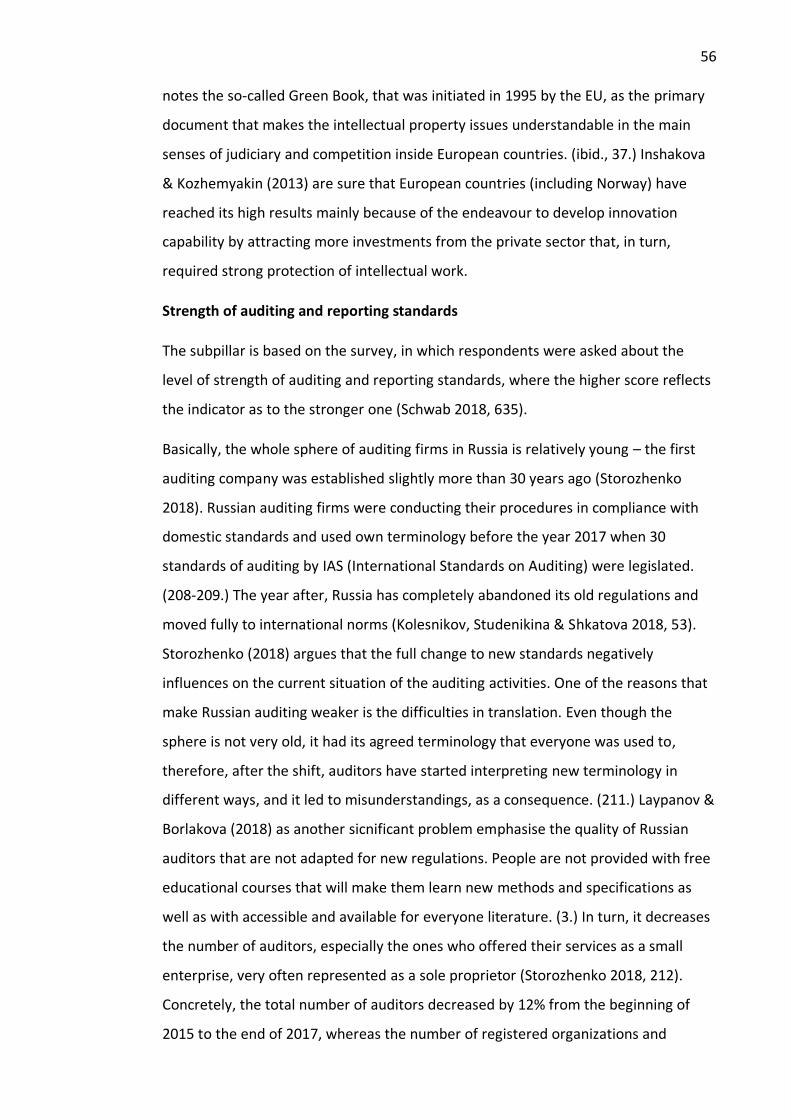
56
notes the so-called Green Book, that was initiated in 1995 by the EU, as the primary
document that makes the intellectual property issues understandable in the main
senses of judiciary and competition inside European countries. (ibid., 37.) Inshakova
& Kozhemyakin (2013) are sure that European countries (including Norway) have
reached its high results mainly because of the endeavour to develop innovation
capability by attracting more investments from the private sector that, in turn,
required strong protection of intellectual work.
Strength of auditing and reporting standards
The subpillar is based on the survey, in which respondents were asked about the
level of strength of auditing and reporting standards, where the higher score reflects
the indicator as to the stronger one (Schwab 2018, 635).
Basically, the whole sphere of auditing firms in Russia is relatively young – the first
auditing company was established slightly more than 30 years ago (Storozhenko
2018). Russian auditing firms were conducting their procedures in compliance with
domestic standards and used own terminology before the year 2017 when 30
standards of auditing by IAS (International Standards on Auditing) were legislated.
(208-209.) The year after, Russia has completely abandoned its old regulations and
moved fully to international norms (Kolesnikov, Studenikina & Shkatova 2018, 53).
Storozhenko (2018) argues that the full change to new standards negatively
influences on the current situation of the auditing activities. One of the reasons that
make Russian auditing weaker is the difficulties in translation. Even though the
sphere is not very old, it had its agreed terminology that everyone was used to,
therefore, after the shift, auditors have started interpreting new terminology in
different ways, and it led to misunderstandings, as a consequence. (211.) Laypanov &
Borlakova (2018) as another sicnificant problem emphasise the quality of Russian
auditors that are not adapted for new regulations. People are not provided with free
educational courses that will make them learn new methods and specifications as
well as with accessible and available for everyone literature. (3.) In turn, it decreases
the number of auditors, especially the ones who offered their services as a small
enterprise, very often represented as a sole proprietor (Storozhenko 2018, 212).
Concretely, the total number of auditors decreased by 12% from the beginning of
2015 to the end of 2017, whereas the number of registered organizations and

57
individual auditors fell by 7% and by 25% respectively. However, it should be
mentioned that there was an increase of 15% in the number of certified auditors.
(Minfin Rossii 2018.) According to Kolesnikov, Studenikina & Skatova (2018, 53),
Gaidarov (2014) correctly reflect that state monitoring bodies negatively impact on
the strength of auditing and reporting standards because they inform tax authorities;
it affects the confidentiality of clients. In addition, Sheremet (2018) explain the
problems of Russian audit as the decline in the prestige of the job. He claims that
new positions related to finance seem more attractive for graduates, especially when
they are required to have an additional certificate that makes them less motivated to
become an auditor (ibid.).
As for Norway, all auditing firms have to follow the regulations set by ISA. The
translation and all other corresponding procedures usually require from 6 to 9
months to be implemented by the special authority – The Norwegian Institute of
Public Accountants. (Moore Stephens Norway DA 2012, 28.) In the interview, AK gave
insights that the system is highly tuned and, on average, the qualification of an
auditor in Norway is higher than of the counterpart in Russia because of that
experience of auditing procedures done in compliance with the standards for years.
AK pointed to the overall systematic approach of the procedures because, again, the
auditing standards have its roots to many years back. This is also supplemented by
strict control over the auditors that does not allow falsifications to happen that often
as in Russia. For instance, AK said that in Norway any firm is not easy to be
established, especially, auditing; therefore, it strengthens the level of responsible
auditing excluding situations with reporting that may be more economically
favourable for the business. Moreover, the market of auditing business is taken
mainly by large companies, and usually, even small enterprises use their services. In
addition, AK distinguished the level of ethical norms in Norwegian auditing, since the
country is relatively small, and the domestic market is limited, all parties strive to act
to build trust with other stakeholders.
4.2.2 Skills
Extent of staff training

58
The variable is based on the survey question asking the level of domestic companies’
investments in providing employees with training and effort in increasing their
professional skills. The lower score, the less domestic companies invest. (Schwab
2018, 637.)
Stuken (2015, 170) says that Russian companies have around 14% of staff being
trained. Interestingly, Stuken made survey-based research where respondents
generally answered that they are in need of having the personnel qualifications be
increased. However, more than 60% of them find training as an expensive activity
and choose not to provide employees with shorter versions. As a result, employers
are still not satisfied with the level of improvements that their staff got. (ibid., 170-
171.) Another problem is the risk of firing an employee that was provided with the
training. It makes employer and employee have an agreement required from a
person to work for a specific amount of time as a return for investments (ibid., 174).
Travkin (2017, 120) express that Russian enterprises spend approximately 0.3% of
the total costs for staff training purposes. Travkin says that the companies usually
fund a little more than two-thirds of training costs, although it is done in European
countries in the same way (123.) The problem is that younger and the ones with
higher education degrees are provided with training more than the workforce with
lower positions, less academic background, and older age. It makes the reskilling
easier for the employer and as a result, dismiss the real need of training for less
qualified people. (125-126.) Generally, BCG (2017, 42) reports that Russian people
are not trained after graduation and firms provide employees with training by 10
times less than in Europe and pensioners represent only 1% of the trainees. Stepanov
(2018) references Alexey Prazdnicnhykh (the GCI contributor) who noted that in the
coming era of automatization, more than 86% of Russian employers plan to hire new
people instead of reskilling them.
Norwegian companies, on the contrary, dedicate around 1.8% of the total costs for
the training. There are more than 25% of Norwegian enterprises that employ staff
who are under their training. (Eurostat 2019.) Although, AK responded that in
Norway such training is paid either by employer or employee, with no governmental
financial participation. Interestingly, that AK professed the view that there is a lack of
qualified human resources in Norway, consequently, local companies seek to

59
increase their professional level. As AM put it: “In Norway, an employee is an asset”.
He continued saying that Norwegian society is inclusive which assets are intentionally
invested in order to bring results.
Quality of vocational trainings
It is based on the survey question where respondents ruminate the level of
vocational training in their countries, where the lower score is, the worse the level
(Schwab 2018, 637).
Zadorina (2017) believes that the reason of the low quality of vocational training in
Russia has its roots in comparatively low attention from the government because of
insufficient financing leading to the disappearing of institutions by 18% in some
regions. Scarce of educational establishments is complemented by narrow program
offerings that do not address the current market and trends of society. The lack of
really important studying fields is caused by the absence of regional visionary toward
the development. In turn, employers often lament about the need for spending time
and resources to introduce to young specialists the real working life in their
enterprises. (Nikolaev & Chugunov 2012, 45-46.) For example, Ivanov (2016, 61)
expresses the lack of technological equipment in the vocational schools needed to
integrate students into the modern businesses. Experts also argue that Russian
teachers of vocational training do not have a higher education that makes their
teaching in a less appropriate manner (Medvedeva 2018). If it is referenced to
statistics, it is seen that in 2017, around 14% of teachers did not have a bachelor’s
degree (Rosstat 2018, 187). Ivanov (2016, 67) even believes that that one-third of
teachers without a pedagogical qualification negatively contribute to the overall
quality of vocational training.
In the case of Norway, the state allocates 1.5% of GDP for upper secondary
education that is 0.1% more than it allocates for the higher education sector
(Statistics Norway 2019). The policies implemented in the sector allows adults to
shorten their studies because of the body assessing their formal and informal
learning. It is being done because it increases mobility and allows people to start
working faster and not spending much on acquiring competencies that they already
have. The competencies might have been acquired differently but also at different

60
levels of education since vocational courses and subjects are integrated into studying
plans. It corresponds with the national aim (implemented by different acts and
regulations) of providing students with professional skills. There are nine vocational
programs designed by the councils consisting of some representatives of different
industries. The authority that has significant power in vocational education and
training policies are reported by those councils. (Souto-Otero & Ure 2011, 100-101).
According to Rusten & Humberlin (2017), actually, Norwegians have two options for
vocational training. The first, which is so far the most popular choice, includes theory,
vocational training with an apprenticeship. The second, which is implemented in
some regions, includes theory as well as vocational and general courses and an
apprenticeship. This way is very popular in regions of industrial activity like
petroleum. Students are provided with vocational training tailored to the regional
activities and include the recent technological novelties used by the local companies.
It does not mean that students have a binding agreement to work for those
companies, but statistics show that they choose them as their working place.
Moreover, Rusten and Humberlin found that the students are also more competitive
in other industries not necessarily the ones that are key in their regions due to
reliability on the program and the practical skills obtained in the young age. (819-
820). In addition, teachers working in the sector have to have a sufficient background
defined by the law: have a master’s degree in the teaching field and a teacher
qualification itself (Krasnova & Polushkina 2014, 57).
Skillset of graduates and Ease of finding skilled employees
The first subpillar is about the fit of skills that graduates obtain to different and
current needs of businesses. In the case of a high score, the fit may be judged as a
great. The second demonstrates how difficult finding the right people is for local
companies. If the score is low, it means that the situation is challenging. The data
used in the index was the most recent. (Schwab 2018, 637.) The variables are
combined because both are found as well-connected.
Before going to the findings of education of higher levels, the attention is paid to the
comparison of 15-years students’ performance in three major disciplines (see Table
14). It is seen that Norway pupils outperform Russian coevals in every discipline, and
especially in the science by being better by 18 points in the mean score.

61
Table 14. Snapshot of performance in science, reading and mathematics (adapted from OECD 2018, 5)
Country Science, mean score Reading, mean score Mathematics, mean score
Russia 487 495 494
Norway 498 513 502
In the year 2017, the total expenditure in Russia for the education is 3.5% of GDP
(Rosstat 2018, 177), whereas Norway spent 8.4% with the main focus on the primary
and lower secondary education that got 2.9% (Statistics Norway 2018). The monthly
salary of Russian public-school teachers is incredibly lower than their counterparts in
Norway: in Russia, it may be around 300 euro (BCG 2017, 37) and in Norway, it is
usually more than 4800 euro (Nikel 2017).
Apart from that, Gurban & Tarasyev (2016, 192) notes that a major problem of
Russian education is in the big gap between real practical needs of employer and
knowledge obtained in educational establishments. Brovkin (2017) believes that this
problem is a special matter in higher education where Russian tertiary schools do not
follow market trends, teach by old methods and admit students with a purpose to
have the intake. For example, in twenty years, admission to universities doubled,
when the number of applicants decreased by more than one-third. In turn, the
situation is the following: 14% of sales assistants and safeguards graduated from
universities. (BCG 2017, 38-40). The intake is based on the exam where students
showing less than average results are offered to pay a fee for studying. Brovkin sees
it as a problem because it influences on the relationship between teachers and the
paying student, making his/her status be privileged and may lead to corruption
(Brovkin 2017). Furthermore, Brovkin distinguishes a problem of the learning method
by pure learning by heart concepts and theories, useless and numerous internal
conferences and a lack of invited people from “practical world”, the representatives
of the profession obtained in the establishment. In the vast majority of institutions,
Russian students cannot choose courses and focus on interesting subjects but to
follow designed beforehand program. As a consequence, students spend more time
on other activities and areas that seem more relevant from a practical perspective
but may not correspond to their educational schedule. Thus, it is difficult to balance.
(Brovkin 2018.)

62
Speaking about Norway, already in primary school, a pupil focuses on some specific
subjects and start planning her/his schedule and set goals with a teacher. In further
steps, children take practical subjects connected with ecology, accounting, and
information technologies as well as others that may appear due to the personal
interest of the student. (Dobrovolskaya 2014, 216.) In the interview, AK stated that a
Norwegian decides to obtain a degree or a diploma, only if he/she feels that it is
needed for the career and life and general. There is not a national trend to become,
for example, a bachelor as it prevails in Russia when higher education is seen as
something vitally important but not practically needed.
According to Damsa et al. (2015, 23), Kehm et al. (2010) characterized the current
educational system as responsive to the needs of a business. Norway develops its
study programs oriented to the market and appeared trends. Therefore, it introduces
programs that are associated with industries like maritime or studies related to
modern social group like studies related to feminism. (Damsa et al. 2015, 35.)
Moreover, state educational establishments do not require a tuition fee. The
admission is based on grades, though competition for a study place occurs but
tertiary schools accept as many as students as they can in the level of bachelor’s
degree. (ibid., 27-30.)
According to OECD (2018, 111), the autonomy of Norwegian tertiary schools allowed
to integrate new teaching methods that differ from lecturing, for instance,
assignments and more group-based work to diversify traditional learning. Also, the
high mobility of Norwegian students allows them to obtain skills fitting to the labour
market. Additionally, students enrolling for the programs that represent the main
labour market trends, e. g. ICT programs are the most popular and represent almost
40% of the doctoral student cohort. (ibid., 114-116.) Norway’s tertiary educational
establishments are highly collaborative with different social actors, particularly with
companies. It is achieved with a significant contribution of the government catalysing
collaborations where representatives of practical world share information, provide
different workshops connected to the field and further job opportunities. (ibid., 120-
125.) This was echoed in the interview with AM who said that “there is a connection
between education and business. A master’s degree student knows where he/she will
be working”. AM highlighted opportunities of working on a project with real

63
enterprises as well as writing theses for them that allows interacting with companies
while studying. What is more, in some study fields such as engineering, educational
institutions have to include practical subjects in the curriculums (ibid., 126).
Additionally, AK noticed that openness to international workers prevails in Norway
taking “the brains from other countries”.
4.2.3 Labour market
Cooperation in labour-employer relations
It is a survey-based subpillar assessing the relations between employee and
employer. In the case of a high score, the relations are more collaborative (Schwab
2018, 639).
AK believes that the difference has its roots to the cultural features of both
countries. Whereas in Norway, the managerial structure is horizontal, consisting of
less hierarchy, in Russia, there is a bigger distance between employer and employee.
AK named the situation in Norway as a Scandinavian approach that was formed for
the years. Scandinavian is obviously about other neighbouring countries with similar
culture – Sweden and Denmark – that are important for Norway in terms of business
(see chapter 3.2). This is interesting that AK argued that Norwegian method in
employer-workforce relations might not work successfully in Russia due to that
difference in mentality. Russian conditions of conducting a business usually require
immediate action with no spending time on discussions and meetings, whereas in
Norway the conditions normally allow to not to decide “right here, right now”. While
commenting, AK found this as the reason why Norwegian companies have not so
many subsidiaries in the territory of Russia. According to Norge.ru (2019), there are
only 70 registered subsidiaries of Norwegian companies in Russia. To compare,
Swedish companies has its representative bodies in Norway as the number of more
than 2500 units (Business Sweden 2014).
Active Labour policies
The subpillar is based on the survey where respondents were telling how helpful
domestic labour policies in finding new jobs and having refresher training. If the
variable’s score is low, it means that the policies are not helpful. (Schwab 2018, 639.)

64
In accordance with Kommitet Po Trudu i Zanyatnosti Naseleniya Sankt-Peterburga
(2019), there is a Russian law that does not financially support people who are in the
process of reskilling or increasing their professional qualification neither in special
educational establishments, education institutions nor anywhere else. The Labour
Code distinguishes all possible reskilling as an initiative of an employer who, in the
case of the implementation of the procedure, have to provide with appropriate
conditions (Trudovoi Kodeks RF 2019).
In Norway, there is The Norwegian Labour and Welfare Administration that is the
public agency providing people with vocational training for the ones who cannot find
a job after several attempts, those who are going to lose a position because of a
shortage of skills or who need assistance. The courses do not require a fee, are
usually about ten months long and their design varies from one region to another.
(NAV 2018.)
Norway follows the strategy where it nationally pays attention to reskilling. There is a
use of online-education courses that are promoted to be utilized. Norway
understands the possible obstacles of documentation of the skills obtained
throughout the working life, especially of immigrants coming to Norway. Thus, it
distinguishes the way of recognition of a part of a degree, full education or skills
acquired from foreigners coming to work. Special courses assessing the skills of
labours are created the proof of the skills. (Norwegian Strategy for Skills Policy 2017,
18-20.) Additionally, there are some people who do not have very basic skills to work
in Norway by doing a manual job. For this category of labours (they are assumed to
be mainly refugees, but the idea is to be applicable for all), special grants are given
for the enterprises to provide them with needed skills. In turn, workers get a
certificate that encourages them to participate. (ibid., 22.)
Reliance on professional management
This refers to the survey result where the higher score reflects the professionals
managing because of their qualifications and the lower – because of close
relationships, friendships. (Schwab 2018, 639).
AK claimed that “the scale of the problem is big” in Russia. The domestic companies,
especially state-owned, have no transparency in recruiting to a managerial position.

65
The legislation does not limit such hiring and the companies, in turn, does not
provide with information revealing this. Norway also has its cases when an
organization employs a relative or a friend of another manager. However, these
rarely happen in the government-run enterprises. As AK noted, once a position is
available, it is always announced to be applied to the public which means that
competition occurs.
Labour tax rate
The variable is based on the business obligatory payments on labour. It is “expressed
as the percentage of commercial profits”. (Schwab 2018, 639). Basically, Norway has
a higher position in the ranking by being 69th with the value of 15.9, while Russia is
133rd with 36.3. Therefore, the logic is the following: if the value has a lower number,
then it is higher in the rating or may be said that it contributes better to the overall
competitiveness of the country. If the average salaries of both countries are
compared, it is seen that an average salary in Norway is bigger by 52% than in Russia
(Average Salary Survey 2019). Thus, one can expect that obligatory payments on
labour are also higher in Norway. However, the fact that obligatory payments on
labour as percentage of commercial profits is lower in Norway suggests that Norway
can still generate more commercial profits despite higher expenditures on salaries.
4.2.4 Financial system
Domestic credit to private sector
This variable provides with the score of the provision of financials to the private
sector (Schwab 2018, 639).
AK supposes that one of the considerable reasons for Norway is its interest rates that
positively contributes to the higher score and position in the ranking. Actually, short-
term rates were noticeably bigger in Russia over the whole period. For example, on
its peak, in 2015, Russian banks offered credit with 14.8% short-term interest rate
while the counterparts in Norway offered the same but with the rate lower by 13.5%.
The situation is similar in long-term interest rates: again, the peak in the period in
Russia was in 2015 when the rates from Norwegian banks were lower by 9.3%. What

66
is observable is that, although the countries have tendencies to go down, Russian
case is more fluctuating, while Norwegian – constant (see Figure 13).
Figure 13. Interest rates of the countries (adapted from OECD 2019)
Financing of SMEs
The subpillar provides with survey responses about how accessible finances needed
for business conduction are for small and medium-sized enterprises. If the score is
high, it tells that finances are more accessible. (Schwab 2018, 639.)
In Russia, SMEs get the main financing support from bank loans – in 2015, it was
94%. However, there are different barriers to getting a loan for small or medium
business purposes. (OECD 2015, 152). Savchina et al. (2016) say that banks do not
have a real interest in developing their businesses with SMEs; thus, credit
connections are not developed, and firms are not provided and offered with
especially emerged products and services contributing to SMEs amelioration. The
problem is in false perceiving SMEs as a well-established and big companies which
borrowings are even much bigger. In general, banks miss an oriented methodology
assessing risks. It leads to either extended periods of awaiting a credit result or not
adequate for SMEs interest rates (11623.) According to Savchina et al. (2016), around
90% of proposed by the Ministry of Economic Development and Trade of Russia sum
is not provided to SMEs. Moreover, OECD (2015, 152) reveals that only 45% of
applying SMEs get a loan. RAEX (2018) explains the high number of refusals as the
lack of sufficient collateral. Even though there are Regional Guarantee Organizations,
0
2
4
6
8
10
12
14
16
2014 2015 2016
Russia, short-term Norway, short-term Russia, long-term Norway, long-term

67
they still successfully contribute only to 6% of given loans. (10.) The main loan issuers
are the biggest banks of Russia, the ones who do not represent the top-30 have a
tendency of decreasing the credits. Overall, 55% of Russian banks do not increase
their credit portfolios. (ibid., 13.) OECD (2015) highlights deficient transparency
norms and not a necessity to provide with financial statements for many borrowers.
It makes risk assessment more difficult for banks. Also, bank employees usually have
not enough understanding and training that limits them in coming up with the bank
own methodology and, again, lack of transparency – public credit recordings –
amplifies the obstacles. (153-154.) According to Savchina et al. (2016, 11629),
Pashchenko (2016) found out that a problematic procedure is in guaranteeing (43%
of responses), high interest-rates (32%) and bureaucracy (26%) are core issues. From
the perspective of AK, though Russia comes up with supportive policies, practically,
the support is absent.
In the case of Norway, AK claimed that Norwegian business system works towards is
SMEs, though the main money comes from large companies mainly working with
natural resources. AK even named the SMEs as “skeleton” of the Norwegian
economy. Therefore, the opportunities to run a small or medium enterprise is
provided by all the official parties starting from a municipality and ending by the
government strategy. All of them are interested in providing support, and very often
some services are free, and it is not like in Russia where a “young” entrepreneur
needs to pay for every single step of his/her business activities. In Norway, apart
from more developed venture capital (see Table 12) and that state support, the
granting system is on the advanced level. Grants may cover up to 50% of SMEs
projects no matter to the overall costs to positively contribute to their development,
e. g. to “discover and enter new international markets or [cover] R&D expenses”.
What makes the whole process small-business-friendly is the terms of getting the
financial support that is always agreed beforehand and in the vast majority of cases,
it is implemented on time.
Notwithstanding some exclusions, there are no delays meaning that a small
developing business may plan its strategy, future and set goals in accordance with
the timeline for the support. AK said that the free and, importantly, qualified and
helping consultancy of developing a business prevails as well as adequate access to

68
tenders with no excessive requirements and expectations. All in all, “the system
supporting SMEs is understandable and transparent”.
Insurance premium
It reflects the amount of life and non-life insurance premium in the country. (Schwab
2018, 640.)
Bykanova & Cherkashina (2017) characterize the general situation in the Russian
insurance market as stagnant: decrease in the number of subsidiaries of big
companies, drops in the profitability of the leading insurance segments and liquidity.
Demonstratively, 16.5% of companies have lost licenses in 2015. (204.) According to
KPMG (2018, 7), from the period of 2015-2017, the total number of insurance
companies in Russia has decreased by 33% and the decline is forecasted to be
continued. Aksyutina (2014, 117) explains that long-lasting tendency as a lack of
resources to increase capital. As an example, five companies from top-100 left the
market in 2017 (NRA 2017, 4).
The problematic areas in the Russian insurance market are described as vulnerable to
macroeconomic factors and instability of the Russian economy as a whole. Low
incomes and volatility (that further reached a dramatic drop) of currency make
paying capacity for Russian citizens low. Geographical features also negatively
contribute to the situation because they lead to higher costs of conducting
businesses and, as a consequence, considerably decrease budgets of small
enterprises that could be spent on insurances. The government, in turn, fails to
provide SMEs with finances that will increase their payment abilities. (Podkolzina
2016, 58.) The area is complemented by low reliability to insurance services and
absence of insurance literacy among residents (Aksyutina 2014, 118). For instance,
voluntary pension insurances are not popular among youth because they do not
think about future incomes in an appropriate manner, whereas elderly people
cannot afford extra pension (Nerovnya, Romanov & Shirshov 2018, 479).
Norwegian insurance market does not face a problem of the population affordance
getting insurance. As it was mentioned by AK: “purchasing capacity in Norway is
high”. Also, it may be referenced to previously mentioned salaries in Norway that are
considerably higher than in Russia as well as overall financing level of SMEs and

69
possibility to get a credit (see Table 12 and previous bolded parts) that cover costs
and should increase that costs of local businesses. Furthermore, life-insurance
companies have the biggest share in the Norwegian market, though the number of
non-life insurance companies prevails in Norway. Life-insurance premium mainly
comes from pensions: both individual and occupational. (Norges Bank 2017, 62-63.)
Soundness of banks
The index expresses it as the responses assessing how sound banks are in the
territory of the country. The higher score, the healthier banks are perceived by the
population. (Schwab 2018, 640).
The period from 2013 to 2016 is known as the cancellation of banks licensing period
in Russia – Central Bank of Russia prohibited continuing the business to more than
400 banks. The reasons were not only economical but also about the suspicion of
fraud (26% of them). (Bidzhoyan 2018, 27-29.) Bashirov (2017) pays attention to the
size of unlicensed banks: only in 2016, five of them represented the top 100 banks in
terms of assets, and in 2015, four were banned. This tendency of “cleaning the
banking sector” lead to the outflow of deposits in smaller banks and lead to an
increased capacity of the state banks. (14.) However, Tavasiev & Mazurina (2016) are
sure that there are still not enough significantly big banks that will attract big
demand for the services. In Russia, it is common to invest, hold the money in the
foreign units. Here is the lack of improving action from the government. However,
macroeconomic interventions do not allow to develop freely. Another quite
uncontrollable issue is in the economic conditions of the population whose solvency
depends on the region of the country (incomes vary from city to city). In other words,
the Russian system should be redeveloped with the perspective of starting from each
region separately and setting concrete goals which are relevant there. (32-33.) AK
said that the instability of Russian banks is the consequences of sanctions set against
the Russian Federation. IMF (2018, 21) reports that there is a dominance of state
banks, which represents 66% of the market; however, in terms of efficiency, they lag
behind private ones. Further, IMF named the overall situation in the market as
monopolistic where that heavy control of state banks crushes the competition. (ibid.,
31.)

70
AK in the interview maintained that banks in Norway are transparent enough to
conduct the business. The legislation ensures the credibility of banks which are old
and has sufficient capital to sustain. Moreover, it "strongly protects borrowers".
Besides, the market consists not only of Norwegian banks which number is not even
huge. There are banks from other Scandinavian countries, and they are part of the
whole system. AK believes that a smaller number of registered banks allows to
control them more properly ensuring their soundness. The absence of turbulence,
constant changes, and overall stability makes the banks operating in Norway sounder
than in Russia. Additionally, IMF (2015) says that Norwegian banks have stable
performance indicators. Some of them are higher than required from international
standards. Importantly, the global financial crisis of the year 2008 did not lead to
Norwegian banks' bankruptcies and did not significantly impact the domestic banks.
(14.)
4.2.5 Innovation capability
State of cluster development
The subpillar should be understood in the way of survey-based answer to the
question of the spread level of advanced clusters in the territory of the country. If the
score is low, it means that the spread is close to the null. (Schwab 2018, 641.)
Rodionova, Krejdenko & MaDry (2018, 61) claims that the government plays the key
role of cluster advancement in Russia and the main financials are flown from the
country’s federal budget. Concretely, Kutsenko (2015) found that 64.4% funding
comes from the federal and regional budget and it is complemented by 7.1% of
funding from the local state where the cluster is. He believes that such a huge
position of the state in cluster activity leads to the dominance of state companies
reducing the overtures number from the private sector. (38-40.) Kutsenko further
adds that Russian SMEs agents are out of discussions and decision-making processes.
(ibid., 46.) Islankina & Thurner (2018) name this phenomenon as the very Soviet
Union alike, when the state participated in every economic activity. (2; 12.) Actually,
this parallel is explained by Rodionova et al. (2018, 62) who say that the dissolution
of the USSR left the economic industries on the rudimentary level, in turn, making
Russian authorities profoundly participate in the cluster development. However,

71
there is still a lack of resources provided to some regions (ibid., 62). Zemtsov, Pavlov
& Sorokina (2016, 517) claim that subsiding is quite chaotic, there is no connection
among the size, efficiency, and extent of development of regions but some of them
simply get more money. Rodionova et al. (2018) remind that in 2010, the Russian
regulatory body announced the creation of 250 clusters. Reality showed, however,
that a part of the number has never been started to be created, whereas another
part was just based on established companies. Thus, in 2017, there were only 113 of
clusters where around 29% were located in the Central Federal region and some
regions did not have a one. Interestingly that only 8 clusters were empirically found
as effective. (69-71.) According to Kutsenko (2015), there are pilot clusters that are in
a so-called “closed administrative-territorial formations” that, nowadays, are known
for their poor level of infrastructure, access to social needs and living standards.
Kutsenko sees it as a major problem of talents leaving the area. Moreover, that kind
of Russian cities has again a problem of the superiority of several big enterprises not
allowing smaller to become a part of the cycle. (36.) Coming back to the issue of the
government role, Kutsenko identifies the tendency of Russian cluster companies to
build a relationship with the authorities instead of other companies to develop
jointly. Thus, there is a need for cluster managers to understand the value of
business-to-business interactions. (44.) Zemtsov et al. (2016) they measured the
interrelations of cluster managers with other participants in Russia. What stands out
in their study is that the number of that interactions was lower by 207 than the
needed standard. (508.) This particular issue was mentioned by AM as a major. The
lack of interactions is from all the stakeholders. AM explained it as a “sociological
phenomenon” revealing that “informal networks prevail” in Russia. It makes the
processes be “less transparent and unilateral” which negatively impact the
attractiveness of new people to the cluster.
In the context of Norway, its innovation policy places the development of cluster to
the central role. To facilitate progress, it has launched three programs. First is Arena
that provides underdeveloped clusters with managerial and financial support that
may be given for up to five years. (Njøs & Jakobsen 2016, 155.) Thus, the program
accompanies the development from the very beginning to a certain targeted goal
(Müller et al. 2012, 122). Arena represents the first level of support granting a

72
possibility to enter the second stage where another national program named
Norwegian Center of Expertise (NCE) (Røtnes et al. 2017, 20). Njøs & Jakobsen (2016,
156) characterize the program as the cluster internationalization and innovation
increasing, designed for a mature and secure position, and it provides ten years long
support. From 2006, more than 73% of supported clusters were active in 2017
(Røtnes et al. 2017, 20). What is important is that in both programs the half of
funding is always from private means (Müller et al. 2012, 118; 124). When it is said
that the role of the programs is supportive, it means that the supported cluster
decides on their own what kind of contribution it needs, where to focus and what
strengths they already have, they are in fully integrated position designing their
future steps. In turn, Arena and NCE assess the projects in terms of a current market
situation as well as strives to balance cooperation development, trust among
participants and keep a cluster’s originality. (Jakobsen & Røtnes 2012, 11.) Moreover,
both programs are very selective – there is a sort of competition among applying
projects; therefore, accepted only those which have proven their supremacy over
others. The benefits of being part of the projects are demonstrative – the majority of
participants in Arena say that mutual trust is enhancing and in NCE –
internationalization along with collaborative activities is growing. (ibid., 16-18.)
Cluster management is greatly supported by different workshops, regular meetings
and specific toolboxes that makes cluster progress (Müller et al. 2012, 68). Jakobsen
& Røtnes (2012, 20) references survey resulting in the overall proper cluster
management evaluation. The third-level program is Global Centers of Expertise (GEC)
which was established only in 2014. It has similar criteria as NCE but focuses on a
cluster with a global position. Thus, it provides with a financial injection only to
increase knowledge, positively contribute to cooperation among clusters and
innovation. (Røtnes et al. 2017, 20-21.) GEC and NCE concentrate on central regions,
whereas Arena mainly contributes to rural clusters development (ibid., 28). AM in his
words explained that the Norwegian system is about a well-tuned dialogue among
cluster participants who can find a collective consensus. Formal networks in the form
of official representatives of companies and regulatory bodies render the interests of
them and decide on where to focus.
International co-inventions
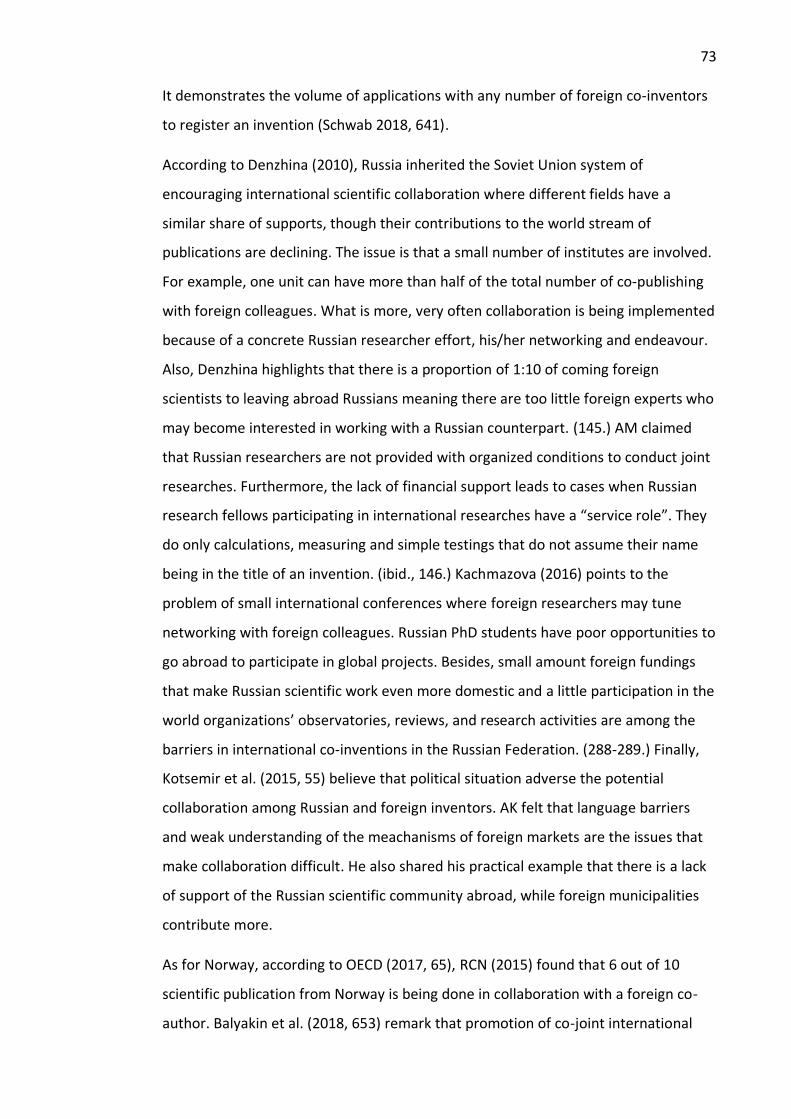
73
It demonstrates the volume of applications with any number of foreign co-inventors
to register an invention (Schwab 2018, 641).
According to Denzhina (2010), Russia inherited the Soviet Union system of
encouraging international scientific collaboration where different fields have a
similar share of supports, though their contributions to the world stream of
publications are declining. The issue is that a small number of institutes are involved.
For example, one unit can have more than half of the total number of co-publishing
with foreign colleagues. What is more, very often collaboration is being implemented
because of a concrete Russian researcher effort, his/her networking and endeavour.
Also, Denzhina highlights that there is a proportion of 1:10 of coming foreign
scientists to leaving abroad Russians meaning there are too little foreign experts who
may become interested in working with a Russian counterpart. (145.) AM claimed
that Russian researchers are not provided with organized conditions to conduct joint
researches. Furthermore, the lack of financial support leads to cases when Russian
research fellows participating in international researches have a “service role”. They
do only calculations, measuring and simple testings that do not assume their name
being in the title of an invention. (ibid., 146.) Kachmazova (2016) points to the
problem of small international conferences where foreign researchers may tune
networking with foreign colleagues. Russian PhD students have poor opportunities to
go abroad to participate in global projects. Besides, small amount foreign fundings
that make Russian scientific work even more domestic and a little participation in the
world organizations’ observatories, reviews, and research activities are among the
barriers in international co-inventions in the Russian Federation. (288-289.) Finally,
Kotsemir et al. (2015, 55) believe that political situation adverse the potential
collaboration among Russian and foreign inventors. AK felt that language barriers
and weak understanding of the meachanisms of foreign markets are the issues that
make collaboration difficult. He also shared his practical example that there is a lack
of support of the Russian scientific community abroad, while foreign municipalities
contribute more.
As for Norway, according to OECD (2017, 65), RCN (2015) found that 6 out of 10
scientific publication from Norway is being done in collaboration with a foreign co-
author. Balyakin et al. (2018, 653) remark that promotion of co-joint international

74
scientific activities is the part of the development of international relations, where
the Ministry of International Affairs stresses the activities upon the Sustainability
Goals set by the United Nations. For instance, there are approximately 100 projects
aimed to connect foreign researching units with domestic counterparts (Norwegian
Ministry of Education and Research 2013, 11). As AK in the interview said:
“Internationalization is one of the main source of getting money, and there is no another way. Norway is a small country”. AM thoughts complement it: “Norway has an orientation towards international cooperation; there is a clear understanding of benefits from it”.
Thus, the country actively collaborates with the world leaders in scientific
publications from North America (where the support is high); as a result, their
number was doubled from 2003 to 2010 (Johne 2011). Norway’s partnerships with
the EU is also beneficial in terms of scientific collaboration. The country is the part of
the Joint Research Center which has sites in 5 European countries. Norway’s
involvement is considerable representing seven large laboratories and two
academies. It has 51 joint projects, 19 scientific networks and six collaboration
agreements (European Commission). AK connected the examined subpillar’s score
and the dependency on foreign markets and trade. He believes that international
trade allows Norway prosper and due to this, Norway constantly aims to develop its
international partnerships.
Patent applications and Trademark applications
The first variable is on the basis of the volume of applications to register an invention
as a patent. The second is on the basis of the volume of applications to register a
trademark per million of residents (Schwab 2018, 641-642). The subpillars are
combined here since they are well-connected.
In accordance with Yakovets, Konchenkova & Rastvortsev (2018), the Russian system
is not correct to the point of publishing articles that lead to further patent
registration. Authors in Russia are not provided with a free and easily accessible way
of being published in the leading journals. Therefore, Russia also meets negative
balance in selling intellectual property. (17.) However, Kuznetsov (2016) says that the
government effort is still significant, but the problem is in the fail of supported

75
projects to become a patent-productive; it decreases the motivation to continue the
support. Russian society has a quite low level of prestige for scientists, they are not
really valued, and their salaries are small. Thus, it is prevalent for them to leave the
country. Because of these, Russia’s innovative capability meets a massive barrier in
attracting talents. (9-11.) Figure 14 is demonstrative because it shows the negative
tendency of the number of researchers in the country. If Norway steadily increases
the number, in Russia the popularity of being a researcher is going down, and the
number is roughly twice less than in Norway.
The state of Russia also fails in providing the appropriate way of support for
applications – there is a lack of administrating support that makes the procedure
very long (ibid., 65). AK sees it is the main barrier for Russian innovators, whose ideas
do not go far, while in Norway a strong “belief in intellectual property” prevails. The
corporate sector in Russia does not seek to innovations and it indicates a modest
result of one-third of the total number of patents. Norway in comparison has 81% of
patents issued by companies. (ibid., 31-32.)
Figure 14. Total researchers per 1 000 employed (adapted from OECD 2019)
Speaking about Norway, the government also plays not the last role in the nation’s
innovations. It concentrates the support on the leading market players. For example,
the Ministry of Petroleum & Energy sets clear long-term goals and contribute to
management. This – single ministry role – is exactly what Kuznetsov sees as missing
in Russian innovation development and as the determinant in the Norwegian. (ibid.,
79.) Apart from that, Norway puts an effort to develop research communities by
heavily funding and improving infrastructure (OECD 2017, 97-98). As it was
0
2
4
6
8
10
12
14
2 0 1 0 2 0 1 1 2 0 1 2 2 0 1 3 2 0 1 4 2 0 1 5 2 0 1 6 2 0 1 7
Norway Russia

76
mentioned it this thesis, Norway and Russia are known for petroleum production.
However, AM points to a considerable difference between the countries approaches.
In Norway, offshore extraction happens, while in Russia – onshore. Norwegian
method allows to come up with innovative solutions more often. It associates with
the words said by AK who added that innovations from Norwegian companies are
usually more integrated into a process.
R&D expenditures
It is based on the volume of public and private spendings on research and
development activities (Schwab 2018, 642).
According to Denzhina (2017), the government mainly contributes to the sphere
allocating 70% of total expenditures to R&D and financially supporting 62% of R&D in
business activities (11-12). Kuznetsov (2016, 28) claims that overall Russia lowly
demands new technologies and novelties: in 2014, only 0.3% of GDP were invested in
intangible assets. Instead of creating new technologies, Russia tends to buy them
from abroad. Denzhina believes that it makes the nation less independent on the
external market (Denzhina 2017, 13). Actually, the government has been aiming to
build innovative infrastructure. For instance, in the 2010s, establishing of so-called
“technology platforms” has been started, where the help was non-financial: parties
were, as it was planned, to be connected communicatively. However, due to the
failure of the relating involved parties and direct them towards the set priorities, and
therefore, the loss of the private sector to participate led to only one-fifth of
functioning platforms by 2017. As for state companies, they were also pushed to
increase R&D activities, although, it is demonstrative that only a third of them
responded that they want to contribute to the world market, while the majority was
aiming to benefit only internally. Collaboration with universities also does not meet
expected results because forcing make it only formal, with no real interest. (ibid., 14-
16.) Kuznetsov (2016, 9) evaluates the government actions as not returning on
investments: extensive spendings do not bring enough results, local businesses are
not innovation-oriented. Kuznetsov further proposes the hypothesis that companies
put an effort for R&D only to meet tax benefits and report about an “achievement”.
Another issue is the business centricity on price, instead of quality. Russian
enterprises rather save money on the less innovative product supplied instead of

77
strategically assume the possible outcome of more expensive product or service.
Kuznetsov claims that it may be interpreted in the way of decreasing R&D potential.
(Kuznetsov 2017, 44.) Interesting that AM noted to the overall limitations of Russian
businesses to invest extra money. Enterprises consider only short-term development.
In Norway, the role of the government in R&D expenditures is not predominant. It
has a share of 15% of total R&D spending, whereas business sector enterprise sector
contributes as of 54%. (NIFU 2016.) However, AM distinguished the political will of
Norway and its awareness of the importance of innovation. The funding is about to
be equal: 0.91% of GDP comes from the government and 0.9% - from the industries
(NIFU 2018). Demonstratively, Norway allocates 46.7% of technology expenditures
for its own innovations; it is higher than in Russia by 20.1% (HSE 2018, 325). OECD
(2017) accentuates the goal set by the government to continually increase R&D
expenditures. Also, business contribution to R&D activities is reached because of
growing expenditures in the service sector. It makes an important fit between the
scientific world and industrial clusters, e.g., the maritime, environment-friendly
technologies. There is an advanced system facilitating R&D activities that encourage
the knowledge shared among sectors. The cluster programs mentioned earlier is an
example of it. The support of start-ups in the form of commercializing R&D also
positively contributes to R&D expenditures. (27-29).
Moreover, SMEs are almost the key R&D performers (ibid., 133). The state supports
businesses by R&D tax credits, grants and other different instruments that are
designed to help financially and technically (ibid., 137). For instance, Innovation
Norway (state-owned company) assists by designing funding schemes, promotion
(ibid., 139). In the case of an approved project including R&D activity, a company has
a chance to get a tax credit of 18-20% (ibid., 147). AK argued that Norway strives to
optimize working processes because of expensive conditions obligatory provided to
an employee and overall need for the more qualified workforce. Norway sees a
solution in replacing human by technology, since, in a long-run, it is less costly.

78
4.3 Summary
To summarize the findings, in terms of the framework, it was preliminarily identified
that Norway surpasses Russia from the perspective of 11 pillars out of 12.
Nonetheless, the research was focused on five of them (namely Institutions, Skills,
Labour market, Financial system and Innovation capability), since some of the pillars
represent an inconsiderable difference, whereas the one (namely Health) could be
perplexing to ascertain the issue and to be influenced within the scope of the thesis.
The 5 pillars have its subpillars that were needed to be chosen by following the same
approach for the deeper study. In total, there were 23 subpillars (variables)
diagnosed as the main aspects making Norway be more competitive than Russia.
Broadly speaking, major reasons for advanced Norwegian position are caused by the
overall systematic imperfectness of Russia. It negatively contributes to the national
regulatory bodies that weaken institutions, lead to no freedom of the press and fails
in ensuring, for example, judicial procedures, corruption investigation, educational
processes of different levels. It also makes the whole country less innovative.
Norway’s better-tuned system allows the nation to have the explicit implementation
of the development of innovation activities and to be more collaborative in foreign
scientific and innovation works. That system includes legislative institutions that are
also the parts of determinants of innovation capability since it was found that the law
protects intellectual property as well as physical property better. Another systematic
advantage of Norway over Russia is again in the regulatory bodies and more precise
implementation of the plans. For example, Norway focuses its strategic development
towards facilitating SMEs by providing them with needed finance via different
initiatives and programs where all the parties are genuinely involved in the process
aiming to contribute. In turn, in Russia, it is possible not to meet the announced
number of created clusters. Speaking about financial support, Russia fails in ensuring
the appropriate conditions to its local academics allowing them to innovate,
collaborate with counterparts from other countries and encourage domestic
enterprises to invest in R&D activities. Moreover, Russia has a small expenditure on
education. It is seen in the percentage of GDP allocated to the sector that, in
comparison, is considerably higher in Norway where primary and secondary schools
are better funded than some Russian tertiary education establishments. Actually, it is

79
related to the skill of labour in both countries where Russian students are less ready
to be integrated into the working life.
The research demonstrates that Norway values the potential of technology by
investing in innovation activities because it sees that the workforce can be more
expensive, whereas, in Russia, businesses prefer saving money due to limited
resources, are not willing to invest in increasing the level of its employees and
coming up with new solutions. However, Norway’s case should be understood that
the nation shows the systematic approach in education, for instance, by being
sensitive to the labour market trends, whereas in Russia, obsolete methods in
preparing future workforce occurs. Notably, some systematic problems of Russia are
explained as the age of executing a particular activity that is quite old in Norway. This
is one of the reasons for the difference in the strength of auditing and reporting
standards between the countries.
Apart from those systematic drawbacks of Russia which are possible to connect in
some ways with many other issues of the competitive extent of the nation, it should
be distinguished that some of the Financial system realms such as Insurance market
and crediting private sector are worse than in Norway. It is because of the economic
situation in Russia (the context of the country may be remembered, low GDP/capita
is also illustrating) and the overall poorness of the residents who cannot afford some
financial services. Although, it is worth to be mentioned that the interest rates are
too big in Russia meaning that banks also are not oriented to the customers.
Norway’s society, in turn, is stable to that issues and is offered adequate interest
rates. Externalities in the form of sanctions also negatively impact the financial
system of Russia. Besides, that low economic conditions of Russian citizens even
effect their occupation: for example, after integrating new auditing standards, the
number of the auditors decreased because not all of them could afford to visit new
courses. In Norway, it is different, and it could also be seen in the growth of the
number of research fellows that, in words, is declining in Russia due to low salaries.
The results of the study also show that cultural difference also plays its role, mainly
in the relationship among participants of any activity. In Russia, there are more
informal networks with no tuned official communication that was found as the
barrier in the development of clusters, whereas Norway has a well-established

80
structure. Corruption happened in Russia also may be explained by that non-official
way of communicating. The study has found that the examined countries have a
different historical way of relationships in workplaces. It means that local people get
used to some approaches and may consider that as the norm. It is connected with
findings that workforce in Russia is considered as a cost and in Norway, it is believed
that a labour is a source to invest in, though, as found, it is more expensive.
Interestingly, the approaches are applicable to the context of each country but
difficult to integrate one to another’s context. Furthermore, the weak intellectual
property protection is related to the national illiteracy and rampant
misunderstanding of the harm from using intellectual works with references to
authors. As it was found, the roots are in the U.S.S.R.-like minds where were fewer
formal frameworks regarding a property. Norway’s case showed that protection is
traditional and old. Although, this may be explained by the overall size of both
countries and their markets. Obviously, Russian – bigger and Norwegian – smaller,
consequently, in Russia, there is not an aspiration to tune communication and build
trust as in Norway, because in the first – the number of potential partners is also
bigger.
5 Discussion
This study was carried in order to compare Russia and Norway in the sense of
competitiveness based on the Global Competitiveness Index as the theoretical
framework. As a fact, the countries have a significant petroleum contribution to their
economies. However, this natural endowment does not make the countries close to
each other: actually, there is a distance of 17 places between Norway and Russia in
the index. Therefore, the research had the main objective to determine what makes
a resource-rich country, Russia less competitive than another resource-rich country,
Norway. It has been done by finding what the problematic areas of the first country
are and what the main successful elements in the same areas of the second are.
Since the summary of the findings is already in chapter 4.3, this part of the thesis will
familiarize readers with practical implications, assessment of the results in the light
of literature, research limitations and point to the further research
recommendations.

81
Practical Implications
In general, this thesis is supposed to contribute to further development of Russia
with the help of Norway’s case, therefore, all the problematic areas of Russia are
identified to be demonstrative where the attention should be paid. Norwegian
successfully established aspects are helpful in the context. Hence, the implications
are addressed to Russian policymakers, the ones who are responsible for certain area
development and can change and impact the situation.
Concretely, to make the judicial system in Russia be more independent, policymakers
can be inspired by the Norwegian system, where a court president has no significant
power in assigning the judges and investigating their professional mistakes. Similar to
Norway, Russia should replace that power to an independent third-party that will do
that tasks impartially. Norway’s special committee is a sufficient example to take into
account. Additionally, Russian law needs to be reconsidered to ensure no pressure
coming from any interested parties. A background required for a Russian judge can
move from obligatory being from the field of the law because the Norwegian case
demonstrates that judges with different fields’ backgrounds can positively
contribute.
Mass media in Russia has a quite challenging picture since it has the roots in the state
regulations. Norwegian authority shows a full-democracy pressing the birth of
monopoly; therefore, the main advice to Russian policymakers is in striving to limit
the ownership of the press by the same parties to reach that level of pluralism. Once
it is done, Russia will have a chance of having flows of different opinions contributing
to overcoming some local issues and become more competitive.
Corruption, as the core of some problems in the territory of the Russian Federation,
can interfere with the nation and its competitiveness less, if the authorized body was
more developed. Norway with its special authority is demonstrative: Russia should
establish the regulatory body that will be in charge of investigating that kind of crime
and engages police, prosecutors and advisors that will represent an elite force
meaning that the competence of that branch is high.
Property rights as well as intellectual property protections in Russia, actually, may be
strengthened by the law changes where all points and nuances are clearly defined. In

82
Norway, it is well-determined, thus, the practical implication for Russian
policymakers might refer to those ways of describing the property and corresponding
matters. In terms of intellectual property only, Russian official should consider
continuing participating and joining and international agreements to protect the
works more properly and ensure it even on the territory of foreign countries.
The auditing and reporting standards can become more solid if Russia directs the
effort on increasing the qualification of domestic auditors. Their number is still big,
and many local firms use their services, therefore, increased competences will be
helpful in the area. Russia may approach Norwegian’s example of preparing system
of new auditors. What is more, there is a need to have stricter control over auditing
companies in Russia.
Another important practical implication starts the need for increasing skills of people
in Russia. There should be more investing in the employees’ skills increasing by
following Norway’s tendency. They understand the future need for a competent
employee. Hence, managers of Russian companies should provide people with more
training to keep them able to work in the modern environment.
Continue the word about skills, Russia educational system should be more provided
with finances. There is a need for new equipment that will familiarize students with
the practical world and allow them to learn better. Besides, it will increase teachers’
salaries and make them more motivated to work. Speaking about teachers, Russian
policymakers should pay attention to the required vocational teachers’ background
by increasing the minimum criteria as it is Norway. Moreover, it seems that the
whole system in Russia has to be more flexible. In other words, it should be planned
according to market trends. Norway shows an example here of creating a studying
scheme according to a region and its specifics. Also, Russia may promote cooperation
between universities and real companies by integrating them in the studying process.
Norway here demonstrates a suitable combination of different co-joint projects.
Practically, Russian students (even from primary school as it is done in Norway)
ought to have a choice of what courses they can attend as electives that are
obligatory to be taken.

83
Going further, it is obvious that cultural difference is difficult to be influenced.
However, Norway’s higher competitiveness may be illustrating for Russian managers
to integrate more cooperating ways of doing business by being more democratic
with employees. It is understandable that the countries have different market sizes,
territory, and parties involved in the process. It means that the situation may be
improved with joint actions of all. It does not require a specific policy or regulation,
but it is just about people’s attitude.
Speaking about labours, Russia should reconsider its state support in reskilling. As
Norway does, there should appear more available and accessible courses aiming to
help people be more competitive in the labour market and fit their needs.
The problem of low transparency of Russia companies, mainly the ones owned by the
government is the problem that needs to be solved in order to overcome the issue of
having not appropriate people be on the key positions. Similar to Norway, the public
announcement needs to be, once a company looks for a top manager.
Moving to Financial system, too high-interest rates are obviously a complex issue;
however, Russian policymakers should pay attention to it and work towards
decreasing them. Norway’s case demonstrates that low-interest rates make the
nation be more competitive in spite of having a wealthier population.
What is more, the entire system of supporting SMEs in Russia may be inspired by the
Norwegian example. The findings suggest that banks should be encouraged to
provide small businesses with more credits, there need to emerge a detailed and
careful scheme of granting that will contribute to more expenses on innovations and
will just cover the costs. The system has to be reconsidered to the point of tuned
communication between involved parties who will require extra investments from
enterprises and do the procedures with no delays. It will allow companies to plan
their strategy accordingly. In turn, SMEs as well as other companies ought to be
controlled more precisely in order to ensure no speculations while applying for credit
and guarantee the paying capacity. However, there has to be stricter control over
Russian banks to avoid problems for businesses and private customers. Therefore,
the policy of liquidating banks is found to be positive and should be continued.

84
Furthermore, the results propose applying similar programs (as Arena, NEC, and GEC
in Norway) dedicated to different extents of cluster development. For Russia, it will
be helpful in developing the clusters with a clear understanding of what is needed,
with more tailored catalysing and with the direct participation of the stakeholders,
particularly – business, especially small ones who are now neglected in the scheming.
As for increasing the level of inventions in collaboration with foreign counterparts,
Russia should consider the Norwegian case and increase the financing. It is needed to
provide with conditions, ease travelling, participation in international conferences as
well as be more attractive for international scientists, scholars, and academics to
cooperate with the domestic ones. Partnerships with other countries need to be
more established and continually supported.
Also, there is a need for emergent state regulations setting the aims not only to SMEs
but to big companies thereby inducing them to invest in innovations. This will
increase R&D expenditures in the long run, increasing the spending of businesses on
new patents, inventions, and trademarks. Again, better-established systems of
granting will stimuli enterprises.
Assessment of the Results in the Light of Literature
Basically, the research pioneers comparing the competitiveness of Russia and
Norway, although there are studies aimed at the competitiveness of the chosen
nations. Even though there are no works absolutely related to this thesis’s topic, the
general field of nations’ competitiveness has already been examined and developed.
Therefore, the thesis has not contributed to creating new theory and results
supported previous studies and the theoretical framework, in particular. Although,
there is a work by Triantafyllou (2014) who worked upon analysis of the business
environment and the competitiveness in his master’s thesis. In the case of Norway,
one of the recent and relevant work was done by Semini et al. (2016) who used the
maritime cluster in Norway to examine characteristics of the local manufacturers and
how it impacts their competitive advantage.
Actually, this study was conducted upon the Global Competitiveness Index 2018.
Similar to the definition of competitiveness in the index, it was found that a nation
should be productive by having a strong complex of institutions and policies. The

85
indexes’ 12 pillars named as “productivity drivers” make the difference between
Russia and Norway. Firstly, Institutions in Russia are weaker and set not appropriate
context to organize activities of different parties. Secondly, Norway’s workforce is
better educated to be productive. The country’s modern educational methods allow
reaching higher productivity by fitting the market and, therefore, be easier
integrated into the work. Thirdly, labours in Russia are less sufficiently organized
meaning that they are not reorganized and administered and, therefore, cannot
realize their productivity potential as working units. Fourthly, Financial system of
Russia is not on the level of its counterpart. Norway is considered as more productive
because it has more available financial products. Finally, Russia lags behind
Innovation capability of Norway. It suggests that Norway is more competitive
because of its state that ensures the environment and set policies increasing the
outputs from R&D activities. (Schwab 2018.) All in all, the framework enabled the
author to investigate the background of the two nations’ competitiveness and come
up with the picture answering the research question. Hence, the GCI 2018 is found to
be useful in having a cross-country comparison with specific areas to focus, that can
concretely direct research.
Apart from that, this thesis results partly approve the words of Porter (1990) who
believes that the role of government is important as it set the environment by
different regulations thereby enhancing the nation’s competitiveness. However, he
sees the government as not the main player. (87.) The thesis results address the idea
of Moon, Rugman and Verbeke (1995, 110-112) who are sure that the government
role is not auxiliary but the paramount. Indeed, the higher competitiveness of
Norway was reached by more elaborated policies than in Russia. As a result, Norway
has higher output from innovation activities, stronger institutions, and businesses as
well as a more prepared workforce.
Limitations of the Research
The thesis has its limitations. To begin with, the research was based on the secondary
data available on the Internet, mainly in the forms of articles. It made the author to
interpret the findings on his own and make them fit the research context. Moreover,
some of the parts were challenging to analyse because of the lack of accessible data,
especially about Norway, since many of the sources are in the Norwegian language
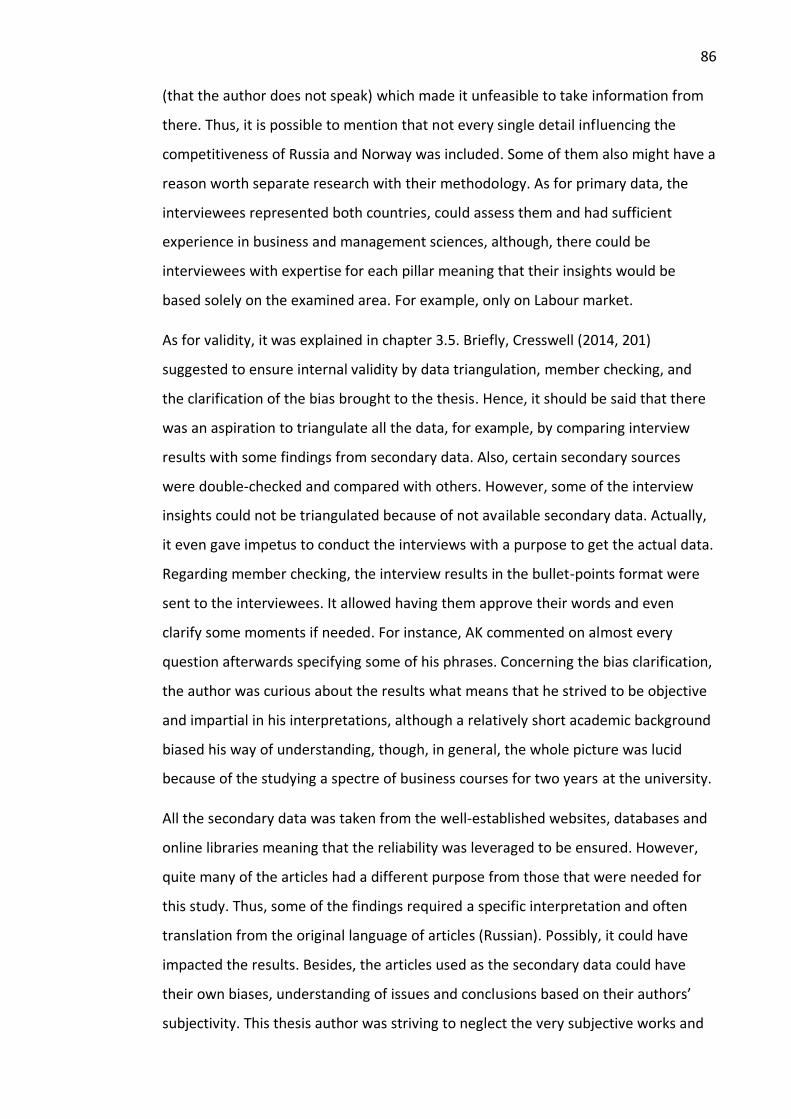
86
(that the author does not speak) which made it unfeasible to take information from
there. Thus, it is possible to mention that not every single detail influencing the
competitiveness of Russia and Norway was included. Some of them also might have a
reason worth separate research with their methodology. As for primary data, the
interviewees represented both countries, could assess them and had sufficient
experience in business and management sciences, although, there could be
interviewees with expertise for each pillar meaning that their insights would be
based solely on the examined area. For example, only on Labour market.
As for validity, it was explained in chapter 3.5. Briefly, Cresswell (2014, 201)
suggested to ensure internal validity by data triangulation, member checking, and
the clarification of the bias brought to the thesis. Hence, it should be said that there
was an aspiration to triangulate all the data, for example, by comparing interview
results with some findings from secondary data. Also, certain secondary sources
were double-checked and compared with others. However, some of the interview
insights could not be triangulated because of not available secondary data. Actually,
it even gave impetus to conduct the interviews with a purpose to get the actual data.
Regarding member checking, the interview results in the bullet-points format were
sent to the interviewees. It allowed having them approve their words and even
clarify some moments if needed. For instance, AK commented on almost every
question afterwards specifying some of his phrases. Concerning the bias clarification,
the author was curious about the results what means that he strived to be objective
and impartial in his interpretations, although a relatively short academic background
biased his way of understanding, though, in general, the whole picture was lucid
because of the studying a spectre of business courses for two years at the university.
All the secondary data was taken from the well-established websites, databases and
online libraries meaning that the reliability was leveraged to be ensured. However,
quite many of the articles had a different purpose from those that were needed for
this study. Thus, some of the findings required a specific interpretation and often
translation from the original language of articles (Russian). Possibly, it could have
impacted the results. Besides, the articles used as the secondary data could have
their own biases, understanding of issues and conclusions based on their authors’
subjectivity. This thesis author was striving to neglect the very subjective works and

87
carefully check some ideas with other sources and in the end taking only the most
reliable and objective works.
Important to allude, that the research was focused on two countries and compared
their indicators. It allowed making implications, which are based on Norwegian
successful cases, for policymakers and other possible contributors in Russia.
However, it should be understood that those implications are relevant only for the
context of this study meaning that the suggestions are not applicable to other
countries since their cases are different. As such, the results cannot and should not
be used for implications to other nations, only if they go through a similar approach
as in this thesis. Additionally, it is reasonable to say that the conclusions for Russian
policymakers may be difficult to implement due to the inevitable difference of the
countries. Their size, population, people’s mindset, and the current situations are
dissimilar. It can make barriers in integrating the same activities of Norway because
the changes will require systematic approaches, definite strategy, and
reconsideration of the previous policies. Finally, all of the practical implications are
written with a purpose to point to the issue and suggest solutions to consider, not
blindly follow them.
Suggestions for future studies
In this final part of the work, some recommendations for further researches are
provided, since the topic may be developed and considered from other perspectives
and examined in the future.
First of all, the thesis was concentrated not on all the pillars present in the Global
Competitiveness Index. Mainly, it is explained as not every single pillar, and its
subpillars should be considered as the most problematic area for Russia compared to
Norway, meaning that there is nothing to glean from Norway. Actually, the reason
for including all the pillars may be understood, since it will provide with a deeper
picture of the examined situation, especially because competitiveness, as it was
posited, is a multisyllabic issue. Therefore, there is an opportunity for future research
to compare every single Russian subpillar that is worse than Norwegian ones. It shall
provide with a broader picture, though it may take much more time for the study.

88
Apart from that, the area for the research may be more focused on a concrete pillar
derived from the index that will be considered as a specific area influencing the
competitiveness of a country. Russia has low figures in the Institutions pillar (see
Table 7). It raises an interesting question of how much Institutions of Russia has been
historically weakening competitiveness. The nation’s systematic problems come from
that imperfect institutions. Norway with its quite high ranking may be taken as a
counterpart to see a well-established example.
The findings of the study suggest developing a topic regarding the potential of SMEs
in strengthening the Russian economy as well as the competitiveness. Norway’s case
may also be considered for comparison; however, to have a more profound case,
some other countries should also be taken for the analysis.
What may positively contribute to Russia is a comparison with a country that had
similar problems but has been overpassing them after applying certain actions. It
should be helpful for Russia to develop by looking not on a historically successful and
finetuned country such as Norway but consider a nation that had demonstrated
significant development over a concrete period.
This thesis focused on Norway and Russia due to their natural resources’ similarity.
However, for Norway, in particular, in future investigations, it might be possible to
compare the country with a country similar in the culture such as a Scandinavian
nation that has higher competitiveness. For instance, Sweden with its close location,
resembling mindset and history may be an adequate counterpart. Denmark is also
sufficient for a study because of its alike characteristics and less distinctive
demographics. Besides, there is an opportunity to conduct a longitudinal study aimed
to observe the competitiveness tendencies of Norway and attempt to explore the
trends. The Global Competitiveness Index has been published for years and may be
the expedient framework allowing to see the historical directions.
Finally, it should be mentioned that the research is based on the framework dated to
the year 2018. It differs from the earlier Global Competitiveness Index and adjusted
to the new environment. Therefore, it is reasonable to compare both countries in the
future, once a new framework is developed, and to see did the reasons for Norway’s

89
competitiveness over Russia disappear, have they been strengthened, or maybe
there will be more obstacles emerged for Russia’s competitive extent.

90
References
Akpinar, M., & Mermercioglu, M. 2014. Benchmarking competitiveness and
innovation performances in two information technology clusters from Finland and
Turkey. Finnish Business Review. Accessed on 10 December 2018. Retrieved from
http://urn.fi/urn:nbn:fi:jamk-issn-2341-9938-3
Akpinar, M., Can, O., & Mermercioglu, M. 2017. Assessing the sources of
competitiveness of the US States. Competitiveness Review, 27 (2), 161–178.
Aksyutina, S. V. 2014. Strahovoi rynok RF: problemy i perspektivy. [Insurance market
of the RF: problems and prospectives]. Problemy Razvitiya Territorii, 2 (70), 115–126.
Accessed on 18 March 2019. Retrieved from
https://cyberleninka.ru/article/n/strahovoy-rynok-rf-problemy-i-perspektivy
Atkinson, R. 2013. Competitiveness, innovation and productivity: clearing up the
confusion. Article from ITIF website. Accessed on 12 November 2018. Retrieved from
https://itif.org/publications/2013/08/19/competitiveness-innovation-and-
productivity-clearing-confusion
Arkin, A. 2018. Norway's policies on media ownership and transparency, and media
pluralism make it "faultless" for press freedom. Article from Michigan State
University College, International Law Review website. Accessed on 8 March 2019.
Retrieved from https://www.msuilr.org/msuilr-legalforum-
blogs/2018/4/19/norways-policies-on-media-ownership-and-transparency-and-
media-pluralism-make-it-faultless-for-press-freedom
Average Salary Survey. 2019. Russia vs. Norway, salary comparison. Accessed on 1
April 2019. Retrieved from https://www.averagesalarysurvey.com/compare-
countries/russia-vs-norway
Balcarová, P. 2013. The comparison of nine-factor model and diamond model:
application for the Czech Republic, Slovakia and Hungary. Acta Academica
Karviniensia, 17, 5–15.
Balyakin, A. A., Zadorin, A. K., Kuklina, I. R., Malyshev, A. S., & Taranenko, S. B. 2018.
Positioning of international scientific and technical cooperation in the legal
91
documents of the countries participating in scientific globalization. RUDN Journal of
Sociology, 18 (4), 651—667. Accessed on 24 March 2019. Retrieved from
http://journals.rudn.ru/sociology
Bankovskiy, A., & Entyakova, A. 2018. Russia. Analysis from Intellectual Property
Review in The Law Reviews website. Accessed on 11 March 2019. Retrieved from
https://thelawreviews.co.uk/edition/1001177/the-intellectual-property-review-
edition-7
Barden, J. 2017. Russia export most of its crude oil production, mainly to Europe. Page
on U.S. Energy Information Administration website. Accessed on 17 January 2019.
Retrieved from https://www.eia.gov/todayinenergy/detail.php?id=33732
Barlett, L., & Vavrus F. 2017. Comparative case studies. Educacao & Realidade, Porto
Alegre, 42 (3), 899–918.
BCG. 2017. Russia 2025: resetting the talent balance. Accessed on 16 March 2019.
Retrieved from http://image-src.bcg.com/Images/russia-2015-eng_tcm26-
187991_tcm9-192725.pdf
Bisschop-Mørland, V., & Dagestad, H. 2019. Anti-corruption regulation. Page on
Getting the Deal Through website. Accessed on 10 March 2019. Retrieved from
https://gettingthedealthrough.com/area/2/jurisdiction/53/anti-corruption-
regulation-norway/
Bradshaw, M. 2008. The geography of Russia’s new political economy. New Political
Economy, 13 (2), 193–201.
Brinkmann, S. 2013. Qualitative interviewing. New York: Oxford University Press.
Brovkin, A. V. 2017. The issues of modern Russian system of higher education and
ways of their solution to the benefit of all participants of educational process: part 1.
Accessed on 16 March 2019. Retrieved from http://en.e-
notabene.ru/pp/article_25053.html
Brovkin, A. V. 2018. The issues of modern Russian system of higher education and
ways of their solution to the benefit of all participants of educational process: part 2.

92
Accessed on 16 March 2019. Retrieved from http://en.e-
notabene.ru/pp/article_26398.html
Brown, P. F. 2008. The effect of human rights on economic growth. Master’s thesis.
University of Oslo, Department of Economics, Degree Programme in Environmental
and Development Economics. Accessed on 9 December 2018. Retrieved from
https://www.duo.uio.no/bitstream/handle/10852/17533/Brown.pdf?sequence=2&is
Allowed=y
Bondarenko, I. S. 2007. Konkurentosposobnost strany i konkurentnye
preimuschestva: suschnost, metody otsenki. [Competitiveness of country and
competitive advantages: nature, assessment methods]. Production Economics, 3 (38),
25–31.
Business Sweden. 2014. Business Sweden in Norway. Page on Business Sweden
website. Accessed on 31 March 2019. Retrieved from https://www.business-
sweden.se/en/Trade/international-markets/europe/Norway/
Bykanova, N. I., & Cherashina, A. S. 2017. Strahovoi rynok Rossii: problemy i
napravleniya razvitiya. [Insurance market of Russia: problems and developments].
Young Scientists, 10 (144), 204–206. Accessed on 19 March 2019. Retrieved from
https://moluch.ru/archive/144/40382/
Candau, M. 2018. Russia’s economy: still dependent on oil. Article from Euractive
website. Accessed on 18 January 2019. Retrieved from
https://www.euractiv.com/section/energy-environment/news/russias-economy-still-
dependent-on-oil/
Central Intelligence Agency. N.d. The World Factbook. Norway. Page on CIA website.
Accessed 16 February 2019. Retrieved from
https://www.cia.gov/library/publications/the-world-factbook/geos/no.html
Chernysheva, T. C., & Novikova V. S. 2018. Intellectual property in the Russian
Federation: the essence, problems of implementation and prospects of
development. Nauchnye Zapiski Molodyh Issledovatelei, 2, 70–76. Accessed on 11
March 2019. Retrieved from https://cyberleninka.ru/article/n/intellektualnaya-

93
sobstvennost-v-rossiyskoy-federatsii-suschnost-problemy-realizatsii-i-perspektivy-
razvitiya
Chetyrkina, N. 2016. Konkurentosposobnost strany: priroda, istochniki i factory.
[Competitiveness of country: nature, sources and features]. Theory and Practice of
Social Development, 10, 51–55.
Chibisova, I. 2014. Otbor, naznachenie i prodvizhenie sudey: mezhdunarodnyi opyt i
mezhdunarodnye standarty. [Selection, assignment and promotion of judges:
international experience and international standards]. Sravnitelnoye kostitutsionnoye
obozrenie, 6. Accessed on 8 March 2019. Retrieved from
http://www.elibrary.az/docs/jurnal/jrn2014_747.pdf
Chief Justice Canada. 2017. The Decline of democracy and the rule of law: how to
preserve the rule of law and judicial independence? Page on the Supreme Court of
Canada. Accessed on 8 March 2019. Retrieved from https://www.scc-csc.ca/judges-
juges/spe-dis/bm-2017-09-28-eng.aspx#fnb6
Cho, D. S., & Moon, H. C. 2005. Extending the scope of international business to the
analysis of national competitiveness. 3rd Annual JIBS/AIB/CIBER Invitational
Conference. Accessed on 11 December 2018. Retrieved from
https://www.researchgate.net/publication/228843402_Extending_the_Scope_of_Int
ernational_Business_to_the_Analysis_of_National_Competitiveness
Cho, D. S., Moon, H. C., & Kim, M. Y. 2009. Does one size fit all? A dual double
diamond approach to country-specific advantages. Asian Business & Management, 8
(1), 83–102.
Cho, D. S., & Moon, H. C. 2013. From Adam Smith to Michael Porter: evolution of
competitiveness theory. Extended edition. Singapore: World Scientific Publishing.
Costanza, R., Hart, M., Posner, S., & Talberth, J. 2009. Beyond GDP: the need for new
measures of progress. The Pardee Papers, 4, 1–37.
Creswell, J. W. 2014. Research design: qualitative, quantitative and mixed methods
approaches. 4th ed. Thousand Oaks: SAGE Publications, Inc.

94
Damsa, C., de Lange, T., Elken, M., Esterhazy, R., Fossland, T., Frølich, N.,
Hovdhaugen, E., Maassen, P., Nerland, M. B., Nordkvelle, Y. T., Stensaker, B., Tømte,
C., Vabø, A., Wiers-Jenssen, J., & Aamodt, P. O. 2015. Quality in Norwegian Higher
Education. Report. Accessed 16 March 2019. Retrieved from
https://www.researchgate.net/publication/284323156_Quality_in_Norwegian_High
er_Education_A_review_of_research_on_aspects_affecting_student_learning
Datsenko, O. V. 2018. Ways of improvement of legal mechanisms combating
corruption. Problemy protivodeystviya korruptsii na gosudarstvennoi i munitsipal’noi
sluzhbe i puti ih resheniya v sovremennoi rossii, 2, 23–30. Accessed on 10 March
2019. Retrieved from
http://uriu.ranepa.ru/nauka/Сборник%2017.02.2018%20коррупция%20молодежь.
Delgado, M., Ketels, C. H. M., Porter, M. E., & Stern, S. 2012. The determinants of
national competitiveness. Working Paper No. 18249, National Bureau Economic
Research.
Dezhina, I. G. 2010. Menyayushiesya prioritety mezhdunarodnogo nauchno-
tekhnicheskogo sotrudnichestva Rossii. [Changing priorities of international scientific
technological cooperation of Russia]. Ekonomicheskaya Politika, 5, 143–155.
Accessed on 24 March 2019. Retrieved from
https://elibrary.ru/item.asp?id=15223439&
Dezhina, I. G. 2017. Science and innovation policy of the Russian government: a
variety of instruments with uncertain outcomes? Public Administration Issues, Special
Issue, 7–26. Accessed on 22 March 2019. Retrieved from
https://www.researchgate.net/publication/319332376_Science_and_innovation_pol
icy_of_the_Russian_government_A_variety_of_instruments_with_uncertain_outco
mes
Dobrovolskaya, A. Yu. 2014. Educational system in Norway: the modern realities.
Izvestia VPGU, 1 (262), 215–217. Accessed on 16 March 2019. Retrieved from
http://izvestia.vspu.ac.ru/izvestia_2014_v262_N1_en.html
95
Doolan, D. M., Winters, J., & Nouredini, S. 2017. Answering research questions using
an existing data set. Medical Research Archives, 5 (9), 1–14.
Dusa, S. 2014. Models of Competitiveness (I). Journal of Euro and Competitiveness, 1
(2), 1–12.
Dyngeland, A. 2016. Overview on anti-corruption rules and regulations in Norway.
Accessed on 10 March 2019. Retrieved from
http://www.ecba.org/extdocserv/projects/ace/20160114_ACE_CountryreportNorwa
y.pdf
Erikkson, P., & Kovalainen, A. 2016. Qualitative methods in business research: a
practical guide to social research. 2nd ed. London: SAGE Publications Ltd.
European Commission. N.d. Norway and its collaboration with the European
Commission’s in-house science service. Joint Research Centre. Materials from EC
website. Accessed on 22 March 2019. Retrieved from
https://ec.europa.eu/jrc/sites/jrcsh/files/jrc_country_leaflet_no_en.pdf
Eurostat. 2019. Vocational education and training statistics. Page on Eurostat
Statistics explained website. Accessed on 15 March 2019. Retrieved from
https://ec.europa.eu/eurostat/statistics-
explained/index.php?title=Vocational_education_and_training_statistics#Cost_of_co
ntinuing_vocational_training_courses
Federalnye Arbitrazhnye Sudy Rossiiskoi Federatsii. 2019. Trebovaniya,
predyavlyaemye k kandidatu na dolzhnost’ sud’i. Page on Federalnye Arbitrazhnye
Sudy Rossiiskoi Federatsii website. Accessed on 8 March 2019. Retrieved from
http://www.arbitr.ru/struct/staff/
Federalnaya sluzhba gosudarstvennoi statistiki. 2019. Demographiya [Demography].
Page on Russian Federal State Statistics Service website. Accessed on 17 February
2019. Retrieved from
http://www.gks.ru/wps/wcm/connect/rosstat_main/rosstat/ru/statistics/population
/demography/#
Federalnaya sluzhba gosudarstvennoi statistiki. 2019. Trudovye resursy [Labour
Force]. Page on Russian Federal State Statistics Service website. Accessed on 17
96
February 2019. Retrieved from
http://www.gks.ru/wps/wcm/connect/rosstat_main/rosstat/ru/statistics/wages/lab
our_force/
Federalnaya sluzhba gosudarstvennoi statistiki. 2018. Socialno-ekonomicheskoe
polozhenie Rossii [Socio-economic situation in Russia]. Page on Russian Federal State
Statistics Service website. Accessed on 6 March 2019. Retrieved from
http://www.gks.ru/bgd/regl/b18_01/Main.htm
Garelli, S. 2006. Top class competitors: how nations, firms, and individuals succeed in
the new world of competitiveness. Chichester: John Wiley & Sons.
Gonzalez, A. 2017. Global investment competitiveness: new insights on FDI. Blog on
The World Bank website. Accessed on 7 December 2018. Retrieved from
http://blogs.worldbank.org/psd/global-investment-competitiveness-new-insights-fdi
Goodrick, D. 2014. Comparative case studies. Methodological briefs: impact
evaluation 9. Florence: UNICEF Office of Research.
Gurban, I. A., & Tarasyev, A. A. 2016. Global trends in education: Russia case study.
IFAC-Papers Online 49, 6, 186–193. Accessed on 16 March 2018. Retrieved from
https://www.researchgate.net/publication/305716994_Global_trends_in_education
_Russia_case_study
Hall, R. E., & Jones, C. I. 1999. Why do some countries produce so much more output
per worker than others? The Quarterly Journal of Economics, 114 (1, 83–116.
Hanafi, M., Wibisono, D., Mangkusubroto, K., Siallagan, M., Jamilah, M., & Badriyah,
K. 2017. Modelling competitive advantage of nation: a literature review.
Competitiveness Review: An International Business Journal, 27 (4), 335–365.
Hancock, B., Ockleford, E., & Windridge, K. 2009. An introduction to qualitative
research. The NIHR RDS EM/YH. Accessed on 8 February 2019. Retrieved from
https://www.rds-yh.nihr.ac.uk/wp-content/uploads/2013/05/5_Introduction-to-
qualitative-research-2009.pdf
Hancock, D. R., & Algozzine, B. 2017. Doing case study research. 3rd ed. New York:
Teachers College Press.

97
Harvard University Center for Geographic Analysis. 2019. The Harvard WorldMap
project. Accessed on 16 February 2019. Retrieved from
https://worldmap.harvard.edu/maps/ecosystemedurable
Hese-Biber, S. N. 2016. The practice of qualitative research: engaging students in the
research process. Thousand Oaks: SAGE Publication Ltd.
HSE. 2018. Indikatory innovatsionnoi deyatelnosti: 2018. [Indicators of innovation
activities: 2018]. Accessed on 22 March 2019. Retrieved from
https://www.hse.ru/primarydata/ii2018
Irwin, S. 2013. Qualitative secondary data analysis: ethics, epistemology and context.
Progress in Development Studies 13 (4), 295–306.
Inshakova, A. O., & Kozhemyakin, D. V. 2013. Implementation of an effective
competition policy in the EU innovation through general intellectual property law.
Zakony Rossii: opyt, analiz, praktika, 2. Accessed on 12 March 2019. Retrieved from
https://elibrary.ru/item.asp?id=19110690
International Commission of Jurists. 2014. Russian Federation: independence and
impartiality; judicial integrity and accountability. Page on ICJ website. Accessed on 8
March 2018. Retrieved from https://www.icj.org/cijlcountryprofiles/russian-
federation/russian-federation-judges/russian-federation-independence-and-
impartiality-judicial-integrity-and-accountability-2/
IMF. 2015. Norway: financial sector assessment program - financial system stability
assessment. Report. Accessed on 1 April 2019. Retrieved from
https://www.imf.org/en/Publications/CR/Issues/2016/12/31/Norway-Financial-
Sector-Assessment-Program-Financial-System-Stability-Assessment-43263
IMF. 2018. Russian Federation: selected issues. Report. Accessed on 1 April 2019.
Retrieved from
https://www.imf.org/en/Publications/CR/Issues/2018/09/12/Russian-Federation-
Selected-Issues-46227
Islankina, E., & Thurner, T. 2018. Internationalization of cluster initiatives in Russia:
empirical evidence, entrepreneurship & regional development. Accessed on 20
March 2019. Retrieved from

98
https://www.researchgate.net/publication/324086773_Internationalization_of_clust
er_initiatives_in_Russia_empirical_evidence
Ivanov, V. G. 2016. Professional education: the destruction of the system or building
a new one? Scholarly Notes of Transbaikal State University. Series Pedagogy.
Psychology, 11 (2), 61–68. Accessed on 17 March 2019. Retrieved from
https://cyberleninka.ru/article/n/professionalnoe-obrazovanie-razrushenie-sistemy-
ili-vystraivanie-novoy
Ivković, A. F., & Strossmayer, J. J. 2016. Limitations of the GDP as a measure of
progress and well-being. Econviews, 1, 257–272.
Jakobsen, E. W., & Røtnes, R. 2012. Cluster Programs in Norway – Evaluation of The
NCE and Arena Programs. Menon Publication Nr. 1/2012. Accessed on 21 March
2019. Retrieved from https://www.menon.no/wp-content/uploads/19clusters-
programs-in-draft-final-report-jan-12-2.pdf
Johne, B. 2011. Norway’s scientific collaboration with USA and Canada. Accessed on
24 March 2019. Retrieved from
https://www.forskningsradet.no/no/Forsiden/1173185591033
Kachmazova, A. D. 2016. Rossiya v mezhdunarodnom nauchno-tekhnicheskom
sotrudnichestve. [Russia in international scientific technological cooperation].
Mirovaya Ekonomika v XXI Veke, 285–291. Accessed on 24 March 2019. Retrieved
from https://elibrary.ru/item.asp?id=27621710
Kazachenok, S. Yu. 2015. Intellectual property right of the United Europe. Vestnik
Volgogradskogo Gosudarstvennogo Universiteta, 3 (28), 35–38. Accessed on 12
March 2019. Retrieved from https://cyberleninka.ru/article/n/pravo-intellektualnoy-
sobstvennosti-obedinennoy-evropy
Ketels, C. 2016. Review of competitiveness frameworks. An analysis conducted for
the Irish National Competitiveness Council. Accessed on 12 November 2018.
Retrieved from
https://www.hbs.edu/faculty/Publication%20Files/Review%20of%20Competitivenes
s%20Frameworks%20_3905ca5f-c5e6-419b-8915-5770a2494381.pdf

99
Kitayov, Yu. A., & Pak, Z. Ch. 2015. Institut intellektual’noi sobstvennosti i ego rol’ v
ekonomicheskom razvitii Rossii. [Institution of intellectual property and its role in the
economic development of Russia]. Izvestiya Orengburskogo gosudarstvennogo
agragrnogo universtiteta, 205–208. Accessed on 11 March 2019. Retrieved from
https://cyberleninka.ru/article/n/institut-intellektualnoy-sobstvennosti-i-ego-rol-v-
ekonomicheskom-razvitii-rossii
Kolesnikov, V. V., Studenikina, L. A., & Shkatova, N. E. 2018. Problems of introduction
of ISA into Russian practice of audit. Uchenye Zapiski Tamboskogo Otdeleniya
RoSMU, 52–56. Accessed on 15 March 2019. Retrieved from
https://cyberleninka.ru/article/n/problemy-vvedeniya-msa-v-rossiyskuyu-praktiku-
audita
Kondrashov, A. A. 2015. Problemy realizatsii pricipa nezavisimosti sudey v rossii: ot
teorii k primenitelnoy praktikiki. [Problems of realization of the independence of
judges in Russia: from theory to practice]. Aktualnye Problemy Rossiiskogo Prava, 8
(57), 181–187. Accessed on 8 March 2019. Retrieved from
https://cyberleninka.ru/article/n/problemy-realizatsii-printsipa-nezavisimosti-sudey-
v-rossii-ot-teorii-k-pravoprimenitelnoy-praktike
Kommitet po trudu i zanyatnosti naseleniya sankt-peterburga. 2019. Sotsial’naya
podderzhka bezrabotnyh grazhdan. [Social support of unemployed population]. Page
on Committee on Labour and Employment of the population of St. Petersburg
website. Accessed on 15 March 2019. Retrieved from
http://rspb.ru/gosudarstvennye-uslugi/socialnaya-podderzhka-bezrabotnyh-
grazhdan/
Konsolas, I. 1999. The competitive advantage of nations: the case of Greece.
ProQuest Dissertations Publishing 17-20. Accessed on 7 December 2018. Retrieved
from http://etheses.lse.ac.uk/2514/1/U615463.pdf
Kornus, N. S., & Deryuga, A. N. 2018. Problema realizatsii principa nezavisimosti
sudey. [Problems of realization of the independence of judges]. Young Scientist, 12
(198), 111–113. Accessed on 8 March 2019. Retrieved from
https://moluch.ru/archive/198/48927/

100
Kotsemir M., Kuznetsova T., Nasybulina E., & Pikalova A. 2015. Identifying directions
for Russia’s science and technology cooperation. Foresight and STI Governance, 9 (4),
54–72. Accessed on 19 March 2019. Retrieved from
https://papers.ssrn.com/sol3/papers.cfm?abstract_id=3091709
KPMG. 2018. Obzor rynka strahovaniya v Rossii. [Review of insurance market in
Russia]. Accessed on 19 March 2019. Retrieved from
https://assets.kpmg/content/dam/kpmg/ru/pdf/2018/07/ru-ru-insurance-survey-
2018.pdf
Krasnova, G. A., & Polushkina, E. A. 2014. Development of System of continuous
education in Norway: state and prospects. Article. Accessed on 17 March 2019.
Retrieved from http://journals.tsu.ru/uploads/import/1080/files/55_054.pdf
Kritskaya, A. A., Kanskaya K. L., & Yanchenkova, T. A. 2018. Factors influencing the
formation and development of corruption crime in Russia. Problemy protivodeystviya
korruptsii na gosudarstvennoi i munitsipal’noi sluzhbe i puti ih resheniya v
sovremennoi Rossii, 2, 45–51. Accessed on 10 March 2019. Retrieved from
http://uriu.ranepa.ru/nauka/Сборник%2017.02.2018%20коррупция%20молодежь.
Krugman, P. 1994. Competitiveness: a dangerous obsession. Article from Foreign
Affairs website. Accessed on 12 November 2018. Retrieved from
https://www.foreignaffairs.com/articles/1994-03-01/competitiveness-dangerous-
obsession
Kubiszewski, I., Costanza, R., Franco, C., Lawn, P., Talberth, J., Jackson, T., & Aylmer,
C. 2013. Beyond GDP: measuring and achieving global genuine progress. Ecological
Economics, 93, 57–68.
Kutsenko, E. 2015. Pilot innovative territorial clusters in Russia: a sustainable
development model. Foresight-Russia, 9 (1), 32–55. Accessed on 20 March 2019.
Retrieved from
https://www.researchgate.net/publication/279274292_Pilot_Innovative_Territorial_
Clusters_in_Russia_A_Sustainable_Development_Model

101
Kuznetsov, E. B. 2017. National Report on Innovations in Russia-2016. Accessed on 22
March 2019. Retrieved from
https://www.rvc.ru/upload/iblock/c7b/RVK_innovation_2016_v3_eng.pdf
Laypanov U. M., & Borlakova T. M. 2018. Actual problems of application of
international audit standards in Russian practice. The Eurasian Scientific Journal, 1
(10), 1–6. Accessed on 13 March 2019. Retrieved from
https://esj.today/PDF/09ECVN118.pdf
Leightner, J. E. 2010. Are the forces that cause China's trade surplus with the USA
good? Journal of Chinese Economic and Foreign Trade Studies, 3 (1), 43–53.
Liu, D. Y., & Hsu, H. F. 2009. An international comparison of empirical generalized
double diamond model approaches to Taiwan And Korea. Competitiveness Review:
An International Business Journal, 19 (3), 160–174.
Martins, F., de Cunha, J., & Serra., F. 2018. Secondary data in research – uses and
opportunities. Iberoamerican Journal of Strategic Management, 17 (4), 1–4.
Maxwell, J. A. 2010. Using number in qualitative research. Qualitative Inquiry, 16 (6),
475–482.
Medvedeva, S. V. 2018. Problemy kachestva obrazovaniya v organizatsiyah sistemy
srednego professional’nogo obucheniya. [Problems of education quality in
organizations of vocational education]. Accessed on 17 March 2019. Retrieved from
https://nsportal.ru/npo-spo/metallurgiya-mashinostroenie-i-
materialoobrabotka/library/2018/03/24/problemy-kachestva
Minfin Rossii. 2018. Osnovnye pokazateli rynka auditorskih uslug v Rossiiskoi
Federatsii. [The main indicators of auditing services in Russian Federation]. Page on
Minfin Rossii website. Accessed on 13 March 2019. Retrieved from
https://www.minfin.ru/ru/perfomance/audit/audit_stat/MainIndex/
Ministerstvo Energetiki Rossiiskoi Federatsii. 2018. Page on Ministerstvo Energetiki
Rossiiskoi Federatsii website. Accessed on 20 January 2019. Retrieved from
https://minenergo.gov.ru/node/910

102
Modig, I. 2018. This Is Norway 2018. What the figures say. Statistics Norway.
Accessed on 16 February 2019. Retrieved from
https://www.ssb.no/en/befolkning/artikler-og-publikasjoner/this-is-norway-2018
Moon, H. C., Rugman A. M., & Verbeke, A. 1995. The generalized double diamond
approach to international competitiveness. Beyond the Diamond, Research in Global
Strategic Management, 5, 97–114.
Moon, H. C., Rugman A. M., & Verbeke, A. 1998. A generalized double diamond
approach to the global competitiveness of Korea and Singapore. International
Business Review, 7, 135–150.
Moon, H. C. 2006. Competition and cooperation between Korea and Japan: a
business perspective. Manufacturing Management Research Center, Discussion
Paper, 65.
Moore Stephens Norway DA. 2012. Doing Business in Norway – an introduction.
Accessed on 31 March 2019. Retrieved from http://www.scott-
moncrieff.com/assets/publications/Doing_business_in_Norway.pdf
Muižnieks, N., Hammarberg, T., & Gil-Robles, Á. 2016. As long as the judicial system
of the Russian Federation does not become more independent, doubts about its
effectiveness remain. Article from Council of Europe website. Accessed on 8 March
2019. Retrieved from https://www.coe.int/en/web/commissioner/-/as-long-as-the-
judicial-system-of-the-russian-federation-does-not-become-more-independent-
doubts-about-its-effectiveness-remain
Muller, L., Lammer-Gamp, T., zu Kocker, G. M., & Christensen, T. A. 2012. Clusters are
individuals, updated report new findings from the European cluster management and
cluster program benchmarking, 2. Copenhagen: The Danish Ministry of Science
Innovation and Higher Education. Accessed on 21 March 2019. Retrieved from
https://www.cluster-
analysis.org/downloads/ClustersareIndividualsVolumeIIAnnex.pdf
Naumenko, D. S. 2018. Corruption in the Russian Federation and the role of the
prosecutor's office in the fight against it. Problemy protivodeystviya korruptsii na
gosudarstvennoi i munitsipal’noi sluzhbe i puti ih resheniya v sovremennoi Rossii, 2,

103
64–75. Accessed on 10 March 2019. Retrieved from
http://uriu.ranepa.ru/nauka/Сборник%2017.02.2018%20коррупция%20молодежь.
Nerovnya Yu. V., Romanov D. G., & Shirshov V. Yu. 2018. Development trends for the
insurance industry in Russia. European Research Studies Journal, 11 (2), 474– 484.
Accessed on 19 March 2019. Retrieved from
https://search.proquest.com/docview/2162695342?pq-origsite=gscholar
NIFU. 2016. Nordic R&D expenditure diverges in 2015. Accessed on 22 March 2019.
Retrieved from https://brage.bibsys.no/xmlui/handle/11250/2420749
NIFU. 2018. R&D statistics and indicators. Oslo: Nordic institute for studies in
Innovation, Research and Education. Accessed on 22 March 2019. Retrieved from
https://www.nifu.no/en/statistics-indicators/nokkeltall/fou-lommefolder/
Nikel, D. 2017. Teaching jobs in Norway. Page on Life in Norway website. Accessed
on 16 March 2019. Retrieved from https://www.lifeinnorway.net/teaching/
Nikolaev, D., & Chugunov, D. 2012. The education system in the Russian Federation.
Washington: The World Bank. Accessed on 17 March 2019. Retrieved from
http://documents.worldbank.org/curated/en/115261468296678354/The-education-
system-in-the-Russian-Federation-education-brief-2012
Norges Bank. 2017. Norway’s financial system: an overview. Accessed on 19 March
2019. Retrieved from https://www.norges-
bank.no/en/Published/Publications/norways-financial-system/2017/
Norwegian Ministry of Education and Research. 2013. Research in Norway. Accessed
on 24 March 2019. Retrieved from
https://www.regjeringen.no/contentassets/12490ae3fbf746eaad2c6b2abd78a14f/br
ochure-research-in-norway-2013.pdf
Norwegian Ministry of Foreign Affairs. 2014. Opportunities for all: human rights in
Norway’s foreign policy and development cooperation. Report to the Storting. Paper
from Norwegian Government Security and Service Organisation website. Accessed on
10 March 2019. Retrieved from https://www.regjeringen.no/en/dokumenter/meld.-
st.-10-2014-2015/id2345623/

104
NRA. 2017. Analiticheskiy obzor: strahovoi rynok Rossii v 2017 godu. [Analytical
review: insurance market in Russia in 2017]. Accessed on 19 March 2019. Retrieved
from http://www.ra-
national.ru/sites/default/files/analitic_article/Insurance%20market%20of%20Russia
%202017.pdf
Norge.ru. 2019. Norvezhskiye kompanii v Rossii. [Norwegian companies in Russia].
Page from Norge.ru website. Accessed on 15 March 2019. Retrieved from
http://www.norge.ru/work_norwayburo/
Norwegian Strategy for Skills. 2017. Report. Accessed on 15 March 2019. Retrieved
from https://www.regjeringen.no/en/dokumenter/norwegian-strategy-for-skills-
policy-2017---2021/id2527271/
Njøs, R. & Jakobsen, S. 2015. Cluster policy and regional development: scale, scope
and renewal. Regional Studies, Regional Science, 3 (1), 146–169. Accessed on 21
March 2019. Retrieved from
https://rsa.tandfonline.com/doi/full/10.1080/21681376.2015.1138094#.XJPEbS2B1Q
I
O’Gorman, K., & MacIntosh, R. 2015. Research methods for business and
management: a guide to writing your dissertation. 2nd ed. Oxford: Goodfellow
Publishers Limited.
OECD. 2015. SMEs and entrepreneurship in the Russian Federation. Russian
Federation: key issues and policies. Paris: OECD Publishing. Online book. Accessed on
22 March 2019. Retrieved from
https://books.google.fi/books?id=c0S8CgAAQBAJ&pg=PA153&lpg=PA153&dq=loans
+smes+russia&source=bl&ots=wnvio9HerQ&sig=ACfU3U1hM-B7FUIl9aCCvt0QGKv-
5dAZFg&hl=en&sa=X&ved=2ahUKEwjr5JqOhJbhAhUu2aYKHeMhDNI4ChDoATADegQI
BxAB#v=onepage&q=loans%20smes%20russia&f=false
OECD. 2017. OECD reviews on innovation policy: Norway 2017. Paris: OECD
Publishing. Accessed on 23 March 2019. Retrieved from https://read.oecd-
ilibrary.org/science-and-technology/oecd-reviews-of-innovation-policy-norway-
2017_9789264277960-en#page1
https://www.regjeringen.no/en/dokumenter/norwegian-strategy-for-skills-policy-2017---2021/id2527271/

105
OECD. 2018. Higher education in Norway: labour market relevance and outcomes.
Paris: OECD Publishing. Online book. Accessed on 16 March 2019. Retrieved from
https://books.google.fi/books?id=bsJeDwAAQBAJ&pg=PA107&lpg=PA107&dq=norw
ay+graduate+labour+market&source=bl&ots=p6lTpJtZLK&sig=ACfU3U1nsW85ctRHW
5x3CmAVer3JBZIa6Q&hl=en&sa=X&ved=2ahUKEwian5-
v1ofhAhUHxosKHcWTBk8Q6AEwBXoECAQQAQ#v=onepage&q&f=false
OECD. 2018. Pisa 2015: results in focus. Accessed on 16 March 2019. Retrieved from
https://www.oecd.org/pisa/pisa-2015-results-in-focus.pdf
OECD. N.d. Data. Page on OECD website. Accessed on 16 February 2019. Retrieved
from https://data.oecd.org
Phuntgtua, W. 2016. A study on national competitiveness, using the single diamond,
generalized diamond, generalized double diamond (GDD, and dual double diamond
(DDD) Approaches. EAU Heritage Journal Social Science and Humanities, 6 (2), 21–33.
Podkolzina, I. M. 2016. Insurance market at the present stage: relevant risks and
threats. economic analysis: theory and practice, 7, 57–64. Accessed on 19 March
2019. Retrieved from https://cyberleninka.ru/article/n/strahovoy-rynok-na-
sovremennom-etape-aktualnye-riski-i-ugrozy
Porter, M. E. 1990. The competitive advantage of nations. Harvard Business Review,
March-April Issue, 73–91.
Porter, M. E. 2000. Location, competition, and economic development: local clusters
in a global economy. Economic Development Quarterly, 14, 15–34.
Porter, M. E., Delgado, M., Ketels, C., & Stern, S. 2008. The Global Competitiveness
Index 2008-2009: moving to a new Global Competitiveness Index, in Porter, M. E., &
Schwab, K. The Global Competitiveness Report 2008-2009. World Economic Forum,
Geneva, 43–63.
Porter, M. E., Stern, S., & Green, M. 2017. Social Progress Index 2017. Social Progress
Imperative 2017.

106
Queirós, A., Faria, D., & Almeida, F. 2017. Strengths and limitations of qualitative and
quantitative research methods. European Journal of Education Studies, 3 (9), 369–
387.
RAEX. 2018. Kreditovaniye malogo i srednego biznessa v Rossii po Itogam 2017 goda:
rost vopreki statistike. [Lending to SMEs in Russia in 2017: Growth despite Statistics].
Accessed on 22 March 2019. Retrieved from
https://raexpert.ru/researches/banks/frb_2017_itog
Ramoniene, L., & Lanskoronskis, M. 2011. Reflection of higher education aspects in
the conception of national competitiveness. Baltic Journal of Management, 6 (1),
124–139.
Reve, T., & Sasson, A. 2015. Theoretical and methodological advances in cluster
research. Competitiveness Review, 25 (5), 524–539.
Rodionova, I., Krejdenko, T., & Madry, C. 2018. Cluster policy in the Russian
Federation: a case study of industrial clusters. Quaestiones Geographicae, 37 (2), 61–
75. Accessed on 20 March 2019. Retrieved from
https://www.researchgate.net/publication/324477183_Cluster_Policy_in_the_Russi
an_Federation_A_Case_Study_of_Industrial_Clusters
Rosstat. 2018. Russian Statistical Yearbook 2018. Accessed on 16 March 2019.
Retrieved from
http://www.gks.ru/wps/wcm/connect/rosstat_main/rosstat/ru/statistics/publication
s/catalog/doc_1135087342078
Rusten, G., & Hermelin, B. 2017. Cross-sector collaboration in upper secondary
school vocational education: experiences from two industrial towns in Sweden and
Norway. Journal of Education and Work, 30 (8), 813-826. Accessed on 17 March
2019. Retrieved from https://www.tandfonline.com/loi/cjew20
Røtnes, R., Norberg-Schulz, M., Rybalka, M., Walbækken, M., M., Ibenholt, K.,
Hakansson, A., & Izsak, K. 2017. Evaluation of Norwegian innovation clusters. Report
76-2017. Accessed on 21 March 2019. Retrieved from
https://www.researchgate.net/publication/322661475_Evaluation_of_Norwegian_In
novation_Clusters

107
Sala-I-Martin, X., Blanke, J., Hanouz, M. D., Geiger, T., Mia, I., & Paua, F. 2007. The
Global Competitiveness Index: measuring the productive potential of nations, in
Porter, M. E. & Schwab, K. The Global Competitiveness Report 2008-2009. World
Economic Forum, Geneva, 3–40.
Samans, R. 2017. Preface, in Schwab, K. & Sala-I-Martin, X. The Global
Competitiveness Report 2017–2018. World Economic Forum, Geneva, v.
Sasson, A. 2011. Knowledge based health. Research Report 4/2011. Oslo: Nordberg.
Sasson, A., & Reve, T. 2012. Competitiveness as industrial attractiveness:
operationalizing the emerald model. Microeconomics of Competitiveness Research
Workshop, Harvard Business School, Boston, MA, 10 December.
Sassen, S. 2011. An emerging global market: trends, consequences and challenges.
Harvard International Review, 33 (2), 48–53.
Saunders, M., Lewis, P., & Thornhill, A. 2009. Research methods for business
students. 5th ed. Essex: Pearson Education Limited.
Savchina, O. V., Bobkov, A. L., Ezenkina, K. U., & Kalashnikova, I. A. 2016. SME lending
in the conditions of economic instability: peculiarities and development prospects.
International Journal of Environmental & Science Education 11 (18), 11621-11633.
Accessed on 22 March 2019. Retrieved from http://ijese.net/makale/1622
Schwab, K. 2016. The fourth industrial revolution: what it means, how to respond.
Article from WEF website. Accessed on 14 December 2018. Retrieved from
https://www.weforum.org/agenda/2016/01/the-fourth-industrial-revolution-what-
it-means-and-how-to-respond/
Schwab, K. 2018. The Global Competitiveness Index Report 2018. World Economic
Forum website. Accessed on 7 November 2018. Retrieved from
http://reports.weforum.org/global-competitiveness-report-2018/
Segundo, J. C., Espina, M. I., & Tinoco-Egas, R. M. 2017. Strategies and
competitiveness for emerging countries: a comparative study among three South-
American countries. International Journal of Emerging Markets, 12 (1), 125–139.

108
Semini, M., Brekken, H., Swanh, N., Alfnes, E., & Strandhagen, J. O. 2016. Global
Manufacturing and How Location in Norway May Give Factories a Competitive
Advantage. Article on Research Gate website. Accessed on 26 January 2019.
Retrieved from
https://www.researchgate.net/publication/311320820_Global_manufacturing_and_
how_location_in_Norway_may_give_factories_a_competitive_advantage/stats
Sheremet, A. D. 2018. Nekotorye problemy razvitiya audita v Rossii. [Some problems
in the development of audit in Russia]. Article on GAAP website. Accessed on 13
March 2019. Retrieved from
https://gaap.ru/articles/Nekotorye_problemy_razvitiya_audita_v_Rossii1/
Shiryaev, D. V., Litvinenko I. L., Rubtsova, N. V., Kolpak E. P., Blaginin V. A., &
Zakharova E. N. 2016. Economic clusters as a form of self-organization of the
economic system. International Journal of Economics and Financial Issues, 6, 284–
288.
Silverman, D. 2011. Interpreting Qualitative Data. 4th ed. London: SAGE Publications
Ltd.
Souto-Otero, M., & Ure, O., D. 2011. The coherence of vocational education and
training in Norway and Spain: national traditions and the reshaping of vet
governance in hybrid VET systems. Compare: A Journal of Comparative and
International Education, 42 (1), 91–111. Accessed on 17 March 2019. Retrieved from
https://www.researchgate.net/publication/233131335_The_coherence_of_vocation
al_education_and_training_in_Norway_and_Spain_National_traditions_and_the_res
haping_of_VET_governance_in_hybrid_VET_systems
Statistics Norway. 2018. Employment, register-based. Page on Statistics Norway
website. Accessed on 16 February 2019. Retrieved from
https://www.ssb.no/en/arbeid-og-lonn/statistikker/regsys
Statistics Norway. 2018. Facts about education in Norway 2019 – key figures 2017.
Accessed on 16 March 2019. Retrieved from
https://www.ssb.no/en/utdanning/artikler-og-
publikasjoner/_attachment/373651?_ts=16813a35da0

109
Statistics Norway. 2019. External trade in goods. Page on Statistics Norway website.
Accessed on 16 February 2019. Retrieved from
https://www.ssb.no/en/utenriksokonomi/statistikker/muh/aar
Stenvik, A. 2016. Norway analysis from intellectual property. Review in The Law
Reviews website. Accessed on 11 March 2019. Retrieved from
https://thelawreviews.co.uk//digital_assets/5933634f-1908-4067-8f63-
61067a56f35e/The-Intellectual-Property-Review-5th-Ed.pdf
Stepanov, V. 2018. Issledovaniya WEF i partnerov: technologii stanut prichinoi
ischeznoveniya 75 millionov rabochih mest. [Research of WEF and partners:
technologies will be a reason of disappearance of 75 million of workplaces]. Page on
CNews website. Accessed on 15 March. Retrieved from
http://www.cnews.ru/news/line/2018-09-
17_issledovanie_vef_i_partnerov_tehnologii_stanut
Stiglitz, E., & Greenwald, C. 2014. Creating a learning society: a new approach to
growth development, and social progress. New York: Columbia University Press.
Storozhenko, A. A. 2018. The need to apple international audit standards in Russia.
The territory of new opportunities. The Herald of Vladivostok State University of
Economics and Service, 10 (2), 206–215. Accessed on 13 March 2019. Retrieved from
https://cyberleninka.ru/article/n/neobhodimost-primeneniya-mezhdunarodnyh-
standartov-audita-v-rossii
Stuken, T. Yu. 2015. Internal Training of personnel: motives of employees and
employers. Vestnik Omskogo universiteta. Seriia “Ekonomika”, 4, 170–176. Article
from Cyberleninka database. Accessed on 15 March 2019. Retrieved from
https://cyberleninka.ru/article/n/vnutrifirmennoe-obuchenie-personala-motivy-
rabotnikov-i-rabotodateley
van den Heuvel, F. P., de Langen, P. W., van Donselaar, K. H., & Fransoo, J. C. 2012.
Proximity matters: synergies through co-location of logistics establishments. BETA
Publicatie: Working Papers, 387. Eindhoven: Technische Universiteit Eindhoven.
https://cyberleninka.ru/article/n/neobhodimost-primeneniya-mezhdunarodnyh-standartov-audita-v-rossii

110
The Courts of Norway. 2019. The judges. Page on The Courts of Norway website.
Accessed on 8 March 2019. Retrieved from https://www.domstol.no/en/The-
criminal-court-proceedings/who-is-involved/The-judges/
The Observatory of Economic Complexity. 2019. Norway. Page on OEC website.
Accessed on 17 February 2019. Retrieved from
https://atlas.media.mit.edu/en/profile/country/nor/
The Observatory of Economic Complexity. 2019. Russia. Page on OEC website.
Accessed on 17 February 2019. Retrieved from
https://atlas.media.mit.edu/en/profile/country/rus/
Trading Economics. N.d. Norway exports by country. Page on Trading Economics
website. Accessed on 16 February 2019. Retrieved from
https://tradingeconomics.com/norway/exports-by-country
Travkin, P. V. 2017. Professional’noye pereobucheniye. [Professional retraining]. In V.
Gimpelson, P. Kapelyushnikova, & S. Roschina (Eds.), Rossiiskiy rynok truda:
Tendentsii, instituty, strukturnye izmeneniya. [Russian labour market: tendencies,
institutions, structural changes]. Accessed on 15 March 2019. Retrieved from
https://www.csr.ru/issledovaniya/rossijskij-rynok-truda/
Triantafyllou, S. 2014. Evaluation of the competitiveness and the business
environment of Russian Federation: challenges and perspectives. Master Thesis.
University of Macedonia, Department of Balkan, Slavic and Oriental Studies.
Accessed on 19 January 2019. Retrieved from
https://dspace.lib.uom.gr/handle/2159/16826
Trudovoi Kodeks RF. 2019. Stat’ya 196 TK RF. Accessed on 15 March 2019. Retrieved
from http://tkodeksrf.ru/ch-3/rzd-9/gl-31/st-196-tk-rf
World Economic Forum Annual Meeting. 2019. Keeping Russia competitive. Video
from the World Economic Forum website. Accessed on 3 March 2019. Retrieved from
https://webcasts.weforum.org/widget/1/davos2019?p=1&pi=1&th=1&hl=english&id
=a0W0X00000DHzrXUAT

111
World Travel & Tourism Council. Travel & tourism economic impact Norway 2018.
Country report on WTTC website. Accessed on 17 February 2019. Retrieved from
https://www.wttc.org/economic-impact/country-analysis/country-reports/
Workman, D. 2019. Russia’s top trading partners. Page on World’s Top Exports
website. Accessed on 17 February 2019. Retrieved from
http://www.worldstopexports.com/russias-top-import-partners/
Yakovets, Yu. V., Konchenkova, T. N., & Rastvortsev, E. E. 2018. Chelovek i mirovoi
naucho-technicheskiy progress. [Human and global scientific technical progress], in
Analytic Centre of the Russian Federation Chelovek i Innovatsii, [Human and
Innovations]. Accessed on 23 March 2019. Retrieved from
http://ac.gov.ru/files/publication/a/19663.pdf
Zadorina, M. A. 2017. Problemy modernizatsii srednego professional’nogo
obrazovaniya (na primere Sverdlovskoi oblasti). [Promlems of modernization of
secondary vocational education (case study of Sverdlovkaya oblast)]. Accessed on 17
Macrh 2019. Retrieved from https://www.sgu.ru/sites/default/files/conf/files/2017-
03/zadorina_mariya_andreevna_ekaterinburg.pdf
Zakem, V., Saunders, P., Hashidova, U., & Hammerberg, P. K. 2018. Mapping Russian
media network: media’s role in Russian foreign policy and decision-making. Article
from CNA online publications archive. Accessed on 9 March 2019. Retrieved from
https://www.cna.org/research/2018
Zemtsov, S. P., Pavlov, P. N., & Sorokina, A. V. 2016. Specifics of cluster policy in
Russia. Equilibrium. Quarterly Journal of Economics and Economic Policy, 11 (3), 499-
536. Accessed on 20 March 2019. Retrieved from
https://www.researchgate.net/publication/309583763_Specifics_of_Cluster_Policy_i
n_Russia
2012. Michael Porter on competitiveness. YouTube video. The Economist 26
November 2012. Accessed on 12 November 2018. Retrieved from
https://www.youtube.com/watch?v=Ul_kXIFdwQE
2013. Norway business law handbook: strategic information and laws. Int'l business
publications. Online book available version on Google Books. Accessed on 10 March.
https://www.sgu.ru/sites/default/files/conf/files/2017-03/zadorina_mariya_andreevna_ekaterinburg.pdf

112
Retrieved from
https://books.google.fi/books?id=Mv7PW2mVUYQC&dq=property+rights+norway&s
ource=gbs_navlinks_s
2015. Statoil calls off ‘Songa Trym’ contract. News from Offshore Energy Today
website. Accessed on 5 December 2018.
https://www.offshoreenergytoday.com/statoil-calls-off-songa-trym-contract/
2016. Michael Porter: Why measuring social progress matters. YouTube video.
Skoll.org 18 April 2016. Accessed on 7 December 2018. Retrieved from
https://www.youtube.com/watch?v=XpNQcoI1JUY
2018. Employment in the petroleum industry. Page on Norwegian Petroleum website.
Accessed on 20 January 2019. Retrieved from
https://www.norskpetroleum.no/en/economy/employment/
2018. Macroeconomic indicators for the petroleum sector. Page on Norwegian
Petroleum website. Accessed on 20 January 2019. Retrieved from
https://www.norskpetroleum.no/en/economy/governments-revenues/
Global Year Statistical Yearbook 2018. N.d. Page on The Enerdata Yearbook website.
Accessed on 17 January 2019. Retrieved from
https://yearbook.enerdata.net/natural-gas/world-natural-gas-production-
statistics.html
Production of crude oil including lease condensate. N.d. Page on Knoema website.
Accessed on 16 January 2019. Retrieved from
https://knoema.com/atlas/topics/Energy/Oil/Production-of-crude-oil

113
Appendices
Appendix 1. Prepared questions for the interview with AM
1. Позиция Норвегии в уровне развития кластеров достаточна высока. Легко можно вспомнить нефтяной центр (один из самых развитых в мире), металлический кластер, морской и так далее. Также известно, что существуют программы, направленные на развитие кластеров разных уровней. Что бы вы выделили основными факторами высокого уровня развития?
2. Россия отстает от 94 стран в рейтинге. Как бы вы объяснили столь скромный показатель?
3. У Норвегии высокий показатель международных со-изобретений. Что способствует такой кооперации между норвежцами и иностранцами?
4. У России этот показатель на 64.4 меньше. Почему со-изобретений так мало и что нужно предпринять, дабы улучшить ситуацию?
5. Каковы основные причины такого большего числа заявок на патенты и товарные знаки в Норвегии?
6. Чем обусловлено такое малое количество патентных и заявок на товарные знаки в России?
7. Как вы считаете, почему Норвегия имеет высокий показатель затрат (с точки зрения и государства, и частного сектора) на НИОКР?
8. У России показатель 37.7 из 100. Государство играет огромную роль, выделяя средства на НИОКР в основной мере. Почему бизнес так мало выделяет денег на эти цели?
9. Что движет норвежскими компаниям, когда они инвестируют в повышение квалификации их сотрудников, развитие их навыков и тренинги?
10. Результат показывает, что, чтобы получить должность, очень часто нужно быть родственников или другом. В связи с этим топ менеджеры российских компаний воспринимаются как ненадежные. Какие проблемы за этим стоят и считаете ли вы, что картину можно изменить?
11. Какие основные факторы в получении высшей должности в Норвегии? Упирается ли все в сознание людей?
12. Как вы считаете, почему выпускники норвежских обр. уч. соответствуют современным нуждам бизнеса, работодателя?
13. Почему норвежским компаниям удается так легко найти людей, соответствующих их профессиональным нуждам?
Translated version:
1. Norway’s position is quite high in State of cluster development. It is known that the country has one of the most developed oil hubs in the world. Also, we may distinguish other clusters like maritime or metal, etc. How Norway reached its level of development?

114
2. Russian position is less than 94 countries present in the ranking. How can you explain such low figure?
3. Norway’s score is high in international co-inventions. What makes Norway be so collaborative with foreigners?
4. Russia has 66.4 less in the score of international co-inventions. Why the number is so low and what should be done in Russia to increase the number of its international co-inventions?
5. What are the reasons behind such a big number of patent and trademark applications in Norway?
6. What problems you may distinguish in such a small number of applications in Russia?
7. Why do you think Norway have big R&D expenditures? 8. Now Russia has 37.7/100 in the score of R&D expenditures? What policies,
frameworks should emerge and be followed to increase it? 9. What makes Norwegian companies invest in the development skills of their
current employees? 10. What are the key factors in getting a top management position in Norway? 11. Why Russian top management seem as not reliable? The result shows that
top managers in Russia get their positions because of friendships or relationship. How the picture may be changed?
12. Why Norwegian graduates fit to current business needs? 13. Why Norwegian companies may easily find people who will fit their business
needs?
Appendix 2. Prepared questions for the interview with AK
1. Как бы вы объяснили такие сильные и надежные стандарты аудита в Норвегии?
2. В чем причина такого высоко обеспечения займами и кредитами в частном секторе Норвегии?
3. Почему российский частный сектор испытывает трудности в получении займов, кредитов?
4. Как вы считаете, в чем причина высокого доступа МСП к необходимым для бизнеса финансам?
5. Что нужно изменить, чтобы обеспечить российские МСП необходимым финансированием?
6. Какие факторы можно выделить в надежности норвежских банков? 7. Каковы основные проблемы ненадёжности российских банков? 8. Что движет норвежскими компаниям, когда они инвестируют в
повышение квалификации их сотрудников, развитие их навыков и тренинги?
9. Результат показывает, что чтобы получить должность, очень часто нужно быть родственников или другом. В связи с этим топ менеджеры российских компаний воспринимаются как ненадежные. Какие проблемы за этим стоят и считаете ли вы, что картину можно изменить?
10. Какие основные факторы в получении высшей должности в Норвегии?

115
11. Как вы считаете, почему выпускники норвежских обр. уч. соответствуют современным нуждам бизнеса, работодателя?
12. Почему норвежским компаниям удается так легко найти людей, соответствующих их профессиональным нуждам?
13. Как вы думаете, почему в Норвегии отношения между работником и работодателем охарактеризованы как более доверительные и сотруднические, чем в России?
14. Каковы основные причины такого большего числа заявок на патенты и товарные знаки в Норвегии?
15. Как вы считаете, почему Норвегия имеет высокий показатель затрат (с точки зрения и государства, и частного сектора) на НИОКР?
16. У Норвегии высокий показатель международных со-изобретений. Что способствует такой кооперации между норвежцами и иностранцами?
17. У России этот показатель на 64.4 меньше. Почему со-изобретений так мало, и что нужно предпринять, дабы улучшить ситуацию?
Translated version:
1. What are the reasons behind such strong auditing and reporting standards in Norway?
2. What are the main regulations, trends or reasons allowing to have such a high figure in provision private sector with a credit?
3. Why Russian private sector is poorly provided with loans, trade credits and other account receivables?
4. How you can explain the high access of local SMEs to finance that they need for their business activities through financial sector?
5. What should be changed in Russia to provide the SMEs with access to finance for their business?
6. What factors influence on the high soundness of Norwegian banks? 7. What are the main problems behind Russian banks’ low soundness? 8. What makes Norwegian companies invest in the development skills of their
current employees? 9. Why do you think Russian top management seem as not reliable? The result
shows that top managers in Russia get their positions because of friendships or relationship. How the picture may be changed?
10. What are the key factors in getting a top management position in Norway? 11. Why Norwegian graduates fit to current business needs? 12. Why Norwegian companies may easily find people who will fit their business
needs? 13. Why the relationship between an employee and a worker in Norway is
characterized as more trust-based and collaborative than in Russia? 14. What are the reasons behind such a big number of patent and trademark
applications in Norway? 15. Why Norway have big R&D expenditures? 16. Norway’s score is high in international co-inventions. What makes Norway be
so collaborative with foreigners?

116
17. Russia has 66.4 less in the score of international co-inventions. Why the number is so low and what should be done in Russia to increase the number of its international co-inventions?