Strengthening the Export Competitiveness of Pakistan's ...
110
A STRENGTHENING THE EXPORT COMPETITIVENESS OF PAKISTAN’S TOWEL AND TERRY MADE-UPS SECTOR SEPTEMBER 2020 Strengthening the Export Competitiveness of Pakistan’s Towels and Terry Made-ups Sector Make-in-Pakistan Series
-
Upload
khangminh22 -
Category
Documents
-
view
1 -
download
0
Transcript of Strengthening the Export Competitiveness of Pakistan's ...

ASTRENGTHENING THE EXPORT COMPETITIVENESS OF PAKISTAN’S TOWEL AND TERRY MADE-UPS SECTOR
SEPTEMBER 2020
Strengthening the Export Competitiveness of Pakistan’s Towels and Terry Made-ups SectorMake-in-Pakistan Series


iSTRENGTHENING THE EXPORT COMPETITIVENESS OF PAKISTAN’S TOWEL AND TERRY MADE-UPS SECTOR
STRENGTHENING THE EXPORT COMPETITIVENESS OF PAKISTAN’S TOWELS AND TERRY MADE-UPS SECTOR
SEPTEMBER 2020
Make-in-Pakistan Series

ii
TABLE OF CONTENTS
• Acknowledgement ..................................................................................................................................ix
• The Pakistan Business Council: An Overview ..........................................................................................xii
• The PBC’s Founding Objectives ................................................................................................................xiii
• PBC Member Companies .........................................................................................................................xiv
• Acronyms ................................................................................................................................................xvi
• Executive Summary ................................................................................................................................1
• Introduction .............................................................................................................................1
• Study Objectives .......................................................................................................................1
• Analysis and Findings ...............................................................................................................2
• Chapter 1: Economic Significance of Pakistan’s Textile Industry and the Global Textile Trade .................9
• Global Supply of Textiles ...........................................................................................................9
• Major Players in the International Textile Trade .........................................................................9
• Composition of World Textile Exports .......................................................................................11
• Pakistan’s Textile Exports .........................................................................................................12
• Composition of Pakistan’s Textile Exports .................................................................................12
• Share of Textiles in Pakistan’s Economy ....................................................................................13
• Foreign Direct Investment in Textiles (Net Inflows) ....................................................................14
• Export Competitiveness: Textiles .............................................................................................14
• Chapter 2: Changing Dynamics of Global Towel Trade and the Emerging Markets ...................................16
• Chapter 3: The Terry Towel Value Chain ...................................................................................................23
• Terry Towel ...............................................................................................................................23
• Lack of Integration and Suboptimal Value Addition Affects the Value Chain for Growth ..............25
• Chapter 4: Study Methodology ...............................................................................................................31
• Chapter 5: Pakistan’s Towel Exports ........................................................................................................32
• HS Codes and Description ........................................................................................................34
• Tariff and Non-Tariff Barriers faced by Pakistan .......................................................................35
• Export Concentration and Lack of Market Diversification ..........................................................36
• Potential Export Markets and Opportunities for Market Expansion ............................................37
• Stagnant Export Growth as compared to Regional Peers ..........................................................44

iiiSTRENGTHENING THE EXPORT COMPETITIVENESS OF PAKISTAN’S TOWEL AND TERRY MADE-UPS SECTOR
• Lower Unit Prices as compared to Competitors ........................................................................46
• GSP-Plus ..................................................................................................................................47
• Free Trade Agreements have not helped Pakistan increase its Exports
of Towels & Towel made-ups .....................................................................................................48
• Chapter 6: Industry View on Enhancing Export Competitiveness of Pakistan’s Towel Sector ..................49
• 1. Supply-side and Productivity Constraints ..............................................................................49
• 2. Ineffective Market Expansion Strategies for Trade Promotion ...............................................58
• 3. Business Environment and Trade Related Issues ..................................................................60
• 4. Socio-Economic and Environment Issues .............................................................................67
• Chapter 7: Performance of Pakistan’s Major Competitors in Towels and
Terry Made-ups Segment ........................................................................................................................69
• Chapter 8: Government Support in Pakistan for the Textile Sector ..........................................................78
• Chapter 9: Recommendations .................................................................................................................79
• References ..............................................................................................................................................82
• Annexures ..............................................................................................................................................86

iv
List of Tables
• Table 1-1 Top Exporters of Textiles, 2009-18 .............................................................................10
• Table 1-2 Top Importers of Textiles, 2009-18 .............................................................................10
• Table 1-3 Composition of World Textile Exports .........................................................................11
• Table 1-4 Composition of Pakistan’s Textile Exports ..................................................................13
• Table 1-5 Contribution of Textiles to the National Economy .......................................................13
• Table 2-1 Top 10 Exporters of Towels .........................................................................................18
• Table 2-2 Towel Products sold in the International Market .........................................................20
• Table 2-3 Top 10 Importers of Towels ........................................................................................21
• Table 2-4 World Imports of Towels ............................................................................................22
• Table 4-1 Division of Towel Manufacturers Operating in Pakistan ...............................................31
• Table 5-1 Major Destinations for Pakistan’s Towel Exports .........................................................32
• Table 5-2 List of HS Codes ........................................................................................................34
• Table 5-3 Tariffs faced by Pakistan, 2019 ...................................................................................35
• Table 5-4 Non-Tariff Barriers (NTBs) faced by Pakistan .............................................................35
• Table 5-5 Region wise Pakistan’s Exports of Towels, 2018 ..........................................................36
• Table 5-6 Top 10 Potential Markets on the basis of Untapped Export Potential ..........................37
• Table 5-7 Pakistan’s Export Share in World Imports of Towels, 2018 ...........................................38
• Table 5-8 Potential Markets and Competitors for 630260 ..........................................................39
• Table 5-9 Tariff and Unit Price for 630260 .................................................................................39
• Table 5-10 Potential Markets and Competitors for 630710 ..........................................................40
• Table 5-11 Tariff and Unit Price for 630710 .................................................................................40
• Table 5-12 Potential Markets and Competitors for 630299 .........................................................41
• Table 5-13 Tariff and Unit Price for 630299 ................................................................................41
• Table 5-14 Potential Markets and Competitors for 630291 ..........................................................42
• Table 5-15 Tariff and Unit Price for 630291 .................................................................................42
• Table 5-16 Potential Markets and Competitors for 630293 .........................................................43
• Table 5-17 Tariff and Unit Price for 630293 ................................................................................43
• Table 5-18 Comparison of EU Import Shares for Towels and Terry Made-ups .............................47
• Table 5-19 Concession on Towels & Towel made-ups under Trade Agreements .........................48
• Table 6-1 Area, Production and Yield of Cotton ..........................................................................49

vSTRENGTHENING THE EXPORT COMPETITIVENESS OF PAKISTAN’S TOWEL AND TERRY MADE-UPS SECTOR
• Table 6-2 Duties on Raw Cotton and Cotton Yarn .......................................................................50
• Table 6-3 Working Time and Wages in the Textile Sector ...........................................................53
• Table 6-4 Labour Productivity, 2017...........................................................................................54
• Table 6-5 Import of Chemicals and Dyes ...................................................................................56
• Table 6-6 Import of Textile Machinery .......................................................................................57
• Table 6-7 Installed Capacity in the Textile Sector .......................................................................58
• Table 6-8 Comparative Statement of Customs Drawback of Local Taxes and Levies (DLTL) ......60
• Table 6-9 Ease of Financing in Competitor Countries ................................................................63
• Table 6-10 Doing Business Comparison .....................................................................................63
• Table 6-11 Doing Business Ranking ............................................................................................65
• Table 6-12 Comparison of Global Competitiveness Indicators – 2019 ..........................................65
• Table 6-13 Components of Logistics Performnace Index (Rank, 2018) ........................................66
• Table 6-14 Global Business Complexity Index, 2018 ....................................................................67
• Table 7-1 Tariffs Applied by Pakistan’s main Export Destinations on China (%) .............................. 70
• Table 7-2 Non-Tariff Barriers (NTBs) faced by China ..................................................................70
• Table 7-3 Tariffs Applied by Pakistan’s main Export Destinations on India (%) .............................. 72
• Table 7-4 Non-Tariff Barriers (NTBs) faced by India ...................................................................73
• Table 7-5 Tariffs Applied by Pakistan’s main Export Destinations on Bangladesh (%) .................... 74
• Table 7-6 Non-Tariff Barriers (NTBs) faced by Bangladesh .........................................................74
• Table 7-7 Tariffs Applied by Pakistan’s main Export Destinations on Viet Nam (%)......................76
• Table 7-8 Non-Tariff Barriers (NTBs) faced by Viet Nam .............................................................76
• Table 7-9 Export Performance of Cambodia, 2010-19 ................................................................77
• Table 7-10 Tariffs Applied by Pakistan’s main Export Destinations on Cambodia (%) ..................... 77
• Table 7-11 Non-Tariff Barriers (NTBs) faced by Cambodia ...........................................................77
• Table 9-1 Effect of Covid-19 on World Cotton Yield.....................................................................78
• Table A-1 List of Towel Manufacturers Interviewed ....................................................................86
• Table A-2 Top potential markets ...............................................................................................88
• Table A-3 Stage-wise Visible and Invisible Wastage ..................................................................89

vi
List of Figures
• Figure 1-1 Overview of Global Trade in Textiles ...........................................................................9
• Figure 1-2 Share of Textile Exports in Total Exports...................................................................12
• Figure 1-3 Foreign Direct Investment (Net Inflows) Trend for Textiles .........................................14
• Figure 1-4 Components of Pakistan’s Relative World Market Shares in Textiles, 2012-16 .............15
• Figure 1-5 Components of Relative Change of World Market Shares in Textiles, 2012-16 .............15
• Figure 2-1 Top Producers of Towels, 2018 ..................................................................................16
• Figure 2-2 Top Consumers of Towels, 2018 ................................................................................16
• Figure 2-3 Trends in World Trade of Towels, 2009-18 .................................................................17
• Figure 2-4 Global Export Performance in 2018: Towels and Towel Made-ups ..............................19
• Figure 3-1 Parts of a Towel ........................................................................................................23
• Figure 3-2 Global Fibre Production (Million Metric Tons) ............................................................25
• Figure 3-3 Structure of Cotton Value-Addition at Each Stage ....................................................25
• Figure 3-4 Structure of Cotton Value-Addition ..........................................................................26
• Figure 3-5 Ring Spinning ...........................................................................................................26
• Figure 3-6 Cotton Sliver ............................................................................................................26
• Figure 3-7 Cross-section of a Towel through the Warp ..............................................................28
• Figure 3-8 Flow Chart of Terry Weaving .....................................................................................28
• Figure 4-1 Towel Hub of Pakistan ..............................................................................................31
• Figure 5-1 Actual Export Markets of Towels and Towel Made-ups, 2018 ......................................33
• Figure 5-2 Export Concentration, 2018 ......................................................................................36
• Figure 5-3 Regional Diversification of Towel Exports, 2009-18...................................................36
• Figure 5-4 Export Performance in 2018 .....................................................................................45
• Figure 5-5 Comparison of Unit Values, 2018 ..............................................................................46
• Figure 5-6 Towels: As share of Pakistan Exports and EU Imports ..............................................47
• Figure 6-1 Global Demand for Cotton vs MMF Towels, 2001-18 ....................................................51
• Figure 6-2 Pakistan Imports of Staple Fibres along with Duties Levied by the Government ........52
• Figure 6-3 Imports of PSF and Viscose by Emerging Competitors in 2018 ..................................52
• Figure 6-4 Minimum Monthly Wages in US$ Market Exchange Rate ...........................................54
• Figure 6-5 Level and Gender Wise Existing Skilled Workforce in the Textile Sector ....................55
• Figure 6-6 Pakistan Real Effective Exchange Rate ....................................................................61

viiSTRENGTHENING THE EXPORT COMPETITIVENESS OF PAKISTAN’S TOWEL AND TERRY MADE-UPS SECTOR
• Figure 6-7 Comparison of Real Effective Exchange Rate (REER) ................................................62
• Figure 6-8 Comparison of Logistics Performance Index (LPI), 2018 ............................................66
• Figure 7-1 Export Performance of China, 2010-19 ......................................................................70
• Figure 7-2 Export Performance of India, 2010-19 .......................................................................72
• Figure 7-3 Export Performance of Bangladesh, 2010-19 ............................................................74
• Figure 7-4 Export Performance of Viet Nam, 2010-19 ................................................................75

viii

ixSTRENGTHENING THE EXPORT COMPETITIVENESS OF PAKISTAN’S TOWEL AND TERRY MADE-UPS SECTOR
Acknowledgement
The Pakistan Business Council (PBC) extends its sincerest gratitude
to the Towel Manufacturers’ Association of Pakistan (TMA), and
especially its Secretary-General Mr. Muhammad Muzammil Hussain,
for helping us reach out to the members of the TMA and for scheduling
interviews with key members of the TMA.

x

xiSTRENGTHENING THE EXPORT COMPETITIVENESS OF PAKISTAN’S TOWEL AND TERRY MADE-UPS SECTOR
Research Team
Team Leader: Samir S. Amir
Lead Researcher: Nida Gulzar Siddiqui
Disclaimer
The findings, interpretations and conclusions expressed do not necessarily reflect the views of the Board of Directors and Members of the Pakistan Business Council or the companies they represent.
Any conclusions and analysis based on the data from ITC Trade Map, ITC Market Access Map, Pakistan Bureau of Statistics, Federal Board of Revenue, Ministry of Finance, the World Bank and World Integrated Trade Solution are the responsibility of the author(s) and do not necessarily reflect the opinion of the ITC, the World Bank, or the Government of Pakistan. Although every effort has been made to cross-check and verify the authenticity of the data, the Pakistan Business Council, or the author(s), do not guarantee the data included in this work. All data and statistics used are correct as of 27th March, 2020 and may be subject to change.
For any queries or feedback regarding this report, please contact [email protected] or [email protected]

xii
The Pakistan Business Council: An Overview
The Pakistan Business Council (PBC) is a business policy advocacy platform, established in 2005 by 14 (now 82) of Pakistan’s largest private-sector businesses and conglomerates, including multinationals. PBC businesses cover nearly all sectors of the formal economy. It is a professionally-run organization headed by a full-time chief executive officer.
The PBC is a not-for-profit entity, registered under Section 42 of the Companies Ordinance 1984. Though it is not required under the law to do so, the PBC follows to the greatest extent possible, the Code of Corporate Governance as applicable to listed companies.
The PBC is a pan-industry advocacy group. It is not a trade body nor does it advocate for any specific business sector. Rather, its key advocacy thrust is on easing barriers to allow Pakistani businesses to compete in regional and global arenas. The PBC conducts research and holds conferences and seminars to facilitate the flow of relevant information to all stakeholders in order to help create an informed view on the major issues faced by Pakistan.
The PBC works closely with relevant government departments, ministries, regulators and institutions, as well as other stakeholders including professional bodies, to develop consensus on major issues which impact the conduct of business in and from Pakistan. The PBC has submitted key position papers and recommendations to the government on legislation and other government policies affecting businesses. It also serves on various taskforces and committees of the Government of Pakistan as well as those of the State Bank, the SECP and other regulators with the objective to provide policy assistance on new initiatives and reforms.

xiiiSTRENGTHENING THE EXPORT COMPETITIVENESS OF PAKISTAN’S TOWEL AND TERRY MADE-UPS SECTOR
The PBC’s Founding Objectives
• To provide for the formation and exchange of views on any question connected with the conduct of business in and from Pakistan.
• To conduct, organize, set up, administer and manage campaigns, surveys, focus groups, workshops, seminars and fieldwork for carrying out research and raising awareness in regard to matters affecting businesses in Pakistan.
• To acquire, collect, compile, analyze, publish and provide statistics, data analysis and other information relating to businesses of any kind, nature or description and on opportunities for such businesses within and outside Pakistan.
• To promote and facilitate the integration of businesses in Pakistan into the World economy and to encourage in the development and growth of Pakistani multinationals.
• To interact with governments in the economic development of Pakistan and to facilitate, foster and further the economic, social and human resource development of Pakistan.

xiv
PBC Member Companies

xvSTRENGTHENING THE EXPORT COMPETITIVENESS OF PAKISTAN’S TOWEL AND TERRY MADE-UPS SECTOR
Packages Limited

xvi
Acronyms
APTMA All Pakistan Textile Mills Association
ATC Agreement on Textiles and Clothing
ATUFS Amended Technology Up-gradation Fund Scheme
AVE Ad Valorem Equivalent
CAGR Compound Annual Growth Rate
CD Custom Duty
CETP Common Effluent Treatment Plants
COVID-19 Corona Virus Disease – 2019
CSR Corporate Social Responsibility
DLTL Drawback of Local Taxes and Levies
EDF Export Development Fund
EFS Export Finance Scheme
EGPF Export Growth Project Finance
EHS Environment, Health and Safety
EOBI Employees’ Old-Age Benefits Institution
EPB Export Promotion Bureau
EPI Export Potential Indicator
EPZ Export Processing Zones
FBR Federal Board of Revenue
FDI Foreign Direct Investment
FOB Free on Board
GDP Gross Domestic Product
GIDC Gas Infrastructure Development Cess
GOTS Global Organic Textile Standard
GST General Sales Tax
ICT Information and Communications Technology
ILO International Labour Organization
IMF International Monetary Fund
ITC International Trade Centre
KORUS United States – Korea Free Trade Agreement
LPI Logistics Performance Index
LTFF Long-Term Financing Facility
MEG Mono Ethylene Glycol
MFA Multi-Fibre Arrangement
MMBTU Metric Million British Thermal Unit
MOP Margin of Preference

xviiSTRENGTHENING THE EXPORT COMPETITIVENESS OF PAKISTAN’S TOWEL AND TERRY MADE-UPS SECTOR
MPI Market Penetration Index
Ne Number English a method for Yarn Count or Cotton Count
NTB Non-Tariff Barriers
PBS Pakistan Bureau of Statistics
PCGA Pakistan Cotton Ginners Association
PCT Pakistan Customs Tariff
PM Prime Minister
POP Persistent Organic Pollutants
PRAL Pakistan Revenue Automation Limited
PSF Polyester Staple Fibre
PSW Pakistan Single Window
PTA Purified Terephthalic Acid
REER Real Effective Exchange Rate
RPM Revolution Per Minute
SBP State Bank of Pakistan
SEDEX Supplier Ethical Data Exchange
SEZ Special Economic Zones
SITP Scheme for Integrated Textile Park
SME Small and Medium Enterprise
SMEDA Small and Medium Enterprises Development Authority
SPV Special Purpose Vehicle
SWIFT Single Window Interface for Facilitation of Trade
TDAP Trade Development Authority of Pakistan
TERF Temporary Economic Refinance Facility
TISF Textile Investment Support Fund
TMA Towel Manufacturers’ Association
TPI Trade Performance Index
TUF Technology Upgradation Fund
UPC Universal Product Code
VTI Vocational Training Institutes
WRAP Worldwide Responsible Accredited Production
WTO World Trade Organization
YOY Year-Over-Year

xviii

1STRENGTHENING THE EXPORT COMPETITIVENESS OF PAKISTAN’S TOWEL AND TERRY MADE-UPS SECTOR
Executive Summary
Introduction
Pakistan is deindustrializing prematurely. The share of manufacturing in Pakistan’s GDP decreased from a high of 14.8 percent in 2008 to 13.2 percent in 2019.1 Ideally, the share of manufacturing in the GDP of a developing country like Pakistan should reach 28.0 percent to 30.0 percent before its contribution begins to decline.
The premature deindustrialization of Pakistan is contributing to an increase in Pakistan’s trade deficit. With the country deindustrializing, the share of exports in GDP has gone down from 13.0 percent in 2006 to 8.7 percent in 2019. Additionally, Pakistan’s share in global exports went down from 0.16 percent in 2005 to 0.13 percent in 2019. Pakistan hasn’t kept up with global demand for manufactured/value-added products.
The textile sector is a major manufacturing and export sector for Pakistan. To begin the process of reversing the premature deindustrialization of Pakistan and for increasing the contribution of manufacturing in GDP, it is important to start with a sector in which Pakistan has a global presence.
As part of PBC’s Make-in-Pakistan initiative, an initiative which aims to revive manufacturing in Pakistan, leading to jobs, an increase in value-added exports, import-substitution initially of labor-intensive products and an increase in tax collection. The PBC has published reports on the Knitted Apparel and Denim Apparel sectors with the purpose of identifying key impediments to achieving export competitiveness.
This report titled “Strengthening the Export Competitiveness of Pakistan’s Towels and Terry Made-ups Sector” is part of the PBC’s Make-in-Pakistan series and relies on existing secondary research supplemented with field interviews of firms in the towel industry.
Study Objectives
• Understand the current state of Pakistan’s towel industry. • Study the global towel market and identify key players. • Compare Pakistan’s performance with that of its competitors such as China, India, Bangladesh and Viet
Nam. • Identify factors affecting the export competitiveness of Pakistan’s towel exporters. • Review the initiatives taken by the government to support the towel industry. • Provide policy recommendations aimed at improving industry and firm-level competitiveness of
Pakistan’s towel industry.
1 Ministry of Finance (2020). Pakistan Economic Survey (2019-20).

2
Analysis and Findings
Economic Significance of Pakistan’s Textile Industry and the Global Textile Trade
The global trade in textiles was worth $837.48 billion in 2018. In 2018, global trade in textiles grew by 6.1 percent over 2017 and was worth $837.5 billion.
Pakistan ranked as the tenth-largest textile exporter in 2018. China was the largest global textile exporter in 2018, with exports of $266.4 billion or 31.8 percent of the global market. The EU was the second-largest exporter with exports in 2018 of $215.9 billion or 25.8 percent. Pakistan at number 10 had a share of 1.6 percent of the global trade in textiles and exports of $13.7 billion.
The European Union (EU) was the largest importer of textiles in 2018. The EU, with imports of $282.9 billion and a share of 37.5 percent, was the most significant global importer of textiles in 2018. The EU’s share in global textile imports was more than double that of the second-largest importer – the United States of America, which had imports of $119.4 billion or a 15.8 percent share in 2018.
The category of towels and textile made-ups has a meager share of the global textile trade. With a 1.3 percent share, the category of towels and textile made-ups commands an insignificant share in global textiles. With a 57.4 percent share, Apparel has the biggest share in global textiles, followed by Cotton (Raw, Waste, Yarn, Thread & Cloth, etc) (7.2 percent), Arts Silk Synthetic Textiles (5.3 percent) and Yarn other than cotton (4.1 percent).
A significant portion of Pakistan’s exports comprises of textiles. In 2018, textiles contributed 59.9 percent to Pakistan’s exports. Pakistan’s total exports of textiles in calendar 2018 amounted to $13.7 billion.
In made-ups, the towel subsector commands the second-largest share after bedware in terms of exports. In 2018, Cotton (Raw, Waste, Yarn, Thread & Cloth) was the major contributor at 25.4 percent to Pakistan’s textile exports. Knitted garments contributed 20.7 percent while woven apparel contributed a further 18.5 percent to Pakistan’s textile group exports. Bedware was the fourth largest export in the textile group contributing 16.6 percent. In made-ups, the towel’s subsector commands the second-largest share after bedware in terms of exports with a 9.6 percent share.
Textiles are a major contributor to the domestic economy. In 2018, textiles contributed 8.5 percent to the GDP, 25.0 percent to industrial value-addition and employed 40.0 percent of the industrial labor force. Moreover, the textile sector had a significant impact on large-scale manufacturing with the highest value of 20.91 of Quantum Index Manufacturing (QIM).2
Foreign Direct Investment (FDI) in textiles is low. Though a major contributor to both exports and the domestic economy, the share of textile specific FDI was only 4.6 percent in FY19.
Low Export Competitiveness. Trade Performance Index (TPI) provides indicators on the decomposition of the country’s change in world market shares to measure international competitiveness. The adaptation effect in Pakistan’s textile sector is low as compared to Bangladesh and Viet Nam. This suggests that Pakistan has not been able to export products that have a growing demand or to adapt to world demand changes.
2 An index number that purports to show the changes in quantity, usually of goods produced, sold or purchased, independently of changes in
prices or money values.

3STRENGTHENING THE EXPORT COMPETITIVENESS OF PAKISTAN’S TOWEL AND TERRY MADE-UPS SECTOR
Changing Dynamics of Global Towel Trade and the Emerging Markets
World exports of towels and terry made-ups increased three-fold from 2001 to 2018. Global exports of textiles and towels have increased substantially after the end of the MFA quota regime. Exports of towels fell by 11.4 percent in 2009. However, the most significant growth rate was recorded in 2011, with an increase of 19.2 percent y-o-y. World exports of towels and terry made-ups increased three-fold from 2001 to 2018, to reach $10.9 billion, representing about 0.1 percent of the world exports in 2018.
Pakistan ranked as the second-largest towel exporter in 2018. China has been a dominant player in this sector since 2001. China, with exports of $4.7 billion, dominated the global market for towels in 2018. China’s exports have been continuously increasing, and the export values are much larger than those of competitors, accounting for nearly 43.0 percent of the sector’s total exports in 2018. China’s CAGR has been 1.7 percent for the last five years. Pakistan has been ranked as the second-largest exporter of towels with exports of $1.3 billion in 2018. Pakistan’s CAGR has been 1.3 percent for the last five years.
If Pakistan does not maintain the same rate of progress as our competitors, our export share in global trade will continue to decline. The MFA shaped global competitiveness for many countries, and in Pakistan’s case, only 20-25 companies were able to export in the MFA phase. In the post-quota regime, many exporters, especially SME’s, took time to get on track. Despite the significant exports of towels, Pakistan lags behind its peers. Bangladesh exports grew from $91.9 million in 2006 (post MFA) to $275.1 million (an increase of $183.2 million) in 2018. Similarly, Viet Nam exports grew from $96.6 million in 2006 to $306.4 million (an increase of $209.8 million) in 2018. The increased use of MMF in textile products has stimulated growth in both Bangladesh and Viet Nam.
Pakistan is the second-largest import sourcing market for the EU and third-largest for the US. The EU, with imports of $3.2 billion or 34.4 percent of global imports, was the largest market for towels in 2018. The EU’s imports from Pakistan in 2018 were worth $0.43 billion. The United States of America was the second-largest importer with imports worth $3.0 billion, followed by Japan at number three, with imports of $0.7 billion.
Pakistan should tap non-traditional markets. Although the US and the EU have remained the top markets with stable imports, they are experiencing a slowdown in demand, as shown by their CAGRs (2014-18). Pakistan is the second-largest import sourcing market for the EU, with a share of 13.5 percent and the US with a share of 24.6 percent. It would be better for Pakistan to tap non-traditional markets such as the Russian Federation, Chile, Korea and Mexico for market expansion. These markets have witnessed higher growth over 2014–18, as shown by their CAGRs (2014-18).
The Terry Towel Value Chain and Pakistan’s Towel Exports
Lack of Integration and Suboptimal Value Addition Affects the Value Chain for Growth. Towel value chain comprises the following segments: provision of inputs, ginning, spinning, weaving, wet processing, finishing (stitching and packing) and finished towels. Figure 3-3 shows the structure of the cotton value chain. Since spinning and weaving are capital-intensive industries and towel industry is labour-intensive, the ratios in terms of the number of jobs created per unit at each stage will increase. This is only possible when value-added exports are achieved and competitive prices are offered. Starting with 1kg of raw cotton at $1.65/kg price offered by the spinning sector in 2017-18, the weaving stage adds another $0.98/kg. Similarly, as we move along the value chain of cotton, the finishing stage adds another $1.25/kg, converting the cotton yarn into the finished towel. The final price of the cotton towel offered in 2017-18 was $3.88/kg. Insufficient cotton production has created a significant gap in the value chain. Therefore, Pakistan seems to have moved upward but with a marginal rate of cotton value addition. These numbers give some idea of the impact on export earnings and job creation if Pakistan can add value to the production of cotton towels.

4
The towel group comprises of a number of products. A wide range of products like bath towels, table linen, kitchen linen, bathrobes, bar mops, dishcloths, floorcloths, face towels, washcloths, terry gloves are produced and exported in different sizes and shapes depending upon customers’ requirements. Towels are woven on dobby looms with two warp systems – one is the ground warp and it creates the framework of the towel and the other is the pile warp and it forms the pile loops and thus two warp beams are let off simultaneously. The intersection of weft and warp creates woven fabric. The pile yarn is loosely threaded into the woven fabric and when this loose filler yarn is pressed or beaten into the fabric, the slack is pushed up and forms a little loop of the terry cloth.
Pakistan has underperformed in exports of Towels. Pakistan is the second-largest exporter of towels and terry made-ups, after China, with total exports amounted to $1.3 billion in 2018. China dominated the global market in 2018, with exports of $4.7 billion, which is nearly four times that of Pakistan.
Tariff and Non-Tariff Barriers faced by Pakistan. Even though Multi-Fibre Arrangement (MFA) prescribed a quota regime for the textile industry in the developing countries for decades and was completely phased out in 2005 by the WTO Agreement on Textiles and Clothing (ATC), there are still tariff and non-tariff barriers faced by Pakistan. Pakistan’s exports of towels and terry made-ups are subject to tariff barriers in the developed countries that range from 5 percent to 17 percent.
Pakistan’s towel exports are highly concentrated in a few destination markets. Almost 58.0 percent of the towels produced were exported to the United States in 2018. Moreover, among the top export markets, eight major buyers belonged to Europe, with a total share of 30.2 percent. The remaining 12 percent belong to the rest of the world with very small export shares. From a regional perspective, countries in North America are the largest markets for Pakistani towels, contributing 59.11 percent share to the total towels and towel made-ups exports. European markets, including countries not in the EU, claim another 33.31 percent share.
Potential Export Markets and Opportunities for Market Expansion. The Export Potential Indicator (EPI) shows the products that the country exports and the diversification opportunities of existing products with additional exports in the target market. It is the extent to which a country can increase exports to a particular potential market given its supply capacities, demand conditions of the target market and market access feasibilities. The difference between the actual and potential exports is indicated as the untapped export potential. Pakistan can tap an additional $614.62 million in the towels and terry made-ups sector. The markets with the highest potential for Pakistan’s exports of towels and terry made-ups are Germany, France, Japan, China, the United Kingdom and Spain, with additional exports potentials worth $79.70 million, $44.62 million, $26.87 million, $25.71 million, $40.30 million and $32.14 million respectively.
Stagnant Export Growth as compared to its Regional Peers. Despite high global demand, Pakistan exports are losing market share. This is reflected by low export growth of Pakistan over 2014–18 as compared to its competitors’. Smaller countries like Viet Nam and Bangladesh have recently succeeded in capturing more significant market shares. The fastest export growth in ‘Toilet linen and kitchen linen, of terry towelling or similar terry fabrics of cotton (excluding floorcloths, polishing cloths, dishcloths and dusters)’ (HS-630260) and ‘Toilet linen and kitchen linen of cotton (excluding of terry fabrics, floor cloths, polishing cloths, dishcloths and dusters)’ (HS-630291) respectively was shown by Viet Nam (6.57 and 5.89 percent) and Bangladesh (4.39 and 5.99 percent). It is evident that Pakistan lags its Asian peers. Unlike Pakistan, these countries have integrated high-quality dyes and polyester and other man-made fibre yarns into their towel value chains.
Lower Unit Prices as compared to Competitors. Pakistan fetches the lowest average unit prices for all products under the towels and terry made-ups category. A detailed comparison of Pakistan’s current exports and unit values in potential markets as compared to its competitors shows that Pakistan is not the top exporter even in markets where it has the lowest per-unit value. This indicates that Pakistan’s competitors have added value to their towels and terry made-ups such that they are able to fetch higher prices.

5STRENGTHENING THE EXPORT COMPETITIVENESS OF PAKISTAN’S TOWEL AND TERRY MADE-UPS SECTOR
The EU GSP-Plus. In 2018, Pakistan exported $433.4 million out of its total towels and terry made-ups of $1,328.6 million (32.1 percent) to the EU, a 5 percent increase from 2014. However, Pakistan’s exports of towels as a share of the EU imports from the world rose by a meager 3.1 percentage points from about 10.7 percent in 2014 to 13.7 percent in 2018. China, the market leader, has a 20.5 percent market share. The EU GSP-Plus is under review. To unlock the true potential of GSP-Plus and to retain duty-free access, Pakistan needs to concentrate on trying to wrest market share from China and Turkey.
Free Trade Agreements have not helped Pakistan increase its Exports of Towels & Towel made-ups. Pakistan has the potential to export products to China under the category of ‘Towels and Towel made-ups,’ as these items face zero-duty under the Pakistan-China FTA. However, China currently imports $1.77 million worth of towels and towel made-ups fom Pakistan. The reasons behind low exports are:
• Pakistan lacks sufficient capacity to meet the demand of the Chinese market. • Further sophistication will require investment. • Pakistan needs to increase the ratio of good quality dyes to enhance value-addition. • NTBs such as labelling requirements and inspection requirements need to be overcome.
Moreover, Malaysia levies 20 percent import duties on articles of towels. Policymakers should focus on negotiating terms within the Pak-Malaysia FTA, and remove impediments to provide better opportunities for Pakistani towel and towel made-ups manufacturers.
Industry View on Enhancing Export Competitiveness of Pakistan’s Towel Sector
Supply-side and Productivity Constraints
For towel manufacturers, the quality, price and availability of cotton is a major hurdle in the promotion of exports. Despite being the fifth-largest cotton producing country in the world, Pakistan is a net importer of cotton, primarily due to the high demand for better grades of cotton for blending with other fibers and producing export quality textile items. Cotton production has averaged 11.3 million bales per year between FY15-FY19 and has fallen by 29.4 percent in the last five years. The cotton produced in Pakistan has short to medium fiber length. Towels are made from coarse yarn and coarse yarn is wastage of fine yarn. This means that the towels produced in Pakistan are very low value-added. The production of short-staple fibers impedes the domestic supply industry to produce high value-added items.
Protections to the spinning industry hurt towel exporters. Due to some relief provided by the government under the PM exporter package (2017-21), the spinning sector prefers to export yarn to China, Bangladesh, and other regional competitors, which leaves high-priced yarn for towel exporters.
Restricting cotton imports by imposing a duty. The government imposed a regulatory duty of 10 percent and a customs duty of 11 percent, whereas cotton imports had a customs duty of 3 percent previously. With 11 percent customs duty imposed by the government, the import of cotton yarn declined by 29 percent in 2019. Though Pakistani towel manufacturers are competing in global markets, they don’t have access to cotton and cotton yarn at global prices. Ban on imports will only make the value-added textile sectors uncompetitive.
Pakistan’s production and exports of towels made from blends of cotton and polyester staple fibres (PSF) and blends of cotton and viscose have remained low, unlike its competitors China and India. The world is shifting more towards man-made fibres (MMF), polyester fibre accounted for 55.1 percent of total fibre production worldwide in 2018, compared with just 16.5 percent in 1998. To promote the exports of high value-added towels, Pakistan must focus on the production of towels made from man-made materials blended in cotton to increase the towel’s aesthetic effects.

6
Pakistan’s towel manufacturers have to rely on the synthetic fibre manufacturing sector to obtain blended yarns made from PSF. According to the Textile Commissioner Organization’s report ‘Performance of Textile Industry during 2017-18’, spinning mills consumed 93 million kgs of MMF. They produced 99.12 million kgs of blended yarn (34.7 percent of the total yarn production) at the end of June 2018. The government has sought to support local production of blended yarn through protectionist policies. Still, the spinning industry has failed to achieve the government’s objective of import-substitution of MMF, mainly polyester and viscose due to lack of modernization and unavailability of raw materials, such as Purified Terephthalic Acid (PTA) and Mono Ethylene Glycol (MEG), required to manufacture MMF. Therefore, the local spinning industry has been unable to meet the excess demand and exporters have to rely on imports of MMF, which are subject to tariffs.
Labour Productivity and Skill Development for Job Creation. The towel industry of Pakistan is highly labor-intensive. Its multiplier effect is enormous in the domestic sector. The textile industry of Pakistan employs 30 percent of the 63.89 million national labour force (as of 2017 est.), or 40.0 percent of the industrial employment.3 Most of the workforce in the textile sector is reportedly unskilled. Inadequate labour supply of sufficiently trained workers hinders productivity, growth and quality in the towel sector. The development of a qualified labour force is constrained by the limited utilization of youth in vocational training. The towel industry relies on the SMA Rizvi Textile Institute (SMART) setup by TMA. Only 2 percent of the youth population (of 4 million who reach working age), has acquired vocational training through the TVET system. This is insufficient to meet the local demand of a skilled workforce.
Limited Access to Technology and Outdated Machinery hinders Productivity and Quality. Due to an increase in competition and high demand for synthetic fibre towels, large-scale exporters have gradually upgraded their quality standards, and sophisticated machinery has been installed. The power looms are the most basic kind of looms with low speed and efficiency and high wastages. This technology was used in 1960-70; however, it is still in use today. Very few units use rapier technology and air-jet looms, which are based on the latest technology with high speed, efficiency, and less wastage. Presently, the towel industry is equipped with 500 air-jet looms. SMEs in the towel industry operate well below capacity, using obsolete technology in weaving due to the non-availability of funds on a long-term basis with low mark-up, non-availability of land, and non-availability of proper infrastructure. Even where the capacity is being utilized optimally, it is not operating at its maximum efficiency.
Low Capacity Utilization prevents Economies of Scale. The units installed in the textile industry are not completely utilizing their installed capacity. This underutilization increases production costs and decreases profit margins.
Ineffective Market Expansion Strategies for Trade Promotion
Lack of Market Penetration. Globally, the towel market is divided into two segments: the institutional market, including the hospitality sector and the home customers segment. By and large Pakistani exporters, neither use distribution channels such as retail chains, customer agents, or commercial counsellors, nor do they efficiently market themselves through exhibitions resulting in a decline in market share.
Ineffective Strategies for Image Building and Brand Development. Pakistan’s image in the world as a towel supplier needs improvement. Currently, it stands as a low quality, low price, non-consistent and unreliable supplier. The ‘Made in Pakistan’ label can be enhanced by efficiently utilizing the funds that have already been designated for this purpose.
Joint Ventures. Pakistan’s textile industry has not been very successful in attracting foreign collaborations and joint ventures. On the other hand, its competitors have been able to receive foreign collaborations due to which they are able to achieve transfer of technology and marketing expertise.
3 International Labour Organization (ILO)

7STRENGTHENING THE EXPORT COMPETITIVENESS OF PAKISTAN’S TOWEL AND TERRY MADE-UPS SECTOR
Business Environment and Trade Related Issues
Automated Mechanism for Tax-based Export Incentives. At the time of withdrawal of the zero-rating regime, exporters were assured that sales tax refunds would be paid at the time of clearance of export goods. However, even before payment of a single refund could be processed, FASTER, the online system to fast track processing of sales tax refunds was launched with a commitment to pay the refund within 72 hours of filing of Annexure H of the Sales Tax return. From the launch of the FASTER system in July 2019 till the present, for one reason or the other, the FBR has itself acknowledged significant delays in refunds.
Effect of Exchange Rate Movements on Exports. The 22 percent appreciation from January 2013 till January 2017 (as indicated by the dotted line in figure 6-6), contributed to a decline in total exports by 14 percent. During the same period, exports of towels and terry made-ups declined by 0.50 percent.4 Due to a sharp decline in REER from the 2nd quarter of 2017 (Pakistani rupee declined by almost 26 percent), the overall exports of the towel group witnessed an upsurge (17 percent).
Harassment by Different Government Agencies. Exporters complained about the self-contradictory behavior and indecisiveness of the government bodies that they face on a daily basis.
Limited Access to Credit hampers Investment in Working Capital. Towel exporters of Pakistan rely on bank credit to finance their working capital and fixed capital. Financial credit provided by commercial banks is restricted to collateralized lending, making it difficult for SMEs to provide security to the banks. For improving the competitiveness of their products, exporters have always relied on SBP’s EFS scheme. Commercial banks give exporters loan at a subsidized rate. However, the government has always crowded out the private sector from borrowing to finance its deficit.
Cost of Production. The cost of major inputs like, electricity and gas are much higher in Pakistan than in comparator countries. According to industry sources, Pakistan’s gas rate per MMBTU is $2.3 higher than that of Viet Nam and $1.9 higher than that of Bangladesh.
Doing Business Ranking. According to the World Bank Ease of Doing Business Report 2020, Pakistan has improved its ranking from 136th in 2019 to 108th in 2020, marking a jump of 28 places. However, Pakistan has been performing poorly and is lagging well behind its competitors (except Bangladesh) in the overall ranking – China (77 places), India (45 places) and Viet Nam (38 places).
Socio-Economic and Environment Issues
Business Compliance with International Standards. Only a few Pakistani towel factories (including large and medium-sized enterprises) are certified under Supplier Ethical Data Exchange (SEDEX), Global Organic Textile Standard (GOTS)5, or the United States Worldwide Responsible Accredited Production (WRAP). These third-party independent companies conduct audits to ensure compliance with various environment, health and workers’ safety issues. The SME’s situation is quite problematic; factory workers work in an unhealthy breathing environment exposed to cotton dust6 and are often subject to work overtime. Obtaining certifications can be useful in accessing markets that are increasingly concerned about workers’ safety and environmental externalities. If the firms do not comply with EHS regulations, they are subject to indirect costs such as loss of market share and brand reputation damage.
4 Author’s estimation based on UN Comtrade data.
5 The Global Organic Textile Standard was launched in 2006 as a leading international standard for processing textile goods using organic fibres.
This standard applies to the entire towel supply chain process, including raw material processing, manufacturing, packaging, labelling, trading
and distribution. Towels must contain a minimum of 70 percent organic fibres and undergo annual on-site bath towel inspection, auditing and
residue testing to become GOTS certified.
6 Exploring ‘Monday fever’ in Pakistan’s textile sector. Retrieved from: https://www.aku.edu/news/Pages/News_Details.aspx?nid=NEWS-001761

8
Installation of Common Effluent Treatment Plants (CETPs). The towel industry consumes large amounts of water in dyeing and finishing processes. Additionally, outdated dyeing processes release chemicals, like Persistent Organic Pollutants (POPs), into the water. New methods include optimization of the dyeing process itself without using water (i.e., using Air-Dye technology) and improved wastewater treatment by the installation of Common Effluent Treatment Plants (CETPs), which is designed to purify industrial wastewater for its reuse.

9STRENGTHENING THE EXPORT COMPETITIVENESS OF PAKISTAN’S TOWEL AND TERRY MADE-UPS SECTOR
Chapter 1
Economic Significance of Pakistan’s Textile Industry and the Global Textile Trade
Global Supply of Textiles
The following figure shows the global supply of textiles over the last ten years. The international market for textiles has seen repeated boom-bust cycles since the turn of the century. Due to the 2008 global financial crisis, exports of textiles fell by 14.1 percent in 2009. However, the most significant growth was recorded in 2011, with an increase of 17.6 percent y-o-y.
FIGURE 1-1 Overview of Global Trade in Textiles
Note: Mirror data has been used for Bangladesh due to unreported data.
Source: ITC Trade Map
Major Players in the International Textile Trade
The following tables list the top ten exporters and importers of textiles. As evident from the Tables below, China, Bangladesh and Germany remained the top three global exporters of textiles in 2018 with a market share of 31.8 percent, 4.9 percent and 4.6 percent, respectively. Exports of Bangladesh and Viet Nam have increased sharply in the last ten years with CAGR’s of 11.1 percent and 15.0 percent respectively. Pakistan ranked tenth in the list with exports of $13.6 billion and a market share of 1.6 percent in 2018; this was less than half that of its immediate competitors, India, Bangladesh and Viet Nam.
Moreover, with respect to imports, the EU and the US accounted for more than half of the total world imports in 2018. A number of markets, including Viet Nam, Korea, the Russian Federation and China have been growing at rapid rates with CAGR’s of 13.8 percent, 9.4 percent, 7.3 percent and 5.1 percent respectively.
As evident from the Tables below, China, Bangladesh and Germany remained the top three global exporters of textiles in 2018 with a market share of 31.8 percent, 4.9 percent and 4.6 percent, respectively. Exports of Bangladesh and Viet Nam have increased sharply in the last ten years with CAGR’s of 11.1 percent and 15.0 percent respectively. Pakistan ranked tenth in the list with exports of $13.6 billion and a market share of 1.6 percent in 2018; this was less than half that of its immediate competitors, India, Bangladesh and Viet Nam.
Moreover, with respect to imports, the EU and the US accounted for more than half of the total world imports in 2018. A number of markets, including Viet Nam, Korea, the Russian Federation and China have been growing at rapid rates with CAGR’s of 13.8 percent, 9.4 percent, 7.3 percent and 5.1 percent respectively.
-14.15%
17.60%
-2.00%
7.36%
-7.76%
6.05%559.12
643.92
757.23 742.07796.69
833.84769.10 751.99
789.73837.48
-20%
-15%
-10%
-5%
0%
5%
10%
15%
20%
0
100
200
300
400
500
600
700
800
900
2009 2010 2011 2012 2013 2014 2015 2016 2017 2018Yo
Y Gr
owth
Rat
e, (%
)
US$,
Bill
ions
China Bangladesh Germany India Viet Nam Others YoY Growth Rate (%) World

10
TABLE 1-1 Top Exporters of Textiles, 2009-18
Exporters Exported value in
2009(US$,
Billions)
Exported value in
2018(US$,
Billions)
CAGR (2009-18)
Share in Total Exports
2018
World 559.12 837.48 4.59% 100.00%
China 161.33 266.42 5.73% 31.81%
European Union 161.42 215.86 3.28% 25.77%
Bangladesh 15.84 40.96 11.13% 4.89%
India 21.91 37.12 6.03% 4.43%
Viet Nam 10.42 36.68 15.01% 4.38%
Turkey 19.32 27.88 4.16% 3.33%
USA 18.34 27.17 4.46% 3.24%
Hong Kong, China
31.87 20.44 -4.82% 2.44%
Pakistan 9.64 13.65 3.94% 1.63%
Source: ITC, Trade Map
TABLE 1-2 Top Importers of Textiles, 2009-18
Importers Imported value in
2009(US$,
Billions)
Imported value in
2018(US$,
Billions)
CAGR (2009-18)
Share in Total Imports
2018
World 538.83 755.12 3.82% 100.00%
European Union 219.64 282.91 2.85% 37.47%
USA 86.74 119.37 3.61% 15.81%
Japan 31.09 37.71 2.17% 4.99%
China 21.78 34.16 5.13% 4.52%
Viet Nam 6.39 20.42 13.77% 2.70%
Hong Kong, China
24.85 18.81 -3.04% 2.49%
Korea, Republic of,
7.28 16.31 9.37% 2.16%
Canada 10.58 14.45 3.53% 1.91%
Bangladesh 12.73 13.75 0.86% 1.82%
Russian Federation
7.16 13.49 7.29% 1.79%
Source: ITC, Trade Map

11STRENGTHENING THE EXPORT COMPETITIVENESS OF PAKISTAN’S TOWEL AND TERRY MADE-UPS SECTOR
Composition of World Textile Exports
The textile sector comprises of a variety of products such as yarn, apparel, carpets, bedware, towels, silk and synthetic textiles. The following table shows the respective shares of different types of textile products exported in 2017 and 2018. Exports of textiles totaled $788.7 billion in 2017 and $837.5 billion in 2018; total textile exports accounted for 4.3 percent of total international trade in 2018. The most important product category with the highest increase in share was knitted apparel (an increase of 15.3 billion or a 0.25 percent increase in share). Other important product categories include ready-made garments ($236.6 billion), arts silk and synthetic textiles ($44.4 billion), yarn excluding cotton yarn ($33.9 billion), bedware ($11.0 billion), and towels and textile made-ups ($10.9 billion).
TABLE 1-3 Composition of World Textile Exports
Share in World Exports of Textiles,
2017 (%)
Share in World Exports of Textiles,
2018 (%)
Increase/Decrease
Cotton (Raw, Waste, Yarn, Thread & Cloth, etc) 7.26% 7.23% â
Knitwear Garments 28.73% 28.98% á
Readymade Garments (Woven) 28.69% 28.43% â
Arts Silk Synthetic Textiles 5.47% 5.34% â
Yarn (excluding Cotton Yarn) 3.92% 4.07% á
Knitted or Crocheted Fabrics 4.09% 4.07% â
Textile Made-ups (excluding Towels) 3.15% 3.16% á
Carpets 2.01% 1.96% â
Bedware 1.34% 1.33% â
Towels (Terry Cloth, Other Textile Materials) 1.32% 1.31% â
Tule, Lace, Embroidery etc. 1.30% 1.28% â
Textile Fabrics Woven & other 0.81% 0.86% á
Raw Wool 0.75% 0.76% á
Textile for Machinery 0.62% 0.62% á
Tents and other Canvas Goods 0.54% 0.55% á
Animal Hair 0.11% 0.12% á
Waste Material of Textiles 0.11% 0.09% â
Other 9.77% 9.84% á
Source: ITC Trade Map for figures & TDAP for HS code product classification

12
Pakistan’s Textile Exports
Share in Total Exports
A significant portion of Pakistan’s exports comprises of textiles, indicating the sector’s significance for Pakistan. Textile exports earn as much as 57.4 percent of Pakistan’s entire export earnings. Textile exports increased by 5.0 percent in 2018, of which the most significant increase was recorded in the exports of knitted or crocheted fabrics.
FIGURE 1-2 Share of Textile Exports in Total Exports
Source: ITC Trade Map
Composition of Pakistan’s Textile Exports
The textile sector is the most important manufacturing sector that contributes substantially to the export earnings of Pakistan. The textile sector comprises of a variety of products such as yarn, apparel, carpets, bedware, towels, silk and synthetic textiles. The following table shows the respective shares of different types of textile products exported in 2017 and 2018. Exports of textiles totaled $13.0 billion in 2017, which was 1.65 percent of global textile exports and were worth $13.7 billion in 2018, which was 1.64 percent of total world textile exports (the share of Pakistan’s textile exports in world textile exports declined by 0.01 percentage points in 2018 over 2017). Overall, global exports of textiles increased by 5.8 percent in 2018; this means that Pakistan’s exports of textiles have not kept pace with global textile exports. Pakistan’s inherent dependence on cotton has inclined manufacturers to produce low value-added or semi-manufactured products. The composition of textile exports in the table below shows that among the value-added sectors, only knitted garments, knitted fabrics and arts silk synthetic textiles have shown an increase in the last year. Moreover, in made-ups, the towel’s subsector is the second largest after bedware in terms of exports.
48%
50%
52%
54%
56%
58%
60%
62%
0
5
10
15
20
25
30
2009 2010 2011 2012 2013 2014 2015 2016 2017 2018
Perc
ent
US$,
Bill
ions
YearOverall Exports to the WorldTextile Exports to the WorldTextile Exports as % of Total Exports
Composition of Exports, 2018
Textile Exports as % of Total Exports
Composition of Other Exports (%)
57.42%
42.58%

13STRENGTHENING THE EXPORT COMPETITIVENESS OF PAKISTAN’S TOWEL AND TERRY MADE-UPS SECTOR
TABLE 1-4 Composition of Pakistan’s Textile Exports
Category Share in Pakistan Exports of Textiles,
2017 (%)
Share in Pakistan Exports of Textiles,
2018 (%)
Increase/Decrease
Cotton (Raw, Waste, Yarn, Thread & Cloth, etc) 27.60% 25.42% â
Knitwear Garments 19.77% 20.70% á
Readymade Garments (Woven) 19.19% 18.53% â
Bedware 17.27% 16.61% â
Towels (Terry Cloth, Other Textile Materials) 10.06% 9.55% â
Knitted or Crocheted Fabrics 0.18% 3.45% á
Arts Silk Synthetic Textiles 1.98% 2.23% á
Textile Made-ups (excluding Towels) 1.95% 1.78% â
Tents and other Canvas Goods 0.89% 0.63% â
Carpets 0.59% 0.52% â
Yarn (excluding Cotton Yarn) 0.21% 0.24% á
Waste Material of Textiles 0.13% 0.14% á
Tule, Lace, Embroidery etc. 0.12% 0.13% á
Animal Hair 0.03% 0.03% â
Textile Fabrics Woven & other 0.03% 0.02% â
Raw Wool 0.01% 0.01% á
Textile for Machinery 0.01% 0.01% â
Source: ITC Trade Map for figures & TDAP for HS code product classification
Share of Textiles in Pakistan’s Economy
Textile has consistently remained an important sector because it has contributed 59.94 percent to exports in 2019-20, it accounted for about one-fourth (25 percent) of the industrial value-addition. It employed 40 percent of the industrial labour force in 2018-19. According to the Pakistan Economic Survey 2019-20, the textile sector registered a decline of 2.6 percent. The industry contracted by 0.2 percent in FY19. The World Bank reported that the textile industry will face a sharp decline post COVID-19 and could subsequently recover slowly.7 On the other hand, the textile sector had a significant impact on large-scale manufacturing with the highest value of 20.91 of Quantum Index of Manufacturing (QIM).8
TABLE 1-5 Contribution of Textiles to the National Economy
Variable Contribution of Textiles to National Economy (%)
Share in GDP 8.50%
Share in Industrial Labour Force 40.00%
Share in Industrial Value Addition 25.00% (1/4th)
Share in Large Scale Manufacturing 21.00%
Share in Total Exports 59.94%
Share in FDI 1.43%
Source: Pakistan Economic Survey 2018-19 & 2019-20, State Bank of Pakistan
7 World Bank predicts Pakistan’s GDP growth at –0.2pc next fiscal. Retrieved from: https://www.thenews.com.pof k/print/670634-world-bank-
predicts-pakistan-gdp-growth-at-0-2pc-next-fiscal
8 An index number that purports to show the changes in quantity, usually of goods produced, sold, or purchased, independently of changes in
prices or money values.

14
Foreign Direct Investment in Textiles (Net Inflows)
Foreign Direct Investment (FDI) has played a minimal role in Pakistan’s textile sector, as shown by the table below. FDI net inflows dropped by almost 16.0 percent between FY07 and FY18. In FY19, net FDI inflows were $76.8 million, and the textile sector represented 4.61 percent of the total FDI. Low FDI in the textile sector leads to limited access to new markets and inputs that could facilitate product diversification. Pakistan needs to strengthen its export competitiveness to attract FDI.
FIGURE 1-3 Foreign Direct Investment (Net Inflows) Trend for Textiles
Source: State Bank of Pakistan
On the bright side, there are certain advantages attached to the low level of FDI. A more significant number of textile exporters in Pakistan are vertically integrated. This means that the firms allow specialization that leads to economies of scale and results in a competitive advantage in the market place. Pakistan has enormous potential to invest in design and brand development, unlike its Southeast Asian competitors such as Cambodia and Viet Nam. This competitive edge gives Pakistan a significant opportunity because major textile importers such as the United States and the European Union have not established sourcing relationships with Pakistan’s competitors in Southeast Asia.
Export Competitiveness: Textiles
Trade Performance Index (TPI) provides indicators on the decomposition of the country’s change in world market shares to measure international competitiveness. Increases in relative global market shares are decomposed using the following competitiveness indicators (details of these indicators are given in Annexure II):
1. Competitiveness Effect2. Adaptation Effect3. Product Specialization4. Geographic Specialization
-1.00%
0.00%
1.00%
2.00%
3.00%
4.00%
5.00%
-10.00
0.00
10.00
20.00
30.00
40.00
50.00
60.00
70.00
80.00
FY02 FY03 FY04 FY05 FY06 FY07 FY08 FY09 FY10 FY11 FY12 FY13 FY14 FY15 FY16 FY17 FY18 FY19
Perc
ent
US$,
Mill
ions
Financial Year
FDI in Textiles (Net In�lows) Textiles Share in FDI (%)

15STRENGTHENING THE EXPORT COMPETITIVENESS OF PAKISTAN’S TOWEL AND TERRY MADE-UPS SECTOR
FIGURE 1-4 Components of Pakistan’s Relative World Market Shares in Textiles, 2012-16
Source: ITC, Trade Competitiveness Map
The adaptation effect in Pakistan’s textile sector is low as compared to Bangladesh and Viet Nam. This suggests that Pakistan has not been able to export products that have a growing demand or to adapt to world demand changes.
FIGURE 1-5 Components of Relative Change of World Market Shares in Textiles, 2012-16
Source: ITC, Trade Competitiveness Map
-1.92%
0.26%
-0.62%
0.13%
-2.50% -2.00% -1.50% -1.00% -0.50% 0.00% 0.50%
Adaptation Effect Product SpecialisationGeographic Specialisation Competitiveness Effect
-8.00%-6.00%-4.00%-2.00%0.00%2.00%4.00%6.00%8.00%
10.00%12.00%
Competitiveness Effect Geographic Specialization
Product Specialization Adaptation Effect

16
Chapter 2
Changing Dynamics of Global Towel Trade and the Emerging Markets
The maps below illustrate the dominance of Asian countries in the production of towels (figure 2-1) and the reliance of developed countries (American and European countries) on the developing countries to fulfill their consumption requirements of towels and terry made-ups.
FIGURE 2-1 Top Producers of Towels, 2018
Source: Data sourced from ITC Trade Map
The figure below shows the trend in world exports of towels and terry made-ups. Global exports of textiles and towels have increased substantially after the end of the MFA quota regime. Exports of towels fell by 11.4 percent in 2009. However, the most significant growth rate was recorded in 2011, with an increase of 19.2 percent y-o-y.
FIGURE 2-2 Top Consumers of Towels, 2018
Source: Data sourced from ITC Trade Map

17STRENGTHENING THE EXPORT COMPETITIVENESS OF PAKISTAN’S TOWEL AND TERRY MADE-UPS SECTOR
FIGURE 2-3 Trends in World Trade of Towels, 2009-18
Source: ITC Trade Map
World exports of towels and terry made-ups increased three-fold from 2001 to 2018, to reach $10.88 billion, representing about 0.06 percent of the world exports in 2018. China has been a dominant player in this sector since 2001. China’s exports have been continuously increasing and the export values are much larger than those of competitors, accounting for nearly 43.0 percent of the sector’s total exports in 2018. China’s CAGR has been 1.7 percent for the last five years. Pakistan has been ranked as the second largest exporter of towels in the world after China since 2001. Pakistan’s CAGR has been 1.3 percent for the last five years. During this period, the highest growth was recorded in 2018. However, exports are likely to decrease once the trade dynamics change as a result of COVID-19.
Compound Annual Growth Rates (CAGR) show that the global towel industry continues to favor smaller countries such as Bangladesh and Viet Nam. It is evident from the table below that, while China dominates a significant proportion of the towel industry, developing countries have recently succeeded in capturing a significant market share post-quota regime. The MFA shaped global competitiveness for many countries, as in Pakistan’s case, only 20-25 companies were allowed to export in the MFA phase. In the post-quota regime, many exporters, especially SME’s, took time to get on track. Despite the significant exports of towels, Pakistan lags behind its peers. Bangladesh’s exports grew from $91.9 million in 2006 (post MFA) to $275.1 million (an increase of $183.2 million) in 2018. Similarly, Viet Nam exports grew from $96.6 million in 2006 to $306.4 million (an increase of $209.8 million) in 2018. The increased use of MMF in textile products has stimulated growth in Bangladesh and Viet Nam.9 If Pakistan does not maintain the same rate of progress as our competitors, our export share in global trade will continue to decline.
9 MMF textile exports in 2017: China 19%, India 16%, Viet Nam 7% and Bangladesh 1%. Retrieved from: https://perfectsourcing.net/global/
an-overview-the-global-mmf-market-with-an-indian-twist/
-11.36%
19.23%
-0.55%
7.77%
-7.23%
4.14%5.06%
-15.00%
-10.00%
-5.00%
0.00%
5.00%
10.00%
15.00%
20.00%
0.00
2.00
4.00
6.00
8.00
10.00
12.00
14.00
16.00
18.00
20.00
2009 2010 2011 2012 2013 2014 2015 2016 2017 2018
Exports Imports Total Trade Annual Export Growth (%)
Perc
ent
US$,
Bill
ions

18
TABLE 2-1 Top 10 Exporters of Towels All values in US$, Billions
Exporters 2014 2015 2016 2017 2018 Compound Annual Growth Rate 2009-18 (%)
Compound Annual Growth Rate 2014-18 (%)
Share in World Towel Exports in 2018 (%)
Top Export Destinations in 2018, Share in Towel Exports (%)
World 10.55 9.79 10.20 10.36 10.88 5.41% 0.77% 100.00%
China 4.35 4.06 4.37 4.39 4.65 6.23% 1.69% 42.72% USA, 20.50% Japan, 11.30% Kazakhstan, 6.30%
Pakistan 1.26 1.25 1.24 1.28 1.32 4.40% 1.27% 12.13% USA, 57.65% UK, 7.80% Netherlands, 4.43%
India 1.14 1.12 1.14 1.11 1.14 18.57% 0.00% 10.47% USA, 60.80% UK, 6.70% Australia, 2.90%
Turkey 0.69 0.61 0.65 0.67 0.66 3.14% -1.12% 6.06% USA, 19.40% Germany, 16.40% France, 8.80%
Viet Nam 0.22 0.23 0.24 0.26 0.31 11.50% 8.81% 2.82% Japan, 69.30% Korea, Republic of, 11.70% USA, 4.80%
Germany 0.28 0.25 0.25 0.25 0.30 1.65% 1.97% 2.77% Austria, 14.20% France, 12.20% Poland, 9.50%
Portugal 0.26 0.23 0.23 0.24 0.28 1.80% 1.84% 2.57% Spain, 21.90% France, 19.30% Italy, 11.20%
Bangladesh 0.23 0.23 0.23 0.27 0.27 8.92% 3.97% 2.52% USA, 28.21% Canada, 15.73% UK, 8.27%
Belgium 0.20 0.18 0.17 0.16 0.18 -1.15% -2.56% 1.67% France, 54.90% Netherlands, 17.70% Germany, 7.80%
Netherlands 0.18 0.16 0.16 0.16 0.16 4.74% -2.01% 1.50% Germany, 33.90% France, 21.80% Belgium, 19.40%
Note: Mirror data has been used for Bangladesh due to unreported data.
Source: ITC Trade Map

19STRENGTHENING THE EXPORT COMPETITIVENESS OF PAKISTAN’S TOWEL AND TERRY MADE-UPS SECTOR
The following figure shows the global performance of exports of towels and terry made-ups. It shows that Pakistan’s growth in exports (CAGR 2009-18) has been in line with the world’s export growth (CAGR 2009-18), which is an indication that Pakistan has kept pace globally though it has been unable to have a large increase.
FIGURE 2-4 Global Export Performance in 2018: Towels and Towel Made-ups
Source: ITC Trade Map
The following table shows the list of products under towels and terry made-ups category exported in the world in 2018. As demonstrated by the break-up of global towel exports, it is evident that about two-thirds of the total value ($7.0 billion) is accounted for by ‘Toilet linen and kitchen linen, of terry towelling or similar terry fabrics of cotton (excluding floorcloths, polishing cloths, dishcloths and dusters)’ (HS-630260). This category comprises of 64.0 percent of the total exports of towels in 2018. China is the leading exporter in this category, followed by India. The highest growth for the last five years has been recorded in the category of ‘Toilet linen and kitchen linen of man-made fibres (excluding floor cloths, polishing cloths, dishcloths and dusters)’ (HS-630293). China is the top producer of towels made from MMF, with a 74.1 percent share in total exports. Pakistan holds the highest share of exports of ‘Toilet linen and kitchen linen of textile materials (excluding of cotton or man-made fibres, floor cloths, polishing cloths, dishcloths and dusters)’ (HS-630299), which constituted 43.7 percent of the total world exports of towels and terry made-ups. In this category, Pakistan’s share is five times that of China. However, in 2018 its growth at 12.1 percent was less than China’s, suggesting scope to move up the value chain. Since the world is moving towards the production of MMF towels, as shown by the positive CAGRs for ‘Toilet linen and kitchen linen of man-made fibres (excluding floor cloths, polishing cloths, dishcloths and dusters)’ (HS-630293), Pakistan needs to diversify its product line for export expansion.
-5%
0%
5%
10%
15%
20%
25%
30%
35%
40%
0
500
1,000
1,500
2,000
2,500
3,000
3,500
4,000
4,500
5,000
Com
poun
d An
nual
Gro
wth
Rat
e (%
)
US$,
Mill
ions
Top ExportersExports CAGR (2009-18)CAGR (2014-18) World CAGR (2009-18)World CAGR (2014-18) Linear (World CAGR (2009-18))
Bangladesh's growth in this sector is 7.5 times that of Pakistan's

20
TABLE 2-2 Towel Products sold in the International Market All values in US$, Billions
Product Code
Product Label 2014 2015 2016 2017 2018 Compound Annual Growth Rate 2009-18 (%)
Compound Annual Growth Rate 2014-18 (%)
Share in World Towel Exports in 2018 (%)
Top 3 Exporters in 2018, Share in World Towel Exports (%)
TOTAL TOWELS (Total) 10.55 9.79 10.20 10.36 10.88 5.41% 0.77% 100.00% China, 42.72% Pakistan, 12.13% India, 10.47%
630260 Toilet linen and kitchen linen, of terry towelling or similar terry fabrics of cotton (excluding floorcloths, polishing cloths, dishcloths and dusters)
6.72 6.28 6.66 6.75 6.97 5.31% 0.90% 64.03% China, 41.20% India, 15.10% Pakistan, 11.30%
630710 Floorcloths, dishcloths, dusters and similar cleaning cloths, of all types of textile materials
2.21 2.11 2.08 2.25 2.41 5.39% 2.26% 22.17% China, 44.60% Pakistan, 18.20% Germany, 5.50%
630293 Toilet linen and kitchen linen of man-made fibres (excluding floorcloths, polishing cloths, dishcloths and dusters)
0.48 0.56 0.67 0.66 0.76 14.95% 12.23% 7.02% China, 74.10% Belgium, 4.10% Spain, 4.00%
630291 Toilet linen and kitchen linen of cotton (excluding of terry fabrics, floorcloths, polishing cloths, dishcloths and dusters)
0.86 0.64 0.55 0.50 0.53 -0.35% -11.25% 4.88% China, 22.40% Egypt, 17.10% Germany, 7.20%
630299 Toilet linen and kitchen linen of textile materials (excluding of cotton or man-made fibres, floorcloths, polishing cloths, dishcloths and dusters)
0.29 0.20 0.24 0.20 0.21 5.33% -7.71% 1.90% Pakistan, 43.76% Spain, 9.00% China, 8.60%
Source: ITC Trade Map
According to data from the United Nation’s ITC’s trade map, the largest import markets include the EU, the US, Japan, Australia, Canada, the Russian Federation, Chile, Switzerland, Korea and Mexico. Although the US and the EU have remained the top markets with stable imports, they are experiencing a slowdown in demand, as shown by their CAGRs (2014-18). Pakistan is the second-largest import sourcing partner for the EU, with a share of 13.5 percent and for the US with a share of 24.6 percent. It would be better for Pakistan to tap non-traditional markets such as the Russian Federation, Chile, Korea and Mexico for market expansion. These markets have witnessed higher growth over 2014–18, as shown by their CAGR (2014-18).

21STRENGTHENING THE EXPORT COMPETITIVENESS OF PAKISTAN’S TOWEL AND TERRY MADE-UPS SECTOR
TABLE 2-3 Top 10 Importers of Towels All values in US$, Billions
Importers 2014 2015 2016 2017 2018 Compound Annual Growth Rate 2009-18 (%)
Compound Annual Growth Rate 2014-18 (%)
Share in World Towel Imports in 2018 (%)
Top Import Sourcing Markets in 2018, Share in Towel Imports (%)
World 8.81 8.33 8.31 8.74 9.19 3.70% 1.06% 100.00%
European Union
3.19 2.77 2.91 3.00 3.16 2.84% -0.25% 34.42% China, 20.48%Turkey, 14.56%Pakistan, 13.49%
United States of America
2.68 2.82 2.75 2.93 2.99 4.71% 2.84% 32.57% China, 32.10% India, 28.30% Pakistan, 24.63%
Japan 0.82 0.70 0.69 0.69 0.71 1.35% -3.37% 7.75% China, 58.80% Viet Nam, 30.90% Bangladesh, 2.40%
Australia 0.21 0.22 0.21 0.22 0.22 5.87% 1.74% 2.41% China, 57.70% India, 19.00% Bangladesh, 6.50%
Canada 0.21 0.20 0.21 0.22 0.22 2.50% 1.80% 2.41% China, 32.10% India, 21.20% Bangladesh, 19.50%
Russian Federation
0.16 0.11 0.10 0.12 0.19 5.40% 4.37% 2.07% China, 40.10% Uzbekistan, 14.20% Belarus, 5.20%
Chile 0.08 0.08 0.08 0.09 0.14 11.34% 14.34% 1.54% China, 46.10% India, 31.80% Israel, 7.60%
Switzerland 0.09 0.08 0.08 0.09 0.10 2.92% 1.32% 1.07% Germany, 21.90% China, 19.90% Turkey, 12.70%
Korea, Republic of
0.06 0.06 0.07 0.08 0.10 9.52% 10.34% 1.04% China, 42.70% Viet Nam, 39.40% Indonesia, 4.50%
Mexico 0.06 0.06 0.07 0.07 0.09 5.42% 11.83% 0.96% China, 40.90% India, 23.40% USA, 16.5%
Source: ITC Trade Map
World imports of towels and terry made-ups totaled $9.19 billion in 2018 with the United States accounting for more than 30.0 percent of the global share.10
10 Figures for exports and imports of towels does not match due to discrepancy in reported data by the countries.

22
TABLE 2-4 World Imports of Towels All values in US$, Billions
Product code
Product label 2014 2015 2016 2017 2018 Compound Annual Growth Rate 2009-18 (%)
Compound Annual Growth Rate 2014-18 (%)
Share in World Towel Imports in 2018 (%)
Top 3 Importers in 2018, Share in World Towel Imports (%)
TOWELS 8.81 8.33 8.31 8.74 9.19 3.70% 1.06% 100.00% USA, 32.57% Japan, 7.80% Germany, 6.30%
630260 Toilet linen and kitchen linen, of terry towelling or similar terry fabrics of cotton (excluding floorcloths, polishing cloths, dishcloths and dusters)
5.59 5.25 5.23 5.43 5.58 2.69% -0.07% 60.70% USA, 37.80% Japan, 9.70% Germany, 5.60%
630710 Floorcloths, dishcloths, dusters and similar cleaning cloths, of all types of textile materials
1.95 1.85 1.83 2.00 2.16 5.70% 2.55% 23.52% USA, 30.30% Germany, 7.30% France, 4.50%
630291 Toilet linen and kitchen linen of cotton (excluding of terry fabrics, floorcloths, polishing cloths, dishcloths and dusters)
0.78 0.73 0.70 0.73 0.76 1.80% -0.44% 8.29% USA, 17.20% France, 7.30% Germany, 7.10%
630293 Toilet linen and kitchen linen of man-made fibres (excluding floorcloths, polishing cloths, dishcloths and dusters)
0.36 0.39 0.43 0.47 0.57 14.28% 12.21% 6.24% USA, 15.30% Japan, 10.40% France, 10.00%
630299 Toilet linen and kitchen linen of textile materials (excluding of cotton or man-made fibres, floorcloths, polishing cloths, dishcloths and dusters)
0.13 0.11 0.11 0.12 0.11 1.71% -2.18% 1.25% France, 9.10% Germany, 9.10% USA, 7.50%
Source: ITC Trade Map

23STRENGTHENING THE EXPORT COMPETITIVENESS OF PAKISTAN’S TOWEL AND TERRY MADE-UPS SECTOR
Chapter 3
The Terry Towel Value Chain
Terry Towel
The term ‘Terry’ is derived from the French word ‘Tirer,’ which means to ‘draw out’ referring to the pile loops which were initially pulled out by hand, long enough to make it a traditional absorbent Turkish towel. Original terry weaving was the result of defective weaving, which led to the evolution of woven fabrics. This development of towel occurred in Bursa city of Turkey in the 17th century. Terry toweling is still known as ‘Turk Fabric,’ ‘Turkish Toweling,’ or ‘Turkish Terry.’ (Bozgeyik, 1991). A terry towel is a type of a textile product that is made with loop piles on one or both sides of the fabric, covering the entire ground surface or forming stripes, checks, or other patterns (with end hems or fringes and side hems or selvages). The sizes and colors of a towel vary depending on the customer’s order.
At the time of independence in 1947, ‘huck-a-back’ towels were used in Pakistan. These towels were weaved in honeycomb pattern using handlooms. In 1965, the Soviet Union showed interest in Pakistani towels; this led to the emergence of the towel industry in Pakistan. Later, the outbreak of the Indo-Pak war in 1971, adversely affected Pakistan’s exports of towels to the Soviet Union. Soon after this disruption, Towel Manufacturers’ Association (TMA) came into existence in 1976; this was the turning point for the towel industry’s development in Pakistan. With the help of the Ministry of Commerce and through trade delegations and international exhibitions, towel manufacturers concentrated their efforts to access new markets such as the European countries, the USA and Canada. Pakistani manufacturers are producing towels in a wide range of shapes and sizes like bath towels, dishcloths, bar mops, washcloths, bath mats, kitchen towels, etc.
Parts of a Conventional Terry Towel
A traditional woven towel consists of five different parts including the pile area (terry body divided into two parts, the smaller part is the cam portion), fringes (tied/untied tassels), the beginning and end part (tightly woven areas to prevent the body area from unravelling), selvedge (stitched border to reinforce the sides of the towel) and dobby border (fancy portion usually embroidered). All these parts are shown in the figure below.
FIGURE 3-1 Parts of a Towel
Source: Yilmaz & Powell (2005).
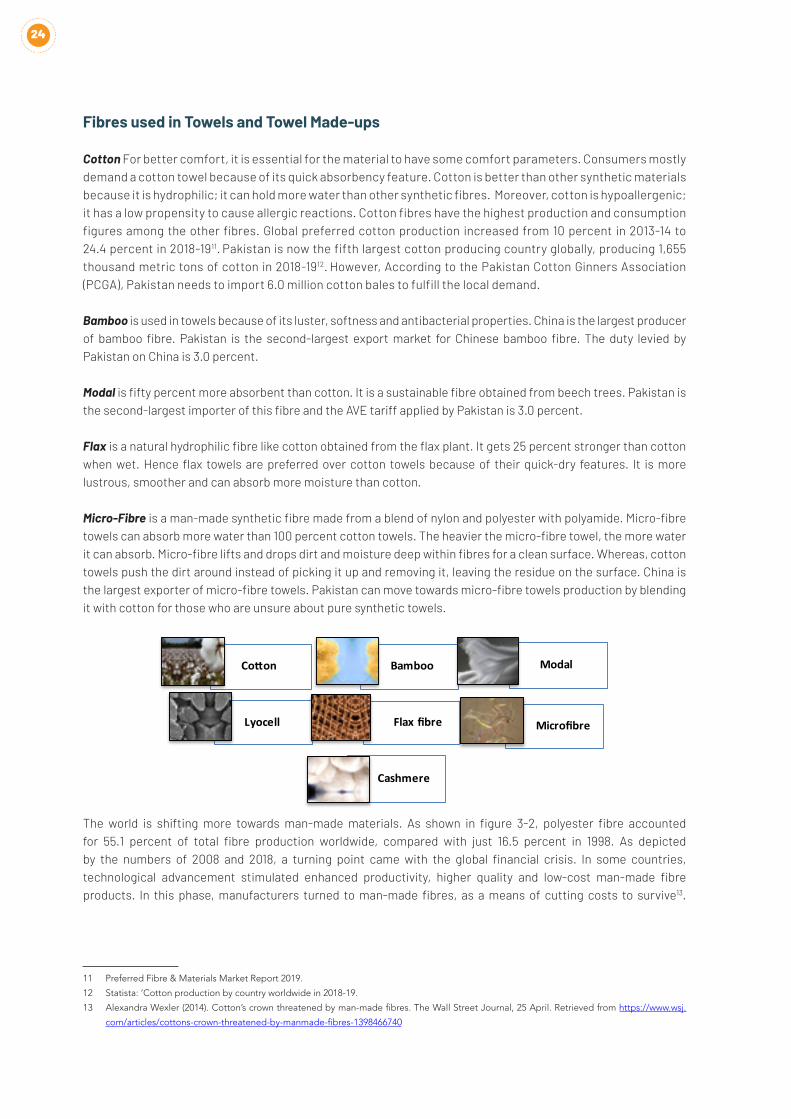
24
Fibres used in Towels and Towel Made-ups
Cotton For better comfort, it is essential for the material to have some comfort parameters. Consumers mostly demand a cotton towel because of its quick absorbency feature. Cotton is better than other synthetic materials because it is hydrophilic; it can hold more water than other synthetic fibres. Moreover, cotton is hypoallergenic; it has a low propensity to cause allergic reactions. Cotton fibres have the highest production and consumption figures among the other fibres. Global preferred cotton production increased from 10 percent in 2013-14 to 24.4 percent in 2018-1911. Pakistan is now the fifth largest cotton producing country globally, producing 1,655 thousand metric tons of cotton in 2018-1912. However, According to the Pakistan Cotton Ginners Association (PCGA), Pakistan needs to import 6.0 million cotton bales to fulfill the local demand.
Bamboo is used in towels because of its luster, softness and antibacterial properties. China is the largest producer of bamboo fibre. Pakistan is the second-largest export market for Chinese bamboo fibre. The duty levied by Pakistan on China is 3.0 percent.
Modal is fifty percent more absorbent than cotton. It is a sustainable fibre obtained from beech trees. Pakistan is the second-largest importer of this fibre and the AVE tariff applied by Pakistan is 3.0 percent.
Flax is a natural hydrophilic fibre like cotton obtained from the flax plant. It gets 25 percent stronger than cotton when wet. Hence flax towels are preferred over cotton towels because of their quick-dry features. It is more lustrous, smoother and can absorb more moisture than cotton.
Micro-Fibre is a man-made synthetic fibre made from a blend of nylon and polyester with polyamide. Micro-fibre towels can absorb more water than 100 percent cotton towels. The heavier the micro-fibre towel, the more water it can absorb. Micro-fibre lifts and drops dirt and moisture deep within fibres for a clean surface. Whereas, cotton towels push the dirt around instead of picking it up and removing it, leaving the residue on the surface. China is the largest exporter of micro-fibre towels. Pakistan can move towards micro-fibre towels production by blending it with cotton for those who are unsure about pure synthetic towels.
The world is shifting more towards man-made materials. As shown in figure 3-2, polyester fibre accounted for 55.1 percent of total fibre production worldwide, compared with just 16.5 percent in 1998. As depicted by the numbers of 2008 and 2018, a turning point came with the global financial crisis. In some countries, technological advancement stimulated enhanced productivity, higher quality and low-cost man-made fibre products. In this phase, manufacturers turned to man-made fibres, as a means of cutting costs to survive13.
11 Preferred Fibre & Materials Market Report 2019.
12 Statista: ‘Cotton production by country worldwide in 2018-19.
13 Alexandra Wexler (2014). Cotton’s crown threatened by man-made fibres. The Wall Street Journal, 25 April. Retrieved from https://www.wsj.
com/articles/cottons-crown-threatened-by-manmade-fibres-1398466740
Cotton Bamboo Modal
Lyocell Flax fibre Microfibre
Cashmere

25STRENGTHENING THE EXPORT COMPETITIVENESS OF PAKISTAN’S TOWEL AND TERRY MADE-UPS SECTOR
FIGURE 3-2 Global Fibre Production (Million Metric Tons)
Source: Preferred Fibre & Materials Market Report 2019
Lack of Integration and Suboptimal Value Addition Affects the Value Chain for Growth
FIGURE 3-3 Structure of Cotton Value-Addition at Each Stage
Towel value chain comprises the following segments: provision of inputs, ginning, spinning, weaving, wet processing, finishing (stitching and packing) and finished towels. Figure 3-3 shows the structure of the cotton value chain. Since spinning and weaving are capital-intensive industries and towel industry is labor-intensive, the ratios in terms of the number of jobs created per unit at each stage will increase. This is only possible when value-added exports are achieved and competitive prices are offered. It is evident that as the level of production increases, the economic value of the product also increases simultaneously. Starting with 1kg of raw cotton at $1.65/kg price offered by the spinning sector in 2017-18, the weaving stage adds another $0.98/kg. Similarly, as we move along the value chain of cotton, the finishing stage adds another $1.25/kg, converting the cotton yarn into the finished towel. The final price of the cotton towel offered in 2017-18 was $3.88/kg14.
Insufficient cotton production has created a significant gap in the value chain. Therefore, Pakistan seems to have moved upward but with a marginal rate of cotton value addition, as seen by the approximate per unit economic value at each stage of towel production. These numbers give some idea of the impact on export earnings and job creation if Pakistan can add value to the production of cotton towels.
14 The entire production process includes some percentage of wastage. The per-unit price of the final product ranges from $3-4/kg, allowing
some percent of the wasted material at each stage. However, the additional cost of non-cotton content, i.e., dyes, is also added in the final
product (value chain of the entire production process of a towel). See Annexure 1 for stage-wise wastage data provided by the TMA.
• Cotton •(Non-Cotton)
•Machinery & Equipment
•Dyes & Bleach
• Ginning• Spinning• Weaving• Finishing
Towels & Towel made-ups

26
FIGURE 3-4 Structure of Cotton Value-Addition
Source: Data sourced from Performance of Textile Industry – TCO.
Yarn Spinning
1. Yarns used in the Production of Towels
Usually, four components of yarns are used in the manufacturing of terry towels; the pile warp yarn, the ground warp yarn, the weft yarn and the border weft. In most cases, the pile warp yarns are 100 percent cotton yarns, carded or combed, in sizes of 16/1, 20/1 Ne counts, 240-255 turns/meter twist, are used (low twisted yarn with low twist factor). Carded yarns of 20/2 or 24/2 Ne count with 550 turns/meter twist, and of 100 percent cotton yarns are used for ground warp ends (normal twist yarn with normal twist factor). This is a commonly used yarn of cotton/polyester blend for greater strength and differentiated products. For weft yarn, carded yarns of 16/1, or 20/1 Ne counts with 240-255 turns/meter twist, and of 100 percent cotton yarns are used (low twist or normal twisted yarn). High-end towels have fancy borders made from shiny and bulky yarns of rayon, polyester, viscose, chenille, or mercerized cotton yarns. (Acar, 2004).
2. Spinning Technique
Towel manufacturers procure cotton from various domestic cotton ginning mills. The manufacturers receive high or medium quality cotton bales for conversion into yarns. Once received, raw cotton bales are broken open by an automated Uniflock machine. Raw cotton contains many impurities, so to filter out impurities, Uniflock blends the cotton fibres by repeatedly beating it. Good quality towels use cotton with fibres that are blended three times before spinning. During this process, cotton is blended with polyester depending on the demand. Nowadays, cotton mixed with polyester is highly demanded by buyers because it is cheaper as compared to pure cotton. The blended fibres are then formed into a picker lap, which goes into the carding machines through tubes; in this way, the longer and shorter fibres are separated. Fine bent wires on revolving cylinders pull the blended fibres apart (while not yet
2001-022002-032003-042004-052005-062006-072007-082008-092009-102010-112011-122012-132013-142014-152015-162016-172017-18
0.70.89
1.280.941.021.121.18
1.032.512.53
1.81.661.78
1.551.551.721.65
1.731.78
2.242.092.04
2.112.3
2.283.49
4.113.14
3.053.01
2.742.82
2.732.63
3.393.68
3.973.73.68
3.794.01
3.873.47
4.394.75
4.524.47
4.714.464.3
3.88
0 2 4 6 8 10 12$/KG
Raw Cotton
Cotton Yarn
Finished Product Cotton TerryTowel (630260)
FIGURE 3-6 Cotton Sliver
FIGURE 3-5 Ring Spinning
Source: Ring Spinning Frame –
ScienceDirect

27STRENGTHENING THE EXPORT COMPETITIVENESS OF PAKISTAN’S TOWEL AND TERRY MADE-UPS SECTOR
yarn) and are shaped parallel enough that they can be spun into yarn. These fibres are fed into another machine and are gathered together to form a sliver – a loose fine twisted rope of cotton fibres. These slivers are sent into another machine, in which they are re-mixed several times and sent between other rollers for straightening. In this way, long, straight and parallel fibres are obtained to produce more durable yarns. The fibres are then sent to combing machines. These machines remove the shorter fibres, coarser and woollier,15 leaving the longer and silkier cotton fibres for spinning into yarn. After combing, the process of doubling is done. This is the process of running slivers between rollers, which draft or draw out a number of slivers to the thickness of one. These sliver ropes travel to roving machines, which is then wound onto bobbins for spinning. During ring spinning, fibres are given a considerable high twist to produce a strong yarn.
Another technique used in spinning cotton yarn for terry towel is open-end spinning. In this process, yarn is created without using a spindle. Fibres are added to an open end of yarn. The twist is applied to newly added fibres converting them into yarn, and the new elements of yarn are continuously removed from the twisting zone. (Yilmaz, 2005). Low twist yarn is also used in Pakistani towels to make towels more absorbent. Low-twist or zero-twist is constructed using longer staples of cotton yarns. It is covered with Polyvinyl alcohol (PVA) yarn to keep the cotton undamaged for twisting.
Pakistan ranks as the third-largest producer of yarn in the world. At present, the spinning sector comprises of 477 spinning units. Enterprises in Pakistan’s yarn-spinning segment have a capacity of 13.41 million spindles and 198 thousand rotors installed, nearly 11.33 million spindles and 126 thousand rotors are in operation. The capacity utilization has stagnated at 84.5 percent in spindles and 63.6 percent in rotors during 2018–19. Even though Pakistan’s spinning mills operate below capacity, the cotton sector does not produce enough lint to meet the mill’s demand. Out of the total yarn production of 285.24 million kgs, 9.72 million kgs (3.5 percent of the total yarn) is consumed by the spinning mills and 45.60 million kgs is exported (16 percent of the total yarn). The remaining 229.83 million kgs (80.5 percent) continue along the domestic value chain.16 The portion of yarn exported rather than being utilized domestically shows the structural weakness of Pakistan’s textile sector. Pakistan’s leading buyers of cotton yarn are China, Bangladesh and Portugal. China was the third-largest exporter of cotton yarn in 2018 and Pakistan was the fourth-largest. China opt-out of yarn production because it is historically evident that countries demand cheaper sources of cotton yarn once their income per capita exceeds $2000. After all, higher labour costs impede the production of low value-added items at competitive rates. In this way, China converts imported yarn into high value-added products fetching high prices in the international market.
15 Small-sized towels e.g., dishcloths, washcloths highly demanded in the US, are made with coarser yarn. (Towel Manufacturers’ Association).
16 Textile Commissioner’s Organization (TCO) Government of Pakistan, 2017–18.

28
Terry Weaving
Terry towels are mostly woven as 3-pick terry weaves.17 The basic technique of towel construction lies in the arrangement of a loop or uncut pile. The warp is a set of lengthwise or longitudinal yarns tightly stretched on a beam or loom. Simultaneously, the transverse weft is a set of latitudinal yarns or the filling yarns, generally less strong than the warp yarn, passed through and inserted over and under the warp to form a woven fabric. The warps are divided as the pile warp yarns and the ground warp yarns. The figure below shows the cross-section of a towel through the warp across the weft yarns. Pile yarn is the body of the towel that absorbs moisture and provides softness. A terry towel can have pile loops on one or both sides of the towel.
FIGURE 3-7 Cross-section of a Towel through the Warp
Source: Acar (2004), as cited in Yilmaz (2005).
In the figure above, the yellow and green yarns show the front and back pile, respectively. Whereas, the plain weave construction is shown by the red and blue ground warps. The small circles between the ground warps are the weft yarns. Weft or filling yarns are wound onto bobbins according to the required softness. Pile warps and ground warps are unwound simultaneously: with lightly tensioned ends given to the pile warp and tightly tensioned ends given to the ground warp. The lower tension given to the pile warp delivers extra length of warps to form loops. These two warps are then warped onto two different section beams; these separate beams are inserted into the loom for weaving. Weaving preparation: warp and weft procedures are performed before weaving to get good quality towels by ensuring warp and weft effective performance.
FIGURE 3-8 Flow Chart of Terry Weaving
Source: Acar (2004), as cited in Yilmaz (2005).
17 Weave is a pattern of the interlacing of warp and weft in a woven fabric.

29STRENGTHENING THE EXPORT COMPETITIVENESS OF PAKISTAN’S TOWEL AND TERRY MADE-UPS SECTOR
A warping beam is warped in which large spools of spun yarns are wrapped and wound onto a large beam (warp beam) in a considerable number of parallel rows. Different types of towels require different counts of warp yarns. Warp threads are rolled onto the section beam in accordance with the required length (total number of ends) and the required density. Double thread is rolled if a good quality towel is demanded to have good strength. Then these fully wrapped warp threads on large beams are placed into a rack, which can hold up to 12 beams, and sized or stiffened so that the yarn can withstand the friction of weaving. Sizing agents such as polyvinyl alcohol (PVA)18, wax and urea are pressed into the yarn and coated. The sized liquor fibres are transferred to a heated storage vessel. This steam helps to dry the warp yarns quickly. With coated yarns, these large beams are picked up by hydraulic lift and sent to the looms. The sizes of the looms vary. Standard size of a loom lies between 85-155 inches; however, the wider the loom, the longer the weft will take to cross the warp hence the slower the weaving. Towels are woven on dobby looms with two warp systems – one is the ground warp and it creates the framework of the towel and the other is the pile warp and it forms the pile loops and thus two warp beams are let off simultaneously. Now comes the most tedious task of drafting – each set of warp threads is fed through a set of heddle eyes and reed dents (warp threads are threaded and combed to prevent from crossing over each other) and is attached to a harness. These harnesses mechanically lower and raise the warp threads so that the weft yarn or filler can be passed between them. The intersection of weft and warp creates woven fabric. The pile yarn is loosely threaded into the woven fabric and when this loose filler yarn is pressed or beaten into the fabric, the slack is pushed up and becomes a little loop of the terry cloth.
Shuttles, which carry the threads of the weft yarn while weaving with a loom, are thrown or passed back and forth through the shed across the warp threads in order to weave in the weft. Towel making looms may have 18 shuttles passed back and forth with that single filler yarn across the warp from a firing cylinder which creates the final edges. A typical shuttle loom can make 350 shuttle insertions in a single minute. Thus, towels are woven on traditional dobby looms. The global standard for production per loom is 250 dozen bath towels in a single week – and there are about 50-70 looms in a factory.19 However, in Pakistan, a small factory typically produces 100 pounds of towels per day.20
Even though Pakistan has traditionally been a cotton-growing country, there was only one mechanized towel manufacturing unit at the time of partition. The towel industry in Pakistan was practically non-existent before 1965. It started on a very small scale in that year. Initially, these units were small with four to twelve looms; however, several new towel manufacturing units came into existence with the passage of time. At present, there are 400 towel manufacturing units in Pakistan. According to the Economic Survey of Pakistan (2018-19), the existing installed capacity of towels is about 10,000 shuttle and shuttle-less looms in both organized and unorganized sectors.
Due to an increase in competition and high demand for synthetic fibre towels, large-scale exporters have gradually upgraded their quality standards and sophisticated machineries have started being installed. The power looms are the most basic kind of looms with low speed and efficiency and high wastages. This technology was used in 1960-70; however, it is still in use today. The newer factories now use rapier technology and air-jet looms, based upon the latest technology with high speeds, efficiency and less wastage. Presently, the towel industry has about 500 air-jet looms.21 The SMEs in the towel industry operate well below capacity, using obsolete technology in weaving due to the non-availability of funds on a long-term basis.
18 Polyvinyl Alcohol (PVA) is a man-made sizing agent. Pakistan imported PVA mainly from China and Thailand with a custom duty of 20 percent
in 2019-20.
19 http://www.madehow.com/Volume-4/Bath-Towel.html
20 Daily Production of Looms (pcs) =
Daily Finish Production (lbs) =
21 Towel Manufacturers’ Association of Pakistan.

30
Processing
Once the towels are made (long terry cloth that has no beginning or end), they are ready for processing. The rolls of greige cloth are converted into processed fabric. To achieve the desired quality of processed towel, the fabric is passed through different sequences of operations which are summarized below:
• De-sizing: De-sizing is the process of removing sizing material (greige fabric obtained from sizing as part of weaving) on fabric to ensure even bleaching and level dyeing.
• Scouring: Greige fabric does not absorb water when de-sizing. To remove the non-fibrous impurities (the primary wall of cotton fibre) from the fabric, a chemical washing process is carried out in a kier boiler with high alkalinity-built detergents.
• Bleaching: Long terry cloth rolls are then wound on an off-loom take-up reel and transported to bleaching vessels to improve whiteness by removing natural coloration. Fabric is bleached through a washing process with bleaching chemicals such as hydrogen peroxide, hypochlorite and sodium chlorite. The fabric is subject to high temperatures above 100 degrees; the bleaching chemicals react with one another, resulting in a pure white fabric. One of the obstacles for SMEs is that they use wood to run their boilers. The textile sector was told that they would be provided RLNG at Rs 600-750, but it has not yet been given. The fabric rolls are washed several times in a washer to remove all chemicals from the towelling. Then the squeezers are used to dry the access water. This task is labor-intensive, and unskilled labour is used to hang the rolls on hangers. Almost 4000kg-5000kg is hung in one go.
• Dyeing: The towels are processed in rope form. To convert bleached fabric into the colored fabric, the large, dried towel panels sewn together, are transported to large vessels of chemical dyes. After being fully immersed in the dye liquor bath, the towelling is squeezed between two heavy rollers, which forces the dye down into the towelling. After being steam-dried and fluffed, the dyed towels are ready for final finishing, including cutting, grading, hemming, labelling and packing.
• Finishing: In the final finishing, different processes are applied to improve the quality of the towel. Towels are graded and hemmed, and after final visual inspection, they are hand folded and packed using different packing accessories like branding hashtags and UPC labels.
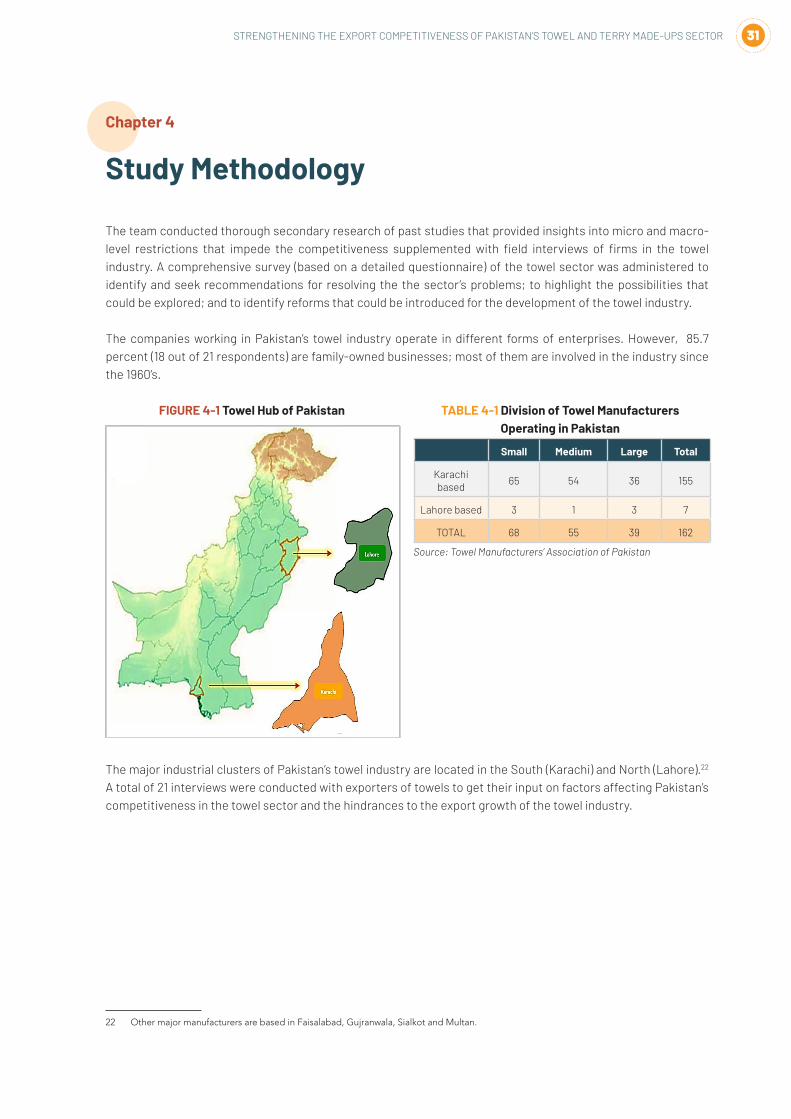
31STRENGTHENING THE EXPORT COMPETITIVENESS OF PAKISTAN’S TOWEL AND TERRY MADE-UPS SECTOR
Chapter 4
Study Methodology
The team conducted thorough secondary research of past studies that provided insights into micro and macro-level restrictions that impede the competitiveness supplemented with field interviews of firms in the towel industry. A comprehensive survey (based on a detailed questionnaire) of the towel sector was administered to identify and seek recommendations for resolving the the sector’s problems; to highlight the possibilities that could be explored; and to identify reforms that could be introduced for the development of the towel industry.
The companies working in Pakistan’s towel industry operate in different forms of enterprises. However, 85.7 percent (18 out of 21 respondents) are family-owned businesses; most of them are involved in the industry since the 1960’s.
FIGURE 4-1 Towel Hub of Pakistan
The major industrial clusters of Pakistan’s towel industry are located in the South (Karachi) and North (Lahore).22 A total of 21 interviews were conducted with exporters of towels to get their input on factors affecting Pakistan’s competitiveness in the towel sector and the hindrances to the export growth of the towel industry.
22 Other major manufacturers are based in Faisalabad, Gujranwala, Sialkot and Multan.
TABLE 4-1 Division of Towel Manufacturers Operating in Pakistan
Small Medium Large Total
Karachi based
65 54 36 155
Lahore based 3 1 3 7
TOTAL 68 55 39 162
Source: Towel Manufacturers’ Association of Pakistan
Figure 4-1 Towel Hub of Pakistan

32
Chapter 5
Pakistan’s Towel Exports
The table below shows Pakistan exports of towels and terry made-ups during 2014–18. Over the past five years (2014–18), Pakistan’s exports have had a Compound Annual Growth Rate (CAGR) of 1.27 percent. Moreover, for the last five years, Pakistan’s exports to the European markets, except the UK and Belgium, have been consistently increasing, as shown by the export values and favorable growth rates.
Pakistan is the second largest exporter of towels and terry made-ups, after China, whose total exports amounted to $1.32 billion in 2018. Pakistan’s exports to the European countries under the top ten export destinations accounted for 23.6 percent of its global exports in 2014, which increased to 27.8 percent in 2018. The Compound Annual Growth Rate (CAGR) of Pakistan’s exports to the European markets for the last five years has been 5.5 percent. However, the United States is the largest export destination for Pakistan, accounting for 57.6 percent of Pakistan’s exports of towels and terry made-ups. According to trade map data, $507.9 million worth of towels were exported to the US in 2009, which increased by 49.8 percent to reach $761.2 million in 2018.
The COVID-19 outbreak has caused unprecedented disruption in global trade. It has significantly affected Pakistan’s exports as Pakistani exporters have started losing export orders resulting in a decline in export share. In July-May FY20, towels exports fell by 10.8 percent in value and 10.6 percent in quantity year-on-year as compared to July-May FY19.23
TABLE 5-1 Major Destinations for Pakistan’s Towel Exports All values in US$, Millions
Importers 2014 2015 2016 2017 2018 Compound Annual Growth Rate 2009-18 (%)
Compound Annual Growth Rate 2014-18 (%)
Change over the last year (%)
Share in Pakistan Exports of Towels, 2018 (%)
Untapped Export Potential
World 1,255.52 1,251.73 1,236.02 1,281.63 1,320.49 4.40% 1.27% 3.03% 100.00%
United States of America
746.36 757.99 725.68 755.36 761.21 4.60% 0.49% 0.77% 57.65% -
United Kingdom
107.31 114.39 113.09 112.47 102.94 7.32% -1.03% -8.47% 7.80% 37.99
Netherlands 28.07 26.64 32.01 45.47 58.46 15.03% 20.13% 28.58% 4.43% 36.05
Germany 48.14 50.30 50.84 52.78 53.46 6.11% 2.66% 1.29% 4.05% 85.37
Italy 34.38 33.98 37.19 38.34 44.69 8.28% 6.78% 16.55% 3.38% 19.51
Spain 20.74 21.31 25.17 31.98 34.63 9.52% 13.67% 8.28% 2.62% 34.88
France 24.41 22.29 23.91 25.11 31.65 11.64% 6.71% 26.05% 2.40% 46.13
Belgium 24.33 27.63 30.73 25.73 21.99 3.95% -2.50% -14.53% 1.67% 14.32
United Arab Emirates
33.30 28.56 24.05 21.98 20.32 -10.55% -11.61% -7.57% 1.54% 7.00
Poland 8.54 9.79 15.71 14.74 19.20 28.28% 22.46% 30.29% 1.45% 14.65
Source: ITC Trade Map
23 Export of Textile Group. Retrieved from: https://www.pbc.org.pk/wp-content/uploads/Trade-Data-FY-20-Jul-to-May.pdf

33STRENGTHENING THE EXPORT COMPETITIVENESS OF PAKISTAN’S TOWEL AND TERRY MADE-UPS SECTOR
Pakistan has a strong base in the home textile sector. In made-ups, towels sub-sector has the second largest share in production and exports of home textiles after bedlinen. A wide range of products like bath towels, table linen, kitchen linen, bathrobes, bar mops, dishcloths, floorcloths, face towels, washcloths, terry gloves are produced and exported in different sizes and shapes depending on customers’ requirements.24 Pakistan is the second largest exporter of terry towels (HS-630260) after China. Almost 88 percent of the total towel produced in the county were exported to the United States and the European countries in 2018. These markets constituted around 12 percent of the total towels exported in the world. The international demand for Pakistani towels has increased over recent years due to its vibrant colors and quality. The following figure shows the shares of Pakistan towel exports (category-wise) in 2018.
FIGURE 5-1 Actual Export Markets of Towels and Towel Made-ups, 2018
Source: ITC Trade Map
24 Bath Towel: 27”x52”, Hand Towel: 16”x30”, Wash Cloth: 13”x13”, Fingertip Towel: 11”x18”, Bath Mat: 27”x52”.
Figure 5-1 Actual Export Markets of Towels and Towel Made-ups, 2018
Source: ITC Trade Map
24 Bath Towel: 27"x52", Hand Towel: 16"x30", Wash Cloth: 13"x13", Fingertip Towel: 11"x18", Bath Mat: 27"x52".

34
HS Codes and Description
TABLE 5-2 List of HS Codes
Product Code
Product Label Pakistan Exports in 2018 (US$, Mn)
630260 Toilet linen and kitchen linen, of terry towelling or similar terry fabrics of cotton (excluding floorcloths, polishing cloths, dishcloths and dusters)
786.30
PCT codes
63026010 Toilet linen and kitchen linen, of terry towelling or similar terry fabrics of cotton (excluding floorcloths, polishing cloths, dishcloths and dusters): towels, mill-made
726.92
63026020 Toilet linen and kitchen linen, of terry towelling or similar terry fabrics of cotton (excluding floorcloths, polishing cloths, dishcloths and dusters): towels of cotton, hand loom
0.93
63026090 Toilet linen and kitchen linen, of terry towelling or similar terry fabrics of cotton (excluding floorcloths, polishing cloths, dishcloths and dusters): other
58.45
630291 Toilet linen and kitchen linen of cotton (excluding of terry fabrics, floorcloths, polishing cloths, dishcloths and dusters)
4.66
PCT codes
63029110 Toilet linen and kitchen linen of cotton (excluding of terry fabrics, floorcloths, polishing cloths, dishcloths and dusters): toilet and kitchen linen mill made
3.10
63029120 Toilet linen and kitchen linen of cotton (excluding of terry fabrics, floorcloths, polishing cloths, dishcloths and dusters): toilet and kitchen linen hand loom made
0.02
63029190 Toilet linen and kitchen linen of cotton (excluding of terry fabrics, floorcloths, polishing cloths, dishcloths and dusters): other
1.54
630293 Toilet linen and kitchen linen of man-made fibres (excluding floorcloths, polishing cloths, dishcloths and dusters)
0.00
PCT codes
63029300 Toilet linen and kitchen linen of man-made fibres (excluding floorcloths, polishing cloths, dishcloths and dusters)
0.00
630299 Toilet linen and kitchen linen of textile materials (excluding of cotton or man-made fibres, floorcloths, polishing cloths, dishcloths and dusters)
90.57
PCT codes
63029900 Toilet linen and kitchen linen of textile materials (excluding of cotton or man-made fibres, floorcloths, polishing cloths, dishcloths and dusters)
90.57
630710 Floorcloths, dishcloths, dusters and similar cleaning cloths, of all types of textile materials
438.96
PCT codes
63071010 Floorcloths, dishcloths, dusters and similar cleaning cloths, of all types of textile materials: dish-cloth
18.92
63071020 Floorcloths, dishcloths, dusters and similar cleaning cloths, of all types of textile materials: wash-cloth
145.23
63071030 Floorcloths, dishcloths, dusters and similar cleaning cloths, of all types of textile materials: dusters
2.66
63071040 Floorcloths, dishcloths, dusters and similar cleaning cloths, of all types of textile materials: bar mops
102.64
63071050 Floorcloths, dishcloths, dusters and similar cleaning cloths, of all types of textile materials: bath mats
15.08
63071090 Floorcloths, dishcloths, dusters and similar cleaning cloths, of all types of textile materials: other
154.43
Source: Detailed Classification of Towel Products has been done using codes assigned by the Towel Manufacturers’ Association of Pakistan
and Pakistan Bureau of Statistics.

35STRENGTHENING THE EXPORT COMPETITIVENESS OF PAKISTAN’S TOWEL AND TERRY MADE-UPS SECTOR
Tariff and Non-Tariff Barriers faced by Pakistan
Even though Multi-Fibre Arrangement (MFA) prescribed a quota regime for the textile industry in the developing countries for decades and was completely phased out in 2005 by the WTO Agreement on Textiles and Clothing (ATC), there are still tariff and non-tariff barriers faced by Pakistan. Pakistan’s exports of towels and terry made-ups are subject to tariff barriers in the developed countries that vary from 5 percent to 17 percent. While trade relationships sometimes eliminate or reduce these restrictions, more often unfair preferential trade agreements and access to competitors impedes growth in exports. These restrictions are expected to get more severe post the COVID-19 outbreak.
TABLE 5-3 Tariffs faced by Pakistan, 2019
630260 630291 630293 630299 630710
United States 9% 9% 8% 3% 5%
Top European Markets
United Kingdom 0% 0% 0% 0% 0%
Germany 0% 0% 0% 0% 0%
Italy 0% 0% 0% 0% 0%
Spain 0% 0% 0% 0% 0%
France 0% 0% 0% 0% 0%
Belgium 0% 0% 0% 0% 0%
Poland 0% 0% 0% 0% 0%
United Arab Emirates
5% 5% 5% 5% 5%
Canada 17% 17% 18% 15% 9%
Japan 6% 6% 2% 5% 0%
Australia 5% 3% 5% 3% 5%
Source: ITC, Trade Map
TABLE 5-4 Non-Tariff Barriers (NTBs) faced by Pakistan
Top Export Destination of Pakistan All Products under Towels and Terry Made-ups
United States Special Authorization Requirement for SPS reasons, Storage & Transport, Cold/Heat Treatment, Fumigation, Labelling, Product Identity, Product Quality & Traceability Information Requirements
Top European Markets for Pakistan Labelling, Marking & Testing Requirements
United Arab Emirates Labelling Requirements (Labels must be in Arabic)
Canada Product Identity, Product Quality, Product Registration, Testing Requirement, Direct Consumption Requirement, Consumption Taxes
Japan Labelling & Product Quality Requirements
Source: ITC, Market Access Map

36
Export Concentration and Lack of Market Diversification
Although Pakistani exporters of towels and made-ups have successfully penetrated 128 countries, exports are highly concentrated in a few destination markets. Almost 58.0 percent of the towels produced for exports were destined for the United States in 2018. The United States is the top buyer of Pakistani towels with a Compound Annual Growth Rate of 4.6 percent for the past ten years. Among the top export markets, eight major buyers belonged to Europe, with a total share of 30.2 percent. The remaining 12 percent belonged to the rest of the world with very small export shares. This lack of market diversification is associated with increased vulnerability to macroeconomic shocks in the destination markets and decreased growth in the export country.
FIGURE 5-2 Export Concentration, 2018
Source: ITC Trade Map
From a regional perspective, countries in North America are the largest markets for Pakistani towels, contributing 59.11 percent share to the total towels and towel made-ups exports. European markets including countries not in the EU claim another 33.31 percent share. In fact, in the list of Pakistan’s top ten export markets for towels, eight belong to Europe. Among the countries with smaller percentages, South America recorded the highest increase of 17.77 percent in 2018 as compared to 2017.
FIGURE 5-3 Regional Diversification of Towel Exports, 2009-18
Source: ITC Trade Map
United States of America
57.65%
Europe30.18%
ROW12.18%
TABLE 5-5 Region wise Pakistan’s Exports of Towels, 2018
Importers Compound Annual Growth Rate 2009-18 (%)
Change over the last year (%)
Share in Pakistan Exports of Towels, 2018 (%)
North America 4.42% 0.86% 59.11%
Europe 8.72% 8.39% 33.31%
Asia -8.51% -2.46% 3.47%
Africa -2.15% 4.06% 2.00%
Oceania -0.91% -14.85% 1.18%
South America 2.00% 17.77% 0.60%
Source: ITC Trade Map
Figure 5-3 Regional Diversification of Towel Exports, 2009-18
United States of America
57.65%
Europe 30.18%
[CATEGORY NAME]
[PERCENTAGE]
0
200
400
600
800
1000
1200
1400
2009 2010 2011 2012 2013 2014 2015 2016 2017 2018
US$,
Mill
ions
Year North America Europe AsiaAfrica Oceania South America

37STRENGTHENING THE EXPORT COMPETITIVENESS OF PAKISTAN’S TOWEL AND TERRY MADE-UPS SECTOR
Potential Export Markets and Opportunities for Market Expansion
For the HS-06 products under towels and terry made-ups category, potential markets are identified based on untapped export potential. ITC’s export potential map showcases the value of a country’s potential to export in 2024. The Export Potential Indicator (EPI) shows the products that the country already exports and the diversification opportunities of existing products with additional exports in the target market. It is the extent to which a country can increase exports to a particular potential market given its supply capacities, demand conditions of the target market and market access feasibilities. It is the actual average of the last five years. The difference between the actual and the potential exports is indicated as the untapped export potential. (For computations see Annexure-III).
The following table shows the potential markets for Pakistan for the exports of ‘Terry Towels’ (HS-630260), ‘Floorcloths and Cleaning Cloths’ (HS-630710), ‘Cotton Linen Cloths’ (HS-630291) and ‘Cloths made from Other Textile Materials’ (HS-630299) respectively. These markets are identified based on the untapped export potential of Pakistan. Reasons for untapped potential include lack of market knowledge and consumer preferences, lack of knowledge about trade regulations and mismatch between the supplied and the demanded qualities. If policy reforms are made such that these issues are resolved, there is a better opportunity for Pakistan to enhance its export competitiveness. It can tap $614.62 million in the towels and terry made-ups sector. The markets with the highest potential for Pakistan’s exports of towels and terry made-ups are Germany, France, Japan, China, the United Kingdom and Spain, leaving room to realize additional exports worth $79.70 million, $44.62 million, $26.87 million, $25.71 million, $40.30 million and $32.14 million respectively. The United States is the top potential market for Pakistan, but when actual export value exceeds the potential export value, the unrealized potential is assigned a value of zero. In Pakistan’s case, the United States has already surpassed the potential.
TABLE 5-6 Top 10 Potential Markets on the basis of Untapped Export Potential
Terry Towels Cotton Linen Linen of Textile Materials Cleaning Cloths
Potential Markets
Untapped Export Potential
Potential Markets
Untapped Export Potential
Potential Markets
Untapped Export Potential
Potential Markets
Untapped Export Potential
Germany $32.9 Mn Spain $871.1 k Germany $2.3 Mn Germany $44.5 Mn
France $27.9 Mn China $510.3 k United Kingdom
$1.5 Mn Netherlands $19.9 Mn
Japan $26.2 Mn Canada $475.2 k Spain $865.6 k United Kingdom $19.6 Mn
United Kingdom $19.2 Mn Japan $423.1 k France $816.1 k Spain $18.8 Mn
China $15.0 Mn Malaysia $410.0 k Poland $340.9 k Italy $17.1 Mn
Spain $11.6 Mn Australia $224.0 k China $333.9 k France $15.9 Mn
Netherlands $11.1 Mn Sweden $207.8 k Australia $312.0 k China $10.2 Mn
Australia $9.9 Mn Chile $163.5 k United Arab Emirates
$282.5 k Poland $9.1 Mn
Canada $9.8 Mn Norway $115.5 k Austria $260.2 k Belgium $6.7 Mn
Sweden $9.5 Mn Czech Republic $80.8 k Japan $246.3 k Australia $6.4 Mn
Source: ITC Export Potential Map
The second approach is to identify potential markets for each product in the towels and made-ups sector based on the world demand and the competition faced by Pakistan. This method will create export expansion opportunities for Pakistan as it already has established trade relationships with top importers of towels in the world. The following table justifies the need for market expansion as Pakistan’s export growth has been slower than the shares of its competitors in world imports.

38
TABLE 5-7 Pakistan’s Export Share in World Imports of Towels, 2018
Code Product label Pakistan Exports to World (US$, Millions)
World Imports 2018 (US$, Millions)
Pakistan’s Share in World Towel Imports 2018
India’s Share in World Towel Imports 2018
China’s Share in World Towel Imports 20182014 2015 2016 2017 2018
630260 Toilet linen and kitchen linen, of terry towelling or similar terry fabrics of cotton (excluding floorcloths, polishing cloths, dishcloths and dusters)
776.39 820.80 777.09 805.01 786.30 5,577.39 14.10% 18.96% 51.50%
630710 Floorcloths, dishcloths, dusters and similar cleaning cloths, of all types of textile materials
392.75 396.83 384.89 407.12 438.96 2,161.09 20.31% 1.76% 49.75
630299 Toilet linen and kitchen linen of textile materials (excluding of cotton or man-made fibres, floorcloths, polishing cloths, dishcloths and dusters)
60.84 23.00 66.44 64.50 90.57 115.00 78.76% 8.51% 15.42%
630291 Toilet linen and kitchen linen of cotton (excluding of terry fabrics, floorcloths, polishing cloths, dishcloths and dusters)
25.49 11.10 7.60 5.00 4.66 761.48 0.61% 4.63% 15.62%
630293 Toilet linen and kitchen linen of man-made fibres (excluding floorcloths, polishing cloths, dishcloths and dusters)
0.05 - 0.01 - - 573.32 0.00% 0.00% 98.67%
Source: ITC Trade Map

39STRENGTHENING THE EXPORT COMPETITIVENESS OF PAKISTAN’S TOWEL AND TERRY MADE-UPS SECTOR
i. Potential Markets for Export of HS-630260 ‘Toilet linen and kitchen linen, of terry towelling or similar terry fabrics of cotton (excluding floorcloths, polishing cloths, dishcloths and dusters)’.
Despite high global demand, Pakistan’s exports are losing market share. This is reflected in low market shares of Pakistan as compared to its competitors’. Potential markets for the export of ‘Toilet linen and kitchen linen, of terry towelling or similar terry fabrics of cotton (excluding floorcloths, polishing cloths, dishcloths and dusters)’ (HS-630260), identified include the United States, Japan and Germany where Pakistan’s market share currently stands at 15.99 percent, 0.53 percent and 13.56 percent, respectively. Pakistan’s competitors in the US market are India and China, with export shares of 36.55 percent and 25.12 percent, respectively, which is higher than that of Pakistan. Similarly, in Japan, Pakistan faces competition from China, Viet Nam and Bangladesh, all whom have market shares higher than those of Pakistan.
TABLE 5-8 Potential Markets and Competitors for 630260
Potential Markets
Imports from World 2018 (US$, Millions)
Pakistan Exports to Country 2018 (US$, Millions)
Pakistan’s Market Share 2018
Competitors Exported Value 2018 (US$, Millions)
Competitor’s Market Share 2018
USA 2,110.97 337.45 15.99% India 771.53 36.55%
China 530.17 25.12%
Japan 542.90 2.86 0.53% China 293.93 54.14%
Viet Nam 196.58 36.21%
Bangladesh 13.73 2.53%
Germany 312.33 42.36 13.56% Turkey 109.96 35.21%
Source: ITC Trade Map
In the German market, Pakistan faces competition from Turkey, the per unit price offered by Turkey is more than double the price charged by Pakistan in the German market. The share of Turkey in Germany’s imports is 2.5 times the share of Pakistan. In the Japanese market, in terms of tariffs, Viet Nam and Bangladesh face zero tariff rates while Pakistan offers the lowest per-unit price of $5,924/Ton to Japan. Both Viet Nam and Bangladesh face zero tariff rates on exports to Japan, mainly because Japan has recently offered trade and investment partnerships to both these countries.25 26
TABLE 5-9 Tariff and Unit Price for 630260
Potential Markets Tariff faced by Pakistan 2018
Per Unit Price offered by Pakistan (US$/Ton)
Competitors Tariff faced by the Competitors 2018
Per Unit Price offered by the Competitors (US$/Ton)
USA 9.10% 4,866.00 India 9.10% 6,843.00
China 9.10% 8,672.00
Japan 5.90% 5,924.00 China 7.40% 9,118.00
Viet Nam 0.00% 6,059.00
Bangladesh 0.00% 6,844.00
Germany 0.00% 4,220.00 Turkey 0.00% 8,591.00
Source: ITC Trade Map
25 METI Holds Third Meeting of Japan-Viet Nam Joint Committee on Cooperation in Industry, Trade and Energy. Retrieved from: https://www.
meti.go.jp/english/press/2018/1012_004.html
26 Japan-Bangladesh ties: Riding the next wave of globalization. Retrieved from: https://www.thedailystar.net/opinion/perspective/news/japan-
bangladesh-ties-riding-the-next-wave-globalisation-1835767

40
ii. Potential Markets for Export of HS-630710 ‘Floorcloths, dishcloths, dusters and similar cleaning cloths, of all types of textile materials.’
Potential markets for the export of ‘Floorcloths, dishcloths, dusters and similar cleaning cloths, of all types of textile materials.’ (HS-630710) identified on the basis of world demand include the United States, Germany and France, with each country importing $654.41 million, $156.88 million and $96.48 million worth of ‘Floorcloths, dishcloths, dusters and similar cleaning cloths, of all types of textile materials.’ (HS-630710) from the world respectively. Pakistan faces competition mainly from China and the Netherlands; both have market shares more than that of Pakistan. Pakistan is a beneficiary of GSP-Plus that allows duty-free access to the European markets. Pakistan’s export share in each of the EU country markets is low as compared to its competitors.
TABLE 5-10 Potential Markets and Competitors for 630710
Potential Markets
Imports from World 2018 (US$, Millions)
Pakistan Exports to Country 2018 (US$, Millions)
Pakistan’s Market Share 2018
Competitors Exported Value 2018 (US$, Millions)
Competitor’s Market Share 2018
USA 654.41 345.16 52.74% China 329.64 50.37%
Germany 156.88 8.57 5.46% China 59.81 38.12%
Netherlands 24.19 15.42%
Korea, Republic of
12.82 8.17%
France 96.48 8.63 8.94% China 30.82 31.94%
Netherlands 14.33 14.85%
Italy 12.70 13.16%
Source: ITC Trade Map
Pakistan has the potential to expand its exports of ‘Floorcloths, dishcloths, dusters and similar cleaning cloths, of all types of textile materials.’ (HS-630710) to Germany and France, as these countries levy 0 percent duty on imports of this product. Except for China, all the competitors enjoy duty-free access to the potential markets. While in terms of per-unit price, China charges $3,426/Ton more than what Pakistan offers to the US. Similarly, Pakistan has a comparative advantage over its competitors in European markets as it offers the lowest unit price in Germany and France.
TABLE 5-11 Tariff and Unit Price for 630710
Potential Markets Tariff faced by Pakistan 2018
Per Unit Price offered by Pakistan (US$/Ton)
Competitors Tariff faced by the Competitors 2018
Per Unit Price offered by the Competitors (US$/Ton)
USA 4.70% 3,076.00 China 4.70% 6,502.00
Germany 0.00% 4,695.00 China 8.60% 6,665.00
Netherlands 0.00% 7,592.00
Korea, Republic of 0.00% 23,530.00
France 0.00% 6,314.00 China 8.60% 7,306.00
Netherlands 0.00% 6,684.00
Italy 0.00% 6,572.00
Source: ITC Trade Map

41STRENGTHENING THE EXPORT COMPETITIVENESS OF PAKISTAN’S TOWEL AND TERRY MADE-UPS SECTOR
iii. Potential Markets for Export of HS-630299 ‘Toilet linen and kitchen linen of textile materials (excluding of cotton or man-made fibres, floor cloths, polishing cloths, dishcloths and dusters)’.
Potential markets for the export of ‘Toilet linen and kitchen linen of textile materials (excluding of cotton or man-made fibres, floor cloths, polishing cloths, dishcloths and dusters)’ (HS-630299) are France and Germany with each country importing $10.52 million and 10.45 million worth of ‘Toilet linen and kitchen linen of textile materials (excluding of cotton or man-made fibres, floor cloths, polishing cloths, dishcloths and dusters)’ (HS-630299) from the world respectively.
TABLE 5-12 Potential Markets and Competitors for 630299
Potential Markets
Imports from World 2018 (US$, Millions)
Pakistan Exports to Country 2018 (US$, Millions)
Pakistan’s Market Share 2018
Competitors Exported Value 2018 (US$, Millions)
Competitor’s Market Share 2018
France 10.52 1.19 11.30% Spain 3.85 36.58%
China 1.87 17.81%
Germany 10.45 1.85 17.69% China 4.85 46.44%
Source: ITC Trade Map
Pakistan has an advantage over its competitors in French and German markets, as Pakistan offers a lower price to France as compared to Spain. However, Spain’s export share in the French market is more than triple Pakistan’s. Pakistan must explore French and German markets as these markets levy 0 percent duty on imports from Pakistan.
TABLE 5-13 Tariff and Unit Price for 630299
Potential Markets Tariff faced by Pakistan 2018
Per Unit Price offered by Pakistan (US$/unit)
Competitors Tariff faced by the Competitors 2018
Per Unit Price offered by the Competitors (US$/unit)
France 0.00% 8,500.00 Spain 0.00% 27,486.00
China 12.00% 8,636.00
Germany 0.00% 6,364.00 China 12.00% 7,865.00
Source: ITC Trade Map

42
iv. Potential Markets for Export of HS-630291 ‘Toilet linen and kitchen linen of cotton (excluding of terry fabrics, floor cloths, polishing cloths, dishcloths and dusters)’.
Potential markets for the export of ‘Toilet linen and kitchen linen of cotton (excluding of terry fabrics, floor cloths, polishing cloths, dishcloths and dusters)’ (HS-630291), identified include the United States and France with Pakistan’s market share currently at 13.36 percent and 17.54 percent respectively.
TABLE 5-14 Potential Markets and Competitors for 630291
Potential Markets
Imports from World 2018 (US$, Millions)
Pakistan Exports to Country 2018 (US$, Millions)
Pakistan’s Market Share 2018
Competitors Exported Value 2018 (US$, Millions)
Competitor’s Market Share 2018
USA 130.87 17.48 13.36% India 52.48 40.10%
China 36.82 28.14%
France 55.30 9.70 17.54% India 11.89 21.50%
Source: ITC Trade Map
The United States levies the same tariff rate of 9.20 percent on Pakistan and its competitors. Still, Pakistan has the potential for market expansion because it offers a relatively cheaper product to the US as compared to India and China. Moreover, Pakistan has an advantage over India in the French market as it faces a zero-tariff rate while India faces a tariff of 9.60 percent. From a price perspective, Pakistan offers better opportunities to France as India’s price is $2,963/Ton more than what Pakistan offers to France.
TABLE 5-15 Tariff and Unit Price for 630291
Potential Markets Tariff faced by Pakistan 2018
Per Unit Price offered by Pakistan (US$/unit)
Competitors Tariff faced by the Competitors 2018
Per Unit Price offered by the Competitors (US$/unit)
USA 9.20% 5,200.00 India 9.20% 9,049.00
China 9.20% 8,560.00
France 0.00% 5,099.00 India 9.60% 8,062.00
Source: ITC Trade Map

43STRENGTHENING THE EXPORT COMPETITIVENESS OF PAKISTAN’S TOWEL AND TERRY MADE-UPS SECTOR
v. Potential Markets for Export of HS-630293 ‘Toilet linen and kitchen linen of man-made fibres (excluding floor cloths, polishing cloths, dishcloths and dusters)’.
Potential markets for Pakistan’s exports of ‘Toilet linen and kitchen linen of man-made fibres (excluding floor cloths, polishing cloths, dishcloths and dusters)’ (HS-630293) are the US, Japan and France with each country importing $87.8 million, $59.7 million and $57.3 million from the world respectively. Pakistan faces competition from China, Korea, Republic of, and Morocco. As compared to these competitors, Pakistan’s market share in each of the potential market is negligible.
TABLE 5-16 Potential Markets and Competitors for 630293
Potential Markets Imports from World 2018 (US$, Millions)
Pakistan Exports to Country 2018 (US$, Millions)
Pakistan’s Market Share 2018 (US$, Millions)
Competitors Exported Value 2018 (US$, Millions)
Competitor’s Market Share 2018
USA 87.8 0.46 0.52% China 76.44 87.07%
Korea, Republic of 3.17 3.61%
Japan 59.7 0.00 0.00% China 57.13 95.68%
Korea, Republic of 1.96 3.28%
France 57.3 0.06 0.10% China 25.55 44.59%
Morocco 24.68 43.06%
Source: ITC Trade Map
In the US market, Pakistan and China face approximately the same tariff rate of 8.0 percent, while Korea, Republic of, enjoys duty-free access due to the United States – Korea Free Trade Agreement (KORUS). In terms of unit price, Pakistan offers a cheaper product as compared to China and Korea, Republic of. In the French market, Pakistan faces competition from Morocco. Pakistan has a cost advantage over Morocco as the price offered by Morocco is double that of Pakistan.
TABLE 5-17 Tariff and Unit Price for 630293
Potential Markets Tariff faced by Pakistan 2018
Per Unit Price offered by Pakistan (US$/unit)
Competitors Tariff faced by the Competitors 2018
Per Unit Price offered by the Competitors (US$/unit)
USA 8.00% 7,222.00 China 8.10% 9,518.00
Korea, Republic of 0.00% 17,594.00
Japan 2.00% - China 5.30% 8,854
Korea, Republic of 5.30% 26,459
France 0.00% 7,000.00 China 9.50% 5,269
Morocco 0.00% 14,760
Source: ITC Trade Map

44
Stagnant Export Growth as compared to Regional Peers
Pakistan’s exports of ‘Toilet linen and kitchen linen of textile materials (excluding of cotton or man-made fibres, floor cloths, polishing cloths, dishcloths and dusters)’ (HS-630299) increased to $90.57 million in 2018 from $60.84 million in 2014. Exports grew faster than world exports of ‘Toilet linen and kitchen linen of textile materials (excluding of cotton or man-made fibres, floor cloths, polishing cloths, dishcloths and dusters)’ (HS-630299) at 41.05 and 18.75 percent respectively per year over the last five years, this growth paled in comparison to the growth rates of other products in the category of towels and made-ups. As shown by the export performance in 2018, this sector could not make much headway in other exports, as seen by Pakistan’s low average growth rates compared to the growth rates of the world and its competitors. On the other hand, smaller countries like Viet Nam and Bangladesh have recently succeeded in capturing more significant market shares as shown by their export growth in ‘Toilet linen and kitchen linen, of terry towelling or similar terry fabrics of cotton (excluding floorcloths, polishing cloths, dishcloths and dusters)’ (HS-630260), ‘Floorcloths, dishcloths, dusters and similar cleaning cloths, of all types of textile materials’ (HS-630710) and ‘Toilet linen and kitchen linen of cotton (excluding of terry fabrics, floor cloths, polishing cloths, dishcloths and dusters)’ (HS-630291). It is evident that Pakistan lags its Asian peers. Unlike Pakistan, these countries have integrated polyester and other man-made fibre yarns into their towel value chain.
The fastest annual growth value of exports over 2014–18 is seen in ‘Toilet linen and kitchen linen, of terry towelling or similar terry fabrics of cotton (excluding floorcloths, polishing cloths, dishcloths and dusters)’ (HS-630260) and ‘Toilet linen and kitchen linen of cotton (excluding of terry fabrics, floor cloths, polishing cloths, dishcloths and dusters)’ (HS-630291). The highest growth was achieved by Viet Nam (6.57 and 5.89 percent) and Bangladesh (4.39 and 5.99 percent). China is the world leader in the exports of ‘Toilet linen and kitchen linen, of terry towelling or similar terry fabrics of cotton (excluding floorcloths, polishing cloths, dishcloths and dusters)’ (HS-630260), ‘Floorcloths, dishcloths, dusters and similar cleaning cloths, of all types of textile materials’ (HS-630710) and ‘Toilet linen and kitchen linen of cotton (excluding of terry fabrics, floor cloths, polishing cloths, dishcloths and dusters)’ (HS-630291) with combined exports of $4.06 billion. However, the per annum growth in China’s exports over 2014-18 was 1.18 percent for (HS-630260), 4.79 percent for (HS-630710) and a negative growth of 20.59 percent for (HS-630291).

45STRENGTHENING THE EXPORT COMPETITIVENESS OF PAKISTAN’S TOWEL AND TERRY MADE-UPS SECTOR
FIGURE 5-4 Export Performance in 2018
Source: ITC, Trade Map
Figure 5-4 Export Performance in 2018
Source: ITC, Trade Map
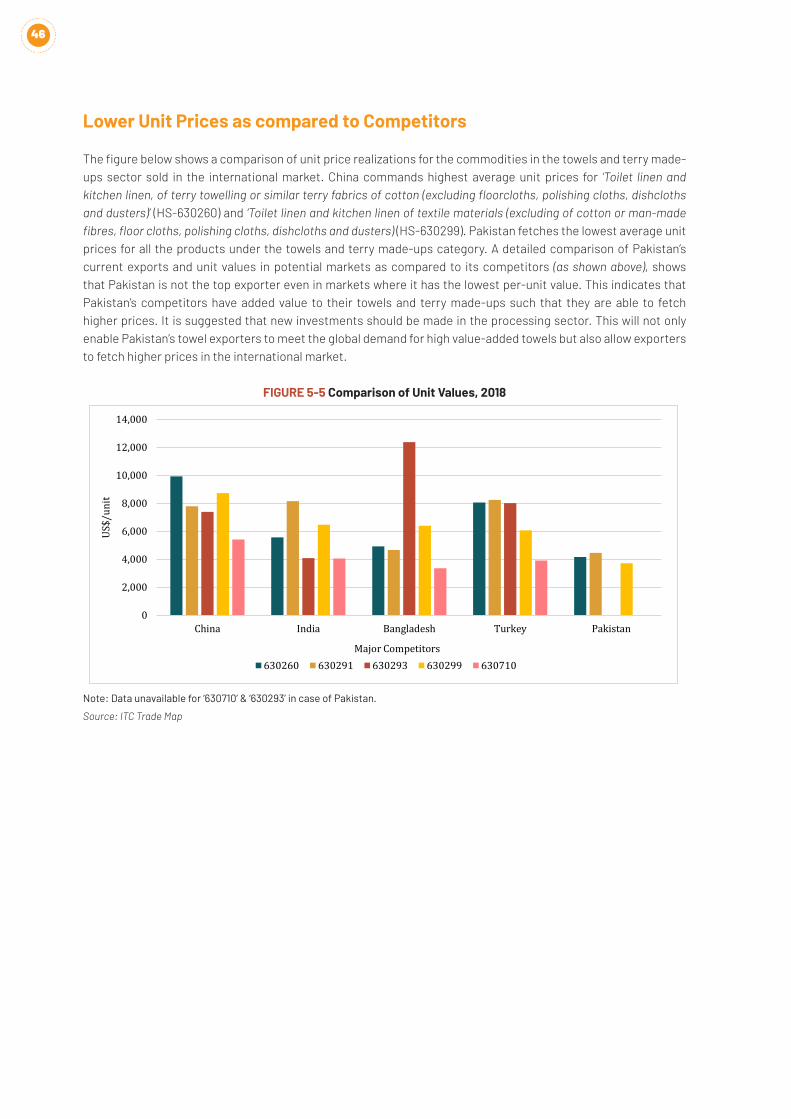
46
Lower Unit Prices as compared to Competitors
The figure below shows a comparison of unit price realizations for the commodities in the towels and terry made-ups sector sold in the international market. China commands highest average unit prices for ‘Toilet linen and kitchen linen, of terry towelling or similar terry fabrics of cotton (excluding floorcloths, polishing cloths, dishcloths and dusters)’ (HS-630260) and ‘Toilet linen and kitchen linen of textile materials (excluding of cotton or man-made fibres, floor cloths, polishing cloths, dishcloths and dusters) (HS-630299). Pakistan fetches the lowest average unit prices for all the products under the towels and terry made-ups category. A detailed comparison of Pakistan’s current exports and unit values in potential markets as compared to its competitors (as shown above), shows that Pakistan is not the top exporter even in markets where it has the lowest per-unit value. This indicates that Pakistan’s competitors have added value to their towels and terry made-ups such that they are able to fetch higher prices. It is suggested that new investments should be made in the processing sector. This will not only enable Pakistan’s towel exporters to meet the global demand for high value-added towels but also allow exporters to fetch higher prices in the international market.
FIGURE 5-5 Comparison of Unit Values, 2018
Note: Data unavailable for ‘630710’ & ‘630293’ in case of Pakistan.
Source: ITC Trade Map
Figure
5
-
5
Comparison of Unit Values, 2018
0
2,000
4,000
6,000
8,000
10,000
12,000
14,000
China India Bangladesh Turkey Pakistan
US$/
unit
Major Competitors 630260 630291 630293 630299 630710

47STRENGTHENING THE EXPORT COMPETITIVENESS OF PAKISTAN’S TOWEL AND TERRY MADE-UPS SECTOR
GSP-Plus
Pakistan acquired GSP-Plus status under the EU’s Generalized Scheme of Preferences in 2014. This scheme granted Pakistani exporters duty-free access to European markets in exchange for the special incentive arrangement for sustainable development and good governance. In 2018, Pakistan exported $433.4 million out of its total towels and terry made-ups of $1,328.6 million (32.1 percent) to the EU, a 5 percent increase from 2014. However, Pakistan’s exports of towels as a share of the EU imports from the world rose by a meager 3.1 percentage points from about 10.7 percent in 2014 to 13.7 percent in 2018.
FIGURE 5-6 Towels: As share of Pakistan Exports and EU Imports
Source: ITC Trade Map
Under the GSP-Plus scheme, $7.6 billion, 77.0 percent of EU imports from Pakistan comprised of textile products in 2018. Pakistan exported 46.3 percent of its total textile exports to the EU under the GSP-Plus in 2018. The proportion of towel exports jumped from 10.7 percent in 2014 to 13.5 percent in 2018. China, the market leader, has a 20.5 percent market share. The EU GSP-Plus is under review. To unlock the true potential of GSP-Plus and to retain duty-free access, Pakistan needs to concentrate on trying to wrest market share from China and Turkey.
TABLE 5-18 Comparison of EU Import Shares for Towels and Terry Made-ups
Country EU Imports in 2014 (US$, Million)
Share of EU Imports in 2014
EU Imports in 2018 (US$, Million)
Share of EU Imports in 2018
China 594.91 18.63% 647.70 20.48%
Turkey 529.38 16.57% 460.30 14.56%
Pakistan 341.30 10.69% 426.72 13.49%
India 314.41 9.84% 288.99 9.14%
Bangladesh 86.75 2.72% 101.47 3.21%
Source: ITC Trade Map
Figure
5-6
Towels: As share of Pakistan Exports and EU Imports
0%
2%
4%
6%
8%
10%
12%
14%
16%
0%
5%
10%
15%
20%
25%
30%
35%
2003 2004 2005 2006 2007 2008 2009 2010 2011 2012 2013 2014 2015 2016 2017 2018
Expo
rts a
s % o
f EU
Impo
rts
Expo
rts a
s % o
f Wor
ld E
xpor
ts
Exports as % of World Exports Exports as % of EU Imports
GSP- Plus

48
Free Trade Agreements have not helped Pakistan increase its Exports of Towels & Towel made-ups
The table below shows Pakistan FTAs/PTA, where Pakistan is offered concessions by partner country.
• Pakistan has the potential to export products to China under the category of ‘Towels and Terry made-ups,’ as these items are exposed to zero-duty under the Pakistan-China FTA. However, China currently imports only $1.77 million worth of towels and terry made-ups from Pakistan. The reasons behind low exports are:
Pakistan lacks sufficient capacity to meet the demand of the Chinese market. Further sophistication will require investment. Pakistan needs to increase the ratio of good quality dyes to enhance value-addition. NTBs such as labelling requirements and inspection requirements need to be overcome.
• Policymakers should focus on negotiating terms within the Pak-Malaysia FTA, and remove impediments to provide better opportunities for Pakistani towel and terry made-ups manufacturers.
TABLE 5-19 Concession on Towels & Towel made-ups under Trade Agreements
Product Code Pak-China FTA Product Code Pak-Malaysia FTA Product Code Pak-Mauritius PTA
HS-630260 ‘Toilet linen and kitchen linen, of terry towelling or similar terry fabrics of cotton (excluding floorcloths, polishing cloths, dishcloths and dusters)’
63026010 0%630260000 20% 630260 50% MOP
63026090 0%
HS-630291 ‘Toilet linen and kitchen linen of cotton (excluding of terry fabrics, floor cloths, polishing cloths, dishcloths and dusters)’
63029100 0%630291100 20%
630291 50% MOP630291900 20%
HS-630293 ‘Toilet linen and kitchen linen of man-made fibres (excluding floor cloths, polishing cloths, dishcloths and dusters)’
63029300 0%
630293100 20%
630293 50% MOP630293200 20%
630293300 20%
630293900 20%
HS-630299 ‘Toilet linen and kitchen linen of textile materials (excluding of cotton or man-made fibres, floor cloths, polishing cloths, dishcloths and dusters)’
63029910 0% 630299100 20%
630299 50% MOP63029990 0%
630299200 20%
630299900 20%
HS-630710 ‘Floorcloths, dishcloths, dusters and similar cleaning cloths, of all types of textile materials’
63071000 0% 630710000 20%
Source: Ministry of Commerce, Government of Pakistan, ITC Trade Map

49STRENGTHENING THE EXPORT COMPETITIVENESS OF PAKISTAN’S TOWEL AND TERRY MADE-UPS SECTOR
Chapter 6
Industry View on Enhancing Export Competitiveness of Pakistan’s Towel Sector1. Supply-side and Productivity Constraints
Inadequate Domestic Supply of Cotton
The towel sector in Pakistan is predominantly cotton-based. Therefore, one of the towel sector’s main inputs is the cotton crop. The majority of the towel manufacturers mentioned quality, price and availability of cotton as a major hurdle in the promotion of exports of towel products. Despite being the fifth largest cotton producing country in the world,27 Pakistan is a net importer of cotton, primarily due to the high demand for better grades of cotton for blending with other fibres and production of export-oriented quality textile items. Pakistan is one of the top consumers of cotton in the world, with average annual local mills’ consumption fluctuating between 13 million to 14 million bales.28 However, cotton production, which averaged 11.3 million bales per year between FY15-FY19, has fallen by 29.4 percent in the last five years.29 In FY2019, the cotton crop was short by 4.6 million bales, against the official target of 14.4 million bales.30 Pakistan needs to import 2 million to 4 million cotton bales per year as per the Pakistan Cotton Ginners Association and towel exporters. However, improvement in yield will help the textile value added industries to improve export competitiveness.
TABLE 6-1 Area, Production and Yield of Cotton
YearArea Production Yield
(000 Hectare) % Change (000 Bales) % Change (Kgs/Hectare) % Change
2014-15 2,961 - 13,960 - 802 -
2015-16 2,902 -2.0% 9,917 -29.0% 582 -27.4%
2016-17 2,489 -14.2% 10,671 7.6% 730 25.3%
2017-18 2,700 8.5% 11,946 11.9% 753 3.1%
2018-19P 2,373 -12.1% 9,861 -17.5% 707 -6.1%
P: Provisional (July-March)
Source: Pakistan Economic Survey, 2018-19
The cotton produced in Pakistan has short to medium fibre length, which is best suited for coarser fabrics like towels. Towels are made from coarse yarn and the coarse yarn is wastage of fine yarn. This means that the towels produced in Pakistan are very low value-added. The production of short-staple fibres impedes the domestic industry to produce high value-added items. China and India manufacture long staple cotton fibre towels such as Pima Cotton Towels, Supima Cotton Towels, Egyptian Cotton Towels, MicroCotton Towels and Turkish Cotton Towels, this results in high-end towel articles which are highly demanded in the world. To produce high value-added towels for exports, it is suggested that the towel manufacturers in Pakistan incorporate different types of long-staple cotton utilized by other top towel producing countries.31 It is expected that Pakistan’s imports of upland and long-staple cotton are likely to remain at last year’s level of 3.0 million bales. Moreover, the extension of EU GSP Plus could lend some support to consumption.32
27 Cotton production by country worldwide – Statista
28 Pakistan Central Cotton Committee
29 Percentage calculated using Pakistan Economic Survey 2018-19 data
30 https://www.thenews.com.pk/print/595254-country-fails-to-achieve-cotton-production-target
31 Duty-free access on Egyptian cotton produced by China and India could benefit Pakistan.
32 Pakistan Cotton and Products Annual 2019 – USDA Foreign Agricultural Service

50
TABLE 6-2 Duties on Raw Cotton and Cotton Yarn
FY19 FY20
Raw Cotton (Custom Duty) 2% 0%
Raw Cotton (Regulatory Duty) 3% 0%
Cotton Yarn 11% 5%
Source: PACRA (2020). Towels: Sector Study
Prices of cotton and yarn is another primary issue faced by the exporters. According to some manufacturers, the prices of yarn are decided by the stakeholders from the spinning mills and APTMA. There is no check and balance in determining yarn prices. Profit margins are constrained by the higher rates demanded by the local yarn suppliers, who hold towel industry hostage to domestic cotton and yarn.33 Due to some relief provided by the government under the PM exporter package (2017-21), the spinning sector prefers to export yarn to China, Bangladesh, and other regional competitors, which leaves high-priced yarn for towel exporters. On the other hand, exporters were getting yarn at a very competitive rate from India until the border recently closed due to the worsening geopolitical situation. Local yarn manufacturers were charging higher costs than the cost of Indian yarn and it was cheaper to import it. But to protect the spinning sector, the government imposed a regulatory of 10 percent34 and a custom duty of 11 percent, whereas cotton imports had a customs duty of 3 percent.35 With 11 percent customs duty imposed by the government, the import of cotton yarn declined by 29 percent in 2019.
Cotton yarn constitutes 50%-60% of the total cost of production. Other inputs, like chemicals, man-made fibres, softeners (starch, urea, etc.), bleaching agents, and dyes, are imported, which accounts for less than 10 percent of the total manufacturing cost. Domestically sourced labour and power constitute the remaining 30 percent. Moreover, sewing threads, labels, cartons and poly bags form another 4 percent to 5 percent of the cost.
Man-made Fibres
Primary raw materials used in the production of towels are indigenously produced by 100 percent local cotton yarn and different blends of ‘polyester’ or some other fibres such as ‘bamboo,’ ‘viscose,’ ‘modal,’ ‘Egyptian cotton,’ ‘Pima cotton’ etc. to provide strength to the towel. Artificial and synthetic fibres are blended in cotton in small percentages to improve yarn’s efficiency and reduce the cost of production to produce a high value-added towel. The material composition and the ratio of the product mix depend upon the demand of the customer: the fibre mix for towels stands at 80:20 or 70:30 in favor of cotton. However, it rarely happens and almost 90 percent of the products made are of 100 percent cotton which are being exported. Pakistan’s emerging competitors: Bangladesh, Viet Nam and Cambodia, have shifted to a ratio of 70:30 in favor of man-made fibres against the natural fibre. Additionally, demand for 100 percent MMF towels have continued to grow but have not yet surpassed the demand for blended cotton towels.
33 The exporters are getting double ply yarn for around Rs. 18,100 per pair and bobbin material for around Rs. 16,000
34 FBR Custom – Budget FY 2019-20, Salient Features
35 Pakistan Customs Tariff, 2019-20

51STRENGTHENING THE EXPORT COMPETITIVENESS OF PAKISTAN’S TOWEL AND TERRY MADE-UPS SECTOR
FIGURE 6-1 Global Demand for Cotton vs MMF Towels, 2001-18
Source: ITC Trade Map
Additionally, ‘micro-fibre’ is another man-made fibre, made from 100 percent polyester or a blend of polyester and polyamide, and is by far considered the best performing fibre used in the production of dishcloths, washcloths, bar mops, etc. This fibre has replaced the wiping materials needed for the production of low-end towel products. Moreover, due to its relatively longer life than the traditional cotton towels, microfibre towels are widely used for kitchen purposes. China has emerged as the world’s largest producer and exporter of ‘microfibre’ towels. However, the COVID-19 pandemic has affected the production in China because the factories were shut for several months.
Microfibres have created their own space in the market, creating 2 to 5 percent shares of the total production but still do not have enough potential to replace cotton in towels because of multiple challenges. One drawback associated with the production of microfibre towels is the issue of sustainability. The production of polyester towels is more energy-intensive, requiring chemicals, including carcinogens, thereby generating harmful greenhouse gases contributing to global warming. These towels cannot be recycled like cotton towels. There is a demand for it internationally because polyester is cheap. Still, nothing can replace 100 percent cotton towels because of its natural, organic, GMO-free (Genetically Modified Organisms) and quick absorbency features. Moreover, for the production of micro-fibre towels, water-jet looms are used in China.
Pakistan’s production and exports of towels made from blends of cotton and polyester staple fibres (PSF) and blends of cotton and viscose have remained low, unlike its competitors China and India. The world is shifting more towards man-made fibres (MMF), as shown in figure 3-2, polyester fibre accounted for 55.1 percent of total fibre production worldwide, compared with just 16.5 percent in 1998. To promote the exports of high value-added towels, it has become important for Pakistan to focus more on the production of towels made from man-made materials blended in cotton to increase the towel’s aesthetic effects.
Pakistan’s towel manufacturers have to rely on the synthetic fibre manufacturing sector to obtain blended yarns made from PSF. This sector has experienced a significant drop in its capacity, after primary plant closure – Dewan Salman Fibre Limited in 2008. Since then, Pakistan’s underlying capacity in the production of blended yarn is not well developed – only 25 percent of Pakistan’s spinning mills use man-made fibres to produce blended yarns.36 According to the Textile Commissioner Organization’s report ‘Performance of Textile Industry during 2017-18’, spinning mills consumed 93 million kgs of MMF. They produced 99.12 million kgs of blended yarn (34.7 percent of the total yarn production) at the end of June 2018.37 The government has sought to support local production of blended yarn through protectionist policies. Still, the spinning industry has failed to achieve the government’s objective of
36 https://dailytimes.com.pk/269261/pakistan-lags-behind-peers-in-synthetic-textiles-exports/
37 Textile Commissioner’s Organization (TCO) Government of Pakistan, 2017–18.
Figure
6-1
Global Demand for Cotton vs MMF Towels, 2001-18
2.36 2.44 2.97
3.34 3.92 4.17
4.56 5.02
4.37
5.33
6.40 6.16 6.63 6.72
6.26 6.68 6.76 6.97
0.00
1.00
2.00
3.00
4.00
5.00
6.00
7.00
8.00
-100
0
100
200
300
400
500
600
700
800
900
2000 2002 2004 2006 2008 2010 2012 2014 2016 2018 2020
US$
, Bill
ions
US$
, Mill
ions
Global Exports of Cotton Towels Global Exports of MMF Towels Pakistan Exports of MMF Towels

52
import-substitution of MMF, mainly polyester and viscose due to lack of modernization and unavailability of raw materials, such as Purified Terephthalic Acid (PTA) and Mono Ethylene Glycol (MEG), required to manufacture MMF. Therefore, the local spinning industry has been unable to meet the excess demand and the exporters have to rely on imports of MMF, which are subject to tariffs.
FIGURE 6-2 Pakistan Imports of Staple Fibres along with Duties Levied by the Government
Source: ITC Trade Map and Federal Board of Revenue Customs Tariff Data for 2015-16 and 2018-19
The following figure shows imports of PSF and viscose by our emerging competitors; Bangladesh and Viet Nam, for the production of textile materials. The customs duty levied by the governments of Bangladesh and Viet Nam on PSF is 5 percent38 and 2 percent.39
FIGURE 6-3 Imports of PSF and Viscose by Emerging Competitors in 2018
Source: ITC Trade Map
38 http://www.bangladeshcustoms.gov.bd/users/search_operative_tariff
39 https://www.customs.gov.vn/SitePages/Tariff-Search.aspx?language=en-US
Figure
6-2 Pakistan Imports of Staple Fibres along with Duties Levied by the Government
Figure 6-3 Imports of PSF and Viscose by Emerging Competitors in 2018
0
50
100
150
200
250
300
350
400
2014 2015 2016 2017 2018
US$
, Mill
ions
Viscose Rayon Polyester Other Artificial Fibers
Custom Duty: 3%
Custom Duty: 11%
Custom Duty: 5%
Custom Duty: 10%
0
100
200
300
400
500
600
Pakistan Bangladesh Viet Nam
US$
, Mill
ions
Polyester Staple Fibers Viscose Rayon

53STRENGTHENING THE EXPORT COMPETITIVENESS OF PAKISTAN’S TOWEL AND TERRY MADE-UPS SECTOR
Labour Productivity and Skill Development for Job Creation
The towel industry of Pakistan is highly labor-intensive. Its multiplier effect is enormous in the domestic sector. One job creates three additional jobs in the community. This is because the towel industry has backward linkages that provide inputs from many sources to produce a towel.40 Therefore, in addition to the jobs created by the towel industry, a large number of indirect jobs may also be created by this industry. The backward linkage multiplier in the textile sector was 7.76 in 2007. This means that a single unit injection into the textile sector yielded over 7.76 units of income in the economy through growth in downstream sectors.41
The textile industry of Pakistan provides employment to 30 percent of the 63.89 million national labour force (as of 2017 est.), or 40.0 percent of the industrial employment.42 Most of the workforce in the textile sector is reportedly unskilled. However, the highest skilled labour force is engaged in the finishing sector comprising 43.0 percent of the total labour force employed in the textile sector, followed by 35.1 percent in the weaving of textile articles, 11.5 percent in made-up articles including home textiles and towels, and, 4.7 percent in knitted crocheted fabrics.43 Inadequate labour supply of sufficiently trained workers hinders productivity, growth and quality in the towel sector. With the up-gradation of technology and the advent of advanced machineries such as shuttle-less and air-jet looms, more skilled workers and engineers are required to operate new machinery. This shortage of skilled labor is one of the reasons why advanced machinery is not being used to its full capacity hindering production.
TABLE 6-3 Working Time and Wages in the Textile Sector
2012-13 2014-15
Male Female Total Male Female Total
Average working time (weekly hours) 53.1 34.8 47.7 54.3 36.6 48.0
Textiles 53.9 39.1 51.1 54.2 39.7 49.9
Total wage employees (000) 1,902.0 429.2 2,331.2 1,945.2 455.1 2,400.3
Textiles 1,000.7 120.8 1,121.5 1,056.3 207.4 1,263.7
Average monthly earnings (000 rupees) 11.4 4.4 10.1 14.8 5.0 13.0
Textiles 12.1 3.8 11.3 15.8 5.0 14.0
Source: International Labour Organization (ILO)
The lack of sufficient trained workers is particularly concerning given that minimum wage for Pakistani textile workers is relatively high as compared to its regional peers. The minimum wage in East Punjab (India) is Rs. 8,776.83, while the trade unions in Bangladesh are asking for 8,000 takas for garment workers. However, the minimum monthly wage in Pakistan has dropped from $136 in 2018 to $107 in 2019 as a result of rupee depreciation against the dollar. On the other hand, the minimum monthly wage in Bangladesh has increased from $64 in 2018 to $95 (8,000 takas) in 2019. Unless firms look to appointing labour with requisite skill sets, entrepreneurs are at risk of spending more money to hire less qualified workers resulting in lower productivity, lower value-addition and reduced competitiveness.
40 Cotton growers, fibre producers, yarn spinners, weavers, dyeing and finishing, cutting and sewing, shipping, banking and insurance, machinery,
chemicals, water and energy suppliers and retailers.
41 https://www.brecorder.com/2020/01/15/561843/beating-the-odds-growth-in-global recession/
42 International Labour Organization (ILO)
43 Situation Analysis: Demand and Supply of Skilled Workforce in Textile Sector, Pakistan – National Vocational & Technical Training Commission
(NAVTTC)

54
FIGURE 6-4 Minimum Monthly Wages in US$ Market Exchange Rate
Source: Haq’s Musings. Retrieved from: http://www.riazhaq.com/2019/01/pakistan-garment-industry-becoming-more.html
Unlike regional competitors, labour productivity in Pakistan is low due to the absence of skilled workers. Therefore, exporters are unable to improve the quality of exports.
TABLE 6-4 Labour Productivity, 2017
Countries Labour productivity (US$ per hour worked, 2017)
Bangladesh 3.8
China 47.7
India 8.3
Malaysia 27.3
Sri Lanka 16.3
Pakistan 8.8
Viet Nam 5.2
Source: Asian Productivity Organization, 2019
The development of a qualified labour force is constrained by the limited utilization of youth in vocational training. The towel industry relies on SMA Rizvi Textile Institute (SMART) setup by TMA and TDAP. It is governed by the Ministry of Commerce and Textile to provide technical education and vocational training, especially to unskilled workers, to convert them into skilled workers for the towel industry. Only 2 percent of the youth population (of 4 million who reach working age), has acquired vocational training through the TVET system. Only a meager percentage of young people have received on-the-job training. This is insufficient to meet the local demand for skilled workers. Currently, ILO is working together with TMA to enhance skills of SMEs.

55STRENGTHENING THE EXPORT COMPETITIVENESS OF PAKISTAN’S TOWEL AND TERRY MADE-UPS SECTOR
FIGURE 6-5 Level and Gender Wise Existing Skilled Workforce in the Textile Sector
Source: Situation Analysis: Demand and Supply of Skilled Workforce in Textile Sector, Pakistan – NAVTTC
Limited Access to Technology and Outdated Machinery hinders Productivity and Quality
Even though Pakistan has traditionally been a cotton-growing country, there was only one mechanized towel manufacturing unit at the time of independence. The towel industry in Pakistan was practically non-existent before 1965. It started on a very small scale in that year. Initially, these units were small with four to twelve looms; however, with the passage of time, a number of new towel manufacturing units came into existence. At present, there are 400 towel manufacturing units in Pakistan. According to the Economic Survey of Pakistan (2019-20), the existing installed capacity of towels is about 10,000 shuttle and shuttle-less looms in both organized and unorganized sectors.
Due to an increase in competition and high demand for synthetic fibre towels, large-scale exporters have gradually upgraded their quality standards, and sophisticated machinery has been installed. The power looms are the most basic kind of looms with low speed and efficiency and high wastages. This technology was used in 1960-70; however, it is still in use today. Very few units use rapier technology and air-jet looms, which is based upon the latest technology with high speed, efficiency, and less wastage. Presently, the towel industry is equipped with 500 air-jet looms. SMEs in the towel industry operate well below capacity, using obsolete technology in weaving due to the non-availability of funds on a long-term basis with low mark-up, non-availability of land and non-availability of proper infrastructure. Even where the capacity is being utilized optimally, it is not operating at its maximum efficiency. The standard of management on the factory floor is another issue.
Technology adoption is the primary constraint not only in the weaving sector but also in the processing segment. The existing processing facilities in the towel sector are ill-equipped to provide quality in the final product demanded by developed markets. This low value-addition ultimately gives rise to low unit price realization in the global markets. Dyeing technology is classified into two types: 1) Batchwise dyeing machinery, allowing processing in rope form or open winches and 2) Continuous dyeing machinery aiming at high production runs and good quality. Batch fashion processing causes the final product to be inferior in quality as compared to the product obtained from continuous processing. There are only a few continuous processing units in the towel sector; the reason behind this is that the majority of businesses in the towel sector are comprised of SMEs, having smaller production capacity. Exporters get orders based on their manufacturing capability, meaning that it is mostly a small order. Orders in low volumes do not justify processing on a continuous unit. As a result, the manufacturers have to go with batch processing.
TVET Graduate
Male
Punjab Sindh
100908070605040302010
0Female
Work based learner Informal Sector
86
8 6
Male Female
56
22 2217
54
210
88
29

56
Processing in the towel sector is mostly outsourced. The plain-woven fabric after weaving is sent to independent processing units. This creates cost-quality trade-offs for the manufacturers who seek to minimize cost and maximize product quality. Manufacturers who produce good quality towels have their processing units because quality control becomes difficult when processing is sub-contracted.
Machinery used in the manufacturing of towels is imported at zero-duty. However, there is still a high duty on complimentary machinery and items such as chemicals and dyes, making the overall technological investment high.
TABLE 6-5 Import of Chemicals and Dyes
Chemicals & DyesImports in 2018-19 (US$, Millions)
Custom Duty (%), 2019-20
Bleaching Powder - 3.00%
Hydrogen Peroxide 3.55 11.00%
Sodium Hydrogen Sulphide 8.38 0.00%
Reactive Dyes 90.30 16.00%
Source: PBS, FBR

57STRENGTHENING THE EXPORT COMPETITIVENESS OF PAKISTAN’S TOWEL AND TERRY MADE-UPS SECTOR
TABLE 6-6 Import of Textile MachineryAll values in US$, Millions
Source: PBS, FBR
Machines Imports in 2017-18
Imports in 2018-19
Change over the last year (%)
Custom Duty (%), 2019-20
Top Supplier to Pakistan, Share in Pakistan's Imports of Machinery (%), 2018-19
Top Supplier by Quantity/Total Quantity Imported 2018-19
TOTAL 298.02 345.01 15.77%
TOTAL 184.83 228.61 23.69%Carding Machines 13.50 26.41 95.62% 0.00% Germany, 41.67% Switzerland: 112/300Combing Machines 8.71 5.46 -37.35% 0.00% India, 39.81% Switzerland: 20/50Drawing or Roving Machines 16.48 22.59 37.06% 0.00% Czech Republic, 21.45% Czech Republic: 67/338Blow Room Machinery 8.23 11.95 45.10% 0.00% China, 39.19% China: 133/325Other Machines for Preparing Textile Fibres 1.06 2.65 148.90% 0.00% Switzerland, 34.05% China: 30/71Textile Spinning Machines 72.36 82.24 13.65% 0.00% India, 48.56% China: 127,762/128,328 Textile Doubling or Twisting Machines 5.72 10.80 88.60% 0.00% India, 64.49% India: 579/837Weft Winding Machines 4.66 4.31 -7.41% 0.00% Japan, 43.96% Japan: 204/268Cone/Bobbin Winding Machines 10.77 11.85 10.05% 0.00% Germany, 51.63% Japan: 80/207Reeling Machines 0.07 0.02 -68.17% 0.00% China, 56.10% China: 5/6Other Textile Winding Machines 15.92 20.04 25.85% 0.00% Japan, 63.49% Japan: 81/215Other Machines for Preparing Textile Fibres 27.34 30.30 10.83% 0.00% China, 23.10% China: 198/602
TOTAL 74.29 71.22 -4.13%For weaving fabrics of a width <= 30cm 0.15 0.12 -17.44% 16.00% China, 64.08% China: 15/18Power looms for weaving fabrics of a width > 30 cm, shuttle type 0.18 0.26 42.09% 20.00% China, 100% China: 25/25
Hand looms for weaving fabrics of a width > 30 cm, shuttle type 8.54 4.41 -48.38% 0.00% China, 43.45% China: 254/487
Weaving machines for weaving fabrics of a width > 30 cm, shuttleless type 65.41 66.43 1.55% 0.00% Belgium, 36.14% Japan: 1,193/2,957
TOTAL 10.70 8.19 -23.50%Reeds for looms, healds and heald-frames: reeds 1.32 0.72 -45.55% 20.00% Turkey, 31.20% Turkey: 5,869/20,879
Reeds for looms, healds and heald-frames: other 1.75 0.86 -50.57% 11.00% China, 48.65% China: 13,542/26,910
Parts and accessories of weaving machines "looms" and their auxiliary machinery, n.e.s: shuttles
0.45 0.02 -96.09% 3.00% Austria, 53.61% Austria: 416/702
Parts and accessories of weaving machines "looms" and their auxiliary machinery, n.e.s: other
7.19 6.59 -8.34% 11.00% Belgium, 29.73% Belgium: 56,034/189,020
TOTAL 28.20 37.00 31.18%Washing Machines 10.12 11.33 11.98% 0.00% Italy, 44.65% Italy: 122/317Bleaching Machines 3.16 3.95 24.72% 0.00% Germany, 73.53% Germany: 3/13Dyeing Machines 14.92 21.72 45.57% 0.00% China, 32.35% China: 164/464
(unit in numbers)Machinery for Washing, Bleaching and Dyeing Textile Yarns, Fabrics or Made-Up Textile Articles
Machines for preparing textile fibres; spinning, doubling or twisting machines and other machinery for producing textile yarns; textile reeling or winding (including weft- winding) machines and machines for preparing textile yarns
Weaving Machines (Looms)
Auxiliary Machinery
(unit in numbers)
(unit in numbers)
(unit in kg)

58
Low Capacity Utilization prevents Economies of Scale
The units installed in the textile industry are not completely utilizing their installed capacity. This underutilization increases production costs and decreases profit margins. Underutilization of production capacities involves a smaller scale of production. This may be due to the lack of qualified workers and managers, outdated machinery and lower levels of management practices. These issues affect competitiveness and reduce the number of orders.
TABLE 6-7 Installed Capacity in the Textile Sector
Capacity 2014-15 2015-16 2016-17 2017-18
Capacity Installed
Spindles (Millions) 13.18 13.41 13.41 13.41
Rotors 185,387 185,259 198,801 198,801
Looms (Mill Sector) 7,934 8,188 9,084 9,084
Shuttle -less Looms 28,500 28,500 28,500 28,500
Power Looms 375,000 375,000 375,000 375,000
Capacity Worked (Average)
Spindles (Millions) 11.08 11.26 11.28 11.33
Rotors 140,500 115,041 126,583 126,583
Looms (Mill Sector) 5,895 5,488 6,384 6,384
Source: Performance of Textile Industry – TCO.
2. Ineffective Market Expansion Strategies for Trade Promotion
Lack of Market Penetration
Globally, the towel market is divided into two segments: the institutional market, including the hospitality sector and the home customers segment. By and large Pakistani exporters neither use distribution channels such as retail chains, customer agents, or commercial counsellors, nor do they efficiently market themselves through exhibitions resulting in a decline in market share. Currently, Pakistan exports towels to more than 128 countries; however, its overall Market Penetration Index (MPI),44 is low, with a value of 14.68 in 2017. By comparison, the Market Penetration Index (MPI) of India is 27.8. This shows that Pakistan lags behind India in terms of export expansion and penetration in the foreign markets.
Ineffective Strategies for Image Building and Brand Development
Pakistan’s image in the world as a towel supplier needs improvement. Currently, it stands as a low quality, low price, non-consistent and unreliable supplier due to lack of strategic planning at almost every international exhibition. Fairs and exhibitions can play a vital role in helping Pakistan build its image. The ‘Made in Pakistan’ label can be enhanced by efficiently utilizing the funds that have already been designated to the Export Promotion Bureau (EPB). The designing and standardizing of Pakistan’s stalls in these fairs should only be done by the Export Promotion Bureau (EPB), and later on, the results should be checked thoroughly for all the efforts made.
Competing countries use trade fairs to promote their industry. Pakistan needs to organize exhibitions of international standards locally as well as internationally in line with buyers’ expectations. The fairs being arranged locally should be well-advertised throughout the world to attract international customers and should also be included in the regular world exhibition calendar.
44 The extent to which a country’s exports reach proven markets.

59STRENGTHENING THE EXPORT COMPETITIVENESS OF PAKISTAN’S TOWEL AND TERRY MADE-UPS SECTOR
The Export Promotion Bureau (EPB) plays an important role in all such activities. Furthermore, a strategic joint venture between the private and the public sector should introduce a corporate marketing company which should be run by professionals and supported by the government. This would help build Pakistan’s image as a supplier of good quality towels in the world.
Despite having a strong textile export base, Pakistani companies have not put in enough effort to build their own brands. Selling products under ones own brand name helps achieve the highest level of value addition in terms of earnings. Huge investments by the manufacturers are required to be able to do this. Enormous potential lies in investing in brands for more prominent names for the domestic, regional, and global markets.
In order to improve our unit prices, more international brands should be invited to Pakistan as more foreign investment and joint ventures are being attracted successfully by our competitors. In today’s striving competition, it is important for the production and development of an international brand as this will also help build the towel industry if foreign investment is received. It is suggested that a ‘Brand Fund’ should be introduced to achieve the desired results. With the help of this fund, full support should be provided to the manufacturers and exporters who invest in building their brand names. The pattern of the Export Development Fund (EDF) should be used to create and subsidize such brands.
Joint Ventures
The Pakistan textile industry has not been very successful in attracting foreign collaborations and joint ventures. On the other hand, our competitors have been able to receive foreign collaborations due to which they are able to achieve transfer of technology and marketing expertise.
To move into the higher end of the market, towel manufacturers need to produce towels using dyed yarns, which fetch better prices than piece-dyed towels. The towel industry of Pakistan has not been able to grow in dyeing and finishing due to a lack of new technology, this results in rejections, process losses and high wastages.
It is important to promote foreign collaborations and joint ventures to improve merchandising and manufacturing processes, to introduce new technology and for building brands. This will lead to an improvement in Pakistan’s image and a rise in the unit values compared to the current values.

60
3. Business Environment and Trade Related Issues
Government Policies
1. Automated Mechanism for Export Incentives
The Drawback of Local Taxes and Levies (DLTL) is a government scheme under ‘Prime Minister’s Package of Incentives for Exporters’, which provides refunds of custom duties paid by the exporters on their inputs. The scheme offers a drawback of duties for the exports made from Pakistan, including Export Processing Zones (EPZs), for the period between July 2018 and June 2021. The refunds are made on two prerequisites: 50 percent of the rate of drawback will be provided to the exporter without the condition of increment; and the remaining 50 percent of the rate will be provided if the exporter achieves a year-on-year export growth rate of 10 percent.45 The DLTL rates under this package entail 4 percent for garments, 3 percent for towels and made-ups, and 2 percent for processed fabrics.46 The government previously cleared Rs.17.6 billion worth of claims on account of DLTL that had been pending for over a decade, however, at the time the interviews were conducted, the exporters complained that the claims were still pending with the FBR for over a decade. The refund involves cumbersome procedures in filing claims causing delays in payments resulting in a severe liquidity crunch for exporters. The current rebate rate on different types of towels is mentioned in the table below. Nevertheless, the government had to wait for the COVID-19 pandemic to begin settling the textile industry’s refunds under DLTL.47
TABLE 6-8 Comparative Statement of Customs Drawback of Local Taxes and Levies (DLTL)
Goods Produced or Manufactured Extent of Repayment of Custom Duties (% of the FOB value)
Revised Rates (% of the FOB value)
Increase/Decrease (%)
from: 05/03/2009 from: 31/03/2011
Cotton Towels Bleached(Full White)
0.44 0.71 (+) 0.27
Cotton Towel Partly or FullyDyed or Printed
1.08 1.88 (+) 0.80
Cotton/Polyester Blended Towels Bleached (Full white), All Blends
0.00 0.80 (+) 0.80
Cotton/Polyester Blended Towels Partly or Fully Dyed or Printed, All Blends
0.00 2.29 (+) 2.29
Source: Towel Manufacturers’ Association (TMA) & Federal Board of Revenue (FBR)
One of the most controversial issues in the existing tax regime is the refund of sales tax. A standard rate of 17 percent GST has been levied by the government on the previously five zero-rated sectors including textiles, to prevent revenue leakage.
Exporters’ liquidity has been severely impacted by the withdrawal of the zero-rating regime resulting in piling up of sales tax refunds with the FBR. Additionally, the cancellation of export orders and a general slowdown in global demand due to the COVID-19 pandemic has undermined operating results.
45 Increase of 10 percent or more in exports during the fiscal year 2018-19 as compared to the financial year 2017-18 or exports in the financial
year 2019-20 as compared the financial year 2018-19 or in the financial year 2020-21 as compared to the financial year 2019-20.
46 https://www.thenews.com.pk/print/628968-textile-policy-2020-25-pm-approves-in-principle-textile-export-target-of-28b-in-five-years
47 https://profit.pakistantoday.com.pk/2020/04/10/moc-releases-over-rs21bn-dltl-refunds-for-industries/

61STRENGTHENING THE EXPORT COMPETITIVENESS OF PAKISTAN’S TOWEL AND TERRY MADE-UPS SECTOR
2. Effect of Exchange Rate Movements on Exports
Exchange rates of Pakistan’s competitors in the towel sector need to be taken into account among other factors to determine export competitiveness. The Real Effective Exchange Rate (REER) is used to measure a country’s currency value relative to other major currencies and analyze the impact of other external factors such as competition and technological change on a country’s trade-weighted index. 48
The 22 percent appreciation from January 2013 till January 2017 (as indicated by the dotted line in figure 6-6), contributed to a decline in total exports by 14 percent. During the same period, exports of towels and terry made-ups declined by 0.50 percent.49 Due to a sharp decline in REER from the 2nd quarter of 2017 (Pakistani rupee declined by almost 26 percent), the overall exports of the towel group witnessed an upsurge (17 percent), which made Pakistani towels and made-ups more competitive in the international market.
FIGURE 6-6 Pakistan Real Effective Exchange Rate
Source: SBP, UN Comtrade
Exports are expected to decline post COVID-19, as Pakistan’s REER has become significantly less competitive as compared to India. Exchange rate stability in India is more than in Pakistan. According to the data published by the International Monetary Fund (IMF), Pakistan’s REER increased by 1.91 percent in the first quarter of 2020 to a value of 100.08 from 98.20 in the last quarter of 2019 when the coronavirus outbreak began. By limiting the depreciation, Pakistan’s towels have become more expensive in the global market as compared to Indian towels, given how much Indian currency has depreciated, thus reducing Pakistan’s export competitiveness.
48 Real Effective Exchange Rate (REER) as a product of Nominal Effective Exchange Rate (NEER) and Relative Price Index (RPI) depends on the
nominal exchange rates of the countries in the basket (given that the firms in these countries compete in the same market), their trade weights
with respect to the reporting economies, their respective Consumer Price Indices (CPI), the GDP deflator, producer prices, export prices and
unit labour costs. REER = NEER*RPI/100
49 Author’s estimation based on UN Comtrade data.
Figure 6-6 Pakistan Real Effective Exchange Rate
Figure 6-7 Comparison of Real Effective Exchange Rate (REER)
85
90
95
100
105
110
115
120
125
1301,200
1,400
1,600
1,800
2,000
2,200
2,400
2,600
2,800
Jan-
13Ap
r-13
Jul-1
3
Oct
-13
Jan-
14Ap
r-14
Jul-1
4
Oct
-14
Jan-
15Ap
r-15
Jul-1
5
Oct
-15
Jan-
16
Apr-
16
Jul-1
6
Oct
-16
Jan-
17Ap
r-17
Jul-1
7
Oct
-17
Jan-
18Ap
r-18
Jul-1
8
Oct
-18
Jan-
19Ap
r-19
Jul-1
9
Oct
-19
Jan-
20
REER
Inde
x (2
010=
100)
US$
, Mill
ions
Pakistan Exports REER
90.00
95.00
100.00
105.00
110.00
115.00
120.00
125.00
130.00
REER
Pakistan China India
COVID-19
PKR Overvalued by 22%

62
FIGURE 6-7 Comparison of Real Effective Exchange Rate (REER)
Source: IMF Data, Bank for International Settlements
3. Harassment by Different Government Agencies
Another major issue faced by the towel manufacturers is of harassment by various government agencies. Exporters complained about the self-contradictory behavior and indecisiveness of the government bodies that they face on a daily basis. The government needs to establish one-window operations for transparent and efficient audit exercises involved in documenting businesses in Pakistan. This will replace the tedious procedures that involve the interaction of exporters with various government functionaries. One suggestion which was put forward by exporters was to have a reasonable percentage of export remittances deducted at source as the exporters contribution to social security, EOBI and other labor levies and in lieu of this deduction, export industries should be exempt from dealing with the various labor related government agencies.
Limited Access to Credit hampers Investment in Working Capital
Limited availability of credit is another major issue faced by the towel exporters, especially SMEs. Towel exporters of Pakistan rely on bank credit to finance their working capital and fixed assets. Financial credit provided by commercial banks is restricted to collateralized lending, making it difficult for SMEs to provide security to the banks.50 Consequently, most SMEs finance their business through their own family or friends’ funds.51
For improving the competitiveness of their products, exporters have always relied on SBP’s EFS scheme. Commercial banks give exporters loans at a subsidized rate.52 However, the government has always crowded out the private sector from borrowing in order to finance its deficit. According to SMEDA, SMEs contribute 40 percent share in the national GDP and constitute 90 percent of all the enterprises in Pakistan. However, the share of SME financing in total financing is meager i.e., 7.60 percent as of December 2019.
The State Bank of Pakistan has announced some relief packages during the COVID-19 pandemic, one of which is the ‘Refinance Scheme for Working Capital Financing of Small Enterprises and Low-End Medium Enterprises,’ for the exporters. However, practically the only ones who can benefit from these packages are already borrowers, resulting in a lack of finance for the SME sector who are already in need of financial credit.
50 Banks ask small units for hefty collateral. Retrieved from: https://tribune.com.pk/story/2206207/2-banks-ask-small-units-hefty-collateral/
51 95% of the finance has been made by SME exporters themselves in the textile industry.
52 The current mark-up rate under EFS for the borrower stands at 3% (banks get refinance from SBP at 2% (1 % for SMEs) and are permitted a
maximum spread of 1% (2% for SMEs).
Figure 6-6 Pakistan Real Effective Exchange Rate
Figure 6-7 Comparison of Real Effective Exchange Rate (REER)
85
90
95
100
105
110
115
120
125
1301,200
1,400
1,600
1,800
2,000
2,200
2,400
2,600
2,800
Jan-
13Ap
r-13
Jul-1
3
Oct
-13
Jan-
14Ap
r-14
Jul-1
4
Oct
-14
Jan-
15Ap
r-15
Jul-1
5
Oct
-15
Jan-
16
Apr-
16
Jul-1
6
Oct
-16
Jan-
17Ap
r-17
Jul-1
7
Oct
-17
Jan-
18Ap
r-18
Jul-1
8
Oct
-18
Jan-
19Ap
r-19
Jul-1
9
Oct
-19
Jan-
20
REER
Inde
x (2
010=
100)
US$
, Mill
ions
Pakistan Exports REER
90.00
95.00
100.00
105.00
110.00
115.00
120.00
125.00
130.00
REER
Pakistan China India
COVID-19
PKR Overvalued by 22%

63STRENGTHENING THE EXPORT COMPETITIVENESS OF PAKISTAN’S TOWEL AND TERRY MADE-UPS SECTOR
TABLE 6-9 Ease of Financing in Competitor Countries
Percent of firms with a bank loan/line of credit
Proportion of loans requiring collateral (%)
Percent of firms using banks to finance investments
Proportion of investment financed by banks (%)
Percent of firms using banks to finance working capital
Proportion of working capital financed by banks (%)
Percent of firms identifying access to finance as a major constraint
Private Sector Lending as Percent of GDP (2010-17, Average)
Bangladesh (2013)
34.1% 84.4% 19.8% 12.4% 29.9% 13.6% 22.8% 43.0%
Cambodia (2016)
19.9% 77.5% 2.5% 0.9% 18.2% 7.4% 16.9% 46.0%
China (2012) 25.3% 77.6% 14.7% 4.5% 22.1% 6.4% 2.9% 137.0%
India (2014) 21.3% 84.7% 30.3% 18.1% 36.4% 17.8% 15.1% 52.0%
Pakistan (2013) 6.7% 64.0% 8.1% 2.0% 8.6% 2.5% 13.2% 16.0%
Viet Nam (2015) 40.8% 91.0% 29.3% 15.4% 32.3% 13.1% 10.8% 101.0%
Source: Enterprise Surveys – The World Bank
Cost of Doing Business and Global Competitiveness
According to towel manufacturers, Pakistan’s high cost of doing business is a significant factor affecting its competitiveness. The gas tariff in Pakistan is higher than the rates in emerging markets. According to industry sources, Pakistan’s gas rate per MMBTU is $2.3 higher than that of Viet Nam and $1.9 higher than that of Bangladesh. Moreover, in Pakistan, it costs $288/container to ship out an export order that reaches its destination in 58 hours (2 days and 10 hours). On the other hand, it costs $212/container in India to ship out an export order that reaches its destination in 52 hours (2 days and 4 hours).53 Apparently, in India, the Single Window Interface for Facilitation of Trade (SWIFT) system helps the traders lodge their clearance documents in minimal time, leaving time to serve the operational side of businesses. Additionally, the government of Pakistan is set to implement Pakistan Single Window (PSW) to streamline cross-border trade and improve logistics and inventory management.54
TABLE 6-10 Doing Business Comparison
Pakistan China India Bangladesh Viet Nam
Starting a Business
Procedures required to register a firm (number) 5 4 10 9 8
Time required to register a firm (days) 16.5 9 18 19.5 16
Cost of starting a new business (% of income per capita) 6.7 1.1 7.2 8.7 5.6
Minimum capital required to start a firm (% of income per capita)
0.0 0.0 0.0 0.0 0.0
Getting Electricity & Gas
Procedures to obtain permanent electricity connection (number)
6 2 4 9 4
Time to obtain permanent electricity connection (days) 113 32 53 125 31
Reliability of supply and transparency of tariff index (0-8) 5 7 6 0 7
Cost of getting permanent electricity connection (% of income per capita)
1,234.5 0.0 28.6 1,745.8 994.2
53 Border compliance captures the time and cost associated with compliance with the economy’s customs regulations and with regulations relating
to other inspections that are mandatory in order for the shipment to cross the economy’s border, as well as the time and cost for handling that
takes place at its port or border. The time and cost for this segment include time and cost for customs clearance and inspection procedures
conducted by other government agencies. Retrieved from: https://databank.worldbank.org/source/world-development-indicators.
54 Pakistan set to implement single window system for trade. Retrieved from https://www.dawn.com/news/1569074/pakistan-set-to-implement-
single-window-system-for-trade

64
Pakistan China India Bangladesh Viet Nam
Electricity Tariff (US cents/kWh) 7.5 8.0 7.2 11.0 8.0
Gas Tariff (US$/MMBTU) 6.5 - 7.0 4.6 4.2
Getting Credit
Strength of legal rights index (0-12) 2 4 9 5 8
Depth of credit information index (0-8) 7 8 7 4 8
Paying Taxes
Payments (number per year) 34 7 11 33 6
Time (hours per year) 283 138 252 435 384
Total tax and contribution rate (% of profits) 33.9 59.2 49.7 33.4 37.6
Corporate Tax Rate (%) 55 29.0 25.0 25.2 25.0 20.0
Trading Across Borders
Time to Export:
Border compliance (hours) 58 21 52 168 55
Documentary compliance (hours) 55 9 12 147 50
Cost to Export:
Border compliance (US$) 288 256 212 408 290
Documentary compliance (US$) 118 74 58 225 139
Time to Import:
Border compliance (hours) 120 36 65 216 56
Documentary compliance (hours) 96 13 20 144 76
Cost to Import:
Border compliance (US$) 287 241 266 900 373
Documentary compliance (US$) 130 77 100 370 183
Enforcing Contracts
Time taken to enforce contract (days) 1,071 496 1,445 1,442 400
Cost of enforcing contract (% of claim) 20.5 16.2 31.0 66.8 29.0
Source: World Bank Doing Business 2020, 17th Edition; Trading Economics55
The following table shows the overall ranking of doing business in Pakistan, in comparison with its competitors. According to the World Bank Ease of Doing Business Report 2020, Pakistan has improved its ranking from 136th in 2019 to 108th in 2020, showing a jump of 28 places. However, Pakistan has been performing poorly and is lagging well behind its competitors (except Bangladesh) in the overall ranking – China (77 places), India (45 places) and Viet Nam (38 places).
55 https://tradingeconomics.com/country-list/corporate-tax-rate

65STRENGTHENING THE EXPORT COMPETITIVENESS OF PAKISTAN’S TOWEL AND TERRY MADE-UPS SECTOR
TABLE 6-11 Doing Business Ranking
Pakistan China India Bangladesh Viet Nam
Overall 108 31 63 168 70
Starting a Business 72 27 136 131 115
Dealing with Construction Permits 112 33 27 135 25
Getting Electricity 123 12 22 176 27
Registering Property 151 28 154 184 64
Getting Credit 119 80 25 119 25
Protecting Minority Investors 28 28 13 72 97
Paying Taxes 161 105 115 151 109
Trading Across Borders 111 56 68 176 104
Enforcing Contracts 156 5 163 189 68
Resolving Insolvency 58 51 52 154 122
Source: World Bank Doing Business 2020, 17th Edition
The Global Competitiveness Index describes competitiveness by integrating different sets of factors based on 12 pillars: institutions; infrastructure; ICT adoption; macroeconomic stability; health; skills; product market; labour market; financial system; market size; business dynamism; and innovation capability.
Pakistan ranks lowest among its competitors. It ranks 11th from the bottom out of 141 economies in ‘ICT Adoption,’ 17th from the bottom in ‘Skills’ and 16th from the bottom in ‘Product Market.’ However, Pakistan performs better than Bangladesh in the fields of ‘Infrastructure,’ ‘Labour Market,’ ‘Financial System,’ ‘Market Size,’ ‘Business Dynamism,’ and ‘Innovation Capability.’ Moreover, Pakistan is least competitive among other competitors in the group, with China, Turkey, Viet Nam, and India taking the lead.
TABLE 6-12 Comparison of Global Competitiveness Indicators – 2019
China Turkey Viet Nam India Bangladesh Cambodia Pakistan
Overall 28 61 67 68 105 106 110
Institutions 58 71 89 59 109 123 107
Infrastructure 36 49 77 70 114 106 105
ICT Adoption 18 69 41 120 108 71 131
Macroeconomic Stability 39 129 64 43 95 75 116
Health 40 42 71 110 93 105 115
Skills 64 78 93 107 117 120 125
Product Market 54 78 79 101 119 113 126
Labour Market 72 109 83 103 121 65 120
Financial System 29 68 60 40 106 88 99
Market Size 1 13 26 3 36 84 29
Business Dynamism 36 75 89 69 121 127 52
Innovation Capability 24 49 76 35 105 102 79
Source: The Global Competitiveness Report 2019 – World Economic Forum

66
Logistics Performance Index (LPI)
Pakistan lacks industrial infrastructure for production. A few of the exporters commented that this is one of the factors impacting their growth plans. They said that there aren’t any developed proposals for industrial zones to facilitate the construction of more factories. In fact, existing infrastructure is not adequate for development because it is out of date. There are no existing gas pipelines, and the electricity supply is not stable. In addition, there is also a need to enhance logistics by providing improved transport links to ports and railway stations. This observation is also backed by secondary data showing that Pakistan has the lowest score and the lowest ranking in the Logistics Performance Index (LPI) among its competitors.
FIGURE 6-8 Comparison of Logistics Performance Index (LPI), 2018
Source: LPI Global Rankings 2018, World Bank
Pakistan lags in customs, tracking and tracing, and timeliness, and is only marginally ahead of Cambodia.
TABLE 6-13 Components of Logistics Performnace Index (Rank, 2018)
Economy Overall LPI Customs Infrastructure International Shipments
Logistics Quality and Competence
Traking and Tracing
Timeliness
Pakistan 122 139 121 97 89 136 136
China 26 31 20 18 27 27 27
India 44 40 52 44 42 38 52
Bangladesh 100 121 100 104 102 79 107
Viet Nam 39 41 47 49 33 34 40
Cambodia 98 109 130 71 111 111 84
Source: LPI Global Rankings 2018, World Bank
Figure 6-8 Comparison of Logistics Performance Index (LPI), 2018
122
26
44
100
39
98
0
20
40
60
80
100
120
140
0
0.5
1
1.5
2
2.5
3
3.5
4
Pakistan China India Bangladesh Viet Nam Cambodia
LPI R
ank
LPI S
core
LPI Score LPI Rank

67STRENGTHENING THE EXPORT COMPETITIVENESS OF PAKISTAN’S TOWEL AND TERRY MADE-UPS SECTOR
4. Socio-Economic and Environment Issues
Business Compliance with International Standards
As the consciousness of the international buyers about sustainability and treatment of workers in the textile sector increases, industries are required to adhere to more stringent regulations and Corporate Social Responsibility (CSR) practices to be able to sell to global buyers. Only a few Pakistani towel factories (including large and medium-sized enterprises) are certified under Supplier Ethical Data Exchange (SEDEX), Global Organic Textile Standard (GOTS)56, or the United States Worldwide Responsible Accredited Production (WRAP). These third-party independent companies conduct audits to ensure compliance with various environment, health and workers’ safety issues. The situation in some of the SMEs is not up to the required standards and this hampers access to international markets. It has been suggested by some SME exporters that the government should help spread awareness regarding EHS laws especially in the SME sector.
The International Labour Organization (ILO) visited the TMA house to launch the ‘Better Work Programme (BWP)’ in Pakistan to help industrial units meet requirements of the World Compliance Index.57 The latest international research conducted by ILO-BWP engaging 150 world brands, shows that better work habits can increase productivity by at least 20 percent. Pakistan ranked 34 out of 84 countries on the Global Business Complexity Index report, published by the TMF group.58 Global Business Complexity Index shows ‘how complicated and unpredictable a business environment is – and how difficult it is to understand and operate in.’ The survey was conducted to understand the business requirements, including legal, EHS compliance, accounting, tax and employment rules (i.e., hiring, firing and paying employees).
TABLE 6-14 Global Business Complexity Index, 2018
Jurisdictions Global Ranking (out of 84)
China 3
Viet Nam 8
India 15
Pakistan 34
Source: The Compliance Complexity Index Report, 2018 – TMF Group
56 The Global Organic Textile Standard was launched in 2006 as a leading international standard for the processing of textile goods using organic
fibres. This standard applies to the entire towel supply chain process, including raw material processing, manufacturing, packaging, labelling,
trading and distribution. Towels must contain a minimum of 70 percent organic fibres and undergo annual on-site bath towel inspection,
auditing and residue testing to become GOTS certified.
57 ILO keen to improve working conditions. Retrieved from: https://www.dawn.com/news/1513202
58 TMF Group is a multinational professional services firm headquartered in Amsterdam, Netherlands. The independent group provides
accounting, tax, HR and payroll services to businesses operating on an international scale.
Figure 6-8 Comparison of Logistics Performance Index (LPI), 2018
122
26
44
100
39
98
0
20
40
60
80
100
120
140
0
0.5
1
1.5
2
2.5
3
3.5
4
Pakistan China India Bangladesh Viet Nam Cambodia
LPI R
ank
LPI S
core
LPI Score LPI Rank

68
Installation of Common Effluent Treatment Plants (CETP)
Other than positive externalities arising from industrial concentration in EHS compliance, towel firms that are a part of the global supply chain have negative externalities within the sector as well. The towel industry consumes a large amount of water in the dyeing and finishing processes. Additionally, outdated dyeing processes release chemicals, like Persistent Organic Pollutants (POPs), into the water. New methods include optimization of the dyeing process itself without using water (i.e., using Air-Dye technology) and improved wastewater treatment by the installation of Effluent Treatment Plants (ETPs), which is designed to purify industrial wastewater for reuse.
The water can be used after processing as the materials are separated and neutralized. The purpose of the whole system is to eliminate the toxic materials and the processed water is reused rather than discharging it into rivers or the sea. The reuse of treated water decreases demand and dependence on water, and increases sustainability of the industry.
The world is moving towards zero discharge of hazardous water, thus ETPs have to be installed. The installation of a water treatment plant requires a minimum space of 869 square meters. There is thus a need for government support to the towel industry to fulfill this requirement. There should be a common treatment facility (communal plants) available for all the units, especially SMEs, and the government should subsidize and incentivize the installation of the treatment plants.

69STRENGTHENING THE EXPORT COMPETITIVENESS OF PAKISTAN’S TOWEL AND TERRY MADE-UPS SECTOR
Chapter 7
Performance of Pakistan’s Major Competitors in Towels and Terry Made-ups Segment
This section reviews the performance of Pakistan’s competitors in the towels and terry made-ups sector:
• China • India • Bangladesh • Viet Nam • Turkey • Cambodia
China
Infrastructure
• Rent-free factories in Special Economic Zones (SEZs).59
• Electricity Tariff US$0.6 cents/Kwh.60
Access to Finance/Credit:
• Tax exemptions of up to 15 percent for investment in Western Regions.61
• Wider access to finance and credit guarantees for SMEs.62
• Interest free loans to support local textile industry.63
Technology Upgradation
Special funds allocated for technological innovation and brand building.64
Labour Productivity
Creation of 110,000 jobs.65
59 Xinjiang’s Textile Park: A new challenge? Retrieved from: https://fp.brecorder.com/2018/10/20181014415100/
60 Xinjiang’s Textile Park: A new challenge? Retrieved from: https://fp.brecorder.com/2018/10/20181014415100/
61 China Extends 15% Profits Tax to Qualifying Investors in its Western Regions. Retrieved from: https://www.china-briefing.com/news/china-
extends-15-percent-profits-tax-qualifying-investors-western-regions-january-1-2021/
62 SMEs to be given wider access to financing. Retrieved from: https://www.chinadaily.com.cn/a/202001/09/WS5e162b60a310cf3e355834ca.html
63 Xinjiang’s Textile Park: A new challenge? Retrieved from: https://fp.brecorder.com/2018/10/20181014415100/
64 Ministry of Textiles, India, (2018)
65 Xinjiang’s Textile Park: A new challenge? Retrieved from: https://fp.brecorder.com/2018/10/20181014415100/

70
FIGURE 7-1 Export Performance of China, 2010-19
Source: ITC, Trade Map
TABLE 7-1 Tariffs Applied by Pakistan’s main Export Destinations on China (%)
630260 630291 630293 630299 630710
United States 9% 9% 8% 4% 5%
Top European Markets
United Kingdom 12% 12% 9% 12% 9%
Germany 12% 12% 9% 12% 9%
Italy 12% 12% 9% 12% 9%
Spain 12% 12% 9% 12% 9%
France 12% 12% 9% 12% 9%
Belgium 12% 12% 9% 12% 9%
Poland 12% 12% 9% 12% 9%
United Arab Emirates 5% 5% 5% 5% 5%
Canada 17% 17% 18% 17% 17%
Japan 7% 7% 5% 7% 6%
Australia 0% 0% 0% 0% 0%
Source: ITC, Trade Map
TABLE 7-2 Non-Tariff Barriers (NTBs) faced by China
Top Export Destination of Pakistan
All Products under Towels and Terry Made-ups
United States Special Authorization Requirement for SPS reasons, Storage & Transport, Cold/Heat Treatment, Fumigation, Labelling, Product Identity, Product Quality & Traceability Information Requirements
Top European Markets for Pakistan
Labelling, Marking & Testing Requirements
United Arab Emirates Labelling Requirements (Labels must be in Arabic)
Canada Product Identity, Product Quality, Product Registration, Testing Requirement, Direct Consumption Requirement, Consumption Taxes
Japan Labelling & Product Quality Requirements
Source: ITC, Market Access Map
Source: ITC, Trade Map
Table 7-1 Tariffs Applied by Pakistan’s main Export Destinations on China (%) 630260 630291 630293 630299 630710
United States 9% 9% 8% 4% 5%
Top European Markets
United Kingdom 12% 12% 9% 12% 9%
Germany 12% 12% 9% 12% 9% Italy 12% 12% 9% 12% 9% Spain 12% 12% 9% 12% 9% France 12% 12% 9% 12% 9% Belgium 12% 12% 9% 12% 9% Poland 12% 12% 9% 12% 9% United Arab Emirates 5% 5% 5% 5% 5%
Canada 17% 17% 18% 17% 17% Japan 7% 7% 5% 7% 6% Australia 0% 0% 0% 0% 0%
Source: ITC, Trade Map
Table 7-2 Non-Tariff Barriers (NTBs) faced by China Top Export Destination of Pakistan
All Products under Towels and Terry Made-ups
United States
Special Authorization Requirement for SPS reasons, Storage & Transport, Cold/Heat Treatment, Fumigation, Labelling, Product Identity, Product Quality & Traceability Information Requirements
Top European Markets for Pakistan Labelling, Marking & Testing Requirements
United Arab Emirates Labelling Requirements (Labels must be in Arabic)
Canada Product Identity, Product Quality, Product Registration, Testing Requirement, Direct Consumption Requirement, Consumption Taxes
Japan Labelling & Product Quality Requirements Source: ITC, Market Access Map
0
500
1,000
1,500
2,000
2,500
3,000
3,500
2010 2011 2012 2013 2014 2015 2016 2017 2018 2019
US$
, Mill
ions
630260 Terry Towels of Cotton 630710 Floorcloths, Dishcloths, & Cleaning Cloths630293 Towels of MMF 630291 Other Linen of Cotton630299 Other Linen of Textile Materials

71STRENGTHENING THE EXPORT COMPETITIVENESS OF PAKISTAN’S TOWEL AND TERRY MADE-UPS SECTOR
India
Infrastructure:
• Textile parks, cluster schemes, and Scheme for Integrated Textile Park (SITP) initiated by the government.66
• Power subsidy of up to Rs 3.77 per unit to powerlooms, spinning mills, and garment units.67
Access to Finance/Credit:
• Introduction of a special package worth Rs 71.48 billion for FY19 for apparel exports.68
• Interest subvention at 2 percent for farmers.69
Vocational Training/Labor laws/ Compliance:
Training subsidies between Rs. 3,000 and Rs 5,000 per employee (in Telangana).70
Technology Upgradation:
• 50 percent cost of installing common effluent treatment plants is borne by the government.71
• Capital subsidy-25 percent for conventional textiles; 35 percent capital subsidy for technical textiles.72
• Amended Technology Up-gradation Fund Scheme (ATUFS) for technology up-gradation of the textile industry.73
66 India: Government Formulating New Textile Policy. Retrieved from: https://www.fashionatingworld.com/new1-2/india-government-
formulating-new-textile-policy
67 Relief for textile units in Maharashtra as state govt offers power subsidy. https://www.business-standard.com/article/markets/relief-for-textile-
units-in-maharashtra-as-state-govt-offers-power-subsidy-119122000038_1.html
68 Budget 2018: Special package announced to boost textiles exports. Retrieved from: http://ptj.com.pk/Web-2018/03-2018/Around-the-World-
India.html
69 https://economictimes.indiatimes.com/news/economy/agriculture/rbi-notifies-2-interest-subsidy-scheme-for-short-term-crop-loans/
articleshow/68308544.cms
70 http://www.industries.telangana.gov.in/Library/Textile%20policy.pdf
71 http://admin.indiaenvironmentportal.org.in/files/file/Effluent%20Treatment%20Plant.pdf
72 https://indianexpress.com/article/business/telangana-govt-offers-incentives-to-textiles-industry-4803929/
73 India: Government Formulating New Textile Policy. Retrieved from: https://www.fashionatingworld.com/new1-2/india-government-
formulating-new-textile-policy

72
TABLE 7-3 Tariffs Applied by Pakistan’s main Export Destinations on India (%)
630260 630291 630293 630299 630710
United States 9% 9% 8% 3% 5%
Top European Markets
United Kingdom 10% 10% 8% 10% 7%
Germany 10% 10% 8% 10% 7%
Italy 10% 10% 8% 10% 7%
Spain 10% 10% 8% 10% 7%
France 10% 10% 8% 10% 7%
Belgium 10% 10% 8% 10% 7%
Poland 10% 10% 8% 10% 7%
United Arab Emirates 5% 5% 5% 5% 5%
Canada 17% 17% 18% 17% 17%
Japan 0% 0% 0% 0% 0%
Australia 5% 3% 3% 5% 5%
Source: ITC, Trade Map
FIGURE 7-2 Export Performance of India, 2010-19
Source: ITC, Trade Map
Source: ITC, Trade Map
Table 7-4 Non-Tariff Barriers (NTBs) faced by India Top Export Destination of Pakistan
All Products under Towels and Terry Made-ups
United States
Special Authorization Requirement for SPS reasons, Storage & Transport, Cold/Heat Treatment, Fumigation, Labelling, Product Identity, Product Quality & Traceability Information Requirements
Top European Markets for Pakistan Labelling, Marking & Testing Requirements
United Arab Emirates Labelling Requirements (Labels must be in Arabic)
Canada Product Identity, Product Quality, Product Registration, Testing Requirement, Direct Consumption Requirement, Consumption Taxes
Japan Labelling & Product Quality Requirements Source: ITC, Market Access Map
0
200
400
600
800
1000
1200
1400
2010 2011 2012 2013 2014 2015 2016 2017 2018 2019
US$
, Mill
ions
630260 Terry Towels of Cotton 630710 Floorcloths, Dishcloths, & Cleaning Cloths630293 Towels of MMF 630291 Other Linen of Cotton630299 Other Linen of Textile Materials

73STRENGTHENING THE EXPORT COMPETITIVENESS OF PAKISTAN’S TOWEL AND TERRY MADE-UPS SECTOR
TABLE 7-4 Non-Tariff Barriers (NTBs) faced by India
Top Export Destination of Pakistan
All Products under Towels and Terry Made-ups
United States Special Authorization Requirement for SPS reasons, Storage & Transport, Cold/Heat Treatment, Fumigation, Labelling, Product Identity, Product Quality & Traceability Information Requirements
Top European Markets for Pakistan
Labelling, Marking & Testing Requirements
United Arab Emirates Labelling Requirements (Labels must be in Arabic)
Canada Product Identity, Product Quality, Product Registration, Testing Requirement, Direct Consumption Requirement, Consumption Taxes
Japan Labelling & Product Quality Requirements
Source: ITC, Market Access Map
Bangladesh
Infrastructure:
Zones in Bangladesh have fully constructed and compliant buildings with proper supply of water, gas and electricity, along with Common Effluent Treatment Plants (CETP).74
Access to Finance/Credit:
• Duty drawback scheme on the import of raw materials for production on woven fabrics including home textiles.75
• Tax rebates between 25 percent to 100 percent over a 5-year period for manufacturers located in the EPZs of Chittagong and Dhaka.76
Technology Upgradation:
• No Specific Policy.
74 Bangladesh Water Sector Network Study (2018). Retrieved from: https://www.netherlandswaterpartnership.com/sites/nwp_corp/files/2019-01/
bangladesh_water_sector_network_studyreport.pdf
75 http://www.bangladeshcustoms.gov.bd/trade_info/duty_drawback_ti
76 https://www.bepza.gov.bd/investor_details/incentives-facilities

74
TABLE 7-5 Tariffs Applied by Pakistan’s main Export Destinations on Bangladesh (%)
630260 630291 630293 630299 630710
United States 9% 9% 8% 4% 5%
Top European Markets
United Kingdom 0% 0% 0% 0% 0%
Germany 0% 0% 0% 0% 0%
Italy 0% 0% 0% 0% 0%
Spain 0% 0% 0% 0% 0%
France 0% 0% 0% 0% 0%
Belgium 0% 0% 0% 0% 0%
Poland 0% 0% 0% 0% 0%
United Arab Emirates 5% 5% 5% 5% 5%
Canada 0% 0% 0% 0% 0%
Japan 0% 0% 2% 0% 0%
Australia 0% 0% 0% 0% 0%
Source: ITC, Trade Map
FIGURE 7-3 Export Performance of Bangladesh, 2010-19
Source: ITC, Trade Map
Note: Line of best is used due to unreported data for the year 2014.
TABLE 7-6 Non-Tariff Barriers (NTBs) faced by Bangladesh
Top Export Destination of Pakistan
All Products under Towels and Terry Made-ups
United States Special Authorization Requirement for SPS reasons, Storage & Transport, Cold/Heat Treatment, Fumigation, Labelling, Product Identity, Product Quality & Traceability Information Requirements
Top European Markets for Pakistan Labelling, Marking & Testing Requirements
United Arab Emirates Labelling Requirements (Labels must be in Arabic)
Canada Product Identity, Product Quality, Product Registration, Testing Requirement, Direct Consumption Requirement, Consumption Taxes
Japan Labelling & Product Quality Requirements
Source: ITC, Market Access Map
- -
Table 7-6 Non-Tariff Barriers (NTBs) faced by Bangladesh Top Export Destination of Pakistan All Products under Towels and Terry Made-ups
United States
Special Authorization Requirement for SPS reasons, Storage & Transport, Cold/Heat Treatment, Fumigation, Labelling, Product Identity, Product Quality & Traceability Information Requirements
Top European Markets for Pakistan Labelling, Marking & Testing Requirements
United Arab Emirates Labelling Requirements (Labels must be in Arabic)
Canada Product Identity, Product Quality, Product Registration, Testing Requirement, Direct Consumption Requirement, Consumption Taxes
Japan Labelling & Product Quality Requirements Source: ITC, Market Access Map
0
50
100
150
200
250
300
2010 2011 2012 2013 2014 2015 2016 2017 2018 2019
US$
, Mill
ions
630260 Terry Towels of Cotton 630710 Floorcloths, Dishcloths, & Cleaning Cloths630293 Towels of MMF 630291 Other Linen of Cotton630299 Other Linen of Textile Materials

75STRENGTHENING THE EXPORT COMPETITIVENESS OF PAKISTAN’S TOWEL AND TERRY MADE-UPS SECTOR
Viet Nam
Infrastructure:
• Economic Zones in Viet Nam benefit from improved connectivity, subsidized infrastructure and tax holidays.77
• Government provides production site for expansion or for investment-intensive projects.78
Access to Finance/Credit:
• Refund of value-added tax.79
• Zero-duty on the import of machinery.80
• Export credit at 4 percent lower interest rate.81
Vocational Training/Labor laws/ Compliance:
• No specific policy.
Technology Upgradation:
Financial support in R&D for technology transfers, strengthening the capability of scientific and technological bodies (laboratories, laboratory standards, R&D institutions etc.) research to improve productivity and quality, Test-trial production (new products & materials to replace imports).
FIGURE 7-4 Export Performance of Viet Nam, 2010-19
Source: ITC, Trade Map
77 Vietnam’s Key Regions and Economic Zones. Retrieved from: http://www.iberglobal.com/files/2017-2/vietnam-key-regions-economic-zones.
78 Vietnam’s Industrial Zones – How to Pick a Location for Your Business. Retrieved from: https://www.vietnam-briefing.com/news/vietnam-
industrial-zones-how-to-pick-location-for-your-business.html/
79 https://www.ids.trade/files/actif_report_on_vietnam_textile_and_garment_industry.pdf
80 https://www.ids.trade/files/actif_report_on_vietnam_textile_and_garment_industry.pdf
81 Ministry of Textiles, India, (2018). (as cited in “Pakistan’s Readymade Garments Sector: Challenges and Opportunities” CDPR and Pakistan
Business Council (PBC)).
Viet Nam
Infrastructure:
• Economic Zones in Viet Nam benefit from improved connectivity, subsidized infrastructure and tax holidays.77
• Government provides production site for expansion or for investment-intensive projects.78
Access to Finance/Credit:
• Refund of value-added tax.79 • Zero-duty on the import of machinery.80 • Export credit at 4 percent lower interest rate.81
Vocational Training/Labor laws/ Compliance:
77 Vietnam's Key Regions and Economic Zones. Retrieved from: http://www.iberglobal.com/files/2017-2/vietnam-key-regions-economic-zones.pdf 78 Vietnam’s Industrial Zones – How to Pick a Location for Your Business. Retrieved from: https://www.vietnam-briefing.com/news/vietnam-industrial-zones-how-to-pick-location-for-your-business.html/ 79 https://www.ids.trade/files/actif_report_on_vietnam_textile_and_garment_industry.pdf 80 https://www.ids.trade/files/actif_report_on_vietnam_textile_and_garment_industry.pdf 81 Ministry of Textiles, India, (2018). (as cited in “Pakistan’s Readymade Garments Sector: Challenges and Opportunities” CDPR and Pakistan Business Council (PBC)).
0
50
100
150
200
250
300
350
400
2010 2011 2012 2013 2014 2015 2016 2017 2018 2019(MirrorData)
US$
, Mill
ions
630260 Terry Towels of Cotton 630710 Floorcloths, Dishcloths, & Cleaning Cloths630293 Towels of MMF 630291 Other Linen of Cotton630299 Other Linen of Textile Materials

76
TABLE 7-7 Tariffs Applied by Pakistan’s main Export Destinations on Viet Nam (%)
630260 630291 630293 630299 630710
United States 9% 9% 8% 4% 5%
Top European Markets
United Kingdom 10% 10% 8% 10% 7%
Germany 10% 10% 8% 10% 7%
Italy 10% 10% 8% 10% 7%
Spain 10% 10% 8% 10% 7%
France 10% 10% 8% 10% 7%
Belgium 10% 10% 8% 10% 7%
Poland 10% 10% 8% 10% 7%
United Arab Emirates 5% 5% 5% 5% 5%
Canada 0% 0% 0% 0% 0%
Japan 0% 0% 0% 0% 0%
Australia 5% 0% 0% 0% 0%
Source: ITC, Trade Map
TABLE 7-8 Non-Tariff Barriers (NTBs) faced by Viet Nam
Top Export Destination of Pakistan
All Products under Towels and Terry Made-ups
United States Special Authorization Requirement for SPS reasons, Storage & Transport, Cold/Heat Treatment, Fumigation, Labelling, Product Identity, Product Quality & Traceability Information Requirements
Top European Markets for Pakistan Labelling, Marking & Testing Requirements
United Arab Emirates Labelling Requirements (Labels must be in Arabic)
Canada Product Identity, Product Quality, Product Registration, Testing Requirement, Direct Consumption Requirement, Consumption Taxes
Japan Labelling & Product Quality Requirements
Source: ITC, Market Access Map

77STRENGTHENING THE EXPORT COMPETITIVENESS OF PAKISTAN’S TOWEL AND TERRY MADE-UPS SECTOR
Cambodia
Access to Finance/Credit:
Export tax exemption for up to 3-5 years.82
TABLE 7-9 Export Performance of Cambodia, 2010-19
Code Product Label 2010 2011 2012 2013 2014 2015 2016 2017 20182019
(Mirror Data)
630260 Terry Towels of Cotton 0 0 0 0 19 0 18 122 230 73
630710Floorcloths, Dishcloths, & Cleaning Cloths
246 34 35 51 377 729 2,165 5,194 4,175 2,762
630293 Towels of MMF 0 0 0 0 0 0 0 316 83 22
630291 Other Linen of Cotton 0 0 0 0 0 0 5 0 0 0
630299Other Linen of Textile Materials
0 0 7 11,332 0 76 42 44 172 1
Source: ITC, Trade Map
TABLE 7-10 Tariffs Applied by Pakistan’s main Export Destinations on Cambodia (%)
630260 630291 630293 630299 630710
United States 9% 9% 8% 3% 5%
Top European Markets
United Kingdom 0% 0% 0% 0% 0%
Germany 0% 0% 0% 0% 0%
Italy 0% 0% 0% 0% 0%
Spain 0% 0% 0% 0% 0%
France 0% 0% 0% 0% 0%
Belgium 0% 0% 0% 0% 0%
Poland 0% 0% 0% 0% 0%
United Arab Emirates 5% 5% 5% 5% 5%
Canada 0% 0% 0% 0% 0%
Japan 0% 0% 0% 0% 0%
Australia 0% 0% 0% 0% 0%
Source: ITC, Trade Map
TABLE 7-11 Non-Tariff Barriers (NTBs) faced by Cambodia
Top Export Destination of Pakistan
All Products under Towels and Terry Made-ups
United States Special Authorization Requirement for SPS reasons, Storage & Transport, Cold/Heat Treatment, Fumigation, Labelling, Product Identity, Product Quality & Traceability Information Requirements
Top European Markets for Pakistan
Labelling, Marking & Testing Requirements
United Arab Emirates Labelling Requirements (Labels must be in Arabic)
Canada Product Identity, Product Quality, Product Registration, Testing Requirement, Direct Consumption Requirement, Consumption Taxes
Japan Labelling & Product Quality Requirements
Source: ITC, Market Access Map
82 Ghazanchyan, M., Klemm, A., & Zhou, Y. S. (2018). Tax Incentives in Cambodia. IMF Working Papers, 18(71), 1. https://doi.
org/10.5089/9781484347522.001

78
Chapter 8
Government Support in Pakistan for the Textile Sector
• Allocation of Rs. 103.50 million for 1000 Industrial Stitching Units. (Budget 2020-21). • Reduction of sales tax on local retail from 14 percent to 12 percent. (Budget 2020-21). • DLTL refunds of Rs20.5 billion for textiles. PM Incentive Package – COVID-19. • An additional Rs6.2 billion (about US$37.05 million) refunds to support its textile sector. PM Incentive
Package – COVID-19. • Reduction in withholding tax on the import of machinery. (Budget 2020-21). • Subsidy on energy was reduced from Rs24 billion to Rs10 billion. (Budget 2020-21). • SBP has reduced mark-up rates for two schemes: Temporary Economic Refinance Facility (TERF) from
the existing 7 percent to 5 percent and Long Term Financing Facility (LTFF) for the non-textile sector from 6 percent to 5 percent.
• Additional incentive scheme was announced by the government to support businesses to prevent layoffs and provide refinancing at zero percent.

79STRENGTHENING THE EXPORT COMPETITIVENESS OF PAKISTAN’S TOWEL AND TERRY MADE-UPS SECTOR
Chapter 9
Recommendations
Despite being one of the top cotton-producing countries in the world, the cotton crop in Pakistan is not at par with the world in terms of yield. The table below suggests that Pakistan at best had less than half the per hectare yield as that of China (world’s best in cotton yield) for its cotton crop in 2018-19. China grew 23.4 percent of the world’s cotton on just 10.5 percent of the global acreage used for growing cotton in 2018-19.83 However, the numbers are expected to lead to a decrease in yields due to COVID-19. According to the Economic Survey of Pakistan 2019-20, the total seed requirement was 57,205 metric tonnes. However, the amount of seeds locally available and imported was 21,844 metric tonnes. It is recommended that emphasis needs to be on improving cotton seeds and adopting better farm management techniques through the transfer of technology. There should be a cotton research institute that works on the techniques of growing good quality cotton. Improving the yields of the cash crop will help the manufacturers in the entire value chain enhance competitiveness.
TABLE 9-1 Effect of Covid-19 on World Cotton Yield
Yield (Kgs/Hectare)
Pakistan India China (World’s Best Yield)
Pakistan’s Yield as a % of China’s Yield
2017-18 661 501 1,761 37.5%
2018-19 719 446 1,726 41.6%
2019-20 (Projected Effects of Covid-19)
575 494 1,720 33.4%
Source: COVID–19 Spurs Record Downward Adjustments to Global Demand – USDA April, 2020
Moreover, when the currency gets devalued, domestic cotton and yarn suppliers automatically increase prices as they match the prices they will get in the international market and demand exporters to pay them at the same conversion rate. The government imposes a regulatory duty on imports of cotton and yarn, putting towel manufacturers out of the international market by protecting the spinning sector. However, with the devaluation, the spinners will already be getting a much higher price for their cotton in the global market. There is certainly no requirement to impose a duty on cotton and cotton yarn.
Another problem that the towel manufacturers face is that of the vicinity. The sugar mills owners have established their sugar mills in close proximity to the areas where cotton was grown. As a result, the growers started growing sugarcane instead of cotton. The government must start from the base and encourage growers to grow cotton by incentivizing the growing of cotton and do away with the support prices for sugarcane.
In the ever-increasing competitive world, Pakistan’s towel industry has to keep pace with modern trends by continually creating new designs that are demanded in the international markets. To promote the exports of high value-added embroidered towels, Pakistan needs to focus more on the production of towels made from man-made materials blended in cotton to increase the towel’s aesthetic effects. Therefore, to increase the production of artistic towels, manufacturers must use low percentages of white and high proportions of dyed yarns using MMFs and cotton both. Hence, it is suggested that the government may abstain from increasing custom duty on polyester to promote value-addition and competitiveness in the international market.
83 Percentage calculated using USDA data.

80
The towel industry of Pakistan is highly labor-intensive. However, the limited availability of skilled labour force hinders quality, productivity and value for growth in exports. Moreover, the institutions are not synchronized with the needs of the industry. The approved course material (curricula) dates back to the 1970s and is outdated, and which cannot be applied to 2020. It is recommended that training staff be given exposure to the international syllabus and to make course content more relevant to the challenges that the industry faces today.
There is a need to make considerable investments in the areas of processing to catch up with our competitors like India and Bangladesh. Technology adoption rates are low in Pakistan as investment in technology is risky and not subsidized sufficiently. Value addition is not possible unless there is a technology shift. By installing modern processing machinery, it is possible to achieve a high average unit price for Pakistani towels in the global market. Better machines and workers knowing advanced production techniques will ensure consistent quality, which cannot be expected from the existing resources. To compete in global markets, Pakistani manufacturers must upgrade both technology and processing. Upgradation should be funded through either tax incentives or lower rates of mark-up for capital investments. The government formulated a Technology Upgradation Fund (TUF) scheme to facilitate the textile sector. Still, the exporters complain that this scheme has not been effective because it does not reduce the risks associated with technology adoption. Furthermore, chemicals and dyes used in textiles should be zero-rated as well, to make technological investment more attractive.
To move into the higher end of the markets, towel manufacturers need to produce towels using dyed yarns, which fetch better prices than piece-dyed towels. The towel industry of Pakistan has not been able to grow in dyeing and finishing due to a lack of new technology; this results in rejections, process losses and high wastages. The printing aspect will add another dollar to the value of the towel. Disney is coming back in the field, and the Chinese products are being discouraged, which will create space in the printing sector. However, the value addition in the form of reactive printing on towels is currently being done by only a few manufacturers in Pakistan. Hence, it is suggested that the government may abstain from imposing custom duty on reactive dyes (CD: 16 percent) to promote value-addition and competitiveness in the international market.
The fairs being arranged locally should be well-advertised throughout the world to attract international customers and should also be included in the regular world exhibition calendar.
In order to improve unit prices, more international brands should be invited to Pakistan as more foreign investment and joint ventures are being attracted successfully by our competitors. It is suggested that a ‘Brand Fund’ should be introduced to achieve the desired results. With the help of this fund, full support should be provided to the manufacturers and exporters who invest in building their brands.
It is important to promote foreign collaborations and joint ventures to improve trade in marketing and manufacturing processes, to introduce new technology and build brands. This will lead to an improvement in Pakistan’s image and a rise in the unit values compared to the current values.
To mitigate the impact of COVID-19 on the towel industry and to sustain employment and exports of the country, sales tax “zero rating” should immediately be restored for 5 export-oriented sectors to support the already struggling export sector and ensure that their liquidity issues are resolved. The rebate and sales tax refund structure should be audited based on the input-output coefficients and timely adjustments are made to maintain exporters’ competitiveness in the international market.
The PBC’s Policy Brief containing the key recommendations for a framework for SEZs published in November 2019 highlighted that “The most successful model adopted by China is to empower local administrations of SEZs to work within a national policy framework to simplify and offer “one-stop/single windows” for all approvals and government interfacing. This includes building permissions, visas and work permits, customs etc.”84At the time
84 The Pakistan Business Council. (2019, November). PBC Policy Brief containing the key recommendations for a framework for SEZs. https://www.

81STRENGTHENING THE EXPORT COMPETITIVENESS OF PAKISTAN’S TOWEL AND TERRY MADE-UPS SECTOR
the interviews were conducted, the exporters also recommended that the government needs to establish one-window operations for transparent and efficient audit and to replace the tedious procedures that involve the interaction of exporters with various government agents. According to an article published by Dawn on 15th July 2020, the government of Pakistan is set to implement Pakistan Single Window (PSW) to streamline cross-border trade and improve logistics and inventory management. 85
Major part of the towel industry, especially SMEs, is self-financed. The government should provide incentives and boost lending to the private sector by reducing the export refinance rate in order to improve the competitiveness of the towel sector.
To retain the towel industry’s competitiveness amidst the COVID-19 crisis, the government must extend the concessionary rates for utilities for the next three years.86
Environment, Health and Safety (EHS) and Corporate Social Responsibility (CSR) practices are not an integral part of doing business in the towel sector, having negative repercussions on social impacts and ineligibility to supply buyers (mainly developed countries) concerned about workers’ health and safety. The government needs to help spread awareness regarding EHS laws, especially in the SME sector.
The world is moving to zero discharge of hazardous water, for which CETPs have to be installed. Therefore, the need of the hour is that the government should support the towel industry in fulfilling this environmental condition. There should be a common treatment facility for all units, especially SMEs, and the government should subsidize and incentivize the installation of the treatment plants. But the subsidy should be accompanied with proper checks and balances. Not only this transition to sustainable development would lead to preserving the environment but could also be used as a marketing tool to add value to the final product.
pbc.org.pk/wp-content/uploads/PBCs-Recommended-Framework-for-SEZs-V3.pdf
85 Pakistan set to implement single window system for trade. Retrieved from https://www.dawn.com/news/1569074/pakistan-set-to-implement-
single-window-system-for-trade
86 Export-oriented industry: TMA calls for continuation of tariffs. Retrieved from: https://www.brecorder.com/news/40003588/export-oriented-
industry-tma-calls-for-continuation-of-tariffs

82
ReferencesAbbas, G. (2020, April 10). MoC releases over Rs21bn DLTL refunds for industries. Profit by Pakistan Today. https://profit.pakistantoday.com.pk/2020/04/10/moc-releases-over-rs21bn-dltl-refunds-for-industries/
Acar, N. D. (2004). Technology of Towel and Bathrobe Production (in Turkish). Unpublished Master’s Thesis, Pamukkale University, Denizli, Turkey.
Alexandra Wexler (2014). Cotton’s crown threatened by man-made fibres. The Wall Street Journal, 25 April. Retrieved from https://www.wsj.com/articles/cottons-crown-threatened-by-manmade-fibres-1398466740
Bangladesh Customs, National Board of Revenue (NBR). (n.d.). Bangladesh Customs. http://www.bangladeshcustoms.gov.bd/trade_info/duty_drawback_ti
BANGLADESH WATER SECTOR NETWORK STUDY. (2018). https://www.netherlandswaterpartnership.com/sites/nwp_corp/files/2019-01/bangladesh_water_sector_network_studyreport.pdf
Beating the odds: growth in global recession. (2020, January 15). Brecorder. https://www.brecorder.com/2020/01/15/561843/beating-the-odds-growth-in-global%20recession/
Bozgeyik, K. (1991). A qualitative research on Towels. Unpublished Master’s Thesis, Ege University, Izmir, Turkey (in Turkish).
Briefing, C. (2020, May 29). China Extends 15% Profits Tax in the Western Region from Jan 1, 2021. China Briefing News. https://www.china-briefing.com/news/china-extends-15-percent-profits-tax-qualifying-investors-western-regions-january-1-2021/
Exchange, T. (2019). Preferred Fibre and Materials Market Report 2017. Textile Exchange.
Export-oriented industry: TMA calls for continuation of tariffs. (2020, July 8). Brecorder. https://www.brecorder.com/news/40003588/export-oriented-industry-tma-calls-for-continuation-of-tariffs
Federal Board of Revenue, Government of Pakistan. (2019). PAKISTAN CUSTOMS TARIFF 2018-19. http://download1.fbr.gov.pk/Docs/2018817158749999PakistanCustomTariff2018-19-CH1-99.pdf
Ghazanchyan, M., Klemm, A., & Zhou, Y. S. (2018). Tax Incentives in Cambodia. IMF Working Papers, 18(71), 1. https://doi.org/10.5089/9781484347522.001
Hamza, A. (2018, July). Pakistan lags behind peers in synthetic textiles exports. Daily Times. https://dailytimes.com.pk/269261/pakistan-lags-behind-peers-in-synthetic-textiles-exports/
How bath towel is made - material, production process, making, history, used, composition, product, industry. (n.d.). Madehow.Com. Retrieved August 19, 2020, from http://www.madehow.com/Volume-4/Bath-Towel.html
Huynh, P. (2017). Employment and wages rising in Pakistan’s garment sector. Asia-Pacific Garment and Footwear Sector Research. International Labour Organization (ILO).
Incentives & Facilities. (2015). BEPZA. https://www.bepza.gov.bd/investor_details/incentives-facilities

83STRENGTHENING THE EXPORT COMPETITIVENESS OF PAKISTAN’S TOWEL AND TERRY MADE-UPS SECTOR
India: Government formulating new textile policy. (n.d.). Fashionating World. https://www.fashionatingworld.com/new1-2/india-government-formulating-new-textile-policy
International Trade Centre (2016), Trade Competitiveness Map. Retrieved from: https://tradecompetitivenessmap.intracen.org/TPIC.aspx
International Trade Centre (2018). Trade Map Database. Retrieved from: https://www.trademap.org/Index.asp
Khan, M. Z. (2020, July 15). Pakistan set to implement single window system for trade. DAWN.COM. https://www.dawn.com/news/1569074/pakistan-set-to-implement-single-window-system-for-trade
List of Countries by Corporate Tax Rate. (n.d.). Trading Economics. https://tradingeconomics.com/country-list/corporate-tax-rate
METI Holds Third Meeting of Japan-Viet Nam Joint Committee on Cooperation in Industry, Trade and Energy. (2018, October 12). Ministry of Economy, Trade and Industry. https://www.meti.go.jp/english/press/2018/1012_004.html
Ministry of Finance (2020). Pakistan Economic Survey (2019-20).
Morshed, A. (2019, December 5). Japan-Bangladesh ties: Riding the next wave of globalisation. The Daily Star. https://www.thedailystar.net/opinion/perspective/news/japan-bangladesh-ties-rid-ing-the-next-wave-globalisation-1835767
M.S. (2019, September 24). Cotton production by country worldwide, 2019. Statista. https://www.statista.com/statistics/263055/cotton-production-worldwide-by-top-countries/
Mustafa, K. (2020, March 14). Textile Policy 2020-25: PM approves in principle textile export target of $28b in five years. The News International. https://www.thenews.com.pk/print/628968-textile-policy-2020-25-pm-approves-in-principle-textile-export-target-of-28b-in-five-years
National Vocational & Technical Training Commission (NAVTTC) (2019). Situation Analysis: Demand and Supply of Skilled Workforce in Textile Sector, Pakistan.
Nawab, Y. (2017). Fabric Manufacturing Calculations Process and Product.
Operative Tariff. (n.d.). Bangladesh Customs. http://www.bangladeshcustoms.gov.bd/users/search_operative_tariff
PakistanTextile Journal. March 2018 - Around the World. (n.d.). Pakistan Textile Journal. http://ptj.com.pk/Web-2018/03-2018/Around-the-World-India.html
PBC. (2020). PAKISTAN’S TRADE DATA (JULY’19-MAY’20). The Pakistan Business Council. https://www.pbc.org.pk/wp-content/uploads/Trade-Data-FY-20-Jul-to-May.pdf
Perfect Sourcing Newsdesk. (2019, February 7). An Overview — The Global MMF Market with an Indian Twist. Perfect Sourcing — Latest Fashion, Apparel, Textile and Technology News. https://perfectsourcing.net/global/an-overview-the-global-mmf-market-with-an-indian-twist/

84
RBI notifies 2% interest subsidy scheme for short-term crop loans. (n.d.). The Economic Times. https://economictimes.indiatimes.com/news/economy/agriculture/rbi-notifies-2-interest-subsidy-scheme-for-short-term-crop-loans/articleshow/68308544.cms
Report on Vietnam Textile and Garment Industry. (2010). https://www.ids.trade/files/actif_report_on_vietnam_textile_and_garment_industry.pdf
Research. (n.d.). International Labour Organization. Retrieved May 19, 2020, from https://www.ilo.org/global/research/lang--en/index.htm
Shah, N. (2020, January 8). Country fails to achieve cotton production target. The News International. https://www.thenews.com.pk/print/595254-country-fails-to-achieve-cotton-production-target
SMEs to be given wider access to financing. (n.d.). Chinadaily.Com.Cn. https://www.chinadaily.com.cn/a/202001/09/WS5e162b60a310cf3e355834ca.html
Textile Commissioner’s Organization. (2019). Performance of Textile Industry - TCO Karachi. http://www.tco.com.pk/documents/de6897176d.pdf
Textile Exchange. (2019, November). Preferred Fibre & Materials Market Report 2019. https://textileexchange.org/wp-content/uploads/2019/11/Textile-Exchange_Preferred-Fiber-Material-Market-Report_2019.pdf
The Aga Khan University. (2019). Exploring ‘Monday fever’ in Pakistan’s textile sector. The Aga Khan University News. Retrieved from: https://www.aku.edu/news/Pages/News_Details.aspx?nid=NEWS-001761
The Pakistan Business Council. (2019, November). PBC Policy Brief containing the key recommendations for a framework for SEZs. https://www.pbc.org.pk/wp-content/uploads/PBCs-Recommended-Framework-for-SEZs-V3.pdf
The World Bank (2020). Enterprise Surveys. Retrieved from: https://www.enterprisesurveys.org/en/data/exploretopics/finance
TMF Group. (2019). The Compliance Business Complexity Index.
Tribune. (2020, April 25). Banks ask small units for hefty collateral. The Express Tribune. https://tribune.com.pk/story/2206207/2-banks-ask-small-units-hefty-collateral
USDA (2020). COVID-19 Spurs Record Downward Adjustments to Global Demand.
USDA Foreign Agricultural Service. (2019). Pakistan Cotton and Products Annual 2019 (No. PK1908). https://apps.fas.usda.gov/newgainapi/api/report/downloadreportbyfilename?filename=Cotton%20and%20Products%20Annual_Islamabad_Pakistan_4-2-2019.pdf
Vietnam’s Industrial Zones – How to Pick a Location for Your Business. (2019, July 25). Vietnam Briefing News. https://www.vietnam-briefing.com/news/vietnam-industrial-zones-how-to-pick-location-for-your-business.html/
Vietnam’s Key Regions and Economic Zones. (2017). http://www.iberglobal.com/files/2017-2/vietnam-key-regions-economic-zones.pdf

85STRENGTHENING THE EXPORT COMPETITIVENESS OF PAKISTAN’S TOWEL AND TERRY MADE-UPS SECTOR
World Bank Group (2020). Doing Business 2020. Washington, DC: World Bank. DOI:10.1596/978-1-4648-1440-2.
World Bank Group. (2018). Logistic Performance Index. Washington, DC: World Bank.
World Bank predicts Pakistan GDP growth at –0.2pc next fiscal. (2020, June 10). The News Interna-tional. https://www.thenews.com.pk/print/670634-world-bank-predicts-pakistan-gdp-growth-at-0-2pc-next-fiscal
World Development Indicators | DataBank. (n.d.). World Development Indicators, DataBank. https://databank.worldbank.org/source/world-development-indicators
World Economic Forum (2019). The Global Competitiveness Report. ISBN-13: 978-2-940631-02-5.
Xinjiang’s Textile Park: A new challenge? – Business Recorder. (n.d.). Brecorder. https://fp.brecorder.com/2018/10/20181014415100/
Yilmaz, N. D., Powell, N., & Durur, G. (2005). The technology of terry towel production. JTATM, 4(4).

86
Annexure I
TABLE A-1 List of Towel Manufacturers Interviewed
S. No. Company Name Address Name of Authorized Representative/Focal Person
1. Towel Manufacturers’ Association (TMA)
TMA House, 77-A, Block ‘A’ Sindhi Muslim Cooperative Housing Society Karachi
Mr. Tahir Jahangir, Chairman
2. Towel Manufacturers’ Association (TMA)
TMA House, 77-A, Block ‘A’ Sindhi Muslim Cooperative Housing Society Karachi
Mr. M. Muzammil Hussain,Secretary General
3. Premier Towels Plot No. 17, Sector-6A, North Karachi Industrial Area, Karachi
Mr. Farooq Ehsan, Managing Partner Premier Towels and Sr. Vice Chairman TMA
4. Shaheen Industries DP-31/16, Sector 6-B, North Karachi Indusrial Area, Karachi.
Mr. Haroon Shamsi, CEOShaheen Industries & Chairman TMA
5. Al-Karam Towel Industries (Pvt.) Ltd.
Super Highway, D-19, Mehtab-ud-din Chawla Road, Scheme#33 SITE, Pakistan
Mr. Mehtab-ud-din Chawla
6. Afroze Textiles Industries (Pvt.) Ltd.
Plot No. C-8, Scheme 33,S.I.T.E., Super Highway, Karachi.
Mr. Feroze Alam Lari, Chairman
7. Bari Textile Mills (Pvt.) Ltd. 29/A, Block-2, P.E.C.H.S, Shahrah-E-Quaideen Karachi
Mr. Muhammad Naqi Bari, Chairman
8. International Textile Limited Head Office: Office: 205-208, Park Tower, Shahrah-e-Firdousi, Clifton Karachi
Mr. Adnan Khan, CEO
9. Regal Textile Industries (Pvt.) Ltd.
L-32/B, Block 22, Federal B Area, Karachi. Mr. Khalid Iqbal, DirectorMr. Asim Iqbal, Director Production
10. Saad Textile Mills Defence Road, Lahore, Punjab. Mr. Pervaiz Anwar Sheikh, CEO
11. Hasham Towel Plot # 126, Sector 24 Korangi Industrial Area, Karachi, Karachi.
Mr. Moin A. Razzak, Director
12. Pearl Fabrics Company Plot # 15, Sector-16, Korangi Industrial Area Karachi
Mr. Sultan Waqar, Director
13. Union Textile Industries L26-A, F. B Industrial Area, Block 22 Gulberg Town, Karachi,
Mr. Muhammad Omer Shahid, Director
14. Al-Rahim Textile Industries G-33, Block-6, Jaffer Street, P.E.C.H.S, Shahrah-e-Faisal Block 6 PECHS, Karachi.
Mr. Mazhar M. Moosani, Director Marketing & Sales
15. Awesome Textile Industries PLOT # 5, Sector 19 Korangi Industrial Area, Karachi.
Mr. Bahzad Mustafa, Manager
16. M.A. Textiles 48/8, Sector 12-C, North Karachi Industrial Area, Karachi
Mr. Muhammad Akhtar
17. Pak Textile Industries D-6, S.I.T.E. 2, Super Highway, Karachi. Muhammad Usman
18. Utopia Industries (Pvt.) Ltd. C-16/A, Scheme 33 Super Highway, Karachi. Mr. Syed Haroon Afaq, Sr. Manager HR & Administration
19. Nasim Textile Industries Plot No. R-146-147, Sector 16-B,North Karachi Gabol Town,Karachi
Mr. MuhammadNasim Akhter
20. Hassan Textiles Plot No. A-130, S.I.T.E, SuperHighway Scheme 33, Karachi
Mr. Aamir HassanLari
21. AnwartexIndustries (Pvt.) Ltd.
Office: EP-11, Sector 12-C, NorthKarachi Industrial Area, Karachi
Mr. Omer AnwarLari

87STRENGTHENING THE EXPORT COMPETITIVENESS OF PAKISTAN’S TOWEL AND TERRY MADE-UPS SECTOR
Annexure II
Competitiveness Index (%):
This index represents a quota of the “relative change of world market share”. The competitiveness effect in fact shows the percentage change in competitiveness of a country’s exports in the world market for the selected sector in the period under review. It corresponds to hypothetical gains or losses of a country’s aggregate market share that would occur if changes were only due to variations in the country’s market share in import markets, regardless of the structure of the country’s exports.
Adaptation Index (%):
The adaptation effect index represents a quota of the ‘relative change of world market share’. This index shows the ability to adjust export supply to changes in world demand of a specific country’s sector.
Product Specialization (%):
The initial product specialization index represents a quota of the ‘relative change of world market share’. This index shows the gains or losses associated with the initial sectoral specialization of domestic supply on products characterized by dynamic demand.
Geographic Specialization (%):
The initial geographic specialization index represents a quota of the ‘relative change of world market share’. This index shows the benefits associated with the initial specialization of domestic exporters on dynamic markets. It corresponds to hypothetical gains or losses in a country’s aggregate market share that would occur if changes were only due to the dynamism of its partner countries, regardless of any variations in the country’s market shares in these markets.

88
Annexure III
TABLE A-2: Top Potential Markets Working of top potential markets
630260: Toilet linen and kitchen linen, of terry towelling or similar terry fabrics of cotton (excluding floorcloths, polishing
cloths, dishcloths and dusters)
630710: Floorcloths, dishcloths, dusters and similar cleaning cloths, of all types of textile materials
Potential Markets
Export Potential
Actual Exports
Untapped Export
Potential
Potential Markets
Export Potential
Actual Exports
Untapped Export
Potential
Germany $77.8 Mn $44.8 Mn $32.9 Mn Germany $48.9 Mn $4.4 Mn $44.5 Mn
France $51.8 Mn $23.8 Mn $27.9 Mn Netherlands $25.2 Mn $5.3 Mn $19.9 Mn
Japan $29.8 Mn $3.5 Mn $26.2 Mn United Kingdom $40.9 Mn $21.3 Mn $19.6 Mn
United Kingdom $94.4 Mn $75.2 Mn $19.2 Mn Spain $19.5 Mn $748.0 k $18.8 Mn
China $16.1 Mn $1.1 Mn $15.0 Mn Italy $19.5 Mn $2.5 Mn $17.1 Mn
Spain $38 Mn $26.4 Mn $11.6 Mn France $22.0 Mn $6.1 Mn $15.9 Mn
Netherlands $40.9 Mn $29.8 Mn $11.1 Mn China $10.7 Mn $493.6 k $10.2 Mn
Australia $18.8 Mn $8.9 Mn $9.9 Mn Poland $9.5 Mn $485.5 k $9.1 Mn
Canada $22.3 Mn $12.5 Mn $9.8 Mn Belgium $9.0 Mn $2.2 Mn $6.7 Mn
Sweden $13.1 Mn $3.7 Mn $9.5 Mn Australia $7.5 Mn $1.1 Mn $6.4 Mn
630299: Toilet linen and kitchen linen of textile materials (excluding of cotton or man-made fibres, floorcloths, polishing
cloths, dishcloths and dusters)
630291: Toilet linen and kitchen linen of cotton (excluding of terry fabrics, floorcloths, polishing cloths, dishcloths and
dusters)
Potential Markets
Export Potential
Actual Exports
Untapped Export
Potential
Potential Markets
Export Potential
Actual Exports
Untapped Export
Potential
Germany $2.9 Mn $536.3 k $2.3 Mn Spain $2.3 Mn $1.4 Mn $871.1 k
United Kingdom $2.2 Mn $668.3 k $1.5 Mn China $526.4 k $16.0 k $510.3 k
Spain $1.0 Mn $154.6 k $865.6 k Canada $916.7 k $441.5 k $475.2 k
France $1.1 Mn $332.5 k $816.1 k Japan $444.2 k $21.1 k $423.1 k
Poland $348.1 k $7.2 k $340.9 k Malaysia $559.3 k $149.3 k $410.0 k
China $334.3 k $433.3 k $333.9 k Australia $772.1 k $548.1 k $224.0 k
Australia $350.6 k $38.6 k $312.0 k Sweden $558.0 k $350.2 k $207.8 k
United Arab Emirates
$407.1 k $124.6 k $282.5 k Chile $189.7 k $26.2 k $163.5 k
Austria $267.5 k $7.3 k $260.2 k Norway $181.4 k $65.9 k $115.5 k
Japan $267.7 k $21.3 k $246.3 k Czech Republic $371.8 k $291.0 k $80.8 k
Source: ITC Export Potential Map

89STRENGTHENING THE EXPORT COMPETITIVENESS OF PAKISTAN’S TOWEL AND TERRY MADE-UPS SECTOR
Annexure IV
TABLE A-3 Stage-wise Visible and Invisible Wastage
s.no. Value Chain Process Description Wastage Invisible Wastage Visible
1. Yarn Warping/Sizing 1.50% -
2. Yarn Twisting/Doubling 1.00% -
3. Weaving 3.00% -
4. Bleaching/Dyeing 8.50% -
5. Stitching - 3.00%
6. Cutting - 3.00%
TOTAL 14.00% 6.00%
Note: If shearing process is used, it adds another 20 percent wastage. The wastage is further sold between Rs20-25/kg for
manufacture of different textile materials. Wastage of cutting is used for the preparation of rags.
Source: Towel Manufacturers’ Association
Towels which are mostly exported to the United States, are made from coarse yarn.87 Coarse yarn is made from the wastage of fine yarn. This wastage comes from cotton fibre particles resulting from the weaving process of raw cotton. Cotton mills providing the yarns generally classify between fine yarn and coarse yarn. The wastage of coarse yarn is not reusable and it is greater than the wastage of fine yarn.
87 This is the result of one feed of yarn being much coarser than normal for the fabric. The result is barré fabric.

D
8th Floor, Dawood Centre,M.T. Khan Road,Karachi, Pakistan
T - +92 21 3563 0528 - 29F - +92 21 3563 0530
www.pbc.org.pk